Embed Size (px)
Citation preview
CARIBBEAN EXAMINATIONS COUNCIL
Caribbean Advanced Proficiency Examinations
CAPE®
Including amendments up to 2008
APPLIED MATHEMATICS SYLLABUS
Effective for examinations from May/June 2008
CXC A9/U2/07
© 2010, Caribbean Examinations Council
All rights reserved. No part of this publication may be reproduced, stored in a retrieval system, or transmitted in any form, or by any means electronic, photocopying, recording or otherwise without prior permission of the author or publisher.
Correspondence related to the syllabus should be addressed to:
The Pro-Registrar Caribbean Examinations Council Caenwood Centre 37 Arnold Road, Kingston 5, Jamaica, W.I.
Telephone: (876) 630-5200 Facsimile Number: (876) 967-4972 E-mail address: [email protected] Website: www.cxc.org
Copyright © 2007, by Caribbean Examinations Council The Garrison, St Michael BB14038, Barbados
Published by the Caribbean Examinations Council
CXC A7/U1/07 iii
RATIONALE ......................................................................................................................................... 1
AIMS...................................................................................................................................................... 1
SKILLS AND ABILITIES TO BE ASSESSED......................................................................................... 2
PRE-REQUISITES OF THE SYLLABUS ............................................................................................... 4
STRUCTURE OF THE SYLLABUS....................................................................................................... 4
RECOMMENDED 2-UNIT OPTIONS .................................................................................................. 4
UNIT 1: STATISTICAL ANALYSIS
MODULE 1: Collecting and Describing Data............................................................................. 5 MODULE 2: Managing Uncertainty .......................................................................................... 9
MODULE 3: Analyzing and Interpreting Data........................................................................... 17
UNIT 2: MATHEMATICAL APPLICATIONS
MODULE 1: Discrete Mathematics............................................................................................ 25 MODULE 2: Probability and Distributions................................................................................ 31
MODULE 3: Particle Mechanics................................................................................................ 36
OUTLINE OF ASSESSMENT ................................................................................................................ 53
REGULATIONS FOR PRIVATE CANDIDATES.................................................................................. 68
REGULATIONS FOR RE-SIT CANDIDATES…………………………………………………………..................... 68
ASSESSMENT GRID ............................................................................................................................. 68
APPLIED MATHEMATICAL NOTATION........................................................................................... 69
MISCELLANEOUS SYMBOLS .............................................................................................................. 70
Contents
CXC A9/U2/07
The Statistical Analysis and Applied Mathematics Syllabuses were merged to create a new 2-Unit syllabus for Applied Mathematics.
This document CXC A9/U2/07, therefore, replaces CXC A7/U1/04 and CXC A9/U1/04 issued in 2004.
Please note that the syllabuses have been revised and amendments are indicated by italics.
First Issued 1999 Revised 2004, 2007
Please check the website, www.cxc.org for updates on CXC’s syllabuses
CXC A7/U1/07 v
he Caribbean Advanced Proficiency Examination (CAPE) is designed to provide certification of the academic, vocational and technical achievement of students in the Caribbean who, having completed
a minimum of five years of secondary education, wish to further their studies. The examinations address the skills and knowledge acquired by students under a flexible and articulated system where subjects are organised in 1-Unit or 2-Unit courses with each Unit containing three Modules. Subjects examined under CAPE may be studied concurrently or singly.
The Caribbean Examinations Council offers three types of certification. The first is the award of a certificate showing each CAPE Unit completed. The second is the CAPE diploma, awarded to candidates who have satisfactorily completed at least six Units, including Caribbean Studies. The third is the CAPE Associate Degree, awarded for the satisfactory completion of a prescribed cluster of seven CAPE Units including Caribbean Studies and Communication Studies. For the CAPE diploma and the CAPE Associate Degree, candidates must complete the cluster of required Units within a maximum period of five years.
Recognized educational institutions presenting candidates for CAPE Associate Degree in one of the nine categories must, on registering these candidates at the start of the qualifying year, have them confirm in the required form, the Associate Degree they wish to be awarded. Candidates will not be awarded any possible alternatives for which they did not apply.
T
Introduction

CXC A9/U2/07
CXC A9/U2/07 1
♦ RATIONALEMathematics and its applications are quickly becoming indispensable in our modern technological world. Advancement in fields of applications has prompted the use of computational techniques unique to particular entities. The discipline of applied mathematics must respond to the demands of conceptual analysis, principles and problem solving for a new world filled with more advanced tools of technology.
The main emphasis of the applied course is on developing the ability of the students to start with a problem in non-mathematical form and transform it into mathematical language. This will enable them to bring mathematical insights and skills in devising a solution, and then interpreting this solution in real-world terms.
Students accomplish this by exploring problems using symbolic, graphical, numerical, physical and verbal techniques in the context of finite or discrete real-world situations. Furthermore, students engage in mathematical thinking and modelling to examine and solve problems arising from a wide variety of disciplines including, but not limited to, economics, medicine, agriculture, marine science, law, transportation, engineering, banking, natural sciences, social sciences and computing.
Driven by computational technology, much mathematical power and efficiency have been provided to teachers and students through the use of calculators and computers. This course incorporates the use of appropriate and relevant technology. These technological skills that students would require would prove vital to them as they present and analyse data for a research component.
It is also recognized that mathematics is a principal gateway to technical and professional careers and academic interests for an increasing number of students in a widening range of subjects in the curriculum. Therefore, this Applied Mathematics syllabus makes provision for this diversity through two carefully articulated Units that are available to students. Both Units employ a stepwise logical approach using mathematical reasoning, principles and patterns to develop models, test conjectures and judge validity of arguments and conclusions. Thus, the mathematical concepts explored establish the importance of reasoning, counting, modelling and algorithmic thinking.
♦ AIMSThe syllabus aims to enable students to:
1. equip themselves with tools of data collection, data organization and data analysis in order to make validdecisions and predictions;
2. develop research skills needed for productive employment, recreation and life-long education;
Applied Mathematics Syllabus
This syllabus will contribute to the development of the Ideal Caribbean Person as articulated by the CARICOM Heads of Government in the following areas: “demonstrate multiple literacies, independent and critical thinking and innovative application of science and technology to problem solving. Such a person should also demonstrate a positive work attitude and value and display creative imagination and entrepreneurship”. In keeping with the UNESCO Pillars of Learning, on completion of this course the study, students will learn to do, learn to be and learn to transform themselves and society.
CXC A9/U2/07 2
3. use of appropriate statistical language and form in written and oral presentations;
4. develop an awareness of the exciting applications of Mathematics;
5. develop a willingness to apply Mathematics to relevant problems that are encountered in dailyactivities;
6. understand certain mathematical concepts and structures, their development and theirinterrelationships;
7. use calculators and computers to enhance mathematical investigations;
8. develop a spirit of mathematical curiosity and creativity;
9. develop the skills of recognizing essential aspects of real-world problems and translating these problemsinto mathematical forms;
10. develop the skills of defining the limitations of the model and the solution;
11. apply Mathematics across the subjects of the school curriculum;
12. acquire relevant skills and knowledge for access to advanced courses in Mathematics and/or itsapplications in other subject areas;
13. gain experiences that will act as a motivating tool for the use of technology.
♦ SKILLS AND ABILITIES TO BE ASSESSEDThe assessment will test candidates’ skills and abilities in relation to three cognitive levels.
1. Conceptual knowledge - the ability to recal l , se lect and use appropriate facts, concepts and principles in a variety of contexts.
2. Algorithmic knowledge - the ability to manipulate mathematical expressions and procedures using appropriatesymbols and language, logical deduction and inferences.
3. Reasoning - the ability to se lect appropriate strategy or select, use and evaluate mathematical models andinterpret the results of a mathematical solution in terms of a given real-world problem and engage in problem-solving.
CXC A9/U2/07 3
♦ PRE-REQUISITES OF THE SYLLABUS
Any person with a good grasp of the contents of the syllabus of the Caribbean Secondary Education Certificate (CSEC) General Proficiency course in Mathematics, or equivalent, should be able to undertake the course. However, successful participation in the course will also depend on the possession of good verbal and written communication skills.
♦ STRUCTURE OF THE SYLLABUSThe syllabus is divided into two (2) Units. Each Unit comprises three (3) Modules.
Unit 1: Statistical Analysis contains three Modules , each requir ing approximate ly 50 hours . The tota l teaching t ime, there fore , i s approximate ly 150 hours .
Module 1 - Collecting and Describing Data Module 2 - Managing Uncertainty Module 3 - Analysing and Interpreting Data
Unit 2: Mathematical Applications contains three Modules , each requir ing approximate ly 50 hours . The tota l teaching t ime, there fore , i s approximate ly 150 hours .
Module 1 - Discrete Mathematics Module 2 - Probability and Distributions Module 3 - Particle Mechanics
♦ RECOMMENDED 2-UNIT OPTIONS1. Pure Mathematics Unit 1 AND Pure Mathematics Unit 2.
2. Applied Mathematics Unit 1 AND Applied Mathematics Unit 2.
3. Pure Mathematics Unit 1 AND Applied Mathematics Unit 2.
CXC A9/U2/07 4
♦ UNIT 1: STATISTICAL ANALYSISMODULE 1: COLLECTING AND DESCRIBING DATA
GENERAL OBJECTIVES
On completion of this Module, students should:
1. understand the concept of randomness and its role in sampling and data collection;
2. appreciate that data can be represented both graphically and numerically with the view to initiate analysis.
SPECIFIC OBJECTIVES
(a) Sources of Data
Students should be able to:
1. distinguish between qualitative and quantitative data, and discrete and continuous data;
2. distinguish between a population and a sample, a census and sample survey, and a parameter and astatistic;
3. identify an appropriate sampling frame for a given situation;
4. explain the role of randomness in statistical work;
5. explain why sampling is necessary;
6. outline the ideal characteristics of a sample;
7. distinguish between random and non-random sampling;
8. distinguish among the following sampling methods - simple random, stratified random, systematic random,cluster and quota;
9. use the ‘lottery’ technique or random numbers (from a table or calculator) to obtain a simple randomsample;
10. outline the advantages and disadvantages of simple random, stratified random, systematic random, clusterand quota sampling.
CXC A9/U2/07 5
UNIT 1 MODULE 1: COLLECTING AND DESCRIBING DATA (cont’d)
CONTENT
(a) Sources of Data
(i) Quantitative, qualitative, discrete and continuous data.
(ii) Populations, parameters, censuses, samples, statistics, sample surveys.
(iii) Sampling frames.
(iv) Random and non-random sampling.
(v) Simple random, stratified random, systematic random, cluster and quota sampling.
(vi) Random numbers, “lottery” techniques.
SPECIFIC OBJECTIVES
(b) Data Collection
Students should be able to:
1. design questionnaires, interviews and observation schedules;
2. use simple random, stratified random, systematic random, cluster and quota sampling to obtain a sample;
3. collect experimental data using questionnaires, interviews or observation schedules;
4. write a report of the findings obtained from collected data.
CONTENT
(b) Data Collection
(i) Design of questionnaires, interviews and observation schedules.
(ii) Sampling techniques.
(iii) Collection of data.
(iv) Analysis of data.
CXC A9/U2/07 6
UNIT 1 MODULE 1: COLLECTING AND DESCRIBING DATA (cont’d)
SPECIFIC OBJECTIVES
(c) Data Analysis
Students should be able to:
1. construct frequency distributions from raw data;
2. construct and use frequency polygons, pie charts, bar charts, histograms, stem-and-leaf diagrams, box-and-whisker plots and cumulative frequency curves (ogives);
3. outline the relative advantages and disadvantages of frequency polygons, pie charts, bar charts, histograms,stem-and-leaf diagrams and box-and-whisker plots in data analysis;
4. determine or calculate the mean, trimmed mean, median and mode for ungrouped and grouped data;
5. outline the relative advantages and disadvantages of the mean, trimmed mean, median and mode asmeasures of central tendency for raw or summarized data;
6. determine quartiles and other percentiles from raw data, grouped data, stem-and-leaf diagrams, box-and-whisker plots and cumulative frequency curves (ogives);
7. calculate the range, interquartile range, semi-interquartile range, variance and standard deviation ofungrouped and grouped data;
8. interpret the following measures of variability: range, interquartile range and standard deviation;
9. interpret the shape of a frequency distribution in terms of uniformity, symmetry, skewness, outliers andmeasures of central tendency and variability.
CONTENT
(c) Data Analysis
(i) Pie charts, bar charts, histograms, stem-and-leaf diagrams, box-and-whisker plots.
(ii) Frequency distributions, frequency polygons, ogives.
(iii) Mean, trimmed mean, median, mode, percentiles, quartiles.
(iv) Relative advantages and disadvantages of various measures of central tendency.
CXC A9/U2/07 7
UNIT 1 MODULE 1: COLLECTING AND DESCRIBING DATA (cont’d)
(v) Range, interquartile range, semi-interquartile range, variance, standard deviation.
(vi) Interpretation of various measures of variability.
(vii) Shape of distributions.
Suggested Teaching and Learning Activities
To facilitate students’ attainment of the objectives of this Module, teachers are advised to engage students in the teaching and learning activities listed below.
Whenever possible, class discussions and presentations should be encouraged.
1. Sources of Data
The objectives related to these concepts could be introduced and developed using primary andsecondary data.
Example: Physical data, economic data, survey data, computer-generated data.
2. Data Collection
It is critical that students be required to collect data to be used in subsequent Modules.
The advantages and disadvantages of different sampling methods should be discussed.
It is desirable that small-group projects be initiated at this time.
The data collected should also be used as stimulus material for hypothesis testing or linear regression andcorrelation, by investigating relationships between variables.
Example: Investigate the relationship between the height of student and the distance to which the student throws a ball.
3. Data Analysis
Calculators or statistical software should be used whenever possible to display and analyse the collecteddata.
CXC A9/U2/07 8
UNIT 1 MODULE 1: COLLECTING AND DESCRIBING DATA (cont’d)
Graphical representations such as histograms, pie-charts, box-and-whisker plots should be used for preliminary analysis of data.
The strengths and weaknesses of the different forms of data representation should be emphasised.
Example: Box-and-whisker plots and “back to back” stem-and-leaf diagrams are appropriate for data comparison, such as scores obtained by boys versus scores obtained by girls from a test.
Discussions on the relative advantages and usefulness of the mean, quartiles, standard deviation of grouped and ungrouped data should be encouraged. Discussions on the shape of frequency distributions should be entertained.
RESOURCES
Crawshaw, J. and Chambers, J. A Concise Course in A-Level Statistics, Cheltenham: Stanley Thornes Limited, 2001.
Mahadeo, R. Statistical Analysis – The Caribbean Advanced Proficiency Examinations A Comprehensive Text, Trinidad and Tobago: Caribbean Educational Publishers Limited, 2007.
Upton, G. and Cook, I. Introducing Statistics, Oxford: Oxford University Press, 2001.
CXC A9/U2/07 9
UNIT 1 MODULE 2: MANAGING UNCERTAINTY
GENERAL OBJECTIVES
On completion of this Module, students should:
1. understand the concept of probability;
2. appreciate that probability models can be used to describe real world situations and to manageuncertainty.
SPECIFIC OBJECTIVES
(a) Probability Theory
Students should be able to:
1. list the elements of a possibility space (or probability sample space), given an experiment;
2. identify the elements of an event, given a possibility space;
3. calculate the probability of event A , P(A), as the number of outcomes of A divided by the totalnumber of possible outcomes;
4. use the property that the probability of an event A is a real number between 0 and 1 inclusive (0 ≤ P(A)≤ 1);
5. use the property that the sum of all the n probabilities of points in the sample space is 1, ( );
6. use the property that P(A ́)= 1 –P(A), where P(A ́ ) is the probability that event A does not occur;
7. calculate P(A ∪ B) and P(A ∩ B);
8. identify mutually exclusive events;
9. use the property of P(A ∩ B) = 0 or P(A ∪ B) = P(A) + P(B) where A and B are mutually exclusive events;
10. calculate the conditional probability P(A | B) where P(A | B) = is the probability that event A
will occur given that event B has already occurred;
11. identify independent events;
CXC A9/U2/07 10
UNIT 1 MODULE 2: MANAGING UNCERTAINTY (cont’d)
12. use the property P(A ∩ B) = P (A) ⋅ P (B) or P(A|B) = P(A) where A and B are independent events;
13. construct and use possibility space diagrams, tree diagrams, Venn diagrams and contingency tables in thecontext of probability;
14. solve problems involving probability.
CONTENT
(a) Probability Theory
(i) Concept of probability.
(ii) P(A ∪ B) = P(A) + P(B) – P(A ∩ B).
(iii) Mutually exclusive events: P(A ∩ B) = 0 or P(A ∪ B) = P(A) + P(B).
(iv) Independent events: P(A ∩ B) = P(A)⋅ P(B) or P(A|B) = P(A).
(v) Possibility space, tree diagrams, Venn diagrams, contingency tables, possibility space diagrams.
(vi) Conditional probability: P(A|B)= .
SPECIFIC OBJECTIVES
(b) Random Variables
Students should be able to:
1. use a given probability function which assigns probabilities to values of a discrete random variable;
2. outline and use the properties of the probability distribution of a random variable X:
(a) 0 ≤ P ( ) ≤ 1 for all .
(b) .
3. calculate the expected value E(X), variance Var(X), and standard deviation of a discrete random variable X;
CXC A9/U2/07 11
UNIT 1 MODULE 2: MANAGING UNCERTAINTY (cont’d)
4. construct and use probability distribution tables for discrete random variables to obtain the probabilities:P(X = a), P(X > a), P(X < a), P(X ≥ a), P(X ≤ a), or any combination of these, where a and b are realnumbers;
5. construct a cumulative distribution function table from a probability distribution table;
6. use a cumulative distribution function table to compute probabilities;
7. use the properties of a probability density function, f(x) of a continuous random variable X:
(a) f(x) ≥ 0 for all x,
(b) the total area under the graph is 1;
8. use areas under the graph of a probability density function as measures of probabilities (integration will notbe tested), noting that P(X = a) = 0 for any continuous random variable X and real number a.
CONTENT
(b) Random Variables
(i) Discrete random variables.
(ii) Continuous random variables.
(iii) Properties of discrete and continuous random variables.
(iv) Expected value, variance and standard deviation of a discrete random variable.
(v) Probability distribution.
(vi) Cumulative distribution.
SPECIFIC OBJECTIVES
(c) Binomial Distribution
Students should be able to:
1. state the assumptions made in modelling data by a binomial distribution;
2. identify and use the binomial distribution as a model of data, where appropriate;

CXC A9/U2/07 12
UNIT 1 MODULE 2: MANAGING UNCERTAINTY (cont’d)
3. use the notation X ~ Bin (n, p), where n is the number of independent trials and p is the probability of asuccessful outcome in each trial;
4. calculate and use the mean and variance of a binomial distribution;
5. calculate the probabilities P(X = a), P(X > a), P(X < a), P(X ≥ a) , P(X ≤ a), or any combination of these,where X ~ Bin (n, p).
CONTENT
(c) Binomial Distribution
(i) Conditions for discrete data to be modelled as a binomial distribution.
(ii) Binomial distribution notation and probabilities.
(iii) Expected value E(X), and variance Var(X), of the binomial distribution.
SPECIFIC OBJECTIVES
(d) Normal Distribution
Students should be able to:
1. describe the main features of the normal distribution;
2. use the normal distribution as a model of data, as appropriate;
3. use the notation X ~ N (µ, σ2), where µ is the population mean and σ 2 is the population variance;
4. determine probabilities from tabulated values of the standard normal distribution Z ~ N (0, 1);
5. solve problems involving probabilities of the normal distribution using z-scores;
6. explain the term ‘continuity correction’ in the context of a normal distribution approximation to abinomial distribution;
7. use the normal distribution as an approximation to the binomial distribution, where appropriate(np >5 and npq >5), and apply a continuity correction.
CXC A9/U2/07 13
UNIT 1 MODULE 2: MANAGING UNCERTAINTY (cont’d)
CONTENT
(d) Normal Distribution
(i) Properties of the normal distribution.
(ii) Normal distribution notation and probabilities.
(iii) The standard normal distribution and the use of standard normal distribution tables.
(iv) z-scores.
(v) Normal approximation to the binomial distribution using a continuity correction.
Suggested Teaching and Learning Activities
To facilitate students’ attainment of the objectives of this Module, teachers are advised to engage students in the teaching and learning activities listed below.
Most concepts in this Module are best understood by linking them to the data collected and concepts learnt in Module 1.
Note
Only simple arithmetic, algebraic and geometric operations are required for this Module (see operations on page 15).
1. Probability Theory
The main emphasis is on understanding the nature of probability as applied to modelling and datainterpretation.
Concepts of possibility spaces and events may be motivated through the practical activities undertakenin Sources of Data of Module 1.
Probability calculations and the properties of probability may be based on data obtained from studentactivities carried out under Data Analysis of Module 1.
Examples: Throwing dice, tossing coins, drawing coloured marbles from a bag.
CXC A9/U2/07 14
UNIT 1 MODULE 2: MANAGING UNCERTAINTY (cont’d)
Discussions on the concepts of mutually exclusive and independent events using real world concepts should be encouraged. A variety of ways to represent mutually exclusive and independent events should be utilized.
Many problems are often best solved with the aid of a Venn diagram, tree diagram or possibility space diagram. Therefore, candidates should be encouraged to draw diagrams as aids or explanations to the solution of problems.
2. Random Variables
Class discussions and activities should be encouraged to clarify the concepts of discrete and continuousrandom variables.
Examples: Examples of discrete random variables include the number of televisions per household and thenumber of people queuing at checkouts; while examples of continuous random variables include thewaiting times for taxis and heights of students.
It should be emphasized that, for continuous random variables, the area under the graph of aprobability density function is a measure of probability and note the important fact that P(X = a) = 0.
3. Binomial Distribution
The teaching of the binomial distribution could be introduced by the following classroom activities:
(a) the number of heads obtained when a coin is tossed 8 times;
(b) the number of sixes obtained from 10 throws of a die, where obtaining a six is considered as a success, and all other outcomes will be regarded as failures.
4. Normal Distribution
This section can be introduced by discussing the concept of continuous random variables with particularreference to the normal distribution.
Students should be made aware that a normal distribution N (µ, σ2) is uniquely defined by its mean, µ,and variance, σ2. The shape of the normal distribution for varying values of µ, and σ2 could then beexplored.
It can be demonstrated that the binomial distribution may be approximated by the normal distribution.
CXC A9/U2/07 15
UNIT 1 MODULE 2: MANAGING UNCERTAINTY (cont’d)
Example:
Use a graphical calculator to study the graph of (p + q)n where p = 0.25, q = 0.75 and n = 3, 10, 25, 50, 100.
Repeat the above activity with different values of (p + q) n where p < 0.25 and q > 0.75 or (p > 0.25) and (q < 0.75) and n = 3, 10, 25, 50, 100.
Arithmetic, Algebraic and Geometric Operations required for this Module.
Arithmetic
1. Use of the operations +, −, ×, ÷ on integers, decimals and fractions.
2. Knowledge of real numbers.
3. Simple applications of ratio, percentage and proportion.
4. Absolute value, ⎢a ⎢.
Algebra
1. Language of sets.
2. Operations on sets: union, intersection, complement.
3. Venn diagram and set notation.
4. Basic manipulation of simple algebraic expressions including factorisation and expansion.
5. Solutions of linear equations and inequalities in one variable.
6. Solutions of simultaneous linear equations in two variables.
7. Solutions of quadratic equations.
8. Ordered relations < , >, ≤ , ≥ and their properties.
Geometry
1. Elementary geometric ideas of the plane.
CXC A9/U2/07 16
2. Concepts of a point, line and plane.
3. Simple two-dimensional shapes and their properties.
4. Areas of polygons and simple closed curves.
RESOURCES
Crawshaw, J. and A Concise Course in A-Level Statistics, Cheltenham: Stanley Chambers, J. Thornes Limited, 1994.
Mahadeo, R. Statistical Analysis – The Caribbean Advanced Proficiency Examinations A Comprehensive Text, Trinidad and Tobago: Caribbean Educational Publishers Limited, 2007.
Upton, G. and Cook, I. Introducing Statistics, Oxford: Oxford University Press, 2001.
CXC A9/U2/07 17
UNIT 1 MODULE 3: ANALYSING AND INTERPRETING DATA
GENERAL OBJECTIVES
On completion of this Module, students should:
1. understand the uses of the sampling distribution and confidence intervals in providing information abouta population;
2. understand the relevance of tests of hypotheses regarding statements about a population parameter;
3. appreciate that finding possible associations between variables and measuring their strengths are keyideas of statistical inference.
SPECIFIC OBJECTIVES
(a) Sampling Distribution and Estimation
Students should be able to:
1. use the fact that E( ) = µ and Var ( ) = where is the sample mean, µ the population
mean, σ2 the population variance and n the sample size;
2. apply the property that is normal if is normal;
3. apply the Central Limit Theorem in situations where n ≥ 30;
4. calculate unbiased estimates for the population mean, proportion or variance;
5. explain the term ‘confidence interval’ in the context of a population mean or proportion;
6. calculate confidence intervals for a population mean or proportion using a large sample drawn from a
population of known or unknown variance.
CONTENT
(a) Sampling Distribution and Estimation
(i) Sampling distribution of the mean and proportion.
(ii) Central Limit Theorem (no proof required).
(iii) Unbiased estimates.
CXC A9/U2/07 18
UNIT 1 MODULE 3: ANALYSING AND INTERPRETING DATA (cont’d)
(iv) Concept of confidence intervals.
(v) Estimation of confidence intervals for a population mean or proportion.
SPECIFIC OBJECTIVES
(b) Hypothesis Testing
Students should be able to:
1. formulate a null hypothesis H0, and an alternative hypothesis H1;
2. apply a one-tailed test or a two-tailed test, appropriately;
3. relate the level of significance to the probability of rejecting H0 given that H0 is true;
4. determine the critical values from tables for a given test and level of significance;
5. identify the critical or rejection region for a given test and level of significance;
6. evaluate from sample data the test statistic for testing a population mean or proportion;
7. apply a z-test for:
(i) a population mean when a sample is drawn from a normal distribution of known variance;
(ii) a population proportion when a large sample (n ≥ 30) is drawn from a binomial distribution, using a normal approximation to the binomial distribution with an appropriate continuity correction;
(iii) a population mean when a large sample (n ≥ 30) is drawn from any other distribution of known or unknown variance, using the Central Limit Theorem.
CONTENT
(b) Hypothesis Testing
(i) Null and alternative hypotheses.
(ii) One-tailed and two-tailed tests.
(iii) Level of significance.
CXC A9/U2/07 19
UNIT 1 MODULE 3: ANALYSING AND INTERPRETING DATA (cont’d)
(iv) Critical values and critical regions.
(v) Test statistic: normal test of a population mean or proportion.
(vi) Hypothesis test for a population mean or proportion from a large sample.
SPECIFIC OBJECTIVES
(c) t-test
Students should be able to:
1. evaluate the t-test statistic;
2. explain the term ‘degrees of freedom’ in the context of a t-test;
3. determine the appropriate number of degrees of freedom for a given data set;
4. determine probabilities from t-distribution tables;
5. apply a hypothesis test for a population mean using a small sample (n < 30) drawn from a normalpopulation of unknown variance.
CONTENT
(c) t-test
(i) t-test statistic.
(ii) Degrees of freedom.
(iii) Use of t-test tables.
(iv) Hypothesis test for a population mean from a small sample.
CXC A9/U2/07 20
UNIT 1 MODULE 3: ANALYSING AND INTERPRETING DATA (cont’d)
SPECIFIC OBJECTIVES
(d) χ2-test
Students should be able to:
1. evaluate the Chi-square test statistic to read or where is
the observed frequency, is the expected frequency and N is the total frequency;
2. explain the term ‘degrees of freedom’ in the context of a χ2- test;
3. determine the appropriate number of degrees of freedom for a contingency table;
4. determine probabilities from χ2- tables;
5. apply a χ2 test for independence in a contingency table (2×2 tables not included) where classes should becombined so that the expected frequency in each cell is at least 5.
CONTENT
(d) χ2 -test
(i) χ2-test statistic.
(ii) Degrees of freedom.
(iii) Use of the χ2-tables.
(iv) Hypothesis test for independence in a contingency table.
SPECIFIC OBJECTIVES
(e) Correlation and Linear Regression - Bivariate Data
Students should be able to:
1. distinguish between dependent and independent variables;
2. draw scatter diagrams to represent bivariate data;
3. make deductions from scatter diagrams;
4. calculate and interpret the value of r, the product-moment correlation coefficient;
CXC A9/U2/07 21
UNIT 1 MODULE 3: ANALYSING AND INTERPRETING DATA (cont’d)
5. justify the use of the regression line y on x or x on y in a given situation;
6. calculate regression coefficients for the line y on x or x on y;
7. give a practical interpretation of the regression coefficients;
8. draw the regression line of y on x or x on y passing through , on a scatter diagram;
9. make estimations using the appropriate regression line;
10. outline the limitations of simple correlation and regression analyses.
CONTENT
(e) Correlation and Linear Regression – Bivariate Data
(i) Dependent and independent variables.
(ii) Scatter diagrams.
(iii) Product moment correlation coefficient.
(iv) Regression coefficients and lines.
(v) Estimation from regression lines.
(vi) Limitations of simple correlation and regression analyses.
Suggested Teaching And Learning Activities
To facilitate students’ attainment of the objectives of this Module, teachers are advised to engage students in the teaching and learning activities listed below.
Teachers should use the data collected in Modules 1 and 2 to facilitate the attainment of the objectives of this Module. Classroom discussions and oral presentations of work done by students, individually or in groups, should be stressed at all times.
CXC A9/U2/07 22
UNIT 1 MODULE 3: ANALYSING AND INTERPRETING DATA (cont’d)
1. Sampling Distributions and Est imation
Shoppers often sample a plum to determine its sweetness before purchasing any. They decide from one plum whatthe larger bunch or lot will taste like. A chemist does the same thing when he takes a sample of rum from a curingvat. He determines it is 90% proof, and infers that all the rum in the vat is 90% proof. If the chemist tests all ofthe rum, and the shopper tastes all the plum, there may be none to sell. Testing all of the product often destroys itand is unnecessary. To determine the characteristics of the whole we have to sample a portion.
Time is also a factor when managers need information quickly in order to adjust an operation or to change policy.Take an automatic machine that sorts thousands of pieces of mail daily. Why wait for an entire day’s output tocheck whether the machine is working accurately? Instead, samples can be taken at specific intervals, and ifnecessary, the machine can be adjusted right away.
Recognise and use the sample mean as a random variable.
Sampling distributions of data collected by students working in groups should be presented in tables and graphs. The emerging patterns should be discussed and used to explore the concepts and principles.
Example: Obtain the means from samples of size 3 and construct a histogram of the sample means to illustrate the sampling distribution of the mean.
Repeat the exercise with increasing sample sizes to illustrate the Central Limit Theorem.
2. Confidence Intervals
Data collected from previous classroom activities on sampling distributions may be used to enhancestudents’ understanding of the concept of confidence levels and intervals.
Example: Determine the sample mean and sample standard deviation from random samples of size 5 chosen from a population of size 50. For each sample calculate a 95% confidence interval and determine the number of confidence intervals which contain the population mean.
3. Hypothesis Testing
(a) Suppose a manager of a large shopping mall tells us that the average work efficiency of the employees is 90%. How can we test the validity if that manager’s claim or hypothesis? Using a sampling method discussed, the efficiency of a sample could be calculated. If the sample statistic came out to 93%, would the manager’s statement be readily accepted? If the sample statistic were 43%, we may reject the claim as untrue. Using common sense the claim can either be accepted or rejected based on the results of the sample. Suppose the sample statistic revealed an efficiency of 83%. This is relatively close to 90%. Is it close enough to 90% for us to accept or reject the manager’s claim or hypothesis?
CXC A9/U2/07 23
UNIT 1 MODULE 3: ANALYSING AND INTERPRETING DATA (cont’d)
Whether we accept or reject the claim we cannot be absolutely certain that our decision is correct. Decisions on acceptance or rejection of a hypothesis cannot be made on intuition. One needs to learn how to decide objectively, on the basis of sample information, whether to accept or reject a hypothesis.
(b) Data collected from previous classroom activities on sampling distributions may be used to enhance students’ ability to apply a hypothesis test concerning a population mean or proportion from a large sample of known variance.
4. t -test
Data collected from previous classroom activities on sampling distributions may be used to enhancestudents’ ability to apply a hypothesis test for a population mean from a small sample of unknownvariance.
5. χ2-test
Data collected from previous classroom activities on sampling distributions may be used to enhancestudents’ ability to apply a hypothesis test for independence in a contingency table.
Example: Testing whether there is a relationship between sex and performance in Mathematics.
6. Correlation and Linear Regression – Bivariate Data
Information collected in Module 1 from the section Data Analysis can be applied to the concepts oflinear regression and correlation.
Students should become proficient in the use of computers or scientific calculators to perform statisticalcalculations, as in obtaining regression estimates and correlation coefficients.
RESOURCES
Crawshaw, J. and A Concise Course in A-Level Statistics, Cheltenham: Stanley Thornes Chambers, J. Limited, 1994.
Mahadeo, R. Statistical Analysis – The Caribbean Advanced Proficiency Examinations A Comprehensive Text, Trinidad and Tobago: Caribbean Educational Publishers Limited, 2007.
Upton, G. and Cook, J. Introducing Statistics, Oxford: Oxford University Press, 2001.
CXC A9/U2/07 24
♦ UNIT 2: MATHEMATICAL APPLICATIONSMODULE 1: DISCRETE MATHEMATICS
GENERAL OBJECTIVES
On completion of this Module, students should:
1. understand the concept of linear programming to formulate models in a real-world context;
2. understand the terms, concepts and methods used in graph theory;
3. understand basic network concepts;
4. understand basic concepts and applications of Boolean Algebra;
5. have the ability to employ truth table techniques to establish the validity of statements;
6. appreciate the application of discrete methods in efficiently addressing real-world situations.
SPECIFIC OBJECTIVES
(a) Linear Programming
Students should be able to:
1. derive and graph linear inequalities in two variables;
2. determine whether a selected trial point satisfies a given inequality;
3. determine the solution set that satisfies a set of linear inequalities in two variables;
4. determine the feasible region of a linear programming problem;
5. identify the objective function and constraints of a linear programming problem;
6. determine a unique optimal solution (where it exists) of a linear programming problem;
7. formulate linear programming models in two variables from real-world data.
CXC A9/U2/07 25
UNIT 2 MODULE 1: DISCRETE MATHEMATICS (cont’d)
CONTENT
(a) Linear Programming
(i) Graphical representation of linear inequalities in two variables.
(ii) Solution set for linear inequalities in two variables.
(iii) Formulation of linear programming models from real-world data.
SPECIFIC OBJECTIVES
(b ) Ass ignment Models
Students should be able to:
1. model a weighted assignment (or allocation) problem as an m x n matrix (where m is the number of rows and n isthe number of columns);
2. convert non-square matrix models to square matrix models with the addition of rows or columns of dummy entriesthat take the maximum (minimum) value of all entries in the minimisation (maximisation) assignment problem;
3. convert a maximisation assignment problem into a minimisation problem (by changing the sign of each entry);
4. solve a minimisation assignment problem (of complexity 5 x 5 or less) by the Hungarian algorithm. (Theconvention of reducing rows before columns will be followed.
CONTENT
(b ) Assignment Models
(i) Models of assignment problems.
(ii) Maximum and minimum assignment problems.
(iii) Hungarian algorithm.
CXC A9/U2/07 26
UNIT 2 MODULE 1: DISCRETE MATHEMATICS (cont’d)
SPECIFIC OBJECTIVES
(c ) Graph Theory and Crit ica l Path Analys i s
Students should be able to:
1. identify the vertices and sequence of edges that make up a path;
2. determine the degree of a vertex;
3. use networks as models of real-world situations;
4. use the activity network algorithm in drawing a network diagram to model a real-world problem(activities will be represented by vertices and the duration of activities by edges);
5. calculate the earliest start time, latest start time, earliest finish time, latest finish time and float time;
6. identify the critical path in an activity network;
7. use the activity network in decision making
8. use networks as models of real-world situations;
9. use the activity network algorithm in drawing a network diagram to model a real-world problem(activities will be represented by vertices and the duration of activities by edges);
10. calculate the earliest start time, latest start time and float time;
11. identify the critical path in an activity network;
12. use the critical path in decision making.
CONTENT
(c) Graph Theory and Critical Path Analysis
(i) Graph theory terminology: vertex, edge, path, degree (of a vertex).
(ii) Earliest and latest starting times, float time.
(iii) Networks.
(iv) Critical path.
CXC A9/U2/07 27
UNIT 2 MODULE 1: DISCRETE MATHEMATICS (cont’d)
SPECIFIC OBJECTIVES
(c) Logic and Boolean Algebra
Students should be able to:
1. formulate (in symbols or in words):
(i) simple propositions,
(ii) the negation of simple propositions,
(iii) compound propositions,
(iv) compound propositions that involve conjunctions, disjunctions and negations,
(v) conditional and bi-conditional propositions;
2. establish the truth value of:
(i) the negation of simple propositions,
(ii) compound propositions that involve conjunctions, disjunctions and negations,
(iii) conditional and bi-conditional propositions;
3. state the converse, inverse and contrapositive of implications of propositions;
4. use truth tables to:
(i) determine whether a proposition is a tautology or a contradiction,
(ii) establish the truth values of the converse, inverse and contrapositive of propositions,
(iii) determine if propositions are equivalent;
5. use the laws of Boolean algebra (idempotent, complement, identity, commutative, associative, distributive,absorption, de Morgan’s Law) to simplify Boolean expressions;
6. derive a Boolean expression from a given switching or logic circuit;
CXC A9/U2/07 28
UNIT 2 MODULE 1: DISCRETE MATHEMATICS (cont’d)
7. represent a Boolean expression by a switching or logic circuit;
8. use switching and logic circuits to model real-world situations.
CONTENT
(d) Logic and Boolean Algebra
(i) Algebra of propositions.
(ii) Truth tables.
(iii) Converse, inverse and contrapositive of propositions.
(iv) Tautologies and contradictions.
(v) Logical equivalencies and implications.
(vi) Application of algebra of propositions to mathematical logic.
(vii) Boolean Algebra.
(viii) Application of Boolean algebra to switching and logic circuits.
Suggested Teaching and Learning Activities
To facilitate students’ attainment of the objectives of this Module, teachers are advised to engage students in the teaching and learning activities listed below.
Critical Path Analysis
The critical path in an activity network has proven to be very useful to plan, schedule and control a wide variety of activities and projects in real-world situations. These projects include construction of plants, buildings, roads, the design and installation of new systems, finding the shortest route in a connected set of roads, organizing a wedding, and organizing a regional cricket competition.
Staying on the critical path in an activity network designed for the construction of a building, for example, ensures that the building is completed as scheduled.
This topic is appropriate for the project work a student may be required to do. For example, a student could design an activity network for a local community project (a small building) and establish the critical path to ensure that this building is completed as scheduled within a given budget. This same technique could be
CXC A9/U2/07 29
employed to map out the shortest route from the airport to the local cricket field in a small village – another project!
Below is an example of one activity.
Discuss the route of a postman in a community with a crisscross of streets and houses situated on both sides of the street. Plan the route that best serves to save on time and avoid returning along the same street. A simple diagram may be used.
RESOURCES
Bloomfield, I. and Stevens, J. Discrete & Decision, Cheltenham: Nelson and Thornes, 2002.
Bloomfield, I. and Stevens, J. Discrete & Decision, Cheltenham: Teacher Resource File, 2002.
Bolt, B. and Hobbs, D. 101 Mathematical Projects: A Resource Book, U.K.: Cambridge University Press, 1994.
Bryant, V. Advancing Mathematics for AQA Discrete Mathematics I, Oxford: Heinemann Educational Publishers, 2001.
Peter, G. W. (Ed.) Discrete Mathematics, Oxford: Heinemann Educational, 1992.
Ramirez, A. and Perriot, L. Applied Mathematics, Barbados: Caribbean Examinations Council, 2004.
CXC A9/U2/07 30
UNIT 2 MODULE 2: PROBABILITY AND DISTRIBUTIONS
GENERAL OBJECTIVES
On completion of this Module, students should:
1. apply counting techniques and calculus in probability;
2. appreciate that probability models can be used to describe real-world situations;
3. apply appropriate distributional approximations to data;
4. assess the appropriateness of distributions to data.
SPECIFIC OBJECTIVES
(a) Probability
Students should be able to:
1. calculate the number of selections of n distinct objects taken r at a time, with or without restrictions;
2. calculate the number of ordered arrangements of n objects taken r at a time, with or withoutrestrictions;
3. calculate probabilities of events (which may be combined by unions or intersections) using appropriate countingtechniques;
4. calculate and use probabilities associated with conditional, independent or mutually exclusive events.
CONTENT
(a) Probability
(i) Counting principles.
(ii) Concept of probability.
(iii) Union and intersection of events.
(iv) Conditional, independent and mutually exclusive events.
CXC A9/U2/07 31
UNIT 2 MODULE 2: PROBABILITY AND DISTRIBUTIONS (cont’d)
SPECIFIC OBJECTIVES
(b) Discrete Random Variables
Students should be able to:
1. apply the properties:
2. formulate and use the probability function f(x) = P(X=x) where f is a simple polynomial or rationalfunction;
3. calculate and use the expected values and variance of linear combinations of independent random variables;
4. model practical situations in which the discrete uniform, binomial, geometric or Poisson distributionsare suitable;
5. apply the formulae:
(i) , where x =
(ii) , =0, 1, 2, 3,…..n
(iii) , where
(iv) , x = 0, 1, 2, 3, …
to calculate probabilities in the discrete uniform, binomial, geometric or Poisson distributions respectively;
6. use the formulae for E(X) and Var(X) where X follows a discrete uniform, binomial, geometric orPoisson distribution;
7. use the Poisson distribution as an approximation to the binomial distribution, where appropriate.
CXC A9/U2/07 32
UNIT 2 MODULE 2: PROBABILITY AND DISTRIBUTIONS (cont’d) CONTENT
(b) Discrete Random Variables
(i) Probability function of a discrete random variable.
(ii) Expectation and variance of a linear combination of independent random variables.
(iii) Special discrete distributions: uniform, binomial, geometric and Poisson.
(iv) Poisson approximation to binomial distribution.
SPECIFIC OBJECTIVES
(c) Continuous Random Variables
Students should be able to:
1. apply the properties of the probability density function f of a continuous random variable X
i.
ii.
where f is a probability density function (f will be restricted to simple polynomials);
2. use the cumulative distribution function ;
3. use the result =
4. calculate expected value, variance, median and other quartiles;
5. solve problems involving probabilities of the normal distribution using scores;
6. use the normal distribution, with a continuity correction, to approximate the Poisson distribution, as appropriate (λ > 15).
CONTENT
(c) Continuous Random Variables
(i) Properties of a continuous random variable.
(ii) Probability density function and cumulative distribution function.
CXC A9/U2/07 33
UNIT 2 MODULE 2: PROBABILITY AND DISTRIBUTIONS (cont’d)
(iii) Expectation and variance of a continuous random variable.
(iv) Medians, quartiles and percentiles.
(v) The normal distribution.
(vi) Normal approximation to the Poisson distribution.
SPECIFIC OBJECTIVE
(d) χ2-test
Students should be able to carry out a Chi-square (χ2) goodness-of-fit test, with appropriate number of degrees of freedom. (Only situations modelled by a discrete uniform, binomial, geometric, Poisson or normal distribution will be tested. Classes should be combined in cases where the expected frequency is less then 5). Cases requiring the use of Yates’ continuity correction will not be tested.
CONTENT
(d) χ2-test
Goodness–of–fit test.
Suggested Teaching and Learning Activities
To facilitate students’ attainment of the objectives of this Module, teachers are advised to engage students in the teaching and learning activities listed below.
1. Probability
While teaching counting principles, the concepts of independence and mutually exclusive events should beintroduced.
2. Discrete Random Variables
Computation of expected values and variances will not entail lengthy calculations or the summation ofseries.
The difference between discrete and continuous random variables could be illustrated by using real life situations.
CXC A9/U2/07 34
UNIT 2 MODULE 2: PROBABILITY AND DISTRIBUTIONS (cont’d)
3. Continuous Random Variables
Students may need to be introduced to the integration of simple polynomials.
RESOURCES
Chambers, J., and Crawshaw, J. A Concise Course in Advanced Level Statistics, Cheltenham: Stanley Thornes Limited, 2001.
Graham, G. and Cook, I. Introducing Statistics: Oxford: Oxford University Press, 2001.
CXC A9/U2/07 35
UNIT 2 MODULE 3: PARTICLE MECHANICS
GENERAL OBJECTIVES
On completion of this Module, students should:
1. understand forces and their applications;
2. understand the concepts of work, energy and power;
3. appreciate the application of mathematical models to the motion of a particle.
SPECIFIC OBJECTIVES
(a) Coplanar Forces and Equilibrium
Students should be able to:
1. identify forces (including gravitational forces) acting on a body in a given situation;
2. use vector notation to represent forces;
3. represent the contact force between two surfaces in terms of its normal and frictional component;
4. calculate the resultant of two or more coplanar forces;
5. resolve forces, on particles, in mutually perpendicular directions (including those on inclined planes);
6. use the principle that, for a particle in equilibrium, the vector sum of its forces is zero, (or equivalently the sum ofits components in any direction is zero);
7. use the appropriate relationship F = µR or F ≤ µR for two bodies in limiting equilibrium;
8. solve problems involving concurrent forces in equilibrium, (which may involve the use of Lami’s Theorem).
CONTENT
(a) Coplanar Forces and Equilibrium
(i) Vectors.
(ii) Resolution of forces.
(iii) Forces as Vectors.
CXC A9/U2/07 36
UNIT 2 MODULE 3: PARTICLE MECHANICS (cont’d)
(iv) Concurrent forces in equilibrium.
(v) Friction.
(vi) Lami’s Theorem.
SPECIFIC OBJECTIVES
(b) Kinematics and Dynamics
Students should be able to:
1. distinguish between distance and displacement, and speed and velocity;
2. draw and use displacement-time and velocity-time graphs;
3. calculate and use displacement, velocity, acceleration and time in simple equations representing themotion of a particle in a straight line;
4. apply Newton’s laws of motion to:
(i) a constant mass moving in a straight line under the action of a constant force,
(ii) a particle moving vertically or on an inclined plane (rough or smooth) with constant acceleration,
(iii) a system of two connected particles (problems may involve particles moving in a straight line or under gravity, or particles connected by a light, inextensible string passing over a fixed, smooth, light pulley);
5. apply where appropriate the following rates of change:
where represent displacement, velocity and acceleration respectively;
6. formulate and solve first order differential equations as models of the linear motion of a particle whenthe applied force is proportional to its displacement or its velocity (only differential equations wherethe variables are separable will be required);
7. apply the principle of conservation of linear momentum to the direct impact of two inelastic particlesmoving in the same straight line. (Knowledge of impulse is required. Problems may involve two-dimensionalvectors).
CXC A9/U2/07 37
UNIT 2 MODULE 3: PARTICLE MECHANICS (cont’d)
CONTENT
(b) Kinematics and Dynamics
(i) Kinematics of motion in a straight line.
(ii) Velocity-time and displacement-time graphs.
(iii) Newton’s laws of motion.
(iv) Displacement, velocity and acceleration.
(v) First-order differential equations for motion of a particle in a straight line.
(vi) Linear momentum.
(vii) Impulse.
SPECIFIC OBJECTIVES
(c) Projectiles
Students should be able to:
1. model the projectile of a particle moving under constant gravitational force (neglecting air resistance);
2. formulate the equation of the trajectory of a projectile. (Problems may involve velocity expressed in vector notation);
3. use the equations of motion for a projectile to determine:
(i) the magnitude and direction of the velocity of the particle at any time, t;
(ii) the position of the projectile at any time, t;
(iii) the time of flight and the horizontal range of the projectile;
(iv) the maximum range;
(v) the greatest height.
CXC A9/U2/07 38
UNIT 2 MODULE 3: PARTICLE MECHANICS (cont’d)
CONTENT
(c) Projectiles
(i) Modelling the projectile of a particle (including the use of vectors).
(ii) Properties of a projectile.
SPECIFIC OBJECTIVES
(d) Work, Energy and Power
Students should be able to:
1. calculate the work done by a constant force;
2. calculate the work done by a variable force in one-dimension;
3. solve problems involving kinetic energy and gravitational potential energy;
4. apply the principle of conservation of energy;
5. solve problems involving power;
6. apply the work-energy principle in solving problems.
CONTENT
(d) Work, Energy and Power
(i) Work done by a constant force.
(ii) Work done by a variable force.
(iii) Kinetic and potential energy.
(iv) Principle of conservation of energy.
(v) Power.
(vi) Work-energy principle.
CXC A9/U2/07 39
UNIT 2 MODULE 3: PARTICLE MECHANICS (cont’d)
Suggested Teaching and Learning Activities
To facilitate students’ attainment of the objectives of this Module, teachers are advised to engage students in the teaching and learning activities listed below.
1. COPLANAR FORCES AND EQUILIBRIUM
Vectors
Teachers are advised to ensure that students have practice in dealing with vectors (see Module 2 Unit 1 of the Pure Mathematics syllabus) in order to represent a force as a vector.
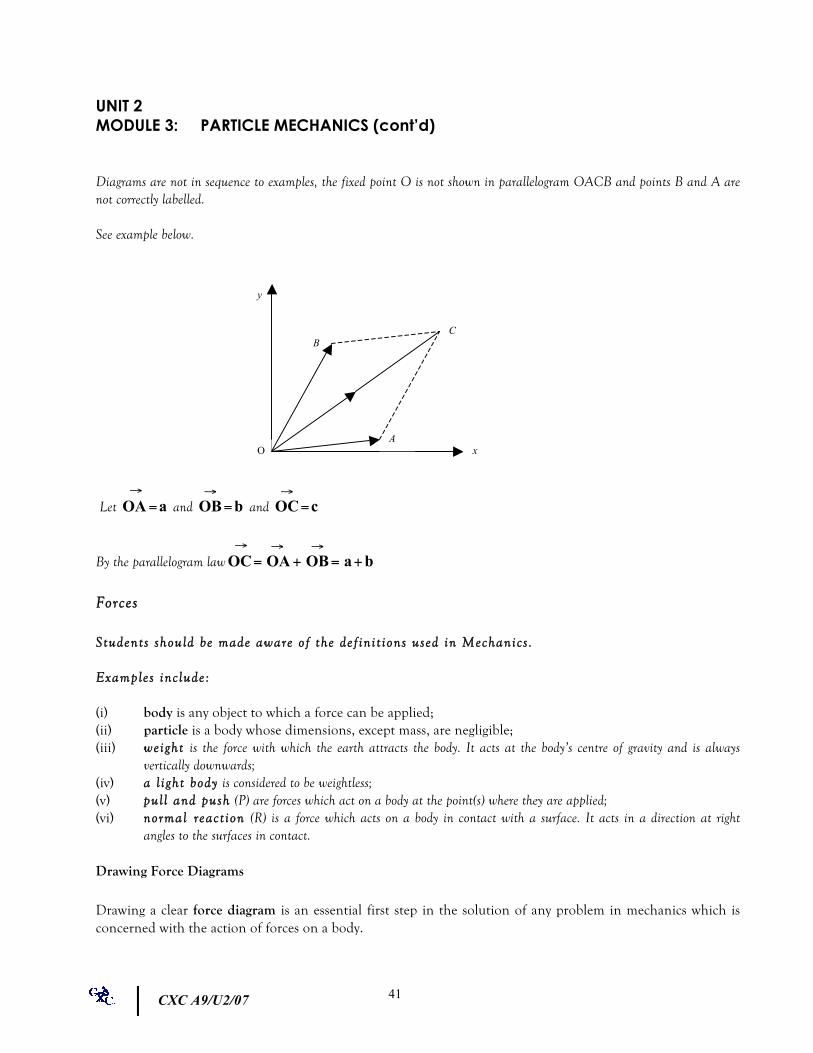
Resolution of Forces
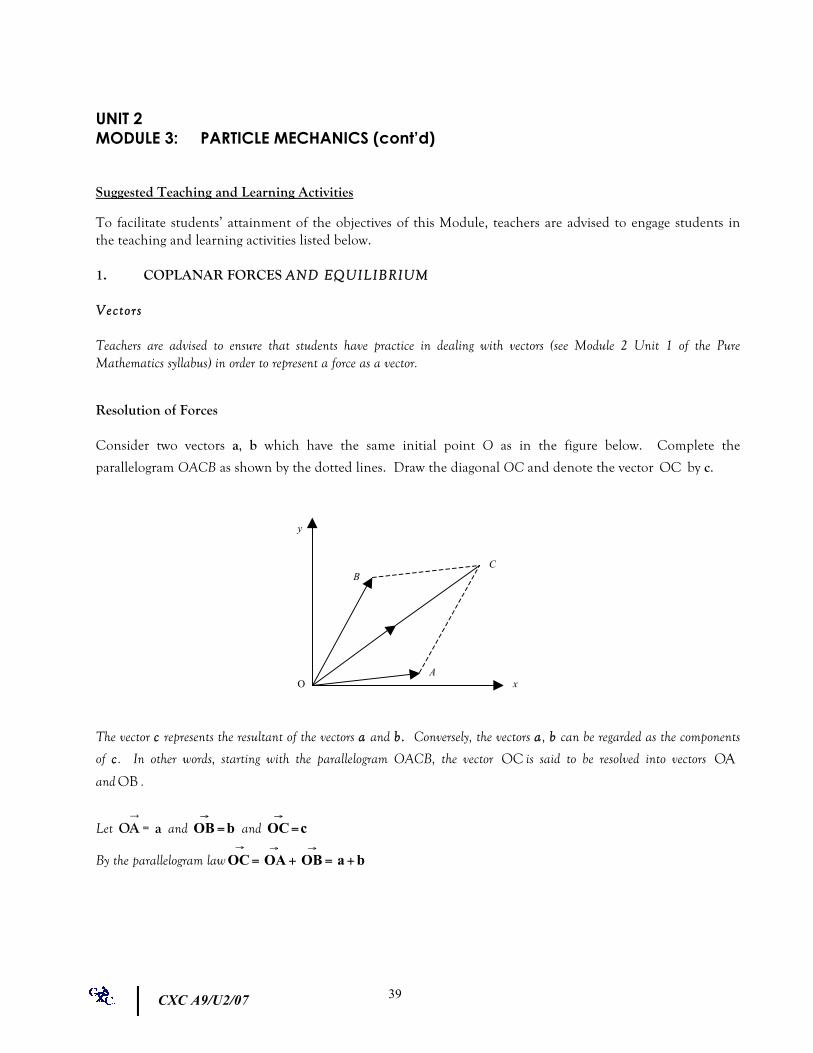
Consider two vectors a, b which have the same initial point O as in the figure below. Complete the
parallelogram OACB as shown by the dotted lines. Draw the diagonal OC and denote the vector by c.
The vector c represents the resultant of the vectors a and b . Conversely, the vectors a , b can be regarded as the components
of c . In other words, starting with the parallelogram OACB, the vector is said to be resolved into vectors
and .
Let and and
By the parallelogram law
y
O x A
B B
C
CXC A9/U2/07 40
A
C
B b
a
c
UNIT 2 MODULE 3: PARTICLE MECHANICS (cont’d)
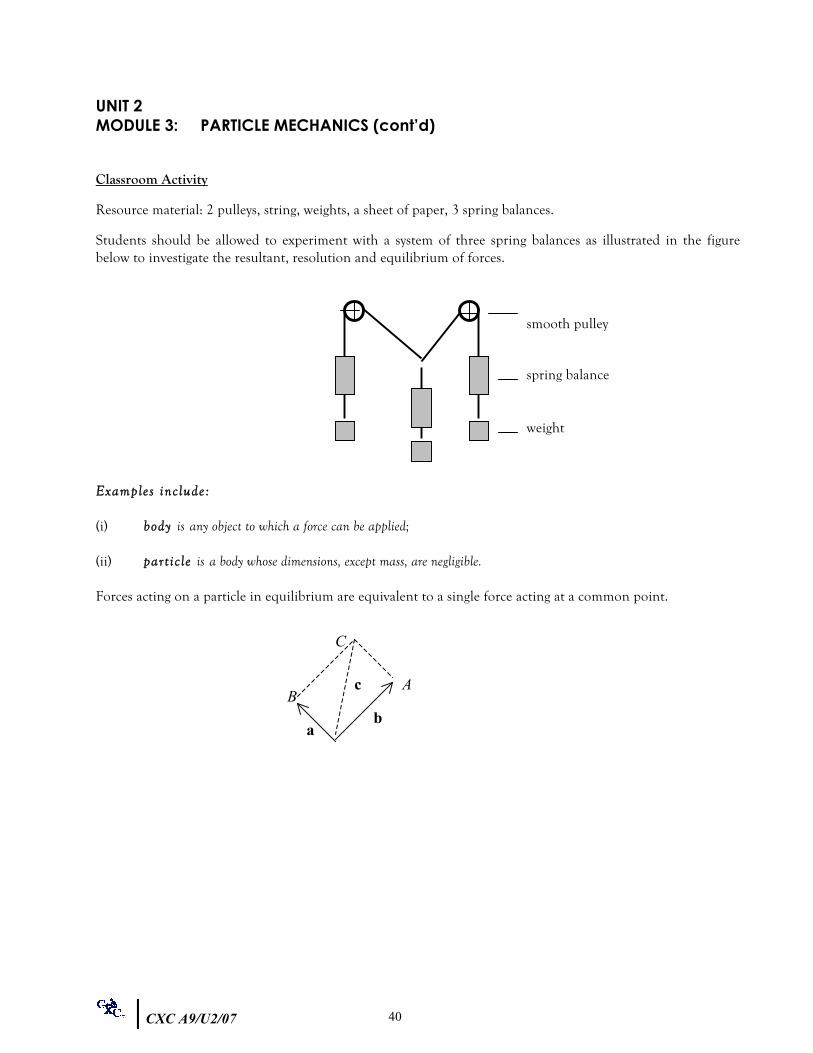
Classroom Activity
Resource material: 2 pulleys, string, weights, a sheet of paper, 3 spring balances.
Students should be allowed to experiment with a system of three spring balances as illustrated in the figure below to investigate the resultant, resolution and equilibrium of forces.
Examples inc lude:
(i) body is any object to which a force can be applied;
(ii) part ic le is a body whose dimensions, except mass, are negligible.
Forces acting on a particle in equilibrium are equivalent to a single force acting at a common point.
spring balance
weight
smooth pulley
CXC A9/U2/07 41
UNIT 2 MODULE 3: PARTICLE MECHANICS (cont’d)
Diagrams are not in sequence to examples, the fixed point O is not shown in parallelogram OACB and points B and A are not correctly labelled.
See example below.
Let and and
By the parallelogram law
Forces
Students should be made aware of the def in i t ions used in Mechanics .
Examples inc lude:
(i) body is any object to which a force can be applied; (ii) particle is a body whose dimensions, except mass, are negligible; (iii) weight is the force with which the earth attracts the body. It acts at the body’s centre of gravity and is always
vertically downwards; (iv) a l ight body is considered to be weightless; (v) pul l and push (P) are forces which act on a body at the point(s) where they are applied; (vi) normal react ion (R) is a force which acts on a body in contact with a surface. It acts in a direction at right
angles to the surfaces in contact.
Drawing Force Diagrams
Drawing a clear force diagram is an essential first step in the solution of any problem in mechanics which is concerned with the action of forces on a body.
y
O x A
B B
C
CXC A9/U2/07 42
UNIT 2 MODULE 3: PARTICLE MECHANICS (cont’d)
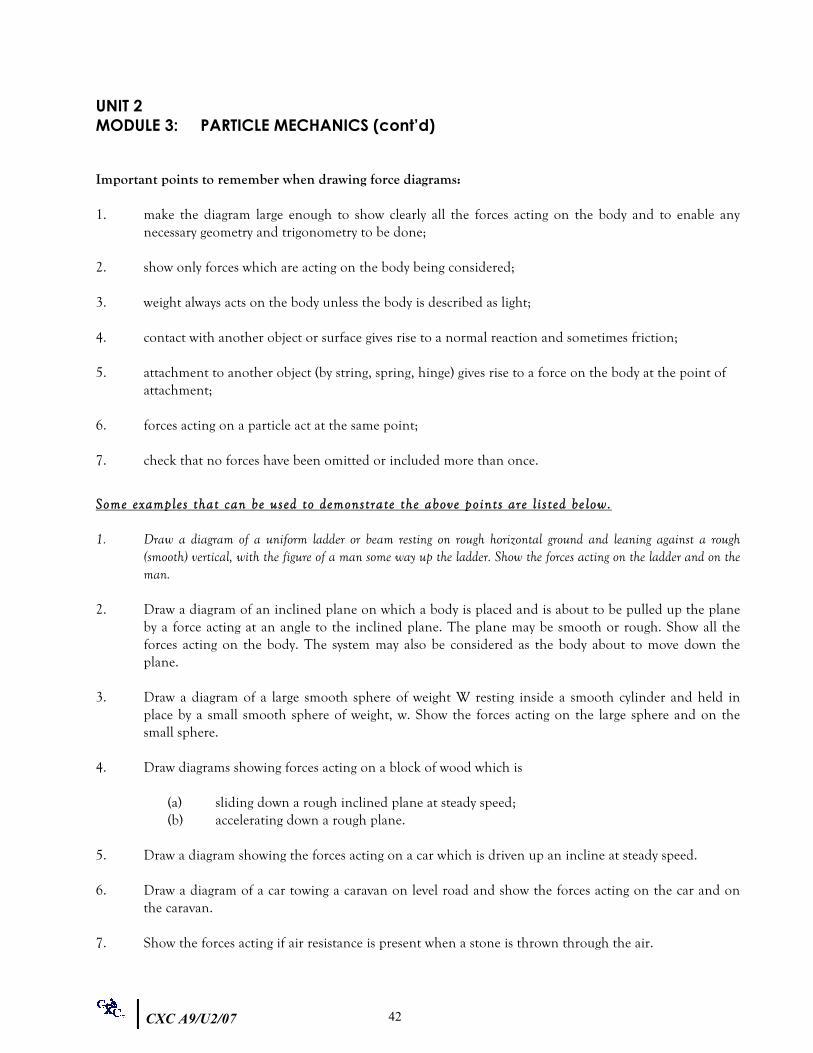
Important points to remember when drawing force diagrams:
1. make the diagram large enough to show clearly all the forces acting on the body and to enable anynecessary geometry and trigonometry to be done;
2. show only forces which are acting on the body being considered;
3. weight always acts on the body unless the body is described as light;
4. contact with another object or surface gives rise to a normal reaction and sometimes friction;
5. attachment to another object (by string, spring, hinge) gives rise to a force on the body at the point ofattachment;
6. forces acting on a particle act at the same point;
7. check that no forces have been omitted or included more than once.
Some examples that can be used to demonstrate the above points are l i s ted be low.
1. Draw a diagram of a uniform ladder or beam resting on rough horizontal ground and leaning against a rough(smooth) vertical, with the figure of a man some way up the ladder. Show the forces acting on the ladder and on theman.
2. Draw a diagram of an inclined plane on which a body is placed and is about to be pulled up the planeby a force acting at an angle to the inclined plane. The plane may be smooth or rough. Show all theforces acting on the body. The system may also be considered as the body about to move down theplane.
3. Draw a diagram of a large smooth sphere of weight W resting inside a smooth cylinder and held inplace by a small smooth sphere of weight, w. Show the forces acting on the large sphere and on thesmall sphere.
4. Draw diagrams showing forces acting on a block of wood which is
(a) sliding down a rough inclined plane at steady speed; (b) accelerating down a rough plane.
5. Draw a diagram showing the forces acting on a car which is driven up an incline at steady speed.
6. Draw a diagram of a car towing a caravan on level road and show the forces acting on the car and onthe caravan.
7. Show the forces acting if air resistance is present when a stone is thrown through the air.
CXC A9/U2/07 43
UNIT 2 MODULE 3: PARTICLE MECHANICS (cont’d)
8. A man is standing alone in a moving lift. Draw a diagram to show the forces acting on:
(a) the man; (b) the lift, when it is accelerating upwards; (c) the lift, when it is travelling at steady speed; and (d) the lift, when it is accelerating downwards.
9. A railway engine is pulling a train up an incline against frictional resistances. If the combined engineand train are experiencing a retardation, draw diagrams to show the forces acting on the engine andforces acting on the train.
2. KINEMATICS AND DYNAMICS
Definitions
Displacement is the position of a point relative to a fixed origin O. It is a vector. The SI Unit is the metre (m). Other metric units are centimeter (cm), kilometer (km).
Velocity is the rate of change of displacement with respect to time. It is a vector. The SI Unit is metre per second (m s –1). Other metric units are cm s –1, kmh–1.
Speed is the magnitude of the velocity and is a scalar quantity.
Uniform velocity is the constant speed in a fixed direction.
Average velocity – change in displacement time taken
Average speed – total distance travelled time taken
Acceleration is the rate of change of velocity with respect to time. It is a vector. The SI Unit is metre per second square (m s–2). Other metric units are cm s –2, km h –2.
Negative acceleration is also referred to as retardation.
Uniform acceleration is the constant acceleration in a fixed direction.
Motion in one dimension – When a particle moves in one dimension, that is, along a straight line, it has only two possible directions in which to move. Positive and negative signs are used to identify the two directions.
Vertical motion under gravity – this is a special case of uniform acceleration in a straight line. The body is thrown vertically upward, or falling freely downward. This uniform acceleration is due to gravity and acts vertically downwards towards the centre of the earth. It is denoted by g and may be approximated by 9.8 m s –2 or 10 m s –2.
CXC A9/U2/07 44
UNIT 2 MODULE 3: PARTICLE MECHANICS (cont’d)
Graphs in Kinematics
A displacement-time graph for a body moving in a straight line shows its displacement x from a fixed point on the line plotted against time, t. The velocity v of the body at time, t is given by the gradient of the graph since
.
The displacement-time graph for a body moving with constant velocity is a straight line. The velocity, v of the body is given by the gradient of the line.
The displacement-time graph for a body moving with variable velocity is a curve. The velocity at any time, t may be estimated from the gradient of the tangent to the curve at that time. The average velocity between two times may be estimated from the gradient of the chord joining them.
Velocity-time graph for a body moving in a straight line shows its velocity v plotted against time, t.
The acceleration, a of the body at time, t is given by the gradient of the graph at t, since .
The displacement in a time interval is given by the area under the velocity-time graph for that time interval
since .
The velocity-time graph for a body moving with uniform acceleration is a straight line. The acceleration of the body is given by the gradient of the line.
Particle Dynamics
Force is necessary to cause a body to accelerate. More than one force may act on a body. If the forces on a body are in equilibrium, then the body may be at rest or moving in a straight line at constant speed.
If forces are acting on a body, then the body will accelerate in the direction of the resultant force. Force is a vector; that is, it has magnitude and direction. The SI Unit is the newton (N). One newton is the force needed to give a body a mass of 1 kg an acceleration of 1 ms –2.
Mass and Weight are different. The mass of a body is a measure of the matter contained in the body. A massive body will need a large force to change its motion. The mass of a body may be considered to be uniform, whatever the position of the body, provided that no part of the body is destroyed or changed.
Mass is a scalar quantity; that is, it has magnitude only. The SI Unit of mass is the kilogram (kg). However, for heavy objects it is sometimes more convenient to give mass in tonnes, where 1 tonne = 1000 kg.
CXC A9/U2/07 45
UNIT 2 MODULE 3: PARTICLE MECHANICS (cont’d)
The weight of a body is the force with which the earth attracts that body. It is dependent upon the body’s distance from the centre of the earth, so a body weighs less at the top of Mount Everest than it does at sea level.
Weight is a vector since it is a force. The SI Unit of weight is the newton (N). The weight, W, in newtons, and mass, m, in kilograms, of a body are connected by the relation W = mg, where g is the acceleration due to gravity, in m s –2.
Newton’s three laws of motion are the basis of the study of mechanics at this level.
1st Law: A body will remain at rest or continue to move in a straight line at constant speed unless an external force acts on it.
(a) If a body has an acceleration, then there must be a force acting on it.
(b) If a body has no acceleration, then the forces acting on it must be in equilibrium.
2nd Law: The rate of change of momentum of a moving body is proportional to the external forces acting on it and takes place in the direction of that force. When an external force acts on a body of uniform mass, the force produces an acceleration which is directly proportional to the force.
(a) The basic equation of motion for constant mass is
Force = mass acceleration (in N) (in kg) (in m s –2)
(b) The force and acceleration of the body are both in the same direction.
(c) A constant force on a constant mass gives a constant acceleration.
3rd Law: If a body, A exerts a force on a body, B, then B exerts an equal and opposite force on A. These forces between bodies are often called reactions. In a rigid body the internal forces occur as equal and opposite pairs and the net effect is zero. So only external forces need be considered.
The following are important points to remember when solving problems using Newton’s laws of motion:
(a) Draw a clear force diagram.
(b) If there is no acceleration, that is, the body is either at rest or moving with uniform velocity, then the forces balance in each direction.
(c) If there is an acceleration:
(i) use the symbol to represent it on the diagram, (ii) write, if possible, an expression for the resultant force, (iii) use Newton’s 2nd law, that is, write the equation of motion: F = ma
CXC A9/U2/07 46
UNIT 2 MODULE 3: PARTICLE MECHANICS (cont’d)
Connected Particles
Two particles connected by a light inextensible string which passes over a fixed light smooth (frictionless) pulley are called connected particles. The tension in the string is the same throughout its length, so each particle is acted upon by the same tension.
Problems concerned with connected particles usually involve finding the acceleration of the system and the tension in the string.
To solve problems of this type:
(i) draw a clear diagram showing the forces on each particle and the common acceleration;
(ii) write the equation of motion, that is, F = ma for each particle separately;
(iii) solve the two equations to find the common acceleration, a, and possibly the tension, T, in the string.
Systems may include:
(i) one particle resting on a smooth or rough horizontal table with a light inextensible string attached and passing over a fixed small smooth pulley at the edge of the table and with its other end attached to another particle which is allowed to hang freely;
(ii) as in (i), two light inextensible strings may be attached to opposite ends of a particle resting on a smooth or rough horizontal table and passing over fixed small smooth pulleys at either edge of the table and with their other ends attached to particles of different masses which are allowed to hang freely;
(iii) one particle resting on a smooth or rough inclined plane and attached to a light inextensible string which passes over a fixed small smooth pulley at the top of the incline and with its other end attached to another mass which is allowed to hang freely.
3. WORK, ENERGY AND POWER
Work may be done either by or against a force (often gravity). It is a scalar. When a constant force F moves its point of application along a straight line through a distance s, the work done by F is F.s. The SI Unit of work is the joule (J). One joule is the work done by a force of one newton in moving its point of application one metre in the direction of the force.
Energy is the capacity to do work and is a scalar. The SI Unit of energy is the joule (the same as work).
A body possessing energy can do work and lose energy. Work can be done on a body and increase its energy, that is, work done = change in energy.
CXC A9/U2/07 47
UNIT 2 MODULE 3: PARTICLE MECHANICS (cont’d)
Kinetic and Potential Energy – are types of mechanical energy.
(a) Kinetic energy (K.E.) is due to a body’s motion. The K.E. of a body of mass, m, moving with velocity, v,
is .
(b) Gravitational Potential Energy (G.P.E.) is dependent on height. The P.E. of a body of mass m at a height h,
(i) above an initial level is given by mgh,
(ii) below an initial level is given by – mgh.
The P.E. at the initial level is zero (any level can be chosen as the initial level).
Mechanical Energy - (M.E.) of a particle (or body) = P.E. + K.E. of the particle (or body).
M.E. is lost (as heat energy or sound energy) when we have: - resistances (friction) or impulses (collisions or strings becoming taut).
Conservation of Mechanical Energy - The total mechanical energy of a body (or system) will be conserved if
(a) no external force (other than gravity) causes work to be done, and
(b) none of the M.E. is converted to other forms. Given these conditions:
P.E. + K.E. = constant or loss in P.E. = gain in K.E. or loss in K.E. = gain in P.E.
Power – is the rate at which a force does work. It is a scalar. The SI Unit of power is the watt (W). One watt (W) = one joule per second (J s –1). The kilowatt (kW), 1 kW = 1000 W is used for large quantities.
When a body is moving in a straight line with velocity v m s –1 under a tractive force F newtons, the power of the force is P = Fv.
Moving vehicles - The power of a moving vehicle is supplied by its engine. The tractive force of an engine is the pushing force it exerts.
CXC A9/U2/07 48
UNIT 2 MODULE 3: PARTICLE MECHANICS (cont’d)
To solve problems involving moving vehicles:
1. draw a clear force diagram, (non-gravitational resistance means frictional force);
2. resolve forces perpendicular to the direction of motion;
3. if the velocity is:
(a) constant (vehicle moving with steady speed), then resolve forces parallel to the direction of motion;
(b) not constant (vehicle accelerating), then find the resultant force acting and write the equation of motion in the direction of motion.
4. Use power = tractive force × speed.
Common situations that may arise are:
(a) vehicles on the level moving with steady speed, v;
(b) vehicles moving on the level with acceleration, a, and instantaneous speed, v;
(c) vehicles on a slope of angle, α moving with steady speed, v, either up or down the slope;
(d) vehicles on a slope moving with acceleration, a and instantaneous speed, v, up or down the slope.
Impulse and Momentum
The impulse of a force F, constant or variable, is equal to the change in momentum it produces. If a force, F acts for a time, t, on a body of mass, m, changing its velocity from u to v then Impulse = mv – mu.
Impulse is the time effect of a force. It is a vector and for a constant force F acting for time, t; impulse = Ft.
For a variable force, F acting for time, t, impulse =
The SI Unit of impulse is the newton second (Ns).
The momentum of a moving body is the product of its mass m and velocity v that is, mv. It is a vector whose direction is that of the velocity and the SI Unit of momentum is the newton second (Ns).
Conservation of Momentum: The principle of conservation of momentum states that the total momentum of a system is constant in any direction provided no external force acts in that direction. Initial momentum = final momentum. In this context a system is usually two bodies.
CXC A9/U2/07 49
UNIT 2 MODULE 3: PARTICLE MECHANICS (cont’d)
Problem solving
Problems concerning impulse and momentum usually involve finding the impulse acting or the velocity on the mass of a body of a system.
To find an impulse for such a system write the impulse equation on each body. To find a velocity or mass for such a system write the equation of the conservation of momentum.
Direct Impact – takes place when two spheres of equal radii are moving along the same straight line and collide.
Direct Impact with a Wall - When a smooth sphere collides directly with a smooth vertical wall, the sphere’s direction of motion is perpendicular to the wall. The sphere receives an impulse perpendicular to the wall.
RESOURCES
Bostock, L. and Chandler, S.
Mechanics for A-Level, Cheltenham, United Kingdom: Stanley Thornes (Publishers) Limited, 1996.
Graham, T. Mechanics, Oxford: Collins Educational, 1995.
Hebborn, J., Littlewood J. and Norton, F.
Heinemann Modular Mathematics for London AS and A-Level Mechanics 1 and 2, Oxford: Heinemann Educational Publishers, 1994.
Jefferson, B., and Beadsworth, T. Introducing Mechanics, Oxford: University Press, 1996.
Price, N. (Editor) AEB Mechanics for AS and A-Level, Oxford: Heinemann Publishers, 1997.
Sadler, A.J., and Thorning, D.W.S. Understanding Mechanics, Oxford: Oxford University Press, 1996.
CXC A9/U2/07 50
♦ OUTLINE OF ASSESSMENT
A candidate’s performance is reported as an overall grade and a grade on each Module. The assessment comprises two components, one external and one internal.
EXTERNAL ASSESSMENT (80%)
The candidate is required to sit a multiple choice paper and a written paper for a total of 4 hours.
Paper 01 (1 hour 30 minutes)
This paper comprises forty-five compulsory multiple choice items, 15 from each module. Each item is worth 1 mark.
30%
Paper 02 (2 hours 30 minutes)
This paper comprises six compulsory extended-response questions.
50%
INTERNAL ASSESSMENT (20%)
Internal Assessment in respect of each Unit will contribute 20% to the total assessment of a candidate’s performance on that Unit.
Paper 03A for Unit 1
This paper is intended for candidates registered through schools.
The Internal Assessment comprises a project designed and internally assessed by the teacher and externally moderated by CXC. It may take the form of mathematical modelling, investigations, applications or statistical surveys.
Paper 03A for Unit 2
This paper is intended for candidates registered through a school or other approved institution.
The paper consists of a project requiring candidates to:
(i) apply mathematical concepts and skills (acquired by the candidate) to probe, describe and explain common everyday occurrences or some phenomenon of interest to the candidate;
(ii) think in mathematical terms about how the associated tasks are being carried out.
CXC A9/U2/07 51
Paper 03B (Alternative to Paper 03A), examined externally
This paper is an alternative for Paper 03A and is intended for private candidates. The paper comprises three questions. The duration of the paper is 1½ hours. In Unit 1, the three questions collectively span the syllabus. In Unit 2, each question is based on the topics contained in one Module.
MODERATION OF INTERNAL ASSESSMENT
Each year an Internal Assessment Record Sheet will be sent to schools submitting candidates for the examinations.
All Internal Assessment Record Sheets and samples of assignments must be submitted to CXC by May 31 of the year of the examination. A sample of assignments must be submitted to CXC for moderation purposes. The projects will be re-assessed by CXC Examiners who moderate the Internal Assessment. The teacher’s marks may be adjusted as a result of the moderation. The Examiners’ comments will be sent to the teacher.
Copies of the candidates’ assignments must be retained by the school until three months after publication by CXC of the examination results.
ASSESSMENT DETAILS
External Assessment by Written Papers (80% of Total Assessment)
Paper 01 (1 hour 30 minutes - 30% of Total Assessment)
1. Composition of papers
(i) This paper consists of forty-five multiple choice items and is partitioned into three sections (Module 1, 2 and 3). Each section contains fifteen questions.
(ii) All items are compulsory.
2. Syllabus Coverage
(i) Knowledge of the entire syllabus is required.
(ii) The paper is designed to test candidates’ knowledge across the breadth of the syllabus.
3. Question Type
Questions may be presented using words, symbols, tables, diagrams or a combination of these.
4. Mark Allocation
(i) Each item is allocated 1 mark.
(ii) Each Module is allocated 15 marks.
CXC A9/U2/07 52
(iii) The total number of marks available for this paper is 45.
(iv) This paper contributes 30% towards the total assessment.
5. Award of Marks
Marks will be awarded for reasoning, algorithmic knowledge and conceptual knowledge.
Reasoning: Clear reasoning, explanation and/or logical argument.
Algorithmic knowledge: Evidence of knowledge, ability to apply concepts and skills, and to analyse a problem in a logical manner.
Conceptual knowledge: Recall or selection of facts or principles; computational skill, numerical accuracy and acceptable tolerance in drawing diagrams.
6. Use of Calculators
(i) Each candidate is required to have a silent non-programmable calculator and is responsible for its functioning.
(ii) The use of calculators with graphical displays will not be permitted.
(iii) Answers found by using a calculator, without relevant working shown, may not be awarded full marks.
(iv) Calculators must not be shared during the examination.
Paper 02 (2 hours 30 minutes - 50% of Total Assessment)
1. Composition of Paper
(i) This paper consists of six questions, two questions from each Module.
(ii) All questions are compulsory. A question may require knowledge of several topics in a Module. However, all topics in a Module may not be given equal emphasis.
2. Syllabus Coverage
(i) Each question may require knowledge from more than one topic in the Module from which the question is taken and will require sustained reasoning.
(ii) Each question may address a single theme or unconnected themes.
CXC A9/U2/07 53
3. Question Type
(i) Questions may require an extended response.
(ii) Questions may be presented using words, symbols, diagrams, tables or combinations of these.
4. Mark Allocation
(i) Each question is worth 25 marks.
(ii) The number of marks allocated to each sub-question will appear in brackets on the examination paper.
(iii) Each Module is allocated 50 marks.
(iv) The total marks available for this paper is 150.
(v) The paper contributes 50% towards the final assessment.
5. Award of Marks
(i) Marks will be awarded for reasoning, algorithmic knowledge and conceptual knowledge.
Reasoning: Clear reasoning, explanation and/ or logical argument.
Algorithmic knowledge: Evidence of knowledge, ability to apply concepts and skills, and to analyse a problem in a logical manner.
Conceptual knowledge: Recall or selection of facts or principles; computational skill, numerical accuracy and acceptable tolerance in drawing diagrams.
(ii) Full marks are awarded for correct answers and the presence of appropriate working.
(iii) It may be possible to earn partial credit for a correct method where the answer is incorrect.
(iv) If an incorrect answer in an earlier question or part-question is used later in a section or a question, then marks may be awarded in the later part even though the original answer is incorrect. In this way, a candidate is not penalized twice for the same mistake.
(v) A correct answer given with no indication of the method used (in the form of written work) will receive no marks. Candidates are, therefore, advised to show all relevant working.
CXC A9/U2/07 54
6. Use of Calculators
(i) Each candidate is required to have a silent non-programmable calculator and is responsible for its functioning.
(ii) The use of calculators with graphical displays will not be permitted.
(iii) Answers found by using a calculator, without relevant working shown, may not be awarded full marks.
(iv) Calculators must not be shared during the examination.
7. Use of Mathematical Tables
A booklet of mathematical formulae will be provided.
INTERNAL ASSESSMENT
Internal Assessment is an integral part of student assessment in the course covered by this syllabus. It is intended to assist students in acquiring certain knowledge, skills, and attitudes that are associated with the subject. The activities for the Internal Assessment are linked to the syllabus and should form part of the learning activities to enable the student to achieve the objectives of the syllabus.
During the course of study for the subject, students obtain marks for the competence they develop and demonstrate in undertaking their Internal Assessment assignments. These marks contribute to the final marks and grades that are awarded to students for their performance in the examination.
The guidelines provided in this syllabus for selecting appropriate tasks are intended to assist teachers and students in selecting assignments that are valid for the purpose of Internal Assessment. The guidelines provided for the assessment of these assignments are intended to assist teachers in awarding marks that are reliable estimates of the achievement of students in the Internal Assessment component of the course. In order to ensure that the scores awarded by teachers are not out of line with the CXC standards, the Council undertakes the moderation of a sample of the Internal Assessment assignments marked by each teacher.
Internal Assessment provides an opportunity to individualise a part of the curriculum to meet the needs of students. It facilitates feedback to the student at various stages of the experience. This helps to build the self-confidence of students as they proceed with their studies. Internal Assessment also facilitates the development of the critical skills and abilities emphasised by this CAPE subject and enhance the validity of the examination on which candidate performance is reported. Internal Assessment, therefore, makes a significant and unique contribution to both the development of relevant skills and the testing and rewarding of students for the development of those skills.
The Caribbean Examinations Council seeks to ensure that the Internal Assessment scores are valid and reliable estimates of accomplishment. The guidelines provided in this syllabus are intended to assist in doing so.
CXC A9/U2/07 55
CRITERIA FOR THE INTERNAL ASSESSMENT (Paper 03A)
Unit 1
This paper is compulsory and consists of a project.
1. The aims of the project are to:
(i) develop candidates’ personal insights into the nature of statistical analysis;
(ii) develop candidates’ abilities to formulate their own questions about statistics;
(iii) encourage candidates to initiate and sustain a statistical investigation;
(iv) provide opportunities for all candidates to show, with confidence, that they have mastered the syllabus;
(v) enable candidates to use the methods and procedures of statistical analysis to describe or explain real-life phenomena.
2. Requirements
(i) The project is written work based on personal research or investigation involving collection, analysis and evaluation of data.
(ii) Each project should include:
(a) a statement of the task;
(b) description of method of data collection;
(c) presentation of data;
(d) analysis of data or measures;
(e) discussion of findings.
(iii) The project may focus on mathematical modelling, investigations, statistical applications or surveys.
(iv) Teachers are expected to guide candidates in choosing appropriate projects that relate to their interests and mathematical expertise.
(v) Candidates should make use of mathematical and statistical skills from any of the Modules.
CXC A9/U2/07 56
3. Integration of Project into the Course
(i) The activities related to project work should be integrated into the course so as to enable candidates to learn and practise the skills of undertaking a successful project.
(ii) Some time in class should be allocated for general discussion of project work. For example, discussion of how data should be collected, how data should be analysed and how data should be presented.
(iii) Class time should also be allocated for discussion between teacher and student, and student and student.
4. Management of Project
(i) Planning
An early start to planning project work is highly recommended and the schedule of the dates for submission should be developed by teachers and candidates.
(ii) Length
The length of the report of the project should be between 1500 and 2000 words excluding diagrams, graphs, tables and references. A total of 10 percent of the candidate’s score will be deducted for any research paper in excess of 2200 words (excluding diagrams, graphs, tables and references). If a deduction is to be made from a candidate’s score, the teacher should clearly indicate on the assignment the candidate’s original score before the deduction is made, the marks which are to be deducted, and the final score that the candidate receives after the deduction has been made.
(iii) Guidance
Each candidate should know the requirements of the project and its assessment process.
Although candidates may consult with resource persons besides the teacher the candidates submission should be his or her own work.
Candidates are not expected to work on their own. The teacher is expected to give appropriate guidance at all stages of project work, for example, chapters to read, alternative procedures to follow and other sources of information.
(iv) Authenticity
Teachers are required to ensure that all projects are the candidates’ work.
The recommended procedures are to:
(a) engage candidates in discussion;
CXC A9/U2/07 57
(b) ask candidates to describe procedures used and summarize findings either orally or written;
(c) ask candidates to explain specific aspects of the analysis.
ASSESSMENT CRITERIA FOR THE PROJECT
General
It is recommended that candidates be provided with assessment criteria before commencing the project.
(i) The following aspects of the project will be assessed:
(a) project title;
(b) purpose of project;
(c) method of data collection;
(d) analysis of data;
(e) statistical Knowledge;
(f) communication of Information;
(g) presentation of Data;
(h) discussion of findings;
(i) conclusion;
(j) list of references.
(ii) For each component, the aim is to find the level of achievement reached by the candidate.
(iii) For each component, only whole numbers should be awarded.
(iv) It is recommended that the assessment criteria be available to candidates at all times.
ASSESSING THE PROJECT
The project will be graded out of a total of 20 marks and marks will be allocated to each task as outlined below. Candidates will be awarded 2 marks for communicating information in a logical way using correct grammar. These marks are awarded under Task 7 below.
CXC A9/U2/07 58
Project Descr iptors
1 . Pro ject Tit le [1]
Title is clear and concise, and relates to the project ......................................... (1)
2. Purpose of Project [2]
Purpose stated (1) Appropriate variables identified ...................................................................... (1)
3 . Method of Data Col lect ion [2]
Data collection method clearly described ......................................................... (1) Data collection method is appropriate and without flaws .............................. (1)
4. Presentat ion of Data [3]
At least one table and one graph/chart used .................................................. (1) Data clearly written, labelled, unambiguous and systematic ........................... (1) Graphs, figures, tables and statistical/mathematical symbols used
appropriately ................................................................................................... (1)
5 . Stat i s t ica l Knowledge/Analys i s o f Data [5]
Appropriate use of statistical concepts demonstrated ....................................... (1) Accurate use of statistical concepts demonstrated ........................................... (1) Some analysis attempted ................................................................................. (1) Analysis is coherent ......................................................................................... (1) Analysis used a variety (two or more) of approaches ....................................... (1)
6 . Discuss ion of Findings/Conclus ion [4]
Statement of most findings are clearly identified ............................................. (1) Statements follow logically from the data gathered .......................................... (1) Conclusion based on findings and related to purposes of project ..................... (1) Conclusion is valid .......................................................................................... (1)
7 . Communicat ion of Information [2]
Communicates information in a logical way using correct grammar, statistical jargon and symbols most of the time ............................................ ................... (2)
Communicates information in a logical way using correct grammar, statistical jargon and symbols some of the time .................................(1)
CXC A9/U2/07 59
8. List o f References [1]
References relevant, up-to-date, written using a consistent convention ............. (1)
TOTAL 20 MARKS Unit 2
This paper is compulsory and consists of an assignment.
1. The aims of the assignment are to:
(i) enable the student to explore possibilities;
(ii) develop mathematical ideas and communicate the findings to others using mathematical tools, language and symbols.
2. Requirements
A. At each stage of the task, the candidate must describe and explain clearly his/her actions and thinking. He/shemust show all data (preferably in a table or chart or diagram or as a set of symbols, equations and inequalities),attempt to process or analyse data using mathematical skills and available technology, and then present the findingin some appropriate way using mathematical tools such as graphs, charts, equations and inequalities.
Finally, the candidate should assess how well he/she dealt with the topic mathematically, and also determine if theway in which the mathematical skills were applied and mathematical thinking was carried out, may be extended toother situations and contexts.
The assignments may take the form of:
(i) a piece of practical work;
(ii) a simulation of a phenomenon (The effects of a vaccine on the spread of influenza x);
(iii) solving a mathematical problem;
(iv) solving a problem encountered in life;
(v) investigating social phenomena;
(vi) describing (or explaining or predicting) a process and its product;
(vii) doing probability experiments (carrying out an investigation into probabilities with dice or calculator, or computer;
(viii) doing explorations within mathematics;
(ix) investigating mathematical principles using simulation;
CXC A9/U2/07 60
(x) problems derived from any area covered in the syllabus.
B. As far as possible the assignment should relate the content of the Discrete Mathematics to AT LEAST ONE of the other two Modules.
C. During the identification-of-the-topic stage, the candidate should be required to:
(i) list most of the mathematics he/she expects to use in engaging the topic; and
(ii) ensure that there is substantial mathematical content in his/her work.
D. Teachers are expected to guide candidates in choosing appropriate projects that relate to candidates’ interests and mathematical expertise.
E. Candidates should make use of mathematical and statistical skills contained in all three Modules.
F . The report should contain between 1500 and 2000 words and should include the following:
(i) statements describing the problem to be engaged and specifying and delimiting the tasks to be undertaken;
(ii) the major ways used to collect data and to probe and analyse, or study or explain the tasks and subtasks;
(iii) statements of the findings and identification of their validity and limitations.
3. Integrat ion of pro ject into the course
(i) The activities related to the Project should be integrated into the course so as to enable students to learn and practise the skills of undertaking and completing a successful project.
(ii) Some time in class should be allocated for general discussion of project work.
(iii) Class time should also be allocated for discussion between teacher and students, and student and student.
4. Management o f Pro ject
(i) P lanning
An early start to planning project work is highly recommended and the schedule of the dates for submission should be developed by teachers and candidates.
(ii) Length
The length of the report of the assignment should be between 1500 and 2000 words excluding diagrams, graphs, tables and references. A total of 10 percent of the candidate’s score will be deducted for any research paper in excess of 2200 words (excluding diagrams, graphs, tables and references). If a deduction is to be made from a candidate’s score, the teacher should clearly indicate on the assignment the
CXC A9/U2/07 61
candidate’s original score before the deduction is made, the marks which are to be deducted, and the final score that the candidate receives after the deduction has been made.
(iii) Guidance
Each candidate should be provided with the requirements of the assignment and its assessment process.
Although candidates may consult with resource persons besides the teacher the candidates submission should be his or her own work.
Candidates are not expected to work on their own. The teacher is expected to give appropriate guidance at all stages of project work, for example, chapters to read, alternative procedures to follow and other sources of information.
(iv) Authent ic i ty
Teachers are required to ensure that all assignments are the candidates’ work.
The recommended procedures are to:
(a) engage candidates in discussion;
(b) require candidates to describe procedures used and summarize findings either orally or written;
(c) require candidates to replicate parts of the analysis.
ASSESSMENT CRITERIA FOR THE PROJECT
General
It is recommended that candidates be provided with an assessment criterion before commencing the Assignment.
(i) The following aspects of the assignment will be assessed:
(a) statement of tasks;
(b) data collected;
(c) mathematical knowledge;
(d) evaluation;
(e) communication.
(ii) For each component, the aim is to ascertain the level of achievement reached by the candidate.
CXC A9/U2/07 62
(iii) For each component, fractional marks should not be awarded.
(iv) It is recommended that the assessment criteria be available to candidates at all times.
ASSESSING THE PROJECT
The project is graded out of a total of 20 marks and marks are allocated to each task as outlined below. Candidates will be awarded 2 marks for communicating information in a logical way using correct grammar. These marks are awarded under Task 5 below.
Ass ignment Descr iptors
1 . Statement o f Task [3]
• Clear statement of task, definition of the variables involved and description of the plan for carrying out task (and mathematics involved)……………….......... (3)
• Clear statement of task and definition of the variables involved………………….. (2)
• Produces a very limited statement of task (one or two short sentences)…………… (1)
• No statement of task…………………………………………............................ (0)
2 . Data Col lected [3]
• Clear evidence of doing relate to the statement of the mathematics: includinginvestigating or experimenting or modelling or designing or interpreting oranalysing or solving…………………………………………………………….. (3)
• Partial evidence of doing purposeful mathematics: including investigating orexperimenting or modelling or designing or interpreting or analysing
or solving……………………………………………………………………….(2)
• Limited evidence of doing purposeful mathematics: including investigatingor experimenting or modelling or designing or interpreting or analysing orsolving………………………………………………………………………….. (1)
3 . Mathematica l Knowledge/Analys i s [4]
• Carries out simple mathematical processes correctly, employs andaccurately integrates these techniques. Use of techniques………………………….
(4)
• Carries out simple mathematical processes correctly,employs and accurately use more sophisticated techniques………………………...
(3)
(2) • Carries out simple mathematical processes correctly and
CXC A9/U2/07 63
employs more sophisticated techniques…………………………………………...
• Carries out simple mathematical processes correctly…………………………........ (1)
4. Evaluat ion [5]
• Conclusion clearly stated………………………………………………………... (1)
• Conclusion related to the purpose of the task…………………………………….. (1)
• Conclusion is valid……………………………………………………………… (1)
• Insights into the nature of and the resolution of problems encountered in thetasks…………………………………………………………………………… (1)
• Insights into the nature of and the resolution of problems encountered in thetasks…………………………………………………………………………… (1)
5. Communicat ion of Information [5]
(a) Correct grammar (2)
• Communicates information in a logical way using correct grammarmost of the time………………………………………………………............ 2
• Communicates information in a logical way using correct grammarsome of the time…………………………………………………………....... 1
(b ) Appropriate mathematical language (3)
• Systematically recording actions using appropriate mathematicallanguage (symbols, notation) and representations (tables, charts,
figures)…………3
• Structure the report by recording actions at each stage using mathematicalLanguage and representations……………………………………………… 2
• Attempt at recording actions at some stages………………………………… 1
For exceeding the word limit of 2000 words, deduct 10 percent of the candidate’s score.
TOTAL 20 MARKS
CXC A9/U2/07 64
GENERAL GUIDELINES FOR TEACHERS
1. Marks must be submitted to CXC on a yearly basis on the Internal Assessment forms provided. Theforms should be dispatched through the Local Registrar for submission to CXC by May 31 in Year 1and May 31 in Year 2.
2. The Internal Assessment for each year should be completed in duplicate. The original should besubmitted to CXC and the copy retained by the school.
3. CXC will require a sample of the assignment for external moderation. Additional assignmentsmay be required. These assignments must be retained by the school for at least three monthsafter publication of examination results.
4. Teachers should note that the reliability of marks awarded is a significant factor in InternalAssessment, and has far-reaching implications for the candidate’s final grade.
5. Candidates who do not fulfill the requirements of the Internal Assessment will be consideredabsent from the whole examination.
6. Teachers are asked to note the following:
(i) the relationship between the marks for the assignments and those submitted to CXC on the internal assessment form should be clearly shown;
(ii) the standard of marking should be consistent.
♦ REGULATIONS FOR PRIVATE CANDIDATESCandidates who are registered privately will be required to sit Paper 01, Paper 02 and Paper 03B. Paper 03B will be 1½hours’ duration and will contribute 20% of the total assessment of a candidate’s performance on that Unit.
The paper consists of three questions which are designed to test the candidates’ skills and abilities to:
1) recall, select and use appropriate facts, concepts and principles in a variety of contexts;
2) manipulate mathematical expressions and procedures using appropriate symbols and language, logical deductionand inferences;
3) simplify and solve statistical/mathematical models.
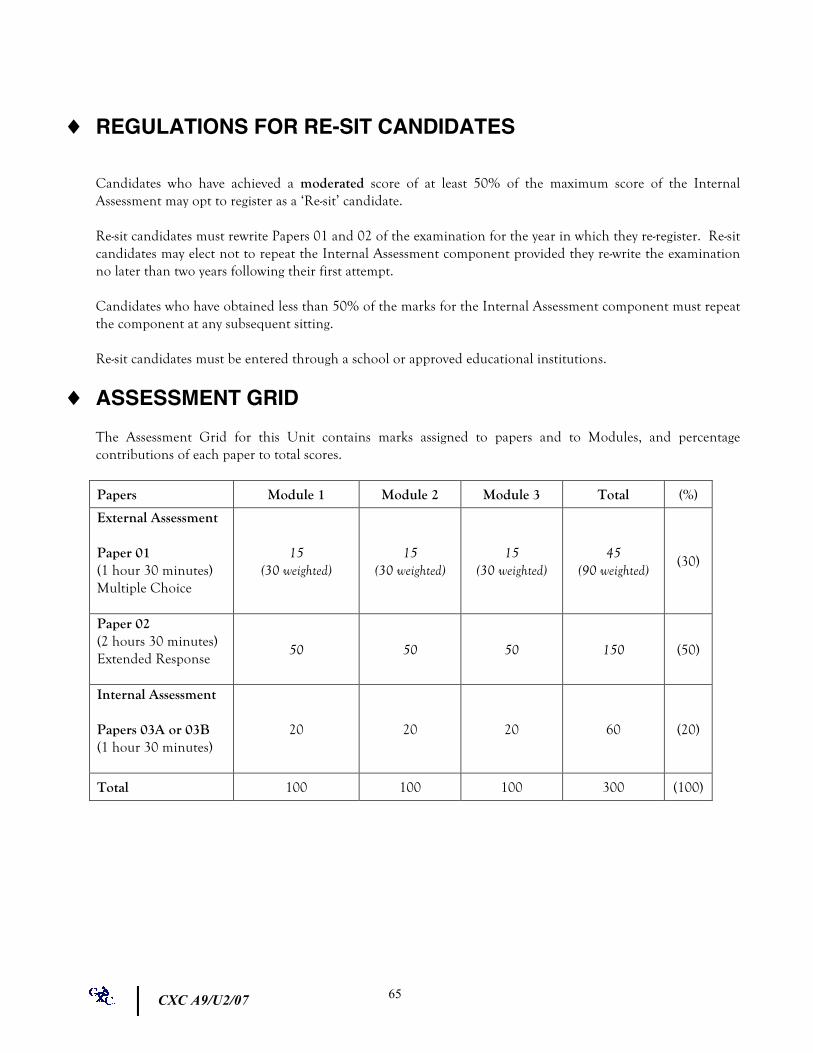
CXC A9/U2/07 65
♦ REGULATIONS FOR RE-SIT CANDIDATES
Candidates who have achieved a moderated score of at least 50% of the maximum score of the Internal Assessment may opt to register as a ‘Re-sit’ candidate.
Re-sit candidates must rewrite Papers 01 and 02 of the examination for the year in which they re-register. Re-sit candidates may elect not to repeat the Internal Assessment component provided they re-write the examination no later than two years following their first attempt.
Candidates who have obtained less than 50% of the marks for the Internal Assessment component must repeat the component at any subsequent sitting.
Re-sit candidates must be entered through a school or approved educational institutions.
♦ ASSESSMENT GRIDThe Assessment Grid for this Unit contains marks assigned to papers and to Modules, and percentagecontributions of each paper to total scores.
Papers Module 1 Module 2 Module 3 Total (%)
External Assessment
Paper 01 (1 hour 30 minutes) Multiple Choice
15 (30 weighted)
15 (30 weighted)
15 (30 weighted)
45 (90 weighted)
(30)
Paper 02 (2 hours 30 minutes) Extended Response
50 50 50 150 (50)
Internal Assessment
Papers 03A or 03B (1 hour 30 minutes)
20 20 20 60 (20)
Total 100 100 100 300 (100)
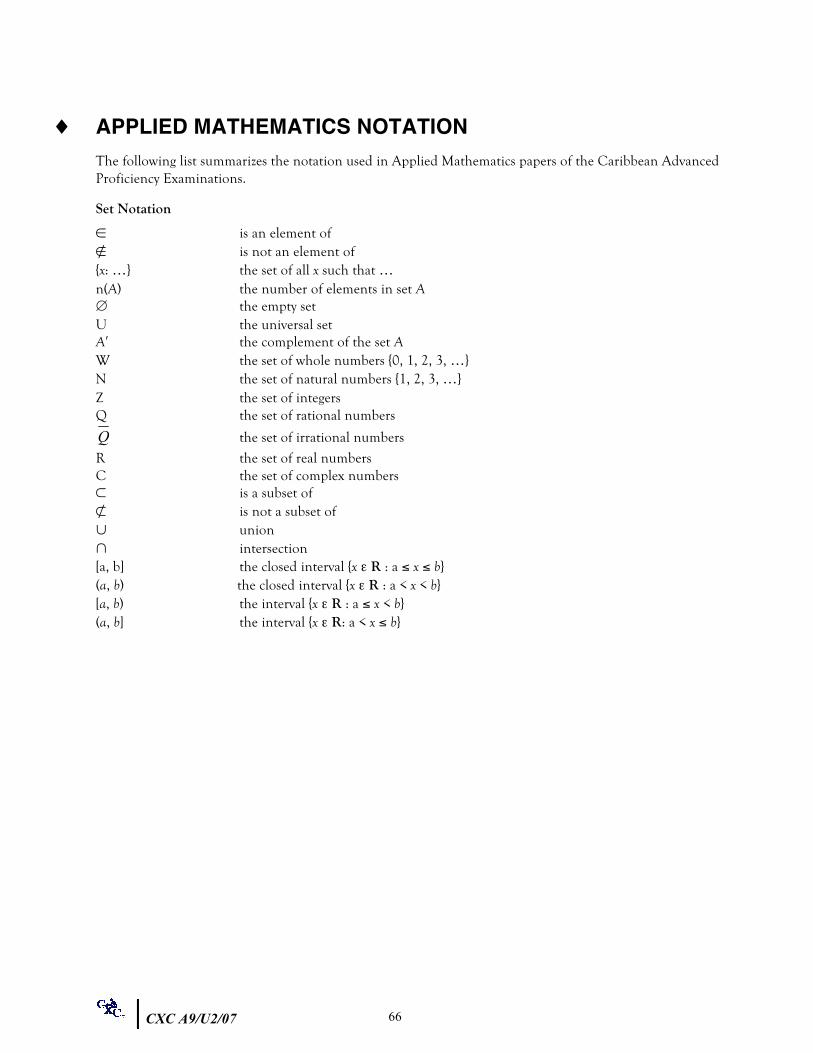
CXC A9/U2/07 66
♦ APPLIED MATHEMATICS NOTATIONThe following list summarizes the notation used in Applied Mathematics papers of the Caribbean AdvancedProficiency Examinations.
Set Notation ∈ is an element of ∉ is not an element of {x: …} the set of all x such that … n(A) the number of elements in set A ∅ the empty set U the universal set Aʹ′ the complement of the set A W the set of whole numbers {0, 1, 2, 3, …} N the set of natural numbers {1, 2, 3, …} Z the set of integers Q the set of rational numbers
the set of irrational numbers
R the set of real numbers C the set of complex numbers ⊂ is a subset of ⊄ is not a subset of ∪ union ∩ intersection [a, b] the closed interval {x ε R : a ≤ x ≤ b} (a, b) the closed interval {x ε R : a < x < b} [a, b) the interval {x ε R : a ≤ x < b} (a, b] the interval {x ε R: a < x ≤ b}
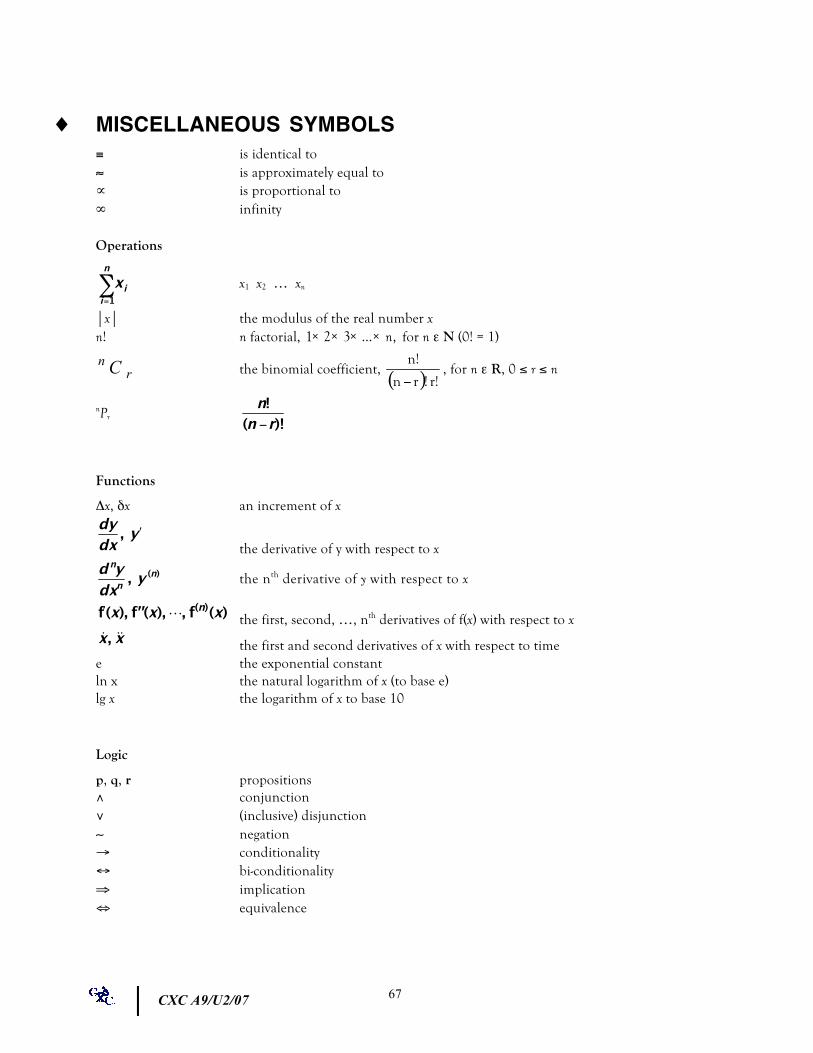
CXC A9/U2/07 67
♦ MISCELLANEOUS SYMBOLS ≡ is identical to ≈ is approximately equal to ∝ is proportional to ∞ infinity
Operations
x1 x2 … xn
⏐x⏐ the modulus of the real number x n! n factorial, for n ε N (0! = 1)
the binomial coefficient, , for n ε R, 0 ≤ r ≤ n
nPr
Functions Δx, δx an increment of x
the derivative of y with respect to x
the nth derivative of y with respect to x
the first, second, …, nth derivatives of f(x) with respect to x
the first and second derivatives of x with respect to time e the exponential constant ln x the natural logarithm of x (to base e) lg x the logarithm of x to base 10
Logic p, q, r propositions ∧ conjunction ∨ (inclusive) disjunction ∼ negation → conditionality ↔ bi-conditionality ⇒ implication ⇔ equivalence
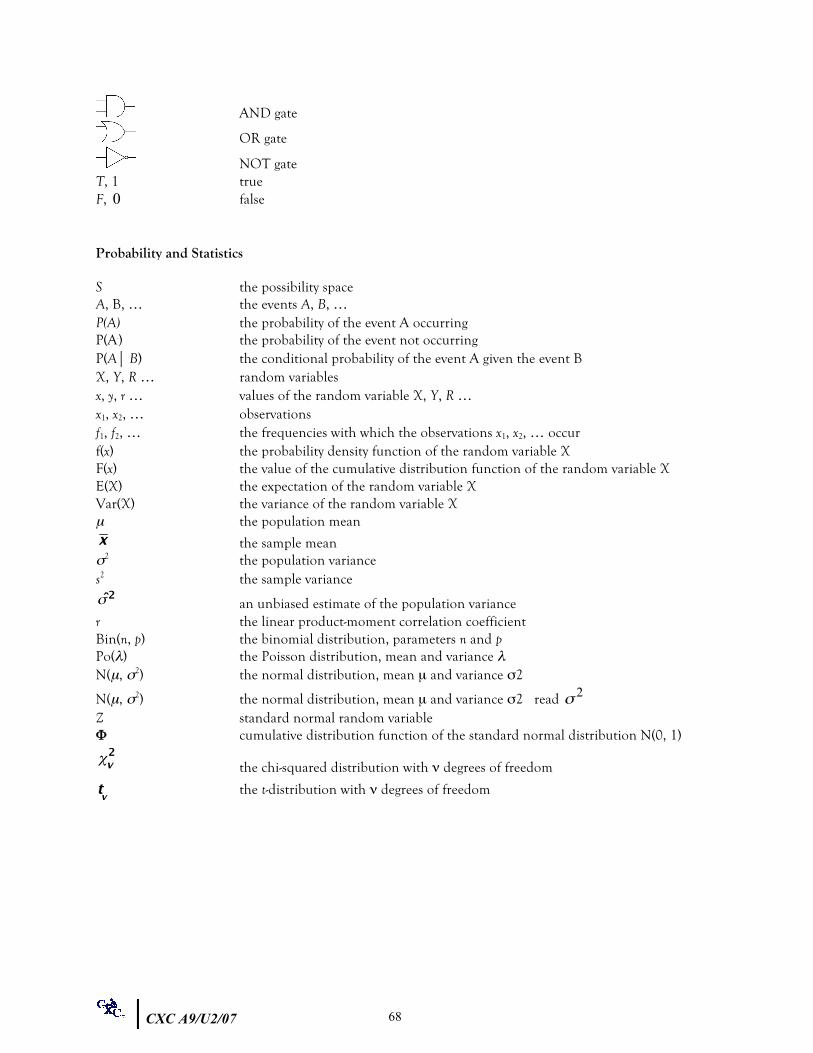
CXC A9/U2/07 68
AND gate
OR gate
NOT gate T, 1 true F, false
Probability and Statistics
S the possibility space A, B, … the events A, B, … P(A) the probability of the event A occurring P(Aʹ′) the probability of the event not occurring P(A⏐ B) the conditional probability of the event A given the event B X, Y, R … random variables x, y, r … values of the random variable X, Y, R … x1, x2, … observations f1, f2, … the frequencies with which the observations x1, x2, … occur f(x) the probability density function of the random variable X F(x) the value of the cumulative distribution function of the random variable X E(X) the expectation of the random variable X Var(X) the variance of the random variable X µ the population mean
the sample mean σ2 the population variance s2 the sample variance
an unbiased estimate of the population variance r the linear product-moment correlation coefficient Bin(n, p) the binomial distribution, parameters n and p Po(λ) the Poisson distribution, mean and variance λ N(µ, σ2) the normal distribution, mean µ and variance σ2
N(µ, σ2) the normal distribution, mean µ and variance σ2 read Z standard normal random variable Φ cumulative distribution function of the standard normal distribution N(0, 1)
the chi-squared distribution with ν degrees of freedom
the t-distribution with ν degrees of freedom
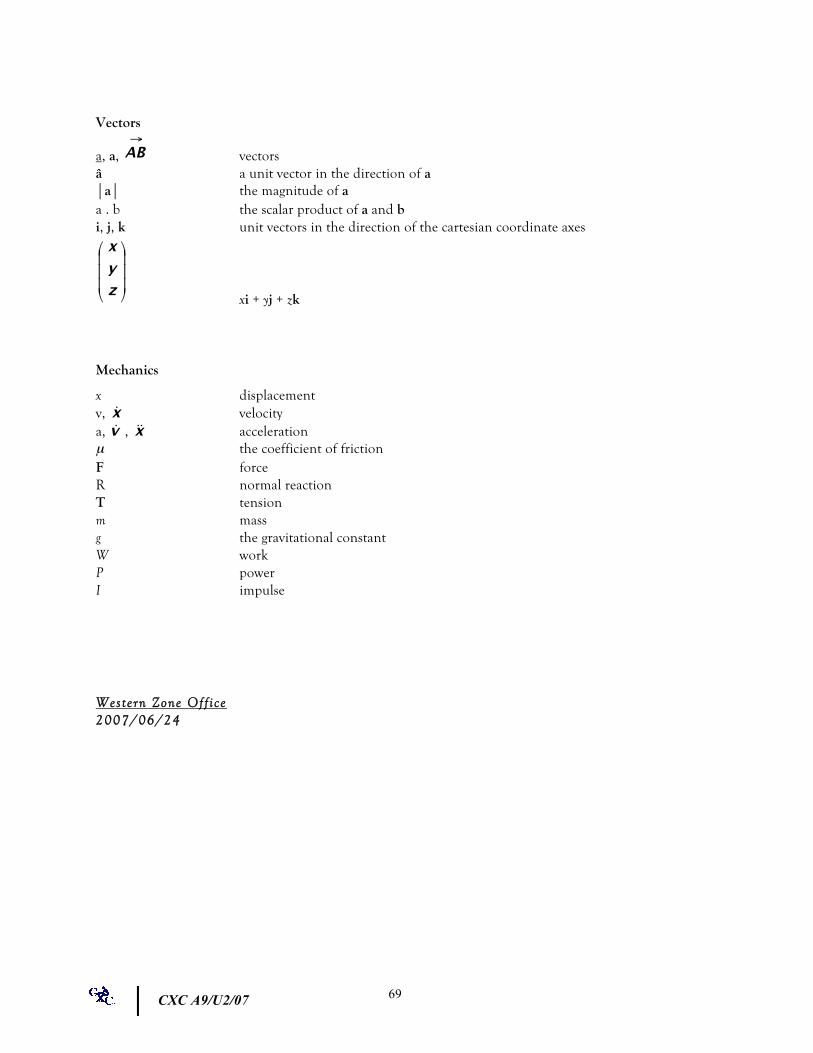
CXC A9/U2/07 69
Vectors
a, a, vectors â a unit vector in the direction of a ⏐a⏐ the magnitude of a a . b the scalar product of a and b i, j, k unit vectors in the direction of the cartesian coordinate axes
xi + yj + zk
Mechanics x displacement v, velocity a, , acceleration µ the coefficient of friction F force R normal reaction T tension m mass g the gravitational constant W work P power I impulse
Western Zone Off ice 2007/06/24