Embed Size (px)
Citation preview

Page 1/22
Performance assessment of static and dynamicroutings using 6LoWPAN on small scenariosapplied to monitoring of Barranquilla �ash �oodPiñeres -Espitia Gabriel
Universidad de la Costa: Corporacion Universitaria de la Costashariq aziz butt ( [email protected] )
Superior universityEstévez -Ortiz Francisco
University of Granada: Universidad de GranadaCama -Pinto Alejandro
Universidad de la Costa: Corporacion Universitaria de la Costa
Research
Keywords: 6LoWPAN, Wireless Sensor Networks (WSN), Routing protocol, Low-Power Listening (LPL),Network monitoring and measurements, �ash �ood
Posted Date: April 9th, 2021
DOI: https://doi.org/10.21203/rs.3.rs-304521/v1
License: This work is licensed under a Creative Commons Attribution 4.0 International License. Read Full License
Page 2/22
AbstractThe Internet of Things (IoT) is growing rapidly due to the wireless network that provides connectivity todevices at anytime and anywhere. Currently, the wireless sensor network is involved in many research�elds like smart health monitoring, smart cities, and smart industries. From all of these, �ood monitoringis the most important �eld in the IoT wireless network to alert about the occurrence of any abnormalities.To monitor the environment wireless sensor network needs a decision-making protocol that sense androute the information timely. The present work includes numerous use of Low Power Wireless PersonalArea Networks (6LoWPAN) with IPv6 protocol de�ned by the Internet Engineering Task Force (IETF) due toits different test conditions, analysing static and dynamic routing and its impact on differentperformance metrics such as latency and packet losses for their application in monitoring system of the�ash �oods in any region. In this study, we are using IPv6 6LoWPAN to develop a wireless warningsystem before a �ood event in “The Brigade” in Barranquilla city. The basic purpose for making system isto secure the city from costly damage and life loss. Different types of tra�c and different 1-/2-hopsscenarios have been considered. In order to implement our system, we use the well-known TelosBplatform jointly with TinyOS, BLIP 2.0 and LPL. The experiment result shows that time on 512 ms and1024 ms with a packet of 120 B obtain good performance on the metrics used for the tests.
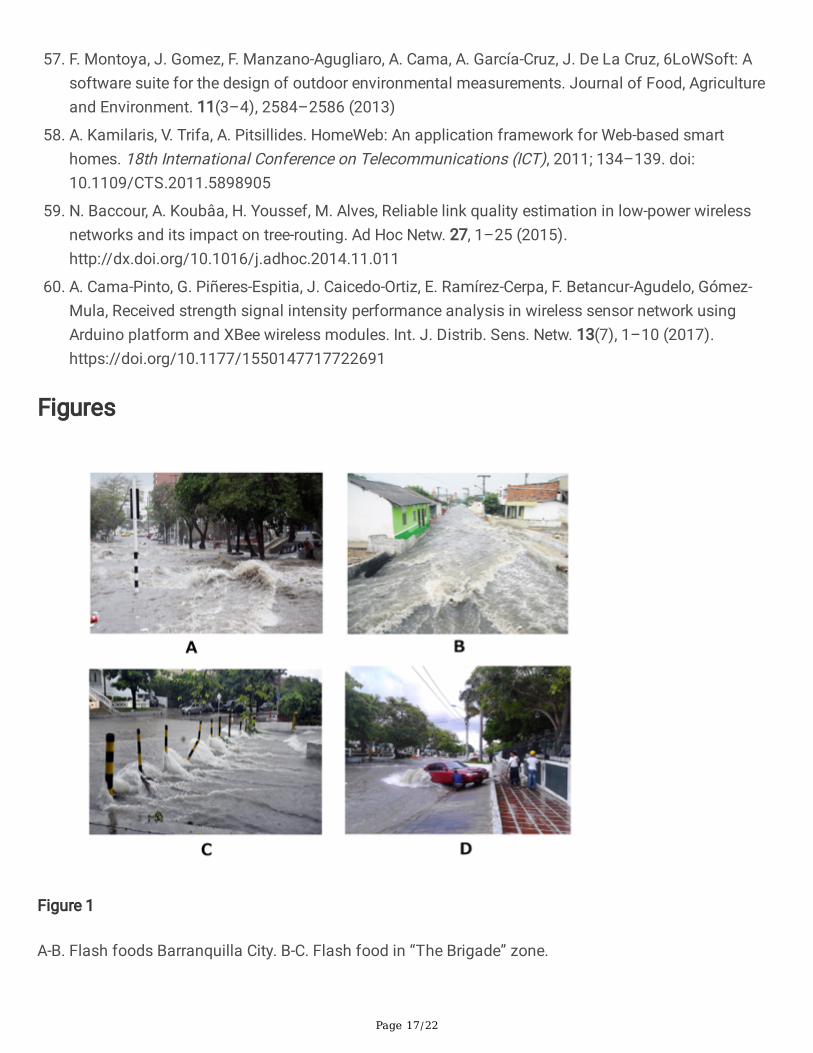
1. IntroductionThe Internet of Things (IoT) is growing due to wireless sensor network that provide smart devicesconnectivity from anywhere and is evolving many research �elds like smart hospitals, smart tra�c, smartcity, environment monitoring and smart decision making systems. This wireless connectivity alsoincreases the data tra�c in IoT [1, 2, 3]. To transmit the data the network needs some new platform,technologies, network architectures and network protocols to route the data [4, 5, 6]. The wireless networkhas many protocols, one of these protocols is the IPv6 for Low Power Wireless Personal Area Networks(6LoWPAN), de�ned by the Internet Engineering Task Force (IETF) in the RFC4944 [7]. It is very vastly inuse IPv6 protocol over IEEE 802.15.4 [8] due to its compatibility with wireless sensor nodes [7–9]. In IoTthe research community has developed many environment monitoring applications like Early WarningSystems (EWS) for catastrophic events to improve the life quality and lifesaving [10, 12, 13]. In the caseof the EWS, a monitoring system that is the objective of this work for the �ash �oods that occur in therainy season in the city of Barranquilla - Colombia. This problem has occurred for many years in this city,therefor this work support by the University of the Coast at a zone known as "The Brigade" for generatealerts when this event is occurred [11, 14]. The existing studies include damages of �oods in terms ofcost and life. We do not �nd any study and EWS system for Barranquilla – Colombia to alert from �ood.We develop a system and mitigate different kinds of tests with three nodes to send packets, using the6LoWPAN logical addressing method and two routing protocols. This allow analysing the implementationof 6LoWPAN in the monitoring of �ash �oods in the area of "The Brigade" as shown in Fig. 1a section ofthe interest zone where the �ash �ood occurs.
Page 3/22
In this context, the study of the performance of 6LoWPAN considering different routing methods, staticand dynamic. In order to compare the performance, the present work is based on the TelosB platform [15],including TinyOS as embedded operative system and the Berkeley Low-Power IP stack (BLIP) [16] as6LoWPAN network stack. Additional libraries for dynamic IPv6 routing like, IPv6 Routing Protocol for Low-Power and Lossy Networks (RPL) [17] and for energy saving purposes like, Low-Power Listening (LPL)[18] have been used. The results are more important in this work therefore the methodologies for theevaluation of 6LoWPAN performance with the established metrics, obtaining impacts important for theselect routing type and the channel scan time for the energy saving with the LPL protocol. Furthermore, ispossible to analysing the network performance according the select packet length. Criteria is alsoprovided for the selection of TelosB platform and 6LoWPAN applied a monitoring network for �ash �oodsin the "The Brigade" area of the city of Barranquilla. The rest of the paper is organized as follows: Sect. 2provides an overview of the most relevant work about 6LoWPAN applications and metrics for WSN.Section 3 describes the materials and methods, as well as the test scenarios used. Section 4 presents theresults and its analysis. Finally, Sect. 5 describes the most relevant conclusions of this paper.
2. 6lowpan: Applications And Metrics For Wsn
2.1 Emerging technologies for Early Warning SystemThe natural hazards affect large part of the population, resulting in severe economic and human losses.For mitigate the impact in the population of the natural hazards are implemented Early Warning System(EWS) in vulnerable areas. This System are an important tool to hazard risk management and manyapplications requires this solutions to face phenomenon such as tornadoes [19, 20], �oods [21, 22],landslides [23, 24], �ash-�oods [25, 26], tsunamis [27], and similar. Therefore, the use of emergingtechnologies in EWS is relevance and is a challenge for the researchers. This technologies consist ofinnovations such as IoT, new protocols and low cost platforms, which have been implemented insolutions for monitoring system and IoT. For example, in Surabaya - Indonesia have development an IoTsystem in EWS to garbage collector robots and be able to monitoring severe and dangerous conditions;this prototype can monitoring the battery level information and operation to the robot; the ESP8266-12module allows the WIFI communication with an android platform [28]. In Malaysia an IoT system isproposed for a �ood EWS; this system consist of a wireless sensor networks, wind sensors and cellphoneimages that are sent to cloud using Zigbee and 3G for monitoring and warning to the users [29].InPakistan, a low cost �ood EWS is development using Raspberry Pi platform, video camera, temperatureand humidity sensors, energy system (battery and solar panels); this system send GSM data to Webdashboard, showing the level water [30]. In Italy, a WSN (Wireless Sensor Networks) is used to estimatelandslide; for this, the RF signal is analyzed in the nodes of the WSN and establish its location in draw agrid map; the change in the locate to the node can indicate that a landslide is present by soil movement[31]. For this work, the �ash �ood are the principal context, because have caused material and humanlosses in recent decades in the Barranquilla city, also causing congestion of tra�c and dragging
Page 4/22
sediments by the �ow. There are thirty zones where �ash �oods occur due to the absence of sewerageover the city, and although some canalizations work has been carried out in some cases, it is important tohave systems based on emerging technologies that can generate warning for the vulnerable population.This motivated different studies from the “Universidad de la Costa” to generate solutions to this problemin Barranquilla [32, 33, 34].
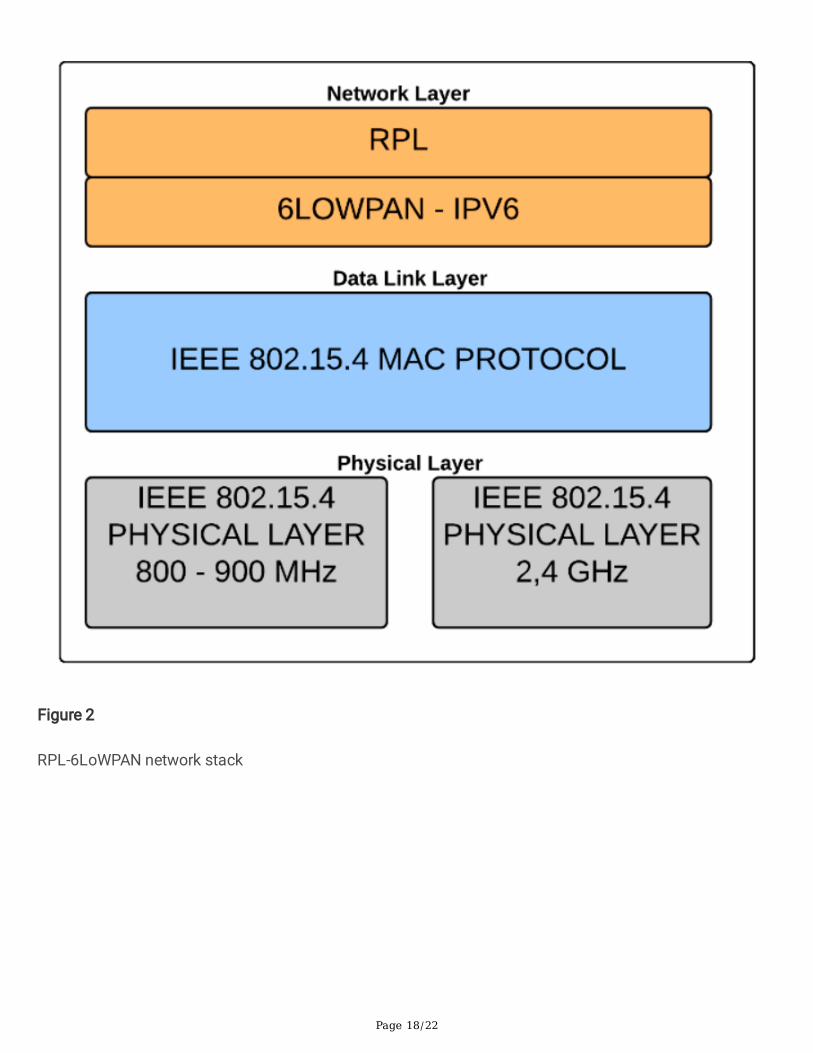
2.2 6LoWPAN and applicationsThe use of emerging technologies for environment applications is important for evaluate its possibleapplication in EWS. These studies can be complemented by the analysis of IPv6 applications forconstrained environments such as the technique 6LoWPAN, in order working on top of the IEEE 802.15.4-standard (see Fig. 2). Between the set of wireless protocols [35], 6LoWPAN shows a major increase of usein several �elds like the web or military applications [36, 37] or even as preferred communication methodfor embedded operative systems such as TinyOS or ContikiOS [38].
As a trend, there are a lot of different studies about its performance like the one about high-precisionagriculture [39] or the latency and energy consumption related to networking mobility (NEMO) [40], oreven studies about network congestion problems
[41], security in point-to-point networks [42], impact in medical applications within high-mobilityenvironments [43, 44] or deep analysis of the energy consumption among the nodes [45, 46].
In the analysis of the literature different performance metrics was analyzed. Additionally the factors thatproduced incidence in the metrics were identi�ed. Furthermore, the hardware and software platformsused for 6LoWPAN were analysed. Based on the above, some researches focused on high-precisionagriculture have been developed using the TelosB platform with different sensors jointly with TinyOS,RPL-6LoWPAN and LPL. In this work different time intervals (512, 1024 and 2048 ms) and their impact inthe battery lifetime have been analysed, resulting in an improvement of the lifetime through using a 2048ms interval [47]. Other relevant work is focused on the carbon-cycle measuring in the Peruvian Amazonjungle, using the same platform [48]. Other applications use the same platform, testing instead of TinyOS,ContikiOS [49]. This revision is important for select the TelosB platform how a tool for the tests analysisin this work. Likewise for the time selection in the tests with the LPL protocol.
Different works have analysed the performance of different platforms, covering a wide spectrum amongthe use of various microcontrollers like Waspmote, TelosB, Arduino and radios like XBee, MicaZ andiMote2. These works also analysed different metrics and parameters, such as the delay in the messagereception or the throughput using different payloads [50]. Researches in the �eld of second layerprotocols [51] have analysed different metrics such as the duty cycle, latency and throughput, looking forthe optimal use conditions in ContikiOS [52].
The above analysis is important for the selection of the metrics, such as the latency and the packet loss.Similarly this analysis allows de�ne the platform TelosB y the framework TinyOS for the use in thetra�cs tests for the proposed scenario. On the other hand, RPL, as a part of 6LoWPAN, is being widely
Page 5/22
studied [53], not only in the �eld of Wireless Personal Area Networks (WPANs), but also in the �eld ofBody Area Networks (BANs) [54, 55]. Thus the comparative between RPL and static routing is animportant factor for the analysis in the tests.
In this study, we are using IPv6 6LoWPAN to develop a wireless warning system before a �ood event in“The Brigade” in Barranquilla city. The basic purpose for making system is to secure the city from costlydamage and life loss. Different types of tra�c and different 1-/2-hops scenarios have been considered. Inorder to implement our system, we use the well-known TelosB platform jointly with TinyOS, BLIP 2.0 andLPL. The experiment result shows that time on 512 ms and 1024 ms with a packet of 120 B obtain goodperformance on the metrics used for the tests.
3. Mitigation Of System
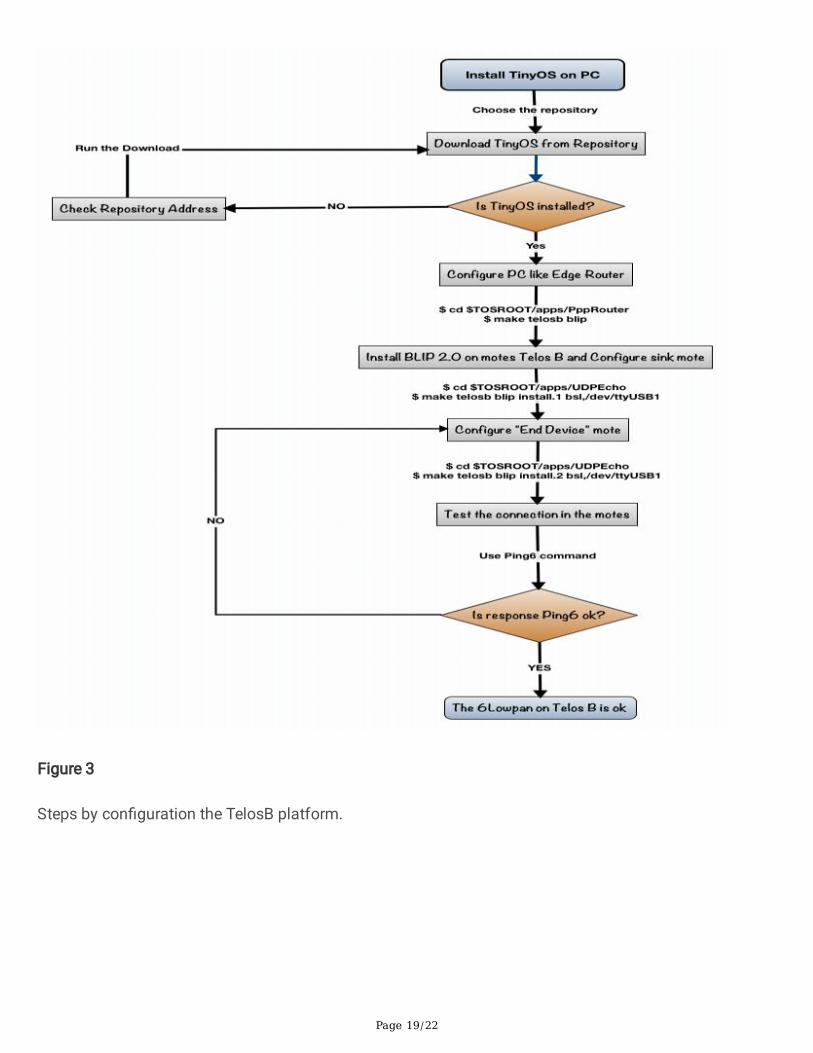
3.1 Materials and methodsThis section presents the scenarios and tests carried out. The present work is based on the TelosBplatform, which is a low-cost and well-known platform in the academic world. This platform also offerssupport to the IEEE 802.15.4 and 6LoWPAN through the use of TinyOS, BLIP, RPL and LPL. In order tocapture and analyse tra�c, like the Internet Control Message Protocol version 6 (ICMPv6), Wireshark [54,56] has been used. The tra�c for these tests is ICMPv6 (Internet Control Message Protocol for the InternetProtocol Version 6) packet, which has been generated using the tool PINGv6. As a result, Round TripTimes (RTT) of the nodes is received on the sink, measuring packet losses and packet delays for theperformance analysis. The Fig. 3 show a �owchart for the implementation of 6LoWPAN on the TelosBplatform and the basics tests for the initially connectivity.
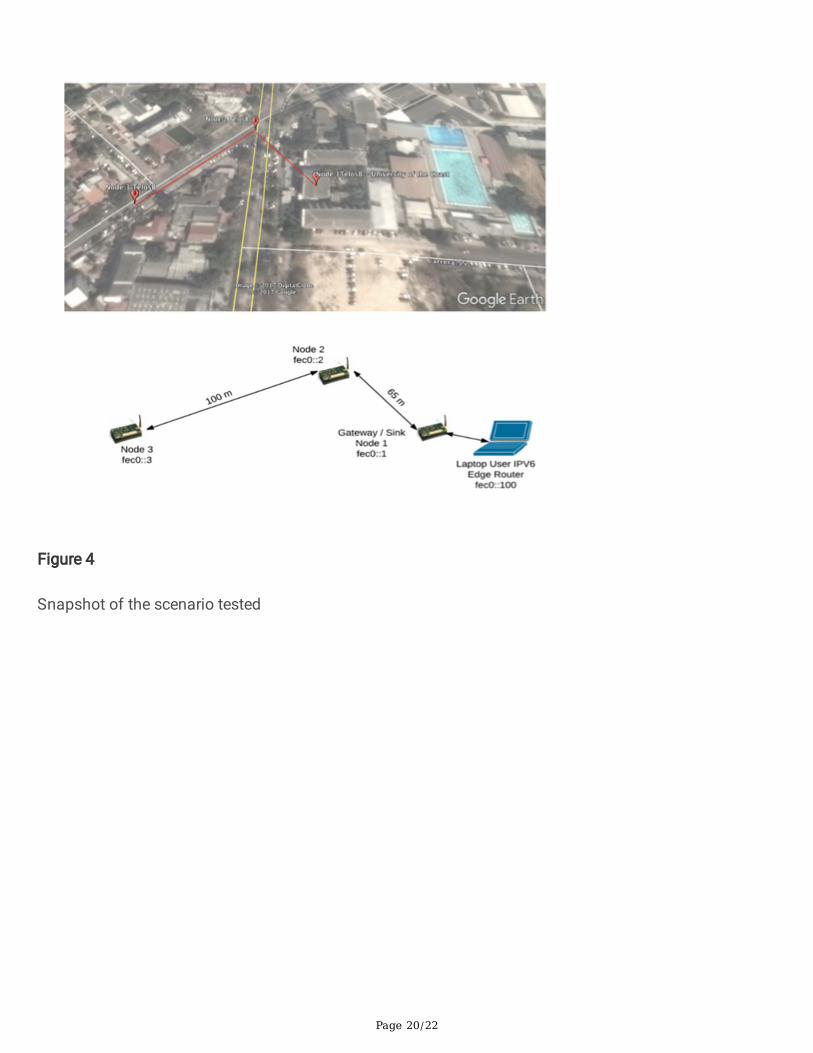
3.2. ScenariosThe scenario presented in this paper is based on three nodes and a host computer. The topology is point-to-point and involves a node working as sink and two as sensor nodes. The Fig. 4 shows the proposedscenario, where the node 1 jointly with the computer acts as sink and the node 2 acts as router.
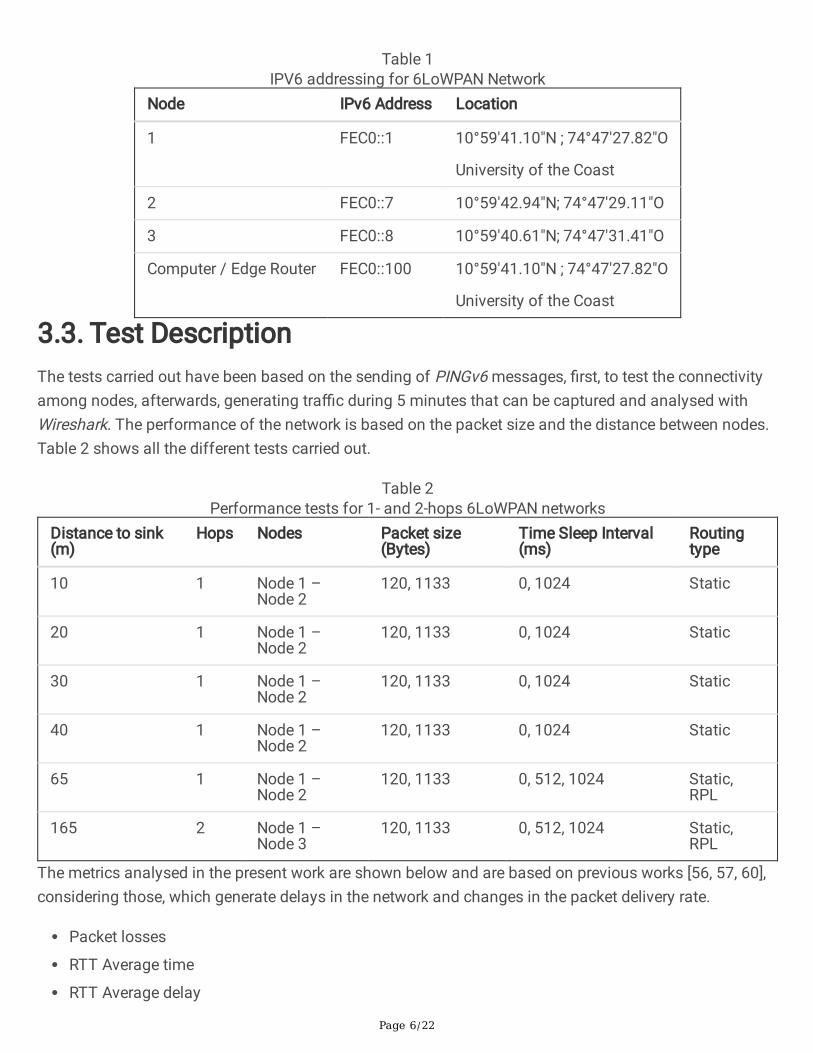
This work considers the Line-Of-Sight (LOS) between nodes as a reference in order to deploy the nodes.Thus, the network has been designed avoiding the LOS between node 1 and 3 in order to generate adirected routing scheme (i.e. the 2-hops route used in the tests). For this network, both static and dynamicrouting methods have been considered. Table 1 shows the static routing con�guration, for the dynamicrouting, RPL is the protocol used.
Page 6/22
Table 1IPV6 addressing for 6LoWPAN Network
Node IPv6 Address Location
1 FEC0::1 10°59'41.10"N ; 74°47'27.82"O
University of the Coast
2 FEC0::7 10°59'42.94"N; 74°47'29.11"O
3 FEC0::8 10°59'40.61"N; 74°47'31.41"O
Computer / Edge Router FEC0::100 10°59'41.10"N ; 74°47'27.82"O
University of the Coast
3.3. Test DescriptionThe tests carried out have been based on the sending of PINGv6 messages, �rst, to test the connectivityamong nodes, afterwards, generating tra�c during 5 minutes that can be captured and analysed withWireshark. The performance of the network is based on the packet size and the distance between nodes.Table 2 shows all the different tests carried out.
Table 2Performance tests for 1- and 2-hops 6LoWPAN networks
Distance to sink(m)
Hops Nodes Packet size(Bytes)
Time Sleep Interval(ms)
Routingtype
10 1 Node 1 –Node 2
120, 1133 0, 1024 Static
20 1 Node 1 –Node 2
120, 1133 0, 1024 Static
30 1 Node 1 –Node 2
120, 1133 0, 1024 Static
40 1 Node 1 –Node 2
120, 1133 0, 1024 Static
65 1 Node 1 –Node 2
120, 1133 0, 512, 1024 Static,RPL
165 2 Node 1 –Node 3
120, 1133 0, 512, 1024 Static,RPL
The metrics analysed in the present work are shown below and are based on previous works [56, 57, 60],considering those, which generate delays in the network and changes in the packet delivery rate.
Packet losses
RTT Average time
RTT Average delay
Page 7/22
Sending packet delay
Average Jitter
3.3.1. Packet LossesThe packet losses have been measured �rstly between the sink and the node 2, with only one hop, varyingthe payload, the time interval con�guration of LPL and the distance between both nodes. After this test, asecond analysis has been carried using all the nodes in the network and analysing the performance withtwo hops, varying also the time con�guration of LPL and the routing type. The tra�c monitoring has beenfocused on nodes 2 and 3.
3.3.2. RTT average timeTo calculate this metric, the time between packet sending and packet response arrival has beenmeasured. A previous theoretic analysis shows that the packets could suffer of delays, due to theprocessing time, which is associated to routing tasks among the network. It can be affected also bydelays derived of the application of LPL. The RTT average time is measured as the sum of the RTTaverage time for a 5 minutes test, using the same tests and conditions than in the packet losses analysis.
3.3.3. RTT sending average delayThe RTT sending delay is measured as the elapsed time between sending two packets withacknowledging receive, consecutively. This metric is calculated because in some cases the packets sentfrom the sink do not produce any reply from the nodes. Then, the RTT sending average delay is theaverage time elapsed between sending two packets with acknowledging receive consecutively, using thesame factors and conditions as in the packet losses analysis.
The RTT delay is measured in the sink by the information received in the Wireshark tool [58, 59].
3.3.4. Sending packet average delayThe packet sending response has been analysed, regardless of the successful acknowledge messagereception, as the elapsed time between the sending of a packet from the sink node to the node 2. Thetests carried out have been similar to the previous ones.
3.3.5. Average JitterThe average jitter has been measured based on the time obtained from the subtraction of the delay totwo consecutive packet sending time. The average of these results is calculated giving the �nal averagejitter measurement.
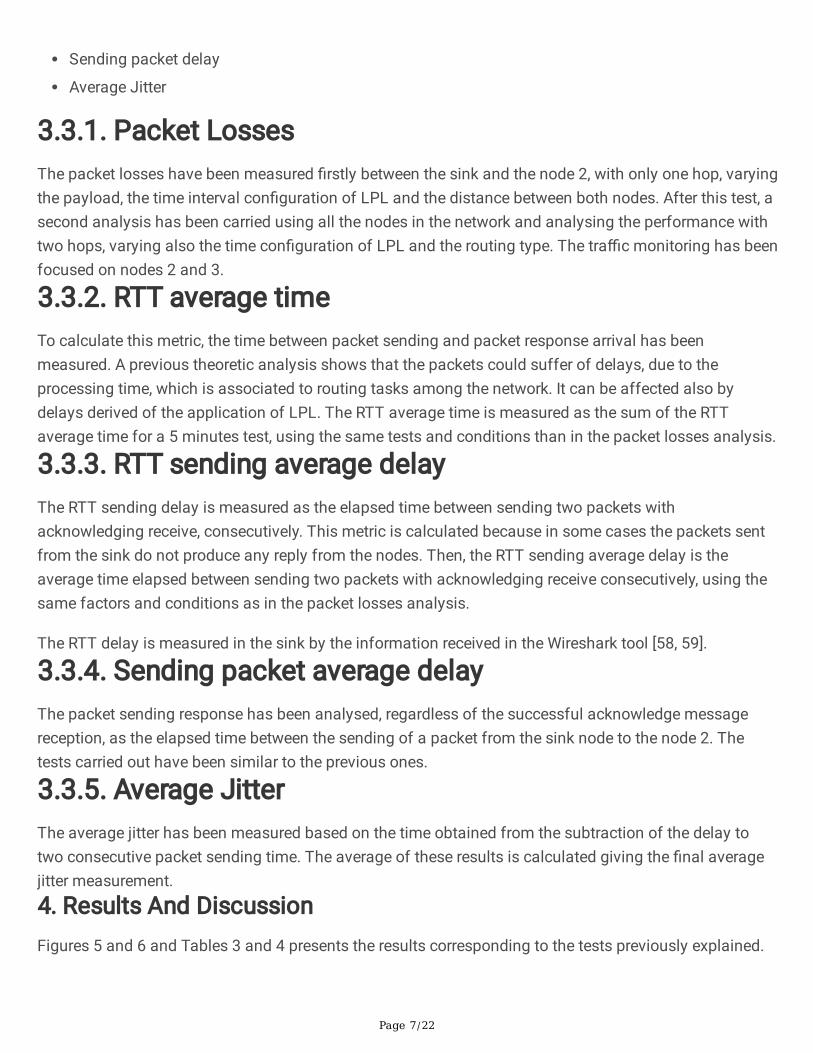
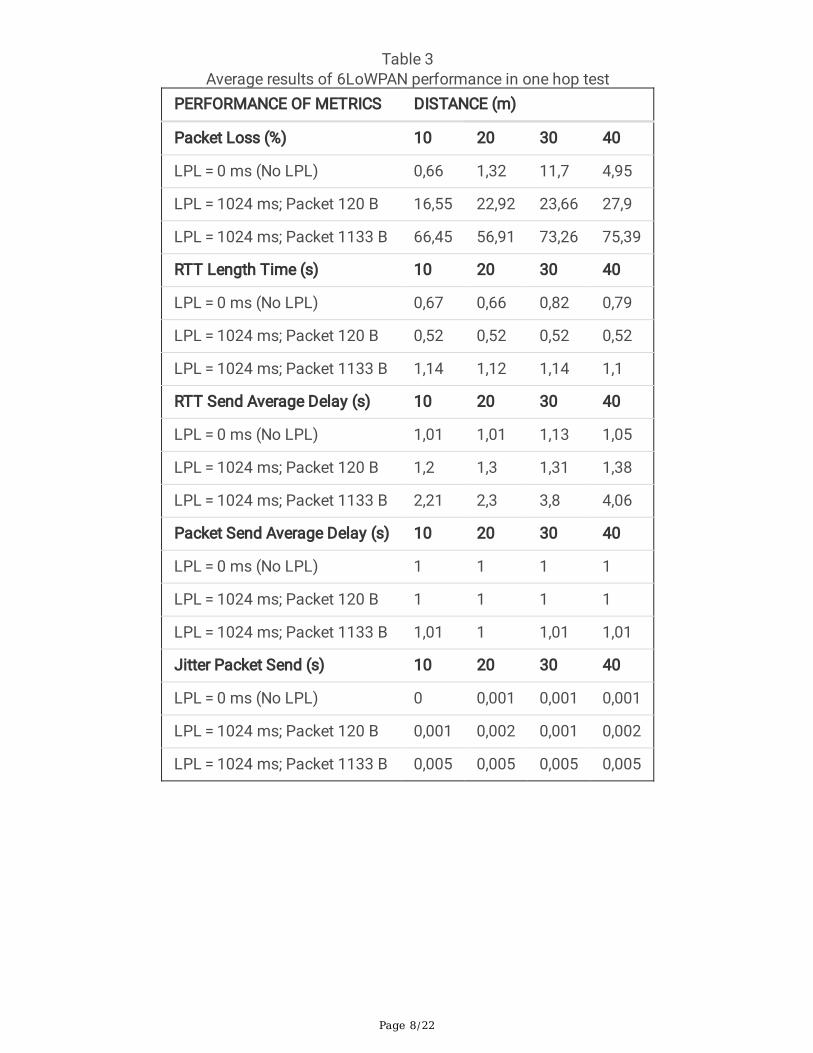
4. Results And DiscussionFigures 5 and 6 and Tables 3 and 4 presents the results corresponding to the tests previously explained.
Page 8/22
Table 3Average results of 6LoWPAN performance in one hop test
PERFORMANCE OF METRICS DISTANCE (m)
Packet Loss (%) 10 20 30 40
LPL = 0 ms (No LPL) 0,66 1,32 11,7 4,95
LPL = 1024 ms; Packet 120 B 16,55 22,92 23,66 27,9
LPL = 1024 ms; Packet 1133 B 66,45 56,91 73,26 75,39
RTT Length Time (s) 10 20 30 40
LPL = 0 ms (No LPL) 0,67 0,66 0,82 0,79
LPL = 1024 ms; Packet 120 B 0,52 0,52 0,52 0,52
LPL = 1024 ms; Packet 1133 B 1,14 1,12 1,14 1,1
RTT Send Average Delay (s) 10 20 30 40
LPL = 0 ms (No LPL) 1,01 1,01 1,13 1,05
LPL = 1024 ms; Packet 120 B 1,2 1,3 1,31 1,38
LPL = 1024 ms; Packet 1133 B 2,21 2,3 3,8 4,06
Packet Send Average Delay (s) 10 20 30 40
LPL = 0 ms (No LPL) 1 1 1 1
LPL = 1024 ms; Packet 120 B 1 1 1 1
LPL = 1024 ms; Packet 1133 B 1,01 1 1,01 1,01
Jitter Packet Send (s) 10 20 30 40
LPL = 0 ms (No LPL) 0 0,001 0,001 0,001
LPL = 1024 ms; Packet 120 B 0,001 0,002 0,001 0,002
LPL = 1024 ms; Packet 1133 B 0,005 0,005 0,005 0,005
Page 9/22
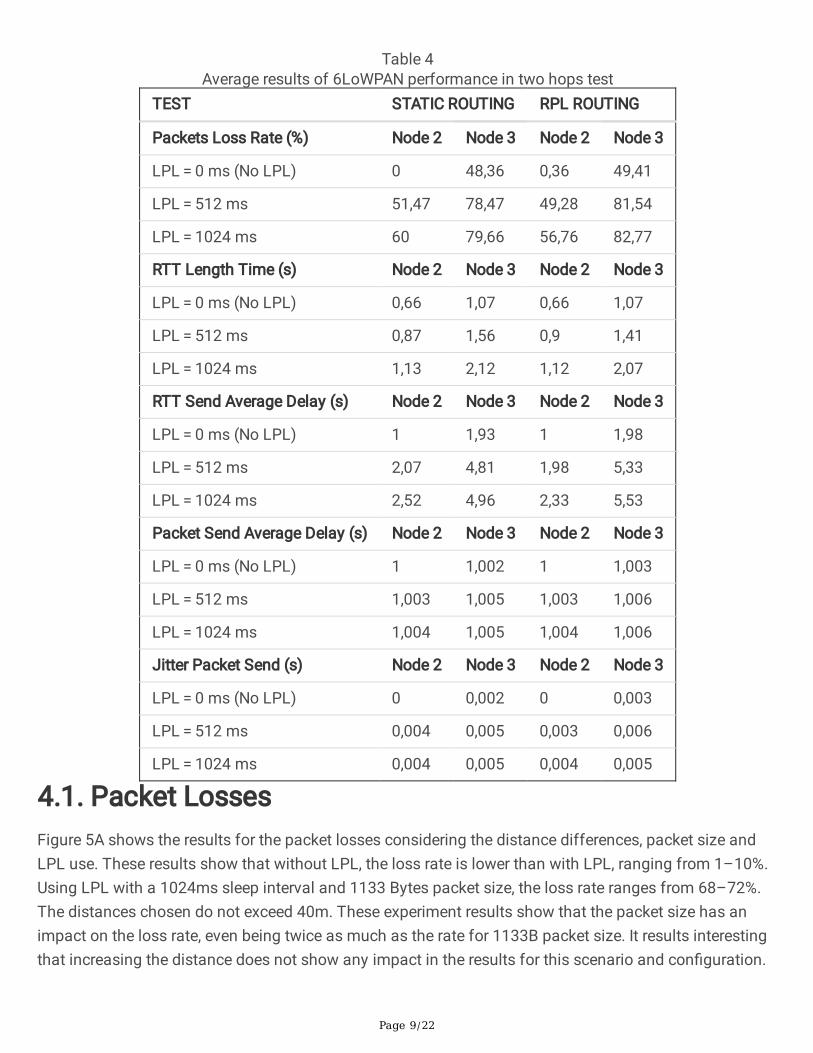
Table 4Average results of 6LoWPAN performance in two hops test
TEST STATIC ROUTING RPL ROUTING
Packets Loss Rate (%) Node 2 Node 3 Node 2 Node 3
LPL = 0 ms (No LPL) 0 48,36 0,36 49,41
LPL = 512 ms 51,47 78,47 49,28 81,54
LPL = 1024 ms 60 79,66 56,76 82,77
RTT Length Time (s) Node 2 Node 3 Node 2 Node 3
LPL = 0 ms (No LPL) 0,66 1,07 0,66 1,07
LPL = 512 ms 0,87 1,56 0,9 1,41
LPL = 1024 ms 1,13 2,12 1,12 2,07
RTT Send Average Delay (s) Node 2 Node 3 Node 2 Node 3
LPL = 0 ms (No LPL) 1 1,93 1 1,98
LPL = 512 ms 2,07 4,81 1,98 5,33
LPL = 1024 ms 2,52 4,96 2,33 5,53
Packet Send Average Delay (s) Node 2 Node 3 Node 2 Node 3
LPL = 0 ms (No LPL) 1 1,002 1 1,003
LPL = 512 ms 1,003 1,005 1,003 1,006
LPL = 1024 ms 1,004 1,005 1,004 1,006
Jitter Packet Send (s) Node 2 Node 3 Node 2 Node 3
LPL = 0 ms (No LPL) 0 0,002 0 0,003
LPL = 512 ms 0,004 0,005 0,003 0,006
LPL = 1024 ms 0,004 0,005 0,004 0,005
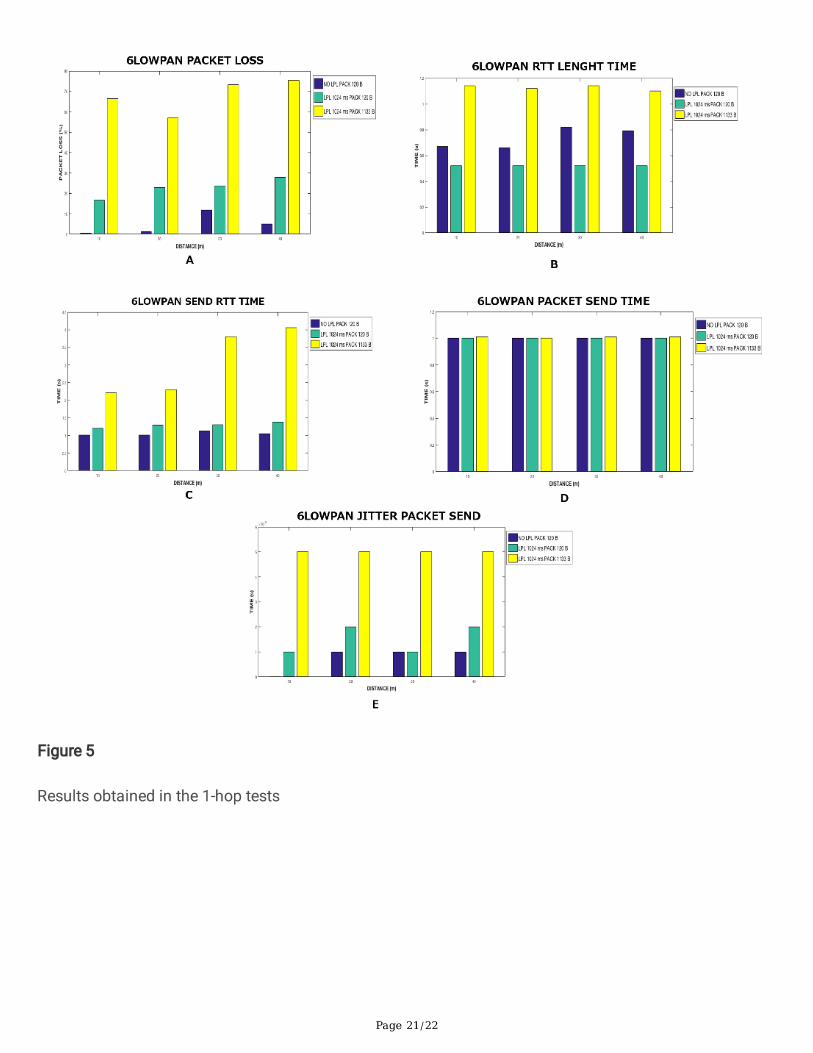
4.1. Packet LossesFigure 5A shows the results for the packet losses considering the distance differences, packet size andLPL use. These results show that without LPL, the loss rate is lower than with LPL, ranging from 1–10%.Using LPL with a 1024ms sleep interval and 1133 Bytes packet size, the loss rate ranges from 68–72%.The distances chosen do not exceed 40m. These experiment results show that the packet size has animpact on the loss rate, even being twice as much as the rate for 1133B packet size. It results interestingthat increasing the distance does not show any impact in the results for this scenario and con�guration.
Page 10/22
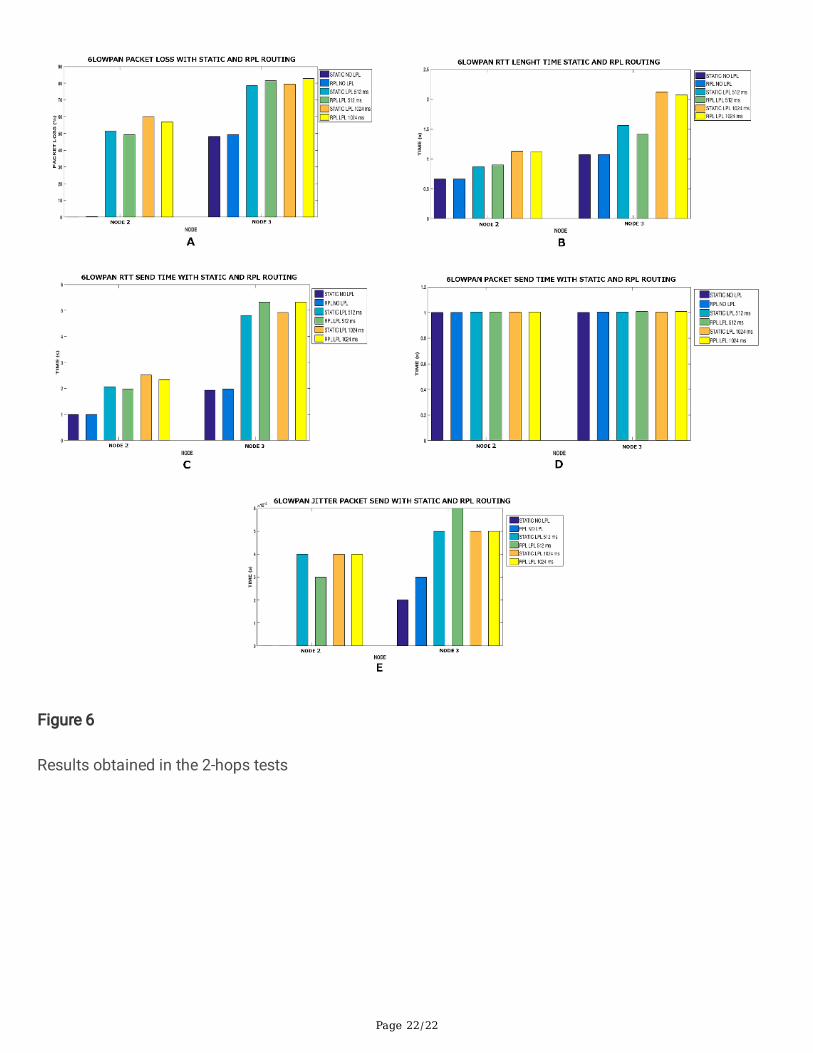
Figure 6A shows the packet losses for nodes 2 and 3, using static and dynamic routing. LPL with acon�guration of 0, 512 and 1024ms has been applied, resulting the 1024ms con�guration, the best interms of energy consumption. The Fig. 6A shows that the routing type does not affect the performance.Another interesting fact is that the node 2 does not lose any packet for the 0ms LPL-con�guration,otherwise, the node 3 loses up to 50% more packets than the node 2 for the same scenario andcon�guration.
In the test with LPL the packet loss rate increases for the node 2 and 3, but the difference betweendifferent LPL-con�gurations is not signi�cant, even in the node 3, where the differences are higher than innode 2.
4.2. RTT LatencyTables 3 and 4 show the average RTT latencies. Figure 5B shows similar results for the differentdistances tested in the 1-hop scenario. The RTT with a lower packet size shows a shortest duration, dueto the shortest processing time among the route. There is no signi�cant difference for the RTT durationsending 120B between 0 and 1024 ms LPL-con�guration. On the other hand, the RTT duration increasesup to 50% for 1133B sending with 1024 ms LPL-con�guration. Finally, the best results are shown in thetest sending 120B with 1024 ms LPL-con�guration, showing also that the distances are not signi�cantfor the performance analysis. Figure 6B presents the RTT duration results for a 2-hops scenario, showingno signi�cant difference in the results derived from the routing type. With 0 ms LPL-con�guration theoverall performance in terms of RTT duration is shorter than with the other con�gurations. The Fig. 6Balso shows differences of 0.3 s for node 2 and 0.5 s for node 3 with a 512 ms LPL-con�guration, howeverthe RTT duration is even higher for a 1024 ms LPL-con�guration. These test results show that node 3 hasa higher RTT, almost being twice as much as the duration than node 2 shows, in all the 2-hop tests carriedout, considering all the different con�gurations.
The application of a 0 ms LPL-con�guration results in an increment in terms of energy consumption butit also results in an improvement of the RTT duration time. Thus, between a 512 ms and a 1024 ms LPL-con�guration, the RTT duration time differences are not signi�cant, so it would be better to use a 1024ms LPL-con�guration in order to improve the energy consumption. Figure 5C presents the results in termsof RTT send average delay for 1-hop, showing a shorter delay for the 0 ms LPL-con�gurationcon�guration. Delay lightly increases with the distance as show the difference of 0.2s between 10 and 40m scenarios. This small difference does not affect the development of the tests. Figure 6C shows theresults of RTT send average delay for 2-hops scenario, showing no signi�cant differences betweenrouting types. For a 0 ms LPL-con�guration the RTT delay is generally shorter than for other LPL-con�gurations. In this scenario, the difference between nodes is signi�cant, reaching 2–3 seconds. For512 and 1024 ms LPL-con�gurations there is no signi�cant difference. Like in other scenarios, a 1024 msLPL-con�guration results in better energy consumption.
4.3. Jitter
Page 11/22
Tables 3 and 4 show the packet sending delay and the jitter results for the 1- and 2-hops scenarios underdifferent con�gurations. Figure 5D presents the packet sending delay for 1-hop scenarios, showing 1 sdelay for all the distances considered, regardless the packet size. The delays detected have been veryshort 3–4 ms, which have been associated to the processing time among the route. There are nosigni�cant differences between 0 and 1024 ms LPL-con�guration for 120B sending. Moreover, thedistances do not present any signi�cant in�uence in the jitter results.
Figure 6D presents the packet sending delay for 2-hops scenarios, con�rming that routing type does nothave any impact in the sending delay. For both routing types, 0 ms LPL-con�guration shows a shorterdelay than a 1024 ms LPL-con�guration, but as collateral drawback shows higher energy consumptionand 4 ms delay. Regarding to the jitter, Fig. 5E shows a higher jitter for 1-hop scenarios than for 2-hopsscenarios. Con�guration also plays a major role, showing a higher jitter sending 1133B and using1024ms LPL-con�guration. Changes in distances do not show any signi�cant impact in jitter results.Figure 6E presents the jitter results for 2-hops scenarios, and it shows lightly differences, around 6 ms forall the cases analysed. For these tests, the shortest jitter is shown with a 0 ms LPL-con�guration, whereasthe other LPL-con�gurations do not present any signi�cant difference. The difference between a 0 and1024 ms LPL-con�guration remains under 4 ms, resulting much more suitable the 1024 ms LPL-con�guration in order to reduce the energy consumption. Again, the routing type does not impact theoverall performance in terms of jitter.
ConclusionBased on the 1-hop tests carried out, it seems to be better the use of 1024 ms as channel scanning timecon�guration (LPL-con�guration) because the network performance does not drop and the energyconsumption is reduced. It has been observed that the packet size is signi�cant for this scenario,resulting the use of 1133B payload in longer delays and higher packet losses. Packet losses increase for2-hops scenarios, reaching its maximum for node 3. The impact of the LPL-con�guration is lightlysigni�cant in terms of packet losses, but more signi�cant in terms of energy consumption. A 1024 msLPL-con�guration results in a good compromise between losses and energy consumption. Routing typesdo not present any signi�cant difference for the different metrics analysed in the present paper. Packetsending delays are not signi�cant between 1- and 2-hops scenarios, remaining under 5 ms, thus, there isno signi�cant impact in the network performance. Distances between nodes do not seem to be signi�cantfor the performance of network, at least, not for the considered scenarios and con�gurations. It is highlyrecommended to use 1024 ms LPL-con�guration, not only for 1-hop scenarios, but also for 2-hopsscenarios in order to obtain an overall improvement in terms of energy consumption.
Finally, the TelosB platform is a system that allows its use for evaluation of data transmission. Althoughit is not a robust system, its use for monitoring �ash �oods is possible by implementing sensors such asrain gauges, given its easy integration. Currently the literature does not evidence works that apply theTelosB platform and the 6LoWPAN method for �ash �ood monitoring systems.

Page 12/22
List Of Abbreviations6LowPAN: IPV6 Low Power Wireless Personal Area Networks
BAN: Body Area Networks
BLIP: Berkeley Low-Power IP stack
EWS: Early Warning System
ICMPV6: Internet Control Message Protocol for the Internet Protocol Version 6
IETF: Internet Engineering Task Force
IoT: Internet of Things
LPL: Low Power Listening
NEMO: Networking mobility
RPL: Routing Protocol for Low-Power and Lossy Networks
RTT: Round Trip Times
WPAN: Wireless Personal Area Networks
WSN: Wireless Sensor Networks
DeclarationsAvailability of data and materials: The authors declare that all the data and materials in this manuscriptare available.
Competing Interest: There is no competing interest.
Funding: As the paper is supported by the 1st author by the Universidad de la costa< Barranquilla,Colombia.
References1. R. James, The Internet of things: a study in hype, reality, disruption, and Growth. Raymond James US
Research, Technology & Communications, Industry Report. 2014
2. D. Evans, The Internet of Things How the Next Evolution of the Internet Is Changing Everything. CiscoInternet Business Solutions Group (IBSG). 2011; 1–11

Page 13/22
3. I. Lee, K. Lee, The Internet of Things (IoT): Applications, investments, and challenges for enterprises.Bus. Horiz. 58(4), 431–440 (2015). http://dx.doi.org/10.1016/j.bushor.2015.03.008
4. G. Piñeres-Espitia, A. Mejía-Neira, Technological platforms applied the climatic monitoring.Prospectiva 11(2), 78–87 (2013). DOI:http://dx.doi.org/10.15665/rp.v11i2.42
5. A. Foerster, A. Udugama, C. Görg, K. Kuladinithi, A. Timm-Giel, A. Cama-Pinto. A novel datadissemination model for organic data �ows. Lecture Notes of the Institute for Computer Sciences,Social-Informatics and Telecommunications Engineering, LNICST. 2015; 158:239–252 p.http://dx.doi.org/10.1007/978-3-319-26925-2_18
�. F. Estevez, P. Glosekoetter, J. González, DARAL: A Dynamic and Adaptive Routing Algorithm forWireless Sensor Networks. Sensors. 16(7), 960 (2016). doi:10.3390/s16070960
7. M. Bouaziz, A. Rachedi, A survey on mobility management protocols in Wireless Sensor Networksbased on 6LoWPAN technology. Comput. Commun. 74, 3–15 (2016)
�. J. Granjal, E. Monteiro, J.S. Silva, Security for the internet of things: a survey of existing protocolsand open research issues. IEEE Communications Surveys & Tutorials 17(3), 1294–1312 (2015)
9. J. Vasseur, A. Dunkels. Interconnecting Smart Objects with IP: The Next Internet. United States.Morgan Kaufmann Publisher/Elsevier; 2010. 231 p
10. A. Zanella, N. Bui, A. Castellani, L. Vangelista, M. Zorzi, Internet of Things for Smart Cities. IEEEInternet of Things Journal 1(1), 22–32 (2014). doi:10.1109/JIOT.2014.2306328
11. T.N. Quynh, N. Le Manh, K.N. Nguyen. Multipath RPL protocols for greenhouse environmentmonitoring system based on Internet of Things. 2015 12th International Conference on ElectricalEngineering/Electronics, Computer, Telecommunications and Information Technology (ECTI-CON).2015; 1–6 p. doi: 10.1109/ECTICon.2015.7207135
12. A. Cenedese, A. Zanella, L. Vangelista, M. Zorzi Padova Smart City: An urban Internet of Thingsexperimentation. Proceeding of IEEE International Symposium on a World of Wireless, Mobile andMultimedia Networks, 2014. 2014; 1–6. doi: 10.1109/WoWMoM.2014.6918931
13. A. Cama-Pinto, G. Piñeres-Espitia, Z. Comas-González, J. Zapata-Vélez, F. Gómez-Mula, Design of amonitoring network of meteorological variables related to tornadoes in Barranquilla-Colombia and itsmetropolitan area. Ingeniare. Revista chilena de ingeniería 24(4), 585–598 (2017)
14. El Heraldo. Proyecto universitario sobre arroyos será �nanciado por Colciencias. 2013.https://www.elheraldo.co/local/proyecto-universitario-sobre-arroyos-sera-�nanciado-por-colciencias-103883. Accessed 06 November 2017
15. C. Walravens, W. Dehaene. Design of a low-energy data processing architecture for WSN nodes.Design, Automation & Test in Europe Conference & Exhibition. 2012; 570–573. doi:10.1109/DATE.2012.6176534
1�. O. Hahm, E. Baccelli, H. Petersen, N. Tsiftes, Operating systems for low-end devices in the internet ofthings: a survey. IEEE Internet of Things Journal 3(5), 720–734 (2015)
17. M. Khan, A. Lodhi, A. Rehman, A. Khan, F. Hussain, Sink-to-Sink Coordination Framework Using RPL:Routing Protocol for Low Power and Lossy Networks. Journal of Sensors 11(4), 2002–2019 (2016).

Page 14/22
doi:10.1155/2016/2635429
1�. T. Dinh, Y. Kim, T. Gu, A.V. Vasilakos, An adaptive low-power listening protocol for wireless sensornetworks in noisy environments. IEEE systems journal 12(3), 2162–2173 (2017)
19. V. Chandrasekar, H. Chen, B. Philips, "DFW urban radar network observations of �oods, tornadoesand hail storms," 2018 IEEE Radar Conference (RadarConf18), Oklahoma City, OK, 2018, pp. 0765–0770. doi: 10.1109/RADAR.2018.8378656
20. 20 Lemon, L. R., Donaldson Jr, R. J., Burgess, D. W., & Brown, R. A. (1977). Doppler radar applicationto severe thunderstorm study and potential real-time warning. Bulletin of the AmericanMeteorological Society, 58(11), 1187–1193. https://doi.org/10.1175/1520-0477(1977)058<1187:DRATST>2.0.CO;2
21. C. 21 Corral, M. Berenguer, D. Sempere-Torres, L. Poletti, F. Silvestro, N. Rebora, Comparison of twoearly warning systems for regional �ash �ood hazard forecasting. J. Hydrol. (2019).https://doi.org/10.1016/j.jhydrol.2019.03.026
22. A. 22 Schimmel, J. Hübl, Automatic detection of debris �ows and debris �oods based on acombination of infrasound and seismic signals. Landslides 13(5), 1181–1196 (2016)
23. N. 23 Ya’acob, N. Tajudin, A.M. Azize, Rainfall-landslide early warning system (RLEWS) using TRMMprecipitation estimates. Indonesian Journal of Electrical Engineering and Computer Science 13(3),1259–1266 (2019). DOI:10.11591/ijeecs.v13.i3.pp1259-1266
24. S. 24 Segoni, L. Piciullo, S.L. Gariano, A review of the recent literature on rainfall thresholds forlandslide occurrence. Landslides 15(8), 1483–1501 (2018)
25. A. 25 Schimmel, J. Hübl, Automatic detection of debris �ows and debris �oods based on acombination of infrasound and seismic signals. Landslides 13(5), 1181–1196 (2016)
2�. M. 26 Azam, S. Kim, H., & S.J. Maeng, Development of �ood alert application in Mushim streamwatershed Korea. International journal of disaster risk reduction 21, 11–26 (2017)
27. C. 27 Cecioni, G. Bellotti, A. Romano, A. Abdolali, P. Sammarco, L. Franco, Tsunami early warningsystem based on real-time measurements of hydro-acoustic waves. Procedia Eng. 70, 311–320(2014)
2�. B.S.B. 28 Dewantara, F. Ardilla (2018). Early Warning and IoT-based Reporting System for MobileTrash Bin Robot Application. In 2018 International Electronics Symposium on Knowledge Creationand Intelligent Computing (IES-KCIC) (pp. 341–348). IEEE
29. N.-A. 29 Maspo, A.N. Harun, M. Goto, M.N.M. Nawi, N.A. Haron, Development of internet of thing (Iot)technology for �ood prediction and early warning system (EWS). International Journal of InnovativeTechnology and Exploring Engineering 8(4S), 219–228 (2019)
30. R.H. 30 Randhawa, R. Mahmood, T. Ahmad (2018, December). AquaEye: A Low Cost Flood EarlyWarning System for Developing Countries. In 2018 International Conference on Frontiers ofInformation Technology (FIT) (pp. 345–349). IEEE
31. 31 Intrieri, E., Gigli, G., Gracchi, T., Nocentini, M., Lombardi, L., Mugnai, F.,… & Fornaciai, A. (2018).Application of an ultra-wide band sensor-free wireless network for ground monitoring. Engineering

Page 15/22
Geology, 238, 1–14
32. 32 A. Cama-Pinto, G. Piñeres-Espitia, R. Zamora-Musa, M. Acosta-Coll, J. Caicedo-Ortiz, J. Sepulveda-Ojeda. Design of a wireless sensor network for monitoring of �ash �oods in the city of BarranquillaColombia. Ingeniare. Revista chilena de ingeniería. 2016; 24(4):581–599.http://dx.doi.org/10.4067/S0718-33052016000400005
33. 33. J. Arrieta, Y. Fernández. Estimación De Los Caudales Del Arroyo La Segunda Brigada II ParaDiferentes Períodos De Retorno Aplicando La Herramienta Computacional Epa-Swmm. 2015.http://hdl.handle.net/11323/490. Accessed November 29, 2017
34. 34. A. Raad, D. Villa. Diseño y desarrollo de una aplicación móvil para dispositivos android para unsistema de alerta temprana de los arroyos de la ciudad de Barranquilla. 2014.http://hdl.handle.net/11323/238. Accessed November 29, 2017
35. 35. A. Chatap, S. Sirsikar. Review on various routing protocols for heterogeneous wireless sensornetwork. In I-SMAC (IoT in Social, Mobile, Analytics and Cloud)(I-SMAC), 2017 InternationalConference on. 2017; 440–444
3�. 36. J. He, X. Huang. Increased interoperability: Evolution of 6LoWPAN-based web application. 4thIEEE International Conference on Broadband Network and Multimedia Technology (IC-BNMT),Shenzhen. 2011; 507–510. doi: 10.1109/ICBNMT.2011.6155986
37. 37. D.W. Courtney, P. Thulasiraman (2016, April). Implementation of secure 6LoWPANcommunications for tactical wireless sensor networks. In 2016 IEEE Conference on ComputerCommunications Workshops (INFOCOM WKSHPS) (pp. 704–709). IEEE
3�. 38. Y. Ch, K. Hou, H. Zhou, H. Shi, X. Liu, X. Diao, H. Ding, J. Li, C. Vaulx 6LoWPAN Stacks: A Survey.7th International Conference on Wireless Communications, Networking and Mobile Computing(WiCOM), Wuhan, 2011; 1–4. doi: 10.1109/wicom.2011.6040344
39. 39. Z. Suryady, M. Shaharil, K. Bakar, R. Khoshdelniat. G.R. Sinniah, U. Sarwar. Performanceevaluation of 6LoWPAN-based precision agriculture. International Conference on InformationNetworking (ICOIN), 2011; 171–176 p. doi: 10.1109/ICOIN.2011.5723173
40. R. Chai, Y. Zhao, Q. Chen, T. Dong, W. Zhou. Group mobility in 6LoWPAN-based WSN. InternationalConference on Wireless Communications and Signal Processing (WCSP). 2010; 1–5. doi:10.1109/WCSP.2010.5633536
41. V. Michopoulos, L. Guan, G. Oikonomou, I. Phillips. A comparative study of congestion controlalgorithms in IPv6 Wireless Sensor Networks. International Conference on Distributed Computing inSensor Systems and Workshops (DCOSS). 2011; 1–6. doi: 10.1109/DCOSS.2011.5982218
42. S. Raza, S. Duquennoy, T. Chung, D. Yazar, T. Voigt, U. Roedig. Securing communication in 6LoWPANwith compressed Ipsec. International Conference on Distributed Computing in Sensor Systems andWorkshops (DCOSS). 2011; 1–8. doi: 10.1109/DCOSS.2011.5982177
43. M. Bouaziz, A. Rachedi, A survey on mobility management protocols in Wireless Sensor Networksbased on 6LoWPAN technology. Comput. Commun. 74, 3–15 (2016)
Page 16/22
44. S.R. Moosavi, T.N. Gia, E. Nigussie, A.M. Rahmani, S. Virtanen, H. Tenhunen, J. Isoaho, End-to-endsecurity scheme for mobility enabled healthcare Internet of Things. Future Generation ComputerSystems 64, 108–124 (2016)
45. S. Takizawa, N. Komuro, S. Sakata. Routing control scheme prolonging network lifetime in a6LoWPAN WSN with Power-supplied and battery-powered nodes. IEEE Consumer Communicationsand Networking Conference (CCNC). 2012; 285–289. doi: 10.1109/CCNC.2012.6181103
4�. A. Efendi, S. Oh, A. Negara, D. Choi. Battery-Less 6LoWPAN-Based Wireless Home Automation by Useof Energy Harvesting. Int. J. Distrib. Sens. Netw. 2013; 9(7) doi:10.1155/2013/924576
47. Montoya F, Gómez J, Cama-Pinto A, Zapata-Sierra A, Martínez F, De La Cruz J, Manzano-Agugliaro F.A monitoring system for intensive agriculture based on mesh networks and the android system.Computers and Electronics in Agriculture 2013; 99: 14–20.<http://dx.doi.org/10.1016/j.compag.2013.08.028>.
4�. A. Cama-Pinto, F. Montoya, J. Gómez, J. De La Cruz, F. Manzano-Agugliaro, Integration ofcommunication technologies in sensor networks to monitor the Amazon environment. J. Clean. Prod.59, 32–42 (2013). http://dx.doi.org/10.1016/j.jclepro.2013.06.041
49. P.A. Neves, J.J. Rodrigues, M. Chen, A.V. Vasilakos, A multi-channel architecture for IPv6-enabledwireless sensor and actuator networks featuring PnP support. Journal of Network and ComputerApplications 37, 12–24 (2014)
50. C. Pham, Communication performances of IEEE 802.15.4 wireless sensor motes for data-intensiveapplications: A comparison of WaspMote, Arduino MEGA, TelosB, MicaZ and iMote2 for imagesurveillance. Journal of Network and Computer Applications. 46, 48–59 (2014).http://dx.doi.org/10.1016/j.jnca.2014.08.002
51. M. Hefeida, T. Canli, A. Khokhar. CL-MAC:, A Cross-Layer MAC protocol for heterogeneous WirelessSensor Networks. Ad Hoc Netw. 11(1), 213–225 (2013).http://dx.doi.org/10.1016/j.adhoc.2012.05.005
52. A. Nahas, S. Duquennoy, V. Iyer, T. Voigt. Low-Power Listening Goes Multi-channel. IEEE InternationalConference on Distributed Computing in Sensor Systems (DCOSS). 2014; 2–9. doi:10.1109/DCOSS.2014.33
53. O. Gaddour, A. Koubâa, RPL in a nutshell: A survey. Comput. Netw. 56(14), 3163–3178 (2012).http://dx.doi.org/10.1016/j.comnet.2012.06.016
54. S. Sankar Bhunia, S. Kumar Das, S. Roy, N. Mukherjee, An Approach to Manage Mobility of SensorNodes in Sensor-Grid Infrastructure. Procedia Technol. 6, 754–762 (2012).http://dx.doi.org/10.1016/j.protcy.2012.10.091
55. J. Santos, J.J. Rodrigues, B.M. Silva, J. Casal, K. Saleem, V. Denisov, An IoT-based mobile gatewayfor intelligent personal assistants on mobile health environments. Journal of Network and ComputerApplications 71, 194–204 (2016)
5�. N. Hoque, M.H. Bhuyan, R.C. Baishya, D.K. Bhattacharyya, J.K. Kalita, Network attacks: Taxonomy,tools and systems. Journal of Network and Computer Applications 40, 307–324 (2014)
Page 17/22
57. F. Montoya, J. Gomez, F. Manzano-Agugliaro, A. Cama, A. García-Cruz, J. De La Cruz, 6LoWSoft: Asoftware suite for the design of outdoor environmental measurements. Journal of Food, Agricultureand Environment. 11(3–4), 2584–2586 (2013)
5�. A. Kamilaris, V. Trifa, A. Pitsillides. HomeWeb: An application framework for Web-based smarthomes. 18th International Conference on Telecommunications (ICT), 2011; 134–139. doi:10.1109/CTS.2011.5898905
59. N. Baccour, A. Koubâa, H. Youssef, M. Alves, Reliable link quality estimation in low-power wirelessnetworks and its impact on tree-routing. Ad Hoc Netw. 27, 1–25 (2015).http://dx.doi.org/10.1016/j.adhoc.2014.11.011
�0. A. Cama-Pinto, G. Piñeres-Espitia, J. Caicedo-Ortiz, E. Ramírez-Cerpa, F. Betancur-Agudelo, Gómez-Mula, Received strength signal intensity performance analysis in wireless sensor network usingArduino platform and XBee wireless modules. Int. J. Distrib. Sens. Netw. 13(7), 1–10 (2017).https://doi.org/10.1177/1550147717722691
Figures
Figure 1
A-B. Flash foods Barranquilla City. B-C. Flash food in “The Brigade” zone.
Page 18/22
Figure 2
RPL-6LoWPAN network stack
Page 19/22
Figure 3
Steps by con�guration the TelosB platform.
Page 20/22
Figure 4
Snapshot of the scenario tested
Page 21/22
Figure 5
Results obtained in the 1-hop tests
Page 22/22
Figure 6
Results obtained in the 2-hops tests