Embed Size (px)
Citation preview
APPLY INDUSTRIAL DESIGN METHODOLOGY TO MULTIDISCIPLINARY PROJECTS
BY
QI CHEN
THESIS
Submitted in partial fulfillment of the requirementsfor the degree of Master of Fine Arts in Art and Design
with a concentration in Industrial Designin the Graduate College of the
University of Illinois at Urbana-Champaign, 2011
Urbana, Illinois
Adviser:
Professor Kevin Reeder
ABSTRACT
The purpose of this study was to apply knowledge from industrial design to other related field such as user interface design, computer science, education, etc. The author had the chance to participate in several multi-disciplinary projects with students from other majors and applied knowledge from industrial design to the projects of interface design for online voting system and interface design of education portal.
This study are assembled by two projects, but more importantly from working on the two projects of interface design, author developed the method of applying industrial design knowledge to that different fields, the study contains both the ways that author tried to apply the practical design knowledge to the inter-disciplinary field and the afterward result; which means the study will not mainly analyze the process of applying industrial design methodologies to interface design projects.
From the background of industrial design, it always encourages the designer/researcher to directly interact with the product or to experience usersʼ feeling, and innovate, which mostly means to revise what already existed; while other field encourage the steady improvement. The popular methodology in industrial design encourage the designers to continue bring up different/ innovated ideas, then to evaluate and select; while from interface design or engineering, the methodology also encourage innovation but much more steady, which means the design will always follow the similar standard for the most of part and the improvement will be based on the certain study. Other conclusions will be carry out through out the content of this study.
With the authorʼs experience of applying the knowledge from industrial design to other related fields, it carries out some innovations of the methodologies which maybe applicable for not only industrial design but also the other fields, and again this not only include the methodology itself but also the way of how to apply it to the multi-disciplinary field, further explanation will be addressed in the study.
ii
TABLE OF CONTENTS
CHAPTER 1: PROJECT 1-INTERFACE DESIGN FOR ONLINE VOTING SYSTEM VISUALIZE THE IDEA POSTING WEBPAGE: MYSTARBUCKSIDEAS.COM .......................................................................... 1
CHAPTER 2: PROJECT 2-ENCOURAGING EDUCATIONAL ENGAGEMENT THROUGH INTERFACE DESIGN SOFTWARE FOR MIDDLE SCHOOLS IN CHINA ................................. 16
CHAPTER 3: METHODOLOGY ................................................................................... 40
CHAPTER 4: CONCLUSIONS ..................................................................................... 52
REFERENCES ............................................................................................................. 53
iii
CHAPTER 1PROJECT 1-INTERFACE DESIGN FOR ONLINE VOTING SYSTEM
VISUALIZE THE IDEA POSTING WEBPAGE-MYSTARBUCKSIDEAS.COM
1.1 Introduction:1.1.1 Abstract:This project is about reconstructing the idea posting website for the users to view and interact with the web page in a more efficient and creative way. The final goal of this project will be the study of the restructured interface of the idea viewing page. The final design will be developed based on the interview and evaluation with the selected potential users in the target group, the final result will be evaluated from the comparison of data which will be collected from the record of the observation and the feedback from the questionnaire of each interface.1.1.2 BackgroundAs the technology is widely spreading nowadays, how to manage the way of viewing and comprehending the information becomes a more and more crucial problem that affects the public effectiveness, interests and eventually the content of information itself. This project is focusing on the problem solving of viewing the idea posting website. There are more and more idea posting or idea exchanging website coming up due to the public seeking of self identification, information communication, problem solving or general creativeness, etc. But the way all the idea posting websites are currently using to display the ideas does not provide user enough effectiveness which leads to the consequence of time consuming, receding interest or missing valuable parts of information. The way how my design manages and displays the information will address and improve the effectiveness and creativeness, this will also diminish lots of the problems I mentioned above about the traditional way of displaying ideas.
1
The design will follow the structure of navigating on the site towards usersʼ need, I started designing and thinking about the relationship between userʼs interest and the content of ideas, the relationship between ideas, brainstorming on selecting ideas from “mystarbucksidea.com” (msi) has been generated and evaluated along with the interviews with design major students who are frequently using similar online forum.I also considered the similarity of each idea, to create a way of combining same ideas or showing the connection between similar ideas which have the intersection partially.
1.2 Related worksMost data on the web (also in businesses and governments) is heterogeneous, unstructured, and often incomplete. Such a collection of heterogeneous data has been called a data space, long-term research is needed for managing the data. spaces. The visualizations don’t need detailed knowledge of data source or schemas; there are two phases of matching the problems: the first one is a path indexing phase to enumerate and prioritize which paths to consider, and the second one is the combination of path examples that attempts to select the best set for each object.Method of integrating visualization and querying-- using the query to give us additional hints for selecting appropriate visualization and using the visualization to help the user formulate the next query.In the heterogeneous data: 1) There are multiple distinct attributes with similar semantics.2) Each object has an incomplete subset of the possible attributes. 3) The above effects can be compounded when following sequences of multiple associations.4) Consequently, retrieving semantically equivalent information pertaining to two different objects may require traversing completely different paths in the graph.The typical procedure of addressing the challenging problems and consequences are as follow: (1) Pose a challenging business problem to the corporate community. (2) Foster community ideation.
2
(3) Filter and refine the best ideas. (4) Launch or integrate the ideas into a product or product-centric pathway.Three layers of developing the system framework are the database layer, the logical control layer and the presentation layer. The database layer stores data extracted from the parsed documents. The logic control layer houses multiple modules for processing user queries or accessing different functions. This layer serves as a middle ware connecting the presentation (user front-end) layer and the back-end database layer. The presentation layer provides user interfaces and so that it allows web access to various functions.
1.3 Primarily User Research:1.3.1 User research planVisualizing idea posting using mystarbucksidea.comThis project is to redesign an existing interface, my user research goals can be broadly categorized under two notions. I would firstly like to conduct an evaluation of the current interface, yet still be open to all the factors I might consider if I was designing the interface from scratch. This will allow me to incorporate the good parts of the current design, without restricting myself for the design.To achieve the first of my goals, I will observe how the user interacts with the current mystarbucksideas website. This will help me determine both the good and bad parts of the existing interface. For example, Mystarbucksideas is an idea posting initiative but their website does not provide an intuitive user experience of the design. Monitoring user activity on the website will provide me a better understanding of how a user attempts to connect to this community, and thus enable me to improve upon it.To accomplish my other goal, I need to garner a better understanding of the userʼs thinking and mapping idea habits. A novel aspect of the interface I am trying to create is to provide user the ability to explore the ideas that they are not familiar with based on the correlation from the idea they are familiar with to the idea that they are not that familiar with. I believe the anonymity of these actions will contribute significantly to my design choices.The tasks which will be specifically observed and/or the questions which will be asked.
3
Below is an outline of questions I plan to begin with.
● What is your habit of purchasing product in the shop such as star-bucks?
● Have you viewed any kind of idea posting website?
● What kind of topic are you interested in of viewing the idea posting website?
● What part of the idea posting website causes your interests if you are a novel user?
● What part of the idea posting website makes you decide to visit that website regularly?I have a list of general tasks I plan to observe my users perform as they interact with current interface. While theyʼre performing these tasks, I intend to prompt them for an explanation when I feel their needs.
○ visiting the website for the first time without knowing what it does
○ how they navigate the website to discover what it does
○ whether the user understands how the website works after a certain amount of time
○ process of searching for an idea
■ how they use filters, sorting
■ whether they read the entire idea description
■ factors that they want to do to reflect their thoughts about the idea(vote for like or dislike, comments, any other things?)
○ what they do right after reflecting their thoughts to the idea?
■ social media integration? advertise?
Questions:
● How easy was it to understand about the website?
● In what approach did you find out the idea that you are interested in?
● What was confusing or difficult about the website or the process of idea searching or
reflecting of your own thoughts?
● Did you get enough information off the website, did you feel comfortable with the information you were viewing, what was missing? What more would you like?
1.3.2 User Research Reports and Task Scenarios
4
I have interviewed 3 design major students, all of them didnʼt have lots of experience of using the idea posting website.A profile characterizing typical users.Bob is a graduate student at the University of Illinois in his second year as a master of fine art student in design major. After he graduates in May, he plans to work in an design/consulting firm. In the long term plan, he wants to start his own design firm after he gains enough experience from working in the industry, so he has a keen sense of the direction of the industry, especially in the region of design. He spent a big portion of time online everyday for both work and entertainment, he always likes to discover the new interesting website(the “interesting” indicates form, style, content, user experience, idea, content, etc) and share it with his colleagues.Bob sometimes goes to the shop of star- bucks, he always buys coffee from 2-3 types which are his favorite, some times he might have some idea about star- bucks, but it always happens when he is in the store, when he came back to his home or studio, he hardly considered those issues.There are three main goals from the interview I had with the users when they are using the website, I will discuss more about the actions based on the goals and the persona.GOAL1: post their own ideas about the topic they are interested or the issue they care about GOAL2: recall the issue their ideas in the memory to generate the topic they are going to post onlineGOAL3: giving feedback to the idea that the viewer is interested about
1.4 Mockup creatingThree types of mockup have been generated to fulfill the three main goals we have mentioned above.1.4.1 The first type of mockup is to reproduce the reality in the form of the graphic/flash design for reproducing the information of the star-bucks stores and their products. Viewer will have the sense of going back to the real star-bucks shop. By hovering over the mouse on each icon which represent a category of the ideas, such as the coffee &
5
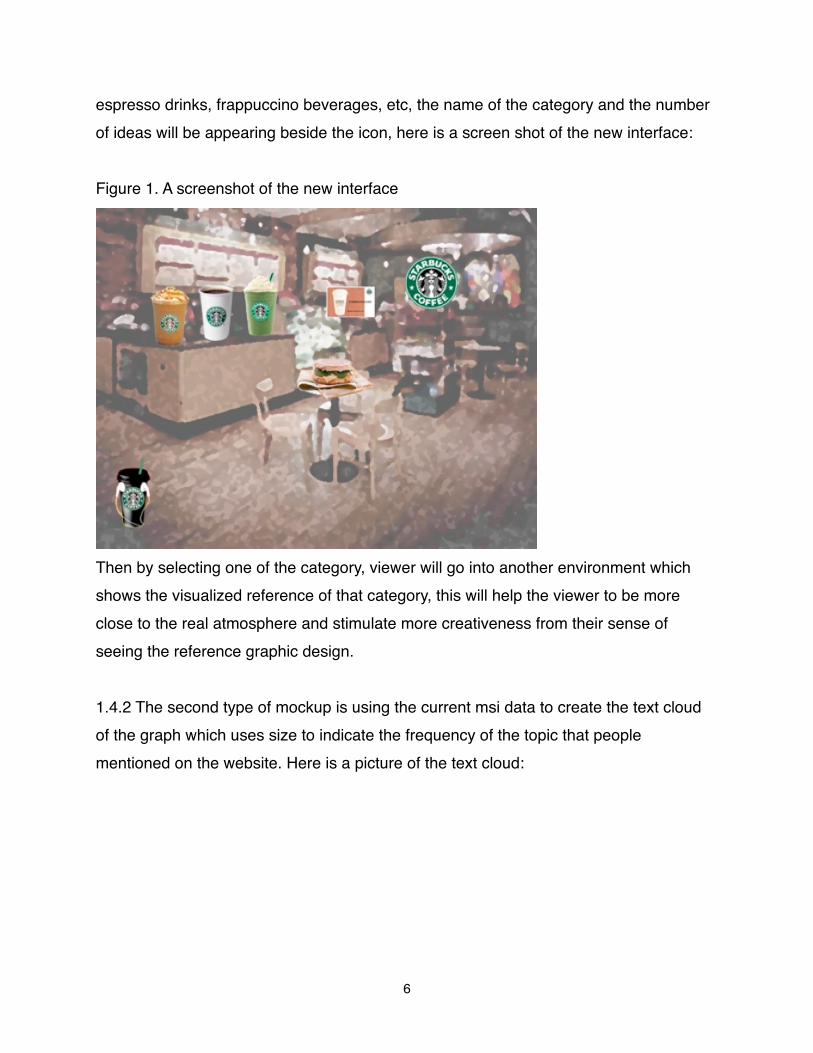
espresso drinks, frappuccino beverages, etc, the name of the category and the number of ideas will be appearing beside the icon, here is a screen shot of the new interface:
Figure 1. A screenshot of the new interface
Then by selecting one of the category, viewer will go into another environment which shows the visualized reference of that category, this will help the viewer to be more close to the real atmosphere and stimulate more creativeness from their sense of seeing the reference graphic design.
1.4.2 The second type of mockup is using the current msi data to create the text cloud of the graph which uses size to indicate the frequency of the topic that people mentioned on the website. Here is a picture of the text cloud:
6
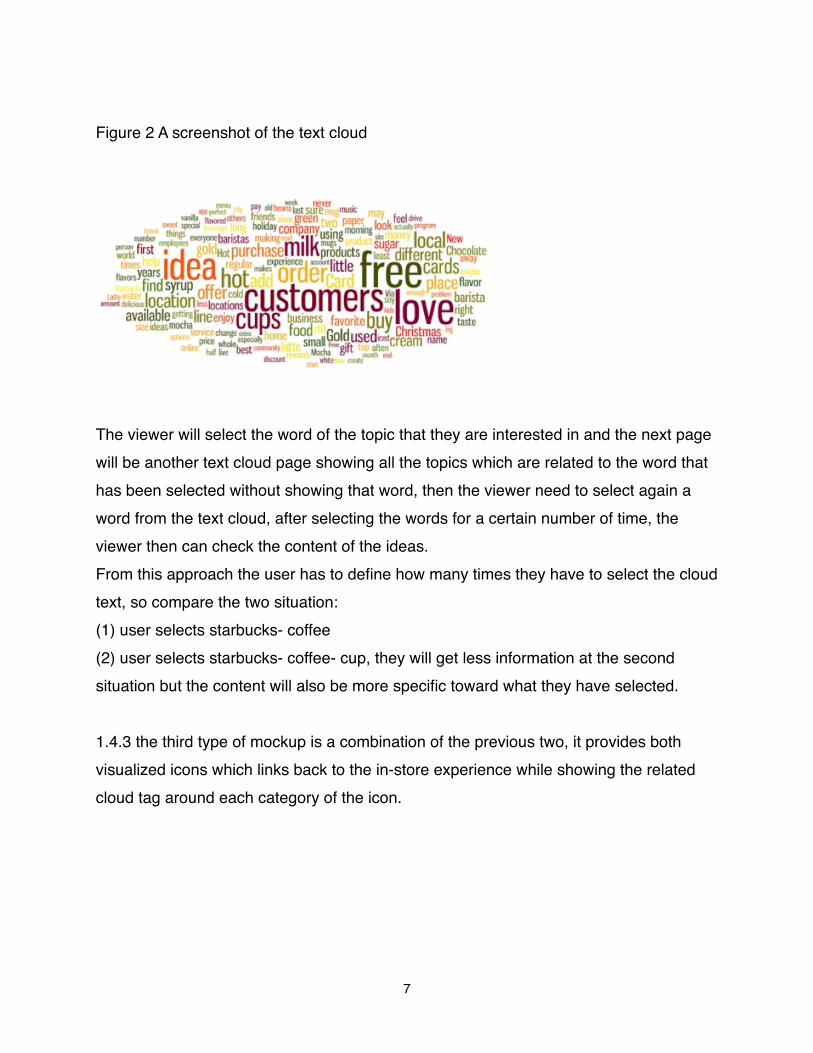
Figure 2 A screenshot of the text cloud
The viewer will select the word of the topic that they are interested in and the next page will be another text cloud page showing all the topics which are related to the word that has been selected without showing that word, then the viewer need to select again a word from the text cloud, after selecting the words for a certain number of time, the viewer then can check the content of the ideas.From this approach the user has to define how many times they have to select the cloud text, so compare the two situation: (1) user selects starbucks- coffee (2) user selects starbucks- coffee- cup, they will get less information at the second situation but the content will also be more specific toward what they have selected.
1.4.3 the third type of mockup is a combination of the previous two, it provides both visualized icons which links back to the in-store experience while showing the related cloud tag around each category of the icon.
7
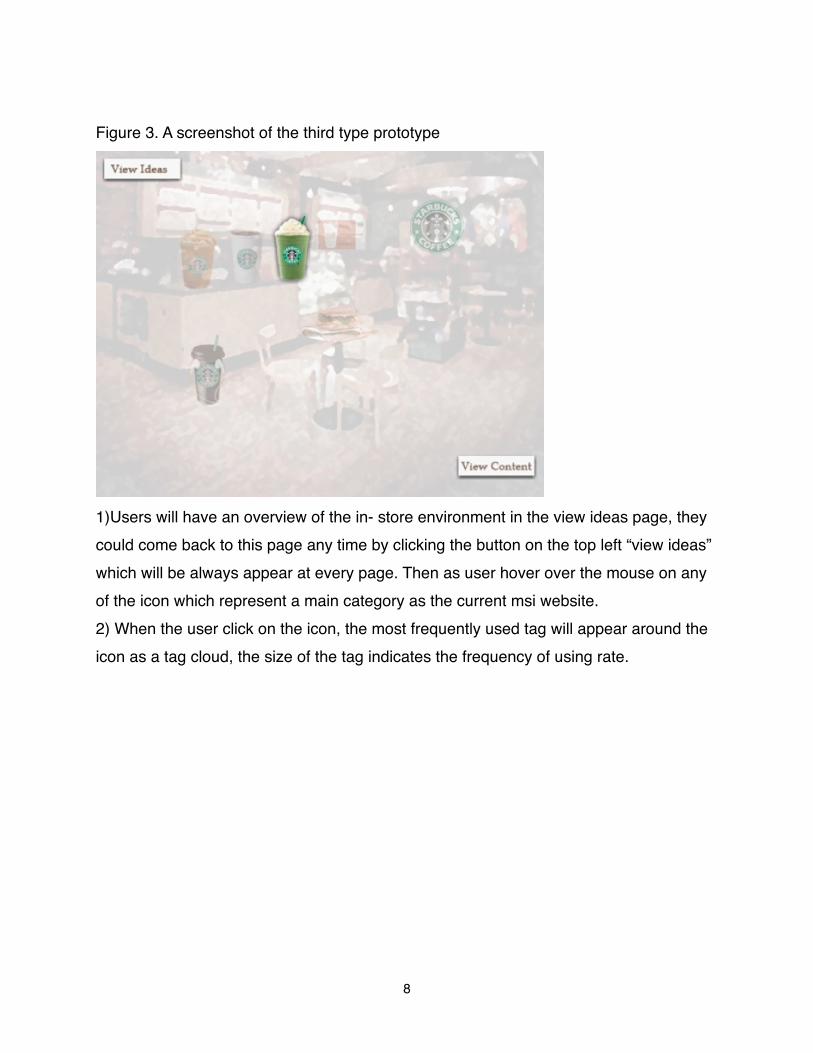
Figure 3. A screenshot of the third type prototype
1)Users will have an overview of the in- store environment in the view ideas page, they could come back to this page any time by clicking the button on the top left “view ideas” which will be always appear at every page. Then as user hover over the mouse on any of the icon which represent a main category as the current msi website.2) When the user click on the icon, the most frequently used tag will appear around the icon as a tag cloud, the size of the tag indicates the frequency of using rate.
8
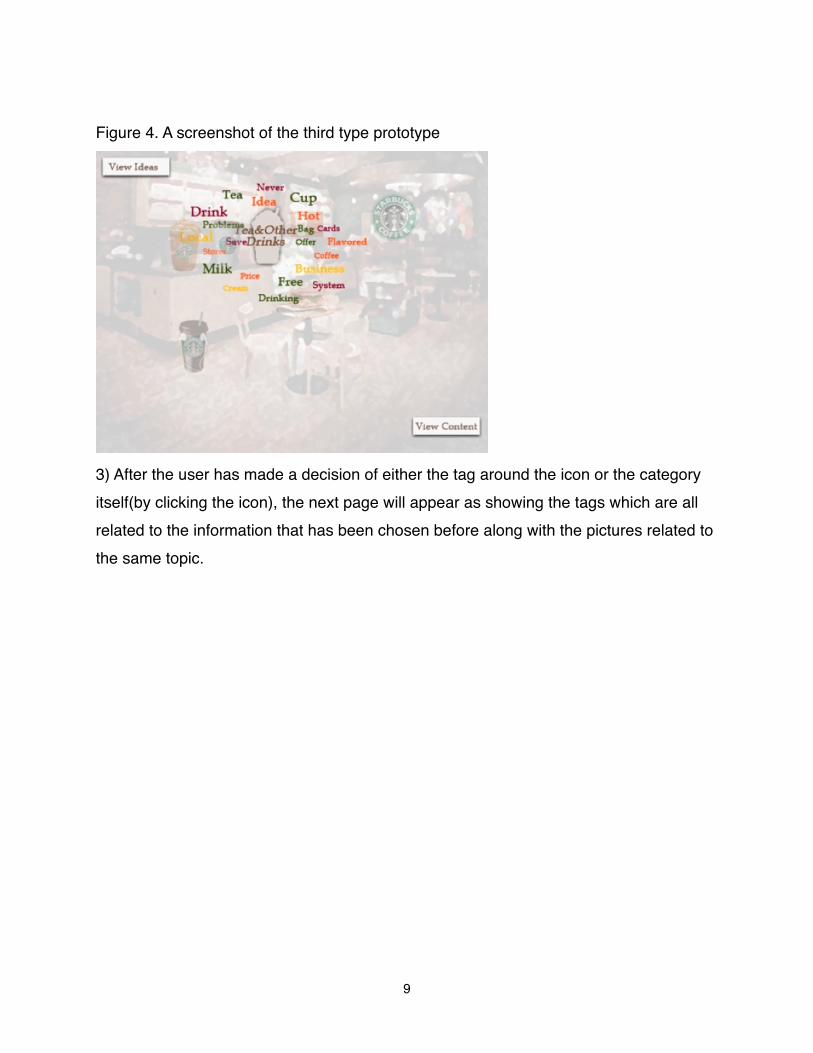
Figure 4. A screenshot of the third type prototype
3) After the user has made a decision of either the tag around the icon or the category itself(by clicking the icon), the next page will appear as showing the tags which are all related to the information that has been chosen before along with the pictures related to the same topic.
9
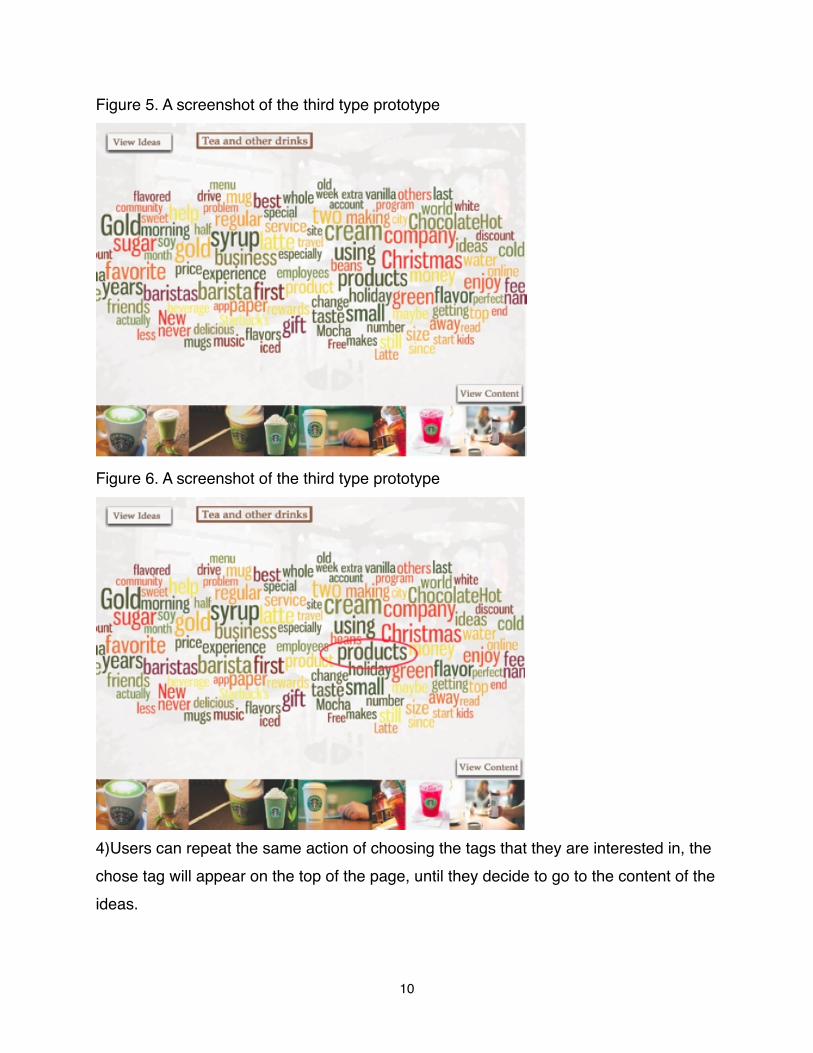
Figure 5. A screenshot of the third type prototype
Figure 6. A screenshot of the third type prototype
4)Users can repeat the same action of choosing the tags that they are interested in, the chose tag will appear on the top of the page, until they decide to go to the content of the ideas.
10
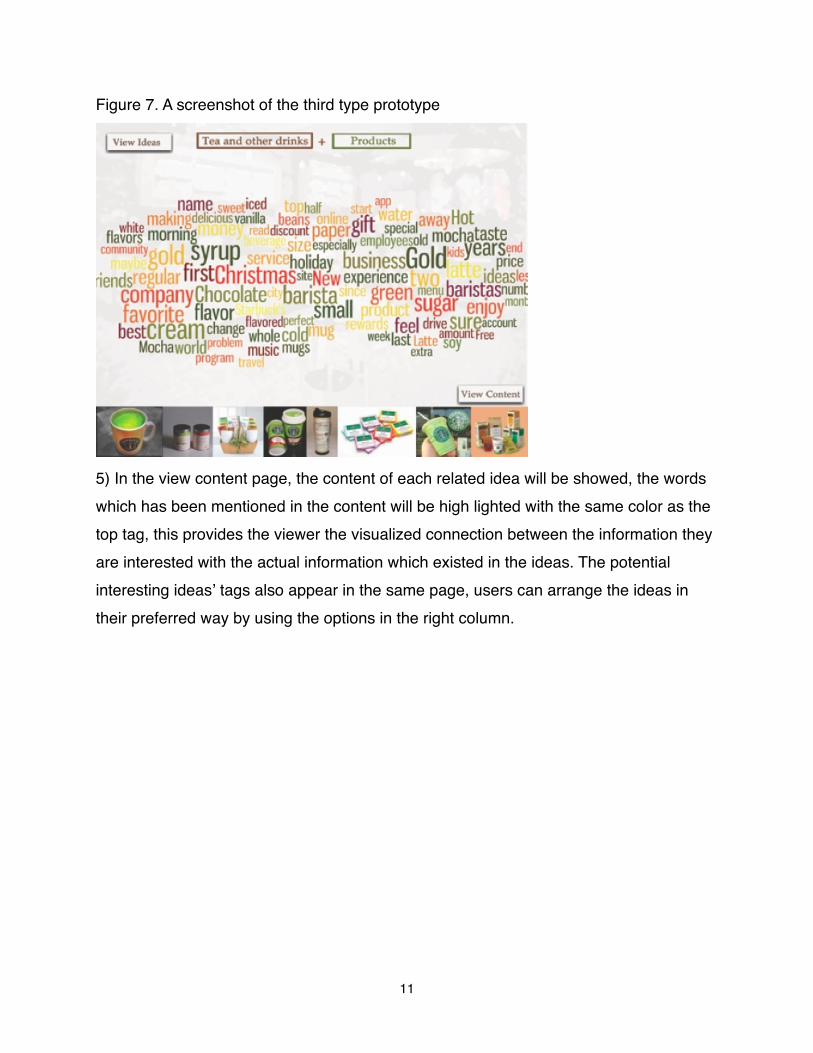
Figure 7. A screenshot of the third type prototype
5) In the view content page, the content of each related idea will be showed, the words which has been mentioned in the content will be high lighted with the same color as the top tag, this provides the viewer the visualized connection between the information they are interested with the actual information which existed in the ideas. The potential interesting ideasʼ tags also appear in the same page, users can arrange the ideas in their preferred way by using the options in the right column.
11
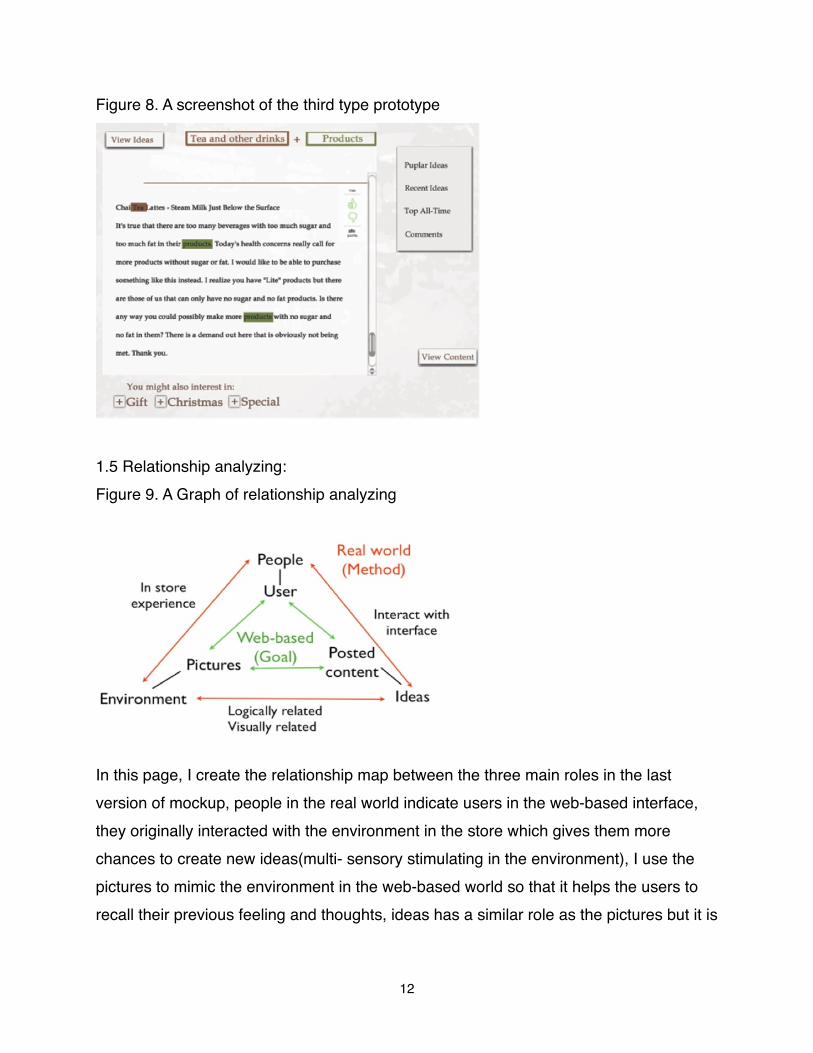
Figure 8. A screenshot of the third type prototype
1.5 Relationship analyzing:Figure 9. A Graph of relationship analyzing
In this page, I create the relationship map between the three main roles in the last version of mockup, people in the real world indicate users in the web-based interface, they originally interacted with the environment in the store which gives them more chances to create new ideas(multi- sensory stimulating in the environment), I use the pictures to mimic the environment in the web-based world so that it helps the users to recall their previous feeling and thoughts, ideas has a similar role as the pictures but it is
12
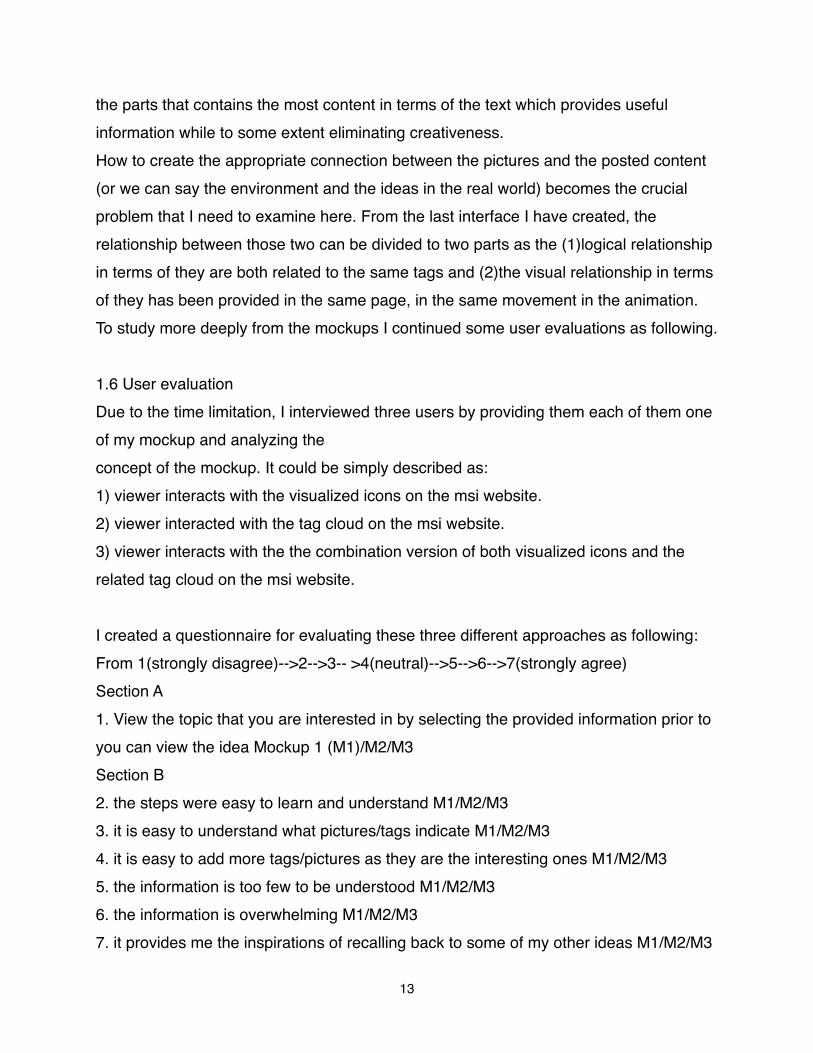
the parts that contains the most content in terms of the text which provides useful information while to some extent eliminating creativeness.How to create the appropriate connection between the pictures and the posted content (or we can say the environment and the ideas in the real world) becomes the crucial problem that I need to examine here. From the last interface I have created, the relationship between those two can be divided to two parts as the (1)logical relationship in terms of they are both related to the same tags and (2)the visual relationship in terms of they has been provided in the same page, in the same movement in the animation.To study more deeply from the mockups I continued some user evaluations as following.
1.6 User evaluationDue to the time limitation, I interviewed three users by providing them each of them one of my mockup and analyzing theconcept of the mockup. It could be simply described as: 1) viewer interacts with the visualized icons on the msi website.2) viewer interacted with the tag cloud on the msi website. 3) viewer interacts with the the combination version of both visualized icons and the related tag cloud on the msi website.
I created a questionnaire for evaluating these three different approaches as following:From 1(strongly disagree)-->2-->3-- >4(neutral)-->5-->6-->7(strongly agree) Section A 1. View the topic that you are interested in by selecting the provided information prior to you can view the idea Mockup 1 (M1)/M2/M3Section B 2. the steps were easy to learn and understand M1/M2/M3 3. it is easy to understand what pictures/tags indicate M1/M2/M3 4. it is easy to add more tags/pictures as they are the interesting ones M1/M2/M3 5. the information is too few to be understood M1/M2/M3 6. the information is overwhelming M1/M2/M3 7. it provides me the inspirations of recalling back to some of my other ideas M1/M2/M3
13
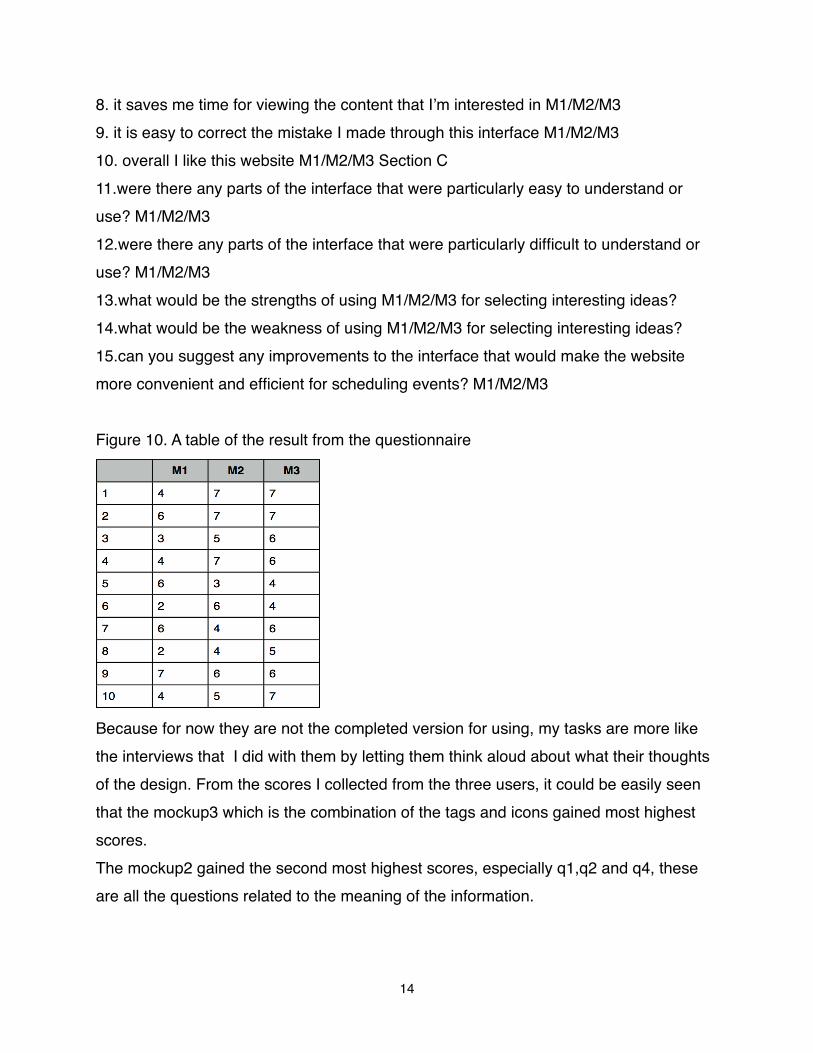
8. it saves me time for viewing the content that Iʼm interested in M1/M2/M3 9. it is easy to correct the mistake I made through this interface M1/M2/M3 10. overall I like this website M1/M2/M3 Section C 11.were there any parts of the interface that were particularly easy to understand or use? M1/M2/M3 12.were there any parts of the interface that were particularly difficult to understand or use? M1/M2/M3 13.what would be the strengths of using M1/M2/M3 for selecting interesting ideas?14.what would be the weakness of using M1/M2/M3 for selecting interesting ideas?15.can you suggest any improvements to the interface that would make the website more convenient and efficient for scheduling events? M1/M2/M3
Figure 10. A table of the result from the questionnaire
Because for now they are not the completed version for using, my tasks are more like the interviews that I did with them by letting them think aloud about what their thoughts of the design. From the scores I collected from the three users, it could be easily seen that the mockup3 which is the combination of the tags and icons gained most highest scores.The mockup2 gained the second most highest scores, especially q1,q2 and q4, these are all the questions related to the meaning of the information.
14
The mockup3 gets the least high scores, but it gets some good scores at the particular question as q7From the table we could see how each part works in this interface to affect the user in stimulating creativeness.
1.7 ConclusionFrom the user study, the mockup creating, the relationship analyzing and the followed user task/interview, we could obviously see how the related information such as pictures which can help users to recall the previous experience is important for stimulating creativeness. From my study, users prefer customized design, this means they want inspirations while they visit the idea posting website but they donʼt want to be disturbed at the same time, they prefer the information filter system to be both logical and visually entertaining, my study have covered both of these two areas above, but they are all at the beginning point, this leaves much room for the future study in these areas.
1.8 Future workIn this course project I have created the frame of the mockup and have tested a very small group of users who provided us very important feedback. This indicated the how valuable to study in this topic. But at the mean time, the mockup I have created did not provided enough functionality for testing users, and it is also lack of details. On the other hand, the number of users who participated in the study is far away from enough. In the future, the functioned prototype should be generated with more details. There should be at least 10 users in each group for testing(each of the three prototypes), and the questionnaire will also contain the data such as error rates or time spent for a better result of analysis.
15
CHAPTER 2PROJECT 2-ENCOURAGING EDUCATIONAL ENGAGEMENT THROUGH
INTERFACE DESIGN:SOFTWARE FOR MIDDLE SCHOOLS IN CHINA
2.1 BackgroundThe phenomenon of “after school tutoring” is now widely spread in China due for several reasons. Firstly, the schoolwork loads are extremely heavy in modern middle school. Secondly, the competition amongst middle school children is becoming more and more intense. Thirdly, the academic scores are the only means of measuring the scholastic ability of Chinese middle school students in Chinese society. The consequence of these issues result in parents feeling the need to spend tremendous amounts of money on “after school tutoring” and time communicating with tutors. To further compound the situation, the after school tutors are not able to communicated with the studentsʼ teachers to best coordinate their academic needs and facilitate the best learning mechanisms.
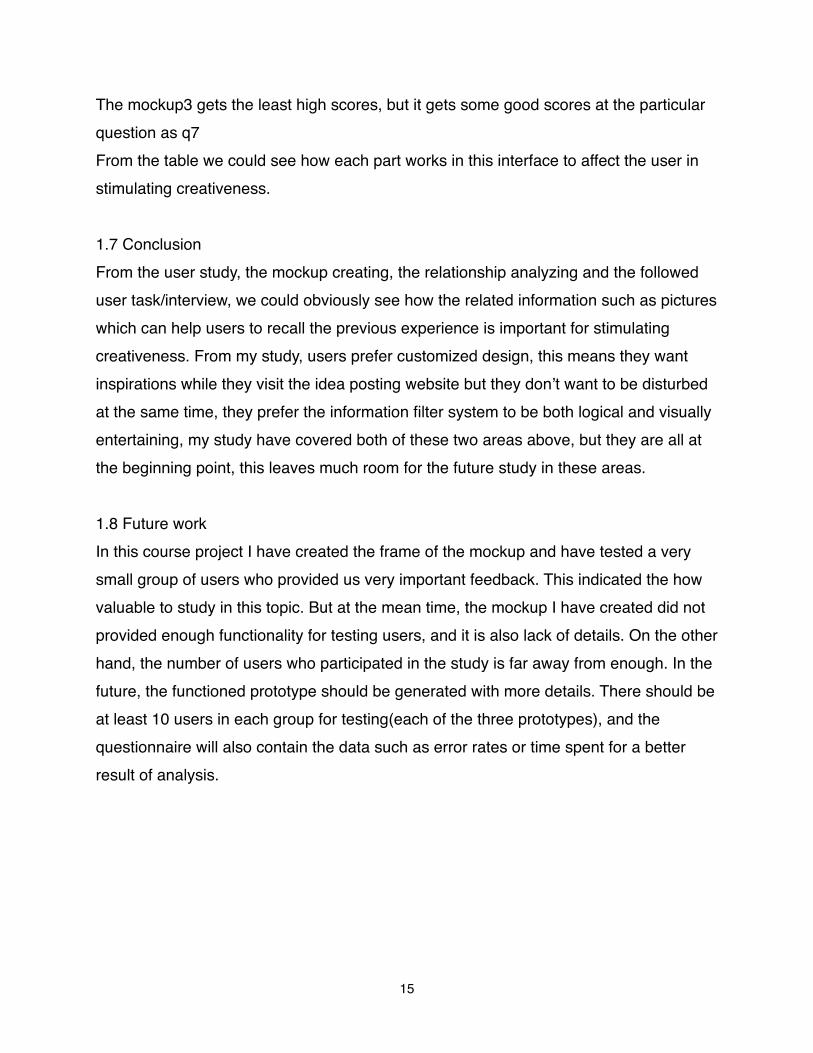
2.2 Research2.2.1 DemographicFigure 11. Demographic of the research
16
Here is an example of demographic from the third biggest city in China -- Guangzhou; in 2010, the population in Guangzhou is about 14,000,000; there are about 91.3 computers being using in every 100 families; 59% in city and 30% in country of the families are connected to the internet; for cells phones, every 100 families own about 214 cell phones; for the fixed line phones, every 100 families own about 103 fixed line phones. The record shows how popular the electronic devices(phones/computers/internet) are being using nowadays in China, almost every family is using computers in Guangzhou, this affords the potential possibility that the electronic devices can be used on educational purpose; the ratio of being connected to the internet, which is about 0.6 in city and 0.3 in country and still growing, also shows the potential possibility that families are affordable for their kids on educational investment, at least there is hardly any hardware limitation for our future project.
2.2.2 TechnologyTo better develop this project, research has also been done on available technology for better supporting the educational engagement, in other words, multi-sensory software can promote the studentsʼ learning motivation from different channel, students will learn knowledge in better efficiency and this also leads to the result of integrated development.
2.2.2.1 Speech Recognition There is some existing software with the technology of controlling usersʼ windowʼs computer through usersʼ voice. For example, if they want to move the cursor down one line, they can just simply say: Down one. If they want to check the emails, they can say: Open Email. The speech recognition technologies change the way users interact with computer, not only the users can speak to the computer but also their computer can speak. But user can not ask the questions such as how he/she is feeling, rather talk with the computer by using a set of the pre-defined commands and instructions, such as “select the files” or “edit find”, and then the computer can ask “find what?”. Human-being has been speaking for communication for hundreds of thousand of years; our brains are used to the auditory input for comprehending the complex set of meaning, our brains
17
have the ability of translating the concrete input of sounds into the conceptual signal and thoughts, then they form the instructions, informations and so on. From my research I notice that computer is just at the very beginning in this area, but at least we can see it has the capability of recognizing human-beingsʼ voice and speak it back, which enables the future of the multi-sensory software -- at least the voice recognition aspect of the future project.
2.2.2.2 Facial recognitionOver the last ten years or so, face recognition has become a popular area for the research in computer vision. In this field, not only computer science researchers but also neuroscientists and psychologists are interested in the problem. The facial explanation always states a lot of things. A nod indicates understanding, a frown may say: "Please explain it to me." Scientists discovered that we are able to classify an expression much better in the form of movement instead of the still picture. To get a better understanding of the action, we have to look at the movement at least for 100 milliseconds. And if the animation is shorter than that time period, we will not be able to interpret due to the capacity of our brain.Now there is the developing technology for applying facial expression recognition algorithm, the prototype is able of processing a serious of images of the movement of faces and it can recognize the facial expression. The software can be used for recognizing the movie of facial movement of the person who sits in front of the camera which linked to the computer. Now this prototype can be used in the personal computer or even laptop.
2.2.3 Available software
18
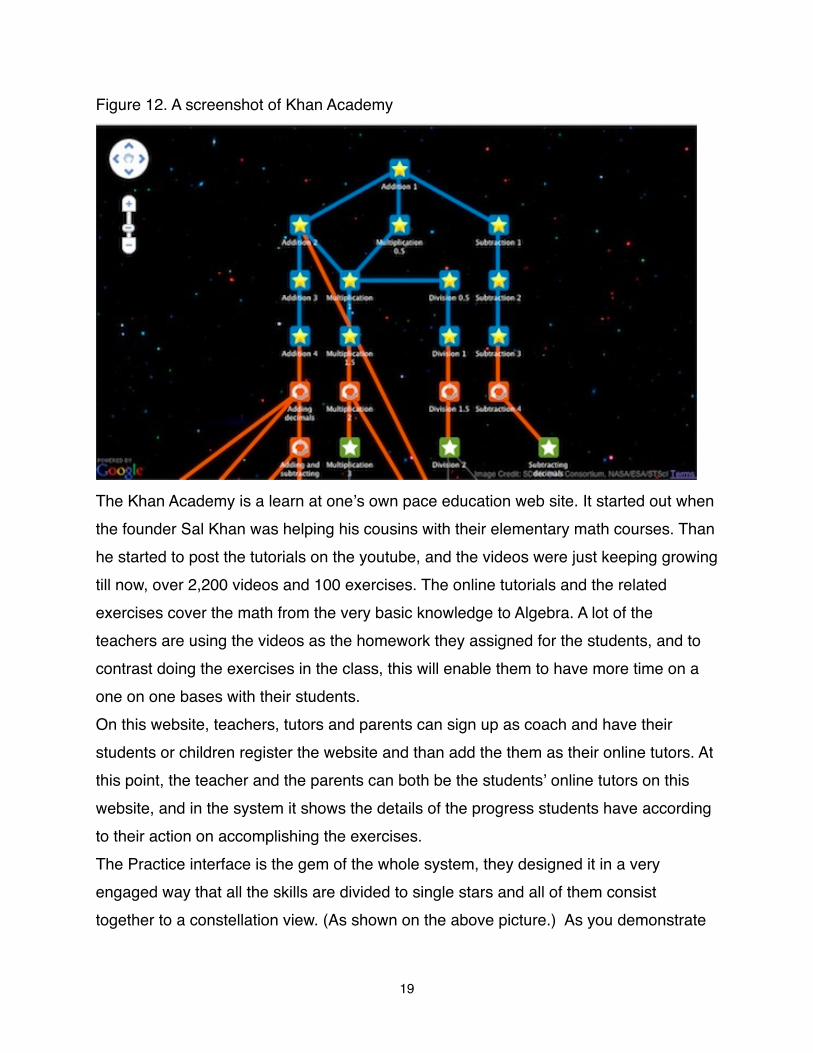
Figure 12. A screenshot of Khan Academy
The Khan Academy is a learn at oneʼs own pace education web site. It started out when the founder Sal Khan was helping his cousins with their elementary math courses. Than he started to post the tutorials on the youtube, and the videos were just keeping growing till now, over 2,200 videos and 100 exercises. The online tutorials and the related exercises cover the math from the very basic knowledge to Algebra. A lot of the teachers are using the videos as the homework they assigned for the students, and to contrast doing the exercises in the class, this will enable them to have more time on a one on one bases with their students.On this website, teachers, tutors and parents can sign up as coach and have their students or children register the website and than add the them as their online tutors. At this point, the teacher and the parents can both be the studentsʼ online tutors on this website, and in the system it shows the details of the progress students have according to their action on accomplishing the exercises.The Practice interface is the gem of the whole system, they designed it in a very engaged way that all the skills are divided to single stars and all of them consist together to a constellation view. (As shown on the above picture.) As you demonstrate
19
proficiency, you earn a star in that constellation, and it also suggest the skills that should be worked for next step according to what you have accomplished.Inside of the practice page, the interface is pretty simple but it is very effective. When you start to practice, the problems show up as images, and you enter the answer in a text box. It even contains hint in each practice, very intuitive and visualized, appropriate for teaching the students from elementary school to college.
2.3 Observation and interviews2.3.1 Comparison real class and using computers(online class)In a real classroom, there is always live communication, the students have to sit together and study together, there is the study environment which stimulates the study motivation for the students, in other words, they are forced to study by sitting in the middle of the place that all the others are doing the same thing, basically this is the phenomenon of human-beingsʼ population effect. Then there is additional facts that promote this behavior, teachersʼ feedback can not only promote but also force the students to pay more attention on their study, teachersʼ words, especially the positive praise for the students is extremely effective for stimulating studentsʼ learning motivation, this will be shown in the following observation. As we have discussed above, when the students feel teachersʼ attention, they start to pay attention on their own behavior and most of the students act more positive while their teachers give them the positive praise, which means they have more motivation of studying with teachersʼ attention.
20
While using computer, either as aid with a real teacher teaching in the classroom or as the only media for the online course, the benefit of using computer is that computers can always help people doing the repetitive work, which saves the precious time for teachers and they are even more exact than human-being, to some extent, has a better working efficiency than human-beings. Another important factor is that the computer can save all the history and keep the record of all the data, which means the teachers and students can always easily review all the previous session. An additional benefits is that the computer can be accessible evenly to all the users, even the ones with disabilities, this allows tens of thousands of users who donʼt have the ability to go to a real classroom to be treated evenly and to have the opportunity evenly. Last but not least, while the users are using any computer applications, they are in a whole system of computer environment, just like the others who take a real class are in the classroom environment, while using one particular application, they can always be connected to other online/offline applications as well, this adds the possibility of some additional functionalities such as social connection, share with friends online, etc.
21
2.3.2 Observation After I analyze the similarity and difference between studying in the real classroom and using computer applications. I went to a local middle school to observe how students are using online reasoning course for algebra. From my observation, the students followed what the instructor told them to do. They tried to finish the assignment as soon as possible by using some tips(such as select the option from the drop down menu after typing in only one letter). After finishing the assignment, they really like to show the instructor that they finished it, and will be really happy if instructor praise them by saying words such as “great job” or “fabulous”, etc. They will go to the web surfing after finished the work, 1 out of 11 students choose to finish the paper home work instead of surfing online, and the others were all web surfing. The type of website they like are as following: cartoon pictures, funny pictures on search engine, girls dressing up web, art web. But after surfing online for a while, some of them were sending emails, some of them were finishing other online homework, and after a while they came back to the entertainment again, iterating. When they were doing online reasoning work, they did them individually, but when they were surfing online watching the funny pictures or dressing up the girls, they were doing it in groups of 2 or 3 of 4 people, the sense of agreement pleased them a lot beside the sense of enjoying the fun stuff itself. The certain group of students were always together, I guess they are good friends who chose to sit together.
2.3.3 Interview with Chinese Student in grade 7.Questionnaire1. Is the work load very heavy? When is the class normally over every day?2. What is your study mode, by group or by yourself, in which way you have a higher efficiency?3. How your parents care about your study situation?4. What is the mode of the teachers in class, use the blackboard or PPT? Did you sit too far from the teacher and cannot see the screen?5. Do you have discussion?6. How do you feel about your homework?
22
7. How many students are there in your class?8. Do teachers grade the students? If yes, is there any comments?9. Do you understand the steps of figuring out the problem?10. Do you use any kind of study device?11. What are you doing when you are using the computer?12. How do you feel about the “three good” student?13. Do you have lots of outside class time?14. What is your feeling of online course?15. What is your feeling of handing in homework online?
2.3.3.1 Interview findingsIʼm not listing all the result of the interview I did with the Chinese student but only the meaningful findings. The student has 36 test paper within 7 days on holiday which should be their free time for themselves. A classmate of the interviewed student who is a 13 years old girl commits suicide because her academic score was lower than her brotherʼs score and the mother blamed at her. In the summer holidays and winter holidays, students are required to go back to school to hand in their homework every three days. In that particular school, teachers even inappropriately adjusted the studentsʼ scores to please the parents. Sketches of the potential problems from studentsʼ daily behavior. On the way from home, there are three common ways for students to get to the school, walking, biking or taking the bus.
23
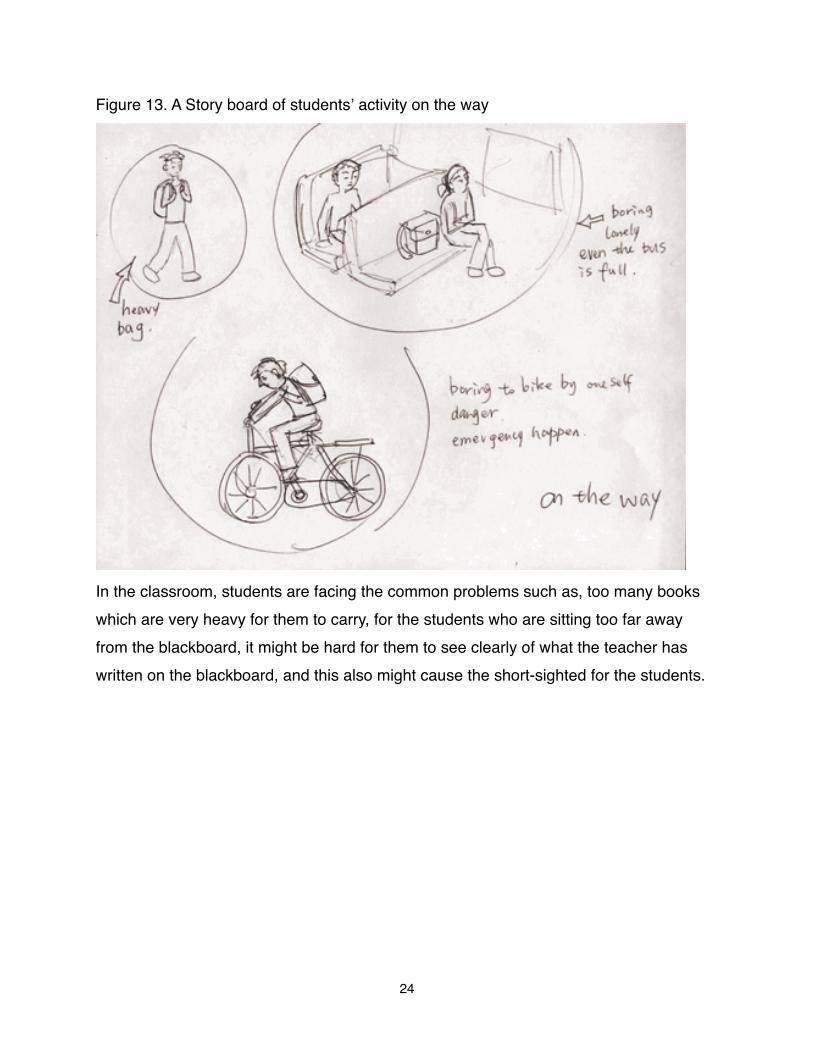
Figure 13. A Story board of studentsʼ activity on the way
In the classroom, students are facing the common problems such as, too many books which are very heavy for them to carry, for the students who are sitting too far away from the blackboard, it might be hard for them to see clearly of what the teacher has written on the blackboard, and this also might cause the short-sighted for the students.
24
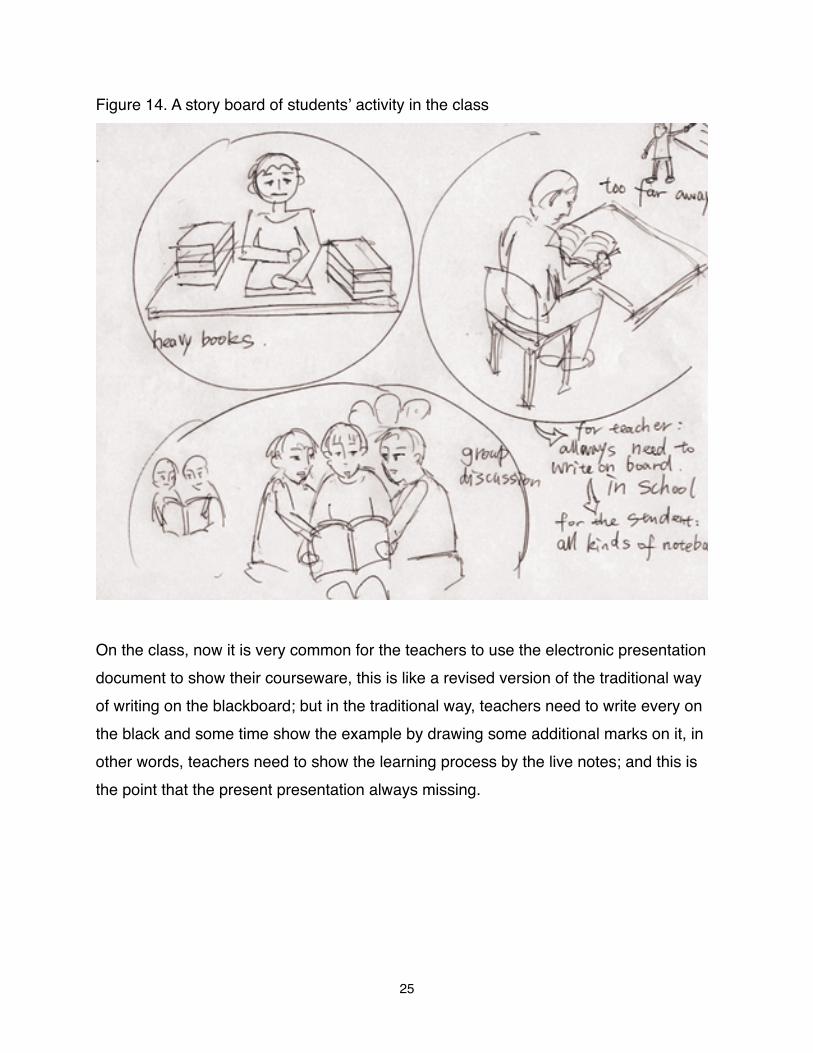
Figure 14. A story board of studentsʼ activity in the class
On the class, now it is very common for the teachers to use the electronic presentation document to show their courseware, this is like a revised version of the traditional way of writing on the blackboard; but in the traditional way, teachers need to write every on the black and some time show the example by drawing some additional marks on it, in other words, teachers need to show the learning process by the live notes; and this is the point that the present presentation always missing.
25
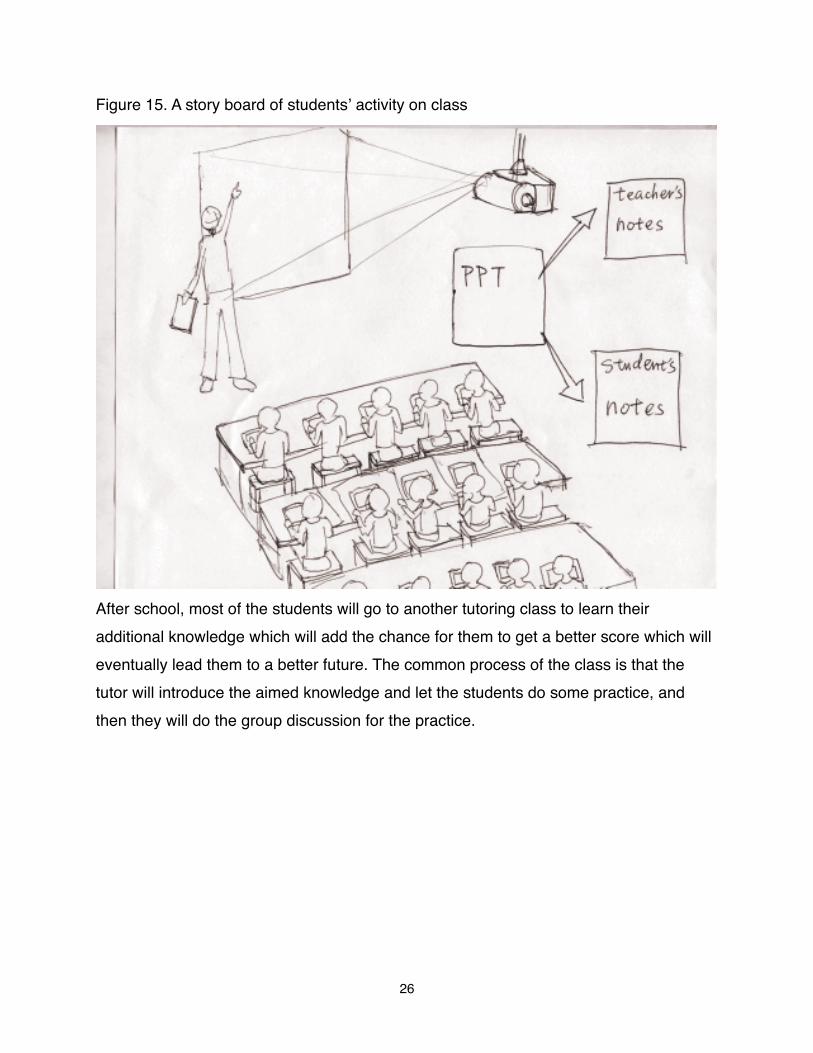
Figure 15. A story board of studentsʼ activity on class
After school, most of the students will go to another tutoring class to learn their additional knowledge which will add the chance for them to get a better score which will eventually lead them to a better future. The common process of the class is that the tutor will introduce the aimed knowledge and let the students do some practice, and then they will do the group discussion for the practice.
26
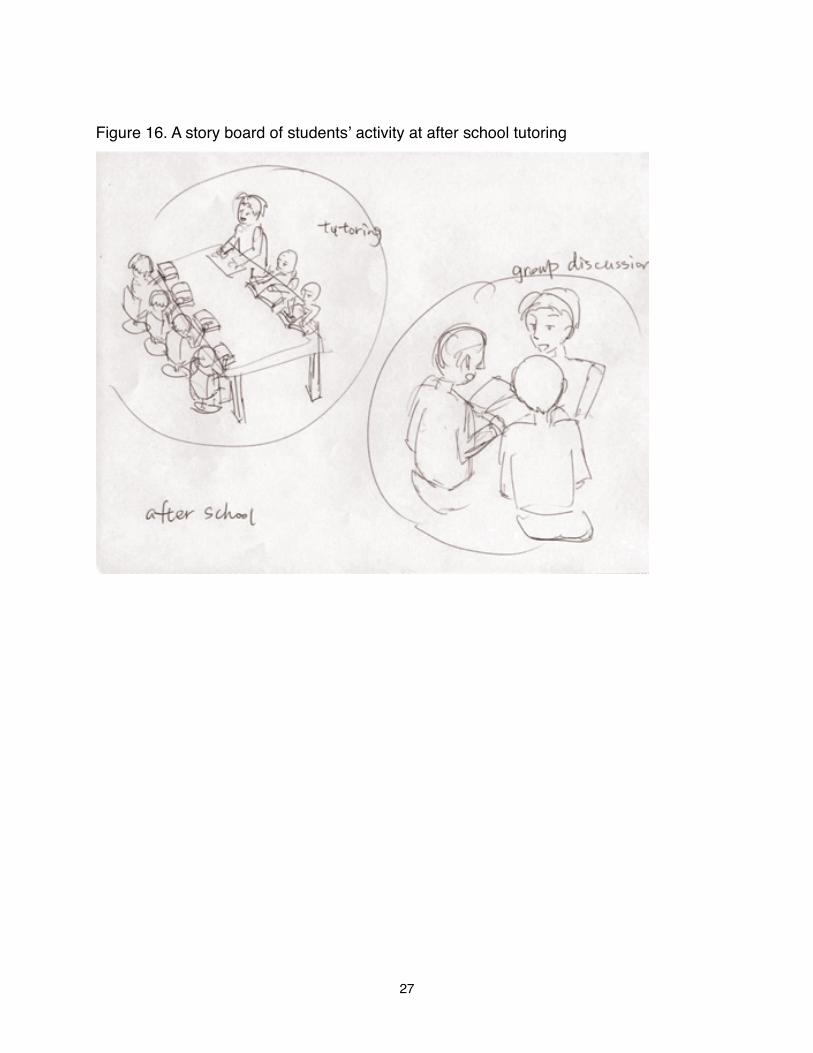
Figure 16. A story board of studentsʼ activity at after school tutoring
27
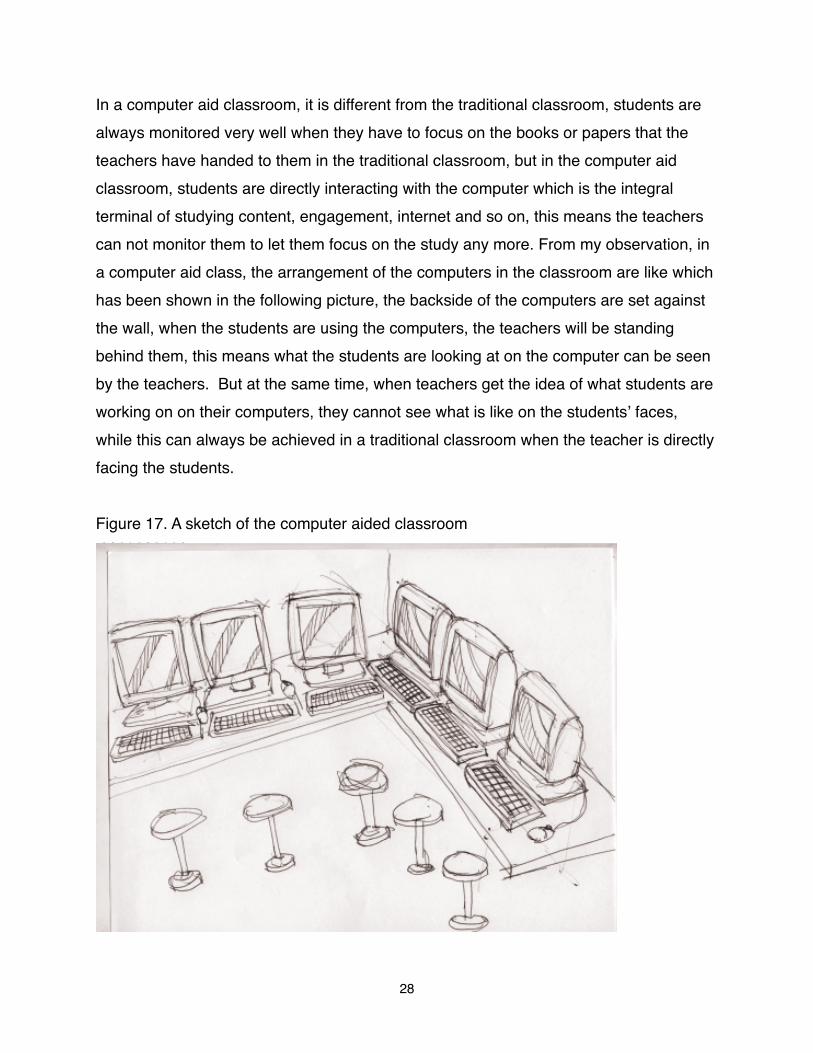
In a computer aid classroom, it is different from the traditional classroom, students are always monitored very well when they have to focus on the books or papers that the teachers have handed to them in the traditional classroom, but in the computer aid classroom, students are directly interacting with the computer which is the integral terminal of studying content, engagement, internet and so on, this means the teachers can not monitor them to let them focus on the study any more. From my observation, in a computer aid class, the arrangement of the computers in the classroom are like which has been shown in the following picture, the backside of the computers are set against the wall, when the students are using the computers, the teachers will be standing behind them, this means what the students are looking at on the computer can be seen by the teachers. But at the same time, when teachers get the idea of what students are working on on their computers, they cannot see what is like on the studentsʼ faces, while this can always be achieved in a traditional classroom when the teacher is directly facing the students.
Figure 17. A sketch of the computer aided classroom
28
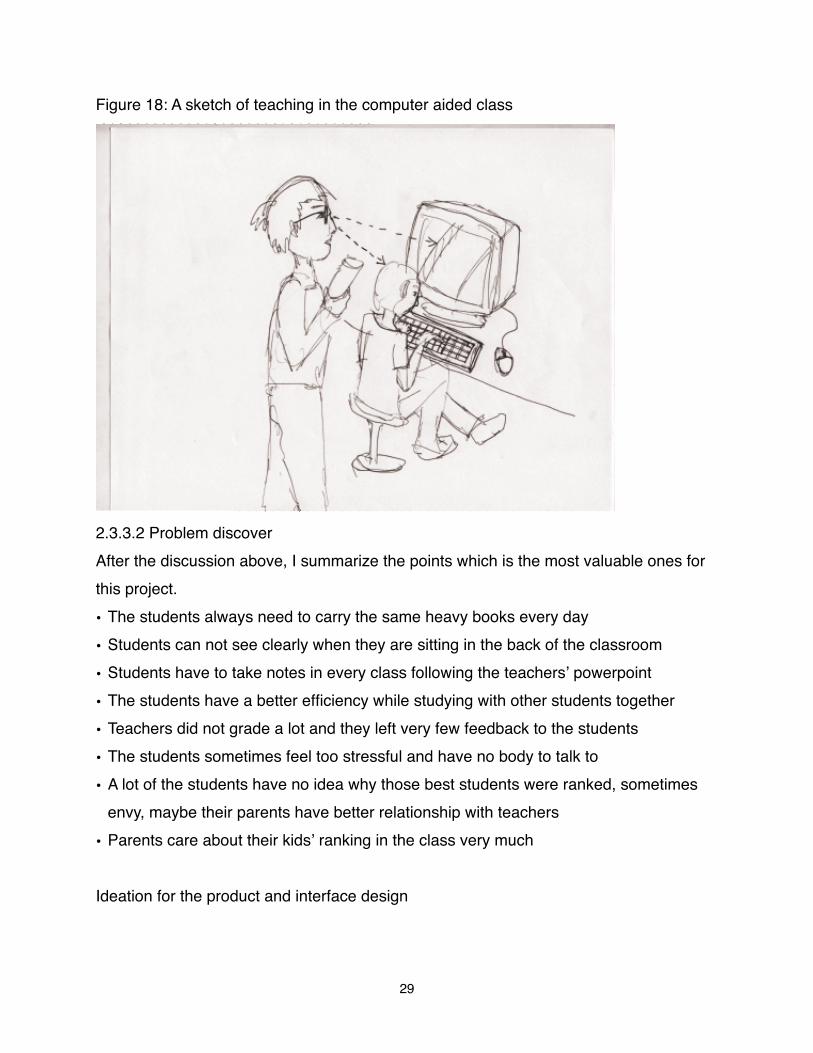
Figure 18: A sketch of teaching in the computer aided class
2.3.3.2 Problem discoverAfter the discussion above, I summarize the points which is the most valuable ones for this project.
• The students always need to carry the same heavy books every day
• Students can not see clearly when they are sitting in the back of the classroom
• Students have to take notes in every class following the teachersʼ powerpoint
• The students have a better efficiency while studying with other students together
• Teachers did not grade a lot and they left very few feedback to the students
• The students sometimes feel too stressful and have no body to talk to
• A lot of the students have no idea why those best students were ranked, sometimes envy, maybe their parents have better relationship with teachers
• Parents care about their kidsʼ ranking in the class very much
Ideation for the product and interface design
29
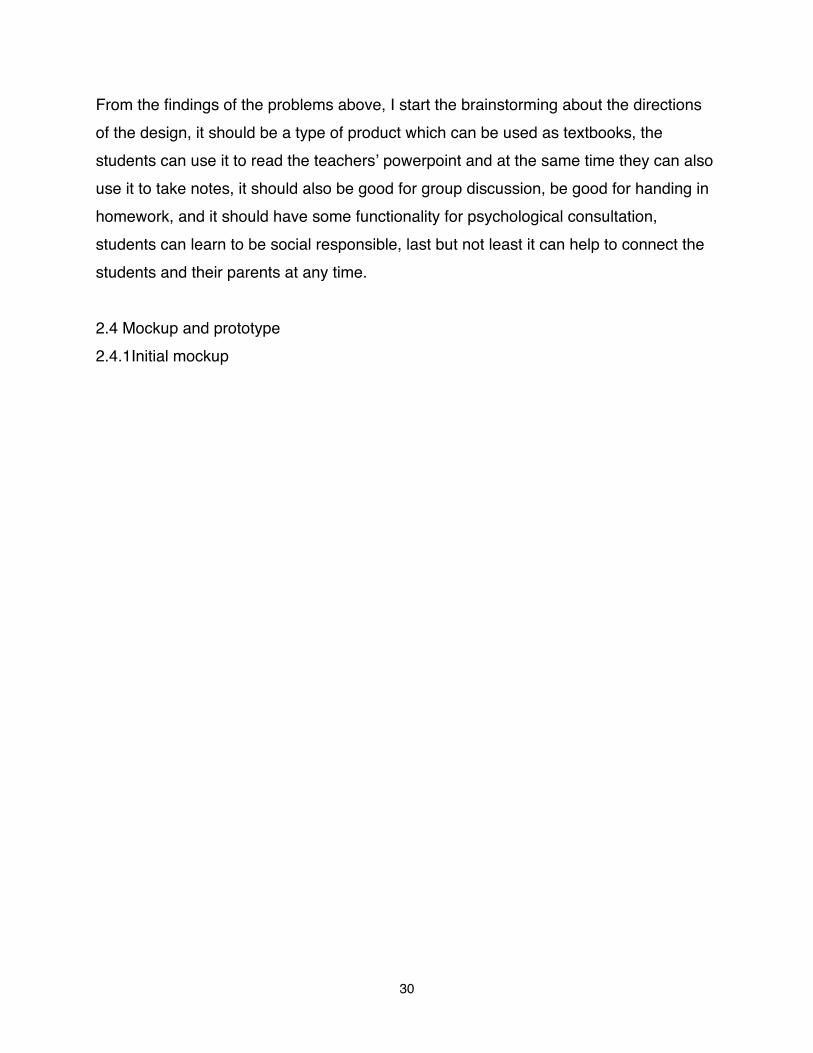
From the findings of the problems above, I start the brainstorming about the directions of the design, it should be a type of product which can be used as textbooks, the students can use it to read the teachersʼ powerpoint and at the same time they can also use it to take notes, it should also be good for group discussion, be good for handing in homework, and it should have some functionality for psychological consultation, students can learn to be social responsible, last but not least it can help to connect the students and their parents at any time.
2.4 Mockup and prototype2.4.1Initial mockup
30
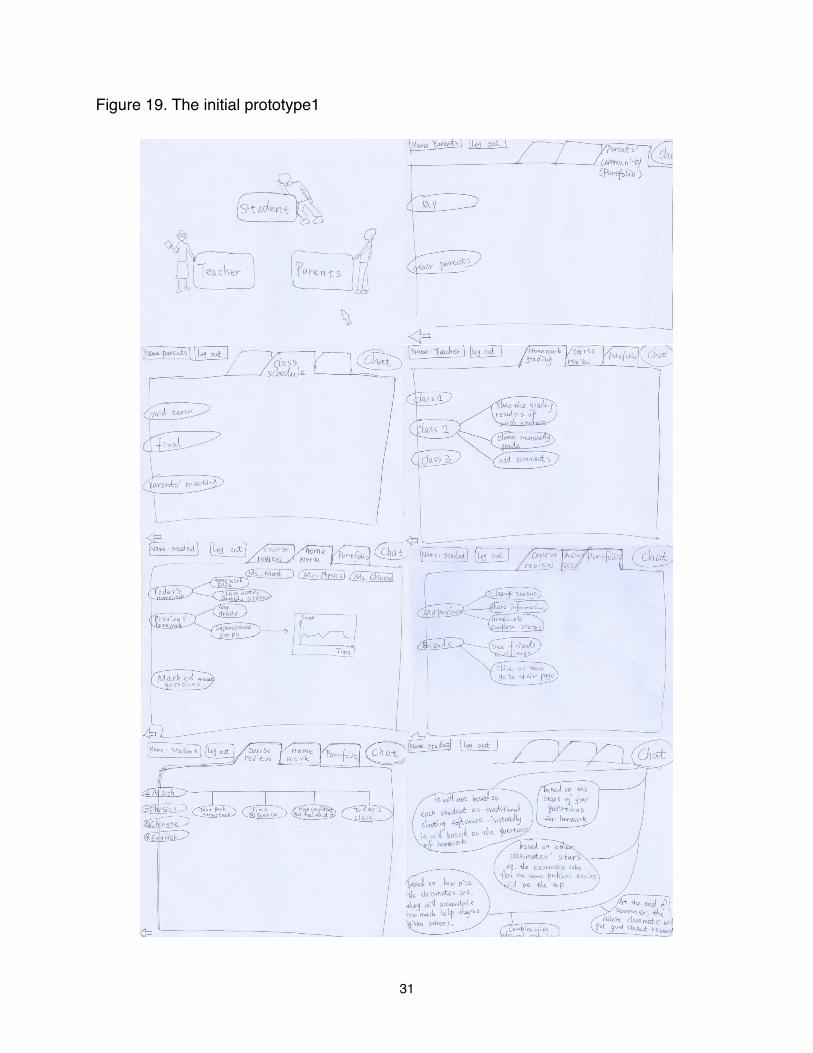
Figure 19. The initial prototype1
31
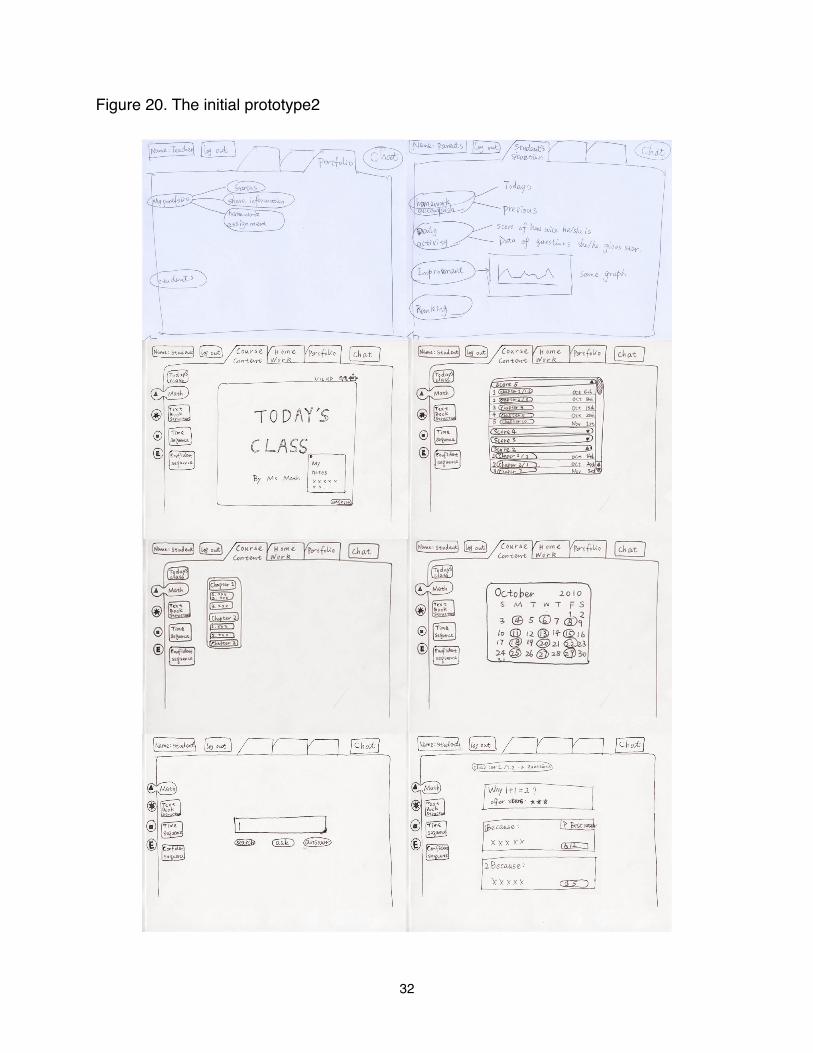
Figure 20. The initial prototype2
32
2.4.2 Prototype:On this page, there will be a title which shows about what this system is about, the type in box of user name and the type in box of the keywords for user to login, there are also two buttons in beneath, the login button for the existed user and the register button for the first time user.
Figure 21. The front page of the prototype
33
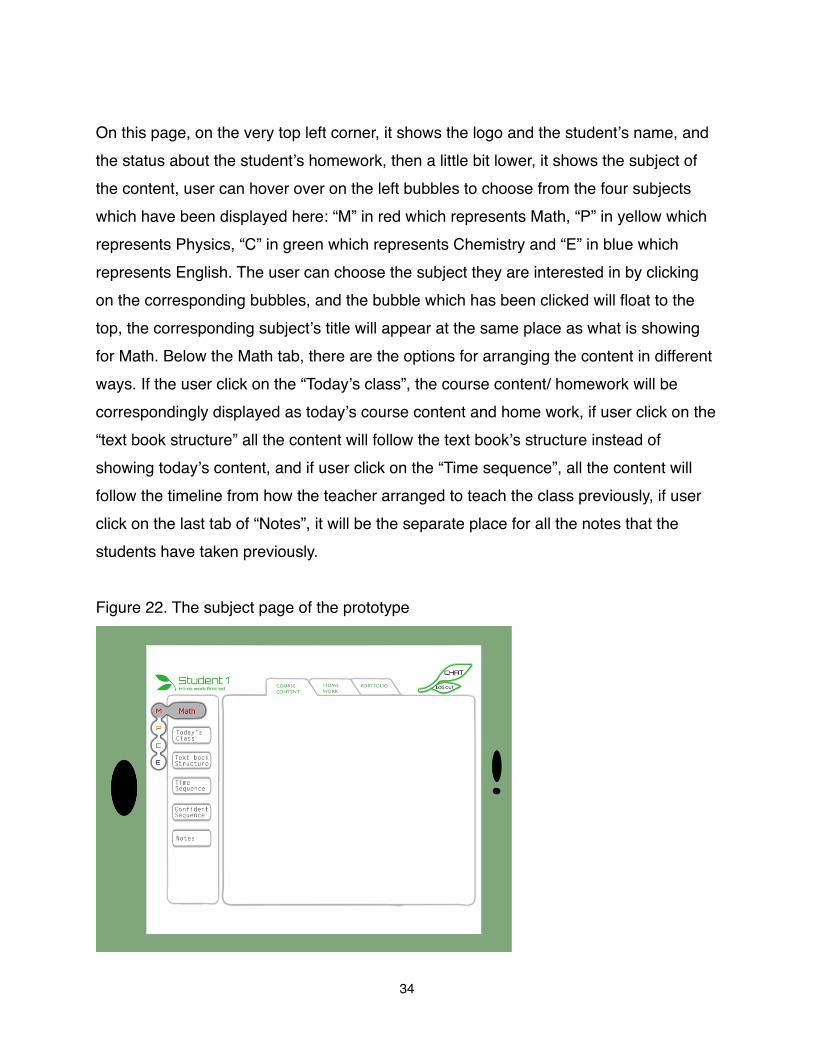
On this page, on the very top left corner, it shows the logo and the studentʼs name, and the status about the studentʼs homework, then a little bit lower, it shows the subject of the content, user can hover over on the left bubbles to choose from the four subjects which have been displayed here: “M” in red which represents Math, “P” in yellow which represents Physics, “C” in green which represents Chemistry and “E” in blue which represents English. The user can choose the subject they are interested in by clicking on the corresponding bubbles, and the bubble which has been clicked will float to the top, the corresponding subjectʼs title will appear at the same place as what is showing for Math. Below the Math tab, there are the options for arranging the content in different ways. If the user click on the “Todayʼs class”, the course content/ homework will be correspondingly displayed as todayʼs course content and home work, if user click on the “text book structure” all the content will follow the text bookʼs structure instead of showing todayʼs content, and if user click on the “Time sequence”, all the content will follow the timeline from how the teacher arranged to teach the class previously, if user click on the last tab of “Notes”, it will be the separate place for all the notes that the students have taken previously.
Figure 22. The subject page of the prototype
34
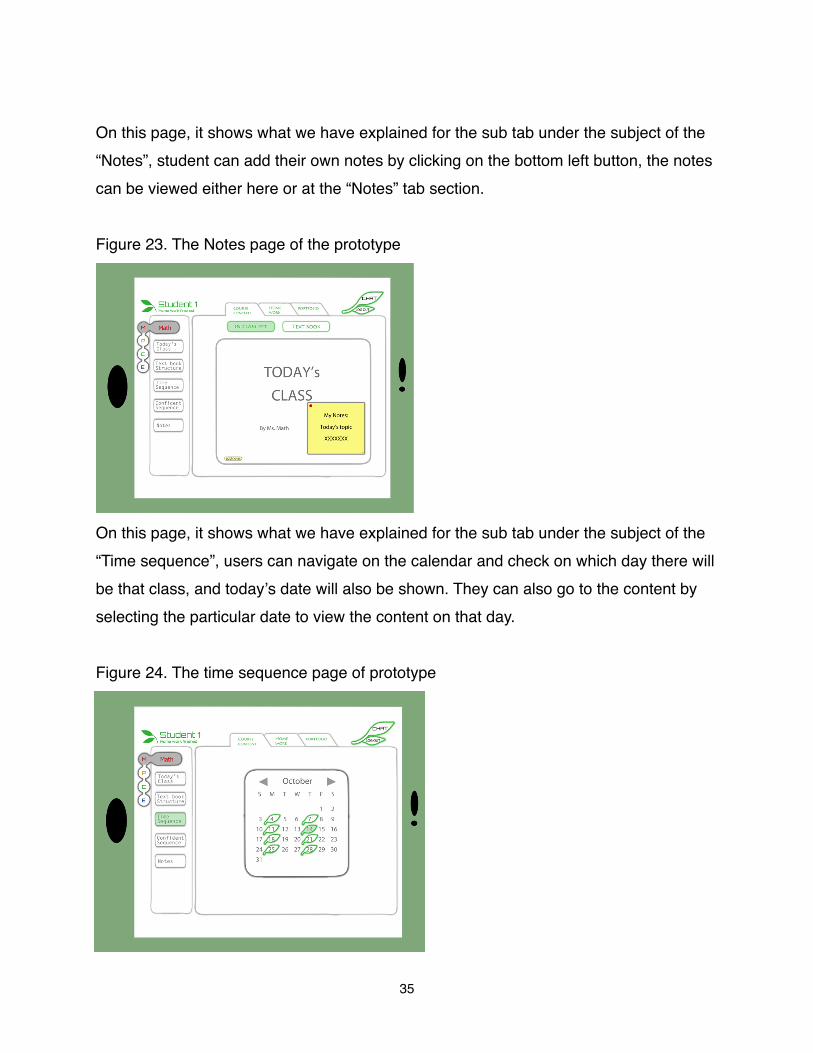
On this page, it shows what we have explained for the sub tab under the subject of the “Notes”, student can add their own notes by clicking on the bottom left button, the notes can be viewed either here or at the “Notes” tab section.
Figure 23. The Notes page of the prototype
On this page, it shows what we have explained for the sub tab under the subject of the “Time sequence”, users can navigate on the calendar and check on which day there will be that class, and todayʼs date will also be shown. They can also go to the content by selecting the particular date to view the content on that day.
Figure 24. The time sequence page of prototype
35
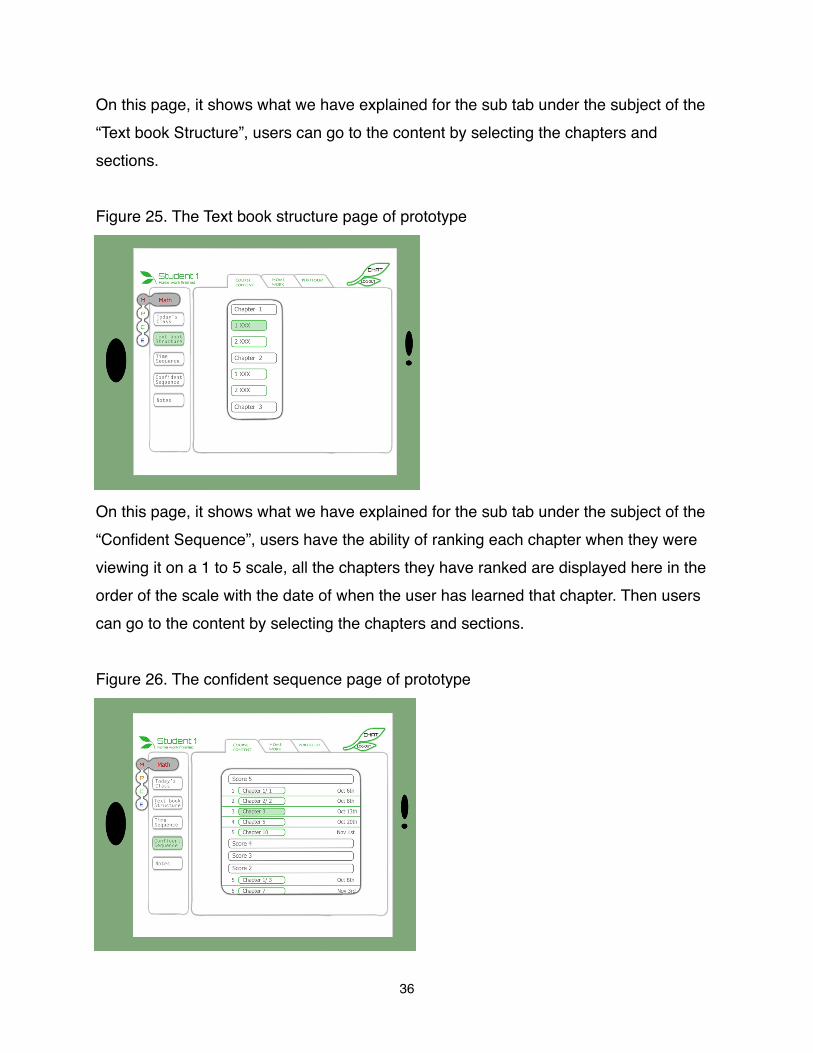
On this page, it shows what we have explained for the sub tab under the subject of the “Text book Structure”, users can go to the content by selecting the chapters and sections.
Figure 25. The Text book structure page of prototype
On this page, it shows what we have explained for the sub tab under the subject of the “Confident Sequence”, users have the ability of ranking each chapter when they were viewing it on a 1 to 5 scale, all the chapters they have ranked are displayed here in the order of the scale with the date of when the user has learned that chapter. Then users can go to the content by selecting the chapters and sections.
Figure 26. The confident sequence page of prototype
36
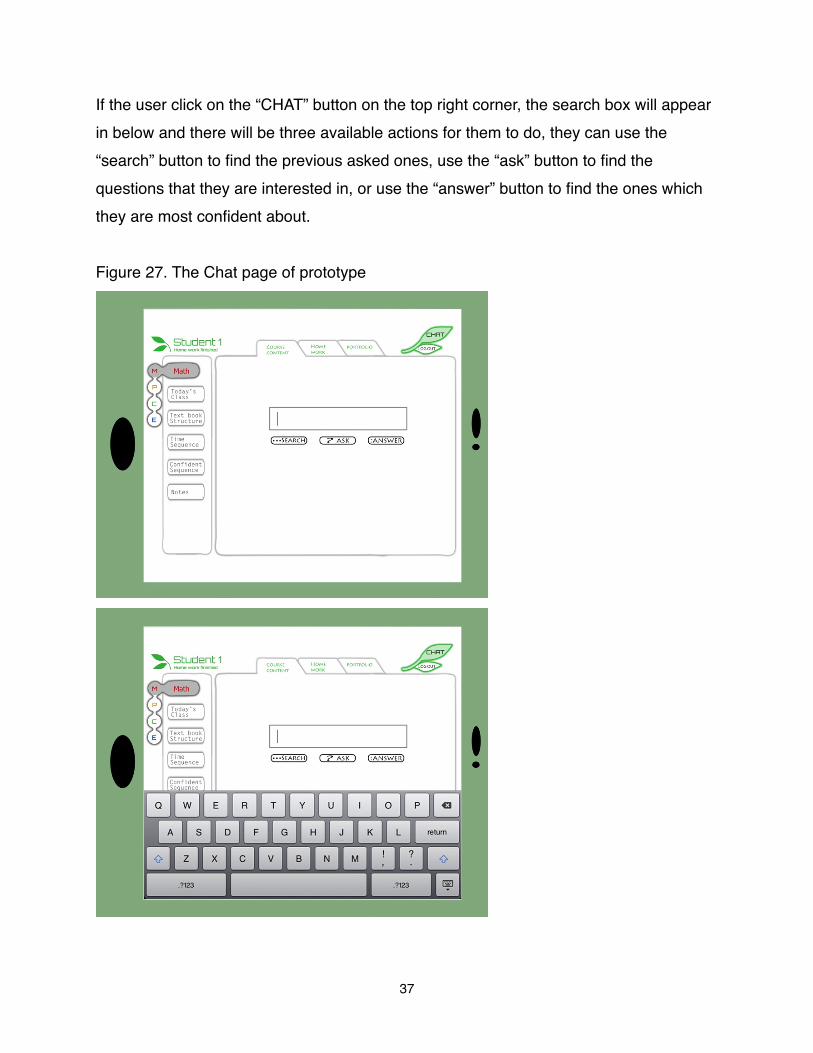
If the user click on the “CHAT” button on the top right corner, the search box will appear in below and there will be three available actions for them to do, they can use the “search” button to find the previous asked ones, use the “ask” button to find the questions that they are interested in, or use the “answer” button to find the ones which they are most confident about.
Figure 27. The Chat page of prototype
37
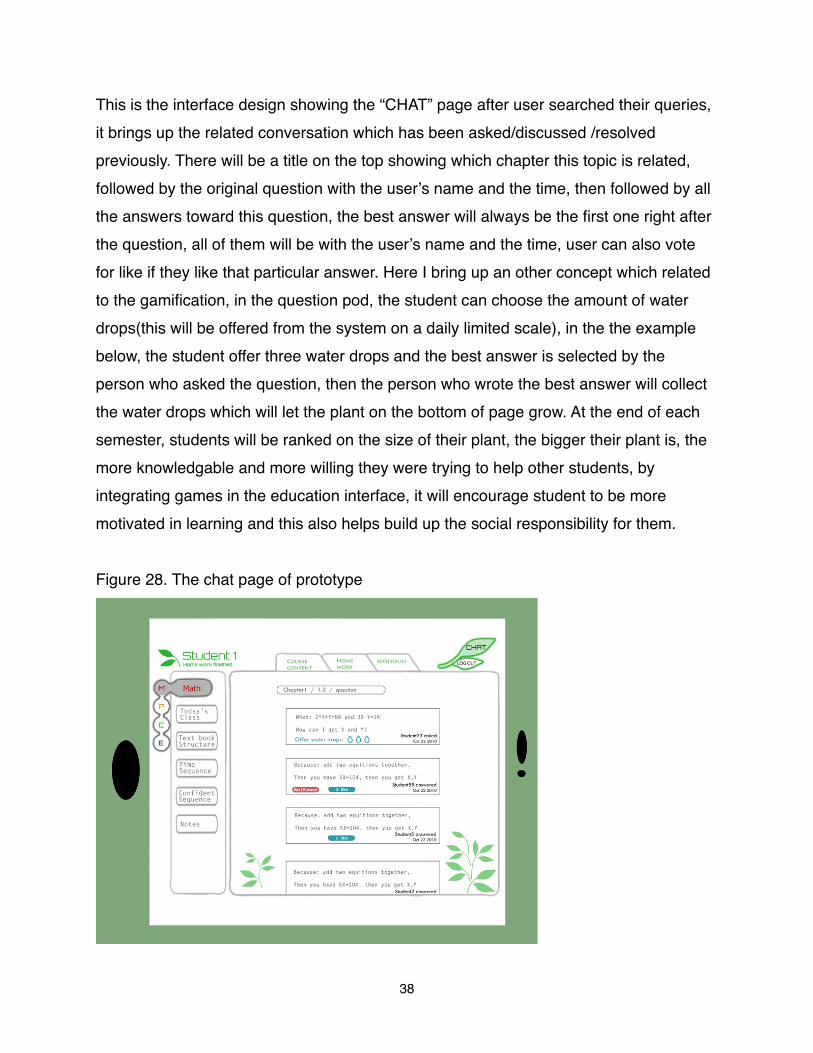
This is the interface design showing the “CHAT” page after user searched their queries, it brings up the related conversation which has been asked/discussed /resolved previously. There will be a title on the top showing which chapter this topic is related, followed by the original question with the userʼs name and the time, then followed by all the answers toward this question, the best answer will always be the first one right after the question, all of them will be with the userʼs name and the time, user can also vote for like if they like that particular answer. Here I bring up an other concept which related to the gamification, in the question pod, the student can choose the amount of water drops(this will be offered from the system on a daily limited scale), in the the example below, the student offer three water drops and the best answer is selected by the person who asked the question, then the person who wrote the best answer will collect the water drops which will let the plant on the bottom of page grow. At the end of each semester, students will be ranked on the size of their plant, the bigger their plant is, the more knowledgable and more willing they were trying to help other students, by integrating games in the education interface, it will encourage student to be more motivated in learning and this also helps build up the social responsibility for them.
Figure 28. The chat page of prototype
38
2.5 Conclusion:From the perspective of education, human-beings are always struggling in between our original desires and our purposeful goals; we can consider the original desires as our laziness, but at the mean time, we also have the desire of enjoying the entertaining stuff, pursuing the beauty, pursuing the knowledge and the truth. So the best way of education for human-beings, especially for kids, is not forcing them to study but bringing something that are interesting enough for them to overcome their laziness by themselves, in other words, let them enjoy study and to be motivated in studying instead of forcing them with parentsʼ and teachersʼ power.In this project, I started from the research of the demographic and the technology, then the research of the existed product, followed by the observation in middle school and the questionnaire, by using the technique of sketching and story board, I then started conducting the observed ideas and possible solutions to more intuitive pictures, At the last part, when I was designing the interface, I started by brain storming for the possible solutions and then by following the user interface principle, I selected the most valuable and meaningful ones, integrated the research with the observations and the result from the interviews, finally comes to the prototype. This prototype brings up the idea of the gamification which will be the future direction for the education, students will learn in the system along with some interesting games, the game adds the aesthetics to the interface, it also rewards the students by showing the growth of the plant, and more importantly, the reward in the real life also gives them more motivation in participating, this can also lead them on the direction of being more social responsible. Finally, in this project, I used a lot of the industrial design methods in developing the interface design, especially for the beginning of the project, the methods of researching, brainstorming and sketching, they are all applicable for the interface design. More importantly, by applying these methods, it started broadly from the possible areas and creative ideas, this bring more creativity compare to just limiting the design process within interface design. This will be explained more in the next section.
39
CHAPTER 3METHODOLOGY
3.1 The two points of industrial design: rational and perceptualDesign itself is a very broad word, it could be used in a lot of different majors. But what does “design” mean in Industrial Design? In the other field, for example, in art, design is more toward the polarization of perceptual, while in engineering, design is more toward the polarization of rational; but in Industrial Design, if there is no perceptual sense then no matter if we figure out the problem, the result will be boring and stiff, it might look like the design from an engineer; in opposite, if there is no rational sense of industrial design, the result will turn out to be gimcrack, it might have a unique but can never help user to figure out the real problem.
3.1.1 The balance between rational and perceptual in industrial designIn the field of industrial design, there is not a constant ratio between rational and emotional, there is always different focal point in different kind of product. When there is a brand new product produced on the market, especially the new product in the technology field, the focal point of the design might be more toward to the rational feeling; while redesigning the product which is already existing and widely spread, the focal point of the design will be more toward the emotional feeling which will lead to the result of speciality and creativity of the product and user personalized. Which means the status of the life cycle would affect the need between rational and perceptual.
3.1.2 What is the design methodologyTo answer this question, here is a definition about design: Design is the symbolic quality of a solution that represents an improvement of a problematic situation. The feature of design is not creating something from nothing, but to define what is actually needed, in other words, to define the problemʼs condition. The goal of understanding problem is to find out the solution, to find out the answer from a step by step process. If there is no problem then there is no need for the solution. So if we just look for a solution to figure
40
out a problem, then it looks like having the solution fulfills that goal, but in the design process, it does not count for a real design. From the word “design” itself, it is composed from two roots, De-sign, of which the meaning is about “sign”, which is related to communication. So design should have the feature of communication. In summary, design should be a process, it has the purpose, it is planning to produce a meaningful product. Which means the rational design methodology
3.2 The methodology of collecting material, organizing material and analyzing materialThere are so many product nowadays in the market, it is hard to find a special product which fulfills all of one userʼs needs, the designerʼs final goal would be an outstanding feature and attractive design outlook of the new product, so at the beginning of the design process, the designers have to collect as much information as possible as he/she can about the existing products. The existing product may not be exactly same as the product which is going to be designed, but it will be very helpful to collect the related product and related material, which will bring rich information and reference for the future design.
3.2.1 Product comparisonTo design a new product, a typical approach is to research for a similar product and modify an existing similar design rather than designing a new product out of the scratch. In this way, it will save the time, the effort and the cost, and the new product could be improved efficiently, which can just use the already existing information from the old design. So it would be very important to have a proper similarity comparison algorithm to apply anytime in design process.
41
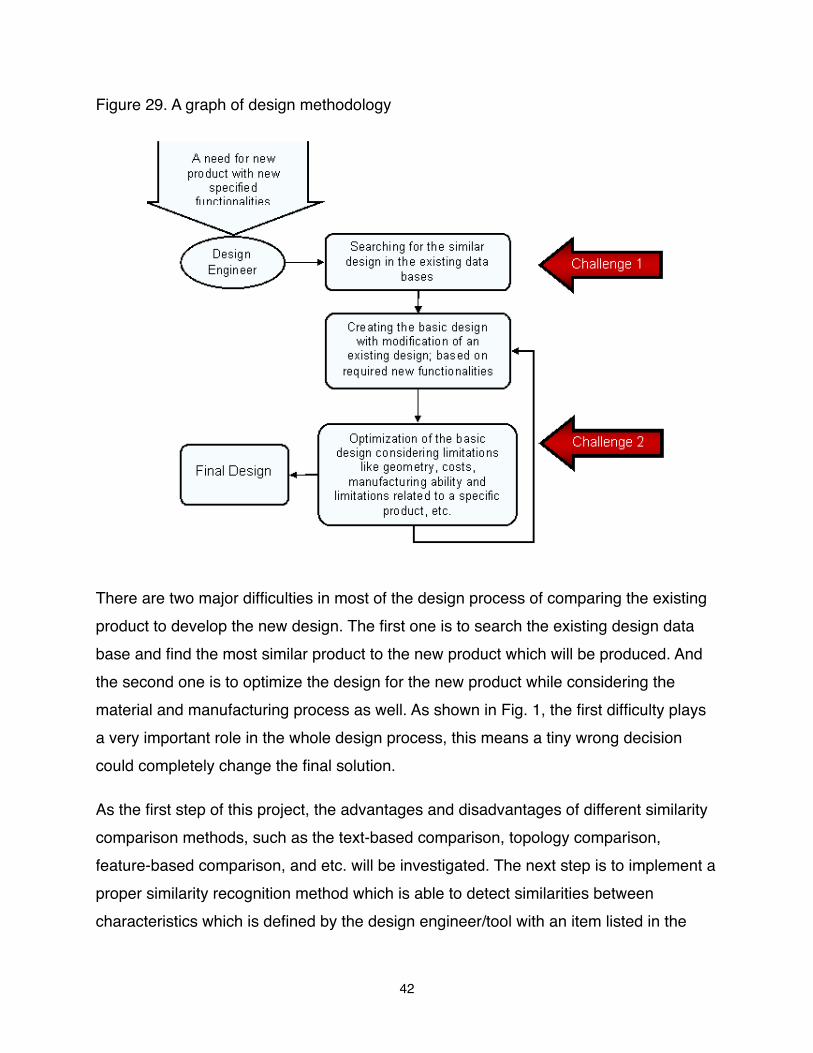
Figure 29. A graph of design methodology
There are two major difficulties in most of the design process of comparing the existing product to develop the new design. The first one is to search the existing design data base and find the most similar product to the new product which will be produced. And the second one is to optimize the design for the new product while considering the material and manufacturing process as well. As shown in Fig. 1, the first difficulty plays a very important role in the whole design process, this means a tiny wrong decision could completely change the final solution.
As the first step of this project, the advantages and disadvantages of different similarity comparison methods, such as the text-based comparison, topology comparison, feature-based comparison, and etc. will be investigated. The next step is to implement a proper similarity recognition method which is able to detect similarities between characteristics which is defined by the design engineer/tool with an item listed in the
42
products data base. Letʼs analyze the product comparison of the two projects from this paper.
3.2.1.1 Product comparison in visualizing the idea posting webpage.
The aim of this project was focusing on the problem solving of viewing the idea posting website, so at the beginning of the project, the author was researching on the related papers, algorithm and the similar product, the other research pointed out that most data on the web is heterogeneous, unstructured, and often incomplete, which is very similar to the problem that this project is going to solve, and they were pointing out that there are two phases of matching the problems: the first one is a path indexing phase to enumerate and prioritize which path to consider, the second one is the combination of path examples that attempts to select the best set for each object. This was simply integrated in the design of this project, in the first path of which is the indexing phase to enumerate and prioritize which path to consider, there are the two options simply and clearly offered to users, which are the words tagging path and the visualized pattern path, and these two paths are not just simply displayed separately to the users, they are to some extent integrated together in a way that can help user to better recognize, which leads to the result of optimizing the stimulation of usersʼ own creativeness. So this is a revised version from what has been mentioned in the method of two phases of matching the problems, followed first phase but modified the second phase to combine the optimization of the parts from the second phase.
From the related works, it is also pointing out the method of integrating visualization and querying -- using the query to give us additional hints for selecting appropriate visualization and using the visualization to help the user formulate the next query. This has also been applied in the design of this project, this project contains a lot of the visualization, from the front page to the pages under each categories, the icons which mimic the real environment offered users not only the clickable link to the next level but also recalls the users memory from their physical feeling. The design also offers querying in terms of giving the user the text cloud instead of letting users to type in by themselves.
43
3.2.1.2 Product comparison in education portal
In the education portal project, the author researched about numbers of other existed product, such as the Kno and Kahn academy, and created the design based on the modification of parts of each existed design. From the research of Kahn academy, which is a learn at your own pace Math and Science web site. In the practice interface, it brings up the idea of gamification. When you click the Practice link, you face a constellation of skills, with Addition 1 at the top. As you demonstrate proficiency, you earn a star in that constellation, and the graphic indicates the suggested skills to work on next.
The interface is simple but effective. When user start to practice, the problems show up as images, and user enter the correct answer in a text box.
How to increase the the learning motivation and interest is always a big problem in education, will it be the right direction in the future to bring up the gamification in education?
The term “gamification” sounds elegant and simple. But it suggests adding far more sophisticated game mechanics to applications -- no matter how serious the application was. Gamification may have more impact outside of schools than in. Here is the case: Dean Takahashi of VentureBeat wrote about how DevHub, the web developersʼ place, added gaming feedback and watched surprisingly the percentage of users who have finished their websites rapidly increasing from 10 percent to 80 percent.Academics are creating a skin of respectability for gamification. Byron Reeves from Stanford University has recently written the article of "Totally Engaging" to outline his ideas about how gaming can turn the boring company man into an engaged worker.
In the design from the education project in this paper, it uses the gamification concept, give the users instantaneous feedback, but in a much slower way compare to other game strategy, this to some extent decreases the deficiency of transferring the users
44
own motivation of learning knowledge to the motivation of getting the reward from the game.
3.2.2 User survey and questionnaireThe target user group is always a special group. The designer have to understand the usersʼ taste, behaviors, habits even their culture. To better understand the users, designers can be aimed at what they want to know about users and design the questionnaire and research on the target users group. Besides the questionnaire, designer can use different method to observe, such as, photographing, taking video, interview, discussion, etc. In the two projects in this paper, I used the method observation in the education portal project, and the interviews, in both of the two projects. For the user survey and questionnaire, it can be designed in different form. Generally speaking, the questionnaire can be divided into two kinds of questions, the open questions and close questions. The content of the questionnaire do not have to be quantitative questions, they can also be the qualitative questions. The close question are the type which will let users to select the predesigned answers, such as multiple choice. The advantage of using close questions is that it is very easy to answer the questions and add up the answers, and it wonʼt be effected by the way how the user answers. But at the mean time, there is also the disadvantage, such as the predefined answer might mislead the user to a wrong direction. Sometimes by using the close questions, we can not get the real reason behind why the user has chosen the predefined answers. There are several type of the closed questions as listed in the following:1) Dichotomous will offer only two options, such as true/false questions2) Multiple choice3) Likert scale, which will offer the scale for the agreement of the answers, such as:
totally agree, agree, neutral, disagree, totally disagree.4) Semantic differential, which is letting the interviewee to choose the degree of their
feeling, such as, beautiful,___,___,___,___,___,ugly.5) Order the ranking, which is letting interviewee to reorder the predesigned answers.
45
The benefit of the close questions is that it is fast and easy to answer, and it also doesnʼt effect by the intervieweeʼs ability of expression. But the shortage of it is that it might mislead the answer since all the choices are predesigned. So it is important to be careful when designing the questions.There are also several type of the open questions listing in below:1) the Unstructured questions which let interviewee to answer in any way they preferred2) Sentence completion questions which let interviewee to complete the unfinished
sentence3) Word association question let interviewee imagine the answer by reading the
predesigned words.The advantage of the open questions is that it let the interviewee to answer the questions in any way that they preferred, which means it will get a much trustee and correct information. But there is also the disadvantage such as it is very time consuming and it might get the misunderstood answers. So in the questionnaire in the two projects in this paper, there are the combination of both open questions and close questions, in this way, we could get a better view from both perspective of what the interviewee felt and thought, and it will decrease a lot of the disadvantage which has been listed above.
3.2.3 Sequence of use: Story boardBenefits, Advantages and Disadvantages
Benefits
The main benefit of storyboarding is that it illustrates what the design would do or how it will behave in response to userʼs interaction. Storyboards are also a good way to help members of the project team visualize how an experience will work.
The advantage of story board is that it is more meaningful than flowcharts and other more technical diagrams for conveying the user experience. And it is vague enough that the audience will pose questions that are useful for the requirements gathering, the functional design, and the impact of the surrounding environment on product use. While
46
it is also a good way to gain early design feedback. It is also easily access because it does not ask for programming skills or the artistic skills, while it can provide a very quick way of sketching out the design ideas. In contrast, it complements verbal because it is always supporting persona and scenarios which are the two very common methods in story board. It is a good method of using visualized concept to rich up the userʼs experience.On the other hand, there is also disadvantages, such as the interaction between the story board, and although it is not required for the artistic skill but some hand drawings are always needed , which might lead to the team memberʼs reluctance. And although it is a well known method, very few data of the effectiveness of the story board has been tested. Appropriate UsesStoryboarding is useful for:
• Early concept sketches • Simulating functionality while not consider the implementation • Visual aides
In the procedure of story board, the first step would be understanding what need to be included in the story board. There are a few important elements that should not be missing, they are:
• Users backgrounds, and design goals.• Systemʼs limitation and other features• A design team for brainstorming and some other equipment • Identify people and artifacts in the storyboard.• Develop the storyboard scenarios.
How the story board has been used in this paper:
• Started the experience from drawing the user, and developing the scenarios by drawing usersʼ actions and interactions with the products
• A common feature is the text in the bubble or like in a conversation to brief illustrate what is the focus in that scenario.
47
• Include people when illustrating interaction.• It can also include the time when it is needed• Not necessary to include every detail but when it is needed• A brief description of introducing whatʼs happening there would be very useful.
Common Problems
• Decide what problem the story board is used to address is very important, in the education portal project, the story board is used for addressing the problem of the daily issue that students encounter, and the author divided them to three parts as on the way to school, in the school and in the after-school tutoring.
• Sometimes, the story board might skip the important details which might be actually the crucial point for the design, but in the projects in this paper, the other material such as the interviews and questionnaire to some extent has filled up this.
Next Steps
After a storyboard is completed, the author extracts the design implications and recommendations for improvements and give the important feedback to the storyboard, summarized them and then used the material for the next step, which would be conceiving and developing the concept for the design.
3.3 The methodology of conceiving and developingWhen we have collected enough material from the research of the existed products, from the observation and interviews of the users, it is the time to start conceiving and developing the design.
3.3.1 Brain-StormingBrainstorming process
48
Brainstorming with a group of people or just by the designer himself/herself is a powerful technique. Brainstorming always creates new ideas, and to some extent solves problems. Brainstorming motivates because when it is in the team, members move forward in thinking by the relevant from othersʼ ideas, when it is by oneself, he/she will also motivate from his/her own previous idea. However, brainstorming is not just a random and unstructured activity. There are certain structure and rules for brainstorming.
Brainstorming process:
• Define the goals
• There should be a time limit for the session
• Condense/combine/refine.
• Analyzing the results.
• The ideas should be ranked.
In the projects within this paper, the author started brainstorming by herself, it is actually very useful for starting the design. Basically what the author did was following the process which is listing above:
• Define the goals by following the story board, extract the problems from the story board and fits the goals that is necessary for addressing the problems.
• Kept the time limit as no more than 30min for each problems
• After the time limit, collect the ideas from the paper, most if the ideas are in the form of the combination of the sketches and some text, then combine the similar ideas, and refine them.
• Analyze the results, this can help designer to generate more interesting and helpful ideas.
• After all, rank the ideas, from the top - most important to bottom - most unimportant.
49
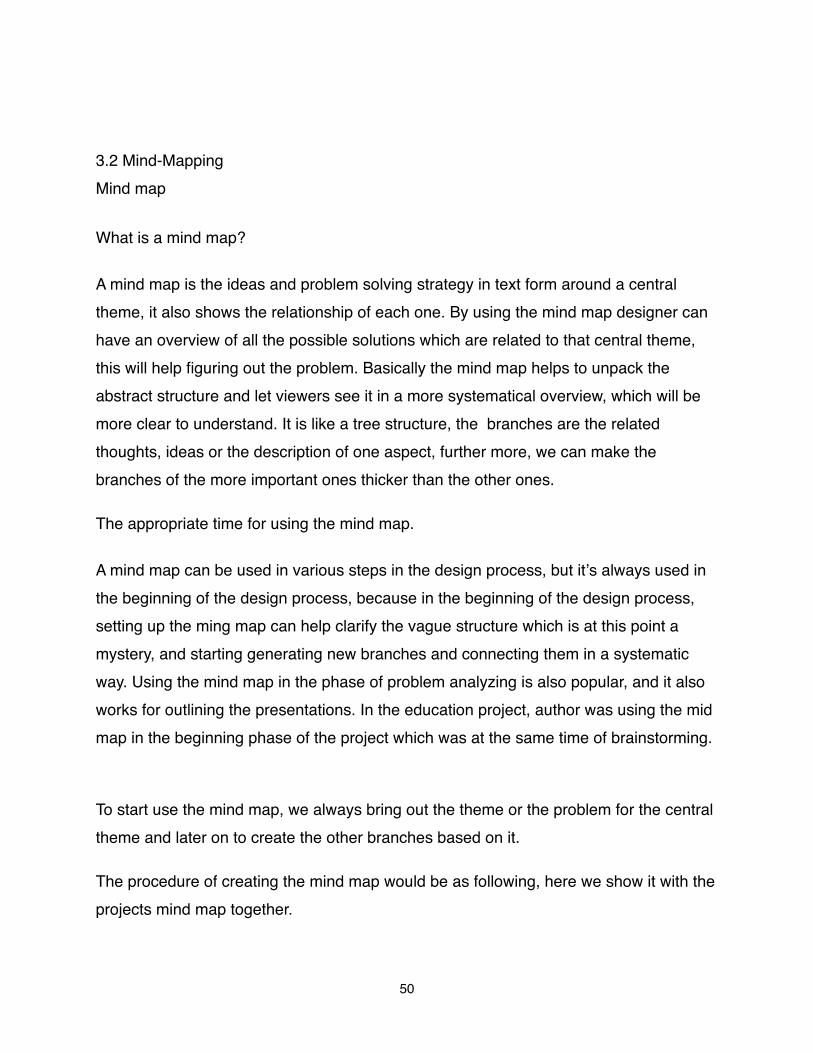
3.2 Mind-MappingMind map
What is a mind map?
A mind map is the ideas and problem solving strategy in text form around a central theme, it also shows the relationship of each one. By using the mind map designer can have an overview of all the possible solutions which are related to that central theme, this will help figuring out the problem. Basically the mind map helps to unpack the abstract structure and let viewers see it in a more systematical overview, which will be more clear to understand. It is like a tree structure, the branches are the related thoughts, ideas or the description of one aspect, further more, we can make the branches of the more important ones thicker than the other ones.
The appropriate time for using the mind map.
A mind map can be used in various steps in the design process, but itʼs always used in the beginning of the design process, because in the beginning of the design process, setting up the ming map can help clarify the vague structure which is at this point a mystery, and starting generating new branches and connecting them in a systematic way. Using the mind map in the phase of problem analyzing is also popular, and it also works for outlining the presentations. In the education project, author was using the mid map in the beginning phase of the project which was at the same time of brainstorming.
To start use the mind map, we always bring out the theme or the problem for the central theme and later on to create the other branches based on it.
The procedure of creating the mind map would be as following, here we show it with the projects mind map together.
50
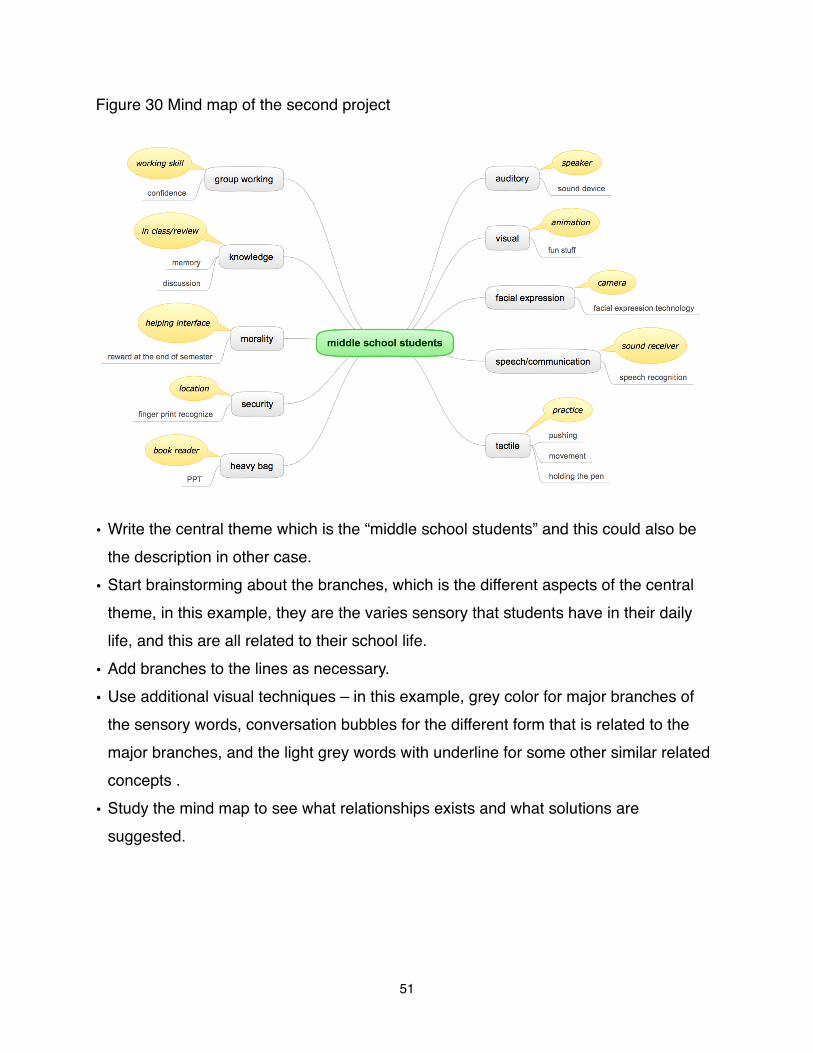
Figure 30 Mind map of the second project
• Write the central theme which is the “middle school students” and this could also be the description in other case.
• Start brainstorming about the branches, which is the different aspects of the central theme, in this example, they are the varies sensory that students have in their daily life, and this are all related to their school life.
• Add branches to the lines as necessary.
• Use additional visual techniques – in this example, grey color for major branches of the sensory words, conversation bubbles for the different form that is related to the major branches, and the light grey words with underline for some other similar related concepts .
• Study the mind map to see what relationships exists and what solutions are suggested.
51
CHAPTER 4CONCLUSIONS
In this paper, the author firstly brought out the two interface design projects, redesign the interface of the improvement online idea voting system, and the interface design of interface design of education portal, showed the whole process of the two projects. Then start analyzing the industrial design methodologies which have been using in these two project, this has brought out the very interesting concept which is the interdisciplinary work between industrial design and interface design. The author extracted the methodology which have been using in the process of the two projects, they are mostly in the beginning part or the middle part of the projects. The methodologies have been analyzed such as, the product comparison, the user survey and questionnaire, the brainstorming and the mind map, etc. It is not only the similarity between industrial design and interface design, but also the fast developing industry of interface design and the long history of the industrial design methodology, makes it necessary to increase the connection between these two fields. By working in the interface projects, the author start to notice that the industrial design methodologies can not only be applied in this field, but also can stimulate the new creativity which would promote the design work. For example, by using the story board, and sketching out the usersʼ actions, even they are mostly physical actions, it will still add up the meaningful ideas to further develop the concept for the design.
52
REFERENCES
[2] Brian P. Bailey, Eric Horvitz, What’s Your Idea? A Case Study of a Grassroots
Innovation Pipeline within a Large Software Company, 2010
[1] Mike Cammarano, Xin (Luna) Dong, Bryan Chan, Jeff Klingner, Justin Talbot, Alon
Halevy, and Pat Hanrahan, Visualization of Heterogeneous Data, 2007
[11] Carver, S. et al. Public participation, GIS, and cyberdemocracy: evaluating on- line
spatial decision support systems. Environment and Planning B-Planning & Design 28 ,
pp. 907-921.2001
[3] Yan Dang, Yulei Zhang, Paul Jen-Hwa Hu, Susan A. Brown, Hsinchun Chen,
Knowledge mapping for rapidly evolving domains: A design science
approach, 2011
[10] Geneva, Switzerland, Human- centered design for interactive systems International
Organization for Standardization,1999
[6] A.R. Hevner, A three cycle view of design science research, Scandinavian Journal of
Information Systems 19 (2) , 2007
[9]D. A. Keim. Information visualization and visual data mining. IEEE Transactions on
Visualization and Computer Graphics, 7(1):1–8, 2002.
[7] Krieger, M. and Y.Y. Wang. Ideas2ideas: Encouraging Constructive Ideation in an
Online, Mass- Participation
Brainstorming System. UIST, Poster session, 2008.
53
[4] Greg Newman, Don Zimmerman, Alycia Crall User-friendly web mapping: lessons
from a citizen science website, 2010
[8]M. Stonebraker. Visionary: A next generation visualization system for data bases. In
Sigmod, page 635, 2003.
[5] Y. Zhou, J. Qin, H. Chen, CMedPort: an integrated approach to facilitating Chinese
medical information seeking, Decision Support Systems 42 (3), 2006
[12] http://www.face-rec.org/general-info/
[13] http://www.sciencedaily.com/releases/2009/12/091223215119.htm
[14] http://www.sciencedaily.com/releases/2008/02/080223125318.htm
[15] http://thegeekreview.com/2011/05/khan-academy/
[16] http://susanmidlarsky.com/blog/blog_files/khan_academy_review.php
[17] http://gamification.org/wiki/Gamification_of_Education
[18] http://www.usabilitybok.org/methods/storyboard?section=special-considerations
[19] http://www.businessballs.com/brainstorming.htm
[20] http://wikid.eu/index.php/Mind_map
54