Embed Size (px)
Citation preview
1
Applying Applying EvidenceEvidence--Based Based Therapies for Preventing and Therapies for Preventing and
Treating Cardiovascular Disease: Treating Cardiovascular Disease: Role of Systems of CareRole of Systems of Careyy
Gregg C. Fonarow, MD, FACC, FAHAEliot Corday Professor of CV Medicine and ScienceDirector, Ahmanson-UCLA Cardiomyopathy CenterCo-Director, UCLA Preventative Cardiology ProgramCo-Chief, UCLA Division of CardiologyLos Angeles, California
Presenter and Program Disclosure Information
Gregg C. Fonarow, MD
FINANCIAL DISCLOSURE:Consultant, Honorarium: Medtronic, Novartis
UNLABELED/UNAPPROVED USES DISCLOSURE:None
Burden of Atherosclerotic Vascular Burden of Atherosclerotic Vascular Disease: CAD, CVD, PVDDisease: CAD, CVD, PVD
• Prevalence– 16 million in United States
• Annual rates Myocardial infarction–1.4 millionStrokes 800 000Strokes-800,000CVD Mortality–812,000 (every 30 seconds a death) Cardiac catheterization–1.1 millionPercutaneous revascularization–1.1 millionSurgical revascularization–416,000
• Annual cost–>$300 billion
American Heart Association. 2012 Heart and Stroke Stat stical Update. At http //www.americanheart.org.
2
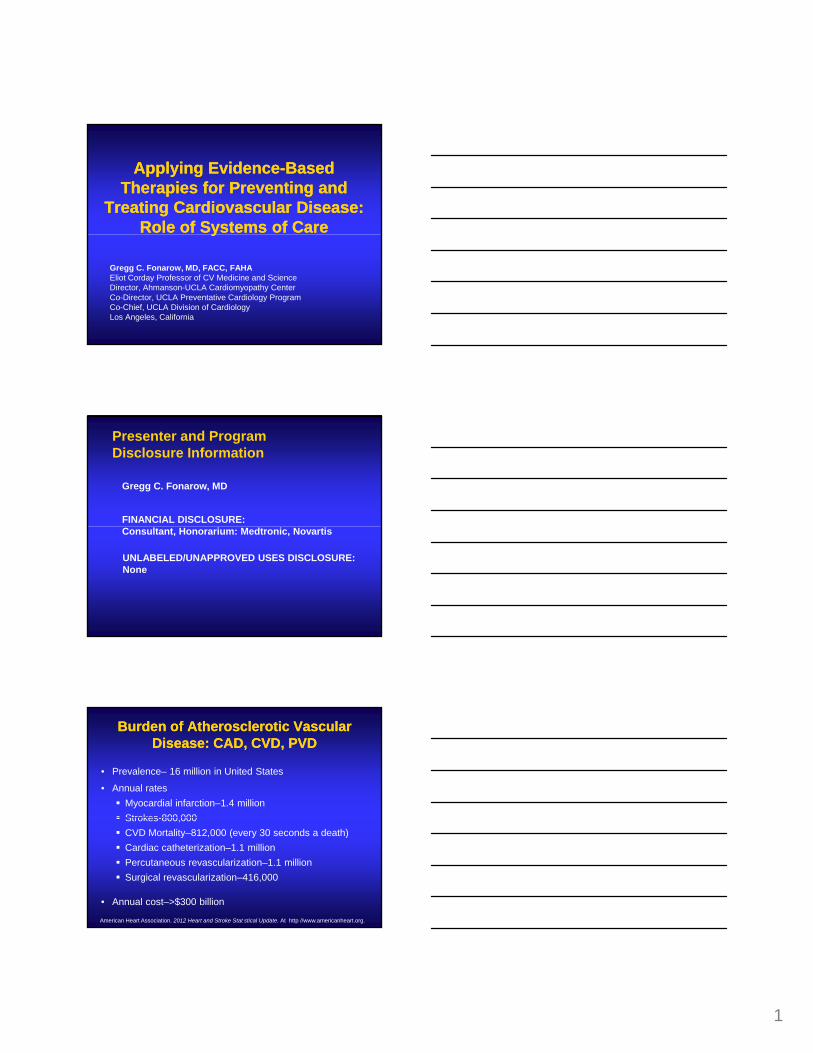
Cost of Cardiovascular Disease in the United StatesCost of Cardiovascular Disease in the United States
American Heart Association. Heart Disease and Stroke Statistics – 2009 Update. Dallas, Texas
*2009 estimates
CVD=Cardiovascular diseaseBillions of dollars
Patients Screened for the Multiple Risk Factor Intervention Trial (N=316,099)
y ra
ter 1
0 y
Total Serum Cholesterol and Total Serum Cholesterol and Cardiovascular Disease RiskCardiovascular Disease Risk
706050
Serum cholesterol (mg/dL)
CAD
mor
talit
ype
r 100
0 ov
er
Neaton and Wentworth. Arch Intern Med. 1992;152 56.
140 180 220 260 300
50403020100
340
Evolution of the NCEP GuidelinesEvolution of the NCEP Guidelines
1970s
NCEPATP IGuidelines1988
NCEPATP IIGuidelines1993
NCEPATP IIIGuidelines2001
FraminghamMRFITLRC-CPPTCoronary Drug ProjectHelsinki HeartCLAS (angio)
Angiographic Trials (FATS, POSCH, SCOR, STARS, Ornish, MARS)Meta-Analyses(Holme, Rossouw)
4S, WOSCOPS, CARE, LIPID, AFCAPS/TexCAPS, VAHIT, others
3
460
480
500
520
n th
ousa
nds)
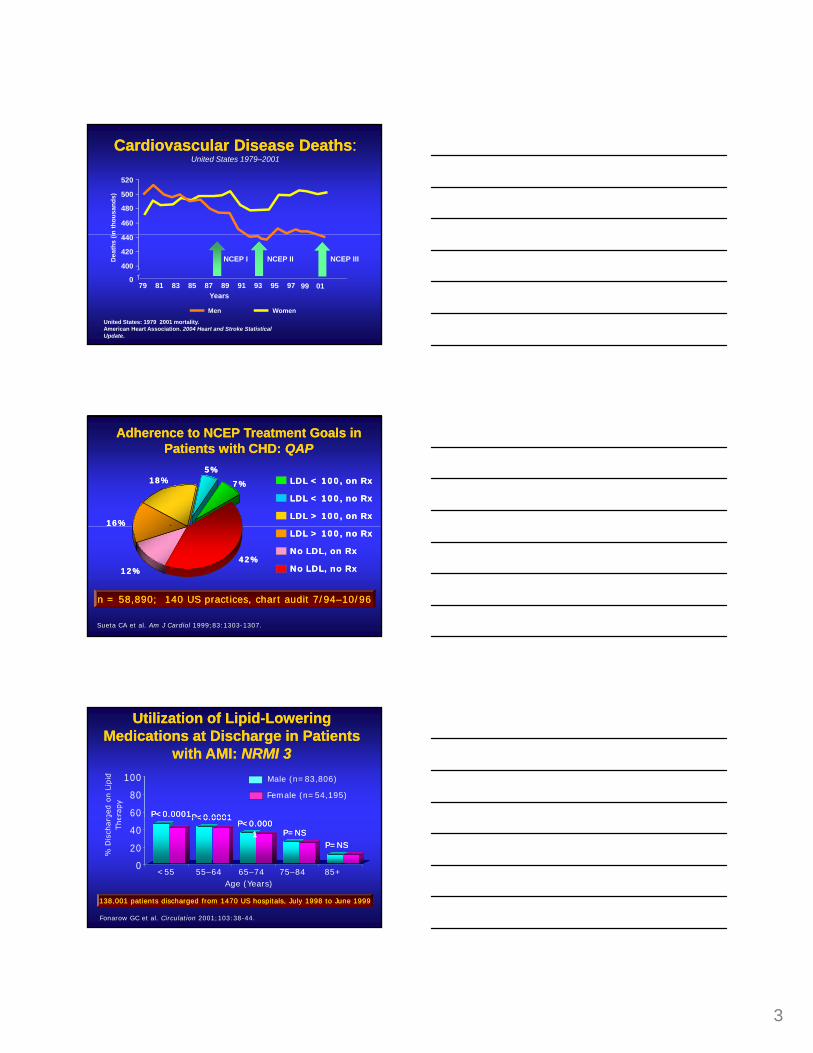
Cardiovascular Disease DeathsCardiovascular Disease Deaths: : United States 1979–2001
United States: 1979 2001 mortality.American Heart Association. 2004 Heart and Stroke Statistical Update.
79 9781 83 85 87 89 91 93 95
400
0
420
440
Dea
ths
(i
Men Women
Years99
NCEP I NCEP II NCEP III
01
Adherence to NCEP Treatment Goals in Adherence to NCEP Treatment Goals in Patients with CHD: Patients with CHD: QAPQAP
LDL < 100, on RxLDL < 100, on Rx
LDL < 100, no RxLDL < 100, no Rx
LDL > 100, on RxLDL > 100, on Rx
7%7%
5%5%18%18%
16%16%
Sueta CA et al. Am J Cardiol 1999;83:1303-1307.
LDL > 100, no RxLDL > 100, no Rx
No LDL, on RxNo LDL, on Rx
No LDL, no RxNo LDL, no Rx12%12%42%42%
n = 58,890; 140 US practices, chart audit 7/94n = 58,890; 140 US practices, chart audit 7/94––10/9610/96
60
80
100
Utilization of LipidUtilization of Lipid--Lowering Lowering Medications at Discharge in Patients Medications at Discharge in Patients
with AMI: with AMI: NRMI 3NRMI 3Male (n=83,806)
P<0.0001P<0.0001
Female (n=54,195)
P<0 0001P<0 0001
0
20
40
Fonarow GC et al. Circulation 2001;103:38-44.
Age (Years)
P<0.0001P<0.0001P<0.000P<0.000
11 P=NSP=NSP=NSP=NS
<55 55–64 65–74 75–84 85+
138,001 patients discharged from 1470 US hospitals, July 1998 to June 1999138,001 patients discharged from 1470 US hospitals, July 1998 to June 1999
4
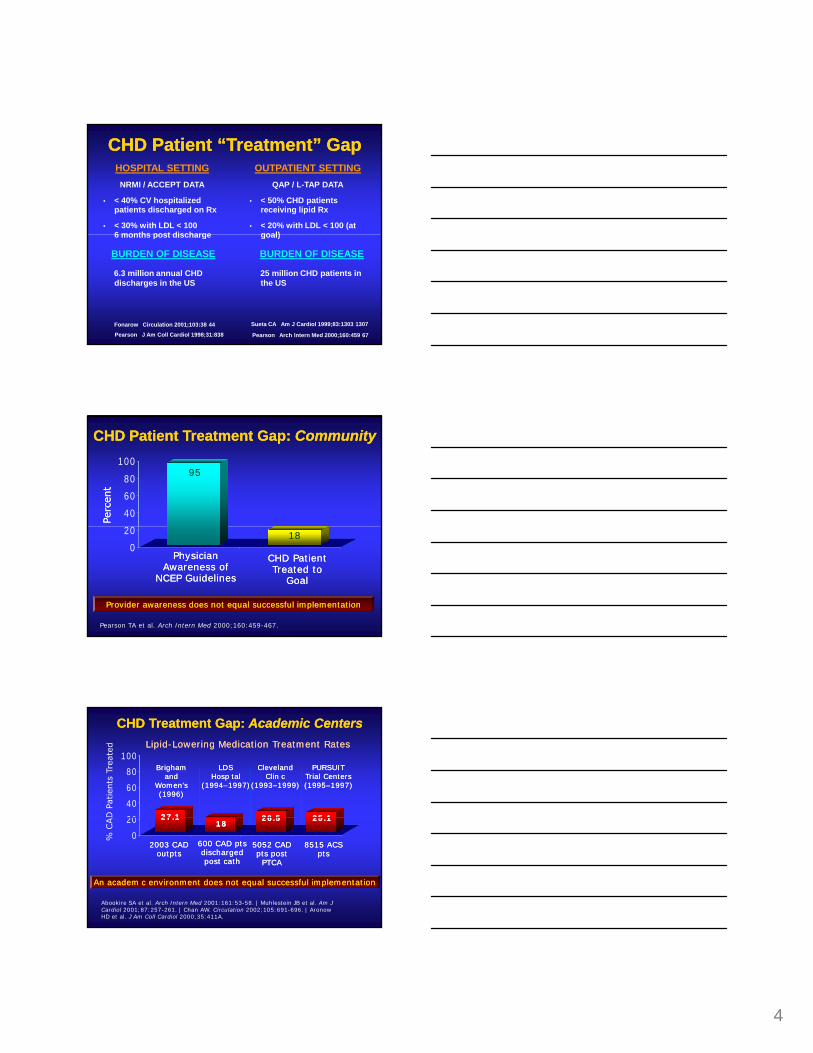
OUTPATIENT SETTINGQAP / L-TAP DATA
• < 50% CHD patients receiving lipid Rx
• < 20% with LDL < 100 (at goal)
HOSPITAL SETTINGNRMI / ACCEPT DATA
• < 40% CV hospitalized patients discharged on Rx
• < 30% with LDL < 100 6 months post discharge
CHD Patient “Treatment” GapCHD Patient “Treatment” Gap
goal)
BURDEN OF DISEASE
25 million CHD patients in the US
6 months post discharge
BURDEN OF DISEASE
6.3 million annual CHD discharges in the US
Fonarow Circulation 2001;103:38 44 Sueta CA Am J Cardiol 1999;83:1303 1307
Pearson Arch Intern Med 2000;160:459 67Pearson J Am Coll Cardiol 1998;31:838
40
60
80
100
CHD Patient Treatment Gap: CHD Patient Treatment Gap: CommunityCommunity
95
0
20
Pearson TA et al. Arch Intern Med 2000;160:459-467.
18
Provider awareness does not equal successful implementationProvider awareness does not equal successful implementation
PhysicianPhysicianAwareness ofAwareness of
NCEP GuidelinesNCEP Guidelines
CHD Patient CHD Patient Treated to Treated to
GoalGoal
20
40
60
80
100
CHD Treatment Gap: CHD Treatment Gap: Academic CentersAcademic Centers
Brigham Brigham and and
Women’sWomen’s(1996)(1996)
LDSLDSHosp talHosp tal
(1994(1994––1997)1997)
Cleveland Cleveland Clin c Clin c
(1993(1993––1999)1999)
LipidLipid--Lowering Medication Treatment RatesLowering Medication Treatment Rates
PURSUIT PURSUIT Trial Centers Trial Centers (1995(1995––1997)1997)
27 127 1 26 526 5 25 125 1
0
20
An academ c environment does not equal successful implementationAn academ c environment does not equal successful implementation
Abookire SA et al. Arch Intern Med 2001:161:53-58. | Muhlestein JB et al. Am J Cardiol 2001;87:257-261. | Chan AW. Circulation 2002;105:691-696. | Aronow HD et al. J Am Coll Cardiol 2000;35:411A.
2003 CAD 2003 CAD outptsoutpts
5052 CAD 5052 CAD pts post pts post
PTCAPTCA
8515 ACS 8515 ACS ptspts
27.127.11818
26.526.5 25.125.1
600 CAD pts 600 CAD pts discharged discharged post cathpost cath
5
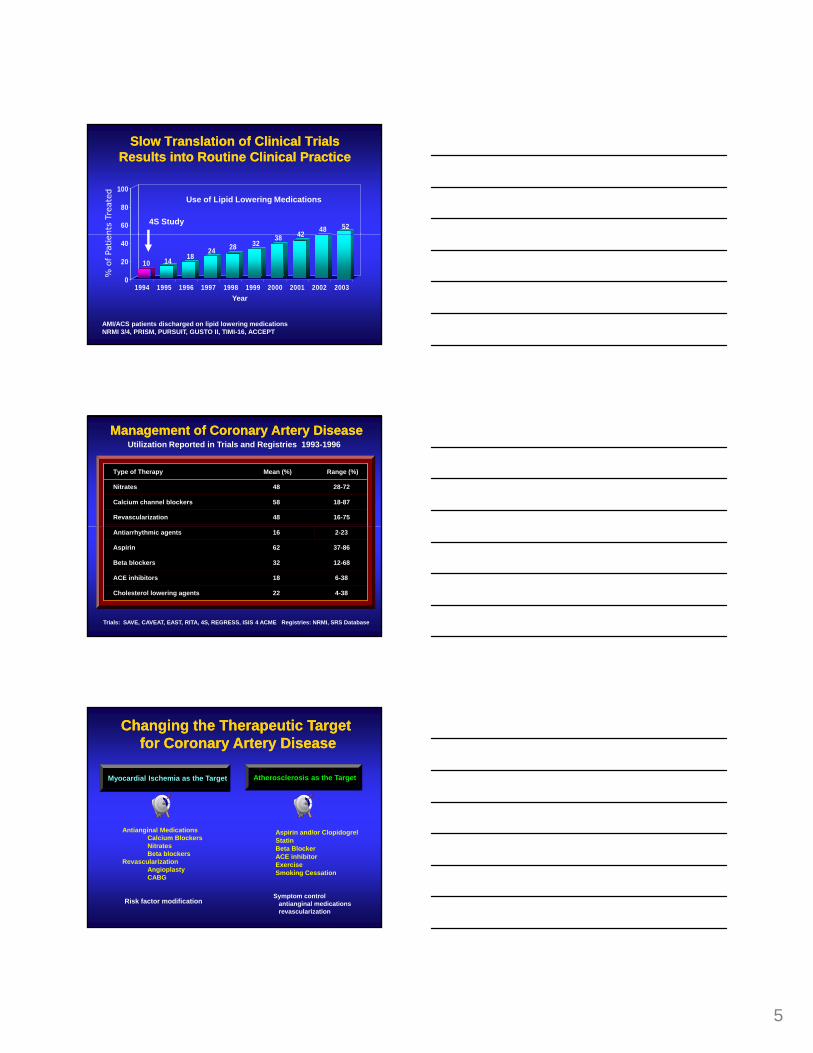
Slow Translation of Clinical Trials Slow Translation of Clinical Trials Results into Routine Clinical PracticeResults into Routine Clinical Practice
42 48 5260
80
100
4S Study
Use of Lipid Lowering Medications
10 14 1824 28 32
38 42
0
20
40
1994 1995 1996 1997 1998 1999 2000 2001 2002 2003Year
AMI/ACS patients discharged on lipid lowering medicationsNRMI 3/4, PRISM, PURSUIT, GUSTO II, TIMI-16, ACCEPT
Type of Therapy Mean (%) Range (%)
Nitrates 48 28-72
Calcium channel blockers 58 18-87
Revascularization 48 16-75
Management of Coronary Artery DiseaseManagement of Coronary Artery DiseaseUtilization Reported in Trials and Registries 1993-1996
Antiarrhythmic agents 16 2-23
Aspirin 62 37-86
Beta blockers 32 12-68
ACE inhibitors 18 6-38
Cholesterol lowering agents 22 4-38
Trials: SAVE, CAVEAT, EAST, RITA, 4S, REGRESS, ISIS 4 ACME Registries: NRMI, SRS Database
Changing the Therapeutic Target Changing the Therapeutic Target for Coronary Artery Diseasefor Coronary Artery Disease
Myocardial Ischemia as the Target Atherosclerosis as the Target
Antianginal MedicationsCalcium BlockersNitratesBeta blockers
RevascularizationAngioplastyCABG
Aspirin and/or ClopidogrelStatinBeta BlockerACE inhibitorExercise Smoking Cessation
Risk factor modificationSymptom control antianginal medications revascularization

6
NitratesCalcium Channel Blockers
Iron Chelation
Alcohol
Red Wine
Folate
Vitamin B12
Meditation
Estrogen
WalnutsGarlic
ACE Inhibitors
Olive Oil
Fish Oils
StentsNiacin
FibratesAnti-Oxidants
Lasers
Phlebotomy
Fiber?
Potential Therapies for Atherosclerosis Potential Therapies for Atherosclerosis
Beta Blockers
Diet
Exercise
Vitamin E
Vitamin C
Beta Carotene
Calcium Chelation
BiofeedbackBlood Pressure Control
Glucose Control Oat BranAspirin Coumadin
Gene Therapy
Weight Loss
VegetablesL-Arginine
Statins
ResinsAcupuncture
Platelet antagonists
Thyroid Hormones
Soy Beans
?
Anti-Platelet Therapy Aspirin
Atherosclerosis as the Therapeutic TargetAtherosclerosis as the Therapeutic TargetTherapies with Demonstrated Benefit
Neurohumoral InhibitionBeta Blockers ACE Inhibitors
Lipoproteins / InflammationStatins (irrespective of baseline LDL)
ExerciseSmoking Cessation
Omega-3 Fatty Acids
CHAMP 1994
Conceptual Basis for Combination CardiovascularConceptual Basis for Combination CardiovascularProtective Medical Therapy for AtherosclerosisProtective Medical Therapy for Atherosclerosis
Angiotensin II
IL-6
Oxidized LDLM-CSF
Aldosterone
Obesity
CRP
ICAMECAM
Lp (a) Triglycerides
Chylomicron RemnantsAGEs
Hypertension
Fibrinogen
Serum amyloid
Apo B100P-selectin
Activated monocytes
Epinephrine
Norepinephrine
Endothelin
TNF
Smoking
HomocysteineAge
Chylomicron RemnantsDiabetes
Superoxide anion
PAI-1 Small dense LDLInsulin ADMA
Uric acid
Chlamydia
Iron
Apo ENAPDH oxidases
Xanthine oxidase
Tissue Factor
PDGFAponectin
MyeloperoxidaseCD-40 ligand
Particulate matter

7
28.9
18.6
11.2
Placebo Only
Statin Only
Interaction Between Therapies to Treat AtherosclerosisInteraction Between Therapies to Treat Atherosclerosis
8.6
Statin+ASA
Statin+ASA+BB
0 5 10 15 20 25 30 35Coronary Event Rate (%)
Placebo 24% Statin 24% Statin+ASA 8% Statin+ASA+Beta Blocker 18%Treatment in 4S 4444 Patients with CAD Only statin vs placebo randomized 5.4 years
70% Reduction
Background Therapy
Aspirin + 6813
N Relative Risk of CV EventRelative Risk of CV Event
ACEI Therapy is Additive to Other ACEI Therapy is Additive to Other CardioprotectiveCardioprotectiveTherapies in Patients with Atherosclerosis or DiabetesTherapies in Patients with Atherosclerosis or Diabetes
Aspirin - 2484
Beta Blocker + 3673
0.4 0.6 0.8 1.0 1.2 1.4 1.6
P=NSTest for heterogeneity
Ramipril Better Placebo Better
Lipid Lowering + 2658
Dagenais Circulation 2001;104:522-526.
Beta Blocker - 5624
Lipid Lowering - 6639
Cumulative Impact of SimpleCumulative Impact of SimpleCardiovascular Protective MedicationsCardiovascular Protective Medications
Relative-risk 5yr CV event rate
None - - 20%Aspirin 25% 15%
25% 11
Cumulative risk reduction if all four therapies are used 77%Absolute risk reduction 15.4%, NNT = 6
Beta blocker 25% 11.3%ACE inhibitor 25% 8.4%Lipid lowering Rx 30% 5.9%LDL 100 70 mg/dl 22% 4.6%
CV event CV death, MI, or strokeFonarow Am J Cardiol 2001;85:10A 17A and Yusuf Lancet 2002;360:2 3
8
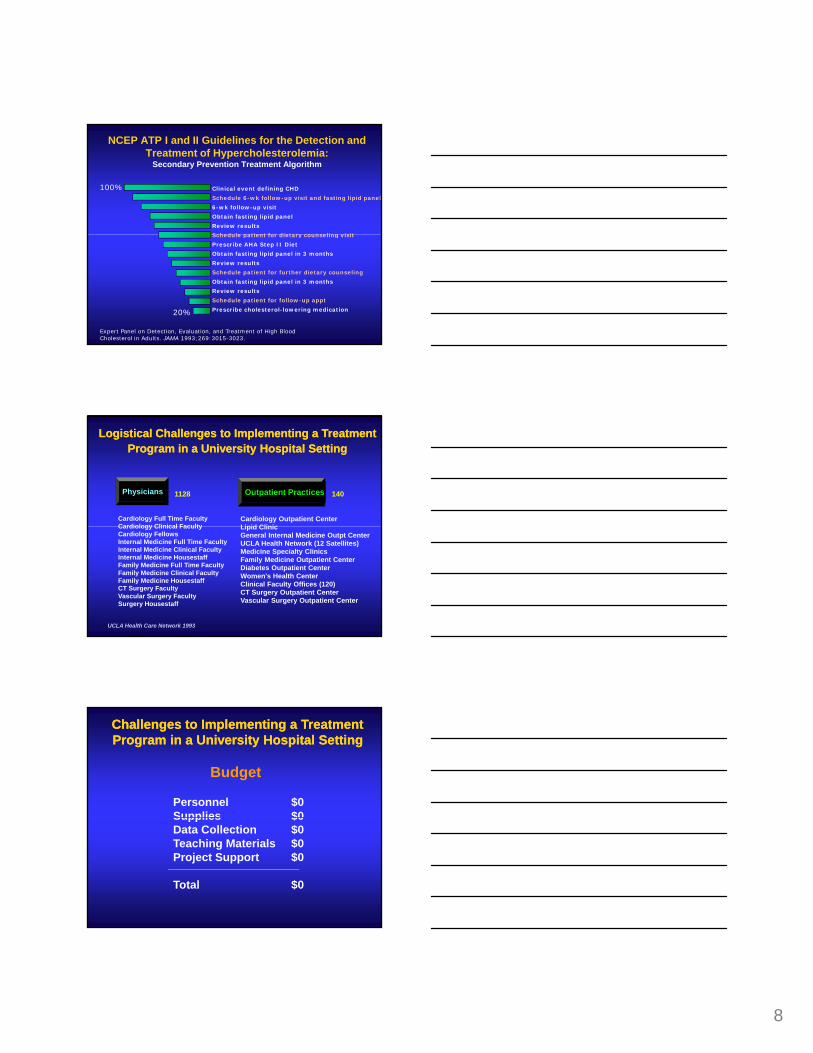
NCEP ATP I and II Guidelines for the Detection and Treatment of Hypercholesterolemia:
Secondary Prevention Treatment Algorithm
Clinical event defining CHD
Schedule 6-wk follow-up visit and fasting lipid panel
6-wk follow-up visit
Obtain fasting lipid panel
Review results
Schedule patient for dietary counseling visit
100%
Expert Panel on Detection, Evaluation, and Treatment of High Blood Cholesterol in Adults. JAMA 1993;269:3015-3023.
Schedule patient for dietary counseling visit
Prescribe AHA Step II Diet
Obtain fasting lipid panel in 3 months
Review results
Schedule patient for further dietary counseling
Obtain fasting lipid panel in 3 months
Review results
Schedule patient for follow-up appt
Prescribe cholesterol-lowering medication20%
Physicians Outpatient Practices
Cardiology Full Time FacultyCardiology Clinical Faculty
Cardiology Outpatient CenterLipid Clinic
1128 140
Logistical Challenges to Implementing a TreatmentLogistical Challenges to Implementing a TreatmentProgram in a University Hospital SettingProgram in a University Hospital Setting
Cardiology Clinical FacultyCardiology FellowsInternal Medicine Full Time FacultyInternal Medicine Clinical FacultyInternal Medicine HousestaffFamily Medicine Full Time FacultyFamily Medicine Clinical FacultyFamily Medicine HousestaffCT Surgery FacultyVascular Surgery FacultySurgery Housestaff
Lipid Clinic General Internal Medicine Outpt CenterUCLA Health Network (12 Satellites)Medicine Specialty ClinicsFamily Medicine Outpatient CenterDiabetes Outpatient CenterWomen's Health CenterClinical Faculty Offices (120)CT Surgery Outpatient CenterVascular Surgery Outpatient Center
UCLA Health Care Network 1993
Challenges to Implementing a TreatmentChallenges to Implementing a TreatmentProgram in a University Hospital SettingProgram in a University Hospital Setting
Budget
Personnel $0Supplies $0Supplies $0Data Collection $0Teaching Materials $0Project Support $0
Total $0
9
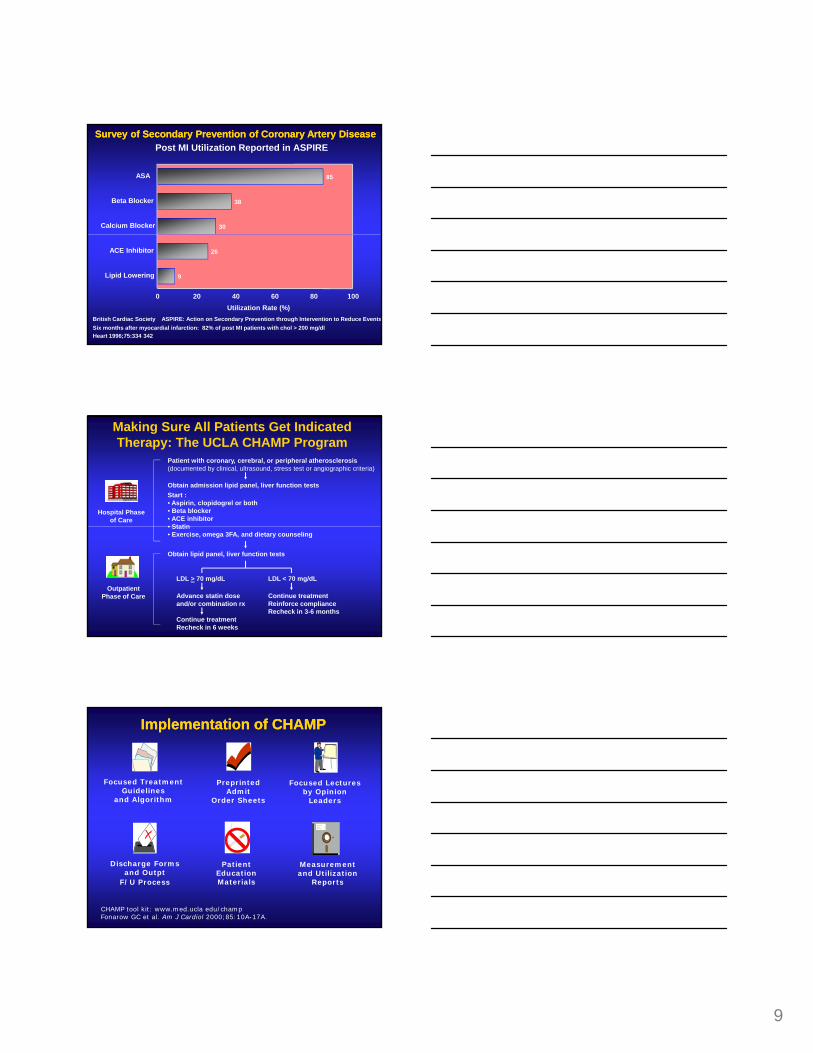
85
38
30
ASA
Beta Blocker
Calcium Blocker
Survey of Secondary Prevention of Coronary Artery DiseaseSurvey of Secondary Prevention of Coronary Artery DiseasePost MI Utilization Reported in ASPIRE
26
9
ACE Inhibitor
Lipid Lowering
0 20 40 60 80 100Utilization Rate (%)
British Cardiac Society ASPIRE: Action on Secondary Prevention through Intervention to Reduce EventsSix months after myocardial infarction: 82% of post MI patients with chol > 200 mg/dl Heart 1996;75:334 342
Making Sure All Patients Get Indicated Therapy: The UCLA CHAMP Program
Hospital Phase of Care
Patient with coronary, cerebral, or peripheral atherosclerosis(documented by clinical, ultrasound, stress test or angiographic criteria)
Obtain admission lipid panel, liver function testsStart : • Aspirin, clopidogrel or both• Beta blocker• ACE inhibitor• Statin
Outpatient Phase of Care
• Statin• Exercise, omega 3FA, and dietary counseling
Obtain lipid panel, liver function tests
LDL > 70 mg/dL LDL < 70 mg/dL
Continue treatmentReinforce complianceRecheck in 3-6 months
Advance statin doseand/or combination rx
Continue treatmentRecheck in 6 weeks
Focused TreatmentGuidelines
and Algorithm
Preprinted Admit
Order Sheets
Focused Lecturesby Opinion
Leaders
Implementation of CHAMPImplementation of CHAMP
Discharge Formsand Outpt
F/U Process
Patient EducationMaterials
Measurement and Utilization
Reports
CHAMP tool kit: www.med.ucla edu/champFonarow GC et al. Am J Cardiol 2000;85:10A-17A.

10
Admit patient to the CCU / COU
Attending ________ Resident ________ Intern _______
Vital Signs Diet 2 gm Na Step II AHA 4 gm Na Step II AHA
Laboratories
Patient ID # UCLA Chest Pain/Unstable Angina Orders
Standardized Admission Order SheetsStandardized Admission Order Sheets
CK and CK-MB q 8 x 3, Troponin I now and 6 hoursLipid panel (nonfasting) TC, LDL, HDL, TGECG now and q AM x ___
MedicationsAspirin 81 mg PO qd or ________________
Beta Blocker ___________ ___ mg PO ___ (carvedilol if LVEF < 0.40)ACE Inhibitor _________ ___ mg PO ___Statin _________ ___ mg PO ___ (high dose/potent statin)
Smoking cessation programCardiac rehab litation referral UCLA Division of Cardiology
Clopidogrel 75 PO qd (after 300 mg loading dose)
Aldosterone Antagonist _________ ___ mg PO ___ (if LVEF < 0.40)
Impact of UCLA CHAMPImpact of UCLA CHAMP
Therapy1992–1993
(n=256)1994–1995
(n=302) P valueNRMI 2 Hosp
(n=74,530)Aspirin 78% 92% 0.01 72%
Beta Blockers 12% 61% 0.001 45%
Discharge medications for patients presenting to UCLA with acute MINational Benchmark NRMI 2 1994–1995 (1369 centers)
Nitrates 62% 34% 0.001 56%
ACE Inhibitors 4% 56% 0.001 29%
Statins 6% 86% 0.0001 ~12%
Fonarow GC et al. Am J Cardiol 2001;87:819-822.
60
80
100
initi
ated
on R
ate,
%
Barriers to Continuing Risk FactorBarriers to Continuing Risk FactorManagement in CHD Patients Management in CHD Patients
Outpatient-Initiated DiscontinuationRates of Lipid-Lowering Medications
0
20
40
Out
patie
nt-
Dis
cont
inua
tio
0 8 24 32 48Weeks
4016
Andrade SE et al. N Engl J Med 1995;332:1125-1131.
11
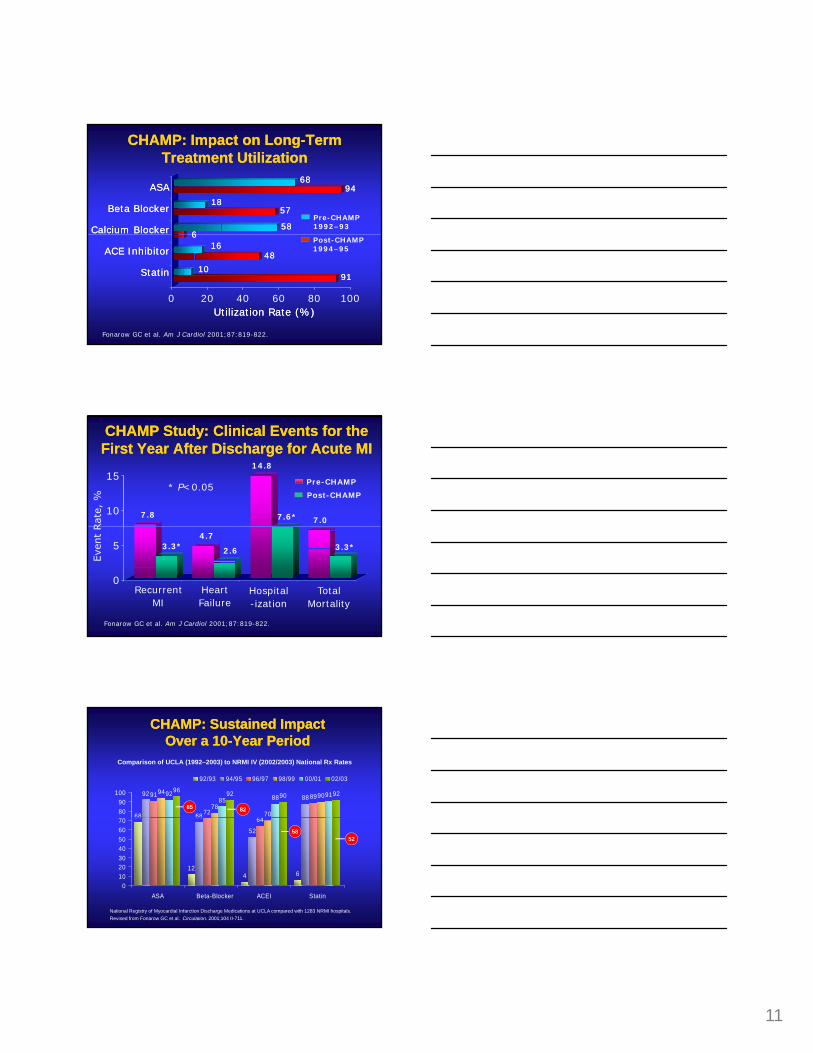
ASAASA
Beta BlockerBeta Blocker
Calcium BlockerCalcium Blocker
6868
1818
5858
CHAMP: Impact on LongCHAMP: Impact on Long--Term Term Treatment UtilizationTreatment Utilization
9494
5757
66
Pre-CHAMP 1992–93
0 20 40 60 80 100
ACE InhibitorACE Inhibitor
StatinStatin
Utilization Rate (%)Utilization Rate (%)
1616
1010
Fonarow GC et al. Am J Cardiol 2001;87:819-822.
66
9191
Post-CHAMP 1994–95
4848
10
15
CHAMP Study: Clinical Events for the CHAMP Study: Clinical Events for the First Year After Discharge for Acute MIFirst Year After Discharge for Acute MI
Pre-CHAMP
Post-CHAMP
7.8
14.8
7.07.6*
* P<0.05
0
5
Fonarow GC et al. Am J Cardiol 2001;87:819-822.
RecurrentMI
HeartFailure
Hospital-ization
TotalMortality
4.73.3* 2.6 3.3*
68
92
68
8891
7264
8994
7870
909285 88 91
96 92 90 92
8090
100
92/93 94/95 96/97 98/99 00/01 02/03
CHAMP: Sustained Impact CHAMP: Sustained Impact Over a 10Over a 10--Year PeriodYear Period
Comparison of UCLA (1992–2003) to NRMI IV (2002/2003) National Rx Rates
85 8268
124 6
68
52
64
010203040506070
ASA Beta-Blocker ACEI Statin
National Registry of Myocardial Infarction Discharge Medications at UCLA compared with 1283 NRMI hospitals.Revised from Fonarow GC et al. Circulation. 2001;104 II-711.
5852

12
Use of Use of StatinStatin Therapy at Hospital Therapy at Hospital Discharge in ACS PatientsDischarge in ACS Patients
at D
isch
arge
Use
of S
tatin
s
Adapted from Fonarow GC, et al Am Heart J 2009;157 185-194
Replication of CHAMP ResultsReplication of CHAMP Results
Aspirin B Blocker ACEI Statin 0
20
40
60
80
100
Perc
ent o
f Pat
ient
s
Inter-Mountain Health Care
Aspirin B Blocker ACEI Statin 0
20
40
60
80
100
Perc
ent o
f Pat
ient
s
Rocky Mountain Kaiser* *
** * *
**
10 hospitals, Pre 96/98 vs. Post 99 00, n 43,841 6 hospitals, Pre 96/97 vs. Post 98 99, n 1,716
Aspirin B Blocker ACEI Statin 0
20
40
60
80
100
Perc
ent o
f Pat
ient
s
AHA GWTG-New England
24 hospitals, Pre 99 vs. Post 00, n 1,709Aspirin B Blocker ACEI Statin 0
20
40
60
80
100
Perc
ent o
f Pat
ient
s
ACC GAP-Michigan
10 hospitals, Pre 98/99 vs. Post 00, n 1,649
* **
Systems Clinical Practice
ACC/AHA/HFSA Guidelines
I III IIIb IIIII III IIIb IIIII III IIIb IIIIIII IIIb IIII
Bridging the Gap Between Knowledge and Bridging the Gap Between Knowledge and Routine Clinical PracticeRoutine Clinical Practice
Adapted from the American Heart Association. Get With The Guidelines; 2001.
• Implement evidence-based care
• Improve communications• Ensure compliance
I IIIa IIIb IIIII IIIa IIIb IIIII IIIa IIIb IIIIIIIa IIIb IIII
• Improve quality of care • Improve outcomes
• Clinical trial evidence• National guidelines

13
Why a HospitalWhy a Hospital--based System forbased System forAtherosclerosis Management?Atherosclerosis Management?
• PatientsPatient capture pointHave patients/family attention:
“teachable moment”Predictor of care in communityy
• Hospital structureStandardized
processes/protocols/orders/teamsJCAHO-ORYX Core Measures
Process improvement examplesCenters for Medicare and Medicaid
Services—peer review organizationsHEDIS (post discharge)
Demographics6 clicks
Clinical/Lab8 clicks
SIMPLE, ONE PAGE, ON-LINE FORM
8 clicks
Dischargemeds and interventions7 clicks
Interactivelychecks patient’sdata with theAHA guidelines
©2001 Out
Track performance over time and against
benchmarks from similar hospitals or all hospitals
14
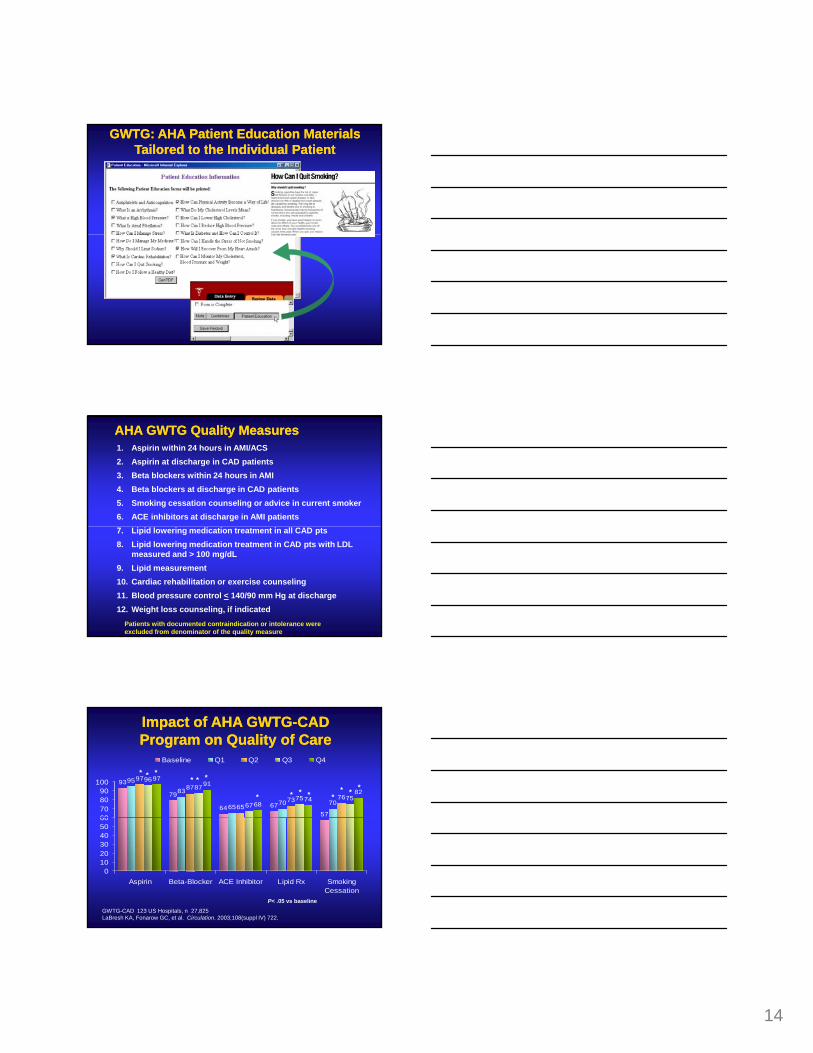
GWTG: AHA GWTG: AHA Patient Education Materials Patient Education Materials Tailored to the Individual PatientTailored to the Individual Patient
AHA GWTG Quality MeasuresAHA GWTG Quality Measures1. Aspirin within 24 hours in AMI/ACS2. Aspirin at discharge in CAD patients3. Beta blockers within 24 hours in AMI4. Beta blockers at discharge in CAD patients5. Smoking cessation counseling or advice in current smoker6. ACE inhibitors at discharge in AMI patients7. Lipid lowering medication treatment in all CAD pts8. Lipid lowering medication treatment in CAD pts with LDL
measured and > 100 mg/dL9. Lipid measurement10. Cardiac rehabilitation or exercise counseling11. Blood pressure control < 140/90 mm Hg at discharge12. Weight loss counseling, if indicated
Patients with documented contraindication or intolerance were excluded from denominator of the quality measure
Impact of AHA GWTGImpact of AHA GWTG--CADCADProgram on Quality of CareProgram on Quality of Care
95
83
6570 70
9787
6573 76
9687
6775 75
9791
6874
82
576764
79
93
60708090
100
Baseline Q1 Q2 Q3 Q4
* *** * *
* ** * ** * *
0102030405060
Aspirin Beta-Blocker ACE Inhibitor Lipid Rx SmokingCessation
P< .05 vs baselineGWTG-CAD 123 US Hospitals, n 27,825LaBresh KA, Fonarow GC, et al. Circulation. 2003;108(suppl IV) 722.
15
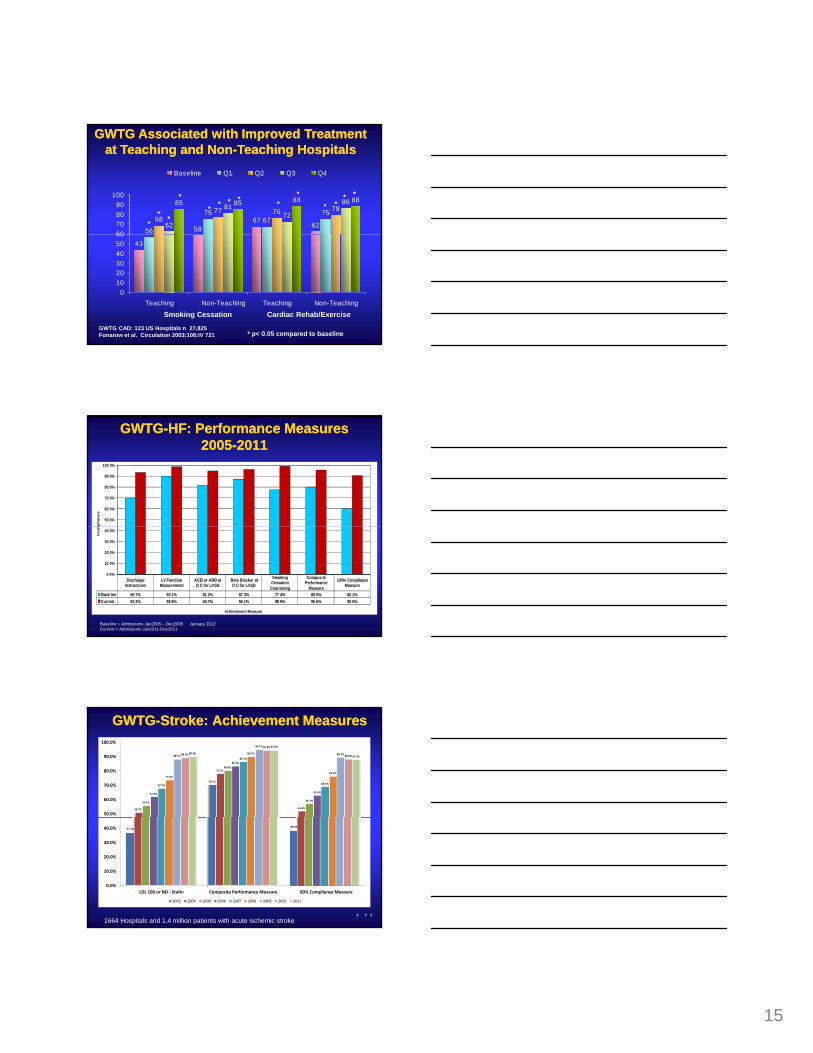
GWTG Associated with Improved Treatment GWTG Associated with Improved Treatment at Teaching and Nonat Teaching and Non--Teaching HospitalsTeaching Hospitals
5867
6256
7567
7568
77 76 79
62
8172
8685 85 88 88
60708090
100
Baseline Q1 Q2 Q3 Q4
** *
* **** **
* ** *
43
0102030405060
Teaching Non-Teaching Teaching Non-Teaching
Smoking Cessation Cardiac Rehab/Exercise
* p< 0.05 compared to baselineGWTG CAD: 123 US Hospitals n 27,825Fonarow et al. Circulation 2003;108:IV 721
GWTGGWTG--HF: Performance MeasuresHF: Performance Measures20052005--20112011
50 0%
60 0%
70 0%
80 0%
90 0%
100 0%
plia
nc
e
Discharge Instructions
LV Function Measurement
ACEI or ARB at D C for LVSD
Beta Blocker at D C for LVSD
Smoking Cessation
Counseling
Compos te Performance
Measure
100% Compliance Measure
Base ine 69 7% 90 1% 81 2% 87 3% 77 4% 80 0% 60 1%Current 93 3% 98 8% 94 7% 96 1% 98 9% 95 6% 90 5%
0 0%
10 0%
20 0%
30 0%
40 0%
Co
mp
Achievement Measure
Baseline = Admissions Jan2005 – Dec2005 January 2012Current = Admissions Jan2011-Dec2011
GWTGGWTG--Stroke: Achievement Measures Stroke: Achievement Measures
70 1%
50 7%
77 7%
51 6%
55 6%
80 0%
56 7%
61 6%
83 1%
62 6%
67 5%
86 1%
68 6%
73 4%
89 7%
76 1%
88 1%
94 7%
89 2%89 0%
94 2%
88 0%89 8%
94 4%
87 6%
50.0%
60.0%
70.0%
80.0%
90.0%
100.0%
A 2 2
37 1%38 6%
0.0%
10.0%
20.0%
30.0%
40.0%
LDL 100 or ND ‐ Statin Composite Performance Measure 00% Compliance Measure
2003 2004 2005 2006 2007 2008 2009 2010 2011
1664 Hospitals and 1,4 million patients with acute ischemic stroke
16
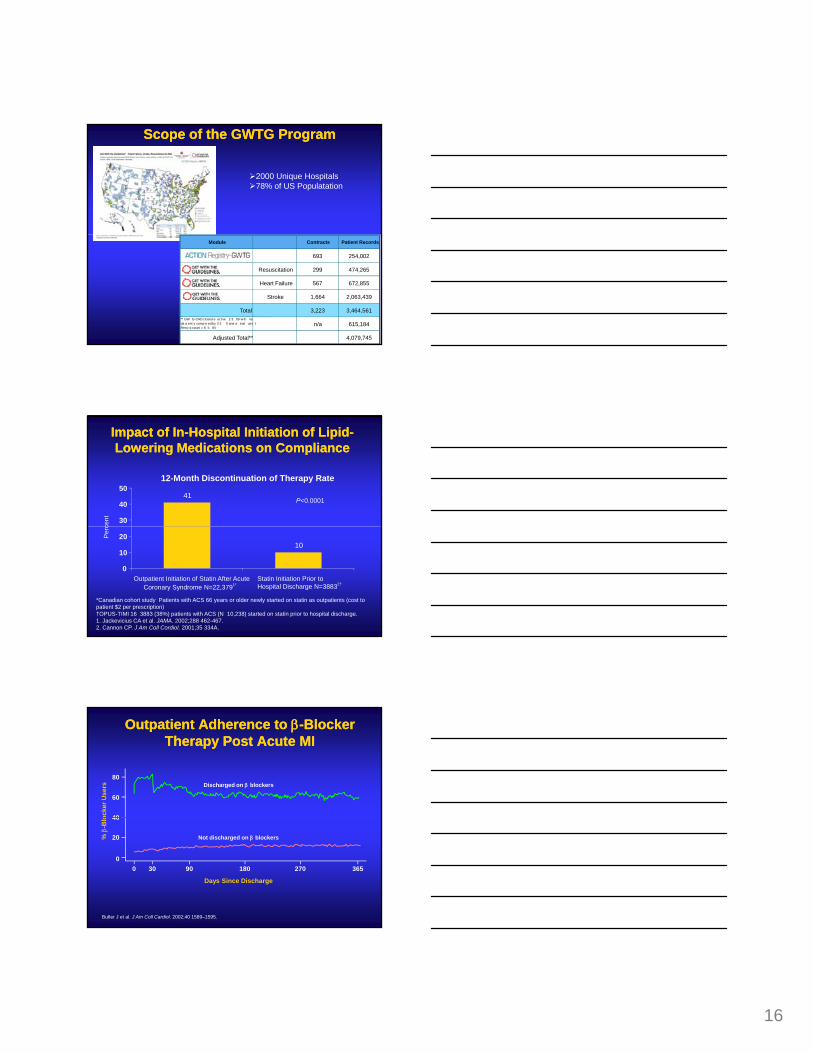
Scope of the GWTG ProgramScope of the GWTG Program
2000 Unique Hospitals78% of US Populatation
Module Contracts Patient Records
693 254,002
Resuscitation 299 474,265
Heart Failure 567 672,855
Stroke 1,664 2,063,439
Total 3,223 3,464,561** GW G-CAD closed e ect ve 2 3 09 w th na da a ent y comp e ed by 3 3 0 and a inal at e t Reco d count = 6 5 84
n/a 615,184
Adjusted Total** 4,079,745
Impact of InImpact of In--Hospital Initiation of LipidHospital Initiation of Lipid--Lowering Medications on ComplianceLowering Medications on Compliance
12-Month Discontinuation of Therapy Rate
P<0.000141
30
40
50
cent
*Canadian cohort study Patients with ACS 66 years or older newly started on statin as outpatients (cost to patient $2 per prescription)†OPUS-TIMI 16 3883 (38%) patients with ACS (N 10,238) started on statin prior to hospital discharge.1. Jackevicius CA et al. JAMA. 2002;288 462-467.2. Cannon CP. J Am Coll Cordiol. 2001;35 334A.
10
0
10
20
Outpatient Initiation of Statin After AcuteCoronary Syndrome N=22,3791*
Statin Initiation Prior to Hospital Discharge N=38832†
Per
c
Outpatient Adherence to Outpatient Adherence to ββ--Blocker Blocker Therapy Post Acute MITherapy Post Acute MI
Discharged on β blockers
ocke
r Use
rs
40
60
80
Not discharged on β blockers
Days Since Discharge
0 30 90 180 270 365
% β
-Blo
0
20
40
Butler J et al. J Am Coll Cardiol. 2002;40 1589–1595.

17
Adherence Rates After Discharge for ACS Adherence Rates After Discharge for ACS if Therapy is Started Inif Therapy is Started In--HospitalHospital
92 8880
87
60
80
100
f Pat
ient
s
GRACE Registry: 21,408 patients, multinational, assessment at discharge and 6 months follow upEagle Am J Med 2004;117:73 81
ASA Beta blocker ACEI Statin0
20
40
Perc
ent o
f
[11,465/12,463] [1906/2379][6796/7738] [5522/6320]
InIn--Hospital Initiation of Hospital Initiation of Cardiovascular Protective TherapiesCardiovascular Protective Therapies
Therapy more likely to be initiated by physician
Therapy more likely to be continued by physician long term
Patients more likely to view therapy as essential (heart medication)
Patients more likely to be compliant (lower discontinuation rates)
Patient more likely to achieve treatment goals
Early event reduction not missed
Fonarow Circulation 2001;103:2768
InIn--hospital Initiation of Lipid Lowering hospital Initiation of Lipid Lowering Medications: The New Standard of CareMedications: The New Standard of Care
The following national guidelines now recommend in-hospital initiation of lipid-lowering medications simultaneously with life-style modification, prior to hospital discharge:
JAMA 2001;285:2486-2497; Circulation 2001;104:1577-9; Circulation 2002;106:1893-900
NCEP-ATP III Guideline 2001
AHA/ACC Secondary Prevention 2001update
ACC/AHA ACS Guideline 2002 update
ACC/AHA STEMI Guideline 2004 update

18
It is possible to create a hospital basedsystem to implement atherosclerosis treatment
In-hospital treatment rates are markedly improved
It is safe to initiate lipid-lowering and other cardioprotective medications in the hospital
In-hospital initiated treatments are continued by outpatient physicians
The Science of ImplementationThe Science of Implementation
outpatient physicians
In-hospital initiation of treatments markedly improves long term patient compliance
In-hospital initiation of lipid lowering therapy results in more patients reaching a LDL < 100 mg/dl
It reduces total medical costs
In-hospital initiation of cardioprotective therapies reduces recurrent CV events and saves lives
Building the TeamBuilding the Team
• Physicians
• Nurses
• Pharmacists
• Hospital Administrators
• Directors of Quality Improvement and Case Management
• Cardiac Rehab Team
Assess Treatment RatesAnalyze
Treatment Rates
Find and Support a ChampionFind and Support a ChampionPerformance Improvement ProcessPerformance Improvement Process
Evaluate AssessmentHospital Team Reviews
Summary Reports
Refine ProtocolHospital Team IdentifiesAreas for Improvement
Implement Refined ProtocolHospital Team Coordinates Implementation of Refined
Protocol

19
“this will not work in a community setting”“the cardiologists will not agree to this”
“it ma not be safe to start ACEI or BB medications in hos italized atients”
“patients do not want to be on a lot of medications”“the managed care organization will not pay for it”
“we can not get a consensus”
“there is not enough time”
Challenges to Implement a Hospital Challenges to Implement a Hospital Performance Improvement SystemPerformance Improvement System
“the physicians at my hospital do not like cookbook medicine”
y p p
“the patients should all be followed in my office”
“the hospital administration will not pay for it”
“it will cost too much”
“we do not have anyone to do this”
“it will take too much time”
“it is too hard to get things through the hospital committee”
“this will benefit the competition”
“all my patients are too complex for this”
“what about the liability”
60
70
80
90
100
ACC GAP Program: Use of Tools ACC GAP Program: Use of Tools was Extremely Variablewas Extremely Variable
nt
Standing Orders
Discharge Tool
0
10
20
30
40
50
Rate of Standing Order and Discharge Tool Use by Hospital
Perc
en
Riba AL et al. American College of Card ology (ACC) acute myocardial infarc ion guidelines applied n practice Southern Michigan Expansion Project a model of collaborati e qual ty. Eur Heart J 2003 2 58
Key Elements to Quality ImprovementKey Elements to Quality Improvement
Access to current and accurate data on treatment and outcomes
Physician champion, support among clinicians
Why Do Some Hospitals Succeed?
Have stated goals
Administrative support
Use of pre-printed orders, care maps
Use of data to provide feedback
Bradley JAMA 2001;285:2604-2611
20
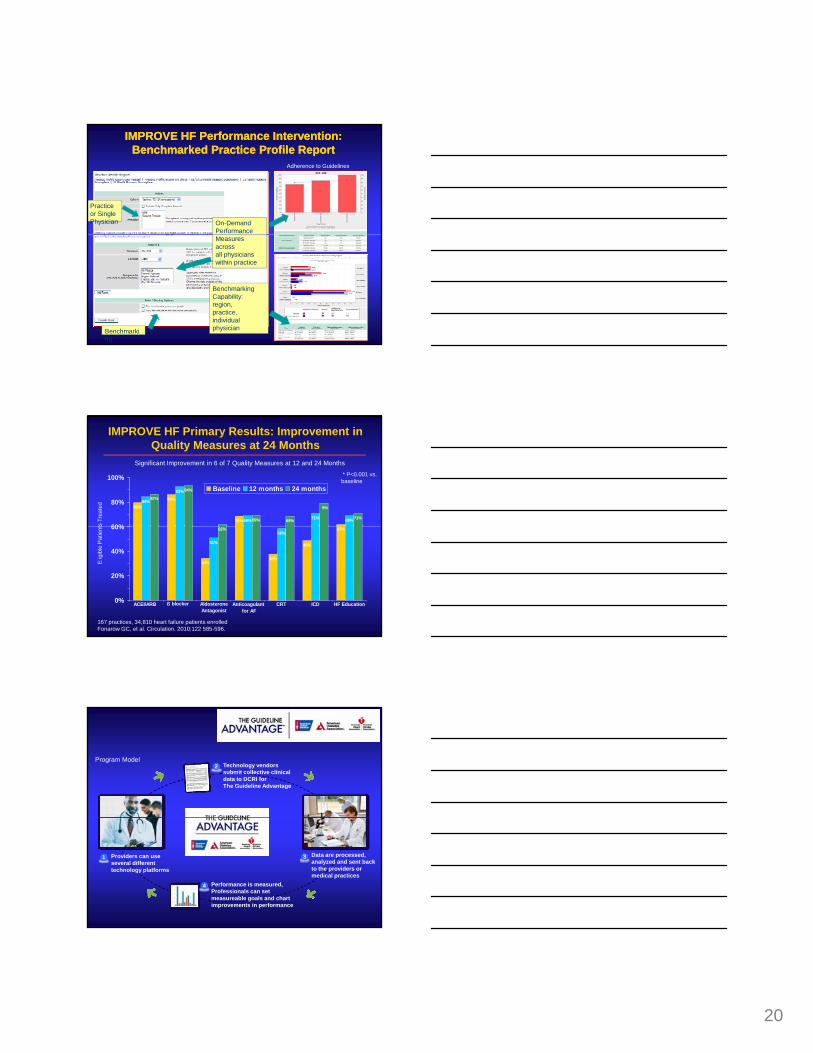
IMPROVE HF Performance Intervention:IMPROVE HF Performance Intervention:Benchmarked Practice Profile ReportBenchmarked Practice Profile Report
On-DemandPerformance
Practice or Single Physician
Adherence to Guidelines
Benchmarking
Measures across all physicians within practice
Benchmarking Capability:region,practice, individual physician
IMPROVE HF Primary Results: Improvement in Quality Measures at 24 Months
80%
86%
69%
84%
93%
69% 71% 69%
87%
94%
69% 69%
9%
71%
60%
80%
100%Baseline 12 months 24 months
ts T
reat
ed
* P<0.001 vs. baseline
Significant Improvement in 6 of 7 Quality Measures at 12 and 24 Months
34%38%
49%
62%
51%
58%62%
0%
20%
40%
60%
ACEI/ARB ß blocker Aldosterone Antagonist
Anticoagulant for AF
CRT ICD HF Education
Eig
ible
Pat
ient
167 practices, 34,810 heart failure patients enrolledFonarow GC, et al. Circulation. 2010;122 585-596.
Technology vendors submit collective clinical data to DCRI for The Guideline Advantage
2Program Model
Providers can use several different technology platforms
Data are processed, analyzed and sent back to the providers or medical practices
1 3
Performance is measured, Professionals can set measureable goals and chart improvements in performance
4
21
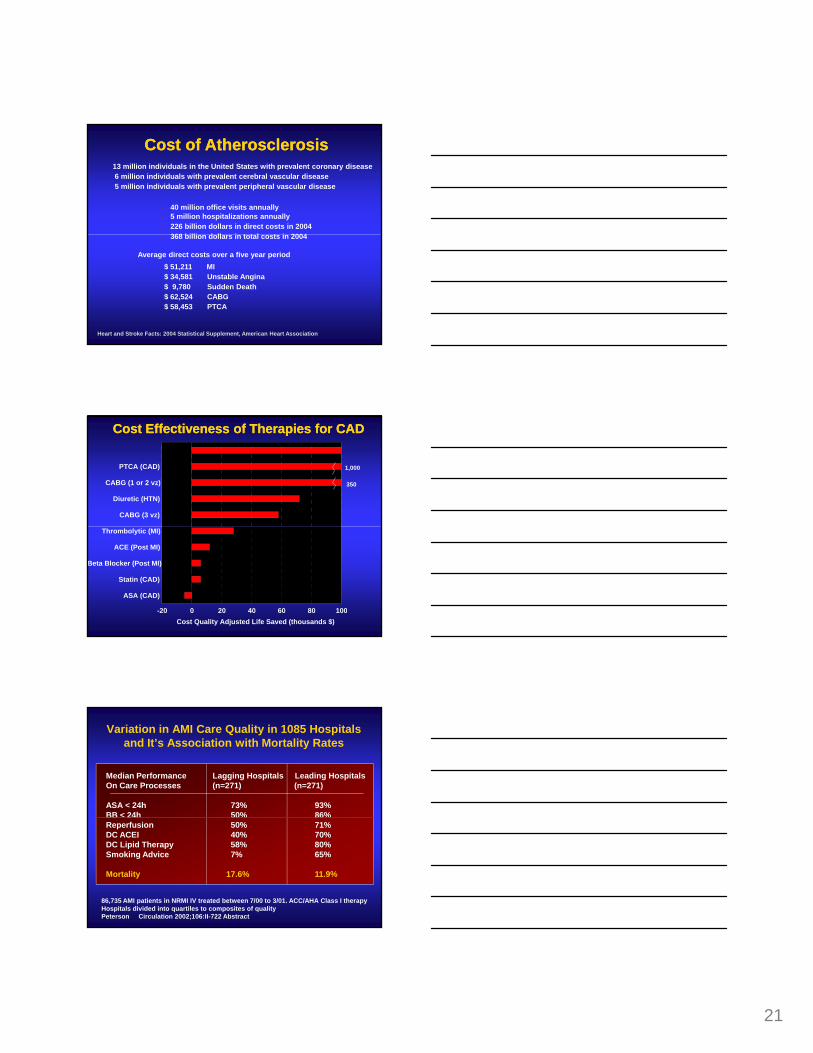
13 million individuals in the United States with prevalent coronary disease6 million individuals with prevalent cerebral vascular disease5 million individuals with prevalent peripheral vascular disease
40 million office visits annually5 million hospitalizations annually226 billion dollars in direct costs in 2004368 billi d ll i t t l t i 2004
Cost of AtherosclerosisCost of Atherosclerosis
368 billion dollars in total costs in 2004
Average direct costs over a five year period $ 51,211 MI$ 34,581 Unstable Angina$ 9,780 Sudden Death$ 62,524 CABG$ 58,453 PTCA
Heart and Stroke Facts: 2004 Statistical Supplement, American Heart Association
PTCA (CAD)
CABG (1 or 2 vz)
Diuretic (HTN)
CABG (3 vz)
Cost Effectiveness of Therapies for CADCost Effectiveness of Therapies for CAD
350
1,000
Thrombolytic (MI)
ACE (Post MI)
Beta Blocker (Post MI)
Statin (CAD)
ASA (CAD)
0 20 40 60 80 100-20Cost Quality Adjusted Life Saved (thousands $)
Variation in AMI Care Quality in 1085 Hospitals and It’s Association with Mortality Rates
Median Performance Lagging Hospitals Leading HospitalsOn Care Processes (n=271) (n=271)
ASA < 24h 73% 93%BB < 24h 50% 86%50% 86%Reperfusion 50% 71%DC ACEI 40% 70%DC Lipid Therapy 58% 80%Smoking Advice 7% 65%
Mortality 17.6% 11.9%
86,735 AMI patients in NRMI IV treated between 7/00 to 3/01. ACC/AHA Class I therapyHospitals divided into quartiles to composites of qualityPeterson Circulation 2002;106:II-722 Abstract
22
4567
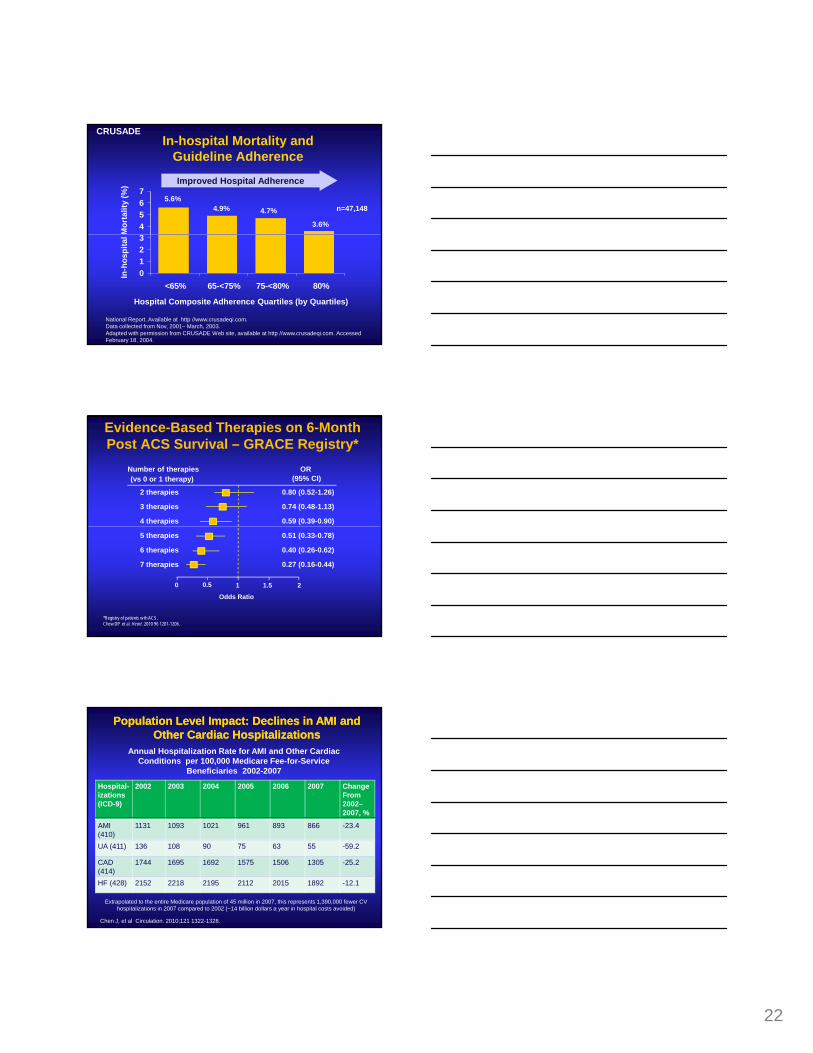
In-hospital Mortality and Guideline Adherence
5.6%4.9% 4.7%
3.6%
n=47,148
Mor
talit
y (%
) Improved Hospital Adherence
CRUSADE
0123
<65% 65-<75% 75-<80% 80%
National Report. Available at http //www.crusadeqi.com. Data collected from Nov, 2001– March, 2003.Adapted with permission from CRUSADE Web site, available at http //www.crusadeqi.com. Accessed February 18, 2004.
In-h
ospi
tal
Hospital Composite Adherence Quartiles (by Quartiles)
Evidence-Based Therapies on 6-Month Post ACS Survival – GRACE Registry*
Number of therapies(vs 0 or 1 therapy)
2 therapies
3 therapies
4 therapies
OR(95% CI)
0.80 (0.52-1.26)
0.74 (0.48-1.13)
0.59 (0.39-0.90)
*Registry of patients w th ACS.Chew DP et al. Heart. 2010 96 1201-1206.
5 therapies
6 therapies
7 therapies
0.51 (0.33-0.78)
0.40 (0.26-0.62)
0.27 (0.16-0.44)
0 0.5 1 1.5 2
Odds Ratio
Annual Hospitalization Rate for AMI and Other Cardiac Conditions per 100,000 Medicare Fee-for-Service
Beneficiaries 2002-2007
Hospital-izations(ICD-9)
2002 2003 2004 2005 2006 2007 Change From2002–2007, %
Population Level Impact: Declines in AMI and Population Level Impact: Declines in AMI and Other Cardiac HospitalizationsOther Cardiac Hospitalizations
AMI (410)
1131 1093 1021 961 893 866 -23.4
UA (411) 136 108 90 75 63 55 -59.2
CAD (414)
1744 1695 1692 1575 1506 1305 -25.2
HF (428) 2152 2218 2195 2112 2015 1892 -12.1
Chen J, et al Circulation. 2010;121 1322-1328.
Extrapolated to the entire Medicare population of 45 million in 2007, this represents 1,390,000 fewer CV hospitalizations in 2007 compared to 2002 (~14 billion dollars a year in hospital costs avoided)
23
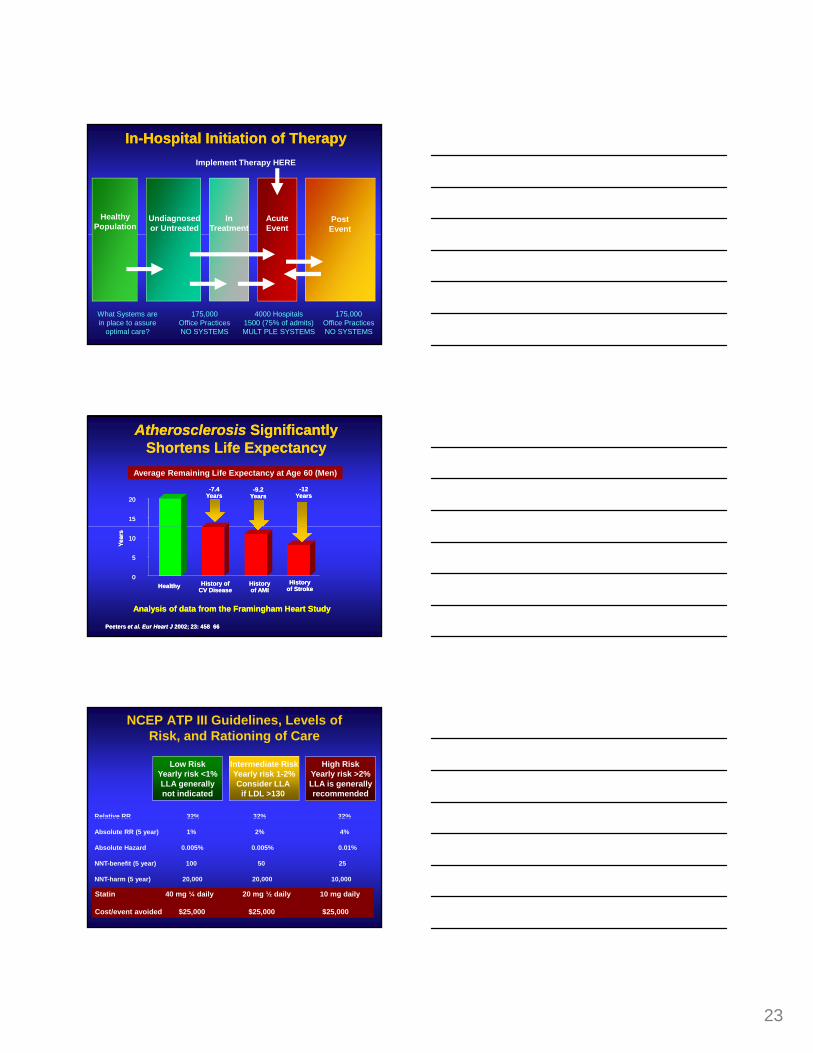
InIn--Hospital Initiation of TherapyHospital Initiation of Therapy
HealthyPopulation
Undiagnosedor Untreated
InTreatment
AcuteEvent
PostEvent
Implement Therapy HERE
175,000Office PracticesNO SYSTEMS
4000 Hospitals1500 (75% of admits)MULT PLE SYSTEMS
What Systems are in place to assure
optimal care?
175,000Office PracticesNO SYSTEMS
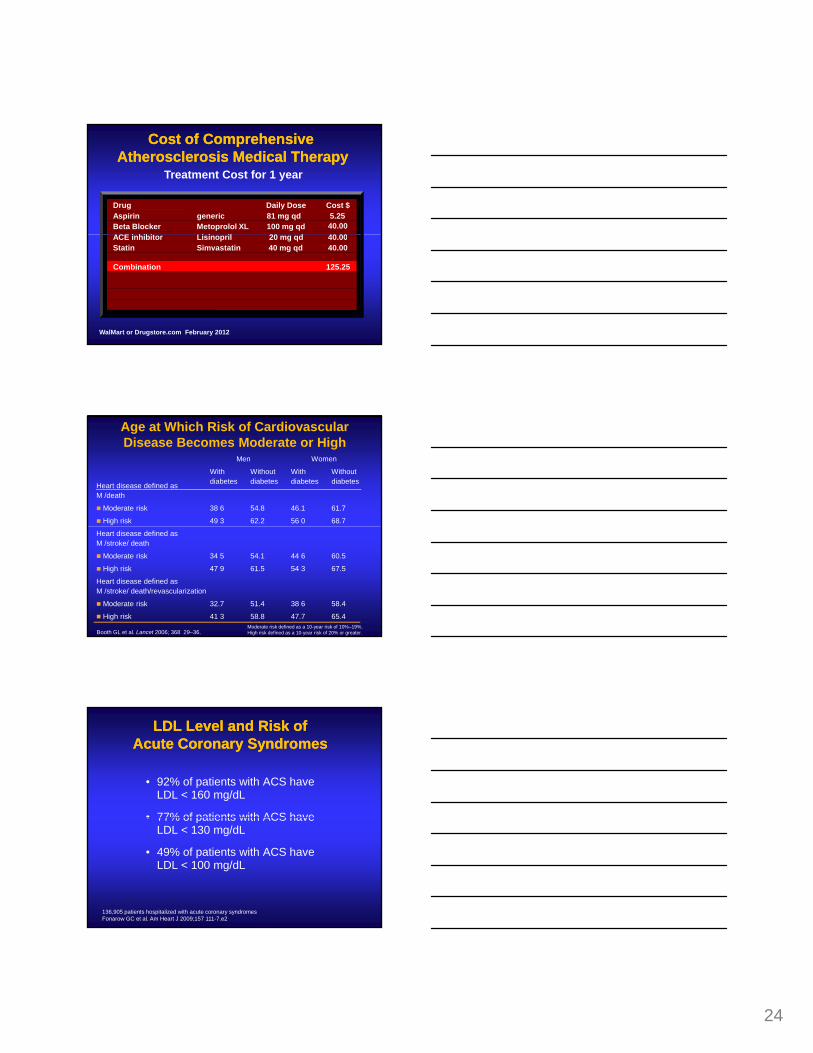
Atherosclerosis Atherosclerosis Significantly Significantly Shortens Life ExpectancyShortens Life Expectancy
Average Remaining Life Expectancy at Age 60 (Men)
1515
2020-9.2
Years-9.2
Years-7.4
Years-7.4
Years-12
Years-12
Years
Analysis of data from the Framingham Heart StudyAnalysis of data from the Framingham Heart Study
HealthyHealthy History ofCV DiseaseHistory of
CV DiseaseHistory of AMIHistory of AMI
History of StrokeHistory
of Stroke
Peeters et al. Eur Heart J 2002; 23: 458 66Peeters et al. Eur Heart J 2002; 23: 458 66
00
55
Year
sYe
ars
1010
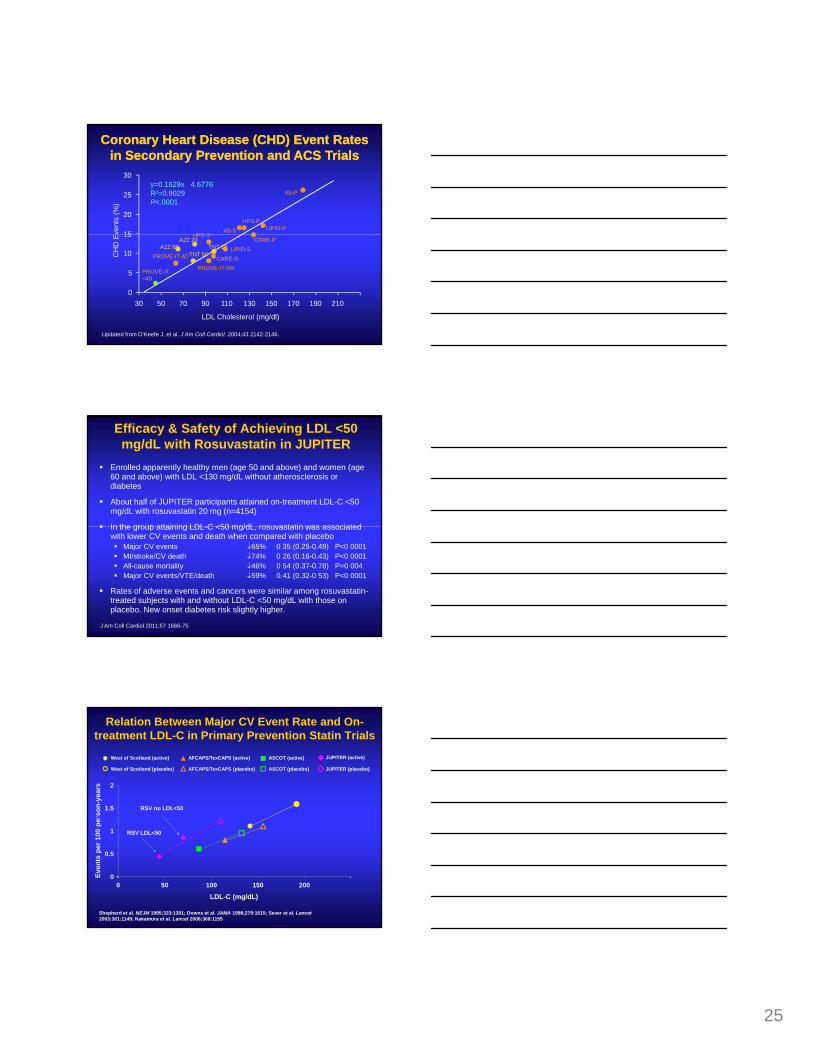
NCEP ATP III Guidelines, Levels of Risk, and Rationing of Care
Low RiskYearly risk <1%LLA generallynot indicated
Intermediate RiskYearly risk 1-2%Consider LLA
if LDL >130
High RiskYearly risk >2%LLA is generallyrecommended
Relative RR 32% 32% 32%Relative RR 32% 32% 32%
Absolute RR (5 year) 1% 2% 4%
Absolute Hazard 0.005% 0.005% 0.01%
NNT-benefit (5 year) 100 50 25
NNT-harm (5 year) 20,000 20,000 10,000
Statin 40 mg ¼ daily 20 mg ½ daily 10 mg daily
Cost/event avoided $25,000 $25,000 $25,000
24
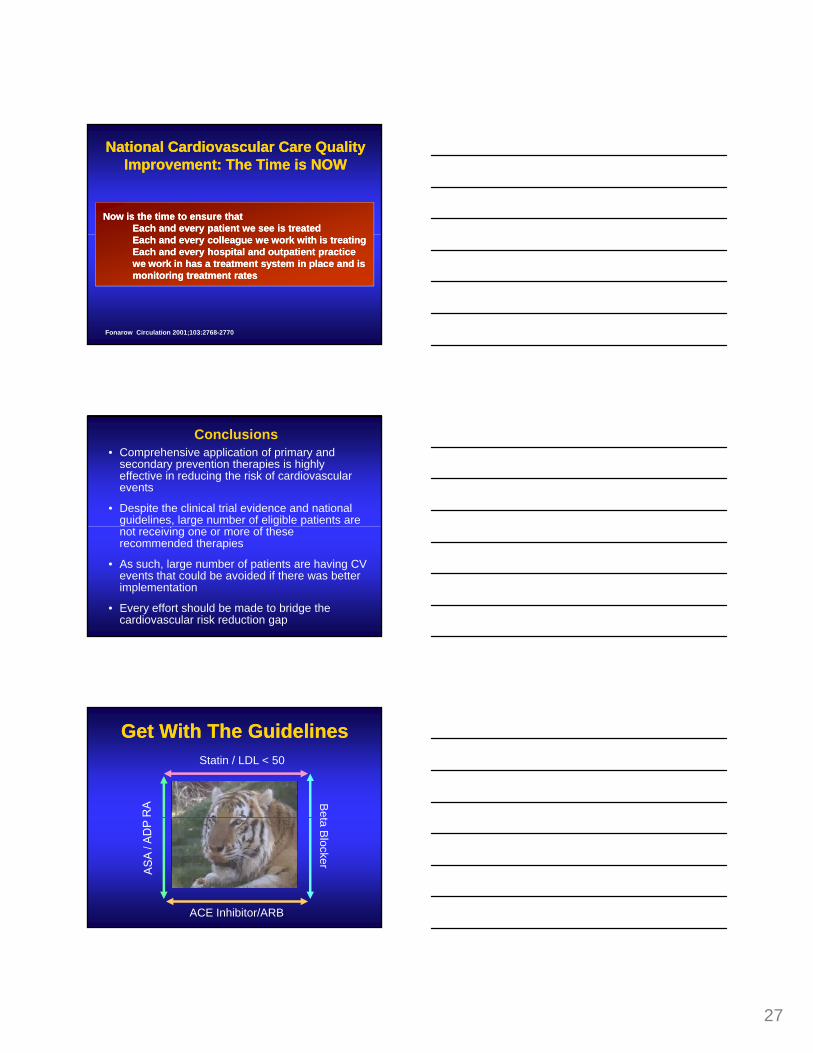
Drug Daily Dose Cost $Aspirin generic 81 mg qd 5.25Beta Blocker Metoprolol XL 100 mg qd 40.00
i hibit Li i il 20 d 40 00
Treatment Cost for 1 year
Cost of ComprehensiveCost of ComprehensiveAtherosclerosis Medical TherapyAtherosclerosis Medical Therapy
ACE inhibitor Lisinopril 20 mg qd 40.00Statin Simvastatin 40 mg qd 40.00
Combination 125.25
WalMart or Drugstore.com February 2012
Age at Which Risk of Cardiovascular Disease Becomes Moderate or High
Heart disease defined as M /death
Men Women
With diabetes
Without diabetes
With diabetes
Without diabetes
Moderate risk 38 6 54.8 46.1 61.7
High risk 49 3 62.2 56 0 68.7
Booth GL et al. Lancet 2006; 368 29–36.
Heart disease defined as M /stroke/ death
Moderate risk 34 5 54.1 44 6 60.5
High risk 47 9 61.5 54 3 67.5
Heart disease defined as M /stroke/ death/revascularization
Moderate risk 32.7 51.4 38 6 58.4
High risk 41 3 58.8 47.7 65.4Moderate risk defined as a 10-year risk of 10%–19%.High risk defined as a 10-year risk of 20% or greater.
LDL Level and Risk of LDL Level and Risk of Acute Acute Coronary SyndromesCoronary Syndromes
• 92% of patients with ACS have LDL < 160 mg/dL
• 77% of patients with ACS have• 77% of patients with ACS have LDL < 130 mg/dL
• 49% of patients with ACS have LDL < 100 mg/dL
136,905 patients hospitalized with acute coronary syndromesFonarow GC et al. Am Heart J 2009;157 111-7.e2
25
Coronary Heart Disease (CHD) Event Rates Coronary Heart Disease (CHD) Event Rates in Secondary Prevention and ACS Trialsin Secondary Prevention and ACS Trials
y=0.1629x 4.6776R²=0.9029P<.0001
vent
s (%
)
HPS S4S-S
HPS-PLIPID-P
4S-P
15
20
25
30
Updated from O’Keefe J, et al. J Am Coll Cardiol. 2004;43 2142-2146.
LDL Cholesterol (mg/dl)
CH
D E
PROVE-IT-PR
PROVE-IT-AT CARE-SLIPID-S
HPS-SCARE-P
0
5
10
15
30 50 70 90 110 130 150 170 190 210
TNT 80TNT 10A2Z 80
A2Z 20
PROVE-IT-<40
Efficacy & Safety of Achieving LDL <50 mg/dL with Rosuvastatin in JUPITER
Enrolled apparently healthy men (age 50 and above) and women (age 60 and above) with LDL <130 mg/dL without atherosclerosis or diabetes
About half of JUPITER participants attained on-treatment LDL-C <50 mg/dL with rosuvastatin 20 mg (n=4154)
In the group attaining LDL C <50 mg/dL rosuvastatin was associatedIn the group attaining LDL-C <50 mg/dL, rosuvastatin was associated with lower CV events and death when compared with placebo
Major CV events ↓65% 0 35 (0.25-0.49) P<0 0001MI/stroke/CV death ↓74% 0 26 (0.16-0.43) P<0 0001All-cause mortality ↓46% 0 54 (0.37-0.78) P=0 004Major CV events/VTE/death ↓59% 0.41 (0.32-0 53) P<0 0001
Rates of adverse events and cancers were similar among rosuvastatin-treated subjects with and without LDL-C <50 mg/dL with those on placebo. New onset diabetes risk slightly higher.
J Am Coll Cardiol 2011;57 1666-75
Relation Between Major CV Event Rate and On-treatment LDL-C in Primary Prevention Statin Trials
RSV no LDL<50
West of Scotland (active)
West of Scotland (placebo)
AFCAPS/TexCAPS (active)
AFCAPS/TexCAPS (placebo)
ASCOT (active)
ASCOT (placebo)
JUPITER (active)
JUPITER (placebo)
1.5
2
rson
-yea
rs
RSV LDL<50
Shepherd et al. NEJM 1995;333:1301; Downs et al. JAMA 1998;279:1615; Sever et al. Lancet2003;361:1149; Nakamura et al. Lancet 2006;368:1155
0
0.5
1
0 50 100 150 200
LDL-C (mg/dL)
Even
ts p
er 1
00 p
er

26
StatiStatins H ve Been Shown to Reduce CV Have Been Shown to Reduce CV Risk in All the Following Circumstances:Risk in All the Following Circumstances:
Older ageYounger ageMenWomenDiabetes
M l S
High LDLLow LDLHigh HDLLow HDLHigh Triglycerides
The Ultimate in Hi hl Personalized Medicine:M l S
HypertensionNo HypertensionObesityNo ObesityCurrent SmokingFormer SmokingNever SmokingCAD Family HistoryNo CAD Family History
Small Dense LDLLarge Buoyant LDLHigh CRPLow CRPHigh HomocysteineLow HomocysteineElevated Lp (a)Low Lp (a)
g yPerson + Statin Rx = Benefit
Primary Prevention CandidatesPrimary Prevention Candidatesfor for StatinStatin RxRx
Men Age 35 and Older
If LDL > 50 mg/dL and no contraindications
Women Age 45 and Older
Start earlier if:SmokerFamily HistoryHypertensionDiabetes or Metabolic Syndrome
Outcomes Events Avoided
PTCA/CABG 120,000
Hospitalizations 464,000
Potential Impact of GWTG on Cardiovascular Potential Impact of GWTG on Cardiovascular Patient Outcome in the United StatesPatient Outcome in the United States
Myocardial Infarction 216,000
Strokes 44,800
All Deaths 83,400
4S/LIPID/HOPE/Antiplatelet and Beta Blocker Meta-analysis and Bahit et al AHA 2000Fonarow Curr Atheroscler Rep. 2002;4:99-106
Annual events avoided if 90% compliance with asa, bb, ACEi, statins in patients with CAD
27
National Cardiovascular Care Quality National Cardiovascular Care Quality Improvement: The Time is NOWImprovement: The Time is NOW
Now is the time to ensure thatNow is the time to ensure thatEach and every patient we see is treatedEach and every patient we see is treatedEach and every colleague we work with is treatingEach and every colleague we work with is treatingEach and every hospital and outpatient practice Each and every hospital and outpatient practice we work in has a treatment system in place and is we work in has a treatment system in place and is monitoring treatment ratesmonitoring treatment rates
Fonarow Circulation 2001;103:2768-2770
Conclusions• Comprehensive application of primary and
secondary prevention therapies is highly effective in reducing the risk of cardiovascular events
• Despite the clinical trial evidence and national guidelines, large number of eligible patients are not receiving one or more of these recommended therapies
• As such, large number of patients are having CV events that could be avoided if there was better implementation
• Every effort should be made to bridge the cardiovascular risk reduction gap
Get With The GuidelinesGet With The GuidelinesStatin / LDL < 50
Bet
ACE Inhibitor/ARB
ta Blocker

28
Questions for the Group1. What further steps could you take to engage participating
health systems, hospitals, practices, health care providers, employers, and community leaders to incentive participation?
2. Are you sure you have the right process of care goals and metrics, as HEDIS measures are often out of date, omit key metrics, and may not be well linked to desired outcomes?
3. What more could you do to engage and incentivize individuals and families, to provide them benchmarked feedback on their cardiovascular health status, progress to goals, and maintenance of goals?