Embed Size (px)
Citation preview

Applying Lessons from Two Years of a Commercial ACO to a Medicare Shared
Savings Program
Lee B. Sacks, MD, CEO
Mark Shields MD, MBA, FACP, Senior Medical Director
AMGA 2013 Annual Conference
Orlando, FL
March 16,2013

Disclosure • Nothing in today’s presentation should be
construed as advising or encouraging any
person to deal, refuse to deal or threaten to
refuse to deal with any payer, or otherwise
interfere with commerce
• Opinions expressed by speakers are their own
2
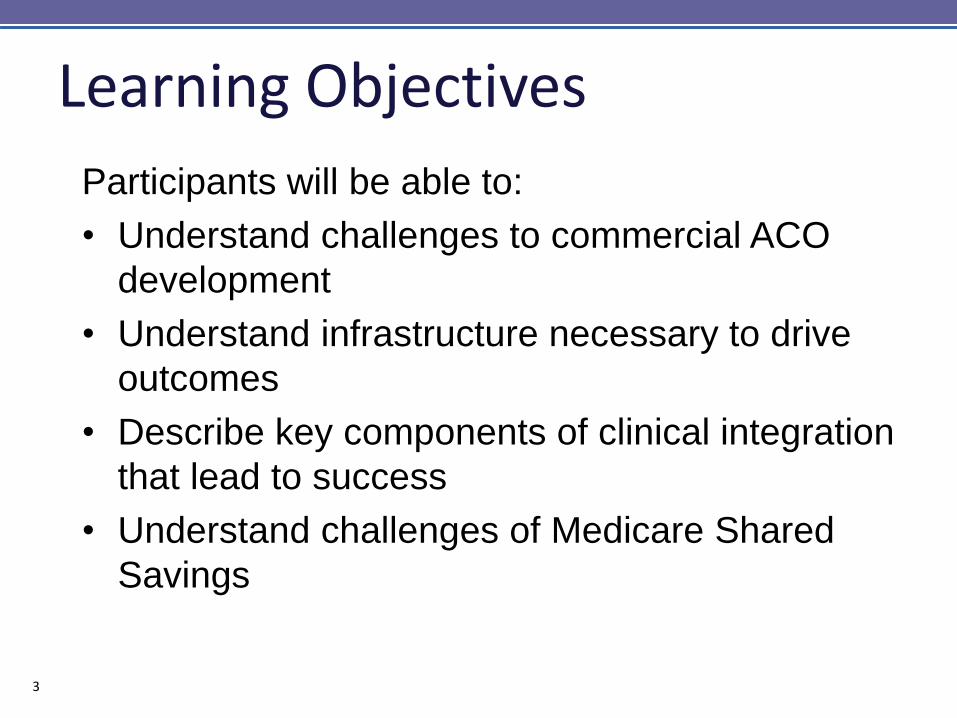
Learning Objectives
Participants will be able to:
• Understand challenges to commercial ACO
development
• Understand infrastructure necessary to drive
outcomes
• Describe key components of clinical integration
that lead to success
• Understand challenges of Medicare Shared
Savings
3

Presentation Topics • Organizational Overview
• Governance
• Infrastructure
• Commercial ACO
• Medicare Shared Savings Program
• Results
• Lessons Learned
4

• $4.9 Billion Annual Revenue • AA Rated • 11 Acute Care Hospitals
– 1 Children’s Hospital – 5 Level 1 Trauma Centers – 4 Major Teaching Hospitals – 4 Magnet Designations
• Over 250 Sites of Care – Advocate Medical Group – Dreyer Medical Clinic – Occupational Health – Imaging Centers – Immediate Care Centers – Surgery Centers – Home Health / Hospice
Advocate Health Care
5

6

Total Physicians on Medical Staffs = 6,007
Total APP Physicians = 3,974
Independent Non-APP = 2,033
Independent APP = 2,987 Employed /
Affiliated = 987
AMG (Employed) = 815
Advocate’s Physician Platform
7
Affiliated (Dreyer) = 172

Advocate Physician Partners
Vision To be a faith-based system providing the
best health outcomes and building lifelong relationships with those we serve.
Our Role
To drive improvement in health outcomes, care coordination and value creation through an
innovative and collaborative partnership with our physicians and the Advocate system.
8
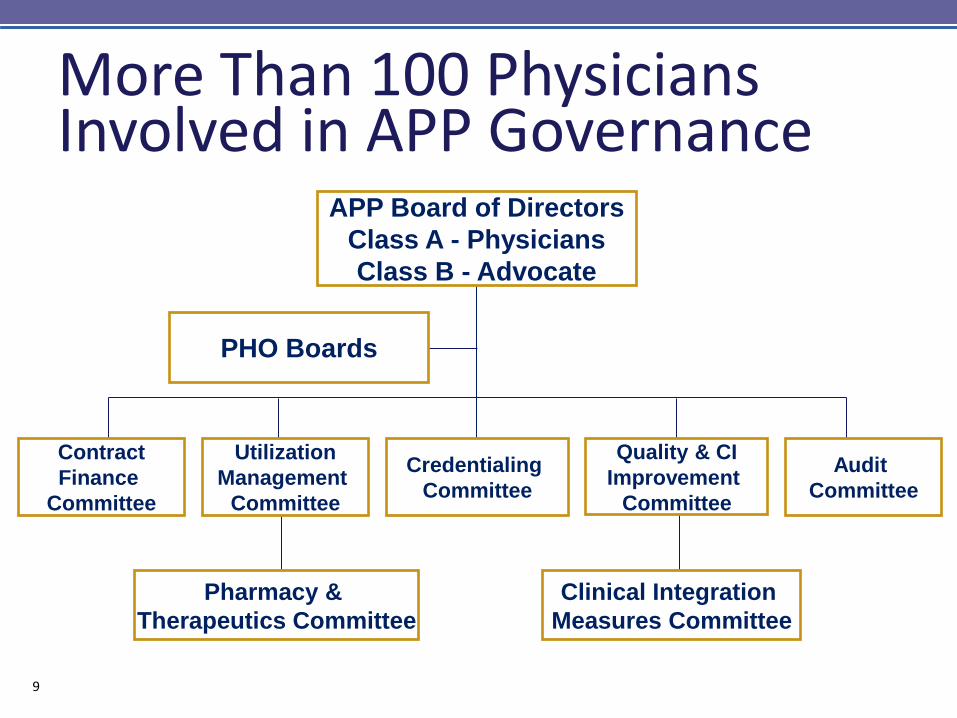
More Than 100 Physicians Involved in APP Governance
APP Board of Directors
Class A - Physicians
Class B - Advocate
Pharmacy &
Therapeutics Committee
Clinical Integration
Measures Committee
PHO Boards
Contract
Finance
Committee
Utilization
Management
Committee
Quality & CI
Improvement
Committee
Credentialing
Committee
Audit
Committee
9

Advocate Physician Partners
Driving improvement in health outcomes, care coordination and value
creation through an innovative and collaborative partnership with our physicians
and the Advocate system.
Condell PHO
Christ PHO
South Suburban
PHO
Trinity PHO
Illinois Masonic
PHO
Dreyer Medical
Clinic
Advocate Medical Group
BroMenn PHO
Good Shepherd
PHO
Lutheran General
PHO
Future Medical Group
Future PHO
Good Samaritan
PHO
10
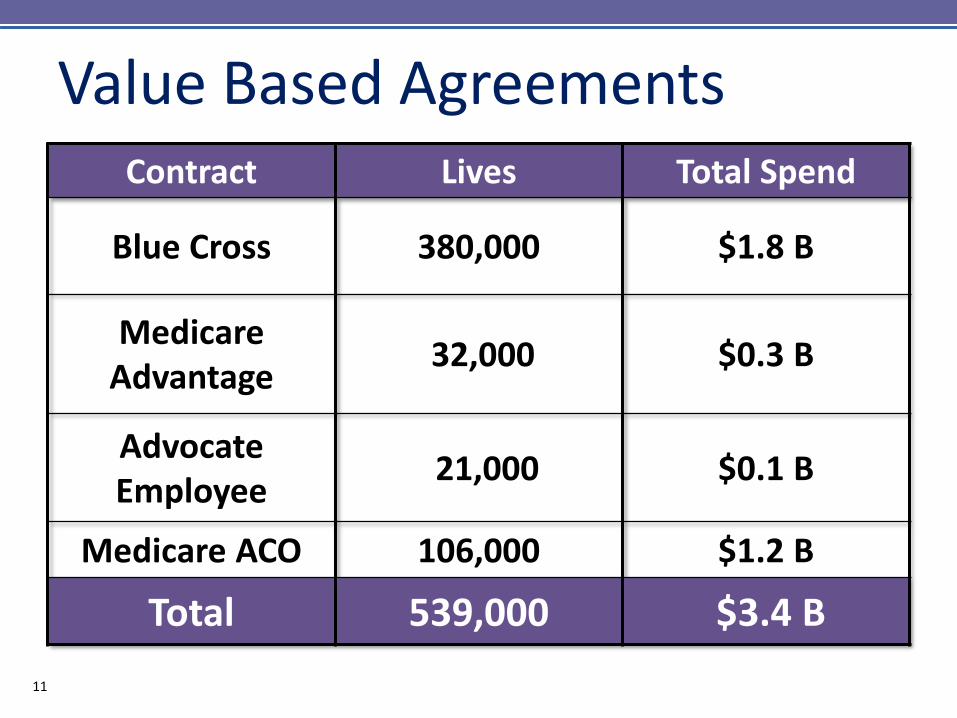
Value Based Agreements Contract Lives Total Spend
Blue Cross 380,000 $1.8 B
Medicare Advantage
32,000 $0.3 B
Advocate Employee
21,000 $0.1 B
Medicare ACO 106,000 $1.2 B
Total 539,000 $3.4 B
14 11
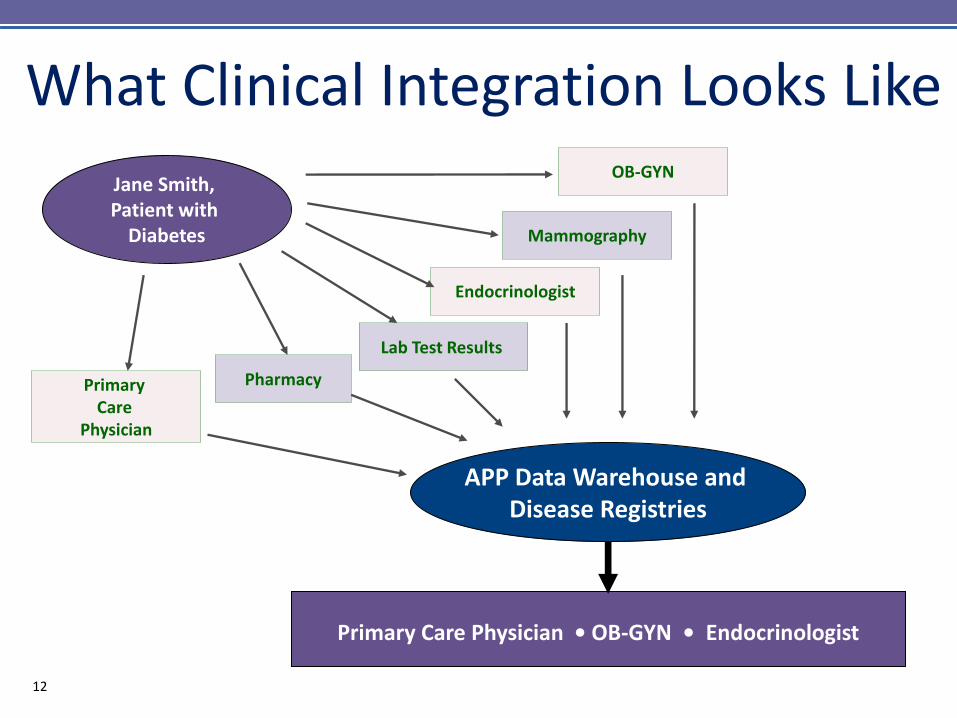
What Clinical Integration Looks Like
Primary
Care Physician
OB-GYN
Endocrinologist
Jane Smith, Patient with
Diabetes
APP Data Warehouse and Disease Registries
Pharmacy
Mammography
Lab Test Results
Primary Care Physician • OB-GYN • Endocrinologist
12
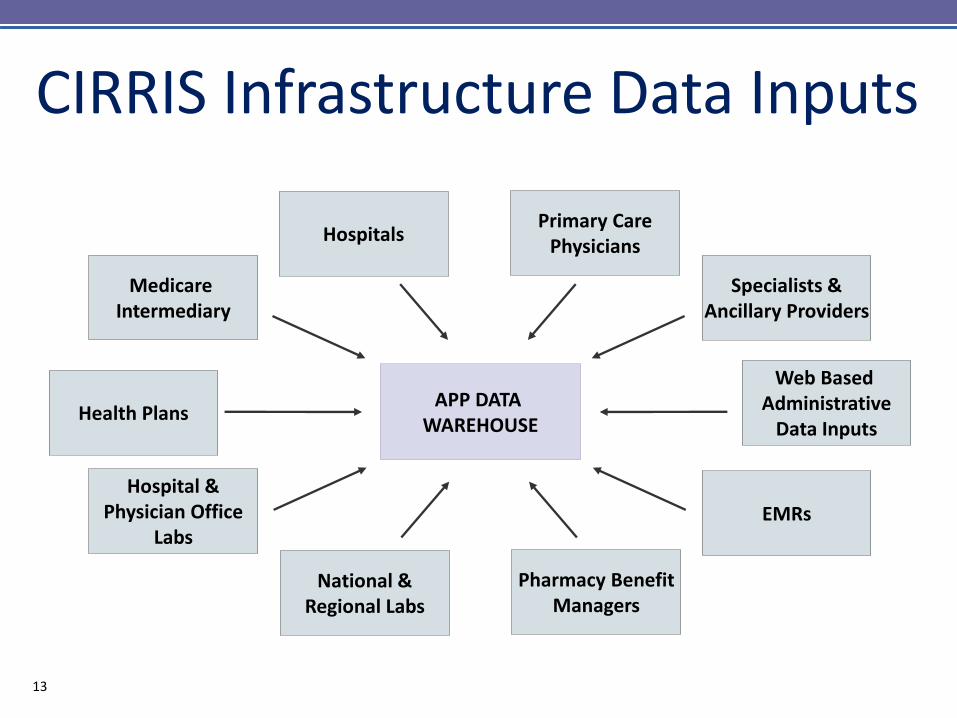
Health Plans
Web Based Administrative
Data Inputs
CIRRIS Infrastructure Data Inputs
APP DATA WAREHOUSE
Medicare Intermediary
Specialists & Ancillary Providers
Hospitals Primary Care
Physicians
Hospital & Physician Office
Labs EMRs
National & Regional Labs
Pharmacy Benefit Managers
13
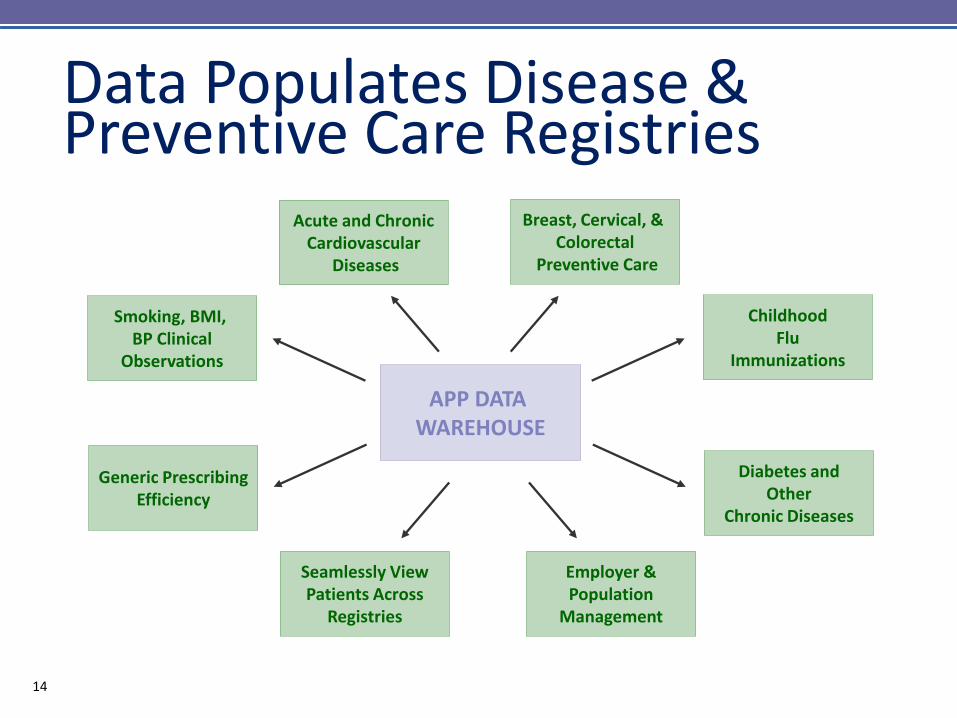
APP DATA WAREHOUSE
Smoking, BMI, BP Clinical
Observations
Childhood Flu
Immunizations
Acute and Chronic Cardiovascular
Diseases
Breast, Cervical, & Colorectal
Preventive Care
Generic Prescribing Efficiency
Diabetes and Other
Chronic Diseases
Seamlessly View Patients Across
Registries
Employer & Population
Management
Data Populates Disease & Preventive Care Registries
14

Information Technology • Inpatient-CareConnection
• Advocate Medical Group-CliniCare
• APP Independents-SynAPPs
• Advocate at Home
• Registries-CIRRIS
• Physician Portal
• Enterprise Data Warehouse
15

IT Solutions for Population Health Management
• IT Applications
– Risk stratification
– Care management
workflow and patient
documentation
– Web-based data
warehouse and reporting
16

Creating a Culture of Engaged Physicians
• Physician engagement in governance
• Physician leadership development
• Shared identity and values → “Membership”
• Infrastructure investment to enable success
• Appeal to pride and sense of excellence
– Recognition for quality and efficiency
– Consistent use of evidence-based medicine
– Power of the outcomes of the group
17

Clinical Integration 4.0: Increasing Physician/System Integration
Early Years:
2004 - 2006
Primary
Care/
Ambulatory
Measures Increasing
Specialist
Measures
Middle Years:
2007 - 2009
Maturing Years:
2010 - 2011
Increasing
Physician/
System
Integration
Clinical
Integration
to
Accountable
Care
Health Reform:
2012 -
18

Year
2004 High Speed Internet Access in Physician Offices
Centralized Longitudinal Registries
Electronic Referral Management Application/Clinical Decision Support for HMO
Access to Hospital, Lab and Diagnostic Test Information Through a Centralized
Clinical Data Repository (Care Net and Care Connection)
2005 Electronic Data Interchange (EDI)
2006 Computerized Physician Order Entry (CPOE)
Electronic Medical Record Roll Out in Employed Groups
2007 Electronic Intensive Care Unit (eICU) Use
2008 e-Prescribing
2009 Web-based Point of Care Integrated Registries (CIRRIS)
2010 e-Learning Physician Continuing Education
Electronic Medical Records Roll Out in Independent Practices
2011 Care Management Software Plus Analytics
2012 Electronic Referral Management Application/Clinical Decision Support for PPO
Advancing Technologies
19

Advancing Evidence-Based Medicine and Care
Year
2004 Physician Reminders for Care
Chart Based Patient Management
2006 Patient Outreach
2007 Physician Office Staff Training
Pharmacy Academic Detailing Program
Generic Voucher Program
2008 Diabetes Collaborative
Patient Coaching Program
Hospitalists
2009 Diabetes Wellness Clinics
Asthma and HF/CAD Collaborative
2011 Access and COPD Collaborative
2012 Patient Experience CME and Coaching
Practice Coaching (Data Sharing) 20
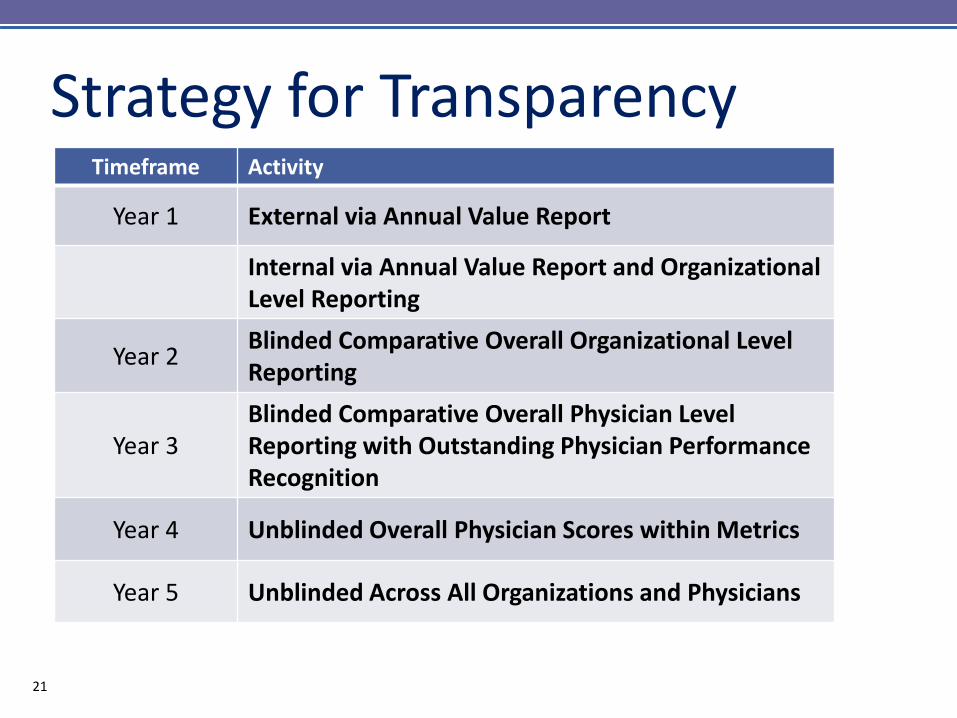
• Timeframe
Timeframe Activity
Year 1 External via Annual Value Report
Internal via Annual Value Report and Organizational Level Reporting
Year 2 Blinded Comparative Overall Organizational Level Reporting
Year 3 Blinded Comparative Overall Physician Level Reporting with Outstanding Physician Performance Recognition
Year 4 Unblinded Overall Physician Scores within Metrics
Year 5 Unblinded Across All Organizations and Physicians
Strategy for Transparency
21
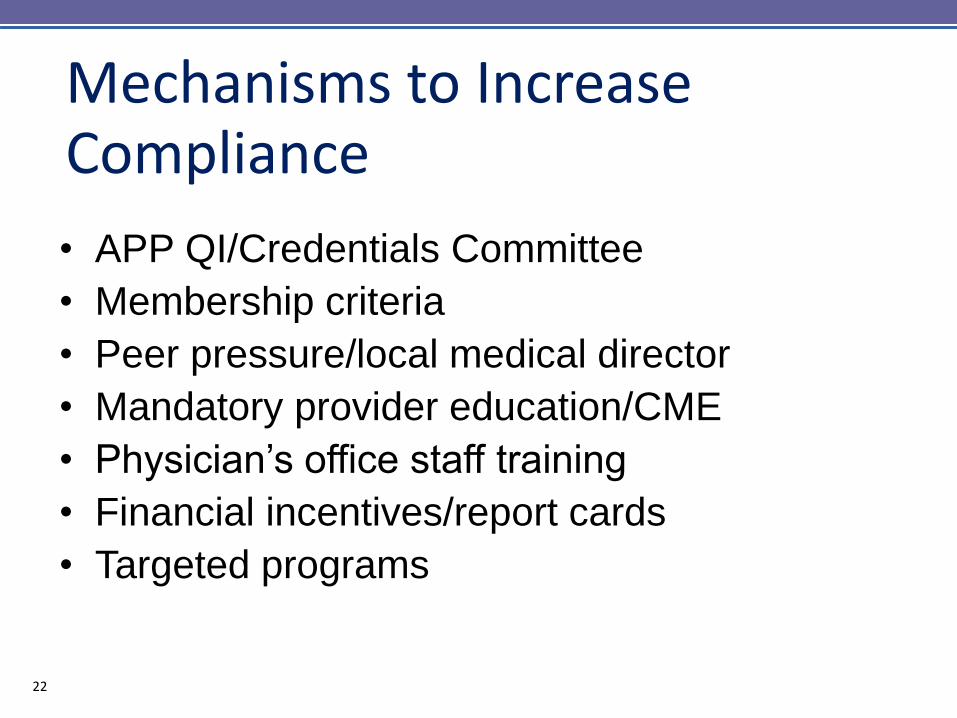
Mechanisms to Increase Compliance
• APP QI/Credentials Committee
• Membership criteria
• Peer pressure/local medical director
• Mandatory provider education/CME
• Physician’s office staff training
• Financial incentives/report cards
• Targeted programs
22

Initial Changes from CI to ACO • Enterprise Care
Management
• Population
Management IS
• Post Acute Programs
23

Outpatient Post Acute
Hospital to Home Transition Coach Program SNF Care Model Palliative Care
Dedicated Care Managers Multi Conditions Centers
Advanced Medical Practice Practice Operations Coaches
Data & Analytics Population Health Management
Acute Care
ED Care Coordination
Hospital ED
ED Care Coordination Optimization Alternative Site Of Care Transitions
Readmission RiskAssessment & Focused Interventions Inpatient Care Coordination Redesign
Acute To Post Acute Transitions
AdvocateCare Programs
Care Coordination
Inpatient Care Coordination
24

Decrease Number of Distribution Components as Part of CI Simplification
Distribution Components PCP Specialist
Traditional CI Y Y
Value Measures Y
Disease Registry Y Y
Inpatient Performance Y Y
In Network Surgical Coordination
Y
Distribution Components PCP Specialist
PCP CI Y
Specialist CI Y
• Future State
• Current State
25

2013 APP Incentive Design
Professional HMO
Surplus
Facility HMO
Surplus CI Funding
AdvocateCare Shared Savings
Minus Infrastructure Costs, Deficits and 120% Fee Schedule
PCP CI Value Pool
Specialist CI Value Pool
Hospital Value Pool
26

Change in Incentive Distribution
• Increase relationship between value
contribution and incentive distribution
– Continue transition from pay-for-performance
• Value contribution has several key
components
– CI Score
– Care coordination
– Number of patients managed
27

APP Primary Care Physicians
Residual Funds from Group/PHO Portion
Individual Opportunity (70%)
Individual Distribution
Distributed Based on
Individual CI Score
Tiers Based on Individual Physician CI & Care Coordination* Scores
Group/PHO Opportunity (30%)
Group/PHO Distribution
Distributed Based on Group/PHO CI
Score
Tier 1 PMPM Individual Physician Opportunity
(120% of Tier 2)
Tier 2 PMPM Individual Physician Opportunity
Tier 3 PMPM Individual Physician Opportunity
(80% of Tier 2)
Residual Funds Are Rolled Over Into General CI Fund and
Available for Distribution the Following Year
APP’s PCP Incentive Fund Design
Residual Funds from Individual Portion
Individual Physician Total
Distribution
+
=
=
= +
+
+
=
Care Coordination Includes Percent In-Network Admissions
and Care Management Engagement Factor
28

APP Specialist Physicians
Residual Funds from Group/PHO Portion
Individual Opportunity (70%)
Individual Distribution
Distributed Based on
Individual CI Score
Tiers Based on Unique AdvocateCare Patient for 5 Specialties* in 2013
Group/PHO Opportunity (30%)
Group/PHO Distribution
Distributed Based on Group/PHO CI
Score
Tier 1 Individual Physician Opportunity
(120% of Tier 2)
Tier 2 Individual Physician Opportunity
Tier 3 Individual Physician Opportunity (80% of Tier 2)
Residual Funds Are Rolled Over Into General CI Fund and
Available for Distribution the Following Year
APP’s Specialist Incentive Fund Design
Residual Funds from Individual Portion
Individual Physician Total
Distribution
+
=
=
= +
+
+
=
* 5 Tiered Specialties: OB/GYN, Cardiology, Orthopedic Surgery,
Hematology/Oncology and Hospitalists
29

Attributed Patient Cost Concentration Supports Care Management Model
Categories Person Years Predicted Expenditures
Number Percent Mean $ Percent
Very Low Risk 54,398 30.5% $ 784 3%
Low Risk 78,520 44.1% $ 4,054 22%
Moderate Risk 24,906 14.0% $ 11,517 20%
High Risk 16,056 9.0% $ 24,054 27%
Very High Risk 4,270 2.4% $ 91,062 27%
Total 178,149 100.0% $ 7,987 100%
30
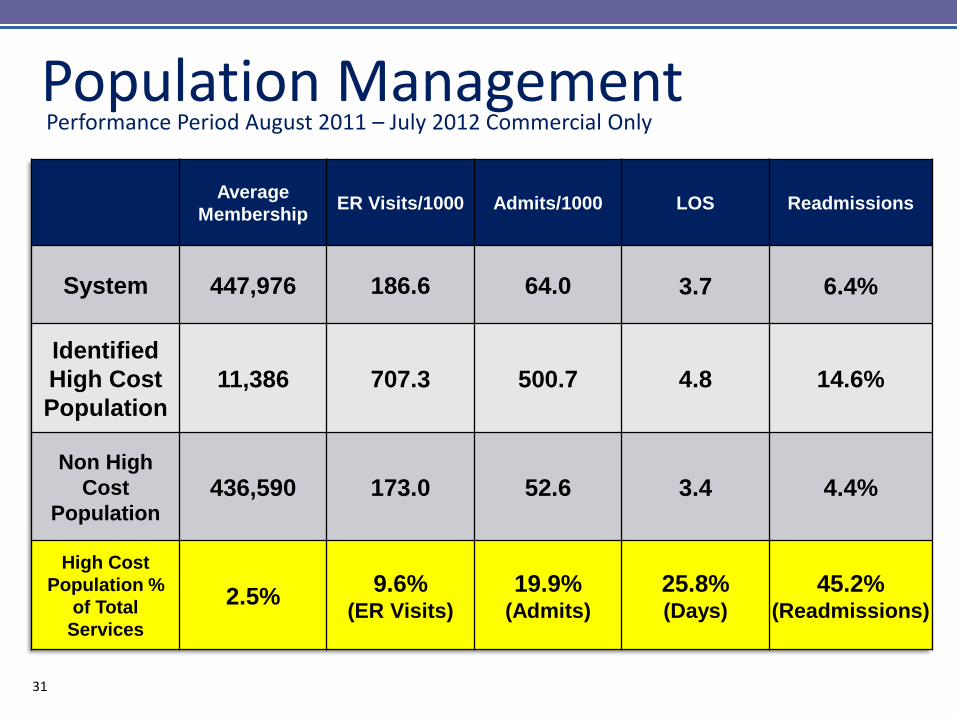
Population Management Performance Period August 2011 – July 2012 Commercial Only
Average
Membership ER Visits/1000 Admits/1000 LOS Readmissions
System 447,976 186.6 64.0 3.7 6.4%
Identified
High Cost
Population
11,386 707.3 500.7 4.8 14.6%
Non High
Cost
Population 436,590 173.0 52.6 3.4 4.4%
High Cost
Population %
of Total
Services
2.5% 9.6%
(ER Visits)
19.9% (Admits)
25.8% (Days)
45.2% (Readmissions)
31
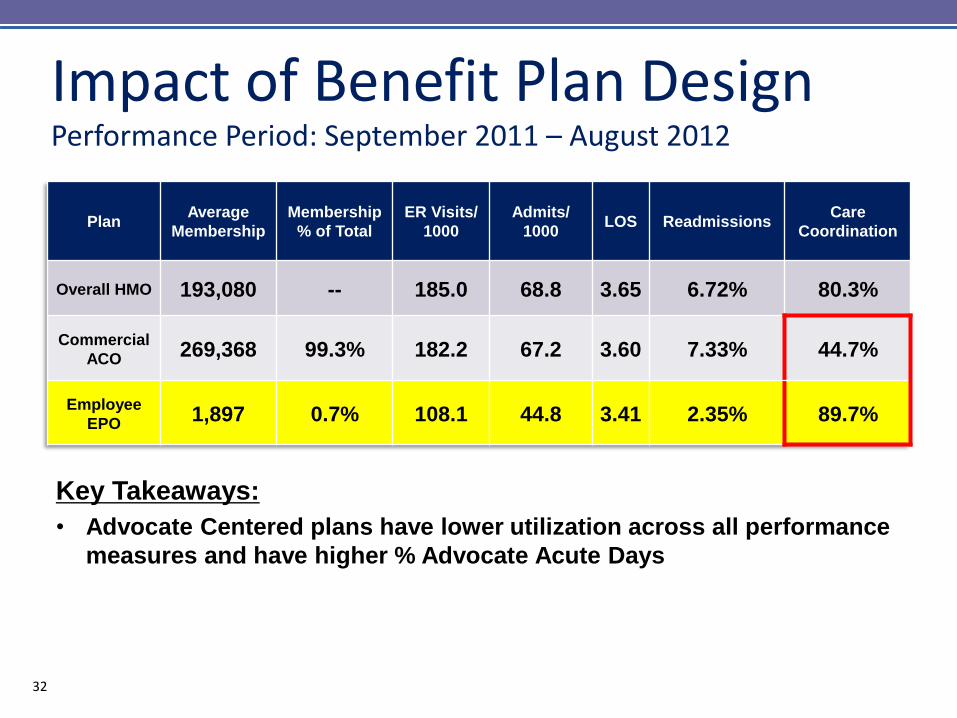
Impact of Benefit Plan Design Performance Period: September 2011 – August 2012
Plan Average
Membership
Membership
% of Total
ER Visits/
1000
Admits/
1000 LOS Readmissions
Care
Coordination
Overall HMO 193,080 -- 185.0 68.8 3.65 6.72% 80.3%
Commercial
ACO 269,368 99.3% 182.2 67.2 3.60 7.33% 44.7%
Employee
EPO 1,897 0.7% 108.1 44.8 3.41 2.35% 89.7%
Key Takeaways:
• Advocate Centered plans have lower utilization across all performance
measures and have higher % Advocate Acute Days
32

Changes Specific to MSSP
• Governance
• New physician participation agreements
• Operating without data
• Post acute grows in importance
• Palliative care
• Advance directives
33

2013 Measures Of Success AdvocateCare Index
• Length of stay
• Admits/1000
• ED Visits/1000
• 30 day readmissions
• % days in-network
20 34
Some Key Issues to Address • Improving PCP access
• Reducing avoidable admissions
• Intensive outpatient management
• Achieving “Hospitalism”
• Affecting “Perfect Transitions”
• Increasing alignment with independent
physicians
• Real time clinical decision support
35

Implications for Primary Care
• Renaissance of Primary Care
• Appropriate incentive structures
– Access/avoidance of ER
– Medical Home
– Managing ambulatory sensitive conditions
– Admission rates & LOS
– Readmissions
– Specialist & ancillary efficiency
• Greater alignment with single system
36

Implications for Specialists • Specialists are Integral to success
• Structures needed to unlock creativity
• “Pay for Work Done” will work for you
• Greater transparency around efficiency
• In-network care strategy will work for you
• Efficacious specialists will thrive
37

Implications for IDNs • Communicating a complex message
– Management & Physicians
• Building a climate of trust
• Ensuring physician access (both employed &
independent)
• Less volume from existing sources
• “Re-purposing” parts of the enterprise
– Business Development, Physician Relations, UM, Operations
Management
– Refocus on in-network care and marketing to physicians
– Hospitals re-energizing business development teams to sell
benefits of in-network care to physicians
– Partner with physicians to enhance care 38

Implementing ACOs: 10 Mistakes Singer and Shortell, JAMA, 8/9/11
Overestimate organization capabilities • Manage risk
• EHR
Failure to engage stakeholders • Balanced governance
• Engage patients
• Specialist selection
and engagement
Failure to recognize interdependencies
• Address all of above
39
• Performance Measures
• Implement Protocols
• Regulations/Legal
• Integrate Beyond Structures

BCBS PPO Jan-June2012 vs Jan-June 2011 Utilization Metrics (PPO) AdvocateCare Market
Inpatient Admit Rate (Admit Rate/1000)
(6.0%) (.3%)
Length of Stay (2.9%) .5%
Days/1000 (8.7%) .2%
Readmits 2.7% 3.8%
Outpatient ED Cases/1000 4.1% 4.4%
OP Surgery/1000 (1.4%) 1.9%
OP Other/1000 .4% 2.2%
Advance Imaging 2.7% 3.5%
Professional Office E&M/1000 (procedures/1000)
(2.9%) (1.4%)
Pharmacy Prescriptions/1000 (4.1%) (1.0%)
Prescription pmpm 1.8% 6.2%
40

Quality Improvement in ACO • With growth of Shared Savings and Full-Risk
Programs, thousands more patients tracked for
outcomes in 2011 and 2012
• Despite this, most outcomes improved or
maintained very high level of performance
• Reported data covers all APP patients in Clinical
Integration, Shared Savings and Risk Programs
41

Population Wellness Cancer Screening Measures
75%
79%
62%
67%
71%
78%
50%
60%
70%
80%
90%
100%
2010 YE Overall APP 2011 YE Overall APP 2012 YE Overall APP
% S
cree
ne
d
Mammography Screening (>= 50%)
Colorectal Cancer Screening (>= 45%)
Cervical Cancer Screening (>= 50%)
42

Diabetes Care Measures
71%
72%
61% 61%
62% 61% 61% 64%
85% 84%
87%
53%
56%
61%
50%
60%
70%
80%
90%
100%
2010 YE Overall APP 2011 YE Overall APP 2012 YE Overall APP
% o
f C
om
plia
nce
% HbA1c performed < 8 (>= 50%)
% of LDLs < 100 mg/dL (>= 49%)
% Annual Eye Examinations (>=50%)
Nephropathy Testing (>= 73%)
Hypertension Control <130/80mm/Hg (>= 36%)
43

Childhood Immunization
89%
83%
87%
50%
60%
70%
80%
90%
100%
2010 YE Overall APP 2011 YE Overall APP 2012 YE Overall APP
% Im
mu
niz
ed
ChildhoodImmunization(>= 80%)
44

Sequence of Impact • Quality metrics (6 months)
• LOS (first 6-12 months)
• In-network care (6-24 months)
• Readmissions (12-24 months)
• Admissions/1000 (12-24 months)
• Patient experience (18-36 months)
• ER visits/1000 (24-36 months)
45

Lessons Learned • Commercial PPO and Medicare lack benefit plan
design to create alignment by patients with the
ACO
• Timely and accurate data is critical
• Communication to the caregivers, focused
messages and actionable items drive change
• Getting critical mass of “attributable” patients in
a practice and across a system is integral for
success
46
Lessons Learned con’t
• MSSP can facilitate getting past the “tipping
point” of critical mass
• A “locked cohort” of attributable commercial
patients will be easier to manage and drive
results
• Having same attribution logic across all payers
in market will facilitate adoption
• This is an evolution that takes time
47

Key Drivers
Culture
Governance
Infrastructure
Incentives
Transparency of Results
Feedback Loop
48

2012 Value Report
49
To download a copy of the 2012 Value Report, go to:
advocatehealth.com/valuereport (2013 Report will be available in April.)

QUESTIONS
50