Embed Size (px)
Citation preview

i
Applying “Real Time Grouting Control Method” in Sedimentary Rock with
Gotvand Dam Data
Jalaleddin Yaghoobi Rafi
Master of Science Thesis 10/04 Division of Soil and Rock Mechanics
Department of Civil and Architectural Engineering Royal Institute of Technology (KTH)
Stockholm, Sweden, 2010

ii
© Jalaleddin Yaghoobi Rafi 2010 Master of Science Thesis 10/04 Division of Soil and Rock Mechanics Royal Institute of Technology (KTH) ISSN 1652-599X
iii
Applying “Real Time Grouting Control Method” in Sedimentary Rock with Gotvand Dam Data Jalaleddin Yaghoobi Rafi
Graduate Student Infrastructure Engineering Division of Soil and Rock Mechanics School of Architecture and the Built Environment Royal Institute of Technology (KTH) SE- 100 44 Stockholm [email protected]
Abstract: “Real Time Grouting Control Method” is a pioneer idea in formulating grouting works which provides possibility for monitoring grouting process in real time to optimize it to performance and cost. Currently this theory has been tested with data from tunnels in Stockholm. In this report the effort is testing the validity of this method in a kind of geology which is situated in southwest of Iran. Data are taken from the Gotvand dam project which is under construction on Karoon River. To achieve this goal, Tests are performed in Stockholm by using the cement collected from the dam site to obtain rheological and penetrability properties of the grout mix which is in use in Gotvand project. Pressure and flow values are recorded in during grouting and have been employed as input data in this report. By developing a proper application, results have been analysed and discussed in detail. It has been shown that in studied cases the theory can provide promising results and this method is applicable in this project although there is a need for site investigation and testing different kind of grout mixes to precise results and be able to drive a general conclusion. KEY WORDS: Grouting; Real Time Grouting Control Method; Fracture aperture; Penetration Length; Cement; Rheology test, filtration, Jacking.

iv

v
Preface This thesis is done at Royal Institute of Technology in Stockholm, Sweden in period of September 2009 to May 2010. Data and material have been collected during site visit in July 2009 and corresponding tests have been performed in corporation of KTH University and NCC Company laboratories in Stockholm in November 2009.
Acknowledgements
I would like to show my gratitude to Professor Håkan Stille, Head of Soil and Rock Mechanics Division in Royal Institute of Technology whose encouragement, guidance and support from the initial to the final level of this project enabled me to develop an understanding of the subject. It is an honour for me to perform this degree report in such a reputable department and in close relation with him who is one of the most well known scientists in this filed
I would like to thank Dr. Dariush Mahjoob, head of Gotvand dam project in Iran Water and Power Development Company, who provided the chance of site visit and coordinated meetings and permissions. Also thanks to Mr. Hassan Nazary, Designer of grouting works of Gotvand Project in Mahab Ghods Company, who accepted to act as advisor of this project and supplied required information and data.
Special thanks to Almir Draganovic for his kind assistance and supervision in performing tests and also to Mehdi Bagheri for his guidelines and support during the project.
And finally, thanks to my family for always being there for me.
vi
List of Symbols
bmin Minimum aperture
bcritical Critical aperture
bmax Maximum penetration
D95 Cement Grain Size indicator
ID Relative grout penetration
Imax Maximum penetration
Q Flow
tD Relative grouting time
t0 Characteristic grouting time
VD Relative grout volume
µ Viscosity
τ0 Shear stress
vii
Table of contents
1 Introduction 1.1 Background.....................................................................................................1 1.2 Stop criteria and real time grouting control method.......................................2 1.3 Objective, Principles and Limitations.............................................................3
2 Theory
2.1 History.............................................................................................................5 2.2 Penetration-Time relation................................................................................5 2.3 Dimensionality................................................................................................7 2.4 Injected volume and flow..............................................................................10 2.5 Changes in grouting pressure........................................................................11
3 Testing of cement base grout mix properties
3.1 Objective and Principles...............................................................................13 3.2 Penetrability Meter Test................................................................................13 3.3 Viscosity and Shear Stress............................................................................16
3.3.1 Marsh Cone Test..................................................................................16 3.3.2 Rheometer Test....................................................................................17
3.4 Results and Discussion.................................................................................19 .
4 Dam specifications and geology 4.1 Gotvand Dam................................................................................................25 4.2 Technical specifications................................................................................25 4.3 Geology of region.........................................................................................26 4.4 Requirements and Design.............................................................................29
5 Application of Real Time Grouting Control Method
5.1 Explanation and discussion...........................................................................31 5.2 Experience from different histories...............................................................33
5.2.1 Input data..............................................................................................34 5.2.2 Determination of dimensionality..........................................................34 5.2.3 Penetration length limits.......................................................................35 5.2.4 Prediction..............................................................................................36 5.2.5 Examination of 2D case........................................................................38
5.3 Borehole DP49...............................................................................................43 5.3.1 Level 45-50m........................................................................................49 5.3.2 Level 50-55m........................................................................................53 5.3.3 Level 55-60m........................................................................................57 5.3.4 Summary of results...............................................................................75

viii
5.3.5 Optimizing the grouting work by changing the grout mix..................61 5.4 Benefits and limitations of application.........................................................67 5.5 Jacking..........................................................................................................72
6 Summary..............................................................................................................75
Appendix A: Graphs
Appendix B: Maps and Drawings
References
1
Introduction:
1.1 Background
Grout is a solution, suspension or emulsion in water which is hardening after a certain time and is injected into the ground in grouting process. The most commonly used grout which this report also dealing with is cement based grout which is essentially a mixture of cement and water. (Lombardi, 2003)
The purpose of grouting according to A.C. Houlsby (1990) can be summarized in reducing conductivity of the rock mass and strengthening the rock. Grout is injected to fill up the joints to stabilize the fractured rock or the soil mostly in tunnels and retaining walls. In this process, grout will flow into the fractures and joints of rock mass or through pores and voids of soil and after hardening can strengthen and stabilized the expected area. The other issue the grouting dealing with is preventing ingress of water and reducing conductivity. In water stopping purpose, the grout is mainly used in casting water resistance curtain under the dam to change the water flow rate. (Ken Weaver and Donald Bruce (2007))
Due to A.C. Houlsby (1990) in grouting process the first step is investigating geology and permeability situation which makes it possible to decide if the grouting is required or not. The grouting design which is mainly deciding about the material, hole pattern and grouting method is performed according to investigation data. Because of uncertainty in variation of geology and ground water level, deciding on the type of cement, water cement ratio, the required penetration length and injection pressure are great challenges. Houlsby describes the execution of grouting which is mainly consisting of drilling holes, water testing and grouting injection.
According to him the assessment and completion of grouting works are two important steps which have significant impact on performance of grouting as well as financial effects on the project. Examining the required penetration and performing destructive tests to check the strength and conductivity of the rock mass after grouting will assure the quality of grouting design and execution.
Different factors to consider as compilation of grouting work have been posed to optimize the grouting to performance and cost. In this report, new stop criteria which is introduced by “Real Time Grouting Control Method” (Stille et al 2009) has been examined and discussed.
2
1.2 Stop criteria and Real Time Grouting Control Method
Currently, in grouting projects, when no flow is recorded, it is considered as all of the fractures have been filled and the rock mass is sealed. According to Gustafson and Stille (2005) in order to make sure that the grout has penetrated far enough and has filled the fractures the grout flow Q has to be lower than a specific value at a certain injection over pressure ∆p. This fact is named stop pressure and used as grouting stop criterion. In order to decrease the risk for an uncontrolled spread of the grout and thus poor efficiency, the volume Vmax and grouting time tmax are maximized. (Gustafson, Stille, 2005). These stop criteria are determined from a judgement of best practise without a theoretical basis. To control the grouting process, Lombardi and Deere (1993) introduced the GIN value which in principle, is to stop grouting in a specific GIN value which is defined as the product of grout pressure and volume at zero flow.
Disadvantage of these stop criteria is lack of understanding in behaviour of grout and its penetration, which leads to unknown penetration length. Sometimes high pressure may induce new fractures or cause dilation in existing fractures which results in high and useless penetration length and wasting material. On the other hand lack of adequate penetration cause insufficient strength to resist the instability in rock mass.
According to Gustafson and Stille (2005) and Kobayashi and Stille (2008) “Real Time Grouting Control Method” is a theory to formulize grouting in order to predict the penetration and flow trend by employing the rheological and penetrability properties of the cement base grout mix such as viscosity and shear stress, fractures aperture and cement grain size and also the injection circumstances and adjustment such as pumping pressure, ground water pressure, borehole filling volume and injected grout volume as input data. Being able to calculate the grout penetration in real time, this theory makes it possible to set stop criteria for different fractures based on required penetration length.
By employing this theory, an online real time quality control mechanism can be achieved. Generating proper application and developing a mechanised tool based on this theory to install on batching machine make it possible to not only monitor the penetration and flow trend but also apply changes on mixture and pressure in real time to fulfil new demands according to changes during grouting.
3
Refer to Stille and Kobayashi (2008) grouting is completed when the grout penetration of smallest fracture to be sealed is above a certain minimum value (target value) or before the grout penetration for the largest fracture aperture reaches a certain maximum value (limiting value).
1.3 Objective, Principles and Limitations
Currently to verify the performance of this theory, different tests have been done through articles and thesis works in tunnelling projects which are under construction in Stockholm.
The objective of this thesis work is to study the performance of real time grouting control method by using the grouting data from Gotvand dam embankment walls which is situated in south west of Iran, also to verify the capacity and limitations of the theory in this geology and examine possibility of using this analytical solution in design and execution of grouting works in this studied case or in similar projects. This is the first try of this theory in geology other than Sweden.
As the first step, In July 2009, in request of water and power supply ministry of Iran, site visit in a group composed of employer and consultant representatives, also professor Håkan Stille performed in order to getting acquaintance with the dam position and geology of the area, also to visit grouting procedure and equipments and to recognize difficulties and problems in grouting process.
Collecting cement and data from the dam site, tests are held in Stockholm in cooperation with “NCC Co. laboratory” and KTH University to measure grout mix properties. The main concern was to determine penetrability properties of the grout mix as well as its rheological properties which are dealing with measuring shear stress and viscosity of Bingham fluid.
Furthermore based on the theory a spread sheet application developed to calculate the penetration length and predict grout flow. Analyzing of each case was possible by generating relevant graphs based on the results from the application. Afterwards, based on penetration length, stop criteria has been defined and efficiency of grouting work in each case has been discussed. Convergence of predicted and recorded flow has been examined to verify validity of application results.
4
Considering the distance of the project from the test spot, it was not possible to provide enough cement from the project and only two tests could be performed on two kinds of cement which are in use in Gotvand project. Also there were no chance to examine the mixes with different water cement ratio and therefore limited part of grouting work data with corresponding w/c ratio could be used in this report. Furthermore lack of enough recorded pressure and flow data of the region this study contribute to, limited the number of case studies. Hence the results of calculations are not presented as a design document and the approach is to examine the possibility of usage of the application in such condition and with the same materials and also discuss the effect of variation in mix recipe and grouting time in grouting works of this project.
Due to lack of proper internet connection in Iran, communication with project engineers to upgrade the information and justifying the existing data was one of the obstacles.
Figure 1. Site Visit
5
2. Theory
2.1 History
The Real Time Grouting Control method is to formulating grouting procedure to predict penetration length and grout flow trend. So the purpose is to monitor the grouting process in real time and find proper time due to suitable penetration length to stop grouting. By using this theory one can make sure that the grout has penetrated far enough and has filled the fractures.
In first efforts, M. Brantberger et al (2001) have tried to set up numerical calculation for prediction of grout spread. They concluded that if the aperture and spreading angel of grout mix are known, the grout spreading and the risk of lifting can be controlled. To solve the numerical approach in analytical solution, relative time and penetration defined by Kobayashi and Stille (2008) according to dimensionality of fractures. In next paragraphs of this chapter, this theory is explained in detail.
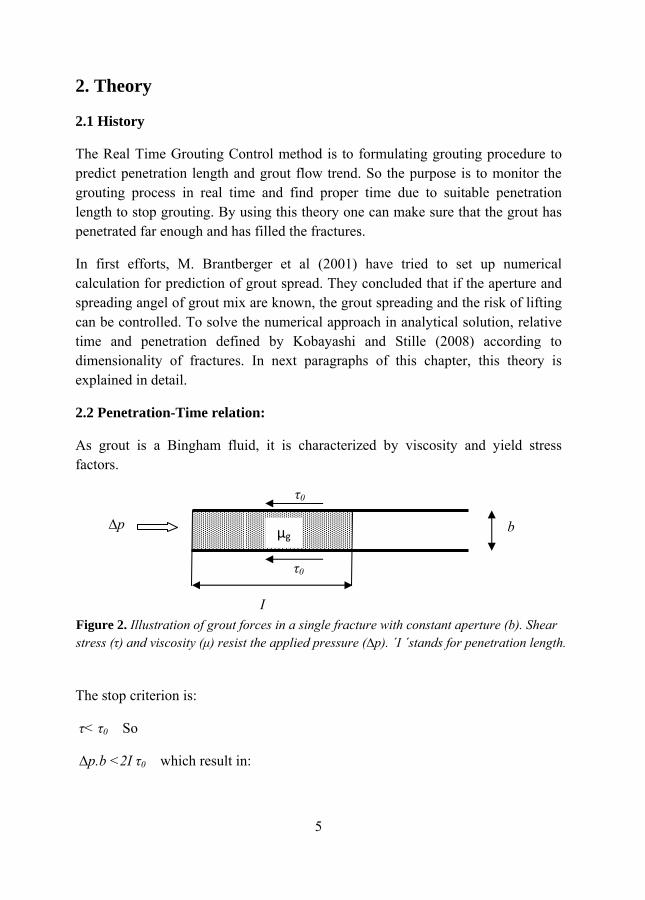
2.2 Penetration-Time relation:
As grout is a Bingham fluid, it is characterized by viscosity and yield stress factors.
The stop criterion is:
τ< τ0 So
∆p.b <2I τ0 which result in:
τ0
τ0
∆p b
I
μg
Figure 2. Illustration of grout forces in a single fracture with constant aperture (b). Shear stress (τ) and viscosity (μ) resist the applied pressure (∆p). ´I ´stands for penetration length.
Im
To(t0
t0=
tD=
ID=
Usdiman
bp⋅⎟⎟⎠
⎞⎜⎜⎝
⎛ Δ=
0max 2τ
o be able to for), relative grout
= 6∆p.μg/ τ02
= t/ t0
= I/Imax
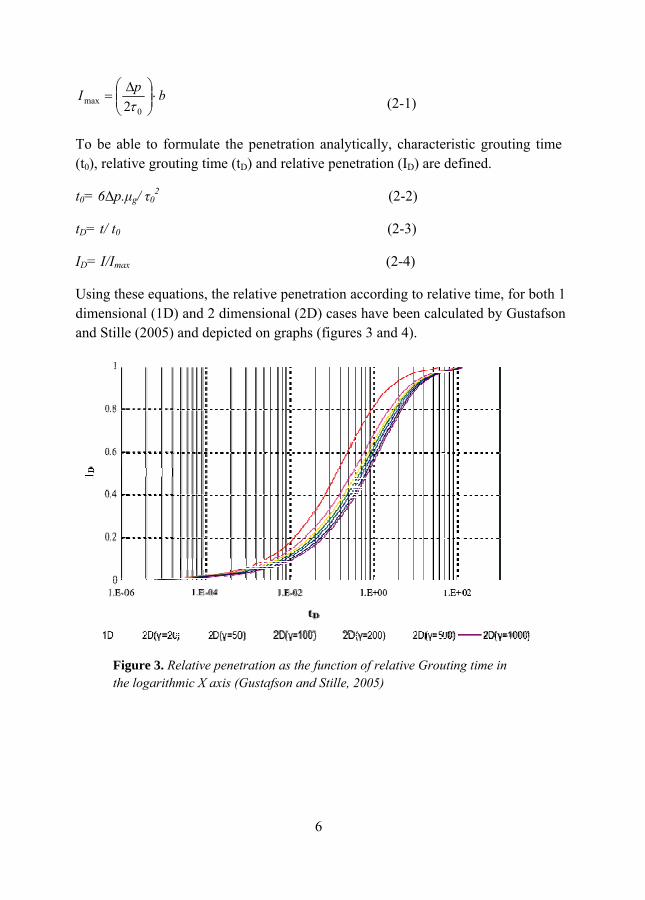
sing these equatmensional (1D)
nd Stille (2005)
Figure 3. Rethe logarithm
rmulate the penting time (tD) an
tions, the relativ) and 2 dimensioand depicted on
elative penetratiomic X axis (Gusta
6
netration analytnd relative pene
ve penetration aonal (2D) casesn graphs (figure
on as the functionafson and Stille, 2
tically, charactetration (ID) are
(2-2)
(2-3)
(2-4)
according to relas have been calces 3 and 4).
n of relative Grou2005)
(2-1)
eristic grouting defined.
ative time, for bculated by Gust
uting time in
time
both 1 tafson
*in
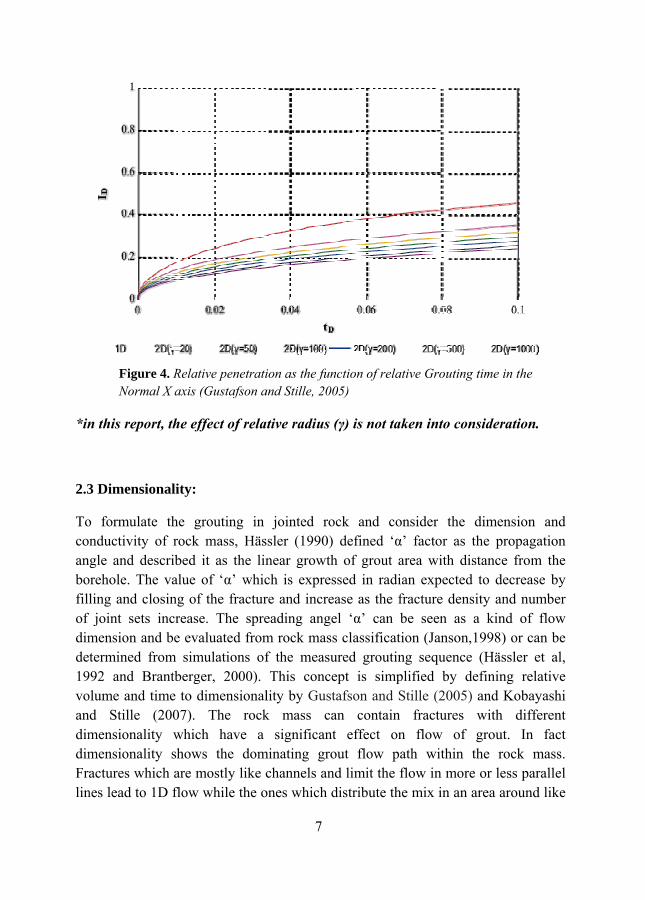
2.3
Tocoanbofilof dimde19voandimdimFrlin
n this report, th
3 Dimensionali
o formulate thnductivity of r
ngle and describorehole. The valing and closing
f joint sets incrmension and betermined from
992 and Brantbolume and time nd Stille (200mensionality wmensionality shactures which a
nes lead to 1D fl
Figure 4. RNormal X a
he effect of rela
ity:
he grouting in rock mass, Häsbed it as the linlue of ‘α’ whicg of the fracturrease. The spree evaluated from
simulations ofberger, 2000). to dimensional
07). The rockwhich have a hows the domare mostly like cflow while the o
Relative penetratiaxis (Gustafson a
7
tive radius (γ) i
jointed rock sler (1990) defnear growth ofch is expressedre and increase eading angel ‘αm rock mass claf the measuredThis concept
lity by Gustafsok mass can
significant efminating grout
channels and limones which distr
ion as the functioand Stille, 2005)
is not taken into
and consider fined ‘α’ factorf grout area witd in radian expe
as the fracture α’ can be seenassification (Jan
d grouting sequis simplified b
on and Stille (2contain fractu
ffect on flow flow path witmit the flow in ribute the mix in
on of relative Gro
o consideration
the dimensionr as the propagth distance fromected to decreadensity and nu
n as a kind of nson,1998) or cuence (Hässler by defining re
2005) and Kobaures with diff
of grout. In thin the rock mmore or less pan an area around
outing time in the
n.
n and gation m the se by
umber f flow an be et al, lative
ayashi ferent
fact mass.
arallel d like
8
a disc result in 2D flow. Three dimensional fractures have more complicated trend and happen in rock with higher porosity.
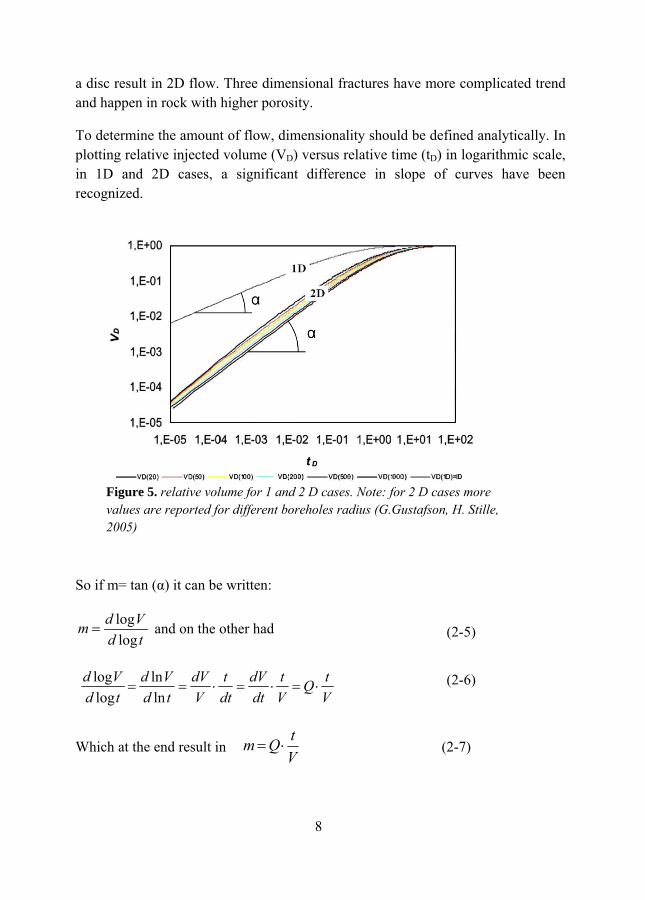
To determine the amount of flow, dimensionality should be defined analytically. In plotting relative injected volume (VD) versus relative time (tD) in logarithmic scale, in 1D and 2D cases, a significant difference in slope of curves have been recognized.
So if m= tan (α) it can be written:
tdVdm
loglog
= and on the other had
VtQ
Vt
dtdV
dtt
VdV
tdVd
tdVd
⋅=⋅=⋅==lnln
loglog
Which at the end result in VtQm ⋅= (2-7)
Figure 5. relative volume for 1 and 2 D cases. Note: for 2 D cases more values are reported for different boreholes radius (G.Gustafson, H. Stille, 2005)
(2-6)
(2-5)
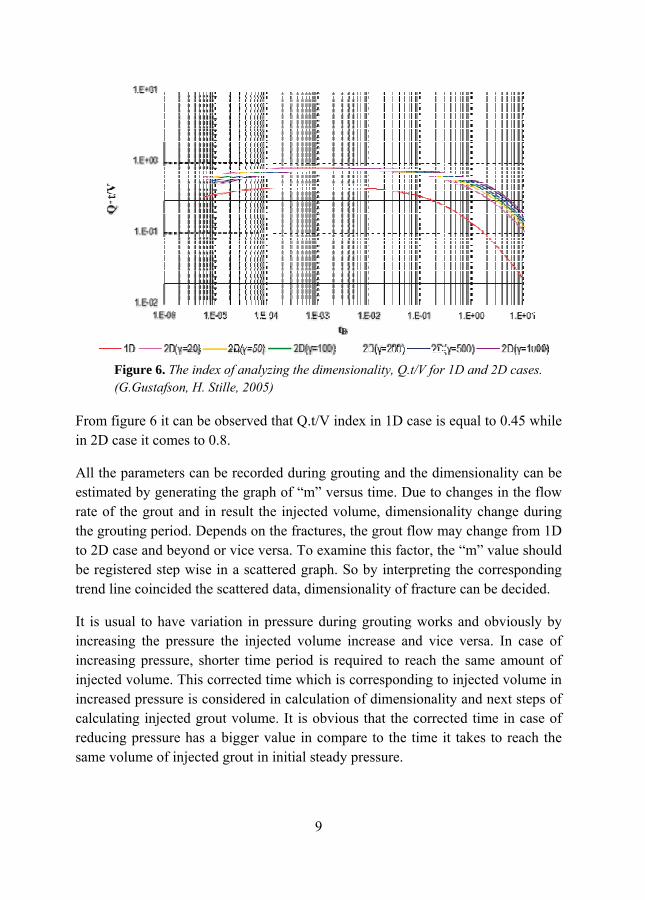
Frin
Alestrattheto betre
It incincinjinccalredsam
om figure 6 it c2D case it com
ll the parametertimated by genete of the grout e grouting perio2D case and be registered step
end line coincid
is usual to havcreasing the prcreasing pressujected volume. Tcreased pressurelculating injecteducing pressureme volume of in
Figure 6. Th(G.Gustafso
can be observedes to 0.8.
rs can be recorderating the grapand in result th
od. Depends on eyond or vice vep wise in a scated the scattered
ve variation in pressure the injeure, shorter timeThis corrected te is considered ed grout volume has a bigger vnjected grout in
he index of analyon, H. Stille, 2005
9
d that Q.t/V inde
ded during grouph of “m” versuhe injected voluthe fractures, th
ersa. To examinttered graph. Sod data, dimensio
pressure duringcted volume ine period is requtime which is cin calculation o
me. It is obviousvalue in compan initial steady p
yzing the dimensio5)
ex in 1D case is
uting and the dimus time. Due to ume, dimensionhe grout flow mne this factor, tho by interpretingonality of fractu
g grouting workncrease and vicuired to reach torresponding toof dimensionalis that the correc
are to the time ipressure.
onality, Q.t/V for
s equal to 0.45 w
mensionality cachanges in the
nality change dumay change fromhe “m” value shg the correspon
ure can be decid
ks and obviouslce versa. In casthe same amouno injected volumity and next stepcted time in casit takes to reach
r 1D and 2D case
while
an be flow
uring m 1D hould nding ed.
ly by se of nt of
me in ps of se of h the
es.
10
2.4 Injected Volume and Flow
Injected volume and grout flow for both 1D and 2D cases have been derived by Gustafson and Stille (2005) and are as below.
1D case:
2
0max 2
bwpIbwIIbwIV DD ⋅⋅⎟⎟⎠
⎞⎜⎜⎝
⎛ Δ⋅=⋅⋅⋅=⋅⋅=
τ
This can be calculated for several fractures as:
2
02bwpIV Dtot ∑ ⋅⋅⎟⎟
⎠
⎞⎜⎜⎝
⎛ Δ⋅=
τ
And the flow is calculated based on injected volume:
∑⋅⎟⎟⎠
⎞⎜⎜⎝
⎛ Δ⋅⋅== 2
00 21 wbptdt
dIdt
dVQD
Dtot
τ
2D case:
Volume injected into circular fracture with aperture b is:
32
0
22max
2
2)( bpIbIIbIV DD ⋅⎟⎟
⎠
⎞⎜⎜⎝
⎛ Δ⋅⋅=⋅⋅⋅=⋅⋅=
τπππ
And for several fractures:
∑⋅⎟⎟⎠
⎞⎜⎜⎝
⎛ Δ⋅⋅= 3
2
0
2
2bpIV Dtot τ
π
Based on injected volume, the flow in 2D case can be calculated:
∑⋅⎟⎟⎠
⎞⎜⎜⎝
⎛ Δ⋅⋅⋅⋅== 3
2
00 212 bptdt
dIIdt
dVQD
DD
tot
τπ
w
b
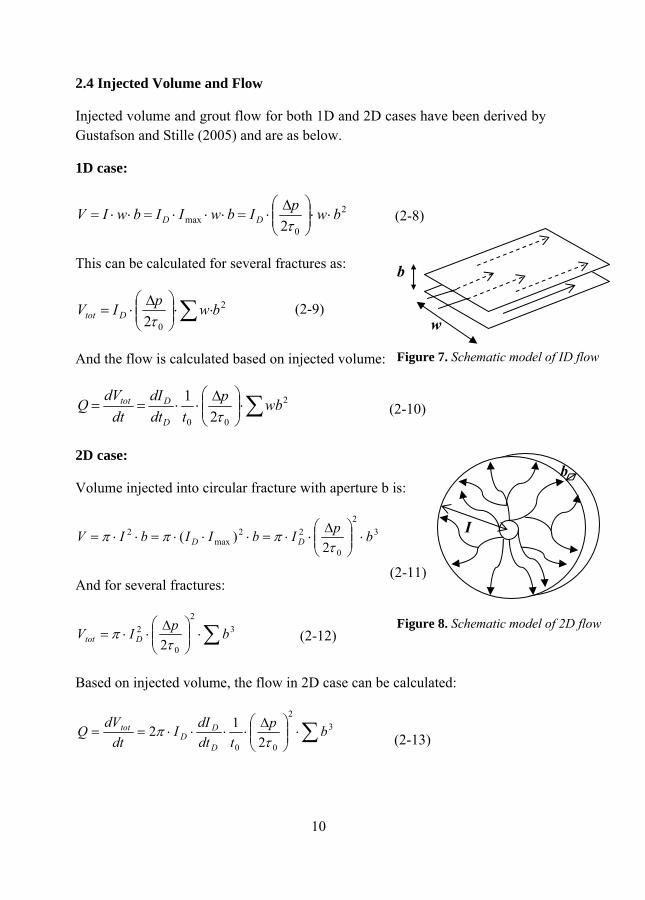
Figure 7. Schematic model of ID flow
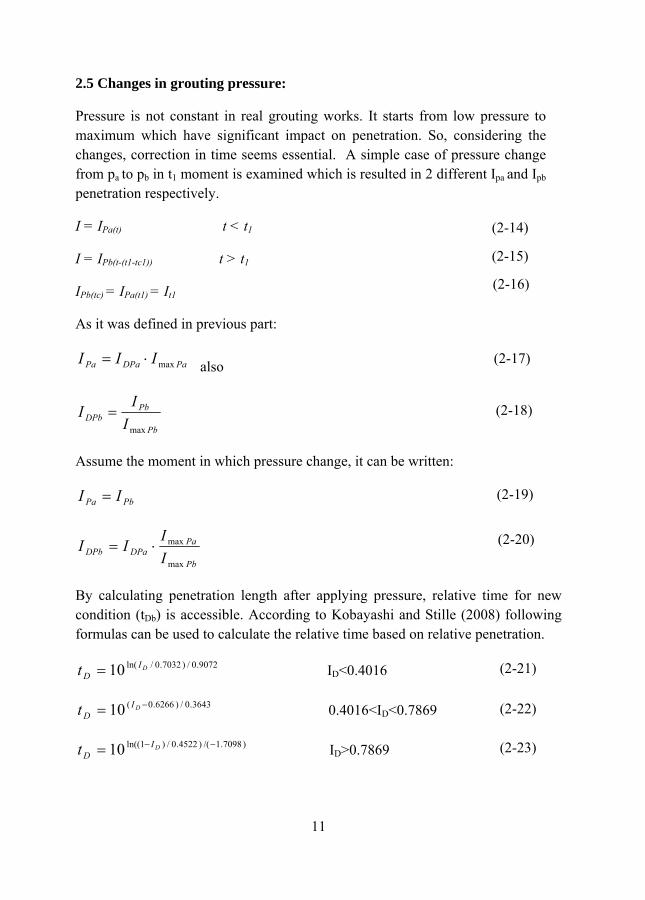
Figure 8. Schematic model of 2D flow
(2-8)
(2-9)
(2-10)
(2-11)
(2-12)
(2-13)
b
I
11
2.5 Changes in grouting pressure:
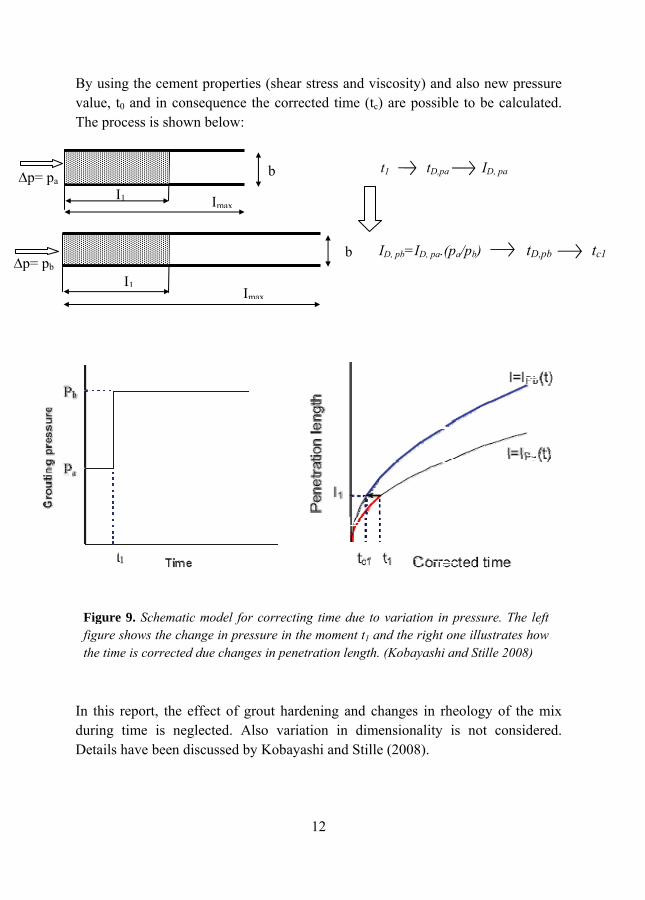
Pressure is not constant in real grouting works. It starts from low pressure to maximum which have significant impact on penetration. So, considering the changes, correction in time seems essential. A simple case of pressure change from pa to pb in t1 moment is examined which is resulted in 2 different Ipa and Ipb penetration respectively.
I = IPa(t) t < t1
I = IPb(t-(t1-tc1)) t > t1
IPb(tc) = IPa(t1) = It1
As it was defined in previous part:
PaDPaPa III max⋅= also
Pb
PbDPb I
II
max
=
Assume the moment in which pressure change, it can be written:
PbPa II =
Pb
PaDPaDPb I
III
max
max⋅=
By calculating penetration length after applying pressure, relative time for new condition (tDb) is accessible. According to Kobayashi and Stille (2008) following formulas can be used to calculate the relative time based on relative penetration.
9072.0/)7032.0/ln(10 DIDt = ID<0.4016
3643.0/)6266.0(10 −= DIDt 0.4016<ID<0.7869
)7098.1/()4522.0/)1ln((10 −−= DIDt ID>0.7869
(2-14)
(2-15)
(2-16)
(2-17)
(2-18)
(2-19)
(2-20)
(2-21)
(2-22)
(2-23)
ByvaTh
In duDe
∆p= pa
∆p= pb
Ffith
y using the cemalue, t0 and in che process is sho
this report, theuring time is netails have been
I1
I1
Figure 9. Schemafigure shows the che time is correct
ment properties (consequence theown below:
e effect of grouneglected. Alson discussed by K
Imax
Imax
atic model for cochange in pressurted due changes i
12
(shear stress ane corrected time
ut hardening ano variation inKobayashi and S
b
b
orrecting time dure in the momentin penetration len
nd viscosity) ane (tc) are possib
nd changes in rdimensionality Stille (2008).
t1 tD,pa
ID, pb=ID, pa.
ue to variation int t1 and the right ngth. (Kobayashi
d also new presble to be calcul
rheology of theis not consid
a ID, pa
(pa/pb) tD
n pressure. The lone illustrates h
i and Stille 2008)
ssure lated.
mix ered.
D,pb tc1
left ow
13
3 Testing of cement base grout mix properties
3.1 Objective and Principles
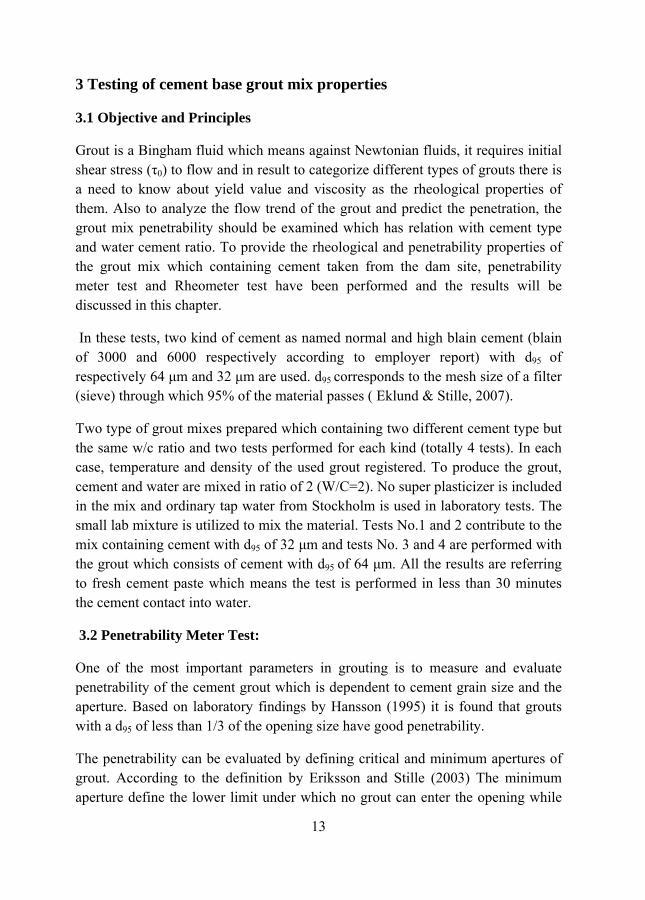
Grout is a Bingham fluid which means against Newtonian fluids, it requires initial shear stress (τ0) to flow and in result to categorize different types of grouts there is a need to know about yield value and viscosity as the rheological properties of them. Also to analyze the flow trend of the grout and predict the penetration, the grout mix penetrability should be examined which has relation with cement type and water cement ratio. To provide the rheological and penetrability properties of the grout mix which containing cement taken from the dam site, penetrability meter test and Rheometer test have been performed and the results will be discussed in this chapter.
In these tests, two kind of cement as named normal and high blain cement (blain of 3000 and 6000 respectively according to employer report) with d95 of respectively 64 μm and 32 μm are used. d95 corresponds to the mesh size of a filter (sieve) through which 95% of the material passes ( Eklund & Stille, 2007).
Two type of grout mixes prepared which containing two different cement type but the same w/c ratio and two tests performed for each kind (totally 4 tests). In each case, temperature and density of the used grout registered. To produce the grout, cement and water are mixed in ratio of 2 (W/C=2). No super plasticizer is included in the mix and ordinary tap water from Stockholm is used in laboratory tests. The small lab mixture is utilized to mix the material. Tests No.1 and 2 contribute to the mix containing cement with d95 of 32 μm and tests No. 3 and 4 are performed with the grout which consists of cement with d95 of 64 μm. All the results are referring to fresh cement paste which means the test is performed in less than 30 minutes the cement contact into water.
3.2 Penetrability Meter Test:
One of the most important parameters in grouting is to measure and evaluate penetrability of the cement grout which is dependent to cement grain size and the aperture. Based on laboratory findings by Hansson (1995) it is found that grouts with a d95 of less than 1/3 of the opening size have good penetrability.
The penetrability can be evaluated by defining critical and minimum apertures of grout. According to the definition by Eriksson and Stille (2003) The minimum aperture define the lower limit under which no grout can enter the opening while
14
the critical aperture represents the upper limit over which no filtration will happen. Aperture limits and their effect on flow trend will be discussed in future chapters.
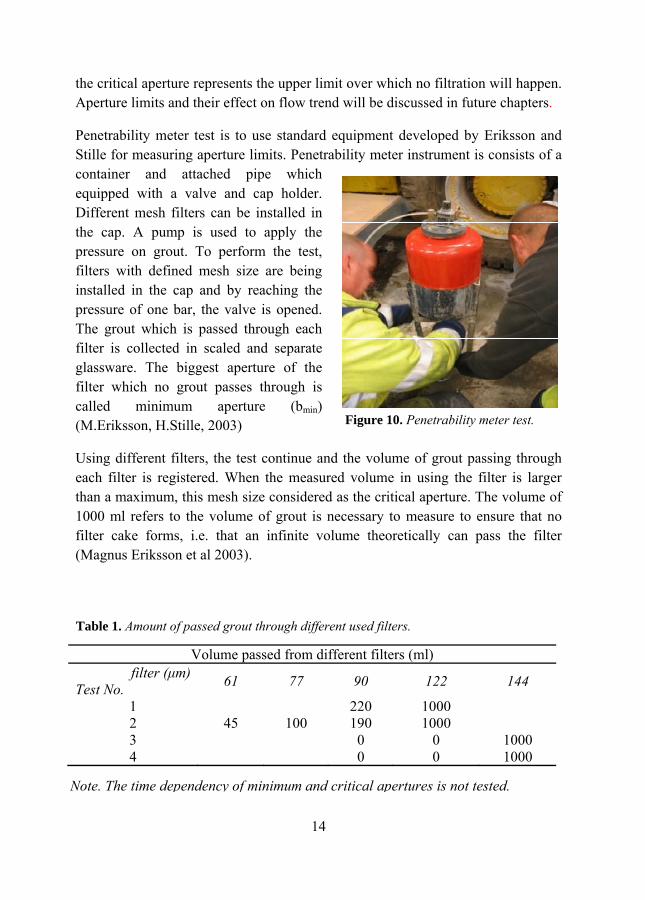
Penetrability meter test is to use standard equipment developed by Eriksson and Stille for measuring aperture limits. Penetrability meter instrument is consists of a container and attached pipe which equipped with a valve and cap holder. Different mesh filters can be installed in the cap. A pump is used to apply the pressure on grout. To perform the test, filters with defined mesh size are being installed in the cap and by reaching the pressure of one bar, the valve is opened. The grout which is passed through each filter is collected in scaled and separate glassware. The biggest aperture of the filter which no grout passes through is called minimum aperture (bmin) (M.Eriksson, H.Stille, 2003)
Using different filters, the test continue and the volume of grout passing through each filter is registered. When the measured volume in using the filter is larger than a maximum, this mesh size considered as the critical aperture. The volume of 1000 ml refers to the volume of grout is necessary to measure to ensure that no filter cake forms, i.e. that an infinite volume theoretically can pass the filter (Magnus Eriksson et al 2003).
Volume passed from different filters (ml) filter (μm)
Test No. 61 77 90 122 144
1 220 1000 2 45 100 190 1000 3 0 0 1000 4 0 0 1000
Figure 10. Penetrability meter test.
Note. The time dependency of minimum and critical apertures is not tested.
Table 1. Amount of passed grout through different used filters.
15
0200400600800
10001200
61 77 90 122 144
pass
ed a
mou
nt (m
l)
filter size µm
test 1 test 2 test 3 test 4
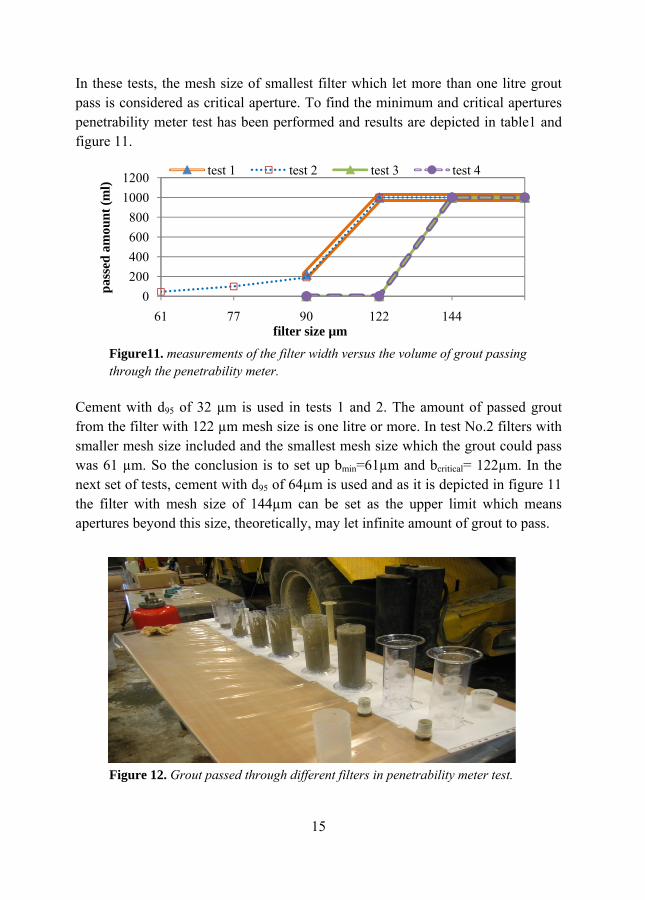
In these tests, the mesh size of smallest filter which let more than one litre grout pass is considered as critical aperture. To find the minimum and critical apertures penetrability meter test has been performed and results are depicted in table1 and figure 11.
Cement with d95 of 32 µm is used in tests 1 and 2. The amount of passed grout from the filter with 122 µm mesh size is one litre or more. In test No.2 filters with smaller mesh size included and the smallest mesh size which the grout could pass was 61 µm. So the conclusion is to set up bmin=61µm and bcritical= 122µm. In the next set of tests, cement with d95 of 64µm is used and as it is depicted in figure 11 the filter with mesh size of 144µm can be set as the upper limit which means apertures beyond this size, theoretically, may let infinite amount of grout to pass.
Figure11. measurements of the filter width versus the volume of grout passing through the penetrability meter.
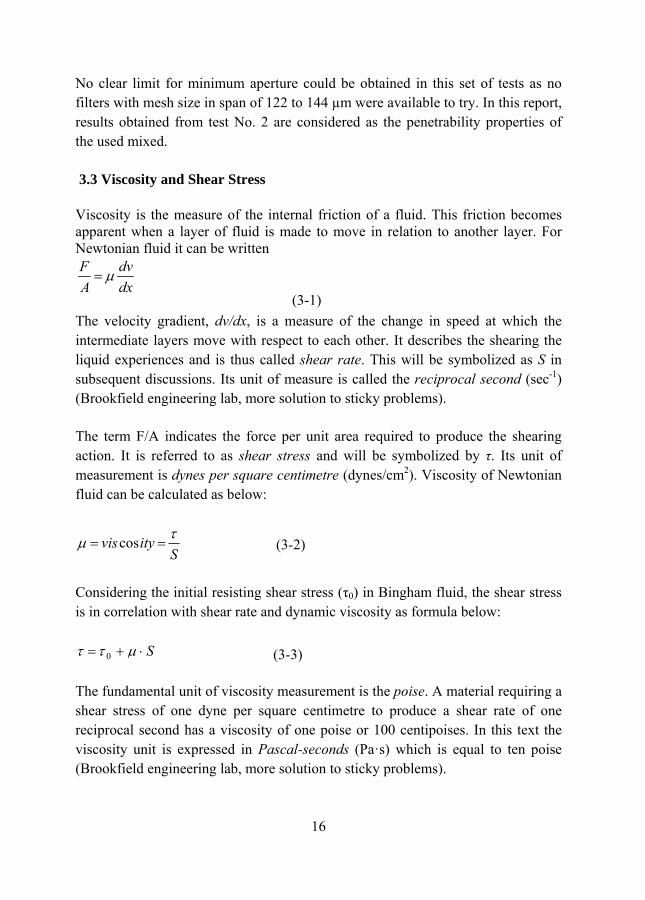
Figure 12. Grout passed through different filters in penetrability meter test.
16
No clear limit for minimum aperture could be obtained in this set of tests as no filters with mesh size in span of 122 to 144 µm were available to try. In this report, results obtained from test No. 2 are considered as the penetrability properties of the used mixed.
3.3 Viscosity and Shear Stress
Viscosity is the measure of the internal friction of a fluid. This friction becomes apparent when a layer of fluid is made to move in relation to another layer. For Newtonian fluid it can be written
dxdv
AF μ=
The velocity gradient, dv/dx, is a measure of the change in speed at which the intermediate layers move with respect to each other. It describes the shearing the liquid experiences and is thus called shear rate. This will be symbolized as S in subsequent discussions. Its unit of measure is called the reciprocal second (sec-1) (Brookfield engineering lab, more solution to sticky problems).
The term F/A indicates the force per unit area required to produce the shearing action. It is referred to as shear stress and will be symbolized by τ. Its unit of measurement is dynes per square centimetre (dynes/cm2). Viscosity of Newtonian fluid can be calculated as below:
Sityvis τμ == cos
Considering the initial resisting shear stress (τ0) in Bingham fluid, the shear stress is in correlation with shear rate and dynamic viscosity as formula below:
The fundamental unit of viscosity measurement is the poise. A material requiring a shear stress of one dyne per square centimetre to produce a shear rate of one reciprocal second has a viscosity of one poise or 100 centipoises. In this text the viscosity unit is expressed in Pascal-seconds (Pa·s) which is equal to ten poise (Brookfield engineering lab, more solution to sticky problems).
(3-2)
(3-3) S⋅+= μττ 0
(3-1)
3.3
Thusof RocoThmareclintesthe20AcBicloThrunheLe
vt
Wex
vt
Wav
an
Thunvis
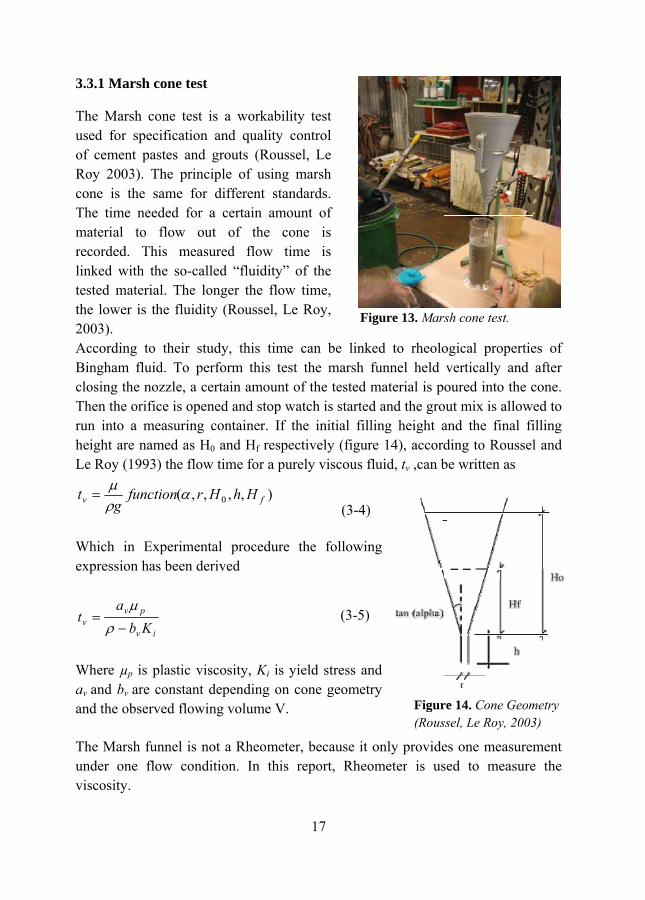
3.1 Marsh cone
he Marsh cone ed for specific
f cement pastesoy 2003). The ne is the same
he time neededaterial to flowcorded. This nked with the ssted material. Te lower is the f
003). ccording to thengham fluid. Tosing the nozzlehen the orifice isn into a measuight are named
e Roy (1993) the
(functiongρμ
=
Which in Experxpression has be
iv
pv
Kba−
=ρ
μ
Where µp is plastand bv are cons
nd the observed
he Marsh funnender one flow scosity.
e test
test is a workcation and qual and grouts (Rprinciple of us
e for different d for a certain w out of themeasured flow
so-called “fluidThe longer thefluidity (Rousse
eir study, this To perform thise, a certain amos opened and sturing container.d as H0 and Hf re flow time for
,,,,( 0 fHhHrα
rimental procedeen derived
tic viscosity, Kstant dependingflowing volume
el is not a Rheocondition. In
17
kability test lity control
Roussel, Le sing marsh
standards. amount of
e cone is w time is dity” of the
flow time, el, Le Roy,
time can be lis test the marsount of the testeop watch is star. If the initial respectively (figa purely viscou
)
dure the follow
Ki is yield stressg on cone geome V.
meter, because this report, Rh
(3-
(3-
inked to rheolosh funnel held ed material is ported and the grofilling height agure 14), accordus fluid, tv ,can b
wing
and metry
it only provideheometer is us
Figure 13. Mars
Figur(Rous
-5)
-4)
ogical propertievertically and oured into the c
out mix is allowand the final fiding to Rousselbe written as
es one measuremsed to measure
sh cone test.
re 14. Cone Geomssel, Le Roy, 2003
es of after
cone. ed to illing l and
ment e the
metry 3)
18
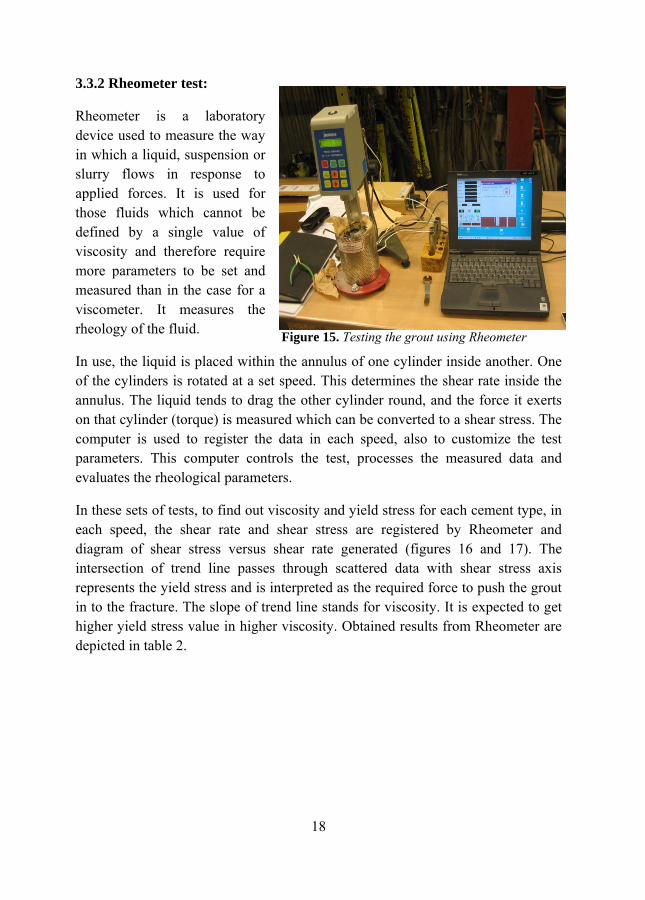
3.3.2 Rheometer test:
Rheometer is a laboratory device used to measure the way in which a liquid, suspension or slurry flows in response to applied forces. It is used for those fluids which cannot be defined by a single value of viscosity and therefore require more parameters to be set and measured than in the case for a viscometer. It measures the rheology of the fluid.
In use, the liquid is placed within the annulus of one cylinder inside another. One of the cylinders is rotated at a set speed. This determines the shear rate inside the annulus. The liquid tends to drag the other cylinder round, and the force it exerts on that cylinder (torque) is measured which can be converted to a shear stress. The computer is used to register the data in each speed, also to customize the test parameters. This computer controls the test, processes the measured data and evaluates the rheological parameters.
In these sets of tests, to find out viscosity and yield stress for each cement type, in each speed, the shear rate and shear stress are registered by Rheometer and diagram of shear stress versus shear rate generated (figures 16 and 17). The intersection of trend line passes through scattered data with shear stress axis represents the yield stress and is interpreted as the required force to push the grout in to the fracture. The slope of trend line stands for viscosity. It is expected to get higher yield stress value in higher viscosity. Obtained results from Rheometer are depicted in table 2.
Figure 15. Testing the grout using Rheometer
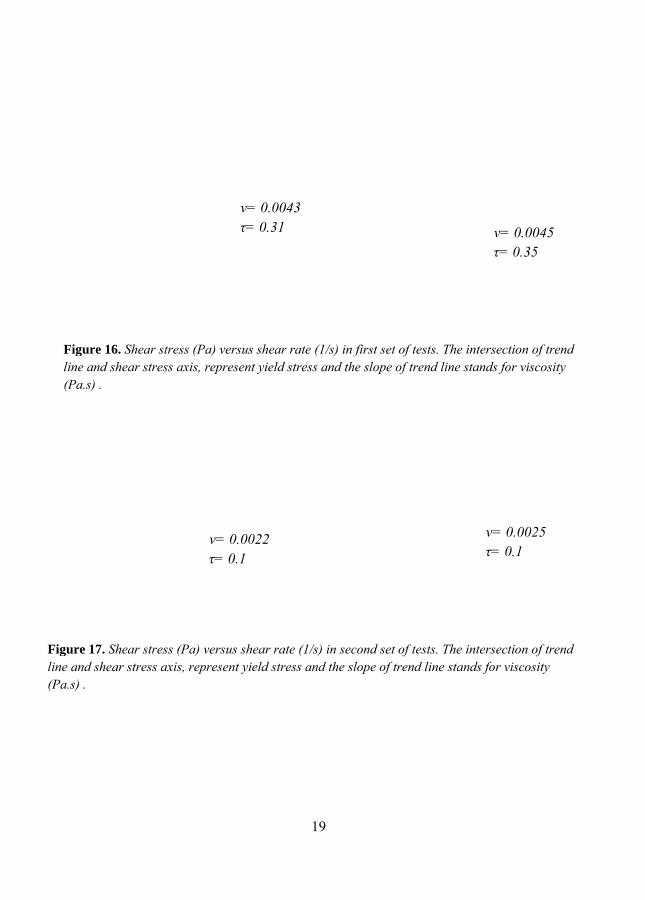
Figure line and(Pa.s) .
Figuline a(Pa.s
17. Shear stress (d shear stress axis
ure 16. Shear streand shear stress as) .
ν= 0τ= 0
(Pa) versus shears, represent yield
ν= 0.0022τ= 0.1
ess (Pa) versus shaxis, represent yi
19
0.0043 .31
r rate (1/s) in secd stress and the sl
2
hear rate (1/s) in field stress and the
cond set of tests. Tlope of trend line
first set of tests. Te slope of trend l
ν= 0.00τ= 0.35
The intersection ostands for viscos
ν= 0.002τ= 0.1
The intersection oine stands for vis
045 5
of trend sity
25
of trend scosity
20
*in all the analysis performed in this report, results from test No.2 are considered as the input values
3.4 Results and Discussion
Many different factors governing with properties of the grout mix and in consequence several tests are required to perform to justify reliable results. Different tests from other projects show that variations in test results are related to cement condition, water cement ratio, super plasticizer content, mixing time, mixer type and water temperature.
In a research which performed by Magnus Eriksson et al.(2003) to investigate these variations it is concluded that large variation occurs by changing cement type. Even there are different outcomes in testing same type of cements which are provided by different suppliers. In these tests they have pointed to storage condition of the cement as a difference has been observed between test results performed with the grout containing fresh cement and the grout produced with stored cement.
They found that lowering the water cement ratio increases the variation in rheological parameters and hence increases the uncertainty. According to their report the variations are generally smaller for penetrability parameters than for the rheological parameters.
In penetrability case, it was concluded that the influence on penetrability due to variation in water cement ratio and type and amount of additives is limited and the main influence arises from the cement type (Erikson, Stille, 2003). When cement
Rheological Properties factor
test No. yield stress(Pa) Viscosity(Pas)
1 0.31 0.0046
2* 0.35 0.0043
3 0.1 0.0022
4 0.1 0.0025
Table 2. Summary of Rheometer test results
21
grains build a stable arch over a fracture constriction during penetration is known as filtration (Draganovic, 2009).
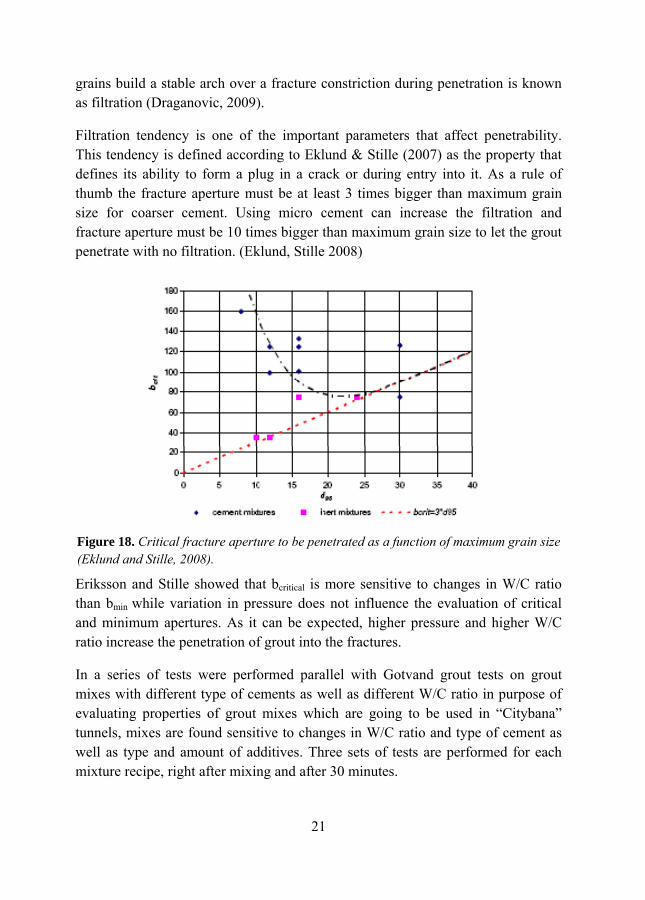
Filtration tendency is one of the important parameters that affect penetrability. This tendency is defined according to Eklund & Stille (2007) as the property that defines its ability to form a plug in a crack or during entry into it. As a rule of thumb the fracture aperture must be at least 3 times bigger than maximum grain size for coarser cement. Using micro cement can increase the filtration and fracture aperture must be 10 times bigger than maximum grain size to let the grout penetrate with no filtration. (Eklund, Stille 2008)
Eriksson and Stille showed that bcritical is more sensitive to changes in W/C ratio than bmin while variation in pressure does not influence the evaluation of critical and minimum apertures. As it can be expected, higher pressure and higher W/C ratio increase the penetration of grout into the fractures.
In a series of tests were performed parallel with Gotvand grout tests on grout mixes with different type of cements as well as different W/C ratio in purpose of evaluating properties of grout mixes which are going to be used in “Citybana” tunnels, mixes are found sensitive to changes in W/C ratio and type of cement as well as type and amount of additives. Three sets of tests are performed for each mixture recipe, right after mixing and after 30 minutes.
Figure 18. Critical fracture aperture to be penetrated as a function of maximum grain size (Eklund and Stille, 2008).
22
From the results of these tests, the differences in viscosity and yield stress are observed in comparison with the results obtained in this study. This can be interpreted due to different water cement ratio and diverse properties of the cement which is provided from a factory in Iran.
From “Citybanan tests” it could be observed that viscosity decrease as the w/c ratio increase. Also viscosity is sensitive to type of cement and type and amount of additives.
In examination of yield stress, by increasing w/c ratio, the shear stress is reducing. Also the type of cement and type and amount of additives have a magnificent effect on yield stress value. It could be found that mixing time affect the rheological properties of the mix.
In case of penetrability properties, variation in w/c ratio has not a considerable effect on critical aperture while the cement type and additives can change the results. No variation due to mixing time is detected.
In present report, due to lack of enough cement, limited number of tests could be performed. Furthermore there was a gap from the storage time to usage of the cement and the cement may be affected by the inevitable existing moisture although it had been stored very well in a dry place. Recorded pressure and flow data from limited number of boreholes were available which in most of them mixes with w/c of 2 were used. So to have possibility of analysing more cases, this ratio (w/c=2) is selected in mix recipe of the tested grout in this case study.
Grout mix properties Factor
test No.
yield stress(Pa) Viscosity(Pas) b min(μm) b critical(μm)
1 0.31 0.0046 90 122
2* 0.35 0.0043 61 122
3 0.1 0.0022 122 144
4 0.1 0.0025 122 144
Table 3. Summary of tests results on cement which has been taken from Gotvand dam
*In this report results from test No.2 is taken as the properties of the used mixed in Gotvand Dam
23
Comparing the results, it is observed that by changing the cement type both rheological and penetrability properties of the cement have changed. Tests number 1 and 2 are performed using cement with d95 of 32 μm and cement with d95 of 64 μm is employed in tests 3 and 4. Using cement with bigger grain size results in lower viscosity and lower shear stress while it increase both minimum and critical apertures as it is expected.
In all the analysis performed in this report, results from test No.2 are considered as input values. In this test the cement with blain of 6000 is used in the grout mix. In examination of grain size of this cement which has been ordered by the project employer, 50 percent of the weight of the cement grains has the size less than 7 µm and 12 percent of the weight belong to grains bigger than 20µm. The size of biggest grain is reported as 40µm (Mahab Ghods Co. design documents). d95 of this cement is 32µm.
It should be noted that in production of grout mix for test No.2, water and cement are mixed in ratio of 2 and no additives are used.
24
4 Dam specification and geology
4.1 Gotvand Dam
Gotvand dam is situated in south west of Iran and constructed on Karoon River in 382 km from the estuary. The dam site is located 25km far from Shooshtar city, in geographical eastern longitudes of 49, 48, 59, 48 and geographical western longitudes of 12, 32, 17, and 32. The humidity varies between 51 to 89 percent and the temperature change between 3 to 49 oC in this area .As the biggest dam which is under construction on Karoon River, it has aimed to produce 4250 million KWH energy annually. Flood control and control of water, discharge from upstream dams, water regulation and tourist attraction, are the other objectives for casting Gotvand dam.
4.2 Technical specifications
This is a rock fill dam with clay core, with capacity of 4500 million m3 water in a reservoir in 96.5 Km2 surface area. Height of the dam from foundation is 180 meter, the crest length 750 m and the width is 15m in elevation of 244m above the sea. Body volume of this dam is 26 million m3. As a hydro power dam, beside the main body, the plan is consists of diversion system, tailrace system, spillway, and a power house.
Diversion system has been designed based on flood with return period of 500 years and in result 3 diversion tunnels in left abutment with horseshoe section, with total length of 4529 m and diameter of 9.5 m2 , also a 71m height cofferdam with 33m length and 15m width crest are constructed to fulfil this demand.
Spillway type ogee with radial gates and shoots with the maximum capacity of 16500 m3/s in maximum flood is the other part of hydropower system. Located in left bank in level of 218 m above the sea, the spillway has a chute with length of 570 m and its width is 72 m with four sector shutters (15m width and 17m length)
The powerhouse is designed as an expose surface structure with 4 unit of 250MW to produce 4250 GWH hydropower energy annually.
Four power tunnels with diameter of 13 m and total length of 5260m are the main part of tailrace system. Surge tanks, penstocks and vertical shafts are constructed to complete this system.
25
To facilitate construction of this huge structure, some permanent and temporary infrastructures have been casted beside. 5 Km access road, Access tunnels to tailrace, spillway and grouting galleries, also 3 bridges with total length of 900 meters are some outstanding examples.
4.3 Geology of region
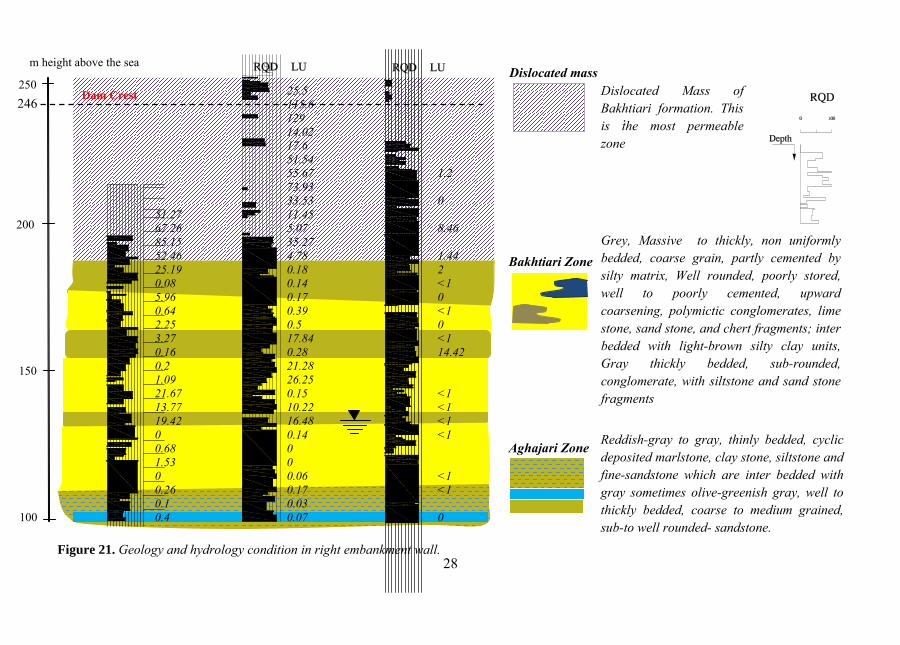
The geology of the region is consists of two different formations: “Bakhtiari” formation which is situated in upper level and the “Agha Jari” formation which is laid beneath. Also there is a Dislocated Mass in this formation which can be categorized as a poor rock with high conductivity.
Agha Jari Formation: which takes its name from the agha jari oil field in Khuzestan province consist almost entirely of terrigenous clastics ranging from silt sizes to boulder conglomerates. The principal lithology consists of gray, calcareous sandstone with veins of gypsum, red marl and siltstone. The upper part of agha jari formation consists of buff, weathering, gypsum-veined siltstone and silty marl with interbeded sandstone, and upper part is formed by pebbly sandstone and siltstone assigned a locality name, the Libhbari Member. The conglomerate of the bakhtiari formation rest on this member which finds its principal development in southwestern Lurestan.
Bakhtiari Formation: the bakhtiari formation takes its name from the mountains in the north eastern Khuzestan province. The name bakhtiari was first applied to the chert and limestone conglomerates interbedded with sandstone that lie unconformably upon the fars sediments of the Lurestan and Khuzestan Province. It is an almost wholly terrigenous, clastic unit ranging in grain size form a silt grade to boulder conglomerate. The lower part of the formation consists of massive conglomerate interbedded with coarse, cross-bedded sandstone and grit. The schematic geology and lugeon value obtained from 3 boreholes can give an idea about the formations, rock type and its conductivity in different levels (figure 19).
26
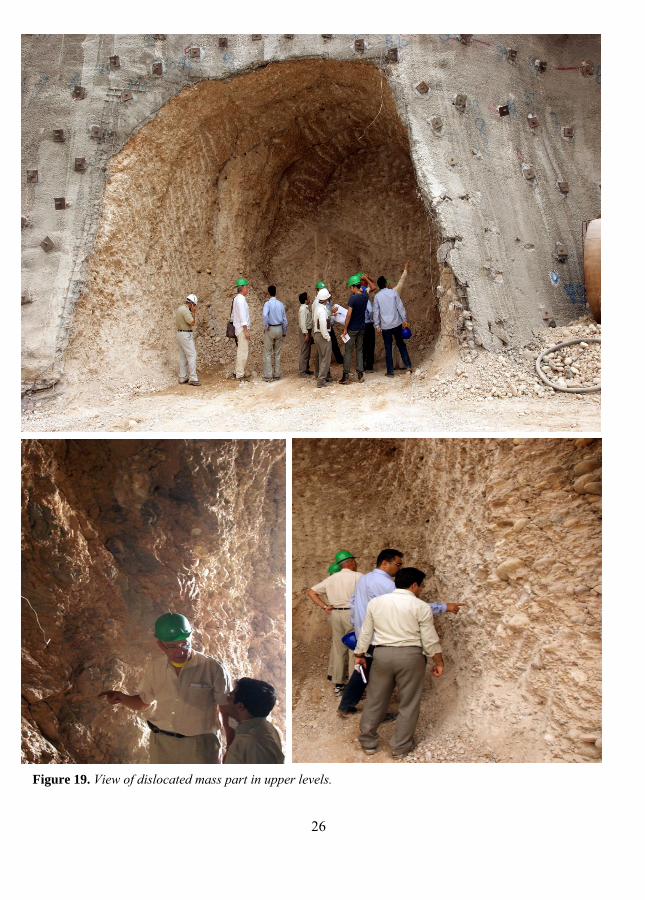
Figure 19. View of dislocated mass part in upper levels.
27
50 mm
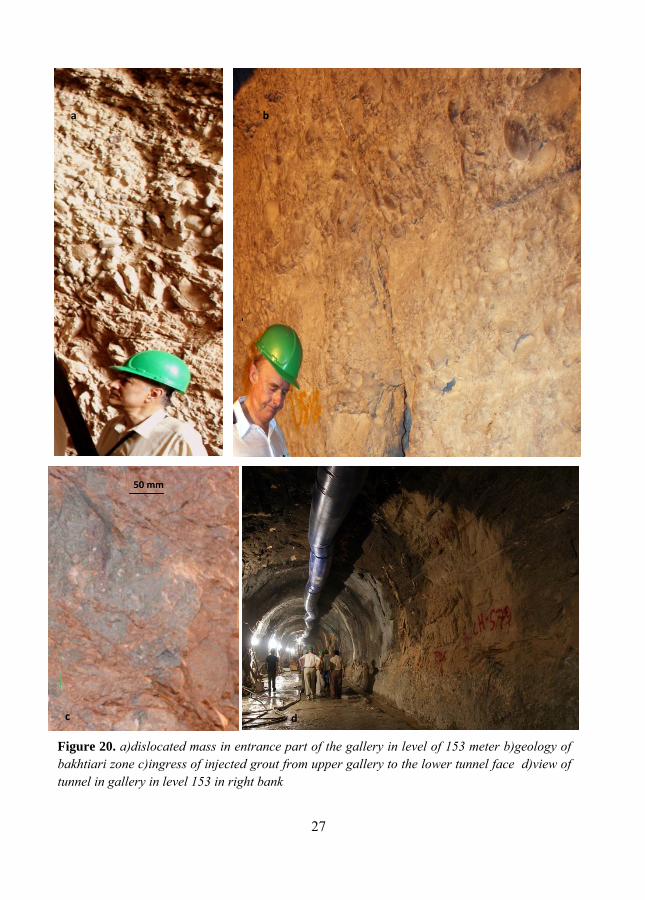
Figure 20. a)dislocated mass in entrance part of the gallery in level of 153 meter b)geology of bakhtiari zone c)ingress of injected grout from upper gallery to the lower tunnel face d)view of tunnel in gallery in level 153 in right bank
c
a
b
d
a
28
.
25.5 115.6 129 14.02 17.6 51.54 55.67 1.2
73.93 33.53 0 51.27 11.45 67.26 5.07 8.46 85.15 35.27 52.46 4.78 1.44 25.19 0.18 2 0.08 0.14 <1 5.96 0.17 0 0.64 0.39 <1 2.25 0.5 0 3.27 17.84 <1 0.16 0.28 14.42 0.2 21.28 1.09 26.25 21.67 0.15 <1 13.77 10.22 <1 19.42 16.48 <1
0 0.14 <1 0.68 0 1.53 0 0 0.06 <1 0.26 0.17 <1 0.1 0.03 0.4 0.07 0
Dislocated Mass of Bakhtiari formation. This is the most permeable zone
Grey, Massive to thickly, non uniformly bedded, coarse grain, partly cemented by silty matrix, Well rounded, poorly stored, well to poorly cemented, upward coarsening, polymictic conglomerates, lime stone, sand stone, and chert fragments; inter bedded with light-brown silty clay units, Gray thickly bedded, sub-rounded, conglomerate, with siltstone and sand stone fragments
Reddish-gray to gray, thinly bedded, cyclic deposited marlstone, clay stone, siltstone and fine-sandstone which are inter bedded with gray sometimes olive-greenish gray, well to thickly bedded, coarse to medium grained, sub-to well rounded- sandstone.
100
150
250
200
m height above the sea
Figure 21. Geology and hydrology condition in right embankment wall.
Dam Crest 246
Dislocated mass
Aghajari Zone
Bakhtiari Zone
29
4.4 Requirements and Design
The objective of grouting in this project is construction of a water tightening system under the dam and in the embankment walls beside. Efficient water stop system is the one to reduce the leakage of water to desired amount and be stable in life time of the dam (Ken Weaver and Donald Bruce (2007)).To do so, a curtain under the dam is designed to be constructed in split technique containing primary, secondary and tertiary holes. The goal is to reduce conductivity to less than 3*10-7 which is corresponding to water loss in control holes of 3 Lugeon. In left bank, there is a good rock with apparent joint set which lead to drill one row of holes. The ground water level is 139 meter above the sea (ma.s.l).
The right bank which is the focus of this report has more complicated geology. The conglomerate is locally disturbed (dislocated) at the right bank with shear zones, clay filled fractures with high PI and open fractures. The origin of the dislocated material is not known but it may be formed depend on old slope failures or faulting. The open fractures are predicted to be created because of stress relief and /or erosion of fractures. The clay content of the infilling seems to be rather high. In a safe approach a curtain designed containing tow row of holes in downstream (DS) and upstream (US) in primary and secondary sets with angel close to vertical axis. In this region due to existence of mix dislocated part and gypsum layer, a cut of wall is designed which the maximum excavation depth of the slurry trench wall is around 130 m. The four grouting galleries in this part are situated in elevations of +106.5m, +153m, +190 m and +247 m above the sea level and the progress of grouting is currently going on (see appendix B).
The gradient of pressure and flow is considered as stop criterion in grouting works of this project and grouting is stopped when the flow is less than a minimum value in a defined pressure. The order of setting pressure according to consultant document is as below:
‐ During the first 10 minutes of grouting the exerted pressure gradient is 0.5bar/min and the manner continue if the flow is more than 8lit/5min.
‐ If the flow is lower than 8lit/5min the exerted pressure gradient increase to 1 bar/min.
‐ If the flow is near zero the pressure Gradient increase 2-3bar/min. (Mahab Ghods Co. design documents)
Grouting boreholes in left and right banks and the curtain under the dam are designed as illustrated in figure 22. Distance of primary boreholes from each other
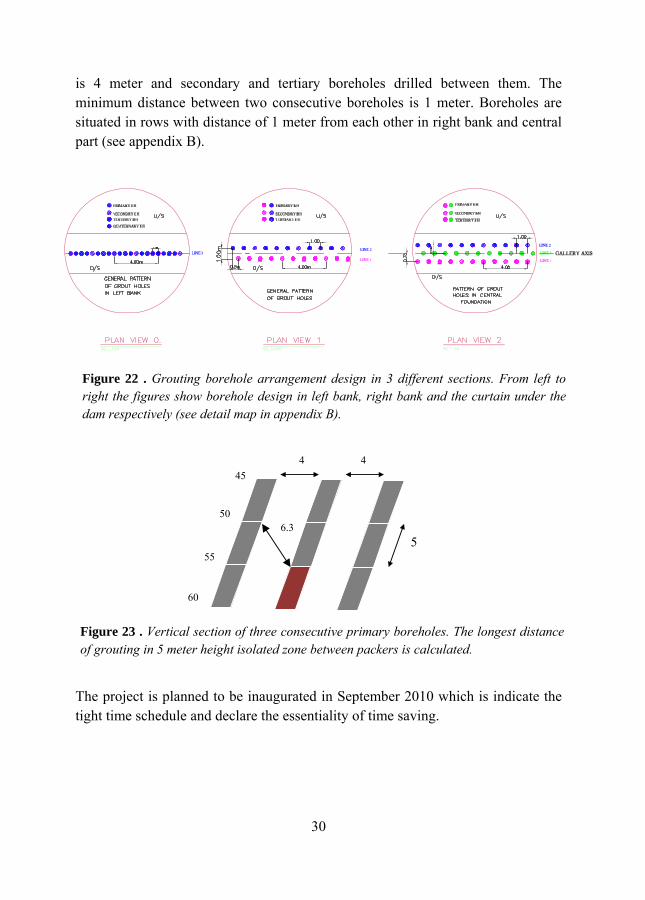
30
is 4 meter and secondary and tertiary boreholes drilled between them. The minimum distance between two consecutive boreholes is 1 meter. Boreholes are situated in rows with distance of 1 meter from each other in right bank and central part (see appendix B).
The project is planned to be inaugurated in September 2010 which is indicate the tight time schedule and declare the essentiality of time saving.
Figure 22 . Grouting borehole arrangement design in 3 different sections. From left to right the figures show borehole design in left bank, right bank and the curtain under the dam respectively (see detail map in appendix B).
4 4
6.3 5
45
50
55
60
Figure 23 . Vertical section of three consecutive primary boreholes. The longest distance of grouting in 5 meter height isolated zone between packers is calculated.
31
5 Application of the real time grouting control method
5.1 Explanation and Discussion
In this chapter, the attempt is to verify Real Time Grouting Control Method by using the data taken from Gotvand dam and results of the tests performed in Stockholm as input data in the generated application. Principles and details of the theory are discussed in two practical samples and grouting work in one of the boreholes is examined in detail. This section is finalized by the conclusion and suggestions for different cases.
To put this theory into work, in first step, dimensionality of fractures should be predicted. The input data are the recorded flow and in result grouting volume, also grouting pressure and underground pressure. Calculating (Qt/V) in each time step is resulting in a scattered graph in which the (Qt/V) value of the trend line is indicating the dimensionality (as it was discussed in chapter 2). Corrected time should be used in calculating the (Qt/V) value in case of variable pressure during grouting process.
The maximum possible penetration can be calculated for the different possible fracture apertures (formula (2-1)). Also it is possible to obtain relative time which is dependent to rheological properties of the mix and the pressure in each step. By deciding dimensionality of fractures, relative penetration is consequence from figures 3. By substitution of maximum and relative penetration in formula (2-4) the final outcome is the penetration length of the grout in the fractures.
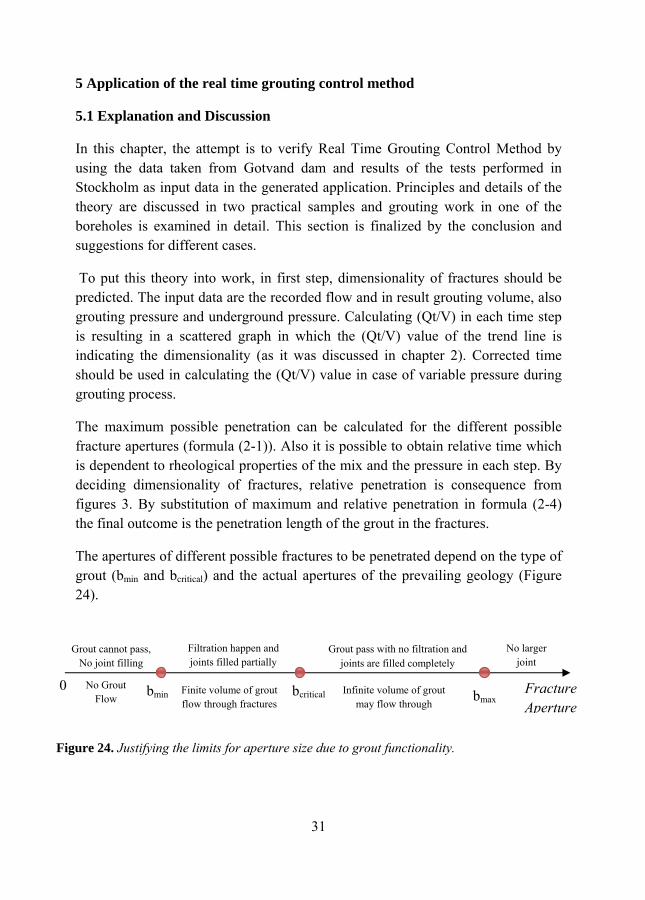
The apertures of different possible fractures to be penetrated depend on the type of grout (bmin and bcritical) and the actual apertures of the prevailing geology (Figure 24).
Figure 24. Justifying the limits for aperture size due to grout functionality.
0 bmin bcritical Fracture Aperture
Grout cannot pass, No joint filling
Filtration happen and joints filled partially
Grout pass with no filtration and joints are filled completely
Finite volume of grout flow through fractures
Infinite volume of grout may flow through
No Grout Flow
No larger joint
bmax
32
To go further, the grouting flow can be calculated based on the average aperture. According to Hässler and Stille (1992) because of high viscosity of grout, grouting usually affects only a limited volume of the rock and in result in most cases the rock should be considered as a discrete medium in grouting simulation. So it seems essential to have a value for the aperture (b) to calculate the amount of the flow. In reality ‘b’ represents some kind of the average opening in the conductive part of the rock mass. (Hässler, 1990).
From the formula (2-10) the grout flow in 1D dimension has direct correlation with ∑wb2 and in 2D case the grout flow is in relation with ∑b3 as well (2-13).
Registering recorded flow versus ⎟⎟⎠
⎞⎜⎜⎝
⎛ Δ⋅⋅
00 21
τp
tdtdI
D
D and 2
00 212 ⎟⎟
⎠
⎞⎜⎜⎝
⎛ Δ⋅⋅⋅⋅
τπ p
tdtdII
D
DD in
a scattered graph for 1D and 2D cases respectively, the slope of the trend line will stands for ∑wb2 and ∑b3. As it is shown, in 2D case the flow has relation with sum of the aperture of fractures up to three (Q~∑b3 ) which means that few number of fractures with larger aperture contribute for most of flow i.e. a fracture with aperture of 1 mm stands for 1000 fractures with the aperture size of 0.1mm. So, to simplify estimating aperture size, third root of 80% of the estimated sum can be a good approximation for largest fracture aperture. By estimating bmax the corresponding penetration length can be calculated.
In 1D case, the flow has correlation with ∑wb2 and it is more complex to estimate the aperture as the width of the fracture should be known from geological investigations.
The minimum and critical apertures which measured by utilizing penetrability meter test can be used to set different penetration limits and define stop criteria for each case. It should be noticed that bmin and bcritical are corresponding to properties of the mix and have no relation to geology of the area. They are mainly dependent to cement type while the water cement ratio has less significant effect on penetrability properties (Eriksson, Stille, 2003).
The theory application has been summarized in a flowchart as depicted in figure 25.
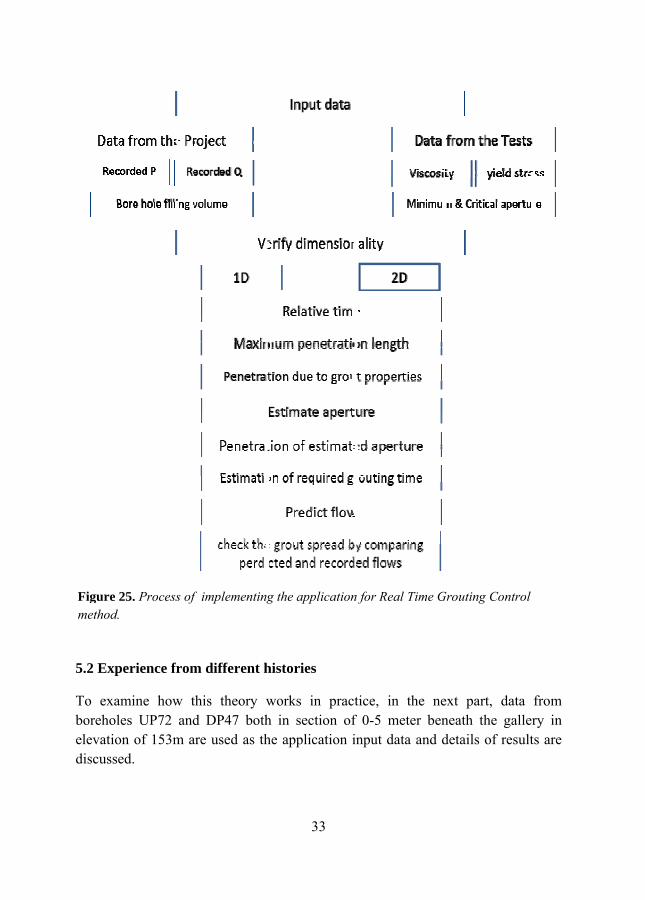
5.2
Toboeledis
Fime
2 Experience fr
o examine howoreholes UP72evation of 153mscussed.
igure 25. Processethod.
rom different h
w this theory wand DP47 both
m are used as th
s of implementing
33
histories
works in practh in section ofhe application i
g the application
tice, in the nef 0-5 meter bennput data and d
n for Real Time G
ext part, data neath the gallerdetails of result
Grouting Control
from ry in ts are
34
5.2.1 Input Data
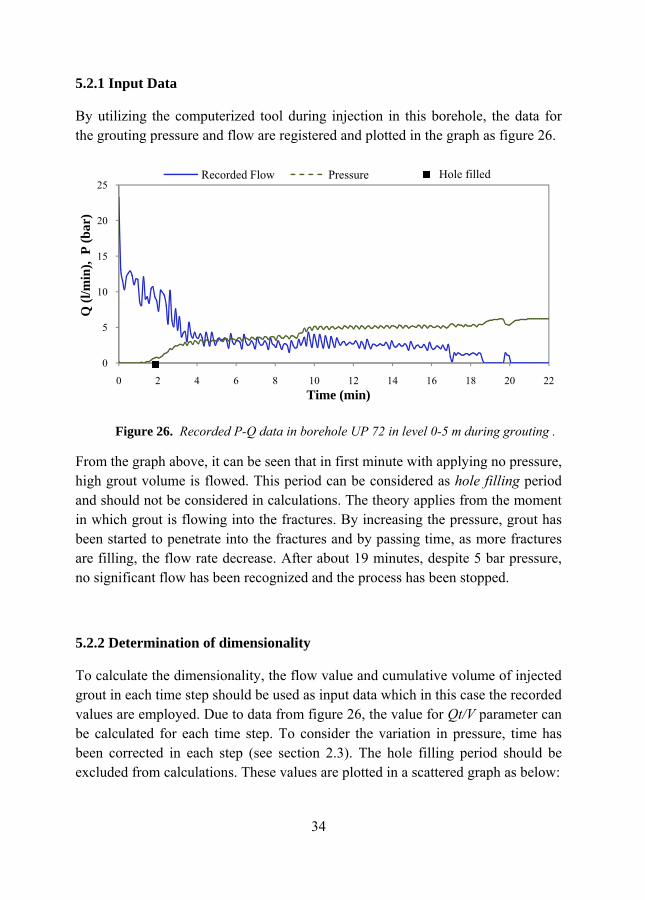
By utilizing the computerized tool during injection in this borehole, the data for the grouting pressure and flow are registered and plotted in the graph as figure 26.
From the graph above, it can be seen that in first minute with applying no pressure, high grout volume is flowed. This period can be considered as hole filling period and should not be considered in calculations. The theory applies from the moment in which grout is flowing into the fractures. By increasing the pressure, grout has been started to penetrate into the fractures and by passing time, as more fractures are filling, the flow rate decrease. After about 19 minutes, despite 5 bar pressure, no significant flow has been recognized and the process has been stopped.
5.2.2 Determination of dimensionality
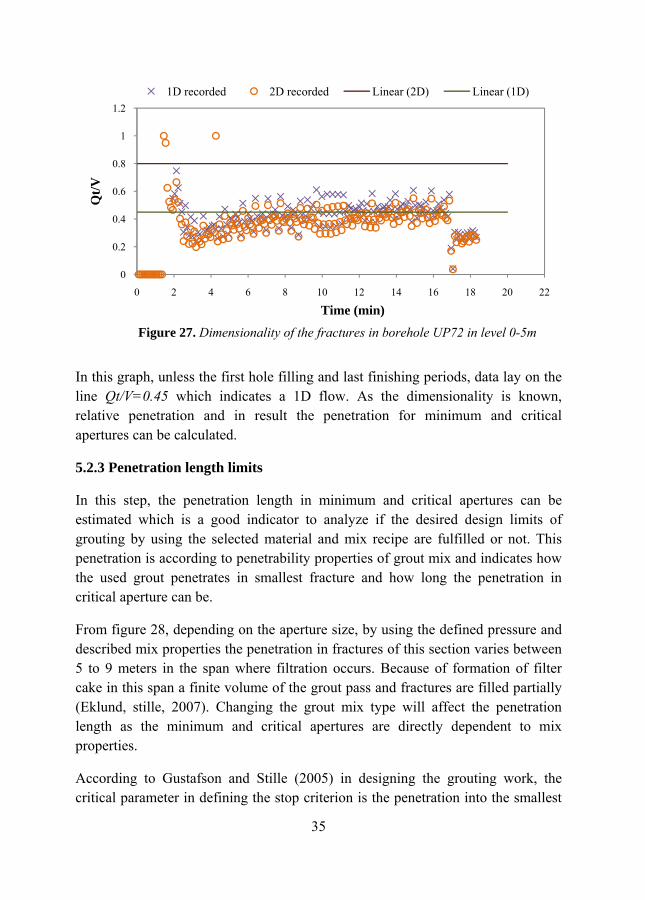
To calculate the dimensionality, the flow value and cumulative volume of injected grout in each time step should be used as input data which in this case the recorded values are employed. Due to data from figure 26, the value for Qt/V parameter can be calculated for each time step. To consider the variation in pressure, time has been corrected in each step (see section 2.3). The hole filling period should be excluded from calculations. These values are plotted in a scattered graph as below:
0
5
10
15
20
25
0 2 4 6 8 10 12 14 16 18 20 22
Q (l
/min
), P
(bar
)
Time (min)
Recorded Flow Pressure
Figure 26. Recorded P-Q data in borehole UP 72 in level 0-5 m during grouting .
Hole filled
35
In this graph, unless the first hole filling and last finishing periods, data lay on the line Qt/V=0.45 which indicates a 1D flow. As the dimensionality is known, relative penetration and in result the penetration for minimum and critical apertures can be calculated.
5.2.3 Penetration length limits
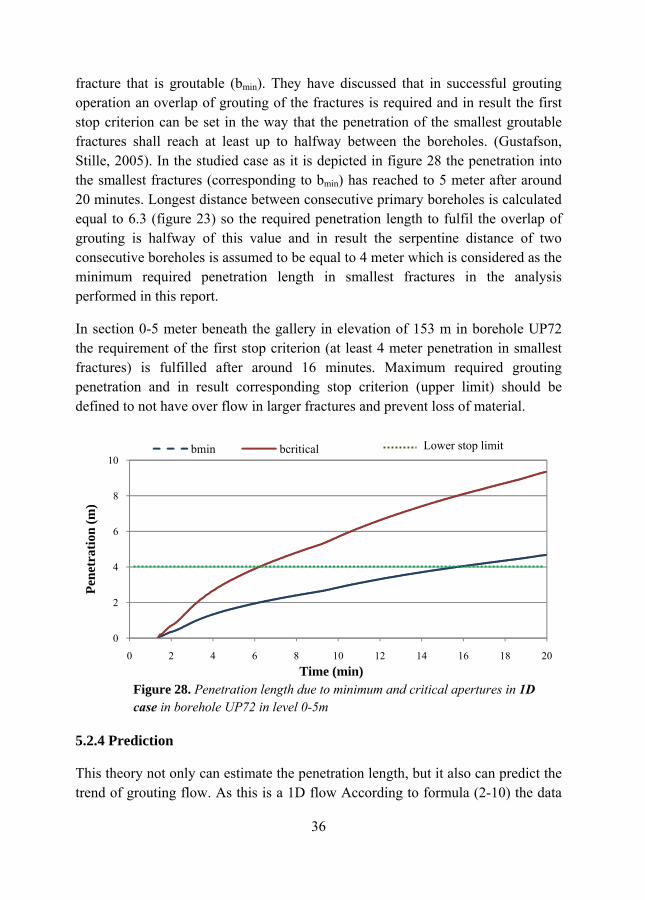
In this step, the penetration length in minimum and critical apertures can be estimated which is a good indicator to analyze if the desired design limits of grouting by using the selected material and mix recipe are fulfilled or not. This penetration is according to penetrability properties of grout mix and indicates how the used grout penetrates in smallest fracture and how long the penetration in critical aperture can be.
From figure 28, depending on the aperture size, by using the defined pressure and described mix properties the penetration in fractures of this section varies between 5 to 9 meters in the span where filtration occurs. Because of formation of filter cake in this span a finite volume of the grout pass and fractures are filled partially (Eklund, stille, 2007). Changing the grout mix type will affect the penetration length as the minimum and critical apertures are directly dependent to mix properties.
According to Gustafson and Stille (2005) in designing the grouting work, the critical parameter in defining the stop criterion is the penetration into the smallest
0
0.2
0.4
0.6
0.8
1
1.2
0 2 4 6 8 10 12 14 16 18 20 22
Qt/V
Time (min)
1D recorded 2D recorded Linear (2D) Linear (1D)
Figure 27. Dimensionality of the fractures in borehole UP72 in level 0-5m
36
fracture that is groutable (bmin). They have discussed that in successful grouting operation an overlap of grouting of the fractures is required and in result the first stop criterion can be set in the way that the penetration of the smallest groutable fractures shall reach at least up to halfway between the boreholes. (Gustafson, Stille, 2005). In the studied case as it is depicted in figure 28 the penetration into the smallest fractures (corresponding to bmin) has reached to 5 meter after around 20 minutes. Longest distance between consecutive primary boreholes is calculated equal to 6.3 (figure 23) so the required penetration length to fulfil the overlap of grouting is halfway of this value and in result the serpentine distance of two consecutive boreholes is assumed to be equal to 4 meter which is considered as the minimum required penetration length in smallest fractures in the analysis performed in this report.
In section 0-5 meter beneath the gallery in elevation of 153 m in borehole UP72 the requirement of the first stop criterion (at least 4 meter penetration in smallest fractures) is fulfilled after around 16 minutes. Maximum required grouting penetration and in result corresponding stop criterion (upper limit) should be defined to not have over flow in larger fractures and prevent loss of material.
5.2.4 Prediction
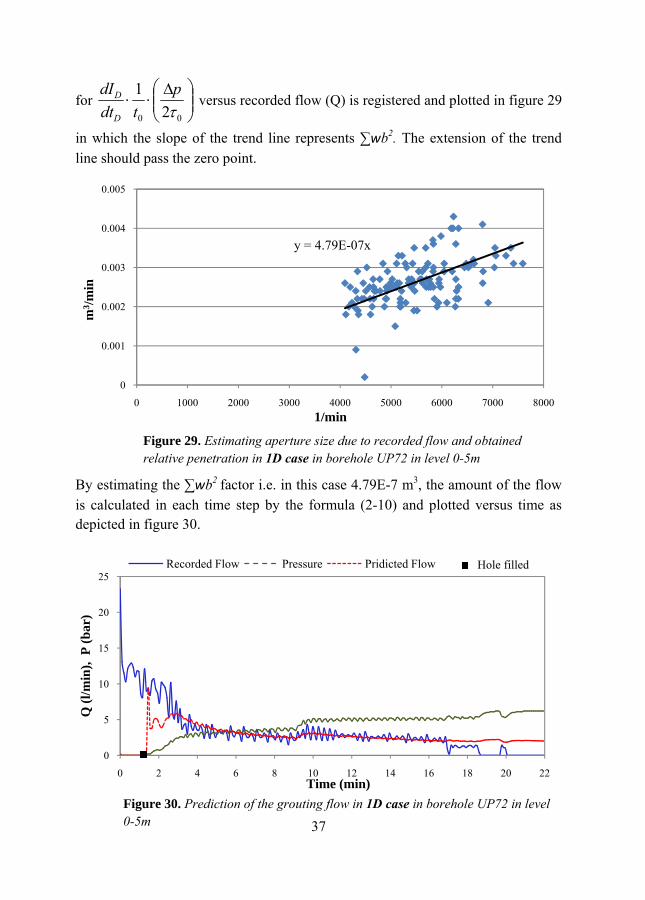
This theory not only can estimate the penetration length, but it also can predict the trend of grouting flow. As this is a 1D flow According to formula (2-10) the data
0
2
4
6
8
10
0 2 4 6 8 10 12 14 16 18 20
Pene
trat
ion
(m)
Time (min)
bmin bcritical
Figure 28. Penetration length due to minimum and critical apertures in 1D case in borehole UP72 in level 0-5m
Lower stop limit
37
for ⎟⎟⎠
⎞⎜⎜⎝
⎛ Δ⋅⋅
00 21
τp
tdtdI
D
D versus recorded flow (Q) is registered and plotted in figure 29
in which the slope of the trend line represents ∑wb2. The extension of the trend line should pass the zero point.
By estimating the ∑wb2 factor i.e. in this case 4.79E-7 m3, the amount of the flow is calculated in each time step by the formula (2-10) and plotted versus time as depicted in figure 30.
y = 4.79E-07x
0
0.001
0.002
0.003
0.004
0.005
0 1000 2000 3000 4000 5000 6000 7000 8000
m3 /m
in
1/min
0
5
10
15
20
25
0 2 4 6 8 10 12 14 16 18 20 22
Q (l
/min
), P
(bar
)
Time (min)
Recorded Flow Pressure Pridicted Flow
Figure 30. Prediction of the grouting flow in 1D case in borehole UP72 in level 0-5m
Figure 29. Estimating aperture size due to recorded flow and obtained relative penetration in 1D case in borehole UP72 in level 0-5m
Hole filled

38
As it is shown, after the first minute which is considered as hole filling period, the trend of estimated flow has a good convergence with the recorded flow in studied period. It should be considered that in these series of calculations time is corrected for changes in pressure while the time dependency of grout properties is neglected. As there is no unexpected variation in flow diagrams, it can be concluded that no jacking has happened (section 5.5) and the rock quality was fairly good which by not a very high pressure, the fractures has been filled up.
5.2.5 Examination of a 2D case
To discuss more on dimensionality and the aperture, a 2D case which has occurred in borehole DP47 in level of 0-5 meter is discussed. The recorded P-Q diagram is as below:
It can be seen that, there is a steady flow with a very slow decreasing rate under a steady pressure. After around 11 minutes the fractures has got filled and no flow is recorded. No hole filling period is considered in this case as no obvious change in pressure or flow has been observed.
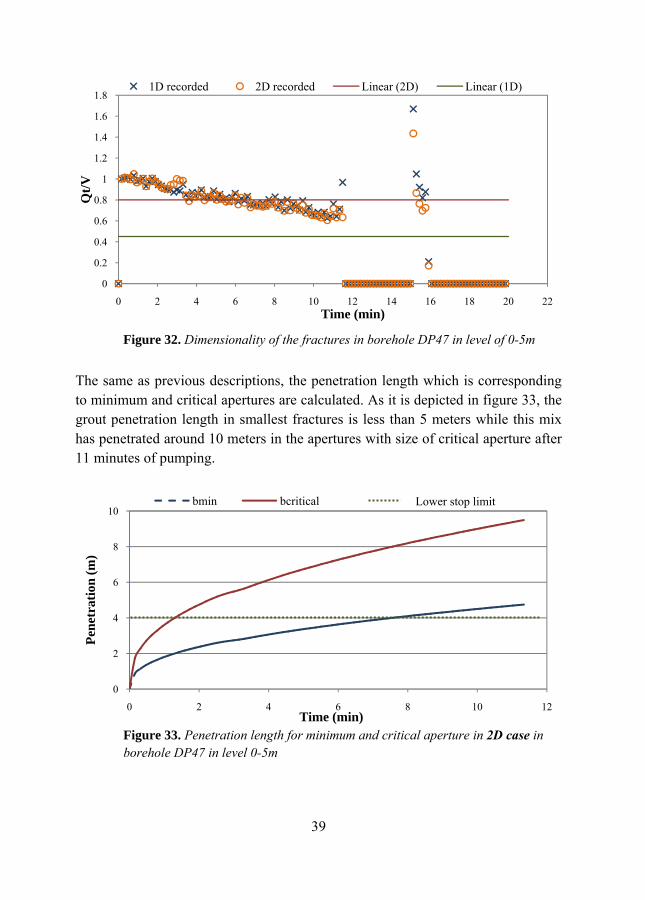
Like the previous case, the first step is to have an idea about dimensionality of fractures. In figure 32 It is shown that (Qt/V) scattered values are in good agreement with Qt/V= 0.8 line which indicates 2D dimensionality.
0
5
10
15
20
25
0 1 2 3 4 5 6 7 8 9 10 11 12 13 14 15 16 17 18 19 20 21
Q (l
/min
), P
(bar
)
Time (min)
Recorded Flow Pressure
Figure 31. Recorded P-Q data in borehole DP47 in level of 0-5m
Hole filled
39
The same as previous descriptions, the penetration length which is corresponding to minimum and critical apertures are calculated. As it is depicted in figure 33, the grout penetration length in smallest fractures is less than 5 meters while this mix has penetrated around 10 meters in the apertures with size of critical aperture after 11 minutes of pumping.
0
0.2
0.4
0.6
0.8
1
1.2
1.4
1.6
1.8
0 2 4 6 8 10 12 14 16 18 20 22
Qt/V
Time (min)
1D recorded 2D recorded Linear (2D) Linear (1D)
0
2
4
6
8
10
0 2 4 6 8 10 12
Pene
trat
ion
(m)
Time (min)
bmin bcritical
Figure 32. Dimensionality of the fractures in borehole DP47 in level of 0-5m
Figure 33. Penetration length for minimum and critical aperture in 2D case in borehole DP47 in level 0-5m
Lower stop limit
40
Setting up a statistical correlation between the flow (Q) and 2
00 212 ⎟⎟
⎠
⎞⎜⎜⎝
⎛ Δ⋅⋅⋅⋅
τπ p
tdtdII
D
DD
the ∑b3 value can be estimated (formula (2-13)).
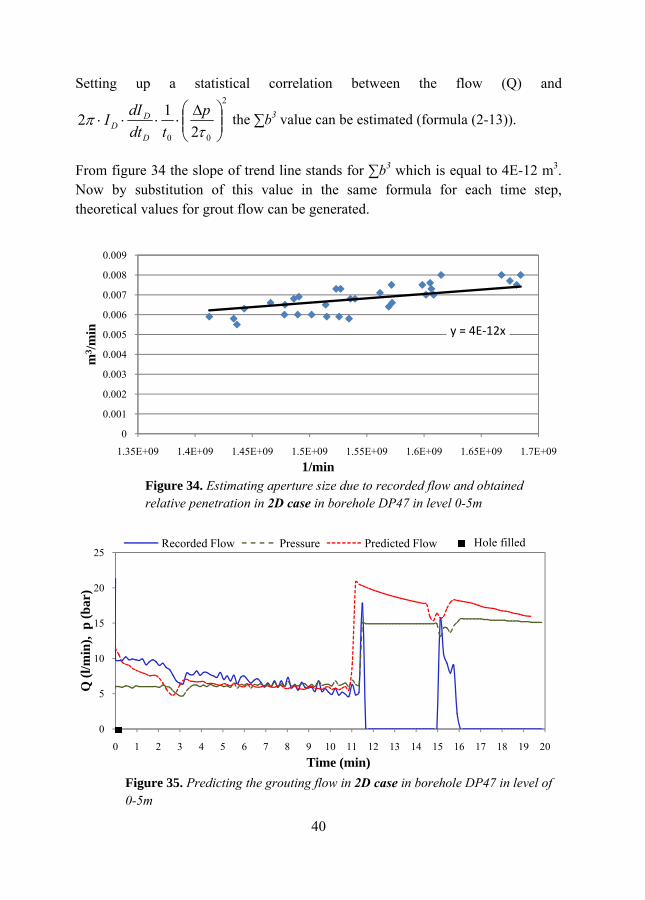
From figure 34 the slope of trend line stands for ∑b3 which is equal to 4E-12 m3. Now by substitution of this value in the same formula for each time step, theoretical values for grout flow can be generated.
y = 4E‐12x
0
0.001
0.002
0.003
0.004
0.005
0.006
0.007
0.008
0.009
1.35E+09 1.4E+09 1.45E+09 1.5E+09 1.55E+09 1.6E+09 1.65E+09 1.7E+09
m3 /m
in
1/min
0
5
10
15
20
25
0 1 2 3 4 5 6 7 8 9 10 11 12 13 14 15 16 17 18 19 20
Q (l
/min
), p
(bar
)
Time (min)
Recorded Flow Pressure Predicted Flow
Figure 34. Estimating aperture size due to recorded flow and obtained relative penetration in 2D case in borehole DP47 in level 0-5m
Figure 35. Predicting the grouting flow in 2D case in borehole DP47 in level of 0-5m
Hole filled
41
As it was expected, there is a fairly good convergence between recorded and predicted flow values in studied period (figure 35).
From registered data in figure 35 the pressure and in consequence the flow are increased in 12th minute but despite steady pressure of 15 bar, no flow is recorded afterwards. In 15th minute a high flow value is registered. There is an obvious difference between recorded and predicted flow which has a decreasing trend in high value. The trend of recorded flow after 12th minute is most probably related to interval closing of the valve by the operator that has affected the flow of grout.
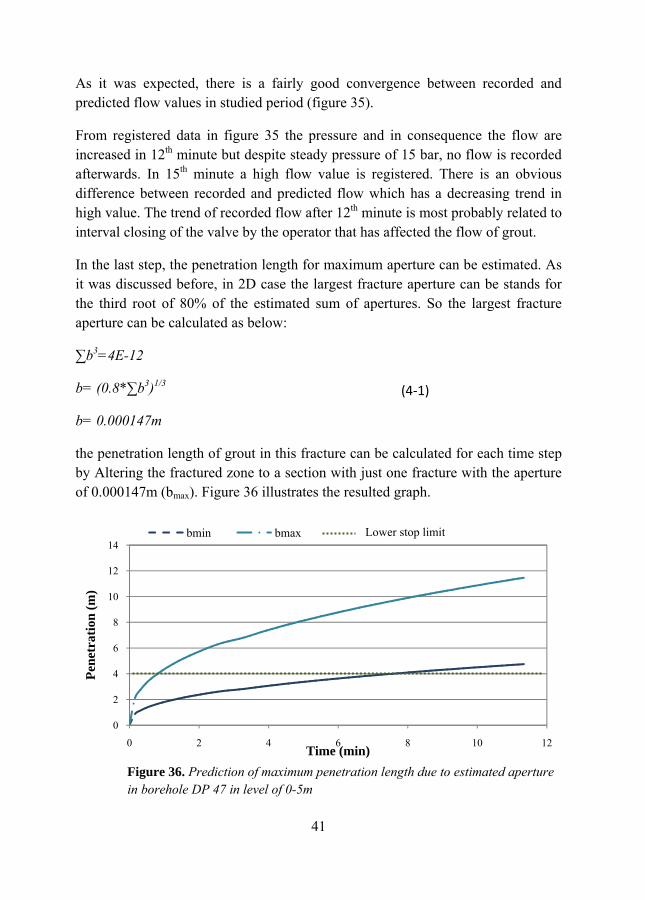
In the last step, the penetration length for maximum aperture can be estimated. As it was discussed before, in 2D case the largest fracture aperture can be stands for the third root of 80% of the estimated sum of apertures. So the largest fracture aperture can be calculated as below:
∑b3=4E-12
b= (0.8*∑b3)1/3
b= 0.000147m
the penetration length of grout in this fracture can be calculated for each time step by Altering the fractured zone to a section with just one fracture with the aperture of 0.000147m (bmax). Figure 36 illustrates the resulted graph.
0
2
4
6
8
10
12
14
0 2 4 6 8 10 12
Pene
trat
ion
(m)
Time (min)
bmin bmax
Figure 36. Prediction of maximum penetration length due to estimated aperture in borehole DP 47 in level of 0-5m
(4‐1)
Lower stop limit
42
The estimated grout penetration has some differences with the measured one and there is a need to have a correction factor to precise the penetration as below:
∫= dtQV estest
est
meatheocorr V
VII .= For 1D case and
est
meatheocorr V
VII .= For 2D case
The penetration lengths in fractures with smallest and largest aperture are calculated to be 5 and 11.8 meter respectively (Figure 36). Measured volume is 84.2 litres while the estimated grout volume (data from figure 35) is 80.9. Considering formula (5-4) the correction factor of 1.02 is required that change the penetration to 12.04 meter.
Water loss measurement test as a complementary study can be performed. Penetration length can be calculated for the aperture size obtained from this test and by comparing it with the results of the theory, calculations can be verified.
By setting up the minimum and maximum penetration length limits according to design, the efficiency of grouting work in this borehole can be examined. Like the 1D case in borehole UP72, by considering the maximum distance of 4 meters as minimum penetration length (figure 23), the first stop criteria is fulfilled after 8 minutes.
To not let the grout flow further, the second stop criterion should be applied in the way that the grouting work should stop before the penetration for the largest fracture aperture reaches a certain maximum value (Kobayashi, Stille 2008). For the largest aperture, the grout is penetrated around 11 meters in about 12 minutes of pumping. It should be noticed that this penetration does not account for variation in aperture in fracture plan and along the borehole. Furthermore this process is performed in primary boreholes which are the first grouting holes in the fractured zone and may let the grout flow further than the desired distance. High water cement ratio of the mix and in result low yield stress and viscosity of the grout by considering relatively high used pressure have had significant role in the achieved result.
(5-2)
(5-3)
(5-4)
43
The next part is to analyze grouting process in borehole DP49 in 3 different levels with consideration of geology of the area this borehole located in to examine how this theory works in this region.
5.3 Borehole DP49:
The objectives of examining the grouting work in borehole DP49 which is located in gallery in elevation of 153 ma.s.l in the right embankment wall are:
• To examine and verify the theory in this specific zone. • To study the effect of the rock quality and geology of the region on the
obtained results. • To discuss the success of the grouting in this borehole and impose
suggestions in order to optimizing further grouting works in similar condition by using this application.
Below there are facts about the situation and conditions this borehole dealing with:
• This is the 49th primary borehole in downstream row. The first borehole in this row is situated 180 meter further than the gallery portal. A concrete cut off wall is decided to be casted in the area between the gallery portal and the first borehole (see appendix B).
• Borehole length is 60 meter with a 10 degree alignment from vertical line. • Upper 30 meters of the borehole is situated in Bakhtiari formation and the
rest is drilled in Aghajari formation (figure 37). • Ground water level is 14 meter lower than the bed of the galley in elevation
of 153ma.s.l (ground water level is 139 ma.s.l.) • Lugeon value in borehole DP50 which is situated just beside this borehole is
less than 1 in level of 45 to 60 meter (figure 38). • The properties of the used mix are according to table 3. The grouting works
data are depicted in table 4. • Halfway of serpentine distance of two consecutive boreholes is considered
as the minimum required penetration length and is set to be 4m (figure 23). • Study has been performed in 3 different sections of this borehole in 45 to 60
meter beneath the bed of the gallery 153. Height of each section is 5 meters.
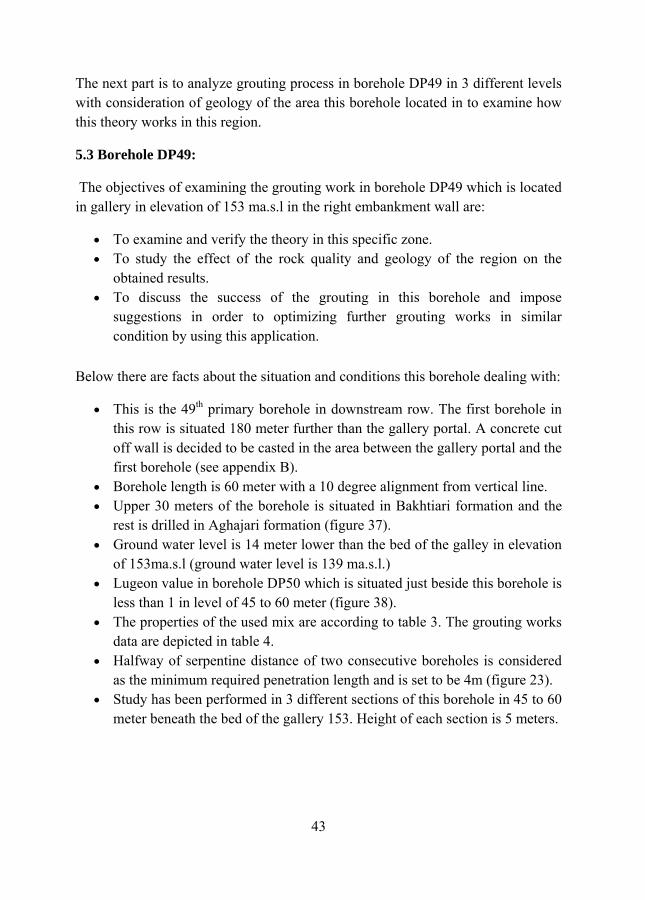
G
Tab
Bor
F
routing Section
45 5050 5555 60
3
40
45
50
55
60
ble 4. Data from
rehole DP49
igure 37. RQD a
n Diff. (m)
T(m
5 05 05 0
5
10
15
20
25
30
35
30
2.65
3.52
2.52
13.24
4.27
6.22
15.95
Gallery 153
grouting of bore
and Lugeon value
44
ime min)
Used (
0:15 0:20 10:35 1
10.86
2.61
3.75
6.21
05.85
5
eholeDP49 in 3 di
e in borehole DP5
Cement kg)
Use
0 100 100
ifferent sections.
Note: effect oduringgroutinneglec
50 in level 45-60
ed Water (lit.)
T(k
0 4200 6200 1
in this repoof hardening of
g time and capang equipmentted.
meter
Take kg/m) 4.27 6.22 5.95
ort the f grout
acity of ts are
45
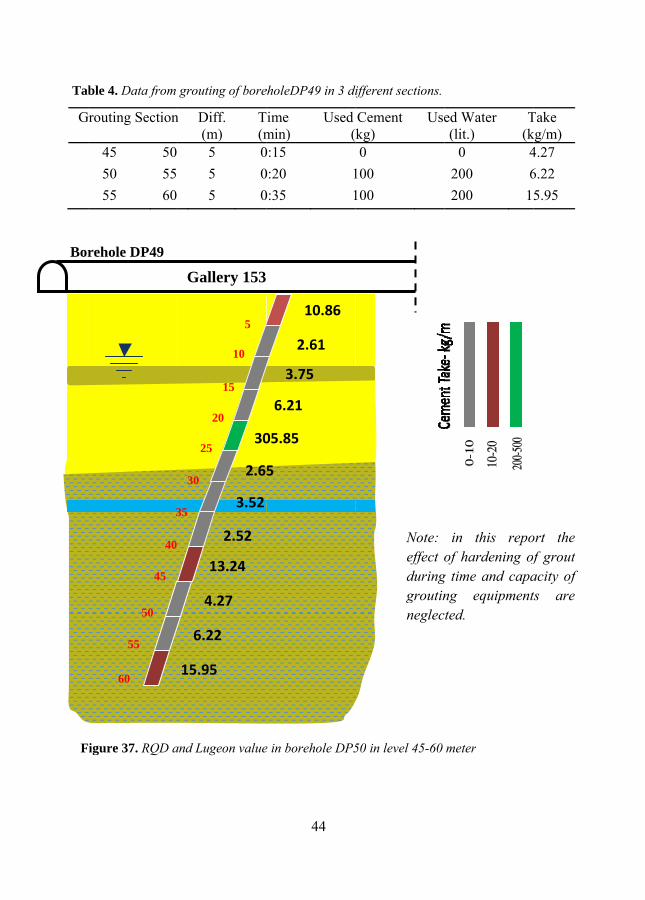
Figure 38. RQD and Lugeon value in borehole DP50 in level 45-60 meter
46
Figure 38 shows high values for RQD and low lugeon values in level of 45 to 60 meters of borehole DP50 which is situated right after borehole DP49, hence its geological properties (rock quality and conductivity) can be generalized to the borehole which will be studied (DP49).
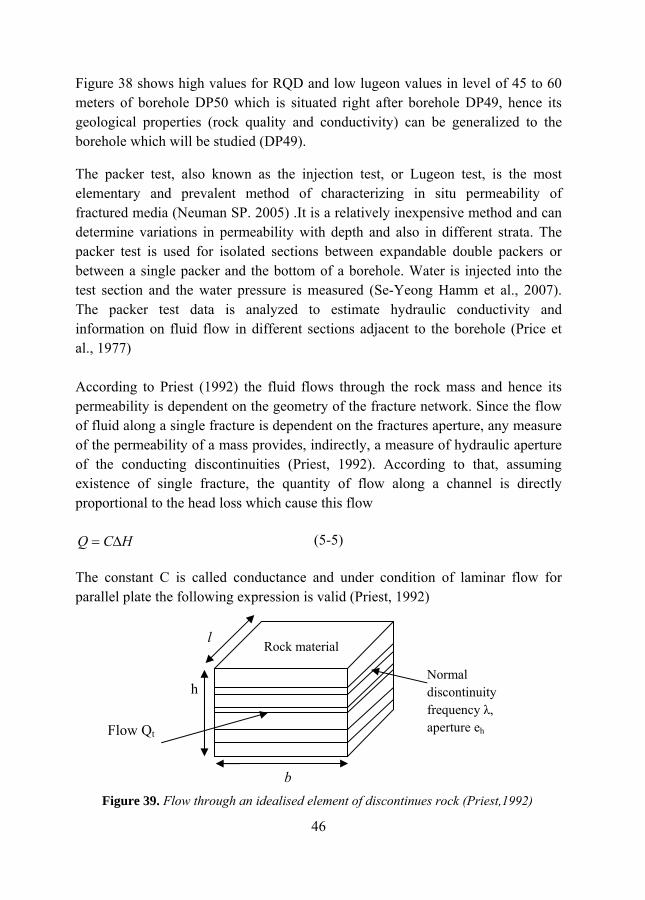
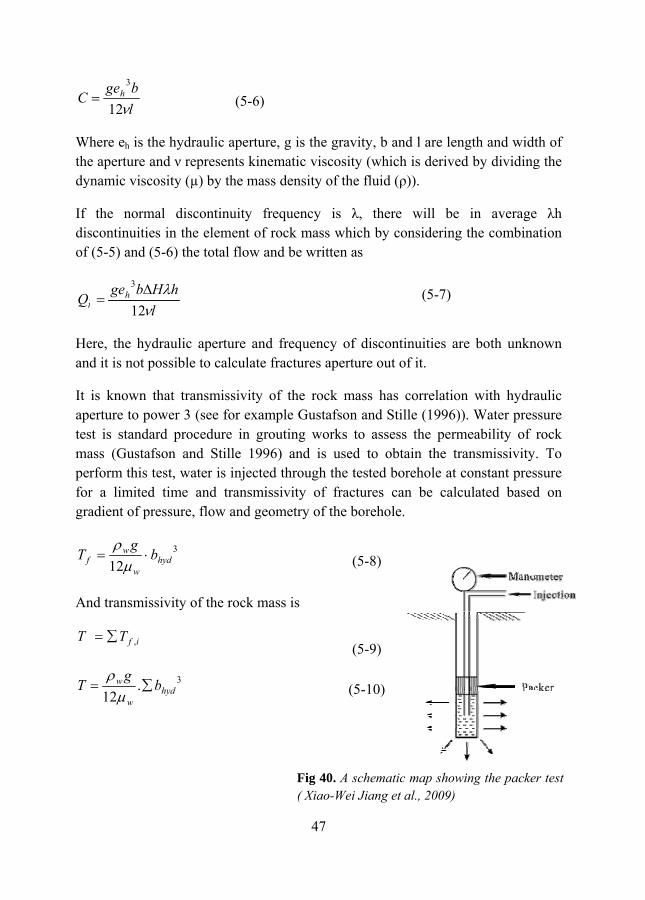
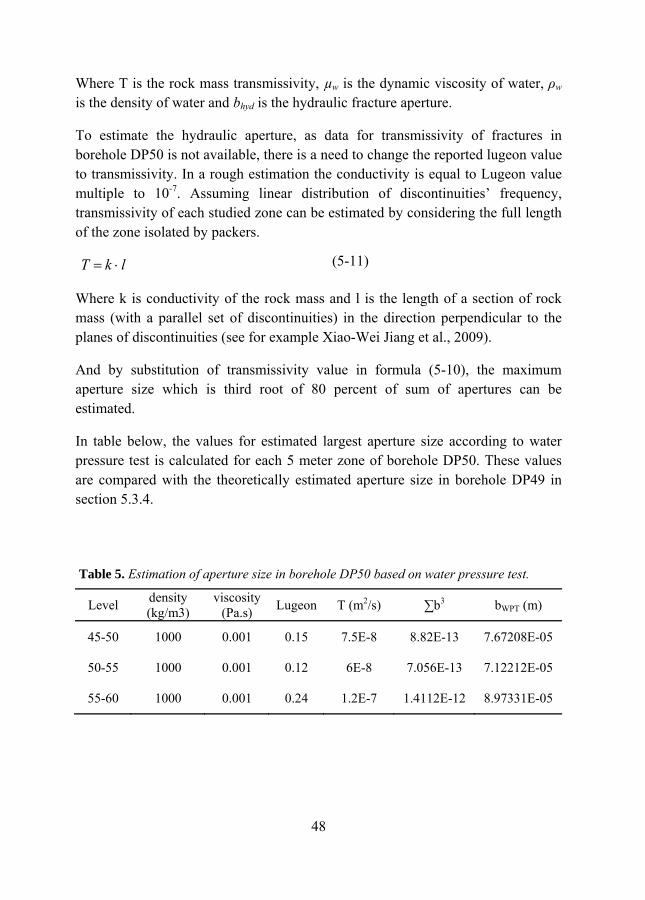
The packer test, also known as the injection test, or Lugeon test, is the most elementary and prevalent method of characterizing in situ permeability of fractured media (Neuman SP. 2005) .It is a relatively inexpensive method and can determine variations in permeability with depth and also in different strata. The packer test is used for isolated sections between expandable double packers or between a single packer and the bottom of a borehole. Water is injected into the test section and the water pressure is measured (Se-Yeong Hamm et al., 2007). The packer test data is analyzed to estimate hydraulic conductivity and information on fluid flow in different sections adjacent to the borehole (Price et al., 1977) According to Priest (1992) the fluid flows through the rock mass and hence its permeability is dependent on the geometry of the fracture network. Since the flow of fluid along a single fracture is dependent on the fractures aperture, any measure of the permeability of a mass provides, indirectly, a measure of hydraulic aperture of the conducting discontinuities (Priest, 1992). According to that, assuming existence of single fracture, the quantity of flow along a channel is directly proportional to the head loss which cause this flow
HCQ Δ=
The constant C is called conductance and under condition of laminar flow for parallel plate the following expression is valid (Priest, 1992)
(5-5)
Figure 39. Flow through an idealised element of discontinues rock (Priest,1992)
h
l
b
Flow Qt
Normal discontinuity frequency λ, aperture eh
Rock material
C
Wthedy
If disof
Qt
Hean
It aptesmapeforgra
fT
An
T
T
lbgeh
ν12
3
=
Where eh is the hye aperture and ν
ynamic viscosity
the normal dscontinuities in
f (5-5) and (5-6)
lhHbgeh
t νλ
12
3 Δ=
ere, the hydraund it is not possib
is known that erture to powerst is standard pass (Gustafson rform this test, r a limited timadient of pressu
3
12 hydw
wf b
g⋅=
μρ
nd transmissivit
ifT ,∑=
3.12 hyd
w
w bg
∑=μ
ρ
ydraulic aperturν represents kiny (µ) by the mas
discontinuity fthe element of the total flow a
lic aperture andble to calculate
transmissivity r 3 (see for examprocedure in gr
and Stille 199water is injecte
me and transmiure, flow and ge
ty of the rock m
3
(5-6)
47
re, g is the gravnematic viscosityss density of the
frequency is λf rock mass whiand be written a
d frequency of fractures apertu
of the rock mample Gustafsonrouting works t96) and is useded through the tissivity of fraceometry of the b
mass is
(
(
(5
Fig 40. A s( Xiao-Wei
vity, b and l are y (which is derie fluid (ρ)).
λ, there will ich by considerias
f discontinuitiesure out of it.
ass has correlan and Stille (199to assess the pd to obtain thetested borehole tures can be c
borehole.
(5-7
(5-8)
(5-9)
5-10)
schematic map shJiang et al., 200
length and widived by dividing
be in averageing the combina
s are both unkn
ation with hydr96)). Water presermeability of
e transmissivityat constant pres
calculated based
7)
howing the packe9)
dth of g the
e λh ation
nown
raulic ssure rock
y. To ssure d on
er test
48
Where T is the rock mass transmissivity, µw is the dynamic viscosity of water, ρw is the density of water and bhyd is the hydraulic fracture aperture.
To estimate the hydraulic aperture, as data for transmissivity of fractures in borehole DP50 is not available, there is a need to change the reported lugeon value to transmissivity. In a rough estimation the conductivity is equal to Lugeon value multiple to 10-7. Assuming linear distribution of discontinuities’ frequency, transmissivity of each studied zone can be estimated by considering the full length of the zone isolated by packers.
lkT ⋅=
Where k is conductivity of the rock mass and l is the length of a section of rock mass (with a parallel set of discontinuities) in the direction perpendicular to the planes of discontinuities (see for example Xiao-Wei Jiang et al., 2009).
And by substitution of transmissivity value in formula (5-10), the maximum aperture size which is third root of 80 percent of sum of apertures can be estimated.
In table below, the values for estimated largest aperture size according to water pressure test is calculated for each 5 meter zone of borehole DP50. These values are compared with the theoretically estimated aperture size in borehole DP49 in section 5.3.4.
Level density (kg/m3)
viscosity (Pa.s) Lugeon T (m2/s) ∑b3 bWPT (m)
45-50 1000 0.001 0.15 7.5E-8 8.82E-13 7.67208E-05
50-55 1000 0.001 0.12 6E-8 7.056E-13 7.12212E-05
55-60 1000 0.001 0.24 1.2E-7 1.4112E-12 8.97331E-05
Table 5. Estimation of aperture size in borehole DP50 based on water pressure test.
(5-11)
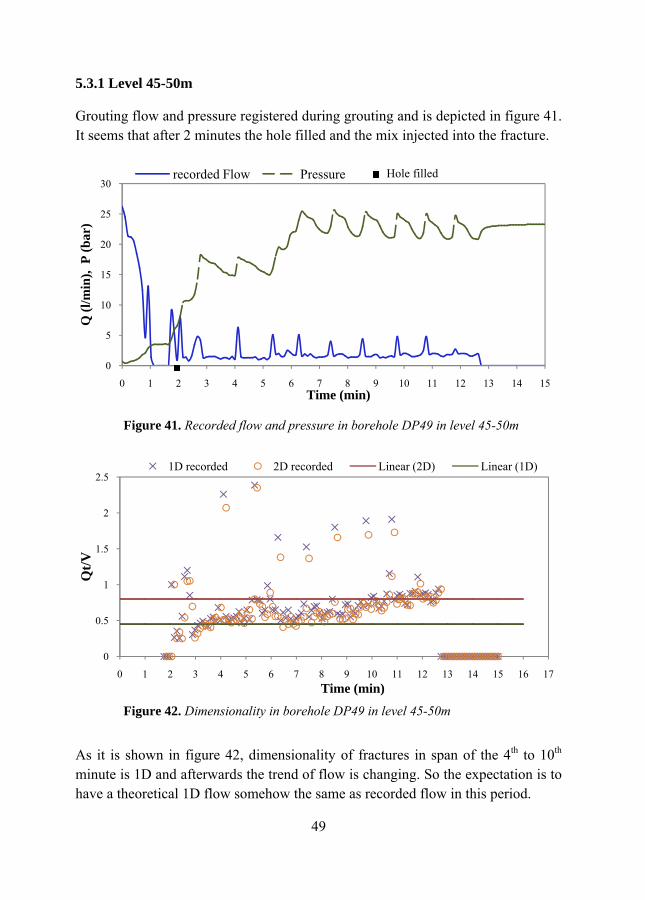
49
5.3.1 Level 45-50m
Grouting flow and pressure registered during grouting and is depicted in figure 41. It seems that after 2 minutes the hole filled and the mix injected into the fracture.
As it is shown in figure 42, dimensionality of fractures in span of the 4th to 10th minute is 1D and afterwards the trend of flow is changing. So the expectation is to have a theoretical 1D flow somehow the same as recorded flow in this period.
0
5
10
15
20
25
30
0 1 2 3 4 5 6 7 8 9 10 11 12 13 14 15
Q (l
/min
), P
(bar
)
Time (min)
recorded Flow Pressure
0
0.5
1
1.5
2
2.5
0 1 2 3 4 5 6 7 8 9 10 11 12 13 14 15 16 17
Qt/V
Time (min)
1D recorded 2D recorded Linear (2D) Linear (1D)
Figure 42. Dimensionality in borehole DP49 in level 45-50m
Figure 41. Recorded flow and pressure in borehole DP49 in level 45-50m
Hole filled
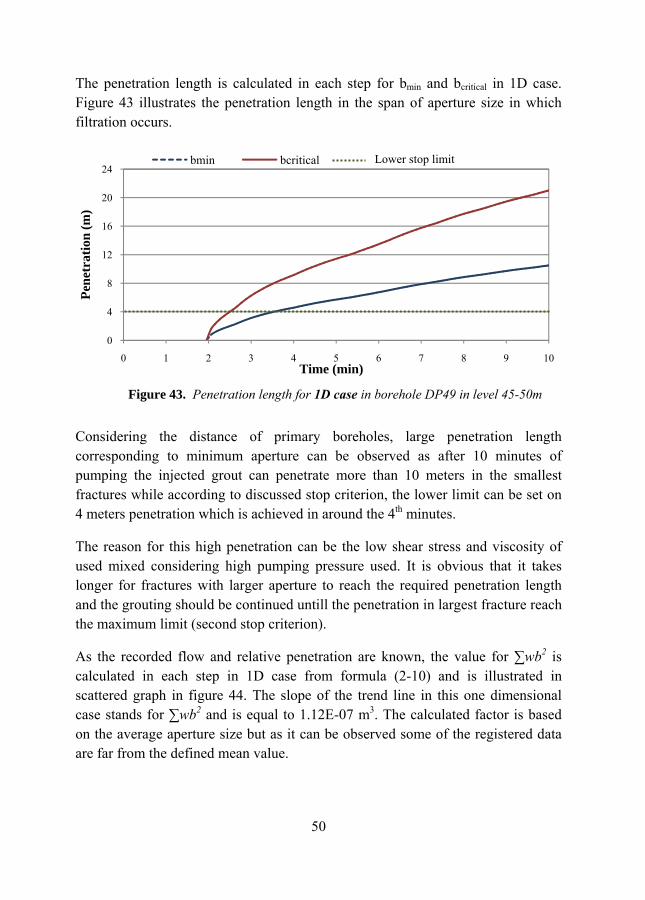
50
The penetration length is calculated in each step for bmin and bcritical in 1D case. Figure 43 illustrates the penetration length in the span of aperture size in which filtration occurs.
Considering the distance of primary boreholes, large penetration length corresponding to minimum aperture can be observed as after 10 minutes of pumping the injected grout can penetrate more than 10 meters in the smallest fractures while according to discussed stop criterion, the lower limit can be set on 4 meters penetration which is achieved in around the 4th minutes.
The reason for this high penetration can be the low shear stress and viscosity of used mixed considering high pumping pressure used. It is obvious that it takes longer for fractures with larger aperture to reach the required penetration length and the grouting should be continued untill the penetration in largest fracture reach the maximum limit (second stop criterion).
As the recorded flow and relative penetration are known, the value for ∑wb2 is calculated in each step in 1D case from formula (2-10) and is illustrated in scattered graph in figure 44. The slope of the trend line in this one dimensional case stands for ∑wb2 and is equal to 1.12E-07 m3. The calculated factor is based on the average aperture size but as it can be observed some of the registered data are far from the defined mean value.
0
4
8
12
16
20
24
0 1 2 3 4 5 6 7 8 9 10
Pene
trat
ion
(m)
Time (min)
bmin bcritical
Figure 43. Penetration length for 1D case in borehole DP49 in level 45-50m
Lower stop limit
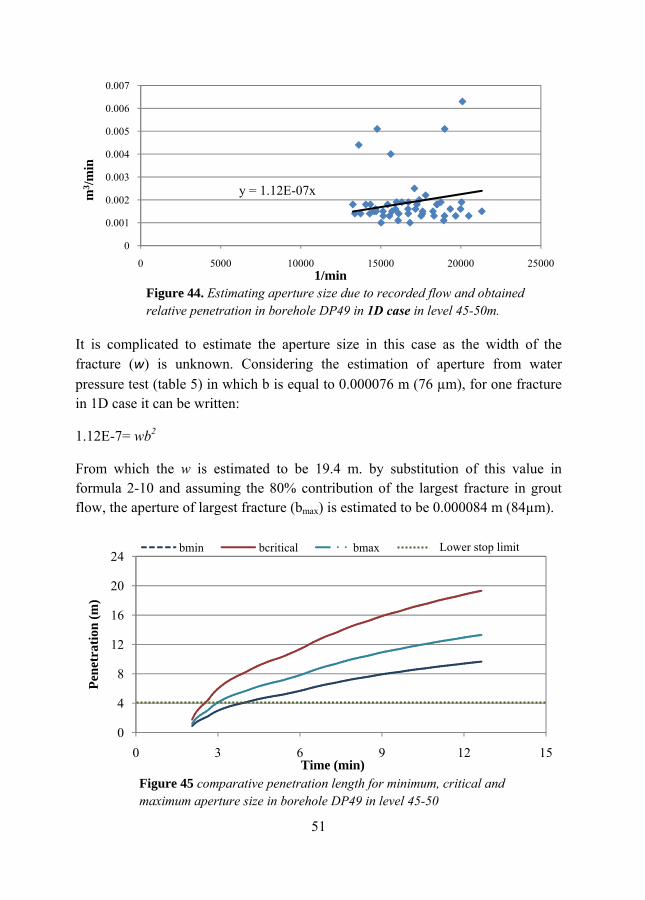
51
It is complicated to estimate the aperture size in this case as the width of the fracture (w) is unknown. Considering the estimation of aperture from water pressure test (table 5) in which b is equal to 0.000076 m (76 µm), for one fracture in 1D case it can be written:
1.12E-7= wb2
From which the w is estimated to be 19.4 m. by substitution of this value in formula 2-10 and assuming the 80% contribution of the largest fracture in grout flow, the aperture of largest fracture (bmax) is estimated to be 0.000084 m (84µm).
y = 1.12E-07x
0
0.001
0.002
0.003
0.004
0.005
0.006
0.007
0 5000 10000 15000 20000 25000
m3 /m
in
1/min
0
4
8
12
16
20
24
0 3 6 9 12 15
Pene
trat
ion
(m)
Time (min)
bmin bcritical bmax
Figure 44. Estimating aperture size due to recorded flow and obtained relative penetration in borehole DP49 in 1D case in level 45-50m.
Figure 45 comparative penetration length for minimum, critical and maximum aperture size in borehole DP49 in level 45-50
Lower stop limit
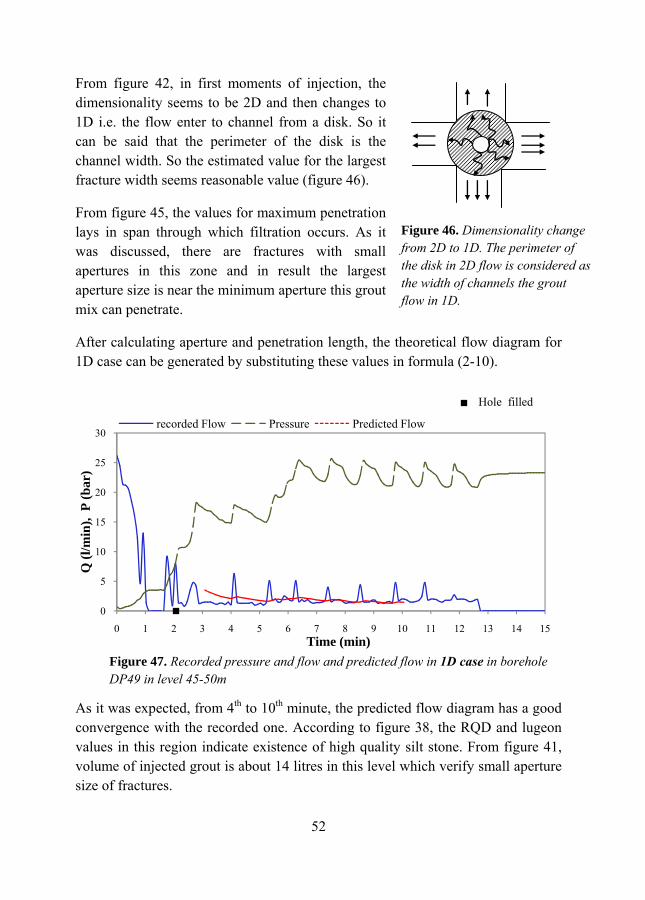
52
From figure 42, in first moments of injection, the dimensionality seems to be 2D and then changes to 1D i.e. the flow enter to channel from a disk. So it can be said that the perimeter of the disk is the channel width. So the estimated value for the largest fracture width seems reasonable value (figure 46).
From figure 45, the values for maximum penetration lays in span through which filtration occurs. As it was discussed, there are fractures with small apertures in this zone and in result the largest aperture size is near the minimum aperture this grout mix can penetrate.
After calculating aperture and penetration length, the theoretical flow diagram for 1D case can be generated by substituting these values in formula (2-10).
As it was expected, from 4th to 10th minute, the predicted flow diagram has a good convergence with the recorded one. According to figure 38, the RQD and lugeon values in this region indicate existence of high quality silt stone. From figure 41, volume of injected grout is about 14 litres in this level which verify small aperture size of fractures.
0
5
10
15
20
25
30
0 1 2 3 4 5 6 7 8 9 10 11 12 13 14 15
Q (l
/min
), P
(bar
)
Time (min)
recorded Flow Pressure Predicted Flow
Figure 47. Recorded pressure and flow and predicted flow in 1D case in borehole DP49 in level 45-50m
Hole filled
Figure 46. Dimensionality change from 2D to 1D. The perimeter of the disk in 2D flow is considered as the width of channels the grout flow in 1D.
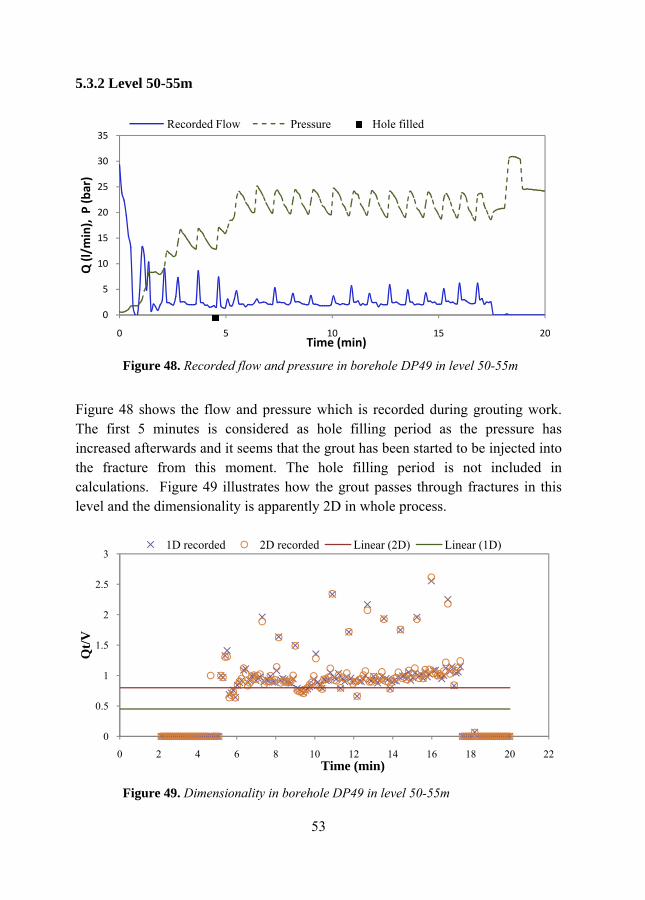
53
5.3.2 Level 50-55m
Figure 48 shows the flow and pressure which is recorded during grouting work. The first 5 minutes is considered as hole filling period as the pressure has increased afterwards and it seems that the grout has been started to be injected into the fracture from this moment. The hole filling period is not included in calculations. Figure 49 illustrates how the grout passes through fractures in this level and the dimensionality is apparently 2D in whole process.
0
5
10
15
20
25
30
35
0 5 10 15 20
Q (l/m
in), P (b
ar)
Time (min)
Recorded Flow Pressure
0
0.5
1
1.5
2
2.5
3
0 2 4 6 8 10 12 14 16 18 20 22
Qt/V
Time (min)
1D recorded 2D recorded Linear (2D) Linear (1D)
Figure 49. Dimensionality in borehole DP49 in level 50-55m
Figure 48. Recorded flow and pressure in borehole DP49 in level 50-55m
Hole filled
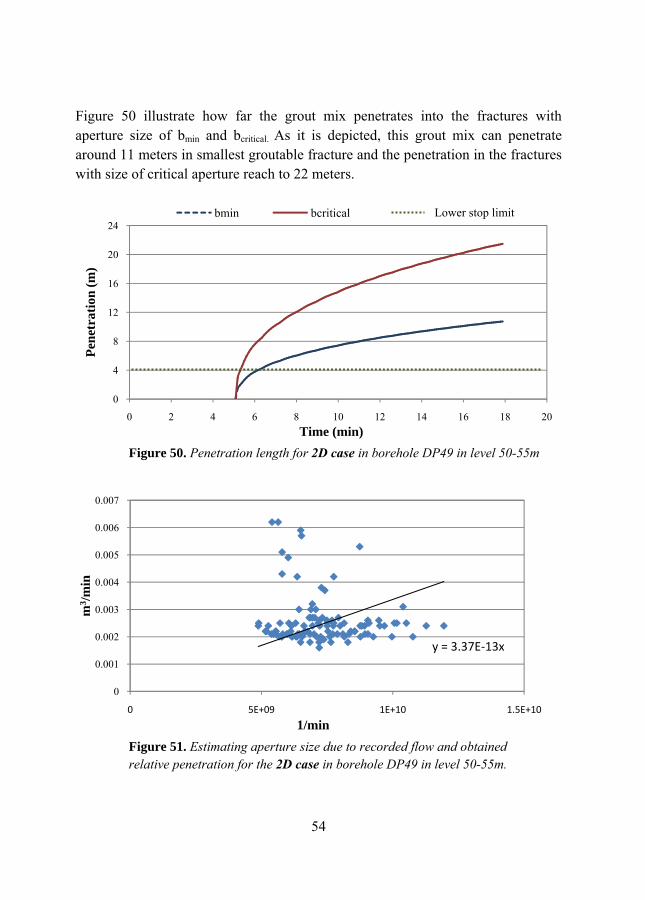
54
Figure 50 illustrate how far the grout mix penetrates into the fractures with aperture size of bmin and bcritical. As it is depicted, this grout mix can penetrate around 11 meters in smallest groutable fracture and the penetration in the fractures with size of critical aperture reach to 22 meters.
0
4
8
12
16
20
24
0 2 4 6 8 10 12 14 16 18 20
Pene
trat
ion
(m)
Time (min)
bmin bcritical
y = 3.37E‐13x
0
0.001
0.002
0.003
0.004
0.005
0.006
0.007
0 5E+09 1E+10 1.5E+10
m3 /m
in
1/minFigure 51. Estimating aperture size due to recorded flow and obtained relative penetration for the 2D case in borehole DP49 in level 50-55m.
Figure 50. Penetration length for 2D case in borehole DP49 in level 50-55m
Lower stop limit
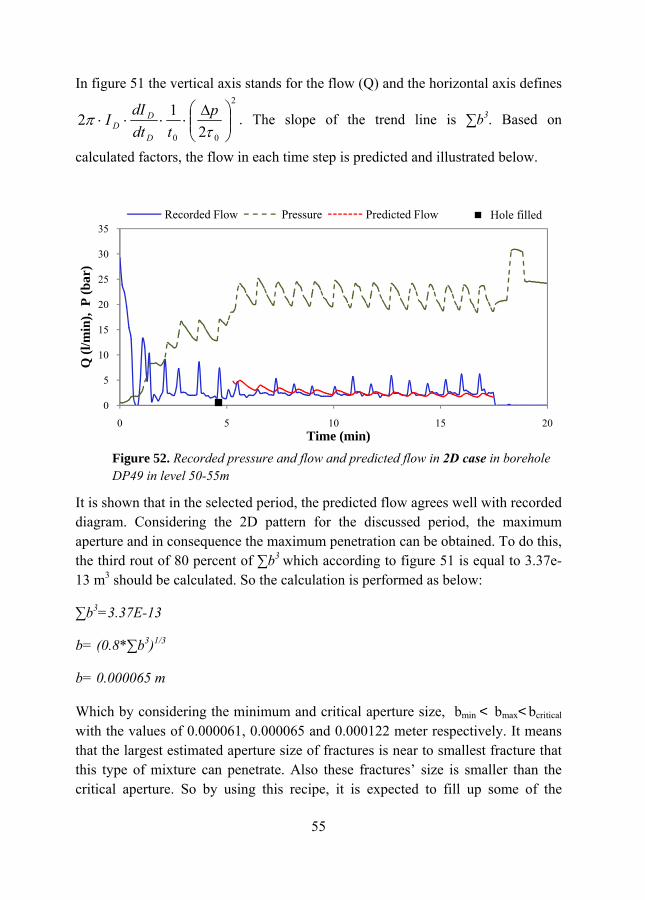
55
In figure 51 the vertical axis stands for the flow (Q) and the horizontal axis defines2
00 212 ⎟⎟
⎠
⎞⎜⎜⎝
⎛ Δ⋅⋅⋅⋅
τπ p
tdtdI
ID
DD . The slope of the trend line is ∑b3. Based on
calculated factors, the flow in each time step is predicted and illustrated below.
It is shown that in the selected period, the predicted flow agrees well with recorded diagram. Considering the 2D pattern for the discussed period, the maximum aperture and in consequence the maximum penetration can be obtained. To do this, the third rout of 80 percent of ∑b3 which according to figure 51 is equal to 3.37e-13 m3 should be calculated. So the calculation is performed as below:
∑b3=3.37E-13
b= (0.8*∑b3)1/3
b= 0.000065 m
Which by considering the minimum and critical aperture size, bmin < bmax<bcritical
with the values of 0.000061, 0.000065 and 0.000122 meter respectively. It means that the largest estimated aperture size of fractures is near to smallest fracture that this type of mixture can penetrate. Also these fractures’ size is smaller than the critical aperture. So by using this recipe, it is expected to fill up some of the
0
5
10
15
20
25
30
35
0 5 10 15 20
Q (l
/min
), P
(bar
)
Time (min)
Recorded Flow Pressure Predicted Flow
Figure 52. Recorded pressure and flow and predicted flow in 2D case in borehole DP49 in level 50-55m
Hole filled
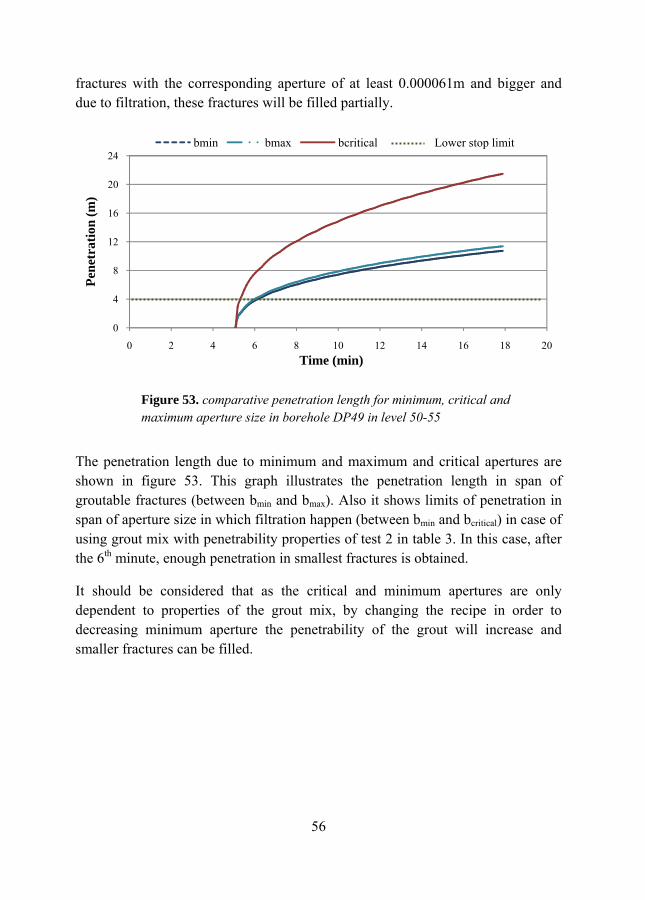
56
fractures with the corresponding aperture of at least 0.000061m and bigger and due to filtration, these fractures will be filled partially.
The penetration length due to minimum and maximum and critical apertures are shown in figure 53. This graph illustrates the penetration length in span of groutable fractures (between bmin and bmax). Also it shows limits of penetration in span of aperture size in which filtration happen (between bmin and bcritical) in case of using grout mix with penetrability properties of test 2 in table 3. In this case, after the 6th minute, enough penetration in smallest fractures is obtained.
It should be considered that as the critical and minimum apertures are only dependent to properties of the grout mix, by changing the recipe in order to decreasing minimum aperture the penetrability of the grout will increase and smaller fractures can be filled.
0
4
8
12
16
20
24
0 2 4 6 8 10 12 14 16 18 20
Pene
trat
ion
(m)
Time (min)
bmin bmax bcritical
Figure 53. comparative penetration length for minimum, critical and maximum aperture size in borehole DP49 in level 50-55
Lower stop limit
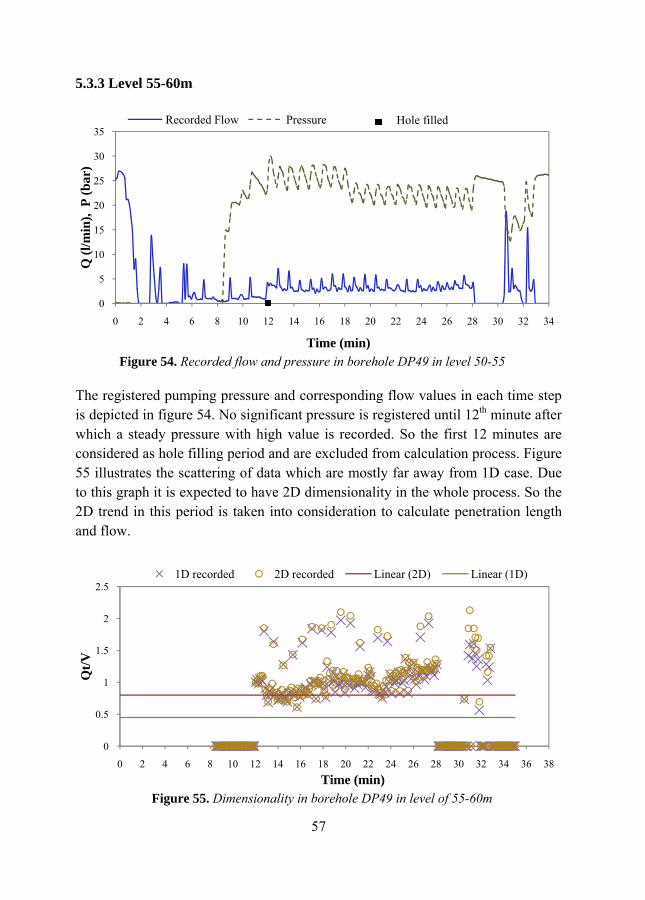
57
5.3.3 Level 55-60m
The registered pumping pressure and corresponding flow values in each time step is depicted in figure 54. No significant pressure is registered until 12th minute after which a steady pressure with high value is recorded. So the first 12 minutes are considered as hole filling period and are excluded from calculation process. Figure 55 illustrates the scattering of data which are mostly far away from 1D case. Due to this graph it is expected to have 2D dimensionality in the whole process. So the 2D trend in this period is taken into consideration to calculate penetration length and flow.
0
5
10
15
20
25
30
35
0 2 4 6 8 10 12 14 16 18 20 22 24 26 28 30 32 34
Q (l
/min
), P
(bar
)
Time (min)
Recorded Flow Pressure
0
0.5
1
1.5
2
2.5
0 2 4 6 8 10 12 14 16 18 20 22 24 26 28 30 32 34 36 38
Qt/V
Time (min)
1D recorded 2D recorded Linear (2D) Linear (1D)
Figure 55. Dimensionality in borehole DP49 in level of 55-60m
Figure 54. Recorded flow and pressure in borehole DP49 in level 50-55
Hole filled
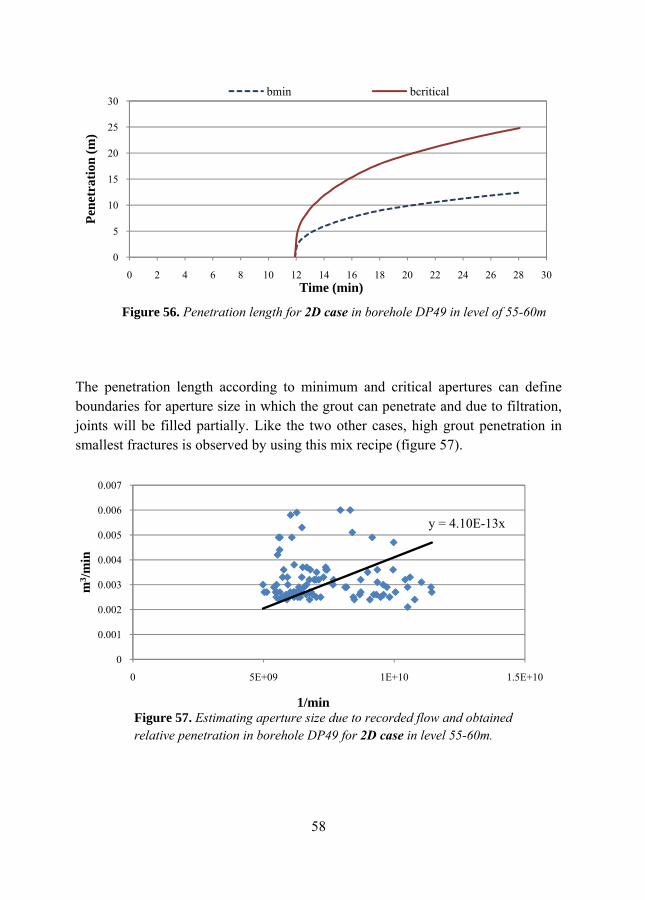
58
The penetration length according to minimum and critical apertures can define boundaries for aperture size in which the grout can penetrate and due to filtration, joints will be filled partially. Like the two other cases, high grout penetration in smallest fractures is observed by using this mix recipe (figure 57).
0
5
10
15
20
25
30
0 2 4 6 8 10 12 14 16 18 20 22 24 26 28 30
Pene
trat
ion
(m)
Time (min)
bmin bcritical
y = 4.10E-13x
0
0.001
0.002
0.003
0.004
0.005
0.006
0.007
0 5E+09 1E+10 1.5E+10
m3 /m
in
1/min
Figure 56. Penetration length for 2D case in borehole DP49 in level of 55-60m
Figure 57. Estimating aperture size due to recorded flow and obtained relative penetration in borehole DP49 for 2D case in level 55-60m.
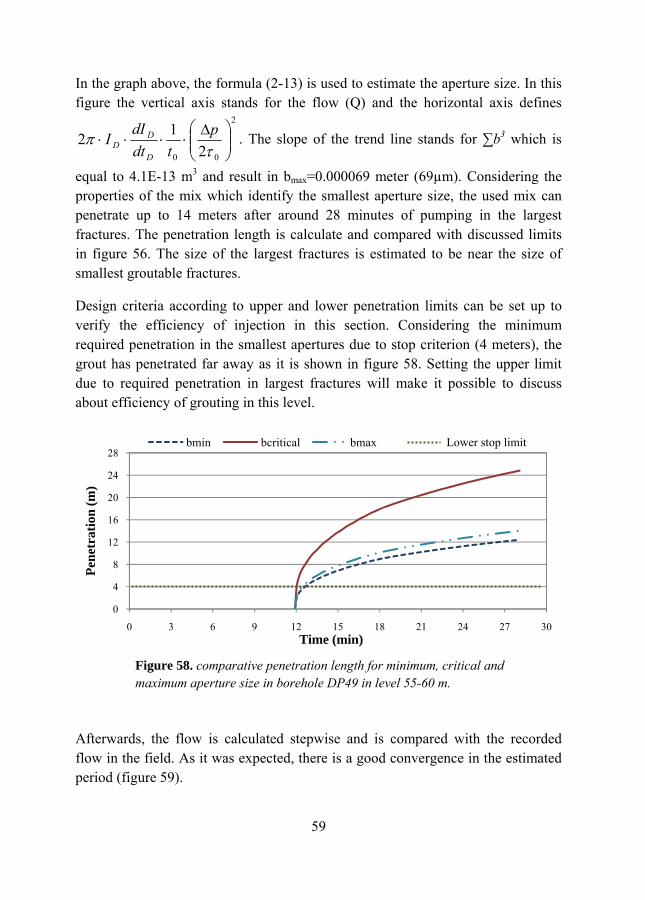
59
In the graph above, the formula (2-13) is used to estimate the aperture size. In this figure the vertical axis stands for the flow (Q) and the horizontal axis defines
2
00 212 ⎟⎟
⎠
⎞⎜⎜⎝
⎛ Δ⋅⋅⋅⋅
τπ p
tdtdI
ID
DD . The slope of the trend line stands for ∑b3 which is
equal to 4.1E-13 m3 and result in bmax=0.000069 meter (69µm). Considering the properties of the mix which identify the smallest aperture size, the used mix can penetrate up to 14 meters after around 28 minutes of pumping in the largest fractures. The penetration length is calculate and compared with discussed limits in figure 56. The size of the largest fractures is estimated to be near the size of smallest groutable fractures.
Design criteria according to upper and lower penetration limits can be set up to verify the efficiency of injection in this section. Considering the minimum required penetration in the smallest apertures due to stop criterion (4 meters), the grout has penetrated far away as it is shown in figure 58. Setting the upper limit due to required penetration in largest fractures will make it possible to discuss about efficiency of grouting in this level.
Afterwards, the flow is calculated stepwise and is compared with the recorded flow in the field. As it was expected, there is a good convergence in the estimated period (figure 59).
0
4
8
12
16
20
24
28
0 3 6 9 12 15 18 21 24 27 30
Pene
trat
ion
(m)
Time (min)
bmin bcritical bmax
Figure 58. comparative penetration length for minimum, critical and maximum aperture size in borehole DP49 in level 55-60 m.
Lower stop limit
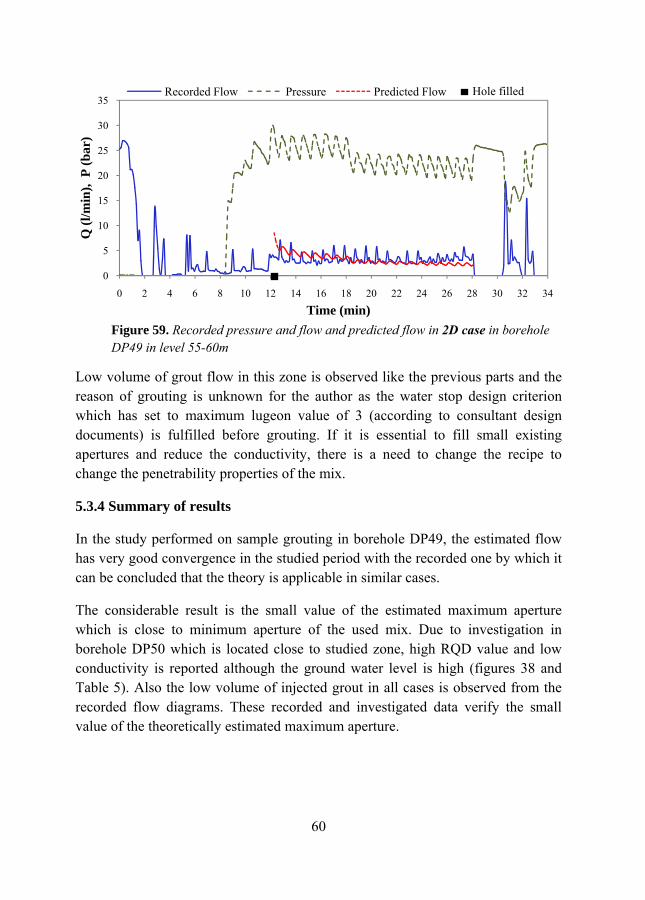
60
Low volume of grout flow in this zone is observed like the previous parts and the reason of grouting is unknown for the author as the water stop design criterion which has set to maximum lugeon value of 3 (according to consultant design documents) is fulfilled before grouting. If it is essential to fill small existing apertures and reduce the conductivity, there is a need to change the recipe to change the penetrability properties of the mix.
5.3.4 Summary of results
In the study performed on sample grouting in borehole DP49, the estimated flow has very good convergence in the studied period with the recorded one by which it can be concluded that the theory is applicable in similar cases.
The considerable result is the small value of the estimated maximum aperture which is close to minimum aperture of the used mix. Due to investigation in borehole DP50 which is located close to studied zone, high RQD value and low conductivity is reported although the ground water level is high (figures 38 and Table 5). Also the low volume of injected grout in all cases is observed from the recorded flow diagrams. These recorded and investigated data verify the small value of the theoretically estimated maximum aperture.
0
5
10
15
20
25
30
35
0 2 4 6 8 10 12 14 16 18 20 22 24 26 28 30 32 34
Q (l
/min
), P
(bar
)
Time (min)
Recorded Flow Pressure Predicted Flow
Figure 59. Recorded pressure and flow and predicted flow in 2D case in borehole DP49 in level 55-60m
Hole filled
61
Level 45-50 Level 50-55 Level 55-60
bWPT btheory bWPT btheory bWPT btheory
7.67E-05 8.5E-05 7.12E-05 6.5E-05 8.97E-05 6.9E-5
In table 6, values for aperture size which are obtained from water pressure test (table 5) in borehole DP50 are compared with theoretically calculated aperture size in borehole DP49. All the values are between minimum and critical apertures for the used grout mix. There is a good agreement between the estimated existing aperture based on water pressure test and the calculated bmax by theory.
Theoretical examination illustrate low efficiency as the used mix cannot fill small existing fractures .also it shows partial filling because of high filtration tendency in groutable fractures.
5.3.5 Optimizing the grouting work by changing the used grout mix
In order to examine effect of variation in mix recipe, the same procedure in borehole DP49 is employed by using the properties of INJ30, w/c=1+ SCII 2% mix based on results from Citybanan project tests which is performed by A.Draganovic (2009). The used cement (INJ30) has a particle size distribution where 95 percent of the material is less than 30 µm in particle size (Cementa AB, June 2007). Water and cement are mixed in ratio of 1. The same levels of borehole DP49 and in result the same values for estimated largest aperture (bmax) has been used. The new grout mix has higher viscosity and shear stress in compare with the used mix in Gotvand project while minimum and critical apertures have been decreased. (table 3 & 7)
mix type viscosity (Pa.s) stress (Pa) bmin (µm) bcritical (µm) INJ30, w/c=1+ SCII 2% 0.01 3.45 40 75
Table 6. Comparing Estimated maximum aperture size in borehole DP50 based on water pressure test with theoretically estimated aperture size in borehole DP49
Table7. Rheological and penetrability properties of the mix according to design of “Citybaban” project.
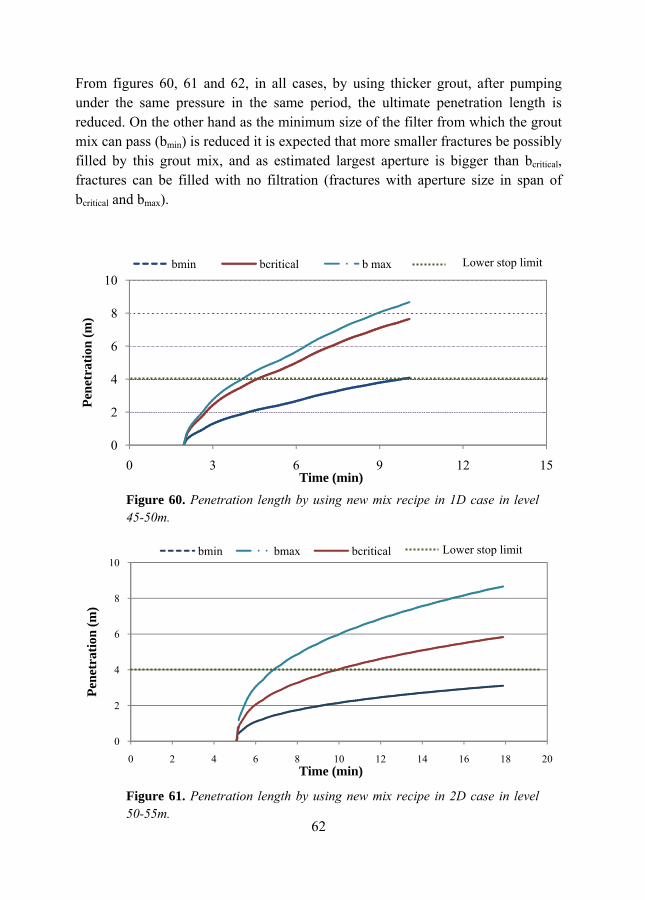
62
From figures 60, 61 and 62, in all cases, by using thicker grout, after pumping under the same pressure in the same period, the ultimate penetration length is reduced. On the other hand as the minimum size of the filter from which the grout mix can pass (bmin) is reduced it is expected that more smaller fractures be possibly filled by this grout mix, and as estimated largest aperture is bigger than bcritical, fractures can be filled with no filtration (fractures with aperture size in span of bcritical and bmax).
0
2
4
6
8
10
0 3 6 9 12 15
Pene
trat
ion
(m)
Time (min)
bmin bcritical b max
0
2
4
6
8
10
0 2 4 6 8 10 12 14 16 18 20
Pene
trat
ion
(m)
Time (min)
bmin bmax bcritical
Figure 60. Penetration length by using new mix recipe in 1D case in level 45-50m.
Figure 61. Penetration length by using new mix recipe in 2D case in level 50-55m.
Lower stop limit
Lower stop limit
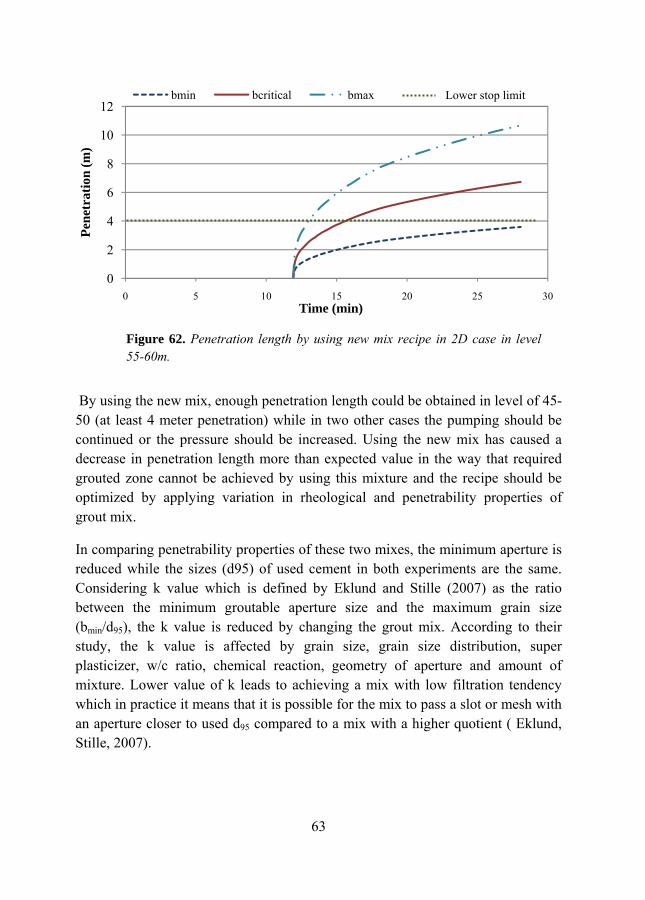
63
By using the new mix, enough penetration length could be obtained in level of 45-50 (at least 4 meter penetration) while in two other cases the pumping should be continued or the pressure should be increased. Using the new mix has caused a decrease in penetration length more than expected value in the way that required grouted zone cannot be achieved by using this mixture and the recipe should be optimized by applying variation in rheological and penetrability properties of grout mix.
In comparing penetrability properties of these two mixes, the minimum aperture is reduced while the sizes (d95) of used cement in both experiments are the same. Considering k value which is defined by Eklund and Stille (2007) as the ratio between the minimum groutable aperture size and the maximum grain size (bmin/d95), the k value is reduced by changing the grout mix. According to their study, the k value is affected by grain size, grain size distribution, super plasticizer, w/c ratio, chemical reaction, geometry of aperture and amount of mixture. Lower value of k leads to achieving a mix with low filtration tendency which in practice it means that it is possible for the mix to pass a slot or mesh with an aperture closer to used d95 compared to a mix with a higher quotient ( Eklund, Stille, 2007).
0
2
4
6
8
10
12
0 5 10 15 20 25 30
Pene
trat
ion
(m)
Time (min)
bmin bcritical bmax
Figure 62. Penetration length by using new mix recipe in 2D case in level 55-60m.
Lower stop limit
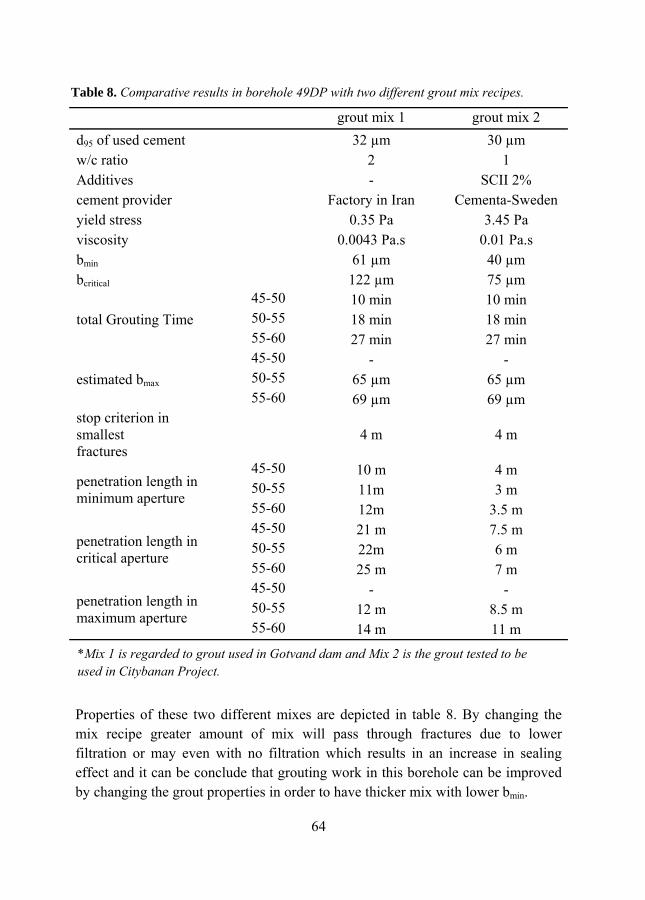
64
grout mix 1 grout mix 2 d95 of used cement 32 µm 30 µm w/c ratio 2 1 Additives - SCII 2% cement provider Factory in Iran Cementa-Sweden yield stress 0.35 Pa 3.45 Pa viscosity 0.0043 Pa.s 0.01 Pa.s bmin 61 µm 40 µm bcritical 122 µm 75 µm
total Grouting Time 45-50 10 min 10 min 50-55 18 min 18 min 55-60 27 min 27 min
estimated bmax 45-50 - - 50-55 65 µm 65 µm 55-60 69 µm 69 µm
stop criterion in smallest fractures
4 m 4 m
penetration length in minimum aperture
45-50 10 m 4 m 50-55 11m 3 m 55-60 12m 3.5 m
penetration length in critical aperture
45-50 21 m 7.5 m 50-55 22m 6 m 55-60 25 m 7 m
penetration length in maximum aperture
45-50 - - 50-55 12 m 8.5 m 55-60 14 m 11 m
Properties of these two different mixes are depicted in table 8. By changing the mix recipe greater amount of mix will pass through fractures due to lower filtration or may even with no filtration which results in an increase in sealing effect and it can be conclude that grouting work in this borehole can be improved by changing the grout properties in order to have thicker mix with lower bmin.
Table 8. Comparative results in borehole 49DP with two different grout mix recipes.
*Mix 1 is regarded to grout used in Gotvand dam and Mix 2 is the grout tested to be used in Citybanan Project.
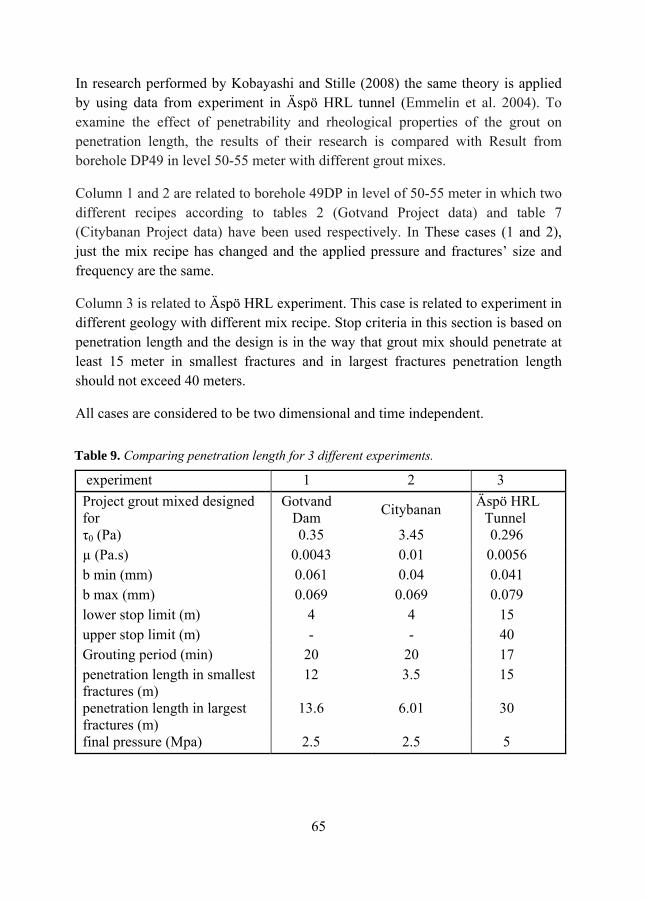
65
In research performed by Kobayashi and Stille (2008) the same theory is applied by using data from experiment in Äspö HRL tunnel (Emmelin et al. 2004). To examine the effect of penetrability and rheological properties of the grout on penetration length, the results of their research is compared with Result from borehole DP49 in level 50-55 meter with different grout mixes.
Column 1 and 2 are related to borehole 49DP in level of 50-55 meter in which two different recipes according to tables 2 (Gotvand Project data) and table 7 (Citybanan Project data) have been used respectively. In These cases (1 and 2), just the mix recipe has changed and the applied pressure and fractures’ size and frequency are the same.
Column 3 is related to Äspö HRL experiment. This case is related to experiment in different geology with different mix recipe. Stop criteria in this section is based on penetration length and the design is in the way that grout mix should penetrate at least 15 meter in smallest fractures and in largest fractures penetration length should not exceed 40 meters.
All cases are considered to be two dimensional and time independent.
experiment 1 2 3 Project grout mixed designed for
Gotvand Dam Citybanan Äspö HRL
Tunnel τ0 (Pa) 0.35 3.45 0.296 µ (Pa.s) 0.0043 0.01 0.0056 b min (mm) 0.061 0.04 0.041 b max (mm) 0.069 0.069 0.079 lower stop limit (m) 4 4 15 upper stop limit (m) - - 40 Grouting period (min) 20 20 17 penetration length in smallest fractures (m)
12 3.5 15
penetration length in largest fractures (m)
13.6 6.01 30
final pressure (Mpa) 2.5 2.5 5
Table 9. Comparing penetration length for 3 different experiments.

66
By comparing the properties of grout mixes and resulted penetration length of these 3 cases with each other, following outcomes are resulted:
1- Comparing 1st and 3rd cases, with almost the same rheological properties, by decreasing the minimum aperture and increasing pressure the penetrability has been increased and in somehow same time period, higher penetration length has been achieved.
2- By almost the same penetrability properties as it has happened in case 2 and 3, using thicker grout (higher yield stress and viscosity) and lower pressure affected the penetration length significantly in decreasing manner.
3- In Äspö HRL experiment (case 3) the design lead to adequate penetration in the smallest apertures while it is lower than the maximum limit which is defined as the second stop criterion.
4- In Gotvand Project (cases 1 and 2) lower stop limit is assumed according to existing data and drawings (section 5.2.3 and figure 23). As it was discussed in section 5.3.5 in case 1 grout mix has been spread further than required zone. By changing the grout properties, the penetration is decreased in 2nd case.
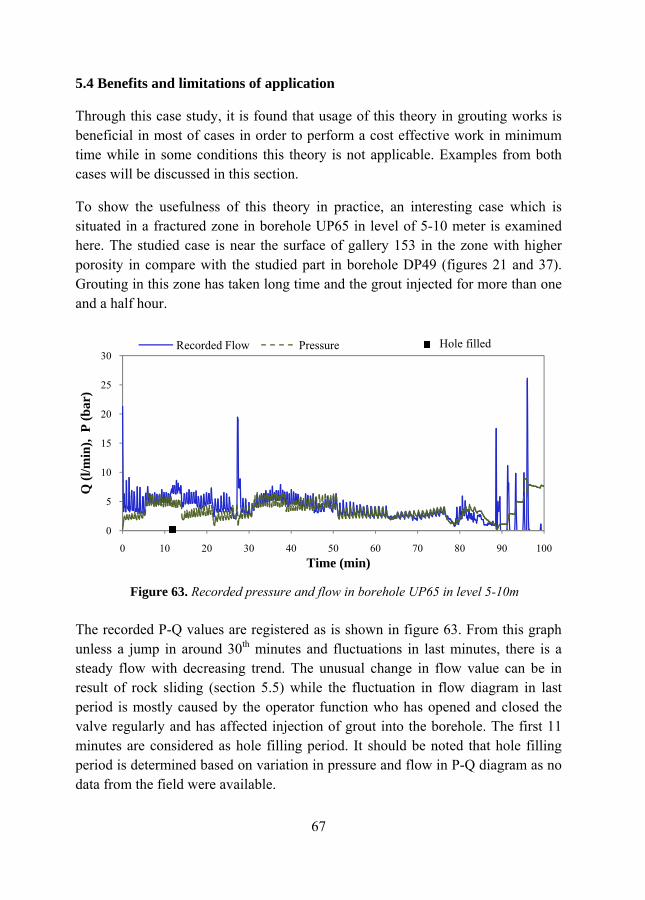
67
5.4 Benefits and limitations of application
Through this case study, it is found that usage of this theory in grouting works is beneficial in most of cases in order to perform a cost effective work in minimum time while in some conditions this theory is not applicable. Examples from both cases will be discussed in this section.
To show the usefulness of this theory in practice, an interesting case which is situated in a fractured zone in borehole UP65 in level of 5-10 meter is examined here. The studied case is near the surface of gallery 153 in the zone with higher porosity in compare with the studied part in borehole DP49 (figures 21 and 37). Grouting in this zone has taken long time and the grout injected for more than one and a half hour.
The recorded P-Q values are registered as is shown in figure 63. From this graph unless a jump in around 30th minutes and fluctuations in last minutes, there is a steady flow with decreasing trend. The unusual change in flow value can be in result of rock sliding (section 5.5) while the fluctuation in flow diagram in last period is mostly caused by the operator function who has opened and closed the valve regularly and has affected injection of grout into the borehole. The first 11 minutes are considered as hole filling period. It should be noted that hole filling period is determined based on variation in pressure and flow in P-Q diagram as no data from the field were available.
0
5
10
15
20
25
30
0 10 20 30 40 50 60 70 80 90 100
Q (l
/min
), P
(bar
)
Time (min)
Recorded Flow Pressure
Figure 63. Recorded pressure and flow in borehole UP65 in level 5-10m
Hole filled
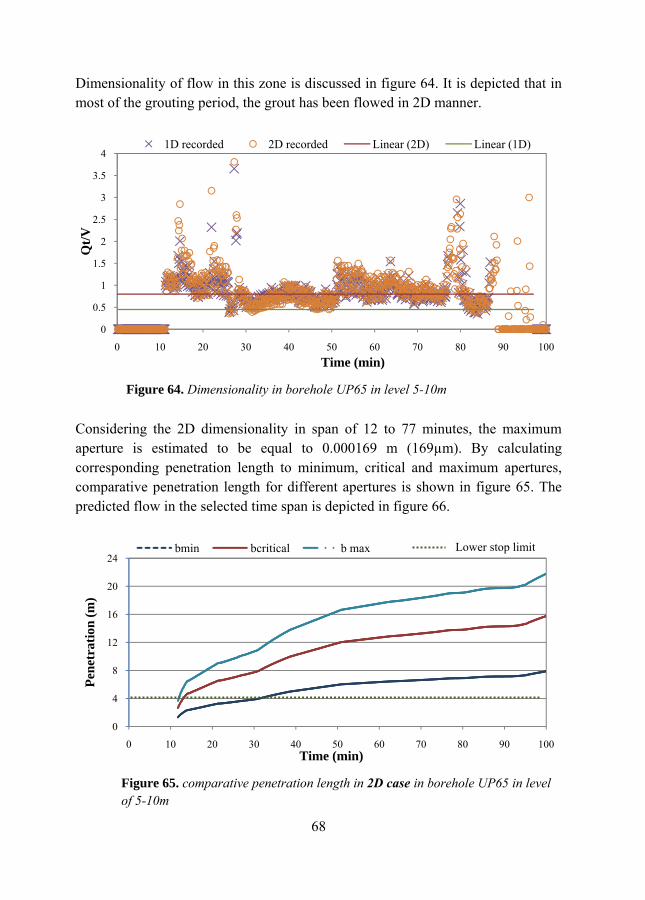
68
Dimensionality of flow in this zone is discussed in figure 64. It is depicted that in most of the grouting period, the grout has been flowed in 2D manner.
Considering the 2D dimensionality in span of 12 to 77 minutes, the maximum aperture is estimated to be equal to 0.000169 m (169µm). By calculating corresponding penetration length to minimum, critical and maximum apertures, comparative penetration length for different apertures is shown in figure 65. The predicted flow in the selected time span is depicted in figure 66.
0
0.5
1
1.5
2
2.5
3
3.5
4
0 10 20 30 40 50 60 70 80 90 100
Qt/V
Time (min)
1D recorded 2D recorded Linear (2D) Linear (1D)
0
4
8
12
16
20
24
0 10 20 30 40 50 60 70 80 90 100
Pene
trat
ion
(m)
Time (min)
bmin bcritical b max
Figure 64. Dimensionality in borehole UP65 in level 5-10m
Figure 65. comparative penetration length in 2D case in borehole UP65 in level of 5-10m
Lower stop limit
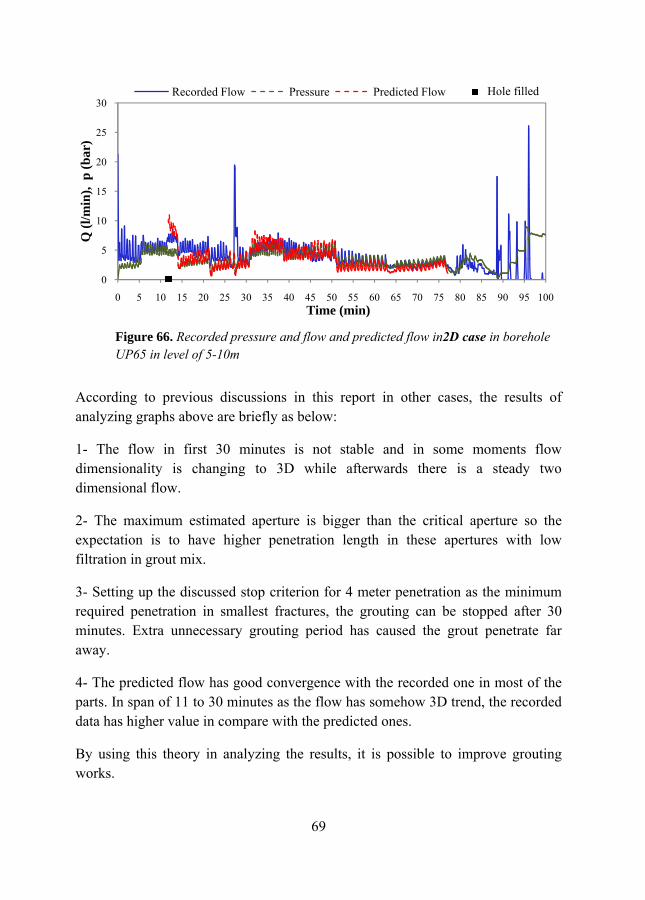
69
According to previous discussions in this report in other cases, the results of analyzing graphs above are briefly as below:
1- The flow in first 30 minutes is not stable and in some moments flow dimensionality is changing to 3D while afterwards there is a steady two dimensional flow.
2- The maximum estimated aperture is bigger than the critical aperture so the expectation is to have higher penetration length in these apertures with low filtration in grout mix.
3- Setting up the discussed stop criterion for 4 meter penetration as the minimum required penetration in smallest fractures, the grouting can be stopped after 30 minutes. Extra unnecessary grouting period has caused the grout penetrate far away.
4- The predicted flow has good convergence with the recorded one in most of the parts. In span of 11 to 30 minutes as the flow has somehow 3D trend, the recorded data has higher value in compare with the predicted ones.
By using this theory in analyzing the results, it is possible to improve grouting works.
0
5
10
15
20
25
30
0 5 10 15 20 25 30 35 40 45 50 55 60 65 70 75 80 85 90 95 100
Q (l
/min
), p
(bar
)
Time (min)
Recorded Flow Pressure Predicted Flow
Figure 66. Recorded pressure and flow and predicted flow in2D case in borehole UP65 in level of 5-10m
Hole filled
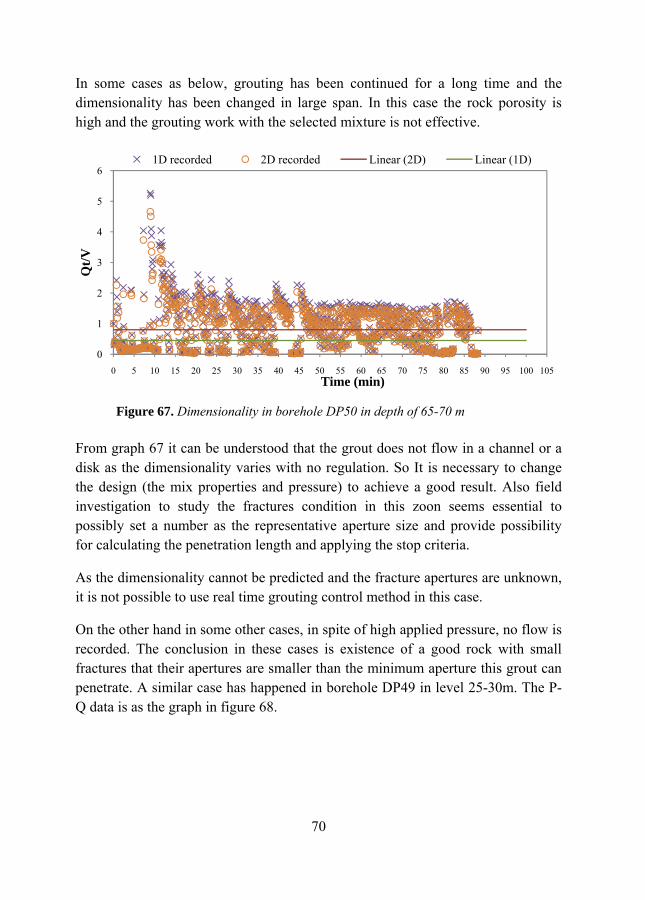
70
In some cases as below, grouting has been continued for a long time and the dimensionality has been changed in large span. In this case the rock porosity is high and the grouting work with the selected mixture is not effective.
From graph 67 it can be understood that the grout does not flow in a channel or a disk as the dimensionality varies with no regulation. So It is necessary to change the design (the mix properties and pressure) to achieve a good result. Also field investigation to study the fractures condition in this zoon seems essential to possibly set a number as the representative aperture size and provide possibility for calculating the penetration length and applying the stop criteria.
As the dimensionality cannot be predicted and the fracture apertures are unknown, it is not possible to use real time grouting control method in this case.
On the other hand in some other cases, in spite of high applied pressure, no flow is recorded. The conclusion in these cases is existence of a good rock with small fractures that their apertures are smaller than the minimum aperture this grout can penetrate. A similar case has happened in borehole DP49 in level 25-30m. The P-Q data is as the graph in figure 68.
0
1
2
3
4
5
6
0 5 10 15 20 25 30 35 40 45 50 55 60 65 70 75 80 85 90 95 100 105
Qt/V
Time (min)
1D recorded 2D recorded Linear (2D) Linear (1D)
Figure 67. Dimensionality in borehole DP50 in depth of 65-70 m
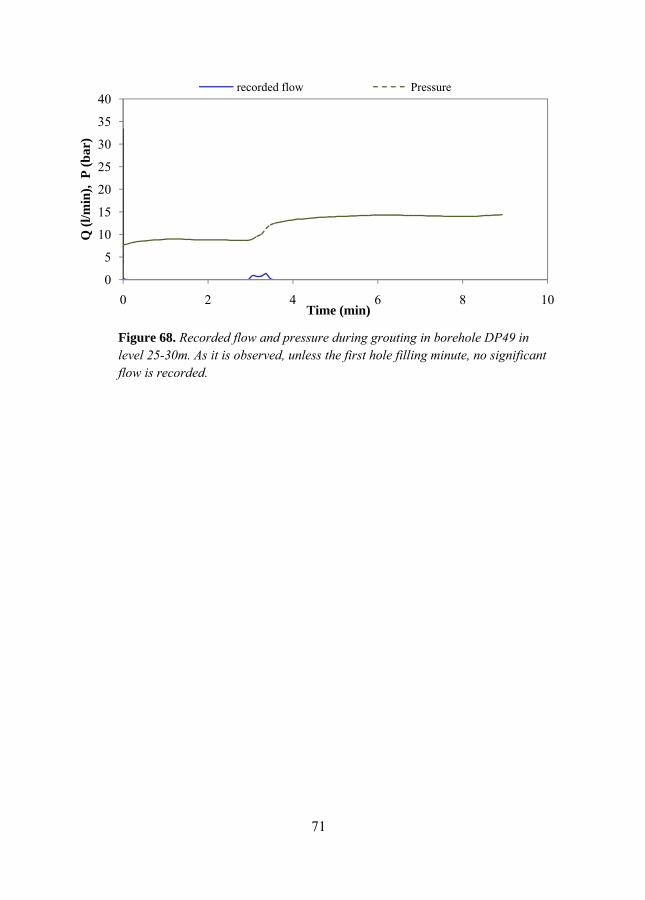
71
0
5
10
15
20
25
30
35
40
0 2 4 6 8 10
Q (l
/min
), P
(bar
)
Time (min)
recorded flow Pressure
Figure 68. Recorded flow and pressure during grouting in borehole DP49 in level 25-30m. As it is observed, unless the first hole filling minute, no significant flow is recorded.
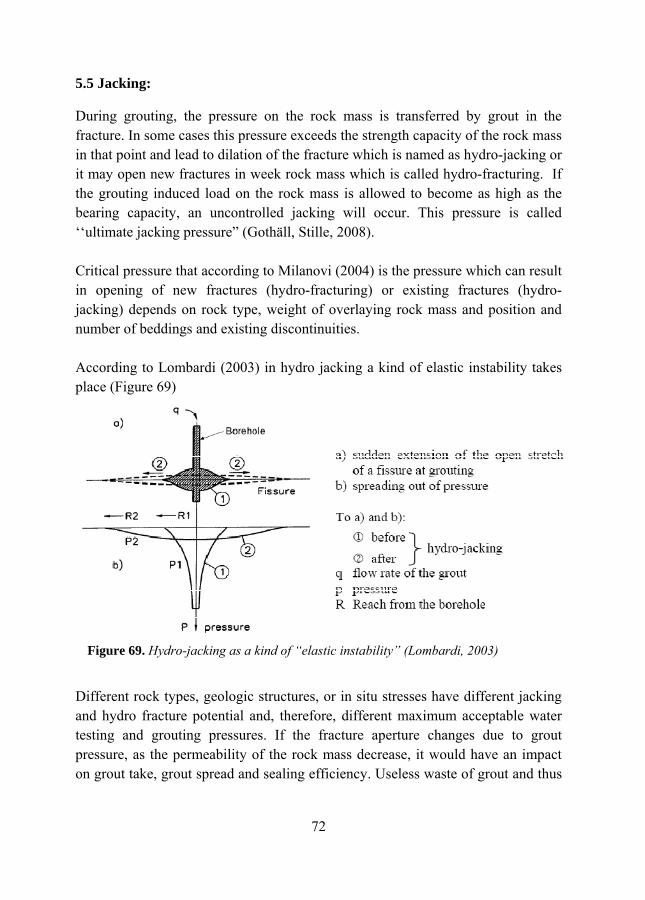
72
5.5 Jacking:
During grouting, the pressure on the rock mass is transferred by grout in the fracture. In some cases this pressure exceeds the strength capacity of the rock mass in that point and lead to dilation of the fracture which is named as hydro-jacking or it may open new fractures in week rock mass which is called hydro-fracturing. If the grouting induced load on the rock mass is allowed to become as high as the bearing capacity, an uncontrolled jacking will occur. This pressure is called ‘‘ultimate jacking pressure” (Gothäll, Stille, 2008). Critical pressure that according to Milanovi (2004) is the pressure which can result in opening of new fractures (hydro-fracturing) or existing fractures (hydro-jacking) depends on rock type, weight of overlaying rock mass and position and number of beddings and existing discontinuities. According to Lombardi (2003) in hydro jacking a kind of elastic instability takes place (Figure 69) Different rock types, geologic structures, or in situ stresses have different jacking and hydro fracture potential and, therefore, different maximum acceptable water testing and grouting pressures. If the fracture aperture changes due to grout pressure, as the permeability of the rock mass decrease, it would have an impact on grout take, grout spread and sealing efficiency. Useless waste of grout and thus
Figure 69. Hydro-jacking as a kind of “elastic instability” (Lombardi, 2003)
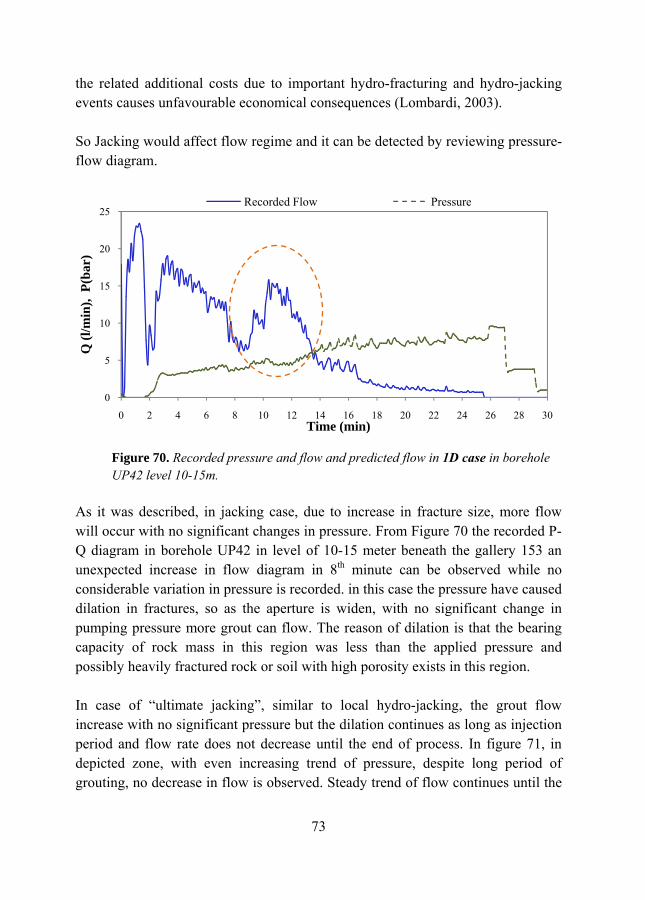
73
the related additional costs due to important hydro-fracturing and hydro-jacking events causes unfavourable economical consequences (Lombardi, 2003). So Jacking would affect flow regime and it can be detected by reviewing pressure-flow diagram.
As it was described, in jacking case, due to increase in fracture size, more flow will occur with no significant changes in pressure. From Figure 70 the recorded P-Q diagram in borehole UP42 in level of 10-15 meter beneath the gallery 153 an unexpected increase in flow diagram in 8th minute can be observed while no considerable variation in pressure is recorded. in this case the pressure have caused dilation in fractures, so as the aperture is widen, with no significant change in pumping pressure more grout can flow. The reason of dilation is that the bearing capacity of rock mass in this region was less than the applied pressure and possibly heavily fractured rock or soil with high porosity exists in this region. In case of “ultimate jacking”, similar to local hydro-jacking, the grout flow increase with no significant pressure but the dilation continues as long as injection period and flow rate does not decrease until the end of process. In figure 71, in depicted zone, with even increasing trend of pressure, despite long period of grouting, no decrease in flow is observed. Steady trend of flow continues until the
0
5
10
15
20
25
0 2 4 6 8 10 12 14 16 18 20 22 24 26 28 30
Q (l
/min
), P
(bar
)
Time (min)
Recorded Flow Pressure
Figure 70. Recorded pressure and flow and predicted flow in 1D case in borehole UP42 level 10-15m.
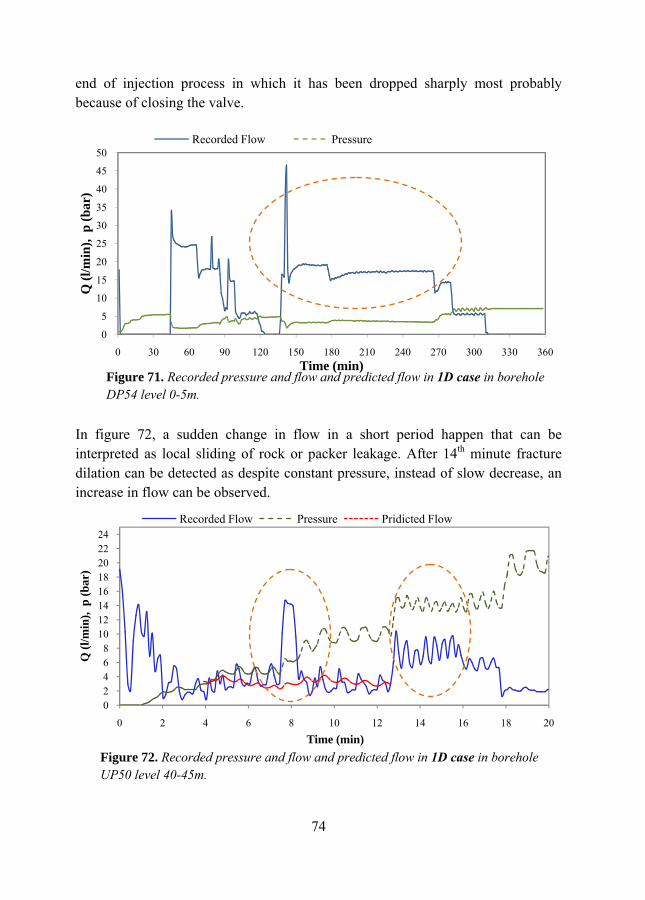
74
end of injection process in which it has been dropped sharply most probably because of closing the valve.
In figure 72, a sudden change in flow in a short period happen that can be interpreted as local sliding of rock or packer leakage. After 14th minute fracture dilation can be detected as despite constant pressure, instead of slow decrease, an increase in flow can be observed.
0
5
10
15
20
25
30
35
40
45
50
0 30 60 90 120 150 180 210 240 270 300 330 360
Q (l
/min
), p
(bar
)
Time (min)
Recorded Flow Pressure
02468
1012141618202224
0 2 4 6 8 10 12 14 16 18 20
Q (l
/min
), p
(bar
)
Time (min)
Recorded Flow Pressure Pridicted Flow
Figure 72. Recorded pressure and flow and predicted flow in 1D case in borehole UP50 level 40-45m.
Figure 71. Recorded pressure and flow and predicted flow in 1D case in borehole DP54 level 0-5m.
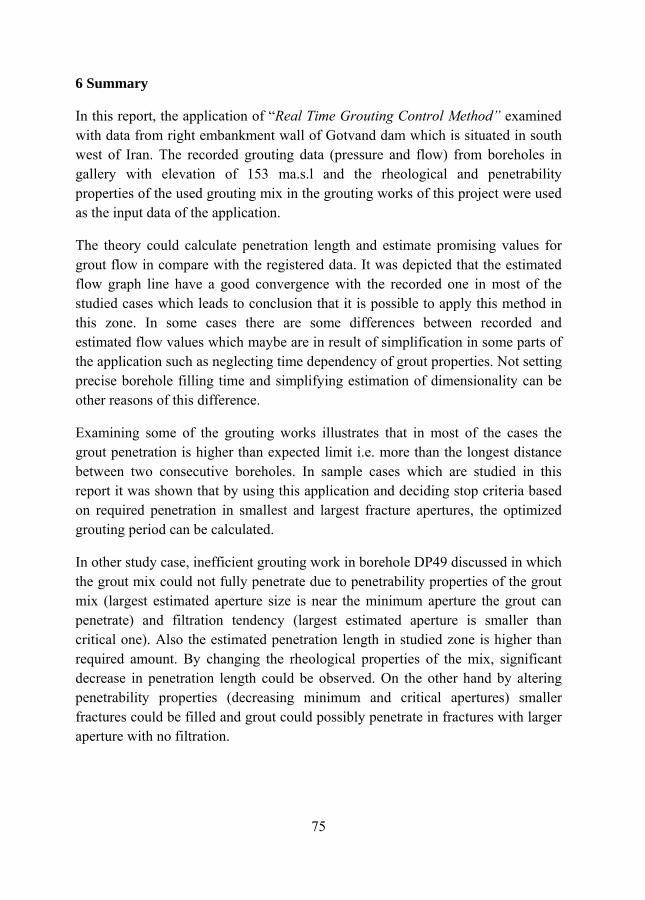
75
6 Summary
In this report, the application of “Real Time Grouting Control Method” examined with data from right embankment wall of Gotvand dam which is situated in south west of Iran. The recorded grouting data (pressure and flow) from boreholes in gallery with elevation of 153 ma.s.l and the rheological and penetrability properties of the used grouting mix in the grouting works of this project were used as the input data of the application.
The theory could calculate penetration length and estimate promising values for grout flow in compare with the registered data. It was depicted that the estimated flow graph line have a good convergence with the recorded one in most of the studied cases which leads to conclusion that it is possible to apply this method in this zone. In some cases there are some differences between recorded and estimated flow values which maybe are in result of simplification in some parts of the application such as neglecting time dependency of grout properties. Not setting precise borehole filling time and simplifying estimation of dimensionality can be other reasons of this difference.
Examining some of the grouting works illustrates that in most of the cases the grout penetration is higher than expected limit i.e. more than the longest distance between two consecutive boreholes. In sample cases which are studied in this report it was shown that by using this application and deciding stop criteria based on required penetration in smallest and largest fracture apertures, the optimized grouting period can be calculated.
In other study case, inefficient grouting work in borehole DP49 discussed in which the grout mix could not fully penetrate due to penetrability properties of the grout mix (largest estimated aperture size is near the minimum aperture the grout can penetrate) and filtration tendency (largest estimated aperture is smaller than critical one). Also the estimated penetration length in studied zone is higher than required amount. By changing the rheological properties of the mix, significant decrease in penetration length could be observed. On the other hand by altering penetrability properties (decreasing minimum and critical apertures) smaller fractures could be filled and grout could possibly penetrate in fractures with larger aperture with no filtration.
76
As a general conclusion, using this theory can give supportive information about how the mix is penetrating in real time steps and based on that grouting works can be optimized by changing grout recipe and grouting time.
By using this theory, not only one can monitor the grouting process to optimize it in real time but it also provides the possibility to predict water leakage in tunnelling works and to check the risk of uplift in real time (Kobayashi and Stille, 2008).
Despite efficiency of this method in prediction of penetration and estimation of grout flow, it is found not easy to apply it in some of the studied cases. In a disadvantageous condition, due to high porosity of rock mass, the flow assumed to be three dimensional in which the fractures did not fill despite the long pumping period. As dimensionality and the average fracture aperture size cannot be calculate in this condition, it is not possible to estimate the penetration length. In other case due to good quality of rock mass, very small values for flow recorded which indicates the existence of fractures with small apertures.
In some cases despite steady pressure, increasing in grout flow is observed which interpreted as jacking in the rock. Sudden and unexpected variations in recorded flow diagram are considered as local sliding or leakage from the packer or in some case they might be related to operator function and interval closing of the valve during grouting process.
Currently this theory is going to be put into practice by developing a tool to be installed on grouting machine to monitor the grouting process in real time. Studies in regions with different geology will be helpful in customizing the instruments and developing special tools to fulfil requirements of the different grouting projects.
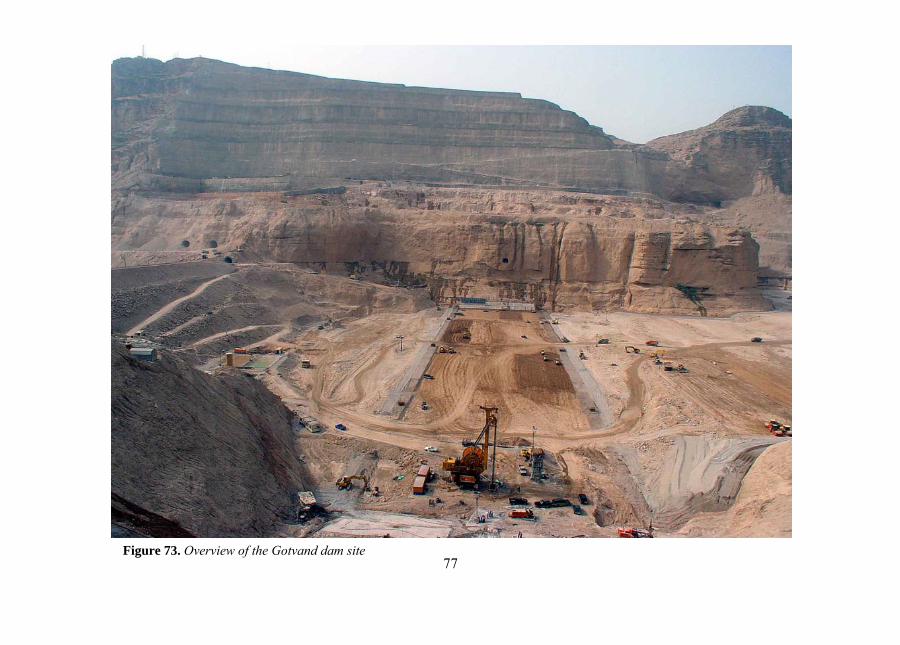
77
Figure 73. Overview of the Gotvand dam site
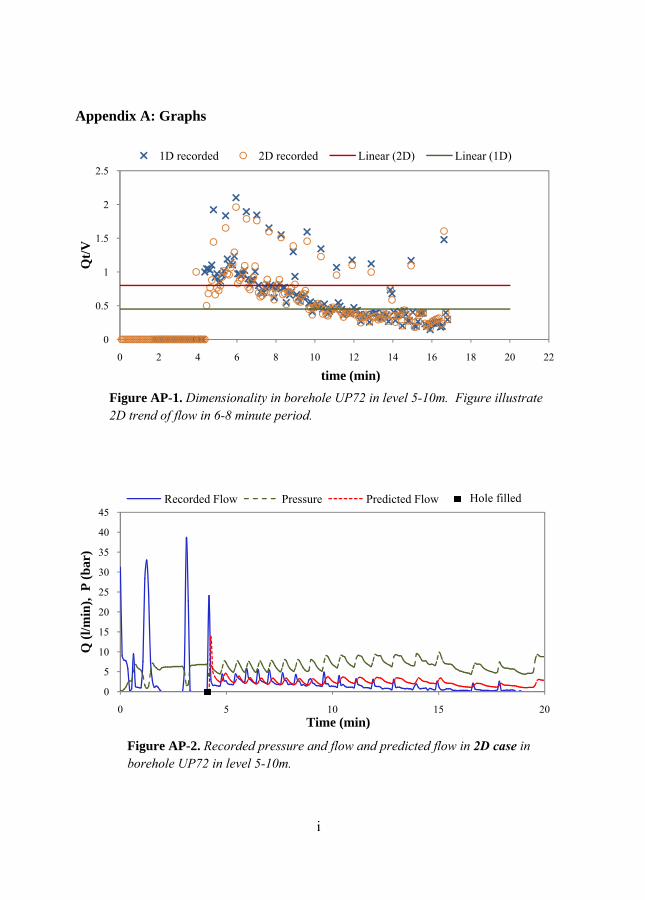
i
Appendix A: Graphs
0
0.5
1
1.5
2
2.5
0 2 4 6 8 10 12 14 16 18 20 22
Qt/V
time (min)
1D recorded 2D recorded Linear (2D) Linear (1D)
0
5
10
15
20
25
30
35
40
45
0 5 10 15 20
Q (l
/min
), P
(bar
)
Time (min)
Recorded Flow Pressure Predicted Flow
Figure AP-1. Dimensionality in borehole UP72 in level 5-10m. Figure illustrate 2D trend of flow in 6-8 minute period.
Figure AP-2. Recorded pressure and flow and predicted flow in 2D case in borehole UP72 in level 5-10m.
Hole filled
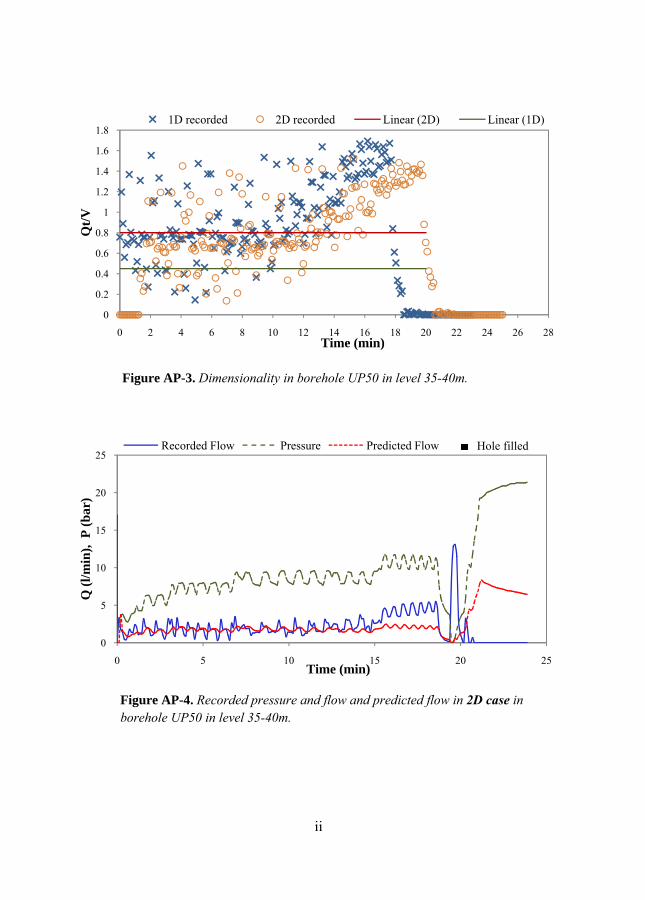
ii
0
0.2
0.4
0.6
0.8
1
1.2
1.4
1.6
1.8
0 2 4 6 8 10 12 14 16 18 20 22 24 26 28
Qt/V
Time (min)
1D recorded 2D recorded Linear (2D) Linear (1D)
0
5
10
15
20
25
0 5 10 15 20 25
Q (l
/min
), P
(bar
)
Time (min)
Recorded Flow Pressure Predicted Flow
Figure AP-3. Dimensionality in borehole UP50 in level 35-40m.
Figure AP-4. Recorded pressure and flow and predicted flow in 2D case in borehole UP50 in level 35-40m.
Hole filled
iii
0
0.5
1
1.5
2
2.5
3
0 2 4 6 8 10 12 14 16 18 20 22 24 26 28
Qt/V
Time (min)
1D recorded 2D recorded Linear (2D) Linear (1D)
02468
1012141618202224
0 2 4 6 8 10 12 14 16 18 20
Q (l
/min
), P
(bar
)
Time (min)
Recorded Flow Pressure Pridicted Flow
Figure AP-5. Dimensionality in borehole UP50 in level 40-45m.
Figure AP-6. Recorded pressure and flow and predicted flow in 1D case in borehole UP50 in level 40-45m.
Hole filled
iv
0
5
10
15
20
25
30
0 2 4 6 8 10 12 14 16 18 20 22 24
Q (l
/min
), P
(bar
)
Time (min)
Recorded Flow Pressure Predicted Flow
Figure AP-7. Recorded pressure and flow and predicted flow in 2D case in borehole UP50 in level 40-45m.
Hole filled
v
0
0.5
1
1.5
2
2.5
0 10 20 30
Qt/V
Time (min)
1D recorded 2D recorded Linear (2D) Linear (1D)
0
5
10
15
20
25
0 5 10 15 20 25 30
Q (l
/min
), P
(bar
)
Time (min)
Recorded Flow Pressure Predicted Flow
Figure AP-8. Dimensionality in borehole DP50 level 60-65m.
Figure AP-9. Recorded pressure and flow and predicted flow in 2D case in borehole DP50 level 60-65m.
Hole filled
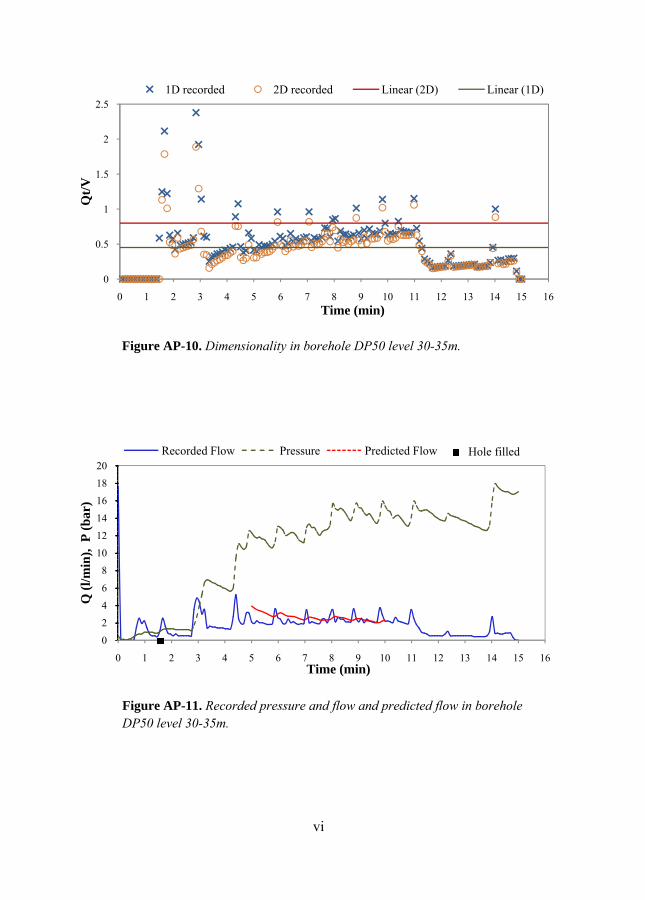
vi
0
0.5
1
1.5
2
2.5
0 1 2 3 4 5 6 7 8 9 10 11 12 13 14 15 16
Qt/V
Time (min)
1D recorded 2D recorded Linear (2D) Linear (1D)
0
24
6
8
1012
14
16
1820
0 1 2 3 4 5 6 7 8 9 10 11 12 13 14 15 16
Q (l
/min
), P
(bar
)
Time (min)
Recorded Flow Pressure Predicted Flow
Figure AP-10. Dimensionality in borehole DP50 level 30-35m.
Figure AP-11. Recorded pressure and flow and predicted flow in borehole DP50 level 30-35m.
Hole filled
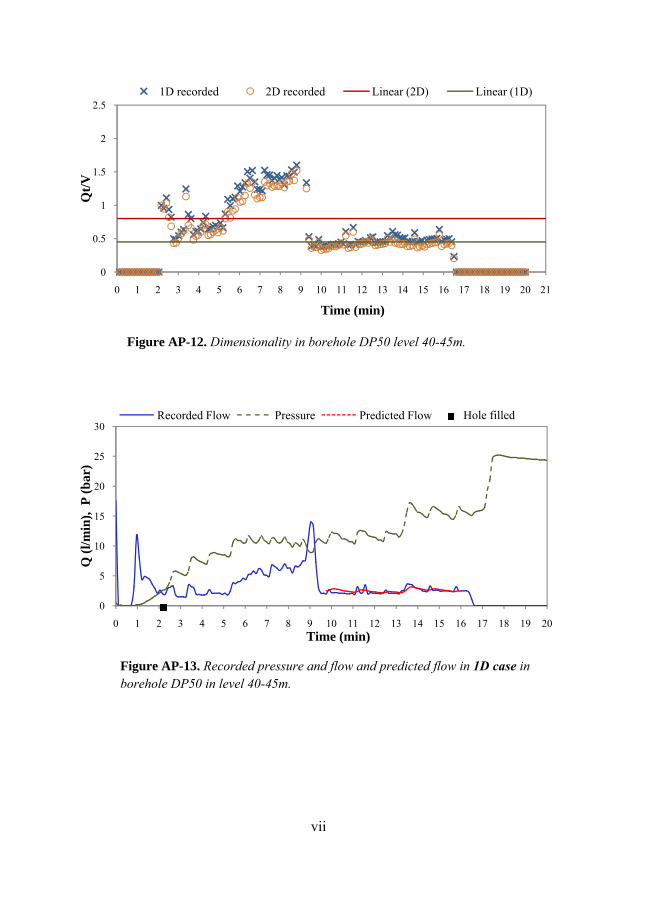
vii
0
0.5
1
1.5
2
2.5
0 1 2 3 4 5 6 7 8 9 10 11 12 13 14 15 16 17 18 19 20 21
Qt/V
Time (min)
1D recorded 2D recorded Linear (2D) Linear (1D)
0
5
10
15
20
25
30
0 1 2 3 4 5 6 7 8 9 10 11 12 13 14 15 16 17 18 19 20
Q (l
/min
), P
(bar
)
Time (min)
Recorded Flow Pressure Predicted Flow
Figure AP-13. Recorded pressure and flow and predicted flow in 1D case in borehole DP50 in level 40-45m.
Figure AP-12. Dimensionality in borehole DP50 level 40-45m.
Hole filled
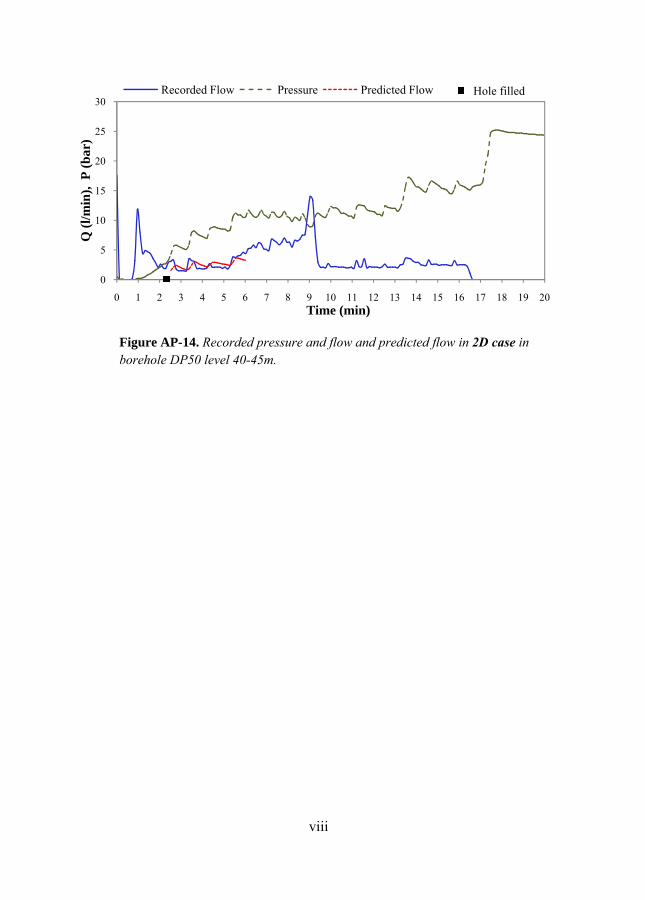
viii
0
5
10
15
20
25
30
0 1 2 3 4 5 6 7 8 9 10 11 12 13 14 15 16 17 18 19 20
Q (l
/min
), P
(bar
)
Time (min)
Recorded Flow Pressure Predicted Flow
Figure AP-14. Recorded pressure and flow and predicted flow in 2D case in borehole DP50 level 40-45m.
Hole filled
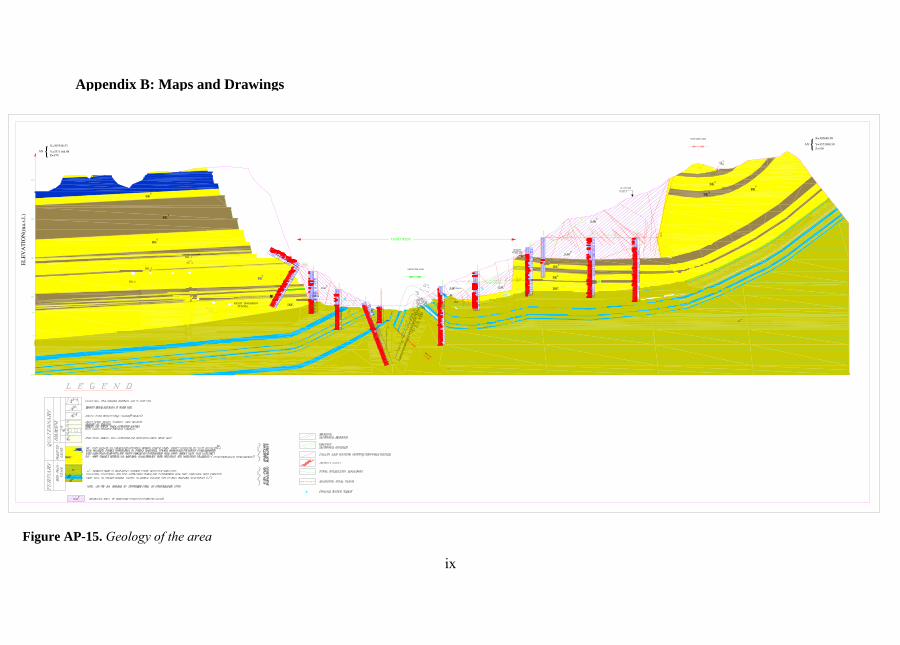
ix
Appendix B: Maps and Drawings
X:−237.848
Y:357.5
Y:200.18X:42.00
X:555Y:88.16
S.ST
S.STSi.ST
S.ST
C.ST C.ST
S.ST
C.ST S.ST
S.ST
SI.ST & C.ST
C.ST & SI.STG.S.ST
S.ST
C.ST
S.ST & C.S.ST
C.ST S.STC.ST
S.ST
C.S.ST
SI.ST & S.ST
C.ST
S.ST
S.ST
S.ST
C.ST
150/56100 0 0 20
Depth
0
10
20
30
40
50
60
70
80
90
100
110
120
100
26
100
100
3
1
100
100
100
0.5
1.3
100
0.68
100
0
17
14
0.4
1
5.5
0.9
2.8
1.6
2.1
S.ST
40
POWER TUNNEL
POWER TUNNEL
POWER TUNNELNO. 2
POWER TUNNEL
LEFT DIVERSIONTUNNEL
AX
AX’
RC
HA
TR
US
T F
AU
LT
80
2.4
5 .1
40
3.8
16
32
33
150
130
140
120
90
100
110
10.9
0
2
0
0
0 .3
160
1
1
1
1
1 00
4.9
1
sBK
BK c
cBK
UG
313
BK c
PRO.GALLERY(C)
mcBK
NO. 1
RQD ULUG−321
NO. 3
120
110
100
90
80
70
50
30
20
1
0
0
0
1
1
1
1
1
1
0
2.4
1
0
1
1
1
0
8
0
2
1
Z=370
Z=410
PRO.GALLERY(A)
NO. 4
MIDDLE DIVERSIONTUNNEL
80
RIGHT DIVERSIONTUNNEL INF.
0.68
INF.
cBK
Si.ST
Si.STS.ST
SYNCLINE AXIS
ANTICLINE AXIS
BK c
BK s
BK c
S.ST
Q 01
BK s
?
100
26
100
100
3
1
100
100
100
0.5
1.3
100
0.68
100
0
17
14
0.4
1
5.5
0.9
2.8
1.6
2.1
0.3
1
0.7
0.95
0.2
0.7
0.8
0.5
1
100
0 0
20
RQDUL
Depth
0
10
20
30
40
50
60
70
80
90
100
110
120
130
140
150
160
170
UG−321
UG
110
UG
A9
UG
220
UG217
100
0
200
UG
213
UG
212
PRO.GALLERY(D)
BK
300
400
EL
EV
AT
ION
(ma.
s.l.)
60
UG
215
UG
216
UG
218
BKc
UG
206
INF.
(F.BK.F.)
c
−100
DAM CREST
UG214
X=305548.53
{Y=3571164.98
X=305689.98
Y=3573099.59{
Figure AP-15. Geology of the area
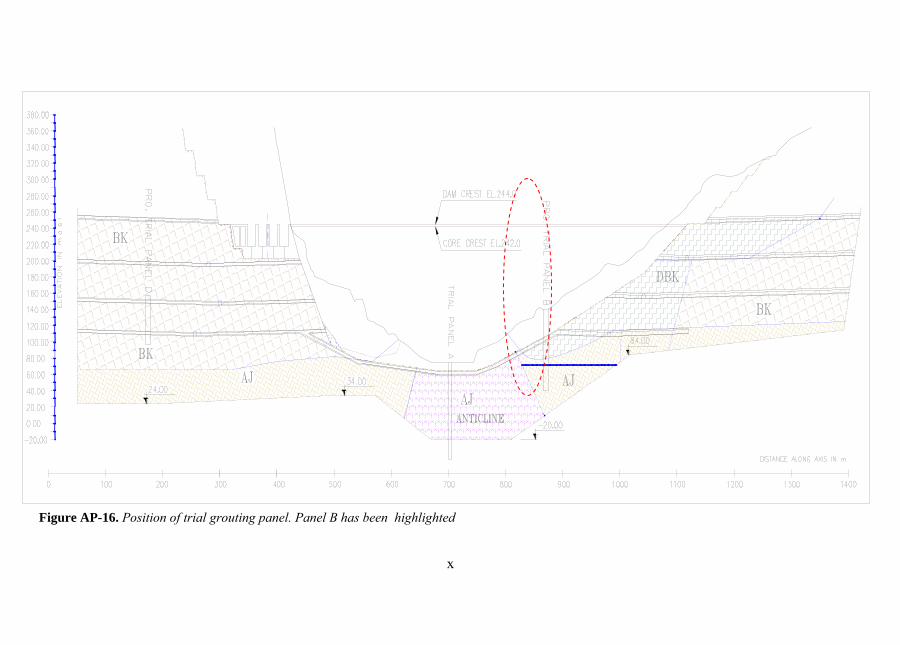
x
Figure AP-16. Position of trial grouting panel. Panel B has been highlighted

Figure AP-17. AArrangement of boreholes in trial panel B
xi
Figure AP-118. Plot of water pressurre test in plan B1 (first l
xii line)
xiii
Figure AP-19. Plot of water pressure test in plan B2 (Second line)
xiv
0 10 20 30 40 50 60 70 80 90 100
10
15
20
25
30
35
40
45
50
55
60
65
70
75
Dep
th (m
)
Lugeon values
Primary Secondary Tertiary Quaternary Check holes
0 10 20 30 40 50 60 70 80 90 100
10
15
20
25
30
35
40
45
50
55
60
65
Dep
th (m
)Lugeon values (LU)
Primary Secondary Tertiary Quaternary Quinary
Figure AP-20. Permeability versus Depth in B panel, the left figure is related to panel B1 (first line) and the left one represent values for the panel B2 (second line)
xv
Figure AP-21. Longitudinal profile of water tightening system
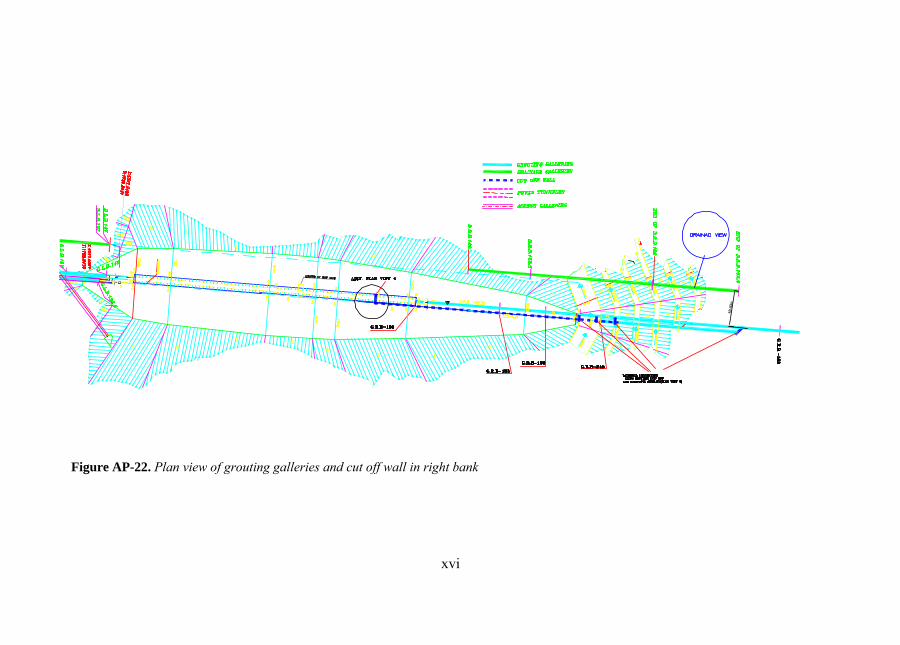
xvi
Figure AP-22. Plan view of grouting galleries and cut off wall in right bank
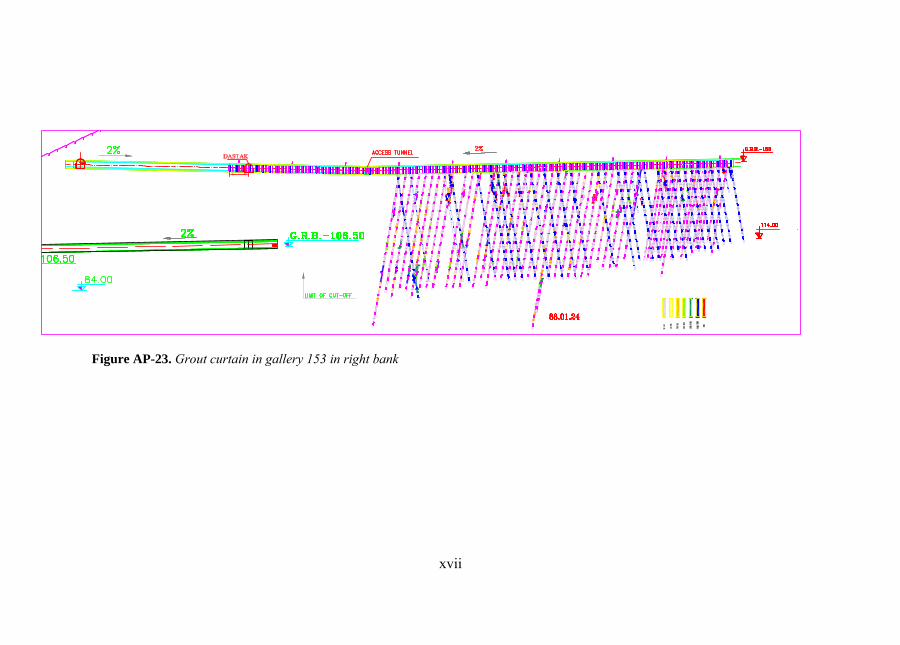
xvii
Figure AP-23. Grout curtain in gallery 153 in right bank
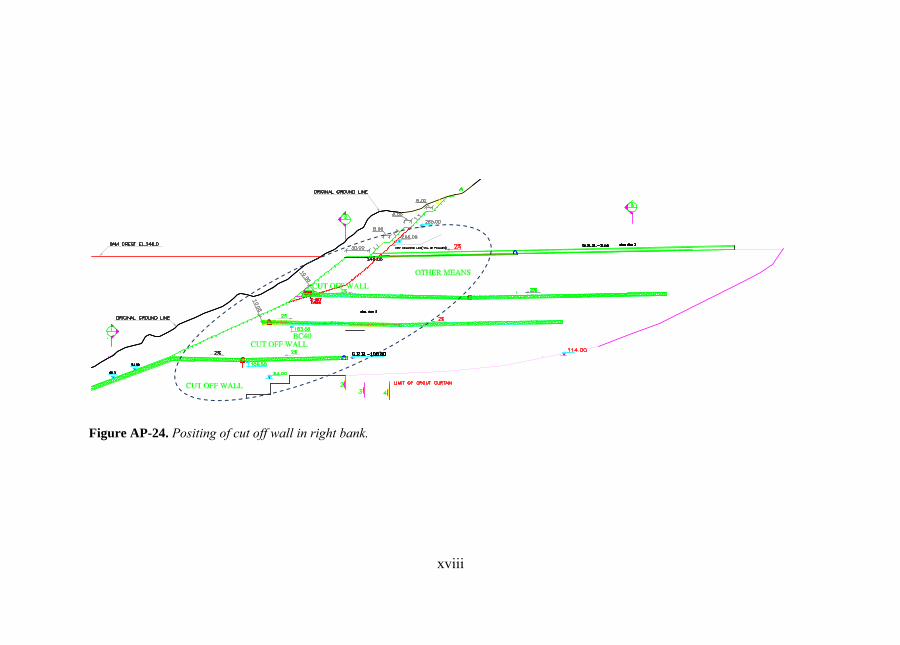
xviii
Figure AP-24. Positing of cut off wall in right bank.
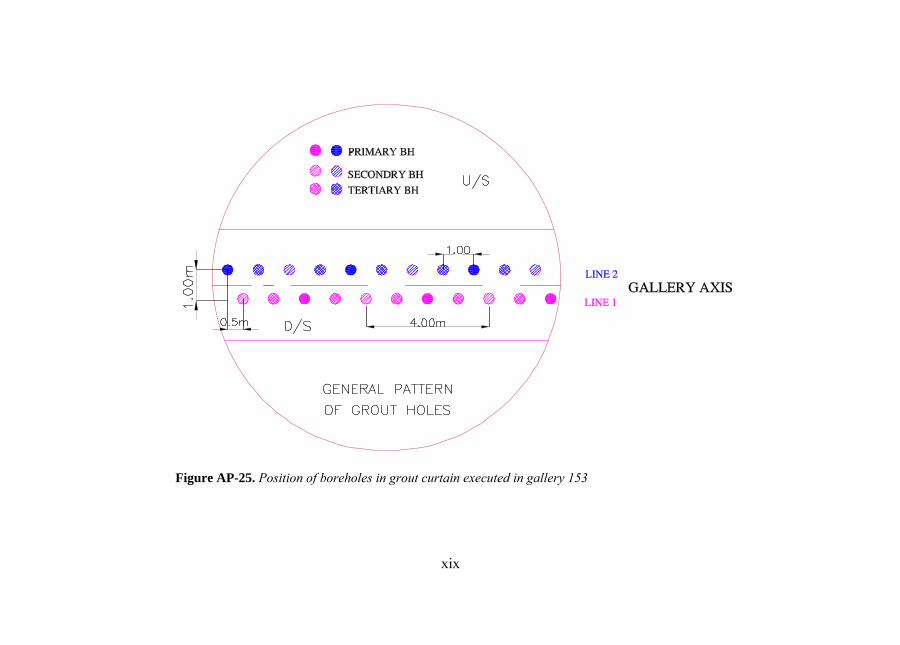
xix
Figure AP-25. Position of boreholes in grout curtain executed in gallery 153
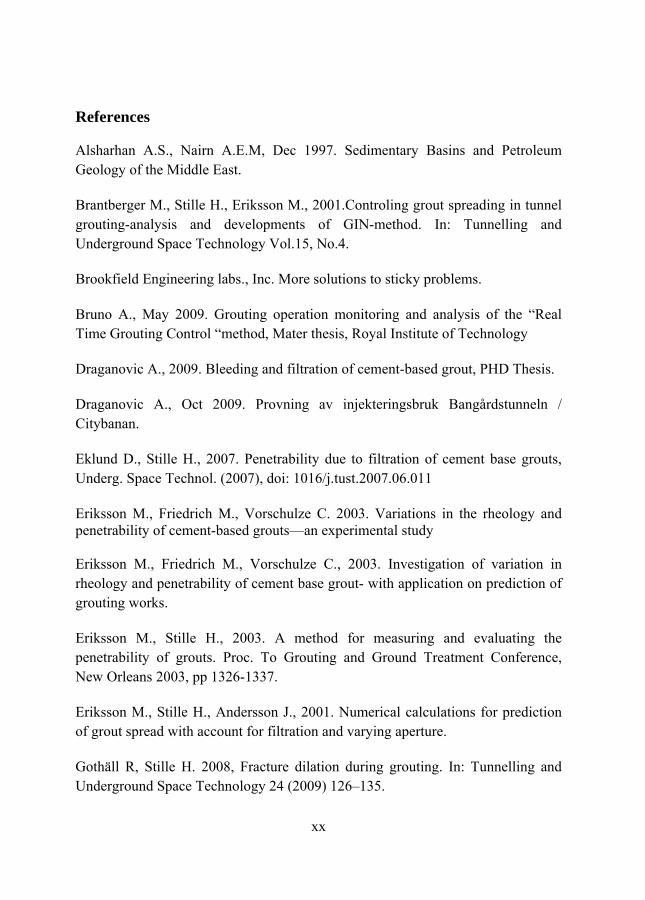
xx
References
Alsharhan A.S., Nairn A.E.M, Dec 1997. Sedimentary Basins and Petroleum Geology of the Middle East.
Brantberger M., Stille H., Eriksson M., 2001.Controling grout spreading in tunnel grouting-analysis and developments of GIN-method. In: Tunnelling and Underground Space Technology Vol.15, No.4.
Brookfield Engineering labs., Inc. More solutions to sticky problems.
Bruno A., May 2009. Grouting operation monitoring and analysis of the “Real Time Grouting Control “method, Mater thesis, Royal Institute of Technology
Draganovic A., 2009. Bleeding and filtration of cement-based grout, PHD Thesis.
Draganovic A., Oct 2009. Provning av injekteringsbruk Bangårdstunneln / Citybanan.
Eklund D., Stille H., 2007. Penetrability due to filtration of cement base grouts, Underg. Space Technol. (2007), doi: 1016/j.tust.2007.06.011
Eriksson M., Friedrich M., Vorschulze C. 2003. Variations in the rheology and penetrability of cement-based grouts—an experimental study Eriksson M., Friedrich M., Vorschulze C., 2003. Investigation of variation in rheology and penetrability of cement base grout- with application on prediction of grouting works.
Eriksson M., Stille H., 2003. A method for measuring and evaluating the penetrability of grouts. Proc. To Grouting and Ground Treatment Conference, New Orleans 2003, pp 1326-1337.
Eriksson M., Stille H., Andersson J., 2001. Numerical calculations for prediction of grout spread with account for filtration and varying aperture.
Gothäll R, Stille H. 2008, Fracture dilation during grouting. In: Tunnelling and Underground Space Technology 24 (2009) 126–135.
xxi
Gustafson G., Stille H., 2005. Stop criteria for cement grouting. Felsbau, 23(3), 62-68.
Gustafson G., Stille H., 1996. Prediction of Groutability from Grout Properties and Hydrogeological Data
Houlsby A.C, 1990. Construction and Design of Cement Grouting: A Guide to Grouting in Rock Foundations, Wiley Series of Practical Construction Guides.
Häsler L., Håkansson U., Stille H., 1992. Classification of jointed rock with emphasis on grouting.
Häsler L., Håkansson U., and Stille H., 1992. Computer-simulated flow of grout in jointed rock.
Injektering 30 (Inj 30), Cementa AB. June 2007. www.cementa.se.
Jasim S.Z, Goff, J.C, 2006. Geology of Iran, book, Edited
Kobayashi S., Stille H., Gustafson G., and Stille B., October 2008. Real time grouting method, Development and application using Äspö HRL data.
Lombardi, G. 2003. Grouting of Rock Masses
Neuman SP., 2005. Trends, prospects and challenges in quantifying flow and transport through fractured rocks. Hydrogeol J 2005;13(1):124–47.
Pitt M.J., 2000. The Marsh Funnel and Drilling Fluid Viscosity: A New Equation for Field Use, SPE Drilling and Completion vol. 15 No.1 pages 3-6.
Priest S.D., 1993. Discontinuity Analysis for Rock Engineering
Price, M., Robertson, A.S., Foster, S.S.D., 1977. Chalk permeability— a study of vertical variation using water injection tests and borehole logging. Water Serv. 81, 603–610. Roussel N., Le Roy R., 2003. The marsh cone: a test or a rheological apparatus? Cement and Concrete Research 35 (2005), 823– 830.
xxii
Se-Yeong H., MoonSu K., Jae-Yeol C., Jung-Yul K., Moon S., Tae-Won K., 2007. Relationship between hydraulic conductivity and fracture properties estimated from packer tests and borehole data in a fractured granite
SEN Z., 1996. Technical note: Theoretical RQD-Porosity-Conductivity-Aperture Charts.
Stille B., Stille H., Gustafson G., Kobayashi S., 2009. Experience with real time grouting control method. Geomechanics and Tunnelling 2(2009) No.5 dio: 10.1002/geot.200900036
Stille H. July 2009. Report of Gotvand Site Visit
Xiao-Wei J., Li W., Xu-Sheng W., Xiong W., Xin Z., 2009. Estimation of rock mass deformation modulus using variations in transmissivity and RQD with depth
Weaver K, Bruce D, 2007. Dam Foundation Grouting, Revised and Expanded.
Zetterlund M., Larsson T, 2004. Evaluation of water pressure tests in control boreholes as a method of appraising the grouting result, Master Thesis, Chalmers University