Embed Size (px)
Citation preview
Visitor Appraisal Infographics:
What percentage of visitors felt living in or near the AONB was good for life in the community.
The well-being value put on the AONB in terms of what individuals get from being in the AONB.
The reduced costs for treatment of illnesses, because of the activities that visitors take part in while in the AONB.
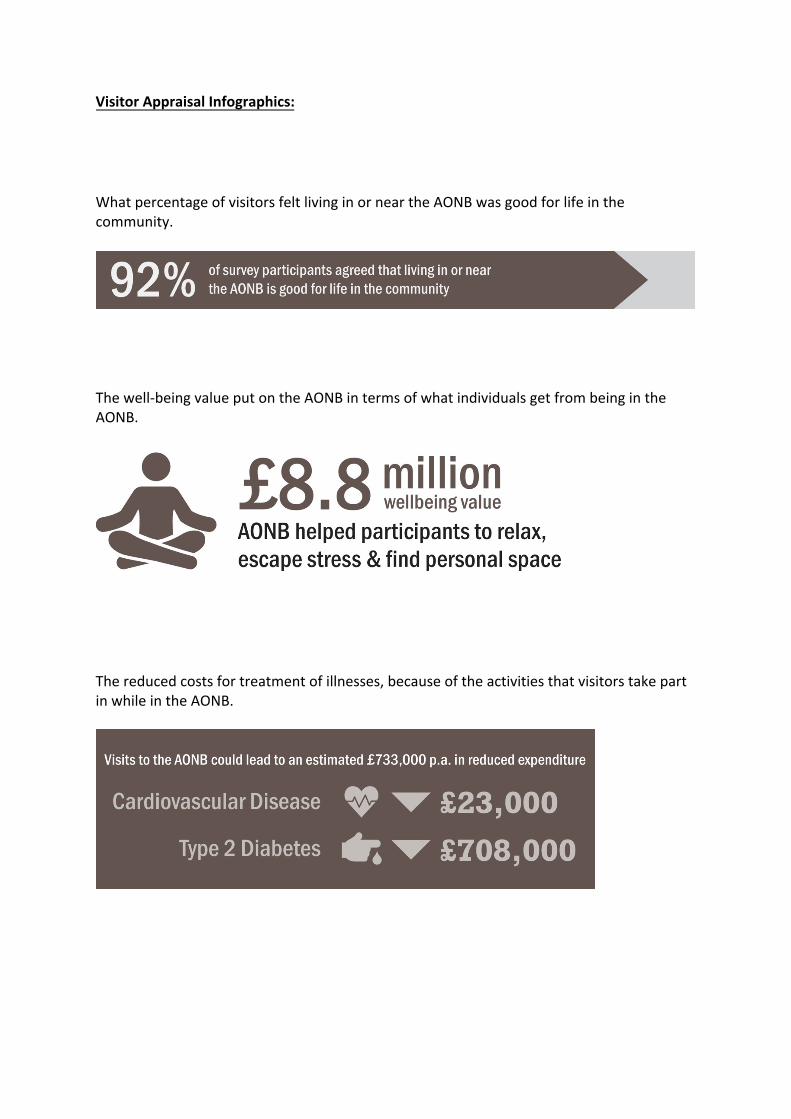
Total number of FTE jobs created by the 6 sites. This illustrates that 19% of these jobs (84 of them) are supported via indirect expenditure
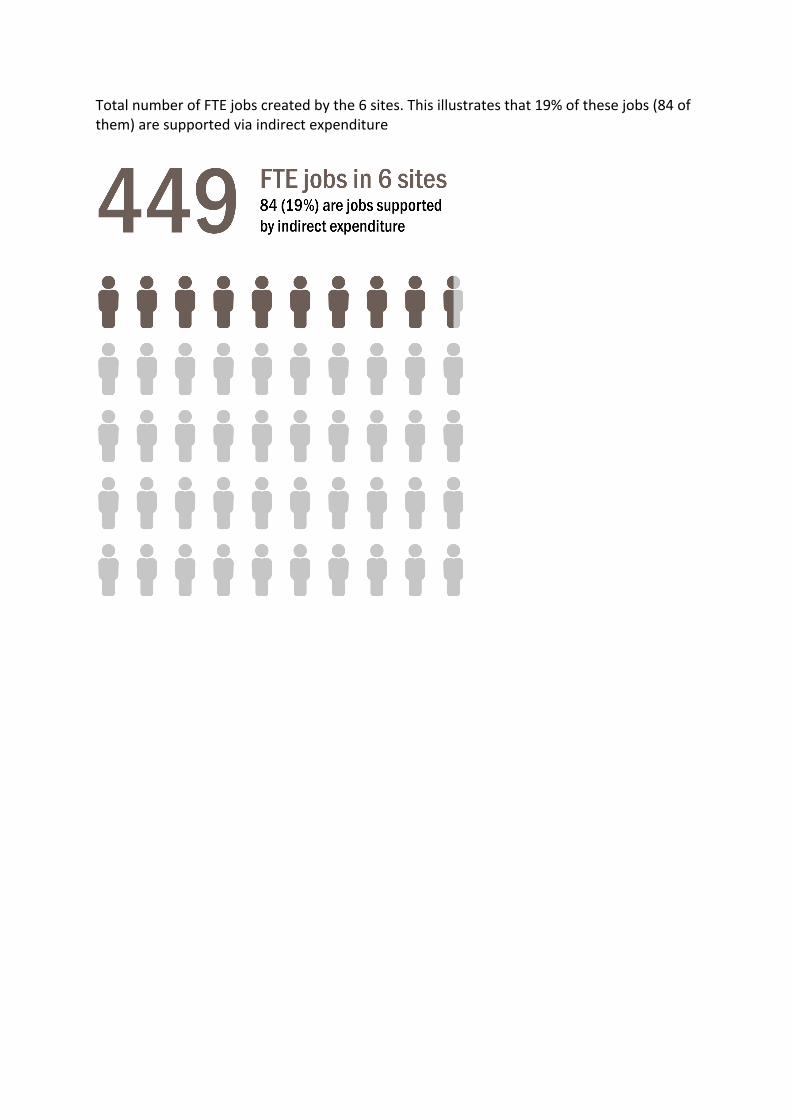
Map - Total estimated number of visitors for 2018 (1.1m). Each site is located on the map and given a coloured circle to illustrate the breakdown of those visitors per site. The AONB border is outlined on the map.
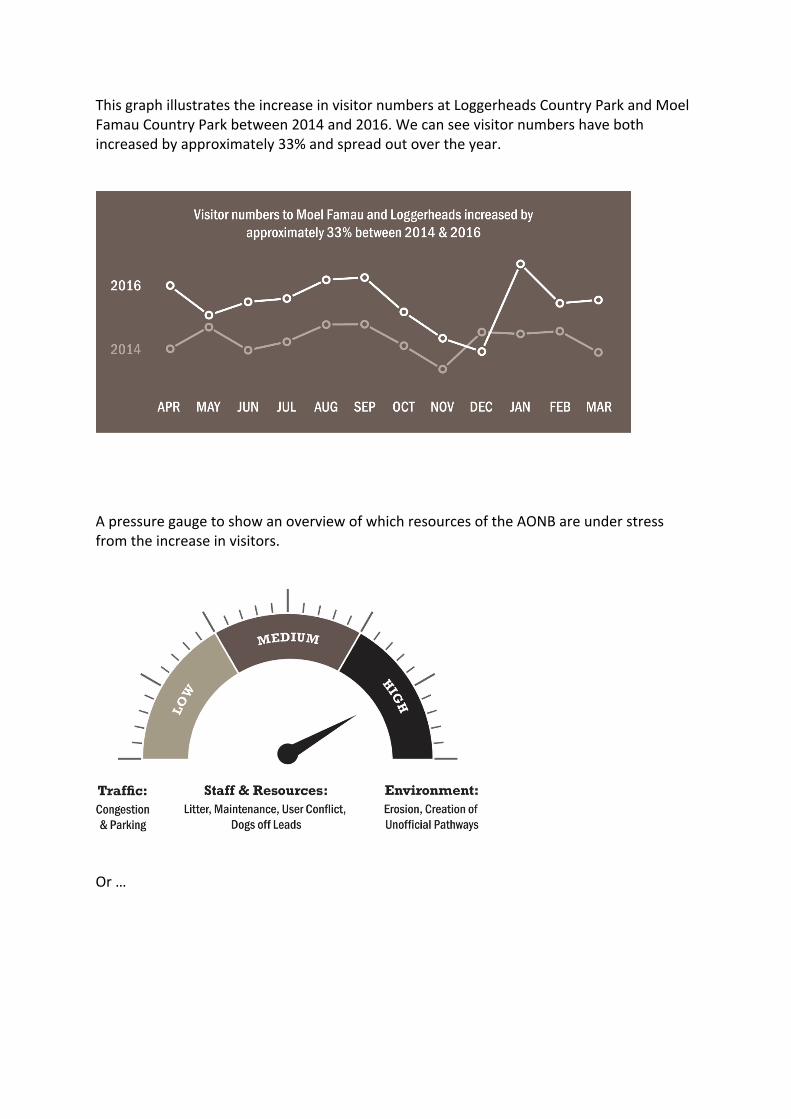
This graph illustrates the increase in visitor numbers at Loggerheads Country Park and Moel Famau Country Park between 2014 and 2016. We can see visitor numbers have both increased by approximately 33% and spread out over the year.
A pressure gauge to show an overview of which resources of the AONB are under stress from the increase in visitors.
Or …
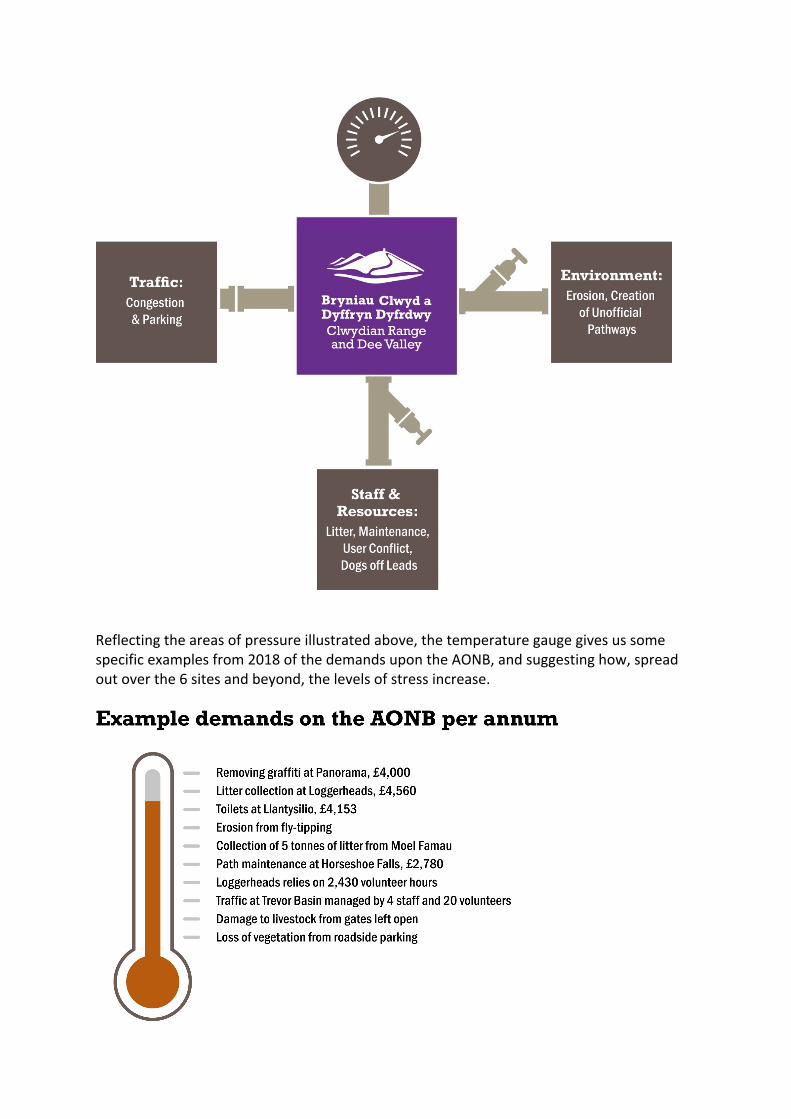
Reflecting the areas of pressure illustrated above, the temperature gauge gives us some specific examples from 2018 of the demands upon the AONB, and suggesting how, spread out over the 6 sites and beyond, the levels of stress increase.
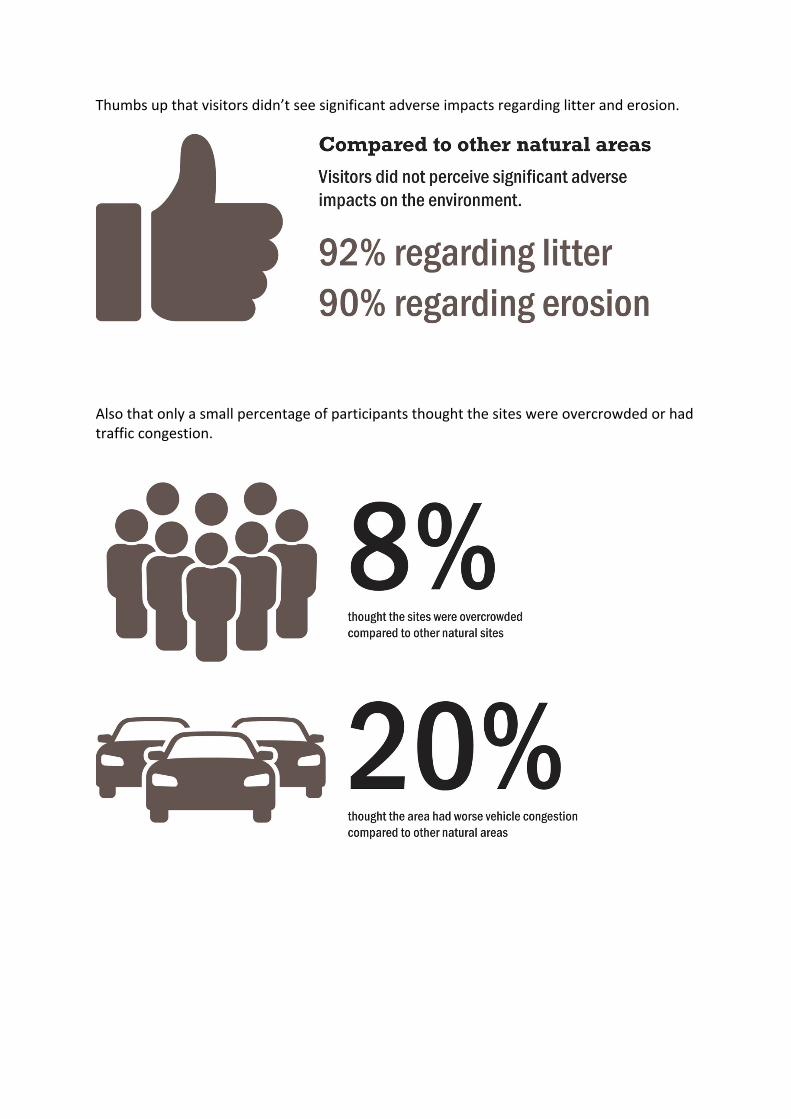
Thumbs up that visitors didn’t see significant adverse impacts regarding litter and erosion.
Also that only a small percentage of participants thought the sites were overcrowded or had traffic congestion.
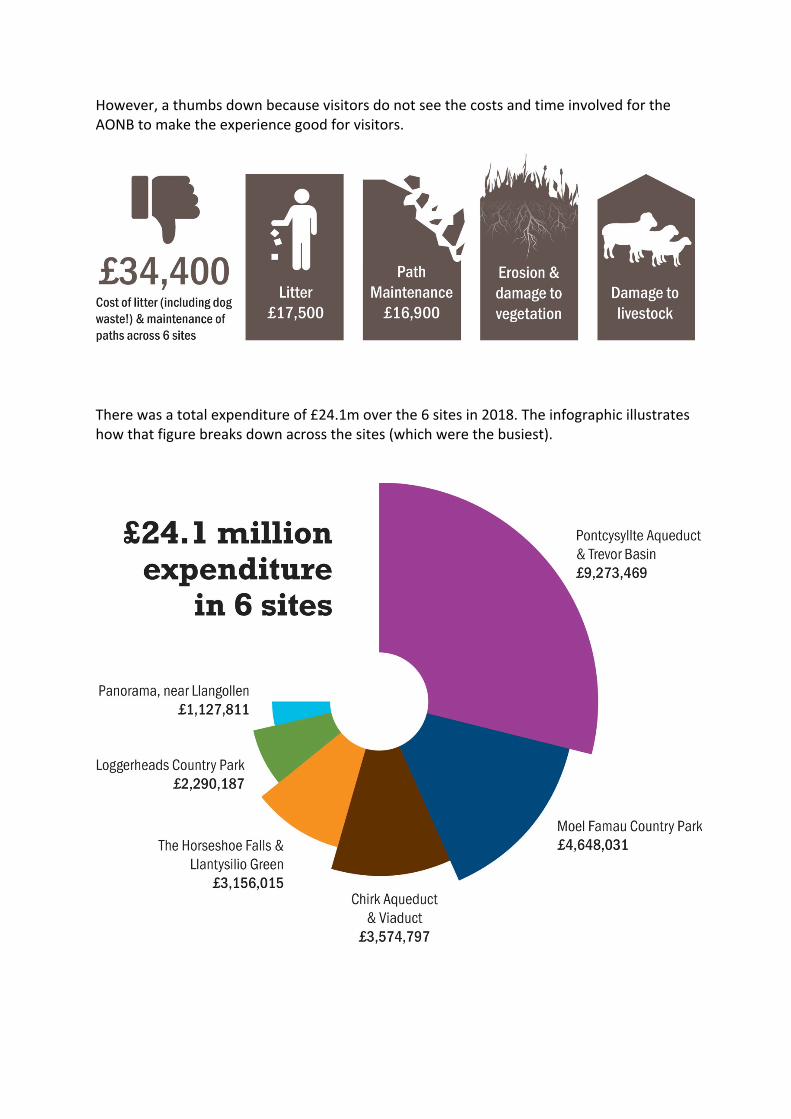
However, a thumbs down because visitors do not see the costs and time involved for the AONB to make the experience good for visitors.
There was a total expenditure of £24.1m over the 6 sites in 2018. The infographic illustrates how that figure breaks down across the sites (which were the busiest).

The recommendations, which are to be put into action across all 6 sites. (More detailed actions per site are in the appraisal document.)