Embed Size (px)
Citation preview
APPROACHES FOR IMPROVING DRAYAGE IN RAIL-TRUCK
INTERMODAL SERVICE
by
Edward K. Morlok UPS Foundation Professor of Transportation
Department of Systems Engineering University of Pennsylvania
Philadelphia, PA 19104-6315 (215) 898-8346
and
Lazar N. Spasovic Assistant Professor
School of Industrial Management and
Center for Transportation Studies and Research New Jersey Institute of Technology
Newark, NJ 07102 (201) 596-6420
August 18, 1994
APPROACHES FOR IMPROVING DRAYAGE IN RAIL-TRUCK INTERMODAL SERVICE
Edward K. Morlok1 and Lazar N. Spasovic2
Abstract
Approaches for improving service quality and reducing cost in the highway portion of rail-truck intermodal transportation are discussed. The highway portion -- termed drayage -- is a major source of service inferiority to the primary competitor -- over-the-road trucking. Drayage costs are also very high, and because these do not vary with the length of the intermodal haul, they preclude profitable intermodal service in the shorter domestic freight markets of less than 600 miles where the highest truck volumes are found. In addition, the inferior service quality precludes intermodal from competing for high quality premium traffic. The potential for overcoming these disadvantages through reorganization of the drayage operation and use of centralized drayage operations planning is discussed. Specific changes in the organizational structure of intermodal and in its operating procedures are outlined.
1 INTRODUCTION
The purpose of this paper is to identify and discuss approaches for improving
service quality and cost of domestic intermodal service. In intermodal transport in
general, a load is moved between the origin and the destination in the same container in a
coordinated manner using two or more transportation modes. The specific system of
concern in this paper is that used in conjunction with rail-truck intermodal or piggyback
service in the United States. In piggyback service, highway trailers or containers loaded
on rail flat cars are hauled by train in line-haul service between the origin and the
destination intermodal terminals, and locally picked up and delivered by truck between
the terminals and shippers and terminals and receivers (termed consignees).
As will be discussed below, rail-truck intermodal service suffers from serious
problems in both productivity and service quality, in drayage or trucking portion of this
1UPS Foundation Professor of Transportation, and Professor of Systems Engineering, Department of Systems Engineering, University of Pennsylvania, Philadelphia, PA 19104-6315. Phone (215) 898-8346, Fax (215) 573-2065. 2Assistant Professor, School of Industrial Management, and Center for Transportation Studies and Research, New Jersey Institute of Technology, University Heights, Newark, NJ 07102. Phone (201) 596-6420, Fax (201) 596-3074.
Morlok, E.K., and Spasovic, L.N. 2
service. This poor productivity effectively limits intermodal to longer distance hauls --
generally greater than 600 miles, thus precluding it from capturing the higher volume
shorter-haul domestic merchandise traffic markets. Without quality improvements, major
inroads into these markets currently held comfortably by over-the-road trucking will be
impossible. After providing the reader with a background on intermodal and its potential,
and identifying problems in the drayage operation, approaches for improvements in
drayage productivity, with implications for service quality and cost, are described.
2 BACKGROUND
2.1 The Rail-Truck Intermodal Concept
The basic concept of intermodal rail-truck service is as follows. Either truck
trailers or containers can be the basic intermodal units; the case of trailers will be
described first. A tractor with an empty trailer (or container) would be dispatched from
the intermodal terminal to a shipper's location in order to pick up a load. The tractor and
driver could wait with the trailer while it is being loaded, in which case the loaded trailer
would then be returned to the intermodal yard for the rail movement. This procedure is
termed "stay with". Alternatively, the trailer might be left with the shipper for loading at a
later time, the tractor then returning without the trailer to the intermodal terminal yard.
After the trailer has been loaded, a tractor would be dispatched to pick up the trailer and
return it to the terminal. This latter option is called "drop and pick". At the terminal, the
loaded trailer would be placed on a piggyback car which would be then hauled in a train
to the destination area intermodal terminal. At the destination end, the drayage operations
would commence, with the trailer delivered to the consignee. After unloading, the empty
trailer would be returned to a pool of empty trailers at the intermodal terminal. The
destination drayage could use either the "stay with" or the "drop and pick" procedure.
In the case of containers, the operations are similar, except that only the container
is carried on the rail car. As a result, a bogie or chassis must be provided for all road
Morlok, E.K., and Spasovic, L.N. 3
moves, and thus a poll of these must be provided at both the origin terminal and the
destination terminal.
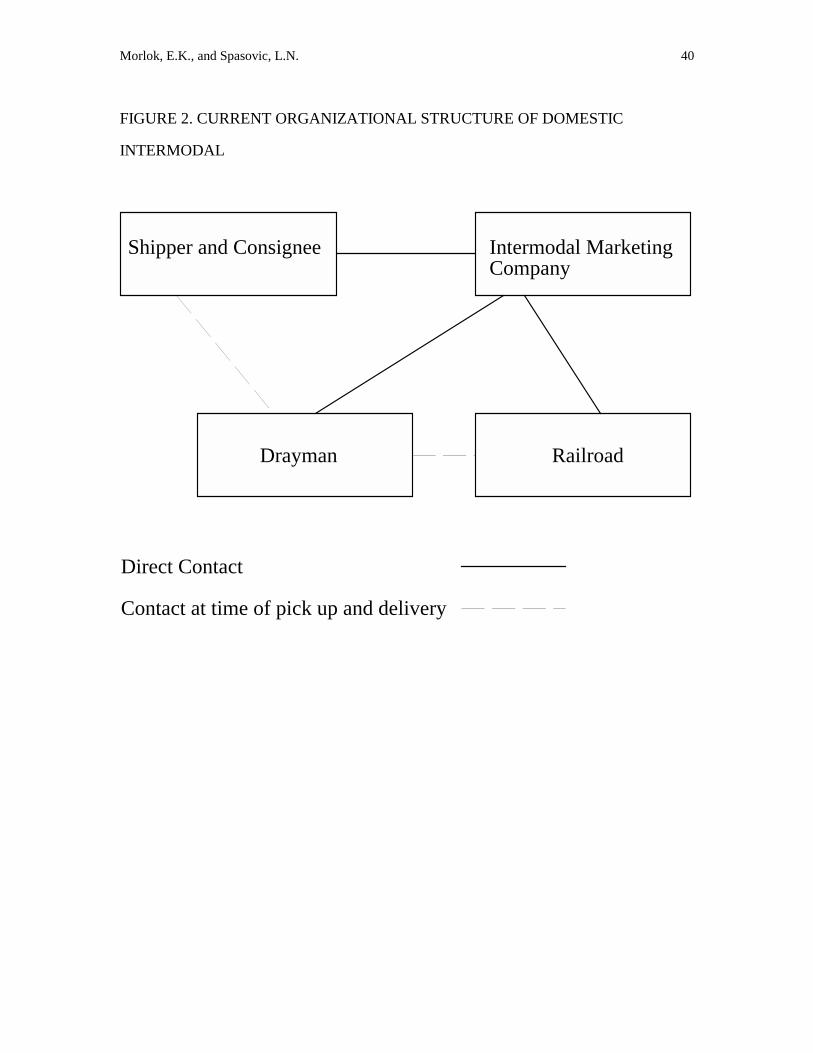
Organizationally, intermodal has been provided in a number of ways, including
railroads providing the four key aspects: rail line haul, terminals and their operation,
sales, and the drayage, all with rail owned equipment and empties. In the last couple of
decades, intermodal service to all but the largest shippers (notably UPS and US Postal
Service) is being accomplished with independent truckers providing the drayage, and
independent sales agents termed intermodal marketing companies (IMCs) doing the
selling. The result is shown in Figure 2, with the IMCs arranging for rail line haul and
drayage.
2.2 Economies of Intermodal Transport
Rail-truck intermodal was primarily designed to compete with over-the-road
trucking. In principle, it combines the best of two modes; economies of rail line haul
wherein a large number of trailers (or containers) is moved at a lower average cost
compared to the parallel over-the-highway movement, with flexibility of truck in local
drayage -- this flexibility enabling pick-up or delivery at the customer's convenience
rather then when a local freight train happens by, and enabling service to points not on
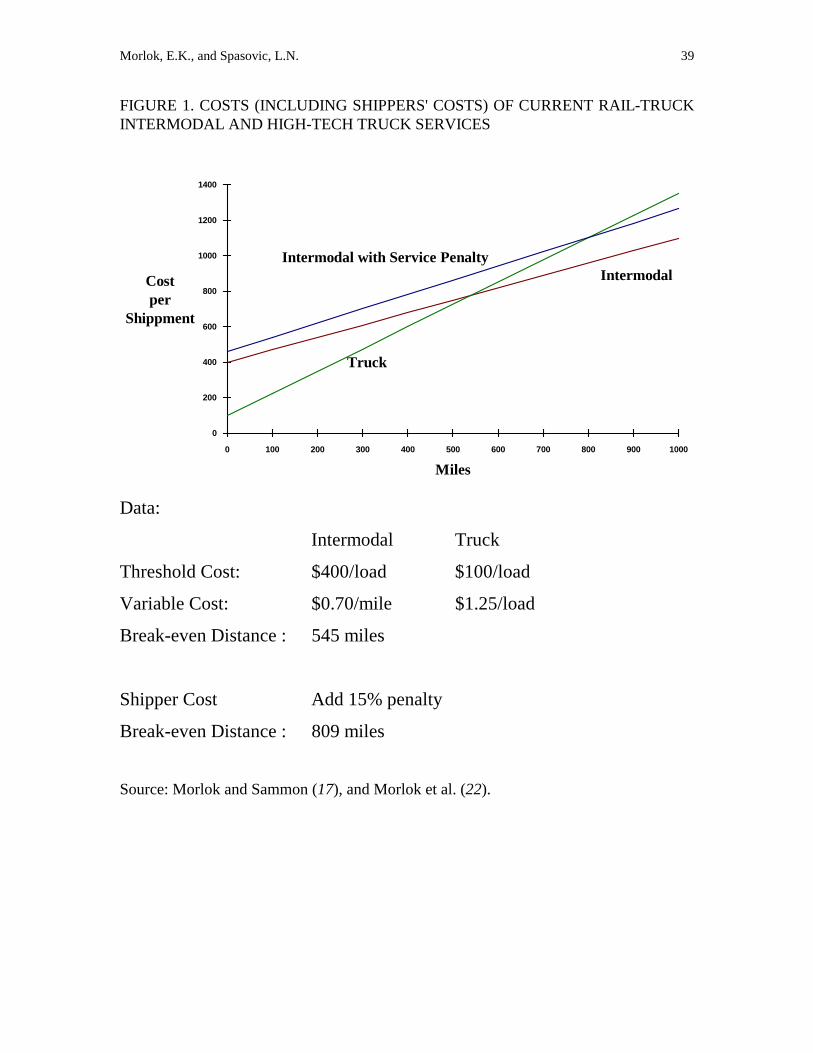
rail lines, among other advantages. The cost characteristics of intermodal service and
trucking are quite different, as illustrated in Figure 1, which portrays the full (or long run)
cost of the two modes on a pre shipment basis as a function of distance. In the case of
trucking, there is a small fixed or threshold cost that is independent of distance,
representing the cost of transactions associated with the movement (documentation,
billing, etc.) and of the loading and unloading activity (including truck time, etc.). The
cost of operating a truck (including ownership, maintenance, etc.) is essentially
proportional to distance. Typical values for the threshold cost are about $80 to $120 per
load and the cost per unit distance is typically in the vicinity of $1 to $ 1.50 per loaded
Morlok, E.K., and Spasovic, L.N. 4
truck-mile, assuming that about 80% or more of the total miles are loaded which is
typical of the most efficient truckers. These costs could be increased proportionally to
include the effect of greater empty mileage. Intermodal transport incurs a much higher
threshold cost, including, in addition to the transaction and loading costs, the costs of
providing the terminal facility, of loading the trailer on the rail car, the corresponding
unloading operation, and of drayage at each end. Typical values for the threshold cost are
$300 to $500. The rail line haul cost per unit distance is in the vicinity of $0.60 to $0.80
per trailer mile.
The net effect of the different cost structures is that there is a break-even distance
below which trucking is less costly and above which intermodal is less costly, as
indicated in Figure 1. Generally this is thought to be in the vicinity of 500 to 700 miles.
Of course, local conditions, particularly the extent of adverse distance for drayage (i.e.
drayage opposite to the direction of the destination), and the degree to which equipment is
fully utilized in both directions, will influence the break-even distance. Using mid-range
values for the above costs of over-the-road and intermodal movements results in a break-
even distance of 546 miles.
While the preceding discussion has been in terms of the carrier cost, it is also
important to consider the cost as perceived by the shipper. The shipper not only pays the
carrier directly for the transportation service, but in addition incurs other costs associated
with the movement. These include the cost of the cargo inventory while in transit,
inventory used as a safety stock in case expected deliveries are late, other inventory costs,
packaging costs, and possibly production or distribution costs. These costs vary with the
mode, because of differences in travel time, reliability, ride quality, and other level of
service (LOS) factors. While the effect of these other factors varies greatly among
different commodities and particular situations, these almost always increase the break-
even distance between rail and truck. This break-even distance is usually thought to be in
the vicinity of 700 to 1000 miles. Using the costs of over-the-road and intermodal
Morlok, E.K., and Spasovic, L.N. 5
movements, and including a penalty of 15% added to the intermodal carrier's costs to
adjust for the service inferiority, results in a break-even distance of 809 miles. This 15%
penalty is often cited as being representative of the value of service inferiority (1, p. 52).
For a haul of d, the truck cost would be $100 + $1.25d while the intermodal cost would
be $1.15 ($400 + $0.70d). Equating and solving for d yields d = (1.15*(400 - 100)/(1.25 -
1.15*0.70) = 809 miles. This value is within the range of a break-even distance indicated
earlier.
It should be noted that intermodal was envisioned to be competitive with intercity
trucking in the sense that it would offer a similar service at a lower cost. However, the
actual cost structure and inferior service quality result in a high break-even distance. This
precludes intermodal service from being a competitive alternative to truck in short haul
markets for which it was originally intended. Given that over 75% of all cargo moves
over distances of 500 miles or less, and 90% moves 900 miles and less (2), intermodal's
competitive position is thus limited to a rather small segment of the intercity freight
market.
In addition, although intermodal traffic volume has grown rapidly over the past
decade, many analysts have concluded that intermodal has been and still is characterized
by low profit margins, describing it as "a great revenue business but poor net revenue
business" (3). It is argued that the low profit margins do not yield acceptable returns on
investment and in turn do not justify the railroads' further investments in intermodal
equipment. This is especially noteworthy because intermodal traffic is concentrated in
long haul markets where its cost advantage over trucking is the greatest, as shown in
Figure 1, and hence the potential for high-margin pricing is the greatest. This weakness in
profitability would explain the lack of investment that has resulted in a serious equipment
shortage and terminal capacity problem, documented in (21), for example, that is
threatening to slow the intermodal growth. In addition, the intermodal was unsuccessful
in making inroads into shorter haul markets of high value merchandise freight.
Morlok, E.K., and Spasovic, L.N. 6
3 POTENTIAL OF INTERMODAL
In the last decade, intermodal service as a whole has grown by a factor of over
100%, i.e. from 3.06 million units in 1980 to 6.21 million units in 1990 (4)3. Various
indicators suggest that the growth in intermodal is going to continue. A number of factors
have supported this trend and these and others suggest that it is likely to continue.
One of the most significant factors supporting this is the shortage of qualified
truck drivers. This shortage is primarily caused by the growing reluctance on part of the
current drivers to continue in the profession that requires them to spend weeks away from
home, lack of interest among the eligible drivers in entering the profession, and to some
degree drivers failing physical exams due to substance abuse. In addition, the driver
shortages are further aggravated by traffic imbalances that leave drivers stranded for days
in one location waiting for the return loads, if the loads can be found, for example, the
excess loads from the production regions of the Mid-West to the consumer regions in the
Northeast.
Faced with driver shortages and low rail intermodal rates, several long distance
truck-load (TL) motor carriers have made alliances with railroads to whom they
contracted out the intercity portion of the truck line haul (5). The truckers have found that
it is cost effective to keep their drayage operations at the intermodal terminals in major
market areas, with drivers stationed there, and utilize a reliable rail link between the
markets. While the contracting out of the line haul could undoubtedly yield significant
cost savings, the resulting predictability of work load and local nature of driver work
assignments should improve driver retention as well. The positive experiences of less-
3 Unfortunately, data on domestic intermodal trailer-on-flat-car (TOFC) and container-on-flat-car (COFC) services as a whole are not available, as these services are typically grouped with the carriage of international containers which are forwarded by rail to and from inland locations for a subsequent trip by water.
Morlok, E.K., and Spasovic, L.N. 7
than-truck-load (LTL) and some TL carriers in using intermodal, the continuing driver
shortages, and recent liberalization of union agreement restrictions on LTL carriers using
intermodal, all point to further increases in the volume of intermodal traffic.
The second major force behind the continued expansion of domestic intermodal is
domestic containerization. In the early 1980s, domestic containerization was spurred by
the re-loading of steamship line containers, which came from the Pacific Rim countries
carrying import cargo to the US ports on the West Cost and moved inland by rail.
Domestic freight was obtained to fill otherwise empty back-hauls to the west (6). The cost
advantage resulting from moving containers double-stacked on flat rail cars, thus
decreasing the average cost of the line haul, and a good performance of the service with
respect to the damage, led to an increase in volume of domestic containers. As a result of
cost advantages and shipper's perception of double-stack as a high quality service,
numerous trucking and shipping companies begun investing in a domestic container fleet
(7).
Third, the public's attitude toward large trucks is changing. Articles decrying the
subsidization of heavy vehicles on the Nation's highways with respect to road
maintenance costs are increasingly common, as are articles pointing out the hidden
subsidies to road traffic in general. As a result, higher user fees, especially for heavy
vehicles, are likely. The introduction of new IVHS - technologies for automatic vehicle
identification (AVI), classification (AVC), and weight-in-motion (WIM) will facilitate
the introduction of user fees that are distance and weight based. Obviously, the truckers
are the natural target for those fees. Also, public opinion seems to be against
liberalization of vehicle size and weight increases, as illustrated by the last federal action
on this subject.
Finally, it is widely perceived that society would benefit from a diversion of
freight traffic from highway to improved rail intermodal. The potential benefits of such a
shift could be incurred in the areas of highway safety, better allocation of funds for
Morlok, E.K., and Spasovic, L.N. 8
highways, and environmental protection. The shift in traffic could reduce the number of
tractor-trailers on the highway, thus potentially increasing the safety of passenger
transportation and reducing the congestion. The decrease in volume of intercity highway
traffic would reduce the damage of highways and, thus, decrease repair and maintenance
cost. Last, but not least, intermodal is being perceived as an environmentally correct or
"green" mode of transportation which is more fuel efficient than truck (e.g., rail can move
the given quantity of freight at less fuel), and thus, it could reduce the air pollution as well
as the consumption of fossil fuel. Recent governmental promotion of intermodalism,
brought forth by the Intermodal Surface Transportation Efficiency Act (ISTEA) of 1990,
calls for the development of innovative ways for planning and financing of intermodal
services. This could further stimulate intermodal growth.
The increased use of intermodal by truckers in the last two years attests to the
general trends of its continued expansion. All indicators show that truckers will be in the
intermodal business for the foreseeable future. A recent study designed to ascertain
preferences about intermodal among the intermodal users and non-users indicated that
80% of shippers surveyed expected TL truckers to offer intermodal services in the next
three to five years (7). It seems that an early concern that the growth rate of piggyback use
among truckers may be limited by the availability of suitable trailers, since not all
existing equipment is suitable for piggyback operation, is being eased with more and
more truckers buying their own container fleets. For example, J. B. Hunt had been
invested 56 million dollars in new containers that will be used exclusively in intermodal..
The major driving force behind this are intermodal revenues which in 1993 were twice
those of 1991. In 1995, Hunt expects intermodal to represent half of the company's
business (8). Its 110 inch high, 45 foot long containers are 4 inch higher than the ordinary
railroad, steamship or third party leaser-owned containers, and can carry up to 1,000
pounds more. In fact, the Hunt containers have the same capacity as ordinary over-the-
highway trailers.
Morlok, E.K., and Spasovic, L.N. 9
It should be noted that, unlike railroads, J. B. Hunt and other truckers seem to
have been able to get a satisfactory return on their investment from dedicated intermodal
fleets and are continuing with equipment acquisitions. Their traffic now represents a
significant portion of the growth of railroad intermodal traffic; fully 50% of last year's
growth came from private fleets (9). All this indicates that intermodal as a transportation
service is sound and likely to grow. But the question remains as to the extent to which
railroads and their traditional parties in intermodal - IMCs and drayage companies - will
participate in and benefit from this growth. This question is discussed next.
4 DRAYAGE AS SOURCE OF PROBLEMS
Despite the recent growth of intermodal, there is ample evidence that there is
considerable need for improvement if it is to capture a much larger share of freight. At
present, it has been estimated that intermodal carries approximately 10%-15% of the
intercity merchandise cargo that is moving at distances over 500 miles (6,10). This
implies that its market share is very small in the high value cargo market for which it was
intended. As it will be discussed below, intermodal rail-truck service suffers from serious
problems in both cost (price) and service quality.
There are numerous reasons for this that have been revealed by many recent
studies probing shippers' views of intermodal. All seem to point to essentially the same
features. Table 1 presents the summary of results of one such study (11). The table reports
the percentage of shippers surveyed who cite each of the eleven reasons why they
currently do not use intermodal. The most commonly cited reason is that intermodal
transit time is not competitive with truck. This is not surprising given the typical
intermodal service of one train per day in each direction (although over a longer distances
the higher cruise speed potential of rail could and sometimes does overcome this time
disadvantage.
Morlok, E.K., and Spasovic, L.N. 10
Another factor underlying this is the fragmentation of responsibility and control
for intermodal movements. Compounding the effect of the fragmentation are the
significant delays which are common between the time when the trailer/container arrives
at the destination terminal and when it is picked up by the draymen for delivery. The next
most frequently cited reason is that the service is not available. This reflects both the
limited number of points between which intermodal service is operated and its absence
from most shorter distance markets (again, defined here as less than 500 miles) in which
the majority of truck traffic moves.
Interestingly, the third most frequently cited reason was the fragmented
responsibility for the service. The difficulty associated with damage and loss problems
was also cited, but less frequently. While fragmented responsibility is separately cited, it
clearly is a major factor underlying items numbered 6 through 9 and items number 2 and
11 in the survey. Cited by about a quarter of the shippers were undesirable equipment and
unreliable equipment. This undoubtedly is partly due to many railroads' reluctance to
invest in intermodal as described earlier. Also, there is much uncertainty as to what
particular equipment technologies will be desirable and needed in the future, a reflection
of the fast pace of technological change. Interestingly about one fifth of the shippers
indicated that the price of intermodal was too high. One interpretation of this is, of
course, that the service disadvantages often found in intermodal are not sufficiently offset
by price savings relative to trucking.
A more recent study (10), the results of which are reported in (12) and shown in
Table 2, addressed shippers perception of intermodal by asking both users and non-users
(of intermodal) the following two questions: How likely were you to increase the use of
intermodal if certain improvements in service quality were made?, and How much are
you willing to pay for these improvements?. The results of the survey reveal that 70% of
the current users of intermodal surveyed would increase its use if loads are delivered the
day when they are scheduled for delivery. Almost 60% of the shippers are also willing to
Morlok, E.K., and Spasovic, L.N. 11
pay more for the service with guaranteed delivery and with a penalty for non-
performance.
Finally, a study of a typical intermodal terminal operation (13) on a major US
railroad revealed that drayage -- and related terminal activities -- is clearly the weak link
in intermodal service. While very stringent service standards were applied to the rail
move, essentially none were applied to drayage. A survey of actual drayage operations, at
what the management felt was a typical terminal, revealed that trailers inbound by rail
remained at the terminal awaiting delivery for an average of 2.3 days, with a standard
deviation of 1.8 days. Only 33% of inbound trailers were removed from the terminal for
delivery within 24 hours of arrival and 98% were dispatched within four days. Delivery to
the consignee would normally be within a few hours of dispatching, given the distances
involved. No similar data were available on pick-ups, but interviews with drayage
companies revealed that most pick-ups were arranged one or more days in advance. A
comparison of these indicators with the "premium" intermodal service provided to UPS
and US Postal Service at the same terminal, where truck and rail movements are closely
coordinated and drayage performed by a dedicated trucker, revealed that the delivery
times are shorter than currently achieved in domestic intermodal. The time between trailer
arrival on rail and delivery by truck was on average 1.7 days, with a standard deviation of
1.6 days.
The above problems are either caused or directly relate to the inefficiencies in
drayage operation. Unless drayage productivity is improved, the intermodal service will
be limited to longer distance hauls and thus precluded from the higher volume medium-
haul domestic merchandise freight markets. Without quality improvement, major inroads
into the premium freight markets currently comfortably held by over-the-road trucking
will be impossible.
4.1 Past Improvements in Intermodal Service
Morlok, E.K., and Spasovic, L.N. 12
In order to compete more effectively with long haul motor carriers, a number of
significant changes have been made in intermodal service in the last two decades. First,
there has been a major change in the technology of rail equipment and track structure.
The introduction of articulated cars (i.e. adjacent cars that are semi-permanently coupled
together and share a common wheel assembly) reduced the slack between the cars, thus
reducing the source of jerking and banging and hence of cargo damage in train
movement. In addition, the reduced tare (empty) weight to load ratio and complexity of
the units, together with the improved aerodynamic properties, resulted in improved fuel
consumption and reduced fuel and motive power (locomotive) requirements. These
changes reduced the cost of the rail line haul movement. The new lighter equipment is
also less expensive to purchase and maintain, thus resulting in reduced track wear and
maintenance costs.
A second major change has been to concentrate traffic at fewer terminals between
which dedicated intermodal trains are operated. Between 1978 and 1986, while the
intermodal volume grew by 88%, the number of intermodal terminals decreased from
1,176 to 361 (14). This densification of traffic has led to economies in terminal operation
by enabling more highly automated equipment to be used. But a major shortcoming of
this consolidation and use of hub and spoke operation is of course that, while it decreased
the terminal costs throughout the system, it also caused the average length of drayage to
increase. This has resulted in a higher average cost of drayage. Also, the use of dedicated
trains has reduced the transit time of cars between terminals, primarily because these
trains make few if any intermediate stops. This has also reduced loss and damage to cargo
since cars need not to go through the classification yards commonly used by regular
freight trains. The use of dedicated trains has also facilitated their operation on a strict
schedule, thus improving both the overall travel time characteristics of intermodal and its
reliability -- at least on the rail portion.
Morlok, E.K., and Spasovic, L.N. 13
A third important change has been that almost all railroads have turned over a
sizable portion of the sales or retailing effort for intermodal to third parties, termed
intermodal marketing companies (IMCs), who act as brokers in arranging for movements.
Primary motivations for this were to obtain nation-wide sales forces and also to obtain
marketing services that were more responsive to shippers' needs.
A fourth change has been to reduce labor cost. Line haul labor cost has been
decreased by decreasing the train crew size, in most cases from three to two. Also, costs
of some of the very labor intensive portions of intermodal service were decreased by out-
sourcing or contracting, including terminal operation and maintenance. The other service
that was out-sourced was that of the drayage, and this is now largely done by relatively
small competitive trucking firms whose costs are considerably below the historic cost
levels of railroad trucking (drayage) subsidiaries.
These changes in sales and drayage have resulted in a relationship between the
railroad and the shipper which is at least one step removed, as shown in Figure 3. While it
has undoubtedly reduced the cost of these activities, this has two distinct disadvantages.
One is loss of contact with the shippers and consignees -- the customers of the service.
The second is fragmentation of responsibility for providing the service, this being split
between the IMCs, the draymen, and the railroads.
5 REQUIREMENTS FOR IMPROVED SERVICE
The previous section points rather clearly to drayage being the primary source of
problems with service quality and cost of intermodal service. Given the reliable and fast
dedicated train service, drayage is the primary cause for both long transit times and transit
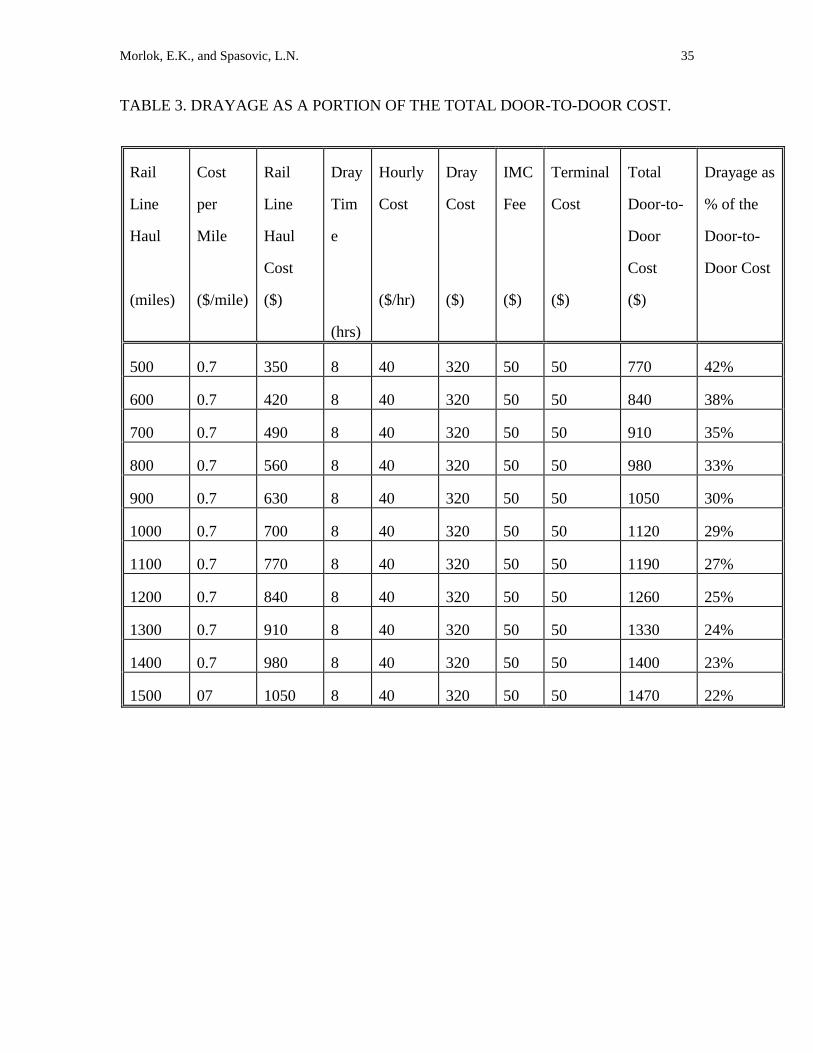
time unreliability. Also, drayage accounts for a very large portion of intermodal door-to-
door cost, as is easily seen by considering a few examples. Assuming optimistically that
drayage requires only 1 hour of tractor time at each terminal, 2 hours (up to 40 miles each
way) driving (round trip) at the origin, the same at the destination, and 1 hour for loading

Morlok, E.K., and Spasovic, L.N. 14
and the same for unloading (8 hours total), at $40/hour, leads to a $320 charge for pick up
and delivery combined. Allowing $50 for the retailers and $50 for the terminal handling,
and $0.70/mile for a rail line haul, yields, for a 1,000 mile haul, a total of $1,120, of
which 29% is drayage. If the line haul were 1,500 miles, the drayage portion is 22% of the
total costs, at 700 miles, fully 35%. Drayage as a portion of the total door-to-door cost for
various lengths of rail line haul is shown in Table 3. Also, if the costs are greater than the
optimistic values assumed here, or drop and pick drayage is used instead of stay with, or
the line haul cost is lower, then the drayage portion is even greater. Also, one industry
source indicated that drayage represented 40% of the total door-to-door cost for a 1,000
mile trip (15). Considering the improvements in cost or performance that have been made
in the other major cost center (sales, terminals, and line haul) the focus naturally falls on
drayage as the area for potential improvements.
The main reason for the high drayage cost is undoubtedly the high percentage of
tractor and tractor-trailer non-revenue movements (called respectively bob-tailing and
deadheading) that are typically required to achieve a high LOS quality of trailer pick ups
and deliveries. It should be noted that drayage was envisioned from the beginning of
intermodal service to be equipment and labor intensive and thus costly. It seems that
drayage operations were originally envisioned as mirroring the movements of rail freight
cars on local trains. Loaded trailers would be delivered, with the tractor often returning
empty to the terminal for another trailer, or vice versa for load pick ups from shippers.
Such operation also enabled prompt delivery and pick ups of loads.
Clearly, the prompt delivery with short time window in which the movements
must be made decreases the probability that both a shipper and a consignee in the same
area or in the vicinity would request service during the same time window. Thus, the
opportunity of using the same truck trailer that delivered a load to the consignee, upon
unloading to pick up a load from a shipper would be diminished. The drayer would have
Morlok, E.K., and Spasovic, L.N. 15
had to charge high rates to account for substantial deadheading associated with the
operation.
Another obstacle to an efficient operation could be the fragmentation of control
over drayage between various players, IMCs and the draymen alike. This fragmentation
leads to many unnecessary tractor movements, bob-tailing and deadheading. It is not
uncommon that at the typical rail terminal, the drayage operation involves a dozen or so
IMCs and two dozen drayers each controlling several load moves and scheduling their
operations independently of one other. This means that tractors often move into and out
of the same area, at about the same time (or within the same time window of a couple of
hours) hauling loads of different IMCs in opposite directions and returning empty.
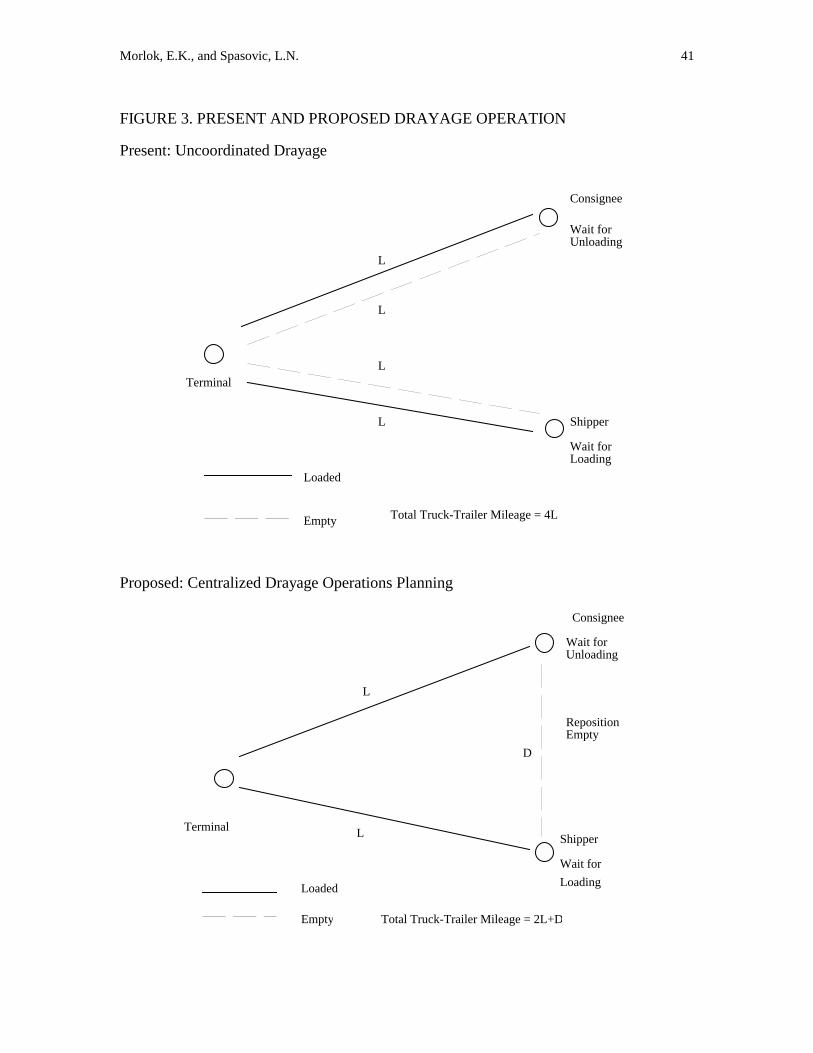
Consider for example a drayage operation shown in Figure 3. Here, a load must be
delivered from the terminal to a consignee and an empty trailer must be delivered to a
shipper for loading within the same time window. Upon loading, the trailer is to be
returned to the terminal for the outbound movement on rail. In drayage, the cost (rate) is
proportional to the miles traveled (or time). If the trailers are moved independently from
one another, the total mileage is 4L. By coordinating the drayage, the mileage could be
decreased to 2L + D, where D represent the repositioning distance from the consignee to
the shipper. If drayage were coordinated, the same tractor that delivers a loaded trailer to
the consignee, waits while it is unloaded, repositions it to a shipper in the same vicinity,
and brings it back to the terminal. The savings, in terms of reduction of tractor-trailer
deadheading miles from the repositioning, over the independent operation is
approximately 2L. This savings is offset by the repositioning mileage, hence the cost of
2L + D. Clearly, this operation is possible only if the shipper requests a trailer similar to
the one delivered to the consignee and the request for moves are made sufficiently close
in time.
To conclude, fragmentation prevents an efficient operation. Current prices are set
assuming that each trailer delivery is undertaken independently of other deliveries. In
Morlok, E.K., and Spasovic, L.N. 16
practice, costs (prices) could deviate, as load density changes and economies and
diseconomies appear. The natural question is: Why not take advantage of these
economies of density? Increasing load density could result in decreasing non-revenue
truck mileage and thus costs. For example, with coordination and information sharing,
cases of two round trip movements, each loaded in only one direction, could be replaced
with one round trip movement with loads in both directions. The cost of a round trip
would then be assigned over the two loads, thus decreasing the cost per load by almost
half compared to the independent operation.
5.1 Proposed Centralized Drayage Operation
Improving this situation is essentially a problem in, first, creating and using the
right information, and second, changing the working relationship between the various
actors so that the information can be acted upon. Specifically, the drayage associated with
an entire terminal must be viewed as a system, and the drayage operation planned so as to
meet the demands and service requirements at a minimum cost.
The basic idea, then, would be to ascertain each day the demands to be met in the
form of loaded trailers to be moved, either to the terminal from shippers or from the
terminal to consignees, and of empty trailers to be spotted for loading or to be removed
after unloading. Tractors and drivers would be assigned to these tasks considering the
totality of work to be done, so as to minimize total cost. Simultaneously the optimal
movements of empty trailers, including repositioning from consignees to shippers, would
be determined and tractors assigned. This would be done by bringing together data on all
the demands to be met, and by applying an appropriate tractor-trailer scheduling
procedure to the problem. Draymen would then follow this master plan in executing the
movements.
The quality of service in this would be preserved by scheduling the moves in
advance. The times of deliveries and pick ups would be negotiated, preferably at the time
Morlok, E.K., and Spasovic, L.N. 17
of load acceptance, considering the possibilities of pairings of moves, thus reducing
empty mileage. The trade off between service quality and cost would be made for each of
the customers. The opportunity of possible pairings would be monitored and, as they
arise, the customer would be advised of possible savings.
Research was undertaken to evaluate the use of centralized drayage operations
planning to both reduce cost (and hence price) and improve service quality of drayage
(15). The central part of the research was the development of a detailed mathematical
model of drayage that was used to evaluate cost savings of an operation in which the
movements of trailers and containers are centrally planned, compared to the current
decentralized drayage operation. The structure of the model is shown in Table 4. The
model is described in (15). Drayage companies would be paid rates that are based on their
costs. The research revealed that substantial cost savings in the range of 43-65%
reduction of cost of centralized operation compared to the current operation [see
(15,16,17)]. It should be noted that these cost savings are achieved with no sacrifice of
service quality of drayage; indeed centralized scheduling should permit service
improvements. Even allowing for sharing of the gains among the players so that each
makes a larger profit, and recognizing that some projected savings may not occur because
of inevitable assumptions in modeling, such gains are clearly sufficient to permit
substantial reductions in the threshold cost (i.e. the cost that doesn't vary with distance in
Figure 1) of intermodal service.
6 INSTITUTIONAL ISSUES AND IMPLEMENTATION
The gains described above arise from centralized drayage operations planning
(CDOP) that makes use of information that now exists but that is dispersed among many
independent disconnected units namely:
• the railroad, on trailer arrivals by rail
Morlok, E.K., and Spasovic, L.N. 18
• the intermodal retailers, on shipper demands for empty trailers and time
commitments for pick-ups and deliveries of loaded trailers, and
• the draymen, on the timing of movements and the location of trailers in the
field
To achieve the gains envisioned, all this information must be brought together and
operating decisions made considering all trailer movements that must be accomplished.
The question of how this can be done is now addressed.
6.1 Organizational Issues
There are many alternative ways which can be identified for achieving centralized
drayage operations planning. The relationships envisioned between the intermodal parties
are shown in Figure 4. The institutional home of the CDOP is deliberately not specified,
as this could be in a variety of organizations, including (1) an independent entity, (2) a
part of the railroad's intermodal organization, (3) an undertaking of a consortium of IMCs
or drayman, or jointly by both, or (4) a single retailer or drayman doing it on behalf of the
others. Obviously such a partnership will require a high level of compatibility of goals
and ways of doing business among the parties, and a high degree of mutual trust.
It is not difficult, though it is highly unlikely, to envision the railroad controlling
the operations planning of drayage. The railroad can do that directly or through a
subsidiary, or an association of drayage companies to which the scheduling function is
assigned. This association would collect information on load and empty movements
needed, from IMCs and the railroad, develop the plan that minimizes the cost of
operation, and relay to the IMCs which drayer to use for each particular movement. A
prerequisite for this scheme is that all drayers operating around the terminal are admitted
into a pool. A condition to be admitted into a pool is that the drayers surrender a control
Morlok, E.K., and Spasovic, L.N. 19
of their own scheduling to the organization. This setup, arrangement of railroad control, is
not likely to be established for two main reasons. First, any move by the railroads to
control drayage may be perceived by IMCs as a threat to their existence. The IMCs could
easily envision that confidential information, once it is shared with the associations, will
become public, and, thus used by competing IMCs to take over their customers. Second,
it is widely perceived by some experts that the railroads' associations with intercity long
haul truckers will put enough pressure on IMCs so that they will have to improve
equipment management (9).
A more likely association would be a partnership between IMCs and a railroad in
managing drayage. IMCs can be motivated to participate in such a partnership and invest
their resources by being rewarded in the form of more traffic or greater profits (or the
threat of loosing traffic if they did not join in). This partnership could select drayage
companies to work with, and undertake the information sharing and planning itself or
through a contractor, perhaps an advanced drayage company. Thus many options exist.
Given the numerous options, the term "coordinated", rather than "centralized", may be
equally descriptive of the changes envisioned in planning and operations.
6.2 Operating Issues
Assuming than some form of partnership for purpose of centralized drayage
operations planning is established, then procedures for rational compensation of drayage,
equipment activity tracking, and service quality control are needed. These procedures are
critical for the practicability and workability of the unified operation.
First, the basis of payment for drayage services will have to be rationalized.
Presently there is considerable variation in the profitability of different drayage moves,
those to some areas being highly desirable and profitable and other not so. This is due to
such factors as payment essentially on a mileage basis even though costs are incurred
largely on the basis of time expended, peculiarities of only partial reimbursement for tolls
Morlok, E.K., and Spasovic, L.N. 20
and other fees that vary with the specific move, hidden or only partly compensated
activities in connection with some moves (e.g., the required return trip to pick-up the
trailer in the case of a "drop and pick" assignment), among others. Now, IMCs try to
assign jobs so as to spread the desirable and undesirable movements among the drayage
firms and drivers, mindful of seniority, cooperation shown, etc. In addition., 90% of
drayage companies use owner-operators (according to informal industry estimates). Based
on discussion with drayage companies, it is typical that under the current payment scheme
the owner-operators receive approximately 70% of a round trip rate that involves taking a
loaded trailer out and bringing it empty, or vice-versa. This payment scheme offers the
owner-operators no incentive to pair trailer moves along the lines outlined in Figure 3,
because they perceive the payment they would receive for the combined operation would
be much less. When the drayman is instructed by an IMCs to pair or triangulate moves, it
is paid a rate that is a fraction of the two round trip rates plus the cost of repositioning.
Consider for example a pairing of two $400 round trip moves that does not require re-
positioning. For this, the drayman would receive 55% of each round trip rate, 70% of
which is paid to the owner-operator. Thus, instead of receiving $560 (70% of the two
$400 round trip rates) for two independent moves, the owner-operator receives only $294
(0.7*(0.55*($400+$400))). Naturally, the owner-operators expect to get paid for their
time, regardless the fact it was spent unproductively from the drayage point of view. All
this must be changed in order to make the concept of centralized planning of drayage
operations acceptable to the three parties involved in intermodal service.
Common to all approaches proposed in Figure 4 is the development of a
computerized system -- decision support tool -- to be used for efficient scheduling and
pricing of drayage moves. This system, which is envisioned to aid dispatchers in day-to-
day planning, scheduling and pricing of tractor and trailer movements, consists of three
modules: a customer data base, a geographical information system (GIS) for displaying
Morlok, E.K., and Spasovic, L.N. 21
transportation network as well as customer locations and vehicle activities, and a
scheduler.
The database would contain data on customer profiles. These will include: the
precise addresses (street, town, ZIP of customer facilities, the site specific time-windows
for deliveries and pick-ups, the characteristics of loading and unloading facilities and
available equipment, the customer preferences as to the type of drayage (e.g., stay with or
drop and pick operation), as well as the customer preferred types and characteristics of
trailers/containers). The geo-referenced portion of the customer data base would be
interfaced with GIS software thus enabling the graphical display of customer locations as
icons. These locations, together with vehicle location and status icons would facilitate
visualizations of drayage and aid in operations planning. The "point (with an arrow) and
click" (on an icon) dispatcher interface with the GIS system should provide easy access to
all important customer information through convenient pull-down menus. These would
facilitate browsing through and retrieving of all customer specific information.
Given the shippers/consignees requests and the current location and status of
truck-trailers, the scheduler would determine an efficient (or optimal) plan of deliveries of
loaded trailers to consignees and pick-up of loads from shippers and assign tractors to
trailers. The scheduler would also produce optimal routing and scheduling plans for each
tractor. Consideration should be given to, not only movements of loads, but also to the
repositioning of empties to be loaded, to meeting shippers preferences and requirements,
and to assisting in negotiating with shippers and consignees regarding the precise times of
deliveries, unloading and loading, and pricing. The system should be capable of taking
into account requests for services in real or near-real time and be able to produce updated
schedules as needed (e.g., in response to deviations from an earlier schedule). The newly
received service requests will be graphically displayed on the monitor together with
revisions and schedule updates. The core of the scheduler would be an optimization
model that determines the tractor assignments so as to minimize the drayage cost subject
Morlok, E.K., and Spasovic, L.N. 22
to meeting the demands and service requirements. The optimization model of drayage
operation described in (15, 17) could be used as a basis for the development of such a
tool.
This system must recognize clear service commitments and provide proper rates
for each drayage move to be undertaken. Currently, drayage rates are derived on the basis
of average costs of an independent operation with 50% empty mileage, rather than on the
actual cost of a move. Often in complex intermodal transportation systems characterized
by load imbalances and terminal congestion, the movement of an additional trailer may
result in a substantial increase in the cost of operation (19). This cost may be significant
and exceed the rate charged for the movement, or alternatively, it could add little to the
overall cost. For example, repositioning a trailer upon unloading at a consignee to pick up
a load at a shipper in the vicinity for subsequent return to the terminal, can be very
efficient since involves fewer empty miles compared to the case of supplying an empty
from the terminal. However, the repositioning and the pick up may require an excessively
long period of driver-assisted loading of the trailer, for example, thus tying up a driver in
an inefficient operation. Even if the drayman gets paid for the driver and tractor idle time,
the compensation may not be sufficient. The system should be able to quickly check the
data base, pull out customer profiles including its loading practices, that could reveal this
potential problem, and proper, higher rate would be quoted.
This problem of tying up drivers and tractors in inefficient operations can be
exacerbated during periods of high (peak) demand when there could be a shortage of
drivers to move the loads. In this case, the system should identify proper rates for the
moves and identify the loads that may be rejected. The system should be able to recognize
the time varying costs of back-haul opportunities and price them accordingly. As a result,
the shippers would be provided various service commitment-price trade-offs so that they
can understand how much more they should pay for the service in periods of high demand
compared to the lower rates that could be quoted during a lull in drayage operation.

Morlok, E.K., and Spasovic, L.N. 23
If a centralized operation is to be introduced, and presumably along with that set
the origin-destination rates for each movement, the actual cost of drayage should be the
basis for paying the drayage and for the overall shipment price. The proposed model can
provide the proper guidelines for pricing of moves. Clearly, the proper pricing of drayage
rates in centralized - or coordinated operation - is a prerequisite for efficient operation.
7 PUSHING FOR CHANGE
The most important question in redesigning -- or reengineering -- drayage is who
should lead the proposed organizational and operational change? The answer to this is
rather obvious: it is in the IMCs' best interest to lead the way for the change, because they
stand to gain the most from it.. The increased use of piggyback by premium long haul
truckers, such as J. B. Hunt and Schneider, has dramatically changed the intermodal
business. With the trucker's entrance in the intermodal arena, the IMCs have encountered,
almost overnight, a strong competitor with a far reaching sales force and a vast
experience in efficient equipment management (5).
It only takes simple back-of-the-envelope arithmetic to show that IMCs will not
be able to compete with intermodal truckers if they continue to tolerate inefficient
drayage. Because of the higher density of trailer loads in intermodal markets, an efficient
trucking company (e.g., J. B. Hunt) is likely to have lower cost of drayage. The higher
load density increases the probability of load matching, i.e. using the same tractor-trailer
to move loads in both direction between the terminal and shippers and consignees thus
reducing deadheading and/or bob-tailing. This lower drayage cost could enable the
trucker to offer a competitive rate on the door-to-door movement. This rate should not
necessarily be lower than the one the trucker would charge for a pure over-the-highway
movement. This means that the trucker can use intermodal so as to boost its profit
margins by taking advantage of shippers' perception of the superior quality of truck
Morlok, E.K., and Spasovic, L.N. 24
service, despite the fact that the load has moved by intermodal. However, the trucker
could also choose to lower its door-to-door rate to take business away from IMCs.
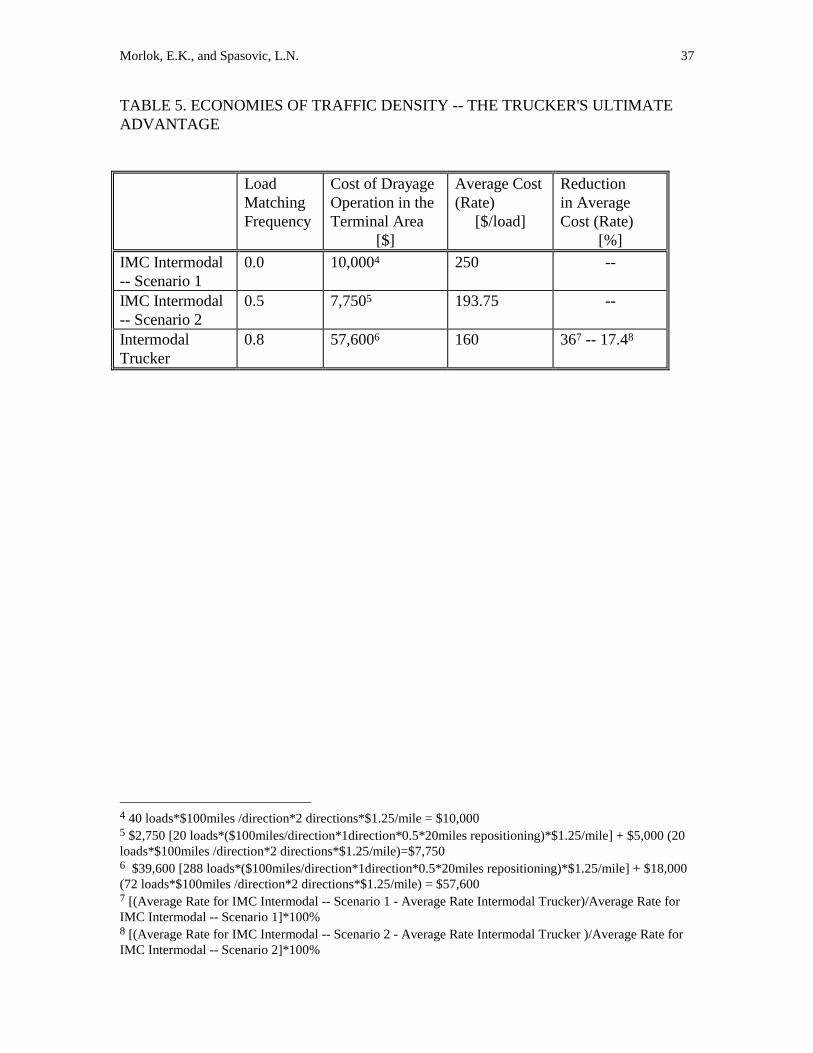
A hypothetical example will illustrate the trucker's advantage resulting from
higher load density. In the example, a weekly volume of 1,000 TLs around an intermodal
terminal is split between IMCs and long haul truckers according to a 10%:90% split. This
is a plausible split since various sources cite intermodal having 10% of the market above
the 500 miles length of haul (6). Assume, that in each market segment, there is a
dominant firm controlling 40% of the volume. This translates into 40 loads for an IMC
and 360 loads for a trucker, respectively. The trucker operates efficiently with 80% of
loaded miles (i.e. it matches 80% of its loads) and is considering contracting out the
intercity portion to rail. Two scenarios are assumed for the IMC operation. Under
Scenario 1, the loads move independently of each other, while in Scenario 2 pick ups are
paired with deliveries for 50% of the loads. The lower load density of the IMC share
causes that it is unlikely that more than 50% of the load moves can be paired. Assume
further that an average one-way dray is 100 miles, and that the rate is $1.25 per mile, for
both the trucker and an IMC hired drayer. Also, when the loads are paired, there is an
average 20 mile empty repositioning. It should be noted that in the real world, an intercity
trucker is likely to the lower cost per mile, than the drayer. However, since the primary
objective of this exercise is to show the impact of traffic density on the cost of drayage,
the trucker's and the drayer's rates are assumed to be equal. The results, shown in Table 5,
indicate an average drayage costs per load for the IMC operation of $250 and $193.75 for
Scenarios 1 and 2 respectively, and $160 for the trucker. The trucker's rate is 36% and
17.42% lower than the IMC rates for Scenario 1 and 2 respectively.
Assuming the IMC operates according to the more favorable Scenario 2, the
reduction of drayage cost of 17.42% would translate into a substantial reduction in the
door-to-door rate. For the IMC, the door-to-door rate is a sum of drayage costs, rail cost
and its fee, and is expressed as $387.5/load + $0.70/rail-mile* X (miles) + $50/load (fee).
Morlok, E.K., and Spasovic, L.N. 25
For the trucker, this rate equals to the sum of drayage and the rail rate: $320/load +
$0.70/rail-mile*X (miles). For various lengths of rail haul of 600, 700, 800 and 1,000
miles, the door-to-door trucker rate is 13.7%, 12.67 %, 11.78% and 10.33 % lower than
the IMC rate. If the shippers' costs are taken into account by imposing a 15% penalty on
the IMC service rate to account for the perceived inferior service quality, the door-to-door
trucker rate becomes 24.95%, 24.06%, 23.29% and 22.03% lower. The bottom line is that
the trucker has a tremendous competitive advantage in terms of cost and service.
The IMCs must take notice about these truckers economies and change the way
they operate intermodal service. It would be unfortunate and even ironic that IMCs, who
have done excellent job in sustaining intermodal business during the lean years of 1970,
did not recognize the danger of doing business as usual and get pushed out of the
intermodal marketplace. Indeed, this truckers' competitive advantage resulting from
efficient equipment management, has been recognized by some principal intermodal
players: several higher quality IMCs and drayers. IMCs have begun offering truck
competitive intermodal services that entail a tight and complete control over all aspects of
intermodal links. An example of such service is the Hub Group's BANTAM service
introduced, not by accident, soon after J. B. Hunt introduced its QUANTUM service with
Santa Fe (5).
Ownership and control the truckers have over their equipment puts them in a
better position to satisfy customers during the periods of higher demand often resulting in
railroad and third party leasing equipment shortage. However, its is not the capital
ownership that matters. It is the trucker's practice of better equipment management so that
he gets satisfactory return on the investment. Traditionally, IMCs not having invested in
the equipment, did not pay attention to its utilization and they often behaved as a one-way
travel agents. They either sent the equipment off-line without worrying how to get it back,
or returned it back to the nearest rail terminal equipment pool without managing to re-
load it. This resulted in inefficient utilization with long trailer cycles. Such practice is
Morlok, E.K., and Spasovic, L.N. 26
unacceptable in the today's competitive intermodal market. The Hub Group has realized
this and has begin improving the equipment utilization by finding return loads for their
drayage (9). The payoff of this is two-fold. First, the productivity of drayage is increased
leading to competitive drayage rates, and second, the customer service is improved
because of the implicit control of the equipment the Hub has through the efficient
management. In addition, the Hub, according to its chairman P. Yeager, believes that
sharing the information among the parties in intermodal chain is the key for improving
equipment utilization and service quality (20).
There are some indications that IMCs are sharing the information and cooperating
with each other in improving equipment utilization. A good example of this is a
coordination of operations between CTSI, an IMC which serves primarily the Southeast
US, and its partner IMC on the West Cost (9). The CTSI notifies its sister IMC in
advance of any loaded trailers/containers coming her way that will be available for re-
loading. The sister IMC solicit the re-loads, and upon loading sends the trailer/container
back to the CTSI. The same would take place in the reverse direction. By balancing the
loads, these IMCs ensure that the equipment stays under their control, an important issue
in the current environment of equipment shortage. However, it is not clear, how much of
this cooperation is driven by the need to hold onto the scarce equipment as opposed to the
need to make a voluntary improvement in the drayage productivity and thus in cost and
service quality of the whole intermodal.
In addition there is a change in the way drayage is doing business. The
competitive drayage companies are moving toward the centralized dispatching. Those
with a regional service are looking at the bottom line of their whole operation rather than
on the per terminal basis. They are trying to balance their loads and eliminate inefficient
inter-terminal competition, which often results in nice revenues on the individual terminal
profit and loss statements but poor net revenue figures for the company. In addition, the
high-tech drayage carriers are entering into partnerships with intermodal long haul

Morlok, E.K., and Spasovic, L.N. 27
truckers to do drayage for them in certain urban areas in which the trucker has no local
fleet presence. Also, they are entering into partnerships with leading railroads and IMC
for whom they are becoming the primary drayer and to whom they are offering
competitive rates in return for the predictable volume of traffic.
The changes above indicate that some of the predictions made by Morlok and
Spasovic (18) have begun to be adopted by the intermodal industry. The examples of
changes in relationships indicated above seem to reflect a realization on the part of
intermodal players of the need to introduce a tighter control over the intermodal chain.
8 LOOKING AHEAD TOWARD THE BIG PAYOFF
If the above proposed organizational and operational changes associated with the
introduction of unified drayage were implemented, the future intermodal service will be
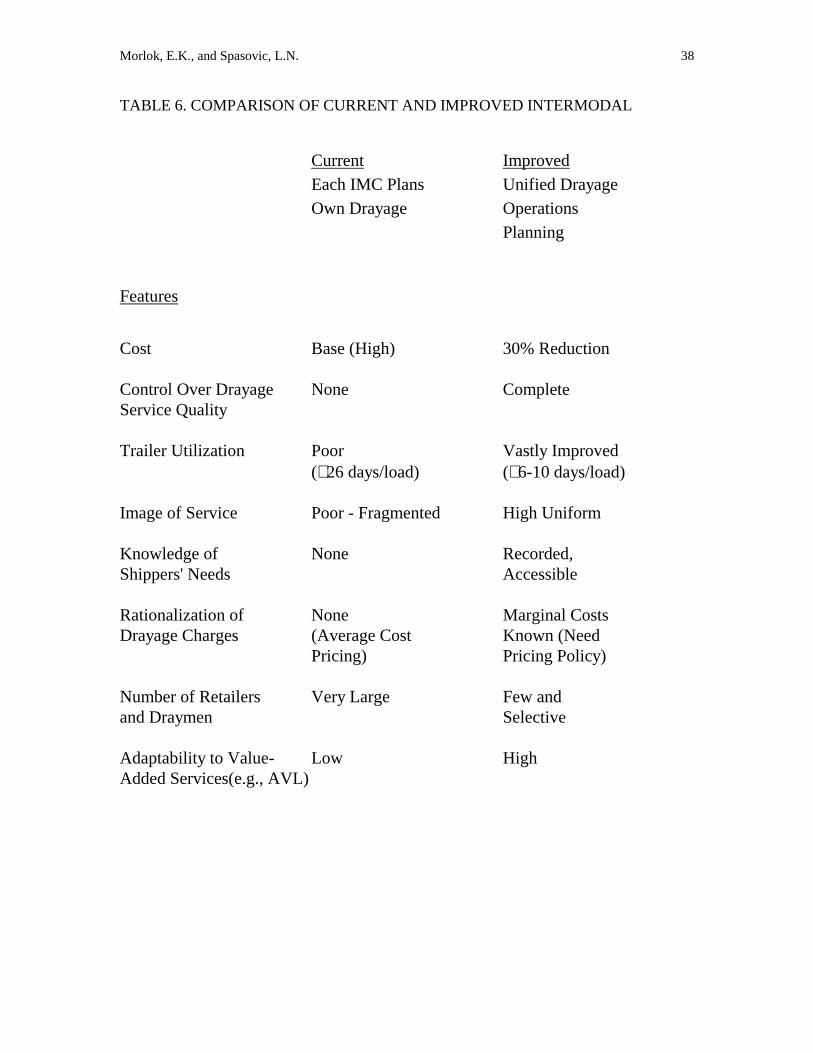
characterized with improved service quality and reduced cost. A comparison of current
and improved intermodal service is given in Table 6. It is conservatively estimated that
the unified drayage operations planning would yield reduction in drayage cost of
approximately 30%. The tighter control of intermodal process will result in efficient
equipment management. It is expected that the trailer utilization would be substantially
improved from approximately 26 days/load (13) to 6-10 days/load. This should somewhat
alleviate the problem of equipment shortage.
As a result in the intermodal improvements, the industry will be dominated by a
smaller number of high tech IMCs and drayers who will use information technology and
sophisticated operations management procedure to offer high quality service. The
competition in the marketplace will eliminate those IMCs who have failed to accept the
above outlined organizational and operational improvements in the intermodal process
and continued to operate inefficiently and take each other's traffic for a small reduction in
drayage rate. The development and use of the decision support systems for operations
planning will result in competitive and rational pricing of drayage services in particular
Morlok, E.K., and Spasovic, L.N. 28
and intermodal service in general. The use of management information systems will result
in shippers profiles and knowledge base being easily accessible thus resulting in better
and more accurate servicing of customer needs. The organizational and operational
improvements will result in uniform service quality and better perception of service on
part of shippers. The resulting higher profit margins would stimulate the introduction of
Intelligent Vehicle-Highway Systems (IVHS) technology such as Automated Vehicle
Location (AVL) systems that would enable drayage to track location and status of their
equipment almost continuously. This information would enable instant routing of
available truck-trailers to respond to shippers requests.
The benefits of improved drayage operation are substantial. Not only will the
improvement in drayage improve the service and increase the profitability of intermodal
in the markets currently served by intermodal, but by reducing the threshold cost of the
service and improving its quality, the break-even distance will be reduced substantially so
that intermodal can compete in the largest truckload markets. This is shown in Figure 5.
To illustrate the leverage that reducing drayage costs and increasing service quality can
have, consider their impact on the break-even distance of 809 miles calculated earlier. If
the drayage cost of $300 ($400 less typical values of $50 for sales and $50 for terminal
activity) is reduced by 30%, the threshold cost would become $310. If the improved
quality reduced the service inferiority adjustment premium of 15% by half to 7.5%, then
the break-even distance is reduced to:
1.075(310) - 100)/(1.25 - (1.075)(0.70)) = 468 miles.
The break-even distance is reduced to less than half its previous value, more
precisely, a reduction of 58%. While all the caveats about the applicability of this
calculations to specific commodities and conditions still apply, it nevertheless indicates
very persuasively the leverage of improvements in drayage have on the ability of
intermodal to compete across major intercity trucking markets. A comparable reduction
(30%) in any other costs element produces a much smaller reduction in the break-even
Morlok, E.K., and Spasovic, L.N. 29
distance. Moreover, considering the improvements in cost or performance that have been
made in the other major cost center (sales, terminals, and line haul), no means of creating
a 30% cost reduction is foreseeable. Indeed, the only real prospect is the use of double-
stack containers, and line haul savings of about 20% per container (load) have been
reported, but against this must be weighed the cost of separate road chassis assemblies
and the need for a unique fleet. In addition, ordinary double-stack rates are typically less
than trailer-on-flat-car rates, by 5 to 10% (1), reflecting differences such as lower
capacities and more difficult loading. Incorporating both these adjustments leads to a
break-even distance of
((1.20(400) - 100)/(1.25 - (1.20)(0.70)(0.80)) = 657 miles
only 19% less than the current estimate of 809 miles. Thus drayage improvements are
clearly the key for substantially reducing the break-even distance and thereby enlarging
the intermodal market.
9 CONCLUSIONS
Intermodal service suffers from both productivity and quality problems,
particularly in drayage. Previous research (15,16, 17) has shown that potential exists for
major and simultaneous improvements in both productivity and service quality in
drayage, and hence in the overall intermodal transportation service. An especially
promising approach to improvement is to reorganize the way the different players that
combine to provide intermodal service relate to one another and perform various tasks.
This reorganization centered on drayage service must entail the use of information on the
status of loads and customers service expectations to achieve efficient scheduling and
pricing of drayage movements. This is critical to intermodal becoming an effective
alternative to over-the-road trucking over the spectrum of intercity markets. In addition,
the change in a ways IMCs administer domestic intermodal is necessary in order to
counteract the effects of increased competition from high-tech long haul truckers that are
Morlok, E.K., and Spasovic, L.N. 30
entering partnerships with railroads. In order to stay competitive, the IMCs must lead the
change in a way the intermodal is operated. The changes proposed in this paper, have
enormous potential for improving cost and service quality. If implemented, they will
result in intermodal becoming competitive in the shorter haul (less than 500 - 700 mile)
merchandise freight traffic markets for which it was originally intended and where the
bulk of truck traffic lies.
Morlok, E.K., and Spasovic, L.N. 31
ACKNOWLEDGMENT
This research was supported by a grant from the US Department of
Transportation, through the Mid-Atlantic Universities Transportation Center, Grant No.
1DTOS88-90003, and a grant from the Consolidated Rail Corporation (CONRAIL), and
also supported by the UPS Foundation Professorship in Transportation held by the first-
named author, and the NJIT SBR Program. This support is gratefully acknowledged but
implies no endorsement of the conclusions by these organizations.
The research benefited substantially from discussions with Messrs. Gordon H.
Kuhn, Senior Vice President - Marketing and Sales, Ralph Von dem Hagen, Assistant
Vice President - Car Management, and John F. Betak, Assistant Vice President - Asset
Development, and the active involvement of Mr. John P. Sammon, Assistant Vice
President - Intermodal, all of Conrail. Special thanks are due to Mr. David M. Toth,
Manager - Strategic Development, for the extensive data gathering effort.
Morlok, E.K., and Spasovic, L.N. 32
REFERENCES
1 D. S. Smith et al. Double-Stack Container Systems: Implication for US Railroads and
Ports, Final Report to US Department of Transportation by Manalytics, Inc. and others,
1988.
2. National Transportation Strategic Planning Study, US Department of Transportation,
1990.
3. R. K. Whitford. Research Needs Related to Intermodal Freight Transportation.
Transportation Research Circular, No. 338, October 1988.
4. Association of American Railroads (1992) Railroad Facts, Washington, DC.
5. M. E. McDonald. Truckload Carriers Climb into the Intermodal Ring, Traffic
Management, July 1993 pp. 49-52
6. D. R. McKenzie, M. C. North and D. S. Smith. Intermodal Transportation-The Whole
Story, Simmons-Boardman, Omaha, NE, 1989.
7. H. L. Richardson. Act Now, Keep Intermodal Moving, Transportation and
Distribution, April 1994, pp. 30-33
8. --, J. B. Hunt Transportation Services: Every Problem is Opportunity, Fortune
Magazine, 1993.
9. J. McQuaid. Is There a Need for a National Pool of Intermodal Equipment,
Proceedings of the 35th Annual Meeting of the Transportation Research Forum, New
York, 1993, pp. 142-162.
10. Intermodal Association of North America, 1992 IANA/INTL Intermodal Index.
11. Temple, Barker, and Sloane, Inc. (1989) Shipper Perceptions of Intermodal, paper
presented to the Intermodal Marketing Association, Maui, HI, February 1989.
12. H. L. Richardson. Better Service Draws Freight to Rail, Transportation and
Distribution, April 1993, pp. 30-33
13. L. N. Spasovic and E. K. Morlok. Case Study Data: Sources and Analysis,
Department of Systems Engineering, University of Pennsylvania and US DOT Mid-
Morlok, E.K., and Spasovic, L.N. 33
Atlantic University Research Transportation center (MAUTC), IMSP WP90-1.1.1990,
pp.38.
14. C. D. Martland. Intermodal Innovations: Railroad Counterattack in Battle for
Merchandise Traffic. Kent T. Healy Memorial Lecture VI, Pennsylvania State University,
March 24, 1998.
15. L. N. Spasovic. Planning Intermodal Drayage Network Operations. Ph.D.
Dissertation. University of Pennsylvania. Department of Systems, 1990.
16. E. K. Morlok, S. F. Hallowell, and L. N. Spasovic and J. P. Sammon (1990) Studies
in Intermodal Freight Transport Service Planning, Vol. 1. Final Report to US
Department of Transportation and Conrail, NTIS No. PB91-226993, 1991.
17. E. K. Morlok and J. P. Sammon. Summary of Results of University of Pennsylvania
Research Service Quality and Reducing Costs into Improving Intermodal Drayage
Operations, University of Pennsylvania and Conrail, Philadelphia, Pennsylvania, 1990.
18. E. K. Morlok and L. N. Spasovic Redesigning Rail-Truck Intermodal Drayage
Operations for Enhancing Service and Cost Performance. Proceedings of the 34th
Annual Meeting of the Transportation Research Forum, Saint Louis, October 1992.
19. L. N. Spasovic and E. K. Morlok. Using Marginal Costs to Evaluate Drayage Rates in
Rail-Truck Intermodal Service, Transportation Research Record, No. 1383, June 1993,
pp. 8-16.
20. P. C. Yeager. Sharing the Intermodal Wealth, Inbound Logistics, October 1993, pp.
47.
21 D. Smith and F. R. Harder. Intermodal Terminal Capacity and Outlook, 4 parts,
Intermodal Trends, Vol. V, Association of American Railroads, Washington DC, 1994.
22. E. K. Morlok, J. P. Sammon, L. N. Spasovic, and L. K. Nozick. Improving
Productivity in Intermodal Rail-Truck Drayage Service and its Implications for Product
Positioning and Organizational Structure. The Service Productivity and Quality
Challenge (Patrick T. Harker, editor) Kluwer Academic Press (forthcoming 1994).

Morlok, E.K., and Spasovic, L.N. 34
TABLE 1. SHIPPERS' REASONS FOR NOT USING INTERMODAL Item Reasons %
1 Transit Time Not Competitive with Truck 62%
2 Service Not Available 45%
3 Fragmented Responsibility 43%
4 Undesirable Equipment 28%
5 Unreliable Equipment 25%
6 Lack of Information 25%
7 Poor Customer Service 23%
8 Damage Problems 22%
9 Claims Problems 21%
10 Price To High 19%
11 Billing Problems 11%
Source: Temple, Barker and Sloane (11). TABLE 2. SHIPPERS REACTIONS TO SELECTED IMPROVEMENTS IN INTERMODAL
Likelihood of increasing use of intermodal
Willingness to pay premiums for service improvements
Type of Improvement
Users Non-Users Users Non-Users
1. 98% of all shipment delivered as scheduled
69% 53% 42% 35%
2. One day faster door-to-door travel time
65% 51% 43% 34%
3. Unconditional service quarantines with penalty for non-performance
57% 48% 56% 49%
Source: Richardson (12), pp. 31.
Morlok, E.K., and Spasovic, L.N. 35
TABLE 3. DRAYAGE AS A PORTION OF THE TOTAL DOOR-TO-DOOR COST.
Rail
Line
Haul
(miles)
Cost
per
Mile
($/mile)
Rail
Line
Haul
Cost
($)
Dray
Tim
e
(hrs)
Hourly
Cost
($/hr)
Dray
Cost
($)
IMC
Fee
($)
Terminal
Cost
($)
Total
Door-to-
Door
Cost
($)
Drayage as
% of the
Door-to-
Door Cost
500 0.7 350 8 40 320 50 50 770 42%
600 0.7 420 8 40 320 50 50 840 38%
700 0.7 490 8 40 320 50 50 910 35%
800 0.7 560 8 40 320 50 50 980 33%
900 0.7 630 8 40 320 50 50 1050 30%
1000 0.7 700 8 40 320 50 50 1120 29%
1100 0.7 770 8 40 320 50 50 1190 27%
1200 0.7 840 8 40 320 50 50 1260 25%
1300 0.7 910 8 40 320 50 50 1330 24%
1400 0.7 980 8 40 320 50 50 1400 23%
1500 07 1050 8 40 320 50 50 1470 22%
Morlok, E.K., and Spasovic, L.N. 36
TABLE 4. MODEL STATEMENT
Minimize Total Drayage Tractor Ownership and Operating Costs by
selecting trailer movements and locations and assigning tractors to those
movements
Subject to:
• Delivering all inbound loads to receivers within specified time
windows
• Delivering empty trailers to shippers for loading within specified
time windows
• Picking Up loaded trailers within specified time windows and
delivering them to terminal
• Repositioning trailers as they are emptied so as to avoid
accumulation.
Morlok, E.K., and Spasovic, L.N. 37
TABLE 5. ECONOMIES OF TRAFFIC DENSITY -- THE TRUCKER'S ULTIMATE ADVANTAGE Load
Matching Frequency
Cost of Drayage Operation in the Terminal Area
[$]
Average Cost (Rate)
[$/load]
Reduction in Average Cost (Rate)
[%] IMC Intermodal -- Scenario 1
0.0 10,0004 250 --
IMC Intermodal -- Scenario 2
0.5 7,7505 193.75 --
Intermodal Trucker
0.8 57,6006 160 367 -- 17.48
4 40 loads*$100miles /direction*2 directions*$1.25/mile = $10,000 5 $2,750 [20 loads*($100miles/direction*1direction*0.5*20miles repositioning)*$1.25/mile] + $5,000 (20 loads*$100miles /direction*2 directions*$1.25/mile)=$7,750 6 $39,600 [288 loads*($100miles/direction*1direction*0.5*20miles repositioning)*$1.25/mile] + $18,000 (72 loads*$100miles /direction*2 directions*$1.25/mile) = $57,600 7 [(Average Rate for IMC Intermodal -- Scenario 1 - Average Rate Intermodal Trucker)/Average Rate for IMC Intermodal -- Scenario 1]*100% 8 [(Average Rate for IMC Intermodal -- Scenario 2 - Average Rate Intermodal Trucker )/Average Rate for IMC Intermodal -- Scenario 2]*100%
Morlok, E.K., and Spasovic, L.N. 38
TABLE 6. COMPARISON OF CURRENT AND IMPROVED INTERMODAL
Current Improved Each IMC Plans Unified Drayage Own Drayage Operations Planning
Features
Cost Base (High) 30% Reduction Control Over Drayage None Complete Service Quality Trailer Utilization Poor Vastly Improved (∼ 26 days/load) (∼ 6-10 days/load) Image of Service Poor - Fragmented High Uniform Knowledge of None Recorded, Shippers' Needs Accessible Rationalization of None Marginal Costs Drayage Charges (Average Cost Known (Need Pricing) Pricing Policy) Number of Retailers Very Large Few and and Draymen Selective Adaptability to Value- Low High Added Services(e.g., AVL)
Morlok, E.K., and Spasovic, L.N. 39
FIGURE 1. COSTS (INCLUDING SHIPPERS' COSTS) OF CURRENT RAIL-TRUCK INTERMODAL AND HIGH-TECH TRUCK SERVICES
Miles
Costper
Shippment
0
200
400
600
800
1000
1200
1400
0 100 200 300 400 500 600 700 800 900 1000
IntermodalIntermodal with Service Penalty
Truck
Data:
Intermodal Truck
Threshold Cost: $400/load $100/load
Variable Cost: $0.70/mile $1.25/load
Break-even Distance : 545 miles
Shipper Cost Add 15% penalty
Break-even Distance : 809 miles Source: Morlok and Sammon (17), and Morlok et al. (22).
Morlok, E.K., and Spasovic, L.N. 40
FIGURE 2. CURRENT ORGANIZATIONAL STRUCTURE OF DOMESTIC
INTERMODAL
Shipper and Consignee Intermodal Marketing
RailroadDrayman
Direct Contact
Contact at time of pick up and delivery
Company
Morlok, E.K., and Spasovic, L.N. 41
FIGURE 3. PRESENT AND PROPOSED DRAYAGE OPERATION
Present: Uncoordinated Drayage
Terminal
Consignee
Wait forUnloading
Shipper
Wait forLoading
Loaded
Empty
L
L
L
L
Total Truck-Trailer Mileage = 4L
Proposed: Centralized Drayage Operations Planning
Terminal
Consignee
Wait forUnloading
Shipper
Wait forLoading
RepositionEmpty
Loaded
Empty
L
L
D
Total Truck-Trailer Mileage = 2L+D
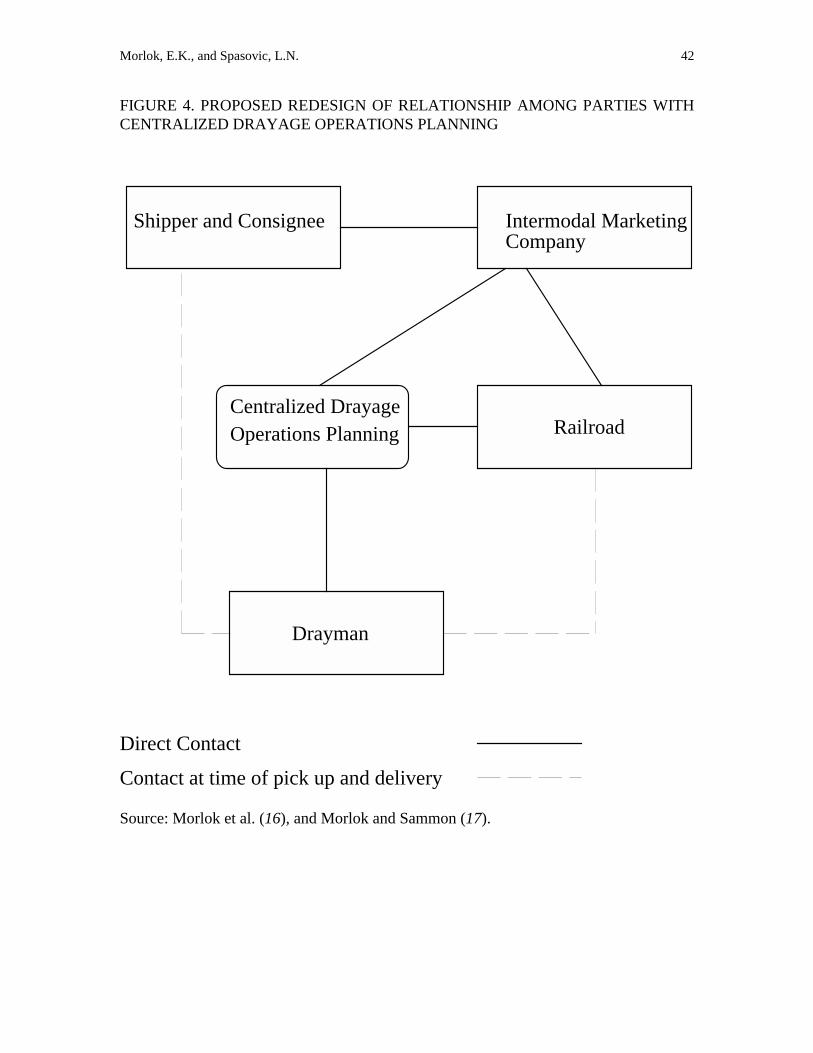
Morlok, E.K., and Spasovic, L.N. 42
FIGURE 4. PROPOSED REDESIGN OF RELATIONSHIP AMONG PARTIES WITH CENTRALIZED DRAYAGE OPERATIONS PLANNING
Shipper and Consignee Intermodal Marketing
Centralized DrayageOperations Planning Railroad
Drayman
Direct Contact
Contact at time of pick up and delivery
Company
Source: Morlok et al. (16), and Morlok and Sammon (17).
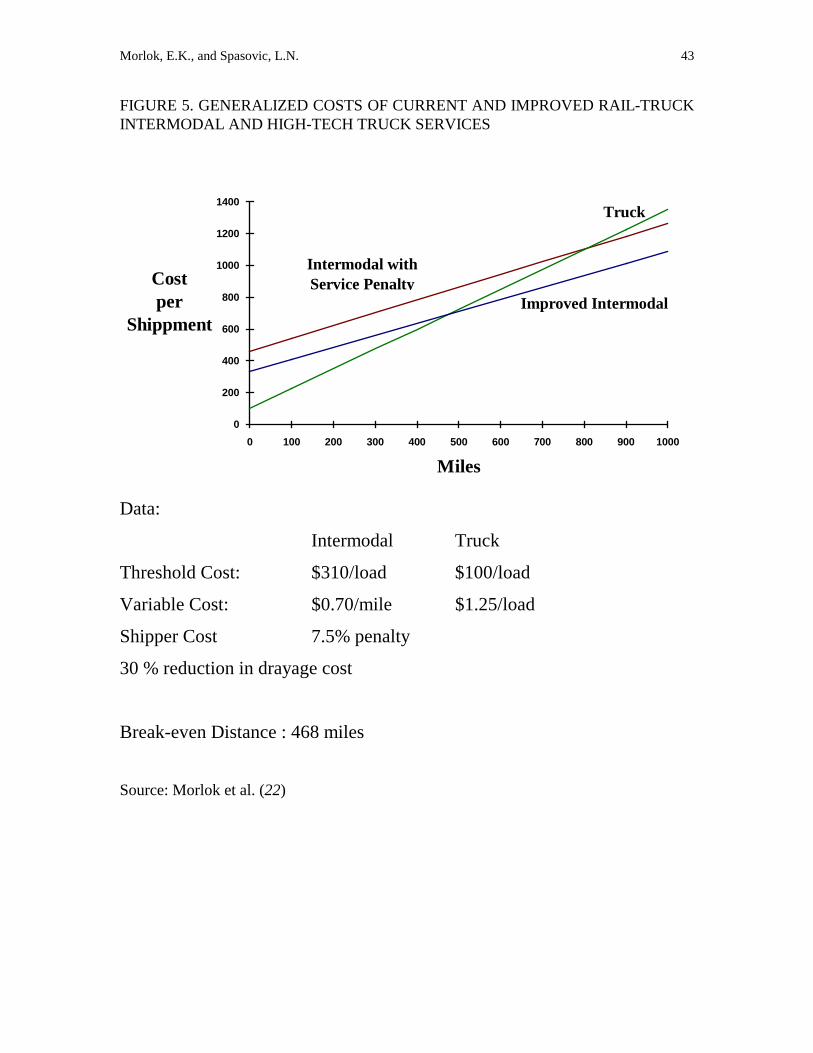
Morlok, E.K., and Spasovic, L.N. 43
FIGURE 5. GENERALIZED COSTS OF CURRENT AND IMPROVED RAIL-TRUCK INTERMODAL AND HIGH-TECH TRUCK SERVICES
Miles
Costper
Shippment
0
200
400
600
800
1000
1200
1400
0 100 200 300 400 500 600 700 800 900 1000
Truck
Intermodal withService Penalty
Improved Intermodal
Data:
Intermodal Truck
Threshold Cost: $310/load $100/load
Variable Cost: $0.70/mile $1.25/load
Shipper Cost 7.5% penalty
30 % reduction in drayage cost
Break-even Distance : 468 miles Source: Morlok et al. (22)


![Intermodal Drayage Onboarding Packet - UPDS SERVICE PROVIDER PRE-QUALIFICATION. O. N-BOARDING . Q. UESTIONNAIRE /I. NTERVIEW [Drayage and Trucking Services] PART I: BACKGROUND INFORMATION](https://img.pdfslide.net/doc/110x75/5ab98ffb7f8b9ac10d8e69a7/intermodal-drayage-onboarding-packet-service-provider-pre-qualification-o-n-boarding.jpg)