Embed Size (px)
Citation preview
THE PORT AUTHORITY OF NEW YORK AND NEW JERSEY
PORT COMMERCE DEPARTMENT
DRAYAGE TRUCK CHARACTERIZATION SURVEY AT THE PORT AUTHORITY AND THE GLOBAL MARINE TERMINALS
DECEMBER 2008
Prepared for:
The Port Authority of New York and New Jersey
Prepared by:
Starcrest Consulting Group, LLC PO Box 5098
Albuquerque, New Mexico 87185-5098
Starcrest Consulting Group, LLC 31 December 2008
The Port Authority of New York and New Jersey Drayage Truck Characterization Survey
at the Port Authority and the Global Marine Terminals
Executive Summary
At the direction of the Port Authority of New York and New Jersey (the Port Authority), Starcrest Consulting Group, LLC (Starcrest) and Hatch Mott MacDonald (HMM) conducted a survey of drayage trucks at the five Port Authority maintained marine container terminals (leased to private companies) and one privately owned marine container terminal. The purpose of the survey was to collect information on the age and activity characteristics of drayage trucks. A copy of the survey questions related to these characteristics is included in Appendix A. The following terminals were surveyed:
Port Newark Container Terminal (PNCT) at Port Newark Maher Terminal at the Elizabeth Port Authority Marine Terminal (EPAMT) APM Terminal at EPAMT New York Container Terminal at Howland Hook Marine Terminal American Stevedoring, Inc (ASI) secondary barge depot at Port Newark Global Marine Terminal (a privately owned terminal)
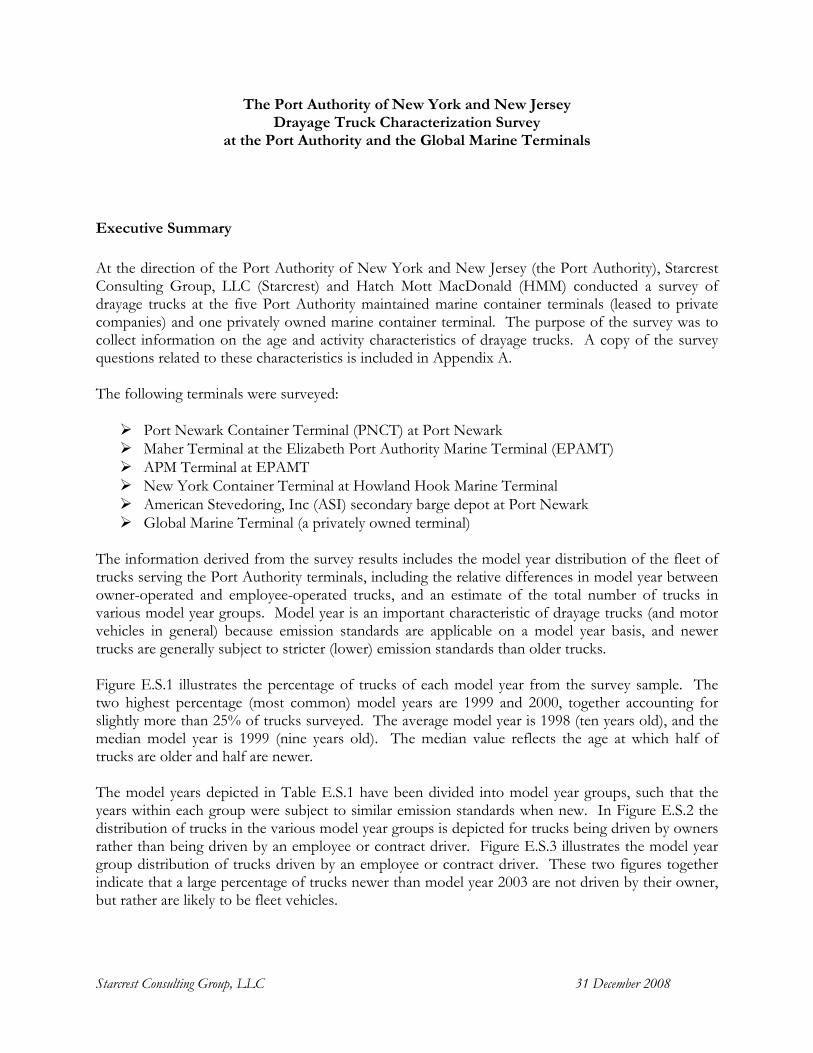
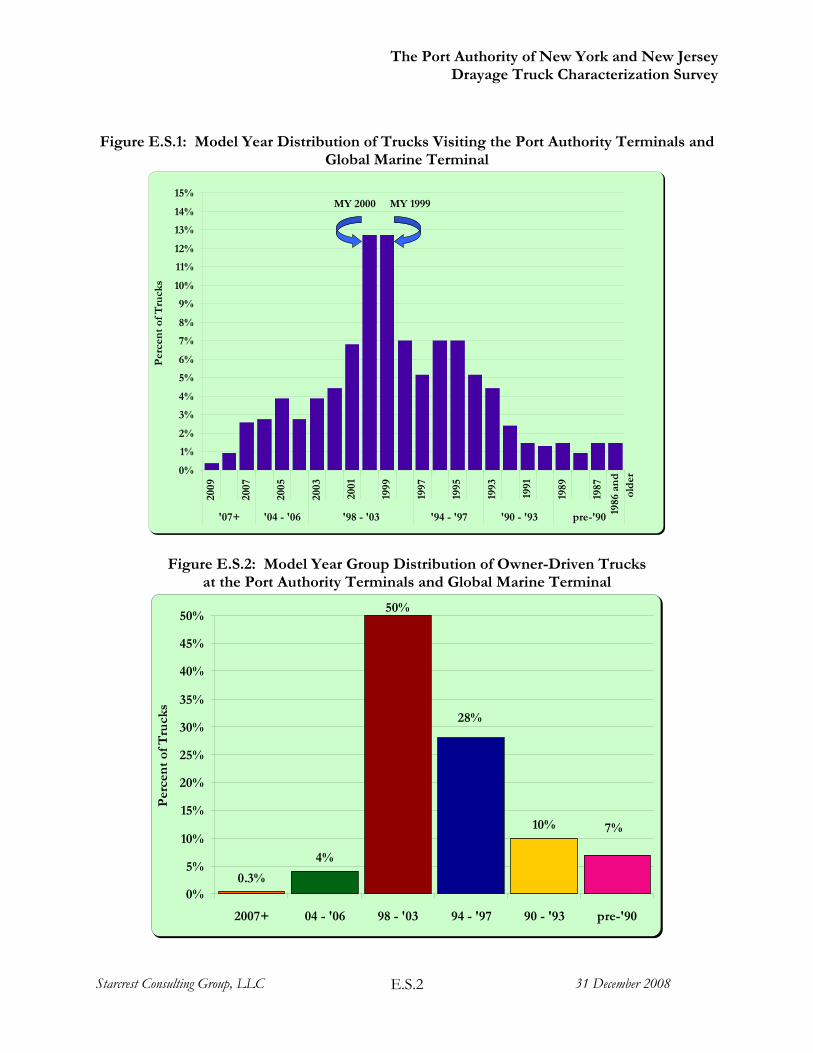
The information derived from the survey results includes the model year distribution of the fleet of trucks serving the Port Authority terminals, including the relative differences in model year between owner-operated and employee-operated trucks, and an estimate of the total number of trucks in various model year groups. Model year is an important characteristic of drayage trucks (and motor vehicles in general) because emission standards are applicable on a model year basis, and newer trucks are generally subject to stricter (lower) emission standards than older trucks. Figure E.S.1 illustrates the percentage of trucks of each model year from the survey sample. The two highest percentage (most common) model years are 1999 and 2000, together accounting for slightly more than 25% of trucks surveyed. The average model year is 1998 (ten years old), and the median model year is 1999 (nine years old). The median value reflects the age at which half of trucks are older and half are newer. The model years depicted in Table E.S.1 have been divided into model year groups, such that the years within each group were subject to similar emission standards when new. In Figure E.S.2 the distribution of trucks in the various model year groups is depicted for trucks being driven by owners rather than being driven by an employee or contract driver. Figure E.S.3 illustrates the model year group distribution of trucks driven by an employee or contract driver. These two figures together indicate that a large percentage of trucks newer than model year 2003 are not driven by their owner, but rather are likely to be fleet vehicles.
The Port Authority of New York and New Jersey Drayage Truck Characterization Survey
Starcrest Consulting Group, LLC 31 December 2008 E.S.2
Figure E.S.1: Model Year Distribution of Trucks Visiting the Port Authority Terminals and
Global Marine Terminal
0%
1%
2%
3%
4%
5%
6%
7%
8%
9%
10%
11%
12%
13%
14%
15%
2009
2007
2005
2003
2001
1999
1997
1995
1993
1991
1989
1987
'07+ '04 - '06 '98 - '03 '94 - '97 '90 - '93 pre-'90
Per
cen
t of
Tru
cks
MY 1999MY 2000
1986
an
d
old
e r
Figure E.S.2: Model Year Group Distribution of Owner-Driven Trucks at the Port Authority Terminals and Global Marine Terminal
0.3%
4%
50%
10%
28%
7%
0%
5%
10%
15%
20%
25%
30%
35%
40%
45%
50%
2007+ 04 - '06 98 - '03 94 - '97 90 - '93 pre-'90
Per
cen
t of
Tru
cks
The Port Authority of New York and New Jersey Drayage Truck Characterization Survey
Starcrest Consulting Group, LLC 31 December 2008 E.S.3
Figure E.S.3: Model Year Distribution of Trucks Driven by Other than Owner
at the Port Authority Terminals and Global Marine Terminal
10%
40%
18% 17%
8% 7%
0%
5%
10%
15%
20%
25%
30%
35%
40%
2007+ 04 - '06 98 - '03 94 - '97 90 - '93 pre-'90
Per
cen
t of
Tru
cks
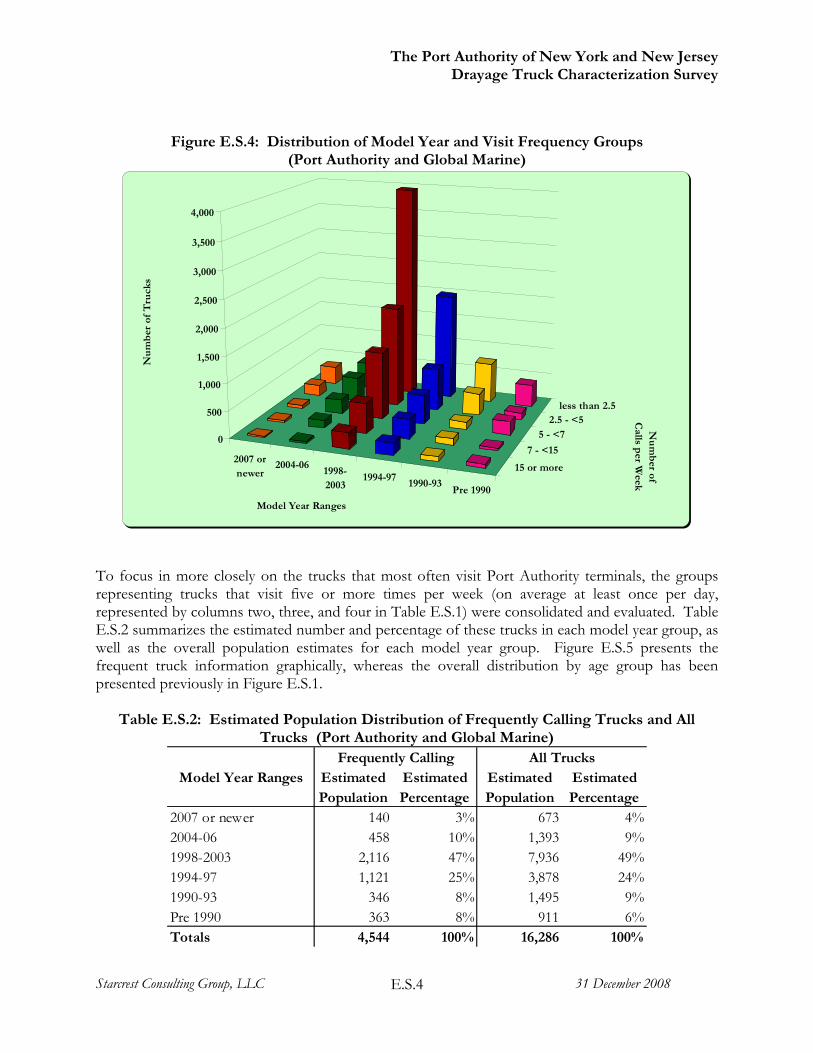
The number of trucks in each model year group was estimated using reported frequency of visits to Port Authority terminals and the estimated total number truck visits per week. Visit frequencies were divided into five groups, ranging from the frequently visiting group of trucks making 15 or more trips to a Port Authority terminal per week (an average of three trips per day) to the least frequently visiting group averaging fewer than 2.5 visits per week (making, on average, less than one visit every other day). Table E.S.1 and Figure E.S.4 illustrate the estimated number of trucks in each model year and visit frequency group. The table illustrates an estimated 1,285 trucks, for example, in the 7 to 15 visit-per-week group, with 48 of those being model year 2007 or newer, and 48 being older than model year 1990.
Table E.S.1: Distribution of Model Year and Visit Frequency Groups (Port Authority and Global Marine)
Visits per Week: 15 or more 7 - <15 5 - <7 2.5 - <5 less than 2.5 All
Model year ranges:
2007 or newer 24 48 68 204 330 6732004-06 42 144 271 441 494 1,3931998-2003 308 565 1,244 1,866 3,954 7,9361994-97 217 360 543 780 1,977 3,8781990-93 91 120 136 407 741 1,495Pre 1990 66 48 249 136 412 911Totals 749 1,285 2,510 3,833 7,908 16,286
The Port Authority of New York and New Jersey Drayage Truck Characterization Survey
Starcrest Consulting Group, LLC 31 December 2008 E.S.4
Figure E.S.4: Distribution of Model Year and Visit Frequency Groups
(Port Authority and Global Marine)
2007 ornewer
2004-061998-2003
1994-971990-93
Pre 1990
15 or more
7 - <15
5 - <72.5 - <5
less than 2.5
0
500
1,000
1,500
2,000
2,500
3,000
3,500
4,000
Nu
mb
er o
f T
ruck
s
Model Year Ranges
Nu
mb
er of C
alls per W
eek
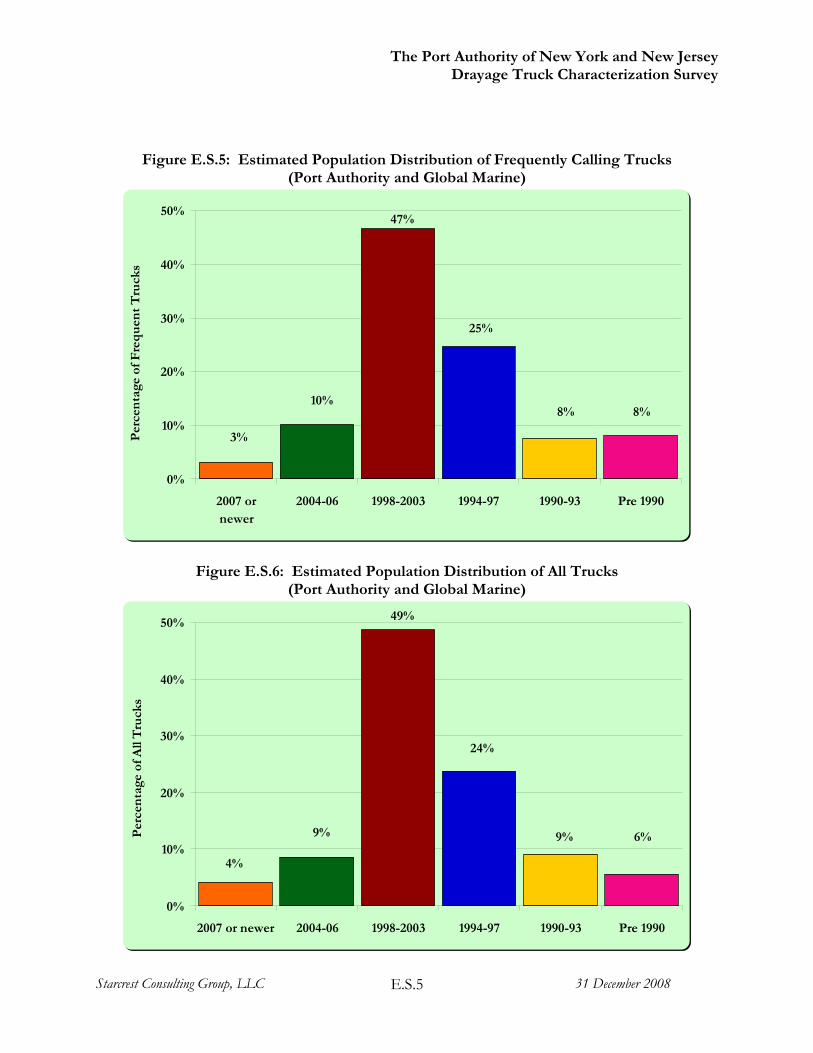
To focus in more closely on the trucks that most often visit Port Authority terminals, the groups representing trucks that visit five or more times per week (on average at least once per day, represented by columns two, three, and four in Table E.S.1) were consolidated and evaluated. Table E.S.2 summarizes the estimated number and percentage of these trucks in each model year group, as well as the overall population estimates for each model year group. Figure E.S.5 presents the frequent truck information graphically, whereas the overall distribution by age group has been presented previously in Figure E.S.1.
Table E.S.2: Estimated Population Distribution of Frequently Calling Trucks and All Trucks (Port Authority and Global Marine)
Model Year Ranges Estimated Estimated Estimated EstimatedPopulation Percentage Population Percentage
2007 or newer 140 3% 673 4%2004-06 458 10% 1,393 9%1998-2003 2,116 47% 7,936 49%1994-97 1,121 25% 3,878 24%1990-93 346 8% 1,495 9%Pre 1990 363 8% 911 6%Totals 4,544 100% 16,286 100%
Frequently Calling All Trucks
The Port Authority of New York and New Jersey Drayage Truck Characterization Survey
Starcrest Consulting Group, LLC 31 December 2008 E.S.5
Figure E.S.5: Estimated Population Distribution of Frequently Calling Trucks (Port Authority and Global Marine)
3%
10%
47%
25%
8% 8%
0%
10%
20%
30%
40%
50%
2007 ornewer
2004-06 1998-2003 1994-97 1990-93 Pre 1990
Per
cen
tage
of F
req
uen
t T
ruck
s
Figure E.S.6: Estimated Population Distribution of All Trucks (Port Authority and Global Marine)
6%9%
24%
49%
9%
4%
0%
10%
20%
30%
40%
50%
2007 or newer 2004-06 1998-2003 1994-97 1990-93 Pre 1990
Per
cen
tage
of A
ll T
ruck
s
Starcrest Consulting Group, LLC 31 December 2008
The Port Authority of New York and New Jersey
Drayage Truck Characterization Survey at the Port Authority and the Global Marine Terminals
1.0 Introduction
At the direction of the Port Authority of New York and New Jersey (the Port Authority), Starcrest Consulting Group, LLC (Starcrest) and Hatch Mott MacDonald (HMM) conducted a survey of drayage trucks at the five Port Authority maintained marine container terminals (leased to private companies) and one privately owned marine container terminal. The purpose of the survey was to collect information on the age and activity characteristics of drayage trucks. A copy of the survey questions related to these characteristics is included in Appendix A. The following terminals were surveyed:
Port Newark Container Terminal (PNCT) at Port Newark Maher Terminal at the Elizabeth Port Authority Marine Terminal (EPAMT) APM Terminal at EPAMT New York Container Terminal at Howland Hook Marine Terminal American Stevedoring, Inc (ASI) secondary barge depot at Port Newark Global Marine Terminal (a privately owned terminal)
The terminals were surveyed once each day between 4 September 2008 and 11 September 2008 (excluding weekend days) at locations and times determined through coordination with the terminal operators. One of the primary considerations required by the operators was that the drivers would not be unduly delayed so as to avoid creating a backup in terminal operations. In most cases surveying commenced before the terminal’s morning opening time to take advantage of the queue of drivers waiting for the gates to open. After gate opening, the surveyors moved to locations approved by the operators where drivers routinely spend time waiting, such as roadability stations, where trailers are inspected and repaired, and trouble windows, where drivers resolve issues with the paperwork on their loads. In all cases, the surveyors confirmed with operations personnel that the reasons the drivers were waiting at these areas were not related to their trucks – so there was no selection bias related to the survey locations that would have caused, for example, trucks older than average to be selected for survey.
2.0 Survey Results
The survey responses were analyzed for important characteristics of the trucks and their activity related to operations associated with Port Authority container terminals. Because the trucks servicing the privately owned Global Marine Terminal have the same general characteristics as those servicing the terminals maintained by the Port Authority, all of the survey responses have been analyzed as a group. The following subsections detail the characteristics of the trucks and various aspects of their operations on the terminals, such as how frequently they visit the marine terminals
The Port Authority of New York and New Jersey Drayage Truck Characterization Survey
Starcrest Consulting Group, LLC 31 December 2008 2
and how long they spend on terminal during each visit. Additional questions on the survey form regarding trip origins and destinations were not answered with enough frequency or completeness to warrant their inclusion in this analysis. Fewer than 50% of respondents were willing or able to provide more than half of the detailed information requested on the form, so the results are not seen as robust enough to modify or replace the conclusions of the previous origin/destination study conducted on Port operations.1
2.1 Model Year Percentages
Model year is an important characteristic of drayage trucks (and motor vehicles in general) because emission standards are applicable on a model year basis, and newer trucks are generally subject to stricter (lower) emission standards than older trucks. The trucks were categorized by model year, and the model years were divided into groups based on the progression of emission standards for heavy-duty diesel vehicles (HDDVs). The groups, listed below, were chosen to reflect the model years that were affected by different emission standards, such that the vehicles in each group were subject to the same emission standards when new. For example, trucks built during the 1998-to-2003 model year group were all subject to the same emission standards; a new set of emission standards became effective in 2004, which applied to trucks built during the 2004 through 2006 model years. Categories were also developed for terminal visit frequencies to help characterize the vehicles that regularly service Port Authority terminals. In addition, the trucks were categorized as being owner-operated or owned by other than the driver. The model year groups are:
2007 or newer 2004-06 1998-2003 1994-97 1990-93 Pre-1990
The average visit frequency categories are:
15 or more visits per week (average of 3 visits or more per day) From 7 to 15 visits per week (average of 1.4 to 3 visits per day) From 5 to 7 visits per week (average of 1 to 1.4 visits per day) From 2.5 to 5 visits per week (average of one visit every other day to one visit per day) Less than 2.5 visits per week (less than one visit every other day)
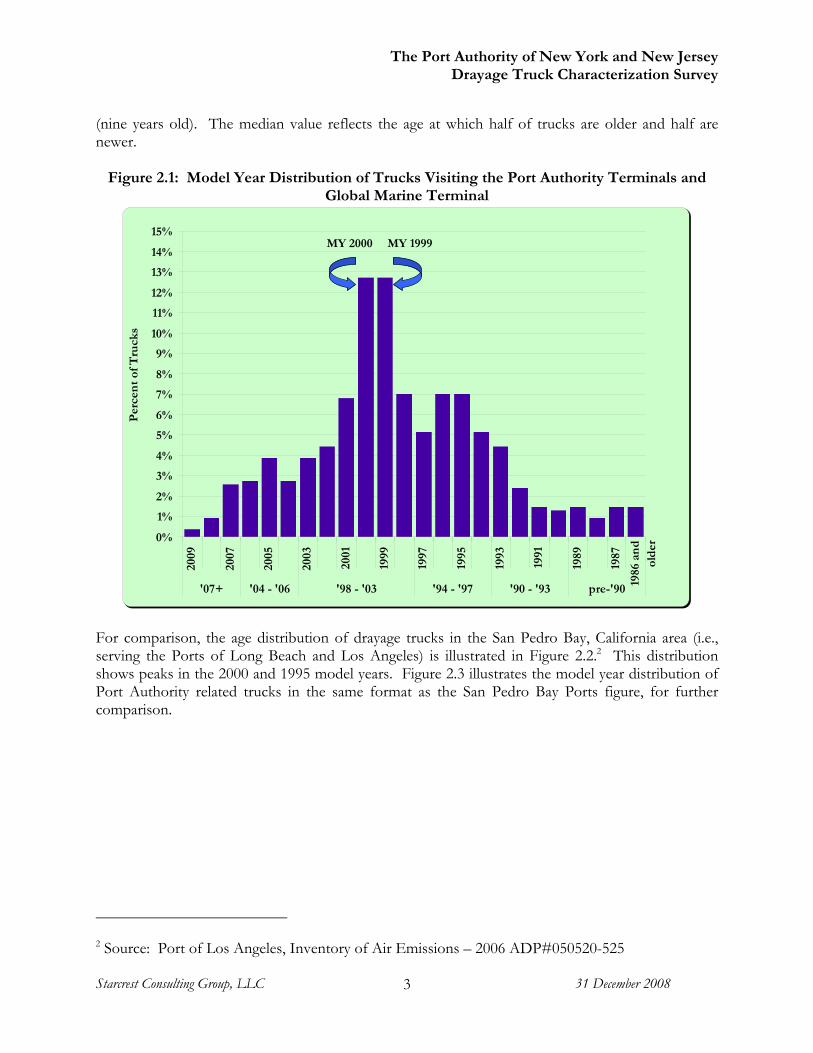
Figure 2.1 illustrates the percentage of trucks of each model year from the survey sample of trucks visiting the Port Authority terminals and Global Marine Terminal. The two highest percentage (most common) model years are 1999 and 2000, together accounting for slightly more than 25% of trucks surveyed. The average model year is 1998 (ten years old), and the median model year is 1999
1 Port Authority Marine Container Terminals – Truck Origin-Destination Survey 2005. Vollmer, November 2005, revised 2/27/2006
The Port Authority of New York and New Jersey Drayage Truck Characterization Survey
Starcrest Consulting Group, LLC 31 December 2008 3
(nine years old). The median value reflects the age at which half of trucks are older and half are newer.
Figure 2.1: Model Year Distribution of Trucks Visiting the Port Authority Terminals and Global Marine Terminal
0%
1%
2%
3%
4%
5%
6%
7%
8%
9%
10%
11%
12%
13%
14%
15%
2009
2007
2005
2003
2001
1999
1997
1995
1993
1991
1989
1987
'07+ '04 - '06 '98 - '03 '94 - '97 '90 - '93 pre-'90
Per
cen
t of
Tru
cks
MY 1999MY 2000
1986
an
dol
der
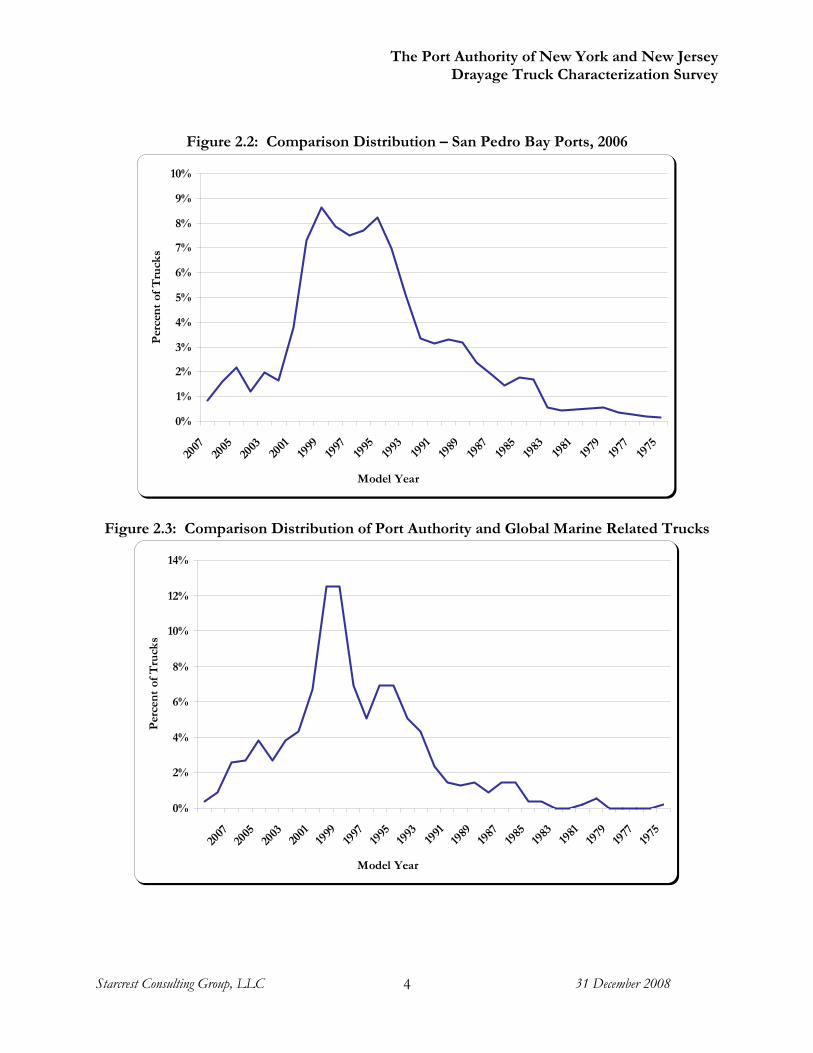
For comparison, the age distribution of drayage trucks in the San Pedro Bay, California area (i.e., serving the Ports of Long Beach and Los Angeles) is illustrated in Figure 2.2.2 This distribution shows peaks in the 2000 and 1995 model years. Figure 2.3 illustrates the model year distribution of Port Authority related trucks in the same format as the San Pedro Bay Ports figure, for further comparison.
2 Source: Port of Los Angeles, Inventory of Air Emissions – 2006 ADP#050520-525
The Port Authority of New York and New Jersey Drayage Truck Characterization Survey
Starcrest Consulting Group, LLC 31 December 2008 4
Figure 2.2: Comparison Distribution – San Pedro Bay Ports, 2006
0%
1%
2%
3%
4%
5%
6%
7%
8%
9%
10%
2007
2005
2003
2001
1999
1997
1995
1993
1991
1989
1987
1985
1983
1981
1979
1977
1975
Model Year
Per
cen
t of
Tru
cks
Figure 2.3: Comparison Distribution of Port Authority and Global Marine Related Trucks
0%
2%
4%
6%
8%
10%
12%
14%
2007
2005
2003
2001
1999
1997
1995
1993
1991
1989
1987
1985
1983
1981
1979
1977
1975
Model Year
Per
cen
t of
Tru
cks
The Port Authority of New York and New Jersey Drayage Truck Characterization Survey
Starcrest Consulting Group, LLC 31 December 2008 5
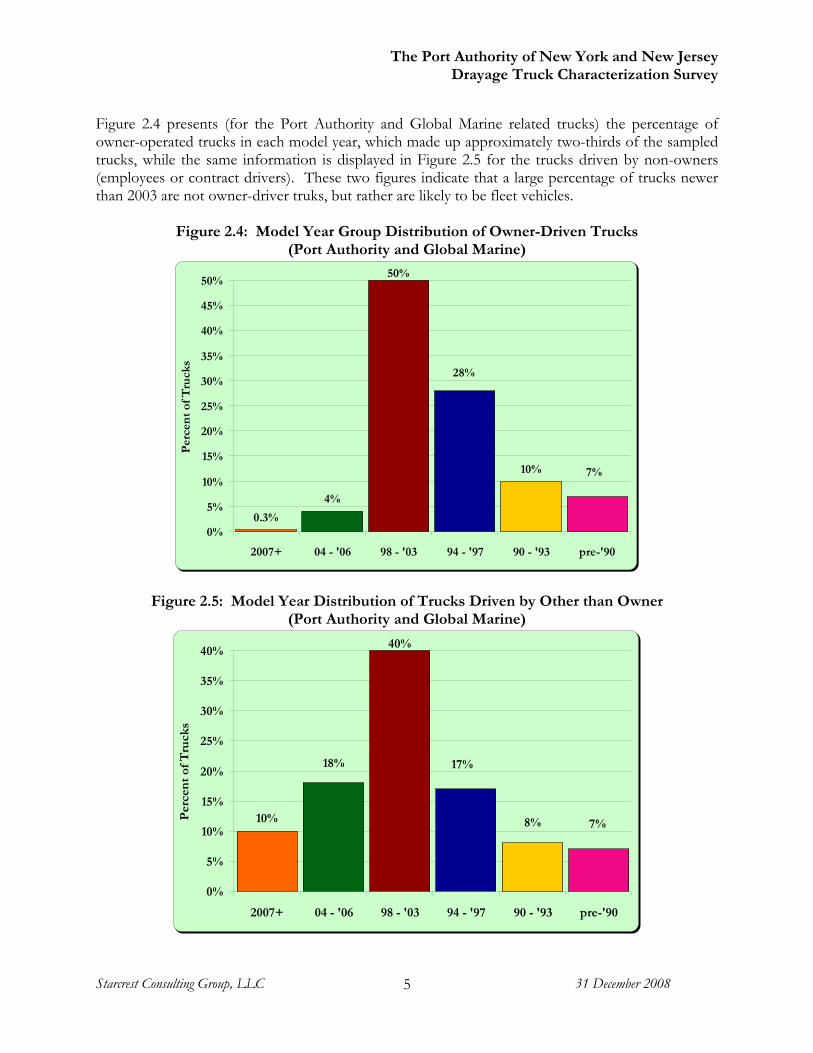
Figure 2.4 presents (for the Port Authority and Global Marine related trucks) the percentage of owner-operated trucks in each model year, which made up approximately two-thirds of the sampled trucks, while the same information is displayed in Figure 2.5 for the trucks driven by non-owners (employees or contract drivers). These two figures indicate that a large percentage of trucks newer than 2003 are not owner-driver truks, but rather are likely to be fleet vehicles.
Figure 2.4: Model Year Group Distribution of Owner-Driven Trucks (Port Authority and Global Marine)
0.3%
4%
50%
10%
28%
7%
0%
5%
10%
15%
20%
25%
30%
35%
40%
45%
50%
2007+ 04 - '06 98 - '03 94 - '97 90 - '93 pre-'90
Per
cen
t of
Tru
cks
Figure 2.5: Model Year Distribution of Trucks Driven by Other than Owner (Port Authority and Global Marine)
10%
40%
18% 17%
8% 7%
0%
5%
10%
15%
20%
25%
30%
35%
40%
2007+ 04 - '06 98 - '03 94 - '97 90 - '93 pre-'90
Per
cen
t of
Tru
cks
The Port Authority of New York and New Jersey Drayage Truck Characterization Survey
Starcrest Consulting Group, LLC 31 December 2008 6
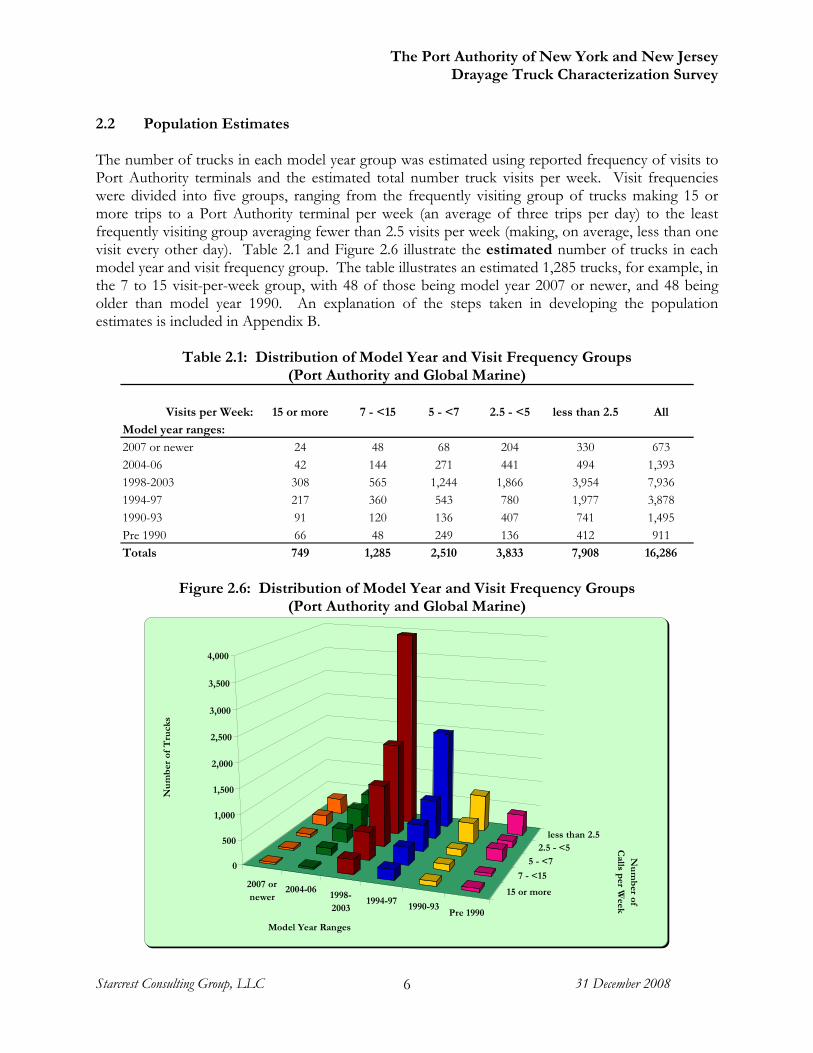
2.2 Population Estimates The number of trucks in each model year group was estimated using reported frequency of visits to Port Authority terminals and the estimated total number truck visits per week. Visit frequencies were divided into five groups, ranging from the frequently visiting group of trucks making 15 or more trips to a Port Authority terminal per week (an average of three trips per day) to the least frequently visiting group averaging fewer than 2.5 visits per week (making, on average, less than one visit every other day). Table 2.1 and Figure 2.6 illustrate the estimated number of trucks in each model year and visit frequency group. The table illustrates an estimated 1,285 trucks, for example, in the 7 to 15 visit-per-week group, with 48 of those being model year 2007 or newer, and 48 being older than model year 1990. An explanation of the steps taken in developing the population estimates is included in Appendix B.
Table 2.1: Distribution of Model Year and Visit Frequency Groups (Port Authority and Global Marine)
Visits per Week: 15 or more 7 - <15 5 - <7 2.5 - <5 less than 2.5 All
Model year ranges:
2007 or newer 24 48 68 204 330 6732004-06 42 144 271 441 494 1,3931998-2003 308 565 1,244 1,866 3,954 7,9361994-97 217 360 543 780 1,977 3,8781990-93 91 120 136 407 741 1,495Pre 1990 66 48 249 136 412 911Totals 749 1,285 2,510 3,833 7,908 16,286
Figure 2.6: Distribution of Model Year and Visit Frequency Groups
(Port Authority and Global Marine)
2007 ornewer
2004-061998-2003
1994-971990-93
Pre 1990
15 or more
7 - <15
5 - <7
2.5 - <5less than 2.5
0
500
1,000
1,500
2,000
2,500
3,000
3,500
4,000
Nu
mb
er o
f T
ruck
s
Model Year Ranges
Nu
mb
er of C
alls per W
eek
The Port Authority of New York and New Jersey Drayage Truck Characterization Survey
Starcrest Consulting Group, LLC 31 December 2008 7
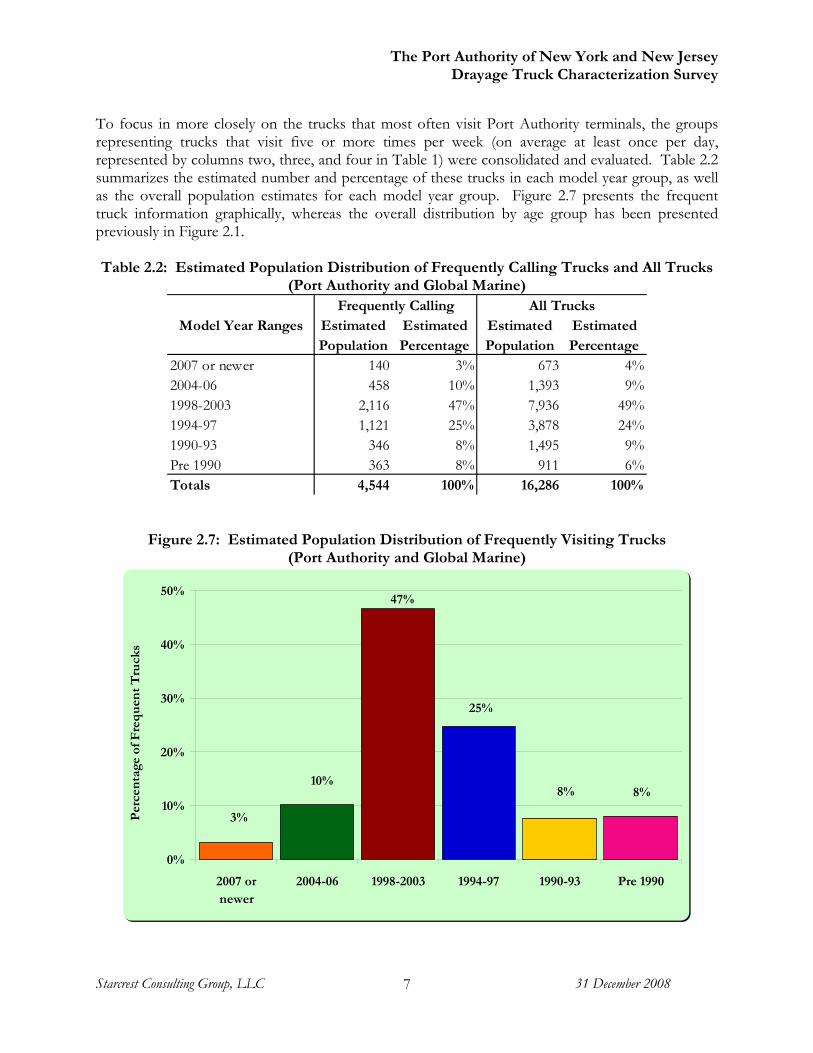
To focus in more closely on the trucks that most often visit Port Authority terminals, the groups representing trucks that visit five or more times per week (on average at least once per day, represented by columns two, three, and four in Table 1) were consolidated and evaluated. Table 2.2 summarizes the estimated number and percentage of these trucks in each model year group, as well as the overall population estimates for each model year group. Figure 2.7 presents the frequent truck information graphically, whereas the overall distribution by age group has been presented previously in Figure 2.1. Table 2.2: Estimated Population Distribution of Frequently Calling Trucks and All Trucks
(Port Authority and Global Marine)
Model Year Ranges Estimated Estimated Estimated EstimatedPopulation Percentage Population Percentage
2007 or newer 140 3% 673 4%2004-06 458 10% 1,393 9%1998-2003 2,116 47% 7,936 49%1994-97 1,121 25% 3,878 24%1990-93 346 8% 1,495 9%Pre 1990 363 8% 911 6%Totals 4,544 100% 16,286 100%
Frequently Calling All Trucks
Figure 2.7: Estimated Population Distribution of Frequently Visiting Trucks (Port Authority and Global Marine)
3%
10%
47%
25%
8% 8%
0%
10%
20%
30%
40%
50%
2007 ornewer
2004-06 1998-2003 1994-97 1990-93 Pre 1990
Per
cen
tage
of F
req
uen
t T
ruck
s
The Port Authority of New York and New Jersey Drayage Truck Characterization Survey
Starcrest Consulting Group, LLC 31 December 2008 8
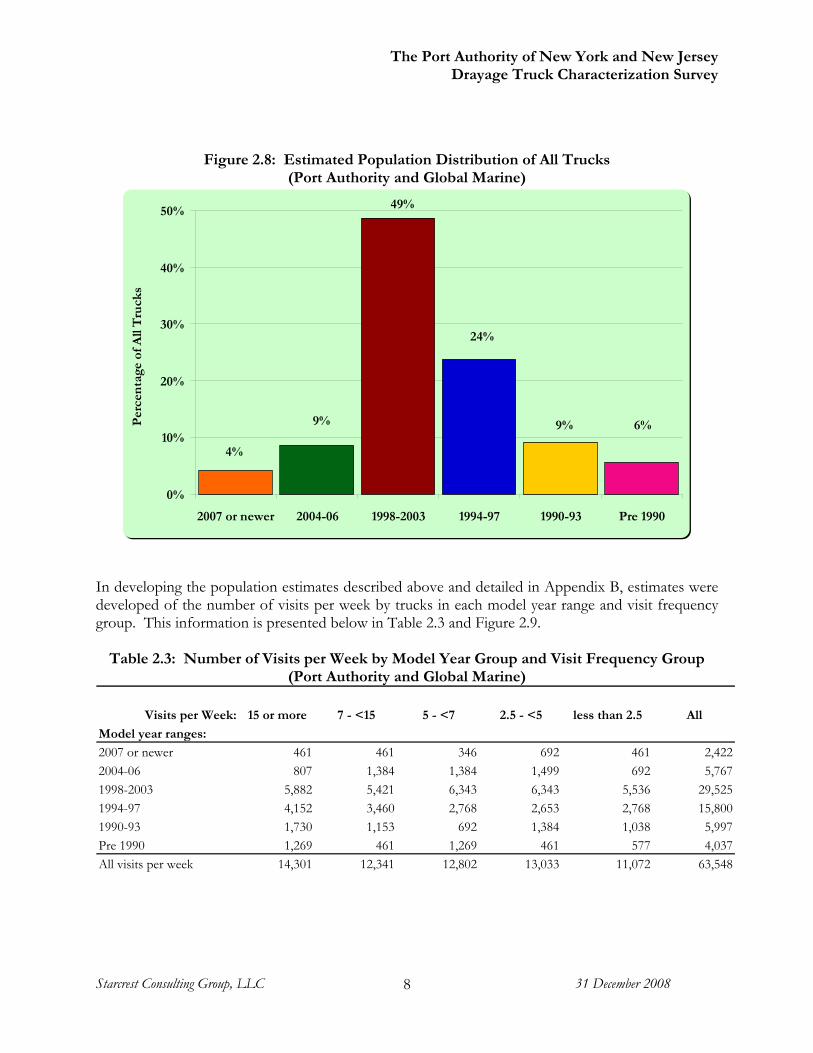
Figure 2.8: Estimated Population Distribution of All Trucks (Port Authority and Global Marine)
6%9%
24%
49%
9%
4%
0%
10%
20%
30%
40%
50%
2007 or newer 2004-06 1998-2003 1994-97 1990-93 Pre 1990
Per
cen
tage
of A
ll T
ruck
s
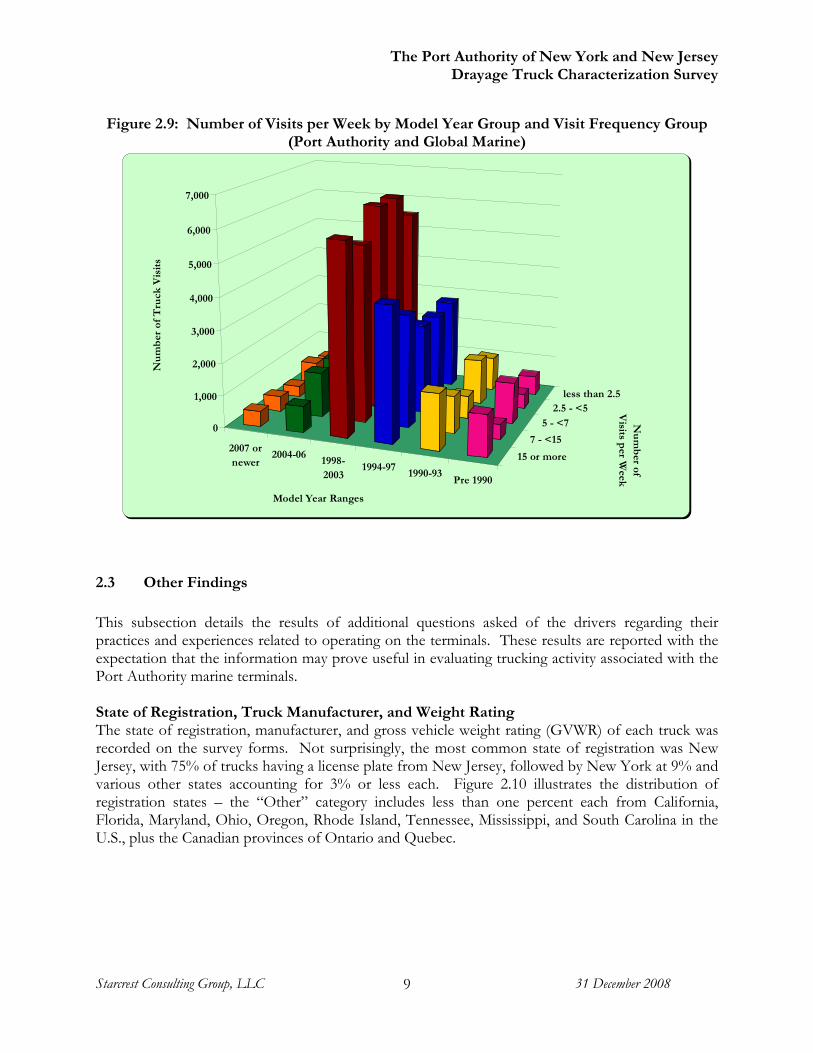
In developing the population estimates described above and detailed in Appendix B, estimates were developed of the number of visits per week by trucks in each model year range and visit frequency group. This information is presented below in Table 2.3 and Figure 2.9.
Table 2.3: Number of Visits per Week by Model Year Group and Visit Frequency Group
(Port Authority and Global Marine)
Visits per Week: 15 or more 7 - <15 5 - <7 2.5 - <5 less than 2.5 All
Model year ranges:
2007 or newer 461 461 346 692 461 2,4222004-06 807 1,384 1,384 1,499 692 5,7671998-2003 5,882 5,421 6,343 6,343 5,536 29,5251994-97 4,152 3,460 2,768 2,653 2,768 15,8001990-93 1,730 1,153 692 1,384 1,038 5,997Pre 1990 1,269 461 1,269 461 577 4,037All visits per week 14,301 12,341 12,802 13,033 11,072 63,548
The Port Authority of New York and New Jersey Drayage Truck Characterization Survey
Starcrest Consulting Group, LLC 31 December 2008 9
Figure 2.9: Number of Visits per Week by Model Year Group and Visit Frequency Group (Port Authority and Global Marine)
2007 ornewer
2004-061998-2003
1994-971990-93
Pre 1990
15 or more
7 - <15
5 - <72.5 - <5
less than 2.5
0
1,000
2,000
3,000
4,000
5,000
6,000
7,000
Nu
mb
er o
f T
ruck
Vis
its
Model Year Ranges
Nu
mb
er of V
isits per W
eek
2.3 Other Findings
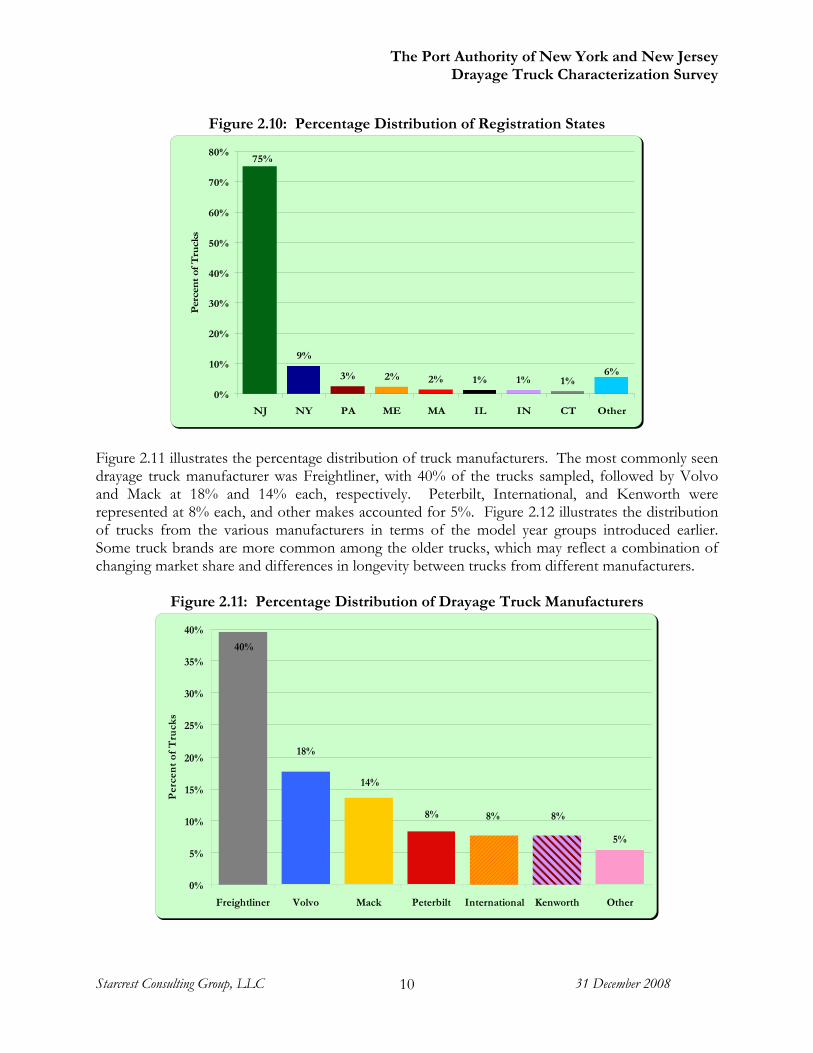
This subsection details the results of additional questions asked of the drivers regarding their practices and experiences related to operating on the terminals. These results are reported with the expectation that the information may prove useful in evaluating trucking activity associated with the Port Authority marine terminals. State of Registration, Truck Manufacturer, and Weight Rating The state of registration, manufacturer, and gross vehicle weight rating (GVWR) of each truck was recorded on the survey forms. Not surprisingly, the most common state of registration was New Jersey, with 75% of trucks having a license plate from New Jersey, followed by New York at 9% and various other states accounting for 3% or less each. Figure 2.10 illustrates the distribution of registration states – the “Other” category includes less than one percent each from California, Florida, Maryland, Ohio, Oregon, Rhode Island, Tennessee, Mississippi, and South Carolina in the U.S., plus the Canadian provinces of Ontario and Quebec.
The Port Authority of New York and New Jersey Drayage Truck Characterization Survey
Starcrest Consulting Group, LLC 31 December 2008 10
Figure 2.10: Percentage Distribution of Registration States
9%
3% 2% 2% 1% 1% 1%
75%
6%
0%
10%
20%
30%
40%
50%
60%
70%
80%
NJ NY PA ME MA IL IN CT Other
Per
cen
t of
Tru
cks
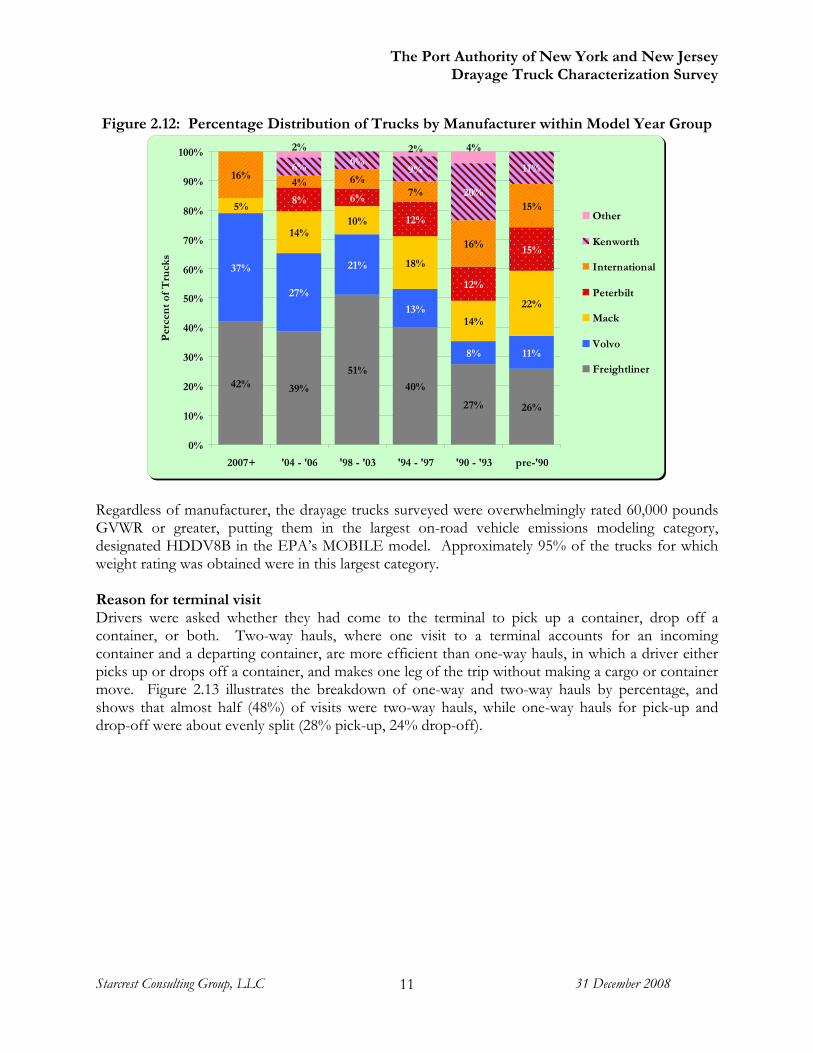
Figure 2.11 illustrates the percentage distribution of truck manufacturers. The most commonly seen drayage truck manufacturer was Freightliner, with 40% of the trucks sampled, followed by Volvo and Mack at 18% and 14% each, respectively. Peterbilt, International, and Kenworth were represented at 8% each, and other makes accounted for 5%. Figure 2.12 illustrates the distribution of trucks from the various manufacturers in terms of the model year groups introduced earlier. Some truck brands are more common among the older trucks, which may reflect a combination of changing market share and differences in longevity between trucks from different manufacturers.
Figure 2.11: Percentage Distribution of Drayage Truck Manufacturers
5%
40%
14%
8%8%8%
18%
0%
5%
10%
15%
20%
25%
30%
35%
40%
Freightliner Volvo Mack Peterbilt International Kenworth Other
Per
cen
t of
Tru
cks
The Port Authority of New York and New Jersey Drayage Truck Characterization Survey
Starcrest Consulting Group, LLC 31 December 2008 11
Figure 2.12: Percentage Distribution of Trucks by Manufacturer within Model Year Group
42% 39%
51%
40%
27% 26%
37%
27%
21%
13%
8% 11%
5%
14%10%
18%
14%
22%
8% 6%
12%
12%
15%
16%4% 6%
7%
16%
15%
6% 6%9%
20%
11%
2% 2% 4%
0%
10%
20%
30%
40%
50%
60%
70%
80%
90%
100%
2007+ '04 - '06 '98 - '03 '94 - '97 '90 - '93 pre-'90
Per
cen
t of
Tru
cks
Other
Kenworth
International
Peterbilt
Mack
Volvo
Freightliner
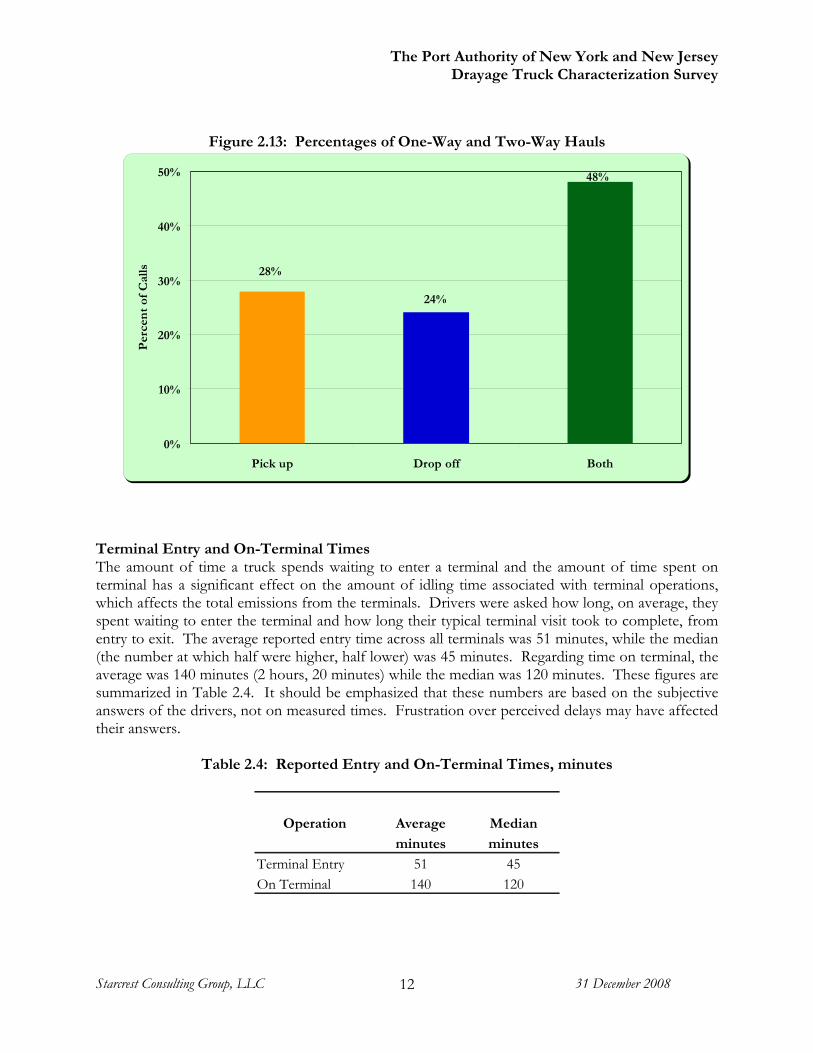
Regardless of manufacturer, the drayage trucks surveyed were overwhelmingly rated 60,000 pounds GVWR or greater, putting them in the largest on-road vehicle emissions modeling category, designated HDDV8B in the EPA’s MOBILE model. Approximately 95% of the trucks for which weight rating was obtained were in this largest category. Reason for terminal visit Drivers were asked whether they had come to the terminal to pick up a container, drop off a container, or both. Two-way hauls, where one visit to a terminal accounts for an incoming container and a departing container, are more efficient than one-way hauls, in which a driver either picks up or drops off a container, and makes one leg of the trip without making a cargo or container move. Figure 2.13 illustrates the breakdown of one-way and two-way hauls by percentage, and shows that almost half (48%) of visits were two-way hauls, while one-way hauls for pick-up and drop-off were about evenly split (28% pick-up, 24% drop-off).
The Port Authority of New York and New Jersey Drayage Truck Characterization Survey
Starcrest Consulting Group, LLC 31 December 2008 12
Figure 2.13: Percentages of One-Way and Two-Way Hauls
28%
24%
48%
0%
10%
20%
30%
40%
50%
Pick up Drop off Both
Per
cen
t of
Cal
ls
Terminal Entry and On-Terminal Times The amount of time a truck spends waiting to enter a terminal and the amount of time spent on terminal has a significant effect on the amount of idling time associated with terminal operations, which affects the total emissions from the terminals. Drivers were asked how long, on average, they spent waiting to enter the terminal and how long their typical terminal visit took to complete, from entry to exit. The average reported entry time across all terminals was 51 minutes, while the median (the number at which half were higher, half lower) was 45 minutes. Regarding time on terminal, the average was 140 minutes (2 hours, 20 minutes) while the median was 120 minutes. These figures are summarized in Table 2.4. It should be emphasized that these numbers are based on the subjective answers of the drivers, not on measured times. Frustration over perceived delays may have affected their answers.
Table 2.4: Reported Entry and On-Terminal Times, minutes
Operation Average Median
minutes minutes
Terminal Entry 51 45On Terminal 140 120
The Port Authority of New York and New Jersey Drayage Truck Characterization Survey
Starcrest Consulting Group, LLC 31 December 2008 13
Tracking Devices Divers were asked whether their trucks were equipped with a global positioning system (GPS) or other tracking device. Of the responses, 73% said the truck was not equipped with a tracking device, 17% said yes, while 11% did not know or did not provide an answer.
Starcrest Consulting Group, LLC 31 December 2008
The Port Authority of New York and New Jersey Drayage Truck Characterization Survey
at the Port Authority and the Global Marine Terminals
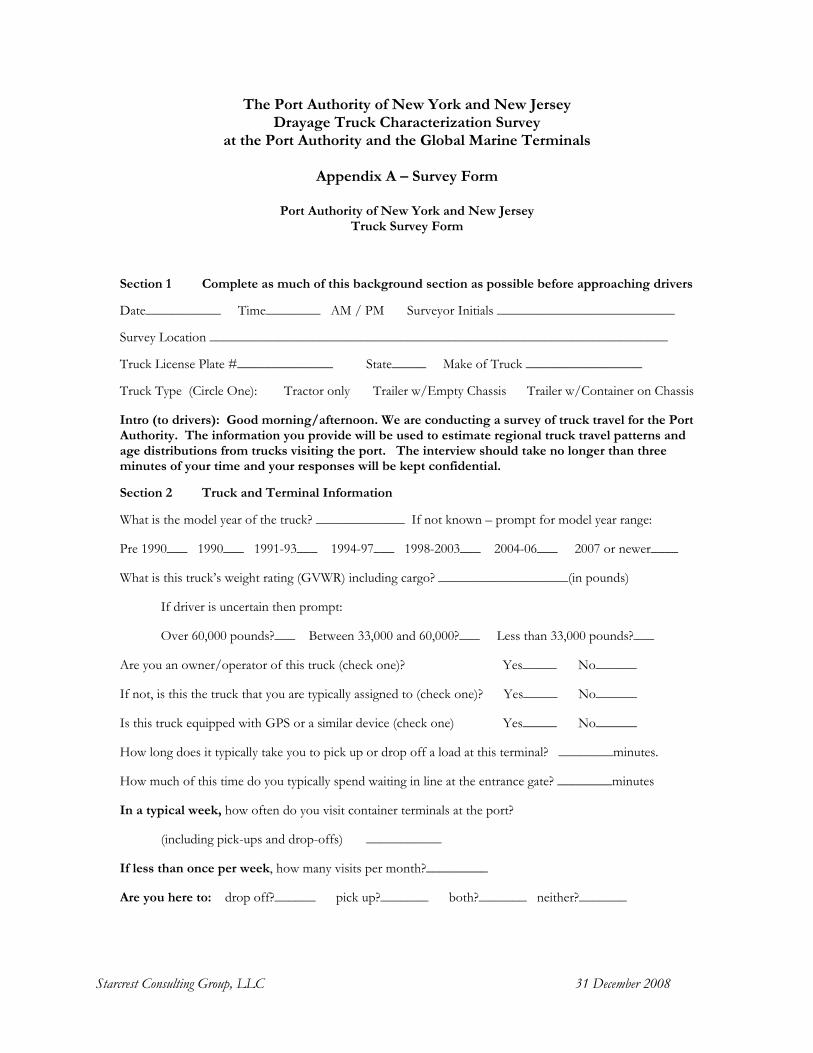
Appendix A – Survey Form
Port Authority of New York and New JerseyTruck Survey Form
Section 1 Complete as much of this background section as possible before approaching drivers
Date___________ Time________ AM / PM Surveyor Initials __________________________
Survey Location ___________________________________________________________________
Truck License Plate #______________ State_____ Make of Truck _________________
Truck Type (Circle One): Tractor only Trailer w/Empty Chassis Trailer w/Container on Chassis
Intro (to drivers): Good morning/afternoon. We are conducting a survey of truck travel for the Port Authority. The information you provide will be used to estimate regional truck travel patterns and age distributions from trucks visiting the port. The interview should take no longer than three minutes of your time and your responses will be kept confidential.
Section 2 Truck and Terminal Information
What is the model year of the truck? _____________ If not known – prompt for model year range:
Pre 1990___ 1990___ 1991-93___ 1994-97___ 1998-2003___ 2004-06___ 2007 or newer____
What is this truck’s weight rating (GVWR) including cargo? ___________________(in pounds)
If driver is uncertain then prompt:
Over 60,000 pounds?___ Between 33,000 and 60,000?___ Less than 33,000 pounds?___
Are you an owner/operator of this truck (check one)? Yes_____ No______
If not, is this the truck that you are typically assigned to (check one)? Yes_____ No______
Is this truck equipped with GPS or a similar device (check one) Yes_____ No______
How long does it typically take you to pick up or drop off a load at this terminal? ________minutes.
How much of this time do you typically spend waiting in line at the entrance gate? ________minutes
In a typical week, how often do you visit container terminals at the port?
(including pick-ups and drop-offs) ___________
If less than once per week, how many visits per month?_________
Are you here to: drop off?______ pick up?_______ both?_______ neither?_______
The Port Authority of New York and New Jersey Drayage Truck Characterization Survey
Appendix A – Survey Form Page 2
Starcrest Consulting Group, LLC 31 December 2008 2
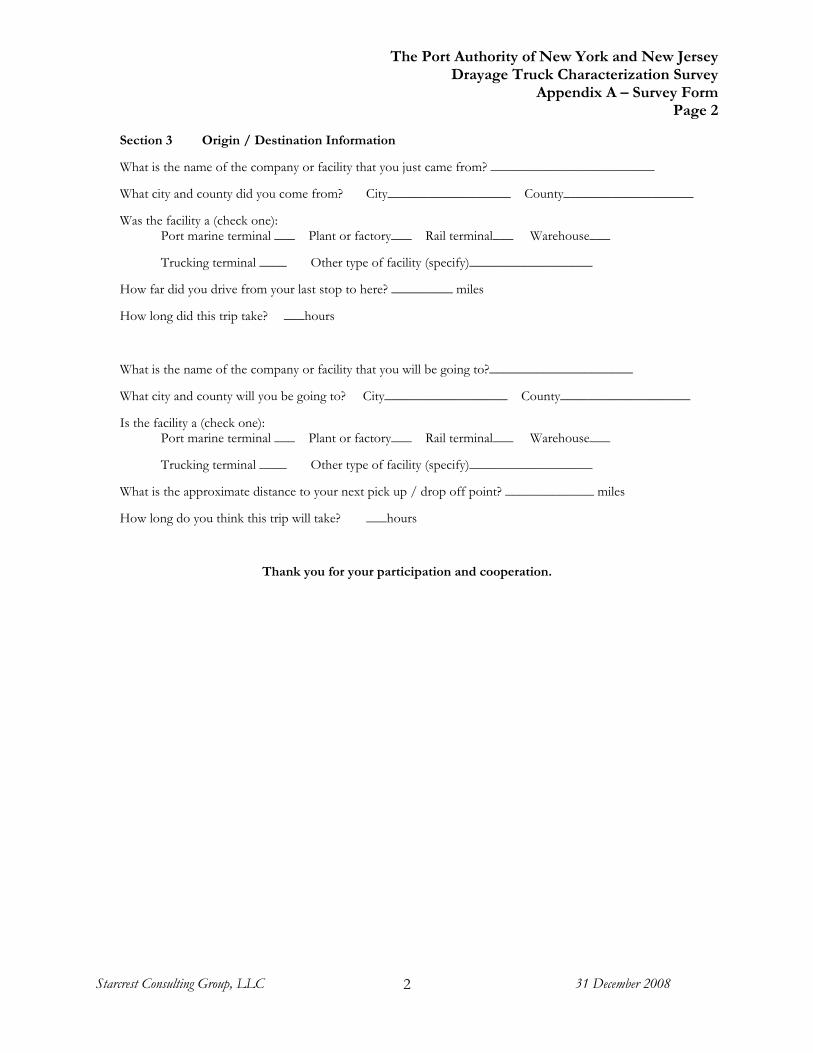
Section 3 Origin / Destination Information
What is the name of the company or facility that you just came from? ________________________
What city and county did you come from? City__________________ County___________________
Was the facility a (check one): Port marine terminal ___ Plant or factory___ Rail terminal___ Warehouse___
Trucking terminal ____ Other type of facility (specify)__________________
How far did you drive from your last stop to here? _________ miles
How long did this trip take? ___hours
What is the name of the company or facility that you will be going to?_____________________
What city and county will you be going to? City__________________ County___________________
Is the facility a (check one): Port marine terminal ___ Plant or factory___ Rail terminal___ Warehouse___
Trucking terminal ____ Other type of facility (specify)__________________
What is the approximate distance to your next pick up / drop off point? _____________ miles
How long do you think this trip will take? ___hours
Thank you for your participation and cooperation.
Starcrest Consulting Group, LLC 31 December 2008
The Port Authority of New York and New Jersey Drayage Truck Characterization Survey
at the Port Authority and the Global Marine Terminals
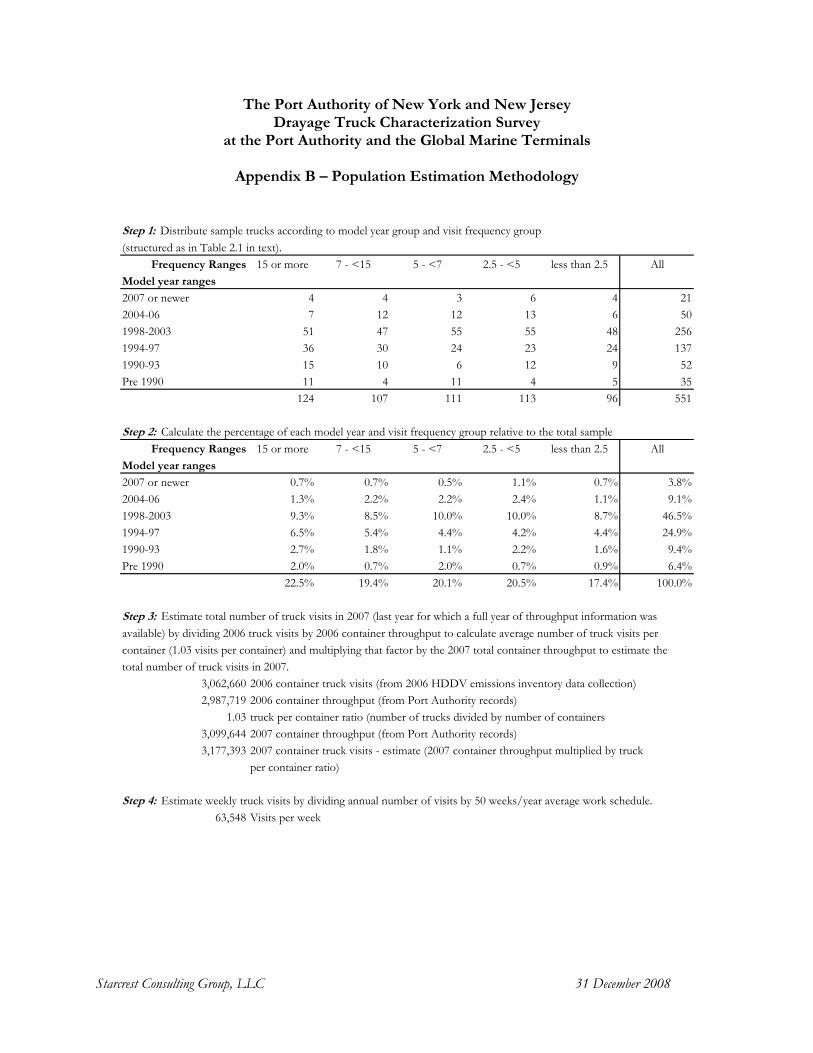
Appendix B – Population Estimation Methodology
Step 1: Distribute sample trucks according to model year group and visit frequency group (structured as in Table 2.1 in text).
Frequency Ranges 15 or more 7 - <15 5 - <7 2.5 - <5 less than 2.5 AllModel year ranges
2007 or newer 4 4 3 6 4 212004-06 7 12 12 13 6 501998-2003 51 47 55 55 48 2561994-97 36 30 24 23 24 1371990-93 15 10 6 12 9 52Pre 1990 11 4 11 4 5 35
124 107 111 113 96 551
Step 2: Calculate the percentage of each model year and visit frequency group relative to the total sample Frequency Ranges 15 or more 7 - <15 5 - <7 2.5 - <5 less than 2.5 All
Model year ranges
2007 or newer 0.7% 0.7% 0.5% 1.1% 0.7% 3.8%2004-06 1.3% 2.2% 2.2% 2.4% 1.1% 9.1%1998-2003 9.3% 8.5% 10.0% 10.0% 8.7% 46.5%1994-97 6.5% 5.4% 4.4% 4.2% 4.4% 24.9%1990-93 2.7% 1.8% 1.1% 2.2% 1.6% 9.4%Pre 1990 2.0% 0.7% 2.0% 0.7% 0.9% 6.4%
22.5% 19.4% 20.1% 20.5% 17.4% 100.0%
Step 3: Estimate total number of truck visits in 2007 (last year for which a full year of throughput information was available) by dividing 2006 truck visits by 2006 container throughput to calculate average number of truck visits per container (1.03 visits per container) and multiplying that factor by the 2007 total container throughput to estimate the total number of truck visits in 2007.
3,062,660 2006 container truck visits (from 2006 HDDV emissions inventory data collection)2,987,719 2006 container throughput (from Port Authority records)
1.03 truck per container ratio (number of trucks divided by number of containers3,099,644 2007 container throughput (from Port Authority records)3,177,393 2007 container truck visits - estimate (2007 container throughput multiplied by truck
per container ratio)
Step 4: Estimate weekly truck visits by dividing annual number of visits by 50 weeks/year average work schedule.63,548 Visits per week
The Port Authority of New York and New Jersey Drayage Truck Characterization Survey
Appendix B – Population Estimation Methodology Page 2
Starcrest Consulting Group, LLC 31 December 2008 2
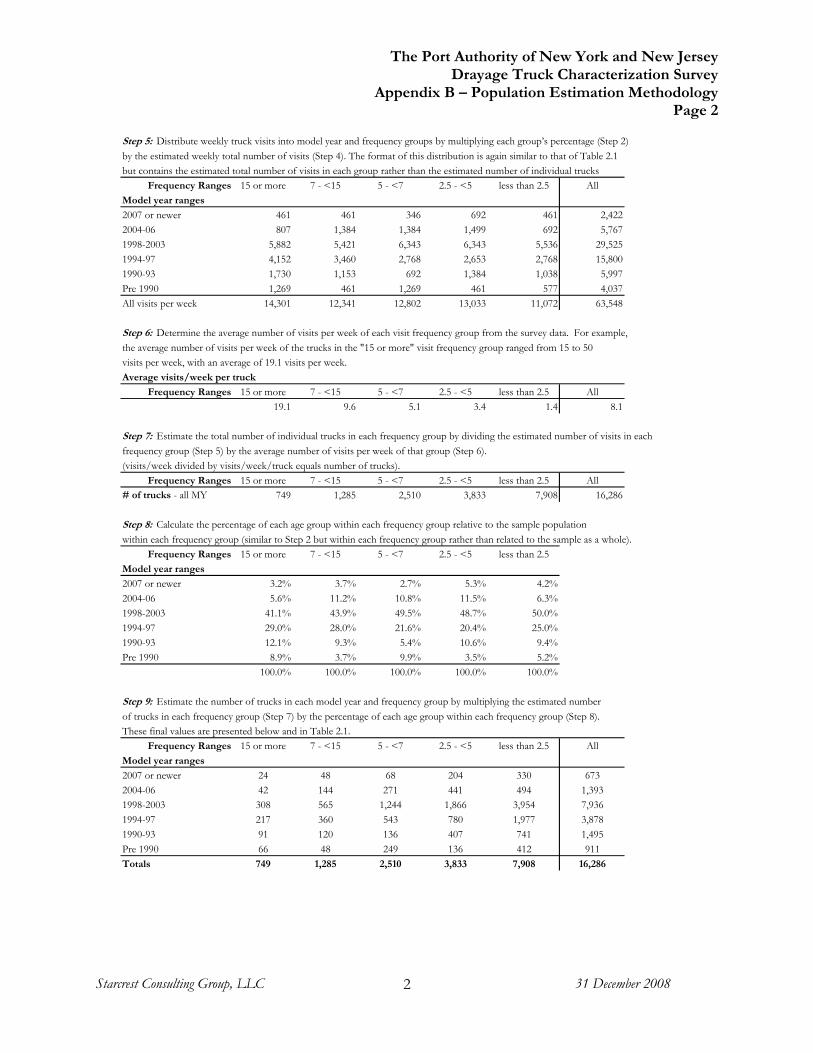
Step 5: Distribute weekly truck visits into model year and frequency groups by multiplying each group’s percentage (Step 2)by the estimated weekly total number of visits (Step 4). The format of this distribution is again similar to that of Table 2.1but contains the estimated total number of visits in each group rather than the estimated number of individual trucks
Frequency Ranges 15 or more 7 - <15 5 - <7 2.5 - <5 less than 2.5 AllModel year ranges
2007 or newer 461 461 346 692 461 2,4222004-06 807 1,384 1,384 1,499 692 5,7671998-2003 5,882 5,421 6,343 6,343 5,536 29,5251994-97 4,152 3,460 2,768 2,653 2,768 15,8001990-93 1,730 1,153 692 1,384 1,038 5,997Pre 1990 1,269 461 1,269 461 577 4,037All visits per week 14,301 12,341 12,802 13,033 11,072 63,548
Step 6: Determine the average number of visits per week of each visit frequency group from the survey data. For example, the average number of visits per week of the trucks in the "15 or more" visit frequency group ranged from 15 to 50 visits per week, with an average of 19.1 visits per week.Average visits/week per truck
Frequency Ranges 15 or more 7 - <15 5 - <7 2.5 - <5 less than 2.5 All19.1 9.6 5.1 3.4 1.4 8.1
Step 7: Estimate the total number of individual trucks in each frequency group by dividing the estimated number of visits in eachfrequency group (Step 5) by the average number of visits per week of that group (Step 6).(visits/week divided by visits/week/truck equals number of trucks).
Frequency Ranges 15 or more 7 - <15 5 - <7 2.5 - <5 less than 2.5 All# of trucks - all MY 749 1,285 2,510 3,833 7,908 16,286
Step 8: Calculate the percentage of each age group within each frequency group relative to the sample population within each frequency group (similar to Step 2 but within each frequency group rather than related to the sample as a whole).
Frequency Ranges 15 or more 7 - <15 5 - <7 2.5 - <5 less than 2.5Model year ranges
2007 or newer 3.2% 3.7% 2.7% 5.3% 4.2%2004-06 5.6% 11.2% 10.8% 11.5% 6.3%1998-2003 41.1% 43.9% 49.5% 48.7% 50.0%1994-97 29.0% 28.0% 21.6% 20.4% 25.0%1990-93 12.1% 9.3% 5.4% 10.6% 9.4%Pre 1990 8.9% 3.7% 9.9% 3.5% 5.2%
100.0% 100.0% 100.0% 100.0% 100.0%
Step 9: Estimate the number of trucks in each model year and frequency group by multiplying the estimated numberof trucks in each frequency group (Step 7) by the percentage of each age group within each frequency group (Step 8). These final values are presented below and in Table 2.1.
Frequency Ranges 15 or more 7 - <15 5 - <7 2.5 - <5 less than 2.5 AllModel year ranges
2007 or newer 24 48 68 204 330 6732004-06 42 144 271 441 494 1,3931998-2003 308 565 1,244 1,866 3,954 7,9361994-97 217 360 543 780 1,977 3,8781990-93 91 120 136 407 741 1,495Pre 1990 66 48 249 136 412 911Totals 749 1,285 2,510 3,833 7,908 16,286