Embed Size (px)
Citation preview

OUTLINEMotivationPreparationToolingQt Tips & Tricks

MOTIVATION

RUN EVERYWHEREShiny Qt apps on low-end embedded hardware?
Sure!

FASTER IS (PERCEIVED) BETTERIncrease your users productivity.

DO MORE... in less time.

ENERGY EFFICIENCYSave costs, trees and battery time!

PREPARATIONS
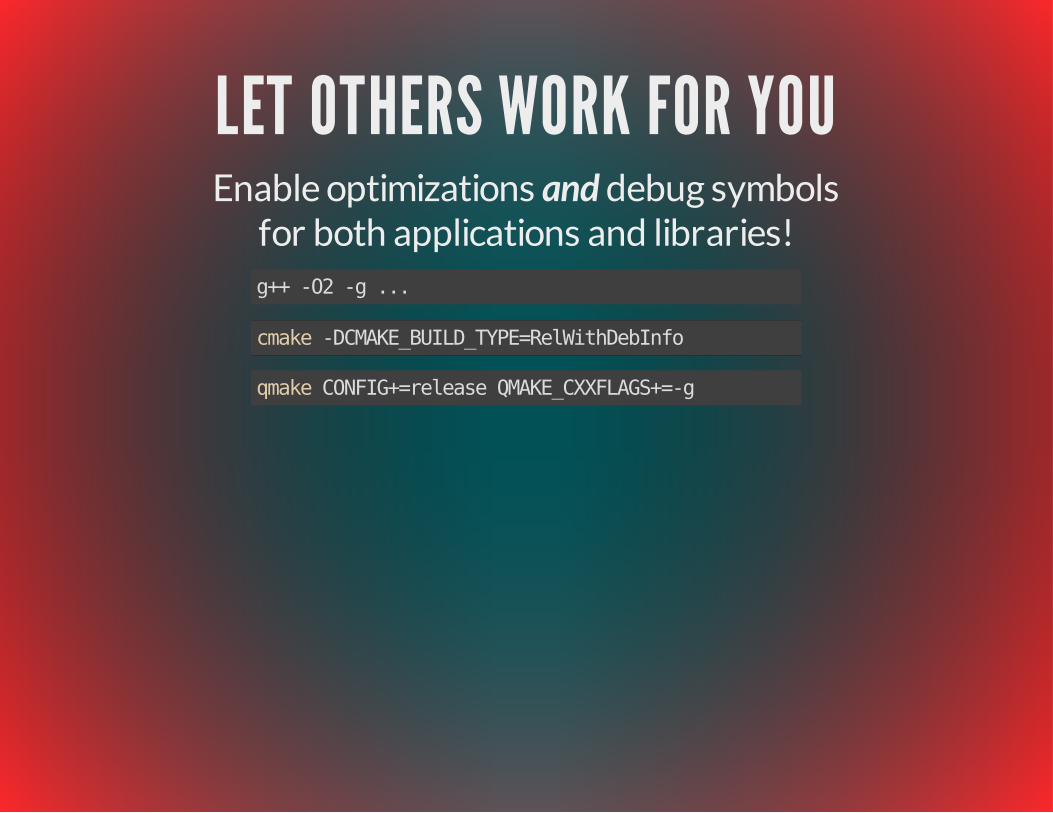
LET OTHERS WORK FOR YOUEnable optimizations and debug symbols
for both applications and libraries!g++ -O2 -g ...
cmake -DCMAKE_BUILD_TYPE=RelWithDebInfo
qmake CONFIG+=release QMAKE_CXXFLAGS+=-g

TESTING TESTING TESTINGCover the code to be optimized by unit tests.
Prevent regressions.Keep functionality - don't overoptimize.Don't be afraid of (extensive?) refactoring.

BENCHMARKINGWrite a benchmark for every function you optimize.
Always do a before/after comparison.Minimize code coverage per benchmark.Choose an adequate problem size.QTestLib has QBENCHMARK.
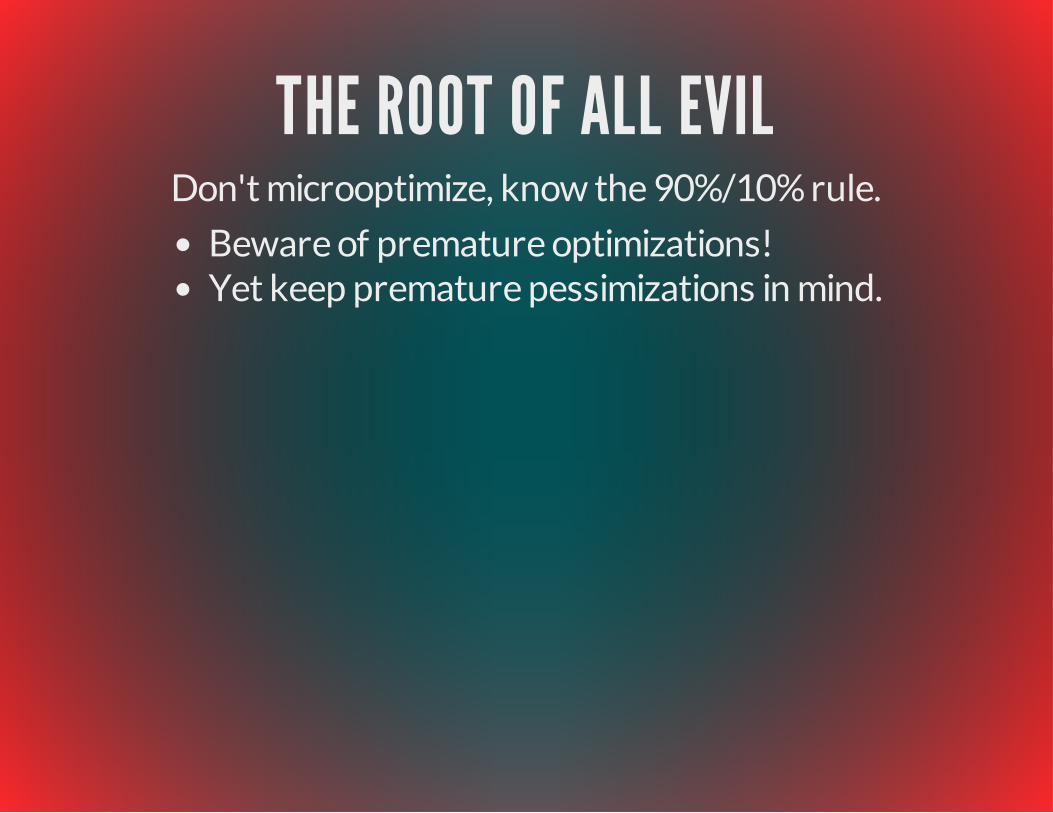
THE ROOT OF ALL EVILDon't microoptimize, know the 90%/10% rule.
Beware of premature optimizations!Yet keep premature pessimizations in mind.

KNOWLEDGE IS KINGThe more you know, the better you can optimize.
Use existing solutions, don't reinvent the wheel.Know your <algorithm>'s.Beware: "Faster" code might be slower for less data.

TOOLING

LINUX PERFPerformance analysis tools for Linux
Fast, sampling based wall time profiling.Versatile: hardware & software counters, tracepointsCross platform: works wherever Linux runs
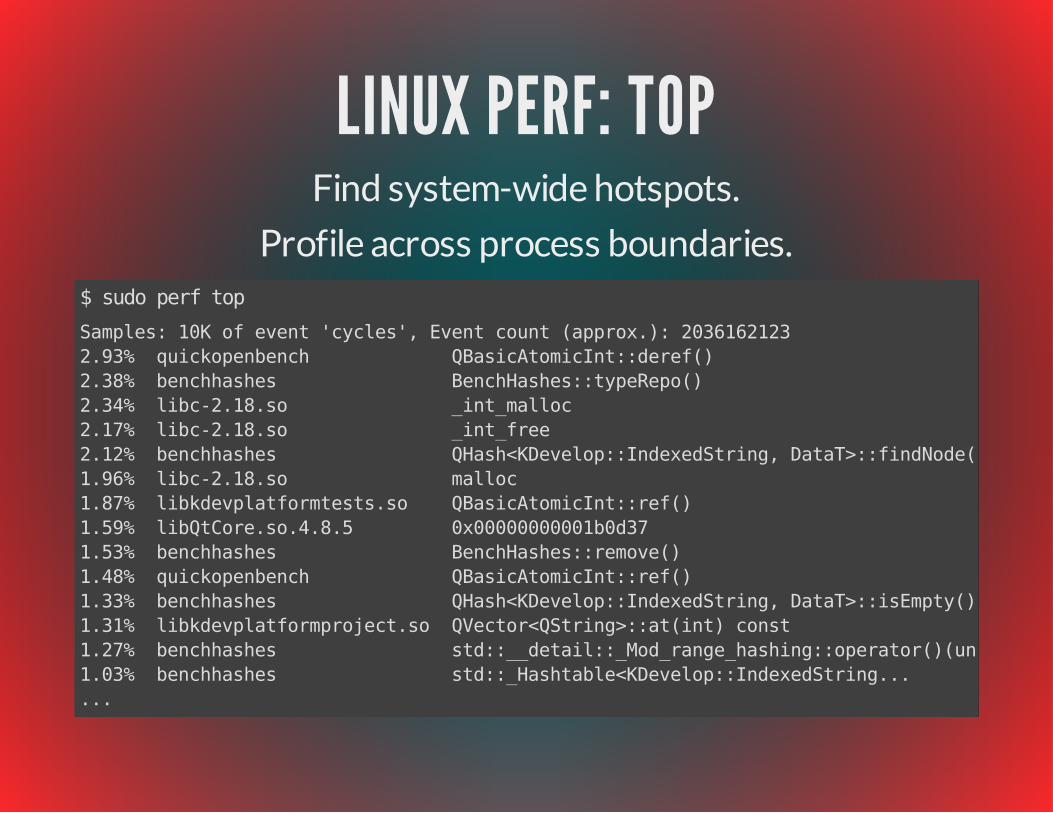
LINUX PERF: TOPFind system-wide hotspots.
Profile across process boundaries.$ sudo perf topSamples: 10K of event 'cycles', Event count (approx.): 20361621232.93% quickopenbench QBasicAtomicInt::deref()2.38% benchhashes BenchHashes::typeRepo()2.34% libc-2.18.so _int_malloc2.17% libc-2.18.so _int_free2.12% benchhashes QHash<KDevelop::IndexedString, DataT>::findNode(1.96% libc-2.18.so malloc1.87% libkdevplatformtests.so QBasicAtomicInt::ref()1.59% libQtCore.so.4.8.5 0x00000000001b0d371.53% benchhashes BenchHashes::remove()1.48% quickopenbench QBasicAtomicInt::ref()1.33% benchhashes QHash<KDevelop::IndexedString, DataT>::isEmpty()1.31% libkdevplatformproject.so QVector<QString>::at(int) const1.27% benchhashes std::__detail::_Mod_range_hashing::operator()(unsigned long, unsigned long) const1.03% benchhashes std::_Hashtable<KDevelop::IndexedString......
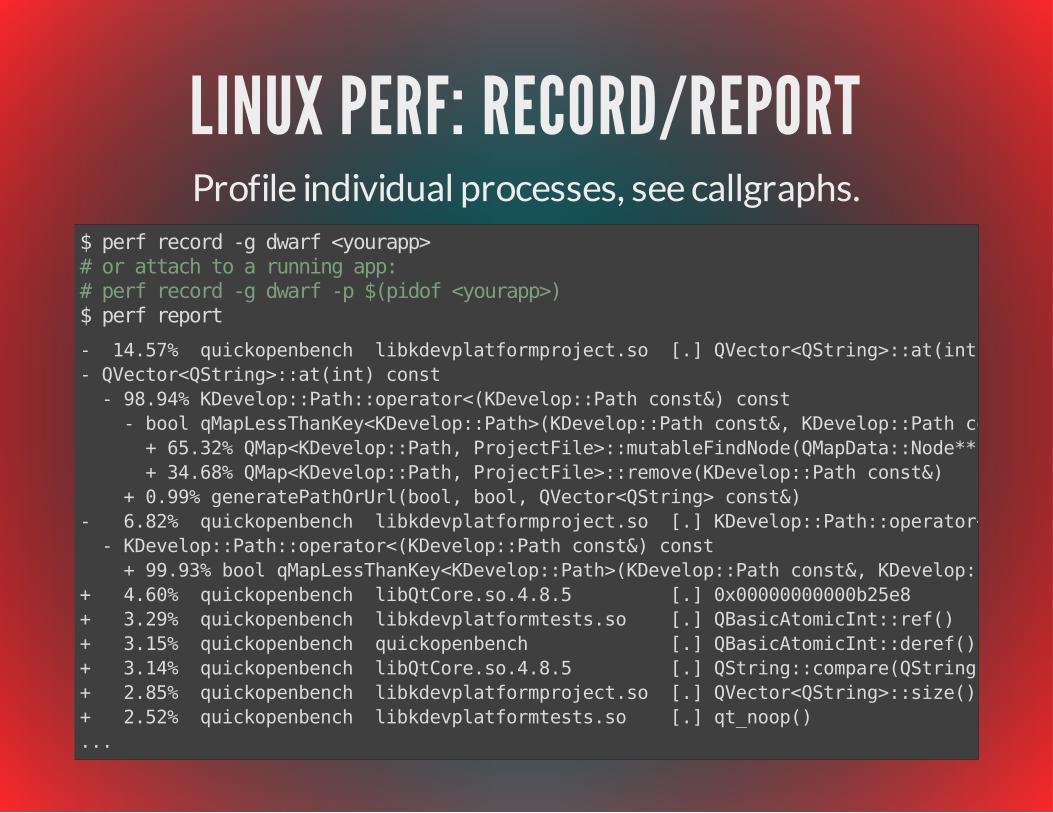
LINUX PERF: RECORD/REPORTProfile individual processes, see callgraphs.
$ perf record -g dwarf <yourapp># or attach to a running app:# perf record -g dwarf -p $(pidof <yourapp>)$ perf report- 14.57% quickopenbench libkdevplatformproject.so [.] QVector<QString>::at(int) const- QVector<QString>::at(int) const - 98.94% KDevelop::Path::operator<(KDevelop::Path const&) const - bool qMapLessThanKey<KDevelop::Path>(KDevelop::Path const&, KDevelop::Path const&) + 65.32% QMap<KDevelop::Path, ProjectFile>::mutableFindNode(QMapData::Node**, KDevelop::Path const&) const + 34.68% QMap<KDevelop::Path, ProjectFile>::remove(KDevelop::Path const&) + 0.99% generatePathOrUrl(bool, bool, QVector<QString> const&)- 6.82% quickopenbench libkdevplatformproject.so [.] KDevelop::Path::operator<(KDevelop::Path const&) const - KDevelop::Path::operator<(KDevelop::Path const&) const + 99.93% bool qMapLessThanKey<KDevelop::Path>(KDevelop::Path const&, KDevelop::Path const&)+ 4.60% quickopenbench libQtCore.so.4.8.5 [.] 0x00000000000b25e8+ 3.29% quickopenbench libkdevplatformtests.so [.] QBasicAtomicInt::ref()+ 3.15% quickopenbench quickopenbench [.] QBasicAtomicInt::deref()+ 3.14% quickopenbench libQtCore.so.4.8.5 [.] QString::compare(QString const&) const+ 2.85% quickopenbench libkdevplatformproject.so [.] QVector<QString>::size() const+ 2.52% quickopenbench libkdevplatformtests.so [.] qt_noop()...
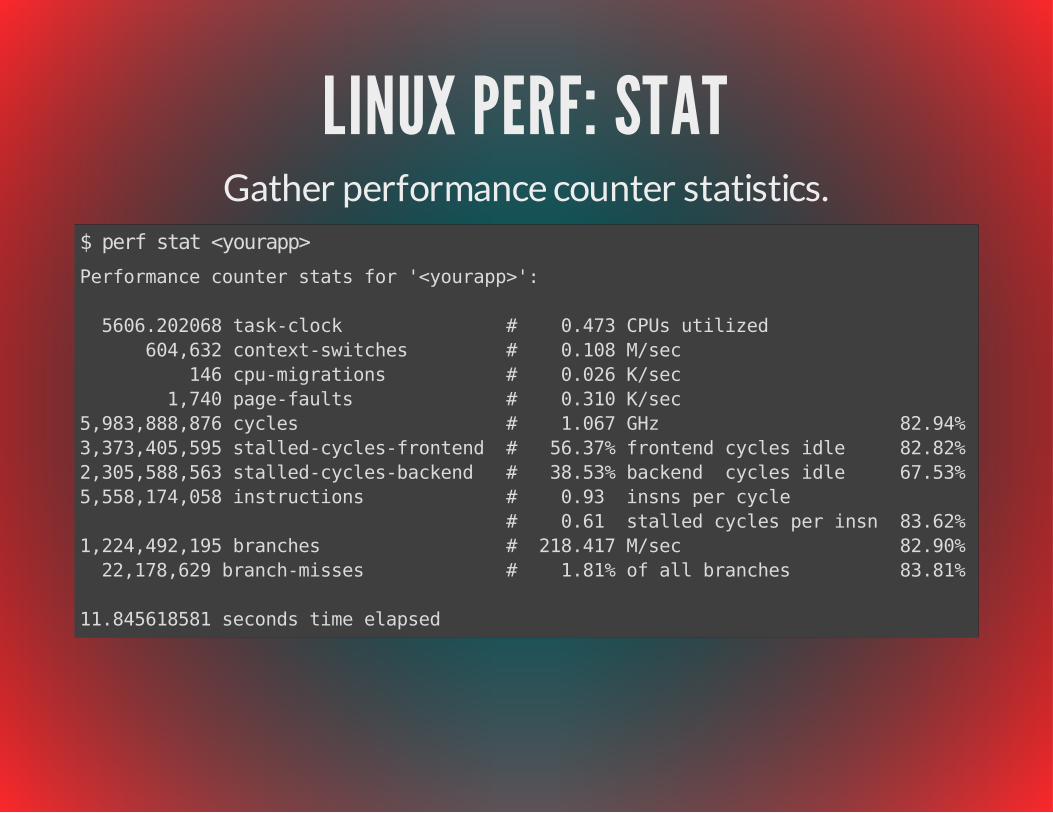
LINUX PERF: STATGather performance counter statistics.
$ perf stat <yourapp>Performance counter stats for '<yourapp>':
5606.202068 task-clock # 0.473 CPUs utilized 604,632 context-switches # 0.108 M/sec 146 cpu-migrations # 0.026 K/sec 1,740 page-faults # 0.310 K/sec5,983,888,876 cycles # 1.067 GHz 82.94%3,373,405,595 stalled-cycles-frontend # 56.37% frontend cycles idle 82.82%2,305,588,563 stalled-cycles-backend # 38.53% backend cycles idle 67.53%5,558,174,058 instructions # 0.93 insns per cycle # 0.61 stalled cycles per insn 83.62%1,224,492,195 branches # 218.417 M/sec 82.90% 22,178,629 branch-misses # 1.81% of all branches 83.81%
11.845618581 seconds time elapsed

LINUX PERF: QTESTLIB IN QT5Fast, reliable benchmark counting CPU cycles.
$ yourQTestLibBench -perf...RESULT : tst_QVector::calibration(): 6,121,714 CPU cycles per iteration (total: 6,121,714, iterations: 1)...

LINUX PERFAlready good, but so much potential for more!
Custom trace points enable custom tools to be build.Proper UI desperately needed!

INTEL® VTUNE™"Commercial perf with a good UI."
Fast, sampling based wall time profiling.Excellent visualizations, good workflow.Proprietary
for non-commercial Linux work.Most features require Intel CPUs!Free license

INTEL® VTUNE™ AMPLIFIERProfile Overview
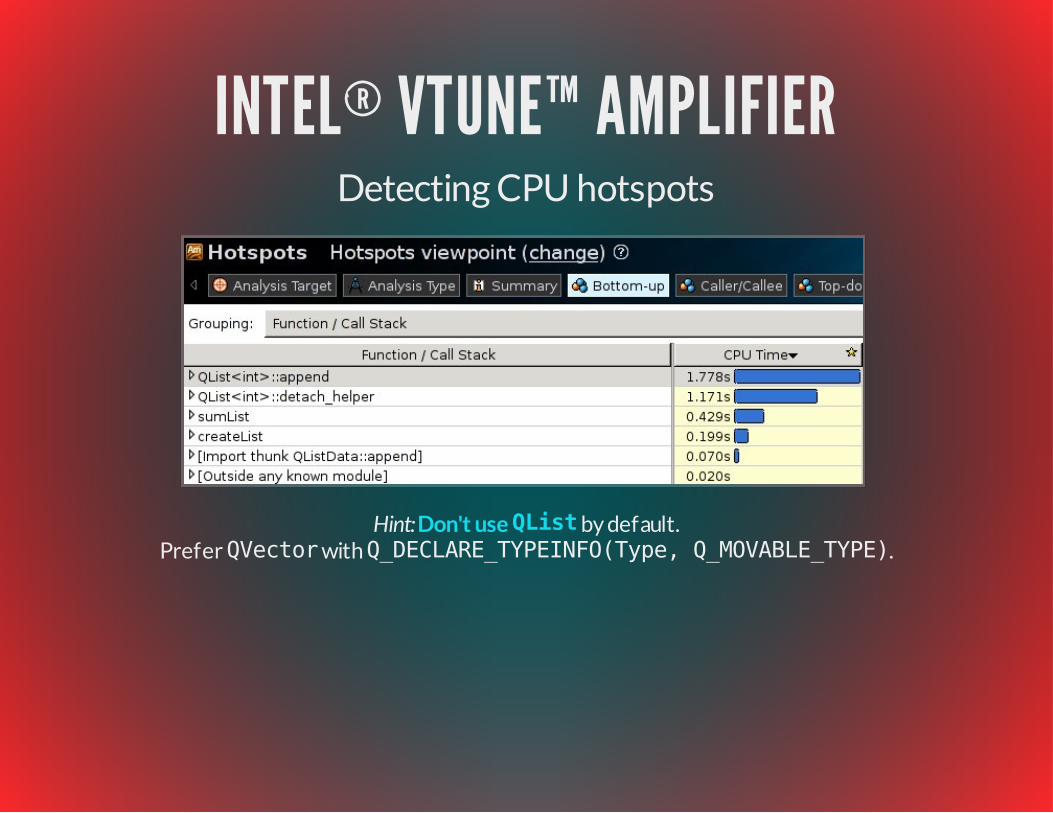
INTEL® VTUNE™ AMPLIFIERDetecting CPU hotspots
Hint: by default.
Prefer QVector with Q_DECLARE_TYPEINFO(Type, Q_MOVABLE_TYPE).Don't use QList

INTEL® VTUNE™ AMPLIFIERFinding Locks and Waits
Note: Not all waits are bad - an idle QThread will wait in the eventloop e.g.
Hint: Prefer asynchronous, task-based code over locking.

INTEL® VTUNE™ AMPLIFIERPer-Thread CPU Usage, Context Switches, Waits
Hint: Prefer asynchronous, task-based code over locking.
Hint: Use value semantics, don't share data between multiple threads.

VALGRINDThe developer's swiss army knife.
Available on Linux, Mac; x86 and ARM supported.
Callgrind: deterministic instruction profilerMassif: heap profiler
Sadly large overhead, very slow
Hint: For apps using a JIT compiler (i.e. via QtScript, QtWebKit, QML, QRegularExpression), add thefollowing argument to valgrind: --smc-check=all-non-file .
$ valgrind --tool={massif,callgrind} <yourapp>

KCACHEGRIND
Todo: Wouldn't it be nice to view perf.data files like this?
Hint: Cleanup Qt results: --fn-skip="QMetaObject::activate*" --fn-skip="QMetaObject::metacall*" --fn-skip="*::qt_metacall*" --fn-skip="*::qt_static_metacall*"
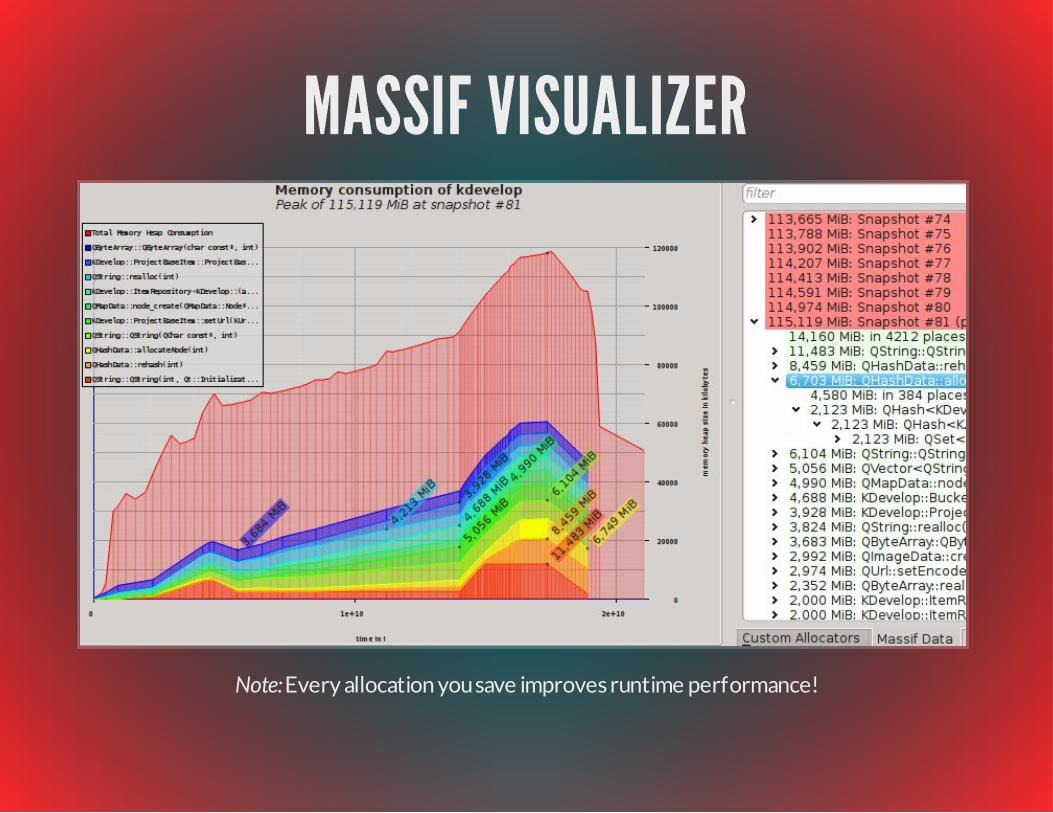
MASSIF VISUALIZER
Note: Every allocation you save improves runtime performance!

PMAPTrack per-process memory consumption over time.
Works nicely on embedded linux systems.Could be ported to OS X, WindowsDownload: github.com/milianw/shell-helpers
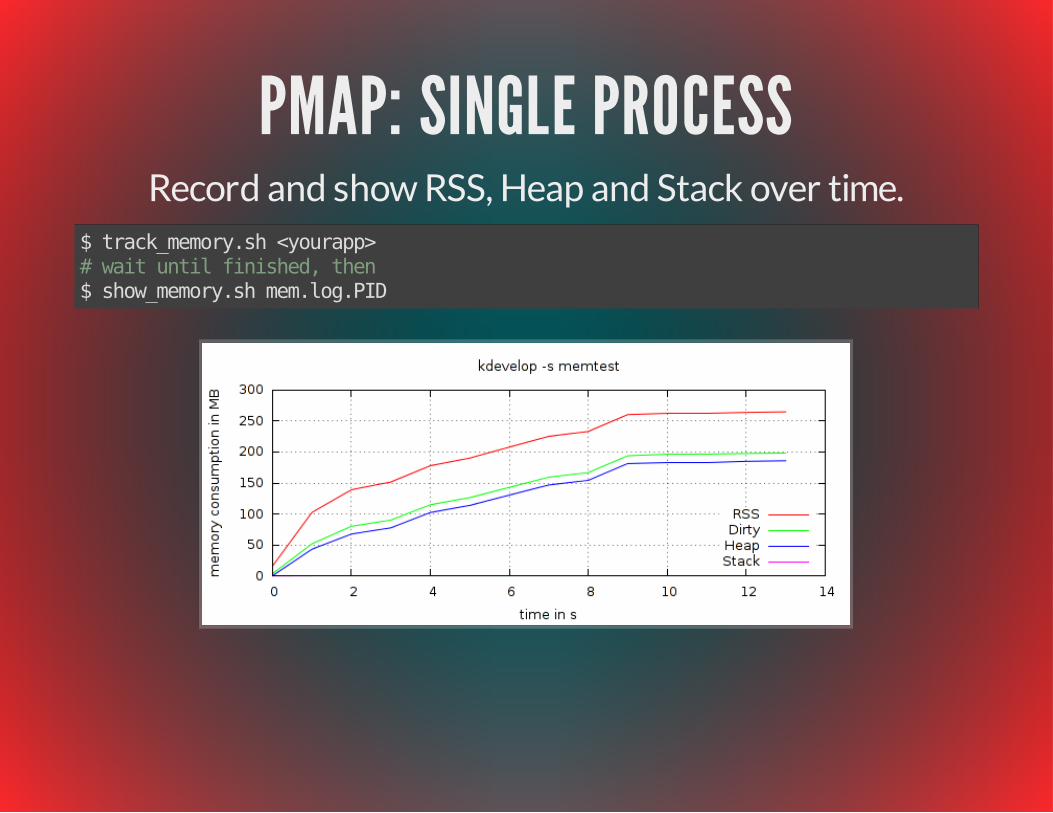
PMAP: SINGLE PROCESSRecord and show RSS, Heap and Stack over time.
$ track_memory.sh <yourapp># wait until finished, then$ show_memory.sh mem.log.PID
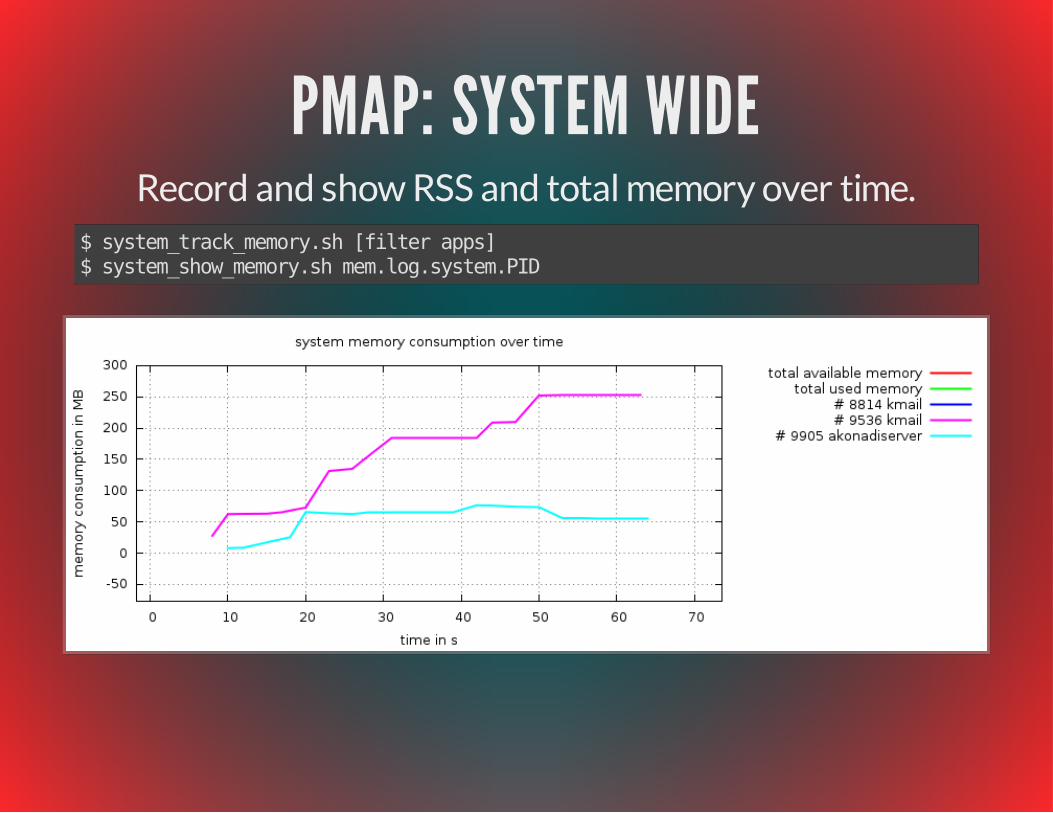
PMAP: SYSTEM WIDERecord and show RSS and total memory over time.
$ system_track_memory.sh [filter apps]$ system_show_memory.sh mem.log.system.PID

QT TIPS & TRICKS

QSTRING ALLOCATIONS
Two QString allocations per call!
source.mid(pos, needle.size())QString("myNeedle")
bool containsAt(const QString& source, const QString& needle, int pos){ return needle == source.mid(pos, needle.size());}
// common usage example:containsAt(longString, "myNeedle", 42);

QSTRING ALLOCATIONS: IMPROVED
No runtime allocations!
bool containsAt(const QString& source, const QString& needle, int pos){ return needle == source.midRef(pos, needle.size());}// common usage example:containsAt(longString, QStringLiteral("myNeedle"), 42);
Slow variant: 54.7 msecs / 153000985.4 CPU cyclesOptimized: 6.7 msecs / 19049591.6 CPU cyclesImprovement: ~87%

QSTRING PARSINGTokenize strings containing repeated keywords.
100% memory overhead.
// common input: foo bar foo bar foo bar ...QVector<QString> tokenize(const QString& input){ QVector<QString> ret; Tokenizer tokenizer; Token token; while(tokenizer.nextToken(&token)) { ret.append(input.mid(token.start, token.end)); }}

QSTRING PARSINGInterning: Leverage implicit sharing.
QString tokenText(const QStringRef& token){ static const QVector<QString> keywords = { QStringLiteral("foo"), QStringLiteral("bar"), ... }; auto it = std::find(keywords.begin(), keywords.end(), token); if (it != keywords.end()) { // hot path: no string allocation, and we share memory return *it; } else { // slow path return token.toString(); }}
Slow variant: 198.3 msecsOptimized: 153.9 msecsImprovement: ~22%, no memory overhead (keywords are shared)

THREAD-SAFE MESSAGE PASSINGUse Qt's Signal/Slots for efficient message passing.
class Worker : public QObject { Q_OBJECTpublic: Worker(QThread *thread) { moveToThread(thread); connect(thread, &QThread::finished, this, &QObject::deleteLater); } void work(const QString& input) { // thread safe dispatching QMetaObject::invokeMethod(this, "workInternal", Q_ARG(QString, input)); }private slots: // only called from background thread void workInternal(const QString& input) { const QString result = doExpensiveStuff(input); emit finished(result); // will be queued and sent to listeners }signals: void finished(const QString& result);};

THE ENDQUESTIONS? FEEDBACK?
/ MILIAN WOLFF WWWW.KDAB.COM