Embed Size (px)
Citation preview
www.utahtaxpayers.org
Volume 37 Issue 4
April 2012
1
THE UTAH TAXPAYER A Publication of the Utah Taxpayers Association
2
Association Staff
Howard Stephenson President Royce Van Tassell Vice President Chase Everton Research Analyst Sophie Mickelsen Executive Assistant
Executive Committee
John Ward Chairman James Hewlett Vice Chair Kent Stanger Secretary Mike Edmonds Treasurer Morris Jackson Legislative Chair Margo Provost Immediate Past Chair H. Val Hafen At Large Max Miller At Large
Page 4
Page 6
Page 3
Page 5
APRil 2012 Volume 37
New Report Highlights Problems of Muni-telecom
Alternative Energy Development Tax Incentives
Utah Tax Freedom Day 2012: April 17
Page 2
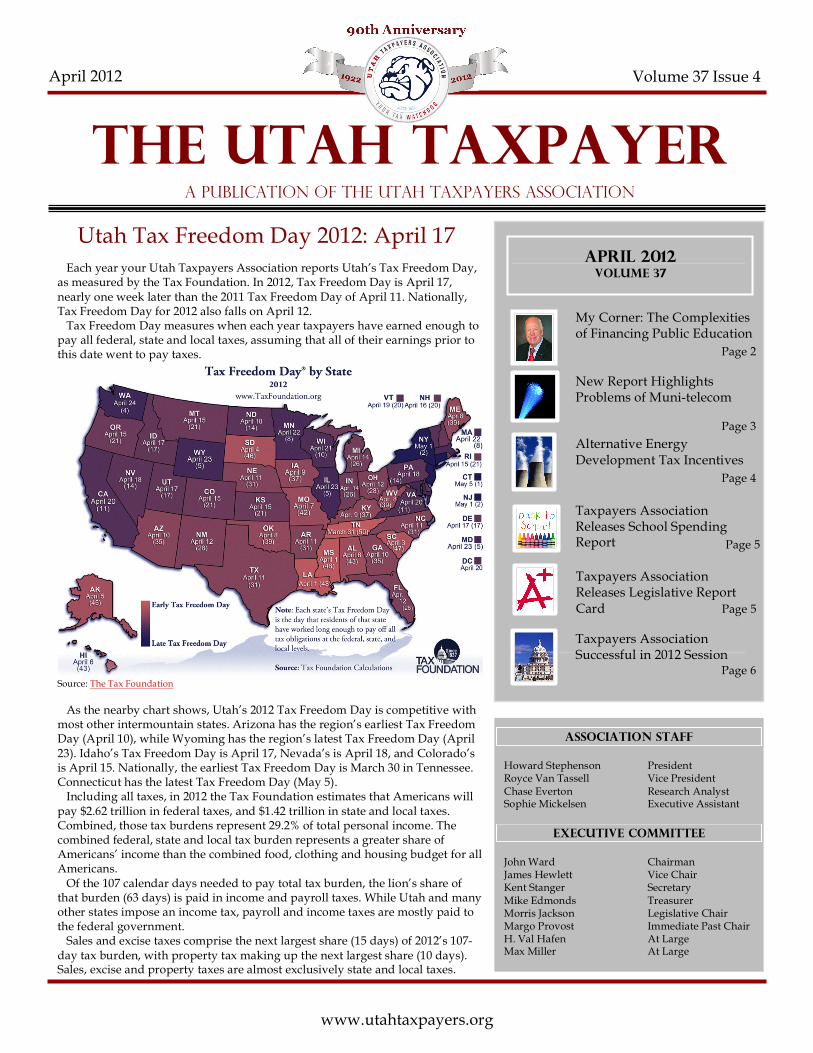
Each year your Utah Taxpayers Association reports Utah’s Tax Freedom Day, as measured by the Tax Foundation. In 2012, Tax Freedom Day is April 17, nearly one week later than the 2011 Tax Freedom Day of April 11. Nationally, Tax Freedom Day for 2012 also falls on April 12. Tax Freedom Day measures when each year taxpayers have earned enough to pay all federal, state and local taxes, assuming that all of their earnings prior to this date went to pay taxes.
Source: The Tax Foundation
As the nearby chart shows, Utah’s 2012 Tax Freedom Day is competitive with most other intermountain states. Arizona has the region’s earliest Tax Freedom Day (April 10), while Wyoming has the region’s latest Tax Freedom Day (April 23). Idaho’s Tax Freedom Day is April 17, Nevada’s is April 18, and Colorado’s is April 15. Nationally, the earliest Tax Freedom Day is March 30 in Tennessee. Connecticut has the latest Tax Freedom Day (May 5). Including all taxes, in 2012 the Tax Foundation estimates that Americans will pay $2.62 trillion in federal taxes, and $1.42 trillion in state and local taxes. Combined, those tax burdens represent 29.2% of total personal income. The combined federal, state and local tax burden represents a greater share of Americans’ income than the combined food, clothing and housing budget for all Americans. Of the 107 calendar days needed to pay total tax burden, the lion’s share of that burden (63 days) is paid in income and payroll taxes. While Utah and many other states impose an income tax, payroll and income taxes are mostly paid to the federal government. Sales and excise taxes comprise the next largest share (15 days) of 2012’s 107-day tax burden, with property tax making up the next largest share (10 days). Sales, excise and property taxes are almost exclusively state and local taxes.
My Corner: The Complexities of Financing Public Education
Taxpayers Association Releases Legislative Report Card
Taxpayers Association Successful in 2012 Session
Page 5
Taxpayers Association Releases School Spending Report
April 2012
2 www.utahtaxpayers.org
Volume 37 Issue 4
1
The most significant budget issue debated each session is public education. Most other issues get debated in terms of their impact on public education. Some observers have asked whether the Legislature fully funded student growth. Perhaps the most prominent example came from a memo written by Brad Smith, superintendent of the Ogden School District. Frustrated by his perception that the Legislature gave more money to
charter schools than to district schools, and reflecting the feelings of many from the public education establishment, he complained in a memo to Ogden School District’s employees that “the legislature partially funded student growth statewide.” He further complained that the Legislature overstated how much the WPU grew, while dramatically increasing funding for charter schools. It’s important to note that Supt. Smith is not a long-time member of the public education establishment. In 2011, he was elected to the Ogden School Board, and now as superintendent he is leading the charge to fundamentally change collective bargaining between Utah’s school districts and teachers unions. In other words, critiques from him about education finance don’t ring quite as hollow as those who see more money as the only meaningful “reform.” It’s no secret that education finance is extraordinarily complex, so I’m not shocked that Brad Smith, whom I consider a good friend, would misunderstand what the Legislature did. The state uses dozens of formulas to set the overall public education budget, and dozens more to allocate that funding to all of the district and charter schools. Superintendent Smith and members of the public education establishment (who remain skeptical of charter schools) are unsurprisingly worried that charter schools, which compete with school districts, might be getting more than their share of public education funding. However, their concern about growth in charter school funding is misplaced. Charter schools comprise only 7.6% of all students in public education. However, the State Office of Education (USOE) anticipates that charters will absorb more than half (6,529) of the total projected growth (12,500) in Utah’s public schools this year. When more than half of public education’s new enrollment goes into Utah’s charter schools, charter schools’ apparent funding growth looks much bigger than it really is. In reality, most of charter schools’ funding growth comes because so many new students want to attend charter schools. In critiquing the Legislature’s new growth funding of $36 million, the public education establishment relies on old data from the USOE. The Legislature provided $36 million in funding for new growth, which is around half of the State School Board's original projection. However, in reviewing the growth projection, the USOE discovered an error it made in converting average daily membership to weighted pupil units. The $36 million reflects the corrected data.
My Corner: The Complexities of Financing Public Education, or Why Parental Choice is so Important
Association President Howard Stephenson
2
The public education establishment’s assessment of how much the WPU grew also reflects a less than full understanding of how education is funded. Before proceeding, though, let me briefly define WPU and ADM. To simplify our conversations on education finance, legislators, lobbyists and others involved in public education financing have shortened complex ideas into acronyms like “ADM” and “WPU.” ADM stands for “average daily membership,” and is a measure of how many students took classes in Utah public schools. One ADM equals one student in a Utah public school classroom all day. WPU stands for “weighted pupil unit,” and is a unit the Legislature uses to allocate income tax dollars throughout public education. The number of WPUs is roughly related to ADM, but it is not exactly the same. In general terms, there are about 1.4 WPUs for each student in a Utah public school. However, the Legislature awards additional WPUs to school districts and charter schools for being especially small, or because they serve students with disabilities, etc. Unfortunately, even the term WPU is vague, since the Legislature actually uses two “flavors” of WPUs. The first flavor is the special ed/career and technology (special ed)
WPU. The second flavor is the “standard” WPU. The values of these “flavors” are very close, but not exactly the same. And when these slight differences are multiplied across the nearly 600,000 students throughout the public education system, that small difference looks much bigger.
In addition, the 2012 Legislature approved HB 206, which changed the number of standard WPUs. The 0.92% figure inappropriately compares the value of special education WPUs before HB 206 takes effect with the value of traditional WPUs after HB 206 takes effect. In layman’s terms, they are comparing apples and oranges. These apples and oranges look VERY similar, but they are still apples and oranges. As this brief foray into public education finance indicates, nuance matters a great deal. The Legislature has tried to create a education system to meet the needs of each individual child, but inevitably it requires grouping students in ways that don’t work for each student. That’s why I have championed parental choice in education. When parents are partners with their child’s teacher and principal, the opportunity for real and lasting changes in a child’s educational outlook increases exponentially. Too often the current formula-driven system pits these natural partners against each other. Parents blame teachers and administrators. Teachers blame parents and administrators. Administrators blame teachers and parents. And no one takes responsibility for making sure our children learn. Utah’s statewide online education program is beginning to break these walls down. Charter schools have been doing the same thing for nearly 15 years. Unfortunately, we still have a long way to go. Witness the inaccurate, if understandable laments of Supt. Brad Smith.
The Legislature has tried to create an education system to meet the needs of each individual child, but inevitably it requires grouping students in ways that don’t work for each student.
April 2012
3 www.utahtaxpayers.org
Volume 37 Issue 4
1
A new report by economist Joseph Fuhr of Widener University notes that muni-telecom systems across the country create the same problems for taxpayers that UTOPIA and iProvo have created here in Utah. Fuhr’s report notes that “government-owned networks” or “GONs” don’t provide the universal service they promise, fail to accurately gauge costs and benefits, are inefficient and wasteful, and compete unfairly with the private sector companies Ashland, Oregon: Not-so-universal Service
Utah supporters of muni-telecom networks pointed to Ashland, Oregon’s network as an example of how a municipal network could benefit a city. Launched in the late 1990s, Ashland’s network accumulated $15.5 million in debts because operating and construction
costs were higher than anticipated. In addition, Ashland has failed to live up to its “universal service” promise. As it turned out, building a new telecom network was cost-prohibitive in some areas. Nevertheless, property taxes from those same areas are subsidizing the Ashland network. Chattanooga, Tennessee: Costs Exceed Benefits Utah’s UTOPIA supporters frequently cite the Chattanooga, Tennessee network as an example of a successful muni-telecom network. Chattanooga’s network offers blazing speeds of up to 1
gigabit per second. That speed far exceeds the typical speeds offered in the private sector. However, the few
customers who want that speed pay $350 per month. When private companies offer speeds of 15, 25 and 50 megabits per second for $50, $65 and $140 per month, it’s no surprise few customers want it. And since customers choose a telecom provider based on speed and cost, it’s hardly surprising that Chattanooga’s audited financials show negative net assets at the end of FY 2011 of $15.6 million (see page 55 of Chattanooga’s audited financials). That said, Chattanooga does offer some hope for Utah taxpayers in UTOPIA/iProvo cities. They saw significant subscriber growth in FY 2011, which led to an operating profit of $3.7 million. However, Chattanooga still has million of dollars of negative net assets to offset. Until Chattanooga consistently shows net profits, it is difficult to see that network as something other than another network where actual costs exceed projected costs and benefits. Mooresville and Davidson, North Carolina: Digging an Ever Deeper Hole Adelphia Communications used to own the telecom network in the neighboring cities of Mooresville and Davidson, North Carolina. While Time Warner offered to buy the network, Mooresville and Davidson preferred to run their own network,
2
which is today called MI-Connection. Despite high expectations set by the cities’ leaders when the cities took over MI-Connection, MI-Connection has failed to live up to its promises. It has not yet turned an annual profit. The network’s $89.9 million in debt translates into an annual debt payment from Davidson of $1.9 million, or 1/5 of the town’s annual budget. Unsurprisingly, North Carolina state officials have issued two warning letters about the network’s finances
Not having properly weighed the costs associated with owning a
telecom network, local leaders now have to choose between bad and worse options: raise taxes or default on the debt. Residents of Midvale and West Valley City, both of whom have raised property taxes to pay for UTOPIA, are familiar with this “Hobson’s Choice.” Marietta, Georgia: What Might Have Been Supporters of muni-telecom used to city Marietta, Georgia’s “FiberNet” network, just as they used to cite the Ashland, Oregon network. Built in 1996 for $35 million, Marietta’s FiberNet was sold in 2004 for $11.2 million. One of the biggest problems FiberNet faced was the constant need for new technology. Marietta Bill Dunaway told USA Today, “That’s why we should not be in the business – you have to keep reinvesting. … [Its] negative cash flow once you consider reinvestment of capital.” As anyone who’s attended even one municipal budget meeting can attest, many, many well meaning, important projects died at the altar of FiberNet. Every city has so much money, and what Marietta spent on FiberNet couldn’t purchase new police cars or fire trucks, couldn’t improve the city’s roads, etc. Lessons Learned The Fuhr report confirms the warnings your Taxpayers Association has expressed many times: cities should not be in the telecom business. Time and again well-meaning municipal leaders fail to recognize the complexity, pace of innovation and cost associated with running a telecom network in the 21st century. That incomplete information “shifts the risk [of failure] from voluntary investors to involuntary investors,” also known as taxpayers. It also means the burdens on taxpayers continue to mount.
New Report Highlights Problems of Muni-telecom
The Utah Taxpayer, August 1966
“The problem of taxation is quite simple. You can shear a sheep repeatedly, but you can only skin it once.”
April 2012
4 www.utahtaxpayers.org
Volume 37 Issue 4
John Stossel Dinner and Reception The Utah Taxpayers Foundation will be hosting a fundraiser with John Stossel of the Fox Business Network on Wednesday, April
18, 2012. The event will be held at the Grand America Hotel in Salt Lake City. Individual dinner seats are available for $50. For more information about sponsorships and attending a private reception with Mr. Stossel, contact us at (801) 972-8814 or email
34th Annual “Utah Taxes Now” Conference Your Taxpayers Association will be hosting its annual “Utah Taxes Now” Conference on Tuesday, May 22, 2012 at the Little
America Hotel. Leaders from the Utah House of Representatives and Senate, the Governor’s office, policy experts and community leaders will cover a broad range of tax issues, including the restaurant tax, education reform and federal and state tax alignment.
CLE and CPE credit will be available.
Teed Off On Taxes Golf Tournament Join the Utah Taxpayers Association for their annual “Teed Off On Taxes” Golf Tournament on Thursday, June 14, 2012 at the
Eaglewood Golf Course in North Salt Lake. Sponsorship opportunities are available.
Register for the John Stossel dinner, “Utah Taxes Now” Conference or the “Teed Off On Taxes” Golf Tournament by visiting contacting Sophie Mickelsen at [email protected] or (801) 972-8814.
21
In 2008, Governor Huntsman pushed legislation to create a Renewable Energy Tax Incentives, which included nuclear power. The resulting incentive took the form of post-performance tax credits. The goal was to create new jobs, grow the economy, and make energy abundant and cost efficient for Utah and surrounding markets. As with all good tax policy these incentives do not redistribute taxpayers’ dollars. These incentives reduce the tax burden on the developing companies that risk investment and create jobs. In 2010, through the efforts of Senator Kevin Van Tassell, the legislature expanded the program to include Alternative Energy development, such as oil shale, oil sands, coal-to-liquids, petroleum coke, other oil impregnated rock.. None of these nascent energy industries are currently in production in Utah although the resources are abundant throughout the state. The goal was again to create new jobs, grow the economy, and make energy abundant and cost efficient for Utah and surrounding markets.
The initial early stage investments by these energy companies had already begun to create some jobs and have positive economic impacts. Although there had been applications for these incentives to the Governor’s Office of Economic Development (GOED) there had yet to be to any incentives issued because of inefficiencies and lack of specific energy experience in GOED. In an effort to make state administration of these incentives more efficient and speed up job
creation and positive economic impacts, Senator Stuart Adams introduced the Alternative Energy Tax Incentive Bill (SB 65) in the recently completed 2012 Legislative Session. The bill passed both chambers of the Utah Legislature with only one dissenting vote and was recently signed by Governor Herbert.
2
Senator Adams’ bill makes the final structural changes necessary to allow the incentive program to be fully utilized. Administratively, one significant change was to move the energy incentive from GOED’s jurisdiction to the recently created (2011) Utah Office of Energy Development (OED). OED is a more natural and efficient fit for the program. Adams bill also defined qualifications and other elements of the incentive program that had previously been left vague and subject to arbitrary decisions by GOED Board members. These parameters are now clearly defined in code, including a requirement that projects be for commercial scale production. As it is now statutorily structured, the energy incentive will give qualifying companies a tax credit equal to 75% of all new taxes paid to the State in a given year. Once initiated, the incentive lasts for 20 years. If the full incentive is not utilized by a company in a given year the balance will carry forward for up to seven years. Senator Adams’ bill also clarified and expanded sales tax exemptions for energy development. Previously, renewable energy projects and some alternative energy projects qualified for sales tax exemptions. SB 65 made these exemptions uniform and consistent and also expanded the qualifications to include all materials used in the development of an energy project. One final improvement to the energy incentive program will require companies seeking an incentive to submit an annual report, prepared by an independent CPA, outlining new revenues to the State and the amount of incentive being claimed. The dollar amount being claimed will also be verified with the Utah State Tax Commission.
Alternative Energy Development Tax Incentives
Senator Stuart Adams
As with all good tax policy these incentives do not redistribute taxpayers’ dollars

April 2012
5 www.utahtaxpayers.org
Volume 37 Issue 4
Your Taxpayers Association has released its 2012 legislative scorecard rating Utah’s 104 legislators on fourteen key taxpayer related bills. The average score in the House of Representatives was 73 percent. Four representatives receive a 100 percent score: Craig Frank, Brad Galvez, John Mathis and Mike Morley. The highest scoring Democrats are Mark Wheatley (62%) and Janice Fisher (58%). The lowest scoring Representatives (less than 60%) are David Litvack (45%), Brian King (50%), Mel Brown (50%), Joel Briscoe (50%), Larry Wiley (54%), Jennifer Seelig (54%), Neal Hend-rickson (54%), Susan Duckworth (54%), Christine Watkins (57%), Kraig Powell (57%), Marie Poulson (57%), Carol Spack-man Moss (57%), Lynn Hemingway (57%), Brian Doughty (57%), Tim Cosgrove (57%), Rebecca Chavez-Houck (57%), Patrice Arent (57%), Kay McIff (58%) and Janice Fisher (58%). The lowest scoring Republicans are Mel Brown (50%) and Kraig Powell (57%). The average score in the Utah Senate was 84 percent. Four senators received a score of 100 percent: Michael Waddoups, Scott Jenkins, Steve Urquhart and Howard Stephenson. The highest scoring Democrats are Ben McAdams (82%) and Gene Davis (80%). The lowest scoring Senators (below 70%) are Luz Robles (64%), Ross Romero (67%), Karen Morgan (67%) and Kevin Van Tassell (67%).
To view the complete scorecard and final legislative watchlist, please visit http://www.utahtaxpayers.org.
2012 “Friend of the Taxpayer”
Only 18 Representatives and 12 Senators scored above 90 percent on our annual legislative scorecard. These fiscally responsibly legislators have earned the title, “Friend of the Taxpayer”
House of Representatives
Craig Frank (100%) Brad Galvez (100%) John Mathis (100%) Mike Morley (100%) Brad Daw (93%) Keith Grover (93%) Val Peterson (93%) Dean Sanpei (93%) Wayne Harper (92%) Chris Herrod (92%) Curtis Oda (92%) Steve Sandstrom (92%) Greg Hughes (92%) Ken Sumsion (92%) Ryan Wilcox (90%) John Dougall (91%) Rebecca Lockhart (91%) Dan McCay (91%)
State Senate Michael Waddoups (100%) Howard Stephenson (100%) Scott Jenkins (100%) Stephen Urquhart (100%) Todd Weiler (92%) Casey Anderson (92%) Margaret Dayton (92%) Stuart Adams (91%) Jerry Stevenson (91%) John Valentine (91%) Mark Madsen (90%) Daniel Thatcher (90%)
Taxpayers Association Releases 2012 Legislative Scorecard
1
Your Taxpayers Association has released its latest School Spending Report. Every year your Utah Taxpayers Association collects the financial and statistical data for Utah's school districts and charter schools. This information compares the spending trends between districts and outlines how the districts spend taxpayer dollars. The 2010-2011 report includes all 41 school districts, and groups all charter schools into one line item. In the 2010-2011 school year, school districts spent an average of $7,752 per student while charter schools spent approximately $8,100 per student. The accompanying chart shows total K-12 spending per student since 1999. Over the last decade public education funding in Utah has steadily increased. Even in the recent economic turmoil, education funding has remained relatively level. To view the complete report and additional analysis, visit http://www.utahtaxpayers.org.
Taxpayers Association Releases School Spending Report
Calculations by Utah Taxpayers Association based on data from Utah State Office of Education and Bureau of Labor Statistics
Volume 37 Issue 4
April 2012
6
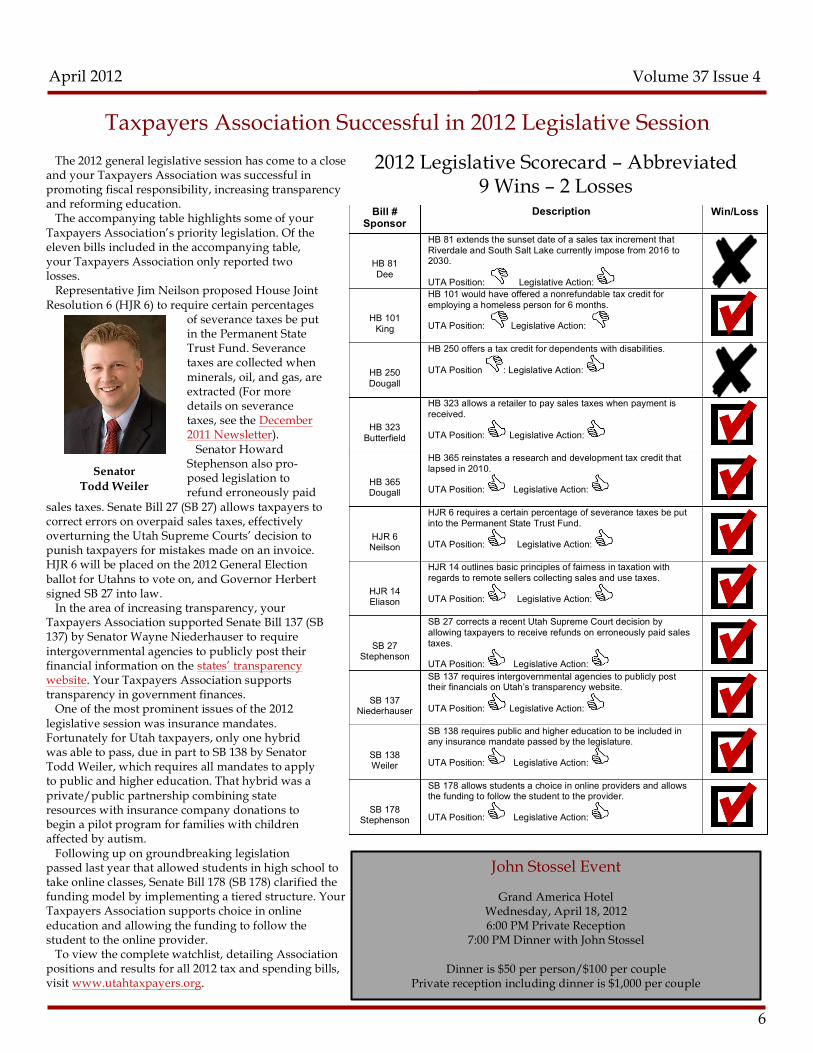
The 2012 general legislative session has come to a close and your Taxpayers Association was successful in promoting fiscal responsibility, increasing transparency and reforming education. The accompanying table highlights some of your Taxpayers Association’s priority legislation. Of the eleven bills included in the accompanying table, your Taxpayers Association only reported two losses. Representative Jim Neilson proposed House Joint Resolution 6 (HJR 6) to require certain percentages
of severance taxes be put in the Permanent State Trust Fund. Severance taxes are collected when minerals, oil, and gas, are extracted (For more details on severance taxes, see the December 2011 Newsletter). Senator Howard Stephenson also pro-posed legislation to refund erroneously paid
sales taxes. Senate Bill 27 (SB 27) allows taxpayers to correct errors on overpaid sales taxes, effectively overturning the Utah Supreme Courts’ decision to punish taxpayers for mistakes made on an invoice. HJR 6 will be placed on the 2012 General Election ballot for Utahns to vote on, and Governor Herbert signed SB 27 into law. In the area of increasing transparency, your Taxpayers Association supported Senate Bill 137 (SB 137) by Senator Wayne Niederhauser to require intergovernmental agencies to publicly post their financial information on the states’ transparency website. Your Taxpayers Association supports transparency in government finances. One of the most prominent issues of the 2012 legislative session was insurance mandates. Fortunately for Utah taxpayers, only one hybrid was able to pass, due in part to SB 138 by Senator Todd Weiler, which requires all mandates to apply to public and higher education. That hybrid was a private/public partnership combining state resources with insurance company donations to begin a pilot program for families with children affected by autism. Following up on groundbreaking legislation passed last year that allowed students in high school to take online classes, Senate Bill 178 (SB 178) clarified the funding model by implementing a tiered structure. Your Taxpayers Association supports choice in online education and allowing the funding to follow the student to the online provider. To view the complete watchlist, detailing Association positions and results for all 2012 tax and spending bills, visit www.utahtaxpayers.org.
Bill # Sponsor
Description Win/Loss
HB 81 Dee
HB 81 extends the sunset date of a sales tax increment that Riverdale and South Salt Lake currently impose from 2016 to 2030.
UTA Position: Legislative Action:
HB 101 King
HB 101 would have offered a nonrefundable tax credit for employing a homeless person for 6 months.
UTA Position: Legislative Action:
HB 250 Dougall
HB 250 offers a tax credit for dependents with disabilities.
UTA Position : Legislative Action:
HB 323 Butterfield
HB 323 allows a retailer to pay sales taxes when payment is received.
UTA Position: Legislative Action:
HB 365 Dougall
HB 365 reinstates a research and development tax credit that lapsed in 2010.
UTA Position: Legislative Action:
HJR 6 Neilson
HJR 6 requires a certain percentage of severance taxes be put into the Permanent State Trust Fund.
UTA Position: Legislative Action:
HJR 14 Eliason
HJR 14 outlines basic principles of fairness in taxation with regards to remote sellers collecting sales and use taxes.
UTA Position: Legislative Action:
SB 27 Stephenson
SB 27 corrects a recent Utah Supreme Court decision by allowing taxpayers to receive refunds on erroneously paid sales taxes.
UTA Position: Legislative Action:
SB 137 Niederhauser
SB 137 requires intergovernmental agencies to publicly post their financials on Utah’s transparency website.
UTA Position: Legislative Action:
SB 138 Weiler
SB 138 requires public and higher education to be included in any insurance mandate passed by the legislature.
UTA Position: Legislative Action:
SB 178 Stephenson
SB 178 allows students a choice in online providers and allows the funding to follow the student to the provider.
UTA Position: Legislative Action:
Taxpayers Association Successful in 2012 Legislative Session
2012 Legislative Scorecard – Abbreviated 9 Wins – 2 Losses
Senator Todd Weiler
John Stossel Event
Grand America Hotel Wednesday, April 18, 2012 6:00 PM Private Reception
7:00 PM Dinner with John Stossel
Dinner is $50 per person/$100 per couple Private reception including dinner is $1,000 per couple