Embed Size (px)
Citation preview
NYC Mayorrsquos Office of Recovery and Resiliency Climate Resiliency Design Guidelines
1PATUS SENDAMPRA PERTUSU LTICTUM FECTUAM IACCHUCO CONDEM ETE O EFECRI SINMOLUDEM IMIS QUEROXIMUS
CLIMATE RESILIENCY DESIGN GUIDELINESCLIMATE RESILIENCY DESIGN GUIDELINES
April 2018Version 20
NYC Mayorrsquos Office of Recovery and Resiliency Climate Resiliency Design Guidelines
2
NYC Mayorrsquos Office of Recovery and Resiliency Climate Resiliency Design Guidelines
3
I INTRODUCTION 4
A GOALS 4
B CLIMATE CHANGE PROJECTIONS FOR NEW YORK CITY 5
C PLANNING ACROSS PROJECT USEFUL LIFE 6
D MANAGING UNCERTAINTY 6
E PROJECT-SPECIFIC CONSIDERATIONS 7
II INTERPRETING CLIMATE CHANGE DATA FOR RESILIENT DESIGN ADJUSTMENTS 9
A INCREASING HEAT 9
B INCREASING PRECIPITATION 15
C SEA LEVEL RISE 19
III EVALUATION OF PROJECT BENEFITS 28
A GENERAL METHODOLOGY TO ESTIMATE PROJECT BENEFITS 28
B CATEGORIES OF PROJECT BENEFITS 28
C WHICH METHODOLOGY TO USE 30
D BCA METHODOLOGY FOR PROJECTS LESS THAN $50 MILLION 30
E BCA METHODOLOGY FOR PROJECTS OVER $50 MILLION 33
APPENDIX 1 - KEY TERMS 36
APPENDIX 2 - CLIMATE CHANGE PROJECTIONS 39
APPENDIX 3 - DIFFERENTIATION OF FLOOD MAPS 41
APPENDIX 4 - PROJECT BENEFITS CATEGORIES 42
APPENDIX 5 - EXAMPLE PLANNING DECISION TREE 51
APPENDIX 6 - DESIGN STRATEGIES CHECKLIST 52
APPENDIX 7 - CLIMATE CHANGE RISK ASSESSMENT RESOURCES 53
WORKS CITED 55
CONTENTS
NYC Mayorrsquos Office of Recovery and Resiliency Climate Resiliency Design Guidelines
4
In the coming years and throughout the 21st century New York City (NYC) will face new challenges from a rapidly changing climate Many physical infrastructure landscape and building projects (ldquofacilitiesrdquo) will face new or more severe risks from extreme flooding precipitation and heat events1 At the same time environmental conditions are also projected to change posing chronic hazards as some coastal areas are regularly inundated by high tide and average annual temperatures rise In NYCrsquos Roadmap to 80 x 50 the City of New York (the City) committed to reducing emissions of greenhouse gases by 80 by 20502 However the impacts from climate change are already occurring and these Guidelines establish how the City can increase its resiliency to unavoidable climate change through design
Codes and standards that regulate the design of infrastructure and buildings incorporate historic weather data to determine how to build for the future However historic conditions do not accurately represent the projected severity and frequency of future storms sea level rise heat waves and precipitation The climate is already changing and will continue to change in significant ways over the entire useful life of facilities designed today threatening to undermine capital investments and impede critical services To protect the facilities New Yorkers depend upon the City will design them using the best available data for future conditions The Climate Resiliency Design Guidelines (ldquoGuidelinesrdquo) provide step-by-step instructions on how to supplement historic climate data with specific regional forward-looking climate change data in the design of City facilities Resilient design is intended to become an integral part of the sequential project planning process for agencies and their designers All new projects should assess their climate change risks in the context of the projectrsquos purpose specific site location and funding and then determine the appropriate design strategies These Guidelines apply to all City capital projects except coastal protection projects (eg sea walls and levees) for which the City will develop separate guidance Implementing the Guidelines will result in protection standards that will make the Cityrsquos built environment more resilient to climate change and promote the health safety and prosperity of New Yorkers
A GOALSThe primary goal of the Guidelines is to incorporate forward-looking climate change data in the design of all City capital projects The Guidelines provide a consistent methodology for engineers architects landscape architects and planners to design facilities that are resilient to changing climate conditions The Guidelines are to be used throughout the design processmdashduring capital planning initiation as a reference in requests for proposals (RFPs) during a conceptual or study phase through to final designmdashfor all new construction and substantial improvements of City facilities
IA GOALS
1 Though the intensity and frequency of storms is expected to increase firm projections on future wind conditions have not yet been developed NYC commenced a study in 2017 to assess projected changes to extreme wind hazards and identify risks to the cityrsquos built environment
2 To learn more about 80 x 50 visit httpwww1nycgovsitesustainabilitycodes80x50page
I INTRODUCTION
The Guidelines provide step-by-step instructions on how to supplement historic climate data with specific regional forward-looking climate change data in the design of City facilities
NYC Mayorrsquos Office of Recovery and Resiliency Climate Resiliency Design Guidelines
5IB CLIMATE CHANGE PROJECTIONS FOR NEW YORK CITY
A successful resiliency strategy is one that provides co-beneficial outcomes reduces costs over the life of the asset wherever possible and avoids negative indirect impacts to other systems Resilient design should not exist in a silo but rather be a well-integrated part of existing processes and address other goals of the City For example these resilient design choices should be made in the context of the Cityrsquos capital planning risk management and financial planning Similarly resilient design choices should be selected to maximize the efficacy and efficiency of investments Some ways this can be done include 1) integrating ldquosoftrdquo resiliency strategies (operational measures or investments in green infrastructure) and ldquohardrdquo resiliency strategies (built or intensive investments) 2) addressing multiple climate hazards with single interventions and 3) reducing climate change risk in concert with other goals (eg energy efficiency or reduction in greenhouse gas emissions) These Guidelines were developed by the Mayorrsquos Office of Recovery and Resiliency (ORR) in close collaboration with City agencies that are involved in the design or management of capital projects A Design Guidelines Working Group was convened to consult on the development of the Guidelines which included more than 15 City agencies3 A preliminary version (10) of these Guidelines was issued in April 2017 and was tested and validated through an extensive review with internal and external climate and design experts Version 20 has been updated to reflect lessons learned through that analysis
B CLIMATE CHANGE PROJECTIONS FOR NEW YORK CITY
The New York City Panel on Climate Change (NPCC) provides regional climate change projections that inform City resiliency policy Composed of leading scientists the NPCC prepares projections for the metropolitan region which have shown that extreme weather will increase in frequency and severity and that the climate will become more variable These projections are divided across future time slices including the 2020s 2050s 2080s and 2100 The most NPCC recent climate change projections from 2015 encompass a wide range of possible outcomes for example
bull Mean annual temperature is projected to increase between 41 and 66degF by the 2050s and between 53 and 103degF by the 2080s4
bull Frequency of heat waves is projected to triple by the 2050s to 5 to 7 heat waves per year and 5 to 8 heat waves per year by the 2080s5
bull Mean annual precipitation is projected to increase between 4 to 13 by the 2050s and between 5 to 19 by the 2080s6
bull Sea level is expected to continue rising by another 11 to 21 inches by the 2050s and by 18 to 39 inches by the 2080s7
This document provides specific guidance on how to use the range of climate change projections in design For more information on climate change projections for the metropolitan region see Appendix 2 The NPCC continues to study and refine projections for the metropolitan region and these Guidelines will be updated as new reports are released by the NPCC
3 Representatives from the following City departments and agencies contributed to the creation of this document Environmental Protection Transportation City Planning Buildings Design and Construction Parks and Recreation Emergency Management School Construction Authority City Administrative Services Health and Hospitals Information Technology and Telecommunications Economic Development Corporation Housing Authority Public Design Commission Mayorrsquos Office of Sustainability Mayorrsquos Office of the Chief Technology Officer Housing Preservation and Development Office of Management and Budget Sanitation and Law
4 Ranges for heat reflect the middle and high range estimates from the NPCC See Appendix 2 for more information5 Ibid6 Ranges for precipitation reflect the middle and high range estimates from the NPCC See Appendix 2 for more information7 Ranges for sea level rise reflect the middle range estimates from the NPCC See Appendix 2 for more information
NYC Mayorrsquos Office of Recovery and Resiliency Climate Resiliency Design Guidelines
6IC PLANNING ACROSS PROJECT USEFUL LIFE ID MANAGING UNCERTAINTY
C PLANNING ACROSS PROJECT USEFUL LIFEA resilient facility is one built to withstand or recover quickly from natural hazards Climate conditions will continue to change over time which makes considering the useful life important for choosing the right level of protection8 Users should using professional knowledge and examples from the built environment estimate the full useful life of the facility to determine necessary design adjustments tied to climate change (useful life starts at the end of construction) The full project useful life of a facility is typically a longer period than the design life and more accurately represents the extended service life of most types of facilities (assuming regular maintenance) For example an administrative building may have a design life of 30 years but in practice such buildings remain in use for 50 years or more when well-maintained Full useful life is also met through the successful deployment of design strategies that minimize operations and maintenances (OampM) and the need for renovations ORR and Department of Design and Construction (DDC) with input from other City agencies are developing a library of common asset types for buildings landscapes infrastructure and equipment and assessing their typical design and useful lives This resource will be added as an addendum to the Guidelines by April 2019
D MANAGING UNCERTAINTYClimate change projections from the NPCC are the product of state-of-the-art modeling and analysis However as with all projections there is uncertainty embedded within them9 The NPCC continues to develop review and synthesize the latest climate data for the metropolitan region and new findings will be incorporated into future versions of these Guidelines
Given uncertainty flexible adaptation pathways provide a useful iterative approach for managing uncertainty and designing resilient facilities particularly those with a useful life that extends over 50 years - beyond which the uncertainty of projections increases10 Adaptation pathways are particularly useful for expensive long-lived and highly complex projects They provide a way to balance uncertainty with cost as well as manage operational and maintenance constraints A facility can be engineered with an adaptable protection level which reduces the hazard risk to acceptable levels for part of its useful life and that can be re-evaluated as risk levels change
8 NIST Community Resilience Planning Guide for Buildings and Infrastructure Systems Vol 1 NIST Special Publication 1190 US Department of Commerce 2016
9 PlaNYC A Stronger More Resilient New York report of the NYC Special Initiative for Rebuilding and Resiliency Report June 11 2013 page 28 From that report ldquoLike all projections the NPCC projections have uncertainty embedded within them Sources of uncertainty include data and modeling constraints the random nature of some parts of the climate system and limited understanding of some physical processes The NPCC characterizes levels of uncertainty using state-of-the-art climate models multiple scenarios of future greenhouse gas concentrations and recent peer-reviewed literature Even so the projections are not true probabilities and the potential for error should be acknowledgedrdquo
10 To learn more see Chapter 2 in the NPCC 2010 report Climate Change Adaptation in New York City available at httponlinelibrarywileycomdoi101111nyas20101196issue-1issuetoc
Figure 1 - Example of a flexible adaptation pathway for an outdoor emergency generator and platform
An illustrative example of using flexible adaptation
NYC Mayorrsquos Office of Recovery and Resiliency Climate Resiliency Design Guidelines
7IE PROJECT-SPECIFIC CONSIDERATIONS
pathway on a facilitiesrsquo component is explained in Figure 1 It shows an emergency generator with an approximate useful life of 25 years located outside a building In order to incorporate the Guidelines into design it is recommended that the foundation of the generator structure is designed to match the useful life of the building which can vary between 50-70 years that the generator serves Assuming the generator is subject to flooding risk from sea level rise and coastal surge it should be built on an elevated concrete slab that matches the future year design flood elevation (DFE) scenario corresponding to the end of the generatorrsquos useful life The generator must be replaced when it reaches the end of its useful life which is typically far less than that of the building When the replacement generator is installed the concrete slab is further elevated to accommodate the future DFE The foundation of the generator and the columns are designed to support the additional future load from the concrete slab Thereby the initial investment into the foundation can be used to adapt in the future allowing for future flexibility and avoided costs
Adaptation pathways may not apply equally to all types of projects or climate change projections Facility flood defenses for example may be more easily developed through an adaptation pathway than heat-vulnerable materials or below grade drainage systems For this reason the Guidelines use the middle of the 25th to 75th percentile range projections for sea level rise (see Table 4) and the high-end 90th percentile projections for heat (see Table 1) For precipitation these Guidelines recommend using the existing 50-year storm data as a proxy for the projected high-end 5-year storm (see Section IIIB and Figure 4 for more details)
Uncertainty can be further addressed through risk management Some facilities such as those that are critical or cost more than $50 million for design and construction will benefit from a full climate change risk assessment (see examples in Appendix 7) This assessment will evaluate protecting the facility to a potentially higher level of sea level rise than the recommended height in these Guidelines The City plans to develop a process for integrating climate change data into existing risk management processes by April 2019 If engaging in a climate change risk assessment process please contact ORR at ResilientDesigncityhallnycgov
E PROJECT-SPECIFIC CONSIDERATIONSExisting information and requirements specific to different kinds of projects must be reviewed on a case-by-case basis when evaluating resiliency design strategies Refer to Appendix 5 for an example approach of how to make resiliency planning and design decisions and discuss these considerations as a project team to determine which apply and how to respond
bull Financing requirements if the project is federally-funded or receives recovery funding discuss with the funding agency if certain protection standards or cost-benefit analyses are required For example FEMA requires specific flood protection standards for critical facilities and non-critical facilities
bull Interdependencies consider how hazards impact interdependencies across sectors as well as the risks from coincident events (eg extreme precipitation occurring during an extreme surge event) to specific projects
bull Existing hazard mitigation projects and risk studies evaluate if nearby or associated projects have already been assessed for climate change risks Identify if
NYC Mayorrsquos Office of Recovery and Resiliency Climate Resiliency Design Guidelines
8IE PROJECT-SPECIFIC CONSIDERATIONS
any studies have been conducted that could inform design (eg local flood modeling with sea level rise) This may inform the climate change risk assessment or provide insights into site specific conditions and design options A map that catalogs NYC resiliency projects is located here httpsmapsnycgovresiliency
bull Agency-specific resiliency design standards refer also to resiliency guidelines provided by various City agencies (eg Parkrsquos Design and Planning for Flood Resiliency11) Agency guidelines build on the climate data provided in these Guidelines by providing specific design alternative and insights relevant to those agencies
bull Limitations the Guidelines do not describe or encompass all City resiliency policies To learn more about how the City plans for a resilient future see the latest OneNYC plan as well as the 2013 report A Stronger More Resilient New York Related resiliency issues are being addressed by the City but are out of the scope of these Guidelines including neighborhood and regional-level climate change risk management and zoning
bull Further questions Contact ORR at ResilientDesigncityhallnycgov
11 Available at httpswwwnycgovparksorgplanning-and-buildingplanningresiliency-plansflood-resiliency
NYC Mayorrsquos Office of Recovery and Resiliency Climate Resiliency Design Guidelines
9IIA INCREASING HEAT
All City of New York capital projects should be designed to withstand increasing heat and precipitation based on the useful life of the asset while design interventions for storm surge and sea level rise depend on the projectrsquos proximity to the floodplain useful life and criticality In order to support design team efforts to generate resilient design responses (ie adjustments to base projects) these Guidelines provide climate change projections and recommend design adjustments or interventions in response to increasing heat increasing precipitation and sea level rise The Guidelines recommend designing to loads beyond the minimum requirements in the prevalent NYC local codes Design teams should consider project benefits and additional costs to incorporating resilient design standards before finalizing project design
A INCREASING HEATUse this section to determine how to adjust a facilityrsquos design to account for increasing temperatures and to reduce the facilityrsquos contribution to the Urban Heat Island effect Heat reduction levels will be determined by the function location and useful life of the asset
BackgroundThe impacts of heat on NYC are well established Every summer over 100 New Yorkers die from causes exacerbated by extreme heat12 The region has seen a steady increase in the number of days above 90degF and temperatures are projected to keep rising worsening heat-related mortality By the 2050s the number of days at or above 90degF is expected to double and the frequency and length of heat waves will triple to an average 6 heat waves per year13 Certain areas of NYC already experience higher temperatures relative to other parts of the city and these hot spots will be exacerbated by climate change (see Figure 2)
12 OneNYC The Plan for a Strong and Just City (The City of New York 2015) 228 See also Madrigano J Ito K Johnson S Kinney PL Matte T 2015 A case-only study of vulnerability to heat wavendashrelated mortality in New York City (2000ndash2011) Environmental Health Perspectives 123672ndash678 httpwwwnycgovhtmlonenycdownloadspdfpublicationsOneNYCpdf
13 Horton et al New York City Panel on Climate Change 2015 Report Chapter 1 Climate Observations and Projections Ann NY Acad Sci ISSN 0077-8923 New York 201514 LANDSAT Thermal Data from 8182009
Figure 2 - Thermal imagery of New York City based on LANDSAT Thermal Data from 818200914
II INTERPRETING CLIMATE CHANGE DATA FOR RESILIENT DESIGN ADJUSTMENTS
NYC Mayorrsquos Office of Recovery and Resiliency Climate Resiliency Design Guidelines
10IIA INCREASING HEAT
In Cool Neighborhoods NYC the City prioritizes strategies to study the Urban Heat Island effect and make targeted investments that benefit communities most vulnerable to heat15 New Yorkers are more or less vulnerable to heat based largely upon socio-economic factors including age income location tree coverage and the percentage of dark surfaces The NYC Department of Health and Mental Hygiene (DOHMH) developed a Heat Vulnerability Index (HVI) which highlights parts of the city where more residents face an increased risk of heat-related mortality Their vulnerability is due to their exposure and socio-economic conditions that determine their
Figure 3 - Heat Vulnerability Index (HVI) for New York City Community Districts (Source NYC DOHMH 2015) This analysis identifies physical social and economic factors associated with increased risk of heat-related morbidity and mortality17
The Guidelines recommend that project designers consider two aspects of the relationship between their project and increasing heat the way their project reduces the Urban Heat Island effect and the impact that increasing heat will have on the physical components of their project itself
bull Reduce Urban Heat Island effect materials in the built environment absorb the sunrsquos heat throughout the day and re-radiate it back into the atmosphere driving localized temperatures higher and increasing demands on cooling systems Air conditioning and ventilation equipment also push extra heat into the air contributing to a feedback loop that increases localized ambient temperatures and impacts the health of heat-vulnerable New Yorkers This section provides guidance on how new capital construction can reduce the contribution to ambient heat in the city
bull Minimize impact from increasing heat increasing heat can physically impact components of buildings and infrastructure damaging or stressing materials electrical systems and mechanical systems Rising temperatures will also stress energy and communications networks that buildings and other infrastructure rely upon18 This section provides climate data to be used to adjust and adapt heat-vulnerable components of assets
15 OneNYC 22816 To learn more about Heat Vulnerability Index see page 229 of OneNYC at httpwwwnycgovhtmlonenycdownloadspdf
publicationsOneNYCpdf17 See page 229 in the OneNYC plan to learn more about HVI18 Damiano H et al NYCrsquos Risk Landscape A Guide to Hazard Mitigation (NYC Emergency Management 2014) 103
Heat can be lethal for all but its impact on New Yorkers is not equal
sensitivity to heat Community districts in red and orange in Figure 3 are areas of highest vulnerability and these are particularly concentrated in east Brooklyn the south Bronx northern Manhattan and southeast Queens16 While all new capital projects should address heat impacts those sited in moderate to high vulnerable HVI areas should implement multiple strategies to reduce the Urban Heat Island and help address the high vulnerability in these neighborhoods
NYC Mayorrsquos Office of Recovery and Resiliency Climate Resiliency Design Guidelines
11IIA INCREASING HEAT
1 Urban Heat Island reductionNew capital construction should minimize its contribution to the Urban Heat Island effect The design interventions provided below offer benefits to the community and the facility through reduced heat loading reduced energy costs andor improved occupant health and thermal comfort The appropriate combination of design interventions will vary dependent on the project scope
a) Increase the solar reflectance of surfaces by utilizing light-colored pavement coatings and materials in combination with shading with a minimum target of 50 of the non-structure areas of facility sites19
Lighter reflective surfaces help reduce the Urban Heat Island effect heat loading and internal building temperatures and extend the lifespan of rooftops and heating ventilation and air conditioning (HVAC) equipment The City has taken steps towards reducing ambient temperatures such as implementing the NYC Cool Roofs program20 New buildings as well as existing buildings with roofs going through significant repairs are required by law to paint their roofs white This program intervention reduces a buildingrsquos contribution to Urban Heat Island effect and provides energy savings by coating the normally dark concrete roof surface with white paint allowing the roof to reflect solar radiation
b) Increase the shading of surfaces by planting trees or other vegetation in combination with cool pavements with a minimum target of 50 of the non-structure areas of facility sites
Shady areas with heat- and in coastal areas salt-tolerant vegetative species can help keep buildings cool and provide energy savings as well as lower temperatures
c) Meet Climate Zone 6 standards for fenestration and insulation (See Section ECC C402 in Chapter C4 of the 2016 NYC Energy Code) to improve efficiency of building envelopes
NYC is currently in Climate Zone 4 NYC already requires that small residential building envelopes are designed to meet higher insulation and fenestration requirements to improve energy efficiency21 All City capital projects including non-residential facilities should meet this standard
d) Select greenblue roofs andor other appropriate landscape elements that maximize cooling with help of landscape architects
The City already encourages the use of green and blue roofs on buildings to reduce the Urban Heat Island effect22 provide stormwater management and increase the useful life of the roof Besides replacing dark roof surfaces green roofs and vegetation also provide shade and keep the air cool through evapotranspiration by releasing moisture into the atmosphere Blue roofs coupled with light colored roofing material can provide stormwater management and rooftop cooling Some of these designs support the shading and solar reflectance goal in Step a) above Additionally City capital projects are subject to Leadership in Energy and Environmental Design (LEED) certification and green roofs can earn LEED credits23 Projects should integrate cooling strategies listed below based on project scope and a balance between costs and benefits
bull Green roofs or blue roofs on a broader range of facilities (including industrial buildings storage garages administration buildings etc)
19 Urban Green Council (2010) Green Codes Task Force Proposed code ldquoEF 12 Reduce Summer Heat with Cool Shady Building Lotsrdquo20 Local Law No 21 (2011) amended Chapter 12 of the NYC Building Code to update roof coating standards Also
see Cool and Green Roofing Manual (DDC) 2007 for more information on NYC standards for cool and green roofs httpwwwnycgovhtmlddcdownloadspdfcool_green_roof_manpdf
21 Read more about the code here httpswww1nycgovsitebuildingscodes2016-energy-conservation-codepage22 See Cool and Green Roofing Manual (DDC) 2007 for more information on NYC standards for cool and green roofs
httpwwwnycgov htmlddcdownloadspdfcool_green_roof_manpdf23 See Local Law No 32 (2016) for more information
NYC Mayorrsquos Office of Recovery and Resiliency Climate Resiliency Design Guidelines
12
2 Minimize impact from increasing heatThis section provides information to support making design adjustments to capital projects to reduce impacts to equipment structures landscapes and materials from rising average temperatures and increasing extreme heat events
a) Review forward-looking climate data provided in Table 1 and Table 2 Select heat projections according to the useful life of the facility and its primary
components then evaluate and address impacts in the steps below Table 1 provides design criteria for average temperatures and incidents of extreme heat events projected to different time periods across the 21st century Table 2 provides guidance on future 1 Dry Bulb Temperature and Cooling Degree Days for the NYC area The 1 Dry Bulb Temperature represents the ambient air temperature
IIA INCREASING HEAT
bull Vegetated structures such as shade trees and planters (to reduce heat loading on horizontal or vertical surfaces)
bull Bioswales rain gardens and bioretention24 bull Maximize planted permeable surfacesbull Other permeable surfaces (used for stormwater management these retain
moisture that evaporates as surface temperatures rise)25 bull Open-grid pavement system (at least 50 unbound)26 bull Evaluate site planning and building massing with regard to solar gainbull Solar panels for shading and to generate energy
Table 1 ndash Baseline and projected extreme heat events27
End of useful life
heat waves per year (3 or more consecutive days with max temperatures at or above 90degF)
days above 90degF
Annual average temperature
Baseline (1971-2000) 2 18 54degF
Through to 2039 4 33 572degF
2040-2069 7 57 606degF
2070-2099 9 87 643degF
Table 2 ndash Projections for 1 Dry Bulb temperature and Cooling Degree Days
Change in projected value for 2050s
Variable Baseline for Central Park (1971-2000)
Low estimate (10th percentile)
Middle range (25th to 75th percentile)
High estimate (90th percentile)
1 Dry Bulb temperature 91degF +3degF +4-6degF +7degF
Cooling Degree Days (base = 65degF) 1149 +37 +46-73 +87
Note Due to HVAC system typical useful life of 25 years or less only projections for the 2050s are shown Projections for the 2020s are not shown because it is anticipated that enough of a safety margin is employed already in current systems to withstand the temperature rise expected through the 2020s The NPCC is currently working on projections of 1 Wet Bulb temperatures which are expected to increase and may require systems to have higher moisture reducing capacity in addition to the enhanced cooling capacity
24 When siting bioswales consider groundwater levels and soil permeability and ensure that the site is not contaminated from past or present land uses A high water table may prohibit some applications
25 Urban Green Council (2010) Green Codes Task Force Proposed code ldquoSW 1 REDUCE EXCESSIVE PAVING OF SITESrdquo26 LEED Neighborhood Development v4 ldquoHeat island reductionrdquo credit27 Projected estimates for average temperatures are based upon 90th percentile change factor added to the baseline average annual
temperature from New York City Panel on Climate Change (2015)
NYC Mayorrsquos Office of Recovery and Resiliency Climate Resiliency Design Guidelines
13IIA INCREASING HEAT
b) Evaluate potential impacts on systems and materials Heat impacts on a facility are highly contingent on the facility type and should be reviewed on a case-by-case basis28 A decrease in the useful life or operational capacity of a facility or components of a facility may occur due to rising temperatures Interventions will also vary depending on whether the project is a new capital investment or a substantial improvement to an existing facility Factors to evaluate as applicable to project scope include but are not limited to
bull Thermal expansion warping softening or other forms of material change or degradation of structural integrity occurring at an accelerated rate by excessive heat
bull Health and safety impacts on occupants vulnerable to heat bull Increased failure or reduced efficiency of electrical or mechanical systems bull Prioritization of critical loads for systems and components at the facility andbull Moisture control needs for buildings with a higher standard for fenestration and
insulation
The results of this evaluation will inform steps taken in the step below
c) Reduce heat impacts Review and implement specific changes to the facility design based on assessments
above Develop a strategy based on the specific type of facility its operational profile and its useful life A Design Strategies Checklist is available for use in Appendix 6 as a resource to track design approaches Specific areas of focus are
bull Electricity outages High temperatures drive demand for air conditioning and can increase the risk of facility equipment failure potentially broader grid disruptions or brownouts2930 To manage this risk design City buildings and infrastructure to withstand periods without electricity using the following approaches in particular if they provide critical or essential services
Ǯ Identify and assess how much of the facilityrsquos load is critical (eg ldquocritical loadrdquo) including the necessary duration of the backup power supply (eg is backup power needed for 8 hours or multiple days) Determining what loads are critical and how long they should be powered for is essential for a facilityrsquos operations and what the role of the facility will have in an emergency situation31
Ǯ Depending on the size of the critical load and budget different backup power supply options could range from backup generators (eg diesel natural gas) to hybrid systems (eg solar + battery storage + appropriately sized generator) Each option has different trade-offs that should be considered in terms of cost feasibility and environmental impacts For shorter duration needs andor smaller critical loads buildings with existing solar systems should consider adding storage to provide a resiliency benefit In some cases co-generation systems may make sense from an economic and resiliency perspective especially if there
28 Sector- and facility-specific impacts vary greatly For examples of sector-specific impacts and design responses see Flooded Bus Barns and Buckled Rails (FTA 2011) and Ready to Respond Strategies for Multifamily Building Resilience (Enterprise Green Communities 2015)
29 McGregor et al (2013) Two Degrees The Built Environment and Our Changing Climate Routledge Press30 High temperatures also increase energy demand which can increase fossil fuel based greenhouse gas emissions31 The key roles of the facility that need to be identified are operational hours number of occupants and electrical loads needed for the
desired operations Electrical equipment and appliances for the desired operations may include - but are not limited to - safety lighting life-supporting systems fire protection systems telecommunications equipment mechanical systems to mitigate extreme temperatures and computing equipment Every facility is unique Operational characteristics and load profiles need to be established prior to sizing the equipment required to keep the facility in operational mode
NYC Mayorrsquos Office of Recovery and Resiliency Climate Resiliency Design Guidelines
14IIA INCREASING HEAT
is a significant heating andor cooling load in addition to electricity demand32
Ǯ Depending on the option assess need to invest in internal electricity rewiring and building energy management systems (eg switches reconfiguration of distribution infrastructure to isolate critical loads from non-critical loads and the ability to island from the broader grid during the event of a larger disruption software and hardware to manage the deployment of hybrid systems) andor need for external hookups for temporary generators and boilers33
bull Failure in facility ventilation electrical and air conditioning systems Some systems designed to meet the requirements of past climate may overheat and fail during extreme events Some design interventions include34
Ǯ Selecting systems with higher heat tolerance Ǯ Adding Energy Recovery Ventilation systems Ǯ Providing additional or redundant ventilation systems either mechanical or
natural to cool electrical equipment Ǯ Optimizing building layout by
bull segregating temperature sensitive electronics and computer control system from other systems
bull placing heat generating equipment like transformers and switchgear outdoors where permitted and
bull splitting the facility cooling loads among different HVAC systems in facility for redundancy and better zone control
bull Passive solar cooling and ventilation There are numerous design features that provide passive solar cooling for buildings to help maintain lower internal ambient temperatures with less air conditioning These features also help keep facilities habitable during extended grid failures when generators fail or must be reserved for critical functions Some design features include35
Ǯ Appropriate east-west orientation Ǯ Passive ventilation design Ǯ Vertically stacked double skin facades Ǯ Exterior window shades Ǯ Light colored exteriors Ǯ Shaded arcades Ǯ Thermally massive materials Ǯ High performance glazing Ǯ Operable windows
32 To learn more see the Building Resiliency Task Force report from Urban Green Council (2013)33 Ibid 34 Flooded Bus Barns and Buckled Rails FTA Office of Budget and Policy 201135 These and other examples are found in McGregor et al (2013) Two Degrees The Built Environment and Our Changing Climate
Routledge Press Also see Flooded Bus Barns and Buckled Rails FTA Office of Budget and Policy 2011
NYC Mayorrsquos Office of Recovery and Resiliency Climate Resiliency Design Guidelines
15IIB INCREASING PRECIPITATION
B INCREASING PRECIPITATIONThe intensity and frequency of precipitation events are projected to increase with climate change creating new challenges for stormwater management and impacts to the built environment such as
bull The potential for greater frequency of stormwater management systems being overwhelmed36
bull More frequent and severe flooding of buildings and infrastructure in areas across the city and
bull Greater variability in rainfall events annually including the chance of drought
The goal for this section is to guide stormwater management approaches including infiltration increases in on-site storage volume and where possible increases in sewer capacity to account for precipitation increases associated with climate change Designers should develop and consider design interventions that would decrease site contribution to sewer in-flows beyond the existing NYC Building Code requirements Given its complexity the Department of Environmental Protection (DEP) is also evaluating climate impacts to the sewer system on a drainage-wide level Proactive design such as increasing on-site infiltration and storm water retention can contribute to system resiliency on a site-specific basis
BackgroundNYCrsquos drainage systems are designed to handle approximately the current 3-year intensity-duration-frequency (IDF) event in most areas of the city where sewers were built prior to 1970 In locations with sewers built after 1970 the capacity was built to handle the 5-year event NYCrsquos network of drainage systems can experience flooding above those thresholds due to widespread precipitation events or by localized intense storms (sometimes called ldquocloudburstsrdquo) causing flooding and backups Climate change projections indicate that flooding resulting from multiple types of precipitation events may increase in frequency This increasing probability is forecast for all types of precipitation events in NYC although there is greater uncertainty around future short duration events Relying on sewers alone to manage extreme precipitation events will not be sufficient in a changing climate The City plans to reduce impervious areas and provide additional storage capacity to reduce flood damage For managing stormwater from larger storms such as at the 50- and 100-year recurrence intervals DEP is increasingly considering the role of streets and open space in managing flow this is referred to as a dual drainage design approach The City is piloting projects to test this dual drainage approach
Another set of interventions include Bluebelt best management practices (BMPs) such as constructed wetlands storm water ponds and stream restorations that emulate pre-development conditions to manage large volumes of water and green infrastructure37 which in NYC have generally been designed to reduce flooding and combined sewer overflow respectively They are not typically sized to manage precipitation events of the same magnitude as sewers which serve as primary drainage conveyance However Bluebelt BMPs green infrastructure and other stormwater management tools may provide an additional buffer for larger storm events by temporarily storing andor infiltrating runoff that would otherwise be directed into the sewer system For instance areas of open space commonly found in NYC may not provide adequate environments for trees and other plantings However in these cases other types of green infrastructure like permeable surfaces and subsurface detention and retention installations would still be considered feasible
36 NYC is already taking steps to address this problem which will worsen with climate change To learn more about how NYC is using green and gray infrastructure to manage stormwater visit httpwwwnycgovhtmldephtmlstormwaterindexshtml
37 NYC DEP NYC Green Infrastructure Program
NYC Mayorrsquos Office of Recovery and Resiliency Climate Resiliency Design Guidelines
16IIB INCREASING PRECIPITATION
The City led by DEP continues to develop its options for managing heavier storm events due to climate change DEP is examining approaches to evaluate sea level rise and rainfall intensity for stormwater management and where possible sewer capacity These efforts will integrate forward-looking climate data into the design of these capital assets and the compounding factors of heavier rain storms and sea level rise will likely require greater infiltration and on-site storm water retention capacity Agencies and consultants should work directly with DEP to develop strategies on a given site necessary to meet expected increases in rainfall intensities and frequencies
1 Precipitation design adjustment for on-site stormwater systems
Based upon the design storm required for the City facility in design follow the steps below and review recommended design interventions
a) Identify the duration of the design event required The current 50-year IDF can be used as a proxy for the future 5-year storm
(projected for the 2080s) Design on-site detentionretention systems to retain the volume associated with the current 50-year IDF curve (see Figure 4 below) Design the on-site system to release at the maximum rate as specified in 15 Rules of the City of NY (RCNY) Chapter 3138
b) Conduct sensitivity analysis Compare the retentiondetention required for the current 5-year IDF versus the
38 Refer to existing codes and standards as well when determining the existing required storm as NYC requires different sizes of design storms for infrastructure and buildings For example NYC Plumbing Code Chapter 11 and Title 15 of the Rules of the City of New York Chapter 31
02
04
06
10
20
40
60
100
200
-2316090
Rai
nfal
l Int
ensi
ty (
inch
es p
er h
our
)
DurationsruoHsetuniM
5 10 15 30 1 2 3 6 12 18
5-yr
10-yr25-yr
50-yr
100-yr
NEW YORK NEW YORK
Figure 4 - Current Intensity-Duration-Frequency Precipitation Curve for NYC adapted from US Department of Commerce Weather Bureau Technical Paper 25
NYC Mayorrsquos Office of Recovery and Resiliency Climate Resiliency Design Guidelines
17IIB INCREASING PRECIPITATION
c) Identify design interventions for managing increased precipitation40 There are different ways to manage stormwater better and avoid urban flooding after
intense rain Choose the right combination of interventions after considering the site location operational requirements cost benefits and useful life of the intervention Some examples of design interventions are
bull Minimize increases in impervious surfacebull Utilize strategies that infiltrate evaporate or reuse rainwater to achieve storm
water volume reductions Then choose strategies that detain (delay drainage) to manage the rate of the storm water flow into the Cityrsquos drainage system
bull Install stormwater infiltration detention and storage (eg bioswales41 green roofs blue roofs and other blue or green infrastructure storage basins or tanks)
bull Protect areas below grade from floodingbull Keep catch basin grates clearbull When implementing perimeter protections ensure that interior water
management is also accounted for andbull Explore interventions to protect underground utility and telecommunications
infrastructure from water damage
d) Use appropriate DEP guidelines to perform the above tasks using the higher design storm
The three currently prescribed DEP guidelines are as follows
bull Guidelines for the Design and Construction of Stormwater Management Systems July 201242
bull Criteria for Detention Facility Design November 201243 bull DEP Site Connection Proposal Application and Guidelines44
Note on stormwater standards As DEP updates stormwater standards and develops specific tools to evaluate impacts of increased precipitation and drainage strategies for on-site storm water management these changes will be reflected in future versions of these Guidelines However it is recommended that the designer should develop and consider design interventions that would increase the on-site storage beyond the existing requirements Also a methodology is under development that will establish a consistent citywide process for addressing legal grade which will have further implications for how extreme precipitation is managed
39 NYC DEP Standards for Stormwater Release Rates available at httpwwwnycgovhtmldephtmlenvironmental_reviewsstormwater_release_ratesshtml 40 Also see DEP Guide to Rain Event Preparedness at httpwwwnycgovhtmldeppdfbrochuresflood-preparedness-flyerpdf and
Ready to Respond Strategies for Multifamily Building Resilience at httpwwwenterprisecommunityorgresourcesready-respond-strategies-multifamily-building-resilience-1335641 When siting bioswales consider groundwater levels and soil permeability and ensure that the site is not contaminated from past or
present land uses A high water table may prohibit some applications42 Available at httpwwwnycgovhtmldephtmlstormwaterstormwater_management_constructionshtml43 Available at httpwwwnycgovhtmldeppdfwater_sewer30_criteria_for_detention_facility_design_06062012pdf44 Available at httpwwwnycgovhtmldeppdfwater_sewer24pdf
current 50 year IDF to determine the cost and benefits associated with complying with these Guidelines Use the Evaluation of Project Benefits section below and Appendix 4 for guidance on how to identify and assess benefits Given the results of the costbenefit analyses review the added benefit of designing retentiondetention using greater magnitude storms (eg 100-year) or lower (eg 25-year) The goal is to maximize retentiondetention capacity given site and cost constraints as well as through an evaluation of the benefit of adding capacity to detainretain water for larger storm events
NYC Mayorrsquos Office of Recovery and Resiliency Climate Resiliency Design Guidelines
18
2 Incorporating climate change projections into DEP drainage planning
The first line of defense for managing intense precipitation events does not require changes to the sewer system as described above For drainage and wastewater infrastructure planning in a changing climate the sewer network and wastewater infrastructure should be qualitatively evaluated from the upstream pipes to the regulator chambers pump stations interceptors and ultimately to the downstream outfall to determine the feasibility of incorporating climate change projections into the system design For DEP storm sewer projects FY 2021 or later in separately sewered drainage areas where the design is in the early stages and there is free discharge the agency will evaluate the feasibility of revising the design to incorporate climate projections into the design If the project (including the prescribed changes) passes the costbenefit analysis then DEP will consider incorporating climate change projections into the sizing However changes in one part of the system must be carefully evaluated For example any upsizing of the regulator chamber or the high point of the system can negatively impact the design and operation of the wastewater infrastructure and residencesbusinesses on the system and can lead to a diminished the level of service
DEP is in the process of developing a hydrologic and hydraulic (HampH) model to estimate runoff flow for future climate scenarios and is evaluating rainfall hyetographs for the existing and future rainfall scenarios to be included in the drainage planning process In addition DEP currently coordinates with ORR for drainage planning as a part of coastal resiliency projects A more detailed methodology to incorporate climate change projections into drainage planning will be developed for version 30 of the Climate Resiliency Design Guidelines to be released in April 2019
IIB INCREASING PRECIPITATION
NYC Mayorrsquos Office of Recovery and Resiliency Climate Resiliency Design Guidelines
19IIC SEA LEVEL RISE
non-critical components within a larger facility or campus (eg at a maintenance yard differentiate between structures and equipment) Critical components essential to the facilityrsquos functionality should be protected to the higher standard for criticality even if the facility itself may be non-critical Some examples of critical components include electrical distribution and switching areas motor-control centers chemical feed equipment boilers communications systems monitoring and safety equipment HVAC units fire alarms and suppression equipment furnaces elevators emergency fuel supplies emergency generators and hazardous material storage Component protection should also be evaluated if a facility is expected to be fully operational during a flood event or if it is expected to quickly resume full operations after an event
For buildings and infrastructure with a long useful life it is not always cost effective or operationally feasible to design a facility to be resilient to hazards faced at the end of its useful life In these cases the most resilient design will be one that provides extra protection against hazards in the initial decades while also leaving open design alternatives for updating resiliency measures as new data is provided or new risk assessments are completed This flexible adaptation pathways approach builds in options to protect assets later in life as demonstrated in an example shown in Figure 1 (in Section I)
Other considerations to keep in mind includebull These Guidelines apply to all City capital projects except coastal flood protection
systems which are designed to different standards than those provided here for
C SEA LEVEL RISEThis section provides tools to 1) determine if the project will be subject to tidal inundation during its useful life due to sea level rise and 2) incorporate sea level rise into flood protection levels of capital projects For projects in the current and future 1 annual chance floodplains sea level rise-adjusted design flood elevations (DFE) are provided and reflect the criticality of the asset and its useful life Background NYC has experienced the devastation of coastal storms most recently during Hurricane Sandy Sea level rise is projected to increase the depth extent and frequency of flooding from storm surge45 Sea level rise will also regularly inundate some low-lying areas during high tides Current flood protection heights are determined by using the base flood elevation established by the FEMA Preliminary Flood Insurance Rate Map (PFIRM) 201546 and the standard of protection for buildings in the floodplain in Appendix G of the NYC Building Code47 These Guidelines augment existing requirements for two primary purposes ensuring City facilities built today incorporate sea level rise and critical assets (as defined in Table 4) are protected to a higher level It is important to note that all projects and design interventions must comply with NYC Building Code
Designers should differentiate between critical and
45 New York City Panel on Climate Change Report Chapter 2 Sea Level Rise and Coastal Storms (2015)46 However NYC Building code G10222 requires that designers review both the PFIRM and the effective FIRM and use the more
restrictive of the two 47 For information on the differences between FEMA FIRM PFIRM and the Cityrsquos forward-looking flood maps see Appendix 3
Critical components essential to the facilityrsquos functionality should be protected to the higher standard for criticality even if the facility itself is non-critical
NYC Mayorrsquos Office of Recovery and Resiliency Climate Resiliency Design Guidelines
20IIC SEA LEVEL RISE
buildings and other physical infrastructure Many of NYCrsquos coastal flood protection systems are currently being developed to comply with FEMA accreditation for flood levee systems48 The City plans to develop further guidance for designing coastal protection projects
bull For information on the differences between FEMA FIRM PFIRM and the Cityrsquos forward-looking flood maps see Appendix 3
bull Coincident stressors from sea level rise should also be considered For example bridge scour may increase as sea levels rise Similarly flooding during heavy rainfall events can be worsened due to higher tailwater conditions associated with high sea levels Be aware of how different risks may interact and how different interventions can be deployed to address multiple hazards or provide other co-benefits
bull Note projects that require discretionary approval are required to incorporate sea level rise projections as part of the NYC Waterfront Revitalization Program49 and
bull A methodology is under development that will establish a consistent citywide process for addressing legal grade which will have further implications for how sea level rise and precipitation are managed
For more information see Section IE Designers should use the resources and methods described in this section to 1) assess tidal inundation due to sea level rise and 2) address risks in the current and future floodplains
1 Assessing tidal inundation due to sea level riseTidal flooding currently affects parts of NYC and is projected to worsen as sea levels rise and inundate low-lying coastal sites during high tides When determining a site location or establishing scope of substantial improvements for other types of coastal facilities the project team will consider alternative sites outside of zones threatened with regular inundation if resiliency actions are not taken Some facilities such as wastewater treatment plants and harbor facilities need to be near the coast for operational purposes
a) Determine tidal inundation risk from sea level rise Use the Flood Hazard Mapper (httpwwwnycgovfloodhazardmapper)50 to see if your
site is in an area inundated from high tide plus sea level rise within the projectrsquos useful life For example if the useful life ends between 2040 and 2069 choose the 2050s High Tide map) Determine risk only from high tide and sea level rise separate from flood events Follow the instructions in Figure 5 and refer to the example in Figure 6 to review inundation at the end of an assetrsquos useful life
48 For more information please visit httpwwwfemagovfema-levee-resources-library49 For more information visit httpwwwnycgovwrp50 The Flood Hazard Mapper relies on publicly available data to present these map resources Users should also refer to FEMA and the
NPCC for official information
Figure 5 - Flood Hazard Mapper high tide plus sea level rise at httpwwwnycgovfloodhazardmapper
NYC Mayorrsquos Office of Recovery and Resiliency Climate Resiliency Design Guidelines
21IIC SEA LEVEL RISE
b) Address flood risk If the Flood Hazard Mapper shows that the facility is expected to be inundated by
high tides within its useful life or if primary access roads are at risk of inundation consider alternative site options
- OR - If the site is not expected to be regularly inundated by tides proceed to the next
section 2 Addressing Risks in the Current Floodplain
Note on calculating tidal inundations with sea level rise if a project team is interested in understanding the depth of tidal inundation given climate change projections follow these steps First determine the Mean Higher High Water (MHHW) elevation in feet-NAVD 8851 datum nearest to the site If the MHHW data is unavailable from a site specific survey refer to httpwwwnycgovwrp for a list of MHHW elevations (NAVD88) at tide stations across the city52 Second add the high estimate (90th percentile) of expected sea level rise (see Table 8 in Appendix 2) for the year corresponding to the facilityrsquos useful life to the MHHW to determine the projected depth of tidal inundation with sea level rise
51 North American Vertical Datum of 1988 (NAVD 88) is the vertical control datum of orthometric height established for vertical control surveying in the US based upon the General Adjustment of the North American Datum of 1988
httpswwwngsnoaagovdatumsvertical52 SLR elevations at httpwwwnycgovwrp are adjusted to account for sea level rise since the last tidal epoch If no other resource is
available to determine MHHW use the NOAA Online Vertical Datum Transformation tool to calculate the MHHW in feet-NAVD
Figure 6 - Flood Hazard Mapper with high tide in the 2020s (left) and in the 2080s (right) at httpwwwnycgovfloodhazardmapper
NYC Mayorrsquos Office of Recovery and Resiliency Climate Resiliency Design Guidelines
22IIC SEA LEVEL RISE
2 Addressing risks in the current floodplain53
A facility located in the current 1 annual chance floodplain (PFIRM 2015)54 will face increasing risk of flooding during its useful life due to sea level rise increasing the depth of coastal storms This section provides a process for adjusting the design flood elevation required by code to account for sea level rise
a) Find the location of the facility using the Flood Hazard Mapper (httpwwwnycgovfloodhazardmapper) and follow the instructions in Figure 7
bull Choose to view the layer ldquoFEMA Preliminary FIRM 2015rdquo bull Click on the facility site in the 1 floodplain to view the base flood elevation
Figure 7 - Flood Hazard Mapper with FEMA PFIRM (2015) at wwwnycgovfloodhazardmapper
b) If the facility is not in the current 1 annual chance floodplain (PFIRM 2015) proceed to the next section ldquo3 Addressing risks in the future floodplainrdquo
- OR - If the facility is in the current 1 annual chance floodplain (PFIRM 2015) note
the base flood elevation (BFE) and proceed to Step c) below Please note if a facility has multiple BFEs or if the site is partially in the 1 annual chance floodplain it is recommended to use the highest BFE as the current BFE for the entire site
c) Establish a sea level rise-adjusted DFE Use the current base flood elevation at your site the facilityrsquos useful life and its
criticality level to determine the design flood elevation using Table 4 (on the next page) as a basis of design
53 This process for adjusting the design flood elevation to account for sea level rise satisfies the criteria of the climate-informed science approach described at the state and federal level
54 FEMA updates its flood maps periodically As of April 2018 the most recent maps are the Preliminary Flood Insurance Rate Maps (PFIRM) available at DCPrsquos Flood Hazard Mapper (httpwwwnycgovfloodhazardmapper) Also note that NYC Building Code requires developers to use the PFIRM (2015) or the FIRM (2007) whichever is more restrictive For more information on these requirements please refer to Appendix G of the NYC Building Code Please note that the DCP maps are not official and all site locations should be confirmed with the official FEMA PFIRM NYC will provide information on the latest flood maps as they are updated
NYC Mayorrsquos Office of Recovery and Resiliency Climate Resiliency Design Guidelines
23IIC SEA LEVEL RISE
Table 4 - Determine the sea level rise-adjusted design flood elevation for critical and non-critical facilities55
Critical facilities
End of useful life Base Flood Elevation (BFE)56 in NAVD 88 + Freeboard57 + Sea Level Rise
Adjustment58= Design Flood Elevation (DFE) in
NAVD 88Through 2039 FEMA 1 (PFIRM) 24rdquo 6rdquo = FEMA 1 + 30rdquo
2040-2069 FEMA 1 (PFIRM) 24rdquo 16rdquo = FEMA 1 + 40rdquo2070-2099 FEMA 1 (PFIRM) 24rdquo 28rdquo = FEMA 1 + 52rdquo
2100+ FEMA 1 (PFIRM) 24rdquo 36rdquo = FEMA 1 + 60rdquoNon-critical facilities
End of useful life Base Flood Elevation (BFE) in NAVD 88 + Freeboard + Sea Level Rise
Adjustment = Design Flood Elevation (DFE) in
NAVD 88Through 2039 FEMA 1 (PFIRM) 12rdquo 6rdquo = FEMA 1 + 18rdquo
2040-2069 FEMA 1 (PFIRM) 12rdquo 16rdquo = FEMA 1 + 28rdquo2070-2099 FEMA 1 (PFIRM) 12rdquo 28rdquo = FEMA 1 + 40rdquo
2100+ FEMA 1 (PFIRM) 12rdquo 36rdquo = FEMA 1 + 48rdquoAdditional analysis should be conducted to incorporate wave action and wave run-up in DFE calculations especially in areas that are located within the FEMArsquos 1 annual chance Limit of Moderate Wave Action (LiMWA) zone Wave run up is the maximum vertical extent of wave uprush above surge
Definition of critical buildings and infrastructure for determining DFE in Table 4The criticality definitions below are for use in the application of the Guidelines only All items identified as critical in NYC Building Code Appendix G are critical in these guidelines however this list includes additional facilities that are not listed in Appendix G59 If a facility is not listed here it is considered non-critical for the purposes of determining freeboard
bull Hospitals and health care facilitiesbull Fire rescue ambulance and police stations and emergency vehicle garages bull Jails correctional facilities and detention facilities bull Facilities used in emergency response including emergency shelters emergency preparedness communication
operation centers communication towers electrical substations back-up generators fuel or water storage tanks power generating stations and other public utility facilities
bull Critical aviation facilities such as control towers air traffic control centers and hangars for aircraft used in emergency response
bull Major food distribution centers (with an annual expected volume of greater than 170000000 pounds)60 bull Buildings and other structures that manufacture process handle store dispose or use toxic or explosive
substances where the quantity of the material exceeds a threshold quantity established by the authority having jurisdiction and is sufficient to pose a threat to the public if released61
bull Infrastructure in transportation telecommunications or power networks including bridges tunnels (vehicular and rail) traffic signals (and other right of way elements including street lights and utilities) power transmission facilities substations circuit breaker houses city gate stations arterial roadways telecommunications central offices switching facilities etc
bull Ventilation buildings and fan plantsbull Operations centersbull Pumping stations (sanitary and stormwater)bull Train and transit maintenance yards and shopsbull Wastewater treatment plantsbull Water supply infrastructurebull Combined-sewer overflow (CSO) retention tanksbull Fueling stationsbull Waste transfer stations and bull Facilities where residents have limited mobility or ability including care facilities and nursing homes
55 If an industry standard does not include freeboard in its flood protection standards for particular infrastructure assets then only consider the sea level rise adjustment when determining flood protection levels
56 Note that NYC Building Code requires developers to use the PFIRM (2015) or the FIRM (2007) whichever is more restrictive For more information on these requirements please refer to Appendix G of the NYC Building Code
57 These freeboard values reflect NYC Building Code Appendix G Table 2-1 which establishes the minimum elevation of the top of lowest floor Appendix G requires other freeboard values for other parts of structures and in different parts of the floodplain Refer to Appendix G for the appropriate freeboard and use that value in Table 4 above
58 The sea level rise figures provided are for the middle of the 25th-75th percentile range projections from the NPCC These values do not necessarily indicate the average of all models
59 The structural occupancy categories outlined in Appendix G of the NYC Building Code are the same as ASCE 7 used for structural design For critical buildings structural design should comply with ASCE 7 and 24 for design class IV
60 This threshold represents the median volume of main food distributors in NYC according to statistics collected as part of the Five Borough Food Flow study in 2016 available at
httpswwwnycedccomsystemfilesfilesresource2016_food_supply-resiliency_study_resultspdf 61 The threshold quantity for hazardous materials is established by Chapter 7 of Title 24 of the NYC Administrative Code
NYC Mayorrsquos Office of Recovery and Resiliency Climate Resiliency Design Guidelines
24IIC SEA LEVEL RISE
Figure 9 ndash Outdoor emergency generator for the critical building
This case study provides an example of how to calculate a sea level rise-adjusted DFE based on the useful life of a hypothetical critical services building and its primary component
Step 1 Organize the site by various critical or primary components and their year of construction Determine their useful life along with the associated future year scenario for flood risk assessment In this example the building structure and the outside emergency generator are the most at-risk components from combined sea level rise and coastal storm surge
Step 2 Overlay the site footprint area over the effective current PFIRM or FIRM and the corresponding future year scenario FEMA 1 to identify flood risk to the site From overlaying the 2015 preliminary FEMA floodplain over the site it was determined that the site has a 1 annual chance of flooding with a base flood elevation of 13rsquo NAVD Step 3 Evaluate the criticality of each primary component of the facility based on the Guidelinesrsquo definition for critical infrastructure (Table 4) This (hypothetical) building is critical
Step 4 Use Table 4 to determine the sea level rise adjustment and freeboard requirements for each component and calculate the DFE for each that corresponds to its useful life period
Step 5 Compare the DFE of each component and the associated Guidelinesrsquo recommended DFE to calculate anticipated flood depth
CASE STUDY Adjusting the DFE for Sea Level Rise
Table 5 ndash Example of how to calculate a sea level rise-adjusted DFE for a critical facility
Construction year Components Useful
Life
Future Year Scenario
[Useful Life + Const
Year]
BFE in NAVD
88 (feet)
Freeboard + Sea
Level Rise Adjustment
(feet)
Adjusted DFE in
NAVD 88 (feet)
2010 Building Structure
70 years 2070-2099 130rsquo 2rsquo+23rsquo 173rsquo
2010Outdoor
Emergency Generator
25 years
Through 2039 130rsquo 2rsquo+05rsquo 155rsquo
Figure 8 - Example of how to locate a facility within the current floodplain and determine the BFE Figure 9 (inset) - Outdoor emergency generator at the facility
Figure 10 - This schematic shows how to determine the design flood elevation of a facility within the current 1 floodplain
Illustrative not to scale
NYC Mayorrsquos Office of Recovery and Resiliency Climate Resiliency Design Guidelines
25IIC SEA LEVEL RISE
Figure 11 - Flood Hazard Mapper with future 1 annual chance floodplain (adjusted for sea level rise) at httpwwwnycgovfloodhazardmapper
b) If the site is not in the future floodplain no flood protection is required for this facility
- OR - If the site is in the future floodplain identify the nearest adjacent base flood
elevation at the project site in the current 1 annual chance floodplain (PFIRM 2015) using the Flood Hazard Mapper62
c) Use Table 4 to determine the DFE Add freeboard and the sea level rise-adjustment to the nearest adjacent BFE on the
current 1 annual chance floodplain (PFIRM 2015) to determine the DFE
d) Apply the DFE calculation from Table 4 to the protected facility See Figures 12 and 13 for an illustration of how to calculate the DFE
62 Maps of future floodplains show the impacts of sea level rise alone and do not consider how changes in stormsrsquo climatology might also affect wave action and the full extent of the floodplain
3 Addressing risks in the future floodplainIf the facility is not in the current 1 annual chance floodplain (PFIRM 2015) it may still be at risk in the future from flooding as sea level rise increases the extent of the floodplain Follow the steps below to determine if your facility is located in the future floodplain and if so what sea level rise-adjusted DFE to use
a) Use the Flood Hazard Mapper (httpwwwnycgovfloodhazardmapper) to determine if the facility site will be in the future 1 annual chance floodplain
Assess if by the end of the facilityrsquos useful life the floodplain is projected to increase to encompass all or part of the project site For example if the useful life ends between 2040 and 2069 choose the 2050s floodplain map Refer to the steps in Figure 11 below
NYC Mayorrsquos Office of Recovery and Resiliency Climate Resiliency Design Guidelines
26IIC SEA LEVEL RISE
Figure 12 - This schematic map shows how to locate the nearest adjacent 1 floodplain elevation
Figure 13 -This schematic shows how to determine the design flood elevation of a facility that is outside of the current 1 floodplain
CASE STUDY Identifying a Base Flood Elevation (BFE) in the Future Floodplain
Illustrative not to scale
NYC Mayorrsquos Office of Recovery and Resiliency Climate Resiliency Design Guidelines
27IIC SEA LEVEL RISE
4 Identify appropriate design interventions
63 Additional resources for identifying adaptive strategies Urban Waterfront Adaptive Strategies (NYC Department of City Planning httpswww1nycgovassetsplanningdownloadpdfplans-studiessustainable-communitiesclimate-resilienceurban_waterfrontpdf Floodproofing Non-Residential Buildings (FEMA) at httpswwwfemagovmedia-libraryassetsdocuments34270 Ready to Respond Strategies for Multifamily Building Resilience (Enterprise Green Community) at
httpwwwenterprisecommunityorgresourcesready-respond-strategies-multifamily-building-resilience-1335664 While natural systems-based approaches ameliorate flooding their use for storm surge or wave mitigation would need to be quantified
before contributing towards the design flood elevation 65 For more information see FEMArsquos Floodproofing Non-Residential Buildings at httpswwwfemagovmedia-libraryassetsdocuments34270
Operational requirements and continuity plans can inform the selection of appropriate design interventions particularly in terms of how quickly a site needs to be up and running after a flood event Some examples of how functional uses can pair with interventions include
bull A facility that needs to be operating during or immediately after a flood event may need to be dry floodproofed using permanent barriers or designed for passive survivability (such as a police or fire station)
bull A facility that needs to recover quickly after an event could elevate prioritized equipment and have deployable barriers
bull A site that can recover over a longer duration of time could be temporarily inundated during an event (such as parks or plazas) The use of resilient materials and strategies can reduce costly damage caused by temporary inundation
Different design interventions should be chosen based on the specific operational requirements of the project however these must meet the ASCE 24 design requirements for Coastal VE Zones
For all projects at risk of current or future flooding select protections that meet the projectrsquos design flood elevation Consider project-specific factors including the site location operational requirements existing continuity planning and cost63 A Design Strategies Checklist in Appendix 6 is available for use as a resource to track possible design approaches Some examples of design alternatives are
bull Site relocation where feasible conduct alternative site analysis
bull Permanent barriers at a site (eg floodwalls)
bull Deployable flood barriers (eg stop logs flood doorsgates inflatable barriers)
bull Natural systems-based approaches (eg living shorelines restored wetlands)64
bull Prioritized protection of electrical mechanical and other critical or costly-to-replace equipment above the design flood elevation (eg motors and controller boilers and furnaces fuel storage tanks duct work alarm systems and suppression equipment electrical panels electrical distribution and switching areas gas and electric meters telecommunications equipment chemical feed equipment HVAC units and emergency generators)65
bull Dry floodproofing design a facility to prevent water from entering
bull Wet floodproofing design a facility to permit floodwaters to flow in and out of the structure without causing significant damage (eg elevate or protect critical equipment use water-resistant building materials below the design flood elevation include flood vents and pumps)
bull Design redundant telecommunications conduit entrances for multiple carrier entry Telecom conduit should run to diverse manholes when possible
bull Install backup power for telecom equipment with design consideration for such equipment (eg installation above DFE)
bull Install outdoor-rated disconnect switch for telecommunications equipment on the roofbull Explore interventions to protect underground utilities and other telecommunications
facilities from water damagebull Install backflow preventers backwater valves and sump pumps for all buildings and
infrastructure in the floodplain as well as behind flood barriersbull Shoreline improvements that reduce the height of waves or attenuate waves where
feasible
NYC Mayorrsquos Office of Recovery and Resiliency Climate Resiliency Design Guidelines
28IIIA GENERAL METHODOLOGY TO ESTIMATE PROJECT BENEFITSIIIB CATEGORIES OF PROJECT BENEFITS
Designing and constructing facilities to handle the future climate loads above the current NYC codes and standards based on projected useful life of the components provides resiliency benefits The incremental costs to implement the Guidelinesrsquo recommended design interventions should be compared with the incremental benefits to aid agencies in making decisions about resilient design strategies The project design team should evaluate benefits of the interventions designed to meet Guidelinesrsquo recommended criteria for all the climate stressors qualitatively andor quantitatively For projects with construction costs below $50 million the project design team is recommended to perform a qualitative benefits assessment on the interventions that meet the Guidelinesrsquo recommendations for all applicable climate stressors For critical facilities or projects with construction costs over $50 million the project design team is recommended to perform quantitative benefit calculations to identify the optimal interventions that meet Guidelinesrsquo recommended design criteria
A GENERAL METHODOLOGY TO ESTIMATE PROJECT BENEFITSThis general methodology to perform qualitative and quantitative benefit calculations is recommended for use by project design teams at the beginning of and during the design process This methodology enables estimation of project benefits for a high-level benefit-cost analysis (BCA) that can be applied to evaluate and compare resiliency features designed to address sea level rise with coastal storm surge increased precipitation and extreme heat events The type of benefits provided by interventions designed to meet the Guidelinesrsquo design criteria can vary by climate stressors and typology of the facilities The main guiding principle in development of the high-level BCA methodologies included in these Guidelines was to balance simplicity with accuracy The project benefits categories identified within the methodology may not cover all the potential benefits provided by every facility type within NYC In particular the benefits of planning for increased precipitation are difficult to quantify Hence the project design team should use their discretion to modify this general benefit calculation methodology as needed to meet their project goals and objectives The project design team should develop appropriate input data whether quantitative or qualitative needed to estimate project benefits
B CATEGORIES OF PROJECT BENEFITSThere are three types of project benefit categories - direct benefits indirect benefits and other benefits - that can be used to perform qualitative assessments and develop quantitative estimates of monetary benefits for intervention alternatives designed to meet the Guidelinesrsquo recommendations These project benefit categories will help to perform a high-level benefit-cost analysis that balances accuracy with an appropriate level of effort
bull Direct Benefits include reduced or avoided physical damages to facilities and contents reduced or avoided displacements for residential structures and reduced life cycle or OampM costs that can be quantified as a primary result of implementing a specific hazard mitigation measure Table 12 in Appendix 4 provides a list of direct benefits and basic guidance on estimating and documenting values for sea level rise and increased precipitation-related flood hazards Note that given the current state of practice it is not possible to quantify reduced or avoided physical damages or residential displacements that result from a specific extreme heat mitigation measures Therefore direct benefits applicable to extreme heat hazards are limited to reduced life cycle costs applicable to certain measures such as green roofs Refer to Table 15 for details on direct benefits for extreme heat hazards
III EVALUATION OF PROJECT BENEFITS
NYC Mayorrsquos Office of Recovery and Resiliency Climate Resiliency Design Guidelines
29IIIB CATEGORIES OF PROJECT BENEFITS
bull Indirect Benefits include reduced or avoided service losses for non-residential
buildings public facilities andor infrastructure (utilities roads and bridges) based on the value of service continuity andor emergency services to New Yorkers that can be quantified as a secondary result of implementing a specific hazard mitigation measure Table 13 in Appendix 4 provides a list of indirect benefits and basic guidance on estimating and documenting values for sea level rise and increased precipitation-related flood hazards Note that given the current state of practice on extreme heat it is not possible to quantify reduced or avoided service losses that result from a specific extreme heat mitigation measures Therefore indirect benefits applicable to extreme heat hazards are limited to reduced energy costs such as cool roofs green roofs or shade trees Refer to Table 15 in Appendix 4 for details on indirect benefits for extreme heat hazards
bull Other Benefits where applicable other potential benefits may include social benefits for residents such as avoided stress and anxiety avoided lost productivity environmentalecosystem service benefits avoided need for emergency services and other potential benefits that can be estimated as a result of implementing a specific hazard mitigation measure Table 14 in Appendix 4 provides a list of other potential benefits and basic guidance on estimating and documenting values for sea level rise and increased precipitation-related flood hazards
Note on the ecosystem service benefit category in Table 14 the stormwater management benefits of green infrastructure should be distributed between the extreme heat and increased precipitation hazards since these measures provide both significant reductions in rainfall runoff as well as Urban Heat Island mitigation through evapotranspiration However there is currently limited data available to quantify the actual distribution of stormwater management benefits between the two hazards For various dual-benefit providing interventions careful considerations should be given to identify the appropriate benefits category provided by the intervention with a goal to avoid duplication of quantified benefits In this methodology the stormwater management benefits of green infrastructure are applied to the increased precipitation hazard in order to avoid a duplication of benefits Note on real estate and quality of life benefits additionally it is important to note that two potential benefit categories shown in Table 14 - real estate and quality of lifehealthavoided casualties - were not included in the current BCA methodology for sea level rise or increased precipitation hazards Although these categories could increase project benefits for sea level rise and increased precipitation hazards they were only applied to measures that address extreme heat hazards such as green roofs trees and other plantings Refer to Table 15 for a detailed summary of other benefit categories quantified as unit benefits for extreme heat hazards
NYC Mayorrsquos Office of Recovery and Resiliency Climate Resiliency Design Guidelines
30IIIC WHICH METHODOLOGY TO USEIIID BCA METHODOLOGY FOR PROJECTS UNDER $50 MILLION
D BCA methodology for projects under $50 millionThe project design team should develop design alternatives to meet the Guidelinesrsquo criteria which may be in excess of NYC code and standards requirements (baseline conditions) It is assumed that the project design team will develop alternatives to address each of the following applicable climate stressors - sea level risecoastal storm surge increased precipitation and extreme heat - separately Tables 12-15 in Appendix 4 provides a list of typical direct indirect and other benefits provided by various intervention typologies to reduce impacts from climate stressors During the qualitative assessment the project design team should consider that intervention strategies will have varying levels of reliability effectiveness benefits and cost implications during the qualitative assessment
The project design team is recommended to develop appropriate evaluation criteria and metrics for each of the applicable project benefit categories For each alternative the project design team could use either a scoring weighting ranking or other type of qualitative assessment framework to assess each applicable project benefit categories with the developed evaluation criteria and metrics Table 6 provides an example template to evaluate alternatives using a set of general evaluation criteria and metrics using a color-coded rating system (and see Table 7 for an example of how to complete the template) The project design team can utilize a similar template customized to their project goals and objectives This assessment allows agencies to screen the qualitative benefits for various alternatives that would then lead to development of final project components to match the available budget and goals of the project
Projects with total costs below $50 million recommended to conduct a qualitative assessment to identify the optimal interventions that meet Guidelinesrsquo design criteria using the ldquoD) BCA methodology for projects under $50 millionrdquo methodology below
C WHICH METHODOLOGY TO USEProjects with a total cost above $50 million or are highly complex or critical facilities recommended to conduct both a qualitative and quantitative benefit calculation to identify the optimal interventions that meet Guidelinersquos design criteria using the ldquoE) BCA methodology for projects above $50 millionrdquo below A quantitative BCA also must include qualitative factors
NYC Mayorrsquos Office of Recovery and Resiliency Climate Resiliency Design Guidelines
31IIID BCA METHODOLOGY FOR PROJECTS UNDER $50 MILLION
Qualitative Color Scale Green=Least resource intensive alternative Purple=most resource intensive yellow=medium level of resource intensity
Qualitative Evaluation Factors Description Relative Color Rating System
First CostsAdditional construction costs needed to incorporate Guidelinesrsquo recommended resilient design over the baseline project costs
Highest cost ($$$) rated as Purple whereas lowest cost ($) rated as Green
ConstructabilityEase of Implementation
Construction techniques and site conditions such as presence of major utilities conflicts and other conditions which dictate the level of constructability required for each alternative
Difficult to construct rated as Purple whereas easiest to construct rated as Green
Environmental ImpactsCo-BenefitsPermitting
Impacts to the built and natural environment such as circulation noise and hazardous waste plus the level of effort required for permitting (eg interventions in water require highest level of permitting requirement) from each alternative in addition to the baseline project condition
Highest environmental impacts and highest level of effort required for permitting rated as Purple whereas the least impact and level of effort rated as Green
Operation and Maintenance (OampM)
Level of effort of additional manpower and cost of OampM for the alternatives over the baseline project OampM requirements
Highest level of effort and cost for OampM rated as Purple whereas the lowest is rated as Green
Reliability and Durability
Interventions that do not require human involvement or a facilityrsquos ability to withstand all the forces during a storm event (eg permanent solutions with higher reliability than deployable solution)
Interventions requiring human involvement (active measures) rated as Purple whereas interventions with minimal or no human involvement (passive measures) rated as Green
Risk Reduction Benefits Monetary benefits provided by each intervention alternative in avoided damages over the baseline condition
Lowest potential monetary benefit rated as Purple whereas as highest potential monetary benefit rated as Green
Quality of Life BenefitsVisual Aesthetics
Benefits either to the community such as recreation or safety or serve the community during emergency situations
Lowest potential quality of life benefits rated as Purple whereas as highest potential benefits rated as Green
Table 6 ndash Evaluation matrix for comparison of mitigation alternatives across the useful life of a project
Project title_______________________________________________________________________________
Evaluation Criteria
Baseline Condition (Designed to NYC Building Code and
Standards)
Resilient Design Alternatives for Managing__________________
Alternative 1
Alternative 2
Alternative 3
First Costs
ConstructabilityEase of ImplementationEnvironmental ImpactsCo-BenefitsPermitting
Operation and Maintenance (OampM)
Reliability and Durability
Risk Reduction Benefits
Quality of Life BenefitsVisual Aesthetics
NYC Mayorrsquos Office of Recovery and Resiliency Climate Resiliency Design Guidelines
32IIID BCA METHODOLOGY FOR PROJECTS UNDER $50 MILLION
Table 7 ndash Evaluation matrix for comparison of mitigation alternatives across the useful life of a project - COMPLETED EXAMPLE
Evaluation Criteria
Baseline Condition (Designed to NYC Building Code and
Standards)
Resilient Design Alternatives for Managing Coastal SurgeSLR
Alternative 1Flood proof building built on grade to Guidelines
DFE
Alternative 2 Elevate building structure above Guidelinesrsquo DFE
on columns
Alternative 3 Raise site grade by filing the building site footprint
to Guidelinesrsquo DFE
First CostsBaseline cost for building structure is $15 million
Incremental costs are within 5 over the baseline costs
Incremental costs are between 5-10 over baseline costs
Incremental costs are 20 and more over baseline costs
ConstructabilityEase of Implementation
Relatively easy to construct within site constraints
Similar to baseline conditions since construction requires additional flood proofing only
Moderate challenges to construct foundation structure for columns within site constraints
Extremely challenging to construct within the site constraints Potentially fatal flaw
Environmental ImpactsCo-BenefitsPermitting
No major impacts but may require additional effort to obtain DOB permits with flood proofing and deployable systems
No major impacts but may require additional effort to obtain DOB permits with flood proofing and deployable systems
No major impacts and relatively easy to permit
Potential drainage circulation impacts and challenges to obtain clean fill material for the site
Operation and Maintenance (OampM)
Major OampM costs associated with deployable systems
Major OampM costs associated with deployable systems
Moderate OampM costs associated with proposed elevator for access
Minimal OampM costs since deployable and elevators not required
Reliability and Durability
Least reliability with highest potential risk from flooding during to failure of deployable systems
Least reliability with highest potential risk from flooding during to failure of deployable systems
Moderate reliability with potential risk from flooding limited to elevator shaft only
Highest reliability since deployable are not required to protect building from flooding
Risk Reduction Benefits
Maximum flood risk reduction benefits assuming deployable and flood proofing is effective
Maximum flood risk reduction benefits assuming deployable and flood proofing is effective
Maximum flood risk reduction benefits
Maximum flood risk reduction benefits
Quality of Life BenefitsVisual Aesthetics
Facility may not be operational during the storm event
Facility may not be operational during the storm event
Facility can be potentially operational during the storm event
Facility can be potentially operational during the storm event
Qualitative Color Scale Green=Least resource intensive alternative Purple=most resource intensive yellow=medium level of resource intensity
A new non-critical facility with a building structure is proposed on a site that is currently in the 2015 Preliminary FEMA 1 annual chance floodplain with a BFE of 10rsquo (NAVD 88) The baseline conditions DFE to meet existing NYC codes and standards is 11rsquo (NAVD 88) Using the Guidelines recommended design criteria the facilityrsquos DFE is 133rsquo (NAVD 88) and existing grade is around 6rsquo (NAVD 88) The project design team develops three alternatives to meet the Guidelinesrsquo recommended DFE design for the facility Table 7 offers an example of how a qualitative assessment can be used to compare three resilient design alternatives using the evaluation criteria and metrics
CASE STUDY Example of How to Use the Evaluation Matrix
NYC Mayorrsquos Office of Recovery and Resiliency Climate Resiliency Design Guidelines
33IIIE BCA METHODOLOGY FOR PROJECTS OVER $50 MILLION
E BCA methodology for projects over $50 millionIn order for a project to be considered cost-effective a benefit-cost analysis (BCA) assesses if the benefits of a project outweigh its costs or in other words the benefit-cost ratio (BCR) is greater than 10 as illustrated in Equation 1
Equation 1 Benefit-Cost Ratio Formula
BCR =
Where BCR = Benefit-Cost Ratio
BENEFITS = Total project benefits
COSTS = Total project costs
BENEFITSCOSTS
These estimated project benefits are combined with the project costs which are defined as the differential construction and long-term operation and maintenance costs associated with constructing a proposed project to the Guidelinesrsquo recommended design level It is assumed that the baseline project will be designed to the most prevalent NYC codes and standards This benefit methodology should be used to determine the additional project benefit that the Guidelinesrsquo recommended design would provide over the baseline project benefit It is assumed that the project design team will develop alternatives to address each of the following applicable climate stressors - sea level risecoastal storm surge increased precipitation and extreme heat - separately For each alternative the project design team should use the following steps to determine the Benefit-Cost Ratio (BCR)
a) Determine project useful life for design interventions Determining the useful life of the proposed project is an important first step in the
detailed BCA assessment methodologies for two reasons First the project useful life determines what values must be used from the Guidelines to establish the future climate design conditions The various hazard tables in the Guidelines establish design requirements based on useful life ranges through 2039 2040-2069 2070-2099 and 2100+ (2100+ projections are only available for sea level rise) A review of these tables show that the design requirements needed to meet the projected climate hazards increase as the end of useful life range increases Second the useful life determines how long the project will need to be operated and maintained in order to remain technically sound and effective at reducing future damages and losses
b) Determine discount rate for project benefits calculation The cost-effectiveness of projects assessed using the BCR must be done on a net
present value basis meaning the present value of the benefits is compared to the present value of the costs Most project costs are computed for present value based on current cost estimates bids or cost guidance However project benefits - as well as project costs for operation and maintenance - accrue over time into the future and are computed on an annualized basis To address this issue the Present Value Coefficient (PVC) is used to bring these annualized project benefits and OampM costs into the present value As indicated by the formula in Equation 2 the PVC is a function of the Project Useful Life (PUL) and the Discount Rate (DR)
NYC Mayorrsquos Office of Recovery and Resiliency Climate Resiliency Design Guidelines
34
Equation 2 Present Value Coefficient (PVC) Formula
PVC =
Where PVC = Present Value Coefficient
PUL = BCA Project Useful Life based on project type
DR = Discount Rate
The project design team should coordinate with agencies and NYC OMB if needed to determine appropriate discount rates based on funding source project type and other factors This coordination should take place during project initiation phase where total project costs (design and construction) are over $50 million66
c) Develop input data to perform benefit calculations Tables 16 and 17 in Appendix 4 provide a list of typical input data by each climate
stressor needed to perform benefit analysis quantitatively on variety of facilities67 The project design team should use these tables as a reference to identify appropriate input data categories andor additional input data needed to perform benefit analysis on the project
d) Identify applicable project benefit categories to estimate benefits Tables 16 and 17 in Appendix 4 provide a list of typical project benefits by each climate
stressor needed to perform benefit analysis quantitatively on various types of projects The project design team should use these tables as a reference to identify appropriate project benefit categories for each climate stressor to perform benefit analysis on the project
e) Calculate benefits of recommended design interventions for each climate
stressor The input data and applicable project benefits can be assembled along with
incremental project cost data to analyze cost-effectiveness using the FEMA BCA Tool Damage-Frequency Assessment (DFA) module or similar software This analysis will provide a BCR for each alternative which can then be used to compare the alternatives that were developed to mitigate effects from applicable climate stressors The project design team can then use the results from this analysis to identify optimal interventions that provides a balanced solution that provides resiliency benefits within the available project budget
IIIE BCA METHODOLOGY FOR PROJECTS OVER $50 MILLION
[1 ndash (1 + DR) -(PUL)]DR
66 For example a NYC OMB March 2015 memorandum recommends using an annually updated DR as published each year in Appendix C of OMB Circular A-94 The current OMB-recommended discount rates from OMB A-94 Appendix C vary by project useful life and are as follows 21 DR for useful lives of 10 to 19 years 25 DR for useful lives of 20 to 29 years and 28 DR for useful lives of 30 years or greater By contrast FEMA hazard mitigation grants use a DR of 70 for all projects based on the Federal OMB A-94 rate for federally-funded mitigation measures Since these DRs will impact the PVC and the project benefits the project team must ensure that BCA results prepared using an OMB-recommended DR (21 to 28) be updated to reflect the Federal DR (70) when applying for FEMA mitigation grant funds
67 Note the data requirements for the sea level rise and increased precipitation hazards in Table 16 are more detailed than the requirements for the extreme heat hazards due to the less detailed level of analysis available for extreme heat
NYC Mayorrsquos Office of Recovery and Resiliency Climate Resiliency Design Guidelines
35
APPENDICES
NYC Mayorrsquos Office of Recovery and Resiliency Climate Resiliency Design Guidelines
36APPENDIX 1 ndash KEY TERMS
100-year flood (1 annual chance flood)
A flood that has a 1 probability of occurring in any given year The 100-year floodplain is the extent of the area of a flood that has a 1 chance of occurring or being exceeded in any given year
500-year flood (02 annual chance flood)
A flood that has a 02 probability of occurring in any given year The 500-year floodplain is the extent of the area of a flood that has a 02 chance of occurring or being exceeded in any given year
AdaptationAdjustment in natural or human systems to a new or changing environment that seeks to maximize beneficial opportunities or moderate negative effects Successful adaptations contribute to resiliency
Base flood elevation (BFE)The elevation of surface water resulting from a flood that has a 1 annual chance of occurring or being exceeded in any given year The BFE is shown on the Flood Insurance Rate Map (FIRM)69
BluebeltReference to the Department of Environmental Protectionrsquos (DEP) Bluebelt program to preserve natural drainage corridors including streams ponds and other wetland areas Preservation of these wetland systems allows them to perform their functions of conveying storing and filtering storm water
Climate
The average weather (or more rigorously a statistical description of the average in terms of the mean and variability) over a period of time usually 30 years These quantities are most often surface variables such as temperature precipitation and wind Climate in a wider sense is the state including a statistical description of the climate system70
Climate change
Changes in average weather conditions that persist over multiple decades or longer Climate change encompasses both increases and decreases in temperature as well as shifts in precipitation changing risk of certain types of severe weather events and changes to other variables of the climate system
Climate change riskThe chance that investments (such as in capital projects) can be affected by the physical impacts of climate change71 Risks are evaluated as a product of the probability of occurrence and the magnitude of damages or impacts including socioeconomic factors that would result if they did occur (consequences)
Climate change risk assessment
This assessment involves a detailed project-specific analysis that includes a vulnerability and risk assessment often followed by cost-benefit analysis to assess and select investments in climate change risk mitigation Risk is assessed as a function of the magnitude and probability of a given climate change hazard Examples resources are included in Appendix 7
Climate vulnerabilityThe degree to which systems and populations are affected by adverse impacts It is a function of the character magnitude and rate of climate change and variation to which a system is exposed its sensitivity and its adaptive capacity72
Cloudburst An extreme amount of rain in a short period of time often over a small geographic area73
Cooling Degree Day (CDD) A form of degree-day used to estimate the energy requirements for air conditioning or refrigeration when the daily mean temperature is above 65degF
68 All terms are from the US Global Change Research Program (USGCRP) glossary unless otherwise noted The USGCRP glossary is available at httpwwwglobalchangegovclimate-changeglossary
69 ldquoDefinitionsrdquo FEMA last modified March 1 2017 httpswwwfemagovnational-flood-insurance-programdefinitions70 UKCIP Glossary httpwwwukciporgukglossary71 ldquoAccount for Climate Riskrdquo International Finance Corporation 72 UKCIP Glossary httpwwwukciporgukglossary73 New York City Environmental Protection ldquoCloudburst Resiliency Planning Studyrdquo 2017 Available at httpwwwnycgovhtmldeppdfclimatenyc-cloudburst-studypdf
APPENDIX 1 - KEY TERMS68
NYC Mayorrsquos Office of Recovery and Resiliency Climate Resiliency Design Guidelines
37APPENDIX 1 ndash KEY TERMS
Design life The life expectancy of an asset or product as determined during design74 As opposed to useful life (see below)
Dry Bulb temperature The ambient air temperature measured by a thermometer
Extreme eventUnexpected unusual or unpredictable weather or flooding compared to historical or future projected distribution Extreme events include for example heat waves cold waves heavy rains periods of drought and flooding and severe storms
Facilities For the purposes of this document ldquofacilitiesrdquo refers to all types of buildings housing infrastructure structures and landscape features designed by or for the City of New York
Flexible adaptation pathwayResilience-building strategies that can evolve or be adapted over time as climate change risk assessments evaluations of adaptation strategies and monitoring continue75
Flood Insurance Rate Maps (FIRM)
Official flood map of a community on which FEMA has delineated the 1 annual chance floodplain and the base flood elevations (BFEs) applicable to the community76 The FIRM also includes the 02 floodplain annual chance floodplain and differentiates between special flood hazard areas (V A Coast A zones) and floodways The official FIRM is from the year 2007 while the 2015 PFIRM is currently required by NYC Building Code to calculate design flood elevations NYC DOB references the more restrictive of the two maps in both base flood elevation and flood hazard area (ie V versus A zone) Refer to Appendix 3 for more information
FreeboardAn additional amount of height above the base flood elevation used as a factor of safety (eg two feet above the base flood) in determining the level at which a facilitys lowest floor must be elevated or floodproofed to be in accordance with state or community floodplain management regulations77
Future time slices
Future periods defined by the NPCC for when climate change projections are available In this document the following decadal projections are associated with specific time spans2020s projection = present to 20392050s projection = 2040 to 20592080s projection = 2070 to 20992100s projection = end of century and beyond
Green infrastructureAn array of practices that use or mimic natural systems to manage urban stormwater runoff Water is either directed to engineered systems for infiltration or detained for longer periods before it enters the sewer system
Heat Vulnerability Index (HVI)Summarizes relative risk of adverse health effects from heat due to social and environmental factors Used to identify neighborhoods at higher risk during and after extreme heat events
Heat wave A period of three consecutive days where temperatures rise above 90degF or two consecutive days over 95 degrees78
New York City Panel on Climate Change (NPCC)
The body of leading climate and social scientists charged with making climate change projections for the metropolitan region79
74 Sustainable Infrastructure Management Program Learning Environment httpsimplewerforg 75 Rosenzweig C et al Climate Change Adaptation in New York City Building a Risk Management Response76 ldquoDefinitionsrdquo FEMA77 Ibid78 Horton R et al New York City Panel on Climate Change 2015 Report Chapter 1 Climate Observations and Projections Ann NY
Acad Sci ISSN 0077-8923 (New York 2015) 2579 For more information on the NPCC visit www1nycgovsiteorrchallengesnyc-panel-on-climate-changepage
NYC Mayorrsquos Office of Recovery and Resiliency Climate Resiliency Design Guidelines
38APPENDIX 1 ndash KEY TERMS
Open-grid pavement system
Pavements that consist of loose substrates supported by a grid of a more structurally sound grid or webbing Unbounded loose substrates in these systems transfer and store less heat than bound and compacted pavements and aid permeability Pavement is 50 pervious and contains vegetation in the open cells designed to allow percolation or infiltration of storm water through the surface into the soil below80
Preliminary Flood Insurance Rate Map (PFIRM)
Preliminary flood map developed by FEMA in 2015 for New York City that provides projected risks for flood hazards81 Refer to Appendix 3 for more information
Project useful life (PUL)
The period over which an asset or component is expected to be available for use by an entity This depends on regular and adequate maintenance This period of time typically exceeds the design life (see above) The combined effect of operational requirements and useful life is practical in assessing an investment in improving resilience82
Rain gardenAlso called ldquobioswalerdquo Planted areas designed to collect and manage stormwater that runs off streets sidewalks commercial and residential rooftops and other sources when it rains
Resiliency The ability to bounce back after change or adversity The capability of preparing for responding to and recovering from difficult conditions83
Sea level rise-adjusted design flood elevation
As defined in these Guidelines the increased height of the base flood elevation due to sea level rise plus freeboard depending on the criticality of the facility The sea level rise adjustment depends on the useful life of the facility
Storm surge An abnormal rise of water generated by a storm over and above predicted astronomical tides84
Substantial improvementAny repair reconstruction rehabilitation addition or improvement of a building or structure the cost which equals or exceeds 50 of the market value of the structure before the improvement or repairs started For more information see Appendix G of the NYC Building Code and 1 RCNY sect3606-0185
Tidal inundation Flooding which occurs at high tides due to climate-related sea level rise land subsidence andor the loss of natural barriers86
Urban Heat Island (UHI) effectThe tendency for higher air temperatures to persist in urban areas as a result of heat absorbed and emitted by buildings and asphalt tending to make cities warmer than the surrounding suburban and rural areas
Weather The state of the atmosphere at a given time with regard to temperature cloudiness precipitation wind and other meteorological conditions87
Wet Bulb temperatureThe temperature indicated when a thermometer bulb is covered with a water-saturated wick over which air is caused to flow at approximately 45 ms (900 ftmin) to reach the equilibrium temperature of water evaporating into the air when the heat of vaporization is supplied by the sensible heat of the air88
80 ldquoGlossaryrdquo US Green Building Council (2017) Available at httpwwwusgbcorgglossaryterm552581 ldquoPreliminary FEMA Map Productsrdquo FEMA Map Service Center Available at httpshazardsfemagovfemaportalprelimdownload82 ldquoGlossaryrdquo International Infrastructure Management Manual (2011) 83 A Stronger More Resilient New York (2013) 184 ldquoStorm Surge Overviewrdquo National Hurricane Center NOAA Available at httpswwwnhcnoaagovsurge85 ldquoFlood Resistant Constructionrdquo Appendix G New York City Building Code (2008) and 1 RCNY sect3606-01 available at httpswww1nycgovassetsbuildingsrules1_RCNY_3606-01pdf86 ldquoOcean Factsrdquo National Ocean Service NOAA Available at httpoceanservicenoaagovfactsnuisance-floodinghtml 87 UKCIP Glossary httpwwwukciporgukglossary88 ldquoASHRAE Terminologyrdquo ASHRAE Available at httpswwwashraeorgtechnical-resourcesauthoring-toolsterminology
NYC Mayorrsquos Office of Recovery and Resiliency Climate Resiliency Design Guidelines
39APPENDIX 2 - CLIMATE CHANGE PROJECTIONS
Climate change projections are provided by the New York City Panel on Climate Change (NPCC) The full NPCC report is available from the New York Academy of Sciences89 Tables 8-10 (below) were reproduced directly from the NPCC report while Table 2 (see Section IIA) was developed using the data underlying the NPCC report to inform the design of HVAC systems under warmer conditions
Table 8 ndash NYC sea level rise projections90
Baseline (2000-2004) 0 in
Low estimate (10th percentile)
Middle range (25th to 75th percentile)
High estimate (90th percentile)
2020s 2 in 4-8 in 10 in
2050s 8 in 11-21 in 30 in
2080s 13 in 18-39 in 58 in
2100 15 in 22-50 in 75 in
Note Projections are based on six-component approach that incorporates both local and global factors The model-based components are from 24 global climate models and two representative concentration pathways Projections are relative to the 2000-2004 base period
Table 9 ndash Mean annual changes91
a Temperature Baseline(1971-2000) 54degF
Low estimate (10th percentile)
Middle range (25th to 75th percentile)
High estimate (90th percentile)
2020s + 15degF +20-29degF +32degF
2050s +31degF +41-57degF +66degF
2080s +38degF +53-88degF +103degF
2100 +42degF +58-104degF +121F
b Precipitation Baseline(1971-2000) 501 in
Low estimate (10th percentile)
Middle range (25th to 75th percentile)
High estimate (90th percentile)
2020s -1 percent +1-8 +10
2050s +1 percent +4-11 +13
2080s +2 percent +5-13 +19
2100 -6 percent -1 to +19 +25
Note Based on 35 global climate models (GCMs) and two RCPs Baseline data cover the 1971ndash2000 base period and are from the NOAA National Climatic Data Center (NCDC) Shown are the low estimate (10th percentile) middle range (25th percentile to 75th percentile) and high estimate (90th percentile) These estimates are based on a ranking (from most to least) of the 70 (35 GCMs times 2 RCPs) projections The 90th percentile is defined as the value that 90 percent of the outcomes (or 63 of the 70 values) are the same or lower than Like all projections the NPCC climate change projections have uncertainty embedded within them Sources of uncertainty include data and modeling constraints the random nature of some parts of the climate system and limited understanding of some physical processes The NPCC characterizes levels of uncertainty using state-of-the-art climate models multiple scenarios of future greenhouse gas concentrations and recent peer-reviewed literature Even so the projections are not true probabilities and the potential for error should be acknowledged
89 The NPCC 2015 report is available at httponlinelibrarywileycomdoi101111nyas20151336issue-1issuetoc90 From New York City Panel on Climate Change 2015 Report Chapter 1 Climate Observations and Projections page 4191 From New York City Panel on Climate Change 2015 Report Chapter 1 Climate Observations and Projections page 30
APPENDIX 2 - CLIMATE CHANGE PROJECTIONS
NYC Mayorrsquos Office of Recovery and Resiliency Climate Resiliency Design Guidelines
40APPENDIX 2 - CLIMATE CHANGE PROJECTIONS
Table 10 ndash Extreme events92
2020s Baseline (1971-2000)
Low estimate(10th percentile)
Middle range(25th to 75th percentile)
High estimate (90th percentile)
Numbers of heat waves per year 2 3 3-4 4
Average heat wave duration (days) 4 5 5 5
Number of days per year with
Maximum temperature at or above 90degF 18 24 26-31 33
Maximum temperature at or above 100degF 04 07 1-2 2
Minimum temperature at or below 32degF 71 50 52-58 60
Rainfall at or above 1 inch 13 13 14-15 16
Rainfall at or above 2 inches 3 3 3-4 5
Rainfall at or above 4 inches 03 02 03ndash04 05
2050s Baseline (1971-2000)
Low estimate(10th percentile)
Middle range(25th to 75th percentile)
High estimate (90th percentile)
Numbers of heat waves per year 2 4 5-7 7
Average heat wave duration (days) 4 5 5-6 6
Number of days per year with
Maximum temperature at or above 90degF 18 32 39-52 57
Maximum temperature at or above 100degF 04 2 3-5 7
Minimum temperature at or below 32degF 71 37 42-48 52
Rainfall at or above 1 inch 13 13 14-16 17
Rainfall at or above 2 inches 3 3 4-4 5
Rainfall at or above 4 inches 03 03 03-04 05
2080s Baseline (1971-2000)
Low estimate(10th percentile)
Middle range(25th to 75th percentile)
High estimate (90th percentile)
Numbers of heat waves per year 2 5 6-9 9
Average heat wave duration (days) 4 5 5-7 8
Number of days per year with
Maximum temperature at or above 90degF 18 38 44-76 87
Maximum temperature at or above 100degF 04 2 4-14 20
Minimum temperature at or below 32degF 71 25 30-42 49
Rainfall at or above 1 inch 13 14 15-17 18
Rainfall at or above 2 inches 3 3 4-5 5
Rainfall at or above 4 inches 03 02 03-05 07
Note Projections for temperature and precipitation are based on 35 GCMs and 2 RCPs Baseline data are for the 1971 to 2000 base period and are from the NOAA National Climatic Data Center (NCDC) Shown are the low estimate (10th percentile) middle range (25th to 75th percentile) and high estimate (90th percentile) 30-year mean values from model-based outcomes Decimal places are shown for values less than one although this does not indicate higher precisioncertainty Heat waves are defined as three or more consecutive days with maximum temperatures at or above 90degF Like all projections the NPCC climate change projections have uncertainty embedded within them Sources of uncertainty include data and modeling constraints the random nature of some parts of the climate system and limited understanding of some physical processes The NPCC characterizes levels of uncertainty using state-of-the-art climate models multiple scenarios of future greenhouse gas concentrations and recent peer-reviewed literature Even so the projections are not true probabilities and the potential for error should be acknowledged
92 From New York City Panel on Climate Change 2015 Report Chapter 1 Climate Observations and Projections page 31
NYC Mayorrsquos Office of Recovery and Resiliency Climate Resiliency Design Guidelines
41APPENDIX 3 - DIFFERENTIATION OF FLOOD MAPS
These Guidelines reference several different kinds of flood maps and sources of design flood elevations These maps are described and differentiated below
Table 11 - Differentiation of flood maps used in NYC
Reference Title Data Source Information Provided Referenced By Link
2007 FIRM FEMA
Based on historical data from before 1983 identifies the current base flood (extent and elevation) as the flood that has a 1 chance of occurring in any given year also known as a 100-year flood The NYC Building Code requires that either the 2007 FIRM or 2015 PFIRM elevation be used whichever is higher
2014 NYC Building Code Appendix G
Climate Resiliency Design Guidelines
httpsmscfemagovportal
2015 PFIRM FEMA
Based on historical data identifies the current base flood (extents and elevation) as the flood that has a 1 chance of occurring in any given year also known as a 100-year flood The NYC Building Code requires that either the 2007 FIRM or 2015 PFIRM elevation be used whichever is higher The 2015 PFIRM is currently being reassessed by FEMA
2014 NYC Building Code Appendix G
Climate Resiliency Design Guidelines
httpshazardsfemagovfemaportalprelimdownload
httpwwwregion2coastalcomview-flood-maps-dataview-preliminary-flood-map-data
NYC Flood Hazard Mapper
NYC Department of City Planning
Maps current and future flood hazards in NYC including the following data layers 2007 FIRM and 2015 PFIRM high tide with sea level rise and PFIRM with sea level rise through 2100
Climate Resiliency Design Guidelines
Waterfront Revitalization Plan
httpwww1nycgovsiteplanningdata-mapsflood-hazard-mapperpage
ldquoTable 4 ndash Determine the sea level rise-adjusted design flood elevation for critical and non-critical facilitiesrdquo
ORR amp NPCC
Provides data to use when adding sea level rise to a given 2015 PFIRM or 2007 FIRM Base Flood Elevation (BFE) to calculate a Design Flood Elevation (DFE) Based on the criticality and expected useful life of a facility
Climate Resiliency Design Guidelines
See Section II on ldquoSea Level Riserdquo above
APPENDIX 3 - DIFFERENTIATION OF FLOOD MAPS
NYC Mayorrsquos Office of Recovery and Resiliency Climate Resiliency Design Guidelines
42APPENDIX 4 - PROJECT BENEFITS CATEGORIES
This appendix provides guidance on how to identify and assess benefits as a supplement to Sections IIID and IIIE
Table 12 lists typical direct benefits for reducing impacts from climate stressors and basic guidance for how to estimate them See Section IIID for more information
Table 13 lists typical indirect benefits for reducing impacts from climate stressors and basic guidance for how to estimate them See Section IIID for more information
Table 12 ndash Direct benefits for (1) sea level rise with coastal storm surge and (2) increased precipitation measures
Direct Benefit Basic Guidance for Estimating Values
Physical Damages (Structure Contents)
bull For flood-damaged buildings use depth damage functions developed by FEMA and USACE for structures and contents
bull Use depth damage functions in conjunction with Building Replacement Values (BRVs) and not market values BRVs typically range between $100 to $325SF for residential buildings and $120 to $450SF for commercial public buildings
bull For more complex structures or facilities use engineering estimates of flood damages or review historic flood damages documented from insurance claims repair records or FEMA Public Assistance claims from recent flood disasters
Residential Displacements
bull For flood-damaged buildings use depth damage functions developed by FEMA and USACE for residential displacements
Reduced Life CycleOperation and Maintenance (OampM) Costs93
bull Applicable only to projects that reduce overall life cycle costs or net annual OampM costs from baseline conditions
bull Input reduced annual OampM costs as a project benefit at a 1-year recurrence intervalbull Reduced overall life cycle costs can be input as a longer project useful life
Table 13 ndash Indirect benefits for (1) sea level rise with coastal storm surge and (2) increased precipitation measures
Indirect Benefit Basic Guidance for Estimating Values
Non-Residential Building Service Losses
bull Estimate service loss values and durations for non-residential buildings public buildings critical facilities and parksnatural features based on FEMA BCA guidance and standard values based on building use
Utility Service Losses94
bull Estimate utility service losses for water wastewater and electrical facilities based on the number of impacted customers FEMA per capita standard values for utility service ($105personday for potable water $49personday for wastewater $148personday for electrical)95
bull Estimate utility service loss durations based on engineering estimates or review historic flood damages losses documented from utility company records
bull This benefit can also apply to measures that increase energy efficiency
RoadBridge Service Losses
bull Estimate roadbridge service losses based on the average daily traffic (ADT) detour time and additional travel distance and FEMA and GSA standard values for road service ($3344vehiclehour of delay $0545mile)96
bull Estimate roadbridge service loss durations or review historic flood damages losses
Emergency Service Losses
bull Applicable only to projects that reduce or eliminate documented emergency service costs from baseline conditions
bull Examples of avoided emergency services costs include NYPD staffing to monitor barricades for flooded roads or NFDY staffing for water rescues of residents from flooded buildings or streets
APPENDIX 4 - PROJECT BENEFITS CATEGORIES
93 Reduced life cycle costs may be applicable to some measures that provide extreme heat benefits such as green roofs that can last longer than a standard roof if properly maintained
94 Reduced utility service costs may be applicable to some measures that provide extreme heat benefits such as cool roofs green roofs and shade trees
95 FEMA per capita standard values taken from FEMA BCA Toolkit Version 530 (Build Date 12222016) and developed in FEMArsquos Baseline Standard Economic Value Methodology Report (July 28 2016) Consider updating FEMA standard per capita values to reflect current New York City utility rates
96 Consider updating FEMA and GSA standard values to reflect current New York City area labor rates and fuel costs
NYC Mayorrsquos Office of Recovery and Resiliency Climate Resiliency Design Guidelines
43APPENDIX 4 - PROJECT BENEFITS CATEGORIES
Table 14 ndash Other potential benefits for (1) sea level rise with coastal storm surge and (2) increased precipitation measures
Other Benefit Basic Guidance for Estimating Values
Avoided Stress and Anxiety
bull Applicable only for projects that directly benefit occupants of residential structuresbull Use FEMA standard value for avoided mental stress and anxiety treatment costs of $2443person to
estimate benefit for all impacted residents97
Avoided Lost Productivity
bull Applicable only for projects that directly benefit occupants of residential structuresbull Use FEMA standard value for avoided lost worker productivity costs of $8736household to estimate
benefit for all impacted workers (conservatively assuming one worker per household)
Environmental Open Space
bull Applicable only for projects that create or acquire open space areas by acquisitionbull Use FEMA standard value for environmental open space based on the type of land acquired ($8308
Acreyear for Green open space $39545Acreyear for Riparian $6010Acreyear for Wetlands $554Acreyear for Forests $1799Year for Marine and estuary)97
CSO Volume Reduction
bull Applicable only for projects that provide Combined Sewer Overflow (CSO) abatement by reducing the volume of rainfall runoff
bull Use CSO abatement cost of $0015gallonsyear applied to increased precipitation hazard runoff volume for 5-year design storm98
Ecosystem Service99
bull Add stormwater management benefits of green infrastructure projects to increased precipitation hazards where avoided damages and service losses are not quantified
bull Unit benefits applicable to increased precipitation hazard includeo Green roofs $0133SFyear (PUL 40 years)o BioswaleRain GardenMeadow Mix $0020SFyear (PUL 30 years)o Permeable Grass Pavers $0020SFyear (PUL 30 years)o Tree Plantings $303Treeyear (PUL 30 years)o Planter Box Trees $101Treeyear (PUL 15 years)
Real Estate99
bull Potential real estate benefits from increased resilience of residential andor commercial propertiesstreetscapesneighborhoods included within the project scope
bull Benefit applied to extreme heat hazard for green infrastructure projects directly impacting residential or commercial properties
Quality of Life Health Benefits99
bull Potential quality of life benefits related to improved public health from the resilience measures included within the project scope
bull Benefit applied to extreme heat hazard for green infrastructure projects directly impacting residential or commercial properties
Table 14 lists other typical benefits for reducing impacts from climate stressors and basic guidance for how to estimate them See Section IIID for more information
97 FEMA standard values for avoided mental stress and anxiety and environmental open space values taken from FEMA BCA Toolkit Version 530 (Build Date 12222016)
98 CSO abatement cost taken from APG1 Report for NYC ldquoTechnical Approaches for Benefit-Cost Analysis of Hazard Mitigation Projects in Urban and Coastal Environmentsrdquo (April 2016)
99 Ecosystem Services Real Estate and Quality of LifeHealth benefits tend to be more applicable to green infrastructure measures that provide extreme heat benefits such as green roofs trees and other plantings
NYC Mayorrsquos Office of Recovery and Resiliency Climate Resiliency Design Guidelines
44APPENDIX 4 - PROJECT BENEFITS CATEGORIES
Table 15 ndash Potential benefits for extreme heat (Urban Heat Island) reduction measures
Category Benefit Basic Guidance for Estimating Values
Direct Benefit
Reduced Life Cycle Cost
bull Applicable only to measures such as green roofs that are expected to last longer than standard roofs
bull Compute total cost savings including annual OampM costs
Indirect Benefit
Energy Savings
bull Applicable to measures that reduce energy costs by providing cooling through increased shading andor evapotranspiration
bull Use New York Power Authority rates of $0148kWh for electricity and $0810Therm for natural gas
Other Potential Benefits
Air Quality bull Applicable to measures that absorb pollutants andor reduce carbon dioxide emissions
Acoustics bull Applicable to measures such as green roof or walls that reduce noise transfer
Quality of LifeHealth bull Potential quality of life benefits and related to improved public health
Real Estate bull Applicable to measures that provide residential real estate benefits from increased resilience of propertiesstreetscapesneighborhoods
Retail Sales Marketing
bull Applicable to measures that provide commercial property benefits from increased aesthetics resulting in increased marketing and sales for streetscapesneighborhoods
Tax Credits Incentives
bull Applicable to resilience or green infrastructure measures such as green roofs that have accompanying Federal State or City tax credits or other incentives
Table 15 lists potential benefits for reducing impacts from heat and basic guidance for how to estimate them See Section IIID for more information
NYC Mayorrsquos Office of Recovery and Resiliency Climate Resiliency Design Guidelines
45APPENDIX 4 - PROJECT BENEFITS CATEGORIES
Table 16 ndash Guidance on quantitative calculations for (1) sea level rise with coastal storm surge and (2) increased precipitation measures
Data Input General Guidance ndash Basic Description
Applicable Benefit Category
Applicable Typical Facility Typology
Dire
ct B
enefi
ts
Indi
rect
Ben
efits
Oth
er P
oten
tial
Ben
efits
Bui
ldin
g St
ruct
ures
Com
plex
Fa
cilit
ies
Tran
spor
tatio
nSt
reet
scap
es
Plaz
as
Park
Fea
ture
s
First Floor Elevation (FFE)
bull The elevation of the first finished floor of the structure excluding basements
bull FFE measured from top of lowest floor (riverinenon-coastal high hazard areas) or bottom of lowest horizontal structural member (coastal high hazard areas)
Y Y Y Y
Building Replacement Value (BRV)
bull The unit cost to rebuild a structure of the same quality of construction
bull Not the same as market value
Y Y Y Y
Building Size
bull The total floor area of the building in square feet
bull Total Building Value = BRV x Building Sizebull Typical BRVs for NYC range between $100 to
$325SF for residential buildings and $120 to $450SF for commercialpublic buildings
Y Y Y Y
Structure Description
bull The type of building number of stories and foundation type (full basement partial basement no basement)
bull Collect more detailed foundation data for coastal flood zones
Y Y Y Y
Building Use bull Details related to residential housing commercial business and public use
Y Y Y Y Y
Building Type bull The primary use of building ndash residential commercial public and others
Y Y Y Y Y
Depth Damage Function (DDF)
bull Curves used to estimate structure damage contents damage and displacement of residential buildings based on flood depth
bull DDFs selection based on Structure Description Building Type Building Use
bull Structure DDFs based on percentage of Total Building Value
bull Contents DDFs based on percentage of Total Contents Value
bull Displacement DDFs based on number of displacement days x Displacement Cost
Y Y Y Y Y
Contents Value
bull The cost to replace structure contents (furnishings equipment)
bull Residential building Contents Values typically 50 BRV (FEMA DDFs) or 100 BRV (USACE DDFs)
bull Non-residential building Contents Values between 18 to over 100 depending on building use (USACE DDFs)
bull Total Contents Value = BRV x Building Size
Y Y Y Y Y
Table 16 provides general guidance on how to quantitatively calculate benefits from efforts to address from climate stressors See Section IIIE for more information
NYC Mayorrsquos Office of Recovery and Resiliency Climate Resiliency Design Guidelines
46APPENDIX 4 - PROJECT BENEFITS CATEGORIES
Table 16 ndash Guidance on quantitative calculations for (1) sea level rise with coastal storm surge and (2) increased precipitation measures
Data Input General Guidance ndash Basic Description
Applicable Benefit Category
Applicable Typical Facility Typology
Dire
ct B
enefi
ts
Indi
rect
Ben
efits
Oth
er P
oten
tial
Ben
efits
Bui
ldin
g St
ruct
ures
Com
plex
Fa
cilit
ies
Tran
spor
tatio
nSt
reet
scap
es
Plaz
as
Park
Fea
ture
s
Number of Residents (Residential)
bull Total number of occupants in a residential building
bull Typically estimated based on number of residential units x average number of individuals per household (based on current US Census data or use 25 individuals per household as a default)
Y Y Y Y Y
Displacement Cost (Residential)
bull The unit cost to lodge and feed displaced residents while flood damage is repaired
bull Average unit displacement cost of $415residential unitday recommended based on current FY2018 GSA Per Diem rates for New York City
Y Y Y Y Y
Value of Service (Non-Residential and Public)
bull The unit cost of service disruption and rental of temporary facilities while flood damage is repaired
bull Disruption costs for non-residential buildings typically range from $095 to $136SFmonth and rental costs range from $020 to $136SFmonth depending on building use
bull Value of service for public buildings ($day) is typically based on the annual operating budget for the City agency using the building prorated based on building size or population served by the building then divided by 365 daysyear
Y Y Y Y
Value of Service (Critical Facilities)
bull The unit cost of critical facilities (police fire emergency medical services) lost or delayed while flood damage is repaired
Y Y Y
Value of Service Duration
bull The duration of service disruption and rental of temporary facilities for non-residential buildings and critical facilities while flood damage is repaired
bull For non-residential buildingso Value of Service Durations vary from
4 months to over 30 months based on building use and the depth of flooding
o Total Value of Service Loss = (Disruption Cost x Building Area) = (Rental Cost x Building Area x Value of Service Duration)
bull For public buildings and critical facilitieso Value of Service Durations vary from 0
days to 720 months based on building use and the depth of flooding from FEMA FIA or USACE DDFs
o Total Value of Service Loss = (Value of Service) x (Service Loss Duration)
Y Y Y
NYC Mayorrsquos Office of Recovery and Resiliency Climate Resiliency Design Guidelines
47APPENDIX 4 - PROJECT BENEFITS CATEGORIES
Table 16 ndash Guidance on quantitative calculations for (1) sea level rise with coastal storm surge and (2) increased precipitation measures
Data Input General Guidance ndash Basic Description
Applicable Benefit Category
Applicable Typical Facility Typology
Dire
ct B
enefi
ts
Indi
rect
Ben
efits
Oth
er P
oten
tial
Ben
efits
Bui
ldin
g St
ruct
ures
Com
plex
Fa
cilit
ies
Tran
spor
tatio
nSt
reet
scap
es
Plaz
as
Park
Fea
ture
s
Engineering Estimates for Damages
bull Engineered estimate models of physical damages and service losses at the project site based on the Guidelines event recurrence interval(s) and flood depth(s)
Y Y Y Y Y Y
Historic Damages and Service Losses
bull Historic physical damages and service losses at the project site documented from previous flood events
bull Do not use routine maintenancebull The historic damage event recurrence interval
(RIs) andor flood depths must be determined updated for inflation to the present value and adjusted to match the Guidelines event RIsflood depths
Y Y Y Y Y Y
Facility Replacement Value
bull The unit cost to rebuild the facility
Impacted Area bull The geographic area impacted by the facility in the event of failure in acres
Y Y Y Y
Facility Capacity
bull The design capacity of the facilitybull For example - facility capacity expressed in
millions of gallons per day (MGD) for water and wastewater facilities or megawatts (MW) for electrical facilities
Y Y Y Y
Service Population
bull The number of impacted residents served by the facility
bull Typically estimated based on number of impacted residential customers x average number of individuals per household (based on current US Census data or use 25 individuals per household as a default)
bull Facilities serving mostly non-residentialpublic buildings andor critical facilities should focus on service losses rather than service population
Y Y Y
NYC Mayorrsquos Office of Recovery and Resiliency Climate Resiliency Design Guidelines
48APPENDIX 4 - PROJECT BENEFITS CATEGORIES
Table 16 ndash Guidance on quantitative calculations for (1) sea level rise with coastal storm surge and (2) increased precipitation measures
Data Input General Guidance ndash Basic Description
Applicable Benefit Category
Applicable Typical Facility Typology
Dire
ct B
enefi
ts
Indi
rect
Ben
efits
Oth
er P
oten
tial
Ben
efits
Bui
ldin
g St
ruct
ures
Com
plex
Fa
cilit
ies
Tran
spor
tatio
nSt
reet
scap
es
Plaz
as
Park
Fea
ture
s
Value of Service
bull Unit value of service provided by the facilitybull Example of FEMA standard values for complete
loss of utility service $105personday for potable water$49personday for wastewater$148personday for electrical
bull Consider updating FEMA standard per capita values to reflect current The New York City utility rates
Y Y
Roadway Elevations bull Roadway Elevations
Y Y
Roadway Replacement Value
bull Roadway Replacement ValueY Y
Inundation Area Map
bull Inundation Area Map developed by FEMA or through modeling by project design team
Y Y Y
Building Inventory of Inundation Area
bull The number and type of buildings within the streetscape and neighborhood inundated by the Guidelinersquos flood events
Y Y Y
Average Daily Traffic (ADT)
bull The average number of one-way traffic trips per day along the roadway(s) within the streetscapeneighborhood inundated by the Guidelinersquos flood events
Y Y
Additional Travel Time
bull The additional travel time needed to detour around a flooded roadway expressed in minutes
bull In the unlikely event there is no detour available use a 12-hour travel time per one-way trap but provide a detailed area street map as supporting documentation
Y Y
Value of Traffic Delay
bull The value of service associated with lost time in traffic
bull For example - FEMA standard average value of $3344vehiclehour of delay
bull Consider updating FEMA and GSA standard values to reflect current New York City area labor rates and fuel costs
Y Y
NYC Mayorrsquos Office of Recovery and Resiliency Climate Resiliency Design Guidelines
49APPENDIX 4 - PROJECT BENEFITS CATEGORIES
Table 17 ndash Guidance on quantitative unit benefit calculations for extreme heat hazard measures
Measure General Guidance ndash Unit Benefit Information and Data Requirements
Applicable Benefit Category
Applicable Typical Facility Typology
Dire
ct B
enefi
ts
Indi
rect
Ben
efits
Oth
er P
oten
tial
Ben
efits
Bui
ldin
g St
ruct
ures
Com
plex
Fa
cilit
ies
Tran
spor
tatio
nSt
reet
scap
es
Plaz
as
Park
Fea
ture
s
Green Roof
bull Unit benefit range over PUL = $470SF to $373SF of green roof area ($719SF standard value)
bull Assumed PUL = 40 yearsbull Apply standard value unit benefit to green
roof area to estimate measure benefitbull Higher range values more applicable
to residential and commercial building streetscape projects
Y Y Y Y Y Y
Bioswale Rain Garden Meadow Mix
bull Unit benefit range over PUL = $396SF to $211SF of area ($730SF standard value)
bull Assumed PUL = 30 yearsbull Apply standard value unit benefit to bioswale
rain gardenmeadow mix area to estimate total measure benefit
Y Y Y Y Y Y
Cool Roof
bull Unit benefit range over PUL = $117 to $3151SF of material area ($144SF standard value)
bull Assumed PUL = 20 yearsbull Apply standard value unit benefit to cool roof
area to estimate total measure benefitbull Higher range values more applicable to
residential building streetscape projects
Y Y Y Y Y
Light-Colored PaversLight-Colored Materials
bull Unit benefit range over PUL = $0774 to $204SF of material area ($0866SF standard value)
bull Assumed PUL = 30 yearsbull Apply standard value unit benefit to material
area to estimate total measure benefit
Y Y Y Y
Table 17 provides general guidance on how to quantitatively calculate benefits from efforts to address climate stressors See Section IIIE for more information
NYC Mayorrsquos Office of Recovery and Resiliency Climate Resiliency Design Guidelines
50APPENDIX 4 - PROJECT BENEFITS CATEGORIES
Table 17 ndash Guidance on quantitative unit benefit calculations for extreme heat hazard measures
Measure General Guidance ndash Unit Benefit Information and Data Requirements
Applicable Benefit Category
Applicable Typical Facility Typology
Dire
ct B
enefi
ts
Indi
rect
Ben
efits
Oth
er P
oten
tial
Ben
efits
Bui
ldin
g St
ruct
ures
Com
plex
Fa
cilit
ies
Tran
spor
tatio
nSt
reet
scap
es
Plaz
as
Park
Fea
ture
s
Tree Planting
bull Unit benefit range over PUL = $1005 to $77154Tree ($1855Tree standard value)
bull Assumed PUL = 30 yearsbull Apply standard value unit benefit to number of
trees to estimate total measure benefitbull Higher range values more applicable
to residential and commercial building streetscape projects
Y Y Y Y Y Y
Planter Box Tree
bull Unit benefit range over PUL = $212 to 16304Tree ($392Tree standard value)
bull Assumed PUL = 15 yearsbull Apply standard value unit benefit to number of
trees to estimate total measure benefitbull Higher range values more applicable
to residential and commercial building streetscape projects
Y Y Y Y Y
Shade Canopy
bull Unit benefit range over PUL = $0363 to $396SF ($0458SF standard value)
bull Assumed PUL = 15 yearsbull Apply standard value unit benefit to area of
shade canopy estimate total measure benefitbull Higher range values more applicable
to residential and commercial building streetscape projects
Y Y Y Y
Permeable Grass Pavers
bull Unit benefit range over PUL = $0258SF to $0521SF of pavers ($0363SF standard value)
bull Assumed PUL = 30 yearsbull Apply standard value unit benefit to paver
area to estimate total measure benefit
Y Y Y Y Y
For the purposes of the BCA refer to the following facility typologies bull ldquoBuilding Structuresrdquo include critical small building sites such as EMS or FDNY stations and non-critical small building sites such as
libraries or comfort stationsbull ldquoComplex Facilitiesrdquo include critical infrastructure such as wastewater treatment sites pump stations water filtration plants and similar
large or complex facilitiesbull ldquoTransportationStreetscapePlazasrdquo include roadway reconstruction streetscape improvements street raising plazas and other
transportation-related infrastructurebull ldquoPark Featuresrdquo include parks and similar public recreational facility with natural landscape features
NYC Mayorrsquos Office of Recovery and Resiliency Climate Resiliency Design Guidelines
51APPENDIX 5 - EXAMPLE PLANNING DECISION TREE
This decision tree provides a summarized example approach for how to implement these Guidelines Projects with a total cost greater than $50 million are recommended to conduct a full qualitative and quantitative climate change risk assessment and BCA while projects below $50 million are recommended to conduct a qualitative risk assessment and BCA
Define Project
1) Operational goals and criticality level2) Useful life3) Location in the current flood plain future floodplain and or zone
of tidal inundation and the project arearsquos score on the heat vulnerability index
Evaluate Project Risks According to Probability and Magnitude of Consequence
bull Extreme Heat bull Precipitationbull Sea Level Risebull Coastal Surge
High Level Identification and Assessment of Risk Mitigation Alternatives and Co-benefits
(qualitative)
Detailed Identification and Assessment of Risk Mitigation Alternatives and Co-benefits (qualitative and quantitative)
High Level Estimate of Costs and Benefits of Design Alternatives
(qualitative)
Detailed Estimate of Costs and Benefits of Design Alternatives
(qualitative and quantitative)
Decision Point Which climate change risks require mitigation
Decision Point Evaluate risk mitigation benefits and costs to
determine final resilient design alternative or if no action is required
Decision Point Is the total project cost above $50 million
Below $50 million Above $50 million
APPENDIX 5 - EXAMPLE PLANNING DECISION TREE
NYC Mayorrsquos Office of Recovery and Resiliency Climate Resiliency Design Guidelines
52
Project Title
Design Strategies Checklist (not exhaustive)
Extreme Heat Comments Extreme Precipitation Comments Sea Level Rise amp Storm Surge Comments
Select Site in Low Heat Vulnerability Index area Select High Elevation Site Select High Elevation Site
Minimize East-West Building Orientation Green Roof Raise Building Floor Elevation
Passive Solar Cooling and Ventilation Systems
Protect Below Grade Areas from Flooding Waterproof Building Envelope
Cool Roof (SRI appropriate) On-site Stormwater Management (gray) Elevate Critical Building Functions
Green Roof (extensive) Reduce Impervious Areas Elevate Critical Equipment
Vegetative Structures Permeable Pavement Perimeter Floodwall100 Levee (passive or active)
Enhanced HVAC System including space layout optimization and system scalability
Increase Green Spaces and Planted Areas DryWet Floodproofing
More Efficient Building Envelope Other Utility Redundancy Design101
Parking Lot Shading Resilient Materials amp Landscape Treatments
Light Colored Pavements (appropriate SRI) Design for Storm Surge Outflow
Increase Planted Areas Install Backwater Flow Prevention
Permeable Surfaces Design for Scour
Open-grid Pavement Raise Road Elevation
Other Other
This appendix provides a template for identifying possible design strategies to address climate change risks as described throughout the Guidelines
APPENDIX 6 - DESIGN STRATEGIES CHECKLIST
100 Permanent perimeter flood walls are not permitted to meet floodproofing requirements in buildings with substantial improvements andor damages 101 Utility redundancy design should be pursued for critical systems not all building systems
APPENDIX 6 - DESIGN STRATEGIES CHECKLIST
NYC Mayorrsquos Office of Recovery and Resiliency Climate Resiliency Design Guidelines
53APPENDIX 7 - CLIMATE CHANGE RISK ASSESSMENT RESOURCES
These Guidelines provide data on climate change hazards and recommend how that data can inform resilient design A risk assessment is a tool to help project managers and designers evaluate risk levels as well as select and prioritize resilient design strategies A high level risk assessment is recommended for all City capital projects with a total cost of under $50 million Projects above $50 million are recommended to conduct an in-depth assessment
Risk assessments use quantified estimates of the probability and magnitude of consequence of an event occurring to prioritize responses ldquoProbabilityrdquo is an assessment of the likelihood of a hazard occurring while ldquomagnituderdquo describes the hazardrsquos potential impact Risk assessment tools such as the examples listed below can be used to define and score these categories Projects that score higher across both probability and magnitude can be prioritized for investment and risk mitigation action Projects that score lower across both criteria may require no action beyond meeting code The results are typically charted on a risk matrix and an example is provided on the next page
The climate change risk management frameworks below offer templates for how to integrate climate change projections into a risk assessment process Refer to these resources for examples and further information
bull Vulnerability Assessment and Adaptation Framework is prepared by the Federal Highway Administration (FHWA) While developed for transportation planning this risk assessment framework has broad applicability for evaluating asset vulnerability to climate change Available at httpswwwfhwadotgovenvironmentsustainabilityresilienceadaptation_framework
bull US Climate Resilience Toolkit The US Global Change Research Program offers a step by step risk assessment
framework including tools and case studies at httpstoolkitclimategovsteps (see example on next page)
bull Coast Adapt Guidance on undertaking a risk assessment High level assessment httpscoastadaptcomausitesdefaultfilesfactsheetsT3M4_2_2nd_pass_risk_assessmentpdfDetailed assessment httpscoastadaptcomausitesdefaultfilesfactsheetsT3M4_3_3rd_pass_risk_assessmentpdf
bull Climate adaptation Risk uncertainty and decision-makingDownload the report here httpswwwukciporgukpublicationsRisk
The City plans to develop a NYC-specific process for integrating climate change data into existing risk management processes by April 2019
APPENDIX 7 - CLIMATE CHANGE RISK ASSESSMENT RESOURCES
NYC Mayorrsquos Office of Recovery and Resiliency Climate Resiliency Design Guidelines
54APPENDIX 7 - CLIMATE CHANGE RISK ASSESSMENT RESOURCES
The Risk Characterization Matrix below is an example from the US Climate Resilience Toolkit This tool can be used to assess the probability and magnitude of impact for identified risks The risk of coincident climate stressorsrisks (such as storm surge plus increased precipitation) can also be assessed as applicable
Figure 14 - Example of a climate change risk matrix (adapted from US Climate Resilience Toolkit)
Project teams can determine the magnitude of the impact (along the horizontal scale of 1 through 3 with 3 being the most severe) and the probabilitylikelihood of occurrence for each specific risk (along the vertical scale with 3 being the most likely) A score is typically assigned for each risk (Probabil-ity x Magnitude) and then charted on the matrix Based on the estimated probability and magnitude of consequence above the risks are ranked and prioritized for mitigation Factors to bear in mind include
bull Not all facility typologies have the same level of functional and operational importance during events or tolerance for disruption
bull Not all climate stressors and risks have the same level of impact on each project sitebull Not all identified risks can or should be mitigated fully
NYC Mayorrsquos Office of Recovery and Resiliency Climate Resiliency Design Guidelines
55WORKS CITED
A Stronger More Resilient New York PlaNYC Report of the NYC Special Initiative for Rebuilding and Resiliency The City of New York 2013
ldquoAccount for Climate Riskrdquo International Finance Corporation accessed March 27 2017 httpwwwifcorgwpswcmconnectTopics_Ext_ContentIFC_External_Corporate_SiteClimate+Business
PrioritiesAccount+for+Climate+Risk
American Society of Heating Refrigeration and Air-Conditioning Engineers (ASHRAE) Handbook -Fundamentals 2017
ldquoBaseline Standard Economic Value Methodology Reportrdquo Federal Emergency Management Agency July 2016
Benefit Cost Analysis Toolkit Software Version 530 Federal Emergency Management Agency (build date December 2016)
Criteria for Detention Facility Design New York City Department of Environmental Protection November 2012
Community Resilience Planning Guide for Buildings and Infrastructure Systems Vol 1 NIST Special Publication 1190 US Department of Commerce 2016
Cool and Green Roofing Manual NYC Department of Design and Construction 2007 httpwwwnycgovhtmlddcdownloadspdfcool_green_roof_manpdf
Building Resiliency Task Force US Urban Green Building Council New York 2013 httpurbangreencouncilforcecomBuildingResiliency
Design and Planning for Flood Resiliency Guidelines for NYC Parks New York City Department of Parks and Recreation 2017
httpswwwnycgovparksorgplanning-and-buildingplanningresiliency-plansflood-resiliency
Flooded Bus Barns and Buckled Rails Federal Transit Administration Office of Budget and Policy 2011 httpswwwhsdlorgabstractampdid=685187
Floodproofing Non-Residential Buildings FEMA P936 FEMA 2013 httpswwwfemagovmedia-library-data9a50c534fc5895799321dcdd4b6083e7P-936_8-20-13_508rpdf
ldquoGlossaryrdquo International Infrastructure Management Manual National Asset Management Support Group New Zealand 2011 httpwwwipweaorg
ldquoGreen Roof Metrics Draft Reportrdquo New York City Department of Parks and Recreation 2017
ldquoGuide to Rain Event Preparednessrdquo NYC Department of Environmental Protection httpwwwnycgovhtmldeppdfbrochuresflood-preparedness-flyerpdf
ldquoGuidelines and Discount Rates for Benefit-Cost Analysis of Federal Programsrdquo Appendix C Circular A-94 US Office of Management and Budget (OMB) 2017
ldquoGuidelines for the Design and Construction of Stormwater Management Systemsrdquo New York City Department of Environmental Protection July 2012
Horton R et al New York City Panel on Climate Change 2015 Report Ann NY Acad Sci ISSN 0077-892 New York 2015
Madrigano J et al ldquoA case-only study of vulnerability to heat wavendashrelated mortality in New York City (2000ndash2011)rdquo Environmental Health Perspectives 123672ndash678 2013
WORKS CITED
NYC Mayorrsquos Office of Recovery and Resiliency Climate Resiliency Design Guidelines
56WORKS CITED
enspMcGregor et al Two Degrees The Built Environment and Our Changing Climate Routledge Press 2013
NYC Green Codes Task Force US Green Building Council New York 2010 httpurbangreencouncilorgGreenCodes
NYCrsquos Risk Landscape A Guide to Hazard Mitigation NYC Emergency Management 2014
One New York The Plan for a Strong and Just City The City of New York 2015 httpwwwnycgovhtmlonenyc downloadspdfpublicationsOneNYCpdf
Ready to Respond Strategies for Multifamily Building Resilience Enterprise Green Communities 2015 httpswwwenterprisecommunityorgresources
Rosenzweig C et al Climate Change Adaptation in New York City Building a Risk Management Response New York City Panel on Climate Change 2010
httponlinelibrarywileycomdoi101111nyas20101196issue-1 issuetoc
ldquoSustainable Infrastructure Management Program Learning Environmentrdquo Water Environment Research Foundation accessed March 24 2017 httpsimplewerforg
Urban Waterfront Adaptive Strategies NYC Department of City Planning 2013 httpwww1nycgovsiteplanningplanssustainable-communitiesclimate-resiliencepagetab=1
Wastewater Resiliency Plan Climate Risk Assessment and Adaptation Study New York City Department of Environmental Protection October 2013

NYC Mayorrsquos Office of Recovery and Resiliency Climate Resiliency Design Guidelines
2
NYC Mayorrsquos Office of Recovery and Resiliency Climate Resiliency Design Guidelines
3
I INTRODUCTION 4
A GOALS 4
B CLIMATE CHANGE PROJECTIONS FOR NEW YORK CITY 5
C PLANNING ACROSS PROJECT USEFUL LIFE 6
D MANAGING UNCERTAINTY 6
E PROJECT-SPECIFIC CONSIDERATIONS 7
II INTERPRETING CLIMATE CHANGE DATA FOR RESILIENT DESIGN ADJUSTMENTS 9
A INCREASING HEAT 9
B INCREASING PRECIPITATION 15
C SEA LEVEL RISE 19
III EVALUATION OF PROJECT BENEFITS 28
A GENERAL METHODOLOGY TO ESTIMATE PROJECT BENEFITS 28
B CATEGORIES OF PROJECT BENEFITS 28
C WHICH METHODOLOGY TO USE 30
D BCA METHODOLOGY FOR PROJECTS LESS THAN $50 MILLION 30
E BCA METHODOLOGY FOR PROJECTS OVER $50 MILLION 33
APPENDIX 1 - KEY TERMS 36
APPENDIX 2 - CLIMATE CHANGE PROJECTIONS 39
APPENDIX 3 - DIFFERENTIATION OF FLOOD MAPS 41
APPENDIX 4 - PROJECT BENEFITS CATEGORIES 42
APPENDIX 5 - EXAMPLE PLANNING DECISION TREE 51
APPENDIX 6 - DESIGN STRATEGIES CHECKLIST 52
APPENDIX 7 - CLIMATE CHANGE RISK ASSESSMENT RESOURCES 53
WORKS CITED 55
CONTENTS
NYC Mayorrsquos Office of Recovery and Resiliency Climate Resiliency Design Guidelines
4
In the coming years and throughout the 21st century New York City (NYC) will face new challenges from a rapidly changing climate Many physical infrastructure landscape and building projects (ldquofacilitiesrdquo) will face new or more severe risks from extreme flooding precipitation and heat events1 At the same time environmental conditions are also projected to change posing chronic hazards as some coastal areas are regularly inundated by high tide and average annual temperatures rise In NYCrsquos Roadmap to 80 x 50 the City of New York (the City) committed to reducing emissions of greenhouse gases by 80 by 20502 However the impacts from climate change are already occurring and these Guidelines establish how the City can increase its resiliency to unavoidable climate change through design
Codes and standards that regulate the design of infrastructure and buildings incorporate historic weather data to determine how to build for the future However historic conditions do not accurately represent the projected severity and frequency of future storms sea level rise heat waves and precipitation The climate is already changing and will continue to change in significant ways over the entire useful life of facilities designed today threatening to undermine capital investments and impede critical services To protect the facilities New Yorkers depend upon the City will design them using the best available data for future conditions The Climate Resiliency Design Guidelines (ldquoGuidelinesrdquo) provide step-by-step instructions on how to supplement historic climate data with specific regional forward-looking climate change data in the design of City facilities Resilient design is intended to become an integral part of the sequential project planning process for agencies and their designers All new projects should assess their climate change risks in the context of the projectrsquos purpose specific site location and funding and then determine the appropriate design strategies These Guidelines apply to all City capital projects except coastal protection projects (eg sea walls and levees) for which the City will develop separate guidance Implementing the Guidelines will result in protection standards that will make the Cityrsquos built environment more resilient to climate change and promote the health safety and prosperity of New Yorkers
A GOALSThe primary goal of the Guidelines is to incorporate forward-looking climate change data in the design of all City capital projects The Guidelines provide a consistent methodology for engineers architects landscape architects and planners to design facilities that are resilient to changing climate conditions The Guidelines are to be used throughout the design processmdashduring capital planning initiation as a reference in requests for proposals (RFPs) during a conceptual or study phase through to final designmdashfor all new construction and substantial improvements of City facilities
IA GOALS
1 Though the intensity and frequency of storms is expected to increase firm projections on future wind conditions have not yet been developed NYC commenced a study in 2017 to assess projected changes to extreme wind hazards and identify risks to the cityrsquos built environment
2 To learn more about 80 x 50 visit httpwww1nycgovsitesustainabilitycodes80x50page
I INTRODUCTION
The Guidelines provide step-by-step instructions on how to supplement historic climate data with specific regional forward-looking climate change data in the design of City facilities
NYC Mayorrsquos Office of Recovery and Resiliency Climate Resiliency Design Guidelines
5IB CLIMATE CHANGE PROJECTIONS FOR NEW YORK CITY
A successful resiliency strategy is one that provides co-beneficial outcomes reduces costs over the life of the asset wherever possible and avoids negative indirect impacts to other systems Resilient design should not exist in a silo but rather be a well-integrated part of existing processes and address other goals of the City For example these resilient design choices should be made in the context of the Cityrsquos capital planning risk management and financial planning Similarly resilient design choices should be selected to maximize the efficacy and efficiency of investments Some ways this can be done include 1) integrating ldquosoftrdquo resiliency strategies (operational measures or investments in green infrastructure) and ldquohardrdquo resiliency strategies (built or intensive investments) 2) addressing multiple climate hazards with single interventions and 3) reducing climate change risk in concert with other goals (eg energy efficiency or reduction in greenhouse gas emissions) These Guidelines were developed by the Mayorrsquos Office of Recovery and Resiliency (ORR) in close collaboration with City agencies that are involved in the design or management of capital projects A Design Guidelines Working Group was convened to consult on the development of the Guidelines which included more than 15 City agencies3 A preliminary version (10) of these Guidelines was issued in April 2017 and was tested and validated through an extensive review with internal and external climate and design experts Version 20 has been updated to reflect lessons learned through that analysis
B CLIMATE CHANGE PROJECTIONS FOR NEW YORK CITY
The New York City Panel on Climate Change (NPCC) provides regional climate change projections that inform City resiliency policy Composed of leading scientists the NPCC prepares projections for the metropolitan region which have shown that extreme weather will increase in frequency and severity and that the climate will become more variable These projections are divided across future time slices including the 2020s 2050s 2080s and 2100 The most NPCC recent climate change projections from 2015 encompass a wide range of possible outcomes for example
bull Mean annual temperature is projected to increase between 41 and 66degF by the 2050s and between 53 and 103degF by the 2080s4
bull Frequency of heat waves is projected to triple by the 2050s to 5 to 7 heat waves per year and 5 to 8 heat waves per year by the 2080s5
bull Mean annual precipitation is projected to increase between 4 to 13 by the 2050s and between 5 to 19 by the 2080s6
bull Sea level is expected to continue rising by another 11 to 21 inches by the 2050s and by 18 to 39 inches by the 2080s7
This document provides specific guidance on how to use the range of climate change projections in design For more information on climate change projections for the metropolitan region see Appendix 2 The NPCC continues to study and refine projections for the metropolitan region and these Guidelines will be updated as new reports are released by the NPCC
3 Representatives from the following City departments and agencies contributed to the creation of this document Environmental Protection Transportation City Planning Buildings Design and Construction Parks and Recreation Emergency Management School Construction Authority City Administrative Services Health and Hospitals Information Technology and Telecommunications Economic Development Corporation Housing Authority Public Design Commission Mayorrsquos Office of Sustainability Mayorrsquos Office of the Chief Technology Officer Housing Preservation and Development Office of Management and Budget Sanitation and Law
4 Ranges for heat reflect the middle and high range estimates from the NPCC See Appendix 2 for more information5 Ibid6 Ranges for precipitation reflect the middle and high range estimates from the NPCC See Appendix 2 for more information7 Ranges for sea level rise reflect the middle range estimates from the NPCC See Appendix 2 for more information
NYC Mayorrsquos Office of Recovery and Resiliency Climate Resiliency Design Guidelines
6IC PLANNING ACROSS PROJECT USEFUL LIFE ID MANAGING UNCERTAINTY
C PLANNING ACROSS PROJECT USEFUL LIFEA resilient facility is one built to withstand or recover quickly from natural hazards Climate conditions will continue to change over time which makes considering the useful life important for choosing the right level of protection8 Users should using professional knowledge and examples from the built environment estimate the full useful life of the facility to determine necessary design adjustments tied to climate change (useful life starts at the end of construction) The full project useful life of a facility is typically a longer period than the design life and more accurately represents the extended service life of most types of facilities (assuming regular maintenance) For example an administrative building may have a design life of 30 years but in practice such buildings remain in use for 50 years or more when well-maintained Full useful life is also met through the successful deployment of design strategies that minimize operations and maintenances (OampM) and the need for renovations ORR and Department of Design and Construction (DDC) with input from other City agencies are developing a library of common asset types for buildings landscapes infrastructure and equipment and assessing their typical design and useful lives This resource will be added as an addendum to the Guidelines by April 2019
D MANAGING UNCERTAINTYClimate change projections from the NPCC are the product of state-of-the-art modeling and analysis However as with all projections there is uncertainty embedded within them9 The NPCC continues to develop review and synthesize the latest climate data for the metropolitan region and new findings will be incorporated into future versions of these Guidelines
Given uncertainty flexible adaptation pathways provide a useful iterative approach for managing uncertainty and designing resilient facilities particularly those with a useful life that extends over 50 years - beyond which the uncertainty of projections increases10 Adaptation pathways are particularly useful for expensive long-lived and highly complex projects They provide a way to balance uncertainty with cost as well as manage operational and maintenance constraints A facility can be engineered with an adaptable protection level which reduces the hazard risk to acceptable levels for part of its useful life and that can be re-evaluated as risk levels change
8 NIST Community Resilience Planning Guide for Buildings and Infrastructure Systems Vol 1 NIST Special Publication 1190 US Department of Commerce 2016
9 PlaNYC A Stronger More Resilient New York report of the NYC Special Initiative for Rebuilding and Resiliency Report June 11 2013 page 28 From that report ldquoLike all projections the NPCC projections have uncertainty embedded within them Sources of uncertainty include data and modeling constraints the random nature of some parts of the climate system and limited understanding of some physical processes The NPCC characterizes levels of uncertainty using state-of-the-art climate models multiple scenarios of future greenhouse gas concentrations and recent peer-reviewed literature Even so the projections are not true probabilities and the potential for error should be acknowledgedrdquo
10 To learn more see Chapter 2 in the NPCC 2010 report Climate Change Adaptation in New York City available at httponlinelibrarywileycomdoi101111nyas20101196issue-1issuetoc
Figure 1 - Example of a flexible adaptation pathway for an outdoor emergency generator and platform
An illustrative example of using flexible adaptation
NYC Mayorrsquos Office of Recovery and Resiliency Climate Resiliency Design Guidelines
7IE PROJECT-SPECIFIC CONSIDERATIONS
pathway on a facilitiesrsquo component is explained in Figure 1 It shows an emergency generator with an approximate useful life of 25 years located outside a building In order to incorporate the Guidelines into design it is recommended that the foundation of the generator structure is designed to match the useful life of the building which can vary between 50-70 years that the generator serves Assuming the generator is subject to flooding risk from sea level rise and coastal surge it should be built on an elevated concrete slab that matches the future year design flood elevation (DFE) scenario corresponding to the end of the generatorrsquos useful life The generator must be replaced when it reaches the end of its useful life which is typically far less than that of the building When the replacement generator is installed the concrete slab is further elevated to accommodate the future DFE The foundation of the generator and the columns are designed to support the additional future load from the concrete slab Thereby the initial investment into the foundation can be used to adapt in the future allowing for future flexibility and avoided costs
Adaptation pathways may not apply equally to all types of projects or climate change projections Facility flood defenses for example may be more easily developed through an adaptation pathway than heat-vulnerable materials or below grade drainage systems For this reason the Guidelines use the middle of the 25th to 75th percentile range projections for sea level rise (see Table 4) and the high-end 90th percentile projections for heat (see Table 1) For precipitation these Guidelines recommend using the existing 50-year storm data as a proxy for the projected high-end 5-year storm (see Section IIIB and Figure 4 for more details)
Uncertainty can be further addressed through risk management Some facilities such as those that are critical or cost more than $50 million for design and construction will benefit from a full climate change risk assessment (see examples in Appendix 7) This assessment will evaluate protecting the facility to a potentially higher level of sea level rise than the recommended height in these Guidelines The City plans to develop a process for integrating climate change data into existing risk management processes by April 2019 If engaging in a climate change risk assessment process please contact ORR at ResilientDesigncityhallnycgov
E PROJECT-SPECIFIC CONSIDERATIONSExisting information and requirements specific to different kinds of projects must be reviewed on a case-by-case basis when evaluating resiliency design strategies Refer to Appendix 5 for an example approach of how to make resiliency planning and design decisions and discuss these considerations as a project team to determine which apply and how to respond
bull Financing requirements if the project is federally-funded or receives recovery funding discuss with the funding agency if certain protection standards or cost-benefit analyses are required For example FEMA requires specific flood protection standards for critical facilities and non-critical facilities
bull Interdependencies consider how hazards impact interdependencies across sectors as well as the risks from coincident events (eg extreme precipitation occurring during an extreme surge event) to specific projects
bull Existing hazard mitigation projects and risk studies evaluate if nearby or associated projects have already been assessed for climate change risks Identify if
NYC Mayorrsquos Office of Recovery and Resiliency Climate Resiliency Design Guidelines
8IE PROJECT-SPECIFIC CONSIDERATIONS
any studies have been conducted that could inform design (eg local flood modeling with sea level rise) This may inform the climate change risk assessment or provide insights into site specific conditions and design options A map that catalogs NYC resiliency projects is located here httpsmapsnycgovresiliency
bull Agency-specific resiliency design standards refer also to resiliency guidelines provided by various City agencies (eg Parkrsquos Design and Planning for Flood Resiliency11) Agency guidelines build on the climate data provided in these Guidelines by providing specific design alternative and insights relevant to those agencies
bull Limitations the Guidelines do not describe or encompass all City resiliency policies To learn more about how the City plans for a resilient future see the latest OneNYC plan as well as the 2013 report A Stronger More Resilient New York Related resiliency issues are being addressed by the City but are out of the scope of these Guidelines including neighborhood and regional-level climate change risk management and zoning
bull Further questions Contact ORR at ResilientDesigncityhallnycgov
11 Available at httpswwwnycgovparksorgplanning-and-buildingplanningresiliency-plansflood-resiliency
NYC Mayorrsquos Office of Recovery and Resiliency Climate Resiliency Design Guidelines
9IIA INCREASING HEAT
All City of New York capital projects should be designed to withstand increasing heat and precipitation based on the useful life of the asset while design interventions for storm surge and sea level rise depend on the projectrsquos proximity to the floodplain useful life and criticality In order to support design team efforts to generate resilient design responses (ie adjustments to base projects) these Guidelines provide climate change projections and recommend design adjustments or interventions in response to increasing heat increasing precipitation and sea level rise The Guidelines recommend designing to loads beyond the minimum requirements in the prevalent NYC local codes Design teams should consider project benefits and additional costs to incorporating resilient design standards before finalizing project design
A INCREASING HEATUse this section to determine how to adjust a facilityrsquos design to account for increasing temperatures and to reduce the facilityrsquos contribution to the Urban Heat Island effect Heat reduction levels will be determined by the function location and useful life of the asset
BackgroundThe impacts of heat on NYC are well established Every summer over 100 New Yorkers die from causes exacerbated by extreme heat12 The region has seen a steady increase in the number of days above 90degF and temperatures are projected to keep rising worsening heat-related mortality By the 2050s the number of days at or above 90degF is expected to double and the frequency and length of heat waves will triple to an average 6 heat waves per year13 Certain areas of NYC already experience higher temperatures relative to other parts of the city and these hot spots will be exacerbated by climate change (see Figure 2)
12 OneNYC The Plan for a Strong and Just City (The City of New York 2015) 228 See also Madrigano J Ito K Johnson S Kinney PL Matte T 2015 A case-only study of vulnerability to heat wavendashrelated mortality in New York City (2000ndash2011) Environmental Health Perspectives 123672ndash678 httpwwwnycgovhtmlonenycdownloadspdfpublicationsOneNYCpdf
13 Horton et al New York City Panel on Climate Change 2015 Report Chapter 1 Climate Observations and Projections Ann NY Acad Sci ISSN 0077-8923 New York 201514 LANDSAT Thermal Data from 8182009
Figure 2 - Thermal imagery of New York City based on LANDSAT Thermal Data from 818200914
II INTERPRETING CLIMATE CHANGE DATA FOR RESILIENT DESIGN ADJUSTMENTS
NYC Mayorrsquos Office of Recovery and Resiliency Climate Resiliency Design Guidelines
10IIA INCREASING HEAT
In Cool Neighborhoods NYC the City prioritizes strategies to study the Urban Heat Island effect and make targeted investments that benefit communities most vulnerable to heat15 New Yorkers are more or less vulnerable to heat based largely upon socio-economic factors including age income location tree coverage and the percentage of dark surfaces The NYC Department of Health and Mental Hygiene (DOHMH) developed a Heat Vulnerability Index (HVI) which highlights parts of the city where more residents face an increased risk of heat-related mortality Their vulnerability is due to their exposure and socio-economic conditions that determine their
Figure 3 - Heat Vulnerability Index (HVI) for New York City Community Districts (Source NYC DOHMH 2015) This analysis identifies physical social and economic factors associated with increased risk of heat-related morbidity and mortality17
The Guidelines recommend that project designers consider two aspects of the relationship between their project and increasing heat the way their project reduces the Urban Heat Island effect and the impact that increasing heat will have on the physical components of their project itself
bull Reduce Urban Heat Island effect materials in the built environment absorb the sunrsquos heat throughout the day and re-radiate it back into the atmosphere driving localized temperatures higher and increasing demands on cooling systems Air conditioning and ventilation equipment also push extra heat into the air contributing to a feedback loop that increases localized ambient temperatures and impacts the health of heat-vulnerable New Yorkers This section provides guidance on how new capital construction can reduce the contribution to ambient heat in the city
bull Minimize impact from increasing heat increasing heat can physically impact components of buildings and infrastructure damaging or stressing materials electrical systems and mechanical systems Rising temperatures will also stress energy and communications networks that buildings and other infrastructure rely upon18 This section provides climate data to be used to adjust and adapt heat-vulnerable components of assets
15 OneNYC 22816 To learn more about Heat Vulnerability Index see page 229 of OneNYC at httpwwwnycgovhtmlonenycdownloadspdf
publicationsOneNYCpdf17 See page 229 in the OneNYC plan to learn more about HVI18 Damiano H et al NYCrsquos Risk Landscape A Guide to Hazard Mitigation (NYC Emergency Management 2014) 103
Heat can be lethal for all but its impact on New Yorkers is not equal
sensitivity to heat Community districts in red and orange in Figure 3 are areas of highest vulnerability and these are particularly concentrated in east Brooklyn the south Bronx northern Manhattan and southeast Queens16 While all new capital projects should address heat impacts those sited in moderate to high vulnerable HVI areas should implement multiple strategies to reduce the Urban Heat Island and help address the high vulnerability in these neighborhoods
NYC Mayorrsquos Office of Recovery and Resiliency Climate Resiliency Design Guidelines
11IIA INCREASING HEAT
1 Urban Heat Island reductionNew capital construction should minimize its contribution to the Urban Heat Island effect The design interventions provided below offer benefits to the community and the facility through reduced heat loading reduced energy costs andor improved occupant health and thermal comfort The appropriate combination of design interventions will vary dependent on the project scope
a) Increase the solar reflectance of surfaces by utilizing light-colored pavement coatings and materials in combination with shading with a minimum target of 50 of the non-structure areas of facility sites19
Lighter reflective surfaces help reduce the Urban Heat Island effect heat loading and internal building temperatures and extend the lifespan of rooftops and heating ventilation and air conditioning (HVAC) equipment The City has taken steps towards reducing ambient temperatures such as implementing the NYC Cool Roofs program20 New buildings as well as existing buildings with roofs going through significant repairs are required by law to paint their roofs white This program intervention reduces a buildingrsquos contribution to Urban Heat Island effect and provides energy savings by coating the normally dark concrete roof surface with white paint allowing the roof to reflect solar radiation
b) Increase the shading of surfaces by planting trees or other vegetation in combination with cool pavements with a minimum target of 50 of the non-structure areas of facility sites
Shady areas with heat- and in coastal areas salt-tolerant vegetative species can help keep buildings cool and provide energy savings as well as lower temperatures
c) Meet Climate Zone 6 standards for fenestration and insulation (See Section ECC C402 in Chapter C4 of the 2016 NYC Energy Code) to improve efficiency of building envelopes
NYC is currently in Climate Zone 4 NYC already requires that small residential building envelopes are designed to meet higher insulation and fenestration requirements to improve energy efficiency21 All City capital projects including non-residential facilities should meet this standard
d) Select greenblue roofs andor other appropriate landscape elements that maximize cooling with help of landscape architects
The City already encourages the use of green and blue roofs on buildings to reduce the Urban Heat Island effect22 provide stormwater management and increase the useful life of the roof Besides replacing dark roof surfaces green roofs and vegetation also provide shade and keep the air cool through evapotranspiration by releasing moisture into the atmosphere Blue roofs coupled with light colored roofing material can provide stormwater management and rooftop cooling Some of these designs support the shading and solar reflectance goal in Step a) above Additionally City capital projects are subject to Leadership in Energy and Environmental Design (LEED) certification and green roofs can earn LEED credits23 Projects should integrate cooling strategies listed below based on project scope and a balance between costs and benefits
bull Green roofs or blue roofs on a broader range of facilities (including industrial buildings storage garages administration buildings etc)
19 Urban Green Council (2010) Green Codes Task Force Proposed code ldquoEF 12 Reduce Summer Heat with Cool Shady Building Lotsrdquo20 Local Law No 21 (2011) amended Chapter 12 of the NYC Building Code to update roof coating standards Also
see Cool and Green Roofing Manual (DDC) 2007 for more information on NYC standards for cool and green roofs httpwwwnycgovhtmlddcdownloadspdfcool_green_roof_manpdf
21 Read more about the code here httpswww1nycgovsitebuildingscodes2016-energy-conservation-codepage22 See Cool and Green Roofing Manual (DDC) 2007 for more information on NYC standards for cool and green roofs
httpwwwnycgov htmlddcdownloadspdfcool_green_roof_manpdf23 See Local Law No 32 (2016) for more information
NYC Mayorrsquos Office of Recovery and Resiliency Climate Resiliency Design Guidelines
12
2 Minimize impact from increasing heatThis section provides information to support making design adjustments to capital projects to reduce impacts to equipment structures landscapes and materials from rising average temperatures and increasing extreme heat events
a) Review forward-looking climate data provided in Table 1 and Table 2 Select heat projections according to the useful life of the facility and its primary
components then evaluate and address impacts in the steps below Table 1 provides design criteria for average temperatures and incidents of extreme heat events projected to different time periods across the 21st century Table 2 provides guidance on future 1 Dry Bulb Temperature and Cooling Degree Days for the NYC area The 1 Dry Bulb Temperature represents the ambient air temperature
IIA INCREASING HEAT
bull Vegetated structures such as shade trees and planters (to reduce heat loading on horizontal or vertical surfaces)
bull Bioswales rain gardens and bioretention24 bull Maximize planted permeable surfacesbull Other permeable surfaces (used for stormwater management these retain
moisture that evaporates as surface temperatures rise)25 bull Open-grid pavement system (at least 50 unbound)26 bull Evaluate site planning and building massing with regard to solar gainbull Solar panels for shading and to generate energy
Table 1 ndash Baseline and projected extreme heat events27
End of useful life
heat waves per year (3 or more consecutive days with max temperatures at or above 90degF)
days above 90degF
Annual average temperature
Baseline (1971-2000) 2 18 54degF
Through to 2039 4 33 572degF
2040-2069 7 57 606degF
2070-2099 9 87 643degF
Table 2 ndash Projections for 1 Dry Bulb temperature and Cooling Degree Days
Change in projected value for 2050s
Variable Baseline for Central Park (1971-2000)
Low estimate (10th percentile)
Middle range (25th to 75th percentile)
High estimate (90th percentile)
1 Dry Bulb temperature 91degF +3degF +4-6degF +7degF
Cooling Degree Days (base = 65degF) 1149 +37 +46-73 +87
Note Due to HVAC system typical useful life of 25 years or less only projections for the 2050s are shown Projections for the 2020s are not shown because it is anticipated that enough of a safety margin is employed already in current systems to withstand the temperature rise expected through the 2020s The NPCC is currently working on projections of 1 Wet Bulb temperatures which are expected to increase and may require systems to have higher moisture reducing capacity in addition to the enhanced cooling capacity
24 When siting bioswales consider groundwater levels and soil permeability and ensure that the site is not contaminated from past or present land uses A high water table may prohibit some applications
25 Urban Green Council (2010) Green Codes Task Force Proposed code ldquoSW 1 REDUCE EXCESSIVE PAVING OF SITESrdquo26 LEED Neighborhood Development v4 ldquoHeat island reductionrdquo credit27 Projected estimates for average temperatures are based upon 90th percentile change factor added to the baseline average annual
temperature from New York City Panel on Climate Change (2015)
NYC Mayorrsquos Office of Recovery and Resiliency Climate Resiliency Design Guidelines
13IIA INCREASING HEAT
b) Evaluate potential impacts on systems and materials Heat impacts on a facility are highly contingent on the facility type and should be reviewed on a case-by-case basis28 A decrease in the useful life or operational capacity of a facility or components of a facility may occur due to rising temperatures Interventions will also vary depending on whether the project is a new capital investment or a substantial improvement to an existing facility Factors to evaluate as applicable to project scope include but are not limited to
bull Thermal expansion warping softening or other forms of material change or degradation of structural integrity occurring at an accelerated rate by excessive heat
bull Health and safety impacts on occupants vulnerable to heat bull Increased failure or reduced efficiency of electrical or mechanical systems bull Prioritization of critical loads for systems and components at the facility andbull Moisture control needs for buildings with a higher standard for fenestration and
insulation
The results of this evaluation will inform steps taken in the step below
c) Reduce heat impacts Review and implement specific changes to the facility design based on assessments
above Develop a strategy based on the specific type of facility its operational profile and its useful life A Design Strategies Checklist is available for use in Appendix 6 as a resource to track design approaches Specific areas of focus are
bull Electricity outages High temperatures drive demand for air conditioning and can increase the risk of facility equipment failure potentially broader grid disruptions or brownouts2930 To manage this risk design City buildings and infrastructure to withstand periods without electricity using the following approaches in particular if they provide critical or essential services
Ǯ Identify and assess how much of the facilityrsquos load is critical (eg ldquocritical loadrdquo) including the necessary duration of the backup power supply (eg is backup power needed for 8 hours or multiple days) Determining what loads are critical and how long they should be powered for is essential for a facilityrsquos operations and what the role of the facility will have in an emergency situation31
Ǯ Depending on the size of the critical load and budget different backup power supply options could range from backup generators (eg diesel natural gas) to hybrid systems (eg solar + battery storage + appropriately sized generator) Each option has different trade-offs that should be considered in terms of cost feasibility and environmental impacts For shorter duration needs andor smaller critical loads buildings with existing solar systems should consider adding storage to provide a resiliency benefit In some cases co-generation systems may make sense from an economic and resiliency perspective especially if there
28 Sector- and facility-specific impacts vary greatly For examples of sector-specific impacts and design responses see Flooded Bus Barns and Buckled Rails (FTA 2011) and Ready to Respond Strategies for Multifamily Building Resilience (Enterprise Green Communities 2015)
29 McGregor et al (2013) Two Degrees The Built Environment and Our Changing Climate Routledge Press30 High temperatures also increase energy demand which can increase fossil fuel based greenhouse gas emissions31 The key roles of the facility that need to be identified are operational hours number of occupants and electrical loads needed for the
desired operations Electrical equipment and appliances for the desired operations may include - but are not limited to - safety lighting life-supporting systems fire protection systems telecommunications equipment mechanical systems to mitigate extreme temperatures and computing equipment Every facility is unique Operational characteristics and load profiles need to be established prior to sizing the equipment required to keep the facility in operational mode
NYC Mayorrsquos Office of Recovery and Resiliency Climate Resiliency Design Guidelines
14IIA INCREASING HEAT
is a significant heating andor cooling load in addition to electricity demand32
Ǯ Depending on the option assess need to invest in internal electricity rewiring and building energy management systems (eg switches reconfiguration of distribution infrastructure to isolate critical loads from non-critical loads and the ability to island from the broader grid during the event of a larger disruption software and hardware to manage the deployment of hybrid systems) andor need for external hookups for temporary generators and boilers33
bull Failure in facility ventilation electrical and air conditioning systems Some systems designed to meet the requirements of past climate may overheat and fail during extreme events Some design interventions include34
Ǯ Selecting systems with higher heat tolerance Ǯ Adding Energy Recovery Ventilation systems Ǯ Providing additional or redundant ventilation systems either mechanical or
natural to cool electrical equipment Ǯ Optimizing building layout by
bull segregating temperature sensitive electronics and computer control system from other systems
bull placing heat generating equipment like transformers and switchgear outdoors where permitted and
bull splitting the facility cooling loads among different HVAC systems in facility for redundancy and better zone control
bull Passive solar cooling and ventilation There are numerous design features that provide passive solar cooling for buildings to help maintain lower internal ambient temperatures with less air conditioning These features also help keep facilities habitable during extended grid failures when generators fail or must be reserved for critical functions Some design features include35
Ǯ Appropriate east-west orientation Ǯ Passive ventilation design Ǯ Vertically stacked double skin facades Ǯ Exterior window shades Ǯ Light colored exteriors Ǯ Shaded arcades Ǯ Thermally massive materials Ǯ High performance glazing Ǯ Operable windows
32 To learn more see the Building Resiliency Task Force report from Urban Green Council (2013)33 Ibid 34 Flooded Bus Barns and Buckled Rails FTA Office of Budget and Policy 201135 These and other examples are found in McGregor et al (2013) Two Degrees The Built Environment and Our Changing Climate
Routledge Press Also see Flooded Bus Barns and Buckled Rails FTA Office of Budget and Policy 2011
NYC Mayorrsquos Office of Recovery and Resiliency Climate Resiliency Design Guidelines
15IIB INCREASING PRECIPITATION
B INCREASING PRECIPITATIONThe intensity and frequency of precipitation events are projected to increase with climate change creating new challenges for stormwater management and impacts to the built environment such as
bull The potential for greater frequency of stormwater management systems being overwhelmed36
bull More frequent and severe flooding of buildings and infrastructure in areas across the city and
bull Greater variability in rainfall events annually including the chance of drought
The goal for this section is to guide stormwater management approaches including infiltration increases in on-site storage volume and where possible increases in sewer capacity to account for precipitation increases associated with climate change Designers should develop and consider design interventions that would decrease site contribution to sewer in-flows beyond the existing NYC Building Code requirements Given its complexity the Department of Environmental Protection (DEP) is also evaluating climate impacts to the sewer system on a drainage-wide level Proactive design such as increasing on-site infiltration and storm water retention can contribute to system resiliency on a site-specific basis
BackgroundNYCrsquos drainage systems are designed to handle approximately the current 3-year intensity-duration-frequency (IDF) event in most areas of the city where sewers were built prior to 1970 In locations with sewers built after 1970 the capacity was built to handle the 5-year event NYCrsquos network of drainage systems can experience flooding above those thresholds due to widespread precipitation events or by localized intense storms (sometimes called ldquocloudburstsrdquo) causing flooding and backups Climate change projections indicate that flooding resulting from multiple types of precipitation events may increase in frequency This increasing probability is forecast for all types of precipitation events in NYC although there is greater uncertainty around future short duration events Relying on sewers alone to manage extreme precipitation events will not be sufficient in a changing climate The City plans to reduce impervious areas and provide additional storage capacity to reduce flood damage For managing stormwater from larger storms such as at the 50- and 100-year recurrence intervals DEP is increasingly considering the role of streets and open space in managing flow this is referred to as a dual drainage design approach The City is piloting projects to test this dual drainage approach
Another set of interventions include Bluebelt best management practices (BMPs) such as constructed wetlands storm water ponds and stream restorations that emulate pre-development conditions to manage large volumes of water and green infrastructure37 which in NYC have generally been designed to reduce flooding and combined sewer overflow respectively They are not typically sized to manage precipitation events of the same magnitude as sewers which serve as primary drainage conveyance However Bluebelt BMPs green infrastructure and other stormwater management tools may provide an additional buffer for larger storm events by temporarily storing andor infiltrating runoff that would otherwise be directed into the sewer system For instance areas of open space commonly found in NYC may not provide adequate environments for trees and other plantings However in these cases other types of green infrastructure like permeable surfaces and subsurface detention and retention installations would still be considered feasible
36 NYC is already taking steps to address this problem which will worsen with climate change To learn more about how NYC is using green and gray infrastructure to manage stormwater visit httpwwwnycgovhtmldephtmlstormwaterindexshtml
37 NYC DEP NYC Green Infrastructure Program
NYC Mayorrsquos Office of Recovery and Resiliency Climate Resiliency Design Guidelines
16IIB INCREASING PRECIPITATION
The City led by DEP continues to develop its options for managing heavier storm events due to climate change DEP is examining approaches to evaluate sea level rise and rainfall intensity for stormwater management and where possible sewer capacity These efforts will integrate forward-looking climate data into the design of these capital assets and the compounding factors of heavier rain storms and sea level rise will likely require greater infiltration and on-site storm water retention capacity Agencies and consultants should work directly with DEP to develop strategies on a given site necessary to meet expected increases in rainfall intensities and frequencies
1 Precipitation design adjustment for on-site stormwater systems
Based upon the design storm required for the City facility in design follow the steps below and review recommended design interventions
a) Identify the duration of the design event required The current 50-year IDF can be used as a proxy for the future 5-year storm
(projected for the 2080s) Design on-site detentionretention systems to retain the volume associated with the current 50-year IDF curve (see Figure 4 below) Design the on-site system to release at the maximum rate as specified in 15 Rules of the City of NY (RCNY) Chapter 3138
b) Conduct sensitivity analysis Compare the retentiondetention required for the current 5-year IDF versus the
38 Refer to existing codes and standards as well when determining the existing required storm as NYC requires different sizes of design storms for infrastructure and buildings For example NYC Plumbing Code Chapter 11 and Title 15 of the Rules of the City of New York Chapter 31
02
04
06
10
20
40
60
100
200
-2316090
Rai
nfal
l Int
ensi
ty (
inch
es p
er h
our
)
DurationsruoHsetuniM
5 10 15 30 1 2 3 6 12 18
5-yr
10-yr25-yr
50-yr
100-yr
NEW YORK NEW YORK
Figure 4 - Current Intensity-Duration-Frequency Precipitation Curve for NYC adapted from US Department of Commerce Weather Bureau Technical Paper 25
NYC Mayorrsquos Office of Recovery and Resiliency Climate Resiliency Design Guidelines
17IIB INCREASING PRECIPITATION
c) Identify design interventions for managing increased precipitation40 There are different ways to manage stormwater better and avoid urban flooding after
intense rain Choose the right combination of interventions after considering the site location operational requirements cost benefits and useful life of the intervention Some examples of design interventions are
bull Minimize increases in impervious surfacebull Utilize strategies that infiltrate evaporate or reuse rainwater to achieve storm
water volume reductions Then choose strategies that detain (delay drainage) to manage the rate of the storm water flow into the Cityrsquos drainage system
bull Install stormwater infiltration detention and storage (eg bioswales41 green roofs blue roofs and other blue or green infrastructure storage basins or tanks)
bull Protect areas below grade from floodingbull Keep catch basin grates clearbull When implementing perimeter protections ensure that interior water
management is also accounted for andbull Explore interventions to protect underground utility and telecommunications
infrastructure from water damage
d) Use appropriate DEP guidelines to perform the above tasks using the higher design storm
The three currently prescribed DEP guidelines are as follows
bull Guidelines for the Design and Construction of Stormwater Management Systems July 201242
bull Criteria for Detention Facility Design November 201243 bull DEP Site Connection Proposal Application and Guidelines44
Note on stormwater standards As DEP updates stormwater standards and develops specific tools to evaluate impacts of increased precipitation and drainage strategies for on-site storm water management these changes will be reflected in future versions of these Guidelines However it is recommended that the designer should develop and consider design interventions that would increase the on-site storage beyond the existing requirements Also a methodology is under development that will establish a consistent citywide process for addressing legal grade which will have further implications for how extreme precipitation is managed
39 NYC DEP Standards for Stormwater Release Rates available at httpwwwnycgovhtmldephtmlenvironmental_reviewsstormwater_release_ratesshtml 40 Also see DEP Guide to Rain Event Preparedness at httpwwwnycgovhtmldeppdfbrochuresflood-preparedness-flyerpdf and
Ready to Respond Strategies for Multifamily Building Resilience at httpwwwenterprisecommunityorgresourcesready-respond-strategies-multifamily-building-resilience-1335641 When siting bioswales consider groundwater levels and soil permeability and ensure that the site is not contaminated from past or
present land uses A high water table may prohibit some applications42 Available at httpwwwnycgovhtmldephtmlstormwaterstormwater_management_constructionshtml43 Available at httpwwwnycgovhtmldeppdfwater_sewer30_criteria_for_detention_facility_design_06062012pdf44 Available at httpwwwnycgovhtmldeppdfwater_sewer24pdf
current 50 year IDF to determine the cost and benefits associated with complying with these Guidelines Use the Evaluation of Project Benefits section below and Appendix 4 for guidance on how to identify and assess benefits Given the results of the costbenefit analyses review the added benefit of designing retentiondetention using greater magnitude storms (eg 100-year) or lower (eg 25-year) The goal is to maximize retentiondetention capacity given site and cost constraints as well as through an evaluation of the benefit of adding capacity to detainretain water for larger storm events
NYC Mayorrsquos Office of Recovery and Resiliency Climate Resiliency Design Guidelines
18
2 Incorporating climate change projections into DEP drainage planning
The first line of defense for managing intense precipitation events does not require changes to the sewer system as described above For drainage and wastewater infrastructure planning in a changing climate the sewer network and wastewater infrastructure should be qualitatively evaluated from the upstream pipes to the regulator chambers pump stations interceptors and ultimately to the downstream outfall to determine the feasibility of incorporating climate change projections into the system design For DEP storm sewer projects FY 2021 or later in separately sewered drainage areas where the design is in the early stages and there is free discharge the agency will evaluate the feasibility of revising the design to incorporate climate projections into the design If the project (including the prescribed changes) passes the costbenefit analysis then DEP will consider incorporating climate change projections into the sizing However changes in one part of the system must be carefully evaluated For example any upsizing of the regulator chamber or the high point of the system can negatively impact the design and operation of the wastewater infrastructure and residencesbusinesses on the system and can lead to a diminished the level of service
DEP is in the process of developing a hydrologic and hydraulic (HampH) model to estimate runoff flow for future climate scenarios and is evaluating rainfall hyetographs for the existing and future rainfall scenarios to be included in the drainage planning process In addition DEP currently coordinates with ORR for drainage planning as a part of coastal resiliency projects A more detailed methodology to incorporate climate change projections into drainage planning will be developed for version 30 of the Climate Resiliency Design Guidelines to be released in April 2019
IIB INCREASING PRECIPITATION
NYC Mayorrsquos Office of Recovery and Resiliency Climate Resiliency Design Guidelines
19IIC SEA LEVEL RISE
non-critical components within a larger facility or campus (eg at a maintenance yard differentiate between structures and equipment) Critical components essential to the facilityrsquos functionality should be protected to the higher standard for criticality even if the facility itself may be non-critical Some examples of critical components include electrical distribution and switching areas motor-control centers chemical feed equipment boilers communications systems monitoring and safety equipment HVAC units fire alarms and suppression equipment furnaces elevators emergency fuel supplies emergency generators and hazardous material storage Component protection should also be evaluated if a facility is expected to be fully operational during a flood event or if it is expected to quickly resume full operations after an event
For buildings and infrastructure with a long useful life it is not always cost effective or operationally feasible to design a facility to be resilient to hazards faced at the end of its useful life In these cases the most resilient design will be one that provides extra protection against hazards in the initial decades while also leaving open design alternatives for updating resiliency measures as new data is provided or new risk assessments are completed This flexible adaptation pathways approach builds in options to protect assets later in life as demonstrated in an example shown in Figure 1 (in Section I)
Other considerations to keep in mind includebull These Guidelines apply to all City capital projects except coastal flood protection
systems which are designed to different standards than those provided here for
C SEA LEVEL RISEThis section provides tools to 1) determine if the project will be subject to tidal inundation during its useful life due to sea level rise and 2) incorporate sea level rise into flood protection levels of capital projects For projects in the current and future 1 annual chance floodplains sea level rise-adjusted design flood elevations (DFE) are provided and reflect the criticality of the asset and its useful life Background NYC has experienced the devastation of coastal storms most recently during Hurricane Sandy Sea level rise is projected to increase the depth extent and frequency of flooding from storm surge45 Sea level rise will also regularly inundate some low-lying areas during high tides Current flood protection heights are determined by using the base flood elevation established by the FEMA Preliminary Flood Insurance Rate Map (PFIRM) 201546 and the standard of protection for buildings in the floodplain in Appendix G of the NYC Building Code47 These Guidelines augment existing requirements for two primary purposes ensuring City facilities built today incorporate sea level rise and critical assets (as defined in Table 4) are protected to a higher level It is important to note that all projects and design interventions must comply with NYC Building Code
Designers should differentiate between critical and
45 New York City Panel on Climate Change Report Chapter 2 Sea Level Rise and Coastal Storms (2015)46 However NYC Building code G10222 requires that designers review both the PFIRM and the effective FIRM and use the more
restrictive of the two 47 For information on the differences between FEMA FIRM PFIRM and the Cityrsquos forward-looking flood maps see Appendix 3
Critical components essential to the facilityrsquos functionality should be protected to the higher standard for criticality even if the facility itself is non-critical
NYC Mayorrsquos Office of Recovery and Resiliency Climate Resiliency Design Guidelines
20IIC SEA LEVEL RISE
buildings and other physical infrastructure Many of NYCrsquos coastal flood protection systems are currently being developed to comply with FEMA accreditation for flood levee systems48 The City plans to develop further guidance for designing coastal protection projects
bull For information on the differences between FEMA FIRM PFIRM and the Cityrsquos forward-looking flood maps see Appendix 3
bull Coincident stressors from sea level rise should also be considered For example bridge scour may increase as sea levels rise Similarly flooding during heavy rainfall events can be worsened due to higher tailwater conditions associated with high sea levels Be aware of how different risks may interact and how different interventions can be deployed to address multiple hazards or provide other co-benefits
bull Note projects that require discretionary approval are required to incorporate sea level rise projections as part of the NYC Waterfront Revitalization Program49 and
bull A methodology is under development that will establish a consistent citywide process for addressing legal grade which will have further implications for how sea level rise and precipitation are managed
For more information see Section IE Designers should use the resources and methods described in this section to 1) assess tidal inundation due to sea level rise and 2) address risks in the current and future floodplains
1 Assessing tidal inundation due to sea level riseTidal flooding currently affects parts of NYC and is projected to worsen as sea levels rise and inundate low-lying coastal sites during high tides When determining a site location or establishing scope of substantial improvements for other types of coastal facilities the project team will consider alternative sites outside of zones threatened with regular inundation if resiliency actions are not taken Some facilities such as wastewater treatment plants and harbor facilities need to be near the coast for operational purposes
a) Determine tidal inundation risk from sea level rise Use the Flood Hazard Mapper (httpwwwnycgovfloodhazardmapper)50 to see if your
site is in an area inundated from high tide plus sea level rise within the projectrsquos useful life For example if the useful life ends between 2040 and 2069 choose the 2050s High Tide map) Determine risk only from high tide and sea level rise separate from flood events Follow the instructions in Figure 5 and refer to the example in Figure 6 to review inundation at the end of an assetrsquos useful life
48 For more information please visit httpwwwfemagovfema-levee-resources-library49 For more information visit httpwwwnycgovwrp50 The Flood Hazard Mapper relies on publicly available data to present these map resources Users should also refer to FEMA and the
NPCC for official information
Figure 5 - Flood Hazard Mapper high tide plus sea level rise at httpwwwnycgovfloodhazardmapper
NYC Mayorrsquos Office of Recovery and Resiliency Climate Resiliency Design Guidelines
21IIC SEA LEVEL RISE
b) Address flood risk If the Flood Hazard Mapper shows that the facility is expected to be inundated by
high tides within its useful life or if primary access roads are at risk of inundation consider alternative site options
- OR - If the site is not expected to be regularly inundated by tides proceed to the next
section 2 Addressing Risks in the Current Floodplain
Note on calculating tidal inundations with sea level rise if a project team is interested in understanding the depth of tidal inundation given climate change projections follow these steps First determine the Mean Higher High Water (MHHW) elevation in feet-NAVD 8851 datum nearest to the site If the MHHW data is unavailable from a site specific survey refer to httpwwwnycgovwrp for a list of MHHW elevations (NAVD88) at tide stations across the city52 Second add the high estimate (90th percentile) of expected sea level rise (see Table 8 in Appendix 2) for the year corresponding to the facilityrsquos useful life to the MHHW to determine the projected depth of tidal inundation with sea level rise
51 North American Vertical Datum of 1988 (NAVD 88) is the vertical control datum of orthometric height established for vertical control surveying in the US based upon the General Adjustment of the North American Datum of 1988
httpswwwngsnoaagovdatumsvertical52 SLR elevations at httpwwwnycgovwrp are adjusted to account for sea level rise since the last tidal epoch If no other resource is
available to determine MHHW use the NOAA Online Vertical Datum Transformation tool to calculate the MHHW in feet-NAVD
Figure 6 - Flood Hazard Mapper with high tide in the 2020s (left) and in the 2080s (right) at httpwwwnycgovfloodhazardmapper
NYC Mayorrsquos Office of Recovery and Resiliency Climate Resiliency Design Guidelines
22IIC SEA LEVEL RISE
2 Addressing risks in the current floodplain53
A facility located in the current 1 annual chance floodplain (PFIRM 2015)54 will face increasing risk of flooding during its useful life due to sea level rise increasing the depth of coastal storms This section provides a process for adjusting the design flood elevation required by code to account for sea level rise
a) Find the location of the facility using the Flood Hazard Mapper (httpwwwnycgovfloodhazardmapper) and follow the instructions in Figure 7
bull Choose to view the layer ldquoFEMA Preliminary FIRM 2015rdquo bull Click on the facility site in the 1 floodplain to view the base flood elevation
Figure 7 - Flood Hazard Mapper with FEMA PFIRM (2015) at wwwnycgovfloodhazardmapper
b) If the facility is not in the current 1 annual chance floodplain (PFIRM 2015) proceed to the next section ldquo3 Addressing risks in the future floodplainrdquo
- OR - If the facility is in the current 1 annual chance floodplain (PFIRM 2015) note
the base flood elevation (BFE) and proceed to Step c) below Please note if a facility has multiple BFEs or if the site is partially in the 1 annual chance floodplain it is recommended to use the highest BFE as the current BFE for the entire site
c) Establish a sea level rise-adjusted DFE Use the current base flood elevation at your site the facilityrsquos useful life and its
criticality level to determine the design flood elevation using Table 4 (on the next page) as a basis of design
53 This process for adjusting the design flood elevation to account for sea level rise satisfies the criteria of the climate-informed science approach described at the state and federal level
54 FEMA updates its flood maps periodically As of April 2018 the most recent maps are the Preliminary Flood Insurance Rate Maps (PFIRM) available at DCPrsquos Flood Hazard Mapper (httpwwwnycgovfloodhazardmapper) Also note that NYC Building Code requires developers to use the PFIRM (2015) or the FIRM (2007) whichever is more restrictive For more information on these requirements please refer to Appendix G of the NYC Building Code Please note that the DCP maps are not official and all site locations should be confirmed with the official FEMA PFIRM NYC will provide information on the latest flood maps as they are updated
NYC Mayorrsquos Office of Recovery and Resiliency Climate Resiliency Design Guidelines
23IIC SEA LEVEL RISE
Table 4 - Determine the sea level rise-adjusted design flood elevation for critical and non-critical facilities55
Critical facilities
End of useful life Base Flood Elevation (BFE)56 in NAVD 88 + Freeboard57 + Sea Level Rise
Adjustment58= Design Flood Elevation (DFE) in
NAVD 88Through 2039 FEMA 1 (PFIRM) 24rdquo 6rdquo = FEMA 1 + 30rdquo
2040-2069 FEMA 1 (PFIRM) 24rdquo 16rdquo = FEMA 1 + 40rdquo2070-2099 FEMA 1 (PFIRM) 24rdquo 28rdquo = FEMA 1 + 52rdquo
2100+ FEMA 1 (PFIRM) 24rdquo 36rdquo = FEMA 1 + 60rdquoNon-critical facilities
End of useful life Base Flood Elevation (BFE) in NAVD 88 + Freeboard + Sea Level Rise
Adjustment = Design Flood Elevation (DFE) in
NAVD 88Through 2039 FEMA 1 (PFIRM) 12rdquo 6rdquo = FEMA 1 + 18rdquo
2040-2069 FEMA 1 (PFIRM) 12rdquo 16rdquo = FEMA 1 + 28rdquo2070-2099 FEMA 1 (PFIRM) 12rdquo 28rdquo = FEMA 1 + 40rdquo
2100+ FEMA 1 (PFIRM) 12rdquo 36rdquo = FEMA 1 + 48rdquoAdditional analysis should be conducted to incorporate wave action and wave run-up in DFE calculations especially in areas that are located within the FEMArsquos 1 annual chance Limit of Moderate Wave Action (LiMWA) zone Wave run up is the maximum vertical extent of wave uprush above surge
Definition of critical buildings and infrastructure for determining DFE in Table 4The criticality definitions below are for use in the application of the Guidelines only All items identified as critical in NYC Building Code Appendix G are critical in these guidelines however this list includes additional facilities that are not listed in Appendix G59 If a facility is not listed here it is considered non-critical for the purposes of determining freeboard
bull Hospitals and health care facilitiesbull Fire rescue ambulance and police stations and emergency vehicle garages bull Jails correctional facilities and detention facilities bull Facilities used in emergency response including emergency shelters emergency preparedness communication
operation centers communication towers electrical substations back-up generators fuel or water storage tanks power generating stations and other public utility facilities
bull Critical aviation facilities such as control towers air traffic control centers and hangars for aircraft used in emergency response
bull Major food distribution centers (with an annual expected volume of greater than 170000000 pounds)60 bull Buildings and other structures that manufacture process handle store dispose or use toxic or explosive
substances where the quantity of the material exceeds a threshold quantity established by the authority having jurisdiction and is sufficient to pose a threat to the public if released61
bull Infrastructure in transportation telecommunications or power networks including bridges tunnels (vehicular and rail) traffic signals (and other right of way elements including street lights and utilities) power transmission facilities substations circuit breaker houses city gate stations arterial roadways telecommunications central offices switching facilities etc
bull Ventilation buildings and fan plantsbull Operations centersbull Pumping stations (sanitary and stormwater)bull Train and transit maintenance yards and shopsbull Wastewater treatment plantsbull Water supply infrastructurebull Combined-sewer overflow (CSO) retention tanksbull Fueling stationsbull Waste transfer stations and bull Facilities where residents have limited mobility or ability including care facilities and nursing homes
55 If an industry standard does not include freeboard in its flood protection standards for particular infrastructure assets then only consider the sea level rise adjustment when determining flood protection levels
56 Note that NYC Building Code requires developers to use the PFIRM (2015) or the FIRM (2007) whichever is more restrictive For more information on these requirements please refer to Appendix G of the NYC Building Code
57 These freeboard values reflect NYC Building Code Appendix G Table 2-1 which establishes the minimum elevation of the top of lowest floor Appendix G requires other freeboard values for other parts of structures and in different parts of the floodplain Refer to Appendix G for the appropriate freeboard and use that value in Table 4 above
58 The sea level rise figures provided are for the middle of the 25th-75th percentile range projections from the NPCC These values do not necessarily indicate the average of all models
59 The structural occupancy categories outlined in Appendix G of the NYC Building Code are the same as ASCE 7 used for structural design For critical buildings structural design should comply with ASCE 7 and 24 for design class IV
60 This threshold represents the median volume of main food distributors in NYC according to statistics collected as part of the Five Borough Food Flow study in 2016 available at
httpswwwnycedccomsystemfilesfilesresource2016_food_supply-resiliency_study_resultspdf 61 The threshold quantity for hazardous materials is established by Chapter 7 of Title 24 of the NYC Administrative Code
NYC Mayorrsquos Office of Recovery and Resiliency Climate Resiliency Design Guidelines
24IIC SEA LEVEL RISE
Figure 9 ndash Outdoor emergency generator for the critical building
This case study provides an example of how to calculate a sea level rise-adjusted DFE based on the useful life of a hypothetical critical services building and its primary component
Step 1 Organize the site by various critical or primary components and their year of construction Determine their useful life along with the associated future year scenario for flood risk assessment In this example the building structure and the outside emergency generator are the most at-risk components from combined sea level rise and coastal storm surge
Step 2 Overlay the site footprint area over the effective current PFIRM or FIRM and the corresponding future year scenario FEMA 1 to identify flood risk to the site From overlaying the 2015 preliminary FEMA floodplain over the site it was determined that the site has a 1 annual chance of flooding with a base flood elevation of 13rsquo NAVD Step 3 Evaluate the criticality of each primary component of the facility based on the Guidelinesrsquo definition for critical infrastructure (Table 4) This (hypothetical) building is critical
Step 4 Use Table 4 to determine the sea level rise adjustment and freeboard requirements for each component and calculate the DFE for each that corresponds to its useful life period
Step 5 Compare the DFE of each component and the associated Guidelinesrsquo recommended DFE to calculate anticipated flood depth
CASE STUDY Adjusting the DFE for Sea Level Rise
Table 5 ndash Example of how to calculate a sea level rise-adjusted DFE for a critical facility
Construction year Components Useful
Life
Future Year Scenario
[Useful Life + Const
Year]
BFE in NAVD
88 (feet)
Freeboard + Sea
Level Rise Adjustment
(feet)
Adjusted DFE in
NAVD 88 (feet)
2010 Building Structure
70 years 2070-2099 130rsquo 2rsquo+23rsquo 173rsquo
2010Outdoor
Emergency Generator
25 years
Through 2039 130rsquo 2rsquo+05rsquo 155rsquo
Figure 8 - Example of how to locate a facility within the current floodplain and determine the BFE Figure 9 (inset) - Outdoor emergency generator at the facility
Figure 10 - This schematic shows how to determine the design flood elevation of a facility within the current 1 floodplain
Illustrative not to scale
NYC Mayorrsquos Office of Recovery and Resiliency Climate Resiliency Design Guidelines
25IIC SEA LEVEL RISE
Figure 11 - Flood Hazard Mapper with future 1 annual chance floodplain (adjusted for sea level rise) at httpwwwnycgovfloodhazardmapper
b) If the site is not in the future floodplain no flood protection is required for this facility
- OR - If the site is in the future floodplain identify the nearest adjacent base flood
elevation at the project site in the current 1 annual chance floodplain (PFIRM 2015) using the Flood Hazard Mapper62
c) Use Table 4 to determine the DFE Add freeboard and the sea level rise-adjustment to the nearest adjacent BFE on the
current 1 annual chance floodplain (PFIRM 2015) to determine the DFE
d) Apply the DFE calculation from Table 4 to the protected facility See Figures 12 and 13 for an illustration of how to calculate the DFE
62 Maps of future floodplains show the impacts of sea level rise alone and do not consider how changes in stormsrsquo climatology might also affect wave action and the full extent of the floodplain
3 Addressing risks in the future floodplainIf the facility is not in the current 1 annual chance floodplain (PFIRM 2015) it may still be at risk in the future from flooding as sea level rise increases the extent of the floodplain Follow the steps below to determine if your facility is located in the future floodplain and if so what sea level rise-adjusted DFE to use
a) Use the Flood Hazard Mapper (httpwwwnycgovfloodhazardmapper) to determine if the facility site will be in the future 1 annual chance floodplain
Assess if by the end of the facilityrsquos useful life the floodplain is projected to increase to encompass all or part of the project site For example if the useful life ends between 2040 and 2069 choose the 2050s floodplain map Refer to the steps in Figure 11 below
NYC Mayorrsquos Office of Recovery and Resiliency Climate Resiliency Design Guidelines
26IIC SEA LEVEL RISE
Figure 12 - This schematic map shows how to locate the nearest adjacent 1 floodplain elevation
Figure 13 -This schematic shows how to determine the design flood elevation of a facility that is outside of the current 1 floodplain
CASE STUDY Identifying a Base Flood Elevation (BFE) in the Future Floodplain
Illustrative not to scale
NYC Mayorrsquos Office of Recovery and Resiliency Climate Resiliency Design Guidelines
27IIC SEA LEVEL RISE
4 Identify appropriate design interventions
63 Additional resources for identifying adaptive strategies Urban Waterfront Adaptive Strategies (NYC Department of City Planning httpswww1nycgovassetsplanningdownloadpdfplans-studiessustainable-communitiesclimate-resilienceurban_waterfrontpdf Floodproofing Non-Residential Buildings (FEMA) at httpswwwfemagovmedia-libraryassetsdocuments34270 Ready to Respond Strategies for Multifamily Building Resilience (Enterprise Green Community) at
httpwwwenterprisecommunityorgresourcesready-respond-strategies-multifamily-building-resilience-1335664 While natural systems-based approaches ameliorate flooding their use for storm surge or wave mitigation would need to be quantified
before contributing towards the design flood elevation 65 For more information see FEMArsquos Floodproofing Non-Residential Buildings at httpswwwfemagovmedia-libraryassetsdocuments34270
Operational requirements and continuity plans can inform the selection of appropriate design interventions particularly in terms of how quickly a site needs to be up and running after a flood event Some examples of how functional uses can pair with interventions include
bull A facility that needs to be operating during or immediately after a flood event may need to be dry floodproofed using permanent barriers or designed for passive survivability (such as a police or fire station)
bull A facility that needs to recover quickly after an event could elevate prioritized equipment and have deployable barriers
bull A site that can recover over a longer duration of time could be temporarily inundated during an event (such as parks or plazas) The use of resilient materials and strategies can reduce costly damage caused by temporary inundation
Different design interventions should be chosen based on the specific operational requirements of the project however these must meet the ASCE 24 design requirements for Coastal VE Zones
For all projects at risk of current or future flooding select protections that meet the projectrsquos design flood elevation Consider project-specific factors including the site location operational requirements existing continuity planning and cost63 A Design Strategies Checklist in Appendix 6 is available for use as a resource to track possible design approaches Some examples of design alternatives are
bull Site relocation where feasible conduct alternative site analysis
bull Permanent barriers at a site (eg floodwalls)
bull Deployable flood barriers (eg stop logs flood doorsgates inflatable barriers)
bull Natural systems-based approaches (eg living shorelines restored wetlands)64
bull Prioritized protection of electrical mechanical and other critical or costly-to-replace equipment above the design flood elevation (eg motors and controller boilers and furnaces fuel storage tanks duct work alarm systems and suppression equipment electrical panels electrical distribution and switching areas gas and electric meters telecommunications equipment chemical feed equipment HVAC units and emergency generators)65
bull Dry floodproofing design a facility to prevent water from entering
bull Wet floodproofing design a facility to permit floodwaters to flow in and out of the structure without causing significant damage (eg elevate or protect critical equipment use water-resistant building materials below the design flood elevation include flood vents and pumps)
bull Design redundant telecommunications conduit entrances for multiple carrier entry Telecom conduit should run to diverse manholes when possible
bull Install backup power for telecom equipment with design consideration for such equipment (eg installation above DFE)
bull Install outdoor-rated disconnect switch for telecommunications equipment on the roofbull Explore interventions to protect underground utilities and other telecommunications
facilities from water damagebull Install backflow preventers backwater valves and sump pumps for all buildings and
infrastructure in the floodplain as well as behind flood barriersbull Shoreline improvements that reduce the height of waves or attenuate waves where
feasible
NYC Mayorrsquos Office of Recovery and Resiliency Climate Resiliency Design Guidelines
28IIIA GENERAL METHODOLOGY TO ESTIMATE PROJECT BENEFITSIIIB CATEGORIES OF PROJECT BENEFITS
Designing and constructing facilities to handle the future climate loads above the current NYC codes and standards based on projected useful life of the components provides resiliency benefits The incremental costs to implement the Guidelinesrsquo recommended design interventions should be compared with the incremental benefits to aid agencies in making decisions about resilient design strategies The project design team should evaluate benefits of the interventions designed to meet Guidelinesrsquo recommended criteria for all the climate stressors qualitatively andor quantitatively For projects with construction costs below $50 million the project design team is recommended to perform a qualitative benefits assessment on the interventions that meet the Guidelinesrsquo recommendations for all applicable climate stressors For critical facilities or projects with construction costs over $50 million the project design team is recommended to perform quantitative benefit calculations to identify the optimal interventions that meet Guidelinesrsquo recommended design criteria
A GENERAL METHODOLOGY TO ESTIMATE PROJECT BENEFITSThis general methodology to perform qualitative and quantitative benefit calculations is recommended for use by project design teams at the beginning of and during the design process This methodology enables estimation of project benefits for a high-level benefit-cost analysis (BCA) that can be applied to evaluate and compare resiliency features designed to address sea level rise with coastal storm surge increased precipitation and extreme heat events The type of benefits provided by interventions designed to meet the Guidelinesrsquo design criteria can vary by climate stressors and typology of the facilities The main guiding principle in development of the high-level BCA methodologies included in these Guidelines was to balance simplicity with accuracy The project benefits categories identified within the methodology may not cover all the potential benefits provided by every facility type within NYC In particular the benefits of planning for increased precipitation are difficult to quantify Hence the project design team should use their discretion to modify this general benefit calculation methodology as needed to meet their project goals and objectives The project design team should develop appropriate input data whether quantitative or qualitative needed to estimate project benefits
B CATEGORIES OF PROJECT BENEFITSThere are three types of project benefit categories - direct benefits indirect benefits and other benefits - that can be used to perform qualitative assessments and develop quantitative estimates of monetary benefits for intervention alternatives designed to meet the Guidelinesrsquo recommendations These project benefit categories will help to perform a high-level benefit-cost analysis that balances accuracy with an appropriate level of effort
bull Direct Benefits include reduced or avoided physical damages to facilities and contents reduced or avoided displacements for residential structures and reduced life cycle or OampM costs that can be quantified as a primary result of implementing a specific hazard mitigation measure Table 12 in Appendix 4 provides a list of direct benefits and basic guidance on estimating and documenting values for sea level rise and increased precipitation-related flood hazards Note that given the current state of practice it is not possible to quantify reduced or avoided physical damages or residential displacements that result from a specific extreme heat mitigation measures Therefore direct benefits applicable to extreme heat hazards are limited to reduced life cycle costs applicable to certain measures such as green roofs Refer to Table 15 for details on direct benefits for extreme heat hazards
III EVALUATION OF PROJECT BENEFITS
NYC Mayorrsquos Office of Recovery and Resiliency Climate Resiliency Design Guidelines
29IIIB CATEGORIES OF PROJECT BENEFITS
bull Indirect Benefits include reduced or avoided service losses for non-residential
buildings public facilities andor infrastructure (utilities roads and bridges) based on the value of service continuity andor emergency services to New Yorkers that can be quantified as a secondary result of implementing a specific hazard mitigation measure Table 13 in Appendix 4 provides a list of indirect benefits and basic guidance on estimating and documenting values for sea level rise and increased precipitation-related flood hazards Note that given the current state of practice on extreme heat it is not possible to quantify reduced or avoided service losses that result from a specific extreme heat mitigation measures Therefore indirect benefits applicable to extreme heat hazards are limited to reduced energy costs such as cool roofs green roofs or shade trees Refer to Table 15 in Appendix 4 for details on indirect benefits for extreme heat hazards
bull Other Benefits where applicable other potential benefits may include social benefits for residents such as avoided stress and anxiety avoided lost productivity environmentalecosystem service benefits avoided need for emergency services and other potential benefits that can be estimated as a result of implementing a specific hazard mitigation measure Table 14 in Appendix 4 provides a list of other potential benefits and basic guidance on estimating and documenting values for sea level rise and increased precipitation-related flood hazards
Note on the ecosystem service benefit category in Table 14 the stormwater management benefits of green infrastructure should be distributed between the extreme heat and increased precipitation hazards since these measures provide both significant reductions in rainfall runoff as well as Urban Heat Island mitigation through evapotranspiration However there is currently limited data available to quantify the actual distribution of stormwater management benefits between the two hazards For various dual-benefit providing interventions careful considerations should be given to identify the appropriate benefits category provided by the intervention with a goal to avoid duplication of quantified benefits In this methodology the stormwater management benefits of green infrastructure are applied to the increased precipitation hazard in order to avoid a duplication of benefits Note on real estate and quality of life benefits additionally it is important to note that two potential benefit categories shown in Table 14 - real estate and quality of lifehealthavoided casualties - were not included in the current BCA methodology for sea level rise or increased precipitation hazards Although these categories could increase project benefits for sea level rise and increased precipitation hazards they were only applied to measures that address extreme heat hazards such as green roofs trees and other plantings Refer to Table 15 for a detailed summary of other benefit categories quantified as unit benefits for extreme heat hazards
NYC Mayorrsquos Office of Recovery and Resiliency Climate Resiliency Design Guidelines
30IIIC WHICH METHODOLOGY TO USEIIID BCA METHODOLOGY FOR PROJECTS UNDER $50 MILLION
D BCA methodology for projects under $50 millionThe project design team should develop design alternatives to meet the Guidelinesrsquo criteria which may be in excess of NYC code and standards requirements (baseline conditions) It is assumed that the project design team will develop alternatives to address each of the following applicable climate stressors - sea level risecoastal storm surge increased precipitation and extreme heat - separately Tables 12-15 in Appendix 4 provides a list of typical direct indirect and other benefits provided by various intervention typologies to reduce impacts from climate stressors During the qualitative assessment the project design team should consider that intervention strategies will have varying levels of reliability effectiveness benefits and cost implications during the qualitative assessment
The project design team is recommended to develop appropriate evaluation criteria and metrics for each of the applicable project benefit categories For each alternative the project design team could use either a scoring weighting ranking or other type of qualitative assessment framework to assess each applicable project benefit categories with the developed evaluation criteria and metrics Table 6 provides an example template to evaluate alternatives using a set of general evaluation criteria and metrics using a color-coded rating system (and see Table 7 for an example of how to complete the template) The project design team can utilize a similar template customized to their project goals and objectives This assessment allows agencies to screen the qualitative benefits for various alternatives that would then lead to development of final project components to match the available budget and goals of the project
Projects with total costs below $50 million recommended to conduct a qualitative assessment to identify the optimal interventions that meet Guidelinesrsquo design criteria using the ldquoD) BCA methodology for projects under $50 millionrdquo methodology below
C WHICH METHODOLOGY TO USEProjects with a total cost above $50 million or are highly complex or critical facilities recommended to conduct both a qualitative and quantitative benefit calculation to identify the optimal interventions that meet Guidelinersquos design criteria using the ldquoE) BCA methodology for projects above $50 millionrdquo below A quantitative BCA also must include qualitative factors
NYC Mayorrsquos Office of Recovery and Resiliency Climate Resiliency Design Guidelines
31IIID BCA METHODOLOGY FOR PROJECTS UNDER $50 MILLION
Qualitative Color Scale Green=Least resource intensive alternative Purple=most resource intensive yellow=medium level of resource intensity
Qualitative Evaluation Factors Description Relative Color Rating System
First CostsAdditional construction costs needed to incorporate Guidelinesrsquo recommended resilient design over the baseline project costs
Highest cost ($$$) rated as Purple whereas lowest cost ($) rated as Green
ConstructabilityEase of Implementation
Construction techniques and site conditions such as presence of major utilities conflicts and other conditions which dictate the level of constructability required for each alternative
Difficult to construct rated as Purple whereas easiest to construct rated as Green
Environmental ImpactsCo-BenefitsPermitting
Impacts to the built and natural environment such as circulation noise and hazardous waste plus the level of effort required for permitting (eg interventions in water require highest level of permitting requirement) from each alternative in addition to the baseline project condition
Highest environmental impacts and highest level of effort required for permitting rated as Purple whereas the least impact and level of effort rated as Green
Operation and Maintenance (OampM)
Level of effort of additional manpower and cost of OampM for the alternatives over the baseline project OampM requirements
Highest level of effort and cost for OampM rated as Purple whereas the lowest is rated as Green
Reliability and Durability
Interventions that do not require human involvement or a facilityrsquos ability to withstand all the forces during a storm event (eg permanent solutions with higher reliability than deployable solution)
Interventions requiring human involvement (active measures) rated as Purple whereas interventions with minimal or no human involvement (passive measures) rated as Green
Risk Reduction Benefits Monetary benefits provided by each intervention alternative in avoided damages over the baseline condition
Lowest potential monetary benefit rated as Purple whereas as highest potential monetary benefit rated as Green
Quality of Life BenefitsVisual Aesthetics
Benefits either to the community such as recreation or safety or serve the community during emergency situations
Lowest potential quality of life benefits rated as Purple whereas as highest potential benefits rated as Green
Table 6 ndash Evaluation matrix for comparison of mitigation alternatives across the useful life of a project
Project title_______________________________________________________________________________
Evaluation Criteria
Baseline Condition (Designed to NYC Building Code and
Standards)
Resilient Design Alternatives for Managing__________________
Alternative 1
Alternative 2
Alternative 3
First Costs
ConstructabilityEase of ImplementationEnvironmental ImpactsCo-BenefitsPermitting
Operation and Maintenance (OampM)
Reliability and Durability
Risk Reduction Benefits
Quality of Life BenefitsVisual Aesthetics
NYC Mayorrsquos Office of Recovery and Resiliency Climate Resiliency Design Guidelines
32IIID BCA METHODOLOGY FOR PROJECTS UNDER $50 MILLION
Table 7 ndash Evaluation matrix for comparison of mitigation alternatives across the useful life of a project - COMPLETED EXAMPLE
Evaluation Criteria
Baseline Condition (Designed to NYC Building Code and
Standards)
Resilient Design Alternatives for Managing Coastal SurgeSLR
Alternative 1Flood proof building built on grade to Guidelines
DFE
Alternative 2 Elevate building structure above Guidelinesrsquo DFE
on columns
Alternative 3 Raise site grade by filing the building site footprint
to Guidelinesrsquo DFE
First CostsBaseline cost for building structure is $15 million
Incremental costs are within 5 over the baseline costs
Incremental costs are between 5-10 over baseline costs
Incremental costs are 20 and more over baseline costs
ConstructabilityEase of Implementation
Relatively easy to construct within site constraints
Similar to baseline conditions since construction requires additional flood proofing only
Moderate challenges to construct foundation structure for columns within site constraints
Extremely challenging to construct within the site constraints Potentially fatal flaw
Environmental ImpactsCo-BenefitsPermitting
No major impacts but may require additional effort to obtain DOB permits with flood proofing and deployable systems
No major impacts but may require additional effort to obtain DOB permits with flood proofing and deployable systems
No major impacts and relatively easy to permit
Potential drainage circulation impacts and challenges to obtain clean fill material for the site
Operation and Maintenance (OampM)
Major OampM costs associated with deployable systems
Major OampM costs associated with deployable systems
Moderate OampM costs associated with proposed elevator for access
Minimal OampM costs since deployable and elevators not required
Reliability and Durability
Least reliability with highest potential risk from flooding during to failure of deployable systems
Least reliability with highest potential risk from flooding during to failure of deployable systems
Moderate reliability with potential risk from flooding limited to elevator shaft only
Highest reliability since deployable are not required to protect building from flooding
Risk Reduction Benefits
Maximum flood risk reduction benefits assuming deployable and flood proofing is effective
Maximum flood risk reduction benefits assuming deployable and flood proofing is effective
Maximum flood risk reduction benefits
Maximum flood risk reduction benefits
Quality of Life BenefitsVisual Aesthetics
Facility may not be operational during the storm event
Facility may not be operational during the storm event
Facility can be potentially operational during the storm event
Facility can be potentially operational during the storm event
Qualitative Color Scale Green=Least resource intensive alternative Purple=most resource intensive yellow=medium level of resource intensity
A new non-critical facility with a building structure is proposed on a site that is currently in the 2015 Preliminary FEMA 1 annual chance floodplain with a BFE of 10rsquo (NAVD 88) The baseline conditions DFE to meet existing NYC codes and standards is 11rsquo (NAVD 88) Using the Guidelines recommended design criteria the facilityrsquos DFE is 133rsquo (NAVD 88) and existing grade is around 6rsquo (NAVD 88) The project design team develops three alternatives to meet the Guidelinesrsquo recommended DFE design for the facility Table 7 offers an example of how a qualitative assessment can be used to compare three resilient design alternatives using the evaluation criteria and metrics
CASE STUDY Example of How to Use the Evaluation Matrix
NYC Mayorrsquos Office of Recovery and Resiliency Climate Resiliency Design Guidelines
33IIIE BCA METHODOLOGY FOR PROJECTS OVER $50 MILLION
E BCA methodology for projects over $50 millionIn order for a project to be considered cost-effective a benefit-cost analysis (BCA) assesses if the benefits of a project outweigh its costs or in other words the benefit-cost ratio (BCR) is greater than 10 as illustrated in Equation 1
Equation 1 Benefit-Cost Ratio Formula
BCR =
Where BCR = Benefit-Cost Ratio
BENEFITS = Total project benefits
COSTS = Total project costs
BENEFITSCOSTS
These estimated project benefits are combined with the project costs which are defined as the differential construction and long-term operation and maintenance costs associated with constructing a proposed project to the Guidelinesrsquo recommended design level It is assumed that the baseline project will be designed to the most prevalent NYC codes and standards This benefit methodology should be used to determine the additional project benefit that the Guidelinesrsquo recommended design would provide over the baseline project benefit It is assumed that the project design team will develop alternatives to address each of the following applicable climate stressors - sea level risecoastal storm surge increased precipitation and extreme heat - separately For each alternative the project design team should use the following steps to determine the Benefit-Cost Ratio (BCR)
a) Determine project useful life for design interventions Determining the useful life of the proposed project is an important first step in the
detailed BCA assessment methodologies for two reasons First the project useful life determines what values must be used from the Guidelines to establish the future climate design conditions The various hazard tables in the Guidelines establish design requirements based on useful life ranges through 2039 2040-2069 2070-2099 and 2100+ (2100+ projections are only available for sea level rise) A review of these tables show that the design requirements needed to meet the projected climate hazards increase as the end of useful life range increases Second the useful life determines how long the project will need to be operated and maintained in order to remain technically sound and effective at reducing future damages and losses
b) Determine discount rate for project benefits calculation The cost-effectiveness of projects assessed using the BCR must be done on a net
present value basis meaning the present value of the benefits is compared to the present value of the costs Most project costs are computed for present value based on current cost estimates bids or cost guidance However project benefits - as well as project costs for operation and maintenance - accrue over time into the future and are computed on an annualized basis To address this issue the Present Value Coefficient (PVC) is used to bring these annualized project benefits and OampM costs into the present value As indicated by the formula in Equation 2 the PVC is a function of the Project Useful Life (PUL) and the Discount Rate (DR)
NYC Mayorrsquos Office of Recovery and Resiliency Climate Resiliency Design Guidelines
34
Equation 2 Present Value Coefficient (PVC) Formula
PVC =
Where PVC = Present Value Coefficient
PUL = BCA Project Useful Life based on project type
DR = Discount Rate
The project design team should coordinate with agencies and NYC OMB if needed to determine appropriate discount rates based on funding source project type and other factors This coordination should take place during project initiation phase where total project costs (design and construction) are over $50 million66
c) Develop input data to perform benefit calculations Tables 16 and 17 in Appendix 4 provide a list of typical input data by each climate
stressor needed to perform benefit analysis quantitatively on variety of facilities67 The project design team should use these tables as a reference to identify appropriate input data categories andor additional input data needed to perform benefit analysis on the project
d) Identify applicable project benefit categories to estimate benefits Tables 16 and 17 in Appendix 4 provide a list of typical project benefits by each climate
stressor needed to perform benefit analysis quantitatively on various types of projects The project design team should use these tables as a reference to identify appropriate project benefit categories for each climate stressor to perform benefit analysis on the project
e) Calculate benefits of recommended design interventions for each climate
stressor The input data and applicable project benefits can be assembled along with
incremental project cost data to analyze cost-effectiveness using the FEMA BCA Tool Damage-Frequency Assessment (DFA) module or similar software This analysis will provide a BCR for each alternative which can then be used to compare the alternatives that were developed to mitigate effects from applicable climate stressors The project design team can then use the results from this analysis to identify optimal interventions that provides a balanced solution that provides resiliency benefits within the available project budget
IIIE BCA METHODOLOGY FOR PROJECTS OVER $50 MILLION
[1 ndash (1 + DR) -(PUL)]DR
66 For example a NYC OMB March 2015 memorandum recommends using an annually updated DR as published each year in Appendix C of OMB Circular A-94 The current OMB-recommended discount rates from OMB A-94 Appendix C vary by project useful life and are as follows 21 DR for useful lives of 10 to 19 years 25 DR for useful lives of 20 to 29 years and 28 DR for useful lives of 30 years or greater By contrast FEMA hazard mitigation grants use a DR of 70 for all projects based on the Federal OMB A-94 rate for federally-funded mitigation measures Since these DRs will impact the PVC and the project benefits the project team must ensure that BCA results prepared using an OMB-recommended DR (21 to 28) be updated to reflect the Federal DR (70) when applying for FEMA mitigation grant funds
67 Note the data requirements for the sea level rise and increased precipitation hazards in Table 16 are more detailed than the requirements for the extreme heat hazards due to the less detailed level of analysis available for extreme heat
NYC Mayorrsquos Office of Recovery and Resiliency Climate Resiliency Design Guidelines
35
APPENDICES
NYC Mayorrsquos Office of Recovery and Resiliency Climate Resiliency Design Guidelines
36APPENDIX 1 ndash KEY TERMS
100-year flood (1 annual chance flood)
A flood that has a 1 probability of occurring in any given year The 100-year floodplain is the extent of the area of a flood that has a 1 chance of occurring or being exceeded in any given year
500-year flood (02 annual chance flood)
A flood that has a 02 probability of occurring in any given year The 500-year floodplain is the extent of the area of a flood that has a 02 chance of occurring or being exceeded in any given year
AdaptationAdjustment in natural or human systems to a new or changing environment that seeks to maximize beneficial opportunities or moderate negative effects Successful adaptations contribute to resiliency
Base flood elevation (BFE)The elevation of surface water resulting from a flood that has a 1 annual chance of occurring or being exceeded in any given year The BFE is shown on the Flood Insurance Rate Map (FIRM)69
BluebeltReference to the Department of Environmental Protectionrsquos (DEP) Bluebelt program to preserve natural drainage corridors including streams ponds and other wetland areas Preservation of these wetland systems allows them to perform their functions of conveying storing and filtering storm water
Climate
The average weather (or more rigorously a statistical description of the average in terms of the mean and variability) over a period of time usually 30 years These quantities are most often surface variables such as temperature precipitation and wind Climate in a wider sense is the state including a statistical description of the climate system70
Climate change
Changes in average weather conditions that persist over multiple decades or longer Climate change encompasses both increases and decreases in temperature as well as shifts in precipitation changing risk of certain types of severe weather events and changes to other variables of the climate system
Climate change riskThe chance that investments (such as in capital projects) can be affected by the physical impacts of climate change71 Risks are evaluated as a product of the probability of occurrence and the magnitude of damages or impacts including socioeconomic factors that would result if they did occur (consequences)
Climate change risk assessment
This assessment involves a detailed project-specific analysis that includes a vulnerability and risk assessment often followed by cost-benefit analysis to assess and select investments in climate change risk mitigation Risk is assessed as a function of the magnitude and probability of a given climate change hazard Examples resources are included in Appendix 7
Climate vulnerabilityThe degree to which systems and populations are affected by adverse impacts It is a function of the character magnitude and rate of climate change and variation to which a system is exposed its sensitivity and its adaptive capacity72
Cloudburst An extreme amount of rain in a short period of time often over a small geographic area73
Cooling Degree Day (CDD) A form of degree-day used to estimate the energy requirements for air conditioning or refrigeration when the daily mean temperature is above 65degF
68 All terms are from the US Global Change Research Program (USGCRP) glossary unless otherwise noted The USGCRP glossary is available at httpwwwglobalchangegovclimate-changeglossary
69 ldquoDefinitionsrdquo FEMA last modified March 1 2017 httpswwwfemagovnational-flood-insurance-programdefinitions70 UKCIP Glossary httpwwwukciporgukglossary71 ldquoAccount for Climate Riskrdquo International Finance Corporation 72 UKCIP Glossary httpwwwukciporgukglossary73 New York City Environmental Protection ldquoCloudburst Resiliency Planning Studyrdquo 2017 Available at httpwwwnycgovhtmldeppdfclimatenyc-cloudburst-studypdf
APPENDIX 1 - KEY TERMS68
NYC Mayorrsquos Office of Recovery and Resiliency Climate Resiliency Design Guidelines
37APPENDIX 1 ndash KEY TERMS
Design life The life expectancy of an asset or product as determined during design74 As opposed to useful life (see below)
Dry Bulb temperature The ambient air temperature measured by a thermometer
Extreme eventUnexpected unusual or unpredictable weather or flooding compared to historical or future projected distribution Extreme events include for example heat waves cold waves heavy rains periods of drought and flooding and severe storms
Facilities For the purposes of this document ldquofacilitiesrdquo refers to all types of buildings housing infrastructure structures and landscape features designed by or for the City of New York
Flexible adaptation pathwayResilience-building strategies that can evolve or be adapted over time as climate change risk assessments evaluations of adaptation strategies and monitoring continue75
Flood Insurance Rate Maps (FIRM)
Official flood map of a community on which FEMA has delineated the 1 annual chance floodplain and the base flood elevations (BFEs) applicable to the community76 The FIRM also includes the 02 floodplain annual chance floodplain and differentiates between special flood hazard areas (V A Coast A zones) and floodways The official FIRM is from the year 2007 while the 2015 PFIRM is currently required by NYC Building Code to calculate design flood elevations NYC DOB references the more restrictive of the two maps in both base flood elevation and flood hazard area (ie V versus A zone) Refer to Appendix 3 for more information
FreeboardAn additional amount of height above the base flood elevation used as a factor of safety (eg two feet above the base flood) in determining the level at which a facilitys lowest floor must be elevated or floodproofed to be in accordance with state or community floodplain management regulations77
Future time slices
Future periods defined by the NPCC for when climate change projections are available In this document the following decadal projections are associated with specific time spans2020s projection = present to 20392050s projection = 2040 to 20592080s projection = 2070 to 20992100s projection = end of century and beyond
Green infrastructureAn array of practices that use or mimic natural systems to manage urban stormwater runoff Water is either directed to engineered systems for infiltration or detained for longer periods before it enters the sewer system
Heat Vulnerability Index (HVI)Summarizes relative risk of adverse health effects from heat due to social and environmental factors Used to identify neighborhoods at higher risk during and after extreme heat events
Heat wave A period of three consecutive days where temperatures rise above 90degF or two consecutive days over 95 degrees78
New York City Panel on Climate Change (NPCC)
The body of leading climate and social scientists charged with making climate change projections for the metropolitan region79
74 Sustainable Infrastructure Management Program Learning Environment httpsimplewerforg 75 Rosenzweig C et al Climate Change Adaptation in New York City Building a Risk Management Response76 ldquoDefinitionsrdquo FEMA77 Ibid78 Horton R et al New York City Panel on Climate Change 2015 Report Chapter 1 Climate Observations and Projections Ann NY
Acad Sci ISSN 0077-8923 (New York 2015) 2579 For more information on the NPCC visit www1nycgovsiteorrchallengesnyc-panel-on-climate-changepage
NYC Mayorrsquos Office of Recovery and Resiliency Climate Resiliency Design Guidelines
38APPENDIX 1 ndash KEY TERMS
Open-grid pavement system
Pavements that consist of loose substrates supported by a grid of a more structurally sound grid or webbing Unbounded loose substrates in these systems transfer and store less heat than bound and compacted pavements and aid permeability Pavement is 50 pervious and contains vegetation in the open cells designed to allow percolation or infiltration of storm water through the surface into the soil below80
Preliminary Flood Insurance Rate Map (PFIRM)
Preliminary flood map developed by FEMA in 2015 for New York City that provides projected risks for flood hazards81 Refer to Appendix 3 for more information
Project useful life (PUL)
The period over which an asset or component is expected to be available for use by an entity This depends on regular and adequate maintenance This period of time typically exceeds the design life (see above) The combined effect of operational requirements and useful life is practical in assessing an investment in improving resilience82
Rain gardenAlso called ldquobioswalerdquo Planted areas designed to collect and manage stormwater that runs off streets sidewalks commercial and residential rooftops and other sources when it rains
Resiliency The ability to bounce back after change or adversity The capability of preparing for responding to and recovering from difficult conditions83
Sea level rise-adjusted design flood elevation
As defined in these Guidelines the increased height of the base flood elevation due to sea level rise plus freeboard depending on the criticality of the facility The sea level rise adjustment depends on the useful life of the facility
Storm surge An abnormal rise of water generated by a storm over and above predicted astronomical tides84
Substantial improvementAny repair reconstruction rehabilitation addition or improvement of a building or structure the cost which equals or exceeds 50 of the market value of the structure before the improvement or repairs started For more information see Appendix G of the NYC Building Code and 1 RCNY sect3606-0185
Tidal inundation Flooding which occurs at high tides due to climate-related sea level rise land subsidence andor the loss of natural barriers86
Urban Heat Island (UHI) effectThe tendency for higher air temperatures to persist in urban areas as a result of heat absorbed and emitted by buildings and asphalt tending to make cities warmer than the surrounding suburban and rural areas
Weather The state of the atmosphere at a given time with regard to temperature cloudiness precipitation wind and other meteorological conditions87
Wet Bulb temperatureThe temperature indicated when a thermometer bulb is covered with a water-saturated wick over which air is caused to flow at approximately 45 ms (900 ftmin) to reach the equilibrium temperature of water evaporating into the air when the heat of vaporization is supplied by the sensible heat of the air88
80 ldquoGlossaryrdquo US Green Building Council (2017) Available at httpwwwusgbcorgglossaryterm552581 ldquoPreliminary FEMA Map Productsrdquo FEMA Map Service Center Available at httpshazardsfemagovfemaportalprelimdownload82 ldquoGlossaryrdquo International Infrastructure Management Manual (2011) 83 A Stronger More Resilient New York (2013) 184 ldquoStorm Surge Overviewrdquo National Hurricane Center NOAA Available at httpswwwnhcnoaagovsurge85 ldquoFlood Resistant Constructionrdquo Appendix G New York City Building Code (2008) and 1 RCNY sect3606-01 available at httpswww1nycgovassetsbuildingsrules1_RCNY_3606-01pdf86 ldquoOcean Factsrdquo National Ocean Service NOAA Available at httpoceanservicenoaagovfactsnuisance-floodinghtml 87 UKCIP Glossary httpwwwukciporgukglossary88 ldquoASHRAE Terminologyrdquo ASHRAE Available at httpswwwashraeorgtechnical-resourcesauthoring-toolsterminology
NYC Mayorrsquos Office of Recovery and Resiliency Climate Resiliency Design Guidelines
39APPENDIX 2 - CLIMATE CHANGE PROJECTIONS
Climate change projections are provided by the New York City Panel on Climate Change (NPCC) The full NPCC report is available from the New York Academy of Sciences89 Tables 8-10 (below) were reproduced directly from the NPCC report while Table 2 (see Section IIA) was developed using the data underlying the NPCC report to inform the design of HVAC systems under warmer conditions
Table 8 ndash NYC sea level rise projections90
Baseline (2000-2004) 0 in
Low estimate (10th percentile)
Middle range (25th to 75th percentile)
High estimate (90th percentile)
2020s 2 in 4-8 in 10 in
2050s 8 in 11-21 in 30 in
2080s 13 in 18-39 in 58 in
2100 15 in 22-50 in 75 in
Note Projections are based on six-component approach that incorporates both local and global factors The model-based components are from 24 global climate models and two representative concentration pathways Projections are relative to the 2000-2004 base period
Table 9 ndash Mean annual changes91
a Temperature Baseline(1971-2000) 54degF
Low estimate (10th percentile)
Middle range (25th to 75th percentile)
High estimate (90th percentile)
2020s + 15degF +20-29degF +32degF
2050s +31degF +41-57degF +66degF
2080s +38degF +53-88degF +103degF
2100 +42degF +58-104degF +121F
b Precipitation Baseline(1971-2000) 501 in
Low estimate (10th percentile)
Middle range (25th to 75th percentile)
High estimate (90th percentile)
2020s -1 percent +1-8 +10
2050s +1 percent +4-11 +13
2080s +2 percent +5-13 +19
2100 -6 percent -1 to +19 +25
Note Based on 35 global climate models (GCMs) and two RCPs Baseline data cover the 1971ndash2000 base period and are from the NOAA National Climatic Data Center (NCDC) Shown are the low estimate (10th percentile) middle range (25th percentile to 75th percentile) and high estimate (90th percentile) These estimates are based on a ranking (from most to least) of the 70 (35 GCMs times 2 RCPs) projections The 90th percentile is defined as the value that 90 percent of the outcomes (or 63 of the 70 values) are the same or lower than Like all projections the NPCC climate change projections have uncertainty embedded within them Sources of uncertainty include data and modeling constraints the random nature of some parts of the climate system and limited understanding of some physical processes The NPCC characterizes levels of uncertainty using state-of-the-art climate models multiple scenarios of future greenhouse gas concentrations and recent peer-reviewed literature Even so the projections are not true probabilities and the potential for error should be acknowledged
89 The NPCC 2015 report is available at httponlinelibrarywileycomdoi101111nyas20151336issue-1issuetoc90 From New York City Panel on Climate Change 2015 Report Chapter 1 Climate Observations and Projections page 4191 From New York City Panel on Climate Change 2015 Report Chapter 1 Climate Observations and Projections page 30
APPENDIX 2 - CLIMATE CHANGE PROJECTIONS
NYC Mayorrsquos Office of Recovery and Resiliency Climate Resiliency Design Guidelines
40APPENDIX 2 - CLIMATE CHANGE PROJECTIONS
Table 10 ndash Extreme events92
2020s Baseline (1971-2000)
Low estimate(10th percentile)
Middle range(25th to 75th percentile)
High estimate (90th percentile)
Numbers of heat waves per year 2 3 3-4 4
Average heat wave duration (days) 4 5 5 5
Number of days per year with
Maximum temperature at or above 90degF 18 24 26-31 33
Maximum temperature at or above 100degF 04 07 1-2 2
Minimum temperature at or below 32degF 71 50 52-58 60
Rainfall at or above 1 inch 13 13 14-15 16
Rainfall at or above 2 inches 3 3 3-4 5
Rainfall at or above 4 inches 03 02 03ndash04 05
2050s Baseline (1971-2000)
Low estimate(10th percentile)
Middle range(25th to 75th percentile)
High estimate (90th percentile)
Numbers of heat waves per year 2 4 5-7 7
Average heat wave duration (days) 4 5 5-6 6
Number of days per year with
Maximum temperature at or above 90degF 18 32 39-52 57
Maximum temperature at or above 100degF 04 2 3-5 7
Minimum temperature at or below 32degF 71 37 42-48 52
Rainfall at or above 1 inch 13 13 14-16 17
Rainfall at or above 2 inches 3 3 4-4 5
Rainfall at or above 4 inches 03 03 03-04 05
2080s Baseline (1971-2000)
Low estimate(10th percentile)
Middle range(25th to 75th percentile)
High estimate (90th percentile)
Numbers of heat waves per year 2 5 6-9 9
Average heat wave duration (days) 4 5 5-7 8
Number of days per year with
Maximum temperature at or above 90degF 18 38 44-76 87
Maximum temperature at or above 100degF 04 2 4-14 20
Minimum temperature at or below 32degF 71 25 30-42 49
Rainfall at or above 1 inch 13 14 15-17 18
Rainfall at or above 2 inches 3 3 4-5 5
Rainfall at or above 4 inches 03 02 03-05 07
Note Projections for temperature and precipitation are based on 35 GCMs and 2 RCPs Baseline data are for the 1971 to 2000 base period and are from the NOAA National Climatic Data Center (NCDC) Shown are the low estimate (10th percentile) middle range (25th to 75th percentile) and high estimate (90th percentile) 30-year mean values from model-based outcomes Decimal places are shown for values less than one although this does not indicate higher precisioncertainty Heat waves are defined as three or more consecutive days with maximum temperatures at or above 90degF Like all projections the NPCC climate change projections have uncertainty embedded within them Sources of uncertainty include data and modeling constraints the random nature of some parts of the climate system and limited understanding of some physical processes The NPCC characterizes levels of uncertainty using state-of-the-art climate models multiple scenarios of future greenhouse gas concentrations and recent peer-reviewed literature Even so the projections are not true probabilities and the potential for error should be acknowledged
92 From New York City Panel on Climate Change 2015 Report Chapter 1 Climate Observations and Projections page 31
NYC Mayorrsquos Office of Recovery and Resiliency Climate Resiliency Design Guidelines
41APPENDIX 3 - DIFFERENTIATION OF FLOOD MAPS
These Guidelines reference several different kinds of flood maps and sources of design flood elevations These maps are described and differentiated below
Table 11 - Differentiation of flood maps used in NYC
Reference Title Data Source Information Provided Referenced By Link
2007 FIRM FEMA
Based on historical data from before 1983 identifies the current base flood (extent and elevation) as the flood that has a 1 chance of occurring in any given year also known as a 100-year flood The NYC Building Code requires that either the 2007 FIRM or 2015 PFIRM elevation be used whichever is higher
2014 NYC Building Code Appendix G
Climate Resiliency Design Guidelines
httpsmscfemagovportal
2015 PFIRM FEMA
Based on historical data identifies the current base flood (extents and elevation) as the flood that has a 1 chance of occurring in any given year also known as a 100-year flood The NYC Building Code requires that either the 2007 FIRM or 2015 PFIRM elevation be used whichever is higher The 2015 PFIRM is currently being reassessed by FEMA
2014 NYC Building Code Appendix G
Climate Resiliency Design Guidelines
httpshazardsfemagovfemaportalprelimdownload
httpwwwregion2coastalcomview-flood-maps-dataview-preliminary-flood-map-data
NYC Flood Hazard Mapper
NYC Department of City Planning
Maps current and future flood hazards in NYC including the following data layers 2007 FIRM and 2015 PFIRM high tide with sea level rise and PFIRM with sea level rise through 2100
Climate Resiliency Design Guidelines
Waterfront Revitalization Plan
httpwww1nycgovsiteplanningdata-mapsflood-hazard-mapperpage
ldquoTable 4 ndash Determine the sea level rise-adjusted design flood elevation for critical and non-critical facilitiesrdquo
ORR amp NPCC
Provides data to use when adding sea level rise to a given 2015 PFIRM or 2007 FIRM Base Flood Elevation (BFE) to calculate a Design Flood Elevation (DFE) Based on the criticality and expected useful life of a facility
Climate Resiliency Design Guidelines
See Section II on ldquoSea Level Riserdquo above
APPENDIX 3 - DIFFERENTIATION OF FLOOD MAPS
NYC Mayorrsquos Office of Recovery and Resiliency Climate Resiliency Design Guidelines
42APPENDIX 4 - PROJECT BENEFITS CATEGORIES
This appendix provides guidance on how to identify and assess benefits as a supplement to Sections IIID and IIIE
Table 12 lists typical direct benefits for reducing impacts from climate stressors and basic guidance for how to estimate them See Section IIID for more information
Table 13 lists typical indirect benefits for reducing impacts from climate stressors and basic guidance for how to estimate them See Section IIID for more information
Table 12 ndash Direct benefits for (1) sea level rise with coastal storm surge and (2) increased precipitation measures
Direct Benefit Basic Guidance for Estimating Values
Physical Damages (Structure Contents)
bull For flood-damaged buildings use depth damage functions developed by FEMA and USACE for structures and contents
bull Use depth damage functions in conjunction with Building Replacement Values (BRVs) and not market values BRVs typically range between $100 to $325SF for residential buildings and $120 to $450SF for commercial public buildings
bull For more complex structures or facilities use engineering estimates of flood damages or review historic flood damages documented from insurance claims repair records or FEMA Public Assistance claims from recent flood disasters
Residential Displacements
bull For flood-damaged buildings use depth damage functions developed by FEMA and USACE for residential displacements
Reduced Life CycleOperation and Maintenance (OampM) Costs93
bull Applicable only to projects that reduce overall life cycle costs or net annual OampM costs from baseline conditions
bull Input reduced annual OampM costs as a project benefit at a 1-year recurrence intervalbull Reduced overall life cycle costs can be input as a longer project useful life
Table 13 ndash Indirect benefits for (1) sea level rise with coastal storm surge and (2) increased precipitation measures
Indirect Benefit Basic Guidance for Estimating Values
Non-Residential Building Service Losses
bull Estimate service loss values and durations for non-residential buildings public buildings critical facilities and parksnatural features based on FEMA BCA guidance and standard values based on building use
Utility Service Losses94
bull Estimate utility service losses for water wastewater and electrical facilities based on the number of impacted customers FEMA per capita standard values for utility service ($105personday for potable water $49personday for wastewater $148personday for electrical)95
bull Estimate utility service loss durations based on engineering estimates or review historic flood damages losses documented from utility company records
bull This benefit can also apply to measures that increase energy efficiency
RoadBridge Service Losses
bull Estimate roadbridge service losses based on the average daily traffic (ADT) detour time and additional travel distance and FEMA and GSA standard values for road service ($3344vehiclehour of delay $0545mile)96
bull Estimate roadbridge service loss durations or review historic flood damages losses
Emergency Service Losses
bull Applicable only to projects that reduce or eliminate documented emergency service costs from baseline conditions
bull Examples of avoided emergency services costs include NYPD staffing to monitor barricades for flooded roads or NFDY staffing for water rescues of residents from flooded buildings or streets
APPENDIX 4 - PROJECT BENEFITS CATEGORIES
93 Reduced life cycle costs may be applicable to some measures that provide extreme heat benefits such as green roofs that can last longer than a standard roof if properly maintained
94 Reduced utility service costs may be applicable to some measures that provide extreme heat benefits such as cool roofs green roofs and shade trees
95 FEMA per capita standard values taken from FEMA BCA Toolkit Version 530 (Build Date 12222016) and developed in FEMArsquos Baseline Standard Economic Value Methodology Report (July 28 2016) Consider updating FEMA standard per capita values to reflect current New York City utility rates
96 Consider updating FEMA and GSA standard values to reflect current New York City area labor rates and fuel costs
NYC Mayorrsquos Office of Recovery and Resiliency Climate Resiliency Design Guidelines
43APPENDIX 4 - PROJECT BENEFITS CATEGORIES
Table 14 ndash Other potential benefits for (1) sea level rise with coastal storm surge and (2) increased precipitation measures
Other Benefit Basic Guidance for Estimating Values
Avoided Stress and Anxiety
bull Applicable only for projects that directly benefit occupants of residential structuresbull Use FEMA standard value for avoided mental stress and anxiety treatment costs of $2443person to
estimate benefit for all impacted residents97
Avoided Lost Productivity
bull Applicable only for projects that directly benefit occupants of residential structuresbull Use FEMA standard value for avoided lost worker productivity costs of $8736household to estimate
benefit for all impacted workers (conservatively assuming one worker per household)
Environmental Open Space
bull Applicable only for projects that create or acquire open space areas by acquisitionbull Use FEMA standard value for environmental open space based on the type of land acquired ($8308
Acreyear for Green open space $39545Acreyear for Riparian $6010Acreyear for Wetlands $554Acreyear for Forests $1799Year for Marine and estuary)97
CSO Volume Reduction
bull Applicable only for projects that provide Combined Sewer Overflow (CSO) abatement by reducing the volume of rainfall runoff
bull Use CSO abatement cost of $0015gallonsyear applied to increased precipitation hazard runoff volume for 5-year design storm98
Ecosystem Service99
bull Add stormwater management benefits of green infrastructure projects to increased precipitation hazards where avoided damages and service losses are not quantified
bull Unit benefits applicable to increased precipitation hazard includeo Green roofs $0133SFyear (PUL 40 years)o BioswaleRain GardenMeadow Mix $0020SFyear (PUL 30 years)o Permeable Grass Pavers $0020SFyear (PUL 30 years)o Tree Plantings $303Treeyear (PUL 30 years)o Planter Box Trees $101Treeyear (PUL 15 years)
Real Estate99
bull Potential real estate benefits from increased resilience of residential andor commercial propertiesstreetscapesneighborhoods included within the project scope
bull Benefit applied to extreme heat hazard for green infrastructure projects directly impacting residential or commercial properties
Quality of Life Health Benefits99
bull Potential quality of life benefits related to improved public health from the resilience measures included within the project scope
bull Benefit applied to extreme heat hazard for green infrastructure projects directly impacting residential or commercial properties
Table 14 lists other typical benefits for reducing impacts from climate stressors and basic guidance for how to estimate them See Section IIID for more information
97 FEMA standard values for avoided mental stress and anxiety and environmental open space values taken from FEMA BCA Toolkit Version 530 (Build Date 12222016)
98 CSO abatement cost taken from APG1 Report for NYC ldquoTechnical Approaches for Benefit-Cost Analysis of Hazard Mitigation Projects in Urban and Coastal Environmentsrdquo (April 2016)
99 Ecosystem Services Real Estate and Quality of LifeHealth benefits tend to be more applicable to green infrastructure measures that provide extreme heat benefits such as green roofs trees and other plantings
NYC Mayorrsquos Office of Recovery and Resiliency Climate Resiliency Design Guidelines
44APPENDIX 4 - PROJECT BENEFITS CATEGORIES
Table 15 ndash Potential benefits for extreme heat (Urban Heat Island) reduction measures
Category Benefit Basic Guidance for Estimating Values
Direct Benefit
Reduced Life Cycle Cost
bull Applicable only to measures such as green roofs that are expected to last longer than standard roofs
bull Compute total cost savings including annual OampM costs
Indirect Benefit
Energy Savings
bull Applicable to measures that reduce energy costs by providing cooling through increased shading andor evapotranspiration
bull Use New York Power Authority rates of $0148kWh for electricity and $0810Therm for natural gas
Other Potential Benefits
Air Quality bull Applicable to measures that absorb pollutants andor reduce carbon dioxide emissions
Acoustics bull Applicable to measures such as green roof or walls that reduce noise transfer
Quality of LifeHealth bull Potential quality of life benefits and related to improved public health
Real Estate bull Applicable to measures that provide residential real estate benefits from increased resilience of propertiesstreetscapesneighborhoods
Retail Sales Marketing
bull Applicable to measures that provide commercial property benefits from increased aesthetics resulting in increased marketing and sales for streetscapesneighborhoods
Tax Credits Incentives
bull Applicable to resilience or green infrastructure measures such as green roofs that have accompanying Federal State or City tax credits or other incentives
Table 15 lists potential benefits for reducing impacts from heat and basic guidance for how to estimate them See Section IIID for more information
NYC Mayorrsquos Office of Recovery and Resiliency Climate Resiliency Design Guidelines
45APPENDIX 4 - PROJECT BENEFITS CATEGORIES
Table 16 ndash Guidance on quantitative calculations for (1) sea level rise with coastal storm surge and (2) increased precipitation measures
Data Input General Guidance ndash Basic Description
Applicable Benefit Category
Applicable Typical Facility Typology
Dire
ct B
enefi
ts
Indi
rect
Ben
efits
Oth
er P
oten
tial
Ben
efits
Bui
ldin
g St
ruct
ures
Com
plex
Fa
cilit
ies
Tran
spor
tatio
nSt
reet
scap
es
Plaz
as
Park
Fea
ture
s
First Floor Elevation (FFE)
bull The elevation of the first finished floor of the structure excluding basements
bull FFE measured from top of lowest floor (riverinenon-coastal high hazard areas) or bottom of lowest horizontal structural member (coastal high hazard areas)
Y Y Y Y
Building Replacement Value (BRV)
bull The unit cost to rebuild a structure of the same quality of construction
bull Not the same as market value
Y Y Y Y
Building Size
bull The total floor area of the building in square feet
bull Total Building Value = BRV x Building Sizebull Typical BRVs for NYC range between $100 to
$325SF for residential buildings and $120 to $450SF for commercialpublic buildings
Y Y Y Y
Structure Description
bull The type of building number of stories and foundation type (full basement partial basement no basement)
bull Collect more detailed foundation data for coastal flood zones
Y Y Y Y
Building Use bull Details related to residential housing commercial business and public use
Y Y Y Y Y
Building Type bull The primary use of building ndash residential commercial public and others
Y Y Y Y Y
Depth Damage Function (DDF)
bull Curves used to estimate structure damage contents damage and displacement of residential buildings based on flood depth
bull DDFs selection based on Structure Description Building Type Building Use
bull Structure DDFs based on percentage of Total Building Value
bull Contents DDFs based on percentage of Total Contents Value
bull Displacement DDFs based on number of displacement days x Displacement Cost
Y Y Y Y Y
Contents Value
bull The cost to replace structure contents (furnishings equipment)
bull Residential building Contents Values typically 50 BRV (FEMA DDFs) or 100 BRV (USACE DDFs)
bull Non-residential building Contents Values between 18 to over 100 depending on building use (USACE DDFs)
bull Total Contents Value = BRV x Building Size
Y Y Y Y Y
Table 16 provides general guidance on how to quantitatively calculate benefits from efforts to address from climate stressors See Section IIIE for more information
NYC Mayorrsquos Office of Recovery and Resiliency Climate Resiliency Design Guidelines
46APPENDIX 4 - PROJECT BENEFITS CATEGORIES
Table 16 ndash Guidance on quantitative calculations for (1) sea level rise with coastal storm surge and (2) increased precipitation measures
Data Input General Guidance ndash Basic Description
Applicable Benefit Category
Applicable Typical Facility Typology
Dire
ct B
enefi
ts
Indi
rect
Ben
efits
Oth
er P
oten
tial
Ben
efits
Bui
ldin
g St
ruct
ures
Com
plex
Fa
cilit
ies
Tran
spor
tatio
nSt
reet
scap
es
Plaz
as
Park
Fea
ture
s
Number of Residents (Residential)
bull Total number of occupants in a residential building
bull Typically estimated based on number of residential units x average number of individuals per household (based on current US Census data or use 25 individuals per household as a default)
Y Y Y Y Y
Displacement Cost (Residential)
bull The unit cost to lodge and feed displaced residents while flood damage is repaired
bull Average unit displacement cost of $415residential unitday recommended based on current FY2018 GSA Per Diem rates for New York City
Y Y Y Y Y
Value of Service (Non-Residential and Public)
bull The unit cost of service disruption and rental of temporary facilities while flood damage is repaired
bull Disruption costs for non-residential buildings typically range from $095 to $136SFmonth and rental costs range from $020 to $136SFmonth depending on building use
bull Value of service for public buildings ($day) is typically based on the annual operating budget for the City agency using the building prorated based on building size or population served by the building then divided by 365 daysyear
Y Y Y Y
Value of Service (Critical Facilities)
bull The unit cost of critical facilities (police fire emergency medical services) lost or delayed while flood damage is repaired
Y Y Y
Value of Service Duration
bull The duration of service disruption and rental of temporary facilities for non-residential buildings and critical facilities while flood damage is repaired
bull For non-residential buildingso Value of Service Durations vary from
4 months to over 30 months based on building use and the depth of flooding
o Total Value of Service Loss = (Disruption Cost x Building Area) = (Rental Cost x Building Area x Value of Service Duration)
bull For public buildings and critical facilitieso Value of Service Durations vary from 0
days to 720 months based on building use and the depth of flooding from FEMA FIA or USACE DDFs
o Total Value of Service Loss = (Value of Service) x (Service Loss Duration)
Y Y Y
NYC Mayorrsquos Office of Recovery and Resiliency Climate Resiliency Design Guidelines
47APPENDIX 4 - PROJECT BENEFITS CATEGORIES
Table 16 ndash Guidance on quantitative calculations for (1) sea level rise with coastal storm surge and (2) increased precipitation measures
Data Input General Guidance ndash Basic Description
Applicable Benefit Category
Applicable Typical Facility Typology
Dire
ct B
enefi
ts
Indi
rect
Ben
efits
Oth
er P
oten
tial
Ben
efits
Bui
ldin
g St
ruct
ures
Com
plex
Fa
cilit
ies
Tran
spor
tatio
nSt
reet
scap
es
Plaz
as
Park
Fea
ture
s
Engineering Estimates for Damages
bull Engineered estimate models of physical damages and service losses at the project site based on the Guidelines event recurrence interval(s) and flood depth(s)
Y Y Y Y Y Y
Historic Damages and Service Losses
bull Historic physical damages and service losses at the project site documented from previous flood events
bull Do not use routine maintenancebull The historic damage event recurrence interval
(RIs) andor flood depths must be determined updated for inflation to the present value and adjusted to match the Guidelines event RIsflood depths
Y Y Y Y Y Y
Facility Replacement Value
bull The unit cost to rebuild the facility
Impacted Area bull The geographic area impacted by the facility in the event of failure in acres
Y Y Y Y
Facility Capacity
bull The design capacity of the facilitybull For example - facility capacity expressed in
millions of gallons per day (MGD) for water and wastewater facilities or megawatts (MW) for electrical facilities
Y Y Y Y
Service Population
bull The number of impacted residents served by the facility
bull Typically estimated based on number of impacted residential customers x average number of individuals per household (based on current US Census data or use 25 individuals per household as a default)
bull Facilities serving mostly non-residentialpublic buildings andor critical facilities should focus on service losses rather than service population
Y Y Y
NYC Mayorrsquos Office of Recovery and Resiliency Climate Resiliency Design Guidelines
48APPENDIX 4 - PROJECT BENEFITS CATEGORIES
Table 16 ndash Guidance on quantitative calculations for (1) sea level rise with coastal storm surge and (2) increased precipitation measures
Data Input General Guidance ndash Basic Description
Applicable Benefit Category
Applicable Typical Facility Typology
Dire
ct B
enefi
ts
Indi
rect
Ben
efits
Oth
er P
oten
tial
Ben
efits
Bui
ldin
g St
ruct
ures
Com
plex
Fa
cilit
ies
Tran
spor
tatio
nSt
reet
scap
es
Plaz
as
Park
Fea
ture
s
Value of Service
bull Unit value of service provided by the facilitybull Example of FEMA standard values for complete
loss of utility service $105personday for potable water$49personday for wastewater$148personday for electrical
bull Consider updating FEMA standard per capita values to reflect current The New York City utility rates
Y Y
Roadway Elevations bull Roadway Elevations
Y Y
Roadway Replacement Value
bull Roadway Replacement ValueY Y
Inundation Area Map
bull Inundation Area Map developed by FEMA or through modeling by project design team
Y Y Y
Building Inventory of Inundation Area
bull The number and type of buildings within the streetscape and neighborhood inundated by the Guidelinersquos flood events
Y Y Y
Average Daily Traffic (ADT)
bull The average number of one-way traffic trips per day along the roadway(s) within the streetscapeneighborhood inundated by the Guidelinersquos flood events
Y Y
Additional Travel Time
bull The additional travel time needed to detour around a flooded roadway expressed in minutes
bull In the unlikely event there is no detour available use a 12-hour travel time per one-way trap but provide a detailed area street map as supporting documentation
Y Y
Value of Traffic Delay
bull The value of service associated with lost time in traffic
bull For example - FEMA standard average value of $3344vehiclehour of delay
bull Consider updating FEMA and GSA standard values to reflect current New York City area labor rates and fuel costs
Y Y
NYC Mayorrsquos Office of Recovery and Resiliency Climate Resiliency Design Guidelines
49APPENDIX 4 - PROJECT BENEFITS CATEGORIES
Table 17 ndash Guidance on quantitative unit benefit calculations for extreme heat hazard measures
Measure General Guidance ndash Unit Benefit Information and Data Requirements
Applicable Benefit Category
Applicable Typical Facility Typology
Dire
ct B
enefi
ts
Indi
rect
Ben
efits
Oth
er P
oten
tial
Ben
efits
Bui
ldin
g St
ruct
ures
Com
plex
Fa
cilit
ies
Tran
spor
tatio
nSt
reet
scap
es
Plaz
as
Park
Fea
ture
s
Green Roof
bull Unit benefit range over PUL = $470SF to $373SF of green roof area ($719SF standard value)
bull Assumed PUL = 40 yearsbull Apply standard value unit benefit to green
roof area to estimate measure benefitbull Higher range values more applicable
to residential and commercial building streetscape projects
Y Y Y Y Y Y
Bioswale Rain Garden Meadow Mix
bull Unit benefit range over PUL = $396SF to $211SF of area ($730SF standard value)
bull Assumed PUL = 30 yearsbull Apply standard value unit benefit to bioswale
rain gardenmeadow mix area to estimate total measure benefit
Y Y Y Y Y Y
Cool Roof
bull Unit benefit range over PUL = $117 to $3151SF of material area ($144SF standard value)
bull Assumed PUL = 20 yearsbull Apply standard value unit benefit to cool roof
area to estimate total measure benefitbull Higher range values more applicable to
residential building streetscape projects
Y Y Y Y Y
Light-Colored PaversLight-Colored Materials
bull Unit benefit range over PUL = $0774 to $204SF of material area ($0866SF standard value)
bull Assumed PUL = 30 yearsbull Apply standard value unit benefit to material
area to estimate total measure benefit
Y Y Y Y
Table 17 provides general guidance on how to quantitatively calculate benefits from efforts to address climate stressors See Section IIIE for more information
NYC Mayorrsquos Office of Recovery and Resiliency Climate Resiliency Design Guidelines
50APPENDIX 4 - PROJECT BENEFITS CATEGORIES
Table 17 ndash Guidance on quantitative unit benefit calculations for extreme heat hazard measures
Measure General Guidance ndash Unit Benefit Information and Data Requirements
Applicable Benefit Category
Applicable Typical Facility Typology
Dire
ct B
enefi
ts
Indi
rect
Ben
efits
Oth
er P
oten
tial
Ben
efits
Bui
ldin
g St
ruct
ures
Com
plex
Fa
cilit
ies
Tran
spor
tatio
nSt
reet
scap
es
Plaz
as
Park
Fea
ture
s
Tree Planting
bull Unit benefit range over PUL = $1005 to $77154Tree ($1855Tree standard value)
bull Assumed PUL = 30 yearsbull Apply standard value unit benefit to number of
trees to estimate total measure benefitbull Higher range values more applicable
to residential and commercial building streetscape projects
Y Y Y Y Y Y
Planter Box Tree
bull Unit benefit range over PUL = $212 to 16304Tree ($392Tree standard value)
bull Assumed PUL = 15 yearsbull Apply standard value unit benefit to number of
trees to estimate total measure benefitbull Higher range values more applicable
to residential and commercial building streetscape projects
Y Y Y Y Y
Shade Canopy
bull Unit benefit range over PUL = $0363 to $396SF ($0458SF standard value)
bull Assumed PUL = 15 yearsbull Apply standard value unit benefit to area of
shade canopy estimate total measure benefitbull Higher range values more applicable
to residential and commercial building streetscape projects
Y Y Y Y
Permeable Grass Pavers
bull Unit benefit range over PUL = $0258SF to $0521SF of pavers ($0363SF standard value)
bull Assumed PUL = 30 yearsbull Apply standard value unit benefit to paver
area to estimate total measure benefit
Y Y Y Y Y
For the purposes of the BCA refer to the following facility typologies bull ldquoBuilding Structuresrdquo include critical small building sites such as EMS or FDNY stations and non-critical small building sites such as
libraries or comfort stationsbull ldquoComplex Facilitiesrdquo include critical infrastructure such as wastewater treatment sites pump stations water filtration plants and similar
large or complex facilitiesbull ldquoTransportationStreetscapePlazasrdquo include roadway reconstruction streetscape improvements street raising plazas and other
transportation-related infrastructurebull ldquoPark Featuresrdquo include parks and similar public recreational facility with natural landscape features
NYC Mayorrsquos Office of Recovery and Resiliency Climate Resiliency Design Guidelines
51APPENDIX 5 - EXAMPLE PLANNING DECISION TREE
This decision tree provides a summarized example approach for how to implement these Guidelines Projects with a total cost greater than $50 million are recommended to conduct a full qualitative and quantitative climate change risk assessment and BCA while projects below $50 million are recommended to conduct a qualitative risk assessment and BCA
Define Project
1) Operational goals and criticality level2) Useful life3) Location in the current flood plain future floodplain and or zone
of tidal inundation and the project arearsquos score on the heat vulnerability index
Evaluate Project Risks According to Probability and Magnitude of Consequence
bull Extreme Heat bull Precipitationbull Sea Level Risebull Coastal Surge
High Level Identification and Assessment of Risk Mitigation Alternatives and Co-benefits
(qualitative)
Detailed Identification and Assessment of Risk Mitigation Alternatives and Co-benefits (qualitative and quantitative)
High Level Estimate of Costs and Benefits of Design Alternatives
(qualitative)
Detailed Estimate of Costs and Benefits of Design Alternatives
(qualitative and quantitative)
Decision Point Which climate change risks require mitigation
Decision Point Evaluate risk mitigation benefits and costs to
determine final resilient design alternative or if no action is required
Decision Point Is the total project cost above $50 million
Below $50 million Above $50 million
APPENDIX 5 - EXAMPLE PLANNING DECISION TREE
NYC Mayorrsquos Office of Recovery and Resiliency Climate Resiliency Design Guidelines
52
Project Title
Design Strategies Checklist (not exhaustive)
Extreme Heat Comments Extreme Precipitation Comments Sea Level Rise amp Storm Surge Comments
Select Site in Low Heat Vulnerability Index area Select High Elevation Site Select High Elevation Site
Minimize East-West Building Orientation Green Roof Raise Building Floor Elevation
Passive Solar Cooling and Ventilation Systems
Protect Below Grade Areas from Flooding Waterproof Building Envelope
Cool Roof (SRI appropriate) On-site Stormwater Management (gray) Elevate Critical Building Functions
Green Roof (extensive) Reduce Impervious Areas Elevate Critical Equipment
Vegetative Structures Permeable Pavement Perimeter Floodwall100 Levee (passive or active)
Enhanced HVAC System including space layout optimization and system scalability
Increase Green Spaces and Planted Areas DryWet Floodproofing
More Efficient Building Envelope Other Utility Redundancy Design101
Parking Lot Shading Resilient Materials amp Landscape Treatments
Light Colored Pavements (appropriate SRI) Design for Storm Surge Outflow
Increase Planted Areas Install Backwater Flow Prevention
Permeable Surfaces Design for Scour
Open-grid Pavement Raise Road Elevation
Other Other
This appendix provides a template for identifying possible design strategies to address climate change risks as described throughout the Guidelines
APPENDIX 6 - DESIGN STRATEGIES CHECKLIST
100 Permanent perimeter flood walls are not permitted to meet floodproofing requirements in buildings with substantial improvements andor damages 101 Utility redundancy design should be pursued for critical systems not all building systems
APPENDIX 6 - DESIGN STRATEGIES CHECKLIST
NYC Mayorrsquos Office of Recovery and Resiliency Climate Resiliency Design Guidelines
53APPENDIX 7 - CLIMATE CHANGE RISK ASSESSMENT RESOURCES
These Guidelines provide data on climate change hazards and recommend how that data can inform resilient design A risk assessment is a tool to help project managers and designers evaluate risk levels as well as select and prioritize resilient design strategies A high level risk assessment is recommended for all City capital projects with a total cost of under $50 million Projects above $50 million are recommended to conduct an in-depth assessment
Risk assessments use quantified estimates of the probability and magnitude of consequence of an event occurring to prioritize responses ldquoProbabilityrdquo is an assessment of the likelihood of a hazard occurring while ldquomagnituderdquo describes the hazardrsquos potential impact Risk assessment tools such as the examples listed below can be used to define and score these categories Projects that score higher across both probability and magnitude can be prioritized for investment and risk mitigation action Projects that score lower across both criteria may require no action beyond meeting code The results are typically charted on a risk matrix and an example is provided on the next page
The climate change risk management frameworks below offer templates for how to integrate climate change projections into a risk assessment process Refer to these resources for examples and further information
bull Vulnerability Assessment and Adaptation Framework is prepared by the Federal Highway Administration (FHWA) While developed for transportation planning this risk assessment framework has broad applicability for evaluating asset vulnerability to climate change Available at httpswwwfhwadotgovenvironmentsustainabilityresilienceadaptation_framework
bull US Climate Resilience Toolkit The US Global Change Research Program offers a step by step risk assessment
framework including tools and case studies at httpstoolkitclimategovsteps (see example on next page)
bull Coast Adapt Guidance on undertaking a risk assessment High level assessment httpscoastadaptcomausitesdefaultfilesfactsheetsT3M4_2_2nd_pass_risk_assessmentpdfDetailed assessment httpscoastadaptcomausitesdefaultfilesfactsheetsT3M4_3_3rd_pass_risk_assessmentpdf
bull Climate adaptation Risk uncertainty and decision-makingDownload the report here httpswwwukciporgukpublicationsRisk
The City plans to develop a NYC-specific process for integrating climate change data into existing risk management processes by April 2019
APPENDIX 7 - CLIMATE CHANGE RISK ASSESSMENT RESOURCES
NYC Mayorrsquos Office of Recovery and Resiliency Climate Resiliency Design Guidelines
54APPENDIX 7 - CLIMATE CHANGE RISK ASSESSMENT RESOURCES
The Risk Characterization Matrix below is an example from the US Climate Resilience Toolkit This tool can be used to assess the probability and magnitude of impact for identified risks The risk of coincident climate stressorsrisks (such as storm surge plus increased precipitation) can also be assessed as applicable
Figure 14 - Example of a climate change risk matrix (adapted from US Climate Resilience Toolkit)
Project teams can determine the magnitude of the impact (along the horizontal scale of 1 through 3 with 3 being the most severe) and the probabilitylikelihood of occurrence for each specific risk (along the vertical scale with 3 being the most likely) A score is typically assigned for each risk (Probabil-ity x Magnitude) and then charted on the matrix Based on the estimated probability and magnitude of consequence above the risks are ranked and prioritized for mitigation Factors to bear in mind include
bull Not all facility typologies have the same level of functional and operational importance during events or tolerance for disruption
bull Not all climate stressors and risks have the same level of impact on each project sitebull Not all identified risks can or should be mitigated fully
NYC Mayorrsquos Office of Recovery and Resiliency Climate Resiliency Design Guidelines
55WORKS CITED
A Stronger More Resilient New York PlaNYC Report of the NYC Special Initiative for Rebuilding and Resiliency The City of New York 2013
ldquoAccount for Climate Riskrdquo International Finance Corporation accessed March 27 2017 httpwwwifcorgwpswcmconnectTopics_Ext_ContentIFC_External_Corporate_SiteClimate+Business
PrioritiesAccount+for+Climate+Risk
American Society of Heating Refrigeration and Air-Conditioning Engineers (ASHRAE) Handbook -Fundamentals 2017
ldquoBaseline Standard Economic Value Methodology Reportrdquo Federal Emergency Management Agency July 2016
Benefit Cost Analysis Toolkit Software Version 530 Federal Emergency Management Agency (build date December 2016)
Criteria for Detention Facility Design New York City Department of Environmental Protection November 2012
Community Resilience Planning Guide for Buildings and Infrastructure Systems Vol 1 NIST Special Publication 1190 US Department of Commerce 2016
Cool and Green Roofing Manual NYC Department of Design and Construction 2007 httpwwwnycgovhtmlddcdownloadspdfcool_green_roof_manpdf
Building Resiliency Task Force US Urban Green Building Council New York 2013 httpurbangreencouncilforcecomBuildingResiliency
Design and Planning for Flood Resiliency Guidelines for NYC Parks New York City Department of Parks and Recreation 2017
httpswwwnycgovparksorgplanning-and-buildingplanningresiliency-plansflood-resiliency
Flooded Bus Barns and Buckled Rails Federal Transit Administration Office of Budget and Policy 2011 httpswwwhsdlorgabstractampdid=685187
Floodproofing Non-Residential Buildings FEMA P936 FEMA 2013 httpswwwfemagovmedia-library-data9a50c534fc5895799321dcdd4b6083e7P-936_8-20-13_508rpdf
ldquoGlossaryrdquo International Infrastructure Management Manual National Asset Management Support Group New Zealand 2011 httpwwwipweaorg
ldquoGreen Roof Metrics Draft Reportrdquo New York City Department of Parks and Recreation 2017
ldquoGuide to Rain Event Preparednessrdquo NYC Department of Environmental Protection httpwwwnycgovhtmldeppdfbrochuresflood-preparedness-flyerpdf
ldquoGuidelines and Discount Rates for Benefit-Cost Analysis of Federal Programsrdquo Appendix C Circular A-94 US Office of Management and Budget (OMB) 2017
ldquoGuidelines for the Design and Construction of Stormwater Management Systemsrdquo New York City Department of Environmental Protection July 2012
Horton R et al New York City Panel on Climate Change 2015 Report Ann NY Acad Sci ISSN 0077-892 New York 2015
Madrigano J et al ldquoA case-only study of vulnerability to heat wavendashrelated mortality in New York City (2000ndash2011)rdquo Environmental Health Perspectives 123672ndash678 2013
WORKS CITED
NYC Mayorrsquos Office of Recovery and Resiliency Climate Resiliency Design Guidelines
56WORKS CITED
enspMcGregor et al Two Degrees The Built Environment and Our Changing Climate Routledge Press 2013
NYC Green Codes Task Force US Green Building Council New York 2010 httpurbangreencouncilorgGreenCodes
NYCrsquos Risk Landscape A Guide to Hazard Mitigation NYC Emergency Management 2014
One New York The Plan for a Strong and Just City The City of New York 2015 httpwwwnycgovhtmlonenyc downloadspdfpublicationsOneNYCpdf
Ready to Respond Strategies for Multifamily Building Resilience Enterprise Green Communities 2015 httpswwwenterprisecommunityorgresources
Rosenzweig C et al Climate Change Adaptation in New York City Building a Risk Management Response New York City Panel on Climate Change 2010
httponlinelibrarywileycomdoi101111nyas20101196issue-1 issuetoc
ldquoSustainable Infrastructure Management Program Learning Environmentrdquo Water Environment Research Foundation accessed March 24 2017 httpsimplewerforg
Urban Waterfront Adaptive Strategies NYC Department of City Planning 2013 httpwww1nycgovsiteplanningplanssustainable-communitiesclimate-resiliencepagetab=1
Wastewater Resiliency Plan Climate Risk Assessment and Adaptation Study New York City Department of Environmental Protection October 2013
NYC Mayorrsquos Office of Recovery and Resiliency Climate Resiliency Design Guidelines
3
I INTRODUCTION 4
A GOALS 4
B CLIMATE CHANGE PROJECTIONS FOR NEW YORK CITY 5
C PLANNING ACROSS PROJECT USEFUL LIFE 6
D MANAGING UNCERTAINTY 6
E PROJECT-SPECIFIC CONSIDERATIONS 7
II INTERPRETING CLIMATE CHANGE DATA FOR RESILIENT DESIGN ADJUSTMENTS 9
A INCREASING HEAT 9
B INCREASING PRECIPITATION 15
C SEA LEVEL RISE 19
III EVALUATION OF PROJECT BENEFITS 28
A GENERAL METHODOLOGY TO ESTIMATE PROJECT BENEFITS 28
B CATEGORIES OF PROJECT BENEFITS 28
C WHICH METHODOLOGY TO USE 30
D BCA METHODOLOGY FOR PROJECTS LESS THAN $50 MILLION 30
E BCA METHODOLOGY FOR PROJECTS OVER $50 MILLION 33
APPENDIX 1 - KEY TERMS 36
APPENDIX 2 - CLIMATE CHANGE PROJECTIONS 39
APPENDIX 3 - DIFFERENTIATION OF FLOOD MAPS 41
APPENDIX 4 - PROJECT BENEFITS CATEGORIES 42
APPENDIX 5 - EXAMPLE PLANNING DECISION TREE 51
APPENDIX 6 - DESIGN STRATEGIES CHECKLIST 52
APPENDIX 7 - CLIMATE CHANGE RISK ASSESSMENT RESOURCES 53
WORKS CITED 55
CONTENTS
NYC Mayorrsquos Office of Recovery and Resiliency Climate Resiliency Design Guidelines
4
In the coming years and throughout the 21st century New York City (NYC) will face new challenges from a rapidly changing climate Many physical infrastructure landscape and building projects (ldquofacilitiesrdquo) will face new or more severe risks from extreme flooding precipitation and heat events1 At the same time environmental conditions are also projected to change posing chronic hazards as some coastal areas are regularly inundated by high tide and average annual temperatures rise In NYCrsquos Roadmap to 80 x 50 the City of New York (the City) committed to reducing emissions of greenhouse gases by 80 by 20502 However the impacts from climate change are already occurring and these Guidelines establish how the City can increase its resiliency to unavoidable climate change through design
Codes and standards that regulate the design of infrastructure and buildings incorporate historic weather data to determine how to build for the future However historic conditions do not accurately represent the projected severity and frequency of future storms sea level rise heat waves and precipitation The climate is already changing and will continue to change in significant ways over the entire useful life of facilities designed today threatening to undermine capital investments and impede critical services To protect the facilities New Yorkers depend upon the City will design them using the best available data for future conditions The Climate Resiliency Design Guidelines (ldquoGuidelinesrdquo) provide step-by-step instructions on how to supplement historic climate data with specific regional forward-looking climate change data in the design of City facilities Resilient design is intended to become an integral part of the sequential project planning process for agencies and their designers All new projects should assess their climate change risks in the context of the projectrsquos purpose specific site location and funding and then determine the appropriate design strategies These Guidelines apply to all City capital projects except coastal protection projects (eg sea walls and levees) for which the City will develop separate guidance Implementing the Guidelines will result in protection standards that will make the Cityrsquos built environment more resilient to climate change and promote the health safety and prosperity of New Yorkers
A GOALSThe primary goal of the Guidelines is to incorporate forward-looking climate change data in the design of all City capital projects The Guidelines provide a consistent methodology for engineers architects landscape architects and planners to design facilities that are resilient to changing climate conditions The Guidelines are to be used throughout the design processmdashduring capital planning initiation as a reference in requests for proposals (RFPs) during a conceptual or study phase through to final designmdashfor all new construction and substantial improvements of City facilities
IA GOALS
1 Though the intensity and frequency of storms is expected to increase firm projections on future wind conditions have not yet been developed NYC commenced a study in 2017 to assess projected changes to extreme wind hazards and identify risks to the cityrsquos built environment
2 To learn more about 80 x 50 visit httpwww1nycgovsitesustainabilitycodes80x50page
I INTRODUCTION
The Guidelines provide step-by-step instructions on how to supplement historic climate data with specific regional forward-looking climate change data in the design of City facilities
NYC Mayorrsquos Office of Recovery and Resiliency Climate Resiliency Design Guidelines
5IB CLIMATE CHANGE PROJECTIONS FOR NEW YORK CITY
A successful resiliency strategy is one that provides co-beneficial outcomes reduces costs over the life of the asset wherever possible and avoids negative indirect impacts to other systems Resilient design should not exist in a silo but rather be a well-integrated part of existing processes and address other goals of the City For example these resilient design choices should be made in the context of the Cityrsquos capital planning risk management and financial planning Similarly resilient design choices should be selected to maximize the efficacy and efficiency of investments Some ways this can be done include 1) integrating ldquosoftrdquo resiliency strategies (operational measures or investments in green infrastructure) and ldquohardrdquo resiliency strategies (built or intensive investments) 2) addressing multiple climate hazards with single interventions and 3) reducing climate change risk in concert with other goals (eg energy efficiency or reduction in greenhouse gas emissions) These Guidelines were developed by the Mayorrsquos Office of Recovery and Resiliency (ORR) in close collaboration with City agencies that are involved in the design or management of capital projects A Design Guidelines Working Group was convened to consult on the development of the Guidelines which included more than 15 City agencies3 A preliminary version (10) of these Guidelines was issued in April 2017 and was tested and validated through an extensive review with internal and external climate and design experts Version 20 has been updated to reflect lessons learned through that analysis
B CLIMATE CHANGE PROJECTIONS FOR NEW YORK CITY
The New York City Panel on Climate Change (NPCC) provides regional climate change projections that inform City resiliency policy Composed of leading scientists the NPCC prepares projections for the metropolitan region which have shown that extreme weather will increase in frequency and severity and that the climate will become more variable These projections are divided across future time slices including the 2020s 2050s 2080s and 2100 The most NPCC recent climate change projections from 2015 encompass a wide range of possible outcomes for example
bull Mean annual temperature is projected to increase between 41 and 66degF by the 2050s and between 53 and 103degF by the 2080s4
bull Frequency of heat waves is projected to triple by the 2050s to 5 to 7 heat waves per year and 5 to 8 heat waves per year by the 2080s5
bull Mean annual precipitation is projected to increase between 4 to 13 by the 2050s and between 5 to 19 by the 2080s6
bull Sea level is expected to continue rising by another 11 to 21 inches by the 2050s and by 18 to 39 inches by the 2080s7
This document provides specific guidance on how to use the range of climate change projections in design For more information on climate change projections for the metropolitan region see Appendix 2 The NPCC continues to study and refine projections for the metropolitan region and these Guidelines will be updated as new reports are released by the NPCC
3 Representatives from the following City departments and agencies contributed to the creation of this document Environmental Protection Transportation City Planning Buildings Design and Construction Parks and Recreation Emergency Management School Construction Authority City Administrative Services Health and Hospitals Information Technology and Telecommunications Economic Development Corporation Housing Authority Public Design Commission Mayorrsquos Office of Sustainability Mayorrsquos Office of the Chief Technology Officer Housing Preservation and Development Office of Management and Budget Sanitation and Law
4 Ranges for heat reflect the middle and high range estimates from the NPCC See Appendix 2 for more information5 Ibid6 Ranges for precipitation reflect the middle and high range estimates from the NPCC See Appendix 2 for more information7 Ranges for sea level rise reflect the middle range estimates from the NPCC See Appendix 2 for more information
NYC Mayorrsquos Office of Recovery and Resiliency Climate Resiliency Design Guidelines
6IC PLANNING ACROSS PROJECT USEFUL LIFE ID MANAGING UNCERTAINTY
C PLANNING ACROSS PROJECT USEFUL LIFEA resilient facility is one built to withstand or recover quickly from natural hazards Climate conditions will continue to change over time which makes considering the useful life important for choosing the right level of protection8 Users should using professional knowledge and examples from the built environment estimate the full useful life of the facility to determine necessary design adjustments tied to climate change (useful life starts at the end of construction) The full project useful life of a facility is typically a longer period than the design life and more accurately represents the extended service life of most types of facilities (assuming regular maintenance) For example an administrative building may have a design life of 30 years but in practice such buildings remain in use for 50 years or more when well-maintained Full useful life is also met through the successful deployment of design strategies that minimize operations and maintenances (OampM) and the need for renovations ORR and Department of Design and Construction (DDC) with input from other City agencies are developing a library of common asset types for buildings landscapes infrastructure and equipment and assessing their typical design and useful lives This resource will be added as an addendum to the Guidelines by April 2019
D MANAGING UNCERTAINTYClimate change projections from the NPCC are the product of state-of-the-art modeling and analysis However as with all projections there is uncertainty embedded within them9 The NPCC continues to develop review and synthesize the latest climate data for the metropolitan region and new findings will be incorporated into future versions of these Guidelines
Given uncertainty flexible adaptation pathways provide a useful iterative approach for managing uncertainty and designing resilient facilities particularly those with a useful life that extends over 50 years - beyond which the uncertainty of projections increases10 Adaptation pathways are particularly useful for expensive long-lived and highly complex projects They provide a way to balance uncertainty with cost as well as manage operational and maintenance constraints A facility can be engineered with an adaptable protection level which reduces the hazard risk to acceptable levels for part of its useful life and that can be re-evaluated as risk levels change
8 NIST Community Resilience Planning Guide for Buildings and Infrastructure Systems Vol 1 NIST Special Publication 1190 US Department of Commerce 2016
9 PlaNYC A Stronger More Resilient New York report of the NYC Special Initiative for Rebuilding and Resiliency Report June 11 2013 page 28 From that report ldquoLike all projections the NPCC projections have uncertainty embedded within them Sources of uncertainty include data and modeling constraints the random nature of some parts of the climate system and limited understanding of some physical processes The NPCC characterizes levels of uncertainty using state-of-the-art climate models multiple scenarios of future greenhouse gas concentrations and recent peer-reviewed literature Even so the projections are not true probabilities and the potential for error should be acknowledgedrdquo
10 To learn more see Chapter 2 in the NPCC 2010 report Climate Change Adaptation in New York City available at httponlinelibrarywileycomdoi101111nyas20101196issue-1issuetoc
Figure 1 - Example of a flexible adaptation pathway for an outdoor emergency generator and platform
An illustrative example of using flexible adaptation
NYC Mayorrsquos Office of Recovery and Resiliency Climate Resiliency Design Guidelines
7IE PROJECT-SPECIFIC CONSIDERATIONS
pathway on a facilitiesrsquo component is explained in Figure 1 It shows an emergency generator with an approximate useful life of 25 years located outside a building In order to incorporate the Guidelines into design it is recommended that the foundation of the generator structure is designed to match the useful life of the building which can vary between 50-70 years that the generator serves Assuming the generator is subject to flooding risk from sea level rise and coastal surge it should be built on an elevated concrete slab that matches the future year design flood elevation (DFE) scenario corresponding to the end of the generatorrsquos useful life The generator must be replaced when it reaches the end of its useful life which is typically far less than that of the building When the replacement generator is installed the concrete slab is further elevated to accommodate the future DFE The foundation of the generator and the columns are designed to support the additional future load from the concrete slab Thereby the initial investment into the foundation can be used to adapt in the future allowing for future flexibility and avoided costs
Adaptation pathways may not apply equally to all types of projects or climate change projections Facility flood defenses for example may be more easily developed through an adaptation pathway than heat-vulnerable materials or below grade drainage systems For this reason the Guidelines use the middle of the 25th to 75th percentile range projections for sea level rise (see Table 4) and the high-end 90th percentile projections for heat (see Table 1) For precipitation these Guidelines recommend using the existing 50-year storm data as a proxy for the projected high-end 5-year storm (see Section IIIB and Figure 4 for more details)
Uncertainty can be further addressed through risk management Some facilities such as those that are critical or cost more than $50 million for design and construction will benefit from a full climate change risk assessment (see examples in Appendix 7) This assessment will evaluate protecting the facility to a potentially higher level of sea level rise than the recommended height in these Guidelines The City plans to develop a process for integrating climate change data into existing risk management processes by April 2019 If engaging in a climate change risk assessment process please contact ORR at ResilientDesigncityhallnycgov
E PROJECT-SPECIFIC CONSIDERATIONSExisting information and requirements specific to different kinds of projects must be reviewed on a case-by-case basis when evaluating resiliency design strategies Refer to Appendix 5 for an example approach of how to make resiliency planning and design decisions and discuss these considerations as a project team to determine which apply and how to respond
bull Financing requirements if the project is federally-funded or receives recovery funding discuss with the funding agency if certain protection standards or cost-benefit analyses are required For example FEMA requires specific flood protection standards for critical facilities and non-critical facilities
bull Interdependencies consider how hazards impact interdependencies across sectors as well as the risks from coincident events (eg extreme precipitation occurring during an extreme surge event) to specific projects
bull Existing hazard mitigation projects and risk studies evaluate if nearby or associated projects have already been assessed for climate change risks Identify if
NYC Mayorrsquos Office of Recovery and Resiliency Climate Resiliency Design Guidelines
8IE PROJECT-SPECIFIC CONSIDERATIONS
any studies have been conducted that could inform design (eg local flood modeling with sea level rise) This may inform the climate change risk assessment or provide insights into site specific conditions and design options A map that catalogs NYC resiliency projects is located here httpsmapsnycgovresiliency
bull Agency-specific resiliency design standards refer also to resiliency guidelines provided by various City agencies (eg Parkrsquos Design and Planning for Flood Resiliency11) Agency guidelines build on the climate data provided in these Guidelines by providing specific design alternative and insights relevant to those agencies
bull Limitations the Guidelines do not describe or encompass all City resiliency policies To learn more about how the City plans for a resilient future see the latest OneNYC plan as well as the 2013 report A Stronger More Resilient New York Related resiliency issues are being addressed by the City but are out of the scope of these Guidelines including neighborhood and regional-level climate change risk management and zoning
bull Further questions Contact ORR at ResilientDesigncityhallnycgov
11 Available at httpswwwnycgovparksorgplanning-and-buildingplanningresiliency-plansflood-resiliency
NYC Mayorrsquos Office of Recovery and Resiliency Climate Resiliency Design Guidelines
9IIA INCREASING HEAT
All City of New York capital projects should be designed to withstand increasing heat and precipitation based on the useful life of the asset while design interventions for storm surge and sea level rise depend on the projectrsquos proximity to the floodplain useful life and criticality In order to support design team efforts to generate resilient design responses (ie adjustments to base projects) these Guidelines provide climate change projections and recommend design adjustments or interventions in response to increasing heat increasing precipitation and sea level rise The Guidelines recommend designing to loads beyond the minimum requirements in the prevalent NYC local codes Design teams should consider project benefits and additional costs to incorporating resilient design standards before finalizing project design
A INCREASING HEATUse this section to determine how to adjust a facilityrsquos design to account for increasing temperatures and to reduce the facilityrsquos contribution to the Urban Heat Island effect Heat reduction levels will be determined by the function location and useful life of the asset
BackgroundThe impacts of heat on NYC are well established Every summer over 100 New Yorkers die from causes exacerbated by extreme heat12 The region has seen a steady increase in the number of days above 90degF and temperatures are projected to keep rising worsening heat-related mortality By the 2050s the number of days at or above 90degF is expected to double and the frequency and length of heat waves will triple to an average 6 heat waves per year13 Certain areas of NYC already experience higher temperatures relative to other parts of the city and these hot spots will be exacerbated by climate change (see Figure 2)
12 OneNYC The Plan for a Strong and Just City (The City of New York 2015) 228 See also Madrigano J Ito K Johnson S Kinney PL Matte T 2015 A case-only study of vulnerability to heat wavendashrelated mortality in New York City (2000ndash2011) Environmental Health Perspectives 123672ndash678 httpwwwnycgovhtmlonenycdownloadspdfpublicationsOneNYCpdf
13 Horton et al New York City Panel on Climate Change 2015 Report Chapter 1 Climate Observations and Projections Ann NY Acad Sci ISSN 0077-8923 New York 201514 LANDSAT Thermal Data from 8182009
Figure 2 - Thermal imagery of New York City based on LANDSAT Thermal Data from 818200914
II INTERPRETING CLIMATE CHANGE DATA FOR RESILIENT DESIGN ADJUSTMENTS
NYC Mayorrsquos Office of Recovery and Resiliency Climate Resiliency Design Guidelines
10IIA INCREASING HEAT
In Cool Neighborhoods NYC the City prioritizes strategies to study the Urban Heat Island effect and make targeted investments that benefit communities most vulnerable to heat15 New Yorkers are more or less vulnerable to heat based largely upon socio-economic factors including age income location tree coverage and the percentage of dark surfaces The NYC Department of Health and Mental Hygiene (DOHMH) developed a Heat Vulnerability Index (HVI) which highlights parts of the city where more residents face an increased risk of heat-related mortality Their vulnerability is due to their exposure and socio-economic conditions that determine their
Figure 3 - Heat Vulnerability Index (HVI) for New York City Community Districts (Source NYC DOHMH 2015) This analysis identifies physical social and economic factors associated with increased risk of heat-related morbidity and mortality17
The Guidelines recommend that project designers consider two aspects of the relationship between their project and increasing heat the way their project reduces the Urban Heat Island effect and the impact that increasing heat will have on the physical components of their project itself
bull Reduce Urban Heat Island effect materials in the built environment absorb the sunrsquos heat throughout the day and re-radiate it back into the atmosphere driving localized temperatures higher and increasing demands on cooling systems Air conditioning and ventilation equipment also push extra heat into the air contributing to a feedback loop that increases localized ambient temperatures and impacts the health of heat-vulnerable New Yorkers This section provides guidance on how new capital construction can reduce the contribution to ambient heat in the city
bull Minimize impact from increasing heat increasing heat can physically impact components of buildings and infrastructure damaging or stressing materials electrical systems and mechanical systems Rising temperatures will also stress energy and communications networks that buildings and other infrastructure rely upon18 This section provides climate data to be used to adjust and adapt heat-vulnerable components of assets
15 OneNYC 22816 To learn more about Heat Vulnerability Index see page 229 of OneNYC at httpwwwnycgovhtmlonenycdownloadspdf
publicationsOneNYCpdf17 See page 229 in the OneNYC plan to learn more about HVI18 Damiano H et al NYCrsquos Risk Landscape A Guide to Hazard Mitigation (NYC Emergency Management 2014) 103
Heat can be lethal for all but its impact on New Yorkers is not equal
sensitivity to heat Community districts in red and orange in Figure 3 are areas of highest vulnerability and these are particularly concentrated in east Brooklyn the south Bronx northern Manhattan and southeast Queens16 While all new capital projects should address heat impacts those sited in moderate to high vulnerable HVI areas should implement multiple strategies to reduce the Urban Heat Island and help address the high vulnerability in these neighborhoods
NYC Mayorrsquos Office of Recovery and Resiliency Climate Resiliency Design Guidelines
11IIA INCREASING HEAT
1 Urban Heat Island reductionNew capital construction should minimize its contribution to the Urban Heat Island effect The design interventions provided below offer benefits to the community and the facility through reduced heat loading reduced energy costs andor improved occupant health and thermal comfort The appropriate combination of design interventions will vary dependent on the project scope
a) Increase the solar reflectance of surfaces by utilizing light-colored pavement coatings and materials in combination with shading with a minimum target of 50 of the non-structure areas of facility sites19
Lighter reflective surfaces help reduce the Urban Heat Island effect heat loading and internal building temperatures and extend the lifespan of rooftops and heating ventilation and air conditioning (HVAC) equipment The City has taken steps towards reducing ambient temperatures such as implementing the NYC Cool Roofs program20 New buildings as well as existing buildings with roofs going through significant repairs are required by law to paint their roofs white This program intervention reduces a buildingrsquos contribution to Urban Heat Island effect and provides energy savings by coating the normally dark concrete roof surface with white paint allowing the roof to reflect solar radiation
b) Increase the shading of surfaces by planting trees or other vegetation in combination with cool pavements with a minimum target of 50 of the non-structure areas of facility sites
Shady areas with heat- and in coastal areas salt-tolerant vegetative species can help keep buildings cool and provide energy savings as well as lower temperatures
c) Meet Climate Zone 6 standards for fenestration and insulation (See Section ECC C402 in Chapter C4 of the 2016 NYC Energy Code) to improve efficiency of building envelopes
NYC is currently in Climate Zone 4 NYC already requires that small residential building envelopes are designed to meet higher insulation and fenestration requirements to improve energy efficiency21 All City capital projects including non-residential facilities should meet this standard
d) Select greenblue roofs andor other appropriate landscape elements that maximize cooling with help of landscape architects
The City already encourages the use of green and blue roofs on buildings to reduce the Urban Heat Island effect22 provide stormwater management and increase the useful life of the roof Besides replacing dark roof surfaces green roofs and vegetation also provide shade and keep the air cool through evapotranspiration by releasing moisture into the atmosphere Blue roofs coupled with light colored roofing material can provide stormwater management and rooftop cooling Some of these designs support the shading and solar reflectance goal in Step a) above Additionally City capital projects are subject to Leadership in Energy and Environmental Design (LEED) certification and green roofs can earn LEED credits23 Projects should integrate cooling strategies listed below based on project scope and a balance between costs and benefits
bull Green roofs or blue roofs on a broader range of facilities (including industrial buildings storage garages administration buildings etc)
19 Urban Green Council (2010) Green Codes Task Force Proposed code ldquoEF 12 Reduce Summer Heat with Cool Shady Building Lotsrdquo20 Local Law No 21 (2011) amended Chapter 12 of the NYC Building Code to update roof coating standards Also
see Cool and Green Roofing Manual (DDC) 2007 for more information on NYC standards for cool and green roofs httpwwwnycgovhtmlddcdownloadspdfcool_green_roof_manpdf
21 Read more about the code here httpswww1nycgovsitebuildingscodes2016-energy-conservation-codepage22 See Cool and Green Roofing Manual (DDC) 2007 for more information on NYC standards for cool and green roofs
httpwwwnycgov htmlddcdownloadspdfcool_green_roof_manpdf23 See Local Law No 32 (2016) for more information
NYC Mayorrsquos Office of Recovery and Resiliency Climate Resiliency Design Guidelines
12
2 Minimize impact from increasing heatThis section provides information to support making design adjustments to capital projects to reduce impacts to equipment structures landscapes and materials from rising average temperatures and increasing extreme heat events
a) Review forward-looking climate data provided in Table 1 and Table 2 Select heat projections according to the useful life of the facility and its primary
components then evaluate and address impacts in the steps below Table 1 provides design criteria for average temperatures and incidents of extreme heat events projected to different time periods across the 21st century Table 2 provides guidance on future 1 Dry Bulb Temperature and Cooling Degree Days for the NYC area The 1 Dry Bulb Temperature represents the ambient air temperature
IIA INCREASING HEAT
bull Vegetated structures such as shade trees and planters (to reduce heat loading on horizontal or vertical surfaces)
bull Bioswales rain gardens and bioretention24 bull Maximize planted permeable surfacesbull Other permeable surfaces (used for stormwater management these retain
moisture that evaporates as surface temperatures rise)25 bull Open-grid pavement system (at least 50 unbound)26 bull Evaluate site planning and building massing with regard to solar gainbull Solar panels for shading and to generate energy
Table 1 ndash Baseline and projected extreme heat events27
End of useful life
heat waves per year (3 or more consecutive days with max temperatures at or above 90degF)
days above 90degF
Annual average temperature
Baseline (1971-2000) 2 18 54degF
Through to 2039 4 33 572degF
2040-2069 7 57 606degF
2070-2099 9 87 643degF
Table 2 ndash Projections for 1 Dry Bulb temperature and Cooling Degree Days
Change in projected value for 2050s
Variable Baseline for Central Park (1971-2000)
Low estimate (10th percentile)
Middle range (25th to 75th percentile)
High estimate (90th percentile)
1 Dry Bulb temperature 91degF +3degF +4-6degF +7degF
Cooling Degree Days (base = 65degF) 1149 +37 +46-73 +87
Note Due to HVAC system typical useful life of 25 years or less only projections for the 2050s are shown Projections for the 2020s are not shown because it is anticipated that enough of a safety margin is employed already in current systems to withstand the temperature rise expected through the 2020s The NPCC is currently working on projections of 1 Wet Bulb temperatures which are expected to increase and may require systems to have higher moisture reducing capacity in addition to the enhanced cooling capacity
24 When siting bioswales consider groundwater levels and soil permeability and ensure that the site is not contaminated from past or present land uses A high water table may prohibit some applications
25 Urban Green Council (2010) Green Codes Task Force Proposed code ldquoSW 1 REDUCE EXCESSIVE PAVING OF SITESrdquo26 LEED Neighborhood Development v4 ldquoHeat island reductionrdquo credit27 Projected estimates for average temperatures are based upon 90th percentile change factor added to the baseline average annual
temperature from New York City Panel on Climate Change (2015)
NYC Mayorrsquos Office of Recovery and Resiliency Climate Resiliency Design Guidelines
13IIA INCREASING HEAT
b) Evaluate potential impacts on systems and materials Heat impacts on a facility are highly contingent on the facility type and should be reviewed on a case-by-case basis28 A decrease in the useful life or operational capacity of a facility or components of a facility may occur due to rising temperatures Interventions will also vary depending on whether the project is a new capital investment or a substantial improvement to an existing facility Factors to evaluate as applicable to project scope include but are not limited to
bull Thermal expansion warping softening or other forms of material change or degradation of structural integrity occurring at an accelerated rate by excessive heat
bull Health and safety impacts on occupants vulnerable to heat bull Increased failure or reduced efficiency of electrical or mechanical systems bull Prioritization of critical loads for systems and components at the facility andbull Moisture control needs for buildings with a higher standard for fenestration and
insulation
The results of this evaluation will inform steps taken in the step below
c) Reduce heat impacts Review and implement specific changes to the facility design based on assessments
above Develop a strategy based on the specific type of facility its operational profile and its useful life A Design Strategies Checklist is available for use in Appendix 6 as a resource to track design approaches Specific areas of focus are
bull Electricity outages High temperatures drive demand for air conditioning and can increase the risk of facility equipment failure potentially broader grid disruptions or brownouts2930 To manage this risk design City buildings and infrastructure to withstand periods without electricity using the following approaches in particular if they provide critical or essential services
Ǯ Identify and assess how much of the facilityrsquos load is critical (eg ldquocritical loadrdquo) including the necessary duration of the backup power supply (eg is backup power needed for 8 hours or multiple days) Determining what loads are critical and how long they should be powered for is essential for a facilityrsquos operations and what the role of the facility will have in an emergency situation31
Ǯ Depending on the size of the critical load and budget different backup power supply options could range from backup generators (eg diesel natural gas) to hybrid systems (eg solar + battery storage + appropriately sized generator) Each option has different trade-offs that should be considered in terms of cost feasibility and environmental impacts For shorter duration needs andor smaller critical loads buildings with existing solar systems should consider adding storage to provide a resiliency benefit In some cases co-generation systems may make sense from an economic and resiliency perspective especially if there
28 Sector- and facility-specific impacts vary greatly For examples of sector-specific impacts and design responses see Flooded Bus Barns and Buckled Rails (FTA 2011) and Ready to Respond Strategies for Multifamily Building Resilience (Enterprise Green Communities 2015)
29 McGregor et al (2013) Two Degrees The Built Environment and Our Changing Climate Routledge Press30 High temperatures also increase energy demand which can increase fossil fuel based greenhouse gas emissions31 The key roles of the facility that need to be identified are operational hours number of occupants and electrical loads needed for the
desired operations Electrical equipment and appliances for the desired operations may include - but are not limited to - safety lighting life-supporting systems fire protection systems telecommunications equipment mechanical systems to mitigate extreme temperatures and computing equipment Every facility is unique Operational characteristics and load profiles need to be established prior to sizing the equipment required to keep the facility in operational mode
NYC Mayorrsquos Office of Recovery and Resiliency Climate Resiliency Design Guidelines
14IIA INCREASING HEAT
is a significant heating andor cooling load in addition to electricity demand32
Ǯ Depending on the option assess need to invest in internal electricity rewiring and building energy management systems (eg switches reconfiguration of distribution infrastructure to isolate critical loads from non-critical loads and the ability to island from the broader grid during the event of a larger disruption software and hardware to manage the deployment of hybrid systems) andor need for external hookups for temporary generators and boilers33
bull Failure in facility ventilation electrical and air conditioning systems Some systems designed to meet the requirements of past climate may overheat and fail during extreme events Some design interventions include34
Ǯ Selecting systems with higher heat tolerance Ǯ Adding Energy Recovery Ventilation systems Ǯ Providing additional or redundant ventilation systems either mechanical or
natural to cool electrical equipment Ǯ Optimizing building layout by
bull segregating temperature sensitive electronics and computer control system from other systems
bull placing heat generating equipment like transformers and switchgear outdoors where permitted and
bull splitting the facility cooling loads among different HVAC systems in facility for redundancy and better zone control
bull Passive solar cooling and ventilation There are numerous design features that provide passive solar cooling for buildings to help maintain lower internal ambient temperatures with less air conditioning These features also help keep facilities habitable during extended grid failures when generators fail or must be reserved for critical functions Some design features include35
Ǯ Appropriate east-west orientation Ǯ Passive ventilation design Ǯ Vertically stacked double skin facades Ǯ Exterior window shades Ǯ Light colored exteriors Ǯ Shaded arcades Ǯ Thermally massive materials Ǯ High performance glazing Ǯ Operable windows
32 To learn more see the Building Resiliency Task Force report from Urban Green Council (2013)33 Ibid 34 Flooded Bus Barns and Buckled Rails FTA Office of Budget and Policy 201135 These and other examples are found in McGregor et al (2013) Two Degrees The Built Environment and Our Changing Climate
Routledge Press Also see Flooded Bus Barns and Buckled Rails FTA Office of Budget and Policy 2011
NYC Mayorrsquos Office of Recovery and Resiliency Climate Resiliency Design Guidelines
15IIB INCREASING PRECIPITATION
B INCREASING PRECIPITATIONThe intensity and frequency of precipitation events are projected to increase with climate change creating new challenges for stormwater management and impacts to the built environment such as
bull The potential for greater frequency of stormwater management systems being overwhelmed36
bull More frequent and severe flooding of buildings and infrastructure in areas across the city and
bull Greater variability in rainfall events annually including the chance of drought
The goal for this section is to guide stormwater management approaches including infiltration increases in on-site storage volume and where possible increases in sewer capacity to account for precipitation increases associated with climate change Designers should develop and consider design interventions that would decrease site contribution to sewer in-flows beyond the existing NYC Building Code requirements Given its complexity the Department of Environmental Protection (DEP) is also evaluating climate impacts to the sewer system on a drainage-wide level Proactive design such as increasing on-site infiltration and storm water retention can contribute to system resiliency on a site-specific basis
BackgroundNYCrsquos drainage systems are designed to handle approximately the current 3-year intensity-duration-frequency (IDF) event in most areas of the city where sewers were built prior to 1970 In locations with sewers built after 1970 the capacity was built to handle the 5-year event NYCrsquos network of drainage systems can experience flooding above those thresholds due to widespread precipitation events or by localized intense storms (sometimes called ldquocloudburstsrdquo) causing flooding and backups Climate change projections indicate that flooding resulting from multiple types of precipitation events may increase in frequency This increasing probability is forecast for all types of precipitation events in NYC although there is greater uncertainty around future short duration events Relying on sewers alone to manage extreme precipitation events will not be sufficient in a changing climate The City plans to reduce impervious areas and provide additional storage capacity to reduce flood damage For managing stormwater from larger storms such as at the 50- and 100-year recurrence intervals DEP is increasingly considering the role of streets and open space in managing flow this is referred to as a dual drainage design approach The City is piloting projects to test this dual drainage approach
Another set of interventions include Bluebelt best management practices (BMPs) such as constructed wetlands storm water ponds and stream restorations that emulate pre-development conditions to manage large volumes of water and green infrastructure37 which in NYC have generally been designed to reduce flooding and combined sewer overflow respectively They are not typically sized to manage precipitation events of the same magnitude as sewers which serve as primary drainage conveyance However Bluebelt BMPs green infrastructure and other stormwater management tools may provide an additional buffer for larger storm events by temporarily storing andor infiltrating runoff that would otherwise be directed into the sewer system For instance areas of open space commonly found in NYC may not provide adequate environments for trees and other plantings However in these cases other types of green infrastructure like permeable surfaces and subsurface detention and retention installations would still be considered feasible
36 NYC is already taking steps to address this problem which will worsen with climate change To learn more about how NYC is using green and gray infrastructure to manage stormwater visit httpwwwnycgovhtmldephtmlstormwaterindexshtml
37 NYC DEP NYC Green Infrastructure Program
NYC Mayorrsquos Office of Recovery and Resiliency Climate Resiliency Design Guidelines
16IIB INCREASING PRECIPITATION
The City led by DEP continues to develop its options for managing heavier storm events due to climate change DEP is examining approaches to evaluate sea level rise and rainfall intensity for stormwater management and where possible sewer capacity These efforts will integrate forward-looking climate data into the design of these capital assets and the compounding factors of heavier rain storms and sea level rise will likely require greater infiltration and on-site storm water retention capacity Agencies and consultants should work directly with DEP to develop strategies on a given site necessary to meet expected increases in rainfall intensities and frequencies
1 Precipitation design adjustment for on-site stormwater systems
Based upon the design storm required for the City facility in design follow the steps below and review recommended design interventions
a) Identify the duration of the design event required The current 50-year IDF can be used as a proxy for the future 5-year storm
(projected for the 2080s) Design on-site detentionretention systems to retain the volume associated with the current 50-year IDF curve (see Figure 4 below) Design the on-site system to release at the maximum rate as specified in 15 Rules of the City of NY (RCNY) Chapter 3138
b) Conduct sensitivity analysis Compare the retentiondetention required for the current 5-year IDF versus the
38 Refer to existing codes and standards as well when determining the existing required storm as NYC requires different sizes of design storms for infrastructure and buildings For example NYC Plumbing Code Chapter 11 and Title 15 of the Rules of the City of New York Chapter 31
02
04
06
10
20
40
60
100
200
-2316090
Rai
nfal
l Int
ensi
ty (
inch
es p
er h
our
)
DurationsruoHsetuniM
5 10 15 30 1 2 3 6 12 18
5-yr
10-yr25-yr
50-yr
100-yr
NEW YORK NEW YORK
Figure 4 - Current Intensity-Duration-Frequency Precipitation Curve for NYC adapted from US Department of Commerce Weather Bureau Technical Paper 25
NYC Mayorrsquos Office of Recovery and Resiliency Climate Resiliency Design Guidelines
17IIB INCREASING PRECIPITATION
c) Identify design interventions for managing increased precipitation40 There are different ways to manage stormwater better and avoid urban flooding after
intense rain Choose the right combination of interventions after considering the site location operational requirements cost benefits and useful life of the intervention Some examples of design interventions are
bull Minimize increases in impervious surfacebull Utilize strategies that infiltrate evaporate or reuse rainwater to achieve storm
water volume reductions Then choose strategies that detain (delay drainage) to manage the rate of the storm water flow into the Cityrsquos drainage system
bull Install stormwater infiltration detention and storage (eg bioswales41 green roofs blue roofs and other blue or green infrastructure storage basins or tanks)
bull Protect areas below grade from floodingbull Keep catch basin grates clearbull When implementing perimeter protections ensure that interior water
management is also accounted for andbull Explore interventions to protect underground utility and telecommunications
infrastructure from water damage
d) Use appropriate DEP guidelines to perform the above tasks using the higher design storm
The three currently prescribed DEP guidelines are as follows
bull Guidelines for the Design and Construction of Stormwater Management Systems July 201242
bull Criteria for Detention Facility Design November 201243 bull DEP Site Connection Proposal Application and Guidelines44
Note on stormwater standards As DEP updates stormwater standards and develops specific tools to evaluate impacts of increased precipitation and drainage strategies for on-site storm water management these changes will be reflected in future versions of these Guidelines However it is recommended that the designer should develop and consider design interventions that would increase the on-site storage beyond the existing requirements Also a methodology is under development that will establish a consistent citywide process for addressing legal grade which will have further implications for how extreme precipitation is managed
39 NYC DEP Standards for Stormwater Release Rates available at httpwwwnycgovhtmldephtmlenvironmental_reviewsstormwater_release_ratesshtml 40 Also see DEP Guide to Rain Event Preparedness at httpwwwnycgovhtmldeppdfbrochuresflood-preparedness-flyerpdf and
Ready to Respond Strategies for Multifamily Building Resilience at httpwwwenterprisecommunityorgresourcesready-respond-strategies-multifamily-building-resilience-1335641 When siting bioswales consider groundwater levels and soil permeability and ensure that the site is not contaminated from past or
present land uses A high water table may prohibit some applications42 Available at httpwwwnycgovhtmldephtmlstormwaterstormwater_management_constructionshtml43 Available at httpwwwnycgovhtmldeppdfwater_sewer30_criteria_for_detention_facility_design_06062012pdf44 Available at httpwwwnycgovhtmldeppdfwater_sewer24pdf
current 50 year IDF to determine the cost and benefits associated with complying with these Guidelines Use the Evaluation of Project Benefits section below and Appendix 4 for guidance on how to identify and assess benefits Given the results of the costbenefit analyses review the added benefit of designing retentiondetention using greater magnitude storms (eg 100-year) or lower (eg 25-year) The goal is to maximize retentiondetention capacity given site and cost constraints as well as through an evaluation of the benefit of adding capacity to detainretain water for larger storm events
NYC Mayorrsquos Office of Recovery and Resiliency Climate Resiliency Design Guidelines
18
2 Incorporating climate change projections into DEP drainage planning
The first line of defense for managing intense precipitation events does not require changes to the sewer system as described above For drainage and wastewater infrastructure planning in a changing climate the sewer network and wastewater infrastructure should be qualitatively evaluated from the upstream pipes to the regulator chambers pump stations interceptors and ultimately to the downstream outfall to determine the feasibility of incorporating climate change projections into the system design For DEP storm sewer projects FY 2021 or later in separately sewered drainage areas where the design is in the early stages and there is free discharge the agency will evaluate the feasibility of revising the design to incorporate climate projections into the design If the project (including the prescribed changes) passes the costbenefit analysis then DEP will consider incorporating climate change projections into the sizing However changes in one part of the system must be carefully evaluated For example any upsizing of the regulator chamber or the high point of the system can negatively impact the design and operation of the wastewater infrastructure and residencesbusinesses on the system and can lead to a diminished the level of service
DEP is in the process of developing a hydrologic and hydraulic (HampH) model to estimate runoff flow for future climate scenarios and is evaluating rainfall hyetographs for the existing and future rainfall scenarios to be included in the drainage planning process In addition DEP currently coordinates with ORR for drainage planning as a part of coastal resiliency projects A more detailed methodology to incorporate climate change projections into drainage planning will be developed for version 30 of the Climate Resiliency Design Guidelines to be released in April 2019
IIB INCREASING PRECIPITATION
NYC Mayorrsquos Office of Recovery and Resiliency Climate Resiliency Design Guidelines
19IIC SEA LEVEL RISE
non-critical components within a larger facility or campus (eg at a maintenance yard differentiate between structures and equipment) Critical components essential to the facilityrsquos functionality should be protected to the higher standard for criticality even if the facility itself may be non-critical Some examples of critical components include electrical distribution and switching areas motor-control centers chemical feed equipment boilers communications systems monitoring and safety equipment HVAC units fire alarms and suppression equipment furnaces elevators emergency fuel supplies emergency generators and hazardous material storage Component protection should also be evaluated if a facility is expected to be fully operational during a flood event or if it is expected to quickly resume full operations after an event
For buildings and infrastructure with a long useful life it is not always cost effective or operationally feasible to design a facility to be resilient to hazards faced at the end of its useful life In these cases the most resilient design will be one that provides extra protection against hazards in the initial decades while also leaving open design alternatives for updating resiliency measures as new data is provided or new risk assessments are completed This flexible adaptation pathways approach builds in options to protect assets later in life as demonstrated in an example shown in Figure 1 (in Section I)
Other considerations to keep in mind includebull These Guidelines apply to all City capital projects except coastal flood protection
systems which are designed to different standards than those provided here for
C SEA LEVEL RISEThis section provides tools to 1) determine if the project will be subject to tidal inundation during its useful life due to sea level rise and 2) incorporate sea level rise into flood protection levels of capital projects For projects in the current and future 1 annual chance floodplains sea level rise-adjusted design flood elevations (DFE) are provided and reflect the criticality of the asset and its useful life Background NYC has experienced the devastation of coastal storms most recently during Hurricane Sandy Sea level rise is projected to increase the depth extent and frequency of flooding from storm surge45 Sea level rise will also regularly inundate some low-lying areas during high tides Current flood protection heights are determined by using the base flood elevation established by the FEMA Preliminary Flood Insurance Rate Map (PFIRM) 201546 and the standard of protection for buildings in the floodplain in Appendix G of the NYC Building Code47 These Guidelines augment existing requirements for two primary purposes ensuring City facilities built today incorporate sea level rise and critical assets (as defined in Table 4) are protected to a higher level It is important to note that all projects and design interventions must comply with NYC Building Code
Designers should differentiate between critical and
45 New York City Panel on Climate Change Report Chapter 2 Sea Level Rise and Coastal Storms (2015)46 However NYC Building code G10222 requires that designers review both the PFIRM and the effective FIRM and use the more
restrictive of the two 47 For information on the differences between FEMA FIRM PFIRM and the Cityrsquos forward-looking flood maps see Appendix 3
Critical components essential to the facilityrsquos functionality should be protected to the higher standard for criticality even if the facility itself is non-critical
NYC Mayorrsquos Office of Recovery and Resiliency Climate Resiliency Design Guidelines
20IIC SEA LEVEL RISE
buildings and other physical infrastructure Many of NYCrsquos coastal flood protection systems are currently being developed to comply with FEMA accreditation for flood levee systems48 The City plans to develop further guidance for designing coastal protection projects
bull For information on the differences between FEMA FIRM PFIRM and the Cityrsquos forward-looking flood maps see Appendix 3
bull Coincident stressors from sea level rise should also be considered For example bridge scour may increase as sea levels rise Similarly flooding during heavy rainfall events can be worsened due to higher tailwater conditions associated with high sea levels Be aware of how different risks may interact and how different interventions can be deployed to address multiple hazards or provide other co-benefits
bull Note projects that require discretionary approval are required to incorporate sea level rise projections as part of the NYC Waterfront Revitalization Program49 and
bull A methodology is under development that will establish a consistent citywide process for addressing legal grade which will have further implications for how sea level rise and precipitation are managed
For more information see Section IE Designers should use the resources and methods described in this section to 1) assess tidal inundation due to sea level rise and 2) address risks in the current and future floodplains
1 Assessing tidal inundation due to sea level riseTidal flooding currently affects parts of NYC and is projected to worsen as sea levels rise and inundate low-lying coastal sites during high tides When determining a site location or establishing scope of substantial improvements for other types of coastal facilities the project team will consider alternative sites outside of zones threatened with regular inundation if resiliency actions are not taken Some facilities such as wastewater treatment plants and harbor facilities need to be near the coast for operational purposes
a) Determine tidal inundation risk from sea level rise Use the Flood Hazard Mapper (httpwwwnycgovfloodhazardmapper)50 to see if your
site is in an area inundated from high tide plus sea level rise within the projectrsquos useful life For example if the useful life ends between 2040 and 2069 choose the 2050s High Tide map) Determine risk only from high tide and sea level rise separate from flood events Follow the instructions in Figure 5 and refer to the example in Figure 6 to review inundation at the end of an assetrsquos useful life
48 For more information please visit httpwwwfemagovfema-levee-resources-library49 For more information visit httpwwwnycgovwrp50 The Flood Hazard Mapper relies on publicly available data to present these map resources Users should also refer to FEMA and the
NPCC for official information
Figure 5 - Flood Hazard Mapper high tide plus sea level rise at httpwwwnycgovfloodhazardmapper
NYC Mayorrsquos Office of Recovery and Resiliency Climate Resiliency Design Guidelines
21IIC SEA LEVEL RISE
b) Address flood risk If the Flood Hazard Mapper shows that the facility is expected to be inundated by
high tides within its useful life or if primary access roads are at risk of inundation consider alternative site options
- OR - If the site is not expected to be regularly inundated by tides proceed to the next
section 2 Addressing Risks in the Current Floodplain
Note on calculating tidal inundations with sea level rise if a project team is interested in understanding the depth of tidal inundation given climate change projections follow these steps First determine the Mean Higher High Water (MHHW) elevation in feet-NAVD 8851 datum nearest to the site If the MHHW data is unavailable from a site specific survey refer to httpwwwnycgovwrp for a list of MHHW elevations (NAVD88) at tide stations across the city52 Second add the high estimate (90th percentile) of expected sea level rise (see Table 8 in Appendix 2) for the year corresponding to the facilityrsquos useful life to the MHHW to determine the projected depth of tidal inundation with sea level rise
51 North American Vertical Datum of 1988 (NAVD 88) is the vertical control datum of orthometric height established for vertical control surveying in the US based upon the General Adjustment of the North American Datum of 1988
httpswwwngsnoaagovdatumsvertical52 SLR elevations at httpwwwnycgovwrp are adjusted to account for sea level rise since the last tidal epoch If no other resource is
available to determine MHHW use the NOAA Online Vertical Datum Transformation tool to calculate the MHHW in feet-NAVD
Figure 6 - Flood Hazard Mapper with high tide in the 2020s (left) and in the 2080s (right) at httpwwwnycgovfloodhazardmapper
NYC Mayorrsquos Office of Recovery and Resiliency Climate Resiliency Design Guidelines
22IIC SEA LEVEL RISE
2 Addressing risks in the current floodplain53
A facility located in the current 1 annual chance floodplain (PFIRM 2015)54 will face increasing risk of flooding during its useful life due to sea level rise increasing the depth of coastal storms This section provides a process for adjusting the design flood elevation required by code to account for sea level rise
a) Find the location of the facility using the Flood Hazard Mapper (httpwwwnycgovfloodhazardmapper) and follow the instructions in Figure 7
bull Choose to view the layer ldquoFEMA Preliminary FIRM 2015rdquo bull Click on the facility site in the 1 floodplain to view the base flood elevation
Figure 7 - Flood Hazard Mapper with FEMA PFIRM (2015) at wwwnycgovfloodhazardmapper
b) If the facility is not in the current 1 annual chance floodplain (PFIRM 2015) proceed to the next section ldquo3 Addressing risks in the future floodplainrdquo
- OR - If the facility is in the current 1 annual chance floodplain (PFIRM 2015) note
the base flood elevation (BFE) and proceed to Step c) below Please note if a facility has multiple BFEs or if the site is partially in the 1 annual chance floodplain it is recommended to use the highest BFE as the current BFE for the entire site
c) Establish a sea level rise-adjusted DFE Use the current base flood elevation at your site the facilityrsquos useful life and its
criticality level to determine the design flood elevation using Table 4 (on the next page) as a basis of design
53 This process for adjusting the design flood elevation to account for sea level rise satisfies the criteria of the climate-informed science approach described at the state and federal level
54 FEMA updates its flood maps periodically As of April 2018 the most recent maps are the Preliminary Flood Insurance Rate Maps (PFIRM) available at DCPrsquos Flood Hazard Mapper (httpwwwnycgovfloodhazardmapper) Also note that NYC Building Code requires developers to use the PFIRM (2015) or the FIRM (2007) whichever is more restrictive For more information on these requirements please refer to Appendix G of the NYC Building Code Please note that the DCP maps are not official and all site locations should be confirmed with the official FEMA PFIRM NYC will provide information on the latest flood maps as they are updated
NYC Mayorrsquos Office of Recovery and Resiliency Climate Resiliency Design Guidelines
23IIC SEA LEVEL RISE
Table 4 - Determine the sea level rise-adjusted design flood elevation for critical and non-critical facilities55
Critical facilities
End of useful life Base Flood Elevation (BFE)56 in NAVD 88 + Freeboard57 + Sea Level Rise
Adjustment58= Design Flood Elevation (DFE) in
NAVD 88Through 2039 FEMA 1 (PFIRM) 24rdquo 6rdquo = FEMA 1 + 30rdquo
2040-2069 FEMA 1 (PFIRM) 24rdquo 16rdquo = FEMA 1 + 40rdquo2070-2099 FEMA 1 (PFIRM) 24rdquo 28rdquo = FEMA 1 + 52rdquo
2100+ FEMA 1 (PFIRM) 24rdquo 36rdquo = FEMA 1 + 60rdquoNon-critical facilities
End of useful life Base Flood Elevation (BFE) in NAVD 88 + Freeboard + Sea Level Rise
Adjustment = Design Flood Elevation (DFE) in
NAVD 88Through 2039 FEMA 1 (PFIRM) 12rdquo 6rdquo = FEMA 1 + 18rdquo
2040-2069 FEMA 1 (PFIRM) 12rdquo 16rdquo = FEMA 1 + 28rdquo2070-2099 FEMA 1 (PFIRM) 12rdquo 28rdquo = FEMA 1 + 40rdquo
2100+ FEMA 1 (PFIRM) 12rdquo 36rdquo = FEMA 1 + 48rdquoAdditional analysis should be conducted to incorporate wave action and wave run-up in DFE calculations especially in areas that are located within the FEMArsquos 1 annual chance Limit of Moderate Wave Action (LiMWA) zone Wave run up is the maximum vertical extent of wave uprush above surge
Definition of critical buildings and infrastructure for determining DFE in Table 4The criticality definitions below are for use in the application of the Guidelines only All items identified as critical in NYC Building Code Appendix G are critical in these guidelines however this list includes additional facilities that are not listed in Appendix G59 If a facility is not listed here it is considered non-critical for the purposes of determining freeboard
bull Hospitals and health care facilitiesbull Fire rescue ambulance and police stations and emergency vehicle garages bull Jails correctional facilities and detention facilities bull Facilities used in emergency response including emergency shelters emergency preparedness communication
operation centers communication towers electrical substations back-up generators fuel or water storage tanks power generating stations and other public utility facilities
bull Critical aviation facilities such as control towers air traffic control centers and hangars for aircraft used in emergency response
bull Major food distribution centers (with an annual expected volume of greater than 170000000 pounds)60 bull Buildings and other structures that manufacture process handle store dispose or use toxic or explosive
substances where the quantity of the material exceeds a threshold quantity established by the authority having jurisdiction and is sufficient to pose a threat to the public if released61
bull Infrastructure in transportation telecommunications or power networks including bridges tunnels (vehicular and rail) traffic signals (and other right of way elements including street lights and utilities) power transmission facilities substations circuit breaker houses city gate stations arterial roadways telecommunications central offices switching facilities etc
bull Ventilation buildings and fan plantsbull Operations centersbull Pumping stations (sanitary and stormwater)bull Train and transit maintenance yards and shopsbull Wastewater treatment plantsbull Water supply infrastructurebull Combined-sewer overflow (CSO) retention tanksbull Fueling stationsbull Waste transfer stations and bull Facilities where residents have limited mobility or ability including care facilities and nursing homes
55 If an industry standard does not include freeboard in its flood protection standards for particular infrastructure assets then only consider the sea level rise adjustment when determining flood protection levels
56 Note that NYC Building Code requires developers to use the PFIRM (2015) or the FIRM (2007) whichever is more restrictive For more information on these requirements please refer to Appendix G of the NYC Building Code
57 These freeboard values reflect NYC Building Code Appendix G Table 2-1 which establishes the minimum elevation of the top of lowest floor Appendix G requires other freeboard values for other parts of structures and in different parts of the floodplain Refer to Appendix G for the appropriate freeboard and use that value in Table 4 above
58 The sea level rise figures provided are for the middle of the 25th-75th percentile range projections from the NPCC These values do not necessarily indicate the average of all models
59 The structural occupancy categories outlined in Appendix G of the NYC Building Code are the same as ASCE 7 used for structural design For critical buildings structural design should comply with ASCE 7 and 24 for design class IV
60 This threshold represents the median volume of main food distributors in NYC according to statistics collected as part of the Five Borough Food Flow study in 2016 available at
httpswwwnycedccomsystemfilesfilesresource2016_food_supply-resiliency_study_resultspdf 61 The threshold quantity for hazardous materials is established by Chapter 7 of Title 24 of the NYC Administrative Code
NYC Mayorrsquos Office of Recovery and Resiliency Climate Resiliency Design Guidelines
24IIC SEA LEVEL RISE
Figure 9 ndash Outdoor emergency generator for the critical building
This case study provides an example of how to calculate a sea level rise-adjusted DFE based on the useful life of a hypothetical critical services building and its primary component
Step 1 Organize the site by various critical or primary components and their year of construction Determine their useful life along with the associated future year scenario for flood risk assessment In this example the building structure and the outside emergency generator are the most at-risk components from combined sea level rise and coastal storm surge
Step 2 Overlay the site footprint area over the effective current PFIRM or FIRM and the corresponding future year scenario FEMA 1 to identify flood risk to the site From overlaying the 2015 preliminary FEMA floodplain over the site it was determined that the site has a 1 annual chance of flooding with a base flood elevation of 13rsquo NAVD Step 3 Evaluate the criticality of each primary component of the facility based on the Guidelinesrsquo definition for critical infrastructure (Table 4) This (hypothetical) building is critical
Step 4 Use Table 4 to determine the sea level rise adjustment and freeboard requirements for each component and calculate the DFE for each that corresponds to its useful life period
Step 5 Compare the DFE of each component and the associated Guidelinesrsquo recommended DFE to calculate anticipated flood depth
CASE STUDY Adjusting the DFE for Sea Level Rise
Table 5 ndash Example of how to calculate a sea level rise-adjusted DFE for a critical facility
Construction year Components Useful
Life
Future Year Scenario
[Useful Life + Const
Year]
BFE in NAVD
88 (feet)
Freeboard + Sea
Level Rise Adjustment
(feet)
Adjusted DFE in
NAVD 88 (feet)
2010 Building Structure
70 years 2070-2099 130rsquo 2rsquo+23rsquo 173rsquo
2010Outdoor
Emergency Generator
25 years
Through 2039 130rsquo 2rsquo+05rsquo 155rsquo
Figure 8 - Example of how to locate a facility within the current floodplain and determine the BFE Figure 9 (inset) - Outdoor emergency generator at the facility
Figure 10 - This schematic shows how to determine the design flood elevation of a facility within the current 1 floodplain
Illustrative not to scale
NYC Mayorrsquos Office of Recovery and Resiliency Climate Resiliency Design Guidelines
25IIC SEA LEVEL RISE
Figure 11 - Flood Hazard Mapper with future 1 annual chance floodplain (adjusted for sea level rise) at httpwwwnycgovfloodhazardmapper
b) If the site is not in the future floodplain no flood protection is required for this facility
- OR - If the site is in the future floodplain identify the nearest adjacent base flood
elevation at the project site in the current 1 annual chance floodplain (PFIRM 2015) using the Flood Hazard Mapper62
c) Use Table 4 to determine the DFE Add freeboard and the sea level rise-adjustment to the nearest adjacent BFE on the
current 1 annual chance floodplain (PFIRM 2015) to determine the DFE
d) Apply the DFE calculation from Table 4 to the protected facility See Figures 12 and 13 for an illustration of how to calculate the DFE
62 Maps of future floodplains show the impacts of sea level rise alone and do not consider how changes in stormsrsquo climatology might also affect wave action and the full extent of the floodplain
3 Addressing risks in the future floodplainIf the facility is not in the current 1 annual chance floodplain (PFIRM 2015) it may still be at risk in the future from flooding as sea level rise increases the extent of the floodplain Follow the steps below to determine if your facility is located in the future floodplain and if so what sea level rise-adjusted DFE to use
a) Use the Flood Hazard Mapper (httpwwwnycgovfloodhazardmapper) to determine if the facility site will be in the future 1 annual chance floodplain
Assess if by the end of the facilityrsquos useful life the floodplain is projected to increase to encompass all or part of the project site For example if the useful life ends between 2040 and 2069 choose the 2050s floodplain map Refer to the steps in Figure 11 below
NYC Mayorrsquos Office of Recovery and Resiliency Climate Resiliency Design Guidelines
26IIC SEA LEVEL RISE
Figure 12 - This schematic map shows how to locate the nearest adjacent 1 floodplain elevation
Figure 13 -This schematic shows how to determine the design flood elevation of a facility that is outside of the current 1 floodplain
CASE STUDY Identifying a Base Flood Elevation (BFE) in the Future Floodplain
Illustrative not to scale
NYC Mayorrsquos Office of Recovery and Resiliency Climate Resiliency Design Guidelines
27IIC SEA LEVEL RISE
4 Identify appropriate design interventions
63 Additional resources for identifying adaptive strategies Urban Waterfront Adaptive Strategies (NYC Department of City Planning httpswww1nycgovassetsplanningdownloadpdfplans-studiessustainable-communitiesclimate-resilienceurban_waterfrontpdf Floodproofing Non-Residential Buildings (FEMA) at httpswwwfemagovmedia-libraryassetsdocuments34270 Ready to Respond Strategies for Multifamily Building Resilience (Enterprise Green Community) at
httpwwwenterprisecommunityorgresourcesready-respond-strategies-multifamily-building-resilience-1335664 While natural systems-based approaches ameliorate flooding their use for storm surge or wave mitigation would need to be quantified
before contributing towards the design flood elevation 65 For more information see FEMArsquos Floodproofing Non-Residential Buildings at httpswwwfemagovmedia-libraryassetsdocuments34270
Operational requirements and continuity plans can inform the selection of appropriate design interventions particularly in terms of how quickly a site needs to be up and running after a flood event Some examples of how functional uses can pair with interventions include
bull A facility that needs to be operating during or immediately after a flood event may need to be dry floodproofed using permanent barriers or designed for passive survivability (such as a police or fire station)
bull A facility that needs to recover quickly after an event could elevate prioritized equipment and have deployable barriers
bull A site that can recover over a longer duration of time could be temporarily inundated during an event (such as parks or plazas) The use of resilient materials and strategies can reduce costly damage caused by temporary inundation
Different design interventions should be chosen based on the specific operational requirements of the project however these must meet the ASCE 24 design requirements for Coastal VE Zones
For all projects at risk of current or future flooding select protections that meet the projectrsquos design flood elevation Consider project-specific factors including the site location operational requirements existing continuity planning and cost63 A Design Strategies Checklist in Appendix 6 is available for use as a resource to track possible design approaches Some examples of design alternatives are
bull Site relocation where feasible conduct alternative site analysis
bull Permanent barriers at a site (eg floodwalls)
bull Deployable flood barriers (eg stop logs flood doorsgates inflatable barriers)
bull Natural systems-based approaches (eg living shorelines restored wetlands)64
bull Prioritized protection of electrical mechanical and other critical or costly-to-replace equipment above the design flood elevation (eg motors and controller boilers and furnaces fuel storage tanks duct work alarm systems and suppression equipment electrical panels electrical distribution and switching areas gas and electric meters telecommunications equipment chemical feed equipment HVAC units and emergency generators)65
bull Dry floodproofing design a facility to prevent water from entering
bull Wet floodproofing design a facility to permit floodwaters to flow in and out of the structure without causing significant damage (eg elevate or protect critical equipment use water-resistant building materials below the design flood elevation include flood vents and pumps)
bull Design redundant telecommunications conduit entrances for multiple carrier entry Telecom conduit should run to diverse manholes when possible
bull Install backup power for telecom equipment with design consideration for such equipment (eg installation above DFE)
bull Install outdoor-rated disconnect switch for telecommunications equipment on the roofbull Explore interventions to protect underground utilities and other telecommunications
facilities from water damagebull Install backflow preventers backwater valves and sump pumps for all buildings and
infrastructure in the floodplain as well as behind flood barriersbull Shoreline improvements that reduce the height of waves or attenuate waves where
feasible
NYC Mayorrsquos Office of Recovery and Resiliency Climate Resiliency Design Guidelines
28IIIA GENERAL METHODOLOGY TO ESTIMATE PROJECT BENEFITSIIIB CATEGORIES OF PROJECT BENEFITS
Designing and constructing facilities to handle the future climate loads above the current NYC codes and standards based on projected useful life of the components provides resiliency benefits The incremental costs to implement the Guidelinesrsquo recommended design interventions should be compared with the incremental benefits to aid agencies in making decisions about resilient design strategies The project design team should evaluate benefits of the interventions designed to meet Guidelinesrsquo recommended criteria for all the climate stressors qualitatively andor quantitatively For projects with construction costs below $50 million the project design team is recommended to perform a qualitative benefits assessment on the interventions that meet the Guidelinesrsquo recommendations for all applicable climate stressors For critical facilities or projects with construction costs over $50 million the project design team is recommended to perform quantitative benefit calculations to identify the optimal interventions that meet Guidelinesrsquo recommended design criteria
A GENERAL METHODOLOGY TO ESTIMATE PROJECT BENEFITSThis general methodology to perform qualitative and quantitative benefit calculations is recommended for use by project design teams at the beginning of and during the design process This methodology enables estimation of project benefits for a high-level benefit-cost analysis (BCA) that can be applied to evaluate and compare resiliency features designed to address sea level rise with coastal storm surge increased precipitation and extreme heat events The type of benefits provided by interventions designed to meet the Guidelinesrsquo design criteria can vary by climate stressors and typology of the facilities The main guiding principle in development of the high-level BCA methodologies included in these Guidelines was to balance simplicity with accuracy The project benefits categories identified within the methodology may not cover all the potential benefits provided by every facility type within NYC In particular the benefits of planning for increased precipitation are difficult to quantify Hence the project design team should use their discretion to modify this general benefit calculation methodology as needed to meet their project goals and objectives The project design team should develop appropriate input data whether quantitative or qualitative needed to estimate project benefits
B CATEGORIES OF PROJECT BENEFITSThere are three types of project benefit categories - direct benefits indirect benefits and other benefits - that can be used to perform qualitative assessments and develop quantitative estimates of monetary benefits for intervention alternatives designed to meet the Guidelinesrsquo recommendations These project benefit categories will help to perform a high-level benefit-cost analysis that balances accuracy with an appropriate level of effort
bull Direct Benefits include reduced or avoided physical damages to facilities and contents reduced or avoided displacements for residential structures and reduced life cycle or OampM costs that can be quantified as a primary result of implementing a specific hazard mitigation measure Table 12 in Appendix 4 provides a list of direct benefits and basic guidance on estimating and documenting values for sea level rise and increased precipitation-related flood hazards Note that given the current state of practice it is not possible to quantify reduced or avoided physical damages or residential displacements that result from a specific extreme heat mitigation measures Therefore direct benefits applicable to extreme heat hazards are limited to reduced life cycle costs applicable to certain measures such as green roofs Refer to Table 15 for details on direct benefits for extreme heat hazards
III EVALUATION OF PROJECT BENEFITS
NYC Mayorrsquos Office of Recovery and Resiliency Climate Resiliency Design Guidelines
29IIIB CATEGORIES OF PROJECT BENEFITS
bull Indirect Benefits include reduced or avoided service losses for non-residential
buildings public facilities andor infrastructure (utilities roads and bridges) based on the value of service continuity andor emergency services to New Yorkers that can be quantified as a secondary result of implementing a specific hazard mitigation measure Table 13 in Appendix 4 provides a list of indirect benefits and basic guidance on estimating and documenting values for sea level rise and increased precipitation-related flood hazards Note that given the current state of practice on extreme heat it is not possible to quantify reduced or avoided service losses that result from a specific extreme heat mitigation measures Therefore indirect benefits applicable to extreme heat hazards are limited to reduced energy costs such as cool roofs green roofs or shade trees Refer to Table 15 in Appendix 4 for details on indirect benefits for extreme heat hazards
bull Other Benefits where applicable other potential benefits may include social benefits for residents such as avoided stress and anxiety avoided lost productivity environmentalecosystem service benefits avoided need for emergency services and other potential benefits that can be estimated as a result of implementing a specific hazard mitigation measure Table 14 in Appendix 4 provides a list of other potential benefits and basic guidance on estimating and documenting values for sea level rise and increased precipitation-related flood hazards
Note on the ecosystem service benefit category in Table 14 the stormwater management benefits of green infrastructure should be distributed between the extreme heat and increased precipitation hazards since these measures provide both significant reductions in rainfall runoff as well as Urban Heat Island mitigation through evapotranspiration However there is currently limited data available to quantify the actual distribution of stormwater management benefits between the two hazards For various dual-benefit providing interventions careful considerations should be given to identify the appropriate benefits category provided by the intervention with a goal to avoid duplication of quantified benefits In this methodology the stormwater management benefits of green infrastructure are applied to the increased precipitation hazard in order to avoid a duplication of benefits Note on real estate and quality of life benefits additionally it is important to note that two potential benefit categories shown in Table 14 - real estate and quality of lifehealthavoided casualties - were not included in the current BCA methodology for sea level rise or increased precipitation hazards Although these categories could increase project benefits for sea level rise and increased precipitation hazards they were only applied to measures that address extreme heat hazards such as green roofs trees and other plantings Refer to Table 15 for a detailed summary of other benefit categories quantified as unit benefits for extreme heat hazards
NYC Mayorrsquos Office of Recovery and Resiliency Climate Resiliency Design Guidelines
30IIIC WHICH METHODOLOGY TO USEIIID BCA METHODOLOGY FOR PROJECTS UNDER $50 MILLION
D BCA methodology for projects under $50 millionThe project design team should develop design alternatives to meet the Guidelinesrsquo criteria which may be in excess of NYC code and standards requirements (baseline conditions) It is assumed that the project design team will develop alternatives to address each of the following applicable climate stressors - sea level risecoastal storm surge increased precipitation and extreme heat - separately Tables 12-15 in Appendix 4 provides a list of typical direct indirect and other benefits provided by various intervention typologies to reduce impacts from climate stressors During the qualitative assessment the project design team should consider that intervention strategies will have varying levels of reliability effectiveness benefits and cost implications during the qualitative assessment
The project design team is recommended to develop appropriate evaluation criteria and metrics for each of the applicable project benefit categories For each alternative the project design team could use either a scoring weighting ranking or other type of qualitative assessment framework to assess each applicable project benefit categories with the developed evaluation criteria and metrics Table 6 provides an example template to evaluate alternatives using a set of general evaluation criteria and metrics using a color-coded rating system (and see Table 7 for an example of how to complete the template) The project design team can utilize a similar template customized to their project goals and objectives This assessment allows agencies to screen the qualitative benefits for various alternatives that would then lead to development of final project components to match the available budget and goals of the project
Projects with total costs below $50 million recommended to conduct a qualitative assessment to identify the optimal interventions that meet Guidelinesrsquo design criteria using the ldquoD) BCA methodology for projects under $50 millionrdquo methodology below
C WHICH METHODOLOGY TO USEProjects with a total cost above $50 million or are highly complex or critical facilities recommended to conduct both a qualitative and quantitative benefit calculation to identify the optimal interventions that meet Guidelinersquos design criteria using the ldquoE) BCA methodology for projects above $50 millionrdquo below A quantitative BCA also must include qualitative factors
NYC Mayorrsquos Office of Recovery and Resiliency Climate Resiliency Design Guidelines
31IIID BCA METHODOLOGY FOR PROJECTS UNDER $50 MILLION
Qualitative Color Scale Green=Least resource intensive alternative Purple=most resource intensive yellow=medium level of resource intensity
Qualitative Evaluation Factors Description Relative Color Rating System
First CostsAdditional construction costs needed to incorporate Guidelinesrsquo recommended resilient design over the baseline project costs
Highest cost ($$$) rated as Purple whereas lowest cost ($) rated as Green
ConstructabilityEase of Implementation
Construction techniques and site conditions such as presence of major utilities conflicts and other conditions which dictate the level of constructability required for each alternative
Difficult to construct rated as Purple whereas easiest to construct rated as Green
Environmental ImpactsCo-BenefitsPermitting
Impacts to the built and natural environment such as circulation noise and hazardous waste plus the level of effort required for permitting (eg interventions in water require highest level of permitting requirement) from each alternative in addition to the baseline project condition
Highest environmental impacts and highest level of effort required for permitting rated as Purple whereas the least impact and level of effort rated as Green
Operation and Maintenance (OampM)
Level of effort of additional manpower and cost of OampM for the alternatives over the baseline project OampM requirements
Highest level of effort and cost for OampM rated as Purple whereas the lowest is rated as Green
Reliability and Durability
Interventions that do not require human involvement or a facilityrsquos ability to withstand all the forces during a storm event (eg permanent solutions with higher reliability than deployable solution)
Interventions requiring human involvement (active measures) rated as Purple whereas interventions with minimal or no human involvement (passive measures) rated as Green
Risk Reduction Benefits Monetary benefits provided by each intervention alternative in avoided damages over the baseline condition
Lowest potential monetary benefit rated as Purple whereas as highest potential monetary benefit rated as Green
Quality of Life BenefitsVisual Aesthetics
Benefits either to the community such as recreation or safety or serve the community during emergency situations
Lowest potential quality of life benefits rated as Purple whereas as highest potential benefits rated as Green
Table 6 ndash Evaluation matrix for comparison of mitigation alternatives across the useful life of a project
Project title_______________________________________________________________________________
Evaluation Criteria
Baseline Condition (Designed to NYC Building Code and
Standards)
Resilient Design Alternatives for Managing__________________
Alternative 1
Alternative 2
Alternative 3
First Costs
ConstructabilityEase of ImplementationEnvironmental ImpactsCo-BenefitsPermitting
Operation and Maintenance (OampM)
Reliability and Durability
Risk Reduction Benefits
Quality of Life BenefitsVisual Aesthetics
NYC Mayorrsquos Office of Recovery and Resiliency Climate Resiliency Design Guidelines
32IIID BCA METHODOLOGY FOR PROJECTS UNDER $50 MILLION
Table 7 ndash Evaluation matrix for comparison of mitigation alternatives across the useful life of a project - COMPLETED EXAMPLE
Evaluation Criteria
Baseline Condition (Designed to NYC Building Code and
Standards)
Resilient Design Alternatives for Managing Coastal SurgeSLR
Alternative 1Flood proof building built on grade to Guidelines
DFE
Alternative 2 Elevate building structure above Guidelinesrsquo DFE
on columns
Alternative 3 Raise site grade by filing the building site footprint
to Guidelinesrsquo DFE
First CostsBaseline cost for building structure is $15 million
Incremental costs are within 5 over the baseline costs
Incremental costs are between 5-10 over baseline costs
Incremental costs are 20 and more over baseline costs
ConstructabilityEase of Implementation
Relatively easy to construct within site constraints
Similar to baseline conditions since construction requires additional flood proofing only
Moderate challenges to construct foundation structure for columns within site constraints
Extremely challenging to construct within the site constraints Potentially fatal flaw
Environmental ImpactsCo-BenefitsPermitting
No major impacts but may require additional effort to obtain DOB permits with flood proofing and deployable systems
No major impacts but may require additional effort to obtain DOB permits with flood proofing and deployable systems
No major impacts and relatively easy to permit
Potential drainage circulation impacts and challenges to obtain clean fill material for the site
Operation and Maintenance (OampM)
Major OampM costs associated with deployable systems
Major OampM costs associated with deployable systems
Moderate OampM costs associated with proposed elevator for access
Minimal OampM costs since deployable and elevators not required
Reliability and Durability
Least reliability with highest potential risk from flooding during to failure of deployable systems
Least reliability with highest potential risk from flooding during to failure of deployable systems
Moderate reliability with potential risk from flooding limited to elevator shaft only
Highest reliability since deployable are not required to protect building from flooding
Risk Reduction Benefits
Maximum flood risk reduction benefits assuming deployable and flood proofing is effective
Maximum flood risk reduction benefits assuming deployable and flood proofing is effective
Maximum flood risk reduction benefits
Maximum flood risk reduction benefits
Quality of Life BenefitsVisual Aesthetics
Facility may not be operational during the storm event
Facility may not be operational during the storm event
Facility can be potentially operational during the storm event
Facility can be potentially operational during the storm event
Qualitative Color Scale Green=Least resource intensive alternative Purple=most resource intensive yellow=medium level of resource intensity
A new non-critical facility with a building structure is proposed on a site that is currently in the 2015 Preliminary FEMA 1 annual chance floodplain with a BFE of 10rsquo (NAVD 88) The baseline conditions DFE to meet existing NYC codes and standards is 11rsquo (NAVD 88) Using the Guidelines recommended design criteria the facilityrsquos DFE is 133rsquo (NAVD 88) and existing grade is around 6rsquo (NAVD 88) The project design team develops three alternatives to meet the Guidelinesrsquo recommended DFE design for the facility Table 7 offers an example of how a qualitative assessment can be used to compare three resilient design alternatives using the evaluation criteria and metrics
CASE STUDY Example of How to Use the Evaluation Matrix
NYC Mayorrsquos Office of Recovery and Resiliency Climate Resiliency Design Guidelines
33IIIE BCA METHODOLOGY FOR PROJECTS OVER $50 MILLION
E BCA methodology for projects over $50 millionIn order for a project to be considered cost-effective a benefit-cost analysis (BCA) assesses if the benefits of a project outweigh its costs or in other words the benefit-cost ratio (BCR) is greater than 10 as illustrated in Equation 1
Equation 1 Benefit-Cost Ratio Formula
BCR =
Where BCR = Benefit-Cost Ratio
BENEFITS = Total project benefits
COSTS = Total project costs
BENEFITSCOSTS
These estimated project benefits are combined with the project costs which are defined as the differential construction and long-term operation and maintenance costs associated with constructing a proposed project to the Guidelinesrsquo recommended design level It is assumed that the baseline project will be designed to the most prevalent NYC codes and standards This benefit methodology should be used to determine the additional project benefit that the Guidelinesrsquo recommended design would provide over the baseline project benefit It is assumed that the project design team will develop alternatives to address each of the following applicable climate stressors - sea level risecoastal storm surge increased precipitation and extreme heat - separately For each alternative the project design team should use the following steps to determine the Benefit-Cost Ratio (BCR)
a) Determine project useful life for design interventions Determining the useful life of the proposed project is an important first step in the
detailed BCA assessment methodologies for two reasons First the project useful life determines what values must be used from the Guidelines to establish the future climate design conditions The various hazard tables in the Guidelines establish design requirements based on useful life ranges through 2039 2040-2069 2070-2099 and 2100+ (2100+ projections are only available for sea level rise) A review of these tables show that the design requirements needed to meet the projected climate hazards increase as the end of useful life range increases Second the useful life determines how long the project will need to be operated and maintained in order to remain technically sound and effective at reducing future damages and losses
b) Determine discount rate for project benefits calculation The cost-effectiveness of projects assessed using the BCR must be done on a net
present value basis meaning the present value of the benefits is compared to the present value of the costs Most project costs are computed for present value based on current cost estimates bids or cost guidance However project benefits - as well as project costs for operation and maintenance - accrue over time into the future and are computed on an annualized basis To address this issue the Present Value Coefficient (PVC) is used to bring these annualized project benefits and OampM costs into the present value As indicated by the formula in Equation 2 the PVC is a function of the Project Useful Life (PUL) and the Discount Rate (DR)
NYC Mayorrsquos Office of Recovery and Resiliency Climate Resiliency Design Guidelines
34
Equation 2 Present Value Coefficient (PVC) Formula
PVC =
Where PVC = Present Value Coefficient
PUL = BCA Project Useful Life based on project type
DR = Discount Rate
The project design team should coordinate with agencies and NYC OMB if needed to determine appropriate discount rates based on funding source project type and other factors This coordination should take place during project initiation phase where total project costs (design and construction) are over $50 million66
c) Develop input data to perform benefit calculations Tables 16 and 17 in Appendix 4 provide a list of typical input data by each climate
stressor needed to perform benefit analysis quantitatively on variety of facilities67 The project design team should use these tables as a reference to identify appropriate input data categories andor additional input data needed to perform benefit analysis on the project
d) Identify applicable project benefit categories to estimate benefits Tables 16 and 17 in Appendix 4 provide a list of typical project benefits by each climate
stressor needed to perform benefit analysis quantitatively on various types of projects The project design team should use these tables as a reference to identify appropriate project benefit categories for each climate stressor to perform benefit analysis on the project
e) Calculate benefits of recommended design interventions for each climate
stressor The input data and applicable project benefits can be assembled along with
incremental project cost data to analyze cost-effectiveness using the FEMA BCA Tool Damage-Frequency Assessment (DFA) module or similar software This analysis will provide a BCR for each alternative which can then be used to compare the alternatives that were developed to mitigate effects from applicable climate stressors The project design team can then use the results from this analysis to identify optimal interventions that provides a balanced solution that provides resiliency benefits within the available project budget
IIIE BCA METHODOLOGY FOR PROJECTS OVER $50 MILLION
[1 ndash (1 + DR) -(PUL)]DR
66 For example a NYC OMB March 2015 memorandum recommends using an annually updated DR as published each year in Appendix C of OMB Circular A-94 The current OMB-recommended discount rates from OMB A-94 Appendix C vary by project useful life and are as follows 21 DR for useful lives of 10 to 19 years 25 DR for useful lives of 20 to 29 years and 28 DR for useful lives of 30 years or greater By contrast FEMA hazard mitigation grants use a DR of 70 for all projects based on the Federal OMB A-94 rate for federally-funded mitigation measures Since these DRs will impact the PVC and the project benefits the project team must ensure that BCA results prepared using an OMB-recommended DR (21 to 28) be updated to reflect the Federal DR (70) when applying for FEMA mitigation grant funds
67 Note the data requirements for the sea level rise and increased precipitation hazards in Table 16 are more detailed than the requirements for the extreme heat hazards due to the less detailed level of analysis available for extreme heat
NYC Mayorrsquos Office of Recovery and Resiliency Climate Resiliency Design Guidelines
35
APPENDICES
NYC Mayorrsquos Office of Recovery and Resiliency Climate Resiliency Design Guidelines
36APPENDIX 1 ndash KEY TERMS
100-year flood (1 annual chance flood)
A flood that has a 1 probability of occurring in any given year The 100-year floodplain is the extent of the area of a flood that has a 1 chance of occurring or being exceeded in any given year
500-year flood (02 annual chance flood)
A flood that has a 02 probability of occurring in any given year The 500-year floodplain is the extent of the area of a flood that has a 02 chance of occurring or being exceeded in any given year
AdaptationAdjustment in natural or human systems to a new or changing environment that seeks to maximize beneficial opportunities or moderate negative effects Successful adaptations contribute to resiliency
Base flood elevation (BFE)The elevation of surface water resulting from a flood that has a 1 annual chance of occurring or being exceeded in any given year The BFE is shown on the Flood Insurance Rate Map (FIRM)69
BluebeltReference to the Department of Environmental Protectionrsquos (DEP) Bluebelt program to preserve natural drainage corridors including streams ponds and other wetland areas Preservation of these wetland systems allows them to perform their functions of conveying storing and filtering storm water
Climate
The average weather (or more rigorously a statistical description of the average in terms of the mean and variability) over a period of time usually 30 years These quantities are most often surface variables such as temperature precipitation and wind Climate in a wider sense is the state including a statistical description of the climate system70
Climate change
Changes in average weather conditions that persist over multiple decades or longer Climate change encompasses both increases and decreases in temperature as well as shifts in precipitation changing risk of certain types of severe weather events and changes to other variables of the climate system
Climate change riskThe chance that investments (such as in capital projects) can be affected by the physical impacts of climate change71 Risks are evaluated as a product of the probability of occurrence and the magnitude of damages or impacts including socioeconomic factors that would result if they did occur (consequences)
Climate change risk assessment
This assessment involves a detailed project-specific analysis that includes a vulnerability and risk assessment often followed by cost-benefit analysis to assess and select investments in climate change risk mitigation Risk is assessed as a function of the magnitude and probability of a given climate change hazard Examples resources are included in Appendix 7
Climate vulnerabilityThe degree to which systems and populations are affected by adverse impacts It is a function of the character magnitude and rate of climate change and variation to which a system is exposed its sensitivity and its adaptive capacity72
Cloudburst An extreme amount of rain in a short period of time often over a small geographic area73
Cooling Degree Day (CDD) A form of degree-day used to estimate the energy requirements for air conditioning or refrigeration when the daily mean temperature is above 65degF
68 All terms are from the US Global Change Research Program (USGCRP) glossary unless otherwise noted The USGCRP glossary is available at httpwwwglobalchangegovclimate-changeglossary
69 ldquoDefinitionsrdquo FEMA last modified March 1 2017 httpswwwfemagovnational-flood-insurance-programdefinitions70 UKCIP Glossary httpwwwukciporgukglossary71 ldquoAccount for Climate Riskrdquo International Finance Corporation 72 UKCIP Glossary httpwwwukciporgukglossary73 New York City Environmental Protection ldquoCloudburst Resiliency Planning Studyrdquo 2017 Available at httpwwwnycgovhtmldeppdfclimatenyc-cloudburst-studypdf
APPENDIX 1 - KEY TERMS68
NYC Mayorrsquos Office of Recovery and Resiliency Climate Resiliency Design Guidelines
37APPENDIX 1 ndash KEY TERMS
Design life The life expectancy of an asset or product as determined during design74 As opposed to useful life (see below)
Dry Bulb temperature The ambient air temperature measured by a thermometer
Extreme eventUnexpected unusual or unpredictable weather or flooding compared to historical or future projected distribution Extreme events include for example heat waves cold waves heavy rains periods of drought and flooding and severe storms
Facilities For the purposes of this document ldquofacilitiesrdquo refers to all types of buildings housing infrastructure structures and landscape features designed by or for the City of New York
Flexible adaptation pathwayResilience-building strategies that can evolve or be adapted over time as climate change risk assessments evaluations of adaptation strategies and monitoring continue75
Flood Insurance Rate Maps (FIRM)
Official flood map of a community on which FEMA has delineated the 1 annual chance floodplain and the base flood elevations (BFEs) applicable to the community76 The FIRM also includes the 02 floodplain annual chance floodplain and differentiates between special flood hazard areas (V A Coast A zones) and floodways The official FIRM is from the year 2007 while the 2015 PFIRM is currently required by NYC Building Code to calculate design flood elevations NYC DOB references the more restrictive of the two maps in both base flood elevation and flood hazard area (ie V versus A zone) Refer to Appendix 3 for more information
FreeboardAn additional amount of height above the base flood elevation used as a factor of safety (eg two feet above the base flood) in determining the level at which a facilitys lowest floor must be elevated or floodproofed to be in accordance with state or community floodplain management regulations77
Future time slices
Future periods defined by the NPCC for when climate change projections are available In this document the following decadal projections are associated with specific time spans2020s projection = present to 20392050s projection = 2040 to 20592080s projection = 2070 to 20992100s projection = end of century and beyond
Green infrastructureAn array of practices that use or mimic natural systems to manage urban stormwater runoff Water is either directed to engineered systems for infiltration or detained for longer periods before it enters the sewer system
Heat Vulnerability Index (HVI)Summarizes relative risk of adverse health effects from heat due to social and environmental factors Used to identify neighborhoods at higher risk during and after extreme heat events
Heat wave A period of three consecutive days where temperatures rise above 90degF or two consecutive days over 95 degrees78
New York City Panel on Climate Change (NPCC)
The body of leading climate and social scientists charged with making climate change projections for the metropolitan region79
74 Sustainable Infrastructure Management Program Learning Environment httpsimplewerforg 75 Rosenzweig C et al Climate Change Adaptation in New York City Building a Risk Management Response76 ldquoDefinitionsrdquo FEMA77 Ibid78 Horton R et al New York City Panel on Climate Change 2015 Report Chapter 1 Climate Observations and Projections Ann NY
Acad Sci ISSN 0077-8923 (New York 2015) 2579 For more information on the NPCC visit www1nycgovsiteorrchallengesnyc-panel-on-climate-changepage
NYC Mayorrsquos Office of Recovery and Resiliency Climate Resiliency Design Guidelines
38APPENDIX 1 ndash KEY TERMS
Open-grid pavement system
Pavements that consist of loose substrates supported by a grid of a more structurally sound grid or webbing Unbounded loose substrates in these systems transfer and store less heat than bound and compacted pavements and aid permeability Pavement is 50 pervious and contains vegetation in the open cells designed to allow percolation or infiltration of storm water through the surface into the soil below80
Preliminary Flood Insurance Rate Map (PFIRM)
Preliminary flood map developed by FEMA in 2015 for New York City that provides projected risks for flood hazards81 Refer to Appendix 3 for more information
Project useful life (PUL)
The period over which an asset or component is expected to be available for use by an entity This depends on regular and adequate maintenance This period of time typically exceeds the design life (see above) The combined effect of operational requirements and useful life is practical in assessing an investment in improving resilience82
Rain gardenAlso called ldquobioswalerdquo Planted areas designed to collect and manage stormwater that runs off streets sidewalks commercial and residential rooftops and other sources when it rains
Resiliency The ability to bounce back after change or adversity The capability of preparing for responding to and recovering from difficult conditions83
Sea level rise-adjusted design flood elevation
As defined in these Guidelines the increased height of the base flood elevation due to sea level rise plus freeboard depending on the criticality of the facility The sea level rise adjustment depends on the useful life of the facility
Storm surge An abnormal rise of water generated by a storm over and above predicted astronomical tides84
Substantial improvementAny repair reconstruction rehabilitation addition or improvement of a building or structure the cost which equals or exceeds 50 of the market value of the structure before the improvement or repairs started For more information see Appendix G of the NYC Building Code and 1 RCNY sect3606-0185
Tidal inundation Flooding which occurs at high tides due to climate-related sea level rise land subsidence andor the loss of natural barriers86
Urban Heat Island (UHI) effectThe tendency for higher air temperatures to persist in urban areas as a result of heat absorbed and emitted by buildings and asphalt tending to make cities warmer than the surrounding suburban and rural areas
Weather The state of the atmosphere at a given time with regard to temperature cloudiness precipitation wind and other meteorological conditions87
Wet Bulb temperatureThe temperature indicated when a thermometer bulb is covered with a water-saturated wick over which air is caused to flow at approximately 45 ms (900 ftmin) to reach the equilibrium temperature of water evaporating into the air when the heat of vaporization is supplied by the sensible heat of the air88
80 ldquoGlossaryrdquo US Green Building Council (2017) Available at httpwwwusgbcorgglossaryterm552581 ldquoPreliminary FEMA Map Productsrdquo FEMA Map Service Center Available at httpshazardsfemagovfemaportalprelimdownload82 ldquoGlossaryrdquo International Infrastructure Management Manual (2011) 83 A Stronger More Resilient New York (2013) 184 ldquoStorm Surge Overviewrdquo National Hurricane Center NOAA Available at httpswwwnhcnoaagovsurge85 ldquoFlood Resistant Constructionrdquo Appendix G New York City Building Code (2008) and 1 RCNY sect3606-01 available at httpswww1nycgovassetsbuildingsrules1_RCNY_3606-01pdf86 ldquoOcean Factsrdquo National Ocean Service NOAA Available at httpoceanservicenoaagovfactsnuisance-floodinghtml 87 UKCIP Glossary httpwwwukciporgukglossary88 ldquoASHRAE Terminologyrdquo ASHRAE Available at httpswwwashraeorgtechnical-resourcesauthoring-toolsterminology
NYC Mayorrsquos Office of Recovery and Resiliency Climate Resiliency Design Guidelines
39APPENDIX 2 - CLIMATE CHANGE PROJECTIONS
Climate change projections are provided by the New York City Panel on Climate Change (NPCC) The full NPCC report is available from the New York Academy of Sciences89 Tables 8-10 (below) were reproduced directly from the NPCC report while Table 2 (see Section IIA) was developed using the data underlying the NPCC report to inform the design of HVAC systems under warmer conditions
Table 8 ndash NYC sea level rise projections90
Baseline (2000-2004) 0 in
Low estimate (10th percentile)
Middle range (25th to 75th percentile)
High estimate (90th percentile)
2020s 2 in 4-8 in 10 in
2050s 8 in 11-21 in 30 in
2080s 13 in 18-39 in 58 in
2100 15 in 22-50 in 75 in
Note Projections are based on six-component approach that incorporates both local and global factors The model-based components are from 24 global climate models and two representative concentration pathways Projections are relative to the 2000-2004 base period
Table 9 ndash Mean annual changes91
a Temperature Baseline(1971-2000) 54degF
Low estimate (10th percentile)
Middle range (25th to 75th percentile)
High estimate (90th percentile)
2020s + 15degF +20-29degF +32degF
2050s +31degF +41-57degF +66degF
2080s +38degF +53-88degF +103degF
2100 +42degF +58-104degF +121F
b Precipitation Baseline(1971-2000) 501 in
Low estimate (10th percentile)
Middle range (25th to 75th percentile)
High estimate (90th percentile)
2020s -1 percent +1-8 +10
2050s +1 percent +4-11 +13
2080s +2 percent +5-13 +19
2100 -6 percent -1 to +19 +25
Note Based on 35 global climate models (GCMs) and two RCPs Baseline data cover the 1971ndash2000 base period and are from the NOAA National Climatic Data Center (NCDC) Shown are the low estimate (10th percentile) middle range (25th percentile to 75th percentile) and high estimate (90th percentile) These estimates are based on a ranking (from most to least) of the 70 (35 GCMs times 2 RCPs) projections The 90th percentile is defined as the value that 90 percent of the outcomes (or 63 of the 70 values) are the same or lower than Like all projections the NPCC climate change projections have uncertainty embedded within them Sources of uncertainty include data and modeling constraints the random nature of some parts of the climate system and limited understanding of some physical processes The NPCC characterizes levels of uncertainty using state-of-the-art climate models multiple scenarios of future greenhouse gas concentrations and recent peer-reviewed literature Even so the projections are not true probabilities and the potential for error should be acknowledged
89 The NPCC 2015 report is available at httponlinelibrarywileycomdoi101111nyas20151336issue-1issuetoc90 From New York City Panel on Climate Change 2015 Report Chapter 1 Climate Observations and Projections page 4191 From New York City Panel on Climate Change 2015 Report Chapter 1 Climate Observations and Projections page 30
APPENDIX 2 - CLIMATE CHANGE PROJECTIONS
NYC Mayorrsquos Office of Recovery and Resiliency Climate Resiliency Design Guidelines
40APPENDIX 2 - CLIMATE CHANGE PROJECTIONS
Table 10 ndash Extreme events92
2020s Baseline (1971-2000)
Low estimate(10th percentile)
Middle range(25th to 75th percentile)
High estimate (90th percentile)
Numbers of heat waves per year 2 3 3-4 4
Average heat wave duration (days) 4 5 5 5
Number of days per year with
Maximum temperature at or above 90degF 18 24 26-31 33
Maximum temperature at or above 100degF 04 07 1-2 2
Minimum temperature at or below 32degF 71 50 52-58 60
Rainfall at or above 1 inch 13 13 14-15 16
Rainfall at or above 2 inches 3 3 3-4 5
Rainfall at or above 4 inches 03 02 03ndash04 05
2050s Baseline (1971-2000)
Low estimate(10th percentile)
Middle range(25th to 75th percentile)
High estimate (90th percentile)
Numbers of heat waves per year 2 4 5-7 7
Average heat wave duration (days) 4 5 5-6 6
Number of days per year with
Maximum temperature at or above 90degF 18 32 39-52 57
Maximum temperature at or above 100degF 04 2 3-5 7
Minimum temperature at or below 32degF 71 37 42-48 52
Rainfall at or above 1 inch 13 13 14-16 17
Rainfall at or above 2 inches 3 3 4-4 5
Rainfall at or above 4 inches 03 03 03-04 05
2080s Baseline (1971-2000)
Low estimate(10th percentile)
Middle range(25th to 75th percentile)
High estimate (90th percentile)
Numbers of heat waves per year 2 5 6-9 9
Average heat wave duration (days) 4 5 5-7 8
Number of days per year with
Maximum temperature at or above 90degF 18 38 44-76 87
Maximum temperature at or above 100degF 04 2 4-14 20
Minimum temperature at or below 32degF 71 25 30-42 49
Rainfall at or above 1 inch 13 14 15-17 18
Rainfall at or above 2 inches 3 3 4-5 5
Rainfall at or above 4 inches 03 02 03-05 07
Note Projections for temperature and precipitation are based on 35 GCMs and 2 RCPs Baseline data are for the 1971 to 2000 base period and are from the NOAA National Climatic Data Center (NCDC) Shown are the low estimate (10th percentile) middle range (25th to 75th percentile) and high estimate (90th percentile) 30-year mean values from model-based outcomes Decimal places are shown for values less than one although this does not indicate higher precisioncertainty Heat waves are defined as three or more consecutive days with maximum temperatures at or above 90degF Like all projections the NPCC climate change projections have uncertainty embedded within them Sources of uncertainty include data and modeling constraints the random nature of some parts of the climate system and limited understanding of some physical processes The NPCC characterizes levels of uncertainty using state-of-the-art climate models multiple scenarios of future greenhouse gas concentrations and recent peer-reviewed literature Even so the projections are not true probabilities and the potential for error should be acknowledged
92 From New York City Panel on Climate Change 2015 Report Chapter 1 Climate Observations and Projections page 31
NYC Mayorrsquos Office of Recovery and Resiliency Climate Resiliency Design Guidelines
41APPENDIX 3 - DIFFERENTIATION OF FLOOD MAPS
These Guidelines reference several different kinds of flood maps and sources of design flood elevations These maps are described and differentiated below
Table 11 - Differentiation of flood maps used in NYC
Reference Title Data Source Information Provided Referenced By Link
2007 FIRM FEMA
Based on historical data from before 1983 identifies the current base flood (extent and elevation) as the flood that has a 1 chance of occurring in any given year also known as a 100-year flood The NYC Building Code requires that either the 2007 FIRM or 2015 PFIRM elevation be used whichever is higher
2014 NYC Building Code Appendix G
Climate Resiliency Design Guidelines
httpsmscfemagovportal
2015 PFIRM FEMA
Based on historical data identifies the current base flood (extents and elevation) as the flood that has a 1 chance of occurring in any given year also known as a 100-year flood The NYC Building Code requires that either the 2007 FIRM or 2015 PFIRM elevation be used whichever is higher The 2015 PFIRM is currently being reassessed by FEMA
2014 NYC Building Code Appendix G
Climate Resiliency Design Guidelines
httpshazardsfemagovfemaportalprelimdownload
httpwwwregion2coastalcomview-flood-maps-dataview-preliminary-flood-map-data
NYC Flood Hazard Mapper
NYC Department of City Planning
Maps current and future flood hazards in NYC including the following data layers 2007 FIRM and 2015 PFIRM high tide with sea level rise and PFIRM with sea level rise through 2100
Climate Resiliency Design Guidelines
Waterfront Revitalization Plan
httpwww1nycgovsiteplanningdata-mapsflood-hazard-mapperpage
ldquoTable 4 ndash Determine the sea level rise-adjusted design flood elevation for critical and non-critical facilitiesrdquo
ORR amp NPCC
Provides data to use when adding sea level rise to a given 2015 PFIRM or 2007 FIRM Base Flood Elevation (BFE) to calculate a Design Flood Elevation (DFE) Based on the criticality and expected useful life of a facility
Climate Resiliency Design Guidelines
See Section II on ldquoSea Level Riserdquo above
APPENDIX 3 - DIFFERENTIATION OF FLOOD MAPS
NYC Mayorrsquos Office of Recovery and Resiliency Climate Resiliency Design Guidelines
42APPENDIX 4 - PROJECT BENEFITS CATEGORIES
This appendix provides guidance on how to identify and assess benefits as a supplement to Sections IIID and IIIE
Table 12 lists typical direct benefits for reducing impacts from climate stressors and basic guidance for how to estimate them See Section IIID for more information
Table 13 lists typical indirect benefits for reducing impacts from climate stressors and basic guidance for how to estimate them See Section IIID for more information
Table 12 ndash Direct benefits for (1) sea level rise with coastal storm surge and (2) increased precipitation measures
Direct Benefit Basic Guidance for Estimating Values
Physical Damages (Structure Contents)
bull For flood-damaged buildings use depth damage functions developed by FEMA and USACE for structures and contents
bull Use depth damage functions in conjunction with Building Replacement Values (BRVs) and not market values BRVs typically range between $100 to $325SF for residential buildings and $120 to $450SF for commercial public buildings
bull For more complex structures or facilities use engineering estimates of flood damages or review historic flood damages documented from insurance claims repair records or FEMA Public Assistance claims from recent flood disasters
Residential Displacements
bull For flood-damaged buildings use depth damage functions developed by FEMA and USACE for residential displacements
Reduced Life CycleOperation and Maintenance (OampM) Costs93
bull Applicable only to projects that reduce overall life cycle costs or net annual OampM costs from baseline conditions
bull Input reduced annual OampM costs as a project benefit at a 1-year recurrence intervalbull Reduced overall life cycle costs can be input as a longer project useful life
Table 13 ndash Indirect benefits for (1) sea level rise with coastal storm surge and (2) increased precipitation measures
Indirect Benefit Basic Guidance for Estimating Values
Non-Residential Building Service Losses
bull Estimate service loss values and durations for non-residential buildings public buildings critical facilities and parksnatural features based on FEMA BCA guidance and standard values based on building use
Utility Service Losses94
bull Estimate utility service losses for water wastewater and electrical facilities based on the number of impacted customers FEMA per capita standard values for utility service ($105personday for potable water $49personday for wastewater $148personday for electrical)95
bull Estimate utility service loss durations based on engineering estimates or review historic flood damages losses documented from utility company records
bull This benefit can also apply to measures that increase energy efficiency
RoadBridge Service Losses
bull Estimate roadbridge service losses based on the average daily traffic (ADT) detour time and additional travel distance and FEMA and GSA standard values for road service ($3344vehiclehour of delay $0545mile)96
bull Estimate roadbridge service loss durations or review historic flood damages losses
Emergency Service Losses
bull Applicable only to projects that reduce or eliminate documented emergency service costs from baseline conditions
bull Examples of avoided emergency services costs include NYPD staffing to monitor barricades for flooded roads or NFDY staffing for water rescues of residents from flooded buildings or streets
APPENDIX 4 - PROJECT BENEFITS CATEGORIES
93 Reduced life cycle costs may be applicable to some measures that provide extreme heat benefits such as green roofs that can last longer than a standard roof if properly maintained
94 Reduced utility service costs may be applicable to some measures that provide extreme heat benefits such as cool roofs green roofs and shade trees
95 FEMA per capita standard values taken from FEMA BCA Toolkit Version 530 (Build Date 12222016) and developed in FEMArsquos Baseline Standard Economic Value Methodology Report (July 28 2016) Consider updating FEMA standard per capita values to reflect current New York City utility rates
96 Consider updating FEMA and GSA standard values to reflect current New York City area labor rates and fuel costs
NYC Mayorrsquos Office of Recovery and Resiliency Climate Resiliency Design Guidelines
43APPENDIX 4 - PROJECT BENEFITS CATEGORIES
Table 14 ndash Other potential benefits for (1) sea level rise with coastal storm surge and (2) increased precipitation measures
Other Benefit Basic Guidance for Estimating Values
Avoided Stress and Anxiety
bull Applicable only for projects that directly benefit occupants of residential structuresbull Use FEMA standard value for avoided mental stress and anxiety treatment costs of $2443person to
estimate benefit for all impacted residents97
Avoided Lost Productivity
bull Applicable only for projects that directly benefit occupants of residential structuresbull Use FEMA standard value for avoided lost worker productivity costs of $8736household to estimate
benefit for all impacted workers (conservatively assuming one worker per household)
Environmental Open Space
bull Applicable only for projects that create or acquire open space areas by acquisitionbull Use FEMA standard value for environmental open space based on the type of land acquired ($8308
Acreyear for Green open space $39545Acreyear for Riparian $6010Acreyear for Wetlands $554Acreyear for Forests $1799Year for Marine and estuary)97
CSO Volume Reduction
bull Applicable only for projects that provide Combined Sewer Overflow (CSO) abatement by reducing the volume of rainfall runoff
bull Use CSO abatement cost of $0015gallonsyear applied to increased precipitation hazard runoff volume for 5-year design storm98
Ecosystem Service99
bull Add stormwater management benefits of green infrastructure projects to increased precipitation hazards where avoided damages and service losses are not quantified
bull Unit benefits applicable to increased precipitation hazard includeo Green roofs $0133SFyear (PUL 40 years)o BioswaleRain GardenMeadow Mix $0020SFyear (PUL 30 years)o Permeable Grass Pavers $0020SFyear (PUL 30 years)o Tree Plantings $303Treeyear (PUL 30 years)o Planter Box Trees $101Treeyear (PUL 15 years)
Real Estate99
bull Potential real estate benefits from increased resilience of residential andor commercial propertiesstreetscapesneighborhoods included within the project scope
bull Benefit applied to extreme heat hazard for green infrastructure projects directly impacting residential or commercial properties
Quality of Life Health Benefits99
bull Potential quality of life benefits related to improved public health from the resilience measures included within the project scope
bull Benefit applied to extreme heat hazard for green infrastructure projects directly impacting residential or commercial properties
Table 14 lists other typical benefits for reducing impacts from climate stressors and basic guidance for how to estimate them See Section IIID for more information
97 FEMA standard values for avoided mental stress and anxiety and environmental open space values taken from FEMA BCA Toolkit Version 530 (Build Date 12222016)
98 CSO abatement cost taken from APG1 Report for NYC ldquoTechnical Approaches for Benefit-Cost Analysis of Hazard Mitigation Projects in Urban and Coastal Environmentsrdquo (April 2016)
99 Ecosystem Services Real Estate and Quality of LifeHealth benefits tend to be more applicable to green infrastructure measures that provide extreme heat benefits such as green roofs trees and other plantings
NYC Mayorrsquos Office of Recovery and Resiliency Climate Resiliency Design Guidelines
44APPENDIX 4 - PROJECT BENEFITS CATEGORIES
Table 15 ndash Potential benefits for extreme heat (Urban Heat Island) reduction measures
Category Benefit Basic Guidance for Estimating Values
Direct Benefit
Reduced Life Cycle Cost
bull Applicable only to measures such as green roofs that are expected to last longer than standard roofs
bull Compute total cost savings including annual OampM costs
Indirect Benefit
Energy Savings
bull Applicable to measures that reduce energy costs by providing cooling through increased shading andor evapotranspiration
bull Use New York Power Authority rates of $0148kWh for electricity and $0810Therm for natural gas
Other Potential Benefits
Air Quality bull Applicable to measures that absorb pollutants andor reduce carbon dioxide emissions
Acoustics bull Applicable to measures such as green roof or walls that reduce noise transfer
Quality of LifeHealth bull Potential quality of life benefits and related to improved public health
Real Estate bull Applicable to measures that provide residential real estate benefits from increased resilience of propertiesstreetscapesneighborhoods
Retail Sales Marketing
bull Applicable to measures that provide commercial property benefits from increased aesthetics resulting in increased marketing and sales for streetscapesneighborhoods
Tax Credits Incentives
bull Applicable to resilience or green infrastructure measures such as green roofs that have accompanying Federal State or City tax credits or other incentives
Table 15 lists potential benefits for reducing impacts from heat and basic guidance for how to estimate them See Section IIID for more information
NYC Mayorrsquos Office of Recovery and Resiliency Climate Resiliency Design Guidelines
45APPENDIX 4 - PROJECT BENEFITS CATEGORIES
Table 16 ndash Guidance on quantitative calculations for (1) sea level rise with coastal storm surge and (2) increased precipitation measures
Data Input General Guidance ndash Basic Description
Applicable Benefit Category
Applicable Typical Facility Typology
Dire
ct B
enefi
ts
Indi
rect
Ben
efits
Oth
er P
oten
tial
Ben
efits
Bui
ldin
g St
ruct
ures
Com
plex
Fa
cilit
ies
Tran
spor
tatio
nSt
reet
scap
es
Plaz
as
Park
Fea
ture
s
First Floor Elevation (FFE)
bull The elevation of the first finished floor of the structure excluding basements
bull FFE measured from top of lowest floor (riverinenon-coastal high hazard areas) or bottom of lowest horizontal structural member (coastal high hazard areas)
Y Y Y Y
Building Replacement Value (BRV)
bull The unit cost to rebuild a structure of the same quality of construction
bull Not the same as market value
Y Y Y Y
Building Size
bull The total floor area of the building in square feet
bull Total Building Value = BRV x Building Sizebull Typical BRVs for NYC range between $100 to
$325SF for residential buildings and $120 to $450SF for commercialpublic buildings
Y Y Y Y
Structure Description
bull The type of building number of stories and foundation type (full basement partial basement no basement)
bull Collect more detailed foundation data for coastal flood zones
Y Y Y Y
Building Use bull Details related to residential housing commercial business and public use
Y Y Y Y Y
Building Type bull The primary use of building ndash residential commercial public and others
Y Y Y Y Y
Depth Damage Function (DDF)
bull Curves used to estimate structure damage contents damage and displacement of residential buildings based on flood depth
bull DDFs selection based on Structure Description Building Type Building Use
bull Structure DDFs based on percentage of Total Building Value
bull Contents DDFs based on percentage of Total Contents Value
bull Displacement DDFs based on number of displacement days x Displacement Cost
Y Y Y Y Y
Contents Value
bull The cost to replace structure contents (furnishings equipment)
bull Residential building Contents Values typically 50 BRV (FEMA DDFs) or 100 BRV (USACE DDFs)
bull Non-residential building Contents Values between 18 to over 100 depending on building use (USACE DDFs)
bull Total Contents Value = BRV x Building Size
Y Y Y Y Y
Table 16 provides general guidance on how to quantitatively calculate benefits from efforts to address from climate stressors See Section IIIE for more information
NYC Mayorrsquos Office of Recovery and Resiliency Climate Resiliency Design Guidelines
46APPENDIX 4 - PROJECT BENEFITS CATEGORIES
Table 16 ndash Guidance on quantitative calculations for (1) sea level rise with coastal storm surge and (2) increased precipitation measures
Data Input General Guidance ndash Basic Description
Applicable Benefit Category
Applicable Typical Facility Typology
Dire
ct B
enefi
ts
Indi
rect
Ben
efits
Oth
er P
oten
tial
Ben
efits
Bui
ldin
g St
ruct
ures
Com
plex
Fa
cilit
ies
Tran
spor
tatio
nSt
reet
scap
es
Plaz
as
Park
Fea
ture
s
Number of Residents (Residential)
bull Total number of occupants in a residential building
bull Typically estimated based on number of residential units x average number of individuals per household (based on current US Census data or use 25 individuals per household as a default)
Y Y Y Y Y
Displacement Cost (Residential)
bull The unit cost to lodge and feed displaced residents while flood damage is repaired
bull Average unit displacement cost of $415residential unitday recommended based on current FY2018 GSA Per Diem rates for New York City
Y Y Y Y Y
Value of Service (Non-Residential and Public)
bull The unit cost of service disruption and rental of temporary facilities while flood damage is repaired
bull Disruption costs for non-residential buildings typically range from $095 to $136SFmonth and rental costs range from $020 to $136SFmonth depending on building use
bull Value of service for public buildings ($day) is typically based on the annual operating budget for the City agency using the building prorated based on building size or population served by the building then divided by 365 daysyear
Y Y Y Y
Value of Service (Critical Facilities)
bull The unit cost of critical facilities (police fire emergency medical services) lost or delayed while flood damage is repaired
Y Y Y
Value of Service Duration
bull The duration of service disruption and rental of temporary facilities for non-residential buildings and critical facilities while flood damage is repaired
bull For non-residential buildingso Value of Service Durations vary from
4 months to over 30 months based on building use and the depth of flooding
o Total Value of Service Loss = (Disruption Cost x Building Area) = (Rental Cost x Building Area x Value of Service Duration)
bull For public buildings and critical facilitieso Value of Service Durations vary from 0
days to 720 months based on building use and the depth of flooding from FEMA FIA or USACE DDFs
o Total Value of Service Loss = (Value of Service) x (Service Loss Duration)
Y Y Y
NYC Mayorrsquos Office of Recovery and Resiliency Climate Resiliency Design Guidelines
47APPENDIX 4 - PROJECT BENEFITS CATEGORIES
Table 16 ndash Guidance on quantitative calculations for (1) sea level rise with coastal storm surge and (2) increased precipitation measures
Data Input General Guidance ndash Basic Description
Applicable Benefit Category
Applicable Typical Facility Typology
Dire
ct B
enefi
ts
Indi
rect
Ben
efits
Oth
er P
oten
tial
Ben
efits
Bui
ldin
g St
ruct
ures
Com
plex
Fa
cilit
ies
Tran
spor
tatio
nSt
reet
scap
es
Plaz
as
Park
Fea
ture
s
Engineering Estimates for Damages
bull Engineered estimate models of physical damages and service losses at the project site based on the Guidelines event recurrence interval(s) and flood depth(s)
Y Y Y Y Y Y
Historic Damages and Service Losses
bull Historic physical damages and service losses at the project site documented from previous flood events
bull Do not use routine maintenancebull The historic damage event recurrence interval
(RIs) andor flood depths must be determined updated for inflation to the present value and adjusted to match the Guidelines event RIsflood depths
Y Y Y Y Y Y
Facility Replacement Value
bull The unit cost to rebuild the facility
Impacted Area bull The geographic area impacted by the facility in the event of failure in acres
Y Y Y Y
Facility Capacity
bull The design capacity of the facilitybull For example - facility capacity expressed in
millions of gallons per day (MGD) for water and wastewater facilities or megawatts (MW) for electrical facilities
Y Y Y Y
Service Population
bull The number of impacted residents served by the facility
bull Typically estimated based on number of impacted residential customers x average number of individuals per household (based on current US Census data or use 25 individuals per household as a default)
bull Facilities serving mostly non-residentialpublic buildings andor critical facilities should focus on service losses rather than service population
Y Y Y
NYC Mayorrsquos Office of Recovery and Resiliency Climate Resiliency Design Guidelines
48APPENDIX 4 - PROJECT BENEFITS CATEGORIES
Table 16 ndash Guidance on quantitative calculations for (1) sea level rise with coastal storm surge and (2) increased precipitation measures
Data Input General Guidance ndash Basic Description
Applicable Benefit Category
Applicable Typical Facility Typology
Dire
ct B
enefi
ts
Indi
rect
Ben
efits
Oth
er P
oten
tial
Ben
efits
Bui
ldin
g St
ruct
ures
Com
plex
Fa
cilit
ies
Tran
spor
tatio
nSt
reet
scap
es
Plaz
as
Park
Fea
ture
s
Value of Service
bull Unit value of service provided by the facilitybull Example of FEMA standard values for complete
loss of utility service $105personday for potable water$49personday for wastewater$148personday for electrical
bull Consider updating FEMA standard per capita values to reflect current The New York City utility rates
Y Y
Roadway Elevations bull Roadway Elevations
Y Y
Roadway Replacement Value
bull Roadway Replacement ValueY Y
Inundation Area Map
bull Inundation Area Map developed by FEMA or through modeling by project design team
Y Y Y
Building Inventory of Inundation Area
bull The number and type of buildings within the streetscape and neighborhood inundated by the Guidelinersquos flood events
Y Y Y
Average Daily Traffic (ADT)
bull The average number of one-way traffic trips per day along the roadway(s) within the streetscapeneighborhood inundated by the Guidelinersquos flood events
Y Y
Additional Travel Time
bull The additional travel time needed to detour around a flooded roadway expressed in minutes
bull In the unlikely event there is no detour available use a 12-hour travel time per one-way trap but provide a detailed area street map as supporting documentation
Y Y
Value of Traffic Delay
bull The value of service associated with lost time in traffic
bull For example - FEMA standard average value of $3344vehiclehour of delay
bull Consider updating FEMA and GSA standard values to reflect current New York City area labor rates and fuel costs
Y Y
NYC Mayorrsquos Office of Recovery and Resiliency Climate Resiliency Design Guidelines
49APPENDIX 4 - PROJECT BENEFITS CATEGORIES
Table 17 ndash Guidance on quantitative unit benefit calculations for extreme heat hazard measures
Measure General Guidance ndash Unit Benefit Information and Data Requirements
Applicable Benefit Category
Applicable Typical Facility Typology
Dire
ct B
enefi
ts
Indi
rect
Ben
efits
Oth
er P
oten
tial
Ben
efits
Bui
ldin
g St
ruct
ures
Com
plex
Fa
cilit
ies
Tran
spor
tatio
nSt
reet
scap
es
Plaz
as
Park
Fea
ture
s
Green Roof
bull Unit benefit range over PUL = $470SF to $373SF of green roof area ($719SF standard value)
bull Assumed PUL = 40 yearsbull Apply standard value unit benefit to green
roof area to estimate measure benefitbull Higher range values more applicable
to residential and commercial building streetscape projects
Y Y Y Y Y Y
Bioswale Rain Garden Meadow Mix
bull Unit benefit range over PUL = $396SF to $211SF of area ($730SF standard value)
bull Assumed PUL = 30 yearsbull Apply standard value unit benefit to bioswale
rain gardenmeadow mix area to estimate total measure benefit
Y Y Y Y Y Y
Cool Roof
bull Unit benefit range over PUL = $117 to $3151SF of material area ($144SF standard value)
bull Assumed PUL = 20 yearsbull Apply standard value unit benefit to cool roof
area to estimate total measure benefitbull Higher range values more applicable to
residential building streetscape projects
Y Y Y Y Y
Light-Colored PaversLight-Colored Materials
bull Unit benefit range over PUL = $0774 to $204SF of material area ($0866SF standard value)
bull Assumed PUL = 30 yearsbull Apply standard value unit benefit to material
area to estimate total measure benefit
Y Y Y Y
Table 17 provides general guidance on how to quantitatively calculate benefits from efforts to address climate stressors See Section IIIE for more information
NYC Mayorrsquos Office of Recovery and Resiliency Climate Resiliency Design Guidelines
50APPENDIX 4 - PROJECT BENEFITS CATEGORIES
Table 17 ndash Guidance on quantitative unit benefit calculations for extreme heat hazard measures
Measure General Guidance ndash Unit Benefit Information and Data Requirements
Applicable Benefit Category
Applicable Typical Facility Typology
Dire
ct B
enefi
ts
Indi
rect
Ben
efits
Oth
er P
oten
tial
Ben
efits
Bui
ldin
g St
ruct
ures
Com
plex
Fa
cilit
ies
Tran
spor
tatio
nSt
reet
scap
es
Plaz
as
Park
Fea
ture
s
Tree Planting
bull Unit benefit range over PUL = $1005 to $77154Tree ($1855Tree standard value)
bull Assumed PUL = 30 yearsbull Apply standard value unit benefit to number of
trees to estimate total measure benefitbull Higher range values more applicable
to residential and commercial building streetscape projects
Y Y Y Y Y Y
Planter Box Tree
bull Unit benefit range over PUL = $212 to 16304Tree ($392Tree standard value)
bull Assumed PUL = 15 yearsbull Apply standard value unit benefit to number of
trees to estimate total measure benefitbull Higher range values more applicable
to residential and commercial building streetscape projects
Y Y Y Y Y
Shade Canopy
bull Unit benefit range over PUL = $0363 to $396SF ($0458SF standard value)
bull Assumed PUL = 15 yearsbull Apply standard value unit benefit to area of
shade canopy estimate total measure benefitbull Higher range values more applicable
to residential and commercial building streetscape projects
Y Y Y Y
Permeable Grass Pavers
bull Unit benefit range over PUL = $0258SF to $0521SF of pavers ($0363SF standard value)
bull Assumed PUL = 30 yearsbull Apply standard value unit benefit to paver
area to estimate total measure benefit
Y Y Y Y Y
For the purposes of the BCA refer to the following facility typologies bull ldquoBuilding Structuresrdquo include critical small building sites such as EMS or FDNY stations and non-critical small building sites such as
libraries or comfort stationsbull ldquoComplex Facilitiesrdquo include critical infrastructure such as wastewater treatment sites pump stations water filtration plants and similar
large or complex facilitiesbull ldquoTransportationStreetscapePlazasrdquo include roadway reconstruction streetscape improvements street raising plazas and other
transportation-related infrastructurebull ldquoPark Featuresrdquo include parks and similar public recreational facility with natural landscape features
NYC Mayorrsquos Office of Recovery and Resiliency Climate Resiliency Design Guidelines
51APPENDIX 5 - EXAMPLE PLANNING DECISION TREE
This decision tree provides a summarized example approach for how to implement these Guidelines Projects with a total cost greater than $50 million are recommended to conduct a full qualitative and quantitative climate change risk assessment and BCA while projects below $50 million are recommended to conduct a qualitative risk assessment and BCA
Define Project
1) Operational goals and criticality level2) Useful life3) Location in the current flood plain future floodplain and or zone
of tidal inundation and the project arearsquos score on the heat vulnerability index
Evaluate Project Risks According to Probability and Magnitude of Consequence
bull Extreme Heat bull Precipitationbull Sea Level Risebull Coastal Surge
High Level Identification and Assessment of Risk Mitigation Alternatives and Co-benefits
(qualitative)
Detailed Identification and Assessment of Risk Mitigation Alternatives and Co-benefits (qualitative and quantitative)
High Level Estimate of Costs and Benefits of Design Alternatives
(qualitative)
Detailed Estimate of Costs and Benefits of Design Alternatives
(qualitative and quantitative)
Decision Point Which climate change risks require mitigation
Decision Point Evaluate risk mitigation benefits and costs to
determine final resilient design alternative or if no action is required
Decision Point Is the total project cost above $50 million
Below $50 million Above $50 million
APPENDIX 5 - EXAMPLE PLANNING DECISION TREE
NYC Mayorrsquos Office of Recovery and Resiliency Climate Resiliency Design Guidelines
52
Project Title
Design Strategies Checklist (not exhaustive)
Extreme Heat Comments Extreme Precipitation Comments Sea Level Rise amp Storm Surge Comments
Select Site in Low Heat Vulnerability Index area Select High Elevation Site Select High Elevation Site
Minimize East-West Building Orientation Green Roof Raise Building Floor Elevation
Passive Solar Cooling and Ventilation Systems
Protect Below Grade Areas from Flooding Waterproof Building Envelope
Cool Roof (SRI appropriate) On-site Stormwater Management (gray) Elevate Critical Building Functions
Green Roof (extensive) Reduce Impervious Areas Elevate Critical Equipment
Vegetative Structures Permeable Pavement Perimeter Floodwall100 Levee (passive or active)
Enhanced HVAC System including space layout optimization and system scalability
Increase Green Spaces and Planted Areas DryWet Floodproofing
More Efficient Building Envelope Other Utility Redundancy Design101
Parking Lot Shading Resilient Materials amp Landscape Treatments
Light Colored Pavements (appropriate SRI) Design for Storm Surge Outflow
Increase Planted Areas Install Backwater Flow Prevention
Permeable Surfaces Design for Scour
Open-grid Pavement Raise Road Elevation
Other Other
This appendix provides a template for identifying possible design strategies to address climate change risks as described throughout the Guidelines
APPENDIX 6 - DESIGN STRATEGIES CHECKLIST
100 Permanent perimeter flood walls are not permitted to meet floodproofing requirements in buildings with substantial improvements andor damages 101 Utility redundancy design should be pursued for critical systems not all building systems
APPENDIX 6 - DESIGN STRATEGIES CHECKLIST
NYC Mayorrsquos Office of Recovery and Resiliency Climate Resiliency Design Guidelines
53APPENDIX 7 - CLIMATE CHANGE RISK ASSESSMENT RESOURCES
These Guidelines provide data on climate change hazards and recommend how that data can inform resilient design A risk assessment is a tool to help project managers and designers evaluate risk levels as well as select and prioritize resilient design strategies A high level risk assessment is recommended for all City capital projects with a total cost of under $50 million Projects above $50 million are recommended to conduct an in-depth assessment
Risk assessments use quantified estimates of the probability and magnitude of consequence of an event occurring to prioritize responses ldquoProbabilityrdquo is an assessment of the likelihood of a hazard occurring while ldquomagnituderdquo describes the hazardrsquos potential impact Risk assessment tools such as the examples listed below can be used to define and score these categories Projects that score higher across both probability and magnitude can be prioritized for investment and risk mitigation action Projects that score lower across both criteria may require no action beyond meeting code The results are typically charted on a risk matrix and an example is provided on the next page
The climate change risk management frameworks below offer templates for how to integrate climate change projections into a risk assessment process Refer to these resources for examples and further information
bull Vulnerability Assessment and Adaptation Framework is prepared by the Federal Highway Administration (FHWA) While developed for transportation planning this risk assessment framework has broad applicability for evaluating asset vulnerability to climate change Available at httpswwwfhwadotgovenvironmentsustainabilityresilienceadaptation_framework
bull US Climate Resilience Toolkit The US Global Change Research Program offers a step by step risk assessment
framework including tools and case studies at httpstoolkitclimategovsteps (see example on next page)
bull Coast Adapt Guidance on undertaking a risk assessment High level assessment httpscoastadaptcomausitesdefaultfilesfactsheetsT3M4_2_2nd_pass_risk_assessmentpdfDetailed assessment httpscoastadaptcomausitesdefaultfilesfactsheetsT3M4_3_3rd_pass_risk_assessmentpdf
bull Climate adaptation Risk uncertainty and decision-makingDownload the report here httpswwwukciporgukpublicationsRisk
The City plans to develop a NYC-specific process for integrating climate change data into existing risk management processes by April 2019
APPENDIX 7 - CLIMATE CHANGE RISK ASSESSMENT RESOURCES
NYC Mayorrsquos Office of Recovery and Resiliency Climate Resiliency Design Guidelines
54APPENDIX 7 - CLIMATE CHANGE RISK ASSESSMENT RESOURCES
The Risk Characterization Matrix below is an example from the US Climate Resilience Toolkit This tool can be used to assess the probability and magnitude of impact for identified risks The risk of coincident climate stressorsrisks (such as storm surge plus increased precipitation) can also be assessed as applicable
Figure 14 - Example of a climate change risk matrix (adapted from US Climate Resilience Toolkit)
Project teams can determine the magnitude of the impact (along the horizontal scale of 1 through 3 with 3 being the most severe) and the probabilitylikelihood of occurrence for each specific risk (along the vertical scale with 3 being the most likely) A score is typically assigned for each risk (Probabil-ity x Magnitude) and then charted on the matrix Based on the estimated probability and magnitude of consequence above the risks are ranked and prioritized for mitigation Factors to bear in mind include
bull Not all facility typologies have the same level of functional and operational importance during events or tolerance for disruption
bull Not all climate stressors and risks have the same level of impact on each project sitebull Not all identified risks can or should be mitigated fully
NYC Mayorrsquos Office of Recovery and Resiliency Climate Resiliency Design Guidelines
55WORKS CITED
A Stronger More Resilient New York PlaNYC Report of the NYC Special Initiative for Rebuilding and Resiliency The City of New York 2013
ldquoAccount for Climate Riskrdquo International Finance Corporation accessed March 27 2017 httpwwwifcorgwpswcmconnectTopics_Ext_ContentIFC_External_Corporate_SiteClimate+Business
PrioritiesAccount+for+Climate+Risk
American Society of Heating Refrigeration and Air-Conditioning Engineers (ASHRAE) Handbook -Fundamentals 2017
ldquoBaseline Standard Economic Value Methodology Reportrdquo Federal Emergency Management Agency July 2016
Benefit Cost Analysis Toolkit Software Version 530 Federal Emergency Management Agency (build date December 2016)
Criteria for Detention Facility Design New York City Department of Environmental Protection November 2012
Community Resilience Planning Guide for Buildings and Infrastructure Systems Vol 1 NIST Special Publication 1190 US Department of Commerce 2016
Cool and Green Roofing Manual NYC Department of Design and Construction 2007 httpwwwnycgovhtmlddcdownloadspdfcool_green_roof_manpdf
Building Resiliency Task Force US Urban Green Building Council New York 2013 httpurbangreencouncilforcecomBuildingResiliency
Design and Planning for Flood Resiliency Guidelines for NYC Parks New York City Department of Parks and Recreation 2017
httpswwwnycgovparksorgplanning-and-buildingplanningresiliency-plansflood-resiliency
Flooded Bus Barns and Buckled Rails Federal Transit Administration Office of Budget and Policy 2011 httpswwwhsdlorgabstractampdid=685187
Floodproofing Non-Residential Buildings FEMA P936 FEMA 2013 httpswwwfemagovmedia-library-data9a50c534fc5895799321dcdd4b6083e7P-936_8-20-13_508rpdf
ldquoGlossaryrdquo International Infrastructure Management Manual National Asset Management Support Group New Zealand 2011 httpwwwipweaorg
ldquoGreen Roof Metrics Draft Reportrdquo New York City Department of Parks and Recreation 2017
ldquoGuide to Rain Event Preparednessrdquo NYC Department of Environmental Protection httpwwwnycgovhtmldeppdfbrochuresflood-preparedness-flyerpdf
ldquoGuidelines and Discount Rates for Benefit-Cost Analysis of Federal Programsrdquo Appendix C Circular A-94 US Office of Management and Budget (OMB) 2017
ldquoGuidelines for the Design and Construction of Stormwater Management Systemsrdquo New York City Department of Environmental Protection July 2012
Horton R et al New York City Panel on Climate Change 2015 Report Ann NY Acad Sci ISSN 0077-892 New York 2015
Madrigano J et al ldquoA case-only study of vulnerability to heat wavendashrelated mortality in New York City (2000ndash2011)rdquo Environmental Health Perspectives 123672ndash678 2013
WORKS CITED
NYC Mayorrsquos Office of Recovery and Resiliency Climate Resiliency Design Guidelines
56WORKS CITED
enspMcGregor et al Two Degrees The Built Environment and Our Changing Climate Routledge Press 2013
NYC Green Codes Task Force US Green Building Council New York 2010 httpurbangreencouncilorgGreenCodes
NYCrsquos Risk Landscape A Guide to Hazard Mitigation NYC Emergency Management 2014
One New York The Plan for a Strong and Just City The City of New York 2015 httpwwwnycgovhtmlonenyc downloadspdfpublicationsOneNYCpdf
Ready to Respond Strategies for Multifamily Building Resilience Enterprise Green Communities 2015 httpswwwenterprisecommunityorgresources
Rosenzweig C et al Climate Change Adaptation in New York City Building a Risk Management Response New York City Panel on Climate Change 2010
httponlinelibrarywileycomdoi101111nyas20101196issue-1 issuetoc
ldquoSustainable Infrastructure Management Program Learning Environmentrdquo Water Environment Research Foundation accessed March 24 2017 httpsimplewerforg
Urban Waterfront Adaptive Strategies NYC Department of City Planning 2013 httpwww1nycgovsiteplanningplanssustainable-communitiesclimate-resiliencepagetab=1
Wastewater Resiliency Plan Climate Risk Assessment and Adaptation Study New York City Department of Environmental Protection October 2013
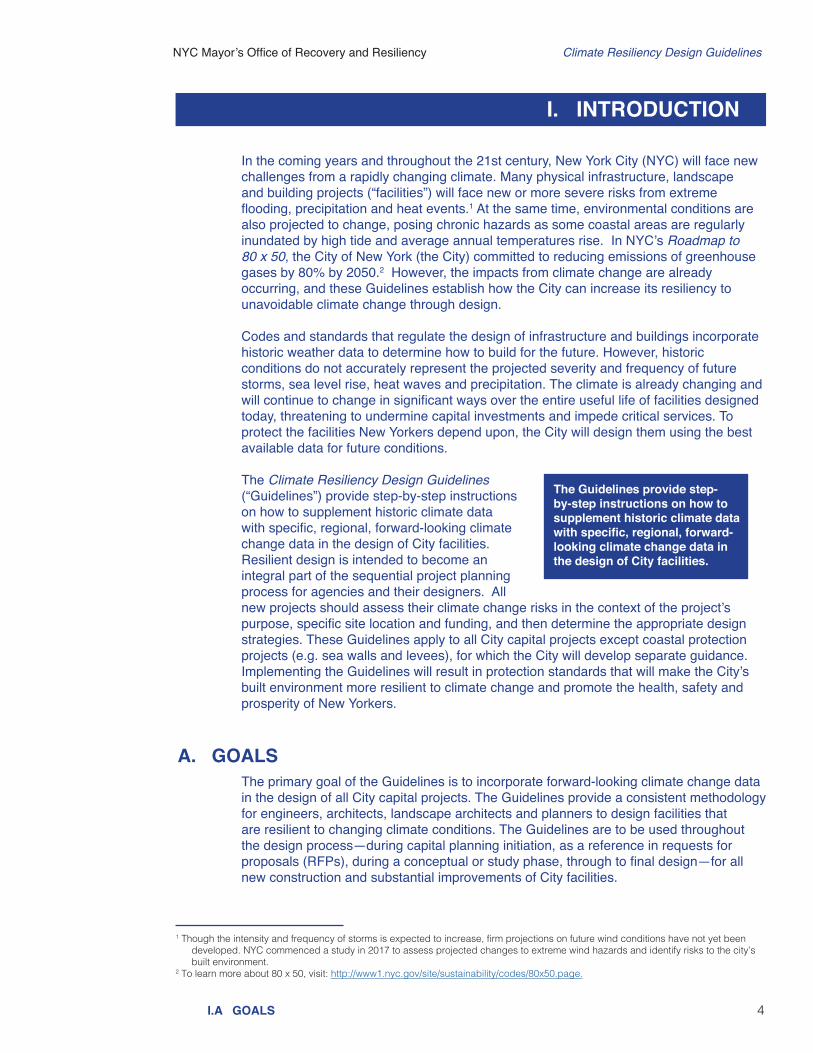
NYC Mayorrsquos Office of Recovery and Resiliency Climate Resiliency Design Guidelines
4
In the coming years and throughout the 21st century New York City (NYC) will face new challenges from a rapidly changing climate Many physical infrastructure landscape and building projects (ldquofacilitiesrdquo) will face new or more severe risks from extreme flooding precipitation and heat events1 At the same time environmental conditions are also projected to change posing chronic hazards as some coastal areas are regularly inundated by high tide and average annual temperatures rise In NYCrsquos Roadmap to 80 x 50 the City of New York (the City) committed to reducing emissions of greenhouse gases by 80 by 20502 However the impacts from climate change are already occurring and these Guidelines establish how the City can increase its resiliency to unavoidable climate change through design
Codes and standards that regulate the design of infrastructure and buildings incorporate historic weather data to determine how to build for the future However historic conditions do not accurately represent the projected severity and frequency of future storms sea level rise heat waves and precipitation The climate is already changing and will continue to change in significant ways over the entire useful life of facilities designed today threatening to undermine capital investments and impede critical services To protect the facilities New Yorkers depend upon the City will design them using the best available data for future conditions The Climate Resiliency Design Guidelines (ldquoGuidelinesrdquo) provide step-by-step instructions on how to supplement historic climate data with specific regional forward-looking climate change data in the design of City facilities Resilient design is intended to become an integral part of the sequential project planning process for agencies and their designers All new projects should assess their climate change risks in the context of the projectrsquos purpose specific site location and funding and then determine the appropriate design strategies These Guidelines apply to all City capital projects except coastal protection projects (eg sea walls and levees) for which the City will develop separate guidance Implementing the Guidelines will result in protection standards that will make the Cityrsquos built environment more resilient to climate change and promote the health safety and prosperity of New Yorkers
A GOALSThe primary goal of the Guidelines is to incorporate forward-looking climate change data in the design of all City capital projects The Guidelines provide a consistent methodology for engineers architects landscape architects and planners to design facilities that are resilient to changing climate conditions The Guidelines are to be used throughout the design processmdashduring capital planning initiation as a reference in requests for proposals (RFPs) during a conceptual or study phase through to final designmdashfor all new construction and substantial improvements of City facilities
IA GOALS
1 Though the intensity and frequency of storms is expected to increase firm projections on future wind conditions have not yet been developed NYC commenced a study in 2017 to assess projected changes to extreme wind hazards and identify risks to the cityrsquos built environment
2 To learn more about 80 x 50 visit httpwww1nycgovsitesustainabilitycodes80x50page
I INTRODUCTION
The Guidelines provide step-by-step instructions on how to supplement historic climate data with specific regional forward-looking climate change data in the design of City facilities
NYC Mayorrsquos Office of Recovery and Resiliency Climate Resiliency Design Guidelines
5IB CLIMATE CHANGE PROJECTIONS FOR NEW YORK CITY
A successful resiliency strategy is one that provides co-beneficial outcomes reduces costs over the life of the asset wherever possible and avoids negative indirect impacts to other systems Resilient design should not exist in a silo but rather be a well-integrated part of existing processes and address other goals of the City For example these resilient design choices should be made in the context of the Cityrsquos capital planning risk management and financial planning Similarly resilient design choices should be selected to maximize the efficacy and efficiency of investments Some ways this can be done include 1) integrating ldquosoftrdquo resiliency strategies (operational measures or investments in green infrastructure) and ldquohardrdquo resiliency strategies (built or intensive investments) 2) addressing multiple climate hazards with single interventions and 3) reducing climate change risk in concert with other goals (eg energy efficiency or reduction in greenhouse gas emissions) These Guidelines were developed by the Mayorrsquos Office of Recovery and Resiliency (ORR) in close collaboration with City agencies that are involved in the design or management of capital projects A Design Guidelines Working Group was convened to consult on the development of the Guidelines which included more than 15 City agencies3 A preliminary version (10) of these Guidelines was issued in April 2017 and was tested and validated through an extensive review with internal and external climate and design experts Version 20 has been updated to reflect lessons learned through that analysis
B CLIMATE CHANGE PROJECTIONS FOR NEW YORK CITY
The New York City Panel on Climate Change (NPCC) provides regional climate change projections that inform City resiliency policy Composed of leading scientists the NPCC prepares projections for the metropolitan region which have shown that extreme weather will increase in frequency and severity and that the climate will become more variable These projections are divided across future time slices including the 2020s 2050s 2080s and 2100 The most NPCC recent climate change projections from 2015 encompass a wide range of possible outcomes for example
bull Mean annual temperature is projected to increase between 41 and 66degF by the 2050s and between 53 and 103degF by the 2080s4
bull Frequency of heat waves is projected to triple by the 2050s to 5 to 7 heat waves per year and 5 to 8 heat waves per year by the 2080s5
bull Mean annual precipitation is projected to increase between 4 to 13 by the 2050s and between 5 to 19 by the 2080s6
bull Sea level is expected to continue rising by another 11 to 21 inches by the 2050s and by 18 to 39 inches by the 2080s7
This document provides specific guidance on how to use the range of climate change projections in design For more information on climate change projections for the metropolitan region see Appendix 2 The NPCC continues to study and refine projections for the metropolitan region and these Guidelines will be updated as new reports are released by the NPCC
3 Representatives from the following City departments and agencies contributed to the creation of this document Environmental Protection Transportation City Planning Buildings Design and Construction Parks and Recreation Emergency Management School Construction Authority City Administrative Services Health and Hospitals Information Technology and Telecommunications Economic Development Corporation Housing Authority Public Design Commission Mayorrsquos Office of Sustainability Mayorrsquos Office of the Chief Technology Officer Housing Preservation and Development Office of Management and Budget Sanitation and Law
4 Ranges for heat reflect the middle and high range estimates from the NPCC See Appendix 2 for more information5 Ibid6 Ranges for precipitation reflect the middle and high range estimates from the NPCC See Appendix 2 for more information7 Ranges for sea level rise reflect the middle range estimates from the NPCC See Appendix 2 for more information
NYC Mayorrsquos Office of Recovery and Resiliency Climate Resiliency Design Guidelines
6IC PLANNING ACROSS PROJECT USEFUL LIFE ID MANAGING UNCERTAINTY
C PLANNING ACROSS PROJECT USEFUL LIFEA resilient facility is one built to withstand or recover quickly from natural hazards Climate conditions will continue to change over time which makes considering the useful life important for choosing the right level of protection8 Users should using professional knowledge and examples from the built environment estimate the full useful life of the facility to determine necessary design adjustments tied to climate change (useful life starts at the end of construction) The full project useful life of a facility is typically a longer period than the design life and more accurately represents the extended service life of most types of facilities (assuming regular maintenance) For example an administrative building may have a design life of 30 years but in practice such buildings remain in use for 50 years or more when well-maintained Full useful life is also met through the successful deployment of design strategies that minimize operations and maintenances (OampM) and the need for renovations ORR and Department of Design and Construction (DDC) with input from other City agencies are developing a library of common asset types for buildings landscapes infrastructure and equipment and assessing their typical design and useful lives This resource will be added as an addendum to the Guidelines by April 2019
D MANAGING UNCERTAINTYClimate change projections from the NPCC are the product of state-of-the-art modeling and analysis However as with all projections there is uncertainty embedded within them9 The NPCC continues to develop review and synthesize the latest climate data for the metropolitan region and new findings will be incorporated into future versions of these Guidelines
Given uncertainty flexible adaptation pathways provide a useful iterative approach for managing uncertainty and designing resilient facilities particularly those with a useful life that extends over 50 years - beyond which the uncertainty of projections increases10 Adaptation pathways are particularly useful for expensive long-lived and highly complex projects They provide a way to balance uncertainty with cost as well as manage operational and maintenance constraints A facility can be engineered with an adaptable protection level which reduces the hazard risk to acceptable levels for part of its useful life and that can be re-evaluated as risk levels change
8 NIST Community Resilience Planning Guide for Buildings and Infrastructure Systems Vol 1 NIST Special Publication 1190 US Department of Commerce 2016
9 PlaNYC A Stronger More Resilient New York report of the NYC Special Initiative for Rebuilding and Resiliency Report June 11 2013 page 28 From that report ldquoLike all projections the NPCC projections have uncertainty embedded within them Sources of uncertainty include data and modeling constraints the random nature of some parts of the climate system and limited understanding of some physical processes The NPCC characterizes levels of uncertainty using state-of-the-art climate models multiple scenarios of future greenhouse gas concentrations and recent peer-reviewed literature Even so the projections are not true probabilities and the potential for error should be acknowledgedrdquo
10 To learn more see Chapter 2 in the NPCC 2010 report Climate Change Adaptation in New York City available at httponlinelibrarywileycomdoi101111nyas20101196issue-1issuetoc
Figure 1 - Example of a flexible adaptation pathway for an outdoor emergency generator and platform
An illustrative example of using flexible adaptation
NYC Mayorrsquos Office of Recovery and Resiliency Climate Resiliency Design Guidelines
7IE PROJECT-SPECIFIC CONSIDERATIONS
pathway on a facilitiesrsquo component is explained in Figure 1 It shows an emergency generator with an approximate useful life of 25 years located outside a building In order to incorporate the Guidelines into design it is recommended that the foundation of the generator structure is designed to match the useful life of the building which can vary between 50-70 years that the generator serves Assuming the generator is subject to flooding risk from sea level rise and coastal surge it should be built on an elevated concrete slab that matches the future year design flood elevation (DFE) scenario corresponding to the end of the generatorrsquos useful life The generator must be replaced when it reaches the end of its useful life which is typically far less than that of the building When the replacement generator is installed the concrete slab is further elevated to accommodate the future DFE The foundation of the generator and the columns are designed to support the additional future load from the concrete slab Thereby the initial investment into the foundation can be used to adapt in the future allowing for future flexibility and avoided costs
Adaptation pathways may not apply equally to all types of projects or climate change projections Facility flood defenses for example may be more easily developed through an adaptation pathway than heat-vulnerable materials or below grade drainage systems For this reason the Guidelines use the middle of the 25th to 75th percentile range projections for sea level rise (see Table 4) and the high-end 90th percentile projections for heat (see Table 1) For precipitation these Guidelines recommend using the existing 50-year storm data as a proxy for the projected high-end 5-year storm (see Section IIIB and Figure 4 for more details)
Uncertainty can be further addressed through risk management Some facilities such as those that are critical or cost more than $50 million for design and construction will benefit from a full climate change risk assessment (see examples in Appendix 7) This assessment will evaluate protecting the facility to a potentially higher level of sea level rise than the recommended height in these Guidelines The City plans to develop a process for integrating climate change data into existing risk management processes by April 2019 If engaging in a climate change risk assessment process please contact ORR at ResilientDesigncityhallnycgov
E PROJECT-SPECIFIC CONSIDERATIONSExisting information and requirements specific to different kinds of projects must be reviewed on a case-by-case basis when evaluating resiliency design strategies Refer to Appendix 5 for an example approach of how to make resiliency planning and design decisions and discuss these considerations as a project team to determine which apply and how to respond
bull Financing requirements if the project is federally-funded or receives recovery funding discuss with the funding agency if certain protection standards or cost-benefit analyses are required For example FEMA requires specific flood protection standards for critical facilities and non-critical facilities
bull Interdependencies consider how hazards impact interdependencies across sectors as well as the risks from coincident events (eg extreme precipitation occurring during an extreme surge event) to specific projects
bull Existing hazard mitigation projects and risk studies evaluate if nearby or associated projects have already been assessed for climate change risks Identify if
NYC Mayorrsquos Office of Recovery and Resiliency Climate Resiliency Design Guidelines
8IE PROJECT-SPECIFIC CONSIDERATIONS
any studies have been conducted that could inform design (eg local flood modeling with sea level rise) This may inform the climate change risk assessment or provide insights into site specific conditions and design options A map that catalogs NYC resiliency projects is located here httpsmapsnycgovresiliency
bull Agency-specific resiliency design standards refer also to resiliency guidelines provided by various City agencies (eg Parkrsquos Design and Planning for Flood Resiliency11) Agency guidelines build on the climate data provided in these Guidelines by providing specific design alternative and insights relevant to those agencies
bull Limitations the Guidelines do not describe or encompass all City resiliency policies To learn more about how the City plans for a resilient future see the latest OneNYC plan as well as the 2013 report A Stronger More Resilient New York Related resiliency issues are being addressed by the City but are out of the scope of these Guidelines including neighborhood and regional-level climate change risk management and zoning
bull Further questions Contact ORR at ResilientDesigncityhallnycgov
11 Available at httpswwwnycgovparksorgplanning-and-buildingplanningresiliency-plansflood-resiliency
NYC Mayorrsquos Office of Recovery and Resiliency Climate Resiliency Design Guidelines
9IIA INCREASING HEAT
All City of New York capital projects should be designed to withstand increasing heat and precipitation based on the useful life of the asset while design interventions for storm surge and sea level rise depend on the projectrsquos proximity to the floodplain useful life and criticality In order to support design team efforts to generate resilient design responses (ie adjustments to base projects) these Guidelines provide climate change projections and recommend design adjustments or interventions in response to increasing heat increasing precipitation and sea level rise The Guidelines recommend designing to loads beyond the minimum requirements in the prevalent NYC local codes Design teams should consider project benefits and additional costs to incorporating resilient design standards before finalizing project design
A INCREASING HEATUse this section to determine how to adjust a facilityrsquos design to account for increasing temperatures and to reduce the facilityrsquos contribution to the Urban Heat Island effect Heat reduction levels will be determined by the function location and useful life of the asset
BackgroundThe impacts of heat on NYC are well established Every summer over 100 New Yorkers die from causes exacerbated by extreme heat12 The region has seen a steady increase in the number of days above 90degF and temperatures are projected to keep rising worsening heat-related mortality By the 2050s the number of days at or above 90degF is expected to double and the frequency and length of heat waves will triple to an average 6 heat waves per year13 Certain areas of NYC already experience higher temperatures relative to other parts of the city and these hot spots will be exacerbated by climate change (see Figure 2)
12 OneNYC The Plan for a Strong and Just City (The City of New York 2015) 228 See also Madrigano J Ito K Johnson S Kinney PL Matte T 2015 A case-only study of vulnerability to heat wavendashrelated mortality in New York City (2000ndash2011) Environmental Health Perspectives 123672ndash678 httpwwwnycgovhtmlonenycdownloadspdfpublicationsOneNYCpdf
13 Horton et al New York City Panel on Climate Change 2015 Report Chapter 1 Climate Observations and Projections Ann NY Acad Sci ISSN 0077-8923 New York 201514 LANDSAT Thermal Data from 8182009
Figure 2 - Thermal imagery of New York City based on LANDSAT Thermal Data from 818200914
II INTERPRETING CLIMATE CHANGE DATA FOR RESILIENT DESIGN ADJUSTMENTS
NYC Mayorrsquos Office of Recovery and Resiliency Climate Resiliency Design Guidelines
10IIA INCREASING HEAT
In Cool Neighborhoods NYC the City prioritizes strategies to study the Urban Heat Island effect and make targeted investments that benefit communities most vulnerable to heat15 New Yorkers are more or less vulnerable to heat based largely upon socio-economic factors including age income location tree coverage and the percentage of dark surfaces The NYC Department of Health and Mental Hygiene (DOHMH) developed a Heat Vulnerability Index (HVI) which highlights parts of the city where more residents face an increased risk of heat-related mortality Their vulnerability is due to their exposure and socio-economic conditions that determine their
Figure 3 - Heat Vulnerability Index (HVI) for New York City Community Districts (Source NYC DOHMH 2015) This analysis identifies physical social and economic factors associated with increased risk of heat-related morbidity and mortality17
The Guidelines recommend that project designers consider two aspects of the relationship between their project and increasing heat the way their project reduces the Urban Heat Island effect and the impact that increasing heat will have on the physical components of their project itself
bull Reduce Urban Heat Island effect materials in the built environment absorb the sunrsquos heat throughout the day and re-radiate it back into the atmosphere driving localized temperatures higher and increasing demands on cooling systems Air conditioning and ventilation equipment also push extra heat into the air contributing to a feedback loop that increases localized ambient temperatures and impacts the health of heat-vulnerable New Yorkers This section provides guidance on how new capital construction can reduce the contribution to ambient heat in the city
bull Minimize impact from increasing heat increasing heat can physically impact components of buildings and infrastructure damaging or stressing materials electrical systems and mechanical systems Rising temperatures will also stress energy and communications networks that buildings and other infrastructure rely upon18 This section provides climate data to be used to adjust and adapt heat-vulnerable components of assets
15 OneNYC 22816 To learn more about Heat Vulnerability Index see page 229 of OneNYC at httpwwwnycgovhtmlonenycdownloadspdf
publicationsOneNYCpdf17 See page 229 in the OneNYC plan to learn more about HVI18 Damiano H et al NYCrsquos Risk Landscape A Guide to Hazard Mitigation (NYC Emergency Management 2014) 103
Heat can be lethal for all but its impact on New Yorkers is not equal
sensitivity to heat Community districts in red and orange in Figure 3 are areas of highest vulnerability and these are particularly concentrated in east Brooklyn the south Bronx northern Manhattan and southeast Queens16 While all new capital projects should address heat impacts those sited in moderate to high vulnerable HVI areas should implement multiple strategies to reduce the Urban Heat Island and help address the high vulnerability in these neighborhoods
NYC Mayorrsquos Office of Recovery and Resiliency Climate Resiliency Design Guidelines
11IIA INCREASING HEAT
1 Urban Heat Island reductionNew capital construction should minimize its contribution to the Urban Heat Island effect The design interventions provided below offer benefits to the community and the facility through reduced heat loading reduced energy costs andor improved occupant health and thermal comfort The appropriate combination of design interventions will vary dependent on the project scope
a) Increase the solar reflectance of surfaces by utilizing light-colored pavement coatings and materials in combination with shading with a minimum target of 50 of the non-structure areas of facility sites19
Lighter reflective surfaces help reduce the Urban Heat Island effect heat loading and internal building temperatures and extend the lifespan of rooftops and heating ventilation and air conditioning (HVAC) equipment The City has taken steps towards reducing ambient temperatures such as implementing the NYC Cool Roofs program20 New buildings as well as existing buildings with roofs going through significant repairs are required by law to paint their roofs white This program intervention reduces a buildingrsquos contribution to Urban Heat Island effect and provides energy savings by coating the normally dark concrete roof surface with white paint allowing the roof to reflect solar radiation
b) Increase the shading of surfaces by planting trees or other vegetation in combination with cool pavements with a minimum target of 50 of the non-structure areas of facility sites
Shady areas with heat- and in coastal areas salt-tolerant vegetative species can help keep buildings cool and provide energy savings as well as lower temperatures
c) Meet Climate Zone 6 standards for fenestration and insulation (See Section ECC C402 in Chapter C4 of the 2016 NYC Energy Code) to improve efficiency of building envelopes
NYC is currently in Climate Zone 4 NYC already requires that small residential building envelopes are designed to meet higher insulation and fenestration requirements to improve energy efficiency21 All City capital projects including non-residential facilities should meet this standard
d) Select greenblue roofs andor other appropriate landscape elements that maximize cooling with help of landscape architects
The City already encourages the use of green and blue roofs on buildings to reduce the Urban Heat Island effect22 provide stormwater management and increase the useful life of the roof Besides replacing dark roof surfaces green roofs and vegetation also provide shade and keep the air cool through evapotranspiration by releasing moisture into the atmosphere Blue roofs coupled with light colored roofing material can provide stormwater management and rooftop cooling Some of these designs support the shading and solar reflectance goal in Step a) above Additionally City capital projects are subject to Leadership in Energy and Environmental Design (LEED) certification and green roofs can earn LEED credits23 Projects should integrate cooling strategies listed below based on project scope and a balance between costs and benefits
bull Green roofs or blue roofs on a broader range of facilities (including industrial buildings storage garages administration buildings etc)
19 Urban Green Council (2010) Green Codes Task Force Proposed code ldquoEF 12 Reduce Summer Heat with Cool Shady Building Lotsrdquo20 Local Law No 21 (2011) amended Chapter 12 of the NYC Building Code to update roof coating standards Also
see Cool and Green Roofing Manual (DDC) 2007 for more information on NYC standards for cool and green roofs httpwwwnycgovhtmlddcdownloadspdfcool_green_roof_manpdf
21 Read more about the code here httpswww1nycgovsitebuildingscodes2016-energy-conservation-codepage22 See Cool and Green Roofing Manual (DDC) 2007 for more information on NYC standards for cool and green roofs
httpwwwnycgov htmlddcdownloadspdfcool_green_roof_manpdf23 See Local Law No 32 (2016) for more information
NYC Mayorrsquos Office of Recovery and Resiliency Climate Resiliency Design Guidelines
12
2 Minimize impact from increasing heatThis section provides information to support making design adjustments to capital projects to reduce impacts to equipment structures landscapes and materials from rising average temperatures and increasing extreme heat events
a) Review forward-looking climate data provided in Table 1 and Table 2 Select heat projections according to the useful life of the facility and its primary
components then evaluate and address impacts in the steps below Table 1 provides design criteria for average temperatures and incidents of extreme heat events projected to different time periods across the 21st century Table 2 provides guidance on future 1 Dry Bulb Temperature and Cooling Degree Days for the NYC area The 1 Dry Bulb Temperature represents the ambient air temperature
IIA INCREASING HEAT
bull Vegetated structures such as shade trees and planters (to reduce heat loading on horizontal or vertical surfaces)
bull Bioswales rain gardens and bioretention24 bull Maximize planted permeable surfacesbull Other permeable surfaces (used for stormwater management these retain
moisture that evaporates as surface temperatures rise)25 bull Open-grid pavement system (at least 50 unbound)26 bull Evaluate site planning and building massing with regard to solar gainbull Solar panels for shading and to generate energy
Table 1 ndash Baseline and projected extreme heat events27
End of useful life
heat waves per year (3 or more consecutive days with max temperatures at or above 90degF)
days above 90degF
Annual average temperature
Baseline (1971-2000) 2 18 54degF
Through to 2039 4 33 572degF
2040-2069 7 57 606degF
2070-2099 9 87 643degF
Table 2 ndash Projections for 1 Dry Bulb temperature and Cooling Degree Days
Change in projected value for 2050s
Variable Baseline for Central Park (1971-2000)
Low estimate (10th percentile)
Middle range (25th to 75th percentile)
High estimate (90th percentile)
1 Dry Bulb temperature 91degF +3degF +4-6degF +7degF
Cooling Degree Days (base = 65degF) 1149 +37 +46-73 +87
Note Due to HVAC system typical useful life of 25 years or less only projections for the 2050s are shown Projections for the 2020s are not shown because it is anticipated that enough of a safety margin is employed already in current systems to withstand the temperature rise expected through the 2020s The NPCC is currently working on projections of 1 Wet Bulb temperatures which are expected to increase and may require systems to have higher moisture reducing capacity in addition to the enhanced cooling capacity
24 When siting bioswales consider groundwater levels and soil permeability and ensure that the site is not contaminated from past or present land uses A high water table may prohibit some applications
25 Urban Green Council (2010) Green Codes Task Force Proposed code ldquoSW 1 REDUCE EXCESSIVE PAVING OF SITESrdquo26 LEED Neighborhood Development v4 ldquoHeat island reductionrdquo credit27 Projected estimates for average temperatures are based upon 90th percentile change factor added to the baseline average annual
temperature from New York City Panel on Climate Change (2015)
NYC Mayorrsquos Office of Recovery and Resiliency Climate Resiliency Design Guidelines
13IIA INCREASING HEAT
b) Evaluate potential impacts on systems and materials Heat impacts on a facility are highly contingent on the facility type and should be reviewed on a case-by-case basis28 A decrease in the useful life or operational capacity of a facility or components of a facility may occur due to rising temperatures Interventions will also vary depending on whether the project is a new capital investment or a substantial improvement to an existing facility Factors to evaluate as applicable to project scope include but are not limited to
bull Thermal expansion warping softening or other forms of material change or degradation of structural integrity occurring at an accelerated rate by excessive heat
bull Health and safety impacts on occupants vulnerable to heat bull Increased failure or reduced efficiency of electrical or mechanical systems bull Prioritization of critical loads for systems and components at the facility andbull Moisture control needs for buildings with a higher standard for fenestration and
insulation
The results of this evaluation will inform steps taken in the step below
c) Reduce heat impacts Review and implement specific changes to the facility design based on assessments
above Develop a strategy based on the specific type of facility its operational profile and its useful life A Design Strategies Checklist is available for use in Appendix 6 as a resource to track design approaches Specific areas of focus are
bull Electricity outages High temperatures drive demand for air conditioning and can increase the risk of facility equipment failure potentially broader grid disruptions or brownouts2930 To manage this risk design City buildings and infrastructure to withstand periods without electricity using the following approaches in particular if they provide critical or essential services
Ǯ Identify and assess how much of the facilityrsquos load is critical (eg ldquocritical loadrdquo) including the necessary duration of the backup power supply (eg is backup power needed for 8 hours or multiple days) Determining what loads are critical and how long they should be powered for is essential for a facilityrsquos operations and what the role of the facility will have in an emergency situation31
Ǯ Depending on the size of the critical load and budget different backup power supply options could range from backup generators (eg diesel natural gas) to hybrid systems (eg solar + battery storage + appropriately sized generator) Each option has different trade-offs that should be considered in terms of cost feasibility and environmental impacts For shorter duration needs andor smaller critical loads buildings with existing solar systems should consider adding storage to provide a resiliency benefit In some cases co-generation systems may make sense from an economic and resiliency perspective especially if there
28 Sector- and facility-specific impacts vary greatly For examples of sector-specific impacts and design responses see Flooded Bus Barns and Buckled Rails (FTA 2011) and Ready to Respond Strategies for Multifamily Building Resilience (Enterprise Green Communities 2015)
29 McGregor et al (2013) Two Degrees The Built Environment and Our Changing Climate Routledge Press30 High temperatures also increase energy demand which can increase fossil fuel based greenhouse gas emissions31 The key roles of the facility that need to be identified are operational hours number of occupants and electrical loads needed for the
desired operations Electrical equipment and appliances for the desired operations may include - but are not limited to - safety lighting life-supporting systems fire protection systems telecommunications equipment mechanical systems to mitigate extreme temperatures and computing equipment Every facility is unique Operational characteristics and load profiles need to be established prior to sizing the equipment required to keep the facility in operational mode
NYC Mayorrsquos Office of Recovery and Resiliency Climate Resiliency Design Guidelines
14IIA INCREASING HEAT
is a significant heating andor cooling load in addition to electricity demand32
Ǯ Depending on the option assess need to invest in internal electricity rewiring and building energy management systems (eg switches reconfiguration of distribution infrastructure to isolate critical loads from non-critical loads and the ability to island from the broader grid during the event of a larger disruption software and hardware to manage the deployment of hybrid systems) andor need for external hookups for temporary generators and boilers33
bull Failure in facility ventilation electrical and air conditioning systems Some systems designed to meet the requirements of past climate may overheat and fail during extreme events Some design interventions include34
Ǯ Selecting systems with higher heat tolerance Ǯ Adding Energy Recovery Ventilation systems Ǯ Providing additional or redundant ventilation systems either mechanical or
natural to cool electrical equipment Ǯ Optimizing building layout by
bull segregating temperature sensitive electronics and computer control system from other systems
bull placing heat generating equipment like transformers and switchgear outdoors where permitted and
bull splitting the facility cooling loads among different HVAC systems in facility for redundancy and better zone control
bull Passive solar cooling and ventilation There are numerous design features that provide passive solar cooling for buildings to help maintain lower internal ambient temperatures with less air conditioning These features also help keep facilities habitable during extended grid failures when generators fail or must be reserved for critical functions Some design features include35
Ǯ Appropriate east-west orientation Ǯ Passive ventilation design Ǯ Vertically stacked double skin facades Ǯ Exterior window shades Ǯ Light colored exteriors Ǯ Shaded arcades Ǯ Thermally massive materials Ǯ High performance glazing Ǯ Operable windows
32 To learn more see the Building Resiliency Task Force report from Urban Green Council (2013)33 Ibid 34 Flooded Bus Barns and Buckled Rails FTA Office of Budget and Policy 201135 These and other examples are found in McGregor et al (2013) Two Degrees The Built Environment and Our Changing Climate
Routledge Press Also see Flooded Bus Barns and Buckled Rails FTA Office of Budget and Policy 2011
NYC Mayorrsquos Office of Recovery and Resiliency Climate Resiliency Design Guidelines
15IIB INCREASING PRECIPITATION
B INCREASING PRECIPITATIONThe intensity and frequency of precipitation events are projected to increase with climate change creating new challenges for stormwater management and impacts to the built environment such as
bull The potential for greater frequency of stormwater management systems being overwhelmed36
bull More frequent and severe flooding of buildings and infrastructure in areas across the city and
bull Greater variability in rainfall events annually including the chance of drought
The goal for this section is to guide stormwater management approaches including infiltration increases in on-site storage volume and where possible increases in sewer capacity to account for precipitation increases associated with climate change Designers should develop and consider design interventions that would decrease site contribution to sewer in-flows beyond the existing NYC Building Code requirements Given its complexity the Department of Environmental Protection (DEP) is also evaluating climate impacts to the sewer system on a drainage-wide level Proactive design such as increasing on-site infiltration and storm water retention can contribute to system resiliency on a site-specific basis
BackgroundNYCrsquos drainage systems are designed to handle approximately the current 3-year intensity-duration-frequency (IDF) event in most areas of the city where sewers were built prior to 1970 In locations with sewers built after 1970 the capacity was built to handle the 5-year event NYCrsquos network of drainage systems can experience flooding above those thresholds due to widespread precipitation events or by localized intense storms (sometimes called ldquocloudburstsrdquo) causing flooding and backups Climate change projections indicate that flooding resulting from multiple types of precipitation events may increase in frequency This increasing probability is forecast for all types of precipitation events in NYC although there is greater uncertainty around future short duration events Relying on sewers alone to manage extreme precipitation events will not be sufficient in a changing climate The City plans to reduce impervious areas and provide additional storage capacity to reduce flood damage For managing stormwater from larger storms such as at the 50- and 100-year recurrence intervals DEP is increasingly considering the role of streets and open space in managing flow this is referred to as a dual drainage design approach The City is piloting projects to test this dual drainage approach
Another set of interventions include Bluebelt best management practices (BMPs) such as constructed wetlands storm water ponds and stream restorations that emulate pre-development conditions to manage large volumes of water and green infrastructure37 which in NYC have generally been designed to reduce flooding and combined sewer overflow respectively They are not typically sized to manage precipitation events of the same magnitude as sewers which serve as primary drainage conveyance However Bluebelt BMPs green infrastructure and other stormwater management tools may provide an additional buffer for larger storm events by temporarily storing andor infiltrating runoff that would otherwise be directed into the sewer system For instance areas of open space commonly found in NYC may not provide adequate environments for trees and other plantings However in these cases other types of green infrastructure like permeable surfaces and subsurface detention and retention installations would still be considered feasible
36 NYC is already taking steps to address this problem which will worsen with climate change To learn more about how NYC is using green and gray infrastructure to manage stormwater visit httpwwwnycgovhtmldephtmlstormwaterindexshtml
37 NYC DEP NYC Green Infrastructure Program
NYC Mayorrsquos Office of Recovery and Resiliency Climate Resiliency Design Guidelines
16IIB INCREASING PRECIPITATION
The City led by DEP continues to develop its options for managing heavier storm events due to climate change DEP is examining approaches to evaluate sea level rise and rainfall intensity for stormwater management and where possible sewer capacity These efforts will integrate forward-looking climate data into the design of these capital assets and the compounding factors of heavier rain storms and sea level rise will likely require greater infiltration and on-site storm water retention capacity Agencies and consultants should work directly with DEP to develop strategies on a given site necessary to meet expected increases in rainfall intensities and frequencies
1 Precipitation design adjustment for on-site stormwater systems
Based upon the design storm required for the City facility in design follow the steps below and review recommended design interventions
a) Identify the duration of the design event required The current 50-year IDF can be used as a proxy for the future 5-year storm
(projected for the 2080s) Design on-site detentionretention systems to retain the volume associated with the current 50-year IDF curve (see Figure 4 below) Design the on-site system to release at the maximum rate as specified in 15 Rules of the City of NY (RCNY) Chapter 3138
b) Conduct sensitivity analysis Compare the retentiondetention required for the current 5-year IDF versus the
38 Refer to existing codes and standards as well when determining the existing required storm as NYC requires different sizes of design storms for infrastructure and buildings For example NYC Plumbing Code Chapter 11 and Title 15 of the Rules of the City of New York Chapter 31
02
04
06
10
20
40
60
100
200
-2316090
Rai
nfal
l Int
ensi
ty (
inch
es p
er h
our
)
DurationsruoHsetuniM
5 10 15 30 1 2 3 6 12 18
5-yr
10-yr25-yr
50-yr
100-yr
NEW YORK NEW YORK
Figure 4 - Current Intensity-Duration-Frequency Precipitation Curve for NYC adapted from US Department of Commerce Weather Bureau Technical Paper 25
NYC Mayorrsquos Office of Recovery and Resiliency Climate Resiliency Design Guidelines
17IIB INCREASING PRECIPITATION
c) Identify design interventions for managing increased precipitation40 There are different ways to manage stormwater better and avoid urban flooding after
intense rain Choose the right combination of interventions after considering the site location operational requirements cost benefits and useful life of the intervention Some examples of design interventions are
bull Minimize increases in impervious surfacebull Utilize strategies that infiltrate evaporate or reuse rainwater to achieve storm
water volume reductions Then choose strategies that detain (delay drainage) to manage the rate of the storm water flow into the Cityrsquos drainage system
bull Install stormwater infiltration detention and storage (eg bioswales41 green roofs blue roofs and other blue or green infrastructure storage basins or tanks)
bull Protect areas below grade from floodingbull Keep catch basin grates clearbull When implementing perimeter protections ensure that interior water
management is also accounted for andbull Explore interventions to protect underground utility and telecommunications
infrastructure from water damage
d) Use appropriate DEP guidelines to perform the above tasks using the higher design storm
The three currently prescribed DEP guidelines are as follows
bull Guidelines for the Design and Construction of Stormwater Management Systems July 201242
bull Criteria for Detention Facility Design November 201243 bull DEP Site Connection Proposal Application and Guidelines44
Note on stormwater standards As DEP updates stormwater standards and develops specific tools to evaluate impacts of increased precipitation and drainage strategies for on-site storm water management these changes will be reflected in future versions of these Guidelines However it is recommended that the designer should develop and consider design interventions that would increase the on-site storage beyond the existing requirements Also a methodology is under development that will establish a consistent citywide process for addressing legal grade which will have further implications for how extreme precipitation is managed
39 NYC DEP Standards for Stormwater Release Rates available at httpwwwnycgovhtmldephtmlenvironmental_reviewsstormwater_release_ratesshtml 40 Also see DEP Guide to Rain Event Preparedness at httpwwwnycgovhtmldeppdfbrochuresflood-preparedness-flyerpdf and
Ready to Respond Strategies for Multifamily Building Resilience at httpwwwenterprisecommunityorgresourcesready-respond-strategies-multifamily-building-resilience-1335641 When siting bioswales consider groundwater levels and soil permeability and ensure that the site is not contaminated from past or
present land uses A high water table may prohibit some applications42 Available at httpwwwnycgovhtmldephtmlstormwaterstormwater_management_constructionshtml43 Available at httpwwwnycgovhtmldeppdfwater_sewer30_criteria_for_detention_facility_design_06062012pdf44 Available at httpwwwnycgovhtmldeppdfwater_sewer24pdf
current 50 year IDF to determine the cost and benefits associated with complying with these Guidelines Use the Evaluation of Project Benefits section below and Appendix 4 for guidance on how to identify and assess benefits Given the results of the costbenefit analyses review the added benefit of designing retentiondetention using greater magnitude storms (eg 100-year) or lower (eg 25-year) The goal is to maximize retentiondetention capacity given site and cost constraints as well as through an evaluation of the benefit of adding capacity to detainretain water for larger storm events
NYC Mayorrsquos Office of Recovery and Resiliency Climate Resiliency Design Guidelines
18
2 Incorporating climate change projections into DEP drainage planning
The first line of defense for managing intense precipitation events does not require changes to the sewer system as described above For drainage and wastewater infrastructure planning in a changing climate the sewer network and wastewater infrastructure should be qualitatively evaluated from the upstream pipes to the regulator chambers pump stations interceptors and ultimately to the downstream outfall to determine the feasibility of incorporating climate change projections into the system design For DEP storm sewer projects FY 2021 or later in separately sewered drainage areas where the design is in the early stages and there is free discharge the agency will evaluate the feasibility of revising the design to incorporate climate projections into the design If the project (including the prescribed changes) passes the costbenefit analysis then DEP will consider incorporating climate change projections into the sizing However changes in one part of the system must be carefully evaluated For example any upsizing of the regulator chamber or the high point of the system can negatively impact the design and operation of the wastewater infrastructure and residencesbusinesses on the system and can lead to a diminished the level of service
DEP is in the process of developing a hydrologic and hydraulic (HampH) model to estimate runoff flow for future climate scenarios and is evaluating rainfall hyetographs for the existing and future rainfall scenarios to be included in the drainage planning process In addition DEP currently coordinates with ORR for drainage planning as a part of coastal resiliency projects A more detailed methodology to incorporate climate change projections into drainage planning will be developed for version 30 of the Climate Resiliency Design Guidelines to be released in April 2019
IIB INCREASING PRECIPITATION
NYC Mayorrsquos Office of Recovery and Resiliency Climate Resiliency Design Guidelines
19IIC SEA LEVEL RISE
non-critical components within a larger facility or campus (eg at a maintenance yard differentiate between structures and equipment) Critical components essential to the facilityrsquos functionality should be protected to the higher standard for criticality even if the facility itself may be non-critical Some examples of critical components include electrical distribution and switching areas motor-control centers chemical feed equipment boilers communications systems monitoring and safety equipment HVAC units fire alarms and suppression equipment furnaces elevators emergency fuel supplies emergency generators and hazardous material storage Component protection should also be evaluated if a facility is expected to be fully operational during a flood event or if it is expected to quickly resume full operations after an event
For buildings and infrastructure with a long useful life it is not always cost effective or operationally feasible to design a facility to be resilient to hazards faced at the end of its useful life In these cases the most resilient design will be one that provides extra protection against hazards in the initial decades while also leaving open design alternatives for updating resiliency measures as new data is provided or new risk assessments are completed This flexible adaptation pathways approach builds in options to protect assets later in life as demonstrated in an example shown in Figure 1 (in Section I)
Other considerations to keep in mind includebull These Guidelines apply to all City capital projects except coastal flood protection
systems which are designed to different standards than those provided here for
C SEA LEVEL RISEThis section provides tools to 1) determine if the project will be subject to tidal inundation during its useful life due to sea level rise and 2) incorporate sea level rise into flood protection levels of capital projects For projects in the current and future 1 annual chance floodplains sea level rise-adjusted design flood elevations (DFE) are provided and reflect the criticality of the asset and its useful life Background NYC has experienced the devastation of coastal storms most recently during Hurricane Sandy Sea level rise is projected to increase the depth extent and frequency of flooding from storm surge45 Sea level rise will also regularly inundate some low-lying areas during high tides Current flood protection heights are determined by using the base flood elevation established by the FEMA Preliminary Flood Insurance Rate Map (PFIRM) 201546 and the standard of protection for buildings in the floodplain in Appendix G of the NYC Building Code47 These Guidelines augment existing requirements for two primary purposes ensuring City facilities built today incorporate sea level rise and critical assets (as defined in Table 4) are protected to a higher level It is important to note that all projects and design interventions must comply with NYC Building Code
Designers should differentiate between critical and
45 New York City Panel on Climate Change Report Chapter 2 Sea Level Rise and Coastal Storms (2015)46 However NYC Building code G10222 requires that designers review both the PFIRM and the effective FIRM and use the more
restrictive of the two 47 For information on the differences between FEMA FIRM PFIRM and the Cityrsquos forward-looking flood maps see Appendix 3
Critical components essential to the facilityrsquos functionality should be protected to the higher standard for criticality even if the facility itself is non-critical
NYC Mayorrsquos Office of Recovery and Resiliency Climate Resiliency Design Guidelines
20IIC SEA LEVEL RISE
buildings and other physical infrastructure Many of NYCrsquos coastal flood protection systems are currently being developed to comply with FEMA accreditation for flood levee systems48 The City plans to develop further guidance for designing coastal protection projects
bull For information on the differences between FEMA FIRM PFIRM and the Cityrsquos forward-looking flood maps see Appendix 3
bull Coincident stressors from sea level rise should also be considered For example bridge scour may increase as sea levels rise Similarly flooding during heavy rainfall events can be worsened due to higher tailwater conditions associated with high sea levels Be aware of how different risks may interact and how different interventions can be deployed to address multiple hazards or provide other co-benefits
bull Note projects that require discretionary approval are required to incorporate sea level rise projections as part of the NYC Waterfront Revitalization Program49 and
bull A methodology is under development that will establish a consistent citywide process for addressing legal grade which will have further implications for how sea level rise and precipitation are managed
For more information see Section IE Designers should use the resources and methods described in this section to 1) assess tidal inundation due to sea level rise and 2) address risks in the current and future floodplains
1 Assessing tidal inundation due to sea level riseTidal flooding currently affects parts of NYC and is projected to worsen as sea levels rise and inundate low-lying coastal sites during high tides When determining a site location or establishing scope of substantial improvements for other types of coastal facilities the project team will consider alternative sites outside of zones threatened with regular inundation if resiliency actions are not taken Some facilities such as wastewater treatment plants and harbor facilities need to be near the coast for operational purposes
a) Determine tidal inundation risk from sea level rise Use the Flood Hazard Mapper (httpwwwnycgovfloodhazardmapper)50 to see if your
site is in an area inundated from high tide plus sea level rise within the projectrsquos useful life For example if the useful life ends between 2040 and 2069 choose the 2050s High Tide map) Determine risk only from high tide and sea level rise separate from flood events Follow the instructions in Figure 5 and refer to the example in Figure 6 to review inundation at the end of an assetrsquos useful life
48 For more information please visit httpwwwfemagovfema-levee-resources-library49 For more information visit httpwwwnycgovwrp50 The Flood Hazard Mapper relies on publicly available data to present these map resources Users should also refer to FEMA and the
NPCC for official information
Figure 5 - Flood Hazard Mapper high tide plus sea level rise at httpwwwnycgovfloodhazardmapper
NYC Mayorrsquos Office of Recovery and Resiliency Climate Resiliency Design Guidelines
21IIC SEA LEVEL RISE
b) Address flood risk If the Flood Hazard Mapper shows that the facility is expected to be inundated by
high tides within its useful life or if primary access roads are at risk of inundation consider alternative site options
- OR - If the site is not expected to be regularly inundated by tides proceed to the next
section 2 Addressing Risks in the Current Floodplain
Note on calculating tidal inundations with sea level rise if a project team is interested in understanding the depth of tidal inundation given climate change projections follow these steps First determine the Mean Higher High Water (MHHW) elevation in feet-NAVD 8851 datum nearest to the site If the MHHW data is unavailable from a site specific survey refer to httpwwwnycgovwrp for a list of MHHW elevations (NAVD88) at tide stations across the city52 Second add the high estimate (90th percentile) of expected sea level rise (see Table 8 in Appendix 2) for the year corresponding to the facilityrsquos useful life to the MHHW to determine the projected depth of tidal inundation with sea level rise
51 North American Vertical Datum of 1988 (NAVD 88) is the vertical control datum of orthometric height established for vertical control surveying in the US based upon the General Adjustment of the North American Datum of 1988
httpswwwngsnoaagovdatumsvertical52 SLR elevations at httpwwwnycgovwrp are adjusted to account for sea level rise since the last tidal epoch If no other resource is
available to determine MHHW use the NOAA Online Vertical Datum Transformation tool to calculate the MHHW in feet-NAVD
Figure 6 - Flood Hazard Mapper with high tide in the 2020s (left) and in the 2080s (right) at httpwwwnycgovfloodhazardmapper
NYC Mayorrsquos Office of Recovery and Resiliency Climate Resiliency Design Guidelines
22IIC SEA LEVEL RISE
2 Addressing risks in the current floodplain53
A facility located in the current 1 annual chance floodplain (PFIRM 2015)54 will face increasing risk of flooding during its useful life due to sea level rise increasing the depth of coastal storms This section provides a process for adjusting the design flood elevation required by code to account for sea level rise
a) Find the location of the facility using the Flood Hazard Mapper (httpwwwnycgovfloodhazardmapper) and follow the instructions in Figure 7
bull Choose to view the layer ldquoFEMA Preliminary FIRM 2015rdquo bull Click on the facility site in the 1 floodplain to view the base flood elevation
Figure 7 - Flood Hazard Mapper with FEMA PFIRM (2015) at wwwnycgovfloodhazardmapper
b) If the facility is not in the current 1 annual chance floodplain (PFIRM 2015) proceed to the next section ldquo3 Addressing risks in the future floodplainrdquo
- OR - If the facility is in the current 1 annual chance floodplain (PFIRM 2015) note
the base flood elevation (BFE) and proceed to Step c) below Please note if a facility has multiple BFEs or if the site is partially in the 1 annual chance floodplain it is recommended to use the highest BFE as the current BFE for the entire site
c) Establish a sea level rise-adjusted DFE Use the current base flood elevation at your site the facilityrsquos useful life and its
criticality level to determine the design flood elevation using Table 4 (on the next page) as a basis of design
53 This process for adjusting the design flood elevation to account for sea level rise satisfies the criteria of the climate-informed science approach described at the state and federal level
54 FEMA updates its flood maps periodically As of April 2018 the most recent maps are the Preliminary Flood Insurance Rate Maps (PFIRM) available at DCPrsquos Flood Hazard Mapper (httpwwwnycgovfloodhazardmapper) Also note that NYC Building Code requires developers to use the PFIRM (2015) or the FIRM (2007) whichever is more restrictive For more information on these requirements please refer to Appendix G of the NYC Building Code Please note that the DCP maps are not official and all site locations should be confirmed with the official FEMA PFIRM NYC will provide information on the latest flood maps as they are updated
NYC Mayorrsquos Office of Recovery and Resiliency Climate Resiliency Design Guidelines
23IIC SEA LEVEL RISE
Table 4 - Determine the sea level rise-adjusted design flood elevation for critical and non-critical facilities55
Critical facilities
End of useful life Base Flood Elevation (BFE)56 in NAVD 88 + Freeboard57 + Sea Level Rise
Adjustment58= Design Flood Elevation (DFE) in
NAVD 88Through 2039 FEMA 1 (PFIRM) 24rdquo 6rdquo = FEMA 1 + 30rdquo
2040-2069 FEMA 1 (PFIRM) 24rdquo 16rdquo = FEMA 1 + 40rdquo2070-2099 FEMA 1 (PFIRM) 24rdquo 28rdquo = FEMA 1 + 52rdquo
2100+ FEMA 1 (PFIRM) 24rdquo 36rdquo = FEMA 1 + 60rdquoNon-critical facilities
End of useful life Base Flood Elevation (BFE) in NAVD 88 + Freeboard + Sea Level Rise
Adjustment = Design Flood Elevation (DFE) in
NAVD 88Through 2039 FEMA 1 (PFIRM) 12rdquo 6rdquo = FEMA 1 + 18rdquo
2040-2069 FEMA 1 (PFIRM) 12rdquo 16rdquo = FEMA 1 + 28rdquo2070-2099 FEMA 1 (PFIRM) 12rdquo 28rdquo = FEMA 1 + 40rdquo
2100+ FEMA 1 (PFIRM) 12rdquo 36rdquo = FEMA 1 + 48rdquoAdditional analysis should be conducted to incorporate wave action and wave run-up in DFE calculations especially in areas that are located within the FEMArsquos 1 annual chance Limit of Moderate Wave Action (LiMWA) zone Wave run up is the maximum vertical extent of wave uprush above surge
Definition of critical buildings and infrastructure for determining DFE in Table 4The criticality definitions below are for use in the application of the Guidelines only All items identified as critical in NYC Building Code Appendix G are critical in these guidelines however this list includes additional facilities that are not listed in Appendix G59 If a facility is not listed here it is considered non-critical for the purposes of determining freeboard
bull Hospitals and health care facilitiesbull Fire rescue ambulance and police stations and emergency vehicle garages bull Jails correctional facilities and detention facilities bull Facilities used in emergency response including emergency shelters emergency preparedness communication
operation centers communication towers electrical substations back-up generators fuel or water storage tanks power generating stations and other public utility facilities
bull Critical aviation facilities such as control towers air traffic control centers and hangars for aircraft used in emergency response
bull Major food distribution centers (with an annual expected volume of greater than 170000000 pounds)60 bull Buildings and other structures that manufacture process handle store dispose or use toxic or explosive
substances where the quantity of the material exceeds a threshold quantity established by the authority having jurisdiction and is sufficient to pose a threat to the public if released61
bull Infrastructure in transportation telecommunications or power networks including bridges tunnels (vehicular and rail) traffic signals (and other right of way elements including street lights and utilities) power transmission facilities substations circuit breaker houses city gate stations arterial roadways telecommunications central offices switching facilities etc
bull Ventilation buildings and fan plantsbull Operations centersbull Pumping stations (sanitary and stormwater)bull Train and transit maintenance yards and shopsbull Wastewater treatment plantsbull Water supply infrastructurebull Combined-sewer overflow (CSO) retention tanksbull Fueling stationsbull Waste transfer stations and bull Facilities where residents have limited mobility or ability including care facilities and nursing homes
55 If an industry standard does not include freeboard in its flood protection standards for particular infrastructure assets then only consider the sea level rise adjustment when determining flood protection levels
56 Note that NYC Building Code requires developers to use the PFIRM (2015) or the FIRM (2007) whichever is more restrictive For more information on these requirements please refer to Appendix G of the NYC Building Code
57 These freeboard values reflect NYC Building Code Appendix G Table 2-1 which establishes the minimum elevation of the top of lowest floor Appendix G requires other freeboard values for other parts of structures and in different parts of the floodplain Refer to Appendix G for the appropriate freeboard and use that value in Table 4 above
58 The sea level rise figures provided are for the middle of the 25th-75th percentile range projections from the NPCC These values do not necessarily indicate the average of all models
59 The structural occupancy categories outlined in Appendix G of the NYC Building Code are the same as ASCE 7 used for structural design For critical buildings structural design should comply with ASCE 7 and 24 for design class IV
60 This threshold represents the median volume of main food distributors in NYC according to statistics collected as part of the Five Borough Food Flow study in 2016 available at
httpswwwnycedccomsystemfilesfilesresource2016_food_supply-resiliency_study_resultspdf 61 The threshold quantity for hazardous materials is established by Chapter 7 of Title 24 of the NYC Administrative Code
NYC Mayorrsquos Office of Recovery and Resiliency Climate Resiliency Design Guidelines
24IIC SEA LEVEL RISE
Figure 9 ndash Outdoor emergency generator for the critical building
This case study provides an example of how to calculate a sea level rise-adjusted DFE based on the useful life of a hypothetical critical services building and its primary component
Step 1 Organize the site by various critical or primary components and their year of construction Determine their useful life along with the associated future year scenario for flood risk assessment In this example the building structure and the outside emergency generator are the most at-risk components from combined sea level rise and coastal storm surge
Step 2 Overlay the site footprint area over the effective current PFIRM or FIRM and the corresponding future year scenario FEMA 1 to identify flood risk to the site From overlaying the 2015 preliminary FEMA floodplain over the site it was determined that the site has a 1 annual chance of flooding with a base flood elevation of 13rsquo NAVD Step 3 Evaluate the criticality of each primary component of the facility based on the Guidelinesrsquo definition for critical infrastructure (Table 4) This (hypothetical) building is critical
Step 4 Use Table 4 to determine the sea level rise adjustment and freeboard requirements for each component and calculate the DFE for each that corresponds to its useful life period
Step 5 Compare the DFE of each component and the associated Guidelinesrsquo recommended DFE to calculate anticipated flood depth
CASE STUDY Adjusting the DFE for Sea Level Rise
Table 5 ndash Example of how to calculate a sea level rise-adjusted DFE for a critical facility
Construction year Components Useful
Life
Future Year Scenario
[Useful Life + Const
Year]
BFE in NAVD
88 (feet)
Freeboard + Sea
Level Rise Adjustment
(feet)
Adjusted DFE in
NAVD 88 (feet)
2010 Building Structure
70 years 2070-2099 130rsquo 2rsquo+23rsquo 173rsquo
2010Outdoor
Emergency Generator
25 years
Through 2039 130rsquo 2rsquo+05rsquo 155rsquo
Figure 8 - Example of how to locate a facility within the current floodplain and determine the BFE Figure 9 (inset) - Outdoor emergency generator at the facility
Figure 10 - This schematic shows how to determine the design flood elevation of a facility within the current 1 floodplain
Illustrative not to scale
NYC Mayorrsquos Office of Recovery and Resiliency Climate Resiliency Design Guidelines
25IIC SEA LEVEL RISE
Figure 11 - Flood Hazard Mapper with future 1 annual chance floodplain (adjusted for sea level rise) at httpwwwnycgovfloodhazardmapper
b) If the site is not in the future floodplain no flood protection is required for this facility
- OR - If the site is in the future floodplain identify the nearest adjacent base flood
elevation at the project site in the current 1 annual chance floodplain (PFIRM 2015) using the Flood Hazard Mapper62
c) Use Table 4 to determine the DFE Add freeboard and the sea level rise-adjustment to the nearest adjacent BFE on the
current 1 annual chance floodplain (PFIRM 2015) to determine the DFE
d) Apply the DFE calculation from Table 4 to the protected facility See Figures 12 and 13 for an illustration of how to calculate the DFE
62 Maps of future floodplains show the impacts of sea level rise alone and do not consider how changes in stormsrsquo climatology might also affect wave action and the full extent of the floodplain
3 Addressing risks in the future floodplainIf the facility is not in the current 1 annual chance floodplain (PFIRM 2015) it may still be at risk in the future from flooding as sea level rise increases the extent of the floodplain Follow the steps below to determine if your facility is located in the future floodplain and if so what sea level rise-adjusted DFE to use
a) Use the Flood Hazard Mapper (httpwwwnycgovfloodhazardmapper) to determine if the facility site will be in the future 1 annual chance floodplain
Assess if by the end of the facilityrsquos useful life the floodplain is projected to increase to encompass all or part of the project site For example if the useful life ends between 2040 and 2069 choose the 2050s floodplain map Refer to the steps in Figure 11 below
NYC Mayorrsquos Office of Recovery and Resiliency Climate Resiliency Design Guidelines
26IIC SEA LEVEL RISE
Figure 12 - This schematic map shows how to locate the nearest adjacent 1 floodplain elevation
Figure 13 -This schematic shows how to determine the design flood elevation of a facility that is outside of the current 1 floodplain
CASE STUDY Identifying a Base Flood Elevation (BFE) in the Future Floodplain
Illustrative not to scale
NYC Mayorrsquos Office of Recovery and Resiliency Climate Resiliency Design Guidelines
27IIC SEA LEVEL RISE
4 Identify appropriate design interventions
63 Additional resources for identifying adaptive strategies Urban Waterfront Adaptive Strategies (NYC Department of City Planning httpswww1nycgovassetsplanningdownloadpdfplans-studiessustainable-communitiesclimate-resilienceurban_waterfrontpdf Floodproofing Non-Residential Buildings (FEMA) at httpswwwfemagovmedia-libraryassetsdocuments34270 Ready to Respond Strategies for Multifamily Building Resilience (Enterprise Green Community) at
httpwwwenterprisecommunityorgresourcesready-respond-strategies-multifamily-building-resilience-1335664 While natural systems-based approaches ameliorate flooding their use for storm surge or wave mitigation would need to be quantified
before contributing towards the design flood elevation 65 For more information see FEMArsquos Floodproofing Non-Residential Buildings at httpswwwfemagovmedia-libraryassetsdocuments34270
Operational requirements and continuity plans can inform the selection of appropriate design interventions particularly in terms of how quickly a site needs to be up and running after a flood event Some examples of how functional uses can pair with interventions include
bull A facility that needs to be operating during or immediately after a flood event may need to be dry floodproofed using permanent barriers or designed for passive survivability (such as a police or fire station)
bull A facility that needs to recover quickly after an event could elevate prioritized equipment and have deployable barriers
bull A site that can recover over a longer duration of time could be temporarily inundated during an event (such as parks or plazas) The use of resilient materials and strategies can reduce costly damage caused by temporary inundation
Different design interventions should be chosen based on the specific operational requirements of the project however these must meet the ASCE 24 design requirements for Coastal VE Zones
For all projects at risk of current or future flooding select protections that meet the projectrsquos design flood elevation Consider project-specific factors including the site location operational requirements existing continuity planning and cost63 A Design Strategies Checklist in Appendix 6 is available for use as a resource to track possible design approaches Some examples of design alternatives are
bull Site relocation where feasible conduct alternative site analysis
bull Permanent barriers at a site (eg floodwalls)
bull Deployable flood barriers (eg stop logs flood doorsgates inflatable barriers)
bull Natural systems-based approaches (eg living shorelines restored wetlands)64
bull Prioritized protection of electrical mechanical and other critical or costly-to-replace equipment above the design flood elevation (eg motors and controller boilers and furnaces fuel storage tanks duct work alarm systems and suppression equipment electrical panels electrical distribution and switching areas gas and electric meters telecommunications equipment chemical feed equipment HVAC units and emergency generators)65
bull Dry floodproofing design a facility to prevent water from entering
bull Wet floodproofing design a facility to permit floodwaters to flow in and out of the structure without causing significant damage (eg elevate or protect critical equipment use water-resistant building materials below the design flood elevation include flood vents and pumps)
bull Design redundant telecommunications conduit entrances for multiple carrier entry Telecom conduit should run to diverse manholes when possible
bull Install backup power for telecom equipment with design consideration for such equipment (eg installation above DFE)
bull Install outdoor-rated disconnect switch for telecommunications equipment on the roofbull Explore interventions to protect underground utilities and other telecommunications
facilities from water damagebull Install backflow preventers backwater valves and sump pumps for all buildings and
infrastructure in the floodplain as well as behind flood barriersbull Shoreline improvements that reduce the height of waves or attenuate waves where
feasible
NYC Mayorrsquos Office of Recovery and Resiliency Climate Resiliency Design Guidelines
28IIIA GENERAL METHODOLOGY TO ESTIMATE PROJECT BENEFITSIIIB CATEGORIES OF PROJECT BENEFITS
Designing and constructing facilities to handle the future climate loads above the current NYC codes and standards based on projected useful life of the components provides resiliency benefits The incremental costs to implement the Guidelinesrsquo recommended design interventions should be compared with the incremental benefits to aid agencies in making decisions about resilient design strategies The project design team should evaluate benefits of the interventions designed to meet Guidelinesrsquo recommended criteria for all the climate stressors qualitatively andor quantitatively For projects with construction costs below $50 million the project design team is recommended to perform a qualitative benefits assessment on the interventions that meet the Guidelinesrsquo recommendations for all applicable climate stressors For critical facilities or projects with construction costs over $50 million the project design team is recommended to perform quantitative benefit calculations to identify the optimal interventions that meet Guidelinesrsquo recommended design criteria
A GENERAL METHODOLOGY TO ESTIMATE PROJECT BENEFITSThis general methodology to perform qualitative and quantitative benefit calculations is recommended for use by project design teams at the beginning of and during the design process This methodology enables estimation of project benefits for a high-level benefit-cost analysis (BCA) that can be applied to evaluate and compare resiliency features designed to address sea level rise with coastal storm surge increased precipitation and extreme heat events The type of benefits provided by interventions designed to meet the Guidelinesrsquo design criteria can vary by climate stressors and typology of the facilities The main guiding principle in development of the high-level BCA methodologies included in these Guidelines was to balance simplicity with accuracy The project benefits categories identified within the methodology may not cover all the potential benefits provided by every facility type within NYC In particular the benefits of planning for increased precipitation are difficult to quantify Hence the project design team should use their discretion to modify this general benefit calculation methodology as needed to meet their project goals and objectives The project design team should develop appropriate input data whether quantitative or qualitative needed to estimate project benefits
B CATEGORIES OF PROJECT BENEFITSThere are three types of project benefit categories - direct benefits indirect benefits and other benefits - that can be used to perform qualitative assessments and develop quantitative estimates of monetary benefits for intervention alternatives designed to meet the Guidelinesrsquo recommendations These project benefit categories will help to perform a high-level benefit-cost analysis that balances accuracy with an appropriate level of effort
bull Direct Benefits include reduced or avoided physical damages to facilities and contents reduced or avoided displacements for residential structures and reduced life cycle or OampM costs that can be quantified as a primary result of implementing a specific hazard mitigation measure Table 12 in Appendix 4 provides a list of direct benefits and basic guidance on estimating and documenting values for sea level rise and increased precipitation-related flood hazards Note that given the current state of practice it is not possible to quantify reduced or avoided physical damages or residential displacements that result from a specific extreme heat mitigation measures Therefore direct benefits applicable to extreme heat hazards are limited to reduced life cycle costs applicable to certain measures such as green roofs Refer to Table 15 for details on direct benefits for extreme heat hazards
III EVALUATION OF PROJECT BENEFITS
NYC Mayorrsquos Office of Recovery and Resiliency Climate Resiliency Design Guidelines
29IIIB CATEGORIES OF PROJECT BENEFITS
bull Indirect Benefits include reduced or avoided service losses for non-residential
buildings public facilities andor infrastructure (utilities roads and bridges) based on the value of service continuity andor emergency services to New Yorkers that can be quantified as a secondary result of implementing a specific hazard mitigation measure Table 13 in Appendix 4 provides a list of indirect benefits and basic guidance on estimating and documenting values for sea level rise and increased precipitation-related flood hazards Note that given the current state of practice on extreme heat it is not possible to quantify reduced or avoided service losses that result from a specific extreme heat mitigation measures Therefore indirect benefits applicable to extreme heat hazards are limited to reduced energy costs such as cool roofs green roofs or shade trees Refer to Table 15 in Appendix 4 for details on indirect benefits for extreme heat hazards
bull Other Benefits where applicable other potential benefits may include social benefits for residents such as avoided stress and anxiety avoided lost productivity environmentalecosystem service benefits avoided need for emergency services and other potential benefits that can be estimated as a result of implementing a specific hazard mitigation measure Table 14 in Appendix 4 provides a list of other potential benefits and basic guidance on estimating and documenting values for sea level rise and increased precipitation-related flood hazards
Note on the ecosystem service benefit category in Table 14 the stormwater management benefits of green infrastructure should be distributed between the extreme heat and increased precipitation hazards since these measures provide both significant reductions in rainfall runoff as well as Urban Heat Island mitigation through evapotranspiration However there is currently limited data available to quantify the actual distribution of stormwater management benefits between the two hazards For various dual-benefit providing interventions careful considerations should be given to identify the appropriate benefits category provided by the intervention with a goal to avoid duplication of quantified benefits In this methodology the stormwater management benefits of green infrastructure are applied to the increased precipitation hazard in order to avoid a duplication of benefits Note on real estate and quality of life benefits additionally it is important to note that two potential benefit categories shown in Table 14 - real estate and quality of lifehealthavoided casualties - were not included in the current BCA methodology for sea level rise or increased precipitation hazards Although these categories could increase project benefits for sea level rise and increased precipitation hazards they were only applied to measures that address extreme heat hazards such as green roofs trees and other plantings Refer to Table 15 for a detailed summary of other benefit categories quantified as unit benefits for extreme heat hazards
NYC Mayorrsquos Office of Recovery and Resiliency Climate Resiliency Design Guidelines
30IIIC WHICH METHODOLOGY TO USEIIID BCA METHODOLOGY FOR PROJECTS UNDER $50 MILLION
D BCA methodology for projects under $50 millionThe project design team should develop design alternatives to meet the Guidelinesrsquo criteria which may be in excess of NYC code and standards requirements (baseline conditions) It is assumed that the project design team will develop alternatives to address each of the following applicable climate stressors - sea level risecoastal storm surge increased precipitation and extreme heat - separately Tables 12-15 in Appendix 4 provides a list of typical direct indirect and other benefits provided by various intervention typologies to reduce impacts from climate stressors During the qualitative assessment the project design team should consider that intervention strategies will have varying levels of reliability effectiveness benefits and cost implications during the qualitative assessment
The project design team is recommended to develop appropriate evaluation criteria and metrics for each of the applicable project benefit categories For each alternative the project design team could use either a scoring weighting ranking or other type of qualitative assessment framework to assess each applicable project benefit categories with the developed evaluation criteria and metrics Table 6 provides an example template to evaluate alternatives using a set of general evaluation criteria and metrics using a color-coded rating system (and see Table 7 for an example of how to complete the template) The project design team can utilize a similar template customized to their project goals and objectives This assessment allows agencies to screen the qualitative benefits for various alternatives that would then lead to development of final project components to match the available budget and goals of the project
Projects with total costs below $50 million recommended to conduct a qualitative assessment to identify the optimal interventions that meet Guidelinesrsquo design criteria using the ldquoD) BCA methodology for projects under $50 millionrdquo methodology below
C WHICH METHODOLOGY TO USEProjects with a total cost above $50 million or are highly complex or critical facilities recommended to conduct both a qualitative and quantitative benefit calculation to identify the optimal interventions that meet Guidelinersquos design criteria using the ldquoE) BCA methodology for projects above $50 millionrdquo below A quantitative BCA also must include qualitative factors
NYC Mayorrsquos Office of Recovery and Resiliency Climate Resiliency Design Guidelines
31IIID BCA METHODOLOGY FOR PROJECTS UNDER $50 MILLION
Qualitative Color Scale Green=Least resource intensive alternative Purple=most resource intensive yellow=medium level of resource intensity
Qualitative Evaluation Factors Description Relative Color Rating System
First CostsAdditional construction costs needed to incorporate Guidelinesrsquo recommended resilient design over the baseline project costs
Highest cost ($$$) rated as Purple whereas lowest cost ($) rated as Green
ConstructabilityEase of Implementation
Construction techniques and site conditions such as presence of major utilities conflicts and other conditions which dictate the level of constructability required for each alternative
Difficult to construct rated as Purple whereas easiest to construct rated as Green
Environmental ImpactsCo-BenefitsPermitting
Impacts to the built and natural environment such as circulation noise and hazardous waste plus the level of effort required for permitting (eg interventions in water require highest level of permitting requirement) from each alternative in addition to the baseline project condition
Highest environmental impacts and highest level of effort required for permitting rated as Purple whereas the least impact and level of effort rated as Green
Operation and Maintenance (OampM)
Level of effort of additional manpower and cost of OampM for the alternatives over the baseline project OampM requirements
Highest level of effort and cost for OampM rated as Purple whereas the lowest is rated as Green
Reliability and Durability
Interventions that do not require human involvement or a facilityrsquos ability to withstand all the forces during a storm event (eg permanent solutions with higher reliability than deployable solution)
Interventions requiring human involvement (active measures) rated as Purple whereas interventions with minimal or no human involvement (passive measures) rated as Green
Risk Reduction Benefits Monetary benefits provided by each intervention alternative in avoided damages over the baseline condition
Lowest potential monetary benefit rated as Purple whereas as highest potential monetary benefit rated as Green
Quality of Life BenefitsVisual Aesthetics
Benefits either to the community such as recreation or safety or serve the community during emergency situations
Lowest potential quality of life benefits rated as Purple whereas as highest potential benefits rated as Green
Table 6 ndash Evaluation matrix for comparison of mitigation alternatives across the useful life of a project
Project title_______________________________________________________________________________
Evaluation Criteria
Baseline Condition (Designed to NYC Building Code and
Standards)
Resilient Design Alternatives for Managing__________________
Alternative 1
Alternative 2
Alternative 3
First Costs
ConstructabilityEase of ImplementationEnvironmental ImpactsCo-BenefitsPermitting
Operation and Maintenance (OampM)
Reliability and Durability
Risk Reduction Benefits
Quality of Life BenefitsVisual Aesthetics
NYC Mayorrsquos Office of Recovery and Resiliency Climate Resiliency Design Guidelines
32IIID BCA METHODOLOGY FOR PROJECTS UNDER $50 MILLION
Table 7 ndash Evaluation matrix for comparison of mitigation alternatives across the useful life of a project - COMPLETED EXAMPLE
Evaluation Criteria
Baseline Condition (Designed to NYC Building Code and
Standards)
Resilient Design Alternatives for Managing Coastal SurgeSLR
Alternative 1Flood proof building built on grade to Guidelines
DFE
Alternative 2 Elevate building structure above Guidelinesrsquo DFE
on columns
Alternative 3 Raise site grade by filing the building site footprint
to Guidelinesrsquo DFE
First CostsBaseline cost for building structure is $15 million
Incremental costs are within 5 over the baseline costs
Incremental costs are between 5-10 over baseline costs
Incremental costs are 20 and more over baseline costs
ConstructabilityEase of Implementation
Relatively easy to construct within site constraints
Similar to baseline conditions since construction requires additional flood proofing only
Moderate challenges to construct foundation structure for columns within site constraints
Extremely challenging to construct within the site constraints Potentially fatal flaw
Environmental ImpactsCo-BenefitsPermitting
No major impacts but may require additional effort to obtain DOB permits with flood proofing and deployable systems
No major impacts but may require additional effort to obtain DOB permits with flood proofing and deployable systems
No major impacts and relatively easy to permit
Potential drainage circulation impacts and challenges to obtain clean fill material for the site
Operation and Maintenance (OampM)
Major OampM costs associated with deployable systems
Major OampM costs associated with deployable systems
Moderate OampM costs associated with proposed elevator for access
Minimal OampM costs since deployable and elevators not required
Reliability and Durability
Least reliability with highest potential risk from flooding during to failure of deployable systems
Least reliability with highest potential risk from flooding during to failure of deployable systems
Moderate reliability with potential risk from flooding limited to elevator shaft only
Highest reliability since deployable are not required to protect building from flooding
Risk Reduction Benefits
Maximum flood risk reduction benefits assuming deployable and flood proofing is effective
Maximum flood risk reduction benefits assuming deployable and flood proofing is effective
Maximum flood risk reduction benefits
Maximum flood risk reduction benefits
Quality of Life BenefitsVisual Aesthetics
Facility may not be operational during the storm event
Facility may not be operational during the storm event
Facility can be potentially operational during the storm event
Facility can be potentially operational during the storm event
Qualitative Color Scale Green=Least resource intensive alternative Purple=most resource intensive yellow=medium level of resource intensity
A new non-critical facility with a building structure is proposed on a site that is currently in the 2015 Preliminary FEMA 1 annual chance floodplain with a BFE of 10rsquo (NAVD 88) The baseline conditions DFE to meet existing NYC codes and standards is 11rsquo (NAVD 88) Using the Guidelines recommended design criteria the facilityrsquos DFE is 133rsquo (NAVD 88) and existing grade is around 6rsquo (NAVD 88) The project design team develops three alternatives to meet the Guidelinesrsquo recommended DFE design for the facility Table 7 offers an example of how a qualitative assessment can be used to compare three resilient design alternatives using the evaluation criteria and metrics
CASE STUDY Example of How to Use the Evaluation Matrix
NYC Mayorrsquos Office of Recovery and Resiliency Climate Resiliency Design Guidelines
33IIIE BCA METHODOLOGY FOR PROJECTS OVER $50 MILLION
E BCA methodology for projects over $50 millionIn order for a project to be considered cost-effective a benefit-cost analysis (BCA) assesses if the benefits of a project outweigh its costs or in other words the benefit-cost ratio (BCR) is greater than 10 as illustrated in Equation 1
Equation 1 Benefit-Cost Ratio Formula
BCR =
Where BCR = Benefit-Cost Ratio
BENEFITS = Total project benefits
COSTS = Total project costs
BENEFITSCOSTS
These estimated project benefits are combined with the project costs which are defined as the differential construction and long-term operation and maintenance costs associated with constructing a proposed project to the Guidelinesrsquo recommended design level It is assumed that the baseline project will be designed to the most prevalent NYC codes and standards This benefit methodology should be used to determine the additional project benefit that the Guidelinesrsquo recommended design would provide over the baseline project benefit It is assumed that the project design team will develop alternatives to address each of the following applicable climate stressors - sea level risecoastal storm surge increased precipitation and extreme heat - separately For each alternative the project design team should use the following steps to determine the Benefit-Cost Ratio (BCR)
a) Determine project useful life for design interventions Determining the useful life of the proposed project is an important first step in the
detailed BCA assessment methodologies for two reasons First the project useful life determines what values must be used from the Guidelines to establish the future climate design conditions The various hazard tables in the Guidelines establish design requirements based on useful life ranges through 2039 2040-2069 2070-2099 and 2100+ (2100+ projections are only available for sea level rise) A review of these tables show that the design requirements needed to meet the projected climate hazards increase as the end of useful life range increases Second the useful life determines how long the project will need to be operated and maintained in order to remain technically sound and effective at reducing future damages and losses
b) Determine discount rate for project benefits calculation The cost-effectiveness of projects assessed using the BCR must be done on a net
present value basis meaning the present value of the benefits is compared to the present value of the costs Most project costs are computed for present value based on current cost estimates bids or cost guidance However project benefits - as well as project costs for operation and maintenance - accrue over time into the future and are computed on an annualized basis To address this issue the Present Value Coefficient (PVC) is used to bring these annualized project benefits and OampM costs into the present value As indicated by the formula in Equation 2 the PVC is a function of the Project Useful Life (PUL) and the Discount Rate (DR)
NYC Mayorrsquos Office of Recovery and Resiliency Climate Resiliency Design Guidelines
34
Equation 2 Present Value Coefficient (PVC) Formula
PVC =
Where PVC = Present Value Coefficient
PUL = BCA Project Useful Life based on project type
DR = Discount Rate
The project design team should coordinate with agencies and NYC OMB if needed to determine appropriate discount rates based on funding source project type and other factors This coordination should take place during project initiation phase where total project costs (design and construction) are over $50 million66
c) Develop input data to perform benefit calculations Tables 16 and 17 in Appendix 4 provide a list of typical input data by each climate
stressor needed to perform benefit analysis quantitatively on variety of facilities67 The project design team should use these tables as a reference to identify appropriate input data categories andor additional input data needed to perform benefit analysis on the project
d) Identify applicable project benefit categories to estimate benefits Tables 16 and 17 in Appendix 4 provide a list of typical project benefits by each climate
stressor needed to perform benefit analysis quantitatively on various types of projects The project design team should use these tables as a reference to identify appropriate project benefit categories for each climate stressor to perform benefit analysis on the project
e) Calculate benefits of recommended design interventions for each climate
stressor The input data and applicable project benefits can be assembled along with
incremental project cost data to analyze cost-effectiveness using the FEMA BCA Tool Damage-Frequency Assessment (DFA) module or similar software This analysis will provide a BCR for each alternative which can then be used to compare the alternatives that were developed to mitigate effects from applicable climate stressors The project design team can then use the results from this analysis to identify optimal interventions that provides a balanced solution that provides resiliency benefits within the available project budget
IIIE BCA METHODOLOGY FOR PROJECTS OVER $50 MILLION
[1 ndash (1 + DR) -(PUL)]DR
66 For example a NYC OMB March 2015 memorandum recommends using an annually updated DR as published each year in Appendix C of OMB Circular A-94 The current OMB-recommended discount rates from OMB A-94 Appendix C vary by project useful life and are as follows 21 DR for useful lives of 10 to 19 years 25 DR for useful lives of 20 to 29 years and 28 DR for useful lives of 30 years or greater By contrast FEMA hazard mitigation grants use a DR of 70 for all projects based on the Federal OMB A-94 rate for federally-funded mitigation measures Since these DRs will impact the PVC and the project benefits the project team must ensure that BCA results prepared using an OMB-recommended DR (21 to 28) be updated to reflect the Federal DR (70) when applying for FEMA mitigation grant funds
67 Note the data requirements for the sea level rise and increased precipitation hazards in Table 16 are more detailed than the requirements for the extreme heat hazards due to the less detailed level of analysis available for extreme heat
NYC Mayorrsquos Office of Recovery and Resiliency Climate Resiliency Design Guidelines
35
APPENDICES
NYC Mayorrsquos Office of Recovery and Resiliency Climate Resiliency Design Guidelines
36APPENDIX 1 ndash KEY TERMS
100-year flood (1 annual chance flood)
A flood that has a 1 probability of occurring in any given year The 100-year floodplain is the extent of the area of a flood that has a 1 chance of occurring or being exceeded in any given year
500-year flood (02 annual chance flood)
A flood that has a 02 probability of occurring in any given year The 500-year floodplain is the extent of the area of a flood that has a 02 chance of occurring or being exceeded in any given year
AdaptationAdjustment in natural or human systems to a new or changing environment that seeks to maximize beneficial opportunities or moderate negative effects Successful adaptations contribute to resiliency
Base flood elevation (BFE)The elevation of surface water resulting from a flood that has a 1 annual chance of occurring or being exceeded in any given year The BFE is shown on the Flood Insurance Rate Map (FIRM)69
BluebeltReference to the Department of Environmental Protectionrsquos (DEP) Bluebelt program to preserve natural drainage corridors including streams ponds and other wetland areas Preservation of these wetland systems allows them to perform their functions of conveying storing and filtering storm water
Climate
The average weather (or more rigorously a statistical description of the average in terms of the mean and variability) over a period of time usually 30 years These quantities are most often surface variables such as temperature precipitation and wind Climate in a wider sense is the state including a statistical description of the climate system70
Climate change
Changes in average weather conditions that persist over multiple decades or longer Climate change encompasses both increases and decreases in temperature as well as shifts in precipitation changing risk of certain types of severe weather events and changes to other variables of the climate system
Climate change riskThe chance that investments (such as in capital projects) can be affected by the physical impacts of climate change71 Risks are evaluated as a product of the probability of occurrence and the magnitude of damages or impacts including socioeconomic factors that would result if they did occur (consequences)
Climate change risk assessment
This assessment involves a detailed project-specific analysis that includes a vulnerability and risk assessment often followed by cost-benefit analysis to assess and select investments in climate change risk mitigation Risk is assessed as a function of the magnitude and probability of a given climate change hazard Examples resources are included in Appendix 7
Climate vulnerabilityThe degree to which systems and populations are affected by adverse impacts It is a function of the character magnitude and rate of climate change and variation to which a system is exposed its sensitivity and its adaptive capacity72
Cloudburst An extreme amount of rain in a short period of time often over a small geographic area73
Cooling Degree Day (CDD) A form of degree-day used to estimate the energy requirements for air conditioning or refrigeration when the daily mean temperature is above 65degF
68 All terms are from the US Global Change Research Program (USGCRP) glossary unless otherwise noted The USGCRP glossary is available at httpwwwglobalchangegovclimate-changeglossary
69 ldquoDefinitionsrdquo FEMA last modified March 1 2017 httpswwwfemagovnational-flood-insurance-programdefinitions70 UKCIP Glossary httpwwwukciporgukglossary71 ldquoAccount for Climate Riskrdquo International Finance Corporation 72 UKCIP Glossary httpwwwukciporgukglossary73 New York City Environmental Protection ldquoCloudburst Resiliency Planning Studyrdquo 2017 Available at httpwwwnycgovhtmldeppdfclimatenyc-cloudburst-studypdf
APPENDIX 1 - KEY TERMS68
NYC Mayorrsquos Office of Recovery and Resiliency Climate Resiliency Design Guidelines
37APPENDIX 1 ndash KEY TERMS
Design life The life expectancy of an asset or product as determined during design74 As opposed to useful life (see below)
Dry Bulb temperature The ambient air temperature measured by a thermometer
Extreme eventUnexpected unusual or unpredictable weather or flooding compared to historical or future projected distribution Extreme events include for example heat waves cold waves heavy rains periods of drought and flooding and severe storms
Facilities For the purposes of this document ldquofacilitiesrdquo refers to all types of buildings housing infrastructure structures and landscape features designed by or for the City of New York
Flexible adaptation pathwayResilience-building strategies that can evolve or be adapted over time as climate change risk assessments evaluations of adaptation strategies and monitoring continue75
Flood Insurance Rate Maps (FIRM)
Official flood map of a community on which FEMA has delineated the 1 annual chance floodplain and the base flood elevations (BFEs) applicable to the community76 The FIRM also includes the 02 floodplain annual chance floodplain and differentiates between special flood hazard areas (V A Coast A zones) and floodways The official FIRM is from the year 2007 while the 2015 PFIRM is currently required by NYC Building Code to calculate design flood elevations NYC DOB references the more restrictive of the two maps in both base flood elevation and flood hazard area (ie V versus A zone) Refer to Appendix 3 for more information
FreeboardAn additional amount of height above the base flood elevation used as a factor of safety (eg two feet above the base flood) in determining the level at which a facilitys lowest floor must be elevated or floodproofed to be in accordance with state or community floodplain management regulations77
Future time slices
Future periods defined by the NPCC for when climate change projections are available In this document the following decadal projections are associated with specific time spans2020s projection = present to 20392050s projection = 2040 to 20592080s projection = 2070 to 20992100s projection = end of century and beyond
Green infrastructureAn array of practices that use or mimic natural systems to manage urban stormwater runoff Water is either directed to engineered systems for infiltration or detained for longer periods before it enters the sewer system
Heat Vulnerability Index (HVI)Summarizes relative risk of adverse health effects from heat due to social and environmental factors Used to identify neighborhoods at higher risk during and after extreme heat events
Heat wave A period of three consecutive days where temperatures rise above 90degF or two consecutive days over 95 degrees78
New York City Panel on Climate Change (NPCC)
The body of leading climate and social scientists charged with making climate change projections for the metropolitan region79
74 Sustainable Infrastructure Management Program Learning Environment httpsimplewerforg 75 Rosenzweig C et al Climate Change Adaptation in New York City Building a Risk Management Response76 ldquoDefinitionsrdquo FEMA77 Ibid78 Horton R et al New York City Panel on Climate Change 2015 Report Chapter 1 Climate Observations and Projections Ann NY
Acad Sci ISSN 0077-8923 (New York 2015) 2579 For more information on the NPCC visit www1nycgovsiteorrchallengesnyc-panel-on-climate-changepage
NYC Mayorrsquos Office of Recovery and Resiliency Climate Resiliency Design Guidelines
38APPENDIX 1 ndash KEY TERMS
Open-grid pavement system
Pavements that consist of loose substrates supported by a grid of a more structurally sound grid or webbing Unbounded loose substrates in these systems transfer and store less heat than bound and compacted pavements and aid permeability Pavement is 50 pervious and contains vegetation in the open cells designed to allow percolation or infiltration of storm water through the surface into the soil below80
Preliminary Flood Insurance Rate Map (PFIRM)
Preliminary flood map developed by FEMA in 2015 for New York City that provides projected risks for flood hazards81 Refer to Appendix 3 for more information
Project useful life (PUL)
The period over which an asset or component is expected to be available for use by an entity This depends on regular and adequate maintenance This period of time typically exceeds the design life (see above) The combined effect of operational requirements and useful life is practical in assessing an investment in improving resilience82
Rain gardenAlso called ldquobioswalerdquo Planted areas designed to collect and manage stormwater that runs off streets sidewalks commercial and residential rooftops and other sources when it rains
Resiliency The ability to bounce back after change or adversity The capability of preparing for responding to and recovering from difficult conditions83
Sea level rise-adjusted design flood elevation
As defined in these Guidelines the increased height of the base flood elevation due to sea level rise plus freeboard depending on the criticality of the facility The sea level rise adjustment depends on the useful life of the facility
Storm surge An abnormal rise of water generated by a storm over and above predicted astronomical tides84
Substantial improvementAny repair reconstruction rehabilitation addition or improvement of a building or structure the cost which equals or exceeds 50 of the market value of the structure before the improvement or repairs started For more information see Appendix G of the NYC Building Code and 1 RCNY sect3606-0185
Tidal inundation Flooding which occurs at high tides due to climate-related sea level rise land subsidence andor the loss of natural barriers86
Urban Heat Island (UHI) effectThe tendency for higher air temperatures to persist in urban areas as a result of heat absorbed and emitted by buildings and asphalt tending to make cities warmer than the surrounding suburban and rural areas
Weather The state of the atmosphere at a given time with regard to temperature cloudiness precipitation wind and other meteorological conditions87
Wet Bulb temperatureThe temperature indicated when a thermometer bulb is covered with a water-saturated wick over which air is caused to flow at approximately 45 ms (900 ftmin) to reach the equilibrium temperature of water evaporating into the air when the heat of vaporization is supplied by the sensible heat of the air88
80 ldquoGlossaryrdquo US Green Building Council (2017) Available at httpwwwusgbcorgglossaryterm552581 ldquoPreliminary FEMA Map Productsrdquo FEMA Map Service Center Available at httpshazardsfemagovfemaportalprelimdownload82 ldquoGlossaryrdquo International Infrastructure Management Manual (2011) 83 A Stronger More Resilient New York (2013) 184 ldquoStorm Surge Overviewrdquo National Hurricane Center NOAA Available at httpswwwnhcnoaagovsurge85 ldquoFlood Resistant Constructionrdquo Appendix G New York City Building Code (2008) and 1 RCNY sect3606-01 available at httpswww1nycgovassetsbuildingsrules1_RCNY_3606-01pdf86 ldquoOcean Factsrdquo National Ocean Service NOAA Available at httpoceanservicenoaagovfactsnuisance-floodinghtml 87 UKCIP Glossary httpwwwukciporgukglossary88 ldquoASHRAE Terminologyrdquo ASHRAE Available at httpswwwashraeorgtechnical-resourcesauthoring-toolsterminology
NYC Mayorrsquos Office of Recovery and Resiliency Climate Resiliency Design Guidelines
39APPENDIX 2 - CLIMATE CHANGE PROJECTIONS
Climate change projections are provided by the New York City Panel on Climate Change (NPCC) The full NPCC report is available from the New York Academy of Sciences89 Tables 8-10 (below) were reproduced directly from the NPCC report while Table 2 (see Section IIA) was developed using the data underlying the NPCC report to inform the design of HVAC systems under warmer conditions
Table 8 ndash NYC sea level rise projections90
Baseline (2000-2004) 0 in
Low estimate (10th percentile)
Middle range (25th to 75th percentile)
High estimate (90th percentile)
2020s 2 in 4-8 in 10 in
2050s 8 in 11-21 in 30 in
2080s 13 in 18-39 in 58 in
2100 15 in 22-50 in 75 in
Note Projections are based on six-component approach that incorporates both local and global factors The model-based components are from 24 global climate models and two representative concentration pathways Projections are relative to the 2000-2004 base period
Table 9 ndash Mean annual changes91
a Temperature Baseline(1971-2000) 54degF
Low estimate (10th percentile)
Middle range (25th to 75th percentile)
High estimate (90th percentile)
2020s + 15degF +20-29degF +32degF
2050s +31degF +41-57degF +66degF
2080s +38degF +53-88degF +103degF
2100 +42degF +58-104degF +121F
b Precipitation Baseline(1971-2000) 501 in
Low estimate (10th percentile)
Middle range (25th to 75th percentile)
High estimate (90th percentile)
2020s -1 percent +1-8 +10
2050s +1 percent +4-11 +13
2080s +2 percent +5-13 +19
2100 -6 percent -1 to +19 +25
Note Based on 35 global climate models (GCMs) and two RCPs Baseline data cover the 1971ndash2000 base period and are from the NOAA National Climatic Data Center (NCDC) Shown are the low estimate (10th percentile) middle range (25th percentile to 75th percentile) and high estimate (90th percentile) These estimates are based on a ranking (from most to least) of the 70 (35 GCMs times 2 RCPs) projections The 90th percentile is defined as the value that 90 percent of the outcomes (or 63 of the 70 values) are the same or lower than Like all projections the NPCC climate change projections have uncertainty embedded within them Sources of uncertainty include data and modeling constraints the random nature of some parts of the climate system and limited understanding of some physical processes The NPCC characterizes levels of uncertainty using state-of-the-art climate models multiple scenarios of future greenhouse gas concentrations and recent peer-reviewed literature Even so the projections are not true probabilities and the potential for error should be acknowledged
89 The NPCC 2015 report is available at httponlinelibrarywileycomdoi101111nyas20151336issue-1issuetoc90 From New York City Panel on Climate Change 2015 Report Chapter 1 Climate Observations and Projections page 4191 From New York City Panel on Climate Change 2015 Report Chapter 1 Climate Observations and Projections page 30
APPENDIX 2 - CLIMATE CHANGE PROJECTIONS
NYC Mayorrsquos Office of Recovery and Resiliency Climate Resiliency Design Guidelines
40APPENDIX 2 - CLIMATE CHANGE PROJECTIONS
Table 10 ndash Extreme events92
2020s Baseline (1971-2000)
Low estimate(10th percentile)
Middle range(25th to 75th percentile)
High estimate (90th percentile)
Numbers of heat waves per year 2 3 3-4 4
Average heat wave duration (days) 4 5 5 5
Number of days per year with
Maximum temperature at or above 90degF 18 24 26-31 33
Maximum temperature at or above 100degF 04 07 1-2 2
Minimum temperature at or below 32degF 71 50 52-58 60
Rainfall at or above 1 inch 13 13 14-15 16
Rainfall at or above 2 inches 3 3 3-4 5
Rainfall at or above 4 inches 03 02 03ndash04 05
2050s Baseline (1971-2000)
Low estimate(10th percentile)
Middle range(25th to 75th percentile)
High estimate (90th percentile)
Numbers of heat waves per year 2 4 5-7 7
Average heat wave duration (days) 4 5 5-6 6
Number of days per year with
Maximum temperature at or above 90degF 18 32 39-52 57
Maximum temperature at or above 100degF 04 2 3-5 7
Minimum temperature at or below 32degF 71 37 42-48 52
Rainfall at or above 1 inch 13 13 14-16 17
Rainfall at or above 2 inches 3 3 4-4 5
Rainfall at or above 4 inches 03 03 03-04 05
2080s Baseline (1971-2000)
Low estimate(10th percentile)
Middle range(25th to 75th percentile)
High estimate (90th percentile)
Numbers of heat waves per year 2 5 6-9 9
Average heat wave duration (days) 4 5 5-7 8
Number of days per year with
Maximum temperature at or above 90degF 18 38 44-76 87
Maximum temperature at or above 100degF 04 2 4-14 20
Minimum temperature at or below 32degF 71 25 30-42 49
Rainfall at or above 1 inch 13 14 15-17 18
Rainfall at or above 2 inches 3 3 4-5 5
Rainfall at or above 4 inches 03 02 03-05 07
Note Projections for temperature and precipitation are based on 35 GCMs and 2 RCPs Baseline data are for the 1971 to 2000 base period and are from the NOAA National Climatic Data Center (NCDC) Shown are the low estimate (10th percentile) middle range (25th to 75th percentile) and high estimate (90th percentile) 30-year mean values from model-based outcomes Decimal places are shown for values less than one although this does not indicate higher precisioncertainty Heat waves are defined as three or more consecutive days with maximum temperatures at or above 90degF Like all projections the NPCC climate change projections have uncertainty embedded within them Sources of uncertainty include data and modeling constraints the random nature of some parts of the climate system and limited understanding of some physical processes The NPCC characterizes levels of uncertainty using state-of-the-art climate models multiple scenarios of future greenhouse gas concentrations and recent peer-reviewed literature Even so the projections are not true probabilities and the potential for error should be acknowledged
92 From New York City Panel on Climate Change 2015 Report Chapter 1 Climate Observations and Projections page 31
NYC Mayorrsquos Office of Recovery and Resiliency Climate Resiliency Design Guidelines
41APPENDIX 3 - DIFFERENTIATION OF FLOOD MAPS
These Guidelines reference several different kinds of flood maps and sources of design flood elevations These maps are described and differentiated below
Table 11 - Differentiation of flood maps used in NYC
Reference Title Data Source Information Provided Referenced By Link
2007 FIRM FEMA
Based on historical data from before 1983 identifies the current base flood (extent and elevation) as the flood that has a 1 chance of occurring in any given year also known as a 100-year flood The NYC Building Code requires that either the 2007 FIRM or 2015 PFIRM elevation be used whichever is higher
2014 NYC Building Code Appendix G
Climate Resiliency Design Guidelines
httpsmscfemagovportal
2015 PFIRM FEMA
Based on historical data identifies the current base flood (extents and elevation) as the flood that has a 1 chance of occurring in any given year also known as a 100-year flood The NYC Building Code requires that either the 2007 FIRM or 2015 PFIRM elevation be used whichever is higher The 2015 PFIRM is currently being reassessed by FEMA
2014 NYC Building Code Appendix G
Climate Resiliency Design Guidelines
httpshazardsfemagovfemaportalprelimdownload
httpwwwregion2coastalcomview-flood-maps-dataview-preliminary-flood-map-data
NYC Flood Hazard Mapper
NYC Department of City Planning
Maps current and future flood hazards in NYC including the following data layers 2007 FIRM and 2015 PFIRM high tide with sea level rise and PFIRM with sea level rise through 2100
Climate Resiliency Design Guidelines
Waterfront Revitalization Plan
httpwww1nycgovsiteplanningdata-mapsflood-hazard-mapperpage
ldquoTable 4 ndash Determine the sea level rise-adjusted design flood elevation for critical and non-critical facilitiesrdquo
ORR amp NPCC
Provides data to use when adding sea level rise to a given 2015 PFIRM or 2007 FIRM Base Flood Elevation (BFE) to calculate a Design Flood Elevation (DFE) Based on the criticality and expected useful life of a facility
Climate Resiliency Design Guidelines
See Section II on ldquoSea Level Riserdquo above
APPENDIX 3 - DIFFERENTIATION OF FLOOD MAPS
NYC Mayorrsquos Office of Recovery and Resiliency Climate Resiliency Design Guidelines
42APPENDIX 4 - PROJECT BENEFITS CATEGORIES
This appendix provides guidance on how to identify and assess benefits as a supplement to Sections IIID and IIIE
Table 12 lists typical direct benefits for reducing impacts from climate stressors and basic guidance for how to estimate them See Section IIID for more information
Table 13 lists typical indirect benefits for reducing impacts from climate stressors and basic guidance for how to estimate them See Section IIID for more information
Table 12 ndash Direct benefits for (1) sea level rise with coastal storm surge and (2) increased precipitation measures
Direct Benefit Basic Guidance for Estimating Values
Physical Damages (Structure Contents)
bull For flood-damaged buildings use depth damage functions developed by FEMA and USACE for structures and contents
bull Use depth damage functions in conjunction with Building Replacement Values (BRVs) and not market values BRVs typically range between $100 to $325SF for residential buildings and $120 to $450SF for commercial public buildings
bull For more complex structures or facilities use engineering estimates of flood damages or review historic flood damages documented from insurance claims repair records or FEMA Public Assistance claims from recent flood disasters
Residential Displacements
bull For flood-damaged buildings use depth damage functions developed by FEMA and USACE for residential displacements
Reduced Life CycleOperation and Maintenance (OampM) Costs93
bull Applicable only to projects that reduce overall life cycle costs or net annual OampM costs from baseline conditions
bull Input reduced annual OampM costs as a project benefit at a 1-year recurrence intervalbull Reduced overall life cycle costs can be input as a longer project useful life
Table 13 ndash Indirect benefits for (1) sea level rise with coastal storm surge and (2) increased precipitation measures
Indirect Benefit Basic Guidance for Estimating Values
Non-Residential Building Service Losses
bull Estimate service loss values and durations for non-residential buildings public buildings critical facilities and parksnatural features based on FEMA BCA guidance and standard values based on building use
Utility Service Losses94
bull Estimate utility service losses for water wastewater and electrical facilities based on the number of impacted customers FEMA per capita standard values for utility service ($105personday for potable water $49personday for wastewater $148personday for electrical)95
bull Estimate utility service loss durations based on engineering estimates or review historic flood damages losses documented from utility company records
bull This benefit can also apply to measures that increase energy efficiency
RoadBridge Service Losses
bull Estimate roadbridge service losses based on the average daily traffic (ADT) detour time and additional travel distance and FEMA and GSA standard values for road service ($3344vehiclehour of delay $0545mile)96
bull Estimate roadbridge service loss durations or review historic flood damages losses
Emergency Service Losses
bull Applicable only to projects that reduce or eliminate documented emergency service costs from baseline conditions
bull Examples of avoided emergency services costs include NYPD staffing to monitor barricades for flooded roads or NFDY staffing for water rescues of residents from flooded buildings or streets
APPENDIX 4 - PROJECT BENEFITS CATEGORIES
93 Reduced life cycle costs may be applicable to some measures that provide extreme heat benefits such as green roofs that can last longer than a standard roof if properly maintained
94 Reduced utility service costs may be applicable to some measures that provide extreme heat benefits such as cool roofs green roofs and shade trees
95 FEMA per capita standard values taken from FEMA BCA Toolkit Version 530 (Build Date 12222016) and developed in FEMArsquos Baseline Standard Economic Value Methodology Report (July 28 2016) Consider updating FEMA standard per capita values to reflect current New York City utility rates
96 Consider updating FEMA and GSA standard values to reflect current New York City area labor rates and fuel costs
NYC Mayorrsquos Office of Recovery and Resiliency Climate Resiliency Design Guidelines
43APPENDIX 4 - PROJECT BENEFITS CATEGORIES
Table 14 ndash Other potential benefits for (1) sea level rise with coastal storm surge and (2) increased precipitation measures
Other Benefit Basic Guidance for Estimating Values
Avoided Stress and Anxiety
bull Applicable only for projects that directly benefit occupants of residential structuresbull Use FEMA standard value for avoided mental stress and anxiety treatment costs of $2443person to
estimate benefit for all impacted residents97
Avoided Lost Productivity
bull Applicable only for projects that directly benefit occupants of residential structuresbull Use FEMA standard value for avoided lost worker productivity costs of $8736household to estimate
benefit for all impacted workers (conservatively assuming one worker per household)
Environmental Open Space
bull Applicable only for projects that create or acquire open space areas by acquisitionbull Use FEMA standard value for environmental open space based on the type of land acquired ($8308
Acreyear for Green open space $39545Acreyear for Riparian $6010Acreyear for Wetlands $554Acreyear for Forests $1799Year for Marine and estuary)97
CSO Volume Reduction
bull Applicable only for projects that provide Combined Sewer Overflow (CSO) abatement by reducing the volume of rainfall runoff
bull Use CSO abatement cost of $0015gallonsyear applied to increased precipitation hazard runoff volume for 5-year design storm98
Ecosystem Service99
bull Add stormwater management benefits of green infrastructure projects to increased precipitation hazards where avoided damages and service losses are not quantified
bull Unit benefits applicable to increased precipitation hazard includeo Green roofs $0133SFyear (PUL 40 years)o BioswaleRain GardenMeadow Mix $0020SFyear (PUL 30 years)o Permeable Grass Pavers $0020SFyear (PUL 30 years)o Tree Plantings $303Treeyear (PUL 30 years)o Planter Box Trees $101Treeyear (PUL 15 years)
Real Estate99
bull Potential real estate benefits from increased resilience of residential andor commercial propertiesstreetscapesneighborhoods included within the project scope
bull Benefit applied to extreme heat hazard for green infrastructure projects directly impacting residential or commercial properties
Quality of Life Health Benefits99
bull Potential quality of life benefits related to improved public health from the resilience measures included within the project scope
bull Benefit applied to extreme heat hazard for green infrastructure projects directly impacting residential or commercial properties
Table 14 lists other typical benefits for reducing impacts from climate stressors and basic guidance for how to estimate them See Section IIID for more information
97 FEMA standard values for avoided mental stress and anxiety and environmental open space values taken from FEMA BCA Toolkit Version 530 (Build Date 12222016)
98 CSO abatement cost taken from APG1 Report for NYC ldquoTechnical Approaches for Benefit-Cost Analysis of Hazard Mitigation Projects in Urban and Coastal Environmentsrdquo (April 2016)
99 Ecosystem Services Real Estate and Quality of LifeHealth benefits tend to be more applicable to green infrastructure measures that provide extreme heat benefits such as green roofs trees and other plantings
NYC Mayorrsquos Office of Recovery and Resiliency Climate Resiliency Design Guidelines
44APPENDIX 4 - PROJECT BENEFITS CATEGORIES
Table 15 ndash Potential benefits for extreme heat (Urban Heat Island) reduction measures
Category Benefit Basic Guidance for Estimating Values
Direct Benefit
Reduced Life Cycle Cost
bull Applicable only to measures such as green roofs that are expected to last longer than standard roofs
bull Compute total cost savings including annual OampM costs
Indirect Benefit
Energy Savings
bull Applicable to measures that reduce energy costs by providing cooling through increased shading andor evapotranspiration
bull Use New York Power Authority rates of $0148kWh for electricity and $0810Therm for natural gas
Other Potential Benefits
Air Quality bull Applicable to measures that absorb pollutants andor reduce carbon dioxide emissions
Acoustics bull Applicable to measures such as green roof or walls that reduce noise transfer
Quality of LifeHealth bull Potential quality of life benefits and related to improved public health
Real Estate bull Applicable to measures that provide residential real estate benefits from increased resilience of propertiesstreetscapesneighborhoods
Retail Sales Marketing
bull Applicable to measures that provide commercial property benefits from increased aesthetics resulting in increased marketing and sales for streetscapesneighborhoods
Tax Credits Incentives
bull Applicable to resilience or green infrastructure measures such as green roofs that have accompanying Federal State or City tax credits or other incentives
Table 15 lists potential benefits for reducing impacts from heat and basic guidance for how to estimate them See Section IIID for more information
NYC Mayorrsquos Office of Recovery and Resiliency Climate Resiliency Design Guidelines
45APPENDIX 4 - PROJECT BENEFITS CATEGORIES
Table 16 ndash Guidance on quantitative calculations for (1) sea level rise with coastal storm surge and (2) increased precipitation measures
Data Input General Guidance ndash Basic Description
Applicable Benefit Category
Applicable Typical Facility Typology
Dire
ct B
enefi
ts
Indi
rect
Ben
efits
Oth
er P
oten
tial
Ben
efits
Bui
ldin
g St
ruct
ures
Com
plex
Fa
cilit
ies
Tran
spor
tatio
nSt
reet
scap
es
Plaz
as
Park
Fea
ture
s
First Floor Elevation (FFE)
bull The elevation of the first finished floor of the structure excluding basements
bull FFE measured from top of lowest floor (riverinenon-coastal high hazard areas) or bottom of lowest horizontal structural member (coastal high hazard areas)
Y Y Y Y
Building Replacement Value (BRV)
bull The unit cost to rebuild a structure of the same quality of construction
bull Not the same as market value
Y Y Y Y
Building Size
bull The total floor area of the building in square feet
bull Total Building Value = BRV x Building Sizebull Typical BRVs for NYC range between $100 to
$325SF for residential buildings and $120 to $450SF for commercialpublic buildings
Y Y Y Y
Structure Description
bull The type of building number of stories and foundation type (full basement partial basement no basement)
bull Collect more detailed foundation data for coastal flood zones
Y Y Y Y
Building Use bull Details related to residential housing commercial business and public use
Y Y Y Y Y
Building Type bull The primary use of building ndash residential commercial public and others
Y Y Y Y Y
Depth Damage Function (DDF)
bull Curves used to estimate structure damage contents damage and displacement of residential buildings based on flood depth
bull DDFs selection based on Structure Description Building Type Building Use
bull Structure DDFs based on percentage of Total Building Value
bull Contents DDFs based on percentage of Total Contents Value
bull Displacement DDFs based on number of displacement days x Displacement Cost
Y Y Y Y Y
Contents Value
bull The cost to replace structure contents (furnishings equipment)
bull Residential building Contents Values typically 50 BRV (FEMA DDFs) or 100 BRV (USACE DDFs)
bull Non-residential building Contents Values between 18 to over 100 depending on building use (USACE DDFs)
bull Total Contents Value = BRV x Building Size
Y Y Y Y Y
Table 16 provides general guidance on how to quantitatively calculate benefits from efforts to address from climate stressors See Section IIIE for more information
NYC Mayorrsquos Office of Recovery and Resiliency Climate Resiliency Design Guidelines
46APPENDIX 4 - PROJECT BENEFITS CATEGORIES
Table 16 ndash Guidance on quantitative calculations for (1) sea level rise with coastal storm surge and (2) increased precipitation measures
Data Input General Guidance ndash Basic Description
Applicable Benefit Category
Applicable Typical Facility Typology
Dire
ct B
enefi
ts
Indi
rect
Ben
efits
Oth
er P
oten
tial
Ben
efits
Bui
ldin
g St
ruct
ures
Com
plex
Fa
cilit
ies
Tran
spor
tatio
nSt
reet
scap
es
Plaz
as
Park
Fea
ture
s
Number of Residents (Residential)
bull Total number of occupants in a residential building
bull Typically estimated based on number of residential units x average number of individuals per household (based on current US Census data or use 25 individuals per household as a default)
Y Y Y Y Y
Displacement Cost (Residential)
bull The unit cost to lodge and feed displaced residents while flood damage is repaired
bull Average unit displacement cost of $415residential unitday recommended based on current FY2018 GSA Per Diem rates for New York City
Y Y Y Y Y
Value of Service (Non-Residential and Public)
bull The unit cost of service disruption and rental of temporary facilities while flood damage is repaired
bull Disruption costs for non-residential buildings typically range from $095 to $136SFmonth and rental costs range from $020 to $136SFmonth depending on building use
bull Value of service for public buildings ($day) is typically based on the annual operating budget for the City agency using the building prorated based on building size or population served by the building then divided by 365 daysyear
Y Y Y Y
Value of Service (Critical Facilities)
bull The unit cost of critical facilities (police fire emergency medical services) lost or delayed while flood damage is repaired
Y Y Y
Value of Service Duration
bull The duration of service disruption and rental of temporary facilities for non-residential buildings and critical facilities while flood damage is repaired
bull For non-residential buildingso Value of Service Durations vary from
4 months to over 30 months based on building use and the depth of flooding
o Total Value of Service Loss = (Disruption Cost x Building Area) = (Rental Cost x Building Area x Value of Service Duration)
bull For public buildings and critical facilitieso Value of Service Durations vary from 0
days to 720 months based on building use and the depth of flooding from FEMA FIA or USACE DDFs
o Total Value of Service Loss = (Value of Service) x (Service Loss Duration)
Y Y Y
NYC Mayorrsquos Office of Recovery and Resiliency Climate Resiliency Design Guidelines
47APPENDIX 4 - PROJECT BENEFITS CATEGORIES
Table 16 ndash Guidance on quantitative calculations for (1) sea level rise with coastal storm surge and (2) increased precipitation measures
Data Input General Guidance ndash Basic Description
Applicable Benefit Category
Applicable Typical Facility Typology
Dire
ct B
enefi
ts
Indi
rect
Ben
efits
Oth
er P
oten
tial
Ben
efits
Bui
ldin
g St
ruct
ures
Com
plex
Fa
cilit
ies
Tran
spor
tatio
nSt
reet
scap
es
Plaz
as
Park
Fea
ture
s
Engineering Estimates for Damages
bull Engineered estimate models of physical damages and service losses at the project site based on the Guidelines event recurrence interval(s) and flood depth(s)
Y Y Y Y Y Y
Historic Damages and Service Losses
bull Historic physical damages and service losses at the project site documented from previous flood events
bull Do not use routine maintenancebull The historic damage event recurrence interval
(RIs) andor flood depths must be determined updated for inflation to the present value and adjusted to match the Guidelines event RIsflood depths
Y Y Y Y Y Y
Facility Replacement Value
bull The unit cost to rebuild the facility
Impacted Area bull The geographic area impacted by the facility in the event of failure in acres
Y Y Y Y
Facility Capacity
bull The design capacity of the facilitybull For example - facility capacity expressed in
millions of gallons per day (MGD) for water and wastewater facilities or megawatts (MW) for electrical facilities
Y Y Y Y
Service Population
bull The number of impacted residents served by the facility
bull Typically estimated based on number of impacted residential customers x average number of individuals per household (based on current US Census data or use 25 individuals per household as a default)
bull Facilities serving mostly non-residentialpublic buildings andor critical facilities should focus on service losses rather than service population
Y Y Y
NYC Mayorrsquos Office of Recovery and Resiliency Climate Resiliency Design Guidelines
48APPENDIX 4 - PROJECT BENEFITS CATEGORIES
Table 16 ndash Guidance on quantitative calculations for (1) sea level rise with coastal storm surge and (2) increased precipitation measures
Data Input General Guidance ndash Basic Description
Applicable Benefit Category
Applicable Typical Facility Typology
Dire
ct B
enefi
ts
Indi
rect
Ben
efits
Oth
er P
oten
tial
Ben
efits
Bui
ldin
g St
ruct
ures
Com
plex
Fa
cilit
ies
Tran
spor
tatio
nSt
reet
scap
es
Plaz
as
Park
Fea
ture
s
Value of Service
bull Unit value of service provided by the facilitybull Example of FEMA standard values for complete
loss of utility service $105personday for potable water$49personday for wastewater$148personday for electrical
bull Consider updating FEMA standard per capita values to reflect current The New York City utility rates
Y Y
Roadway Elevations bull Roadway Elevations
Y Y
Roadway Replacement Value
bull Roadway Replacement ValueY Y
Inundation Area Map
bull Inundation Area Map developed by FEMA or through modeling by project design team
Y Y Y
Building Inventory of Inundation Area
bull The number and type of buildings within the streetscape and neighborhood inundated by the Guidelinersquos flood events
Y Y Y
Average Daily Traffic (ADT)
bull The average number of one-way traffic trips per day along the roadway(s) within the streetscapeneighborhood inundated by the Guidelinersquos flood events
Y Y
Additional Travel Time
bull The additional travel time needed to detour around a flooded roadway expressed in minutes
bull In the unlikely event there is no detour available use a 12-hour travel time per one-way trap but provide a detailed area street map as supporting documentation
Y Y
Value of Traffic Delay
bull The value of service associated with lost time in traffic
bull For example - FEMA standard average value of $3344vehiclehour of delay
bull Consider updating FEMA and GSA standard values to reflect current New York City area labor rates and fuel costs
Y Y
NYC Mayorrsquos Office of Recovery and Resiliency Climate Resiliency Design Guidelines
49APPENDIX 4 - PROJECT BENEFITS CATEGORIES
Table 17 ndash Guidance on quantitative unit benefit calculations for extreme heat hazard measures
Measure General Guidance ndash Unit Benefit Information and Data Requirements
Applicable Benefit Category
Applicable Typical Facility Typology
Dire
ct B
enefi
ts
Indi
rect
Ben
efits
Oth
er P
oten
tial
Ben
efits
Bui
ldin
g St
ruct
ures
Com
plex
Fa
cilit
ies
Tran
spor
tatio
nSt
reet
scap
es
Plaz
as
Park
Fea
ture
s
Green Roof
bull Unit benefit range over PUL = $470SF to $373SF of green roof area ($719SF standard value)
bull Assumed PUL = 40 yearsbull Apply standard value unit benefit to green
roof area to estimate measure benefitbull Higher range values more applicable
to residential and commercial building streetscape projects
Y Y Y Y Y Y
Bioswale Rain Garden Meadow Mix
bull Unit benefit range over PUL = $396SF to $211SF of area ($730SF standard value)
bull Assumed PUL = 30 yearsbull Apply standard value unit benefit to bioswale
rain gardenmeadow mix area to estimate total measure benefit
Y Y Y Y Y Y
Cool Roof
bull Unit benefit range over PUL = $117 to $3151SF of material area ($144SF standard value)
bull Assumed PUL = 20 yearsbull Apply standard value unit benefit to cool roof
area to estimate total measure benefitbull Higher range values more applicable to
residential building streetscape projects
Y Y Y Y Y
Light-Colored PaversLight-Colored Materials
bull Unit benefit range over PUL = $0774 to $204SF of material area ($0866SF standard value)
bull Assumed PUL = 30 yearsbull Apply standard value unit benefit to material
area to estimate total measure benefit
Y Y Y Y
Table 17 provides general guidance on how to quantitatively calculate benefits from efforts to address climate stressors See Section IIIE for more information
NYC Mayorrsquos Office of Recovery and Resiliency Climate Resiliency Design Guidelines
50APPENDIX 4 - PROJECT BENEFITS CATEGORIES
Table 17 ndash Guidance on quantitative unit benefit calculations for extreme heat hazard measures
Measure General Guidance ndash Unit Benefit Information and Data Requirements
Applicable Benefit Category
Applicable Typical Facility Typology
Dire
ct B
enefi
ts
Indi
rect
Ben
efits
Oth
er P
oten
tial
Ben
efits
Bui
ldin
g St
ruct
ures
Com
plex
Fa
cilit
ies
Tran
spor
tatio
nSt
reet
scap
es
Plaz
as
Park
Fea
ture
s
Tree Planting
bull Unit benefit range over PUL = $1005 to $77154Tree ($1855Tree standard value)
bull Assumed PUL = 30 yearsbull Apply standard value unit benefit to number of
trees to estimate total measure benefitbull Higher range values more applicable
to residential and commercial building streetscape projects
Y Y Y Y Y Y
Planter Box Tree
bull Unit benefit range over PUL = $212 to 16304Tree ($392Tree standard value)
bull Assumed PUL = 15 yearsbull Apply standard value unit benefit to number of
trees to estimate total measure benefitbull Higher range values more applicable
to residential and commercial building streetscape projects
Y Y Y Y Y
Shade Canopy
bull Unit benefit range over PUL = $0363 to $396SF ($0458SF standard value)
bull Assumed PUL = 15 yearsbull Apply standard value unit benefit to area of
shade canopy estimate total measure benefitbull Higher range values more applicable
to residential and commercial building streetscape projects
Y Y Y Y
Permeable Grass Pavers
bull Unit benefit range over PUL = $0258SF to $0521SF of pavers ($0363SF standard value)
bull Assumed PUL = 30 yearsbull Apply standard value unit benefit to paver
area to estimate total measure benefit
Y Y Y Y Y
For the purposes of the BCA refer to the following facility typologies bull ldquoBuilding Structuresrdquo include critical small building sites such as EMS or FDNY stations and non-critical small building sites such as
libraries or comfort stationsbull ldquoComplex Facilitiesrdquo include critical infrastructure such as wastewater treatment sites pump stations water filtration plants and similar
large or complex facilitiesbull ldquoTransportationStreetscapePlazasrdquo include roadway reconstruction streetscape improvements street raising plazas and other
transportation-related infrastructurebull ldquoPark Featuresrdquo include parks and similar public recreational facility with natural landscape features
NYC Mayorrsquos Office of Recovery and Resiliency Climate Resiliency Design Guidelines
51APPENDIX 5 - EXAMPLE PLANNING DECISION TREE
This decision tree provides a summarized example approach for how to implement these Guidelines Projects with a total cost greater than $50 million are recommended to conduct a full qualitative and quantitative climate change risk assessment and BCA while projects below $50 million are recommended to conduct a qualitative risk assessment and BCA
Define Project
1) Operational goals and criticality level2) Useful life3) Location in the current flood plain future floodplain and or zone
of tidal inundation and the project arearsquos score on the heat vulnerability index
Evaluate Project Risks According to Probability and Magnitude of Consequence
bull Extreme Heat bull Precipitationbull Sea Level Risebull Coastal Surge
High Level Identification and Assessment of Risk Mitigation Alternatives and Co-benefits
(qualitative)
Detailed Identification and Assessment of Risk Mitigation Alternatives and Co-benefits (qualitative and quantitative)
High Level Estimate of Costs and Benefits of Design Alternatives
(qualitative)
Detailed Estimate of Costs and Benefits of Design Alternatives
(qualitative and quantitative)
Decision Point Which climate change risks require mitigation
Decision Point Evaluate risk mitigation benefits and costs to
determine final resilient design alternative or if no action is required
Decision Point Is the total project cost above $50 million
Below $50 million Above $50 million
APPENDIX 5 - EXAMPLE PLANNING DECISION TREE
NYC Mayorrsquos Office of Recovery and Resiliency Climate Resiliency Design Guidelines
52
Project Title
Design Strategies Checklist (not exhaustive)
Extreme Heat Comments Extreme Precipitation Comments Sea Level Rise amp Storm Surge Comments
Select Site in Low Heat Vulnerability Index area Select High Elevation Site Select High Elevation Site
Minimize East-West Building Orientation Green Roof Raise Building Floor Elevation
Passive Solar Cooling and Ventilation Systems
Protect Below Grade Areas from Flooding Waterproof Building Envelope
Cool Roof (SRI appropriate) On-site Stormwater Management (gray) Elevate Critical Building Functions
Green Roof (extensive) Reduce Impervious Areas Elevate Critical Equipment
Vegetative Structures Permeable Pavement Perimeter Floodwall100 Levee (passive or active)
Enhanced HVAC System including space layout optimization and system scalability
Increase Green Spaces and Planted Areas DryWet Floodproofing
More Efficient Building Envelope Other Utility Redundancy Design101
Parking Lot Shading Resilient Materials amp Landscape Treatments
Light Colored Pavements (appropriate SRI) Design for Storm Surge Outflow
Increase Planted Areas Install Backwater Flow Prevention
Permeable Surfaces Design for Scour
Open-grid Pavement Raise Road Elevation
Other Other
This appendix provides a template for identifying possible design strategies to address climate change risks as described throughout the Guidelines
APPENDIX 6 - DESIGN STRATEGIES CHECKLIST
100 Permanent perimeter flood walls are not permitted to meet floodproofing requirements in buildings with substantial improvements andor damages 101 Utility redundancy design should be pursued for critical systems not all building systems
APPENDIX 6 - DESIGN STRATEGIES CHECKLIST
NYC Mayorrsquos Office of Recovery and Resiliency Climate Resiliency Design Guidelines
53APPENDIX 7 - CLIMATE CHANGE RISK ASSESSMENT RESOURCES
These Guidelines provide data on climate change hazards and recommend how that data can inform resilient design A risk assessment is a tool to help project managers and designers evaluate risk levels as well as select and prioritize resilient design strategies A high level risk assessment is recommended for all City capital projects with a total cost of under $50 million Projects above $50 million are recommended to conduct an in-depth assessment
Risk assessments use quantified estimates of the probability and magnitude of consequence of an event occurring to prioritize responses ldquoProbabilityrdquo is an assessment of the likelihood of a hazard occurring while ldquomagnituderdquo describes the hazardrsquos potential impact Risk assessment tools such as the examples listed below can be used to define and score these categories Projects that score higher across both probability and magnitude can be prioritized for investment and risk mitigation action Projects that score lower across both criteria may require no action beyond meeting code The results are typically charted on a risk matrix and an example is provided on the next page
The climate change risk management frameworks below offer templates for how to integrate climate change projections into a risk assessment process Refer to these resources for examples and further information
bull Vulnerability Assessment and Adaptation Framework is prepared by the Federal Highway Administration (FHWA) While developed for transportation planning this risk assessment framework has broad applicability for evaluating asset vulnerability to climate change Available at httpswwwfhwadotgovenvironmentsustainabilityresilienceadaptation_framework
bull US Climate Resilience Toolkit The US Global Change Research Program offers a step by step risk assessment
framework including tools and case studies at httpstoolkitclimategovsteps (see example on next page)
bull Coast Adapt Guidance on undertaking a risk assessment High level assessment httpscoastadaptcomausitesdefaultfilesfactsheetsT3M4_2_2nd_pass_risk_assessmentpdfDetailed assessment httpscoastadaptcomausitesdefaultfilesfactsheetsT3M4_3_3rd_pass_risk_assessmentpdf
bull Climate adaptation Risk uncertainty and decision-makingDownload the report here httpswwwukciporgukpublicationsRisk
The City plans to develop a NYC-specific process for integrating climate change data into existing risk management processes by April 2019
APPENDIX 7 - CLIMATE CHANGE RISK ASSESSMENT RESOURCES
NYC Mayorrsquos Office of Recovery and Resiliency Climate Resiliency Design Guidelines
54APPENDIX 7 - CLIMATE CHANGE RISK ASSESSMENT RESOURCES
The Risk Characterization Matrix below is an example from the US Climate Resilience Toolkit This tool can be used to assess the probability and magnitude of impact for identified risks The risk of coincident climate stressorsrisks (such as storm surge plus increased precipitation) can also be assessed as applicable
Figure 14 - Example of a climate change risk matrix (adapted from US Climate Resilience Toolkit)
Project teams can determine the magnitude of the impact (along the horizontal scale of 1 through 3 with 3 being the most severe) and the probabilitylikelihood of occurrence for each specific risk (along the vertical scale with 3 being the most likely) A score is typically assigned for each risk (Probabil-ity x Magnitude) and then charted on the matrix Based on the estimated probability and magnitude of consequence above the risks are ranked and prioritized for mitigation Factors to bear in mind include
bull Not all facility typologies have the same level of functional and operational importance during events or tolerance for disruption
bull Not all climate stressors and risks have the same level of impact on each project sitebull Not all identified risks can or should be mitigated fully
NYC Mayorrsquos Office of Recovery and Resiliency Climate Resiliency Design Guidelines
55WORKS CITED
A Stronger More Resilient New York PlaNYC Report of the NYC Special Initiative for Rebuilding and Resiliency The City of New York 2013
ldquoAccount for Climate Riskrdquo International Finance Corporation accessed March 27 2017 httpwwwifcorgwpswcmconnectTopics_Ext_ContentIFC_External_Corporate_SiteClimate+Business
PrioritiesAccount+for+Climate+Risk
American Society of Heating Refrigeration and Air-Conditioning Engineers (ASHRAE) Handbook -Fundamentals 2017
ldquoBaseline Standard Economic Value Methodology Reportrdquo Federal Emergency Management Agency July 2016
Benefit Cost Analysis Toolkit Software Version 530 Federal Emergency Management Agency (build date December 2016)
Criteria for Detention Facility Design New York City Department of Environmental Protection November 2012
Community Resilience Planning Guide for Buildings and Infrastructure Systems Vol 1 NIST Special Publication 1190 US Department of Commerce 2016
Cool and Green Roofing Manual NYC Department of Design and Construction 2007 httpwwwnycgovhtmlddcdownloadspdfcool_green_roof_manpdf
Building Resiliency Task Force US Urban Green Building Council New York 2013 httpurbangreencouncilforcecomBuildingResiliency
Design and Planning for Flood Resiliency Guidelines for NYC Parks New York City Department of Parks and Recreation 2017
httpswwwnycgovparksorgplanning-and-buildingplanningresiliency-plansflood-resiliency
Flooded Bus Barns and Buckled Rails Federal Transit Administration Office of Budget and Policy 2011 httpswwwhsdlorgabstractampdid=685187
Floodproofing Non-Residential Buildings FEMA P936 FEMA 2013 httpswwwfemagovmedia-library-data9a50c534fc5895799321dcdd4b6083e7P-936_8-20-13_508rpdf
ldquoGlossaryrdquo International Infrastructure Management Manual National Asset Management Support Group New Zealand 2011 httpwwwipweaorg
ldquoGreen Roof Metrics Draft Reportrdquo New York City Department of Parks and Recreation 2017
ldquoGuide to Rain Event Preparednessrdquo NYC Department of Environmental Protection httpwwwnycgovhtmldeppdfbrochuresflood-preparedness-flyerpdf
ldquoGuidelines and Discount Rates for Benefit-Cost Analysis of Federal Programsrdquo Appendix C Circular A-94 US Office of Management and Budget (OMB) 2017
ldquoGuidelines for the Design and Construction of Stormwater Management Systemsrdquo New York City Department of Environmental Protection July 2012
Horton R et al New York City Panel on Climate Change 2015 Report Ann NY Acad Sci ISSN 0077-892 New York 2015
Madrigano J et al ldquoA case-only study of vulnerability to heat wavendashrelated mortality in New York City (2000ndash2011)rdquo Environmental Health Perspectives 123672ndash678 2013
WORKS CITED
NYC Mayorrsquos Office of Recovery and Resiliency Climate Resiliency Design Guidelines
56WORKS CITED
enspMcGregor et al Two Degrees The Built Environment and Our Changing Climate Routledge Press 2013
NYC Green Codes Task Force US Green Building Council New York 2010 httpurbangreencouncilorgGreenCodes
NYCrsquos Risk Landscape A Guide to Hazard Mitigation NYC Emergency Management 2014
One New York The Plan for a Strong and Just City The City of New York 2015 httpwwwnycgovhtmlonenyc downloadspdfpublicationsOneNYCpdf
Ready to Respond Strategies for Multifamily Building Resilience Enterprise Green Communities 2015 httpswwwenterprisecommunityorgresources
Rosenzweig C et al Climate Change Adaptation in New York City Building a Risk Management Response New York City Panel on Climate Change 2010
httponlinelibrarywileycomdoi101111nyas20101196issue-1 issuetoc
ldquoSustainable Infrastructure Management Program Learning Environmentrdquo Water Environment Research Foundation accessed March 24 2017 httpsimplewerforg
Urban Waterfront Adaptive Strategies NYC Department of City Planning 2013 httpwww1nycgovsiteplanningplanssustainable-communitiesclimate-resiliencepagetab=1
Wastewater Resiliency Plan Climate Risk Assessment and Adaptation Study New York City Department of Environmental Protection October 2013
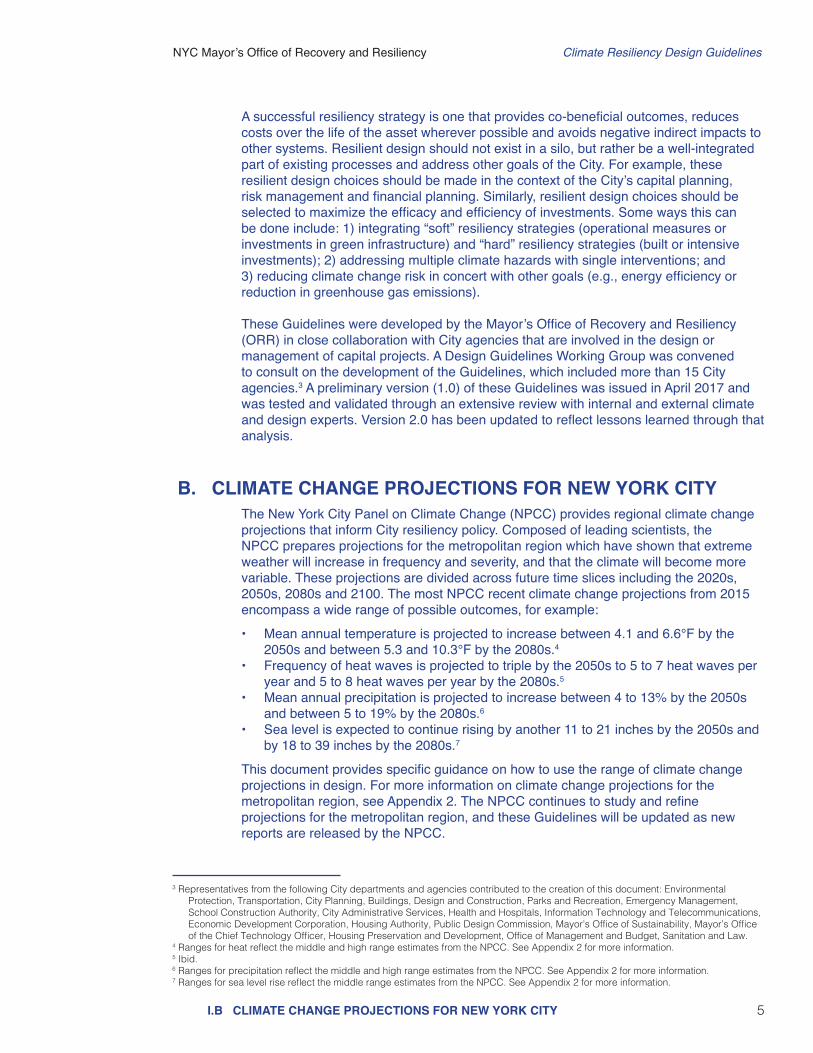
NYC Mayorrsquos Office of Recovery and Resiliency Climate Resiliency Design Guidelines
5IB CLIMATE CHANGE PROJECTIONS FOR NEW YORK CITY
A successful resiliency strategy is one that provides co-beneficial outcomes reduces costs over the life of the asset wherever possible and avoids negative indirect impacts to other systems Resilient design should not exist in a silo but rather be a well-integrated part of existing processes and address other goals of the City For example these resilient design choices should be made in the context of the Cityrsquos capital planning risk management and financial planning Similarly resilient design choices should be selected to maximize the efficacy and efficiency of investments Some ways this can be done include 1) integrating ldquosoftrdquo resiliency strategies (operational measures or investments in green infrastructure) and ldquohardrdquo resiliency strategies (built or intensive investments) 2) addressing multiple climate hazards with single interventions and 3) reducing climate change risk in concert with other goals (eg energy efficiency or reduction in greenhouse gas emissions) These Guidelines were developed by the Mayorrsquos Office of Recovery and Resiliency (ORR) in close collaboration with City agencies that are involved in the design or management of capital projects A Design Guidelines Working Group was convened to consult on the development of the Guidelines which included more than 15 City agencies3 A preliminary version (10) of these Guidelines was issued in April 2017 and was tested and validated through an extensive review with internal and external climate and design experts Version 20 has been updated to reflect lessons learned through that analysis
B CLIMATE CHANGE PROJECTIONS FOR NEW YORK CITY
The New York City Panel on Climate Change (NPCC) provides regional climate change projections that inform City resiliency policy Composed of leading scientists the NPCC prepares projections for the metropolitan region which have shown that extreme weather will increase in frequency and severity and that the climate will become more variable These projections are divided across future time slices including the 2020s 2050s 2080s and 2100 The most NPCC recent climate change projections from 2015 encompass a wide range of possible outcomes for example
bull Mean annual temperature is projected to increase between 41 and 66degF by the 2050s and between 53 and 103degF by the 2080s4
bull Frequency of heat waves is projected to triple by the 2050s to 5 to 7 heat waves per year and 5 to 8 heat waves per year by the 2080s5
bull Mean annual precipitation is projected to increase between 4 to 13 by the 2050s and between 5 to 19 by the 2080s6
bull Sea level is expected to continue rising by another 11 to 21 inches by the 2050s and by 18 to 39 inches by the 2080s7
This document provides specific guidance on how to use the range of climate change projections in design For more information on climate change projections for the metropolitan region see Appendix 2 The NPCC continues to study and refine projections for the metropolitan region and these Guidelines will be updated as new reports are released by the NPCC
3 Representatives from the following City departments and agencies contributed to the creation of this document Environmental Protection Transportation City Planning Buildings Design and Construction Parks and Recreation Emergency Management School Construction Authority City Administrative Services Health and Hospitals Information Technology and Telecommunications Economic Development Corporation Housing Authority Public Design Commission Mayorrsquos Office of Sustainability Mayorrsquos Office of the Chief Technology Officer Housing Preservation and Development Office of Management and Budget Sanitation and Law
4 Ranges for heat reflect the middle and high range estimates from the NPCC See Appendix 2 for more information5 Ibid6 Ranges for precipitation reflect the middle and high range estimates from the NPCC See Appendix 2 for more information7 Ranges for sea level rise reflect the middle range estimates from the NPCC See Appendix 2 for more information
NYC Mayorrsquos Office of Recovery and Resiliency Climate Resiliency Design Guidelines
6IC PLANNING ACROSS PROJECT USEFUL LIFE ID MANAGING UNCERTAINTY
C PLANNING ACROSS PROJECT USEFUL LIFEA resilient facility is one built to withstand or recover quickly from natural hazards Climate conditions will continue to change over time which makes considering the useful life important for choosing the right level of protection8 Users should using professional knowledge and examples from the built environment estimate the full useful life of the facility to determine necessary design adjustments tied to climate change (useful life starts at the end of construction) The full project useful life of a facility is typically a longer period than the design life and more accurately represents the extended service life of most types of facilities (assuming regular maintenance) For example an administrative building may have a design life of 30 years but in practice such buildings remain in use for 50 years or more when well-maintained Full useful life is also met through the successful deployment of design strategies that minimize operations and maintenances (OampM) and the need for renovations ORR and Department of Design and Construction (DDC) with input from other City agencies are developing a library of common asset types for buildings landscapes infrastructure and equipment and assessing their typical design and useful lives This resource will be added as an addendum to the Guidelines by April 2019
D MANAGING UNCERTAINTYClimate change projections from the NPCC are the product of state-of-the-art modeling and analysis However as with all projections there is uncertainty embedded within them9 The NPCC continues to develop review and synthesize the latest climate data for the metropolitan region and new findings will be incorporated into future versions of these Guidelines
Given uncertainty flexible adaptation pathways provide a useful iterative approach for managing uncertainty and designing resilient facilities particularly those with a useful life that extends over 50 years - beyond which the uncertainty of projections increases10 Adaptation pathways are particularly useful for expensive long-lived and highly complex projects They provide a way to balance uncertainty with cost as well as manage operational and maintenance constraints A facility can be engineered with an adaptable protection level which reduces the hazard risk to acceptable levels for part of its useful life and that can be re-evaluated as risk levels change
8 NIST Community Resilience Planning Guide for Buildings and Infrastructure Systems Vol 1 NIST Special Publication 1190 US Department of Commerce 2016
9 PlaNYC A Stronger More Resilient New York report of the NYC Special Initiative for Rebuilding and Resiliency Report June 11 2013 page 28 From that report ldquoLike all projections the NPCC projections have uncertainty embedded within them Sources of uncertainty include data and modeling constraints the random nature of some parts of the climate system and limited understanding of some physical processes The NPCC characterizes levels of uncertainty using state-of-the-art climate models multiple scenarios of future greenhouse gas concentrations and recent peer-reviewed literature Even so the projections are not true probabilities and the potential for error should be acknowledgedrdquo
10 To learn more see Chapter 2 in the NPCC 2010 report Climate Change Adaptation in New York City available at httponlinelibrarywileycomdoi101111nyas20101196issue-1issuetoc
Figure 1 - Example of a flexible adaptation pathway for an outdoor emergency generator and platform
An illustrative example of using flexible adaptation
NYC Mayorrsquos Office of Recovery and Resiliency Climate Resiliency Design Guidelines
7IE PROJECT-SPECIFIC CONSIDERATIONS
pathway on a facilitiesrsquo component is explained in Figure 1 It shows an emergency generator with an approximate useful life of 25 years located outside a building In order to incorporate the Guidelines into design it is recommended that the foundation of the generator structure is designed to match the useful life of the building which can vary between 50-70 years that the generator serves Assuming the generator is subject to flooding risk from sea level rise and coastal surge it should be built on an elevated concrete slab that matches the future year design flood elevation (DFE) scenario corresponding to the end of the generatorrsquos useful life The generator must be replaced when it reaches the end of its useful life which is typically far less than that of the building When the replacement generator is installed the concrete slab is further elevated to accommodate the future DFE The foundation of the generator and the columns are designed to support the additional future load from the concrete slab Thereby the initial investment into the foundation can be used to adapt in the future allowing for future flexibility and avoided costs
Adaptation pathways may not apply equally to all types of projects or climate change projections Facility flood defenses for example may be more easily developed through an adaptation pathway than heat-vulnerable materials or below grade drainage systems For this reason the Guidelines use the middle of the 25th to 75th percentile range projections for sea level rise (see Table 4) and the high-end 90th percentile projections for heat (see Table 1) For precipitation these Guidelines recommend using the existing 50-year storm data as a proxy for the projected high-end 5-year storm (see Section IIIB and Figure 4 for more details)
Uncertainty can be further addressed through risk management Some facilities such as those that are critical or cost more than $50 million for design and construction will benefit from a full climate change risk assessment (see examples in Appendix 7) This assessment will evaluate protecting the facility to a potentially higher level of sea level rise than the recommended height in these Guidelines The City plans to develop a process for integrating climate change data into existing risk management processes by April 2019 If engaging in a climate change risk assessment process please contact ORR at ResilientDesigncityhallnycgov
E PROJECT-SPECIFIC CONSIDERATIONSExisting information and requirements specific to different kinds of projects must be reviewed on a case-by-case basis when evaluating resiliency design strategies Refer to Appendix 5 for an example approach of how to make resiliency planning and design decisions and discuss these considerations as a project team to determine which apply and how to respond
bull Financing requirements if the project is federally-funded or receives recovery funding discuss with the funding agency if certain protection standards or cost-benefit analyses are required For example FEMA requires specific flood protection standards for critical facilities and non-critical facilities
bull Interdependencies consider how hazards impact interdependencies across sectors as well as the risks from coincident events (eg extreme precipitation occurring during an extreme surge event) to specific projects
bull Existing hazard mitigation projects and risk studies evaluate if nearby or associated projects have already been assessed for climate change risks Identify if
NYC Mayorrsquos Office of Recovery and Resiliency Climate Resiliency Design Guidelines
8IE PROJECT-SPECIFIC CONSIDERATIONS
any studies have been conducted that could inform design (eg local flood modeling with sea level rise) This may inform the climate change risk assessment or provide insights into site specific conditions and design options A map that catalogs NYC resiliency projects is located here httpsmapsnycgovresiliency
bull Agency-specific resiliency design standards refer also to resiliency guidelines provided by various City agencies (eg Parkrsquos Design and Planning for Flood Resiliency11) Agency guidelines build on the climate data provided in these Guidelines by providing specific design alternative and insights relevant to those agencies
bull Limitations the Guidelines do not describe or encompass all City resiliency policies To learn more about how the City plans for a resilient future see the latest OneNYC plan as well as the 2013 report A Stronger More Resilient New York Related resiliency issues are being addressed by the City but are out of the scope of these Guidelines including neighborhood and regional-level climate change risk management and zoning
bull Further questions Contact ORR at ResilientDesigncityhallnycgov
11 Available at httpswwwnycgovparksorgplanning-and-buildingplanningresiliency-plansflood-resiliency
NYC Mayorrsquos Office of Recovery and Resiliency Climate Resiliency Design Guidelines
9IIA INCREASING HEAT
All City of New York capital projects should be designed to withstand increasing heat and precipitation based on the useful life of the asset while design interventions for storm surge and sea level rise depend on the projectrsquos proximity to the floodplain useful life and criticality In order to support design team efforts to generate resilient design responses (ie adjustments to base projects) these Guidelines provide climate change projections and recommend design adjustments or interventions in response to increasing heat increasing precipitation and sea level rise The Guidelines recommend designing to loads beyond the minimum requirements in the prevalent NYC local codes Design teams should consider project benefits and additional costs to incorporating resilient design standards before finalizing project design
A INCREASING HEATUse this section to determine how to adjust a facilityrsquos design to account for increasing temperatures and to reduce the facilityrsquos contribution to the Urban Heat Island effect Heat reduction levels will be determined by the function location and useful life of the asset
BackgroundThe impacts of heat on NYC are well established Every summer over 100 New Yorkers die from causes exacerbated by extreme heat12 The region has seen a steady increase in the number of days above 90degF and temperatures are projected to keep rising worsening heat-related mortality By the 2050s the number of days at or above 90degF is expected to double and the frequency and length of heat waves will triple to an average 6 heat waves per year13 Certain areas of NYC already experience higher temperatures relative to other parts of the city and these hot spots will be exacerbated by climate change (see Figure 2)
12 OneNYC The Plan for a Strong and Just City (The City of New York 2015) 228 See also Madrigano J Ito K Johnson S Kinney PL Matte T 2015 A case-only study of vulnerability to heat wavendashrelated mortality in New York City (2000ndash2011) Environmental Health Perspectives 123672ndash678 httpwwwnycgovhtmlonenycdownloadspdfpublicationsOneNYCpdf
13 Horton et al New York City Panel on Climate Change 2015 Report Chapter 1 Climate Observations and Projections Ann NY Acad Sci ISSN 0077-8923 New York 201514 LANDSAT Thermal Data from 8182009
Figure 2 - Thermal imagery of New York City based on LANDSAT Thermal Data from 818200914
II INTERPRETING CLIMATE CHANGE DATA FOR RESILIENT DESIGN ADJUSTMENTS
NYC Mayorrsquos Office of Recovery and Resiliency Climate Resiliency Design Guidelines
10IIA INCREASING HEAT
In Cool Neighborhoods NYC the City prioritizes strategies to study the Urban Heat Island effect and make targeted investments that benefit communities most vulnerable to heat15 New Yorkers are more or less vulnerable to heat based largely upon socio-economic factors including age income location tree coverage and the percentage of dark surfaces The NYC Department of Health and Mental Hygiene (DOHMH) developed a Heat Vulnerability Index (HVI) which highlights parts of the city where more residents face an increased risk of heat-related mortality Their vulnerability is due to their exposure and socio-economic conditions that determine their
Figure 3 - Heat Vulnerability Index (HVI) for New York City Community Districts (Source NYC DOHMH 2015) This analysis identifies physical social and economic factors associated with increased risk of heat-related morbidity and mortality17
The Guidelines recommend that project designers consider two aspects of the relationship between their project and increasing heat the way their project reduces the Urban Heat Island effect and the impact that increasing heat will have on the physical components of their project itself
bull Reduce Urban Heat Island effect materials in the built environment absorb the sunrsquos heat throughout the day and re-radiate it back into the atmosphere driving localized temperatures higher and increasing demands on cooling systems Air conditioning and ventilation equipment also push extra heat into the air contributing to a feedback loop that increases localized ambient temperatures and impacts the health of heat-vulnerable New Yorkers This section provides guidance on how new capital construction can reduce the contribution to ambient heat in the city
bull Minimize impact from increasing heat increasing heat can physically impact components of buildings and infrastructure damaging or stressing materials electrical systems and mechanical systems Rising temperatures will also stress energy and communications networks that buildings and other infrastructure rely upon18 This section provides climate data to be used to adjust and adapt heat-vulnerable components of assets
15 OneNYC 22816 To learn more about Heat Vulnerability Index see page 229 of OneNYC at httpwwwnycgovhtmlonenycdownloadspdf
publicationsOneNYCpdf17 See page 229 in the OneNYC plan to learn more about HVI18 Damiano H et al NYCrsquos Risk Landscape A Guide to Hazard Mitigation (NYC Emergency Management 2014) 103
Heat can be lethal for all but its impact on New Yorkers is not equal
sensitivity to heat Community districts in red and orange in Figure 3 are areas of highest vulnerability and these are particularly concentrated in east Brooklyn the south Bronx northern Manhattan and southeast Queens16 While all new capital projects should address heat impacts those sited in moderate to high vulnerable HVI areas should implement multiple strategies to reduce the Urban Heat Island and help address the high vulnerability in these neighborhoods
NYC Mayorrsquos Office of Recovery and Resiliency Climate Resiliency Design Guidelines
11IIA INCREASING HEAT
1 Urban Heat Island reductionNew capital construction should minimize its contribution to the Urban Heat Island effect The design interventions provided below offer benefits to the community and the facility through reduced heat loading reduced energy costs andor improved occupant health and thermal comfort The appropriate combination of design interventions will vary dependent on the project scope
a) Increase the solar reflectance of surfaces by utilizing light-colored pavement coatings and materials in combination with shading with a minimum target of 50 of the non-structure areas of facility sites19
Lighter reflective surfaces help reduce the Urban Heat Island effect heat loading and internal building temperatures and extend the lifespan of rooftops and heating ventilation and air conditioning (HVAC) equipment The City has taken steps towards reducing ambient temperatures such as implementing the NYC Cool Roofs program20 New buildings as well as existing buildings with roofs going through significant repairs are required by law to paint their roofs white This program intervention reduces a buildingrsquos contribution to Urban Heat Island effect and provides energy savings by coating the normally dark concrete roof surface with white paint allowing the roof to reflect solar radiation
b) Increase the shading of surfaces by planting trees or other vegetation in combination with cool pavements with a minimum target of 50 of the non-structure areas of facility sites
Shady areas with heat- and in coastal areas salt-tolerant vegetative species can help keep buildings cool and provide energy savings as well as lower temperatures
c) Meet Climate Zone 6 standards for fenestration and insulation (See Section ECC C402 in Chapter C4 of the 2016 NYC Energy Code) to improve efficiency of building envelopes
NYC is currently in Climate Zone 4 NYC already requires that small residential building envelopes are designed to meet higher insulation and fenestration requirements to improve energy efficiency21 All City capital projects including non-residential facilities should meet this standard
d) Select greenblue roofs andor other appropriate landscape elements that maximize cooling with help of landscape architects
The City already encourages the use of green and blue roofs on buildings to reduce the Urban Heat Island effect22 provide stormwater management and increase the useful life of the roof Besides replacing dark roof surfaces green roofs and vegetation also provide shade and keep the air cool through evapotranspiration by releasing moisture into the atmosphere Blue roofs coupled with light colored roofing material can provide stormwater management and rooftop cooling Some of these designs support the shading and solar reflectance goal in Step a) above Additionally City capital projects are subject to Leadership in Energy and Environmental Design (LEED) certification and green roofs can earn LEED credits23 Projects should integrate cooling strategies listed below based on project scope and a balance between costs and benefits
bull Green roofs or blue roofs on a broader range of facilities (including industrial buildings storage garages administration buildings etc)
19 Urban Green Council (2010) Green Codes Task Force Proposed code ldquoEF 12 Reduce Summer Heat with Cool Shady Building Lotsrdquo20 Local Law No 21 (2011) amended Chapter 12 of the NYC Building Code to update roof coating standards Also
see Cool and Green Roofing Manual (DDC) 2007 for more information on NYC standards for cool and green roofs httpwwwnycgovhtmlddcdownloadspdfcool_green_roof_manpdf
21 Read more about the code here httpswww1nycgovsitebuildingscodes2016-energy-conservation-codepage22 See Cool and Green Roofing Manual (DDC) 2007 for more information on NYC standards for cool and green roofs
httpwwwnycgov htmlddcdownloadspdfcool_green_roof_manpdf23 See Local Law No 32 (2016) for more information
NYC Mayorrsquos Office of Recovery and Resiliency Climate Resiliency Design Guidelines
12
2 Minimize impact from increasing heatThis section provides information to support making design adjustments to capital projects to reduce impacts to equipment structures landscapes and materials from rising average temperatures and increasing extreme heat events
a) Review forward-looking climate data provided in Table 1 and Table 2 Select heat projections according to the useful life of the facility and its primary
components then evaluate and address impacts in the steps below Table 1 provides design criteria for average temperatures and incidents of extreme heat events projected to different time periods across the 21st century Table 2 provides guidance on future 1 Dry Bulb Temperature and Cooling Degree Days for the NYC area The 1 Dry Bulb Temperature represents the ambient air temperature
IIA INCREASING HEAT
bull Vegetated structures such as shade trees and planters (to reduce heat loading on horizontal or vertical surfaces)
bull Bioswales rain gardens and bioretention24 bull Maximize planted permeable surfacesbull Other permeable surfaces (used for stormwater management these retain
moisture that evaporates as surface temperatures rise)25 bull Open-grid pavement system (at least 50 unbound)26 bull Evaluate site planning and building massing with regard to solar gainbull Solar panels for shading and to generate energy
Table 1 ndash Baseline and projected extreme heat events27
End of useful life
heat waves per year (3 or more consecutive days with max temperatures at or above 90degF)
days above 90degF
Annual average temperature
Baseline (1971-2000) 2 18 54degF
Through to 2039 4 33 572degF
2040-2069 7 57 606degF
2070-2099 9 87 643degF
Table 2 ndash Projections for 1 Dry Bulb temperature and Cooling Degree Days
Change in projected value for 2050s
Variable Baseline for Central Park (1971-2000)
Low estimate (10th percentile)
Middle range (25th to 75th percentile)
High estimate (90th percentile)
1 Dry Bulb temperature 91degF +3degF +4-6degF +7degF
Cooling Degree Days (base = 65degF) 1149 +37 +46-73 +87
Note Due to HVAC system typical useful life of 25 years or less only projections for the 2050s are shown Projections for the 2020s are not shown because it is anticipated that enough of a safety margin is employed already in current systems to withstand the temperature rise expected through the 2020s The NPCC is currently working on projections of 1 Wet Bulb temperatures which are expected to increase and may require systems to have higher moisture reducing capacity in addition to the enhanced cooling capacity
24 When siting bioswales consider groundwater levels and soil permeability and ensure that the site is not contaminated from past or present land uses A high water table may prohibit some applications
25 Urban Green Council (2010) Green Codes Task Force Proposed code ldquoSW 1 REDUCE EXCESSIVE PAVING OF SITESrdquo26 LEED Neighborhood Development v4 ldquoHeat island reductionrdquo credit27 Projected estimates for average temperatures are based upon 90th percentile change factor added to the baseline average annual
temperature from New York City Panel on Climate Change (2015)
NYC Mayorrsquos Office of Recovery and Resiliency Climate Resiliency Design Guidelines
13IIA INCREASING HEAT
b) Evaluate potential impacts on systems and materials Heat impacts on a facility are highly contingent on the facility type and should be reviewed on a case-by-case basis28 A decrease in the useful life or operational capacity of a facility or components of a facility may occur due to rising temperatures Interventions will also vary depending on whether the project is a new capital investment or a substantial improvement to an existing facility Factors to evaluate as applicable to project scope include but are not limited to
bull Thermal expansion warping softening or other forms of material change or degradation of structural integrity occurring at an accelerated rate by excessive heat
bull Health and safety impacts on occupants vulnerable to heat bull Increased failure or reduced efficiency of electrical or mechanical systems bull Prioritization of critical loads for systems and components at the facility andbull Moisture control needs for buildings with a higher standard for fenestration and
insulation
The results of this evaluation will inform steps taken in the step below
c) Reduce heat impacts Review and implement specific changes to the facility design based on assessments
above Develop a strategy based on the specific type of facility its operational profile and its useful life A Design Strategies Checklist is available for use in Appendix 6 as a resource to track design approaches Specific areas of focus are
bull Electricity outages High temperatures drive demand for air conditioning and can increase the risk of facility equipment failure potentially broader grid disruptions or brownouts2930 To manage this risk design City buildings and infrastructure to withstand periods without electricity using the following approaches in particular if they provide critical or essential services
Ǯ Identify and assess how much of the facilityrsquos load is critical (eg ldquocritical loadrdquo) including the necessary duration of the backup power supply (eg is backup power needed for 8 hours or multiple days) Determining what loads are critical and how long they should be powered for is essential for a facilityrsquos operations and what the role of the facility will have in an emergency situation31
Ǯ Depending on the size of the critical load and budget different backup power supply options could range from backup generators (eg diesel natural gas) to hybrid systems (eg solar + battery storage + appropriately sized generator) Each option has different trade-offs that should be considered in terms of cost feasibility and environmental impacts For shorter duration needs andor smaller critical loads buildings with existing solar systems should consider adding storage to provide a resiliency benefit In some cases co-generation systems may make sense from an economic and resiliency perspective especially if there
28 Sector- and facility-specific impacts vary greatly For examples of sector-specific impacts and design responses see Flooded Bus Barns and Buckled Rails (FTA 2011) and Ready to Respond Strategies for Multifamily Building Resilience (Enterprise Green Communities 2015)
29 McGregor et al (2013) Two Degrees The Built Environment and Our Changing Climate Routledge Press30 High temperatures also increase energy demand which can increase fossil fuel based greenhouse gas emissions31 The key roles of the facility that need to be identified are operational hours number of occupants and electrical loads needed for the
desired operations Electrical equipment and appliances for the desired operations may include - but are not limited to - safety lighting life-supporting systems fire protection systems telecommunications equipment mechanical systems to mitigate extreme temperatures and computing equipment Every facility is unique Operational characteristics and load profiles need to be established prior to sizing the equipment required to keep the facility in operational mode
NYC Mayorrsquos Office of Recovery and Resiliency Climate Resiliency Design Guidelines
14IIA INCREASING HEAT
is a significant heating andor cooling load in addition to electricity demand32
Ǯ Depending on the option assess need to invest in internal electricity rewiring and building energy management systems (eg switches reconfiguration of distribution infrastructure to isolate critical loads from non-critical loads and the ability to island from the broader grid during the event of a larger disruption software and hardware to manage the deployment of hybrid systems) andor need for external hookups for temporary generators and boilers33
bull Failure in facility ventilation electrical and air conditioning systems Some systems designed to meet the requirements of past climate may overheat and fail during extreme events Some design interventions include34
Ǯ Selecting systems with higher heat tolerance Ǯ Adding Energy Recovery Ventilation systems Ǯ Providing additional or redundant ventilation systems either mechanical or
natural to cool electrical equipment Ǯ Optimizing building layout by
bull segregating temperature sensitive electronics and computer control system from other systems
bull placing heat generating equipment like transformers and switchgear outdoors where permitted and
bull splitting the facility cooling loads among different HVAC systems in facility for redundancy and better zone control
bull Passive solar cooling and ventilation There are numerous design features that provide passive solar cooling for buildings to help maintain lower internal ambient temperatures with less air conditioning These features also help keep facilities habitable during extended grid failures when generators fail or must be reserved for critical functions Some design features include35
Ǯ Appropriate east-west orientation Ǯ Passive ventilation design Ǯ Vertically stacked double skin facades Ǯ Exterior window shades Ǯ Light colored exteriors Ǯ Shaded arcades Ǯ Thermally massive materials Ǯ High performance glazing Ǯ Operable windows
32 To learn more see the Building Resiliency Task Force report from Urban Green Council (2013)33 Ibid 34 Flooded Bus Barns and Buckled Rails FTA Office of Budget and Policy 201135 These and other examples are found in McGregor et al (2013) Two Degrees The Built Environment and Our Changing Climate
Routledge Press Also see Flooded Bus Barns and Buckled Rails FTA Office of Budget and Policy 2011
NYC Mayorrsquos Office of Recovery and Resiliency Climate Resiliency Design Guidelines
15IIB INCREASING PRECIPITATION
B INCREASING PRECIPITATIONThe intensity and frequency of precipitation events are projected to increase with climate change creating new challenges for stormwater management and impacts to the built environment such as
bull The potential for greater frequency of stormwater management systems being overwhelmed36
bull More frequent and severe flooding of buildings and infrastructure in areas across the city and
bull Greater variability in rainfall events annually including the chance of drought
The goal for this section is to guide stormwater management approaches including infiltration increases in on-site storage volume and where possible increases in sewer capacity to account for precipitation increases associated with climate change Designers should develop and consider design interventions that would decrease site contribution to sewer in-flows beyond the existing NYC Building Code requirements Given its complexity the Department of Environmental Protection (DEP) is also evaluating climate impacts to the sewer system on a drainage-wide level Proactive design such as increasing on-site infiltration and storm water retention can contribute to system resiliency on a site-specific basis
BackgroundNYCrsquos drainage systems are designed to handle approximately the current 3-year intensity-duration-frequency (IDF) event in most areas of the city where sewers were built prior to 1970 In locations with sewers built after 1970 the capacity was built to handle the 5-year event NYCrsquos network of drainage systems can experience flooding above those thresholds due to widespread precipitation events or by localized intense storms (sometimes called ldquocloudburstsrdquo) causing flooding and backups Climate change projections indicate that flooding resulting from multiple types of precipitation events may increase in frequency This increasing probability is forecast for all types of precipitation events in NYC although there is greater uncertainty around future short duration events Relying on sewers alone to manage extreme precipitation events will not be sufficient in a changing climate The City plans to reduce impervious areas and provide additional storage capacity to reduce flood damage For managing stormwater from larger storms such as at the 50- and 100-year recurrence intervals DEP is increasingly considering the role of streets and open space in managing flow this is referred to as a dual drainage design approach The City is piloting projects to test this dual drainage approach
Another set of interventions include Bluebelt best management practices (BMPs) such as constructed wetlands storm water ponds and stream restorations that emulate pre-development conditions to manage large volumes of water and green infrastructure37 which in NYC have generally been designed to reduce flooding and combined sewer overflow respectively They are not typically sized to manage precipitation events of the same magnitude as sewers which serve as primary drainage conveyance However Bluebelt BMPs green infrastructure and other stormwater management tools may provide an additional buffer for larger storm events by temporarily storing andor infiltrating runoff that would otherwise be directed into the sewer system For instance areas of open space commonly found in NYC may not provide adequate environments for trees and other plantings However in these cases other types of green infrastructure like permeable surfaces and subsurface detention and retention installations would still be considered feasible
36 NYC is already taking steps to address this problem which will worsen with climate change To learn more about how NYC is using green and gray infrastructure to manage stormwater visit httpwwwnycgovhtmldephtmlstormwaterindexshtml
37 NYC DEP NYC Green Infrastructure Program
NYC Mayorrsquos Office of Recovery and Resiliency Climate Resiliency Design Guidelines
16IIB INCREASING PRECIPITATION
The City led by DEP continues to develop its options for managing heavier storm events due to climate change DEP is examining approaches to evaluate sea level rise and rainfall intensity for stormwater management and where possible sewer capacity These efforts will integrate forward-looking climate data into the design of these capital assets and the compounding factors of heavier rain storms and sea level rise will likely require greater infiltration and on-site storm water retention capacity Agencies and consultants should work directly with DEP to develop strategies on a given site necessary to meet expected increases in rainfall intensities and frequencies
1 Precipitation design adjustment for on-site stormwater systems
Based upon the design storm required for the City facility in design follow the steps below and review recommended design interventions
a) Identify the duration of the design event required The current 50-year IDF can be used as a proxy for the future 5-year storm
(projected for the 2080s) Design on-site detentionretention systems to retain the volume associated with the current 50-year IDF curve (see Figure 4 below) Design the on-site system to release at the maximum rate as specified in 15 Rules of the City of NY (RCNY) Chapter 3138
b) Conduct sensitivity analysis Compare the retentiondetention required for the current 5-year IDF versus the
38 Refer to existing codes and standards as well when determining the existing required storm as NYC requires different sizes of design storms for infrastructure and buildings For example NYC Plumbing Code Chapter 11 and Title 15 of the Rules of the City of New York Chapter 31
02
04
06
10
20
40
60
100
200
-2316090
Rai
nfal
l Int
ensi
ty (
inch
es p
er h
our
)
DurationsruoHsetuniM
5 10 15 30 1 2 3 6 12 18
5-yr
10-yr25-yr
50-yr
100-yr
NEW YORK NEW YORK
Figure 4 - Current Intensity-Duration-Frequency Precipitation Curve for NYC adapted from US Department of Commerce Weather Bureau Technical Paper 25
NYC Mayorrsquos Office of Recovery and Resiliency Climate Resiliency Design Guidelines
17IIB INCREASING PRECIPITATION
c) Identify design interventions for managing increased precipitation40 There are different ways to manage stormwater better and avoid urban flooding after
intense rain Choose the right combination of interventions after considering the site location operational requirements cost benefits and useful life of the intervention Some examples of design interventions are
bull Minimize increases in impervious surfacebull Utilize strategies that infiltrate evaporate or reuse rainwater to achieve storm
water volume reductions Then choose strategies that detain (delay drainage) to manage the rate of the storm water flow into the Cityrsquos drainage system
bull Install stormwater infiltration detention and storage (eg bioswales41 green roofs blue roofs and other blue or green infrastructure storage basins or tanks)
bull Protect areas below grade from floodingbull Keep catch basin grates clearbull When implementing perimeter protections ensure that interior water
management is also accounted for andbull Explore interventions to protect underground utility and telecommunications
infrastructure from water damage
d) Use appropriate DEP guidelines to perform the above tasks using the higher design storm
The three currently prescribed DEP guidelines are as follows
bull Guidelines for the Design and Construction of Stormwater Management Systems July 201242
bull Criteria for Detention Facility Design November 201243 bull DEP Site Connection Proposal Application and Guidelines44
Note on stormwater standards As DEP updates stormwater standards and develops specific tools to evaluate impacts of increased precipitation and drainage strategies for on-site storm water management these changes will be reflected in future versions of these Guidelines However it is recommended that the designer should develop and consider design interventions that would increase the on-site storage beyond the existing requirements Also a methodology is under development that will establish a consistent citywide process for addressing legal grade which will have further implications for how extreme precipitation is managed
39 NYC DEP Standards for Stormwater Release Rates available at httpwwwnycgovhtmldephtmlenvironmental_reviewsstormwater_release_ratesshtml 40 Also see DEP Guide to Rain Event Preparedness at httpwwwnycgovhtmldeppdfbrochuresflood-preparedness-flyerpdf and
Ready to Respond Strategies for Multifamily Building Resilience at httpwwwenterprisecommunityorgresourcesready-respond-strategies-multifamily-building-resilience-1335641 When siting bioswales consider groundwater levels and soil permeability and ensure that the site is not contaminated from past or
present land uses A high water table may prohibit some applications42 Available at httpwwwnycgovhtmldephtmlstormwaterstormwater_management_constructionshtml43 Available at httpwwwnycgovhtmldeppdfwater_sewer30_criteria_for_detention_facility_design_06062012pdf44 Available at httpwwwnycgovhtmldeppdfwater_sewer24pdf
current 50 year IDF to determine the cost and benefits associated with complying with these Guidelines Use the Evaluation of Project Benefits section below and Appendix 4 for guidance on how to identify and assess benefits Given the results of the costbenefit analyses review the added benefit of designing retentiondetention using greater magnitude storms (eg 100-year) or lower (eg 25-year) The goal is to maximize retentiondetention capacity given site and cost constraints as well as through an evaluation of the benefit of adding capacity to detainretain water for larger storm events
NYC Mayorrsquos Office of Recovery and Resiliency Climate Resiliency Design Guidelines
18
2 Incorporating climate change projections into DEP drainage planning
The first line of defense for managing intense precipitation events does not require changes to the sewer system as described above For drainage and wastewater infrastructure planning in a changing climate the sewer network and wastewater infrastructure should be qualitatively evaluated from the upstream pipes to the regulator chambers pump stations interceptors and ultimately to the downstream outfall to determine the feasibility of incorporating climate change projections into the system design For DEP storm sewer projects FY 2021 or later in separately sewered drainage areas where the design is in the early stages and there is free discharge the agency will evaluate the feasibility of revising the design to incorporate climate projections into the design If the project (including the prescribed changes) passes the costbenefit analysis then DEP will consider incorporating climate change projections into the sizing However changes in one part of the system must be carefully evaluated For example any upsizing of the regulator chamber or the high point of the system can negatively impact the design and operation of the wastewater infrastructure and residencesbusinesses on the system and can lead to a diminished the level of service
DEP is in the process of developing a hydrologic and hydraulic (HampH) model to estimate runoff flow for future climate scenarios and is evaluating rainfall hyetographs for the existing and future rainfall scenarios to be included in the drainage planning process In addition DEP currently coordinates with ORR for drainage planning as a part of coastal resiliency projects A more detailed methodology to incorporate climate change projections into drainage planning will be developed for version 30 of the Climate Resiliency Design Guidelines to be released in April 2019
IIB INCREASING PRECIPITATION
NYC Mayorrsquos Office of Recovery and Resiliency Climate Resiliency Design Guidelines
19IIC SEA LEVEL RISE
non-critical components within a larger facility or campus (eg at a maintenance yard differentiate between structures and equipment) Critical components essential to the facilityrsquos functionality should be protected to the higher standard for criticality even if the facility itself may be non-critical Some examples of critical components include electrical distribution and switching areas motor-control centers chemical feed equipment boilers communications systems monitoring and safety equipment HVAC units fire alarms and suppression equipment furnaces elevators emergency fuel supplies emergency generators and hazardous material storage Component protection should also be evaluated if a facility is expected to be fully operational during a flood event or if it is expected to quickly resume full operations after an event
For buildings and infrastructure with a long useful life it is not always cost effective or operationally feasible to design a facility to be resilient to hazards faced at the end of its useful life In these cases the most resilient design will be one that provides extra protection against hazards in the initial decades while also leaving open design alternatives for updating resiliency measures as new data is provided or new risk assessments are completed This flexible adaptation pathways approach builds in options to protect assets later in life as demonstrated in an example shown in Figure 1 (in Section I)
Other considerations to keep in mind includebull These Guidelines apply to all City capital projects except coastal flood protection
systems which are designed to different standards than those provided here for
C SEA LEVEL RISEThis section provides tools to 1) determine if the project will be subject to tidal inundation during its useful life due to sea level rise and 2) incorporate sea level rise into flood protection levels of capital projects For projects in the current and future 1 annual chance floodplains sea level rise-adjusted design flood elevations (DFE) are provided and reflect the criticality of the asset and its useful life Background NYC has experienced the devastation of coastal storms most recently during Hurricane Sandy Sea level rise is projected to increase the depth extent and frequency of flooding from storm surge45 Sea level rise will also regularly inundate some low-lying areas during high tides Current flood protection heights are determined by using the base flood elevation established by the FEMA Preliminary Flood Insurance Rate Map (PFIRM) 201546 and the standard of protection for buildings in the floodplain in Appendix G of the NYC Building Code47 These Guidelines augment existing requirements for two primary purposes ensuring City facilities built today incorporate sea level rise and critical assets (as defined in Table 4) are protected to a higher level It is important to note that all projects and design interventions must comply with NYC Building Code
Designers should differentiate between critical and
45 New York City Panel on Climate Change Report Chapter 2 Sea Level Rise and Coastal Storms (2015)46 However NYC Building code G10222 requires that designers review both the PFIRM and the effective FIRM and use the more
restrictive of the two 47 For information on the differences between FEMA FIRM PFIRM and the Cityrsquos forward-looking flood maps see Appendix 3
Critical components essential to the facilityrsquos functionality should be protected to the higher standard for criticality even if the facility itself is non-critical
NYC Mayorrsquos Office of Recovery and Resiliency Climate Resiliency Design Guidelines
20IIC SEA LEVEL RISE
buildings and other physical infrastructure Many of NYCrsquos coastal flood protection systems are currently being developed to comply with FEMA accreditation for flood levee systems48 The City plans to develop further guidance for designing coastal protection projects
bull For information on the differences between FEMA FIRM PFIRM and the Cityrsquos forward-looking flood maps see Appendix 3
bull Coincident stressors from sea level rise should also be considered For example bridge scour may increase as sea levels rise Similarly flooding during heavy rainfall events can be worsened due to higher tailwater conditions associated with high sea levels Be aware of how different risks may interact and how different interventions can be deployed to address multiple hazards or provide other co-benefits
bull Note projects that require discretionary approval are required to incorporate sea level rise projections as part of the NYC Waterfront Revitalization Program49 and
bull A methodology is under development that will establish a consistent citywide process for addressing legal grade which will have further implications for how sea level rise and precipitation are managed
For more information see Section IE Designers should use the resources and methods described in this section to 1) assess tidal inundation due to sea level rise and 2) address risks in the current and future floodplains
1 Assessing tidal inundation due to sea level riseTidal flooding currently affects parts of NYC and is projected to worsen as sea levels rise and inundate low-lying coastal sites during high tides When determining a site location or establishing scope of substantial improvements for other types of coastal facilities the project team will consider alternative sites outside of zones threatened with regular inundation if resiliency actions are not taken Some facilities such as wastewater treatment plants and harbor facilities need to be near the coast for operational purposes
a) Determine tidal inundation risk from sea level rise Use the Flood Hazard Mapper (httpwwwnycgovfloodhazardmapper)50 to see if your
site is in an area inundated from high tide plus sea level rise within the projectrsquos useful life For example if the useful life ends between 2040 and 2069 choose the 2050s High Tide map) Determine risk only from high tide and sea level rise separate from flood events Follow the instructions in Figure 5 and refer to the example in Figure 6 to review inundation at the end of an assetrsquos useful life
48 For more information please visit httpwwwfemagovfema-levee-resources-library49 For more information visit httpwwwnycgovwrp50 The Flood Hazard Mapper relies on publicly available data to present these map resources Users should also refer to FEMA and the
NPCC for official information
Figure 5 - Flood Hazard Mapper high tide plus sea level rise at httpwwwnycgovfloodhazardmapper
NYC Mayorrsquos Office of Recovery and Resiliency Climate Resiliency Design Guidelines
21IIC SEA LEVEL RISE
b) Address flood risk If the Flood Hazard Mapper shows that the facility is expected to be inundated by
high tides within its useful life or if primary access roads are at risk of inundation consider alternative site options
- OR - If the site is not expected to be regularly inundated by tides proceed to the next
section 2 Addressing Risks in the Current Floodplain
Note on calculating tidal inundations with sea level rise if a project team is interested in understanding the depth of tidal inundation given climate change projections follow these steps First determine the Mean Higher High Water (MHHW) elevation in feet-NAVD 8851 datum nearest to the site If the MHHW data is unavailable from a site specific survey refer to httpwwwnycgovwrp for a list of MHHW elevations (NAVD88) at tide stations across the city52 Second add the high estimate (90th percentile) of expected sea level rise (see Table 8 in Appendix 2) for the year corresponding to the facilityrsquos useful life to the MHHW to determine the projected depth of tidal inundation with sea level rise
51 North American Vertical Datum of 1988 (NAVD 88) is the vertical control datum of orthometric height established for vertical control surveying in the US based upon the General Adjustment of the North American Datum of 1988
httpswwwngsnoaagovdatumsvertical52 SLR elevations at httpwwwnycgovwrp are adjusted to account for sea level rise since the last tidal epoch If no other resource is
available to determine MHHW use the NOAA Online Vertical Datum Transformation tool to calculate the MHHW in feet-NAVD
Figure 6 - Flood Hazard Mapper with high tide in the 2020s (left) and in the 2080s (right) at httpwwwnycgovfloodhazardmapper
NYC Mayorrsquos Office of Recovery and Resiliency Climate Resiliency Design Guidelines
22IIC SEA LEVEL RISE
2 Addressing risks in the current floodplain53
A facility located in the current 1 annual chance floodplain (PFIRM 2015)54 will face increasing risk of flooding during its useful life due to sea level rise increasing the depth of coastal storms This section provides a process for adjusting the design flood elevation required by code to account for sea level rise
a) Find the location of the facility using the Flood Hazard Mapper (httpwwwnycgovfloodhazardmapper) and follow the instructions in Figure 7
bull Choose to view the layer ldquoFEMA Preliminary FIRM 2015rdquo bull Click on the facility site in the 1 floodplain to view the base flood elevation
Figure 7 - Flood Hazard Mapper with FEMA PFIRM (2015) at wwwnycgovfloodhazardmapper
b) If the facility is not in the current 1 annual chance floodplain (PFIRM 2015) proceed to the next section ldquo3 Addressing risks in the future floodplainrdquo
- OR - If the facility is in the current 1 annual chance floodplain (PFIRM 2015) note
the base flood elevation (BFE) and proceed to Step c) below Please note if a facility has multiple BFEs or if the site is partially in the 1 annual chance floodplain it is recommended to use the highest BFE as the current BFE for the entire site
c) Establish a sea level rise-adjusted DFE Use the current base flood elevation at your site the facilityrsquos useful life and its
criticality level to determine the design flood elevation using Table 4 (on the next page) as a basis of design
53 This process for adjusting the design flood elevation to account for sea level rise satisfies the criteria of the climate-informed science approach described at the state and federal level
54 FEMA updates its flood maps periodically As of April 2018 the most recent maps are the Preliminary Flood Insurance Rate Maps (PFIRM) available at DCPrsquos Flood Hazard Mapper (httpwwwnycgovfloodhazardmapper) Also note that NYC Building Code requires developers to use the PFIRM (2015) or the FIRM (2007) whichever is more restrictive For more information on these requirements please refer to Appendix G of the NYC Building Code Please note that the DCP maps are not official and all site locations should be confirmed with the official FEMA PFIRM NYC will provide information on the latest flood maps as they are updated
NYC Mayorrsquos Office of Recovery and Resiliency Climate Resiliency Design Guidelines
23IIC SEA LEVEL RISE
Table 4 - Determine the sea level rise-adjusted design flood elevation for critical and non-critical facilities55
Critical facilities
End of useful life Base Flood Elevation (BFE)56 in NAVD 88 + Freeboard57 + Sea Level Rise
Adjustment58= Design Flood Elevation (DFE) in
NAVD 88Through 2039 FEMA 1 (PFIRM) 24rdquo 6rdquo = FEMA 1 + 30rdquo
2040-2069 FEMA 1 (PFIRM) 24rdquo 16rdquo = FEMA 1 + 40rdquo2070-2099 FEMA 1 (PFIRM) 24rdquo 28rdquo = FEMA 1 + 52rdquo
2100+ FEMA 1 (PFIRM) 24rdquo 36rdquo = FEMA 1 + 60rdquoNon-critical facilities
End of useful life Base Flood Elevation (BFE) in NAVD 88 + Freeboard + Sea Level Rise
Adjustment = Design Flood Elevation (DFE) in
NAVD 88Through 2039 FEMA 1 (PFIRM) 12rdquo 6rdquo = FEMA 1 + 18rdquo
2040-2069 FEMA 1 (PFIRM) 12rdquo 16rdquo = FEMA 1 + 28rdquo2070-2099 FEMA 1 (PFIRM) 12rdquo 28rdquo = FEMA 1 + 40rdquo
2100+ FEMA 1 (PFIRM) 12rdquo 36rdquo = FEMA 1 + 48rdquoAdditional analysis should be conducted to incorporate wave action and wave run-up in DFE calculations especially in areas that are located within the FEMArsquos 1 annual chance Limit of Moderate Wave Action (LiMWA) zone Wave run up is the maximum vertical extent of wave uprush above surge
Definition of critical buildings and infrastructure for determining DFE in Table 4The criticality definitions below are for use in the application of the Guidelines only All items identified as critical in NYC Building Code Appendix G are critical in these guidelines however this list includes additional facilities that are not listed in Appendix G59 If a facility is not listed here it is considered non-critical for the purposes of determining freeboard
bull Hospitals and health care facilitiesbull Fire rescue ambulance and police stations and emergency vehicle garages bull Jails correctional facilities and detention facilities bull Facilities used in emergency response including emergency shelters emergency preparedness communication
operation centers communication towers electrical substations back-up generators fuel or water storage tanks power generating stations and other public utility facilities
bull Critical aviation facilities such as control towers air traffic control centers and hangars for aircraft used in emergency response
bull Major food distribution centers (with an annual expected volume of greater than 170000000 pounds)60 bull Buildings and other structures that manufacture process handle store dispose or use toxic or explosive
substances where the quantity of the material exceeds a threshold quantity established by the authority having jurisdiction and is sufficient to pose a threat to the public if released61
bull Infrastructure in transportation telecommunications or power networks including bridges tunnels (vehicular and rail) traffic signals (and other right of way elements including street lights and utilities) power transmission facilities substations circuit breaker houses city gate stations arterial roadways telecommunications central offices switching facilities etc
bull Ventilation buildings and fan plantsbull Operations centersbull Pumping stations (sanitary and stormwater)bull Train and transit maintenance yards and shopsbull Wastewater treatment plantsbull Water supply infrastructurebull Combined-sewer overflow (CSO) retention tanksbull Fueling stationsbull Waste transfer stations and bull Facilities where residents have limited mobility or ability including care facilities and nursing homes
55 If an industry standard does not include freeboard in its flood protection standards for particular infrastructure assets then only consider the sea level rise adjustment when determining flood protection levels
56 Note that NYC Building Code requires developers to use the PFIRM (2015) or the FIRM (2007) whichever is more restrictive For more information on these requirements please refer to Appendix G of the NYC Building Code
57 These freeboard values reflect NYC Building Code Appendix G Table 2-1 which establishes the minimum elevation of the top of lowest floor Appendix G requires other freeboard values for other parts of structures and in different parts of the floodplain Refer to Appendix G for the appropriate freeboard and use that value in Table 4 above
58 The sea level rise figures provided are for the middle of the 25th-75th percentile range projections from the NPCC These values do not necessarily indicate the average of all models
59 The structural occupancy categories outlined in Appendix G of the NYC Building Code are the same as ASCE 7 used for structural design For critical buildings structural design should comply with ASCE 7 and 24 for design class IV
60 This threshold represents the median volume of main food distributors in NYC according to statistics collected as part of the Five Borough Food Flow study in 2016 available at
httpswwwnycedccomsystemfilesfilesresource2016_food_supply-resiliency_study_resultspdf 61 The threshold quantity for hazardous materials is established by Chapter 7 of Title 24 of the NYC Administrative Code
NYC Mayorrsquos Office of Recovery and Resiliency Climate Resiliency Design Guidelines
24IIC SEA LEVEL RISE
Figure 9 ndash Outdoor emergency generator for the critical building
This case study provides an example of how to calculate a sea level rise-adjusted DFE based on the useful life of a hypothetical critical services building and its primary component
Step 1 Organize the site by various critical or primary components and their year of construction Determine their useful life along with the associated future year scenario for flood risk assessment In this example the building structure and the outside emergency generator are the most at-risk components from combined sea level rise and coastal storm surge
Step 2 Overlay the site footprint area over the effective current PFIRM or FIRM and the corresponding future year scenario FEMA 1 to identify flood risk to the site From overlaying the 2015 preliminary FEMA floodplain over the site it was determined that the site has a 1 annual chance of flooding with a base flood elevation of 13rsquo NAVD Step 3 Evaluate the criticality of each primary component of the facility based on the Guidelinesrsquo definition for critical infrastructure (Table 4) This (hypothetical) building is critical
Step 4 Use Table 4 to determine the sea level rise adjustment and freeboard requirements for each component and calculate the DFE for each that corresponds to its useful life period
Step 5 Compare the DFE of each component and the associated Guidelinesrsquo recommended DFE to calculate anticipated flood depth
CASE STUDY Adjusting the DFE for Sea Level Rise
Table 5 ndash Example of how to calculate a sea level rise-adjusted DFE for a critical facility
Construction year Components Useful
Life
Future Year Scenario
[Useful Life + Const
Year]
BFE in NAVD
88 (feet)
Freeboard + Sea
Level Rise Adjustment
(feet)
Adjusted DFE in
NAVD 88 (feet)
2010 Building Structure
70 years 2070-2099 130rsquo 2rsquo+23rsquo 173rsquo
2010Outdoor
Emergency Generator
25 years
Through 2039 130rsquo 2rsquo+05rsquo 155rsquo
Figure 8 - Example of how to locate a facility within the current floodplain and determine the BFE Figure 9 (inset) - Outdoor emergency generator at the facility
Figure 10 - This schematic shows how to determine the design flood elevation of a facility within the current 1 floodplain
Illustrative not to scale
NYC Mayorrsquos Office of Recovery and Resiliency Climate Resiliency Design Guidelines
25IIC SEA LEVEL RISE
Figure 11 - Flood Hazard Mapper with future 1 annual chance floodplain (adjusted for sea level rise) at httpwwwnycgovfloodhazardmapper
b) If the site is not in the future floodplain no flood protection is required for this facility
- OR - If the site is in the future floodplain identify the nearest adjacent base flood
elevation at the project site in the current 1 annual chance floodplain (PFIRM 2015) using the Flood Hazard Mapper62
c) Use Table 4 to determine the DFE Add freeboard and the sea level rise-adjustment to the nearest adjacent BFE on the
current 1 annual chance floodplain (PFIRM 2015) to determine the DFE
d) Apply the DFE calculation from Table 4 to the protected facility See Figures 12 and 13 for an illustration of how to calculate the DFE
62 Maps of future floodplains show the impacts of sea level rise alone and do not consider how changes in stormsrsquo climatology might also affect wave action and the full extent of the floodplain
3 Addressing risks in the future floodplainIf the facility is not in the current 1 annual chance floodplain (PFIRM 2015) it may still be at risk in the future from flooding as sea level rise increases the extent of the floodplain Follow the steps below to determine if your facility is located in the future floodplain and if so what sea level rise-adjusted DFE to use
a) Use the Flood Hazard Mapper (httpwwwnycgovfloodhazardmapper) to determine if the facility site will be in the future 1 annual chance floodplain
Assess if by the end of the facilityrsquos useful life the floodplain is projected to increase to encompass all or part of the project site For example if the useful life ends between 2040 and 2069 choose the 2050s floodplain map Refer to the steps in Figure 11 below
NYC Mayorrsquos Office of Recovery and Resiliency Climate Resiliency Design Guidelines
26IIC SEA LEVEL RISE
Figure 12 - This schematic map shows how to locate the nearest adjacent 1 floodplain elevation
Figure 13 -This schematic shows how to determine the design flood elevation of a facility that is outside of the current 1 floodplain
CASE STUDY Identifying a Base Flood Elevation (BFE) in the Future Floodplain
Illustrative not to scale
NYC Mayorrsquos Office of Recovery and Resiliency Climate Resiliency Design Guidelines
27IIC SEA LEVEL RISE
4 Identify appropriate design interventions
63 Additional resources for identifying adaptive strategies Urban Waterfront Adaptive Strategies (NYC Department of City Planning httpswww1nycgovassetsplanningdownloadpdfplans-studiessustainable-communitiesclimate-resilienceurban_waterfrontpdf Floodproofing Non-Residential Buildings (FEMA) at httpswwwfemagovmedia-libraryassetsdocuments34270 Ready to Respond Strategies for Multifamily Building Resilience (Enterprise Green Community) at
httpwwwenterprisecommunityorgresourcesready-respond-strategies-multifamily-building-resilience-1335664 While natural systems-based approaches ameliorate flooding their use for storm surge or wave mitigation would need to be quantified
before contributing towards the design flood elevation 65 For more information see FEMArsquos Floodproofing Non-Residential Buildings at httpswwwfemagovmedia-libraryassetsdocuments34270
Operational requirements and continuity plans can inform the selection of appropriate design interventions particularly in terms of how quickly a site needs to be up and running after a flood event Some examples of how functional uses can pair with interventions include
bull A facility that needs to be operating during or immediately after a flood event may need to be dry floodproofed using permanent barriers or designed for passive survivability (such as a police or fire station)
bull A facility that needs to recover quickly after an event could elevate prioritized equipment and have deployable barriers
bull A site that can recover over a longer duration of time could be temporarily inundated during an event (such as parks or plazas) The use of resilient materials and strategies can reduce costly damage caused by temporary inundation
Different design interventions should be chosen based on the specific operational requirements of the project however these must meet the ASCE 24 design requirements for Coastal VE Zones
For all projects at risk of current or future flooding select protections that meet the projectrsquos design flood elevation Consider project-specific factors including the site location operational requirements existing continuity planning and cost63 A Design Strategies Checklist in Appendix 6 is available for use as a resource to track possible design approaches Some examples of design alternatives are
bull Site relocation where feasible conduct alternative site analysis
bull Permanent barriers at a site (eg floodwalls)
bull Deployable flood barriers (eg stop logs flood doorsgates inflatable barriers)
bull Natural systems-based approaches (eg living shorelines restored wetlands)64
bull Prioritized protection of electrical mechanical and other critical or costly-to-replace equipment above the design flood elevation (eg motors and controller boilers and furnaces fuel storage tanks duct work alarm systems and suppression equipment electrical panels electrical distribution and switching areas gas and electric meters telecommunications equipment chemical feed equipment HVAC units and emergency generators)65
bull Dry floodproofing design a facility to prevent water from entering
bull Wet floodproofing design a facility to permit floodwaters to flow in and out of the structure without causing significant damage (eg elevate or protect critical equipment use water-resistant building materials below the design flood elevation include flood vents and pumps)
bull Design redundant telecommunications conduit entrances for multiple carrier entry Telecom conduit should run to diverse manholes when possible
bull Install backup power for telecom equipment with design consideration for such equipment (eg installation above DFE)
bull Install outdoor-rated disconnect switch for telecommunications equipment on the roofbull Explore interventions to protect underground utilities and other telecommunications
facilities from water damagebull Install backflow preventers backwater valves and sump pumps for all buildings and
infrastructure in the floodplain as well as behind flood barriersbull Shoreline improvements that reduce the height of waves or attenuate waves where
feasible
NYC Mayorrsquos Office of Recovery and Resiliency Climate Resiliency Design Guidelines
28IIIA GENERAL METHODOLOGY TO ESTIMATE PROJECT BENEFITSIIIB CATEGORIES OF PROJECT BENEFITS
Designing and constructing facilities to handle the future climate loads above the current NYC codes and standards based on projected useful life of the components provides resiliency benefits The incremental costs to implement the Guidelinesrsquo recommended design interventions should be compared with the incremental benefits to aid agencies in making decisions about resilient design strategies The project design team should evaluate benefits of the interventions designed to meet Guidelinesrsquo recommended criteria for all the climate stressors qualitatively andor quantitatively For projects with construction costs below $50 million the project design team is recommended to perform a qualitative benefits assessment on the interventions that meet the Guidelinesrsquo recommendations for all applicable climate stressors For critical facilities or projects with construction costs over $50 million the project design team is recommended to perform quantitative benefit calculations to identify the optimal interventions that meet Guidelinesrsquo recommended design criteria
A GENERAL METHODOLOGY TO ESTIMATE PROJECT BENEFITSThis general methodology to perform qualitative and quantitative benefit calculations is recommended for use by project design teams at the beginning of and during the design process This methodology enables estimation of project benefits for a high-level benefit-cost analysis (BCA) that can be applied to evaluate and compare resiliency features designed to address sea level rise with coastal storm surge increased precipitation and extreme heat events The type of benefits provided by interventions designed to meet the Guidelinesrsquo design criteria can vary by climate stressors and typology of the facilities The main guiding principle in development of the high-level BCA methodologies included in these Guidelines was to balance simplicity with accuracy The project benefits categories identified within the methodology may not cover all the potential benefits provided by every facility type within NYC In particular the benefits of planning for increased precipitation are difficult to quantify Hence the project design team should use their discretion to modify this general benefit calculation methodology as needed to meet their project goals and objectives The project design team should develop appropriate input data whether quantitative or qualitative needed to estimate project benefits
B CATEGORIES OF PROJECT BENEFITSThere are three types of project benefit categories - direct benefits indirect benefits and other benefits - that can be used to perform qualitative assessments and develop quantitative estimates of monetary benefits for intervention alternatives designed to meet the Guidelinesrsquo recommendations These project benefit categories will help to perform a high-level benefit-cost analysis that balances accuracy with an appropriate level of effort
bull Direct Benefits include reduced or avoided physical damages to facilities and contents reduced or avoided displacements for residential structures and reduced life cycle or OampM costs that can be quantified as a primary result of implementing a specific hazard mitigation measure Table 12 in Appendix 4 provides a list of direct benefits and basic guidance on estimating and documenting values for sea level rise and increased precipitation-related flood hazards Note that given the current state of practice it is not possible to quantify reduced or avoided physical damages or residential displacements that result from a specific extreme heat mitigation measures Therefore direct benefits applicable to extreme heat hazards are limited to reduced life cycle costs applicable to certain measures such as green roofs Refer to Table 15 for details on direct benefits for extreme heat hazards
III EVALUATION OF PROJECT BENEFITS
NYC Mayorrsquos Office of Recovery and Resiliency Climate Resiliency Design Guidelines
29IIIB CATEGORIES OF PROJECT BENEFITS
bull Indirect Benefits include reduced or avoided service losses for non-residential
buildings public facilities andor infrastructure (utilities roads and bridges) based on the value of service continuity andor emergency services to New Yorkers that can be quantified as a secondary result of implementing a specific hazard mitigation measure Table 13 in Appendix 4 provides a list of indirect benefits and basic guidance on estimating and documenting values for sea level rise and increased precipitation-related flood hazards Note that given the current state of practice on extreme heat it is not possible to quantify reduced or avoided service losses that result from a specific extreme heat mitigation measures Therefore indirect benefits applicable to extreme heat hazards are limited to reduced energy costs such as cool roofs green roofs or shade trees Refer to Table 15 in Appendix 4 for details on indirect benefits for extreme heat hazards
bull Other Benefits where applicable other potential benefits may include social benefits for residents such as avoided stress and anxiety avoided lost productivity environmentalecosystem service benefits avoided need for emergency services and other potential benefits that can be estimated as a result of implementing a specific hazard mitigation measure Table 14 in Appendix 4 provides a list of other potential benefits and basic guidance on estimating and documenting values for sea level rise and increased precipitation-related flood hazards
Note on the ecosystem service benefit category in Table 14 the stormwater management benefits of green infrastructure should be distributed between the extreme heat and increased precipitation hazards since these measures provide both significant reductions in rainfall runoff as well as Urban Heat Island mitigation through evapotranspiration However there is currently limited data available to quantify the actual distribution of stormwater management benefits between the two hazards For various dual-benefit providing interventions careful considerations should be given to identify the appropriate benefits category provided by the intervention with a goal to avoid duplication of quantified benefits In this methodology the stormwater management benefits of green infrastructure are applied to the increased precipitation hazard in order to avoid a duplication of benefits Note on real estate and quality of life benefits additionally it is important to note that two potential benefit categories shown in Table 14 - real estate and quality of lifehealthavoided casualties - were not included in the current BCA methodology for sea level rise or increased precipitation hazards Although these categories could increase project benefits for sea level rise and increased precipitation hazards they were only applied to measures that address extreme heat hazards such as green roofs trees and other plantings Refer to Table 15 for a detailed summary of other benefit categories quantified as unit benefits for extreme heat hazards
NYC Mayorrsquos Office of Recovery and Resiliency Climate Resiliency Design Guidelines
30IIIC WHICH METHODOLOGY TO USEIIID BCA METHODOLOGY FOR PROJECTS UNDER $50 MILLION
D BCA methodology for projects under $50 millionThe project design team should develop design alternatives to meet the Guidelinesrsquo criteria which may be in excess of NYC code and standards requirements (baseline conditions) It is assumed that the project design team will develop alternatives to address each of the following applicable climate stressors - sea level risecoastal storm surge increased precipitation and extreme heat - separately Tables 12-15 in Appendix 4 provides a list of typical direct indirect and other benefits provided by various intervention typologies to reduce impacts from climate stressors During the qualitative assessment the project design team should consider that intervention strategies will have varying levels of reliability effectiveness benefits and cost implications during the qualitative assessment
The project design team is recommended to develop appropriate evaluation criteria and metrics for each of the applicable project benefit categories For each alternative the project design team could use either a scoring weighting ranking or other type of qualitative assessment framework to assess each applicable project benefit categories with the developed evaluation criteria and metrics Table 6 provides an example template to evaluate alternatives using a set of general evaluation criteria and metrics using a color-coded rating system (and see Table 7 for an example of how to complete the template) The project design team can utilize a similar template customized to their project goals and objectives This assessment allows agencies to screen the qualitative benefits for various alternatives that would then lead to development of final project components to match the available budget and goals of the project
Projects with total costs below $50 million recommended to conduct a qualitative assessment to identify the optimal interventions that meet Guidelinesrsquo design criteria using the ldquoD) BCA methodology for projects under $50 millionrdquo methodology below
C WHICH METHODOLOGY TO USEProjects with a total cost above $50 million or are highly complex or critical facilities recommended to conduct both a qualitative and quantitative benefit calculation to identify the optimal interventions that meet Guidelinersquos design criteria using the ldquoE) BCA methodology for projects above $50 millionrdquo below A quantitative BCA also must include qualitative factors
NYC Mayorrsquos Office of Recovery and Resiliency Climate Resiliency Design Guidelines
31IIID BCA METHODOLOGY FOR PROJECTS UNDER $50 MILLION
Qualitative Color Scale Green=Least resource intensive alternative Purple=most resource intensive yellow=medium level of resource intensity
Qualitative Evaluation Factors Description Relative Color Rating System
First CostsAdditional construction costs needed to incorporate Guidelinesrsquo recommended resilient design over the baseline project costs
Highest cost ($$$) rated as Purple whereas lowest cost ($) rated as Green
ConstructabilityEase of Implementation
Construction techniques and site conditions such as presence of major utilities conflicts and other conditions which dictate the level of constructability required for each alternative
Difficult to construct rated as Purple whereas easiest to construct rated as Green
Environmental ImpactsCo-BenefitsPermitting
Impacts to the built and natural environment such as circulation noise and hazardous waste plus the level of effort required for permitting (eg interventions in water require highest level of permitting requirement) from each alternative in addition to the baseline project condition
Highest environmental impacts and highest level of effort required for permitting rated as Purple whereas the least impact and level of effort rated as Green
Operation and Maintenance (OampM)
Level of effort of additional manpower and cost of OampM for the alternatives over the baseline project OampM requirements
Highest level of effort and cost for OampM rated as Purple whereas the lowest is rated as Green
Reliability and Durability
Interventions that do not require human involvement or a facilityrsquos ability to withstand all the forces during a storm event (eg permanent solutions with higher reliability than deployable solution)
Interventions requiring human involvement (active measures) rated as Purple whereas interventions with minimal or no human involvement (passive measures) rated as Green
Risk Reduction Benefits Monetary benefits provided by each intervention alternative in avoided damages over the baseline condition
Lowest potential monetary benefit rated as Purple whereas as highest potential monetary benefit rated as Green
Quality of Life BenefitsVisual Aesthetics
Benefits either to the community such as recreation or safety or serve the community during emergency situations
Lowest potential quality of life benefits rated as Purple whereas as highest potential benefits rated as Green
Table 6 ndash Evaluation matrix for comparison of mitigation alternatives across the useful life of a project
Project title_______________________________________________________________________________
Evaluation Criteria
Baseline Condition (Designed to NYC Building Code and
Standards)
Resilient Design Alternatives for Managing__________________
Alternative 1
Alternative 2
Alternative 3
First Costs
ConstructabilityEase of ImplementationEnvironmental ImpactsCo-BenefitsPermitting
Operation and Maintenance (OampM)
Reliability and Durability
Risk Reduction Benefits
Quality of Life BenefitsVisual Aesthetics
NYC Mayorrsquos Office of Recovery and Resiliency Climate Resiliency Design Guidelines
32IIID BCA METHODOLOGY FOR PROJECTS UNDER $50 MILLION
Table 7 ndash Evaluation matrix for comparison of mitigation alternatives across the useful life of a project - COMPLETED EXAMPLE
Evaluation Criteria
Baseline Condition (Designed to NYC Building Code and
Standards)
Resilient Design Alternatives for Managing Coastal SurgeSLR
Alternative 1Flood proof building built on grade to Guidelines
DFE
Alternative 2 Elevate building structure above Guidelinesrsquo DFE
on columns
Alternative 3 Raise site grade by filing the building site footprint
to Guidelinesrsquo DFE
First CostsBaseline cost for building structure is $15 million
Incremental costs are within 5 over the baseline costs
Incremental costs are between 5-10 over baseline costs
Incremental costs are 20 and more over baseline costs
ConstructabilityEase of Implementation
Relatively easy to construct within site constraints
Similar to baseline conditions since construction requires additional flood proofing only
Moderate challenges to construct foundation structure for columns within site constraints
Extremely challenging to construct within the site constraints Potentially fatal flaw
Environmental ImpactsCo-BenefitsPermitting
No major impacts but may require additional effort to obtain DOB permits with flood proofing and deployable systems
No major impacts but may require additional effort to obtain DOB permits with flood proofing and deployable systems
No major impacts and relatively easy to permit
Potential drainage circulation impacts and challenges to obtain clean fill material for the site
Operation and Maintenance (OampM)
Major OampM costs associated with deployable systems
Major OampM costs associated with deployable systems
Moderate OampM costs associated with proposed elevator for access
Minimal OampM costs since deployable and elevators not required
Reliability and Durability
Least reliability with highest potential risk from flooding during to failure of deployable systems
Least reliability with highest potential risk from flooding during to failure of deployable systems
Moderate reliability with potential risk from flooding limited to elevator shaft only
Highest reliability since deployable are not required to protect building from flooding
Risk Reduction Benefits
Maximum flood risk reduction benefits assuming deployable and flood proofing is effective
Maximum flood risk reduction benefits assuming deployable and flood proofing is effective
Maximum flood risk reduction benefits
Maximum flood risk reduction benefits
Quality of Life BenefitsVisual Aesthetics
Facility may not be operational during the storm event
Facility may not be operational during the storm event
Facility can be potentially operational during the storm event
Facility can be potentially operational during the storm event
Qualitative Color Scale Green=Least resource intensive alternative Purple=most resource intensive yellow=medium level of resource intensity
A new non-critical facility with a building structure is proposed on a site that is currently in the 2015 Preliminary FEMA 1 annual chance floodplain with a BFE of 10rsquo (NAVD 88) The baseline conditions DFE to meet existing NYC codes and standards is 11rsquo (NAVD 88) Using the Guidelines recommended design criteria the facilityrsquos DFE is 133rsquo (NAVD 88) and existing grade is around 6rsquo (NAVD 88) The project design team develops three alternatives to meet the Guidelinesrsquo recommended DFE design for the facility Table 7 offers an example of how a qualitative assessment can be used to compare three resilient design alternatives using the evaluation criteria and metrics
CASE STUDY Example of How to Use the Evaluation Matrix
NYC Mayorrsquos Office of Recovery and Resiliency Climate Resiliency Design Guidelines
33IIIE BCA METHODOLOGY FOR PROJECTS OVER $50 MILLION
E BCA methodology for projects over $50 millionIn order for a project to be considered cost-effective a benefit-cost analysis (BCA) assesses if the benefits of a project outweigh its costs or in other words the benefit-cost ratio (BCR) is greater than 10 as illustrated in Equation 1
Equation 1 Benefit-Cost Ratio Formula
BCR =
Where BCR = Benefit-Cost Ratio
BENEFITS = Total project benefits
COSTS = Total project costs
BENEFITSCOSTS
These estimated project benefits are combined with the project costs which are defined as the differential construction and long-term operation and maintenance costs associated with constructing a proposed project to the Guidelinesrsquo recommended design level It is assumed that the baseline project will be designed to the most prevalent NYC codes and standards This benefit methodology should be used to determine the additional project benefit that the Guidelinesrsquo recommended design would provide over the baseline project benefit It is assumed that the project design team will develop alternatives to address each of the following applicable climate stressors - sea level risecoastal storm surge increased precipitation and extreme heat - separately For each alternative the project design team should use the following steps to determine the Benefit-Cost Ratio (BCR)
a) Determine project useful life for design interventions Determining the useful life of the proposed project is an important first step in the
detailed BCA assessment methodologies for two reasons First the project useful life determines what values must be used from the Guidelines to establish the future climate design conditions The various hazard tables in the Guidelines establish design requirements based on useful life ranges through 2039 2040-2069 2070-2099 and 2100+ (2100+ projections are only available for sea level rise) A review of these tables show that the design requirements needed to meet the projected climate hazards increase as the end of useful life range increases Second the useful life determines how long the project will need to be operated and maintained in order to remain technically sound and effective at reducing future damages and losses
b) Determine discount rate for project benefits calculation The cost-effectiveness of projects assessed using the BCR must be done on a net
present value basis meaning the present value of the benefits is compared to the present value of the costs Most project costs are computed for present value based on current cost estimates bids or cost guidance However project benefits - as well as project costs for operation and maintenance - accrue over time into the future and are computed on an annualized basis To address this issue the Present Value Coefficient (PVC) is used to bring these annualized project benefits and OampM costs into the present value As indicated by the formula in Equation 2 the PVC is a function of the Project Useful Life (PUL) and the Discount Rate (DR)
NYC Mayorrsquos Office of Recovery and Resiliency Climate Resiliency Design Guidelines
34
Equation 2 Present Value Coefficient (PVC) Formula
PVC =
Where PVC = Present Value Coefficient
PUL = BCA Project Useful Life based on project type
DR = Discount Rate
The project design team should coordinate with agencies and NYC OMB if needed to determine appropriate discount rates based on funding source project type and other factors This coordination should take place during project initiation phase where total project costs (design and construction) are over $50 million66
c) Develop input data to perform benefit calculations Tables 16 and 17 in Appendix 4 provide a list of typical input data by each climate
stressor needed to perform benefit analysis quantitatively on variety of facilities67 The project design team should use these tables as a reference to identify appropriate input data categories andor additional input data needed to perform benefit analysis on the project
d) Identify applicable project benefit categories to estimate benefits Tables 16 and 17 in Appendix 4 provide a list of typical project benefits by each climate
stressor needed to perform benefit analysis quantitatively on various types of projects The project design team should use these tables as a reference to identify appropriate project benefit categories for each climate stressor to perform benefit analysis on the project
e) Calculate benefits of recommended design interventions for each climate
stressor The input data and applicable project benefits can be assembled along with
incremental project cost data to analyze cost-effectiveness using the FEMA BCA Tool Damage-Frequency Assessment (DFA) module or similar software This analysis will provide a BCR for each alternative which can then be used to compare the alternatives that were developed to mitigate effects from applicable climate stressors The project design team can then use the results from this analysis to identify optimal interventions that provides a balanced solution that provides resiliency benefits within the available project budget
IIIE BCA METHODOLOGY FOR PROJECTS OVER $50 MILLION
[1 ndash (1 + DR) -(PUL)]DR
66 For example a NYC OMB March 2015 memorandum recommends using an annually updated DR as published each year in Appendix C of OMB Circular A-94 The current OMB-recommended discount rates from OMB A-94 Appendix C vary by project useful life and are as follows 21 DR for useful lives of 10 to 19 years 25 DR for useful lives of 20 to 29 years and 28 DR for useful lives of 30 years or greater By contrast FEMA hazard mitigation grants use a DR of 70 for all projects based on the Federal OMB A-94 rate for federally-funded mitigation measures Since these DRs will impact the PVC and the project benefits the project team must ensure that BCA results prepared using an OMB-recommended DR (21 to 28) be updated to reflect the Federal DR (70) when applying for FEMA mitigation grant funds
67 Note the data requirements for the sea level rise and increased precipitation hazards in Table 16 are more detailed than the requirements for the extreme heat hazards due to the less detailed level of analysis available for extreme heat
NYC Mayorrsquos Office of Recovery and Resiliency Climate Resiliency Design Guidelines
35
APPENDICES
NYC Mayorrsquos Office of Recovery and Resiliency Climate Resiliency Design Guidelines
36APPENDIX 1 ndash KEY TERMS
100-year flood (1 annual chance flood)
A flood that has a 1 probability of occurring in any given year The 100-year floodplain is the extent of the area of a flood that has a 1 chance of occurring or being exceeded in any given year
500-year flood (02 annual chance flood)
A flood that has a 02 probability of occurring in any given year The 500-year floodplain is the extent of the area of a flood that has a 02 chance of occurring or being exceeded in any given year
AdaptationAdjustment in natural or human systems to a new or changing environment that seeks to maximize beneficial opportunities or moderate negative effects Successful adaptations contribute to resiliency
Base flood elevation (BFE)The elevation of surface water resulting from a flood that has a 1 annual chance of occurring or being exceeded in any given year The BFE is shown on the Flood Insurance Rate Map (FIRM)69
BluebeltReference to the Department of Environmental Protectionrsquos (DEP) Bluebelt program to preserve natural drainage corridors including streams ponds and other wetland areas Preservation of these wetland systems allows them to perform their functions of conveying storing and filtering storm water
Climate
The average weather (or more rigorously a statistical description of the average in terms of the mean and variability) over a period of time usually 30 years These quantities are most often surface variables such as temperature precipitation and wind Climate in a wider sense is the state including a statistical description of the climate system70
Climate change
Changes in average weather conditions that persist over multiple decades or longer Climate change encompasses both increases and decreases in temperature as well as shifts in precipitation changing risk of certain types of severe weather events and changes to other variables of the climate system
Climate change riskThe chance that investments (such as in capital projects) can be affected by the physical impacts of climate change71 Risks are evaluated as a product of the probability of occurrence and the magnitude of damages or impacts including socioeconomic factors that would result if they did occur (consequences)
Climate change risk assessment
This assessment involves a detailed project-specific analysis that includes a vulnerability and risk assessment often followed by cost-benefit analysis to assess and select investments in climate change risk mitigation Risk is assessed as a function of the magnitude and probability of a given climate change hazard Examples resources are included in Appendix 7
Climate vulnerabilityThe degree to which systems and populations are affected by adverse impacts It is a function of the character magnitude and rate of climate change and variation to which a system is exposed its sensitivity and its adaptive capacity72
Cloudburst An extreme amount of rain in a short period of time often over a small geographic area73
Cooling Degree Day (CDD) A form of degree-day used to estimate the energy requirements for air conditioning or refrigeration when the daily mean temperature is above 65degF
68 All terms are from the US Global Change Research Program (USGCRP) glossary unless otherwise noted The USGCRP glossary is available at httpwwwglobalchangegovclimate-changeglossary
69 ldquoDefinitionsrdquo FEMA last modified March 1 2017 httpswwwfemagovnational-flood-insurance-programdefinitions70 UKCIP Glossary httpwwwukciporgukglossary71 ldquoAccount for Climate Riskrdquo International Finance Corporation 72 UKCIP Glossary httpwwwukciporgukglossary73 New York City Environmental Protection ldquoCloudburst Resiliency Planning Studyrdquo 2017 Available at httpwwwnycgovhtmldeppdfclimatenyc-cloudburst-studypdf
APPENDIX 1 - KEY TERMS68
NYC Mayorrsquos Office of Recovery and Resiliency Climate Resiliency Design Guidelines
37APPENDIX 1 ndash KEY TERMS
Design life The life expectancy of an asset or product as determined during design74 As opposed to useful life (see below)
Dry Bulb temperature The ambient air temperature measured by a thermometer
Extreme eventUnexpected unusual or unpredictable weather or flooding compared to historical or future projected distribution Extreme events include for example heat waves cold waves heavy rains periods of drought and flooding and severe storms
Facilities For the purposes of this document ldquofacilitiesrdquo refers to all types of buildings housing infrastructure structures and landscape features designed by or for the City of New York
Flexible adaptation pathwayResilience-building strategies that can evolve or be adapted over time as climate change risk assessments evaluations of adaptation strategies and monitoring continue75
Flood Insurance Rate Maps (FIRM)
Official flood map of a community on which FEMA has delineated the 1 annual chance floodplain and the base flood elevations (BFEs) applicable to the community76 The FIRM also includes the 02 floodplain annual chance floodplain and differentiates between special flood hazard areas (V A Coast A zones) and floodways The official FIRM is from the year 2007 while the 2015 PFIRM is currently required by NYC Building Code to calculate design flood elevations NYC DOB references the more restrictive of the two maps in both base flood elevation and flood hazard area (ie V versus A zone) Refer to Appendix 3 for more information
FreeboardAn additional amount of height above the base flood elevation used as a factor of safety (eg two feet above the base flood) in determining the level at which a facilitys lowest floor must be elevated or floodproofed to be in accordance with state or community floodplain management regulations77
Future time slices
Future periods defined by the NPCC for when climate change projections are available In this document the following decadal projections are associated with specific time spans2020s projection = present to 20392050s projection = 2040 to 20592080s projection = 2070 to 20992100s projection = end of century and beyond
Green infrastructureAn array of practices that use or mimic natural systems to manage urban stormwater runoff Water is either directed to engineered systems for infiltration or detained for longer periods before it enters the sewer system
Heat Vulnerability Index (HVI)Summarizes relative risk of adverse health effects from heat due to social and environmental factors Used to identify neighborhoods at higher risk during and after extreme heat events
Heat wave A period of three consecutive days where temperatures rise above 90degF or two consecutive days over 95 degrees78
New York City Panel on Climate Change (NPCC)
The body of leading climate and social scientists charged with making climate change projections for the metropolitan region79
74 Sustainable Infrastructure Management Program Learning Environment httpsimplewerforg 75 Rosenzweig C et al Climate Change Adaptation in New York City Building a Risk Management Response76 ldquoDefinitionsrdquo FEMA77 Ibid78 Horton R et al New York City Panel on Climate Change 2015 Report Chapter 1 Climate Observations and Projections Ann NY
Acad Sci ISSN 0077-8923 (New York 2015) 2579 For more information on the NPCC visit www1nycgovsiteorrchallengesnyc-panel-on-climate-changepage
NYC Mayorrsquos Office of Recovery and Resiliency Climate Resiliency Design Guidelines
38APPENDIX 1 ndash KEY TERMS
Open-grid pavement system
Pavements that consist of loose substrates supported by a grid of a more structurally sound grid or webbing Unbounded loose substrates in these systems transfer and store less heat than bound and compacted pavements and aid permeability Pavement is 50 pervious and contains vegetation in the open cells designed to allow percolation or infiltration of storm water through the surface into the soil below80
Preliminary Flood Insurance Rate Map (PFIRM)
Preliminary flood map developed by FEMA in 2015 for New York City that provides projected risks for flood hazards81 Refer to Appendix 3 for more information
Project useful life (PUL)
The period over which an asset or component is expected to be available for use by an entity This depends on regular and adequate maintenance This period of time typically exceeds the design life (see above) The combined effect of operational requirements and useful life is practical in assessing an investment in improving resilience82
Rain gardenAlso called ldquobioswalerdquo Planted areas designed to collect and manage stormwater that runs off streets sidewalks commercial and residential rooftops and other sources when it rains
Resiliency The ability to bounce back after change or adversity The capability of preparing for responding to and recovering from difficult conditions83
Sea level rise-adjusted design flood elevation
As defined in these Guidelines the increased height of the base flood elevation due to sea level rise plus freeboard depending on the criticality of the facility The sea level rise adjustment depends on the useful life of the facility
Storm surge An abnormal rise of water generated by a storm over and above predicted astronomical tides84
Substantial improvementAny repair reconstruction rehabilitation addition or improvement of a building or structure the cost which equals or exceeds 50 of the market value of the structure before the improvement or repairs started For more information see Appendix G of the NYC Building Code and 1 RCNY sect3606-0185
Tidal inundation Flooding which occurs at high tides due to climate-related sea level rise land subsidence andor the loss of natural barriers86
Urban Heat Island (UHI) effectThe tendency for higher air temperatures to persist in urban areas as a result of heat absorbed and emitted by buildings and asphalt tending to make cities warmer than the surrounding suburban and rural areas
Weather The state of the atmosphere at a given time with regard to temperature cloudiness precipitation wind and other meteorological conditions87
Wet Bulb temperatureThe temperature indicated when a thermometer bulb is covered with a water-saturated wick over which air is caused to flow at approximately 45 ms (900 ftmin) to reach the equilibrium temperature of water evaporating into the air when the heat of vaporization is supplied by the sensible heat of the air88
80 ldquoGlossaryrdquo US Green Building Council (2017) Available at httpwwwusgbcorgglossaryterm552581 ldquoPreliminary FEMA Map Productsrdquo FEMA Map Service Center Available at httpshazardsfemagovfemaportalprelimdownload82 ldquoGlossaryrdquo International Infrastructure Management Manual (2011) 83 A Stronger More Resilient New York (2013) 184 ldquoStorm Surge Overviewrdquo National Hurricane Center NOAA Available at httpswwwnhcnoaagovsurge85 ldquoFlood Resistant Constructionrdquo Appendix G New York City Building Code (2008) and 1 RCNY sect3606-01 available at httpswww1nycgovassetsbuildingsrules1_RCNY_3606-01pdf86 ldquoOcean Factsrdquo National Ocean Service NOAA Available at httpoceanservicenoaagovfactsnuisance-floodinghtml 87 UKCIP Glossary httpwwwukciporgukglossary88 ldquoASHRAE Terminologyrdquo ASHRAE Available at httpswwwashraeorgtechnical-resourcesauthoring-toolsterminology
NYC Mayorrsquos Office of Recovery and Resiliency Climate Resiliency Design Guidelines
39APPENDIX 2 - CLIMATE CHANGE PROJECTIONS
Climate change projections are provided by the New York City Panel on Climate Change (NPCC) The full NPCC report is available from the New York Academy of Sciences89 Tables 8-10 (below) were reproduced directly from the NPCC report while Table 2 (see Section IIA) was developed using the data underlying the NPCC report to inform the design of HVAC systems under warmer conditions
Table 8 ndash NYC sea level rise projections90
Baseline (2000-2004) 0 in
Low estimate (10th percentile)
Middle range (25th to 75th percentile)
High estimate (90th percentile)
2020s 2 in 4-8 in 10 in
2050s 8 in 11-21 in 30 in
2080s 13 in 18-39 in 58 in
2100 15 in 22-50 in 75 in
Note Projections are based on six-component approach that incorporates both local and global factors The model-based components are from 24 global climate models and two representative concentration pathways Projections are relative to the 2000-2004 base period
Table 9 ndash Mean annual changes91
a Temperature Baseline(1971-2000) 54degF
Low estimate (10th percentile)
Middle range (25th to 75th percentile)
High estimate (90th percentile)
2020s + 15degF +20-29degF +32degF
2050s +31degF +41-57degF +66degF
2080s +38degF +53-88degF +103degF
2100 +42degF +58-104degF +121F
b Precipitation Baseline(1971-2000) 501 in
Low estimate (10th percentile)
Middle range (25th to 75th percentile)
High estimate (90th percentile)
2020s -1 percent +1-8 +10
2050s +1 percent +4-11 +13
2080s +2 percent +5-13 +19
2100 -6 percent -1 to +19 +25
Note Based on 35 global climate models (GCMs) and two RCPs Baseline data cover the 1971ndash2000 base period and are from the NOAA National Climatic Data Center (NCDC) Shown are the low estimate (10th percentile) middle range (25th percentile to 75th percentile) and high estimate (90th percentile) These estimates are based on a ranking (from most to least) of the 70 (35 GCMs times 2 RCPs) projections The 90th percentile is defined as the value that 90 percent of the outcomes (or 63 of the 70 values) are the same or lower than Like all projections the NPCC climate change projections have uncertainty embedded within them Sources of uncertainty include data and modeling constraints the random nature of some parts of the climate system and limited understanding of some physical processes The NPCC characterizes levels of uncertainty using state-of-the-art climate models multiple scenarios of future greenhouse gas concentrations and recent peer-reviewed literature Even so the projections are not true probabilities and the potential for error should be acknowledged
89 The NPCC 2015 report is available at httponlinelibrarywileycomdoi101111nyas20151336issue-1issuetoc90 From New York City Panel on Climate Change 2015 Report Chapter 1 Climate Observations and Projections page 4191 From New York City Panel on Climate Change 2015 Report Chapter 1 Climate Observations and Projections page 30
APPENDIX 2 - CLIMATE CHANGE PROJECTIONS
NYC Mayorrsquos Office of Recovery and Resiliency Climate Resiliency Design Guidelines
40APPENDIX 2 - CLIMATE CHANGE PROJECTIONS
Table 10 ndash Extreme events92
2020s Baseline (1971-2000)
Low estimate(10th percentile)
Middle range(25th to 75th percentile)
High estimate (90th percentile)
Numbers of heat waves per year 2 3 3-4 4
Average heat wave duration (days) 4 5 5 5
Number of days per year with
Maximum temperature at or above 90degF 18 24 26-31 33
Maximum temperature at or above 100degF 04 07 1-2 2
Minimum temperature at or below 32degF 71 50 52-58 60
Rainfall at or above 1 inch 13 13 14-15 16
Rainfall at or above 2 inches 3 3 3-4 5
Rainfall at or above 4 inches 03 02 03ndash04 05
2050s Baseline (1971-2000)
Low estimate(10th percentile)
Middle range(25th to 75th percentile)
High estimate (90th percentile)
Numbers of heat waves per year 2 4 5-7 7
Average heat wave duration (days) 4 5 5-6 6
Number of days per year with
Maximum temperature at or above 90degF 18 32 39-52 57
Maximum temperature at or above 100degF 04 2 3-5 7
Minimum temperature at or below 32degF 71 37 42-48 52
Rainfall at or above 1 inch 13 13 14-16 17
Rainfall at or above 2 inches 3 3 4-4 5
Rainfall at or above 4 inches 03 03 03-04 05
2080s Baseline (1971-2000)
Low estimate(10th percentile)
Middle range(25th to 75th percentile)
High estimate (90th percentile)
Numbers of heat waves per year 2 5 6-9 9
Average heat wave duration (days) 4 5 5-7 8
Number of days per year with
Maximum temperature at or above 90degF 18 38 44-76 87
Maximum temperature at or above 100degF 04 2 4-14 20
Minimum temperature at or below 32degF 71 25 30-42 49
Rainfall at or above 1 inch 13 14 15-17 18
Rainfall at or above 2 inches 3 3 4-5 5
Rainfall at or above 4 inches 03 02 03-05 07
Note Projections for temperature and precipitation are based on 35 GCMs and 2 RCPs Baseline data are for the 1971 to 2000 base period and are from the NOAA National Climatic Data Center (NCDC) Shown are the low estimate (10th percentile) middle range (25th to 75th percentile) and high estimate (90th percentile) 30-year mean values from model-based outcomes Decimal places are shown for values less than one although this does not indicate higher precisioncertainty Heat waves are defined as three or more consecutive days with maximum temperatures at or above 90degF Like all projections the NPCC climate change projections have uncertainty embedded within them Sources of uncertainty include data and modeling constraints the random nature of some parts of the climate system and limited understanding of some physical processes The NPCC characterizes levels of uncertainty using state-of-the-art climate models multiple scenarios of future greenhouse gas concentrations and recent peer-reviewed literature Even so the projections are not true probabilities and the potential for error should be acknowledged
92 From New York City Panel on Climate Change 2015 Report Chapter 1 Climate Observations and Projections page 31
NYC Mayorrsquos Office of Recovery and Resiliency Climate Resiliency Design Guidelines
41APPENDIX 3 - DIFFERENTIATION OF FLOOD MAPS
These Guidelines reference several different kinds of flood maps and sources of design flood elevations These maps are described and differentiated below
Table 11 - Differentiation of flood maps used in NYC
Reference Title Data Source Information Provided Referenced By Link
2007 FIRM FEMA
Based on historical data from before 1983 identifies the current base flood (extent and elevation) as the flood that has a 1 chance of occurring in any given year also known as a 100-year flood The NYC Building Code requires that either the 2007 FIRM or 2015 PFIRM elevation be used whichever is higher
2014 NYC Building Code Appendix G
Climate Resiliency Design Guidelines
httpsmscfemagovportal
2015 PFIRM FEMA
Based on historical data identifies the current base flood (extents and elevation) as the flood that has a 1 chance of occurring in any given year also known as a 100-year flood The NYC Building Code requires that either the 2007 FIRM or 2015 PFIRM elevation be used whichever is higher The 2015 PFIRM is currently being reassessed by FEMA
2014 NYC Building Code Appendix G
Climate Resiliency Design Guidelines
httpshazardsfemagovfemaportalprelimdownload
httpwwwregion2coastalcomview-flood-maps-dataview-preliminary-flood-map-data
NYC Flood Hazard Mapper
NYC Department of City Planning
Maps current and future flood hazards in NYC including the following data layers 2007 FIRM and 2015 PFIRM high tide with sea level rise and PFIRM with sea level rise through 2100
Climate Resiliency Design Guidelines
Waterfront Revitalization Plan
httpwww1nycgovsiteplanningdata-mapsflood-hazard-mapperpage
ldquoTable 4 ndash Determine the sea level rise-adjusted design flood elevation for critical and non-critical facilitiesrdquo
ORR amp NPCC
Provides data to use when adding sea level rise to a given 2015 PFIRM or 2007 FIRM Base Flood Elevation (BFE) to calculate a Design Flood Elevation (DFE) Based on the criticality and expected useful life of a facility
Climate Resiliency Design Guidelines
See Section II on ldquoSea Level Riserdquo above
APPENDIX 3 - DIFFERENTIATION OF FLOOD MAPS
NYC Mayorrsquos Office of Recovery and Resiliency Climate Resiliency Design Guidelines
42APPENDIX 4 - PROJECT BENEFITS CATEGORIES
This appendix provides guidance on how to identify and assess benefits as a supplement to Sections IIID and IIIE
Table 12 lists typical direct benefits for reducing impacts from climate stressors and basic guidance for how to estimate them See Section IIID for more information
Table 13 lists typical indirect benefits for reducing impacts from climate stressors and basic guidance for how to estimate them See Section IIID for more information
Table 12 ndash Direct benefits for (1) sea level rise with coastal storm surge and (2) increased precipitation measures
Direct Benefit Basic Guidance for Estimating Values
Physical Damages (Structure Contents)
bull For flood-damaged buildings use depth damage functions developed by FEMA and USACE for structures and contents
bull Use depth damage functions in conjunction with Building Replacement Values (BRVs) and not market values BRVs typically range between $100 to $325SF for residential buildings and $120 to $450SF for commercial public buildings
bull For more complex structures or facilities use engineering estimates of flood damages or review historic flood damages documented from insurance claims repair records or FEMA Public Assistance claims from recent flood disasters
Residential Displacements
bull For flood-damaged buildings use depth damage functions developed by FEMA and USACE for residential displacements
Reduced Life CycleOperation and Maintenance (OampM) Costs93
bull Applicable only to projects that reduce overall life cycle costs or net annual OampM costs from baseline conditions
bull Input reduced annual OampM costs as a project benefit at a 1-year recurrence intervalbull Reduced overall life cycle costs can be input as a longer project useful life
Table 13 ndash Indirect benefits for (1) sea level rise with coastal storm surge and (2) increased precipitation measures
Indirect Benefit Basic Guidance for Estimating Values
Non-Residential Building Service Losses
bull Estimate service loss values and durations for non-residential buildings public buildings critical facilities and parksnatural features based on FEMA BCA guidance and standard values based on building use
Utility Service Losses94
bull Estimate utility service losses for water wastewater and electrical facilities based on the number of impacted customers FEMA per capita standard values for utility service ($105personday for potable water $49personday for wastewater $148personday for electrical)95
bull Estimate utility service loss durations based on engineering estimates or review historic flood damages losses documented from utility company records
bull This benefit can also apply to measures that increase energy efficiency
RoadBridge Service Losses
bull Estimate roadbridge service losses based on the average daily traffic (ADT) detour time and additional travel distance and FEMA and GSA standard values for road service ($3344vehiclehour of delay $0545mile)96
bull Estimate roadbridge service loss durations or review historic flood damages losses
Emergency Service Losses
bull Applicable only to projects that reduce or eliminate documented emergency service costs from baseline conditions
bull Examples of avoided emergency services costs include NYPD staffing to monitor barricades for flooded roads or NFDY staffing for water rescues of residents from flooded buildings or streets
APPENDIX 4 - PROJECT BENEFITS CATEGORIES
93 Reduced life cycle costs may be applicable to some measures that provide extreme heat benefits such as green roofs that can last longer than a standard roof if properly maintained
94 Reduced utility service costs may be applicable to some measures that provide extreme heat benefits such as cool roofs green roofs and shade trees
95 FEMA per capita standard values taken from FEMA BCA Toolkit Version 530 (Build Date 12222016) and developed in FEMArsquos Baseline Standard Economic Value Methodology Report (July 28 2016) Consider updating FEMA standard per capita values to reflect current New York City utility rates
96 Consider updating FEMA and GSA standard values to reflect current New York City area labor rates and fuel costs
NYC Mayorrsquos Office of Recovery and Resiliency Climate Resiliency Design Guidelines
43APPENDIX 4 - PROJECT BENEFITS CATEGORIES
Table 14 ndash Other potential benefits for (1) sea level rise with coastal storm surge and (2) increased precipitation measures
Other Benefit Basic Guidance for Estimating Values
Avoided Stress and Anxiety
bull Applicable only for projects that directly benefit occupants of residential structuresbull Use FEMA standard value for avoided mental stress and anxiety treatment costs of $2443person to
estimate benefit for all impacted residents97
Avoided Lost Productivity
bull Applicable only for projects that directly benefit occupants of residential structuresbull Use FEMA standard value for avoided lost worker productivity costs of $8736household to estimate
benefit for all impacted workers (conservatively assuming one worker per household)
Environmental Open Space
bull Applicable only for projects that create or acquire open space areas by acquisitionbull Use FEMA standard value for environmental open space based on the type of land acquired ($8308
Acreyear for Green open space $39545Acreyear for Riparian $6010Acreyear for Wetlands $554Acreyear for Forests $1799Year for Marine and estuary)97
CSO Volume Reduction
bull Applicable only for projects that provide Combined Sewer Overflow (CSO) abatement by reducing the volume of rainfall runoff
bull Use CSO abatement cost of $0015gallonsyear applied to increased precipitation hazard runoff volume for 5-year design storm98
Ecosystem Service99
bull Add stormwater management benefits of green infrastructure projects to increased precipitation hazards where avoided damages and service losses are not quantified
bull Unit benefits applicable to increased precipitation hazard includeo Green roofs $0133SFyear (PUL 40 years)o BioswaleRain GardenMeadow Mix $0020SFyear (PUL 30 years)o Permeable Grass Pavers $0020SFyear (PUL 30 years)o Tree Plantings $303Treeyear (PUL 30 years)o Planter Box Trees $101Treeyear (PUL 15 years)
Real Estate99
bull Potential real estate benefits from increased resilience of residential andor commercial propertiesstreetscapesneighborhoods included within the project scope
bull Benefit applied to extreme heat hazard for green infrastructure projects directly impacting residential or commercial properties
Quality of Life Health Benefits99
bull Potential quality of life benefits related to improved public health from the resilience measures included within the project scope
bull Benefit applied to extreme heat hazard for green infrastructure projects directly impacting residential or commercial properties
Table 14 lists other typical benefits for reducing impacts from climate stressors and basic guidance for how to estimate them See Section IIID for more information
97 FEMA standard values for avoided mental stress and anxiety and environmental open space values taken from FEMA BCA Toolkit Version 530 (Build Date 12222016)
98 CSO abatement cost taken from APG1 Report for NYC ldquoTechnical Approaches for Benefit-Cost Analysis of Hazard Mitigation Projects in Urban and Coastal Environmentsrdquo (April 2016)
99 Ecosystem Services Real Estate and Quality of LifeHealth benefits tend to be more applicable to green infrastructure measures that provide extreme heat benefits such as green roofs trees and other plantings
NYC Mayorrsquos Office of Recovery and Resiliency Climate Resiliency Design Guidelines
44APPENDIX 4 - PROJECT BENEFITS CATEGORIES
Table 15 ndash Potential benefits for extreme heat (Urban Heat Island) reduction measures
Category Benefit Basic Guidance for Estimating Values
Direct Benefit
Reduced Life Cycle Cost
bull Applicable only to measures such as green roofs that are expected to last longer than standard roofs
bull Compute total cost savings including annual OampM costs
Indirect Benefit
Energy Savings
bull Applicable to measures that reduce energy costs by providing cooling through increased shading andor evapotranspiration
bull Use New York Power Authority rates of $0148kWh for electricity and $0810Therm for natural gas
Other Potential Benefits
Air Quality bull Applicable to measures that absorb pollutants andor reduce carbon dioxide emissions
Acoustics bull Applicable to measures such as green roof or walls that reduce noise transfer
Quality of LifeHealth bull Potential quality of life benefits and related to improved public health
Real Estate bull Applicable to measures that provide residential real estate benefits from increased resilience of propertiesstreetscapesneighborhoods
Retail Sales Marketing
bull Applicable to measures that provide commercial property benefits from increased aesthetics resulting in increased marketing and sales for streetscapesneighborhoods
Tax Credits Incentives
bull Applicable to resilience or green infrastructure measures such as green roofs that have accompanying Federal State or City tax credits or other incentives
Table 15 lists potential benefits for reducing impacts from heat and basic guidance for how to estimate them See Section IIID for more information
NYC Mayorrsquos Office of Recovery and Resiliency Climate Resiliency Design Guidelines
45APPENDIX 4 - PROJECT BENEFITS CATEGORIES
Table 16 ndash Guidance on quantitative calculations for (1) sea level rise with coastal storm surge and (2) increased precipitation measures
Data Input General Guidance ndash Basic Description
Applicable Benefit Category
Applicable Typical Facility Typology
Dire
ct B
enefi
ts
Indi
rect
Ben
efits
Oth
er P
oten
tial
Ben
efits
Bui
ldin
g St
ruct
ures
Com
plex
Fa
cilit
ies
Tran
spor
tatio
nSt
reet
scap
es
Plaz
as
Park
Fea
ture
s
First Floor Elevation (FFE)
bull The elevation of the first finished floor of the structure excluding basements
bull FFE measured from top of lowest floor (riverinenon-coastal high hazard areas) or bottom of lowest horizontal structural member (coastal high hazard areas)
Y Y Y Y
Building Replacement Value (BRV)
bull The unit cost to rebuild a structure of the same quality of construction
bull Not the same as market value
Y Y Y Y
Building Size
bull The total floor area of the building in square feet
bull Total Building Value = BRV x Building Sizebull Typical BRVs for NYC range between $100 to
$325SF for residential buildings and $120 to $450SF for commercialpublic buildings
Y Y Y Y
Structure Description
bull The type of building number of stories and foundation type (full basement partial basement no basement)
bull Collect more detailed foundation data for coastal flood zones
Y Y Y Y
Building Use bull Details related to residential housing commercial business and public use
Y Y Y Y Y
Building Type bull The primary use of building ndash residential commercial public and others
Y Y Y Y Y
Depth Damage Function (DDF)
bull Curves used to estimate structure damage contents damage and displacement of residential buildings based on flood depth
bull DDFs selection based on Structure Description Building Type Building Use
bull Structure DDFs based on percentage of Total Building Value
bull Contents DDFs based on percentage of Total Contents Value
bull Displacement DDFs based on number of displacement days x Displacement Cost
Y Y Y Y Y
Contents Value
bull The cost to replace structure contents (furnishings equipment)
bull Residential building Contents Values typically 50 BRV (FEMA DDFs) or 100 BRV (USACE DDFs)
bull Non-residential building Contents Values between 18 to over 100 depending on building use (USACE DDFs)
bull Total Contents Value = BRV x Building Size
Y Y Y Y Y
Table 16 provides general guidance on how to quantitatively calculate benefits from efforts to address from climate stressors See Section IIIE for more information
NYC Mayorrsquos Office of Recovery and Resiliency Climate Resiliency Design Guidelines
46APPENDIX 4 - PROJECT BENEFITS CATEGORIES
Table 16 ndash Guidance on quantitative calculations for (1) sea level rise with coastal storm surge and (2) increased precipitation measures
Data Input General Guidance ndash Basic Description
Applicable Benefit Category
Applicable Typical Facility Typology
Dire
ct B
enefi
ts
Indi
rect
Ben
efits
Oth
er P
oten
tial
Ben
efits
Bui
ldin
g St
ruct
ures
Com
plex
Fa
cilit
ies
Tran
spor
tatio
nSt
reet
scap
es
Plaz
as
Park
Fea
ture
s
Number of Residents (Residential)
bull Total number of occupants in a residential building
bull Typically estimated based on number of residential units x average number of individuals per household (based on current US Census data or use 25 individuals per household as a default)
Y Y Y Y Y
Displacement Cost (Residential)
bull The unit cost to lodge and feed displaced residents while flood damage is repaired
bull Average unit displacement cost of $415residential unitday recommended based on current FY2018 GSA Per Diem rates for New York City
Y Y Y Y Y
Value of Service (Non-Residential and Public)
bull The unit cost of service disruption and rental of temporary facilities while flood damage is repaired
bull Disruption costs for non-residential buildings typically range from $095 to $136SFmonth and rental costs range from $020 to $136SFmonth depending on building use
bull Value of service for public buildings ($day) is typically based on the annual operating budget for the City agency using the building prorated based on building size or population served by the building then divided by 365 daysyear
Y Y Y Y
Value of Service (Critical Facilities)
bull The unit cost of critical facilities (police fire emergency medical services) lost or delayed while flood damage is repaired
Y Y Y
Value of Service Duration
bull The duration of service disruption and rental of temporary facilities for non-residential buildings and critical facilities while flood damage is repaired
bull For non-residential buildingso Value of Service Durations vary from
4 months to over 30 months based on building use and the depth of flooding
o Total Value of Service Loss = (Disruption Cost x Building Area) = (Rental Cost x Building Area x Value of Service Duration)
bull For public buildings and critical facilitieso Value of Service Durations vary from 0
days to 720 months based on building use and the depth of flooding from FEMA FIA or USACE DDFs
o Total Value of Service Loss = (Value of Service) x (Service Loss Duration)
Y Y Y
NYC Mayorrsquos Office of Recovery and Resiliency Climate Resiliency Design Guidelines
47APPENDIX 4 - PROJECT BENEFITS CATEGORIES
Table 16 ndash Guidance on quantitative calculations for (1) sea level rise with coastal storm surge and (2) increased precipitation measures
Data Input General Guidance ndash Basic Description
Applicable Benefit Category
Applicable Typical Facility Typology
Dire
ct B
enefi
ts
Indi
rect
Ben
efits
Oth
er P
oten
tial
Ben
efits
Bui
ldin
g St
ruct
ures
Com
plex
Fa
cilit
ies
Tran
spor
tatio
nSt
reet
scap
es
Plaz
as
Park
Fea
ture
s
Engineering Estimates for Damages
bull Engineered estimate models of physical damages and service losses at the project site based on the Guidelines event recurrence interval(s) and flood depth(s)
Y Y Y Y Y Y
Historic Damages and Service Losses
bull Historic physical damages and service losses at the project site documented from previous flood events
bull Do not use routine maintenancebull The historic damage event recurrence interval
(RIs) andor flood depths must be determined updated for inflation to the present value and adjusted to match the Guidelines event RIsflood depths
Y Y Y Y Y Y
Facility Replacement Value
bull The unit cost to rebuild the facility
Impacted Area bull The geographic area impacted by the facility in the event of failure in acres
Y Y Y Y
Facility Capacity
bull The design capacity of the facilitybull For example - facility capacity expressed in
millions of gallons per day (MGD) for water and wastewater facilities or megawatts (MW) for electrical facilities
Y Y Y Y
Service Population
bull The number of impacted residents served by the facility
bull Typically estimated based on number of impacted residential customers x average number of individuals per household (based on current US Census data or use 25 individuals per household as a default)
bull Facilities serving mostly non-residentialpublic buildings andor critical facilities should focus on service losses rather than service population
Y Y Y
NYC Mayorrsquos Office of Recovery and Resiliency Climate Resiliency Design Guidelines
48APPENDIX 4 - PROJECT BENEFITS CATEGORIES
Table 16 ndash Guidance on quantitative calculations for (1) sea level rise with coastal storm surge and (2) increased precipitation measures
Data Input General Guidance ndash Basic Description
Applicable Benefit Category
Applicable Typical Facility Typology
Dire
ct B
enefi
ts
Indi
rect
Ben
efits
Oth
er P
oten
tial
Ben
efits
Bui
ldin
g St
ruct
ures
Com
plex
Fa
cilit
ies
Tran
spor
tatio
nSt
reet
scap
es
Plaz
as
Park
Fea
ture
s
Value of Service
bull Unit value of service provided by the facilitybull Example of FEMA standard values for complete
loss of utility service $105personday for potable water$49personday for wastewater$148personday for electrical
bull Consider updating FEMA standard per capita values to reflect current The New York City utility rates
Y Y
Roadway Elevations bull Roadway Elevations
Y Y
Roadway Replacement Value
bull Roadway Replacement ValueY Y
Inundation Area Map
bull Inundation Area Map developed by FEMA or through modeling by project design team
Y Y Y
Building Inventory of Inundation Area
bull The number and type of buildings within the streetscape and neighborhood inundated by the Guidelinersquos flood events
Y Y Y
Average Daily Traffic (ADT)
bull The average number of one-way traffic trips per day along the roadway(s) within the streetscapeneighborhood inundated by the Guidelinersquos flood events
Y Y
Additional Travel Time
bull The additional travel time needed to detour around a flooded roadway expressed in minutes
bull In the unlikely event there is no detour available use a 12-hour travel time per one-way trap but provide a detailed area street map as supporting documentation
Y Y
Value of Traffic Delay
bull The value of service associated with lost time in traffic
bull For example - FEMA standard average value of $3344vehiclehour of delay
bull Consider updating FEMA and GSA standard values to reflect current New York City area labor rates and fuel costs
Y Y
NYC Mayorrsquos Office of Recovery and Resiliency Climate Resiliency Design Guidelines
49APPENDIX 4 - PROJECT BENEFITS CATEGORIES
Table 17 ndash Guidance on quantitative unit benefit calculations for extreme heat hazard measures
Measure General Guidance ndash Unit Benefit Information and Data Requirements
Applicable Benefit Category
Applicable Typical Facility Typology
Dire
ct B
enefi
ts
Indi
rect
Ben
efits
Oth
er P
oten
tial
Ben
efits
Bui
ldin
g St
ruct
ures
Com
plex
Fa
cilit
ies
Tran
spor
tatio
nSt
reet
scap
es
Plaz
as
Park
Fea
ture
s
Green Roof
bull Unit benefit range over PUL = $470SF to $373SF of green roof area ($719SF standard value)
bull Assumed PUL = 40 yearsbull Apply standard value unit benefit to green
roof area to estimate measure benefitbull Higher range values more applicable
to residential and commercial building streetscape projects
Y Y Y Y Y Y
Bioswale Rain Garden Meadow Mix
bull Unit benefit range over PUL = $396SF to $211SF of area ($730SF standard value)
bull Assumed PUL = 30 yearsbull Apply standard value unit benefit to bioswale
rain gardenmeadow mix area to estimate total measure benefit
Y Y Y Y Y Y
Cool Roof
bull Unit benefit range over PUL = $117 to $3151SF of material area ($144SF standard value)
bull Assumed PUL = 20 yearsbull Apply standard value unit benefit to cool roof
area to estimate total measure benefitbull Higher range values more applicable to
residential building streetscape projects
Y Y Y Y Y
Light-Colored PaversLight-Colored Materials
bull Unit benefit range over PUL = $0774 to $204SF of material area ($0866SF standard value)
bull Assumed PUL = 30 yearsbull Apply standard value unit benefit to material
area to estimate total measure benefit
Y Y Y Y
Table 17 provides general guidance on how to quantitatively calculate benefits from efforts to address climate stressors See Section IIIE for more information
NYC Mayorrsquos Office of Recovery and Resiliency Climate Resiliency Design Guidelines
50APPENDIX 4 - PROJECT BENEFITS CATEGORIES
Table 17 ndash Guidance on quantitative unit benefit calculations for extreme heat hazard measures
Measure General Guidance ndash Unit Benefit Information and Data Requirements
Applicable Benefit Category
Applicable Typical Facility Typology
Dire
ct B
enefi
ts
Indi
rect
Ben
efits
Oth
er P
oten
tial
Ben
efits
Bui
ldin
g St
ruct
ures
Com
plex
Fa
cilit
ies
Tran
spor
tatio
nSt
reet
scap
es
Plaz
as
Park
Fea
ture
s
Tree Planting
bull Unit benefit range over PUL = $1005 to $77154Tree ($1855Tree standard value)
bull Assumed PUL = 30 yearsbull Apply standard value unit benefit to number of
trees to estimate total measure benefitbull Higher range values more applicable
to residential and commercial building streetscape projects
Y Y Y Y Y Y
Planter Box Tree
bull Unit benefit range over PUL = $212 to 16304Tree ($392Tree standard value)
bull Assumed PUL = 15 yearsbull Apply standard value unit benefit to number of
trees to estimate total measure benefitbull Higher range values more applicable
to residential and commercial building streetscape projects
Y Y Y Y Y
Shade Canopy
bull Unit benefit range over PUL = $0363 to $396SF ($0458SF standard value)
bull Assumed PUL = 15 yearsbull Apply standard value unit benefit to area of
shade canopy estimate total measure benefitbull Higher range values more applicable
to residential and commercial building streetscape projects
Y Y Y Y
Permeable Grass Pavers
bull Unit benefit range over PUL = $0258SF to $0521SF of pavers ($0363SF standard value)
bull Assumed PUL = 30 yearsbull Apply standard value unit benefit to paver
area to estimate total measure benefit
Y Y Y Y Y
For the purposes of the BCA refer to the following facility typologies bull ldquoBuilding Structuresrdquo include critical small building sites such as EMS or FDNY stations and non-critical small building sites such as
libraries or comfort stationsbull ldquoComplex Facilitiesrdquo include critical infrastructure such as wastewater treatment sites pump stations water filtration plants and similar
large or complex facilitiesbull ldquoTransportationStreetscapePlazasrdquo include roadway reconstruction streetscape improvements street raising plazas and other
transportation-related infrastructurebull ldquoPark Featuresrdquo include parks and similar public recreational facility with natural landscape features
NYC Mayorrsquos Office of Recovery and Resiliency Climate Resiliency Design Guidelines
51APPENDIX 5 - EXAMPLE PLANNING DECISION TREE
This decision tree provides a summarized example approach for how to implement these Guidelines Projects with a total cost greater than $50 million are recommended to conduct a full qualitative and quantitative climate change risk assessment and BCA while projects below $50 million are recommended to conduct a qualitative risk assessment and BCA
Define Project
1) Operational goals and criticality level2) Useful life3) Location in the current flood plain future floodplain and or zone
of tidal inundation and the project arearsquos score on the heat vulnerability index
Evaluate Project Risks According to Probability and Magnitude of Consequence
bull Extreme Heat bull Precipitationbull Sea Level Risebull Coastal Surge
High Level Identification and Assessment of Risk Mitigation Alternatives and Co-benefits
(qualitative)
Detailed Identification and Assessment of Risk Mitigation Alternatives and Co-benefits (qualitative and quantitative)
High Level Estimate of Costs and Benefits of Design Alternatives
(qualitative)
Detailed Estimate of Costs and Benefits of Design Alternatives
(qualitative and quantitative)
Decision Point Which climate change risks require mitigation
Decision Point Evaluate risk mitigation benefits and costs to
determine final resilient design alternative or if no action is required
Decision Point Is the total project cost above $50 million
Below $50 million Above $50 million
APPENDIX 5 - EXAMPLE PLANNING DECISION TREE
NYC Mayorrsquos Office of Recovery and Resiliency Climate Resiliency Design Guidelines
52
Project Title
Design Strategies Checklist (not exhaustive)
Extreme Heat Comments Extreme Precipitation Comments Sea Level Rise amp Storm Surge Comments
Select Site in Low Heat Vulnerability Index area Select High Elevation Site Select High Elevation Site
Minimize East-West Building Orientation Green Roof Raise Building Floor Elevation
Passive Solar Cooling and Ventilation Systems
Protect Below Grade Areas from Flooding Waterproof Building Envelope
Cool Roof (SRI appropriate) On-site Stormwater Management (gray) Elevate Critical Building Functions
Green Roof (extensive) Reduce Impervious Areas Elevate Critical Equipment
Vegetative Structures Permeable Pavement Perimeter Floodwall100 Levee (passive or active)
Enhanced HVAC System including space layout optimization and system scalability
Increase Green Spaces and Planted Areas DryWet Floodproofing
More Efficient Building Envelope Other Utility Redundancy Design101
Parking Lot Shading Resilient Materials amp Landscape Treatments
Light Colored Pavements (appropriate SRI) Design for Storm Surge Outflow
Increase Planted Areas Install Backwater Flow Prevention
Permeable Surfaces Design for Scour
Open-grid Pavement Raise Road Elevation
Other Other
This appendix provides a template for identifying possible design strategies to address climate change risks as described throughout the Guidelines
APPENDIX 6 - DESIGN STRATEGIES CHECKLIST
100 Permanent perimeter flood walls are not permitted to meet floodproofing requirements in buildings with substantial improvements andor damages 101 Utility redundancy design should be pursued for critical systems not all building systems
APPENDIX 6 - DESIGN STRATEGIES CHECKLIST
NYC Mayorrsquos Office of Recovery and Resiliency Climate Resiliency Design Guidelines
53APPENDIX 7 - CLIMATE CHANGE RISK ASSESSMENT RESOURCES
These Guidelines provide data on climate change hazards and recommend how that data can inform resilient design A risk assessment is a tool to help project managers and designers evaluate risk levels as well as select and prioritize resilient design strategies A high level risk assessment is recommended for all City capital projects with a total cost of under $50 million Projects above $50 million are recommended to conduct an in-depth assessment
Risk assessments use quantified estimates of the probability and magnitude of consequence of an event occurring to prioritize responses ldquoProbabilityrdquo is an assessment of the likelihood of a hazard occurring while ldquomagnituderdquo describes the hazardrsquos potential impact Risk assessment tools such as the examples listed below can be used to define and score these categories Projects that score higher across both probability and magnitude can be prioritized for investment and risk mitigation action Projects that score lower across both criteria may require no action beyond meeting code The results are typically charted on a risk matrix and an example is provided on the next page
The climate change risk management frameworks below offer templates for how to integrate climate change projections into a risk assessment process Refer to these resources for examples and further information
bull Vulnerability Assessment and Adaptation Framework is prepared by the Federal Highway Administration (FHWA) While developed for transportation planning this risk assessment framework has broad applicability for evaluating asset vulnerability to climate change Available at httpswwwfhwadotgovenvironmentsustainabilityresilienceadaptation_framework
bull US Climate Resilience Toolkit The US Global Change Research Program offers a step by step risk assessment
framework including tools and case studies at httpstoolkitclimategovsteps (see example on next page)
bull Coast Adapt Guidance on undertaking a risk assessment High level assessment httpscoastadaptcomausitesdefaultfilesfactsheetsT3M4_2_2nd_pass_risk_assessmentpdfDetailed assessment httpscoastadaptcomausitesdefaultfilesfactsheetsT3M4_3_3rd_pass_risk_assessmentpdf
bull Climate adaptation Risk uncertainty and decision-makingDownload the report here httpswwwukciporgukpublicationsRisk
The City plans to develop a NYC-specific process for integrating climate change data into existing risk management processes by April 2019
APPENDIX 7 - CLIMATE CHANGE RISK ASSESSMENT RESOURCES
NYC Mayorrsquos Office of Recovery and Resiliency Climate Resiliency Design Guidelines
54APPENDIX 7 - CLIMATE CHANGE RISK ASSESSMENT RESOURCES
The Risk Characterization Matrix below is an example from the US Climate Resilience Toolkit This tool can be used to assess the probability and magnitude of impact for identified risks The risk of coincident climate stressorsrisks (such as storm surge plus increased precipitation) can also be assessed as applicable
Figure 14 - Example of a climate change risk matrix (adapted from US Climate Resilience Toolkit)
Project teams can determine the magnitude of the impact (along the horizontal scale of 1 through 3 with 3 being the most severe) and the probabilitylikelihood of occurrence for each specific risk (along the vertical scale with 3 being the most likely) A score is typically assigned for each risk (Probabil-ity x Magnitude) and then charted on the matrix Based on the estimated probability and magnitude of consequence above the risks are ranked and prioritized for mitigation Factors to bear in mind include
bull Not all facility typologies have the same level of functional and operational importance during events or tolerance for disruption
bull Not all climate stressors and risks have the same level of impact on each project sitebull Not all identified risks can or should be mitigated fully
NYC Mayorrsquos Office of Recovery and Resiliency Climate Resiliency Design Guidelines
55WORKS CITED
A Stronger More Resilient New York PlaNYC Report of the NYC Special Initiative for Rebuilding and Resiliency The City of New York 2013
ldquoAccount for Climate Riskrdquo International Finance Corporation accessed March 27 2017 httpwwwifcorgwpswcmconnectTopics_Ext_ContentIFC_External_Corporate_SiteClimate+Business
PrioritiesAccount+for+Climate+Risk
American Society of Heating Refrigeration and Air-Conditioning Engineers (ASHRAE) Handbook -Fundamentals 2017
ldquoBaseline Standard Economic Value Methodology Reportrdquo Federal Emergency Management Agency July 2016
Benefit Cost Analysis Toolkit Software Version 530 Federal Emergency Management Agency (build date December 2016)
Criteria for Detention Facility Design New York City Department of Environmental Protection November 2012
Community Resilience Planning Guide for Buildings and Infrastructure Systems Vol 1 NIST Special Publication 1190 US Department of Commerce 2016
Cool and Green Roofing Manual NYC Department of Design and Construction 2007 httpwwwnycgovhtmlddcdownloadspdfcool_green_roof_manpdf
Building Resiliency Task Force US Urban Green Building Council New York 2013 httpurbangreencouncilforcecomBuildingResiliency
Design and Planning for Flood Resiliency Guidelines for NYC Parks New York City Department of Parks and Recreation 2017
httpswwwnycgovparksorgplanning-and-buildingplanningresiliency-plansflood-resiliency
Flooded Bus Barns and Buckled Rails Federal Transit Administration Office of Budget and Policy 2011 httpswwwhsdlorgabstractampdid=685187
Floodproofing Non-Residential Buildings FEMA P936 FEMA 2013 httpswwwfemagovmedia-library-data9a50c534fc5895799321dcdd4b6083e7P-936_8-20-13_508rpdf
ldquoGlossaryrdquo International Infrastructure Management Manual National Asset Management Support Group New Zealand 2011 httpwwwipweaorg
ldquoGreen Roof Metrics Draft Reportrdquo New York City Department of Parks and Recreation 2017
ldquoGuide to Rain Event Preparednessrdquo NYC Department of Environmental Protection httpwwwnycgovhtmldeppdfbrochuresflood-preparedness-flyerpdf
ldquoGuidelines and Discount Rates for Benefit-Cost Analysis of Federal Programsrdquo Appendix C Circular A-94 US Office of Management and Budget (OMB) 2017
ldquoGuidelines for the Design and Construction of Stormwater Management Systemsrdquo New York City Department of Environmental Protection July 2012
Horton R et al New York City Panel on Climate Change 2015 Report Ann NY Acad Sci ISSN 0077-892 New York 2015
Madrigano J et al ldquoA case-only study of vulnerability to heat wavendashrelated mortality in New York City (2000ndash2011)rdquo Environmental Health Perspectives 123672ndash678 2013
WORKS CITED
NYC Mayorrsquos Office of Recovery and Resiliency Climate Resiliency Design Guidelines
56WORKS CITED
enspMcGregor et al Two Degrees The Built Environment and Our Changing Climate Routledge Press 2013
NYC Green Codes Task Force US Green Building Council New York 2010 httpurbangreencouncilorgGreenCodes
NYCrsquos Risk Landscape A Guide to Hazard Mitigation NYC Emergency Management 2014
One New York The Plan for a Strong and Just City The City of New York 2015 httpwwwnycgovhtmlonenyc downloadspdfpublicationsOneNYCpdf
Ready to Respond Strategies for Multifamily Building Resilience Enterprise Green Communities 2015 httpswwwenterprisecommunityorgresources
Rosenzweig C et al Climate Change Adaptation in New York City Building a Risk Management Response New York City Panel on Climate Change 2010
httponlinelibrarywileycomdoi101111nyas20101196issue-1 issuetoc
ldquoSustainable Infrastructure Management Program Learning Environmentrdquo Water Environment Research Foundation accessed March 24 2017 httpsimplewerforg
Urban Waterfront Adaptive Strategies NYC Department of City Planning 2013 httpwww1nycgovsiteplanningplanssustainable-communitiesclimate-resiliencepagetab=1
Wastewater Resiliency Plan Climate Risk Assessment and Adaptation Study New York City Department of Environmental Protection October 2013
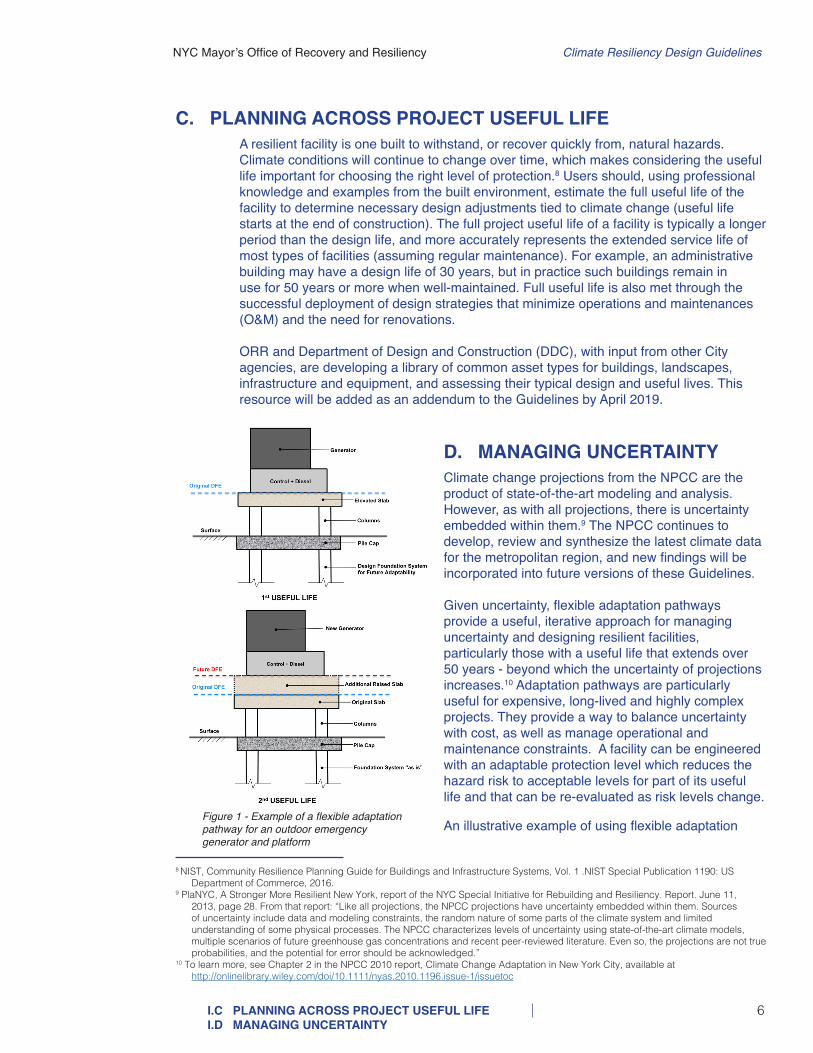
NYC Mayorrsquos Office of Recovery and Resiliency Climate Resiliency Design Guidelines
6IC PLANNING ACROSS PROJECT USEFUL LIFE ID MANAGING UNCERTAINTY
C PLANNING ACROSS PROJECT USEFUL LIFEA resilient facility is one built to withstand or recover quickly from natural hazards Climate conditions will continue to change over time which makes considering the useful life important for choosing the right level of protection8 Users should using professional knowledge and examples from the built environment estimate the full useful life of the facility to determine necessary design adjustments tied to climate change (useful life starts at the end of construction) The full project useful life of a facility is typically a longer period than the design life and more accurately represents the extended service life of most types of facilities (assuming regular maintenance) For example an administrative building may have a design life of 30 years but in practice such buildings remain in use for 50 years or more when well-maintained Full useful life is also met through the successful deployment of design strategies that minimize operations and maintenances (OampM) and the need for renovations ORR and Department of Design and Construction (DDC) with input from other City agencies are developing a library of common asset types for buildings landscapes infrastructure and equipment and assessing their typical design and useful lives This resource will be added as an addendum to the Guidelines by April 2019
D MANAGING UNCERTAINTYClimate change projections from the NPCC are the product of state-of-the-art modeling and analysis However as with all projections there is uncertainty embedded within them9 The NPCC continues to develop review and synthesize the latest climate data for the metropolitan region and new findings will be incorporated into future versions of these Guidelines
Given uncertainty flexible adaptation pathways provide a useful iterative approach for managing uncertainty and designing resilient facilities particularly those with a useful life that extends over 50 years - beyond which the uncertainty of projections increases10 Adaptation pathways are particularly useful for expensive long-lived and highly complex projects They provide a way to balance uncertainty with cost as well as manage operational and maintenance constraints A facility can be engineered with an adaptable protection level which reduces the hazard risk to acceptable levels for part of its useful life and that can be re-evaluated as risk levels change
8 NIST Community Resilience Planning Guide for Buildings and Infrastructure Systems Vol 1 NIST Special Publication 1190 US Department of Commerce 2016
9 PlaNYC A Stronger More Resilient New York report of the NYC Special Initiative for Rebuilding and Resiliency Report June 11 2013 page 28 From that report ldquoLike all projections the NPCC projections have uncertainty embedded within them Sources of uncertainty include data and modeling constraints the random nature of some parts of the climate system and limited understanding of some physical processes The NPCC characterizes levels of uncertainty using state-of-the-art climate models multiple scenarios of future greenhouse gas concentrations and recent peer-reviewed literature Even so the projections are not true probabilities and the potential for error should be acknowledgedrdquo
10 To learn more see Chapter 2 in the NPCC 2010 report Climate Change Adaptation in New York City available at httponlinelibrarywileycomdoi101111nyas20101196issue-1issuetoc
Figure 1 - Example of a flexible adaptation pathway for an outdoor emergency generator and platform
An illustrative example of using flexible adaptation
NYC Mayorrsquos Office of Recovery and Resiliency Climate Resiliency Design Guidelines
7IE PROJECT-SPECIFIC CONSIDERATIONS
pathway on a facilitiesrsquo component is explained in Figure 1 It shows an emergency generator with an approximate useful life of 25 years located outside a building In order to incorporate the Guidelines into design it is recommended that the foundation of the generator structure is designed to match the useful life of the building which can vary between 50-70 years that the generator serves Assuming the generator is subject to flooding risk from sea level rise and coastal surge it should be built on an elevated concrete slab that matches the future year design flood elevation (DFE) scenario corresponding to the end of the generatorrsquos useful life The generator must be replaced when it reaches the end of its useful life which is typically far less than that of the building When the replacement generator is installed the concrete slab is further elevated to accommodate the future DFE The foundation of the generator and the columns are designed to support the additional future load from the concrete slab Thereby the initial investment into the foundation can be used to adapt in the future allowing for future flexibility and avoided costs
Adaptation pathways may not apply equally to all types of projects or climate change projections Facility flood defenses for example may be more easily developed through an adaptation pathway than heat-vulnerable materials or below grade drainage systems For this reason the Guidelines use the middle of the 25th to 75th percentile range projections for sea level rise (see Table 4) and the high-end 90th percentile projections for heat (see Table 1) For precipitation these Guidelines recommend using the existing 50-year storm data as a proxy for the projected high-end 5-year storm (see Section IIIB and Figure 4 for more details)
Uncertainty can be further addressed through risk management Some facilities such as those that are critical or cost more than $50 million for design and construction will benefit from a full climate change risk assessment (see examples in Appendix 7) This assessment will evaluate protecting the facility to a potentially higher level of sea level rise than the recommended height in these Guidelines The City plans to develop a process for integrating climate change data into existing risk management processes by April 2019 If engaging in a climate change risk assessment process please contact ORR at ResilientDesigncityhallnycgov
E PROJECT-SPECIFIC CONSIDERATIONSExisting information and requirements specific to different kinds of projects must be reviewed on a case-by-case basis when evaluating resiliency design strategies Refer to Appendix 5 for an example approach of how to make resiliency planning and design decisions and discuss these considerations as a project team to determine which apply and how to respond
bull Financing requirements if the project is federally-funded or receives recovery funding discuss with the funding agency if certain protection standards or cost-benefit analyses are required For example FEMA requires specific flood protection standards for critical facilities and non-critical facilities
bull Interdependencies consider how hazards impact interdependencies across sectors as well as the risks from coincident events (eg extreme precipitation occurring during an extreme surge event) to specific projects
bull Existing hazard mitigation projects and risk studies evaluate if nearby or associated projects have already been assessed for climate change risks Identify if
NYC Mayorrsquos Office of Recovery and Resiliency Climate Resiliency Design Guidelines
8IE PROJECT-SPECIFIC CONSIDERATIONS
any studies have been conducted that could inform design (eg local flood modeling with sea level rise) This may inform the climate change risk assessment or provide insights into site specific conditions and design options A map that catalogs NYC resiliency projects is located here httpsmapsnycgovresiliency
bull Agency-specific resiliency design standards refer also to resiliency guidelines provided by various City agencies (eg Parkrsquos Design and Planning for Flood Resiliency11) Agency guidelines build on the climate data provided in these Guidelines by providing specific design alternative and insights relevant to those agencies
bull Limitations the Guidelines do not describe or encompass all City resiliency policies To learn more about how the City plans for a resilient future see the latest OneNYC plan as well as the 2013 report A Stronger More Resilient New York Related resiliency issues are being addressed by the City but are out of the scope of these Guidelines including neighborhood and regional-level climate change risk management and zoning
bull Further questions Contact ORR at ResilientDesigncityhallnycgov
11 Available at httpswwwnycgovparksorgplanning-and-buildingplanningresiliency-plansflood-resiliency
NYC Mayorrsquos Office of Recovery and Resiliency Climate Resiliency Design Guidelines
9IIA INCREASING HEAT
All City of New York capital projects should be designed to withstand increasing heat and precipitation based on the useful life of the asset while design interventions for storm surge and sea level rise depend on the projectrsquos proximity to the floodplain useful life and criticality In order to support design team efforts to generate resilient design responses (ie adjustments to base projects) these Guidelines provide climate change projections and recommend design adjustments or interventions in response to increasing heat increasing precipitation and sea level rise The Guidelines recommend designing to loads beyond the minimum requirements in the prevalent NYC local codes Design teams should consider project benefits and additional costs to incorporating resilient design standards before finalizing project design
A INCREASING HEATUse this section to determine how to adjust a facilityrsquos design to account for increasing temperatures and to reduce the facilityrsquos contribution to the Urban Heat Island effect Heat reduction levels will be determined by the function location and useful life of the asset
BackgroundThe impacts of heat on NYC are well established Every summer over 100 New Yorkers die from causes exacerbated by extreme heat12 The region has seen a steady increase in the number of days above 90degF and temperatures are projected to keep rising worsening heat-related mortality By the 2050s the number of days at or above 90degF is expected to double and the frequency and length of heat waves will triple to an average 6 heat waves per year13 Certain areas of NYC already experience higher temperatures relative to other parts of the city and these hot spots will be exacerbated by climate change (see Figure 2)
12 OneNYC The Plan for a Strong and Just City (The City of New York 2015) 228 See also Madrigano J Ito K Johnson S Kinney PL Matte T 2015 A case-only study of vulnerability to heat wavendashrelated mortality in New York City (2000ndash2011) Environmental Health Perspectives 123672ndash678 httpwwwnycgovhtmlonenycdownloadspdfpublicationsOneNYCpdf
13 Horton et al New York City Panel on Climate Change 2015 Report Chapter 1 Climate Observations and Projections Ann NY Acad Sci ISSN 0077-8923 New York 201514 LANDSAT Thermal Data from 8182009
Figure 2 - Thermal imagery of New York City based on LANDSAT Thermal Data from 818200914
II INTERPRETING CLIMATE CHANGE DATA FOR RESILIENT DESIGN ADJUSTMENTS
NYC Mayorrsquos Office of Recovery and Resiliency Climate Resiliency Design Guidelines
10IIA INCREASING HEAT
In Cool Neighborhoods NYC the City prioritizes strategies to study the Urban Heat Island effect and make targeted investments that benefit communities most vulnerable to heat15 New Yorkers are more or less vulnerable to heat based largely upon socio-economic factors including age income location tree coverage and the percentage of dark surfaces The NYC Department of Health and Mental Hygiene (DOHMH) developed a Heat Vulnerability Index (HVI) which highlights parts of the city where more residents face an increased risk of heat-related mortality Their vulnerability is due to their exposure and socio-economic conditions that determine their
Figure 3 - Heat Vulnerability Index (HVI) for New York City Community Districts (Source NYC DOHMH 2015) This analysis identifies physical social and economic factors associated with increased risk of heat-related morbidity and mortality17
The Guidelines recommend that project designers consider two aspects of the relationship between their project and increasing heat the way their project reduces the Urban Heat Island effect and the impact that increasing heat will have on the physical components of their project itself
bull Reduce Urban Heat Island effect materials in the built environment absorb the sunrsquos heat throughout the day and re-radiate it back into the atmosphere driving localized temperatures higher and increasing demands on cooling systems Air conditioning and ventilation equipment also push extra heat into the air contributing to a feedback loop that increases localized ambient temperatures and impacts the health of heat-vulnerable New Yorkers This section provides guidance on how new capital construction can reduce the contribution to ambient heat in the city
bull Minimize impact from increasing heat increasing heat can physically impact components of buildings and infrastructure damaging or stressing materials electrical systems and mechanical systems Rising temperatures will also stress energy and communications networks that buildings and other infrastructure rely upon18 This section provides climate data to be used to adjust and adapt heat-vulnerable components of assets
15 OneNYC 22816 To learn more about Heat Vulnerability Index see page 229 of OneNYC at httpwwwnycgovhtmlonenycdownloadspdf
publicationsOneNYCpdf17 See page 229 in the OneNYC plan to learn more about HVI18 Damiano H et al NYCrsquos Risk Landscape A Guide to Hazard Mitigation (NYC Emergency Management 2014) 103
Heat can be lethal for all but its impact on New Yorkers is not equal
sensitivity to heat Community districts in red and orange in Figure 3 are areas of highest vulnerability and these are particularly concentrated in east Brooklyn the south Bronx northern Manhattan and southeast Queens16 While all new capital projects should address heat impacts those sited in moderate to high vulnerable HVI areas should implement multiple strategies to reduce the Urban Heat Island and help address the high vulnerability in these neighborhoods
NYC Mayorrsquos Office of Recovery and Resiliency Climate Resiliency Design Guidelines
11IIA INCREASING HEAT
1 Urban Heat Island reductionNew capital construction should minimize its contribution to the Urban Heat Island effect The design interventions provided below offer benefits to the community and the facility through reduced heat loading reduced energy costs andor improved occupant health and thermal comfort The appropriate combination of design interventions will vary dependent on the project scope
a) Increase the solar reflectance of surfaces by utilizing light-colored pavement coatings and materials in combination with shading with a minimum target of 50 of the non-structure areas of facility sites19
Lighter reflective surfaces help reduce the Urban Heat Island effect heat loading and internal building temperatures and extend the lifespan of rooftops and heating ventilation and air conditioning (HVAC) equipment The City has taken steps towards reducing ambient temperatures such as implementing the NYC Cool Roofs program20 New buildings as well as existing buildings with roofs going through significant repairs are required by law to paint their roofs white This program intervention reduces a buildingrsquos contribution to Urban Heat Island effect and provides energy savings by coating the normally dark concrete roof surface with white paint allowing the roof to reflect solar radiation
b) Increase the shading of surfaces by planting trees or other vegetation in combination with cool pavements with a minimum target of 50 of the non-structure areas of facility sites
Shady areas with heat- and in coastal areas salt-tolerant vegetative species can help keep buildings cool and provide energy savings as well as lower temperatures
c) Meet Climate Zone 6 standards for fenestration and insulation (See Section ECC C402 in Chapter C4 of the 2016 NYC Energy Code) to improve efficiency of building envelopes
NYC is currently in Climate Zone 4 NYC already requires that small residential building envelopes are designed to meet higher insulation and fenestration requirements to improve energy efficiency21 All City capital projects including non-residential facilities should meet this standard
d) Select greenblue roofs andor other appropriate landscape elements that maximize cooling with help of landscape architects
The City already encourages the use of green and blue roofs on buildings to reduce the Urban Heat Island effect22 provide stormwater management and increase the useful life of the roof Besides replacing dark roof surfaces green roofs and vegetation also provide shade and keep the air cool through evapotranspiration by releasing moisture into the atmosphere Blue roofs coupled with light colored roofing material can provide stormwater management and rooftop cooling Some of these designs support the shading and solar reflectance goal in Step a) above Additionally City capital projects are subject to Leadership in Energy and Environmental Design (LEED) certification and green roofs can earn LEED credits23 Projects should integrate cooling strategies listed below based on project scope and a balance between costs and benefits
bull Green roofs or blue roofs on a broader range of facilities (including industrial buildings storage garages administration buildings etc)
19 Urban Green Council (2010) Green Codes Task Force Proposed code ldquoEF 12 Reduce Summer Heat with Cool Shady Building Lotsrdquo20 Local Law No 21 (2011) amended Chapter 12 of the NYC Building Code to update roof coating standards Also
see Cool and Green Roofing Manual (DDC) 2007 for more information on NYC standards for cool and green roofs httpwwwnycgovhtmlddcdownloadspdfcool_green_roof_manpdf
21 Read more about the code here httpswww1nycgovsitebuildingscodes2016-energy-conservation-codepage22 See Cool and Green Roofing Manual (DDC) 2007 for more information on NYC standards for cool and green roofs
httpwwwnycgov htmlddcdownloadspdfcool_green_roof_manpdf23 See Local Law No 32 (2016) for more information
NYC Mayorrsquos Office of Recovery and Resiliency Climate Resiliency Design Guidelines
12
2 Minimize impact from increasing heatThis section provides information to support making design adjustments to capital projects to reduce impacts to equipment structures landscapes and materials from rising average temperatures and increasing extreme heat events
a) Review forward-looking climate data provided in Table 1 and Table 2 Select heat projections according to the useful life of the facility and its primary
components then evaluate and address impacts in the steps below Table 1 provides design criteria for average temperatures and incidents of extreme heat events projected to different time periods across the 21st century Table 2 provides guidance on future 1 Dry Bulb Temperature and Cooling Degree Days for the NYC area The 1 Dry Bulb Temperature represents the ambient air temperature
IIA INCREASING HEAT
bull Vegetated structures such as shade trees and planters (to reduce heat loading on horizontal or vertical surfaces)
bull Bioswales rain gardens and bioretention24 bull Maximize planted permeable surfacesbull Other permeable surfaces (used for stormwater management these retain
moisture that evaporates as surface temperatures rise)25 bull Open-grid pavement system (at least 50 unbound)26 bull Evaluate site planning and building massing with regard to solar gainbull Solar panels for shading and to generate energy
Table 1 ndash Baseline and projected extreme heat events27
End of useful life
heat waves per year (3 or more consecutive days with max temperatures at or above 90degF)
days above 90degF
Annual average temperature
Baseline (1971-2000) 2 18 54degF
Through to 2039 4 33 572degF
2040-2069 7 57 606degF
2070-2099 9 87 643degF
Table 2 ndash Projections for 1 Dry Bulb temperature and Cooling Degree Days
Change in projected value for 2050s
Variable Baseline for Central Park (1971-2000)
Low estimate (10th percentile)
Middle range (25th to 75th percentile)
High estimate (90th percentile)
1 Dry Bulb temperature 91degF +3degF +4-6degF +7degF
Cooling Degree Days (base = 65degF) 1149 +37 +46-73 +87
Note Due to HVAC system typical useful life of 25 years or less only projections for the 2050s are shown Projections for the 2020s are not shown because it is anticipated that enough of a safety margin is employed already in current systems to withstand the temperature rise expected through the 2020s The NPCC is currently working on projections of 1 Wet Bulb temperatures which are expected to increase and may require systems to have higher moisture reducing capacity in addition to the enhanced cooling capacity
24 When siting bioswales consider groundwater levels and soil permeability and ensure that the site is not contaminated from past or present land uses A high water table may prohibit some applications
25 Urban Green Council (2010) Green Codes Task Force Proposed code ldquoSW 1 REDUCE EXCESSIVE PAVING OF SITESrdquo26 LEED Neighborhood Development v4 ldquoHeat island reductionrdquo credit27 Projected estimates for average temperatures are based upon 90th percentile change factor added to the baseline average annual
temperature from New York City Panel on Climate Change (2015)
NYC Mayorrsquos Office of Recovery and Resiliency Climate Resiliency Design Guidelines
13IIA INCREASING HEAT
b) Evaluate potential impacts on systems and materials Heat impacts on a facility are highly contingent on the facility type and should be reviewed on a case-by-case basis28 A decrease in the useful life or operational capacity of a facility or components of a facility may occur due to rising temperatures Interventions will also vary depending on whether the project is a new capital investment or a substantial improvement to an existing facility Factors to evaluate as applicable to project scope include but are not limited to
bull Thermal expansion warping softening or other forms of material change or degradation of structural integrity occurring at an accelerated rate by excessive heat
bull Health and safety impacts on occupants vulnerable to heat bull Increased failure or reduced efficiency of electrical or mechanical systems bull Prioritization of critical loads for systems and components at the facility andbull Moisture control needs for buildings with a higher standard for fenestration and
insulation
The results of this evaluation will inform steps taken in the step below
c) Reduce heat impacts Review and implement specific changes to the facility design based on assessments
above Develop a strategy based on the specific type of facility its operational profile and its useful life A Design Strategies Checklist is available for use in Appendix 6 as a resource to track design approaches Specific areas of focus are
bull Electricity outages High temperatures drive demand for air conditioning and can increase the risk of facility equipment failure potentially broader grid disruptions or brownouts2930 To manage this risk design City buildings and infrastructure to withstand periods without electricity using the following approaches in particular if they provide critical or essential services
Ǯ Identify and assess how much of the facilityrsquos load is critical (eg ldquocritical loadrdquo) including the necessary duration of the backup power supply (eg is backup power needed for 8 hours or multiple days) Determining what loads are critical and how long they should be powered for is essential for a facilityrsquos operations and what the role of the facility will have in an emergency situation31
Ǯ Depending on the size of the critical load and budget different backup power supply options could range from backup generators (eg diesel natural gas) to hybrid systems (eg solar + battery storage + appropriately sized generator) Each option has different trade-offs that should be considered in terms of cost feasibility and environmental impacts For shorter duration needs andor smaller critical loads buildings with existing solar systems should consider adding storage to provide a resiliency benefit In some cases co-generation systems may make sense from an economic and resiliency perspective especially if there
28 Sector- and facility-specific impacts vary greatly For examples of sector-specific impacts and design responses see Flooded Bus Barns and Buckled Rails (FTA 2011) and Ready to Respond Strategies for Multifamily Building Resilience (Enterprise Green Communities 2015)
29 McGregor et al (2013) Two Degrees The Built Environment and Our Changing Climate Routledge Press30 High temperatures also increase energy demand which can increase fossil fuel based greenhouse gas emissions31 The key roles of the facility that need to be identified are operational hours number of occupants and electrical loads needed for the
desired operations Electrical equipment and appliances for the desired operations may include - but are not limited to - safety lighting life-supporting systems fire protection systems telecommunications equipment mechanical systems to mitigate extreme temperatures and computing equipment Every facility is unique Operational characteristics and load profiles need to be established prior to sizing the equipment required to keep the facility in operational mode
NYC Mayorrsquos Office of Recovery and Resiliency Climate Resiliency Design Guidelines
14IIA INCREASING HEAT
is a significant heating andor cooling load in addition to electricity demand32
Ǯ Depending on the option assess need to invest in internal electricity rewiring and building energy management systems (eg switches reconfiguration of distribution infrastructure to isolate critical loads from non-critical loads and the ability to island from the broader grid during the event of a larger disruption software and hardware to manage the deployment of hybrid systems) andor need for external hookups for temporary generators and boilers33
bull Failure in facility ventilation electrical and air conditioning systems Some systems designed to meet the requirements of past climate may overheat and fail during extreme events Some design interventions include34
Ǯ Selecting systems with higher heat tolerance Ǯ Adding Energy Recovery Ventilation systems Ǯ Providing additional or redundant ventilation systems either mechanical or
natural to cool electrical equipment Ǯ Optimizing building layout by
bull segregating temperature sensitive electronics and computer control system from other systems
bull placing heat generating equipment like transformers and switchgear outdoors where permitted and
bull splitting the facility cooling loads among different HVAC systems in facility for redundancy and better zone control
bull Passive solar cooling and ventilation There are numerous design features that provide passive solar cooling for buildings to help maintain lower internal ambient temperatures with less air conditioning These features also help keep facilities habitable during extended grid failures when generators fail or must be reserved for critical functions Some design features include35
Ǯ Appropriate east-west orientation Ǯ Passive ventilation design Ǯ Vertically stacked double skin facades Ǯ Exterior window shades Ǯ Light colored exteriors Ǯ Shaded arcades Ǯ Thermally massive materials Ǯ High performance glazing Ǯ Operable windows
32 To learn more see the Building Resiliency Task Force report from Urban Green Council (2013)33 Ibid 34 Flooded Bus Barns and Buckled Rails FTA Office of Budget and Policy 201135 These and other examples are found in McGregor et al (2013) Two Degrees The Built Environment and Our Changing Climate
Routledge Press Also see Flooded Bus Barns and Buckled Rails FTA Office of Budget and Policy 2011
NYC Mayorrsquos Office of Recovery and Resiliency Climate Resiliency Design Guidelines
15IIB INCREASING PRECIPITATION
B INCREASING PRECIPITATIONThe intensity and frequency of precipitation events are projected to increase with climate change creating new challenges for stormwater management and impacts to the built environment such as
bull The potential for greater frequency of stormwater management systems being overwhelmed36
bull More frequent and severe flooding of buildings and infrastructure in areas across the city and
bull Greater variability in rainfall events annually including the chance of drought
The goal for this section is to guide stormwater management approaches including infiltration increases in on-site storage volume and where possible increases in sewer capacity to account for precipitation increases associated with climate change Designers should develop and consider design interventions that would decrease site contribution to sewer in-flows beyond the existing NYC Building Code requirements Given its complexity the Department of Environmental Protection (DEP) is also evaluating climate impacts to the sewer system on a drainage-wide level Proactive design such as increasing on-site infiltration and storm water retention can contribute to system resiliency on a site-specific basis
BackgroundNYCrsquos drainage systems are designed to handle approximately the current 3-year intensity-duration-frequency (IDF) event in most areas of the city where sewers were built prior to 1970 In locations with sewers built after 1970 the capacity was built to handle the 5-year event NYCrsquos network of drainage systems can experience flooding above those thresholds due to widespread precipitation events or by localized intense storms (sometimes called ldquocloudburstsrdquo) causing flooding and backups Climate change projections indicate that flooding resulting from multiple types of precipitation events may increase in frequency This increasing probability is forecast for all types of precipitation events in NYC although there is greater uncertainty around future short duration events Relying on sewers alone to manage extreme precipitation events will not be sufficient in a changing climate The City plans to reduce impervious areas and provide additional storage capacity to reduce flood damage For managing stormwater from larger storms such as at the 50- and 100-year recurrence intervals DEP is increasingly considering the role of streets and open space in managing flow this is referred to as a dual drainage design approach The City is piloting projects to test this dual drainage approach
Another set of interventions include Bluebelt best management practices (BMPs) such as constructed wetlands storm water ponds and stream restorations that emulate pre-development conditions to manage large volumes of water and green infrastructure37 which in NYC have generally been designed to reduce flooding and combined sewer overflow respectively They are not typically sized to manage precipitation events of the same magnitude as sewers which serve as primary drainage conveyance However Bluebelt BMPs green infrastructure and other stormwater management tools may provide an additional buffer for larger storm events by temporarily storing andor infiltrating runoff that would otherwise be directed into the sewer system For instance areas of open space commonly found in NYC may not provide adequate environments for trees and other plantings However in these cases other types of green infrastructure like permeable surfaces and subsurface detention and retention installations would still be considered feasible
36 NYC is already taking steps to address this problem which will worsen with climate change To learn more about how NYC is using green and gray infrastructure to manage stormwater visit httpwwwnycgovhtmldephtmlstormwaterindexshtml
37 NYC DEP NYC Green Infrastructure Program
NYC Mayorrsquos Office of Recovery and Resiliency Climate Resiliency Design Guidelines
16IIB INCREASING PRECIPITATION
The City led by DEP continues to develop its options for managing heavier storm events due to climate change DEP is examining approaches to evaluate sea level rise and rainfall intensity for stormwater management and where possible sewer capacity These efforts will integrate forward-looking climate data into the design of these capital assets and the compounding factors of heavier rain storms and sea level rise will likely require greater infiltration and on-site storm water retention capacity Agencies and consultants should work directly with DEP to develop strategies on a given site necessary to meet expected increases in rainfall intensities and frequencies
1 Precipitation design adjustment for on-site stormwater systems
Based upon the design storm required for the City facility in design follow the steps below and review recommended design interventions
a) Identify the duration of the design event required The current 50-year IDF can be used as a proxy for the future 5-year storm
(projected for the 2080s) Design on-site detentionretention systems to retain the volume associated with the current 50-year IDF curve (see Figure 4 below) Design the on-site system to release at the maximum rate as specified in 15 Rules of the City of NY (RCNY) Chapter 3138
b) Conduct sensitivity analysis Compare the retentiondetention required for the current 5-year IDF versus the
38 Refer to existing codes and standards as well when determining the existing required storm as NYC requires different sizes of design storms for infrastructure and buildings For example NYC Plumbing Code Chapter 11 and Title 15 of the Rules of the City of New York Chapter 31
02
04
06
10
20
40
60
100
200
-2316090
Rai
nfal
l Int
ensi
ty (
inch
es p
er h
our
)
DurationsruoHsetuniM
5 10 15 30 1 2 3 6 12 18
5-yr
10-yr25-yr
50-yr
100-yr
NEW YORK NEW YORK
Figure 4 - Current Intensity-Duration-Frequency Precipitation Curve for NYC adapted from US Department of Commerce Weather Bureau Technical Paper 25
NYC Mayorrsquos Office of Recovery and Resiliency Climate Resiliency Design Guidelines
17IIB INCREASING PRECIPITATION
c) Identify design interventions for managing increased precipitation40 There are different ways to manage stormwater better and avoid urban flooding after
intense rain Choose the right combination of interventions after considering the site location operational requirements cost benefits and useful life of the intervention Some examples of design interventions are
bull Minimize increases in impervious surfacebull Utilize strategies that infiltrate evaporate or reuse rainwater to achieve storm
water volume reductions Then choose strategies that detain (delay drainage) to manage the rate of the storm water flow into the Cityrsquos drainage system
bull Install stormwater infiltration detention and storage (eg bioswales41 green roofs blue roofs and other blue or green infrastructure storage basins or tanks)
bull Protect areas below grade from floodingbull Keep catch basin grates clearbull When implementing perimeter protections ensure that interior water
management is also accounted for andbull Explore interventions to protect underground utility and telecommunications
infrastructure from water damage
d) Use appropriate DEP guidelines to perform the above tasks using the higher design storm
The three currently prescribed DEP guidelines are as follows
bull Guidelines for the Design and Construction of Stormwater Management Systems July 201242
bull Criteria for Detention Facility Design November 201243 bull DEP Site Connection Proposal Application and Guidelines44
Note on stormwater standards As DEP updates stormwater standards and develops specific tools to evaluate impacts of increased precipitation and drainage strategies for on-site storm water management these changes will be reflected in future versions of these Guidelines However it is recommended that the designer should develop and consider design interventions that would increase the on-site storage beyond the existing requirements Also a methodology is under development that will establish a consistent citywide process for addressing legal grade which will have further implications for how extreme precipitation is managed
39 NYC DEP Standards for Stormwater Release Rates available at httpwwwnycgovhtmldephtmlenvironmental_reviewsstormwater_release_ratesshtml 40 Also see DEP Guide to Rain Event Preparedness at httpwwwnycgovhtmldeppdfbrochuresflood-preparedness-flyerpdf and
Ready to Respond Strategies for Multifamily Building Resilience at httpwwwenterprisecommunityorgresourcesready-respond-strategies-multifamily-building-resilience-1335641 When siting bioswales consider groundwater levels and soil permeability and ensure that the site is not contaminated from past or
present land uses A high water table may prohibit some applications42 Available at httpwwwnycgovhtmldephtmlstormwaterstormwater_management_constructionshtml43 Available at httpwwwnycgovhtmldeppdfwater_sewer30_criteria_for_detention_facility_design_06062012pdf44 Available at httpwwwnycgovhtmldeppdfwater_sewer24pdf
current 50 year IDF to determine the cost and benefits associated with complying with these Guidelines Use the Evaluation of Project Benefits section below and Appendix 4 for guidance on how to identify and assess benefits Given the results of the costbenefit analyses review the added benefit of designing retentiondetention using greater magnitude storms (eg 100-year) or lower (eg 25-year) The goal is to maximize retentiondetention capacity given site and cost constraints as well as through an evaluation of the benefit of adding capacity to detainretain water for larger storm events
NYC Mayorrsquos Office of Recovery and Resiliency Climate Resiliency Design Guidelines
18
2 Incorporating climate change projections into DEP drainage planning
The first line of defense for managing intense precipitation events does not require changes to the sewer system as described above For drainage and wastewater infrastructure planning in a changing climate the sewer network and wastewater infrastructure should be qualitatively evaluated from the upstream pipes to the regulator chambers pump stations interceptors and ultimately to the downstream outfall to determine the feasibility of incorporating climate change projections into the system design For DEP storm sewer projects FY 2021 or later in separately sewered drainage areas where the design is in the early stages and there is free discharge the agency will evaluate the feasibility of revising the design to incorporate climate projections into the design If the project (including the prescribed changes) passes the costbenefit analysis then DEP will consider incorporating climate change projections into the sizing However changes in one part of the system must be carefully evaluated For example any upsizing of the regulator chamber or the high point of the system can negatively impact the design and operation of the wastewater infrastructure and residencesbusinesses on the system and can lead to a diminished the level of service
DEP is in the process of developing a hydrologic and hydraulic (HampH) model to estimate runoff flow for future climate scenarios and is evaluating rainfall hyetographs for the existing and future rainfall scenarios to be included in the drainage planning process In addition DEP currently coordinates with ORR for drainage planning as a part of coastal resiliency projects A more detailed methodology to incorporate climate change projections into drainage planning will be developed for version 30 of the Climate Resiliency Design Guidelines to be released in April 2019
IIB INCREASING PRECIPITATION
NYC Mayorrsquos Office of Recovery and Resiliency Climate Resiliency Design Guidelines
19IIC SEA LEVEL RISE
non-critical components within a larger facility or campus (eg at a maintenance yard differentiate between structures and equipment) Critical components essential to the facilityrsquos functionality should be protected to the higher standard for criticality even if the facility itself may be non-critical Some examples of critical components include electrical distribution and switching areas motor-control centers chemical feed equipment boilers communications systems monitoring and safety equipment HVAC units fire alarms and suppression equipment furnaces elevators emergency fuel supplies emergency generators and hazardous material storage Component protection should also be evaluated if a facility is expected to be fully operational during a flood event or if it is expected to quickly resume full operations after an event
For buildings and infrastructure with a long useful life it is not always cost effective or operationally feasible to design a facility to be resilient to hazards faced at the end of its useful life In these cases the most resilient design will be one that provides extra protection against hazards in the initial decades while also leaving open design alternatives for updating resiliency measures as new data is provided or new risk assessments are completed This flexible adaptation pathways approach builds in options to protect assets later in life as demonstrated in an example shown in Figure 1 (in Section I)
Other considerations to keep in mind includebull These Guidelines apply to all City capital projects except coastal flood protection
systems which are designed to different standards than those provided here for
C SEA LEVEL RISEThis section provides tools to 1) determine if the project will be subject to tidal inundation during its useful life due to sea level rise and 2) incorporate sea level rise into flood protection levels of capital projects For projects in the current and future 1 annual chance floodplains sea level rise-adjusted design flood elevations (DFE) are provided and reflect the criticality of the asset and its useful life Background NYC has experienced the devastation of coastal storms most recently during Hurricane Sandy Sea level rise is projected to increase the depth extent and frequency of flooding from storm surge45 Sea level rise will also regularly inundate some low-lying areas during high tides Current flood protection heights are determined by using the base flood elevation established by the FEMA Preliminary Flood Insurance Rate Map (PFIRM) 201546 and the standard of protection for buildings in the floodplain in Appendix G of the NYC Building Code47 These Guidelines augment existing requirements for two primary purposes ensuring City facilities built today incorporate sea level rise and critical assets (as defined in Table 4) are protected to a higher level It is important to note that all projects and design interventions must comply with NYC Building Code
Designers should differentiate between critical and
45 New York City Panel on Climate Change Report Chapter 2 Sea Level Rise and Coastal Storms (2015)46 However NYC Building code G10222 requires that designers review both the PFIRM and the effective FIRM and use the more
restrictive of the two 47 For information on the differences between FEMA FIRM PFIRM and the Cityrsquos forward-looking flood maps see Appendix 3
Critical components essential to the facilityrsquos functionality should be protected to the higher standard for criticality even if the facility itself is non-critical
NYC Mayorrsquos Office of Recovery and Resiliency Climate Resiliency Design Guidelines
20IIC SEA LEVEL RISE
buildings and other physical infrastructure Many of NYCrsquos coastal flood protection systems are currently being developed to comply with FEMA accreditation for flood levee systems48 The City plans to develop further guidance for designing coastal protection projects
bull For information on the differences between FEMA FIRM PFIRM and the Cityrsquos forward-looking flood maps see Appendix 3
bull Coincident stressors from sea level rise should also be considered For example bridge scour may increase as sea levels rise Similarly flooding during heavy rainfall events can be worsened due to higher tailwater conditions associated with high sea levels Be aware of how different risks may interact and how different interventions can be deployed to address multiple hazards or provide other co-benefits
bull Note projects that require discretionary approval are required to incorporate sea level rise projections as part of the NYC Waterfront Revitalization Program49 and
bull A methodology is under development that will establish a consistent citywide process for addressing legal grade which will have further implications for how sea level rise and precipitation are managed
For more information see Section IE Designers should use the resources and methods described in this section to 1) assess tidal inundation due to sea level rise and 2) address risks in the current and future floodplains
1 Assessing tidal inundation due to sea level riseTidal flooding currently affects parts of NYC and is projected to worsen as sea levels rise and inundate low-lying coastal sites during high tides When determining a site location or establishing scope of substantial improvements for other types of coastal facilities the project team will consider alternative sites outside of zones threatened with regular inundation if resiliency actions are not taken Some facilities such as wastewater treatment plants and harbor facilities need to be near the coast for operational purposes
a) Determine tidal inundation risk from sea level rise Use the Flood Hazard Mapper (httpwwwnycgovfloodhazardmapper)50 to see if your
site is in an area inundated from high tide plus sea level rise within the projectrsquos useful life For example if the useful life ends between 2040 and 2069 choose the 2050s High Tide map) Determine risk only from high tide and sea level rise separate from flood events Follow the instructions in Figure 5 and refer to the example in Figure 6 to review inundation at the end of an assetrsquos useful life
48 For more information please visit httpwwwfemagovfema-levee-resources-library49 For more information visit httpwwwnycgovwrp50 The Flood Hazard Mapper relies on publicly available data to present these map resources Users should also refer to FEMA and the
NPCC for official information
Figure 5 - Flood Hazard Mapper high tide plus sea level rise at httpwwwnycgovfloodhazardmapper
NYC Mayorrsquos Office of Recovery and Resiliency Climate Resiliency Design Guidelines
21IIC SEA LEVEL RISE
b) Address flood risk If the Flood Hazard Mapper shows that the facility is expected to be inundated by
high tides within its useful life or if primary access roads are at risk of inundation consider alternative site options
- OR - If the site is not expected to be regularly inundated by tides proceed to the next
section 2 Addressing Risks in the Current Floodplain
Note on calculating tidal inundations with sea level rise if a project team is interested in understanding the depth of tidal inundation given climate change projections follow these steps First determine the Mean Higher High Water (MHHW) elevation in feet-NAVD 8851 datum nearest to the site If the MHHW data is unavailable from a site specific survey refer to httpwwwnycgovwrp for a list of MHHW elevations (NAVD88) at tide stations across the city52 Second add the high estimate (90th percentile) of expected sea level rise (see Table 8 in Appendix 2) for the year corresponding to the facilityrsquos useful life to the MHHW to determine the projected depth of tidal inundation with sea level rise
51 North American Vertical Datum of 1988 (NAVD 88) is the vertical control datum of orthometric height established for vertical control surveying in the US based upon the General Adjustment of the North American Datum of 1988
httpswwwngsnoaagovdatumsvertical52 SLR elevations at httpwwwnycgovwrp are adjusted to account for sea level rise since the last tidal epoch If no other resource is
available to determine MHHW use the NOAA Online Vertical Datum Transformation tool to calculate the MHHW in feet-NAVD
Figure 6 - Flood Hazard Mapper with high tide in the 2020s (left) and in the 2080s (right) at httpwwwnycgovfloodhazardmapper
NYC Mayorrsquos Office of Recovery and Resiliency Climate Resiliency Design Guidelines
22IIC SEA LEVEL RISE
2 Addressing risks in the current floodplain53
A facility located in the current 1 annual chance floodplain (PFIRM 2015)54 will face increasing risk of flooding during its useful life due to sea level rise increasing the depth of coastal storms This section provides a process for adjusting the design flood elevation required by code to account for sea level rise
a) Find the location of the facility using the Flood Hazard Mapper (httpwwwnycgovfloodhazardmapper) and follow the instructions in Figure 7
bull Choose to view the layer ldquoFEMA Preliminary FIRM 2015rdquo bull Click on the facility site in the 1 floodplain to view the base flood elevation
Figure 7 - Flood Hazard Mapper with FEMA PFIRM (2015) at wwwnycgovfloodhazardmapper
b) If the facility is not in the current 1 annual chance floodplain (PFIRM 2015) proceed to the next section ldquo3 Addressing risks in the future floodplainrdquo
- OR - If the facility is in the current 1 annual chance floodplain (PFIRM 2015) note
the base flood elevation (BFE) and proceed to Step c) below Please note if a facility has multiple BFEs or if the site is partially in the 1 annual chance floodplain it is recommended to use the highest BFE as the current BFE for the entire site
c) Establish a sea level rise-adjusted DFE Use the current base flood elevation at your site the facilityrsquos useful life and its
criticality level to determine the design flood elevation using Table 4 (on the next page) as a basis of design
53 This process for adjusting the design flood elevation to account for sea level rise satisfies the criteria of the climate-informed science approach described at the state and federal level
54 FEMA updates its flood maps periodically As of April 2018 the most recent maps are the Preliminary Flood Insurance Rate Maps (PFIRM) available at DCPrsquos Flood Hazard Mapper (httpwwwnycgovfloodhazardmapper) Also note that NYC Building Code requires developers to use the PFIRM (2015) or the FIRM (2007) whichever is more restrictive For more information on these requirements please refer to Appendix G of the NYC Building Code Please note that the DCP maps are not official and all site locations should be confirmed with the official FEMA PFIRM NYC will provide information on the latest flood maps as they are updated
NYC Mayorrsquos Office of Recovery and Resiliency Climate Resiliency Design Guidelines
23IIC SEA LEVEL RISE
Table 4 - Determine the sea level rise-adjusted design flood elevation for critical and non-critical facilities55
Critical facilities
End of useful life Base Flood Elevation (BFE)56 in NAVD 88 + Freeboard57 + Sea Level Rise
Adjustment58= Design Flood Elevation (DFE) in
NAVD 88Through 2039 FEMA 1 (PFIRM) 24rdquo 6rdquo = FEMA 1 + 30rdquo
2040-2069 FEMA 1 (PFIRM) 24rdquo 16rdquo = FEMA 1 + 40rdquo2070-2099 FEMA 1 (PFIRM) 24rdquo 28rdquo = FEMA 1 + 52rdquo
2100+ FEMA 1 (PFIRM) 24rdquo 36rdquo = FEMA 1 + 60rdquoNon-critical facilities
End of useful life Base Flood Elevation (BFE) in NAVD 88 + Freeboard + Sea Level Rise
Adjustment = Design Flood Elevation (DFE) in
NAVD 88Through 2039 FEMA 1 (PFIRM) 12rdquo 6rdquo = FEMA 1 + 18rdquo
2040-2069 FEMA 1 (PFIRM) 12rdquo 16rdquo = FEMA 1 + 28rdquo2070-2099 FEMA 1 (PFIRM) 12rdquo 28rdquo = FEMA 1 + 40rdquo
2100+ FEMA 1 (PFIRM) 12rdquo 36rdquo = FEMA 1 + 48rdquoAdditional analysis should be conducted to incorporate wave action and wave run-up in DFE calculations especially in areas that are located within the FEMArsquos 1 annual chance Limit of Moderate Wave Action (LiMWA) zone Wave run up is the maximum vertical extent of wave uprush above surge
Definition of critical buildings and infrastructure for determining DFE in Table 4The criticality definitions below are for use in the application of the Guidelines only All items identified as critical in NYC Building Code Appendix G are critical in these guidelines however this list includes additional facilities that are not listed in Appendix G59 If a facility is not listed here it is considered non-critical for the purposes of determining freeboard
bull Hospitals and health care facilitiesbull Fire rescue ambulance and police stations and emergency vehicle garages bull Jails correctional facilities and detention facilities bull Facilities used in emergency response including emergency shelters emergency preparedness communication
operation centers communication towers electrical substations back-up generators fuel or water storage tanks power generating stations and other public utility facilities
bull Critical aviation facilities such as control towers air traffic control centers and hangars for aircraft used in emergency response
bull Major food distribution centers (with an annual expected volume of greater than 170000000 pounds)60 bull Buildings and other structures that manufacture process handle store dispose or use toxic or explosive
substances where the quantity of the material exceeds a threshold quantity established by the authority having jurisdiction and is sufficient to pose a threat to the public if released61
bull Infrastructure in transportation telecommunications or power networks including bridges tunnels (vehicular and rail) traffic signals (and other right of way elements including street lights and utilities) power transmission facilities substations circuit breaker houses city gate stations arterial roadways telecommunications central offices switching facilities etc
bull Ventilation buildings and fan plantsbull Operations centersbull Pumping stations (sanitary and stormwater)bull Train and transit maintenance yards and shopsbull Wastewater treatment plantsbull Water supply infrastructurebull Combined-sewer overflow (CSO) retention tanksbull Fueling stationsbull Waste transfer stations and bull Facilities where residents have limited mobility or ability including care facilities and nursing homes
55 If an industry standard does not include freeboard in its flood protection standards for particular infrastructure assets then only consider the sea level rise adjustment when determining flood protection levels
56 Note that NYC Building Code requires developers to use the PFIRM (2015) or the FIRM (2007) whichever is more restrictive For more information on these requirements please refer to Appendix G of the NYC Building Code
57 These freeboard values reflect NYC Building Code Appendix G Table 2-1 which establishes the minimum elevation of the top of lowest floor Appendix G requires other freeboard values for other parts of structures and in different parts of the floodplain Refer to Appendix G for the appropriate freeboard and use that value in Table 4 above
58 The sea level rise figures provided are for the middle of the 25th-75th percentile range projections from the NPCC These values do not necessarily indicate the average of all models
59 The structural occupancy categories outlined in Appendix G of the NYC Building Code are the same as ASCE 7 used for structural design For critical buildings structural design should comply with ASCE 7 and 24 for design class IV
60 This threshold represents the median volume of main food distributors in NYC according to statistics collected as part of the Five Borough Food Flow study in 2016 available at
httpswwwnycedccomsystemfilesfilesresource2016_food_supply-resiliency_study_resultspdf 61 The threshold quantity for hazardous materials is established by Chapter 7 of Title 24 of the NYC Administrative Code
NYC Mayorrsquos Office of Recovery and Resiliency Climate Resiliency Design Guidelines
24IIC SEA LEVEL RISE
Figure 9 ndash Outdoor emergency generator for the critical building
This case study provides an example of how to calculate a sea level rise-adjusted DFE based on the useful life of a hypothetical critical services building and its primary component
Step 1 Organize the site by various critical or primary components and their year of construction Determine their useful life along with the associated future year scenario for flood risk assessment In this example the building structure and the outside emergency generator are the most at-risk components from combined sea level rise and coastal storm surge
Step 2 Overlay the site footprint area over the effective current PFIRM or FIRM and the corresponding future year scenario FEMA 1 to identify flood risk to the site From overlaying the 2015 preliminary FEMA floodplain over the site it was determined that the site has a 1 annual chance of flooding with a base flood elevation of 13rsquo NAVD Step 3 Evaluate the criticality of each primary component of the facility based on the Guidelinesrsquo definition for critical infrastructure (Table 4) This (hypothetical) building is critical
Step 4 Use Table 4 to determine the sea level rise adjustment and freeboard requirements for each component and calculate the DFE for each that corresponds to its useful life period
Step 5 Compare the DFE of each component and the associated Guidelinesrsquo recommended DFE to calculate anticipated flood depth
CASE STUDY Adjusting the DFE for Sea Level Rise
Table 5 ndash Example of how to calculate a sea level rise-adjusted DFE for a critical facility
Construction year Components Useful
Life
Future Year Scenario
[Useful Life + Const
Year]
BFE in NAVD
88 (feet)
Freeboard + Sea
Level Rise Adjustment
(feet)
Adjusted DFE in
NAVD 88 (feet)
2010 Building Structure
70 years 2070-2099 130rsquo 2rsquo+23rsquo 173rsquo
2010Outdoor
Emergency Generator
25 years
Through 2039 130rsquo 2rsquo+05rsquo 155rsquo
Figure 8 - Example of how to locate a facility within the current floodplain and determine the BFE Figure 9 (inset) - Outdoor emergency generator at the facility
Figure 10 - This schematic shows how to determine the design flood elevation of a facility within the current 1 floodplain
Illustrative not to scale
NYC Mayorrsquos Office of Recovery and Resiliency Climate Resiliency Design Guidelines
25IIC SEA LEVEL RISE
Figure 11 - Flood Hazard Mapper with future 1 annual chance floodplain (adjusted for sea level rise) at httpwwwnycgovfloodhazardmapper
b) If the site is not in the future floodplain no flood protection is required for this facility
- OR - If the site is in the future floodplain identify the nearest adjacent base flood
elevation at the project site in the current 1 annual chance floodplain (PFIRM 2015) using the Flood Hazard Mapper62
c) Use Table 4 to determine the DFE Add freeboard and the sea level rise-adjustment to the nearest adjacent BFE on the
current 1 annual chance floodplain (PFIRM 2015) to determine the DFE
d) Apply the DFE calculation from Table 4 to the protected facility See Figures 12 and 13 for an illustration of how to calculate the DFE
62 Maps of future floodplains show the impacts of sea level rise alone and do not consider how changes in stormsrsquo climatology might also affect wave action and the full extent of the floodplain
3 Addressing risks in the future floodplainIf the facility is not in the current 1 annual chance floodplain (PFIRM 2015) it may still be at risk in the future from flooding as sea level rise increases the extent of the floodplain Follow the steps below to determine if your facility is located in the future floodplain and if so what sea level rise-adjusted DFE to use
a) Use the Flood Hazard Mapper (httpwwwnycgovfloodhazardmapper) to determine if the facility site will be in the future 1 annual chance floodplain
Assess if by the end of the facilityrsquos useful life the floodplain is projected to increase to encompass all or part of the project site For example if the useful life ends between 2040 and 2069 choose the 2050s floodplain map Refer to the steps in Figure 11 below
NYC Mayorrsquos Office of Recovery and Resiliency Climate Resiliency Design Guidelines
26IIC SEA LEVEL RISE
Figure 12 - This schematic map shows how to locate the nearest adjacent 1 floodplain elevation
Figure 13 -This schematic shows how to determine the design flood elevation of a facility that is outside of the current 1 floodplain
CASE STUDY Identifying a Base Flood Elevation (BFE) in the Future Floodplain
Illustrative not to scale
NYC Mayorrsquos Office of Recovery and Resiliency Climate Resiliency Design Guidelines
27IIC SEA LEVEL RISE
4 Identify appropriate design interventions
63 Additional resources for identifying adaptive strategies Urban Waterfront Adaptive Strategies (NYC Department of City Planning httpswww1nycgovassetsplanningdownloadpdfplans-studiessustainable-communitiesclimate-resilienceurban_waterfrontpdf Floodproofing Non-Residential Buildings (FEMA) at httpswwwfemagovmedia-libraryassetsdocuments34270 Ready to Respond Strategies for Multifamily Building Resilience (Enterprise Green Community) at
httpwwwenterprisecommunityorgresourcesready-respond-strategies-multifamily-building-resilience-1335664 While natural systems-based approaches ameliorate flooding their use for storm surge or wave mitigation would need to be quantified
before contributing towards the design flood elevation 65 For more information see FEMArsquos Floodproofing Non-Residential Buildings at httpswwwfemagovmedia-libraryassetsdocuments34270
Operational requirements and continuity plans can inform the selection of appropriate design interventions particularly in terms of how quickly a site needs to be up and running after a flood event Some examples of how functional uses can pair with interventions include
bull A facility that needs to be operating during or immediately after a flood event may need to be dry floodproofed using permanent barriers or designed for passive survivability (such as a police or fire station)
bull A facility that needs to recover quickly after an event could elevate prioritized equipment and have deployable barriers
bull A site that can recover over a longer duration of time could be temporarily inundated during an event (such as parks or plazas) The use of resilient materials and strategies can reduce costly damage caused by temporary inundation
Different design interventions should be chosen based on the specific operational requirements of the project however these must meet the ASCE 24 design requirements for Coastal VE Zones
For all projects at risk of current or future flooding select protections that meet the projectrsquos design flood elevation Consider project-specific factors including the site location operational requirements existing continuity planning and cost63 A Design Strategies Checklist in Appendix 6 is available for use as a resource to track possible design approaches Some examples of design alternatives are
bull Site relocation where feasible conduct alternative site analysis
bull Permanent barriers at a site (eg floodwalls)
bull Deployable flood barriers (eg stop logs flood doorsgates inflatable barriers)
bull Natural systems-based approaches (eg living shorelines restored wetlands)64
bull Prioritized protection of electrical mechanical and other critical or costly-to-replace equipment above the design flood elevation (eg motors and controller boilers and furnaces fuel storage tanks duct work alarm systems and suppression equipment electrical panels electrical distribution and switching areas gas and electric meters telecommunications equipment chemical feed equipment HVAC units and emergency generators)65
bull Dry floodproofing design a facility to prevent water from entering
bull Wet floodproofing design a facility to permit floodwaters to flow in and out of the structure without causing significant damage (eg elevate or protect critical equipment use water-resistant building materials below the design flood elevation include flood vents and pumps)
bull Design redundant telecommunications conduit entrances for multiple carrier entry Telecom conduit should run to diverse manholes when possible
bull Install backup power for telecom equipment with design consideration for such equipment (eg installation above DFE)
bull Install outdoor-rated disconnect switch for telecommunications equipment on the roofbull Explore interventions to protect underground utilities and other telecommunications
facilities from water damagebull Install backflow preventers backwater valves and sump pumps for all buildings and
infrastructure in the floodplain as well as behind flood barriersbull Shoreline improvements that reduce the height of waves or attenuate waves where
feasible
NYC Mayorrsquos Office of Recovery and Resiliency Climate Resiliency Design Guidelines
28IIIA GENERAL METHODOLOGY TO ESTIMATE PROJECT BENEFITSIIIB CATEGORIES OF PROJECT BENEFITS
Designing and constructing facilities to handle the future climate loads above the current NYC codes and standards based on projected useful life of the components provides resiliency benefits The incremental costs to implement the Guidelinesrsquo recommended design interventions should be compared with the incremental benefits to aid agencies in making decisions about resilient design strategies The project design team should evaluate benefits of the interventions designed to meet Guidelinesrsquo recommended criteria for all the climate stressors qualitatively andor quantitatively For projects with construction costs below $50 million the project design team is recommended to perform a qualitative benefits assessment on the interventions that meet the Guidelinesrsquo recommendations for all applicable climate stressors For critical facilities or projects with construction costs over $50 million the project design team is recommended to perform quantitative benefit calculations to identify the optimal interventions that meet Guidelinesrsquo recommended design criteria
A GENERAL METHODOLOGY TO ESTIMATE PROJECT BENEFITSThis general methodology to perform qualitative and quantitative benefit calculations is recommended for use by project design teams at the beginning of and during the design process This methodology enables estimation of project benefits for a high-level benefit-cost analysis (BCA) that can be applied to evaluate and compare resiliency features designed to address sea level rise with coastal storm surge increased precipitation and extreme heat events The type of benefits provided by interventions designed to meet the Guidelinesrsquo design criteria can vary by climate stressors and typology of the facilities The main guiding principle in development of the high-level BCA methodologies included in these Guidelines was to balance simplicity with accuracy The project benefits categories identified within the methodology may not cover all the potential benefits provided by every facility type within NYC In particular the benefits of planning for increased precipitation are difficult to quantify Hence the project design team should use their discretion to modify this general benefit calculation methodology as needed to meet their project goals and objectives The project design team should develop appropriate input data whether quantitative or qualitative needed to estimate project benefits
B CATEGORIES OF PROJECT BENEFITSThere are three types of project benefit categories - direct benefits indirect benefits and other benefits - that can be used to perform qualitative assessments and develop quantitative estimates of monetary benefits for intervention alternatives designed to meet the Guidelinesrsquo recommendations These project benefit categories will help to perform a high-level benefit-cost analysis that balances accuracy with an appropriate level of effort
bull Direct Benefits include reduced or avoided physical damages to facilities and contents reduced or avoided displacements for residential structures and reduced life cycle or OampM costs that can be quantified as a primary result of implementing a specific hazard mitigation measure Table 12 in Appendix 4 provides a list of direct benefits and basic guidance on estimating and documenting values for sea level rise and increased precipitation-related flood hazards Note that given the current state of practice it is not possible to quantify reduced or avoided physical damages or residential displacements that result from a specific extreme heat mitigation measures Therefore direct benefits applicable to extreme heat hazards are limited to reduced life cycle costs applicable to certain measures such as green roofs Refer to Table 15 for details on direct benefits for extreme heat hazards
III EVALUATION OF PROJECT BENEFITS
NYC Mayorrsquos Office of Recovery and Resiliency Climate Resiliency Design Guidelines
29IIIB CATEGORIES OF PROJECT BENEFITS
bull Indirect Benefits include reduced or avoided service losses for non-residential
buildings public facilities andor infrastructure (utilities roads and bridges) based on the value of service continuity andor emergency services to New Yorkers that can be quantified as a secondary result of implementing a specific hazard mitigation measure Table 13 in Appendix 4 provides a list of indirect benefits and basic guidance on estimating and documenting values for sea level rise and increased precipitation-related flood hazards Note that given the current state of practice on extreme heat it is not possible to quantify reduced or avoided service losses that result from a specific extreme heat mitigation measures Therefore indirect benefits applicable to extreme heat hazards are limited to reduced energy costs such as cool roofs green roofs or shade trees Refer to Table 15 in Appendix 4 for details on indirect benefits for extreme heat hazards
bull Other Benefits where applicable other potential benefits may include social benefits for residents such as avoided stress and anxiety avoided lost productivity environmentalecosystem service benefits avoided need for emergency services and other potential benefits that can be estimated as a result of implementing a specific hazard mitigation measure Table 14 in Appendix 4 provides a list of other potential benefits and basic guidance on estimating and documenting values for sea level rise and increased precipitation-related flood hazards
Note on the ecosystem service benefit category in Table 14 the stormwater management benefits of green infrastructure should be distributed between the extreme heat and increased precipitation hazards since these measures provide both significant reductions in rainfall runoff as well as Urban Heat Island mitigation through evapotranspiration However there is currently limited data available to quantify the actual distribution of stormwater management benefits between the two hazards For various dual-benefit providing interventions careful considerations should be given to identify the appropriate benefits category provided by the intervention with a goal to avoid duplication of quantified benefits In this methodology the stormwater management benefits of green infrastructure are applied to the increased precipitation hazard in order to avoid a duplication of benefits Note on real estate and quality of life benefits additionally it is important to note that two potential benefit categories shown in Table 14 - real estate and quality of lifehealthavoided casualties - were not included in the current BCA methodology for sea level rise or increased precipitation hazards Although these categories could increase project benefits for sea level rise and increased precipitation hazards they were only applied to measures that address extreme heat hazards such as green roofs trees and other plantings Refer to Table 15 for a detailed summary of other benefit categories quantified as unit benefits for extreme heat hazards
NYC Mayorrsquos Office of Recovery and Resiliency Climate Resiliency Design Guidelines
30IIIC WHICH METHODOLOGY TO USEIIID BCA METHODOLOGY FOR PROJECTS UNDER $50 MILLION
D BCA methodology for projects under $50 millionThe project design team should develop design alternatives to meet the Guidelinesrsquo criteria which may be in excess of NYC code and standards requirements (baseline conditions) It is assumed that the project design team will develop alternatives to address each of the following applicable climate stressors - sea level risecoastal storm surge increased precipitation and extreme heat - separately Tables 12-15 in Appendix 4 provides a list of typical direct indirect and other benefits provided by various intervention typologies to reduce impacts from climate stressors During the qualitative assessment the project design team should consider that intervention strategies will have varying levels of reliability effectiveness benefits and cost implications during the qualitative assessment
The project design team is recommended to develop appropriate evaluation criteria and metrics for each of the applicable project benefit categories For each alternative the project design team could use either a scoring weighting ranking or other type of qualitative assessment framework to assess each applicable project benefit categories with the developed evaluation criteria and metrics Table 6 provides an example template to evaluate alternatives using a set of general evaluation criteria and metrics using a color-coded rating system (and see Table 7 for an example of how to complete the template) The project design team can utilize a similar template customized to their project goals and objectives This assessment allows agencies to screen the qualitative benefits for various alternatives that would then lead to development of final project components to match the available budget and goals of the project
Projects with total costs below $50 million recommended to conduct a qualitative assessment to identify the optimal interventions that meet Guidelinesrsquo design criteria using the ldquoD) BCA methodology for projects under $50 millionrdquo methodology below
C WHICH METHODOLOGY TO USEProjects with a total cost above $50 million or are highly complex or critical facilities recommended to conduct both a qualitative and quantitative benefit calculation to identify the optimal interventions that meet Guidelinersquos design criteria using the ldquoE) BCA methodology for projects above $50 millionrdquo below A quantitative BCA also must include qualitative factors
NYC Mayorrsquos Office of Recovery and Resiliency Climate Resiliency Design Guidelines
31IIID BCA METHODOLOGY FOR PROJECTS UNDER $50 MILLION
Qualitative Color Scale Green=Least resource intensive alternative Purple=most resource intensive yellow=medium level of resource intensity
Qualitative Evaluation Factors Description Relative Color Rating System
First CostsAdditional construction costs needed to incorporate Guidelinesrsquo recommended resilient design over the baseline project costs
Highest cost ($$$) rated as Purple whereas lowest cost ($) rated as Green
ConstructabilityEase of Implementation
Construction techniques and site conditions such as presence of major utilities conflicts and other conditions which dictate the level of constructability required for each alternative
Difficult to construct rated as Purple whereas easiest to construct rated as Green
Environmental ImpactsCo-BenefitsPermitting
Impacts to the built and natural environment such as circulation noise and hazardous waste plus the level of effort required for permitting (eg interventions in water require highest level of permitting requirement) from each alternative in addition to the baseline project condition
Highest environmental impacts and highest level of effort required for permitting rated as Purple whereas the least impact and level of effort rated as Green
Operation and Maintenance (OampM)
Level of effort of additional manpower and cost of OampM for the alternatives over the baseline project OampM requirements
Highest level of effort and cost for OampM rated as Purple whereas the lowest is rated as Green
Reliability and Durability
Interventions that do not require human involvement or a facilityrsquos ability to withstand all the forces during a storm event (eg permanent solutions with higher reliability than deployable solution)
Interventions requiring human involvement (active measures) rated as Purple whereas interventions with minimal or no human involvement (passive measures) rated as Green
Risk Reduction Benefits Monetary benefits provided by each intervention alternative in avoided damages over the baseline condition
Lowest potential monetary benefit rated as Purple whereas as highest potential monetary benefit rated as Green
Quality of Life BenefitsVisual Aesthetics
Benefits either to the community such as recreation or safety or serve the community during emergency situations
Lowest potential quality of life benefits rated as Purple whereas as highest potential benefits rated as Green
Table 6 ndash Evaluation matrix for comparison of mitigation alternatives across the useful life of a project
Project title_______________________________________________________________________________
Evaluation Criteria
Baseline Condition (Designed to NYC Building Code and
Standards)
Resilient Design Alternatives for Managing__________________
Alternative 1
Alternative 2
Alternative 3
First Costs
ConstructabilityEase of ImplementationEnvironmental ImpactsCo-BenefitsPermitting
Operation and Maintenance (OampM)
Reliability and Durability
Risk Reduction Benefits
Quality of Life BenefitsVisual Aesthetics
NYC Mayorrsquos Office of Recovery and Resiliency Climate Resiliency Design Guidelines
32IIID BCA METHODOLOGY FOR PROJECTS UNDER $50 MILLION
Table 7 ndash Evaluation matrix for comparison of mitigation alternatives across the useful life of a project - COMPLETED EXAMPLE
Evaluation Criteria
Baseline Condition (Designed to NYC Building Code and
Standards)
Resilient Design Alternatives for Managing Coastal SurgeSLR
Alternative 1Flood proof building built on grade to Guidelines
DFE
Alternative 2 Elevate building structure above Guidelinesrsquo DFE
on columns
Alternative 3 Raise site grade by filing the building site footprint
to Guidelinesrsquo DFE
First CostsBaseline cost for building structure is $15 million
Incremental costs are within 5 over the baseline costs
Incremental costs are between 5-10 over baseline costs
Incremental costs are 20 and more over baseline costs
ConstructabilityEase of Implementation
Relatively easy to construct within site constraints
Similar to baseline conditions since construction requires additional flood proofing only
Moderate challenges to construct foundation structure for columns within site constraints
Extremely challenging to construct within the site constraints Potentially fatal flaw
Environmental ImpactsCo-BenefitsPermitting
No major impacts but may require additional effort to obtain DOB permits with flood proofing and deployable systems
No major impacts but may require additional effort to obtain DOB permits with flood proofing and deployable systems
No major impacts and relatively easy to permit
Potential drainage circulation impacts and challenges to obtain clean fill material for the site
Operation and Maintenance (OampM)
Major OampM costs associated with deployable systems
Major OampM costs associated with deployable systems
Moderate OampM costs associated with proposed elevator for access
Minimal OampM costs since deployable and elevators not required
Reliability and Durability
Least reliability with highest potential risk from flooding during to failure of deployable systems
Least reliability with highest potential risk from flooding during to failure of deployable systems
Moderate reliability with potential risk from flooding limited to elevator shaft only
Highest reliability since deployable are not required to protect building from flooding
Risk Reduction Benefits
Maximum flood risk reduction benefits assuming deployable and flood proofing is effective
Maximum flood risk reduction benefits assuming deployable and flood proofing is effective
Maximum flood risk reduction benefits
Maximum flood risk reduction benefits
Quality of Life BenefitsVisual Aesthetics
Facility may not be operational during the storm event
Facility may not be operational during the storm event
Facility can be potentially operational during the storm event
Facility can be potentially operational during the storm event
Qualitative Color Scale Green=Least resource intensive alternative Purple=most resource intensive yellow=medium level of resource intensity
A new non-critical facility with a building structure is proposed on a site that is currently in the 2015 Preliminary FEMA 1 annual chance floodplain with a BFE of 10rsquo (NAVD 88) The baseline conditions DFE to meet existing NYC codes and standards is 11rsquo (NAVD 88) Using the Guidelines recommended design criteria the facilityrsquos DFE is 133rsquo (NAVD 88) and existing grade is around 6rsquo (NAVD 88) The project design team develops three alternatives to meet the Guidelinesrsquo recommended DFE design for the facility Table 7 offers an example of how a qualitative assessment can be used to compare three resilient design alternatives using the evaluation criteria and metrics
CASE STUDY Example of How to Use the Evaluation Matrix
NYC Mayorrsquos Office of Recovery and Resiliency Climate Resiliency Design Guidelines
33IIIE BCA METHODOLOGY FOR PROJECTS OVER $50 MILLION
E BCA methodology for projects over $50 millionIn order for a project to be considered cost-effective a benefit-cost analysis (BCA) assesses if the benefits of a project outweigh its costs or in other words the benefit-cost ratio (BCR) is greater than 10 as illustrated in Equation 1
Equation 1 Benefit-Cost Ratio Formula
BCR =
Where BCR = Benefit-Cost Ratio
BENEFITS = Total project benefits
COSTS = Total project costs
BENEFITSCOSTS
These estimated project benefits are combined with the project costs which are defined as the differential construction and long-term operation and maintenance costs associated with constructing a proposed project to the Guidelinesrsquo recommended design level It is assumed that the baseline project will be designed to the most prevalent NYC codes and standards This benefit methodology should be used to determine the additional project benefit that the Guidelinesrsquo recommended design would provide over the baseline project benefit It is assumed that the project design team will develop alternatives to address each of the following applicable climate stressors - sea level risecoastal storm surge increased precipitation and extreme heat - separately For each alternative the project design team should use the following steps to determine the Benefit-Cost Ratio (BCR)
a) Determine project useful life for design interventions Determining the useful life of the proposed project is an important first step in the
detailed BCA assessment methodologies for two reasons First the project useful life determines what values must be used from the Guidelines to establish the future climate design conditions The various hazard tables in the Guidelines establish design requirements based on useful life ranges through 2039 2040-2069 2070-2099 and 2100+ (2100+ projections are only available for sea level rise) A review of these tables show that the design requirements needed to meet the projected climate hazards increase as the end of useful life range increases Second the useful life determines how long the project will need to be operated and maintained in order to remain technically sound and effective at reducing future damages and losses
b) Determine discount rate for project benefits calculation The cost-effectiveness of projects assessed using the BCR must be done on a net
present value basis meaning the present value of the benefits is compared to the present value of the costs Most project costs are computed for present value based on current cost estimates bids or cost guidance However project benefits - as well as project costs for operation and maintenance - accrue over time into the future and are computed on an annualized basis To address this issue the Present Value Coefficient (PVC) is used to bring these annualized project benefits and OampM costs into the present value As indicated by the formula in Equation 2 the PVC is a function of the Project Useful Life (PUL) and the Discount Rate (DR)
NYC Mayorrsquos Office of Recovery and Resiliency Climate Resiliency Design Guidelines
34
Equation 2 Present Value Coefficient (PVC) Formula
PVC =
Where PVC = Present Value Coefficient
PUL = BCA Project Useful Life based on project type
DR = Discount Rate
The project design team should coordinate with agencies and NYC OMB if needed to determine appropriate discount rates based on funding source project type and other factors This coordination should take place during project initiation phase where total project costs (design and construction) are over $50 million66
c) Develop input data to perform benefit calculations Tables 16 and 17 in Appendix 4 provide a list of typical input data by each climate
stressor needed to perform benefit analysis quantitatively on variety of facilities67 The project design team should use these tables as a reference to identify appropriate input data categories andor additional input data needed to perform benefit analysis on the project
d) Identify applicable project benefit categories to estimate benefits Tables 16 and 17 in Appendix 4 provide a list of typical project benefits by each climate
stressor needed to perform benefit analysis quantitatively on various types of projects The project design team should use these tables as a reference to identify appropriate project benefit categories for each climate stressor to perform benefit analysis on the project
e) Calculate benefits of recommended design interventions for each climate
stressor The input data and applicable project benefits can be assembled along with
incremental project cost data to analyze cost-effectiveness using the FEMA BCA Tool Damage-Frequency Assessment (DFA) module or similar software This analysis will provide a BCR for each alternative which can then be used to compare the alternatives that were developed to mitigate effects from applicable climate stressors The project design team can then use the results from this analysis to identify optimal interventions that provides a balanced solution that provides resiliency benefits within the available project budget
IIIE BCA METHODOLOGY FOR PROJECTS OVER $50 MILLION
[1 ndash (1 + DR) -(PUL)]DR
66 For example a NYC OMB March 2015 memorandum recommends using an annually updated DR as published each year in Appendix C of OMB Circular A-94 The current OMB-recommended discount rates from OMB A-94 Appendix C vary by project useful life and are as follows 21 DR for useful lives of 10 to 19 years 25 DR for useful lives of 20 to 29 years and 28 DR for useful lives of 30 years or greater By contrast FEMA hazard mitigation grants use a DR of 70 for all projects based on the Federal OMB A-94 rate for federally-funded mitigation measures Since these DRs will impact the PVC and the project benefits the project team must ensure that BCA results prepared using an OMB-recommended DR (21 to 28) be updated to reflect the Federal DR (70) when applying for FEMA mitigation grant funds
67 Note the data requirements for the sea level rise and increased precipitation hazards in Table 16 are more detailed than the requirements for the extreme heat hazards due to the less detailed level of analysis available for extreme heat
NYC Mayorrsquos Office of Recovery and Resiliency Climate Resiliency Design Guidelines
35
APPENDICES
NYC Mayorrsquos Office of Recovery and Resiliency Climate Resiliency Design Guidelines
36APPENDIX 1 ndash KEY TERMS
100-year flood (1 annual chance flood)
A flood that has a 1 probability of occurring in any given year The 100-year floodplain is the extent of the area of a flood that has a 1 chance of occurring or being exceeded in any given year
500-year flood (02 annual chance flood)
A flood that has a 02 probability of occurring in any given year The 500-year floodplain is the extent of the area of a flood that has a 02 chance of occurring or being exceeded in any given year
AdaptationAdjustment in natural or human systems to a new or changing environment that seeks to maximize beneficial opportunities or moderate negative effects Successful adaptations contribute to resiliency
Base flood elevation (BFE)The elevation of surface water resulting from a flood that has a 1 annual chance of occurring or being exceeded in any given year The BFE is shown on the Flood Insurance Rate Map (FIRM)69
BluebeltReference to the Department of Environmental Protectionrsquos (DEP) Bluebelt program to preserve natural drainage corridors including streams ponds and other wetland areas Preservation of these wetland systems allows them to perform their functions of conveying storing and filtering storm water
Climate
The average weather (or more rigorously a statistical description of the average in terms of the mean and variability) over a period of time usually 30 years These quantities are most often surface variables such as temperature precipitation and wind Climate in a wider sense is the state including a statistical description of the climate system70
Climate change
Changes in average weather conditions that persist over multiple decades or longer Climate change encompasses both increases and decreases in temperature as well as shifts in precipitation changing risk of certain types of severe weather events and changes to other variables of the climate system
Climate change riskThe chance that investments (such as in capital projects) can be affected by the physical impacts of climate change71 Risks are evaluated as a product of the probability of occurrence and the magnitude of damages or impacts including socioeconomic factors that would result if they did occur (consequences)
Climate change risk assessment
This assessment involves a detailed project-specific analysis that includes a vulnerability and risk assessment often followed by cost-benefit analysis to assess and select investments in climate change risk mitigation Risk is assessed as a function of the magnitude and probability of a given climate change hazard Examples resources are included in Appendix 7
Climate vulnerabilityThe degree to which systems and populations are affected by adverse impacts It is a function of the character magnitude and rate of climate change and variation to which a system is exposed its sensitivity and its adaptive capacity72
Cloudburst An extreme amount of rain in a short period of time often over a small geographic area73
Cooling Degree Day (CDD) A form of degree-day used to estimate the energy requirements for air conditioning or refrigeration when the daily mean temperature is above 65degF
68 All terms are from the US Global Change Research Program (USGCRP) glossary unless otherwise noted The USGCRP glossary is available at httpwwwglobalchangegovclimate-changeglossary
69 ldquoDefinitionsrdquo FEMA last modified March 1 2017 httpswwwfemagovnational-flood-insurance-programdefinitions70 UKCIP Glossary httpwwwukciporgukglossary71 ldquoAccount for Climate Riskrdquo International Finance Corporation 72 UKCIP Glossary httpwwwukciporgukglossary73 New York City Environmental Protection ldquoCloudburst Resiliency Planning Studyrdquo 2017 Available at httpwwwnycgovhtmldeppdfclimatenyc-cloudburst-studypdf
APPENDIX 1 - KEY TERMS68
NYC Mayorrsquos Office of Recovery and Resiliency Climate Resiliency Design Guidelines
37APPENDIX 1 ndash KEY TERMS
Design life The life expectancy of an asset or product as determined during design74 As opposed to useful life (see below)
Dry Bulb temperature The ambient air temperature measured by a thermometer
Extreme eventUnexpected unusual or unpredictable weather or flooding compared to historical or future projected distribution Extreme events include for example heat waves cold waves heavy rains periods of drought and flooding and severe storms
Facilities For the purposes of this document ldquofacilitiesrdquo refers to all types of buildings housing infrastructure structures and landscape features designed by or for the City of New York
Flexible adaptation pathwayResilience-building strategies that can evolve or be adapted over time as climate change risk assessments evaluations of adaptation strategies and monitoring continue75
Flood Insurance Rate Maps (FIRM)
Official flood map of a community on which FEMA has delineated the 1 annual chance floodplain and the base flood elevations (BFEs) applicable to the community76 The FIRM also includes the 02 floodplain annual chance floodplain and differentiates between special flood hazard areas (V A Coast A zones) and floodways The official FIRM is from the year 2007 while the 2015 PFIRM is currently required by NYC Building Code to calculate design flood elevations NYC DOB references the more restrictive of the two maps in both base flood elevation and flood hazard area (ie V versus A zone) Refer to Appendix 3 for more information
FreeboardAn additional amount of height above the base flood elevation used as a factor of safety (eg two feet above the base flood) in determining the level at which a facilitys lowest floor must be elevated or floodproofed to be in accordance with state or community floodplain management regulations77
Future time slices
Future periods defined by the NPCC for when climate change projections are available In this document the following decadal projections are associated with specific time spans2020s projection = present to 20392050s projection = 2040 to 20592080s projection = 2070 to 20992100s projection = end of century and beyond
Green infrastructureAn array of practices that use or mimic natural systems to manage urban stormwater runoff Water is either directed to engineered systems for infiltration or detained for longer periods before it enters the sewer system
Heat Vulnerability Index (HVI)Summarizes relative risk of adverse health effects from heat due to social and environmental factors Used to identify neighborhoods at higher risk during and after extreme heat events
Heat wave A period of three consecutive days where temperatures rise above 90degF or two consecutive days over 95 degrees78
New York City Panel on Climate Change (NPCC)
The body of leading climate and social scientists charged with making climate change projections for the metropolitan region79
74 Sustainable Infrastructure Management Program Learning Environment httpsimplewerforg 75 Rosenzweig C et al Climate Change Adaptation in New York City Building a Risk Management Response76 ldquoDefinitionsrdquo FEMA77 Ibid78 Horton R et al New York City Panel on Climate Change 2015 Report Chapter 1 Climate Observations and Projections Ann NY
Acad Sci ISSN 0077-8923 (New York 2015) 2579 For more information on the NPCC visit www1nycgovsiteorrchallengesnyc-panel-on-climate-changepage
NYC Mayorrsquos Office of Recovery and Resiliency Climate Resiliency Design Guidelines
38APPENDIX 1 ndash KEY TERMS
Open-grid pavement system
Pavements that consist of loose substrates supported by a grid of a more structurally sound grid or webbing Unbounded loose substrates in these systems transfer and store less heat than bound and compacted pavements and aid permeability Pavement is 50 pervious and contains vegetation in the open cells designed to allow percolation or infiltration of storm water through the surface into the soil below80
Preliminary Flood Insurance Rate Map (PFIRM)
Preliminary flood map developed by FEMA in 2015 for New York City that provides projected risks for flood hazards81 Refer to Appendix 3 for more information
Project useful life (PUL)
The period over which an asset or component is expected to be available for use by an entity This depends on regular and adequate maintenance This period of time typically exceeds the design life (see above) The combined effect of operational requirements and useful life is practical in assessing an investment in improving resilience82
Rain gardenAlso called ldquobioswalerdquo Planted areas designed to collect and manage stormwater that runs off streets sidewalks commercial and residential rooftops and other sources when it rains
Resiliency The ability to bounce back after change or adversity The capability of preparing for responding to and recovering from difficult conditions83
Sea level rise-adjusted design flood elevation
As defined in these Guidelines the increased height of the base flood elevation due to sea level rise plus freeboard depending on the criticality of the facility The sea level rise adjustment depends on the useful life of the facility
Storm surge An abnormal rise of water generated by a storm over and above predicted astronomical tides84
Substantial improvementAny repair reconstruction rehabilitation addition or improvement of a building or structure the cost which equals or exceeds 50 of the market value of the structure before the improvement or repairs started For more information see Appendix G of the NYC Building Code and 1 RCNY sect3606-0185
Tidal inundation Flooding which occurs at high tides due to climate-related sea level rise land subsidence andor the loss of natural barriers86
Urban Heat Island (UHI) effectThe tendency for higher air temperatures to persist in urban areas as a result of heat absorbed and emitted by buildings and asphalt tending to make cities warmer than the surrounding suburban and rural areas
Weather The state of the atmosphere at a given time with regard to temperature cloudiness precipitation wind and other meteorological conditions87
Wet Bulb temperatureThe temperature indicated when a thermometer bulb is covered with a water-saturated wick over which air is caused to flow at approximately 45 ms (900 ftmin) to reach the equilibrium temperature of water evaporating into the air when the heat of vaporization is supplied by the sensible heat of the air88
80 ldquoGlossaryrdquo US Green Building Council (2017) Available at httpwwwusgbcorgglossaryterm552581 ldquoPreliminary FEMA Map Productsrdquo FEMA Map Service Center Available at httpshazardsfemagovfemaportalprelimdownload82 ldquoGlossaryrdquo International Infrastructure Management Manual (2011) 83 A Stronger More Resilient New York (2013) 184 ldquoStorm Surge Overviewrdquo National Hurricane Center NOAA Available at httpswwwnhcnoaagovsurge85 ldquoFlood Resistant Constructionrdquo Appendix G New York City Building Code (2008) and 1 RCNY sect3606-01 available at httpswww1nycgovassetsbuildingsrules1_RCNY_3606-01pdf86 ldquoOcean Factsrdquo National Ocean Service NOAA Available at httpoceanservicenoaagovfactsnuisance-floodinghtml 87 UKCIP Glossary httpwwwukciporgukglossary88 ldquoASHRAE Terminologyrdquo ASHRAE Available at httpswwwashraeorgtechnical-resourcesauthoring-toolsterminology
NYC Mayorrsquos Office of Recovery and Resiliency Climate Resiliency Design Guidelines
39APPENDIX 2 - CLIMATE CHANGE PROJECTIONS
Climate change projections are provided by the New York City Panel on Climate Change (NPCC) The full NPCC report is available from the New York Academy of Sciences89 Tables 8-10 (below) were reproduced directly from the NPCC report while Table 2 (see Section IIA) was developed using the data underlying the NPCC report to inform the design of HVAC systems under warmer conditions
Table 8 ndash NYC sea level rise projections90
Baseline (2000-2004) 0 in
Low estimate (10th percentile)
Middle range (25th to 75th percentile)
High estimate (90th percentile)
2020s 2 in 4-8 in 10 in
2050s 8 in 11-21 in 30 in
2080s 13 in 18-39 in 58 in
2100 15 in 22-50 in 75 in
Note Projections are based on six-component approach that incorporates both local and global factors The model-based components are from 24 global climate models and two representative concentration pathways Projections are relative to the 2000-2004 base period
Table 9 ndash Mean annual changes91
a Temperature Baseline(1971-2000) 54degF
Low estimate (10th percentile)
Middle range (25th to 75th percentile)
High estimate (90th percentile)
2020s + 15degF +20-29degF +32degF
2050s +31degF +41-57degF +66degF
2080s +38degF +53-88degF +103degF
2100 +42degF +58-104degF +121F
b Precipitation Baseline(1971-2000) 501 in
Low estimate (10th percentile)
Middle range (25th to 75th percentile)
High estimate (90th percentile)
2020s -1 percent +1-8 +10
2050s +1 percent +4-11 +13
2080s +2 percent +5-13 +19
2100 -6 percent -1 to +19 +25
Note Based on 35 global climate models (GCMs) and two RCPs Baseline data cover the 1971ndash2000 base period and are from the NOAA National Climatic Data Center (NCDC) Shown are the low estimate (10th percentile) middle range (25th percentile to 75th percentile) and high estimate (90th percentile) These estimates are based on a ranking (from most to least) of the 70 (35 GCMs times 2 RCPs) projections The 90th percentile is defined as the value that 90 percent of the outcomes (or 63 of the 70 values) are the same or lower than Like all projections the NPCC climate change projections have uncertainty embedded within them Sources of uncertainty include data and modeling constraints the random nature of some parts of the climate system and limited understanding of some physical processes The NPCC characterizes levels of uncertainty using state-of-the-art climate models multiple scenarios of future greenhouse gas concentrations and recent peer-reviewed literature Even so the projections are not true probabilities and the potential for error should be acknowledged
89 The NPCC 2015 report is available at httponlinelibrarywileycomdoi101111nyas20151336issue-1issuetoc90 From New York City Panel on Climate Change 2015 Report Chapter 1 Climate Observations and Projections page 4191 From New York City Panel on Climate Change 2015 Report Chapter 1 Climate Observations and Projections page 30
APPENDIX 2 - CLIMATE CHANGE PROJECTIONS
NYC Mayorrsquos Office of Recovery and Resiliency Climate Resiliency Design Guidelines
40APPENDIX 2 - CLIMATE CHANGE PROJECTIONS
Table 10 ndash Extreme events92
2020s Baseline (1971-2000)
Low estimate(10th percentile)
Middle range(25th to 75th percentile)
High estimate (90th percentile)
Numbers of heat waves per year 2 3 3-4 4
Average heat wave duration (days) 4 5 5 5
Number of days per year with
Maximum temperature at or above 90degF 18 24 26-31 33
Maximum temperature at or above 100degF 04 07 1-2 2
Minimum temperature at or below 32degF 71 50 52-58 60
Rainfall at or above 1 inch 13 13 14-15 16
Rainfall at or above 2 inches 3 3 3-4 5
Rainfall at or above 4 inches 03 02 03ndash04 05
2050s Baseline (1971-2000)
Low estimate(10th percentile)
Middle range(25th to 75th percentile)
High estimate (90th percentile)
Numbers of heat waves per year 2 4 5-7 7
Average heat wave duration (days) 4 5 5-6 6
Number of days per year with
Maximum temperature at or above 90degF 18 32 39-52 57
Maximum temperature at or above 100degF 04 2 3-5 7
Minimum temperature at or below 32degF 71 37 42-48 52
Rainfall at or above 1 inch 13 13 14-16 17
Rainfall at or above 2 inches 3 3 4-4 5
Rainfall at or above 4 inches 03 03 03-04 05
2080s Baseline (1971-2000)
Low estimate(10th percentile)
Middle range(25th to 75th percentile)
High estimate (90th percentile)
Numbers of heat waves per year 2 5 6-9 9
Average heat wave duration (days) 4 5 5-7 8
Number of days per year with
Maximum temperature at or above 90degF 18 38 44-76 87
Maximum temperature at or above 100degF 04 2 4-14 20
Minimum temperature at or below 32degF 71 25 30-42 49
Rainfall at or above 1 inch 13 14 15-17 18
Rainfall at or above 2 inches 3 3 4-5 5
Rainfall at or above 4 inches 03 02 03-05 07
Note Projections for temperature and precipitation are based on 35 GCMs and 2 RCPs Baseline data are for the 1971 to 2000 base period and are from the NOAA National Climatic Data Center (NCDC) Shown are the low estimate (10th percentile) middle range (25th to 75th percentile) and high estimate (90th percentile) 30-year mean values from model-based outcomes Decimal places are shown for values less than one although this does not indicate higher precisioncertainty Heat waves are defined as three or more consecutive days with maximum temperatures at or above 90degF Like all projections the NPCC climate change projections have uncertainty embedded within them Sources of uncertainty include data and modeling constraints the random nature of some parts of the climate system and limited understanding of some physical processes The NPCC characterizes levels of uncertainty using state-of-the-art climate models multiple scenarios of future greenhouse gas concentrations and recent peer-reviewed literature Even so the projections are not true probabilities and the potential for error should be acknowledged
92 From New York City Panel on Climate Change 2015 Report Chapter 1 Climate Observations and Projections page 31
NYC Mayorrsquos Office of Recovery and Resiliency Climate Resiliency Design Guidelines
41APPENDIX 3 - DIFFERENTIATION OF FLOOD MAPS
These Guidelines reference several different kinds of flood maps and sources of design flood elevations These maps are described and differentiated below
Table 11 - Differentiation of flood maps used in NYC
Reference Title Data Source Information Provided Referenced By Link
2007 FIRM FEMA
Based on historical data from before 1983 identifies the current base flood (extent and elevation) as the flood that has a 1 chance of occurring in any given year also known as a 100-year flood The NYC Building Code requires that either the 2007 FIRM or 2015 PFIRM elevation be used whichever is higher
2014 NYC Building Code Appendix G
Climate Resiliency Design Guidelines
httpsmscfemagovportal
2015 PFIRM FEMA
Based on historical data identifies the current base flood (extents and elevation) as the flood that has a 1 chance of occurring in any given year also known as a 100-year flood The NYC Building Code requires that either the 2007 FIRM or 2015 PFIRM elevation be used whichever is higher The 2015 PFIRM is currently being reassessed by FEMA
2014 NYC Building Code Appendix G
Climate Resiliency Design Guidelines
httpshazardsfemagovfemaportalprelimdownload
httpwwwregion2coastalcomview-flood-maps-dataview-preliminary-flood-map-data
NYC Flood Hazard Mapper
NYC Department of City Planning
Maps current and future flood hazards in NYC including the following data layers 2007 FIRM and 2015 PFIRM high tide with sea level rise and PFIRM with sea level rise through 2100
Climate Resiliency Design Guidelines
Waterfront Revitalization Plan
httpwww1nycgovsiteplanningdata-mapsflood-hazard-mapperpage
ldquoTable 4 ndash Determine the sea level rise-adjusted design flood elevation for critical and non-critical facilitiesrdquo
ORR amp NPCC
Provides data to use when adding sea level rise to a given 2015 PFIRM or 2007 FIRM Base Flood Elevation (BFE) to calculate a Design Flood Elevation (DFE) Based on the criticality and expected useful life of a facility
Climate Resiliency Design Guidelines
See Section II on ldquoSea Level Riserdquo above
APPENDIX 3 - DIFFERENTIATION OF FLOOD MAPS
NYC Mayorrsquos Office of Recovery and Resiliency Climate Resiliency Design Guidelines
42APPENDIX 4 - PROJECT BENEFITS CATEGORIES
This appendix provides guidance on how to identify and assess benefits as a supplement to Sections IIID and IIIE
Table 12 lists typical direct benefits for reducing impacts from climate stressors and basic guidance for how to estimate them See Section IIID for more information
Table 13 lists typical indirect benefits for reducing impacts from climate stressors and basic guidance for how to estimate them See Section IIID for more information
Table 12 ndash Direct benefits for (1) sea level rise with coastal storm surge and (2) increased precipitation measures
Direct Benefit Basic Guidance for Estimating Values
Physical Damages (Structure Contents)
bull For flood-damaged buildings use depth damage functions developed by FEMA and USACE for structures and contents
bull Use depth damage functions in conjunction with Building Replacement Values (BRVs) and not market values BRVs typically range between $100 to $325SF for residential buildings and $120 to $450SF for commercial public buildings
bull For more complex structures or facilities use engineering estimates of flood damages or review historic flood damages documented from insurance claims repair records or FEMA Public Assistance claims from recent flood disasters
Residential Displacements
bull For flood-damaged buildings use depth damage functions developed by FEMA and USACE for residential displacements
Reduced Life CycleOperation and Maintenance (OampM) Costs93
bull Applicable only to projects that reduce overall life cycle costs or net annual OampM costs from baseline conditions
bull Input reduced annual OampM costs as a project benefit at a 1-year recurrence intervalbull Reduced overall life cycle costs can be input as a longer project useful life
Table 13 ndash Indirect benefits for (1) sea level rise with coastal storm surge and (2) increased precipitation measures
Indirect Benefit Basic Guidance for Estimating Values
Non-Residential Building Service Losses
bull Estimate service loss values and durations for non-residential buildings public buildings critical facilities and parksnatural features based on FEMA BCA guidance and standard values based on building use
Utility Service Losses94
bull Estimate utility service losses for water wastewater and electrical facilities based on the number of impacted customers FEMA per capita standard values for utility service ($105personday for potable water $49personday for wastewater $148personday for electrical)95
bull Estimate utility service loss durations based on engineering estimates or review historic flood damages losses documented from utility company records
bull This benefit can also apply to measures that increase energy efficiency
RoadBridge Service Losses
bull Estimate roadbridge service losses based on the average daily traffic (ADT) detour time and additional travel distance and FEMA and GSA standard values for road service ($3344vehiclehour of delay $0545mile)96
bull Estimate roadbridge service loss durations or review historic flood damages losses
Emergency Service Losses
bull Applicable only to projects that reduce or eliminate documented emergency service costs from baseline conditions
bull Examples of avoided emergency services costs include NYPD staffing to monitor barricades for flooded roads or NFDY staffing for water rescues of residents from flooded buildings or streets
APPENDIX 4 - PROJECT BENEFITS CATEGORIES
93 Reduced life cycle costs may be applicable to some measures that provide extreme heat benefits such as green roofs that can last longer than a standard roof if properly maintained
94 Reduced utility service costs may be applicable to some measures that provide extreme heat benefits such as cool roofs green roofs and shade trees
95 FEMA per capita standard values taken from FEMA BCA Toolkit Version 530 (Build Date 12222016) and developed in FEMArsquos Baseline Standard Economic Value Methodology Report (July 28 2016) Consider updating FEMA standard per capita values to reflect current New York City utility rates
96 Consider updating FEMA and GSA standard values to reflect current New York City area labor rates and fuel costs
NYC Mayorrsquos Office of Recovery and Resiliency Climate Resiliency Design Guidelines
43APPENDIX 4 - PROJECT BENEFITS CATEGORIES
Table 14 ndash Other potential benefits for (1) sea level rise with coastal storm surge and (2) increased precipitation measures
Other Benefit Basic Guidance for Estimating Values
Avoided Stress and Anxiety
bull Applicable only for projects that directly benefit occupants of residential structuresbull Use FEMA standard value for avoided mental stress and anxiety treatment costs of $2443person to
estimate benefit for all impacted residents97
Avoided Lost Productivity
bull Applicable only for projects that directly benefit occupants of residential structuresbull Use FEMA standard value for avoided lost worker productivity costs of $8736household to estimate
benefit for all impacted workers (conservatively assuming one worker per household)
Environmental Open Space
bull Applicable only for projects that create or acquire open space areas by acquisitionbull Use FEMA standard value for environmental open space based on the type of land acquired ($8308
Acreyear for Green open space $39545Acreyear for Riparian $6010Acreyear for Wetlands $554Acreyear for Forests $1799Year for Marine and estuary)97
CSO Volume Reduction
bull Applicable only for projects that provide Combined Sewer Overflow (CSO) abatement by reducing the volume of rainfall runoff
bull Use CSO abatement cost of $0015gallonsyear applied to increased precipitation hazard runoff volume for 5-year design storm98
Ecosystem Service99
bull Add stormwater management benefits of green infrastructure projects to increased precipitation hazards where avoided damages and service losses are not quantified
bull Unit benefits applicable to increased precipitation hazard includeo Green roofs $0133SFyear (PUL 40 years)o BioswaleRain GardenMeadow Mix $0020SFyear (PUL 30 years)o Permeable Grass Pavers $0020SFyear (PUL 30 years)o Tree Plantings $303Treeyear (PUL 30 years)o Planter Box Trees $101Treeyear (PUL 15 years)
Real Estate99
bull Potential real estate benefits from increased resilience of residential andor commercial propertiesstreetscapesneighborhoods included within the project scope
bull Benefit applied to extreme heat hazard for green infrastructure projects directly impacting residential or commercial properties
Quality of Life Health Benefits99
bull Potential quality of life benefits related to improved public health from the resilience measures included within the project scope
bull Benefit applied to extreme heat hazard for green infrastructure projects directly impacting residential or commercial properties
Table 14 lists other typical benefits for reducing impacts from climate stressors and basic guidance for how to estimate them See Section IIID for more information
97 FEMA standard values for avoided mental stress and anxiety and environmental open space values taken from FEMA BCA Toolkit Version 530 (Build Date 12222016)
98 CSO abatement cost taken from APG1 Report for NYC ldquoTechnical Approaches for Benefit-Cost Analysis of Hazard Mitigation Projects in Urban and Coastal Environmentsrdquo (April 2016)
99 Ecosystem Services Real Estate and Quality of LifeHealth benefits tend to be more applicable to green infrastructure measures that provide extreme heat benefits such as green roofs trees and other plantings
NYC Mayorrsquos Office of Recovery and Resiliency Climate Resiliency Design Guidelines
44APPENDIX 4 - PROJECT BENEFITS CATEGORIES
Table 15 ndash Potential benefits for extreme heat (Urban Heat Island) reduction measures
Category Benefit Basic Guidance for Estimating Values
Direct Benefit
Reduced Life Cycle Cost
bull Applicable only to measures such as green roofs that are expected to last longer than standard roofs
bull Compute total cost savings including annual OampM costs
Indirect Benefit
Energy Savings
bull Applicable to measures that reduce energy costs by providing cooling through increased shading andor evapotranspiration
bull Use New York Power Authority rates of $0148kWh for electricity and $0810Therm for natural gas
Other Potential Benefits
Air Quality bull Applicable to measures that absorb pollutants andor reduce carbon dioxide emissions
Acoustics bull Applicable to measures such as green roof or walls that reduce noise transfer
Quality of LifeHealth bull Potential quality of life benefits and related to improved public health
Real Estate bull Applicable to measures that provide residential real estate benefits from increased resilience of propertiesstreetscapesneighborhoods
Retail Sales Marketing
bull Applicable to measures that provide commercial property benefits from increased aesthetics resulting in increased marketing and sales for streetscapesneighborhoods
Tax Credits Incentives
bull Applicable to resilience or green infrastructure measures such as green roofs that have accompanying Federal State or City tax credits or other incentives
Table 15 lists potential benefits for reducing impacts from heat and basic guidance for how to estimate them See Section IIID for more information
NYC Mayorrsquos Office of Recovery and Resiliency Climate Resiliency Design Guidelines
45APPENDIX 4 - PROJECT BENEFITS CATEGORIES
Table 16 ndash Guidance on quantitative calculations for (1) sea level rise with coastal storm surge and (2) increased precipitation measures
Data Input General Guidance ndash Basic Description
Applicable Benefit Category
Applicable Typical Facility Typology
Dire
ct B
enefi
ts
Indi
rect
Ben
efits
Oth
er P
oten
tial
Ben
efits
Bui
ldin
g St
ruct
ures
Com
plex
Fa
cilit
ies
Tran
spor
tatio
nSt
reet
scap
es
Plaz
as
Park
Fea
ture
s
First Floor Elevation (FFE)
bull The elevation of the first finished floor of the structure excluding basements
bull FFE measured from top of lowest floor (riverinenon-coastal high hazard areas) or bottom of lowest horizontal structural member (coastal high hazard areas)
Y Y Y Y
Building Replacement Value (BRV)
bull The unit cost to rebuild a structure of the same quality of construction
bull Not the same as market value
Y Y Y Y
Building Size
bull The total floor area of the building in square feet
bull Total Building Value = BRV x Building Sizebull Typical BRVs for NYC range between $100 to
$325SF for residential buildings and $120 to $450SF for commercialpublic buildings
Y Y Y Y
Structure Description
bull The type of building number of stories and foundation type (full basement partial basement no basement)
bull Collect more detailed foundation data for coastal flood zones
Y Y Y Y
Building Use bull Details related to residential housing commercial business and public use
Y Y Y Y Y
Building Type bull The primary use of building ndash residential commercial public and others
Y Y Y Y Y
Depth Damage Function (DDF)
bull Curves used to estimate structure damage contents damage and displacement of residential buildings based on flood depth
bull DDFs selection based on Structure Description Building Type Building Use
bull Structure DDFs based on percentage of Total Building Value
bull Contents DDFs based on percentage of Total Contents Value
bull Displacement DDFs based on number of displacement days x Displacement Cost
Y Y Y Y Y
Contents Value
bull The cost to replace structure contents (furnishings equipment)
bull Residential building Contents Values typically 50 BRV (FEMA DDFs) or 100 BRV (USACE DDFs)
bull Non-residential building Contents Values between 18 to over 100 depending on building use (USACE DDFs)
bull Total Contents Value = BRV x Building Size
Y Y Y Y Y
Table 16 provides general guidance on how to quantitatively calculate benefits from efforts to address from climate stressors See Section IIIE for more information
NYC Mayorrsquos Office of Recovery and Resiliency Climate Resiliency Design Guidelines
46APPENDIX 4 - PROJECT BENEFITS CATEGORIES
Table 16 ndash Guidance on quantitative calculations for (1) sea level rise with coastal storm surge and (2) increased precipitation measures
Data Input General Guidance ndash Basic Description
Applicable Benefit Category
Applicable Typical Facility Typology
Dire
ct B
enefi
ts
Indi
rect
Ben
efits
Oth
er P
oten
tial
Ben
efits
Bui
ldin
g St
ruct
ures
Com
plex
Fa
cilit
ies
Tran
spor
tatio
nSt
reet
scap
es
Plaz
as
Park
Fea
ture
s
Number of Residents (Residential)
bull Total number of occupants in a residential building
bull Typically estimated based on number of residential units x average number of individuals per household (based on current US Census data or use 25 individuals per household as a default)
Y Y Y Y Y
Displacement Cost (Residential)
bull The unit cost to lodge and feed displaced residents while flood damage is repaired
bull Average unit displacement cost of $415residential unitday recommended based on current FY2018 GSA Per Diem rates for New York City
Y Y Y Y Y
Value of Service (Non-Residential and Public)
bull The unit cost of service disruption and rental of temporary facilities while flood damage is repaired
bull Disruption costs for non-residential buildings typically range from $095 to $136SFmonth and rental costs range from $020 to $136SFmonth depending on building use
bull Value of service for public buildings ($day) is typically based on the annual operating budget for the City agency using the building prorated based on building size or population served by the building then divided by 365 daysyear
Y Y Y Y
Value of Service (Critical Facilities)
bull The unit cost of critical facilities (police fire emergency medical services) lost or delayed while flood damage is repaired
Y Y Y
Value of Service Duration
bull The duration of service disruption and rental of temporary facilities for non-residential buildings and critical facilities while flood damage is repaired
bull For non-residential buildingso Value of Service Durations vary from
4 months to over 30 months based on building use and the depth of flooding
o Total Value of Service Loss = (Disruption Cost x Building Area) = (Rental Cost x Building Area x Value of Service Duration)
bull For public buildings and critical facilitieso Value of Service Durations vary from 0
days to 720 months based on building use and the depth of flooding from FEMA FIA or USACE DDFs
o Total Value of Service Loss = (Value of Service) x (Service Loss Duration)
Y Y Y
NYC Mayorrsquos Office of Recovery and Resiliency Climate Resiliency Design Guidelines
47APPENDIX 4 - PROJECT BENEFITS CATEGORIES
Table 16 ndash Guidance on quantitative calculations for (1) sea level rise with coastal storm surge and (2) increased precipitation measures
Data Input General Guidance ndash Basic Description
Applicable Benefit Category
Applicable Typical Facility Typology
Dire
ct B
enefi
ts
Indi
rect
Ben
efits
Oth
er P
oten
tial
Ben
efits
Bui
ldin
g St
ruct
ures
Com
plex
Fa
cilit
ies
Tran
spor
tatio
nSt
reet
scap
es
Plaz
as
Park
Fea
ture
s
Engineering Estimates for Damages
bull Engineered estimate models of physical damages and service losses at the project site based on the Guidelines event recurrence interval(s) and flood depth(s)
Y Y Y Y Y Y
Historic Damages and Service Losses
bull Historic physical damages and service losses at the project site documented from previous flood events
bull Do not use routine maintenancebull The historic damage event recurrence interval
(RIs) andor flood depths must be determined updated for inflation to the present value and adjusted to match the Guidelines event RIsflood depths
Y Y Y Y Y Y
Facility Replacement Value
bull The unit cost to rebuild the facility
Impacted Area bull The geographic area impacted by the facility in the event of failure in acres
Y Y Y Y
Facility Capacity
bull The design capacity of the facilitybull For example - facility capacity expressed in
millions of gallons per day (MGD) for water and wastewater facilities or megawatts (MW) for electrical facilities
Y Y Y Y
Service Population
bull The number of impacted residents served by the facility
bull Typically estimated based on number of impacted residential customers x average number of individuals per household (based on current US Census data or use 25 individuals per household as a default)
bull Facilities serving mostly non-residentialpublic buildings andor critical facilities should focus on service losses rather than service population
Y Y Y
NYC Mayorrsquos Office of Recovery and Resiliency Climate Resiliency Design Guidelines
48APPENDIX 4 - PROJECT BENEFITS CATEGORIES
Table 16 ndash Guidance on quantitative calculations for (1) sea level rise with coastal storm surge and (2) increased precipitation measures
Data Input General Guidance ndash Basic Description
Applicable Benefit Category
Applicable Typical Facility Typology
Dire
ct B
enefi
ts
Indi
rect
Ben
efits
Oth
er P
oten
tial
Ben
efits
Bui
ldin
g St
ruct
ures
Com
plex
Fa
cilit
ies
Tran
spor
tatio
nSt
reet
scap
es
Plaz
as
Park
Fea
ture
s
Value of Service
bull Unit value of service provided by the facilitybull Example of FEMA standard values for complete
loss of utility service $105personday for potable water$49personday for wastewater$148personday for electrical
bull Consider updating FEMA standard per capita values to reflect current The New York City utility rates
Y Y
Roadway Elevations bull Roadway Elevations
Y Y
Roadway Replacement Value
bull Roadway Replacement ValueY Y
Inundation Area Map
bull Inundation Area Map developed by FEMA or through modeling by project design team
Y Y Y
Building Inventory of Inundation Area
bull The number and type of buildings within the streetscape and neighborhood inundated by the Guidelinersquos flood events
Y Y Y
Average Daily Traffic (ADT)
bull The average number of one-way traffic trips per day along the roadway(s) within the streetscapeneighborhood inundated by the Guidelinersquos flood events
Y Y
Additional Travel Time
bull The additional travel time needed to detour around a flooded roadway expressed in minutes
bull In the unlikely event there is no detour available use a 12-hour travel time per one-way trap but provide a detailed area street map as supporting documentation
Y Y
Value of Traffic Delay
bull The value of service associated with lost time in traffic
bull For example - FEMA standard average value of $3344vehiclehour of delay
bull Consider updating FEMA and GSA standard values to reflect current New York City area labor rates and fuel costs
Y Y
NYC Mayorrsquos Office of Recovery and Resiliency Climate Resiliency Design Guidelines
49APPENDIX 4 - PROJECT BENEFITS CATEGORIES
Table 17 ndash Guidance on quantitative unit benefit calculations for extreme heat hazard measures
Measure General Guidance ndash Unit Benefit Information and Data Requirements
Applicable Benefit Category
Applicable Typical Facility Typology
Dire
ct B
enefi
ts
Indi
rect
Ben
efits
Oth
er P
oten
tial
Ben
efits
Bui
ldin
g St
ruct
ures
Com
plex
Fa
cilit
ies
Tran
spor
tatio
nSt
reet
scap
es
Plaz
as
Park
Fea
ture
s
Green Roof
bull Unit benefit range over PUL = $470SF to $373SF of green roof area ($719SF standard value)
bull Assumed PUL = 40 yearsbull Apply standard value unit benefit to green
roof area to estimate measure benefitbull Higher range values more applicable
to residential and commercial building streetscape projects
Y Y Y Y Y Y
Bioswale Rain Garden Meadow Mix
bull Unit benefit range over PUL = $396SF to $211SF of area ($730SF standard value)
bull Assumed PUL = 30 yearsbull Apply standard value unit benefit to bioswale
rain gardenmeadow mix area to estimate total measure benefit
Y Y Y Y Y Y
Cool Roof
bull Unit benefit range over PUL = $117 to $3151SF of material area ($144SF standard value)
bull Assumed PUL = 20 yearsbull Apply standard value unit benefit to cool roof
area to estimate total measure benefitbull Higher range values more applicable to
residential building streetscape projects
Y Y Y Y Y
Light-Colored PaversLight-Colored Materials
bull Unit benefit range over PUL = $0774 to $204SF of material area ($0866SF standard value)
bull Assumed PUL = 30 yearsbull Apply standard value unit benefit to material
area to estimate total measure benefit
Y Y Y Y
Table 17 provides general guidance on how to quantitatively calculate benefits from efforts to address climate stressors See Section IIIE for more information
NYC Mayorrsquos Office of Recovery and Resiliency Climate Resiliency Design Guidelines
50APPENDIX 4 - PROJECT BENEFITS CATEGORIES
Table 17 ndash Guidance on quantitative unit benefit calculations for extreme heat hazard measures
Measure General Guidance ndash Unit Benefit Information and Data Requirements
Applicable Benefit Category
Applicable Typical Facility Typology
Dire
ct B
enefi
ts
Indi
rect
Ben
efits
Oth
er P
oten
tial
Ben
efits
Bui
ldin
g St
ruct
ures
Com
plex
Fa
cilit
ies
Tran
spor
tatio
nSt
reet
scap
es
Plaz
as
Park
Fea
ture
s
Tree Planting
bull Unit benefit range over PUL = $1005 to $77154Tree ($1855Tree standard value)
bull Assumed PUL = 30 yearsbull Apply standard value unit benefit to number of
trees to estimate total measure benefitbull Higher range values more applicable
to residential and commercial building streetscape projects
Y Y Y Y Y Y
Planter Box Tree
bull Unit benefit range over PUL = $212 to 16304Tree ($392Tree standard value)
bull Assumed PUL = 15 yearsbull Apply standard value unit benefit to number of
trees to estimate total measure benefitbull Higher range values more applicable
to residential and commercial building streetscape projects
Y Y Y Y Y
Shade Canopy
bull Unit benefit range over PUL = $0363 to $396SF ($0458SF standard value)
bull Assumed PUL = 15 yearsbull Apply standard value unit benefit to area of
shade canopy estimate total measure benefitbull Higher range values more applicable
to residential and commercial building streetscape projects
Y Y Y Y
Permeable Grass Pavers
bull Unit benefit range over PUL = $0258SF to $0521SF of pavers ($0363SF standard value)
bull Assumed PUL = 30 yearsbull Apply standard value unit benefit to paver
area to estimate total measure benefit
Y Y Y Y Y
For the purposes of the BCA refer to the following facility typologies bull ldquoBuilding Structuresrdquo include critical small building sites such as EMS or FDNY stations and non-critical small building sites such as
libraries or comfort stationsbull ldquoComplex Facilitiesrdquo include critical infrastructure such as wastewater treatment sites pump stations water filtration plants and similar
large or complex facilitiesbull ldquoTransportationStreetscapePlazasrdquo include roadway reconstruction streetscape improvements street raising plazas and other
transportation-related infrastructurebull ldquoPark Featuresrdquo include parks and similar public recreational facility with natural landscape features
NYC Mayorrsquos Office of Recovery and Resiliency Climate Resiliency Design Guidelines
51APPENDIX 5 - EXAMPLE PLANNING DECISION TREE
This decision tree provides a summarized example approach for how to implement these Guidelines Projects with a total cost greater than $50 million are recommended to conduct a full qualitative and quantitative climate change risk assessment and BCA while projects below $50 million are recommended to conduct a qualitative risk assessment and BCA
Define Project
1) Operational goals and criticality level2) Useful life3) Location in the current flood plain future floodplain and or zone
of tidal inundation and the project arearsquos score on the heat vulnerability index
Evaluate Project Risks According to Probability and Magnitude of Consequence
bull Extreme Heat bull Precipitationbull Sea Level Risebull Coastal Surge
High Level Identification and Assessment of Risk Mitigation Alternatives and Co-benefits
(qualitative)
Detailed Identification and Assessment of Risk Mitigation Alternatives and Co-benefits (qualitative and quantitative)
High Level Estimate of Costs and Benefits of Design Alternatives
(qualitative)
Detailed Estimate of Costs and Benefits of Design Alternatives
(qualitative and quantitative)
Decision Point Which climate change risks require mitigation
Decision Point Evaluate risk mitigation benefits and costs to
determine final resilient design alternative or if no action is required
Decision Point Is the total project cost above $50 million
Below $50 million Above $50 million
APPENDIX 5 - EXAMPLE PLANNING DECISION TREE
NYC Mayorrsquos Office of Recovery and Resiliency Climate Resiliency Design Guidelines
52
Project Title
Design Strategies Checklist (not exhaustive)
Extreme Heat Comments Extreme Precipitation Comments Sea Level Rise amp Storm Surge Comments
Select Site in Low Heat Vulnerability Index area Select High Elevation Site Select High Elevation Site
Minimize East-West Building Orientation Green Roof Raise Building Floor Elevation
Passive Solar Cooling and Ventilation Systems
Protect Below Grade Areas from Flooding Waterproof Building Envelope
Cool Roof (SRI appropriate) On-site Stormwater Management (gray) Elevate Critical Building Functions
Green Roof (extensive) Reduce Impervious Areas Elevate Critical Equipment
Vegetative Structures Permeable Pavement Perimeter Floodwall100 Levee (passive or active)
Enhanced HVAC System including space layout optimization and system scalability
Increase Green Spaces and Planted Areas DryWet Floodproofing
More Efficient Building Envelope Other Utility Redundancy Design101
Parking Lot Shading Resilient Materials amp Landscape Treatments
Light Colored Pavements (appropriate SRI) Design for Storm Surge Outflow
Increase Planted Areas Install Backwater Flow Prevention
Permeable Surfaces Design for Scour
Open-grid Pavement Raise Road Elevation
Other Other
This appendix provides a template for identifying possible design strategies to address climate change risks as described throughout the Guidelines
APPENDIX 6 - DESIGN STRATEGIES CHECKLIST
100 Permanent perimeter flood walls are not permitted to meet floodproofing requirements in buildings with substantial improvements andor damages 101 Utility redundancy design should be pursued for critical systems not all building systems
APPENDIX 6 - DESIGN STRATEGIES CHECKLIST
NYC Mayorrsquos Office of Recovery and Resiliency Climate Resiliency Design Guidelines
53APPENDIX 7 - CLIMATE CHANGE RISK ASSESSMENT RESOURCES
These Guidelines provide data on climate change hazards and recommend how that data can inform resilient design A risk assessment is a tool to help project managers and designers evaluate risk levels as well as select and prioritize resilient design strategies A high level risk assessment is recommended for all City capital projects with a total cost of under $50 million Projects above $50 million are recommended to conduct an in-depth assessment
Risk assessments use quantified estimates of the probability and magnitude of consequence of an event occurring to prioritize responses ldquoProbabilityrdquo is an assessment of the likelihood of a hazard occurring while ldquomagnituderdquo describes the hazardrsquos potential impact Risk assessment tools such as the examples listed below can be used to define and score these categories Projects that score higher across both probability and magnitude can be prioritized for investment and risk mitigation action Projects that score lower across both criteria may require no action beyond meeting code The results are typically charted on a risk matrix and an example is provided on the next page
The climate change risk management frameworks below offer templates for how to integrate climate change projections into a risk assessment process Refer to these resources for examples and further information
bull Vulnerability Assessment and Adaptation Framework is prepared by the Federal Highway Administration (FHWA) While developed for transportation planning this risk assessment framework has broad applicability for evaluating asset vulnerability to climate change Available at httpswwwfhwadotgovenvironmentsustainabilityresilienceadaptation_framework
bull US Climate Resilience Toolkit The US Global Change Research Program offers a step by step risk assessment
framework including tools and case studies at httpstoolkitclimategovsteps (see example on next page)
bull Coast Adapt Guidance on undertaking a risk assessment High level assessment httpscoastadaptcomausitesdefaultfilesfactsheetsT3M4_2_2nd_pass_risk_assessmentpdfDetailed assessment httpscoastadaptcomausitesdefaultfilesfactsheetsT3M4_3_3rd_pass_risk_assessmentpdf
bull Climate adaptation Risk uncertainty and decision-makingDownload the report here httpswwwukciporgukpublicationsRisk
The City plans to develop a NYC-specific process for integrating climate change data into existing risk management processes by April 2019
APPENDIX 7 - CLIMATE CHANGE RISK ASSESSMENT RESOURCES
NYC Mayorrsquos Office of Recovery and Resiliency Climate Resiliency Design Guidelines
54APPENDIX 7 - CLIMATE CHANGE RISK ASSESSMENT RESOURCES
The Risk Characterization Matrix below is an example from the US Climate Resilience Toolkit This tool can be used to assess the probability and magnitude of impact for identified risks The risk of coincident climate stressorsrisks (such as storm surge plus increased precipitation) can also be assessed as applicable
Figure 14 - Example of a climate change risk matrix (adapted from US Climate Resilience Toolkit)
Project teams can determine the magnitude of the impact (along the horizontal scale of 1 through 3 with 3 being the most severe) and the probabilitylikelihood of occurrence for each specific risk (along the vertical scale with 3 being the most likely) A score is typically assigned for each risk (Probabil-ity x Magnitude) and then charted on the matrix Based on the estimated probability and magnitude of consequence above the risks are ranked and prioritized for mitigation Factors to bear in mind include
bull Not all facility typologies have the same level of functional and operational importance during events or tolerance for disruption
bull Not all climate stressors and risks have the same level of impact on each project sitebull Not all identified risks can or should be mitigated fully
NYC Mayorrsquos Office of Recovery and Resiliency Climate Resiliency Design Guidelines
55WORKS CITED
A Stronger More Resilient New York PlaNYC Report of the NYC Special Initiative for Rebuilding and Resiliency The City of New York 2013
ldquoAccount for Climate Riskrdquo International Finance Corporation accessed March 27 2017 httpwwwifcorgwpswcmconnectTopics_Ext_ContentIFC_External_Corporate_SiteClimate+Business
PrioritiesAccount+for+Climate+Risk
American Society of Heating Refrigeration and Air-Conditioning Engineers (ASHRAE) Handbook -Fundamentals 2017
ldquoBaseline Standard Economic Value Methodology Reportrdquo Federal Emergency Management Agency July 2016
Benefit Cost Analysis Toolkit Software Version 530 Federal Emergency Management Agency (build date December 2016)
Criteria for Detention Facility Design New York City Department of Environmental Protection November 2012
Community Resilience Planning Guide for Buildings and Infrastructure Systems Vol 1 NIST Special Publication 1190 US Department of Commerce 2016
Cool and Green Roofing Manual NYC Department of Design and Construction 2007 httpwwwnycgovhtmlddcdownloadspdfcool_green_roof_manpdf
Building Resiliency Task Force US Urban Green Building Council New York 2013 httpurbangreencouncilforcecomBuildingResiliency
Design and Planning for Flood Resiliency Guidelines for NYC Parks New York City Department of Parks and Recreation 2017
httpswwwnycgovparksorgplanning-and-buildingplanningresiliency-plansflood-resiliency
Flooded Bus Barns and Buckled Rails Federal Transit Administration Office of Budget and Policy 2011 httpswwwhsdlorgabstractampdid=685187
Floodproofing Non-Residential Buildings FEMA P936 FEMA 2013 httpswwwfemagovmedia-library-data9a50c534fc5895799321dcdd4b6083e7P-936_8-20-13_508rpdf
ldquoGlossaryrdquo International Infrastructure Management Manual National Asset Management Support Group New Zealand 2011 httpwwwipweaorg
ldquoGreen Roof Metrics Draft Reportrdquo New York City Department of Parks and Recreation 2017
ldquoGuide to Rain Event Preparednessrdquo NYC Department of Environmental Protection httpwwwnycgovhtmldeppdfbrochuresflood-preparedness-flyerpdf
ldquoGuidelines and Discount Rates for Benefit-Cost Analysis of Federal Programsrdquo Appendix C Circular A-94 US Office of Management and Budget (OMB) 2017
ldquoGuidelines for the Design and Construction of Stormwater Management Systemsrdquo New York City Department of Environmental Protection July 2012
Horton R et al New York City Panel on Climate Change 2015 Report Ann NY Acad Sci ISSN 0077-892 New York 2015
Madrigano J et al ldquoA case-only study of vulnerability to heat wavendashrelated mortality in New York City (2000ndash2011)rdquo Environmental Health Perspectives 123672ndash678 2013
WORKS CITED
NYC Mayorrsquos Office of Recovery and Resiliency Climate Resiliency Design Guidelines
56WORKS CITED
enspMcGregor et al Two Degrees The Built Environment and Our Changing Climate Routledge Press 2013
NYC Green Codes Task Force US Green Building Council New York 2010 httpurbangreencouncilorgGreenCodes
NYCrsquos Risk Landscape A Guide to Hazard Mitigation NYC Emergency Management 2014
One New York The Plan for a Strong and Just City The City of New York 2015 httpwwwnycgovhtmlonenyc downloadspdfpublicationsOneNYCpdf
Ready to Respond Strategies for Multifamily Building Resilience Enterprise Green Communities 2015 httpswwwenterprisecommunityorgresources
Rosenzweig C et al Climate Change Adaptation in New York City Building a Risk Management Response New York City Panel on Climate Change 2010
httponlinelibrarywileycomdoi101111nyas20101196issue-1 issuetoc
ldquoSustainable Infrastructure Management Program Learning Environmentrdquo Water Environment Research Foundation accessed March 24 2017 httpsimplewerforg
Urban Waterfront Adaptive Strategies NYC Department of City Planning 2013 httpwww1nycgovsiteplanningplanssustainable-communitiesclimate-resiliencepagetab=1
Wastewater Resiliency Plan Climate Risk Assessment and Adaptation Study New York City Department of Environmental Protection October 2013
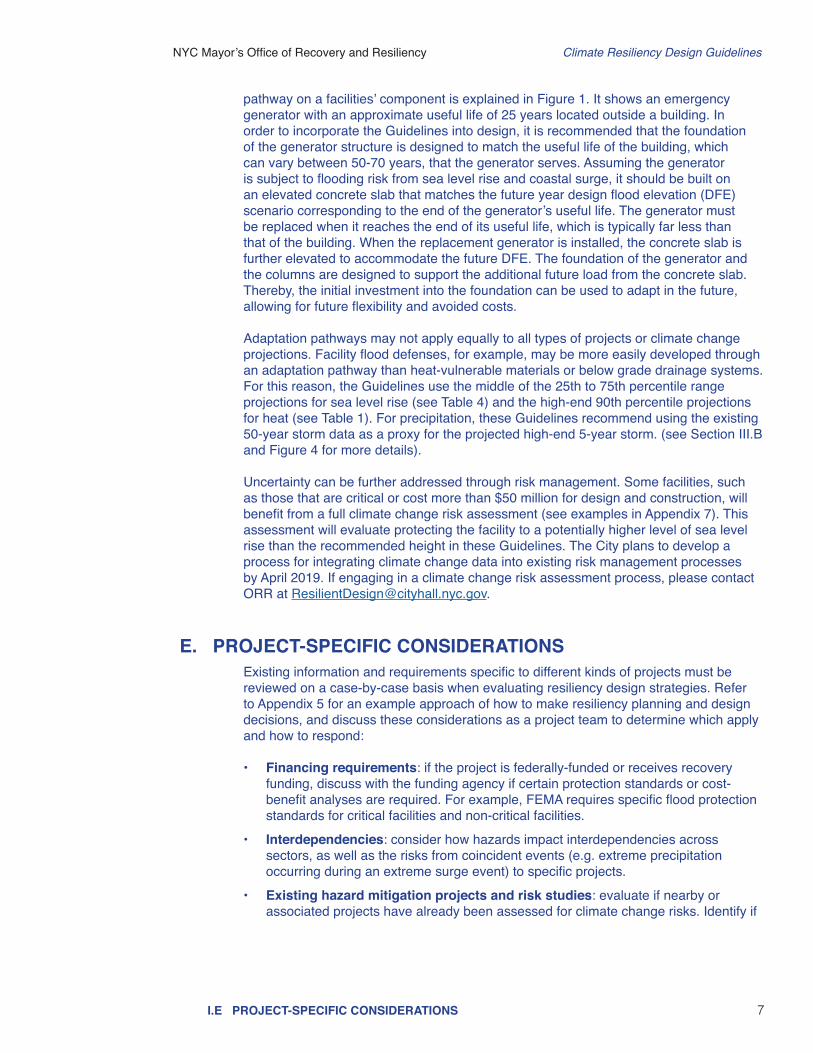
NYC Mayorrsquos Office of Recovery and Resiliency Climate Resiliency Design Guidelines
7IE PROJECT-SPECIFIC CONSIDERATIONS
pathway on a facilitiesrsquo component is explained in Figure 1 It shows an emergency generator with an approximate useful life of 25 years located outside a building In order to incorporate the Guidelines into design it is recommended that the foundation of the generator structure is designed to match the useful life of the building which can vary between 50-70 years that the generator serves Assuming the generator is subject to flooding risk from sea level rise and coastal surge it should be built on an elevated concrete slab that matches the future year design flood elevation (DFE) scenario corresponding to the end of the generatorrsquos useful life The generator must be replaced when it reaches the end of its useful life which is typically far less than that of the building When the replacement generator is installed the concrete slab is further elevated to accommodate the future DFE The foundation of the generator and the columns are designed to support the additional future load from the concrete slab Thereby the initial investment into the foundation can be used to adapt in the future allowing for future flexibility and avoided costs
Adaptation pathways may not apply equally to all types of projects or climate change projections Facility flood defenses for example may be more easily developed through an adaptation pathway than heat-vulnerable materials or below grade drainage systems For this reason the Guidelines use the middle of the 25th to 75th percentile range projections for sea level rise (see Table 4) and the high-end 90th percentile projections for heat (see Table 1) For precipitation these Guidelines recommend using the existing 50-year storm data as a proxy for the projected high-end 5-year storm (see Section IIIB and Figure 4 for more details)
Uncertainty can be further addressed through risk management Some facilities such as those that are critical or cost more than $50 million for design and construction will benefit from a full climate change risk assessment (see examples in Appendix 7) This assessment will evaluate protecting the facility to a potentially higher level of sea level rise than the recommended height in these Guidelines The City plans to develop a process for integrating climate change data into existing risk management processes by April 2019 If engaging in a climate change risk assessment process please contact ORR at ResilientDesigncityhallnycgov
E PROJECT-SPECIFIC CONSIDERATIONSExisting information and requirements specific to different kinds of projects must be reviewed on a case-by-case basis when evaluating resiliency design strategies Refer to Appendix 5 for an example approach of how to make resiliency planning and design decisions and discuss these considerations as a project team to determine which apply and how to respond
bull Financing requirements if the project is federally-funded or receives recovery funding discuss with the funding agency if certain protection standards or cost-benefit analyses are required For example FEMA requires specific flood protection standards for critical facilities and non-critical facilities
bull Interdependencies consider how hazards impact interdependencies across sectors as well as the risks from coincident events (eg extreme precipitation occurring during an extreme surge event) to specific projects
bull Existing hazard mitigation projects and risk studies evaluate if nearby or associated projects have already been assessed for climate change risks Identify if
NYC Mayorrsquos Office of Recovery and Resiliency Climate Resiliency Design Guidelines
8IE PROJECT-SPECIFIC CONSIDERATIONS
any studies have been conducted that could inform design (eg local flood modeling with sea level rise) This may inform the climate change risk assessment or provide insights into site specific conditions and design options A map that catalogs NYC resiliency projects is located here httpsmapsnycgovresiliency
bull Agency-specific resiliency design standards refer also to resiliency guidelines provided by various City agencies (eg Parkrsquos Design and Planning for Flood Resiliency11) Agency guidelines build on the climate data provided in these Guidelines by providing specific design alternative and insights relevant to those agencies
bull Limitations the Guidelines do not describe or encompass all City resiliency policies To learn more about how the City plans for a resilient future see the latest OneNYC plan as well as the 2013 report A Stronger More Resilient New York Related resiliency issues are being addressed by the City but are out of the scope of these Guidelines including neighborhood and regional-level climate change risk management and zoning
bull Further questions Contact ORR at ResilientDesigncityhallnycgov
11 Available at httpswwwnycgovparksorgplanning-and-buildingplanningresiliency-plansflood-resiliency
NYC Mayorrsquos Office of Recovery and Resiliency Climate Resiliency Design Guidelines
9IIA INCREASING HEAT
All City of New York capital projects should be designed to withstand increasing heat and precipitation based on the useful life of the asset while design interventions for storm surge and sea level rise depend on the projectrsquos proximity to the floodplain useful life and criticality In order to support design team efforts to generate resilient design responses (ie adjustments to base projects) these Guidelines provide climate change projections and recommend design adjustments or interventions in response to increasing heat increasing precipitation and sea level rise The Guidelines recommend designing to loads beyond the minimum requirements in the prevalent NYC local codes Design teams should consider project benefits and additional costs to incorporating resilient design standards before finalizing project design
A INCREASING HEATUse this section to determine how to adjust a facilityrsquos design to account for increasing temperatures and to reduce the facilityrsquos contribution to the Urban Heat Island effect Heat reduction levels will be determined by the function location and useful life of the asset
BackgroundThe impacts of heat on NYC are well established Every summer over 100 New Yorkers die from causes exacerbated by extreme heat12 The region has seen a steady increase in the number of days above 90degF and temperatures are projected to keep rising worsening heat-related mortality By the 2050s the number of days at or above 90degF is expected to double and the frequency and length of heat waves will triple to an average 6 heat waves per year13 Certain areas of NYC already experience higher temperatures relative to other parts of the city and these hot spots will be exacerbated by climate change (see Figure 2)
12 OneNYC The Plan for a Strong and Just City (The City of New York 2015) 228 See also Madrigano J Ito K Johnson S Kinney PL Matte T 2015 A case-only study of vulnerability to heat wavendashrelated mortality in New York City (2000ndash2011) Environmental Health Perspectives 123672ndash678 httpwwwnycgovhtmlonenycdownloadspdfpublicationsOneNYCpdf
13 Horton et al New York City Panel on Climate Change 2015 Report Chapter 1 Climate Observations and Projections Ann NY Acad Sci ISSN 0077-8923 New York 201514 LANDSAT Thermal Data from 8182009
Figure 2 - Thermal imagery of New York City based on LANDSAT Thermal Data from 818200914
II INTERPRETING CLIMATE CHANGE DATA FOR RESILIENT DESIGN ADJUSTMENTS
NYC Mayorrsquos Office of Recovery and Resiliency Climate Resiliency Design Guidelines
10IIA INCREASING HEAT
In Cool Neighborhoods NYC the City prioritizes strategies to study the Urban Heat Island effect and make targeted investments that benefit communities most vulnerable to heat15 New Yorkers are more or less vulnerable to heat based largely upon socio-economic factors including age income location tree coverage and the percentage of dark surfaces The NYC Department of Health and Mental Hygiene (DOHMH) developed a Heat Vulnerability Index (HVI) which highlights parts of the city where more residents face an increased risk of heat-related mortality Their vulnerability is due to their exposure and socio-economic conditions that determine their
Figure 3 - Heat Vulnerability Index (HVI) for New York City Community Districts (Source NYC DOHMH 2015) This analysis identifies physical social and economic factors associated with increased risk of heat-related morbidity and mortality17
The Guidelines recommend that project designers consider two aspects of the relationship between their project and increasing heat the way their project reduces the Urban Heat Island effect and the impact that increasing heat will have on the physical components of their project itself
bull Reduce Urban Heat Island effect materials in the built environment absorb the sunrsquos heat throughout the day and re-radiate it back into the atmosphere driving localized temperatures higher and increasing demands on cooling systems Air conditioning and ventilation equipment also push extra heat into the air contributing to a feedback loop that increases localized ambient temperatures and impacts the health of heat-vulnerable New Yorkers This section provides guidance on how new capital construction can reduce the contribution to ambient heat in the city
bull Minimize impact from increasing heat increasing heat can physically impact components of buildings and infrastructure damaging or stressing materials electrical systems and mechanical systems Rising temperatures will also stress energy and communications networks that buildings and other infrastructure rely upon18 This section provides climate data to be used to adjust and adapt heat-vulnerable components of assets
15 OneNYC 22816 To learn more about Heat Vulnerability Index see page 229 of OneNYC at httpwwwnycgovhtmlonenycdownloadspdf
publicationsOneNYCpdf17 See page 229 in the OneNYC plan to learn more about HVI18 Damiano H et al NYCrsquos Risk Landscape A Guide to Hazard Mitigation (NYC Emergency Management 2014) 103
Heat can be lethal for all but its impact on New Yorkers is not equal
sensitivity to heat Community districts in red and orange in Figure 3 are areas of highest vulnerability and these are particularly concentrated in east Brooklyn the south Bronx northern Manhattan and southeast Queens16 While all new capital projects should address heat impacts those sited in moderate to high vulnerable HVI areas should implement multiple strategies to reduce the Urban Heat Island and help address the high vulnerability in these neighborhoods
NYC Mayorrsquos Office of Recovery and Resiliency Climate Resiliency Design Guidelines
11IIA INCREASING HEAT
1 Urban Heat Island reductionNew capital construction should minimize its contribution to the Urban Heat Island effect The design interventions provided below offer benefits to the community and the facility through reduced heat loading reduced energy costs andor improved occupant health and thermal comfort The appropriate combination of design interventions will vary dependent on the project scope
a) Increase the solar reflectance of surfaces by utilizing light-colored pavement coatings and materials in combination with shading with a minimum target of 50 of the non-structure areas of facility sites19
Lighter reflective surfaces help reduce the Urban Heat Island effect heat loading and internal building temperatures and extend the lifespan of rooftops and heating ventilation and air conditioning (HVAC) equipment The City has taken steps towards reducing ambient temperatures such as implementing the NYC Cool Roofs program20 New buildings as well as existing buildings with roofs going through significant repairs are required by law to paint their roofs white This program intervention reduces a buildingrsquos contribution to Urban Heat Island effect and provides energy savings by coating the normally dark concrete roof surface with white paint allowing the roof to reflect solar radiation
b) Increase the shading of surfaces by planting trees or other vegetation in combination with cool pavements with a minimum target of 50 of the non-structure areas of facility sites
Shady areas with heat- and in coastal areas salt-tolerant vegetative species can help keep buildings cool and provide energy savings as well as lower temperatures
c) Meet Climate Zone 6 standards for fenestration and insulation (See Section ECC C402 in Chapter C4 of the 2016 NYC Energy Code) to improve efficiency of building envelopes
NYC is currently in Climate Zone 4 NYC already requires that small residential building envelopes are designed to meet higher insulation and fenestration requirements to improve energy efficiency21 All City capital projects including non-residential facilities should meet this standard
d) Select greenblue roofs andor other appropriate landscape elements that maximize cooling with help of landscape architects
The City already encourages the use of green and blue roofs on buildings to reduce the Urban Heat Island effect22 provide stormwater management and increase the useful life of the roof Besides replacing dark roof surfaces green roofs and vegetation also provide shade and keep the air cool through evapotranspiration by releasing moisture into the atmosphere Blue roofs coupled with light colored roofing material can provide stormwater management and rooftop cooling Some of these designs support the shading and solar reflectance goal in Step a) above Additionally City capital projects are subject to Leadership in Energy and Environmental Design (LEED) certification and green roofs can earn LEED credits23 Projects should integrate cooling strategies listed below based on project scope and a balance between costs and benefits
bull Green roofs or blue roofs on a broader range of facilities (including industrial buildings storage garages administration buildings etc)
19 Urban Green Council (2010) Green Codes Task Force Proposed code ldquoEF 12 Reduce Summer Heat with Cool Shady Building Lotsrdquo20 Local Law No 21 (2011) amended Chapter 12 of the NYC Building Code to update roof coating standards Also
see Cool and Green Roofing Manual (DDC) 2007 for more information on NYC standards for cool and green roofs httpwwwnycgovhtmlddcdownloadspdfcool_green_roof_manpdf
21 Read more about the code here httpswww1nycgovsitebuildingscodes2016-energy-conservation-codepage22 See Cool and Green Roofing Manual (DDC) 2007 for more information on NYC standards for cool and green roofs
httpwwwnycgov htmlddcdownloadspdfcool_green_roof_manpdf23 See Local Law No 32 (2016) for more information
NYC Mayorrsquos Office of Recovery and Resiliency Climate Resiliency Design Guidelines
12
2 Minimize impact from increasing heatThis section provides information to support making design adjustments to capital projects to reduce impacts to equipment structures landscapes and materials from rising average temperatures and increasing extreme heat events
a) Review forward-looking climate data provided in Table 1 and Table 2 Select heat projections according to the useful life of the facility and its primary
components then evaluate and address impacts in the steps below Table 1 provides design criteria for average temperatures and incidents of extreme heat events projected to different time periods across the 21st century Table 2 provides guidance on future 1 Dry Bulb Temperature and Cooling Degree Days for the NYC area The 1 Dry Bulb Temperature represents the ambient air temperature
IIA INCREASING HEAT
bull Vegetated structures such as shade trees and planters (to reduce heat loading on horizontal or vertical surfaces)
bull Bioswales rain gardens and bioretention24 bull Maximize planted permeable surfacesbull Other permeable surfaces (used for stormwater management these retain
moisture that evaporates as surface temperatures rise)25 bull Open-grid pavement system (at least 50 unbound)26 bull Evaluate site planning and building massing with regard to solar gainbull Solar panels for shading and to generate energy
Table 1 ndash Baseline and projected extreme heat events27
End of useful life
heat waves per year (3 or more consecutive days with max temperatures at or above 90degF)
days above 90degF
Annual average temperature
Baseline (1971-2000) 2 18 54degF
Through to 2039 4 33 572degF
2040-2069 7 57 606degF
2070-2099 9 87 643degF
Table 2 ndash Projections for 1 Dry Bulb temperature and Cooling Degree Days
Change in projected value for 2050s
Variable Baseline for Central Park (1971-2000)
Low estimate (10th percentile)
Middle range (25th to 75th percentile)
High estimate (90th percentile)
1 Dry Bulb temperature 91degF +3degF +4-6degF +7degF
Cooling Degree Days (base = 65degF) 1149 +37 +46-73 +87
Note Due to HVAC system typical useful life of 25 years or less only projections for the 2050s are shown Projections for the 2020s are not shown because it is anticipated that enough of a safety margin is employed already in current systems to withstand the temperature rise expected through the 2020s The NPCC is currently working on projections of 1 Wet Bulb temperatures which are expected to increase and may require systems to have higher moisture reducing capacity in addition to the enhanced cooling capacity
24 When siting bioswales consider groundwater levels and soil permeability and ensure that the site is not contaminated from past or present land uses A high water table may prohibit some applications
25 Urban Green Council (2010) Green Codes Task Force Proposed code ldquoSW 1 REDUCE EXCESSIVE PAVING OF SITESrdquo26 LEED Neighborhood Development v4 ldquoHeat island reductionrdquo credit27 Projected estimates for average temperatures are based upon 90th percentile change factor added to the baseline average annual
temperature from New York City Panel on Climate Change (2015)
NYC Mayorrsquos Office of Recovery and Resiliency Climate Resiliency Design Guidelines
13IIA INCREASING HEAT
b) Evaluate potential impacts on systems and materials Heat impacts on a facility are highly contingent on the facility type and should be reviewed on a case-by-case basis28 A decrease in the useful life or operational capacity of a facility or components of a facility may occur due to rising temperatures Interventions will also vary depending on whether the project is a new capital investment or a substantial improvement to an existing facility Factors to evaluate as applicable to project scope include but are not limited to
bull Thermal expansion warping softening or other forms of material change or degradation of structural integrity occurring at an accelerated rate by excessive heat
bull Health and safety impacts on occupants vulnerable to heat bull Increased failure or reduced efficiency of electrical or mechanical systems bull Prioritization of critical loads for systems and components at the facility andbull Moisture control needs for buildings with a higher standard for fenestration and
insulation
The results of this evaluation will inform steps taken in the step below
c) Reduce heat impacts Review and implement specific changes to the facility design based on assessments
above Develop a strategy based on the specific type of facility its operational profile and its useful life A Design Strategies Checklist is available for use in Appendix 6 as a resource to track design approaches Specific areas of focus are
bull Electricity outages High temperatures drive demand for air conditioning and can increase the risk of facility equipment failure potentially broader grid disruptions or brownouts2930 To manage this risk design City buildings and infrastructure to withstand periods without electricity using the following approaches in particular if they provide critical or essential services
Ǯ Identify and assess how much of the facilityrsquos load is critical (eg ldquocritical loadrdquo) including the necessary duration of the backup power supply (eg is backup power needed for 8 hours or multiple days) Determining what loads are critical and how long they should be powered for is essential for a facilityrsquos operations and what the role of the facility will have in an emergency situation31
Ǯ Depending on the size of the critical load and budget different backup power supply options could range from backup generators (eg diesel natural gas) to hybrid systems (eg solar + battery storage + appropriately sized generator) Each option has different trade-offs that should be considered in terms of cost feasibility and environmental impacts For shorter duration needs andor smaller critical loads buildings with existing solar systems should consider adding storage to provide a resiliency benefit In some cases co-generation systems may make sense from an economic and resiliency perspective especially if there
28 Sector- and facility-specific impacts vary greatly For examples of sector-specific impacts and design responses see Flooded Bus Barns and Buckled Rails (FTA 2011) and Ready to Respond Strategies for Multifamily Building Resilience (Enterprise Green Communities 2015)
29 McGregor et al (2013) Two Degrees The Built Environment and Our Changing Climate Routledge Press30 High temperatures also increase energy demand which can increase fossil fuel based greenhouse gas emissions31 The key roles of the facility that need to be identified are operational hours number of occupants and electrical loads needed for the
desired operations Electrical equipment and appliances for the desired operations may include - but are not limited to - safety lighting life-supporting systems fire protection systems telecommunications equipment mechanical systems to mitigate extreme temperatures and computing equipment Every facility is unique Operational characteristics and load profiles need to be established prior to sizing the equipment required to keep the facility in operational mode
NYC Mayorrsquos Office of Recovery and Resiliency Climate Resiliency Design Guidelines
14IIA INCREASING HEAT
is a significant heating andor cooling load in addition to electricity demand32
Ǯ Depending on the option assess need to invest in internal electricity rewiring and building energy management systems (eg switches reconfiguration of distribution infrastructure to isolate critical loads from non-critical loads and the ability to island from the broader grid during the event of a larger disruption software and hardware to manage the deployment of hybrid systems) andor need for external hookups for temporary generators and boilers33
bull Failure in facility ventilation electrical and air conditioning systems Some systems designed to meet the requirements of past climate may overheat and fail during extreme events Some design interventions include34
Ǯ Selecting systems with higher heat tolerance Ǯ Adding Energy Recovery Ventilation systems Ǯ Providing additional or redundant ventilation systems either mechanical or
natural to cool electrical equipment Ǯ Optimizing building layout by
bull segregating temperature sensitive electronics and computer control system from other systems
bull placing heat generating equipment like transformers and switchgear outdoors where permitted and
bull splitting the facility cooling loads among different HVAC systems in facility for redundancy and better zone control
bull Passive solar cooling and ventilation There are numerous design features that provide passive solar cooling for buildings to help maintain lower internal ambient temperatures with less air conditioning These features also help keep facilities habitable during extended grid failures when generators fail or must be reserved for critical functions Some design features include35
Ǯ Appropriate east-west orientation Ǯ Passive ventilation design Ǯ Vertically stacked double skin facades Ǯ Exterior window shades Ǯ Light colored exteriors Ǯ Shaded arcades Ǯ Thermally massive materials Ǯ High performance glazing Ǯ Operable windows
32 To learn more see the Building Resiliency Task Force report from Urban Green Council (2013)33 Ibid 34 Flooded Bus Barns and Buckled Rails FTA Office of Budget and Policy 201135 These and other examples are found in McGregor et al (2013) Two Degrees The Built Environment and Our Changing Climate
Routledge Press Also see Flooded Bus Barns and Buckled Rails FTA Office of Budget and Policy 2011
NYC Mayorrsquos Office of Recovery and Resiliency Climate Resiliency Design Guidelines
15IIB INCREASING PRECIPITATION
B INCREASING PRECIPITATIONThe intensity and frequency of precipitation events are projected to increase with climate change creating new challenges for stormwater management and impacts to the built environment such as
bull The potential for greater frequency of stormwater management systems being overwhelmed36
bull More frequent and severe flooding of buildings and infrastructure in areas across the city and
bull Greater variability in rainfall events annually including the chance of drought
The goal for this section is to guide stormwater management approaches including infiltration increases in on-site storage volume and where possible increases in sewer capacity to account for precipitation increases associated with climate change Designers should develop and consider design interventions that would decrease site contribution to sewer in-flows beyond the existing NYC Building Code requirements Given its complexity the Department of Environmental Protection (DEP) is also evaluating climate impacts to the sewer system on a drainage-wide level Proactive design such as increasing on-site infiltration and storm water retention can contribute to system resiliency on a site-specific basis
BackgroundNYCrsquos drainage systems are designed to handle approximately the current 3-year intensity-duration-frequency (IDF) event in most areas of the city where sewers were built prior to 1970 In locations with sewers built after 1970 the capacity was built to handle the 5-year event NYCrsquos network of drainage systems can experience flooding above those thresholds due to widespread precipitation events or by localized intense storms (sometimes called ldquocloudburstsrdquo) causing flooding and backups Climate change projections indicate that flooding resulting from multiple types of precipitation events may increase in frequency This increasing probability is forecast for all types of precipitation events in NYC although there is greater uncertainty around future short duration events Relying on sewers alone to manage extreme precipitation events will not be sufficient in a changing climate The City plans to reduce impervious areas and provide additional storage capacity to reduce flood damage For managing stormwater from larger storms such as at the 50- and 100-year recurrence intervals DEP is increasingly considering the role of streets and open space in managing flow this is referred to as a dual drainage design approach The City is piloting projects to test this dual drainage approach
Another set of interventions include Bluebelt best management practices (BMPs) such as constructed wetlands storm water ponds and stream restorations that emulate pre-development conditions to manage large volumes of water and green infrastructure37 which in NYC have generally been designed to reduce flooding and combined sewer overflow respectively They are not typically sized to manage precipitation events of the same magnitude as sewers which serve as primary drainage conveyance However Bluebelt BMPs green infrastructure and other stormwater management tools may provide an additional buffer for larger storm events by temporarily storing andor infiltrating runoff that would otherwise be directed into the sewer system For instance areas of open space commonly found in NYC may not provide adequate environments for trees and other plantings However in these cases other types of green infrastructure like permeable surfaces and subsurface detention and retention installations would still be considered feasible
36 NYC is already taking steps to address this problem which will worsen with climate change To learn more about how NYC is using green and gray infrastructure to manage stormwater visit httpwwwnycgovhtmldephtmlstormwaterindexshtml
37 NYC DEP NYC Green Infrastructure Program
NYC Mayorrsquos Office of Recovery and Resiliency Climate Resiliency Design Guidelines
16IIB INCREASING PRECIPITATION
The City led by DEP continues to develop its options for managing heavier storm events due to climate change DEP is examining approaches to evaluate sea level rise and rainfall intensity for stormwater management and where possible sewer capacity These efforts will integrate forward-looking climate data into the design of these capital assets and the compounding factors of heavier rain storms and sea level rise will likely require greater infiltration and on-site storm water retention capacity Agencies and consultants should work directly with DEP to develop strategies on a given site necessary to meet expected increases in rainfall intensities and frequencies
1 Precipitation design adjustment for on-site stormwater systems
Based upon the design storm required for the City facility in design follow the steps below and review recommended design interventions
a) Identify the duration of the design event required The current 50-year IDF can be used as a proxy for the future 5-year storm
(projected for the 2080s) Design on-site detentionretention systems to retain the volume associated with the current 50-year IDF curve (see Figure 4 below) Design the on-site system to release at the maximum rate as specified in 15 Rules of the City of NY (RCNY) Chapter 3138
b) Conduct sensitivity analysis Compare the retentiondetention required for the current 5-year IDF versus the
38 Refer to existing codes and standards as well when determining the existing required storm as NYC requires different sizes of design storms for infrastructure and buildings For example NYC Plumbing Code Chapter 11 and Title 15 of the Rules of the City of New York Chapter 31
02
04
06
10
20
40
60
100
200
-2316090
Rai
nfal
l Int
ensi
ty (
inch
es p
er h
our
)
DurationsruoHsetuniM
5 10 15 30 1 2 3 6 12 18
5-yr
10-yr25-yr
50-yr
100-yr
NEW YORK NEW YORK
Figure 4 - Current Intensity-Duration-Frequency Precipitation Curve for NYC adapted from US Department of Commerce Weather Bureau Technical Paper 25
NYC Mayorrsquos Office of Recovery and Resiliency Climate Resiliency Design Guidelines
17IIB INCREASING PRECIPITATION
c) Identify design interventions for managing increased precipitation40 There are different ways to manage stormwater better and avoid urban flooding after
intense rain Choose the right combination of interventions after considering the site location operational requirements cost benefits and useful life of the intervention Some examples of design interventions are
bull Minimize increases in impervious surfacebull Utilize strategies that infiltrate evaporate or reuse rainwater to achieve storm
water volume reductions Then choose strategies that detain (delay drainage) to manage the rate of the storm water flow into the Cityrsquos drainage system
bull Install stormwater infiltration detention and storage (eg bioswales41 green roofs blue roofs and other blue or green infrastructure storage basins or tanks)
bull Protect areas below grade from floodingbull Keep catch basin grates clearbull When implementing perimeter protections ensure that interior water
management is also accounted for andbull Explore interventions to protect underground utility and telecommunications
infrastructure from water damage
d) Use appropriate DEP guidelines to perform the above tasks using the higher design storm
The three currently prescribed DEP guidelines are as follows
bull Guidelines for the Design and Construction of Stormwater Management Systems July 201242
bull Criteria for Detention Facility Design November 201243 bull DEP Site Connection Proposal Application and Guidelines44
Note on stormwater standards As DEP updates stormwater standards and develops specific tools to evaluate impacts of increased precipitation and drainage strategies for on-site storm water management these changes will be reflected in future versions of these Guidelines However it is recommended that the designer should develop and consider design interventions that would increase the on-site storage beyond the existing requirements Also a methodology is under development that will establish a consistent citywide process for addressing legal grade which will have further implications for how extreme precipitation is managed
39 NYC DEP Standards for Stormwater Release Rates available at httpwwwnycgovhtmldephtmlenvironmental_reviewsstormwater_release_ratesshtml 40 Also see DEP Guide to Rain Event Preparedness at httpwwwnycgovhtmldeppdfbrochuresflood-preparedness-flyerpdf and
Ready to Respond Strategies for Multifamily Building Resilience at httpwwwenterprisecommunityorgresourcesready-respond-strategies-multifamily-building-resilience-1335641 When siting bioswales consider groundwater levels and soil permeability and ensure that the site is not contaminated from past or
present land uses A high water table may prohibit some applications42 Available at httpwwwnycgovhtmldephtmlstormwaterstormwater_management_constructionshtml43 Available at httpwwwnycgovhtmldeppdfwater_sewer30_criteria_for_detention_facility_design_06062012pdf44 Available at httpwwwnycgovhtmldeppdfwater_sewer24pdf
current 50 year IDF to determine the cost and benefits associated with complying with these Guidelines Use the Evaluation of Project Benefits section below and Appendix 4 for guidance on how to identify and assess benefits Given the results of the costbenefit analyses review the added benefit of designing retentiondetention using greater magnitude storms (eg 100-year) or lower (eg 25-year) The goal is to maximize retentiondetention capacity given site and cost constraints as well as through an evaluation of the benefit of adding capacity to detainretain water for larger storm events
NYC Mayorrsquos Office of Recovery and Resiliency Climate Resiliency Design Guidelines
18
2 Incorporating climate change projections into DEP drainage planning
The first line of defense for managing intense precipitation events does not require changes to the sewer system as described above For drainage and wastewater infrastructure planning in a changing climate the sewer network and wastewater infrastructure should be qualitatively evaluated from the upstream pipes to the regulator chambers pump stations interceptors and ultimately to the downstream outfall to determine the feasibility of incorporating climate change projections into the system design For DEP storm sewer projects FY 2021 or later in separately sewered drainage areas where the design is in the early stages and there is free discharge the agency will evaluate the feasibility of revising the design to incorporate climate projections into the design If the project (including the prescribed changes) passes the costbenefit analysis then DEP will consider incorporating climate change projections into the sizing However changes in one part of the system must be carefully evaluated For example any upsizing of the regulator chamber or the high point of the system can negatively impact the design and operation of the wastewater infrastructure and residencesbusinesses on the system and can lead to a diminished the level of service
DEP is in the process of developing a hydrologic and hydraulic (HampH) model to estimate runoff flow for future climate scenarios and is evaluating rainfall hyetographs for the existing and future rainfall scenarios to be included in the drainage planning process In addition DEP currently coordinates with ORR for drainage planning as a part of coastal resiliency projects A more detailed methodology to incorporate climate change projections into drainage planning will be developed for version 30 of the Climate Resiliency Design Guidelines to be released in April 2019
IIB INCREASING PRECIPITATION
NYC Mayorrsquos Office of Recovery and Resiliency Climate Resiliency Design Guidelines
19IIC SEA LEVEL RISE
non-critical components within a larger facility or campus (eg at a maintenance yard differentiate between structures and equipment) Critical components essential to the facilityrsquos functionality should be protected to the higher standard for criticality even if the facility itself may be non-critical Some examples of critical components include electrical distribution and switching areas motor-control centers chemical feed equipment boilers communications systems monitoring and safety equipment HVAC units fire alarms and suppression equipment furnaces elevators emergency fuel supplies emergency generators and hazardous material storage Component protection should also be evaluated if a facility is expected to be fully operational during a flood event or if it is expected to quickly resume full operations after an event
For buildings and infrastructure with a long useful life it is not always cost effective or operationally feasible to design a facility to be resilient to hazards faced at the end of its useful life In these cases the most resilient design will be one that provides extra protection against hazards in the initial decades while also leaving open design alternatives for updating resiliency measures as new data is provided or new risk assessments are completed This flexible adaptation pathways approach builds in options to protect assets later in life as demonstrated in an example shown in Figure 1 (in Section I)
Other considerations to keep in mind includebull These Guidelines apply to all City capital projects except coastal flood protection
systems which are designed to different standards than those provided here for
C SEA LEVEL RISEThis section provides tools to 1) determine if the project will be subject to tidal inundation during its useful life due to sea level rise and 2) incorporate sea level rise into flood protection levels of capital projects For projects in the current and future 1 annual chance floodplains sea level rise-adjusted design flood elevations (DFE) are provided and reflect the criticality of the asset and its useful life Background NYC has experienced the devastation of coastal storms most recently during Hurricane Sandy Sea level rise is projected to increase the depth extent and frequency of flooding from storm surge45 Sea level rise will also regularly inundate some low-lying areas during high tides Current flood protection heights are determined by using the base flood elevation established by the FEMA Preliminary Flood Insurance Rate Map (PFIRM) 201546 and the standard of protection for buildings in the floodplain in Appendix G of the NYC Building Code47 These Guidelines augment existing requirements for two primary purposes ensuring City facilities built today incorporate sea level rise and critical assets (as defined in Table 4) are protected to a higher level It is important to note that all projects and design interventions must comply with NYC Building Code
Designers should differentiate between critical and
45 New York City Panel on Climate Change Report Chapter 2 Sea Level Rise and Coastal Storms (2015)46 However NYC Building code G10222 requires that designers review both the PFIRM and the effective FIRM and use the more
restrictive of the two 47 For information on the differences between FEMA FIRM PFIRM and the Cityrsquos forward-looking flood maps see Appendix 3
Critical components essential to the facilityrsquos functionality should be protected to the higher standard for criticality even if the facility itself is non-critical
NYC Mayorrsquos Office of Recovery and Resiliency Climate Resiliency Design Guidelines
20IIC SEA LEVEL RISE
buildings and other physical infrastructure Many of NYCrsquos coastal flood protection systems are currently being developed to comply with FEMA accreditation for flood levee systems48 The City plans to develop further guidance for designing coastal protection projects
bull For information on the differences between FEMA FIRM PFIRM and the Cityrsquos forward-looking flood maps see Appendix 3
bull Coincident stressors from sea level rise should also be considered For example bridge scour may increase as sea levels rise Similarly flooding during heavy rainfall events can be worsened due to higher tailwater conditions associated with high sea levels Be aware of how different risks may interact and how different interventions can be deployed to address multiple hazards or provide other co-benefits
bull Note projects that require discretionary approval are required to incorporate sea level rise projections as part of the NYC Waterfront Revitalization Program49 and
bull A methodology is under development that will establish a consistent citywide process for addressing legal grade which will have further implications for how sea level rise and precipitation are managed
For more information see Section IE Designers should use the resources and methods described in this section to 1) assess tidal inundation due to sea level rise and 2) address risks in the current and future floodplains
1 Assessing tidal inundation due to sea level riseTidal flooding currently affects parts of NYC and is projected to worsen as sea levels rise and inundate low-lying coastal sites during high tides When determining a site location or establishing scope of substantial improvements for other types of coastal facilities the project team will consider alternative sites outside of zones threatened with regular inundation if resiliency actions are not taken Some facilities such as wastewater treatment plants and harbor facilities need to be near the coast for operational purposes
a) Determine tidal inundation risk from sea level rise Use the Flood Hazard Mapper (httpwwwnycgovfloodhazardmapper)50 to see if your
site is in an area inundated from high tide plus sea level rise within the projectrsquos useful life For example if the useful life ends between 2040 and 2069 choose the 2050s High Tide map) Determine risk only from high tide and sea level rise separate from flood events Follow the instructions in Figure 5 and refer to the example in Figure 6 to review inundation at the end of an assetrsquos useful life
48 For more information please visit httpwwwfemagovfema-levee-resources-library49 For more information visit httpwwwnycgovwrp50 The Flood Hazard Mapper relies on publicly available data to present these map resources Users should also refer to FEMA and the
NPCC for official information
Figure 5 - Flood Hazard Mapper high tide plus sea level rise at httpwwwnycgovfloodhazardmapper
NYC Mayorrsquos Office of Recovery and Resiliency Climate Resiliency Design Guidelines
21IIC SEA LEVEL RISE
b) Address flood risk If the Flood Hazard Mapper shows that the facility is expected to be inundated by
high tides within its useful life or if primary access roads are at risk of inundation consider alternative site options
- OR - If the site is not expected to be regularly inundated by tides proceed to the next
section 2 Addressing Risks in the Current Floodplain
Note on calculating tidal inundations with sea level rise if a project team is interested in understanding the depth of tidal inundation given climate change projections follow these steps First determine the Mean Higher High Water (MHHW) elevation in feet-NAVD 8851 datum nearest to the site If the MHHW data is unavailable from a site specific survey refer to httpwwwnycgovwrp for a list of MHHW elevations (NAVD88) at tide stations across the city52 Second add the high estimate (90th percentile) of expected sea level rise (see Table 8 in Appendix 2) for the year corresponding to the facilityrsquos useful life to the MHHW to determine the projected depth of tidal inundation with sea level rise
51 North American Vertical Datum of 1988 (NAVD 88) is the vertical control datum of orthometric height established for vertical control surveying in the US based upon the General Adjustment of the North American Datum of 1988
httpswwwngsnoaagovdatumsvertical52 SLR elevations at httpwwwnycgovwrp are adjusted to account for sea level rise since the last tidal epoch If no other resource is
available to determine MHHW use the NOAA Online Vertical Datum Transformation tool to calculate the MHHW in feet-NAVD
Figure 6 - Flood Hazard Mapper with high tide in the 2020s (left) and in the 2080s (right) at httpwwwnycgovfloodhazardmapper
NYC Mayorrsquos Office of Recovery and Resiliency Climate Resiliency Design Guidelines
22IIC SEA LEVEL RISE
2 Addressing risks in the current floodplain53
A facility located in the current 1 annual chance floodplain (PFIRM 2015)54 will face increasing risk of flooding during its useful life due to sea level rise increasing the depth of coastal storms This section provides a process for adjusting the design flood elevation required by code to account for sea level rise
a) Find the location of the facility using the Flood Hazard Mapper (httpwwwnycgovfloodhazardmapper) and follow the instructions in Figure 7
bull Choose to view the layer ldquoFEMA Preliminary FIRM 2015rdquo bull Click on the facility site in the 1 floodplain to view the base flood elevation
Figure 7 - Flood Hazard Mapper with FEMA PFIRM (2015) at wwwnycgovfloodhazardmapper
b) If the facility is not in the current 1 annual chance floodplain (PFIRM 2015) proceed to the next section ldquo3 Addressing risks in the future floodplainrdquo
- OR - If the facility is in the current 1 annual chance floodplain (PFIRM 2015) note
the base flood elevation (BFE) and proceed to Step c) below Please note if a facility has multiple BFEs or if the site is partially in the 1 annual chance floodplain it is recommended to use the highest BFE as the current BFE for the entire site
c) Establish a sea level rise-adjusted DFE Use the current base flood elevation at your site the facilityrsquos useful life and its
criticality level to determine the design flood elevation using Table 4 (on the next page) as a basis of design
53 This process for adjusting the design flood elevation to account for sea level rise satisfies the criteria of the climate-informed science approach described at the state and federal level
54 FEMA updates its flood maps periodically As of April 2018 the most recent maps are the Preliminary Flood Insurance Rate Maps (PFIRM) available at DCPrsquos Flood Hazard Mapper (httpwwwnycgovfloodhazardmapper) Also note that NYC Building Code requires developers to use the PFIRM (2015) or the FIRM (2007) whichever is more restrictive For more information on these requirements please refer to Appendix G of the NYC Building Code Please note that the DCP maps are not official and all site locations should be confirmed with the official FEMA PFIRM NYC will provide information on the latest flood maps as they are updated
NYC Mayorrsquos Office of Recovery and Resiliency Climate Resiliency Design Guidelines
23IIC SEA LEVEL RISE
Table 4 - Determine the sea level rise-adjusted design flood elevation for critical and non-critical facilities55
Critical facilities
End of useful life Base Flood Elevation (BFE)56 in NAVD 88 + Freeboard57 + Sea Level Rise
Adjustment58= Design Flood Elevation (DFE) in
NAVD 88Through 2039 FEMA 1 (PFIRM) 24rdquo 6rdquo = FEMA 1 + 30rdquo
2040-2069 FEMA 1 (PFIRM) 24rdquo 16rdquo = FEMA 1 + 40rdquo2070-2099 FEMA 1 (PFIRM) 24rdquo 28rdquo = FEMA 1 + 52rdquo
2100+ FEMA 1 (PFIRM) 24rdquo 36rdquo = FEMA 1 + 60rdquoNon-critical facilities
End of useful life Base Flood Elevation (BFE) in NAVD 88 + Freeboard + Sea Level Rise
Adjustment = Design Flood Elevation (DFE) in
NAVD 88Through 2039 FEMA 1 (PFIRM) 12rdquo 6rdquo = FEMA 1 + 18rdquo
2040-2069 FEMA 1 (PFIRM) 12rdquo 16rdquo = FEMA 1 + 28rdquo2070-2099 FEMA 1 (PFIRM) 12rdquo 28rdquo = FEMA 1 + 40rdquo
2100+ FEMA 1 (PFIRM) 12rdquo 36rdquo = FEMA 1 + 48rdquoAdditional analysis should be conducted to incorporate wave action and wave run-up in DFE calculations especially in areas that are located within the FEMArsquos 1 annual chance Limit of Moderate Wave Action (LiMWA) zone Wave run up is the maximum vertical extent of wave uprush above surge
Definition of critical buildings and infrastructure for determining DFE in Table 4The criticality definitions below are for use in the application of the Guidelines only All items identified as critical in NYC Building Code Appendix G are critical in these guidelines however this list includes additional facilities that are not listed in Appendix G59 If a facility is not listed here it is considered non-critical for the purposes of determining freeboard
bull Hospitals and health care facilitiesbull Fire rescue ambulance and police stations and emergency vehicle garages bull Jails correctional facilities and detention facilities bull Facilities used in emergency response including emergency shelters emergency preparedness communication
operation centers communication towers electrical substations back-up generators fuel or water storage tanks power generating stations and other public utility facilities
bull Critical aviation facilities such as control towers air traffic control centers and hangars for aircraft used in emergency response
bull Major food distribution centers (with an annual expected volume of greater than 170000000 pounds)60 bull Buildings and other structures that manufacture process handle store dispose or use toxic or explosive
substances where the quantity of the material exceeds a threshold quantity established by the authority having jurisdiction and is sufficient to pose a threat to the public if released61
bull Infrastructure in transportation telecommunications or power networks including bridges tunnels (vehicular and rail) traffic signals (and other right of way elements including street lights and utilities) power transmission facilities substations circuit breaker houses city gate stations arterial roadways telecommunications central offices switching facilities etc
bull Ventilation buildings and fan plantsbull Operations centersbull Pumping stations (sanitary and stormwater)bull Train and transit maintenance yards and shopsbull Wastewater treatment plantsbull Water supply infrastructurebull Combined-sewer overflow (CSO) retention tanksbull Fueling stationsbull Waste transfer stations and bull Facilities where residents have limited mobility or ability including care facilities and nursing homes
55 If an industry standard does not include freeboard in its flood protection standards for particular infrastructure assets then only consider the sea level rise adjustment when determining flood protection levels
56 Note that NYC Building Code requires developers to use the PFIRM (2015) or the FIRM (2007) whichever is more restrictive For more information on these requirements please refer to Appendix G of the NYC Building Code
57 These freeboard values reflect NYC Building Code Appendix G Table 2-1 which establishes the minimum elevation of the top of lowest floor Appendix G requires other freeboard values for other parts of structures and in different parts of the floodplain Refer to Appendix G for the appropriate freeboard and use that value in Table 4 above
58 The sea level rise figures provided are for the middle of the 25th-75th percentile range projections from the NPCC These values do not necessarily indicate the average of all models
59 The structural occupancy categories outlined in Appendix G of the NYC Building Code are the same as ASCE 7 used for structural design For critical buildings structural design should comply with ASCE 7 and 24 for design class IV
60 This threshold represents the median volume of main food distributors in NYC according to statistics collected as part of the Five Borough Food Flow study in 2016 available at
httpswwwnycedccomsystemfilesfilesresource2016_food_supply-resiliency_study_resultspdf 61 The threshold quantity for hazardous materials is established by Chapter 7 of Title 24 of the NYC Administrative Code
NYC Mayorrsquos Office of Recovery and Resiliency Climate Resiliency Design Guidelines
24IIC SEA LEVEL RISE
Figure 9 ndash Outdoor emergency generator for the critical building
This case study provides an example of how to calculate a sea level rise-adjusted DFE based on the useful life of a hypothetical critical services building and its primary component
Step 1 Organize the site by various critical or primary components and their year of construction Determine their useful life along with the associated future year scenario for flood risk assessment In this example the building structure and the outside emergency generator are the most at-risk components from combined sea level rise and coastal storm surge
Step 2 Overlay the site footprint area over the effective current PFIRM or FIRM and the corresponding future year scenario FEMA 1 to identify flood risk to the site From overlaying the 2015 preliminary FEMA floodplain over the site it was determined that the site has a 1 annual chance of flooding with a base flood elevation of 13rsquo NAVD Step 3 Evaluate the criticality of each primary component of the facility based on the Guidelinesrsquo definition for critical infrastructure (Table 4) This (hypothetical) building is critical
Step 4 Use Table 4 to determine the sea level rise adjustment and freeboard requirements for each component and calculate the DFE for each that corresponds to its useful life period
Step 5 Compare the DFE of each component and the associated Guidelinesrsquo recommended DFE to calculate anticipated flood depth
CASE STUDY Adjusting the DFE for Sea Level Rise
Table 5 ndash Example of how to calculate a sea level rise-adjusted DFE for a critical facility
Construction year Components Useful
Life
Future Year Scenario
[Useful Life + Const
Year]
BFE in NAVD
88 (feet)
Freeboard + Sea
Level Rise Adjustment
(feet)
Adjusted DFE in
NAVD 88 (feet)
2010 Building Structure
70 years 2070-2099 130rsquo 2rsquo+23rsquo 173rsquo
2010Outdoor
Emergency Generator
25 years
Through 2039 130rsquo 2rsquo+05rsquo 155rsquo
Figure 8 - Example of how to locate a facility within the current floodplain and determine the BFE Figure 9 (inset) - Outdoor emergency generator at the facility
Figure 10 - This schematic shows how to determine the design flood elevation of a facility within the current 1 floodplain
Illustrative not to scale
NYC Mayorrsquos Office of Recovery and Resiliency Climate Resiliency Design Guidelines
25IIC SEA LEVEL RISE
Figure 11 - Flood Hazard Mapper with future 1 annual chance floodplain (adjusted for sea level rise) at httpwwwnycgovfloodhazardmapper
b) If the site is not in the future floodplain no flood protection is required for this facility
- OR - If the site is in the future floodplain identify the nearest adjacent base flood
elevation at the project site in the current 1 annual chance floodplain (PFIRM 2015) using the Flood Hazard Mapper62
c) Use Table 4 to determine the DFE Add freeboard and the sea level rise-adjustment to the nearest adjacent BFE on the
current 1 annual chance floodplain (PFIRM 2015) to determine the DFE
d) Apply the DFE calculation from Table 4 to the protected facility See Figures 12 and 13 for an illustration of how to calculate the DFE
62 Maps of future floodplains show the impacts of sea level rise alone and do not consider how changes in stormsrsquo climatology might also affect wave action and the full extent of the floodplain
3 Addressing risks in the future floodplainIf the facility is not in the current 1 annual chance floodplain (PFIRM 2015) it may still be at risk in the future from flooding as sea level rise increases the extent of the floodplain Follow the steps below to determine if your facility is located in the future floodplain and if so what sea level rise-adjusted DFE to use
a) Use the Flood Hazard Mapper (httpwwwnycgovfloodhazardmapper) to determine if the facility site will be in the future 1 annual chance floodplain
Assess if by the end of the facilityrsquos useful life the floodplain is projected to increase to encompass all or part of the project site For example if the useful life ends between 2040 and 2069 choose the 2050s floodplain map Refer to the steps in Figure 11 below
NYC Mayorrsquos Office of Recovery and Resiliency Climate Resiliency Design Guidelines
26IIC SEA LEVEL RISE
Figure 12 - This schematic map shows how to locate the nearest adjacent 1 floodplain elevation
Figure 13 -This schematic shows how to determine the design flood elevation of a facility that is outside of the current 1 floodplain
CASE STUDY Identifying a Base Flood Elevation (BFE) in the Future Floodplain
Illustrative not to scale
NYC Mayorrsquos Office of Recovery and Resiliency Climate Resiliency Design Guidelines
27IIC SEA LEVEL RISE
4 Identify appropriate design interventions
63 Additional resources for identifying adaptive strategies Urban Waterfront Adaptive Strategies (NYC Department of City Planning httpswww1nycgovassetsplanningdownloadpdfplans-studiessustainable-communitiesclimate-resilienceurban_waterfrontpdf Floodproofing Non-Residential Buildings (FEMA) at httpswwwfemagovmedia-libraryassetsdocuments34270 Ready to Respond Strategies for Multifamily Building Resilience (Enterprise Green Community) at
httpwwwenterprisecommunityorgresourcesready-respond-strategies-multifamily-building-resilience-1335664 While natural systems-based approaches ameliorate flooding their use for storm surge or wave mitigation would need to be quantified
before contributing towards the design flood elevation 65 For more information see FEMArsquos Floodproofing Non-Residential Buildings at httpswwwfemagovmedia-libraryassetsdocuments34270
Operational requirements and continuity plans can inform the selection of appropriate design interventions particularly in terms of how quickly a site needs to be up and running after a flood event Some examples of how functional uses can pair with interventions include
bull A facility that needs to be operating during or immediately after a flood event may need to be dry floodproofed using permanent barriers or designed for passive survivability (such as a police or fire station)
bull A facility that needs to recover quickly after an event could elevate prioritized equipment and have deployable barriers
bull A site that can recover over a longer duration of time could be temporarily inundated during an event (such as parks or plazas) The use of resilient materials and strategies can reduce costly damage caused by temporary inundation
Different design interventions should be chosen based on the specific operational requirements of the project however these must meet the ASCE 24 design requirements for Coastal VE Zones
For all projects at risk of current or future flooding select protections that meet the projectrsquos design flood elevation Consider project-specific factors including the site location operational requirements existing continuity planning and cost63 A Design Strategies Checklist in Appendix 6 is available for use as a resource to track possible design approaches Some examples of design alternatives are
bull Site relocation where feasible conduct alternative site analysis
bull Permanent barriers at a site (eg floodwalls)
bull Deployable flood barriers (eg stop logs flood doorsgates inflatable barriers)
bull Natural systems-based approaches (eg living shorelines restored wetlands)64
bull Prioritized protection of electrical mechanical and other critical or costly-to-replace equipment above the design flood elevation (eg motors and controller boilers and furnaces fuel storage tanks duct work alarm systems and suppression equipment electrical panels electrical distribution and switching areas gas and electric meters telecommunications equipment chemical feed equipment HVAC units and emergency generators)65
bull Dry floodproofing design a facility to prevent water from entering
bull Wet floodproofing design a facility to permit floodwaters to flow in and out of the structure without causing significant damage (eg elevate or protect critical equipment use water-resistant building materials below the design flood elevation include flood vents and pumps)
bull Design redundant telecommunications conduit entrances for multiple carrier entry Telecom conduit should run to diverse manholes when possible
bull Install backup power for telecom equipment with design consideration for such equipment (eg installation above DFE)
bull Install outdoor-rated disconnect switch for telecommunications equipment on the roofbull Explore interventions to protect underground utilities and other telecommunications
facilities from water damagebull Install backflow preventers backwater valves and sump pumps for all buildings and
infrastructure in the floodplain as well as behind flood barriersbull Shoreline improvements that reduce the height of waves or attenuate waves where
feasible
NYC Mayorrsquos Office of Recovery and Resiliency Climate Resiliency Design Guidelines
28IIIA GENERAL METHODOLOGY TO ESTIMATE PROJECT BENEFITSIIIB CATEGORIES OF PROJECT BENEFITS
Designing and constructing facilities to handle the future climate loads above the current NYC codes and standards based on projected useful life of the components provides resiliency benefits The incremental costs to implement the Guidelinesrsquo recommended design interventions should be compared with the incremental benefits to aid agencies in making decisions about resilient design strategies The project design team should evaluate benefits of the interventions designed to meet Guidelinesrsquo recommended criteria for all the climate stressors qualitatively andor quantitatively For projects with construction costs below $50 million the project design team is recommended to perform a qualitative benefits assessment on the interventions that meet the Guidelinesrsquo recommendations for all applicable climate stressors For critical facilities or projects with construction costs over $50 million the project design team is recommended to perform quantitative benefit calculations to identify the optimal interventions that meet Guidelinesrsquo recommended design criteria
A GENERAL METHODOLOGY TO ESTIMATE PROJECT BENEFITSThis general methodology to perform qualitative and quantitative benefit calculations is recommended for use by project design teams at the beginning of and during the design process This methodology enables estimation of project benefits for a high-level benefit-cost analysis (BCA) that can be applied to evaluate and compare resiliency features designed to address sea level rise with coastal storm surge increased precipitation and extreme heat events The type of benefits provided by interventions designed to meet the Guidelinesrsquo design criteria can vary by climate stressors and typology of the facilities The main guiding principle in development of the high-level BCA methodologies included in these Guidelines was to balance simplicity with accuracy The project benefits categories identified within the methodology may not cover all the potential benefits provided by every facility type within NYC In particular the benefits of planning for increased precipitation are difficult to quantify Hence the project design team should use their discretion to modify this general benefit calculation methodology as needed to meet their project goals and objectives The project design team should develop appropriate input data whether quantitative or qualitative needed to estimate project benefits
B CATEGORIES OF PROJECT BENEFITSThere are three types of project benefit categories - direct benefits indirect benefits and other benefits - that can be used to perform qualitative assessments and develop quantitative estimates of monetary benefits for intervention alternatives designed to meet the Guidelinesrsquo recommendations These project benefit categories will help to perform a high-level benefit-cost analysis that balances accuracy with an appropriate level of effort
bull Direct Benefits include reduced or avoided physical damages to facilities and contents reduced or avoided displacements for residential structures and reduced life cycle or OampM costs that can be quantified as a primary result of implementing a specific hazard mitigation measure Table 12 in Appendix 4 provides a list of direct benefits and basic guidance on estimating and documenting values for sea level rise and increased precipitation-related flood hazards Note that given the current state of practice it is not possible to quantify reduced or avoided physical damages or residential displacements that result from a specific extreme heat mitigation measures Therefore direct benefits applicable to extreme heat hazards are limited to reduced life cycle costs applicable to certain measures such as green roofs Refer to Table 15 for details on direct benefits for extreme heat hazards
III EVALUATION OF PROJECT BENEFITS
NYC Mayorrsquos Office of Recovery and Resiliency Climate Resiliency Design Guidelines
29IIIB CATEGORIES OF PROJECT BENEFITS
bull Indirect Benefits include reduced or avoided service losses for non-residential
buildings public facilities andor infrastructure (utilities roads and bridges) based on the value of service continuity andor emergency services to New Yorkers that can be quantified as a secondary result of implementing a specific hazard mitigation measure Table 13 in Appendix 4 provides a list of indirect benefits and basic guidance on estimating and documenting values for sea level rise and increased precipitation-related flood hazards Note that given the current state of practice on extreme heat it is not possible to quantify reduced or avoided service losses that result from a specific extreme heat mitigation measures Therefore indirect benefits applicable to extreme heat hazards are limited to reduced energy costs such as cool roofs green roofs or shade trees Refer to Table 15 in Appendix 4 for details on indirect benefits for extreme heat hazards
bull Other Benefits where applicable other potential benefits may include social benefits for residents such as avoided stress and anxiety avoided lost productivity environmentalecosystem service benefits avoided need for emergency services and other potential benefits that can be estimated as a result of implementing a specific hazard mitigation measure Table 14 in Appendix 4 provides a list of other potential benefits and basic guidance on estimating and documenting values for sea level rise and increased precipitation-related flood hazards
Note on the ecosystem service benefit category in Table 14 the stormwater management benefits of green infrastructure should be distributed between the extreme heat and increased precipitation hazards since these measures provide both significant reductions in rainfall runoff as well as Urban Heat Island mitigation through evapotranspiration However there is currently limited data available to quantify the actual distribution of stormwater management benefits between the two hazards For various dual-benefit providing interventions careful considerations should be given to identify the appropriate benefits category provided by the intervention with a goal to avoid duplication of quantified benefits In this methodology the stormwater management benefits of green infrastructure are applied to the increased precipitation hazard in order to avoid a duplication of benefits Note on real estate and quality of life benefits additionally it is important to note that two potential benefit categories shown in Table 14 - real estate and quality of lifehealthavoided casualties - were not included in the current BCA methodology for sea level rise or increased precipitation hazards Although these categories could increase project benefits for sea level rise and increased precipitation hazards they were only applied to measures that address extreme heat hazards such as green roofs trees and other plantings Refer to Table 15 for a detailed summary of other benefit categories quantified as unit benefits for extreme heat hazards
NYC Mayorrsquos Office of Recovery and Resiliency Climate Resiliency Design Guidelines
30IIIC WHICH METHODOLOGY TO USEIIID BCA METHODOLOGY FOR PROJECTS UNDER $50 MILLION
D BCA methodology for projects under $50 millionThe project design team should develop design alternatives to meet the Guidelinesrsquo criteria which may be in excess of NYC code and standards requirements (baseline conditions) It is assumed that the project design team will develop alternatives to address each of the following applicable climate stressors - sea level risecoastal storm surge increased precipitation and extreme heat - separately Tables 12-15 in Appendix 4 provides a list of typical direct indirect and other benefits provided by various intervention typologies to reduce impacts from climate stressors During the qualitative assessment the project design team should consider that intervention strategies will have varying levels of reliability effectiveness benefits and cost implications during the qualitative assessment
The project design team is recommended to develop appropriate evaluation criteria and metrics for each of the applicable project benefit categories For each alternative the project design team could use either a scoring weighting ranking or other type of qualitative assessment framework to assess each applicable project benefit categories with the developed evaluation criteria and metrics Table 6 provides an example template to evaluate alternatives using a set of general evaluation criteria and metrics using a color-coded rating system (and see Table 7 for an example of how to complete the template) The project design team can utilize a similar template customized to their project goals and objectives This assessment allows agencies to screen the qualitative benefits for various alternatives that would then lead to development of final project components to match the available budget and goals of the project
Projects with total costs below $50 million recommended to conduct a qualitative assessment to identify the optimal interventions that meet Guidelinesrsquo design criteria using the ldquoD) BCA methodology for projects under $50 millionrdquo methodology below
C WHICH METHODOLOGY TO USEProjects with a total cost above $50 million or are highly complex or critical facilities recommended to conduct both a qualitative and quantitative benefit calculation to identify the optimal interventions that meet Guidelinersquos design criteria using the ldquoE) BCA methodology for projects above $50 millionrdquo below A quantitative BCA also must include qualitative factors
NYC Mayorrsquos Office of Recovery and Resiliency Climate Resiliency Design Guidelines
31IIID BCA METHODOLOGY FOR PROJECTS UNDER $50 MILLION
Qualitative Color Scale Green=Least resource intensive alternative Purple=most resource intensive yellow=medium level of resource intensity
Qualitative Evaluation Factors Description Relative Color Rating System
First CostsAdditional construction costs needed to incorporate Guidelinesrsquo recommended resilient design over the baseline project costs
Highest cost ($$$) rated as Purple whereas lowest cost ($) rated as Green
ConstructabilityEase of Implementation
Construction techniques and site conditions such as presence of major utilities conflicts and other conditions which dictate the level of constructability required for each alternative
Difficult to construct rated as Purple whereas easiest to construct rated as Green
Environmental ImpactsCo-BenefitsPermitting
Impacts to the built and natural environment such as circulation noise and hazardous waste plus the level of effort required for permitting (eg interventions in water require highest level of permitting requirement) from each alternative in addition to the baseline project condition
Highest environmental impacts and highest level of effort required for permitting rated as Purple whereas the least impact and level of effort rated as Green
Operation and Maintenance (OampM)
Level of effort of additional manpower and cost of OampM for the alternatives over the baseline project OampM requirements
Highest level of effort and cost for OampM rated as Purple whereas the lowest is rated as Green
Reliability and Durability
Interventions that do not require human involvement or a facilityrsquos ability to withstand all the forces during a storm event (eg permanent solutions with higher reliability than deployable solution)
Interventions requiring human involvement (active measures) rated as Purple whereas interventions with minimal or no human involvement (passive measures) rated as Green
Risk Reduction Benefits Monetary benefits provided by each intervention alternative in avoided damages over the baseline condition
Lowest potential monetary benefit rated as Purple whereas as highest potential monetary benefit rated as Green
Quality of Life BenefitsVisual Aesthetics
Benefits either to the community such as recreation or safety or serve the community during emergency situations
Lowest potential quality of life benefits rated as Purple whereas as highest potential benefits rated as Green
Table 6 ndash Evaluation matrix for comparison of mitigation alternatives across the useful life of a project
Project title_______________________________________________________________________________
Evaluation Criteria
Baseline Condition (Designed to NYC Building Code and
Standards)
Resilient Design Alternatives for Managing__________________
Alternative 1
Alternative 2
Alternative 3
First Costs
ConstructabilityEase of ImplementationEnvironmental ImpactsCo-BenefitsPermitting
Operation and Maintenance (OampM)
Reliability and Durability
Risk Reduction Benefits
Quality of Life BenefitsVisual Aesthetics
NYC Mayorrsquos Office of Recovery and Resiliency Climate Resiliency Design Guidelines
32IIID BCA METHODOLOGY FOR PROJECTS UNDER $50 MILLION
Table 7 ndash Evaluation matrix for comparison of mitigation alternatives across the useful life of a project - COMPLETED EXAMPLE
Evaluation Criteria
Baseline Condition (Designed to NYC Building Code and
Standards)
Resilient Design Alternatives for Managing Coastal SurgeSLR
Alternative 1Flood proof building built on grade to Guidelines
DFE
Alternative 2 Elevate building structure above Guidelinesrsquo DFE
on columns
Alternative 3 Raise site grade by filing the building site footprint
to Guidelinesrsquo DFE
First CostsBaseline cost for building structure is $15 million
Incremental costs are within 5 over the baseline costs
Incremental costs are between 5-10 over baseline costs
Incremental costs are 20 and more over baseline costs
ConstructabilityEase of Implementation
Relatively easy to construct within site constraints
Similar to baseline conditions since construction requires additional flood proofing only
Moderate challenges to construct foundation structure for columns within site constraints
Extremely challenging to construct within the site constraints Potentially fatal flaw
Environmental ImpactsCo-BenefitsPermitting
No major impacts but may require additional effort to obtain DOB permits with flood proofing and deployable systems
No major impacts but may require additional effort to obtain DOB permits with flood proofing and deployable systems
No major impacts and relatively easy to permit
Potential drainage circulation impacts and challenges to obtain clean fill material for the site
Operation and Maintenance (OampM)
Major OampM costs associated with deployable systems
Major OampM costs associated with deployable systems
Moderate OampM costs associated with proposed elevator for access
Minimal OampM costs since deployable and elevators not required
Reliability and Durability
Least reliability with highest potential risk from flooding during to failure of deployable systems
Least reliability with highest potential risk from flooding during to failure of deployable systems
Moderate reliability with potential risk from flooding limited to elevator shaft only
Highest reliability since deployable are not required to protect building from flooding
Risk Reduction Benefits
Maximum flood risk reduction benefits assuming deployable and flood proofing is effective
Maximum flood risk reduction benefits assuming deployable and flood proofing is effective
Maximum flood risk reduction benefits
Maximum flood risk reduction benefits
Quality of Life BenefitsVisual Aesthetics
Facility may not be operational during the storm event
Facility may not be operational during the storm event
Facility can be potentially operational during the storm event
Facility can be potentially operational during the storm event
Qualitative Color Scale Green=Least resource intensive alternative Purple=most resource intensive yellow=medium level of resource intensity
A new non-critical facility with a building structure is proposed on a site that is currently in the 2015 Preliminary FEMA 1 annual chance floodplain with a BFE of 10rsquo (NAVD 88) The baseline conditions DFE to meet existing NYC codes and standards is 11rsquo (NAVD 88) Using the Guidelines recommended design criteria the facilityrsquos DFE is 133rsquo (NAVD 88) and existing grade is around 6rsquo (NAVD 88) The project design team develops three alternatives to meet the Guidelinesrsquo recommended DFE design for the facility Table 7 offers an example of how a qualitative assessment can be used to compare three resilient design alternatives using the evaluation criteria and metrics
CASE STUDY Example of How to Use the Evaluation Matrix
NYC Mayorrsquos Office of Recovery and Resiliency Climate Resiliency Design Guidelines
33IIIE BCA METHODOLOGY FOR PROJECTS OVER $50 MILLION
E BCA methodology for projects over $50 millionIn order for a project to be considered cost-effective a benefit-cost analysis (BCA) assesses if the benefits of a project outweigh its costs or in other words the benefit-cost ratio (BCR) is greater than 10 as illustrated in Equation 1
Equation 1 Benefit-Cost Ratio Formula
BCR =
Where BCR = Benefit-Cost Ratio
BENEFITS = Total project benefits
COSTS = Total project costs
BENEFITSCOSTS
These estimated project benefits are combined with the project costs which are defined as the differential construction and long-term operation and maintenance costs associated with constructing a proposed project to the Guidelinesrsquo recommended design level It is assumed that the baseline project will be designed to the most prevalent NYC codes and standards This benefit methodology should be used to determine the additional project benefit that the Guidelinesrsquo recommended design would provide over the baseline project benefit It is assumed that the project design team will develop alternatives to address each of the following applicable climate stressors - sea level risecoastal storm surge increased precipitation and extreme heat - separately For each alternative the project design team should use the following steps to determine the Benefit-Cost Ratio (BCR)
a) Determine project useful life for design interventions Determining the useful life of the proposed project is an important first step in the
detailed BCA assessment methodologies for two reasons First the project useful life determines what values must be used from the Guidelines to establish the future climate design conditions The various hazard tables in the Guidelines establish design requirements based on useful life ranges through 2039 2040-2069 2070-2099 and 2100+ (2100+ projections are only available for sea level rise) A review of these tables show that the design requirements needed to meet the projected climate hazards increase as the end of useful life range increases Second the useful life determines how long the project will need to be operated and maintained in order to remain technically sound and effective at reducing future damages and losses
b) Determine discount rate for project benefits calculation The cost-effectiveness of projects assessed using the BCR must be done on a net
present value basis meaning the present value of the benefits is compared to the present value of the costs Most project costs are computed for present value based on current cost estimates bids or cost guidance However project benefits - as well as project costs for operation and maintenance - accrue over time into the future and are computed on an annualized basis To address this issue the Present Value Coefficient (PVC) is used to bring these annualized project benefits and OampM costs into the present value As indicated by the formula in Equation 2 the PVC is a function of the Project Useful Life (PUL) and the Discount Rate (DR)
NYC Mayorrsquos Office of Recovery and Resiliency Climate Resiliency Design Guidelines
34
Equation 2 Present Value Coefficient (PVC) Formula
PVC =
Where PVC = Present Value Coefficient
PUL = BCA Project Useful Life based on project type
DR = Discount Rate
The project design team should coordinate with agencies and NYC OMB if needed to determine appropriate discount rates based on funding source project type and other factors This coordination should take place during project initiation phase where total project costs (design and construction) are over $50 million66
c) Develop input data to perform benefit calculations Tables 16 and 17 in Appendix 4 provide a list of typical input data by each climate
stressor needed to perform benefit analysis quantitatively on variety of facilities67 The project design team should use these tables as a reference to identify appropriate input data categories andor additional input data needed to perform benefit analysis on the project
d) Identify applicable project benefit categories to estimate benefits Tables 16 and 17 in Appendix 4 provide a list of typical project benefits by each climate
stressor needed to perform benefit analysis quantitatively on various types of projects The project design team should use these tables as a reference to identify appropriate project benefit categories for each climate stressor to perform benefit analysis on the project
e) Calculate benefits of recommended design interventions for each climate
stressor The input data and applicable project benefits can be assembled along with
incremental project cost data to analyze cost-effectiveness using the FEMA BCA Tool Damage-Frequency Assessment (DFA) module or similar software This analysis will provide a BCR for each alternative which can then be used to compare the alternatives that were developed to mitigate effects from applicable climate stressors The project design team can then use the results from this analysis to identify optimal interventions that provides a balanced solution that provides resiliency benefits within the available project budget
IIIE BCA METHODOLOGY FOR PROJECTS OVER $50 MILLION
[1 ndash (1 + DR) -(PUL)]DR
66 For example a NYC OMB March 2015 memorandum recommends using an annually updated DR as published each year in Appendix C of OMB Circular A-94 The current OMB-recommended discount rates from OMB A-94 Appendix C vary by project useful life and are as follows 21 DR for useful lives of 10 to 19 years 25 DR for useful lives of 20 to 29 years and 28 DR for useful lives of 30 years or greater By contrast FEMA hazard mitigation grants use a DR of 70 for all projects based on the Federal OMB A-94 rate for federally-funded mitigation measures Since these DRs will impact the PVC and the project benefits the project team must ensure that BCA results prepared using an OMB-recommended DR (21 to 28) be updated to reflect the Federal DR (70) when applying for FEMA mitigation grant funds
67 Note the data requirements for the sea level rise and increased precipitation hazards in Table 16 are more detailed than the requirements for the extreme heat hazards due to the less detailed level of analysis available for extreme heat
NYC Mayorrsquos Office of Recovery and Resiliency Climate Resiliency Design Guidelines
35
APPENDICES
NYC Mayorrsquos Office of Recovery and Resiliency Climate Resiliency Design Guidelines
36APPENDIX 1 ndash KEY TERMS
100-year flood (1 annual chance flood)
A flood that has a 1 probability of occurring in any given year The 100-year floodplain is the extent of the area of a flood that has a 1 chance of occurring or being exceeded in any given year
500-year flood (02 annual chance flood)
A flood that has a 02 probability of occurring in any given year The 500-year floodplain is the extent of the area of a flood that has a 02 chance of occurring or being exceeded in any given year
AdaptationAdjustment in natural or human systems to a new or changing environment that seeks to maximize beneficial opportunities or moderate negative effects Successful adaptations contribute to resiliency
Base flood elevation (BFE)The elevation of surface water resulting from a flood that has a 1 annual chance of occurring or being exceeded in any given year The BFE is shown on the Flood Insurance Rate Map (FIRM)69
BluebeltReference to the Department of Environmental Protectionrsquos (DEP) Bluebelt program to preserve natural drainage corridors including streams ponds and other wetland areas Preservation of these wetland systems allows them to perform their functions of conveying storing and filtering storm water
Climate
The average weather (or more rigorously a statistical description of the average in terms of the mean and variability) over a period of time usually 30 years These quantities are most often surface variables such as temperature precipitation and wind Climate in a wider sense is the state including a statistical description of the climate system70
Climate change
Changes in average weather conditions that persist over multiple decades or longer Climate change encompasses both increases and decreases in temperature as well as shifts in precipitation changing risk of certain types of severe weather events and changes to other variables of the climate system
Climate change riskThe chance that investments (such as in capital projects) can be affected by the physical impacts of climate change71 Risks are evaluated as a product of the probability of occurrence and the magnitude of damages or impacts including socioeconomic factors that would result if they did occur (consequences)
Climate change risk assessment
This assessment involves a detailed project-specific analysis that includes a vulnerability and risk assessment often followed by cost-benefit analysis to assess and select investments in climate change risk mitigation Risk is assessed as a function of the magnitude and probability of a given climate change hazard Examples resources are included in Appendix 7
Climate vulnerabilityThe degree to which systems and populations are affected by adverse impacts It is a function of the character magnitude and rate of climate change and variation to which a system is exposed its sensitivity and its adaptive capacity72
Cloudburst An extreme amount of rain in a short period of time often over a small geographic area73
Cooling Degree Day (CDD) A form of degree-day used to estimate the energy requirements for air conditioning or refrigeration when the daily mean temperature is above 65degF
68 All terms are from the US Global Change Research Program (USGCRP) glossary unless otherwise noted The USGCRP glossary is available at httpwwwglobalchangegovclimate-changeglossary
69 ldquoDefinitionsrdquo FEMA last modified March 1 2017 httpswwwfemagovnational-flood-insurance-programdefinitions70 UKCIP Glossary httpwwwukciporgukglossary71 ldquoAccount for Climate Riskrdquo International Finance Corporation 72 UKCIP Glossary httpwwwukciporgukglossary73 New York City Environmental Protection ldquoCloudburst Resiliency Planning Studyrdquo 2017 Available at httpwwwnycgovhtmldeppdfclimatenyc-cloudburst-studypdf
APPENDIX 1 - KEY TERMS68
NYC Mayorrsquos Office of Recovery and Resiliency Climate Resiliency Design Guidelines
37APPENDIX 1 ndash KEY TERMS
Design life The life expectancy of an asset or product as determined during design74 As opposed to useful life (see below)
Dry Bulb temperature The ambient air temperature measured by a thermometer
Extreme eventUnexpected unusual or unpredictable weather or flooding compared to historical or future projected distribution Extreme events include for example heat waves cold waves heavy rains periods of drought and flooding and severe storms
Facilities For the purposes of this document ldquofacilitiesrdquo refers to all types of buildings housing infrastructure structures and landscape features designed by or for the City of New York
Flexible adaptation pathwayResilience-building strategies that can evolve or be adapted over time as climate change risk assessments evaluations of adaptation strategies and monitoring continue75
Flood Insurance Rate Maps (FIRM)
Official flood map of a community on which FEMA has delineated the 1 annual chance floodplain and the base flood elevations (BFEs) applicable to the community76 The FIRM also includes the 02 floodplain annual chance floodplain and differentiates between special flood hazard areas (V A Coast A zones) and floodways The official FIRM is from the year 2007 while the 2015 PFIRM is currently required by NYC Building Code to calculate design flood elevations NYC DOB references the more restrictive of the two maps in both base flood elevation and flood hazard area (ie V versus A zone) Refer to Appendix 3 for more information
FreeboardAn additional amount of height above the base flood elevation used as a factor of safety (eg two feet above the base flood) in determining the level at which a facilitys lowest floor must be elevated or floodproofed to be in accordance with state or community floodplain management regulations77
Future time slices
Future periods defined by the NPCC for when climate change projections are available In this document the following decadal projections are associated with specific time spans2020s projection = present to 20392050s projection = 2040 to 20592080s projection = 2070 to 20992100s projection = end of century and beyond
Green infrastructureAn array of practices that use or mimic natural systems to manage urban stormwater runoff Water is either directed to engineered systems for infiltration or detained for longer periods before it enters the sewer system
Heat Vulnerability Index (HVI)Summarizes relative risk of adverse health effects from heat due to social and environmental factors Used to identify neighborhoods at higher risk during and after extreme heat events
Heat wave A period of three consecutive days where temperatures rise above 90degF or two consecutive days over 95 degrees78
New York City Panel on Climate Change (NPCC)
The body of leading climate and social scientists charged with making climate change projections for the metropolitan region79
74 Sustainable Infrastructure Management Program Learning Environment httpsimplewerforg 75 Rosenzweig C et al Climate Change Adaptation in New York City Building a Risk Management Response76 ldquoDefinitionsrdquo FEMA77 Ibid78 Horton R et al New York City Panel on Climate Change 2015 Report Chapter 1 Climate Observations and Projections Ann NY
Acad Sci ISSN 0077-8923 (New York 2015) 2579 For more information on the NPCC visit www1nycgovsiteorrchallengesnyc-panel-on-climate-changepage
NYC Mayorrsquos Office of Recovery and Resiliency Climate Resiliency Design Guidelines
38APPENDIX 1 ndash KEY TERMS
Open-grid pavement system
Pavements that consist of loose substrates supported by a grid of a more structurally sound grid or webbing Unbounded loose substrates in these systems transfer and store less heat than bound and compacted pavements and aid permeability Pavement is 50 pervious and contains vegetation in the open cells designed to allow percolation or infiltration of storm water through the surface into the soil below80
Preliminary Flood Insurance Rate Map (PFIRM)
Preliminary flood map developed by FEMA in 2015 for New York City that provides projected risks for flood hazards81 Refer to Appendix 3 for more information
Project useful life (PUL)
The period over which an asset or component is expected to be available for use by an entity This depends on regular and adequate maintenance This period of time typically exceeds the design life (see above) The combined effect of operational requirements and useful life is practical in assessing an investment in improving resilience82
Rain gardenAlso called ldquobioswalerdquo Planted areas designed to collect and manage stormwater that runs off streets sidewalks commercial and residential rooftops and other sources when it rains
Resiliency The ability to bounce back after change or adversity The capability of preparing for responding to and recovering from difficult conditions83
Sea level rise-adjusted design flood elevation
As defined in these Guidelines the increased height of the base flood elevation due to sea level rise plus freeboard depending on the criticality of the facility The sea level rise adjustment depends on the useful life of the facility
Storm surge An abnormal rise of water generated by a storm over and above predicted astronomical tides84
Substantial improvementAny repair reconstruction rehabilitation addition or improvement of a building or structure the cost which equals or exceeds 50 of the market value of the structure before the improvement or repairs started For more information see Appendix G of the NYC Building Code and 1 RCNY sect3606-0185
Tidal inundation Flooding which occurs at high tides due to climate-related sea level rise land subsidence andor the loss of natural barriers86
Urban Heat Island (UHI) effectThe tendency for higher air temperatures to persist in urban areas as a result of heat absorbed and emitted by buildings and asphalt tending to make cities warmer than the surrounding suburban and rural areas
Weather The state of the atmosphere at a given time with regard to temperature cloudiness precipitation wind and other meteorological conditions87
Wet Bulb temperatureThe temperature indicated when a thermometer bulb is covered with a water-saturated wick over which air is caused to flow at approximately 45 ms (900 ftmin) to reach the equilibrium temperature of water evaporating into the air when the heat of vaporization is supplied by the sensible heat of the air88
80 ldquoGlossaryrdquo US Green Building Council (2017) Available at httpwwwusgbcorgglossaryterm552581 ldquoPreliminary FEMA Map Productsrdquo FEMA Map Service Center Available at httpshazardsfemagovfemaportalprelimdownload82 ldquoGlossaryrdquo International Infrastructure Management Manual (2011) 83 A Stronger More Resilient New York (2013) 184 ldquoStorm Surge Overviewrdquo National Hurricane Center NOAA Available at httpswwwnhcnoaagovsurge85 ldquoFlood Resistant Constructionrdquo Appendix G New York City Building Code (2008) and 1 RCNY sect3606-01 available at httpswww1nycgovassetsbuildingsrules1_RCNY_3606-01pdf86 ldquoOcean Factsrdquo National Ocean Service NOAA Available at httpoceanservicenoaagovfactsnuisance-floodinghtml 87 UKCIP Glossary httpwwwukciporgukglossary88 ldquoASHRAE Terminologyrdquo ASHRAE Available at httpswwwashraeorgtechnical-resourcesauthoring-toolsterminology
NYC Mayorrsquos Office of Recovery and Resiliency Climate Resiliency Design Guidelines
39APPENDIX 2 - CLIMATE CHANGE PROJECTIONS
Climate change projections are provided by the New York City Panel on Climate Change (NPCC) The full NPCC report is available from the New York Academy of Sciences89 Tables 8-10 (below) were reproduced directly from the NPCC report while Table 2 (see Section IIA) was developed using the data underlying the NPCC report to inform the design of HVAC systems under warmer conditions
Table 8 ndash NYC sea level rise projections90
Baseline (2000-2004) 0 in
Low estimate (10th percentile)
Middle range (25th to 75th percentile)
High estimate (90th percentile)
2020s 2 in 4-8 in 10 in
2050s 8 in 11-21 in 30 in
2080s 13 in 18-39 in 58 in
2100 15 in 22-50 in 75 in
Note Projections are based on six-component approach that incorporates both local and global factors The model-based components are from 24 global climate models and two representative concentration pathways Projections are relative to the 2000-2004 base period
Table 9 ndash Mean annual changes91
a Temperature Baseline(1971-2000) 54degF
Low estimate (10th percentile)
Middle range (25th to 75th percentile)
High estimate (90th percentile)
2020s + 15degF +20-29degF +32degF
2050s +31degF +41-57degF +66degF
2080s +38degF +53-88degF +103degF
2100 +42degF +58-104degF +121F
b Precipitation Baseline(1971-2000) 501 in
Low estimate (10th percentile)
Middle range (25th to 75th percentile)
High estimate (90th percentile)
2020s -1 percent +1-8 +10
2050s +1 percent +4-11 +13
2080s +2 percent +5-13 +19
2100 -6 percent -1 to +19 +25
Note Based on 35 global climate models (GCMs) and two RCPs Baseline data cover the 1971ndash2000 base period and are from the NOAA National Climatic Data Center (NCDC) Shown are the low estimate (10th percentile) middle range (25th percentile to 75th percentile) and high estimate (90th percentile) These estimates are based on a ranking (from most to least) of the 70 (35 GCMs times 2 RCPs) projections The 90th percentile is defined as the value that 90 percent of the outcomes (or 63 of the 70 values) are the same or lower than Like all projections the NPCC climate change projections have uncertainty embedded within them Sources of uncertainty include data and modeling constraints the random nature of some parts of the climate system and limited understanding of some physical processes The NPCC characterizes levels of uncertainty using state-of-the-art climate models multiple scenarios of future greenhouse gas concentrations and recent peer-reviewed literature Even so the projections are not true probabilities and the potential for error should be acknowledged
89 The NPCC 2015 report is available at httponlinelibrarywileycomdoi101111nyas20151336issue-1issuetoc90 From New York City Panel on Climate Change 2015 Report Chapter 1 Climate Observations and Projections page 4191 From New York City Panel on Climate Change 2015 Report Chapter 1 Climate Observations and Projections page 30
APPENDIX 2 - CLIMATE CHANGE PROJECTIONS
NYC Mayorrsquos Office of Recovery and Resiliency Climate Resiliency Design Guidelines
40APPENDIX 2 - CLIMATE CHANGE PROJECTIONS
Table 10 ndash Extreme events92
2020s Baseline (1971-2000)
Low estimate(10th percentile)
Middle range(25th to 75th percentile)
High estimate (90th percentile)
Numbers of heat waves per year 2 3 3-4 4
Average heat wave duration (days) 4 5 5 5
Number of days per year with
Maximum temperature at or above 90degF 18 24 26-31 33
Maximum temperature at or above 100degF 04 07 1-2 2
Minimum temperature at or below 32degF 71 50 52-58 60
Rainfall at or above 1 inch 13 13 14-15 16
Rainfall at or above 2 inches 3 3 3-4 5
Rainfall at or above 4 inches 03 02 03ndash04 05
2050s Baseline (1971-2000)
Low estimate(10th percentile)
Middle range(25th to 75th percentile)
High estimate (90th percentile)
Numbers of heat waves per year 2 4 5-7 7
Average heat wave duration (days) 4 5 5-6 6
Number of days per year with
Maximum temperature at or above 90degF 18 32 39-52 57
Maximum temperature at or above 100degF 04 2 3-5 7
Minimum temperature at or below 32degF 71 37 42-48 52
Rainfall at or above 1 inch 13 13 14-16 17
Rainfall at or above 2 inches 3 3 4-4 5
Rainfall at or above 4 inches 03 03 03-04 05
2080s Baseline (1971-2000)
Low estimate(10th percentile)
Middle range(25th to 75th percentile)
High estimate (90th percentile)
Numbers of heat waves per year 2 5 6-9 9
Average heat wave duration (days) 4 5 5-7 8
Number of days per year with
Maximum temperature at or above 90degF 18 38 44-76 87
Maximum temperature at or above 100degF 04 2 4-14 20
Minimum temperature at or below 32degF 71 25 30-42 49
Rainfall at or above 1 inch 13 14 15-17 18
Rainfall at or above 2 inches 3 3 4-5 5
Rainfall at or above 4 inches 03 02 03-05 07
Note Projections for temperature and precipitation are based on 35 GCMs and 2 RCPs Baseline data are for the 1971 to 2000 base period and are from the NOAA National Climatic Data Center (NCDC) Shown are the low estimate (10th percentile) middle range (25th to 75th percentile) and high estimate (90th percentile) 30-year mean values from model-based outcomes Decimal places are shown for values less than one although this does not indicate higher precisioncertainty Heat waves are defined as three or more consecutive days with maximum temperatures at or above 90degF Like all projections the NPCC climate change projections have uncertainty embedded within them Sources of uncertainty include data and modeling constraints the random nature of some parts of the climate system and limited understanding of some physical processes The NPCC characterizes levels of uncertainty using state-of-the-art climate models multiple scenarios of future greenhouse gas concentrations and recent peer-reviewed literature Even so the projections are not true probabilities and the potential for error should be acknowledged
92 From New York City Panel on Climate Change 2015 Report Chapter 1 Climate Observations and Projections page 31
NYC Mayorrsquos Office of Recovery and Resiliency Climate Resiliency Design Guidelines
41APPENDIX 3 - DIFFERENTIATION OF FLOOD MAPS
These Guidelines reference several different kinds of flood maps and sources of design flood elevations These maps are described and differentiated below
Table 11 - Differentiation of flood maps used in NYC
Reference Title Data Source Information Provided Referenced By Link
2007 FIRM FEMA
Based on historical data from before 1983 identifies the current base flood (extent and elevation) as the flood that has a 1 chance of occurring in any given year also known as a 100-year flood The NYC Building Code requires that either the 2007 FIRM or 2015 PFIRM elevation be used whichever is higher
2014 NYC Building Code Appendix G
Climate Resiliency Design Guidelines
httpsmscfemagovportal
2015 PFIRM FEMA
Based on historical data identifies the current base flood (extents and elevation) as the flood that has a 1 chance of occurring in any given year also known as a 100-year flood The NYC Building Code requires that either the 2007 FIRM or 2015 PFIRM elevation be used whichever is higher The 2015 PFIRM is currently being reassessed by FEMA
2014 NYC Building Code Appendix G
Climate Resiliency Design Guidelines
httpshazardsfemagovfemaportalprelimdownload
httpwwwregion2coastalcomview-flood-maps-dataview-preliminary-flood-map-data
NYC Flood Hazard Mapper
NYC Department of City Planning
Maps current and future flood hazards in NYC including the following data layers 2007 FIRM and 2015 PFIRM high tide with sea level rise and PFIRM with sea level rise through 2100
Climate Resiliency Design Guidelines
Waterfront Revitalization Plan
httpwww1nycgovsiteplanningdata-mapsflood-hazard-mapperpage
ldquoTable 4 ndash Determine the sea level rise-adjusted design flood elevation for critical and non-critical facilitiesrdquo
ORR amp NPCC
Provides data to use when adding sea level rise to a given 2015 PFIRM or 2007 FIRM Base Flood Elevation (BFE) to calculate a Design Flood Elevation (DFE) Based on the criticality and expected useful life of a facility
Climate Resiliency Design Guidelines
See Section II on ldquoSea Level Riserdquo above
APPENDIX 3 - DIFFERENTIATION OF FLOOD MAPS
NYC Mayorrsquos Office of Recovery and Resiliency Climate Resiliency Design Guidelines
42APPENDIX 4 - PROJECT BENEFITS CATEGORIES
This appendix provides guidance on how to identify and assess benefits as a supplement to Sections IIID and IIIE
Table 12 lists typical direct benefits for reducing impacts from climate stressors and basic guidance for how to estimate them See Section IIID for more information
Table 13 lists typical indirect benefits for reducing impacts from climate stressors and basic guidance for how to estimate them See Section IIID for more information
Table 12 ndash Direct benefits for (1) sea level rise with coastal storm surge and (2) increased precipitation measures
Direct Benefit Basic Guidance for Estimating Values
Physical Damages (Structure Contents)
bull For flood-damaged buildings use depth damage functions developed by FEMA and USACE for structures and contents
bull Use depth damage functions in conjunction with Building Replacement Values (BRVs) and not market values BRVs typically range between $100 to $325SF for residential buildings and $120 to $450SF for commercial public buildings
bull For more complex structures or facilities use engineering estimates of flood damages or review historic flood damages documented from insurance claims repair records or FEMA Public Assistance claims from recent flood disasters
Residential Displacements
bull For flood-damaged buildings use depth damage functions developed by FEMA and USACE for residential displacements
Reduced Life CycleOperation and Maintenance (OampM) Costs93
bull Applicable only to projects that reduce overall life cycle costs or net annual OampM costs from baseline conditions
bull Input reduced annual OampM costs as a project benefit at a 1-year recurrence intervalbull Reduced overall life cycle costs can be input as a longer project useful life
Table 13 ndash Indirect benefits for (1) sea level rise with coastal storm surge and (2) increased precipitation measures
Indirect Benefit Basic Guidance for Estimating Values
Non-Residential Building Service Losses
bull Estimate service loss values and durations for non-residential buildings public buildings critical facilities and parksnatural features based on FEMA BCA guidance and standard values based on building use
Utility Service Losses94
bull Estimate utility service losses for water wastewater and electrical facilities based on the number of impacted customers FEMA per capita standard values for utility service ($105personday for potable water $49personday for wastewater $148personday for electrical)95
bull Estimate utility service loss durations based on engineering estimates or review historic flood damages losses documented from utility company records
bull This benefit can also apply to measures that increase energy efficiency
RoadBridge Service Losses
bull Estimate roadbridge service losses based on the average daily traffic (ADT) detour time and additional travel distance and FEMA and GSA standard values for road service ($3344vehiclehour of delay $0545mile)96
bull Estimate roadbridge service loss durations or review historic flood damages losses
Emergency Service Losses
bull Applicable only to projects that reduce or eliminate documented emergency service costs from baseline conditions
bull Examples of avoided emergency services costs include NYPD staffing to monitor barricades for flooded roads or NFDY staffing for water rescues of residents from flooded buildings or streets
APPENDIX 4 - PROJECT BENEFITS CATEGORIES
93 Reduced life cycle costs may be applicable to some measures that provide extreme heat benefits such as green roofs that can last longer than a standard roof if properly maintained
94 Reduced utility service costs may be applicable to some measures that provide extreme heat benefits such as cool roofs green roofs and shade trees
95 FEMA per capita standard values taken from FEMA BCA Toolkit Version 530 (Build Date 12222016) and developed in FEMArsquos Baseline Standard Economic Value Methodology Report (July 28 2016) Consider updating FEMA standard per capita values to reflect current New York City utility rates
96 Consider updating FEMA and GSA standard values to reflect current New York City area labor rates and fuel costs
NYC Mayorrsquos Office of Recovery and Resiliency Climate Resiliency Design Guidelines
43APPENDIX 4 - PROJECT BENEFITS CATEGORIES
Table 14 ndash Other potential benefits for (1) sea level rise with coastal storm surge and (2) increased precipitation measures
Other Benefit Basic Guidance for Estimating Values
Avoided Stress and Anxiety
bull Applicable only for projects that directly benefit occupants of residential structuresbull Use FEMA standard value for avoided mental stress and anxiety treatment costs of $2443person to
estimate benefit for all impacted residents97
Avoided Lost Productivity
bull Applicable only for projects that directly benefit occupants of residential structuresbull Use FEMA standard value for avoided lost worker productivity costs of $8736household to estimate
benefit for all impacted workers (conservatively assuming one worker per household)
Environmental Open Space
bull Applicable only for projects that create or acquire open space areas by acquisitionbull Use FEMA standard value for environmental open space based on the type of land acquired ($8308
Acreyear for Green open space $39545Acreyear for Riparian $6010Acreyear for Wetlands $554Acreyear for Forests $1799Year for Marine and estuary)97
CSO Volume Reduction
bull Applicable only for projects that provide Combined Sewer Overflow (CSO) abatement by reducing the volume of rainfall runoff
bull Use CSO abatement cost of $0015gallonsyear applied to increased precipitation hazard runoff volume for 5-year design storm98
Ecosystem Service99
bull Add stormwater management benefits of green infrastructure projects to increased precipitation hazards where avoided damages and service losses are not quantified
bull Unit benefits applicable to increased precipitation hazard includeo Green roofs $0133SFyear (PUL 40 years)o BioswaleRain GardenMeadow Mix $0020SFyear (PUL 30 years)o Permeable Grass Pavers $0020SFyear (PUL 30 years)o Tree Plantings $303Treeyear (PUL 30 years)o Planter Box Trees $101Treeyear (PUL 15 years)
Real Estate99
bull Potential real estate benefits from increased resilience of residential andor commercial propertiesstreetscapesneighborhoods included within the project scope
bull Benefit applied to extreme heat hazard for green infrastructure projects directly impacting residential or commercial properties
Quality of Life Health Benefits99
bull Potential quality of life benefits related to improved public health from the resilience measures included within the project scope
bull Benefit applied to extreme heat hazard for green infrastructure projects directly impacting residential or commercial properties
Table 14 lists other typical benefits for reducing impacts from climate stressors and basic guidance for how to estimate them See Section IIID for more information
97 FEMA standard values for avoided mental stress and anxiety and environmental open space values taken from FEMA BCA Toolkit Version 530 (Build Date 12222016)
98 CSO abatement cost taken from APG1 Report for NYC ldquoTechnical Approaches for Benefit-Cost Analysis of Hazard Mitigation Projects in Urban and Coastal Environmentsrdquo (April 2016)
99 Ecosystem Services Real Estate and Quality of LifeHealth benefits tend to be more applicable to green infrastructure measures that provide extreme heat benefits such as green roofs trees and other plantings
NYC Mayorrsquos Office of Recovery and Resiliency Climate Resiliency Design Guidelines
44APPENDIX 4 - PROJECT BENEFITS CATEGORIES
Table 15 ndash Potential benefits for extreme heat (Urban Heat Island) reduction measures
Category Benefit Basic Guidance for Estimating Values
Direct Benefit
Reduced Life Cycle Cost
bull Applicable only to measures such as green roofs that are expected to last longer than standard roofs
bull Compute total cost savings including annual OampM costs
Indirect Benefit
Energy Savings
bull Applicable to measures that reduce energy costs by providing cooling through increased shading andor evapotranspiration
bull Use New York Power Authority rates of $0148kWh for electricity and $0810Therm for natural gas
Other Potential Benefits
Air Quality bull Applicable to measures that absorb pollutants andor reduce carbon dioxide emissions
Acoustics bull Applicable to measures such as green roof or walls that reduce noise transfer
Quality of LifeHealth bull Potential quality of life benefits and related to improved public health
Real Estate bull Applicable to measures that provide residential real estate benefits from increased resilience of propertiesstreetscapesneighborhoods
Retail Sales Marketing
bull Applicable to measures that provide commercial property benefits from increased aesthetics resulting in increased marketing and sales for streetscapesneighborhoods
Tax Credits Incentives
bull Applicable to resilience or green infrastructure measures such as green roofs that have accompanying Federal State or City tax credits or other incentives
Table 15 lists potential benefits for reducing impacts from heat and basic guidance for how to estimate them See Section IIID for more information
NYC Mayorrsquos Office of Recovery and Resiliency Climate Resiliency Design Guidelines
45APPENDIX 4 - PROJECT BENEFITS CATEGORIES
Table 16 ndash Guidance on quantitative calculations for (1) sea level rise with coastal storm surge and (2) increased precipitation measures
Data Input General Guidance ndash Basic Description
Applicable Benefit Category
Applicable Typical Facility Typology
Dire
ct B
enefi
ts
Indi
rect
Ben
efits
Oth
er P
oten
tial
Ben
efits
Bui
ldin
g St
ruct
ures
Com
plex
Fa
cilit
ies
Tran
spor
tatio
nSt
reet
scap
es
Plaz
as
Park
Fea
ture
s
First Floor Elevation (FFE)
bull The elevation of the first finished floor of the structure excluding basements
bull FFE measured from top of lowest floor (riverinenon-coastal high hazard areas) or bottom of lowest horizontal structural member (coastal high hazard areas)
Y Y Y Y
Building Replacement Value (BRV)
bull The unit cost to rebuild a structure of the same quality of construction
bull Not the same as market value
Y Y Y Y
Building Size
bull The total floor area of the building in square feet
bull Total Building Value = BRV x Building Sizebull Typical BRVs for NYC range between $100 to
$325SF for residential buildings and $120 to $450SF for commercialpublic buildings
Y Y Y Y
Structure Description
bull The type of building number of stories and foundation type (full basement partial basement no basement)
bull Collect more detailed foundation data for coastal flood zones
Y Y Y Y
Building Use bull Details related to residential housing commercial business and public use
Y Y Y Y Y
Building Type bull The primary use of building ndash residential commercial public and others
Y Y Y Y Y
Depth Damage Function (DDF)
bull Curves used to estimate structure damage contents damage and displacement of residential buildings based on flood depth
bull DDFs selection based on Structure Description Building Type Building Use
bull Structure DDFs based on percentage of Total Building Value
bull Contents DDFs based on percentage of Total Contents Value
bull Displacement DDFs based on number of displacement days x Displacement Cost
Y Y Y Y Y
Contents Value
bull The cost to replace structure contents (furnishings equipment)
bull Residential building Contents Values typically 50 BRV (FEMA DDFs) or 100 BRV (USACE DDFs)
bull Non-residential building Contents Values between 18 to over 100 depending on building use (USACE DDFs)
bull Total Contents Value = BRV x Building Size
Y Y Y Y Y
Table 16 provides general guidance on how to quantitatively calculate benefits from efforts to address from climate stressors See Section IIIE for more information
NYC Mayorrsquos Office of Recovery and Resiliency Climate Resiliency Design Guidelines
46APPENDIX 4 - PROJECT BENEFITS CATEGORIES
Table 16 ndash Guidance on quantitative calculations for (1) sea level rise with coastal storm surge and (2) increased precipitation measures
Data Input General Guidance ndash Basic Description
Applicable Benefit Category
Applicable Typical Facility Typology
Dire
ct B
enefi
ts
Indi
rect
Ben
efits
Oth
er P
oten
tial
Ben
efits
Bui
ldin
g St
ruct
ures
Com
plex
Fa
cilit
ies
Tran
spor
tatio
nSt
reet
scap
es
Plaz
as
Park
Fea
ture
s
Number of Residents (Residential)
bull Total number of occupants in a residential building
bull Typically estimated based on number of residential units x average number of individuals per household (based on current US Census data or use 25 individuals per household as a default)
Y Y Y Y Y
Displacement Cost (Residential)
bull The unit cost to lodge and feed displaced residents while flood damage is repaired
bull Average unit displacement cost of $415residential unitday recommended based on current FY2018 GSA Per Diem rates for New York City
Y Y Y Y Y
Value of Service (Non-Residential and Public)
bull The unit cost of service disruption and rental of temporary facilities while flood damage is repaired
bull Disruption costs for non-residential buildings typically range from $095 to $136SFmonth and rental costs range from $020 to $136SFmonth depending on building use
bull Value of service for public buildings ($day) is typically based on the annual operating budget for the City agency using the building prorated based on building size or population served by the building then divided by 365 daysyear
Y Y Y Y
Value of Service (Critical Facilities)
bull The unit cost of critical facilities (police fire emergency medical services) lost or delayed while flood damage is repaired
Y Y Y
Value of Service Duration
bull The duration of service disruption and rental of temporary facilities for non-residential buildings and critical facilities while flood damage is repaired
bull For non-residential buildingso Value of Service Durations vary from
4 months to over 30 months based on building use and the depth of flooding
o Total Value of Service Loss = (Disruption Cost x Building Area) = (Rental Cost x Building Area x Value of Service Duration)
bull For public buildings and critical facilitieso Value of Service Durations vary from 0
days to 720 months based on building use and the depth of flooding from FEMA FIA or USACE DDFs
o Total Value of Service Loss = (Value of Service) x (Service Loss Duration)
Y Y Y
NYC Mayorrsquos Office of Recovery and Resiliency Climate Resiliency Design Guidelines
47APPENDIX 4 - PROJECT BENEFITS CATEGORIES
Table 16 ndash Guidance on quantitative calculations for (1) sea level rise with coastal storm surge and (2) increased precipitation measures
Data Input General Guidance ndash Basic Description
Applicable Benefit Category
Applicable Typical Facility Typology
Dire
ct B
enefi
ts
Indi
rect
Ben
efits
Oth
er P
oten
tial
Ben
efits
Bui
ldin
g St
ruct
ures
Com
plex
Fa
cilit
ies
Tran
spor
tatio
nSt
reet
scap
es
Plaz
as
Park
Fea
ture
s
Engineering Estimates for Damages
bull Engineered estimate models of physical damages and service losses at the project site based on the Guidelines event recurrence interval(s) and flood depth(s)
Y Y Y Y Y Y
Historic Damages and Service Losses
bull Historic physical damages and service losses at the project site documented from previous flood events
bull Do not use routine maintenancebull The historic damage event recurrence interval
(RIs) andor flood depths must be determined updated for inflation to the present value and adjusted to match the Guidelines event RIsflood depths
Y Y Y Y Y Y
Facility Replacement Value
bull The unit cost to rebuild the facility
Impacted Area bull The geographic area impacted by the facility in the event of failure in acres
Y Y Y Y
Facility Capacity
bull The design capacity of the facilitybull For example - facility capacity expressed in
millions of gallons per day (MGD) for water and wastewater facilities or megawatts (MW) for electrical facilities
Y Y Y Y
Service Population
bull The number of impacted residents served by the facility
bull Typically estimated based on number of impacted residential customers x average number of individuals per household (based on current US Census data or use 25 individuals per household as a default)
bull Facilities serving mostly non-residentialpublic buildings andor critical facilities should focus on service losses rather than service population
Y Y Y
NYC Mayorrsquos Office of Recovery and Resiliency Climate Resiliency Design Guidelines
48APPENDIX 4 - PROJECT BENEFITS CATEGORIES
Table 16 ndash Guidance on quantitative calculations for (1) sea level rise with coastal storm surge and (2) increased precipitation measures
Data Input General Guidance ndash Basic Description
Applicable Benefit Category
Applicable Typical Facility Typology
Dire
ct B
enefi
ts
Indi
rect
Ben
efits
Oth
er P
oten
tial
Ben
efits
Bui
ldin
g St
ruct
ures
Com
plex
Fa
cilit
ies
Tran
spor
tatio
nSt
reet
scap
es
Plaz
as
Park
Fea
ture
s
Value of Service
bull Unit value of service provided by the facilitybull Example of FEMA standard values for complete
loss of utility service $105personday for potable water$49personday for wastewater$148personday for electrical
bull Consider updating FEMA standard per capita values to reflect current The New York City utility rates
Y Y
Roadway Elevations bull Roadway Elevations
Y Y
Roadway Replacement Value
bull Roadway Replacement ValueY Y
Inundation Area Map
bull Inundation Area Map developed by FEMA or through modeling by project design team
Y Y Y
Building Inventory of Inundation Area
bull The number and type of buildings within the streetscape and neighborhood inundated by the Guidelinersquos flood events
Y Y Y
Average Daily Traffic (ADT)
bull The average number of one-way traffic trips per day along the roadway(s) within the streetscapeneighborhood inundated by the Guidelinersquos flood events
Y Y
Additional Travel Time
bull The additional travel time needed to detour around a flooded roadway expressed in minutes
bull In the unlikely event there is no detour available use a 12-hour travel time per one-way trap but provide a detailed area street map as supporting documentation
Y Y
Value of Traffic Delay
bull The value of service associated with lost time in traffic
bull For example - FEMA standard average value of $3344vehiclehour of delay
bull Consider updating FEMA and GSA standard values to reflect current New York City area labor rates and fuel costs
Y Y
NYC Mayorrsquos Office of Recovery and Resiliency Climate Resiliency Design Guidelines
49APPENDIX 4 - PROJECT BENEFITS CATEGORIES
Table 17 ndash Guidance on quantitative unit benefit calculations for extreme heat hazard measures
Measure General Guidance ndash Unit Benefit Information and Data Requirements
Applicable Benefit Category
Applicable Typical Facility Typology
Dire
ct B
enefi
ts
Indi
rect
Ben
efits
Oth
er P
oten
tial
Ben
efits
Bui
ldin
g St
ruct
ures
Com
plex
Fa
cilit
ies
Tran
spor
tatio
nSt
reet
scap
es
Plaz
as
Park
Fea
ture
s
Green Roof
bull Unit benefit range over PUL = $470SF to $373SF of green roof area ($719SF standard value)
bull Assumed PUL = 40 yearsbull Apply standard value unit benefit to green
roof area to estimate measure benefitbull Higher range values more applicable
to residential and commercial building streetscape projects
Y Y Y Y Y Y
Bioswale Rain Garden Meadow Mix
bull Unit benefit range over PUL = $396SF to $211SF of area ($730SF standard value)
bull Assumed PUL = 30 yearsbull Apply standard value unit benefit to bioswale
rain gardenmeadow mix area to estimate total measure benefit
Y Y Y Y Y Y
Cool Roof
bull Unit benefit range over PUL = $117 to $3151SF of material area ($144SF standard value)
bull Assumed PUL = 20 yearsbull Apply standard value unit benefit to cool roof
area to estimate total measure benefitbull Higher range values more applicable to
residential building streetscape projects
Y Y Y Y Y
Light-Colored PaversLight-Colored Materials
bull Unit benefit range over PUL = $0774 to $204SF of material area ($0866SF standard value)
bull Assumed PUL = 30 yearsbull Apply standard value unit benefit to material
area to estimate total measure benefit
Y Y Y Y
Table 17 provides general guidance on how to quantitatively calculate benefits from efforts to address climate stressors See Section IIIE for more information
NYC Mayorrsquos Office of Recovery and Resiliency Climate Resiliency Design Guidelines
50APPENDIX 4 - PROJECT BENEFITS CATEGORIES
Table 17 ndash Guidance on quantitative unit benefit calculations for extreme heat hazard measures
Measure General Guidance ndash Unit Benefit Information and Data Requirements
Applicable Benefit Category
Applicable Typical Facility Typology
Dire
ct B
enefi
ts
Indi
rect
Ben
efits
Oth
er P
oten
tial
Ben
efits
Bui
ldin
g St
ruct
ures
Com
plex
Fa
cilit
ies
Tran
spor
tatio
nSt
reet
scap
es
Plaz
as
Park
Fea
ture
s
Tree Planting
bull Unit benefit range over PUL = $1005 to $77154Tree ($1855Tree standard value)
bull Assumed PUL = 30 yearsbull Apply standard value unit benefit to number of
trees to estimate total measure benefitbull Higher range values more applicable
to residential and commercial building streetscape projects
Y Y Y Y Y Y
Planter Box Tree
bull Unit benefit range over PUL = $212 to 16304Tree ($392Tree standard value)
bull Assumed PUL = 15 yearsbull Apply standard value unit benefit to number of
trees to estimate total measure benefitbull Higher range values more applicable
to residential and commercial building streetscape projects
Y Y Y Y Y
Shade Canopy
bull Unit benefit range over PUL = $0363 to $396SF ($0458SF standard value)
bull Assumed PUL = 15 yearsbull Apply standard value unit benefit to area of
shade canopy estimate total measure benefitbull Higher range values more applicable
to residential and commercial building streetscape projects
Y Y Y Y
Permeable Grass Pavers
bull Unit benefit range over PUL = $0258SF to $0521SF of pavers ($0363SF standard value)
bull Assumed PUL = 30 yearsbull Apply standard value unit benefit to paver
area to estimate total measure benefit
Y Y Y Y Y
For the purposes of the BCA refer to the following facility typologies bull ldquoBuilding Structuresrdquo include critical small building sites such as EMS or FDNY stations and non-critical small building sites such as
libraries or comfort stationsbull ldquoComplex Facilitiesrdquo include critical infrastructure such as wastewater treatment sites pump stations water filtration plants and similar
large or complex facilitiesbull ldquoTransportationStreetscapePlazasrdquo include roadway reconstruction streetscape improvements street raising plazas and other
transportation-related infrastructurebull ldquoPark Featuresrdquo include parks and similar public recreational facility with natural landscape features
NYC Mayorrsquos Office of Recovery and Resiliency Climate Resiliency Design Guidelines
51APPENDIX 5 - EXAMPLE PLANNING DECISION TREE
This decision tree provides a summarized example approach for how to implement these Guidelines Projects with a total cost greater than $50 million are recommended to conduct a full qualitative and quantitative climate change risk assessment and BCA while projects below $50 million are recommended to conduct a qualitative risk assessment and BCA
Define Project
1) Operational goals and criticality level2) Useful life3) Location in the current flood plain future floodplain and or zone
of tidal inundation and the project arearsquos score on the heat vulnerability index
Evaluate Project Risks According to Probability and Magnitude of Consequence
bull Extreme Heat bull Precipitationbull Sea Level Risebull Coastal Surge
High Level Identification and Assessment of Risk Mitigation Alternatives and Co-benefits
(qualitative)
Detailed Identification and Assessment of Risk Mitigation Alternatives and Co-benefits (qualitative and quantitative)
High Level Estimate of Costs and Benefits of Design Alternatives
(qualitative)
Detailed Estimate of Costs and Benefits of Design Alternatives
(qualitative and quantitative)
Decision Point Which climate change risks require mitigation
Decision Point Evaluate risk mitigation benefits and costs to
determine final resilient design alternative or if no action is required
Decision Point Is the total project cost above $50 million
Below $50 million Above $50 million
APPENDIX 5 - EXAMPLE PLANNING DECISION TREE
NYC Mayorrsquos Office of Recovery and Resiliency Climate Resiliency Design Guidelines
52
Project Title
Design Strategies Checklist (not exhaustive)
Extreme Heat Comments Extreme Precipitation Comments Sea Level Rise amp Storm Surge Comments
Select Site in Low Heat Vulnerability Index area Select High Elevation Site Select High Elevation Site
Minimize East-West Building Orientation Green Roof Raise Building Floor Elevation
Passive Solar Cooling and Ventilation Systems
Protect Below Grade Areas from Flooding Waterproof Building Envelope
Cool Roof (SRI appropriate) On-site Stormwater Management (gray) Elevate Critical Building Functions
Green Roof (extensive) Reduce Impervious Areas Elevate Critical Equipment
Vegetative Structures Permeable Pavement Perimeter Floodwall100 Levee (passive or active)
Enhanced HVAC System including space layout optimization and system scalability
Increase Green Spaces and Planted Areas DryWet Floodproofing
More Efficient Building Envelope Other Utility Redundancy Design101
Parking Lot Shading Resilient Materials amp Landscape Treatments
Light Colored Pavements (appropriate SRI) Design for Storm Surge Outflow
Increase Planted Areas Install Backwater Flow Prevention
Permeable Surfaces Design for Scour
Open-grid Pavement Raise Road Elevation
Other Other
This appendix provides a template for identifying possible design strategies to address climate change risks as described throughout the Guidelines
APPENDIX 6 - DESIGN STRATEGIES CHECKLIST
100 Permanent perimeter flood walls are not permitted to meet floodproofing requirements in buildings with substantial improvements andor damages 101 Utility redundancy design should be pursued for critical systems not all building systems
APPENDIX 6 - DESIGN STRATEGIES CHECKLIST
NYC Mayorrsquos Office of Recovery and Resiliency Climate Resiliency Design Guidelines
53APPENDIX 7 - CLIMATE CHANGE RISK ASSESSMENT RESOURCES
These Guidelines provide data on climate change hazards and recommend how that data can inform resilient design A risk assessment is a tool to help project managers and designers evaluate risk levels as well as select and prioritize resilient design strategies A high level risk assessment is recommended for all City capital projects with a total cost of under $50 million Projects above $50 million are recommended to conduct an in-depth assessment
Risk assessments use quantified estimates of the probability and magnitude of consequence of an event occurring to prioritize responses ldquoProbabilityrdquo is an assessment of the likelihood of a hazard occurring while ldquomagnituderdquo describes the hazardrsquos potential impact Risk assessment tools such as the examples listed below can be used to define and score these categories Projects that score higher across both probability and magnitude can be prioritized for investment and risk mitigation action Projects that score lower across both criteria may require no action beyond meeting code The results are typically charted on a risk matrix and an example is provided on the next page
The climate change risk management frameworks below offer templates for how to integrate climate change projections into a risk assessment process Refer to these resources for examples and further information
bull Vulnerability Assessment and Adaptation Framework is prepared by the Federal Highway Administration (FHWA) While developed for transportation planning this risk assessment framework has broad applicability for evaluating asset vulnerability to climate change Available at httpswwwfhwadotgovenvironmentsustainabilityresilienceadaptation_framework
bull US Climate Resilience Toolkit The US Global Change Research Program offers a step by step risk assessment
framework including tools and case studies at httpstoolkitclimategovsteps (see example on next page)
bull Coast Adapt Guidance on undertaking a risk assessment High level assessment httpscoastadaptcomausitesdefaultfilesfactsheetsT3M4_2_2nd_pass_risk_assessmentpdfDetailed assessment httpscoastadaptcomausitesdefaultfilesfactsheetsT3M4_3_3rd_pass_risk_assessmentpdf
bull Climate adaptation Risk uncertainty and decision-makingDownload the report here httpswwwukciporgukpublicationsRisk
The City plans to develop a NYC-specific process for integrating climate change data into existing risk management processes by April 2019
APPENDIX 7 - CLIMATE CHANGE RISK ASSESSMENT RESOURCES
NYC Mayorrsquos Office of Recovery and Resiliency Climate Resiliency Design Guidelines
54APPENDIX 7 - CLIMATE CHANGE RISK ASSESSMENT RESOURCES
The Risk Characterization Matrix below is an example from the US Climate Resilience Toolkit This tool can be used to assess the probability and magnitude of impact for identified risks The risk of coincident climate stressorsrisks (such as storm surge plus increased precipitation) can also be assessed as applicable
Figure 14 - Example of a climate change risk matrix (adapted from US Climate Resilience Toolkit)
Project teams can determine the magnitude of the impact (along the horizontal scale of 1 through 3 with 3 being the most severe) and the probabilitylikelihood of occurrence for each specific risk (along the vertical scale with 3 being the most likely) A score is typically assigned for each risk (Probabil-ity x Magnitude) and then charted on the matrix Based on the estimated probability and magnitude of consequence above the risks are ranked and prioritized for mitigation Factors to bear in mind include
bull Not all facility typologies have the same level of functional and operational importance during events or tolerance for disruption
bull Not all climate stressors and risks have the same level of impact on each project sitebull Not all identified risks can or should be mitigated fully
NYC Mayorrsquos Office of Recovery and Resiliency Climate Resiliency Design Guidelines
55WORKS CITED
A Stronger More Resilient New York PlaNYC Report of the NYC Special Initiative for Rebuilding and Resiliency The City of New York 2013
ldquoAccount for Climate Riskrdquo International Finance Corporation accessed March 27 2017 httpwwwifcorgwpswcmconnectTopics_Ext_ContentIFC_External_Corporate_SiteClimate+Business
PrioritiesAccount+for+Climate+Risk
American Society of Heating Refrigeration and Air-Conditioning Engineers (ASHRAE) Handbook -Fundamentals 2017
ldquoBaseline Standard Economic Value Methodology Reportrdquo Federal Emergency Management Agency July 2016
Benefit Cost Analysis Toolkit Software Version 530 Federal Emergency Management Agency (build date December 2016)
Criteria for Detention Facility Design New York City Department of Environmental Protection November 2012
Community Resilience Planning Guide for Buildings and Infrastructure Systems Vol 1 NIST Special Publication 1190 US Department of Commerce 2016
Cool and Green Roofing Manual NYC Department of Design and Construction 2007 httpwwwnycgovhtmlddcdownloadspdfcool_green_roof_manpdf
Building Resiliency Task Force US Urban Green Building Council New York 2013 httpurbangreencouncilforcecomBuildingResiliency
Design and Planning for Flood Resiliency Guidelines for NYC Parks New York City Department of Parks and Recreation 2017
httpswwwnycgovparksorgplanning-and-buildingplanningresiliency-plansflood-resiliency
Flooded Bus Barns and Buckled Rails Federal Transit Administration Office of Budget and Policy 2011 httpswwwhsdlorgabstractampdid=685187
Floodproofing Non-Residential Buildings FEMA P936 FEMA 2013 httpswwwfemagovmedia-library-data9a50c534fc5895799321dcdd4b6083e7P-936_8-20-13_508rpdf
ldquoGlossaryrdquo International Infrastructure Management Manual National Asset Management Support Group New Zealand 2011 httpwwwipweaorg
ldquoGreen Roof Metrics Draft Reportrdquo New York City Department of Parks and Recreation 2017
ldquoGuide to Rain Event Preparednessrdquo NYC Department of Environmental Protection httpwwwnycgovhtmldeppdfbrochuresflood-preparedness-flyerpdf
ldquoGuidelines and Discount Rates for Benefit-Cost Analysis of Federal Programsrdquo Appendix C Circular A-94 US Office of Management and Budget (OMB) 2017
ldquoGuidelines for the Design and Construction of Stormwater Management Systemsrdquo New York City Department of Environmental Protection July 2012
Horton R et al New York City Panel on Climate Change 2015 Report Ann NY Acad Sci ISSN 0077-892 New York 2015
Madrigano J et al ldquoA case-only study of vulnerability to heat wavendashrelated mortality in New York City (2000ndash2011)rdquo Environmental Health Perspectives 123672ndash678 2013
WORKS CITED
NYC Mayorrsquos Office of Recovery and Resiliency Climate Resiliency Design Guidelines
56WORKS CITED
enspMcGregor et al Two Degrees The Built Environment and Our Changing Climate Routledge Press 2013
NYC Green Codes Task Force US Green Building Council New York 2010 httpurbangreencouncilorgGreenCodes
NYCrsquos Risk Landscape A Guide to Hazard Mitigation NYC Emergency Management 2014
One New York The Plan for a Strong and Just City The City of New York 2015 httpwwwnycgovhtmlonenyc downloadspdfpublicationsOneNYCpdf
Ready to Respond Strategies for Multifamily Building Resilience Enterprise Green Communities 2015 httpswwwenterprisecommunityorgresources
Rosenzweig C et al Climate Change Adaptation in New York City Building a Risk Management Response New York City Panel on Climate Change 2010
httponlinelibrarywileycomdoi101111nyas20101196issue-1 issuetoc
ldquoSustainable Infrastructure Management Program Learning Environmentrdquo Water Environment Research Foundation accessed March 24 2017 httpsimplewerforg
Urban Waterfront Adaptive Strategies NYC Department of City Planning 2013 httpwww1nycgovsiteplanningplanssustainable-communitiesclimate-resiliencepagetab=1
Wastewater Resiliency Plan Climate Risk Assessment and Adaptation Study New York City Department of Environmental Protection October 2013
NYC Mayorrsquos Office of Recovery and Resiliency Climate Resiliency Design Guidelines
8IE PROJECT-SPECIFIC CONSIDERATIONS
any studies have been conducted that could inform design (eg local flood modeling with sea level rise) This may inform the climate change risk assessment or provide insights into site specific conditions and design options A map that catalogs NYC resiliency projects is located here httpsmapsnycgovresiliency
bull Agency-specific resiliency design standards refer also to resiliency guidelines provided by various City agencies (eg Parkrsquos Design and Planning for Flood Resiliency11) Agency guidelines build on the climate data provided in these Guidelines by providing specific design alternative and insights relevant to those agencies
bull Limitations the Guidelines do not describe or encompass all City resiliency policies To learn more about how the City plans for a resilient future see the latest OneNYC plan as well as the 2013 report A Stronger More Resilient New York Related resiliency issues are being addressed by the City but are out of the scope of these Guidelines including neighborhood and regional-level climate change risk management and zoning
bull Further questions Contact ORR at ResilientDesigncityhallnycgov
11 Available at httpswwwnycgovparksorgplanning-and-buildingplanningresiliency-plansflood-resiliency
NYC Mayorrsquos Office of Recovery and Resiliency Climate Resiliency Design Guidelines
9IIA INCREASING HEAT
All City of New York capital projects should be designed to withstand increasing heat and precipitation based on the useful life of the asset while design interventions for storm surge and sea level rise depend on the projectrsquos proximity to the floodplain useful life and criticality In order to support design team efforts to generate resilient design responses (ie adjustments to base projects) these Guidelines provide climate change projections and recommend design adjustments or interventions in response to increasing heat increasing precipitation and sea level rise The Guidelines recommend designing to loads beyond the minimum requirements in the prevalent NYC local codes Design teams should consider project benefits and additional costs to incorporating resilient design standards before finalizing project design
A INCREASING HEATUse this section to determine how to adjust a facilityrsquos design to account for increasing temperatures and to reduce the facilityrsquos contribution to the Urban Heat Island effect Heat reduction levels will be determined by the function location and useful life of the asset
BackgroundThe impacts of heat on NYC are well established Every summer over 100 New Yorkers die from causes exacerbated by extreme heat12 The region has seen a steady increase in the number of days above 90degF and temperatures are projected to keep rising worsening heat-related mortality By the 2050s the number of days at or above 90degF is expected to double and the frequency and length of heat waves will triple to an average 6 heat waves per year13 Certain areas of NYC already experience higher temperatures relative to other parts of the city and these hot spots will be exacerbated by climate change (see Figure 2)
12 OneNYC The Plan for a Strong and Just City (The City of New York 2015) 228 See also Madrigano J Ito K Johnson S Kinney PL Matte T 2015 A case-only study of vulnerability to heat wavendashrelated mortality in New York City (2000ndash2011) Environmental Health Perspectives 123672ndash678 httpwwwnycgovhtmlonenycdownloadspdfpublicationsOneNYCpdf
13 Horton et al New York City Panel on Climate Change 2015 Report Chapter 1 Climate Observations and Projections Ann NY Acad Sci ISSN 0077-8923 New York 201514 LANDSAT Thermal Data from 8182009
Figure 2 - Thermal imagery of New York City based on LANDSAT Thermal Data from 818200914
II INTERPRETING CLIMATE CHANGE DATA FOR RESILIENT DESIGN ADJUSTMENTS
NYC Mayorrsquos Office of Recovery and Resiliency Climate Resiliency Design Guidelines
10IIA INCREASING HEAT
In Cool Neighborhoods NYC the City prioritizes strategies to study the Urban Heat Island effect and make targeted investments that benefit communities most vulnerable to heat15 New Yorkers are more or less vulnerable to heat based largely upon socio-economic factors including age income location tree coverage and the percentage of dark surfaces The NYC Department of Health and Mental Hygiene (DOHMH) developed a Heat Vulnerability Index (HVI) which highlights parts of the city where more residents face an increased risk of heat-related mortality Their vulnerability is due to their exposure and socio-economic conditions that determine their
Figure 3 - Heat Vulnerability Index (HVI) for New York City Community Districts (Source NYC DOHMH 2015) This analysis identifies physical social and economic factors associated with increased risk of heat-related morbidity and mortality17
The Guidelines recommend that project designers consider two aspects of the relationship between their project and increasing heat the way their project reduces the Urban Heat Island effect and the impact that increasing heat will have on the physical components of their project itself
bull Reduce Urban Heat Island effect materials in the built environment absorb the sunrsquos heat throughout the day and re-radiate it back into the atmosphere driving localized temperatures higher and increasing demands on cooling systems Air conditioning and ventilation equipment also push extra heat into the air contributing to a feedback loop that increases localized ambient temperatures and impacts the health of heat-vulnerable New Yorkers This section provides guidance on how new capital construction can reduce the contribution to ambient heat in the city
bull Minimize impact from increasing heat increasing heat can physically impact components of buildings and infrastructure damaging or stressing materials electrical systems and mechanical systems Rising temperatures will also stress energy and communications networks that buildings and other infrastructure rely upon18 This section provides climate data to be used to adjust and adapt heat-vulnerable components of assets
15 OneNYC 22816 To learn more about Heat Vulnerability Index see page 229 of OneNYC at httpwwwnycgovhtmlonenycdownloadspdf
publicationsOneNYCpdf17 See page 229 in the OneNYC plan to learn more about HVI18 Damiano H et al NYCrsquos Risk Landscape A Guide to Hazard Mitigation (NYC Emergency Management 2014) 103
Heat can be lethal for all but its impact on New Yorkers is not equal
sensitivity to heat Community districts in red and orange in Figure 3 are areas of highest vulnerability and these are particularly concentrated in east Brooklyn the south Bronx northern Manhattan and southeast Queens16 While all new capital projects should address heat impacts those sited in moderate to high vulnerable HVI areas should implement multiple strategies to reduce the Urban Heat Island and help address the high vulnerability in these neighborhoods
NYC Mayorrsquos Office of Recovery and Resiliency Climate Resiliency Design Guidelines
11IIA INCREASING HEAT
1 Urban Heat Island reductionNew capital construction should minimize its contribution to the Urban Heat Island effect The design interventions provided below offer benefits to the community and the facility through reduced heat loading reduced energy costs andor improved occupant health and thermal comfort The appropriate combination of design interventions will vary dependent on the project scope
a) Increase the solar reflectance of surfaces by utilizing light-colored pavement coatings and materials in combination with shading with a minimum target of 50 of the non-structure areas of facility sites19
Lighter reflective surfaces help reduce the Urban Heat Island effect heat loading and internal building temperatures and extend the lifespan of rooftops and heating ventilation and air conditioning (HVAC) equipment The City has taken steps towards reducing ambient temperatures such as implementing the NYC Cool Roofs program20 New buildings as well as existing buildings with roofs going through significant repairs are required by law to paint their roofs white This program intervention reduces a buildingrsquos contribution to Urban Heat Island effect and provides energy savings by coating the normally dark concrete roof surface with white paint allowing the roof to reflect solar radiation
b) Increase the shading of surfaces by planting trees or other vegetation in combination with cool pavements with a minimum target of 50 of the non-structure areas of facility sites
Shady areas with heat- and in coastal areas salt-tolerant vegetative species can help keep buildings cool and provide energy savings as well as lower temperatures
c) Meet Climate Zone 6 standards for fenestration and insulation (See Section ECC C402 in Chapter C4 of the 2016 NYC Energy Code) to improve efficiency of building envelopes
NYC is currently in Climate Zone 4 NYC already requires that small residential building envelopes are designed to meet higher insulation and fenestration requirements to improve energy efficiency21 All City capital projects including non-residential facilities should meet this standard
d) Select greenblue roofs andor other appropriate landscape elements that maximize cooling with help of landscape architects
The City already encourages the use of green and blue roofs on buildings to reduce the Urban Heat Island effect22 provide stormwater management and increase the useful life of the roof Besides replacing dark roof surfaces green roofs and vegetation also provide shade and keep the air cool through evapotranspiration by releasing moisture into the atmosphere Blue roofs coupled with light colored roofing material can provide stormwater management and rooftop cooling Some of these designs support the shading and solar reflectance goal in Step a) above Additionally City capital projects are subject to Leadership in Energy and Environmental Design (LEED) certification and green roofs can earn LEED credits23 Projects should integrate cooling strategies listed below based on project scope and a balance between costs and benefits
bull Green roofs or blue roofs on a broader range of facilities (including industrial buildings storage garages administration buildings etc)
19 Urban Green Council (2010) Green Codes Task Force Proposed code ldquoEF 12 Reduce Summer Heat with Cool Shady Building Lotsrdquo20 Local Law No 21 (2011) amended Chapter 12 of the NYC Building Code to update roof coating standards Also
see Cool and Green Roofing Manual (DDC) 2007 for more information on NYC standards for cool and green roofs httpwwwnycgovhtmlddcdownloadspdfcool_green_roof_manpdf
21 Read more about the code here httpswww1nycgovsitebuildingscodes2016-energy-conservation-codepage22 See Cool and Green Roofing Manual (DDC) 2007 for more information on NYC standards for cool and green roofs
httpwwwnycgov htmlddcdownloadspdfcool_green_roof_manpdf23 See Local Law No 32 (2016) for more information
NYC Mayorrsquos Office of Recovery and Resiliency Climate Resiliency Design Guidelines
12
2 Minimize impact from increasing heatThis section provides information to support making design adjustments to capital projects to reduce impacts to equipment structures landscapes and materials from rising average temperatures and increasing extreme heat events
a) Review forward-looking climate data provided in Table 1 and Table 2 Select heat projections according to the useful life of the facility and its primary
components then evaluate and address impacts in the steps below Table 1 provides design criteria for average temperatures and incidents of extreme heat events projected to different time periods across the 21st century Table 2 provides guidance on future 1 Dry Bulb Temperature and Cooling Degree Days for the NYC area The 1 Dry Bulb Temperature represents the ambient air temperature
IIA INCREASING HEAT
bull Vegetated structures such as shade trees and planters (to reduce heat loading on horizontal or vertical surfaces)
bull Bioswales rain gardens and bioretention24 bull Maximize planted permeable surfacesbull Other permeable surfaces (used for stormwater management these retain
moisture that evaporates as surface temperatures rise)25 bull Open-grid pavement system (at least 50 unbound)26 bull Evaluate site planning and building massing with regard to solar gainbull Solar panels for shading and to generate energy
Table 1 ndash Baseline and projected extreme heat events27
End of useful life
heat waves per year (3 or more consecutive days with max temperatures at or above 90degF)
days above 90degF
Annual average temperature
Baseline (1971-2000) 2 18 54degF
Through to 2039 4 33 572degF
2040-2069 7 57 606degF
2070-2099 9 87 643degF
Table 2 ndash Projections for 1 Dry Bulb temperature and Cooling Degree Days
Change in projected value for 2050s
Variable Baseline for Central Park (1971-2000)
Low estimate (10th percentile)
Middle range (25th to 75th percentile)
High estimate (90th percentile)
1 Dry Bulb temperature 91degF +3degF +4-6degF +7degF
Cooling Degree Days (base = 65degF) 1149 +37 +46-73 +87
Note Due to HVAC system typical useful life of 25 years or less only projections for the 2050s are shown Projections for the 2020s are not shown because it is anticipated that enough of a safety margin is employed already in current systems to withstand the temperature rise expected through the 2020s The NPCC is currently working on projections of 1 Wet Bulb temperatures which are expected to increase and may require systems to have higher moisture reducing capacity in addition to the enhanced cooling capacity
24 When siting bioswales consider groundwater levels and soil permeability and ensure that the site is not contaminated from past or present land uses A high water table may prohibit some applications
25 Urban Green Council (2010) Green Codes Task Force Proposed code ldquoSW 1 REDUCE EXCESSIVE PAVING OF SITESrdquo26 LEED Neighborhood Development v4 ldquoHeat island reductionrdquo credit27 Projected estimates for average temperatures are based upon 90th percentile change factor added to the baseline average annual
temperature from New York City Panel on Climate Change (2015)
NYC Mayorrsquos Office of Recovery and Resiliency Climate Resiliency Design Guidelines
13IIA INCREASING HEAT
b) Evaluate potential impacts on systems and materials Heat impacts on a facility are highly contingent on the facility type and should be reviewed on a case-by-case basis28 A decrease in the useful life or operational capacity of a facility or components of a facility may occur due to rising temperatures Interventions will also vary depending on whether the project is a new capital investment or a substantial improvement to an existing facility Factors to evaluate as applicable to project scope include but are not limited to
bull Thermal expansion warping softening or other forms of material change or degradation of structural integrity occurring at an accelerated rate by excessive heat
bull Health and safety impacts on occupants vulnerable to heat bull Increased failure or reduced efficiency of electrical or mechanical systems bull Prioritization of critical loads for systems and components at the facility andbull Moisture control needs for buildings with a higher standard for fenestration and
insulation
The results of this evaluation will inform steps taken in the step below
c) Reduce heat impacts Review and implement specific changes to the facility design based on assessments
above Develop a strategy based on the specific type of facility its operational profile and its useful life A Design Strategies Checklist is available for use in Appendix 6 as a resource to track design approaches Specific areas of focus are
bull Electricity outages High temperatures drive demand for air conditioning and can increase the risk of facility equipment failure potentially broader grid disruptions or brownouts2930 To manage this risk design City buildings and infrastructure to withstand periods without electricity using the following approaches in particular if they provide critical or essential services
Ǯ Identify and assess how much of the facilityrsquos load is critical (eg ldquocritical loadrdquo) including the necessary duration of the backup power supply (eg is backup power needed for 8 hours or multiple days) Determining what loads are critical and how long they should be powered for is essential for a facilityrsquos operations and what the role of the facility will have in an emergency situation31
Ǯ Depending on the size of the critical load and budget different backup power supply options could range from backup generators (eg diesel natural gas) to hybrid systems (eg solar + battery storage + appropriately sized generator) Each option has different trade-offs that should be considered in terms of cost feasibility and environmental impacts For shorter duration needs andor smaller critical loads buildings with existing solar systems should consider adding storage to provide a resiliency benefit In some cases co-generation systems may make sense from an economic and resiliency perspective especially if there
28 Sector- and facility-specific impacts vary greatly For examples of sector-specific impacts and design responses see Flooded Bus Barns and Buckled Rails (FTA 2011) and Ready to Respond Strategies for Multifamily Building Resilience (Enterprise Green Communities 2015)
29 McGregor et al (2013) Two Degrees The Built Environment and Our Changing Climate Routledge Press30 High temperatures also increase energy demand which can increase fossil fuel based greenhouse gas emissions31 The key roles of the facility that need to be identified are operational hours number of occupants and electrical loads needed for the
desired operations Electrical equipment and appliances for the desired operations may include - but are not limited to - safety lighting life-supporting systems fire protection systems telecommunications equipment mechanical systems to mitigate extreme temperatures and computing equipment Every facility is unique Operational characteristics and load profiles need to be established prior to sizing the equipment required to keep the facility in operational mode
NYC Mayorrsquos Office of Recovery and Resiliency Climate Resiliency Design Guidelines
14IIA INCREASING HEAT
is a significant heating andor cooling load in addition to electricity demand32
Ǯ Depending on the option assess need to invest in internal electricity rewiring and building energy management systems (eg switches reconfiguration of distribution infrastructure to isolate critical loads from non-critical loads and the ability to island from the broader grid during the event of a larger disruption software and hardware to manage the deployment of hybrid systems) andor need for external hookups for temporary generators and boilers33
bull Failure in facility ventilation electrical and air conditioning systems Some systems designed to meet the requirements of past climate may overheat and fail during extreme events Some design interventions include34
Ǯ Selecting systems with higher heat tolerance Ǯ Adding Energy Recovery Ventilation systems Ǯ Providing additional or redundant ventilation systems either mechanical or
natural to cool electrical equipment Ǯ Optimizing building layout by
bull segregating temperature sensitive electronics and computer control system from other systems
bull placing heat generating equipment like transformers and switchgear outdoors where permitted and
bull splitting the facility cooling loads among different HVAC systems in facility for redundancy and better zone control
bull Passive solar cooling and ventilation There are numerous design features that provide passive solar cooling for buildings to help maintain lower internal ambient temperatures with less air conditioning These features also help keep facilities habitable during extended grid failures when generators fail or must be reserved for critical functions Some design features include35
Ǯ Appropriate east-west orientation Ǯ Passive ventilation design Ǯ Vertically stacked double skin facades Ǯ Exterior window shades Ǯ Light colored exteriors Ǯ Shaded arcades Ǯ Thermally massive materials Ǯ High performance glazing Ǯ Operable windows
32 To learn more see the Building Resiliency Task Force report from Urban Green Council (2013)33 Ibid 34 Flooded Bus Barns and Buckled Rails FTA Office of Budget and Policy 201135 These and other examples are found in McGregor et al (2013) Two Degrees The Built Environment and Our Changing Climate
Routledge Press Also see Flooded Bus Barns and Buckled Rails FTA Office of Budget and Policy 2011
NYC Mayorrsquos Office of Recovery and Resiliency Climate Resiliency Design Guidelines
15IIB INCREASING PRECIPITATION
B INCREASING PRECIPITATIONThe intensity and frequency of precipitation events are projected to increase with climate change creating new challenges for stormwater management and impacts to the built environment such as
bull The potential for greater frequency of stormwater management systems being overwhelmed36
bull More frequent and severe flooding of buildings and infrastructure in areas across the city and
bull Greater variability in rainfall events annually including the chance of drought
The goal for this section is to guide stormwater management approaches including infiltration increases in on-site storage volume and where possible increases in sewer capacity to account for precipitation increases associated with climate change Designers should develop and consider design interventions that would decrease site contribution to sewer in-flows beyond the existing NYC Building Code requirements Given its complexity the Department of Environmental Protection (DEP) is also evaluating climate impacts to the sewer system on a drainage-wide level Proactive design such as increasing on-site infiltration and storm water retention can contribute to system resiliency on a site-specific basis
BackgroundNYCrsquos drainage systems are designed to handle approximately the current 3-year intensity-duration-frequency (IDF) event in most areas of the city where sewers were built prior to 1970 In locations with sewers built after 1970 the capacity was built to handle the 5-year event NYCrsquos network of drainage systems can experience flooding above those thresholds due to widespread precipitation events or by localized intense storms (sometimes called ldquocloudburstsrdquo) causing flooding and backups Climate change projections indicate that flooding resulting from multiple types of precipitation events may increase in frequency This increasing probability is forecast for all types of precipitation events in NYC although there is greater uncertainty around future short duration events Relying on sewers alone to manage extreme precipitation events will not be sufficient in a changing climate The City plans to reduce impervious areas and provide additional storage capacity to reduce flood damage For managing stormwater from larger storms such as at the 50- and 100-year recurrence intervals DEP is increasingly considering the role of streets and open space in managing flow this is referred to as a dual drainage design approach The City is piloting projects to test this dual drainage approach
Another set of interventions include Bluebelt best management practices (BMPs) such as constructed wetlands storm water ponds and stream restorations that emulate pre-development conditions to manage large volumes of water and green infrastructure37 which in NYC have generally been designed to reduce flooding and combined sewer overflow respectively They are not typically sized to manage precipitation events of the same magnitude as sewers which serve as primary drainage conveyance However Bluebelt BMPs green infrastructure and other stormwater management tools may provide an additional buffer for larger storm events by temporarily storing andor infiltrating runoff that would otherwise be directed into the sewer system For instance areas of open space commonly found in NYC may not provide adequate environments for trees and other plantings However in these cases other types of green infrastructure like permeable surfaces and subsurface detention and retention installations would still be considered feasible
36 NYC is already taking steps to address this problem which will worsen with climate change To learn more about how NYC is using green and gray infrastructure to manage stormwater visit httpwwwnycgovhtmldephtmlstormwaterindexshtml
37 NYC DEP NYC Green Infrastructure Program
NYC Mayorrsquos Office of Recovery and Resiliency Climate Resiliency Design Guidelines
16IIB INCREASING PRECIPITATION
The City led by DEP continues to develop its options for managing heavier storm events due to climate change DEP is examining approaches to evaluate sea level rise and rainfall intensity for stormwater management and where possible sewer capacity These efforts will integrate forward-looking climate data into the design of these capital assets and the compounding factors of heavier rain storms and sea level rise will likely require greater infiltration and on-site storm water retention capacity Agencies and consultants should work directly with DEP to develop strategies on a given site necessary to meet expected increases in rainfall intensities and frequencies
1 Precipitation design adjustment for on-site stormwater systems
Based upon the design storm required for the City facility in design follow the steps below and review recommended design interventions
a) Identify the duration of the design event required The current 50-year IDF can be used as a proxy for the future 5-year storm
(projected for the 2080s) Design on-site detentionretention systems to retain the volume associated with the current 50-year IDF curve (see Figure 4 below) Design the on-site system to release at the maximum rate as specified in 15 Rules of the City of NY (RCNY) Chapter 3138
b) Conduct sensitivity analysis Compare the retentiondetention required for the current 5-year IDF versus the
38 Refer to existing codes and standards as well when determining the existing required storm as NYC requires different sizes of design storms for infrastructure and buildings For example NYC Plumbing Code Chapter 11 and Title 15 of the Rules of the City of New York Chapter 31
02
04
06
10
20
40
60
100
200
-2316090
Rai
nfal
l Int
ensi
ty (
inch
es p
er h
our
)
DurationsruoHsetuniM
5 10 15 30 1 2 3 6 12 18
5-yr
10-yr25-yr
50-yr
100-yr
NEW YORK NEW YORK
Figure 4 - Current Intensity-Duration-Frequency Precipitation Curve for NYC adapted from US Department of Commerce Weather Bureau Technical Paper 25
NYC Mayorrsquos Office of Recovery and Resiliency Climate Resiliency Design Guidelines
17IIB INCREASING PRECIPITATION
c) Identify design interventions for managing increased precipitation40 There are different ways to manage stormwater better and avoid urban flooding after
intense rain Choose the right combination of interventions after considering the site location operational requirements cost benefits and useful life of the intervention Some examples of design interventions are
bull Minimize increases in impervious surfacebull Utilize strategies that infiltrate evaporate or reuse rainwater to achieve storm
water volume reductions Then choose strategies that detain (delay drainage) to manage the rate of the storm water flow into the Cityrsquos drainage system
bull Install stormwater infiltration detention and storage (eg bioswales41 green roofs blue roofs and other blue or green infrastructure storage basins or tanks)
bull Protect areas below grade from floodingbull Keep catch basin grates clearbull When implementing perimeter protections ensure that interior water
management is also accounted for andbull Explore interventions to protect underground utility and telecommunications
infrastructure from water damage
d) Use appropriate DEP guidelines to perform the above tasks using the higher design storm
The three currently prescribed DEP guidelines are as follows
bull Guidelines for the Design and Construction of Stormwater Management Systems July 201242
bull Criteria for Detention Facility Design November 201243 bull DEP Site Connection Proposal Application and Guidelines44
Note on stormwater standards As DEP updates stormwater standards and develops specific tools to evaluate impacts of increased precipitation and drainage strategies for on-site storm water management these changes will be reflected in future versions of these Guidelines However it is recommended that the designer should develop and consider design interventions that would increase the on-site storage beyond the existing requirements Also a methodology is under development that will establish a consistent citywide process for addressing legal grade which will have further implications for how extreme precipitation is managed
39 NYC DEP Standards for Stormwater Release Rates available at httpwwwnycgovhtmldephtmlenvironmental_reviewsstormwater_release_ratesshtml 40 Also see DEP Guide to Rain Event Preparedness at httpwwwnycgovhtmldeppdfbrochuresflood-preparedness-flyerpdf and
Ready to Respond Strategies for Multifamily Building Resilience at httpwwwenterprisecommunityorgresourcesready-respond-strategies-multifamily-building-resilience-1335641 When siting bioswales consider groundwater levels and soil permeability and ensure that the site is not contaminated from past or
present land uses A high water table may prohibit some applications42 Available at httpwwwnycgovhtmldephtmlstormwaterstormwater_management_constructionshtml43 Available at httpwwwnycgovhtmldeppdfwater_sewer30_criteria_for_detention_facility_design_06062012pdf44 Available at httpwwwnycgovhtmldeppdfwater_sewer24pdf
current 50 year IDF to determine the cost and benefits associated with complying with these Guidelines Use the Evaluation of Project Benefits section below and Appendix 4 for guidance on how to identify and assess benefits Given the results of the costbenefit analyses review the added benefit of designing retentiondetention using greater magnitude storms (eg 100-year) or lower (eg 25-year) The goal is to maximize retentiondetention capacity given site and cost constraints as well as through an evaluation of the benefit of adding capacity to detainretain water for larger storm events
NYC Mayorrsquos Office of Recovery and Resiliency Climate Resiliency Design Guidelines
18
2 Incorporating climate change projections into DEP drainage planning
The first line of defense for managing intense precipitation events does not require changes to the sewer system as described above For drainage and wastewater infrastructure planning in a changing climate the sewer network and wastewater infrastructure should be qualitatively evaluated from the upstream pipes to the regulator chambers pump stations interceptors and ultimately to the downstream outfall to determine the feasibility of incorporating climate change projections into the system design For DEP storm sewer projects FY 2021 or later in separately sewered drainage areas where the design is in the early stages and there is free discharge the agency will evaluate the feasibility of revising the design to incorporate climate projections into the design If the project (including the prescribed changes) passes the costbenefit analysis then DEP will consider incorporating climate change projections into the sizing However changes in one part of the system must be carefully evaluated For example any upsizing of the regulator chamber or the high point of the system can negatively impact the design and operation of the wastewater infrastructure and residencesbusinesses on the system and can lead to a diminished the level of service
DEP is in the process of developing a hydrologic and hydraulic (HampH) model to estimate runoff flow for future climate scenarios and is evaluating rainfall hyetographs for the existing and future rainfall scenarios to be included in the drainage planning process In addition DEP currently coordinates with ORR for drainage planning as a part of coastal resiliency projects A more detailed methodology to incorporate climate change projections into drainage planning will be developed for version 30 of the Climate Resiliency Design Guidelines to be released in April 2019
IIB INCREASING PRECIPITATION
NYC Mayorrsquos Office of Recovery and Resiliency Climate Resiliency Design Guidelines
19IIC SEA LEVEL RISE
non-critical components within a larger facility or campus (eg at a maintenance yard differentiate between structures and equipment) Critical components essential to the facilityrsquos functionality should be protected to the higher standard for criticality even if the facility itself may be non-critical Some examples of critical components include electrical distribution and switching areas motor-control centers chemical feed equipment boilers communications systems monitoring and safety equipment HVAC units fire alarms and suppression equipment furnaces elevators emergency fuel supplies emergency generators and hazardous material storage Component protection should also be evaluated if a facility is expected to be fully operational during a flood event or if it is expected to quickly resume full operations after an event
For buildings and infrastructure with a long useful life it is not always cost effective or operationally feasible to design a facility to be resilient to hazards faced at the end of its useful life In these cases the most resilient design will be one that provides extra protection against hazards in the initial decades while also leaving open design alternatives for updating resiliency measures as new data is provided or new risk assessments are completed This flexible adaptation pathways approach builds in options to protect assets later in life as demonstrated in an example shown in Figure 1 (in Section I)
Other considerations to keep in mind includebull These Guidelines apply to all City capital projects except coastal flood protection
systems which are designed to different standards than those provided here for
C SEA LEVEL RISEThis section provides tools to 1) determine if the project will be subject to tidal inundation during its useful life due to sea level rise and 2) incorporate sea level rise into flood protection levels of capital projects For projects in the current and future 1 annual chance floodplains sea level rise-adjusted design flood elevations (DFE) are provided and reflect the criticality of the asset and its useful life Background NYC has experienced the devastation of coastal storms most recently during Hurricane Sandy Sea level rise is projected to increase the depth extent and frequency of flooding from storm surge45 Sea level rise will also regularly inundate some low-lying areas during high tides Current flood protection heights are determined by using the base flood elevation established by the FEMA Preliminary Flood Insurance Rate Map (PFIRM) 201546 and the standard of protection for buildings in the floodplain in Appendix G of the NYC Building Code47 These Guidelines augment existing requirements for two primary purposes ensuring City facilities built today incorporate sea level rise and critical assets (as defined in Table 4) are protected to a higher level It is important to note that all projects and design interventions must comply with NYC Building Code
Designers should differentiate between critical and
45 New York City Panel on Climate Change Report Chapter 2 Sea Level Rise and Coastal Storms (2015)46 However NYC Building code G10222 requires that designers review both the PFIRM and the effective FIRM and use the more
restrictive of the two 47 For information on the differences between FEMA FIRM PFIRM and the Cityrsquos forward-looking flood maps see Appendix 3
Critical components essential to the facilityrsquos functionality should be protected to the higher standard for criticality even if the facility itself is non-critical
NYC Mayorrsquos Office of Recovery and Resiliency Climate Resiliency Design Guidelines
20IIC SEA LEVEL RISE
buildings and other physical infrastructure Many of NYCrsquos coastal flood protection systems are currently being developed to comply with FEMA accreditation for flood levee systems48 The City plans to develop further guidance for designing coastal protection projects
bull For information on the differences between FEMA FIRM PFIRM and the Cityrsquos forward-looking flood maps see Appendix 3
bull Coincident stressors from sea level rise should also be considered For example bridge scour may increase as sea levels rise Similarly flooding during heavy rainfall events can be worsened due to higher tailwater conditions associated with high sea levels Be aware of how different risks may interact and how different interventions can be deployed to address multiple hazards or provide other co-benefits
bull Note projects that require discretionary approval are required to incorporate sea level rise projections as part of the NYC Waterfront Revitalization Program49 and
bull A methodology is under development that will establish a consistent citywide process for addressing legal grade which will have further implications for how sea level rise and precipitation are managed
For more information see Section IE Designers should use the resources and methods described in this section to 1) assess tidal inundation due to sea level rise and 2) address risks in the current and future floodplains
1 Assessing tidal inundation due to sea level riseTidal flooding currently affects parts of NYC and is projected to worsen as sea levels rise and inundate low-lying coastal sites during high tides When determining a site location or establishing scope of substantial improvements for other types of coastal facilities the project team will consider alternative sites outside of zones threatened with regular inundation if resiliency actions are not taken Some facilities such as wastewater treatment plants and harbor facilities need to be near the coast for operational purposes
a) Determine tidal inundation risk from sea level rise Use the Flood Hazard Mapper (httpwwwnycgovfloodhazardmapper)50 to see if your
site is in an area inundated from high tide plus sea level rise within the projectrsquos useful life For example if the useful life ends between 2040 and 2069 choose the 2050s High Tide map) Determine risk only from high tide and sea level rise separate from flood events Follow the instructions in Figure 5 and refer to the example in Figure 6 to review inundation at the end of an assetrsquos useful life
48 For more information please visit httpwwwfemagovfema-levee-resources-library49 For more information visit httpwwwnycgovwrp50 The Flood Hazard Mapper relies on publicly available data to present these map resources Users should also refer to FEMA and the
NPCC for official information
Figure 5 - Flood Hazard Mapper high tide plus sea level rise at httpwwwnycgovfloodhazardmapper
NYC Mayorrsquos Office of Recovery and Resiliency Climate Resiliency Design Guidelines
21IIC SEA LEVEL RISE
b) Address flood risk If the Flood Hazard Mapper shows that the facility is expected to be inundated by
high tides within its useful life or if primary access roads are at risk of inundation consider alternative site options
- OR - If the site is not expected to be regularly inundated by tides proceed to the next
section 2 Addressing Risks in the Current Floodplain
Note on calculating tidal inundations with sea level rise if a project team is interested in understanding the depth of tidal inundation given climate change projections follow these steps First determine the Mean Higher High Water (MHHW) elevation in feet-NAVD 8851 datum nearest to the site If the MHHW data is unavailable from a site specific survey refer to httpwwwnycgovwrp for a list of MHHW elevations (NAVD88) at tide stations across the city52 Second add the high estimate (90th percentile) of expected sea level rise (see Table 8 in Appendix 2) for the year corresponding to the facilityrsquos useful life to the MHHW to determine the projected depth of tidal inundation with sea level rise
51 North American Vertical Datum of 1988 (NAVD 88) is the vertical control datum of orthometric height established for vertical control surveying in the US based upon the General Adjustment of the North American Datum of 1988
httpswwwngsnoaagovdatumsvertical52 SLR elevations at httpwwwnycgovwrp are adjusted to account for sea level rise since the last tidal epoch If no other resource is
available to determine MHHW use the NOAA Online Vertical Datum Transformation tool to calculate the MHHW in feet-NAVD
Figure 6 - Flood Hazard Mapper with high tide in the 2020s (left) and in the 2080s (right) at httpwwwnycgovfloodhazardmapper
NYC Mayorrsquos Office of Recovery and Resiliency Climate Resiliency Design Guidelines
22IIC SEA LEVEL RISE
2 Addressing risks in the current floodplain53
A facility located in the current 1 annual chance floodplain (PFIRM 2015)54 will face increasing risk of flooding during its useful life due to sea level rise increasing the depth of coastal storms This section provides a process for adjusting the design flood elevation required by code to account for sea level rise
a) Find the location of the facility using the Flood Hazard Mapper (httpwwwnycgovfloodhazardmapper) and follow the instructions in Figure 7
bull Choose to view the layer ldquoFEMA Preliminary FIRM 2015rdquo bull Click on the facility site in the 1 floodplain to view the base flood elevation
Figure 7 - Flood Hazard Mapper with FEMA PFIRM (2015) at wwwnycgovfloodhazardmapper
b) If the facility is not in the current 1 annual chance floodplain (PFIRM 2015) proceed to the next section ldquo3 Addressing risks in the future floodplainrdquo
- OR - If the facility is in the current 1 annual chance floodplain (PFIRM 2015) note
the base flood elevation (BFE) and proceed to Step c) below Please note if a facility has multiple BFEs or if the site is partially in the 1 annual chance floodplain it is recommended to use the highest BFE as the current BFE for the entire site
c) Establish a sea level rise-adjusted DFE Use the current base flood elevation at your site the facilityrsquos useful life and its
criticality level to determine the design flood elevation using Table 4 (on the next page) as a basis of design
53 This process for adjusting the design flood elevation to account for sea level rise satisfies the criteria of the climate-informed science approach described at the state and federal level
54 FEMA updates its flood maps periodically As of April 2018 the most recent maps are the Preliminary Flood Insurance Rate Maps (PFIRM) available at DCPrsquos Flood Hazard Mapper (httpwwwnycgovfloodhazardmapper) Also note that NYC Building Code requires developers to use the PFIRM (2015) or the FIRM (2007) whichever is more restrictive For more information on these requirements please refer to Appendix G of the NYC Building Code Please note that the DCP maps are not official and all site locations should be confirmed with the official FEMA PFIRM NYC will provide information on the latest flood maps as they are updated
NYC Mayorrsquos Office of Recovery and Resiliency Climate Resiliency Design Guidelines
23IIC SEA LEVEL RISE
Table 4 - Determine the sea level rise-adjusted design flood elevation for critical and non-critical facilities55
Critical facilities
End of useful life Base Flood Elevation (BFE)56 in NAVD 88 + Freeboard57 + Sea Level Rise
Adjustment58= Design Flood Elevation (DFE) in
NAVD 88Through 2039 FEMA 1 (PFIRM) 24rdquo 6rdquo = FEMA 1 + 30rdquo
2040-2069 FEMA 1 (PFIRM) 24rdquo 16rdquo = FEMA 1 + 40rdquo2070-2099 FEMA 1 (PFIRM) 24rdquo 28rdquo = FEMA 1 + 52rdquo
2100+ FEMA 1 (PFIRM) 24rdquo 36rdquo = FEMA 1 + 60rdquoNon-critical facilities
End of useful life Base Flood Elevation (BFE) in NAVD 88 + Freeboard + Sea Level Rise
Adjustment = Design Flood Elevation (DFE) in
NAVD 88Through 2039 FEMA 1 (PFIRM) 12rdquo 6rdquo = FEMA 1 + 18rdquo
2040-2069 FEMA 1 (PFIRM) 12rdquo 16rdquo = FEMA 1 + 28rdquo2070-2099 FEMA 1 (PFIRM) 12rdquo 28rdquo = FEMA 1 + 40rdquo
2100+ FEMA 1 (PFIRM) 12rdquo 36rdquo = FEMA 1 + 48rdquoAdditional analysis should be conducted to incorporate wave action and wave run-up in DFE calculations especially in areas that are located within the FEMArsquos 1 annual chance Limit of Moderate Wave Action (LiMWA) zone Wave run up is the maximum vertical extent of wave uprush above surge
Definition of critical buildings and infrastructure for determining DFE in Table 4The criticality definitions below are for use in the application of the Guidelines only All items identified as critical in NYC Building Code Appendix G are critical in these guidelines however this list includes additional facilities that are not listed in Appendix G59 If a facility is not listed here it is considered non-critical for the purposes of determining freeboard
bull Hospitals and health care facilitiesbull Fire rescue ambulance and police stations and emergency vehicle garages bull Jails correctional facilities and detention facilities bull Facilities used in emergency response including emergency shelters emergency preparedness communication
operation centers communication towers electrical substations back-up generators fuel or water storage tanks power generating stations and other public utility facilities
bull Critical aviation facilities such as control towers air traffic control centers and hangars for aircraft used in emergency response
bull Major food distribution centers (with an annual expected volume of greater than 170000000 pounds)60 bull Buildings and other structures that manufacture process handle store dispose or use toxic or explosive
substances where the quantity of the material exceeds a threshold quantity established by the authority having jurisdiction and is sufficient to pose a threat to the public if released61
bull Infrastructure in transportation telecommunications or power networks including bridges tunnels (vehicular and rail) traffic signals (and other right of way elements including street lights and utilities) power transmission facilities substations circuit breaker houses city gate stations arterial roadways telecommunications central offices switching facilities etc
bull Ventilation buildings and fan plantsbull Operations centersbull Pumping stations (sanitary and stormwater)bull Train and transit maintenance yards and shopsbull Wastewater treatment plantsbull Water supply infrastructurebull Combined-sewer overflow (CSO) retention tanksbull Fueling stationsbull Waste transfer stations and bull Facilities where residents have limited mobility or ability including care facilities and nursing homes
55 If an industry standard does not include freeboard in its flood protection standards for particular infrastructure assets then only consider the sea level rise adjustment when determining flood protection levels
56 Note that NYC Building Code requires developers to use the PFIRM (2015) or the FIRM (2007) whichever is more restrictive For more information on these requirements please refer to Appendix G of the NYC Building Code
57 These freeboard values reflect NYC Building Code Appendix G Table 2-1 which establishes the minimum elevation of the top of lowest floor Appendix G requires other freeboard values for other parts of structures and in different parts of the floodplain Refer to Appendix G for the appropriate freeboard and use that value in Table 4 above
58 The sea level rise figures provided are for the middle of the 25th-75th percentile range projections from the NPCC These values do not necessarily indicate the average of all models
59 The structural occupancy categories outlined in Appendix G of the NYC Building Code are the same as ASCE 7 used for structural design For critical buildings structural design should comply with ASCE 7 and 24 for design class IV
60 This threshold represents the median volume of main food distributors in NYC according to statistics collected as part of the Five Borough Food Flow study in 2016 available at
httpswwwnycedccomsystemfilesfilesresource2016_food_supply-resiliency_study_resultspdf 61 The threshold quantity for hazardous materials is established by Chapter 7 of Title 24 of the NYC Administrative Code
NYC Mayorrsquos Office of Recovery and Resiliency Climate Resiliency Design Guidelines
24IIC SEA LEVEL RISE
Figure 9 ndash Outdoor emergency generator for the critical building
This case study provides an example of how to calculate a sea level rise-adjusted DFE based on the useful life of a hypothetical critical services building and its primary component
Step 1 Organize the site by various critical or primary components and their year of construction Determine their useful life along with the associated future year scenario for flood risk assessment In this example the building structure and the outside emergency generator are the most at-risk components from combined sea level rise and coastal storm surge
Step 2 Overlay the site footprint area over the effective current PFIRM or FIRM and the corresponding future year scenario FEMA 1 to identify flood risk to the site From overlaying the 2015 preliminary FEMA floodplain over the site it was determined that the site has a 1 annual chance of flooding with a base flood elevation of 13rsquo NAVD Step 3 Evaluate the criticality of each primary component of the facility based on the Guidelinesrsquo definition for critical infrastructure (Table 4) This (hypothetical) building is critical
Step 4 Use Table 4 to determine the sea level rise adjustment and freeboard requirements for each component and calculate the DFE for each that corresponds to its useful life period
Step 5 Compare the DFE of each component and the associated Guidelinesrsquo recommended DFE to calculate anticipated flood depth
CASE STUDY Adjusting the DFE for Sea Level Rise
Table 5 ndash Example of how to calculate a sea level rise-adjusted DFE for a critical facility
Construction year Components Useful
Life
Future Year Scenario
[Useful Life + Const
Year]
BFE in NAVD
88 (feet)
Freeboard + Sea
Level Rise Adjustment
(feet)
Adjusted DFE in
NAVD 88 (feet)
2010 Building Structure
70 years 2070-2099 130rsquo 2rsquo+23rsquo 173rsquo
2010Outdoor
Emergency Generator
25 years
Through 2039 130rsquo 2rsquo+05rsquo 155rsquo
Figure 8 - Example of how to locate a facility within the current floodplain and determine the BFE Figure 9 (inset) - Outdoor emergency generator at the facility
Figure 10 - This schematic shows how to determine the design flood elevation of a facility within the current 1 floodplain
Illustrative not to scale
NYC Mayorrsquos Office of Recovery and Resiliency Climate Resiliency Design Guidelines
25IIC SEA LEVEL RISE
Figure 11 - Flood Hazard Mapper with future 1 annual chance floodplain (adjusted for sea level rise) at httpwwwnycgovfloodhazardmapper
b) If the site is not in the future floodplain no flood protection is required for this facility
- OR - If the site is in the future floodplain identify the nearest adjacent base flood
elevation at the project site in the current 1 annual chance floodplain (PFIRM 2015) using the Flood Hazard Mapper62
c) Use Table 4 to determine the DFE Add freeboard and the sea level rise-adjustment to the nearest adjacent BFE on the
current 1 annual chance floodplain (PFIRM 2015) to determine the DFE
d) Apply the DFE calculation from Table 4 to the protected facility See Figures 12 and 13 for an illustration of how to calculate the DFE
62 Maps of future floodplains show the impacts of sea level rise alone and do not consider how changes in stormsrsquo climatology might also affect wave action and the full extent of the floodplain
3 Addressing risks in the future floodplainIf the facility is not in the current 1 annual chance floodplain (PFIRM 2015) it may still be at risk in the future from flooding as sea level rise increases the extent of the floodplain Follow the steps below to determine if your facility is located in the future floodplain and if so what sea level rise-adjusted DFE to use
a) Use the Flood Hazard Mapper (httpwwwnycgovfloodhazardmapper) to determine if the facility site will be in the future 1 annual chance floodplain
Assess if by the end of the facilityrsquos useful life the floodplain is projected to increase to encompass all or part of the project site For example if the useful life ends between 2040 and 2069 choose the 2050s floodplain map Refer to the steps in Figure 11 below
NYC Mayorrsquos Office of Recovery and Resiliency Climate Resiliency Design Guidelines
26IIC SEA LEVEL RISE
Figure 12 - This schematic map shows how to locate the nearest adjacent 1 floodplain elevation
Figure 13 -This schematic shows how to determine the design flood elevation of a facility that is outside of the current 1 floodplain
CASE STUDY Identifying a Base Flood Elevation (BFE) in the Future Floodplain
Illustrative not to scale
NYC Mayorrsquos Office of Recovery and Resiliency Climate Resiliency Design Guidelines
27IIC SEA LEVEL RISE
4 Identify appropriate design interventions
63 Additional resources for identifying adaptive strategies Urban Waterfront Adaptive Strategies (NYC Department of City Planning httpswww1nycgovassetsplanningdownloadpdfplans-studiessustainable-communitiesclimate-resilienceurban_waterfrontpdf Floodproofing Non-Residential Buildings (FEMA) at httpswwwfemagovmedia-libraryassetsdocuments34270 Ready to Respond Strategies for Multifamily Building Resilience (Enterprise Green Community) at
httpwwwenterprisecommunityorgresourcesready-respond-strategies-multifamily-building-resilience-1335664 While natural systems-based approaches ameliorate flooding their use for storm surge or wave mitigation would need to be quantified
before contributing towards the design flood elevation 65 For more information see FEMArsquos Floodproofing Non-Residential Buildings at httpswwwfemagovmedia-libraryassetsdocuments34270
Operational requirements and continuity plans can inform the selection of appropriate design interventions particularly in terms of how quickly a site needs to be up and running after a flood event Some examples of how functional uses can pair with interventions include
bull A facility that needs to be operating during or immediately after a flood event may need to be dry floodproofed using permanent barriers or designed for passive survivability (such as a police or fire station)
bull A facility that needs to recover quickly after an event could elevate prioritized equipment and have deployable barriers
bull A site that can recover over a longer duration of time could be temporarily inundated during an event (such as parks or plazas) The use of resilient materials and strategies can reduce costly damage caused by temporary inundation
Different design interventions should be chosen based on the specific operational requirements of the project however these must meet the ASCE 24 design requirements for Coastal VE Zones
For all projects at risk of current or future flooding select protections that meet the projectrsquos design flood elevation Consider project-specific factors including the site location operational requirements existing continuity planning and cost63 A Design Strategies Checklist in Appendix 6 is available for use as a resource to track possible design approaches Some examples of design alternatives are
bull Site relocation where feasible conduct alternative site analysis
bull Permanent barriers at a site (eg floodwalls)
bull Deployable flood barriers (eg stop logs flood doorsgates inflatable barriers)
bull Natural systems-based approaches (eg living shorelines restored wetlands)64
bull Prioritized protection of electrical mechanical and other critical or costly-to-replace equipment above the design flood elevation (eg motors and controller boilers and furnaces fuel storage tanks duct work alarm systems and suppression equipment electrical panels electrical distribution and switching areas gas and electric meters telecommunications equipment chemical feed equipment HVAC units and emergency generators)65
bull Dry floodproofing design a facility to prevent water from entering
bull Wet floodproofing design a facility to permit floodwaters to flow in and out of the structure without causing significant damage (eg elevate or protect critical equipment use water-resistant building materials below the design flood elevation include flood vents and pumps)
bull Design redundant telecommunications conduit entrances for multiple carrier entry Telecom conduit should run to diverse manholes when possible
bull Install backup power for telecom equipment with design consideration for such equipment (eg installation above DFE)
bull Install outdoor-rated disconnect switch for telecommunications equipment on the roofbull Explore interventions to protect underground utilities and other telecommunications
facilities from water damagebull Install backflow preventers backwater valves and sump pumps for all buildings and
infrastructure in the floodplain as well as behind flood barriersbull Shoreline improvements that reduce the height of waves or attenuate waves where
feasible
NYC Mayorrsquos Office of Recovery and Resiliency Climate Resiliency Design Guidelines
28IIIA GENERAL METHODOLOGY TO ESTIMATE PROJECT BENEFITSIIIB CATEGORIES OF PROJECT BENEFITS
Designing and constructing facilities to handle the future climate loads above the current NYC codes and standards based on projected useful life of the components provides resiliency benefits The incremental costs to implement the Guidelinesrsquo recommended design interventions should be compared with the incremental benefits to aid agencies in making decisions about resilient design strategies The project design team should evaluate benefits of the interventions designed to meet Guidelinesrsquo recommended criteria for all the climate stressors qualitatively andor quantitatively For projects with construction costs below $50 million the project design team is recommended to perform a qualitative benefits assessment on the interventions that meet the Guidelinesrsquo recommendations for all applicable climate stressors For critical facilities or projects with construction costs over $50 million the project design team is recommended to perform quantitative benefit calculations to identify the optimal interventions that meet Guidelinesrsquo recommended design criteria
A GENERAL METHODOLOGY TO ESTIMATE PROJECT BENEFITSThis general methodology to perform qualitative and quantitative benefit calculations is recommended for use by project design teams at the beginning of and during the design process This methodology enables estimation of project benefits for a high-level benefit-cost analysis (BCA) that can be applied to evaluate and compare resiliency features designed to address sea level rise with coastal storm surge increased precipitation and extreme heat events The type of benefits provided by interventions designed to meet the Guidelinesrsquo design criteria can vary by climate stressors and typology of the facilities The main guiding principle in development of the high-level BCA methodologies included in these Guidelines was to balance simplicity with accuracy The project benefits categories identified within the methodology may not cover all the potential benefits provided by every facility type within NYC In particular the benefits of planning for increased precipitation are difficult to quantify Hence the project design team should use their discretion to modify this general benefit calculation methodology as needed to meet their project goals and objectives The project design team should develop appropriate input data whether quantitative or qualitative needed to estimate project benefits
B CATEGORIES OF PROJECT BENEFITSThere are three types of project benefit categories - direct benefits indirect benefits and other benefits - that can be used to perform qualitative assessments and develop quantitative estimates of monetary benefits for intervention alternatives designed to meet the Guidelinesrsquo recommendations These project benefit categories will help to perform a high-level benefit-cost analysis that balances accuracy with an appropriate level of effort
bull Direct Benefits include reduced or avoided physical damages to facilities and contents reduced or avoided displacements for residential structures and reduced life cycle or OampM costs that can be quantified as a primary result of implementing a specific hazard mitigation measure Table 12 in Appendix 4 provides a list of direct benefits and basic guidance on estimating and documenting values for sea level rise and increased precipitation-related flood hazards Note that given the current state of practice it is not possible to quantify reduced or avoided physical damages or residential displacements that result from a specific extreme heat mitigation measures Therefore direct benefits applicable to extreme heat hazards are limited to reduced life cycle costs applicable to certain measures such as green roofs Refer to Table 15 for details on direct benefits for extreme heat hazards
III EVALUATION OF PROJECT BENEFITS
NYC Mayorrsquos Office of Recovery and Resiliency Climate Resiliency Design Guidelines
29IIIB CATEGORIES OF PROJECT BENEFITS
bull Indirect Benefits include reduced or avoided service losses for non-residential
buildings public facilities andor infrastructure (utilities roads and bridges) based on the value of service continuity andor emergency services to New Yorkers that can be quantified as a secondary result of implementing a specific hazard mitigation measure Table 13 in Appendix 4 provides a list of indirect benefits and basic guidance on estimating and documenting values for sea level rise and increased precipitation-related flood hazards Note that given the current state of practice on extreme heat it is not possible to quantify reduced or avoided service losses that result from a specific extreme heat mitigation measures Therefore indirect benefits applicable to extreme heat hazards are limited to reduced energy costs such as cool roofs green roofs or shade trees Refer to Table 15 in Appendix 4 for details on indirect benefits for extreme heat hazards
bull Other Benefits where applicable other potential benefits may include social benefits for residents such as avoided stress and anxiety avoided lost productivity environmentalecosystem service benefits avoided need for emergency services and other potential benefits that can be estimated as a result of implementing a specific hazard mitigation measure Table 14 in Appendix 4 provides a list of other potential benefits and basic guidance on estimating and documenting values for sea level rise and increased precipitation-related flood hazards
Note on the ecosystem service benefit category in Table 14 the stormwater management benefits of green infrastructure should be distributed between the extreme heat and increased precipitation hazards since these measures provide both significant reductions in rainfall runoff as well as Urban Heat Island mitigation through evapotranspiration However there is currently limited data available to quantify the actual distribution of stormwater management benefits between the two hazards For various dual-benefit providing interventions careful considerations should be given to identify the appropriate benefits category provided by the intervention with a goal to avoid duplication of quantified benefits In this methodology the stormwater management benefits of green infrastructure are applied to the increased precipitation hazard in order to avoid a duplication of benefits Note on real estate and quality of life benefits additionally it is important to note that two potential benefit categories shown in Table 14 - real estate and quality of lifehealthavoided casualties - were not included in the current BCA methodology for sea level rise or increased precipitation hazards Although these categories could increase project benefits for sea level rise and increased precipitation hazards they were only applied to measures that address extreme heat hazards such as green roofs trees and other plantings Refer to Table 15 for a detailed summary of other benefit categories quantified as unit benefits for extreme heat hazards
NYC Mayorrsquos Office of Recovery and Resiliency Climate Resiliency Design Guidelines
30IIIC WHICH METHODOLOGY TO USEIIID BCA METHODOLOGY FOR PROJECTS UNDER $50 MILLION
D BCA methodology for projects under $50 millionThe project design team should develop design alternatives to meet the Guidelinesrsquo criteria which may be in excess of NYC code and standards requirements (baseline conditions) It is assumed that the project design team will develop alternatives to address each of the following applicable climate stressors - sea level risecoastal storm surge increased precipitation and extreme heat - separately Tables 12-15 in Appendix 4 provides a list of typical direct indirect and other benefits provided by various intervention typologies to reduce impacts from climate stressors During the qualitative assessment the project design team should consider that intervention strategies will have varying levels of reliability effectiveness benefits and cost implications during the qualitative assessment
The project design team is recommended to develop appropriate evaluation criteria and metrics for each of the applicable project benefit categories For each alternative the project design team could use either a scoring weighting ranking or other type of qualitative assessment framework to assess each applicable project benefit categories with the developed evaluation criteria and metrics Table 6 provides an example template to evaluate alternatives using a set of general evaluation criteria and metrics using a color-coded rating system (and see Table 7 for an example of how to complete the template) The project design team can utilize a similar template customized to their project goals and objectives This assessment allows agencies to screen the qualitative benefits for various alternatives that would then lead to development of final project components to match the available budget and goals of the project
Projects with total costs below $50 million recommended to conduct a qualitative assessment to identify the optimal interventions that meet Guidelinesrsquo design criteria using the ldquoD) BCA methodology for projects under $50 millionrdquo methodology below
C WHICH METHODOLOGY TO USEProjects with a total cost above $50 million or are highly complex or critical facilities recommended to conduct both a qualitative and quantitative benefit calculation to identify the optimal interventions that meet Guidelinersquos design criteria using the ldquoE) BCA methodology for projects above $50 millionrdquo below A quantitative BCA also must include qualitative factors
NYC Mayorrsquos Office of Recovery and Resiliency Climate Resiliency Design Guidelines
31IIID BCA METHODOLOGY FOR PROJECTS UNDER $50 MILLION
Qualitative Color Scale Green=Least resource intensive alternative Purple=most resource intensive yellow=medium level of resource intensity
Qualitative Evaluation Factors Description Relative Color Rating System
First CostsAdditional construction costs needed to incorporate Guidelinesrsquo recommended resilient design over the baseline project costs
Highest cost ($$$) rated as Purple whereas lowest cost ($) rated as Green
ConstructabilityEase of Implementation
Construction techniques and site conditions such as presence of major utilities conflicts and other conditions which dictate the level of constructability required for each alternative
Difficult to construct rated as Purple whereas easiest to construct rated as Green
Environmental ImpactsCo-BenefitsPermitting
Impacts to the built and natural environment such as circulation noise and hazardous waste plus the level of effort required for permitting (eg interventions in water require highest level of permitting requirement) from each alternative in addition to the baseline project condition
Highest environmental impacts and highest level of effort required for permitting rated as Purple whereas the least impact and level of effort rated as Green
Operation and Maintenance (OampM)
Level of effort of additional manpower and cost of OampM for the alternatives over the baseline project OampM requirements
Highest level of effort and cost for OampM rated as Purple whereas the lowest is rated as Green
Reliability and Durability
Interventions that do not require human involvement or a facilityrsquos ability to withstand all the forces during a storm event (eg permanent solutions with higher reliability than deployable solution)
Interventions requiring human involvement (active measures) rated as Purple whereas interventions with minimal or no human involvement (passive measures) rated as Green
Risk Reduction Benefits Monetary benefits provided by each intervention alternative in avoided damages over the baseline condition
Lowest potential monetary benefit rated as Purple whereas as highest potential monetary benefit rated as Green
Quality of Life BenefitsVisual Aesthetics
Benefits either to the community such as recreation or safety or serve the community during emergency situations
Lowest potential quality of life benefits rated as Purple whereas as highest potential benefits rated as Green
Table 6 ndash Evaluation matrix for comparison of mitigation alternatives across the useful life of a project
Project title_______________________________________________________________________________
Evaluation Criteria
Baseline Condition (Designed to NYC Building Code and
Standards)
Resilient Design Alternatives for Managing__________________
Alternative 1
Alternative 2
Alternative 3
First Costs
ConstructabilityEase of ImplementationEnvironmental ImpactsCo-BenefitsPermitting
Operation and Maintenance (OampM)
Reliability and Durability
Risk Reduction Benefits
Quality of Life BenefitsVisual Aesthetics
NYC Mayorrsquos Office of Recovery and Resiliency Climate Resiliency Design Guidelines
32IIID BCA METHODOLOGY FOR PROJECTS UNDER $50 MILLION
Table 7 ndash Evaluation matrix for comparison of mitigation alternatives across the useful life of a project - COMPLETED EXAMPLE
Evaluation Criteria
Baseline Condition (Designed to NYC Building Code and
Standards)
Resilient Design Alternatives for Managing Coastal SurgeSLR
Alternative 1Flood proof building built on grade to Guidelines
DFE
Alternative 2 Elevate building structure above Guidelinesrsquo DFE
on columns
Alternative 3 Raise site grade by filing the building site footprint
to Guidelinesrsquo DFE
First CostsBaseline cost for building structure is $15 million
Incremental costs are within 5 over the baseline costs
Incremental costs are between 5-10 over baseline costs
Incremental costs are 20 and more over baseline costs
ConstructabilityEase of Implementation
Relatively easy to construct within site constraints
Similar to baseline conditions since construction requires additional flood proofing only
Moderate challenges to construct foundation structure for columns within site constraints
Extremely challenging to construct within the site constraints Potentially fatal flaw
Environmental ImpactsCo-BenefitsPermitting
No major impacts but may require additional effort to obtain DOB permits with flood proofing and deployable systems
No major impacts but may require additional effort to obtain DOB permits with flood proofing and deployable systems
No major impacts and relatively easy to permit
Potential drainage circulation impacts and challenges to obtain clean fill material for the site
Operation and Maintenance (OampM)
Major OampM costs associated with deployable systems
Major OampM costs associated with deployable systems
Moderate OampM costs associated with proposed elevator for access
Minimal OampM costs since deployable and elevators not required
Reliability and Durability
Least reliability with highest potential risk from flooding during to failure of deployable systems
Least reliability with highest potential risk from flooding during to failure of deployable systems
Moderate reliability with potential risk from flooding limited to elevator shaft only
Highest reliability since deployable are not required to protect building from flooding
Risk Reduction Benefits
Maximum flood risk reduction benefits assuming deployable and flood proofing is effective
Maximum flood risk reduction benefits assuming deployable and flood proofing is effective
Maximum flood risk reduction benefits
Maximum flood risk reduction benefits
Quality of Life BenefitsVisual Aesthetics
Facility may not be operational during the storm event
Facility may not be operational during the storm event
Facility can be potentially operational during the storm event
Facility can be potentially operational during the storm event
Qualitative Color Scale Green=Least resource intensive alternative Purple=most resource intensive yellow=medium level of resource intensity
A new non-critical facility with a building structure is proposed on a site that is currently in the 2015 Preliminary FEMA 1 annual chance floodplain with a BFE of 10rsquo (NAVD 88) The baseline conditions DFE to meet existing NYC codes and standards is 11rsquo (NAVD 88) Using the Guidelines recommended design criteria the facilityrsquos DFE is 133rsquo (NAVD 88) and existing grade is around 6rsquo (NAVD 88) The project design team develops three alternatives to meet the Guidelinesrsquo recommended DFE design for the facility Table 7 offers an example of how a qualitative assessment can be used to compare three resilient design alternatives using the evaluation criteria and metrics
CASE STUDY Example of How to Use the Evaluation Matrix
NYC Mayorrsquos Office of Recovery and Resiliency Climate Resiliency Design Guidelines
33IIIE BCA METHODOLOGY FOR PROJECTS OVER $50 MILLION
E BCA methodology for projects over $50 millionIn order for a project to be considered cost-effective a benefit-cost analysis (BCA) assesses if the benefits of a project outweigh its costs or in other words the benefit-cost ratio (BCR) is greater than 10 as illustrated in Equation 1
Equation 1 Benefit-Cost Ratio Formula
BCR =
Where BCR = Benefit-Cost Ratio
BENEFITS = Total project benefits
COSTS = Total project costs
BENEFITSCOSTS
These estimated project benefits are combined with the project costs which are defined as the differential construction and long-term operation and maintenance costs associated with constructing a proposed project to the Guidelinesrsquo recommended design level It is assumed that the baseline project will be designed to the most prevalent NYC codes and standards This benefit methodology should be used to determine the additional project benefit that the Guidelinesrsquo recommended design would provide over the baseline project benefit It is assumed that the project design team will develop alternatives to address each of the following applicable climate stressors - sea level risecoastal storm surge increased precipitation and extreme heat - separately For each alternative the project design team should use the following steps to determine the Benefit-Cost Ratio (BCR)
a) Determine project useful life for design interventions Determining the useful life of the proposed project is an important first step in the
detailed BCA assessment methodologies for two reasons First the project useful life determines what values must be used from the Guidelines to establish the future climate design conditions The various hazard tables in the Guidelines establish design requirements based on useful life ranges through 2039 2040-2069 2070-2099 and 2100+ (2100+ projections are only available for sea level rise) A review of these tables show that the design requirements needed to meet the projected climate hazards increase as the end of useful life range increases Second the useful life determines how long the project will need to be operated and maintained in order to remain technically sound and effective at reducing future damages and losses
b) Determine discount rate for project benefits calculation The cost-effectiveness of projects assessed using the BCR must be done on a net
present value basis meaning the present value of the benefits is compared to the present value of the costs Most project costs are computed for present value based on current cost estimates bids or cost guidance However project benefits - as well as project costs for operation and maintenance - accrue over time into the future and are computed on an annualized basis To address this issue the Present Value Coefficient (PVC) is used to bring these annualized project benefits and OampM costs into the present value As indicated by the formula in Equation 2 the PVC is a function of the Project Useful Life (PUL) and the Discount Rate (DR)
NYC Mayorrsquos Office of Recovery and Resiliency Climate Resiliency Design Guidelines
34
Equation 2 Present Value Coefficient (PVC) Formula
PVC =
Where PVC = Present Value Coefficient
PUL = BCA Project Useful Life based on project type
DR = Discount Rate
The project design team should coordinate with agencies and NYC OMB if needed to determine appropriate discount rates based on funding source project type and other factors This coordination should take place during project initiation phase where total project costs (design and construction) are over $50 million66
c) Develop input data to perform benefit calculations Tables 16 and 17 in Appendix 4 provide a list of typical input data by each climate
stressor needed to perform benefit analysis quantitatively on variety of facilities67 The project design team should use these tables as a reference to identify appropriate input data categories andor additional input data needed to perform benefit analysis on the project
d) Identify applicable project benefit categories to estimate benefits Tables 16 and 17 in Appendix 4 provide a list of typical project benefits by each climate
stressor needed to perform benefit analysis quantitatively on various types of projects The project design team should use these tables as a reference to identify appropriate project benefit categories for each climate stressor to perform benefit analysis on the project
e) Calculate benefits of recommended design interventions for each climate
stressor The input data and applicable project benefits can be assembled along with
incremental project cost data to analyze cost-effectiveness using the FEMA BCA Tool Damage-Frequency Assessment (DFA) module or similar software This analysis will provide a BCR for each alternative which can then be used to compare the alternatives that were developed to mitigate effects from applicable climate stressors The project design team can then use the results from this analysis to identify optimal interventions that provides a balanced solution that provides resiliency benefits within the available project budget
IIIE BCA METHODOLOGY FOR PROJECTS OVER $50 MILLION
[1 ndash (1 + DR) -(PUL)]DR
66 For example a NYC OMB March 2015 memorandum recommends using an annually updated DR as published each year in Appendix C of OMB Circular A-94 The current OMB-recommended discount rates from OMB A-94 Appendix C vary by project useful life and are as follows 21 DR for useful lives of 10 to 19 years 25 DR for useful lives of 20 to 29 years and 28 DR for useful lives of 30 years or greater By contrast FEMA hazard mitigation grants use a DR of 70 for all projects based on the Federal OMB A-94 rate for federally-funded mitigation measures Since these DRs will impact the PVC and the project benefits the project team must ensure that BCA results prepared using an OMB-recommended DR (21 to 28) be updated to reflect the Federal DR (70) when applying for FEMA mitigation grant funds
67 Note the data requirements for the sea level rise and increased precipitation hazards in Table 16 are more detailed than the requirements for the extreme heat hazards due to the less detailed level of analysis available for extreme heat
NYC Mayorrsquos Office of Recovery and Resiliency Climate Resiliency Design Guidelines
35
APPENDICES
NYC Mayorrsquos Office of Recovery and Resiliency Climate Resiliency Design Guidelines
36APPENDIX 1 ndash KEY TERMS
100-year flood (1 annual chance flood)
A flood that has a 1 probability of occurring in any given year The 100-year floodplain is the extent of the area of a flood that has a 1 chance of occurring or being exceeded in any given year
500-year flood (02 annual chance flood)
A flood that has a 02 probability of occurring in any given year The 500-year floodplain is the extent of the area of a flood that has a 02 chance of occurring or being exceeded in any given year
AdaptationAdjustment in natural or human systems to a new or changing environment that seeks to maximize beneficial opportunities or moderate negative effects Successful adaptations contribute to resiliency
Base flood elevation (BFE)The elevation of surface water resulting from a flood that has a 1 annual chance of occurring or being exceeded in any given year The BFE is shown on the Flood Insurance Rate Map (FIRM)69
BluebeltReference to the Department of Environmental Protectionrsquos (DEP) Bluebelt program to preserve natural drainage corridors including streams ponds and other wetland areas Preservation of these wetland systems allows them to perform their functions of conveying storing and filtering storm water
Climate
The average weather (or more rigorously a statistical description of the average in terms of the mean and variability) over a period of time usually 30 years These quantities are most often surface variables such as temperature precipitation and wind Climate in a wider sense is the state including a statistical description of the climate system70
Climate change
Changes in average weather conditions that persist over multiple decades or longer Climate change encompasses both increases and decreases in temperature as well as shifts in precipitation changing risk of certain types of severe weather events and changes to other variables of the climate system
Climate change riskThe chance that investments (such as in capital projects) can be affected by the physical impacts of climate change71 Risks are evaluated as a product of the probability of occurrence and the magnitude of damages or impacts including socioeconomic factors that would result if they did occur (consequences)
Climate change risk assessment
This assessment involves a detailed project-specific analysis that includes a vulnerability and risk assessment often followed by cost-benefit analysis to assess and select investments in climate change risk mitigation Risk is assessed as a function of the magnitude and probability of a given climate change hazard Examples resources are included in Appendix 7
Climate vulnerabilityThe degree to which systems and populations are affected by adverse impacts It is a function of the character magnitude and rate of climate change and variation to which a system is exposed its sensitivity and its adaptive capacity72
Cloudburst An extreme amount of rain in a short period of time often over a small geographic area73
Cooling Degree Day (CDD) A form of degree-day used to estimate the energy requirements for air conditioning or refrigeration when the daily mean temperature is above 65degF
68 All terms are from the US Global Change Research Program (USGCRP) glossary unless otherwise noted The USGCRP glossary is available at httpwwwglobalchangegovclimate-changeglossary
69 ldquoDefinitionsrdquo FEMA last modified March 1 2017 httpswwwfemagovnational-flood-insurance-programdefinitions70 UKCIP Glossary httpwwwukciporgukglossary71 ldquoAccount for Climate Riskrdquo International Finance Corporation 72 UKCIP Glossary httpwwwukciporgukglossary73 New York City Environmental Protection ldquoCloudburst Resiliency Planning Studyrdquo 2017 Available at httpwwwnycgovhtmldeppdfclimatenyc-cloudburst-studypdf
APPENDIX 1 - KEY TERMS68
NYC Mayorrsquos Office of Recovery and Resiliency Climate Resiliency Design Guidelines
37APPENDIX 1 ndash KEY TERMS
Design life The life expectancy of an asset or product as determined during design74 As opposed to useful life (see below)
Dry Bulb temperature The ambient air temperature measured by a thermometer
Extreme eventUnexpected unusual or unpredictable weather or flooding compared to historical or future projected distribution Extreme events include for example heat waves cold waves heavy rains periods of drought and flooding and severe storms
Facilities For the purposes of this document ldquofacilitiesrdquo refers to all types of buildings housing infrastructure structures and landscape features designed by or for the City of New York
Flexible adaptation pathwayResilience-building strategies that can evolve or be adapted over time as climate change risk assessments evaluations of adaptation strategies and monitoring continue75
Flood Insurance Rate Maps (FIRM)
Official flood map of a community on which FEMA has delineated the 1 annual chance floodplain and the base flood elevations (BFEs) applicable to the community76 The FIRM also includes the 02 floodplain annual chance floodplain and differentiates between special flood hazard areas (V A Coast A zones) and floodways The official FIRM is from the year 2007 while the 2015 PFIRM is currently required by NYC Building Code to calculate design flood elevations NYC DOB references the more restrictive of the two maps in both base flood elevation and flood hazard area (ie V versus A zone) Refer to Appendix 3 for more information
FreeboardAn additional amount of height above the base flood elevation used as a factor of safety (eg two feet above the base flood) in determining the level at which a facilitys lowest floor must be elevated or floodproofed to be in accordance with state or community floodplain management regulations77
Future time slices
Future periods defined by the NPCC for when climate change projections are available In this document the following decadal projections are associated with specific time spans2020s projection = present to 20392050s projection = 2040 to 20592080s projection = 2070 to 20992100s projection = end of century and beyond
Green infrastructureAn array of practices that use or mimic natural systems to manage urban stormwater runoff Water is either directed to engineered systems for infiltration or detained for longer periods before it enters the sewer system
Heat Vulnerability Index (HVI)Summarizes relative risk of adverse health effects from heat due to social and environmental factors Used to identify neighborhoods at higher risk during and after extreme heat events
Heat wave A period of three consecutive days where temperatures rise above 90degF or two consecutive days over 95 degrees78
New York City Panel on Climate Change (NPCC)
The body of leading climate and social scientists charged with making climate change projections for the metropolitan region79
74 Sustainable Infrastructure Management Program Learning Environment httpsimplewerforg 75 Rosenzweig C et al Climate Change Adaptation in New York City Building a Risk Management Response76 ldquoDefinitionsrdquo FEMA77 Ibid78 Horton R et al New York City Panel on Climate Change 2015 Report Chapter 1 Climate Observations and Projections Ann NY
Acad Sci ISSN 0077-8923 (New York 2015) 2579 For more information on the NPCC visit www1nycgovsiteorrchallengesnyc-panel-on-climate-changepage
NYC Mayorrsquos Office of Recovery and Resiliency Climate Resiliency Design Guidelines
38APPENDIX 1 ndash KEY TERMS
Open-grid pavement system
Pavements that consist of loose substrates supported by a grid of a more structurally sound grid or webbing Unbounded loose substrates in these systems transfer and store less heat than bound and compacted pavements and aid permeability Pavement is 50 pervious and contains vegetation in the open cells designed to allow percolation or infiltration of storm water through the surface into the soil below80
Preliminary Flood Insurance Rate Map (PFIRM)
Preliminary flood map developed by FEMA in 2015 for New York City that provides projected risks for flood hazards81 Refer to Appendix 3 for more information
Project useful life (PUL)
The period over which an asset or component is expected to be available for use by an entity This depends on regular and adequate maintenance This period of time typically exceeds the design life (see above) The combined effect of operational requirements and useful life is practical in assessing an investment in improving resilience82
Rain gardenAlso called ldquobioswalerdquo Planted areas designed to collect and manage stormwater that runs off streets sidewalks commercial and residential rooftops and other sources when it rains
Resiliency The ability to bounce back after change or adversity The capability of preparing for responding to and recovering from difficult conditions83
Sea level rise-adjusted design flood elevation
As defined in these Guidelines the increased height of the base flood elevation due to sea level rise plus freeboard depending on the criticality of the facility The sea level rise adjustment depends on the useful life of the facility
Storm surge An abnormal rise of water generated by a storm over and above predicted astronomical tides84
Substantial improvementAny repair reconstruction rehabilitation addition or improvement of a building or structure the cost which equals or exceeds 50 of the market value of the structure before the improvement or repairs started For more information see Appendix G of the NYC Building Code and 1 RCNY sect3606-0185
Tidal inundation Flooding which occurs at high tides due to climate-related sea level rise land subsidence andor the loss of natural barriers86
Urban Heat Island (UHI) effectThe tendency for higher air temperatures to persist in urban areas as a result of heat absorbed and emitted by buildings and asphalt tending to make cities warmer than the surrounding suburban and rural areas
Weather The state of the atmosphere at a given time with regard to temperature cloudiness precipitation wind and other meteorological conditions87
Wet Bulb temperatureThe temperature indicated when a thermometer bulb is covered with a water-saturated wick over which air is caused to flow at approximately 45 ms (900 ftmin) to reach the equilibrium temperature of water evaporating into the air when the heat of vaporization is supplied by the sensible heat of the air88
80 ldquoGlossaryrdquo US Green Building Council (2017) Available at httpwwwusgbcorgglossaryterm552581 ldquoPreliminary FEMA Map Productsrdquo FEMA Map Service Center Available at httpshazardsfemagovfemaportalprelimdownload82 ldquoGlossaryrdquo International Infrastructure Management Manual (2011) 83 A Stronger More Resilient New York (2013) 184 ldquoStorm Surge Overviewrdquo National Hurricane Center NOAA Available at httpswwwnhcnoaagovsurge85 ldquoFlood Resistant Constructionrdquo Appendix G New York City Building Code (2008) and 1 RCNY sect3606-01 available at httpswww1nycgovassetsbuildingsrules1_RCNY_3606-01pdf86 ldquoOcean Factsrdquo National Ocean Service NOAA Available at httpoceanservicenoaagovfactsnuisance-floodinghtml 87 UKCIP Glossary httpwwwukciporgukglossary88 ldquoASHRAE Terminologyrdquo ASHRAE Available at httpswwwashraeorgtechnical-resourcesauthoring-toolsterminology
NYC Mayorrsquos Office of Recovery and Resiliency Climate Resiliency Design Guidelines
39APPENDIX 2 - CLIMATE CHANGE PROJECTIONS
Climate change projections are provided by the New York City Panel on Climate Change (NPCC) The full NPCC report is available from the New York Academy of Sciences89 Tables 8-10 (below) were reproduced directly from the NPCC report while Table 2 (see Section IIA) was developed using the data underlying the NPCC report to inform the design of HVAC systems under warmer conditions
Table 8 ndash NYC sea level rise projections90
Baseline (2000-2004) 0 in
Low estimate (10th percentile)
Middle range (25th to 75th percentile)
High estimate (90th percentile)
2020s 2 in 4-8 in 10 in
2050s 8 in 11-21 in 30 in
2080s 13 in 18-39 in 58 in
2100 15 in 22-50 in 75 in
Note Projections are based on six-component approach that incorporates both local and global factors The model-based components are from 24 global climate models and two representative concentration pathways Projections are relative to the 2000-2004 base period
Table 9 ndash Mean annual changes91
a Temperature Baseline(1971-2000) 54degF
Low estimate (10th percentile)
Middle range (25th to 75th percentile)
High estimate (90th percentile)
2020s + 15degF +20-29degF +32degF
2050s +31degF +41-57degF +66degF
2080s +38degF +53-88degF +103degF
2100 +42degF +58-104degF +121F
b Precipitation Baseline(1971-2000) 501 in
Low estimate (10th percentile)
Middle range (25th to 75th percentile)
High estimate (90th percentile)
2020s -1 percent +1-8 +10
2050s +1 percent +4-11 +13
2080s +2 percent +5-13 +19
2100 -6 percent -1 to +19 +25
Note Based on 35 global climate models (GCMs) and two RCPs Baseline data cover the 1971ndash2000 base period and are from the NOAA National Climatic Data Center (NCDC) Shown are the low estimate (10th percentile) middle range (25th percentile to 75th percentile) and high estimate (90th percentile) These estimates are based on a ranking (from most to least) of the 70 (35 GCMs times 2 RCPs) projections The 90th percentile is defined as the value that 90 percent of the outcomes (or 63 of the 70 values) are the same or lower than Like all projections the NPCC climate change projections have uncertainty embedded within them Sources of uncertainty include data and modeling constraints the random nature of some parts of the climate system and limited understanding of some physical processes The NPCC characterizes levels of uncertainty using state-of-the-art climate models multiple scenarios of future greenhouse gas concentrations and recent peer-reviewed literature Even so the projections are not true probabilities and the potential for error should be acknowledged
89 The NPCC 2015 report is available at httponlinelibrarywileycomdoi101111nyas20151336issue-1issuetoc90 From New York City Panel on Climate Change 2015 Report Chapter 1 Climate Observations and Projections page 4191 From New York City Panel on Climate Change 2015 Report Chapter 1 Climate Observations and Projections page 30
APPENDIX 2 - CLIMATE CHANGE PROJECTIONS
NYC Mayorrsquos Office of Recovery and Resiliency Climate Resiliency Design Guidelines
40APPENDIX 2 - CLIMATE CHANGE PROJECTIONS
Table 10 ndash Extreme events92
2020s Baseline (1971-2000)
Low estimate(10th percentile)
Middle range(25th to 75th percentile)
High estimate (90th percentile)
Numbers of heat waves per year 2 3 3-4 4
Average heat wave duration (days) 4 5 5 5
Number of days per year with
Maximum temperature at or above 90degF 18 24 26-31 33
Maximum temperature at or above 100degF 04 07 1-2 2
Minimum temperature at or below 32degF 71 50 52-58 60
Rainfall at or above 1 inch 13 13 14-15 16
Rainfall at or above 2 inches 3 3 3-4 5
Rainfall at or above 4 inches 03 02 03ndash04 05
2050s Baseline (1971-2000)
Low estimate(10th percentile)
Middle range(25th to 75th percentile)
High estimate (90th percentile)
Numbers of heat waves per year 2 4 5-7 7
Average heat wave duration (days) 4 5 5-6 6
Number of days per year with
Maximum temperature at or above 90degF 18 32 39-52 57
Maximum temperature at or above 100degF 04 2 3-5 7
Minimum temperature at or below 32degF 71 37 42-48 52
Rainfall at or above 1 inch 13 13 14-16 17
Rainfall at or above 2 inches 3 3 4-4 5
Rainfall at or above 4 inches 03 03 03-04 05
2080s Baseline (1971-2000)
Low estimate(10th percentile)
Middle range(25th to 75th percentile)
High estimate (90th percentile)
Numbers of heat waves per year 2 5 6-9 9
Average heat wave duration (days) 4 5 5-7 8
Number of days per year with
Maximum temperature at or above 90degF 18 38 44-76 87
Maximum temperature at or above 100degF 04 2 4-14 20
Minimum temperature at or below 32degF 71 25 30-42 49
Rainfall at or above 1 inch 13 14 15-17 18
Rainfall at or above 2 inches 3 3 4-5 5
Rainfall at or above 4 inches 03 02 03-05 07
Note Projections for temperature and precipitation are based on 35 GCMs and 2 RCPs Baseline data are for the 1971 to 2000 base period and are from the NOAA National Climatic Data Center (NCDC) Shown are the low estimate (10th percentile) middle range (25th to 75th percentile) and high estimate (90th percentile) 30-year mean values from model-based outcomes Decimal places are shown for values less than one although this does not indicate higher precisioncertainty Heat waves are defined as three or more consecutive days with maximum temperatures at or above 90degF Like all projections the NPCC climate change projections have uncertainty embedded within them Sources of uncertainty include data and modeling constraints the random nature of some parts of the climate system and limited understanding of some physical processes The NPCC characterizes levels of uncertainty using state-of-the-art climate models multiple scenarios of future greenhouse gas concentrations and recent peer-reviewed literature Even so the projections are not true probabilities and the potential for error should be acknowledged
92 From New York City Panel on Climate Change 2015 Report Chapter 1 Climate Observations and Projections page 31
NYC Mayorrsquos Office of Recovery and Resiliency Climate Resiliency Design Guidelines
41APPENDIX 3 - DIFFERENTIATION OF FLOOD MAPS
These Guidelines reference several different kinds of flood maps and sources of design flood elevations These maps are described and differentiated below
Table 11 - Differentiation of flood maps used in NYC
Reference Title Data Source Information Provided Referenced By Link
2007 FIRM FEMA
Based on historical data from before 1983 identifies the current base flood (extent and elevation) as the flood that has a 1 chance of occurring in any given year also known as a 100-year flood The NYC Building Code requires that either the 2007 FIRM or 2015 PFIRM elevation be used whichever is higher
2014 NYC Building Code Appendix G
Climate Resiliency Design Guidelines
httpsmscfemagovportal
2015 PFIRM FEMA
Based on historical data identifies the current base flood (extents and elevation) as the flood that has a 1 chance of occurring in any given year also known as a 100-year flood The NYC Building Code requires that either the 2007 FIRM or 2015 PFIRM elevation be used whichever is higher The 2015 PFIRM is currently being reassessed by FEMA
2014 NYC Building Code Appendix G
Climate Resiliency Design Guidelines
httpshazardsfemagovfemaportalprelimdownload
httpwwwregion2coastalcomview-flood-maps-dataview-preliminary-flood-map-data
NYC Flood Hazard Mapper
NYC Department of City Planning
Maps current and future flood hazards in NYC including the following data layers 2007 FIRM and 2015 PFIRM high tide with sea level rise and PFIRM with sea level rise through 2100
Climate Resiliency Design Guidelines
Waterfront Revitalization Plan
httpwww1nycgovsiteplanningdata-mapsflood-hazard-mapperpage
ldquoTable 4 ndash Determine the sea level rise-adjusted design flood elevation for critical and non-critical facilitiesrdquo
ORR amp NPCC
Provides data to use when adding sea level rise to a given 2015 PFIRM or 2007 FIRM Base Flood Elevation (BFE) to calculate a Design Flood Elevation (DFE) Based on the criticality and expected useful life of a facility
Climate Resiliency Design Guidelines
See Section II on ldquoSea Level Riserdquo above
APPENDIX 3 - DIFFERENTIATION OF FLOOD MAPS
NYC Mayorrsquos Office of Recovery and Resiliency Climate Resiliency Design Guidelines
42APPENDIX 4 - PROJECT BENEFITS CATEGORIES
This appendix provides guidance on how to identify and assess benefits as a supplement to Sections IIID and IIIE
Table 12 lists typical direct benefits for reducing impacts from climate stressors and basic guidance for how to estimate them See Section IIID for more information
Table 13 lists typical indirect benefits for reducing impacts from climate stressors and basic guidance for how to estimate them See Section IIID for more information
Table 12 ndash Direct benefits for (1) sea level rise with coastal storm surge and (2) increased precipitation measures
Direct Benefit Basic Guidance for Estimating Values
Physical Damages (Structure Contents)
bull For flood-damaged buildings use depth damage functions developed by FEMA and USACE for structures and contents
bull Use depth damage functions in conjunction with Building Replacement Values (BRVs) and not market values BRVs typically range between $100 to $325SF for residential buildings and $120 to $450SF for commercial public buildings
bull For more complex structures or facilities use engineering estimates of flood damages or review historic flood damages documented from insurance claims repair records or FEMA Public Assistance claims from recent flood disasters
Residential Displacements
bull For flood-damaged buildings use depth damage functions developed by FEMA and USACE for residential displacements
Reduced Life CycleOperation and Maintenance (OampM) Costs93
bull Applicable only to projects that reduce overall life cycle costs or net annual OampM costs from baseline conditions
bull Input reduced annual OampM costs as a project benefit at a 1-year recurrence intervalbull Reduced overall life cycle costs can be input as a longer project useful life
Table 13 ndash Indirect benefits for (1) sea level rise with coastal storm surge and (2) increased precipitation measures
Indirect Benefit Basic Guidance for Estimating Values
Non-Residential Building Service Losses
bull Estimate service loss values and durations for non-residential buildings public buildings critical facilities and parksnatural features based on FEMA BCA guidance and standard values based on building use
Utility Service Losses94
bull Estimate utility service losses for water wastewater and electrical facilities based on the number of impacted customers FEMA per capita standard values for utility service ($105personday for potable water $49personday for wastewater $148personday for electrical)95
bull Estimate utility service loss durations based on engineering estimates or review historic flood damages losses documented from utility company records
bull This benefit can also apply to measures that increase energy efficiency
RoadBridge Service Losses
bull Estimate roadbridge service losses based on the average daily traffic (ADT) detour time and additional travel distance and FEMA and GSA standard values for road service ($3344vehiclehour of delay $0545mile)96
bull Estimate roadbridge service loss durations or review historic flood damages losses
Emergency Service Losses
bull Applicable only to projects that reduce or eliminate documented emergency service costs from baseline conditions
bull Examples of avoided emergency services costs include NYPD staffing to monitor barricades for flooded roads or NFDY staffing for water rescues of residents from flooded buildings or streets
APPENDIX 4 - PROJECT BENEFITS CATEGORIES
93 Reduced life cycle costs may be applicable to some measures that provide extreme heat benefits such as green roofs that can last longer than a standard roof if properly maintained
94 Reduced utility service costs may be applicable to some measures that provide extreme heat benefits such as cool roofs green roofs and shade trees
95 FEMA per capita standard values taken from FEMA BCA Toolkit Version 530 (Build Date 12222016) and developed in FEMArsquos Baseline Standard Economic Value Methodology Report (July 28 2016) Consider updating FEMA standard per capita values to reflect current New York City utility rates
96 Consider updating FEMA and GSA standard values to reflect current New York City area labor rates and fuel costs
NYC Mayorrsquos Office of Recovery and Resiliency Climate Resiliency Design Guidelines
43APPENDIX 4 - PROJECT BENEFITS CATEGORIES
Table 14 ndash Other potential benefits for (1) sea level rise with coastal storm surge and (2) increased precipitation measures
Other Benefit Basic Guidance for Estimating Values
Avoided Stress and Anxiety
bull Applicable only for projects that directly benefit occupants of residential structuresbull Use FEMA standard value for avoided mental stress and anxiety treatment costs of $2443person to
estimate benefit for all impacted residents97
Avoided Lost Productivity
bull Applicable only for projects that directly benefit occupants of residential structuresbull Use FEMA standard value for avoided lost worker productivity costs of $8736household to estimate
benefit for all impacted workers (conservatively assuming one worker per household)
Environmental Open Space
bull Applicable only for projects that create or acquire open space areas by acquisitionbull Use FEMA standard value for environmental open space based on the type of land acquired ($8308
Acreyear for Green open space $39545Acreyear for Riparian $6010Acreyear for Wetlands $554Acreyear for Forests $1799Year for Marine and estuary)97
CSO Volume Reduction
bull Applicable only for projects that provide Combined Sewer Overflow (CSO) abatement by reducing the volume of rainfall runoff
bull Use CSO abatement cost of $0015gallonsyear applied to increased precipitation hazard runoff volume for 5-year design storm98
Ecosystem Service99
bull Add stormwater management benefits of green infrastructure projects to increased precipitation hazards where avoided damages and service losses are not quantified
bull Unit benefits applicable to increased precipitation hazard includeo Green roofs $0133SFyear (PUL 40 years)o BioswaleRain GardenMeadow Mix $0020SFyear (PUL 30 years)o Permeable Grass Pavers $0020SFyear (PUL 30 years)o Tree Plantings $303Treeyear (PUL 30 years)o Planter Box Trees $101Treeyear (PUL 15 years)
Real Estate99
bull Potential real estate benefits from increased resilience of residential andor commercial propertiesstreetscapesneighborhoods included within the project scope
bull Benefit applied to extreme heat hazard for green infrastructure projects directly impacting residential or commercial properties
Quality of Life Health Benefits99
bull Potential quality of life benefits related to improved public health from the resilience measures included within the project scope
bull Benefit applied to extreme heat hazard for green infrastructure projects directly impacting residential or commercial properties
Table 14 lists other typical benefits for reducing impacts from climate stressors and basic guidance for how to estimate them See Section IIID for more information
97 FEMA standard values for avoided mental stress and anxiety and environmental open space values taken from FEMA BCA Toolkit Version 530 (Build Date 12222016)
98 CSO abatement cost taken from APG1 Report for NYC ldquoTechnical Approaches for Benefit-Cost Analysis of Hazard Mitigation Projects in Urban and Coastal Environmentsrdquo (April 2016)
99 Ecosystem Services Real Estate and Quality of LifeHealth benefits tend to be more applicable to green infrastructure measures that provide extreme heat benefits such as green roofs trees and other plantings
NYC Mayorrsquos Office of Recovery and Resiliency Climate Resiliency Design Guidelines
44APPENDIX 4 - PROJECT BENEFITS CATEGORIES
Table 15 ndash Potential benefits for extreme heat (Urban Heat Island) reduction measures
Category Benefit Basic Guidance for Estimating Values
Direct Benefit
Reduced Life Cycle Cost
bull Applicable only to measures such as green roofs that are expected to last longer than standard roofs
bull Compute total cost savings including annual OampM costs
Indirect Benefit
Energy Savings
bull Applicable to measures that reduce energy costs by providing cooling through increased shading andor evapotranspiration
bull Use New York Power Authority rates of $0148kWh for electricity and $0810Therm for natural gas
Other Potential Benefits
Air Quality bull Applicable to measures that absorb pollutants andor reduce carbon dioxide emissions
Acoustics bull Applicable to measures such as green roof or walls that reduce noise transfer
Quality of LifeHealth bull Potential quality of life benefits and related to improved public health
Real Estate bull Applicable to measures that provide residential real estate benefits from increased resilience of propertiesstreetscapesneighborhoods
Retail Sales Marketing
bull Applicable to measures that provide commercial property benefits from increased aesthetics resulting in increased marketing and sales for streetscapesneighborhoods
Tax Credits Incentives
bull Applicable to resilience or green infrastructure measures such as green roofs that have accompanying Federal State or City tax credits or other incentives
Table 15 lists potential benefits for reducing impacts from heat and basic guidance for how to estimate them See Section IIID for more information
NYC Mayorrsquos Office of Recovery and Resiliency Climate Resiliency Design Guidelines
45APPENDIX 4 - PROJECT BENEFITS CATEGORIES
Table 16 ndash Guidance on quantitative calculations for (1) sea level rise with coastal storm surge and (2) increased precipitation measures
Data Input General Guidance ndash Basic Description
Applicable Benefit Category
Applicable Typical Facility Typology
Dire
ct B
enefi
ts
Indi
rect
Ben
efits
Oth
er P
oten
tial
Ben
efits
Bui
ldin
g St
ruct
ures
Com
plex
Fa
cilit
ies
Tran
spor
tatio
nSt
reet
scap
es
Plaz
as
Park
Fea
ture
s
First Floor Elevation (FFE)
bull The elevation of the first finished floor of the structure excluding basements
bull FFE measured from top of lowest floor (riverinenon-coastal high hazard areas) or bottom of lowest horizontal structural member (coastal high hazard areas)
Y Y Y Y
Building Replacement Value (BRV)
bull The unit cost to rebuild a structure of the same quality of construction
bull Not the same as market value
Y Y Y Y
Building Size
bull The total floor area of the building in square feet
bull Total Building Value = BRV x Building Sizebull Typical BRVs for NYC range between $100 to
$325SF for residential buildings and $120 to $450SF for commercialpublic buildings
Y Y Y Y
Structure Description
bull The type of building number of stories and foundation type (full basement partial basement no basement)
bull Collect more detailed foundation data for coastal flood zones
Y Y Y Y
Building Use bull Details related to residential housing commercial business and public use
Y Y Y Y Y
Building Type bull The primary use of building ndash residential commercial public and others
Y Y Y Y Y
Depth Damage Function (DDF)
bull Curves used to estimate structure damage contents damage and displacement of residential buildings based on flood depth
bull DDFs selection based on Structure Description Building Type Building Use
bull Structure DDFs based on percentage of Total Building Value
bull Contents DDFs based on percentage of Total Contents Value
bull Displacement DDFs based on number of displacement days x Displacement Cost
Y Y Y Y Y
Contents Value
bull The cost to replace structure contents (furnishings equipment)
bull Residential building Contents Values typically 50 BRV (FEMA DDFs) or 100 BRV (USACE DDFs)
bull Non-residential building Contents Values between 18 to over 100 depending on building use (USACE DDFs)
bull Total Contents Value = BRV x Building Size
Y Y Y Y Y
Table 16 provides general guidance on how to quantitatively calculate benefits from efforts to address from climate stressors See Section IIIE for more information
NYC Mayorrsquos Office of Recovery and Resiliency Climate Resiliency Design Guidelines
46APPENDIX 4 - PROJECT BENEFITS CATEGORIES
Table 16 ndash Guidance on quantitative calculations for (1) sea level rise with coastal storm surge and (2) increased precipitation measures
Data Input General Guidance ndash Basic Description
Applicable Benefit Category
Applicable Typical Facility Typology
Dire
ct B
enefi
ts
Indi
rect
Ben
efits
Oth
er P
oten
tial
Ben
efits
Bui
ldin
g St
ruct
ures
Com
plex
Fa
cilit
ies
Tran
spor
tatio
nSt
reet
scap
es
Plaz
as
Park
Fea
ture
s
Number of Residents (Residential)
bull Total number of occupants in a residential building
bull Typically estimated based on number of residential units x average number of individuals per household (based on current US Census data or use 25 individuals per household as a default)
Y Y Y Y Y
Displacement Cost (Residential)
bull The unit cost to lodge and feed displaced residents while flood damage is repaired
bull Average unit displacement cost of $415residential unitday recommended based on current FY2018 GSA Per Diem rates for New York City
Y Y Y Y Y
Value of Service (Non-Residential and Public)
bull The unit cost of service disruption and rental of temporary facilities while flood damage is repaired
bull Disruption costs for non-residential buildings typically range from $095 to $136SFmonth and rental costs range from $020 to $136SFmonth depending on building use
bull Value of service for public buildings ($day) is typically based on the annual operating budget for the City agency using the building prorated based on building size or population served by the building then divided by 365 daysyear
Y Y Y Y
Value of Service (Critical Facilities)
bull The unit cost of critical facilities (police fire emergency medical services) lost or delayed while flood damage is repaired
Y Y Y
Value of Service Duration
bull The duration of service disruption and rental of temporary facilities for non-residential buildings and critical facilities while flood damage is repaired
bull For non-residential buildingso Value of Service Durations vary from
4 months to over 30 months based on building use and the depth of flooding
o Total Value of Service Loss = (Disruption Cost x Building Area) = (Rental Cost x Building Area x Value of Service Duration)
bull For public buildings and critical facilitieso Value of Service Durations vary from 0
days to 720 months based on building use and the depth of flooding from FEMA FIA or USACE DDFs
o Total Value of Service Loss = (Value of Service) x (Service Loss Duration)
Y Y Y
NYC Mayorrsquos Office of Recovery and Resiliency Climate Resiliency Design Guidelines
47APPENDIX 4 - PROJECT BENEFITS CATEGORIES
Table 16 ndash Guidance on quantitative calculations for (1) sea level rise with coastal storm surge and (2) increased precipitation measures
Data Input General Guidance ndash Basic Description
Applicable Benefit Category
Applicable Typical Facility Typology
Dire
ct B
enefi
ts
Indi
rect
Ben
efits
Oth
er P
oten
tial
Ben
efits
Bui
ldin
g St
ruct
ures
Com
plex
Fa
cilit
ies
Tran
spor
tatio
nSt
reet
scap
es
Plaz
as
Park
Fea
ture
s
Engineering Estimates for Damages
bull Engineered estimate models of physical damages and service losses at the project site based on the Guidelines event recurrence interval(s) and flood depth(s)
Y Y Y Y Y Y
Historic Damages and Service Losses
bull Historic physical damages and service losses at the project site documented from previous flood events
bull Do not use routine maintenancebull The historic damage event recurrence interval
(RIs) andor flood depths must be determined updated for inflation to the present value and adjusted to match the Guidelines event RIsflood depths
Y Y Y Y Y Y
Facility Replacement Value
bull The unit cost to rebuild the facility
Impacted Area bull The geographic area impacted by the facility in the event of failure in acres
Y Y Y Y
Facility Capacity
bull The design capacity of the facilitybull For example - facility capacity expressed in
millions of gallons per day (MGD) for water and wastewater facilities or megawatts (MW) for electrical facilities
Y Y Y Y
Service Population
bull The number of impacted residents served by the facility
bull Typically estimated based on number of impacted residential customers x average number of individuals per household (based on current US Census data or use 25 individuals per household as a default)
bull Facilities serving mostly non-residentialpublic buildings andor critical facilities should focus on service losses rather than service population
Y Y Y
NYC Mayorrsquos Office of Recovery and Resiliency Climate Resiliency Design Guidelines
48APPENDIX 4 - PROJECT BENEFITS CATEGORIES
Table 16 ndash Guidance on quantitative calculations for (1) sea level rise with coastal storm surge and (2) increased precipitation measures
Data Input General Guidance ndash Basic Description
Applicable Benefit Category
Applicable Typical Facility Typology
Dire
ct B
enefi
ts
Indi
rect
Ben
efits
Oth
er P
oten
tial
Ben
efits
Bui
ldin
g St
ruct
ures
Com
plex
Fa
cilit
ies
Tran
spor
tatio
nSt
reet
scap
es
Plaz
as
Park
Fea
ture
s
Value of Service
bull Unit value of service provided by the facilitybull Example of FEMA standard values for complete
loss of utility service $105personday for potable water$49personday for wastewater$148personday for electrical
bull Consider updating FEMA standard per capita values to reflect current The New York City utility rates
Y Y
Roadway Elevations bull Roadway Elevations
Y Y
Roadway Replacement Value
bull Roadway Replacement ValueY Y
Inundation Area Map
bull Inundation Area Map developed by FEMA or through modeling by project design team
Y Y Y
Building Inventory of Inundation Area
bull The number and type of buildings within the streetscape and neighborhood inundated by the Guidelinersquos flood events
Y Y Y
Average Daily Traffic (ADT)
bull The average number of one-way traffic trips per day along the roadway(s) within the streetscapeneighborhood inundated by the Guidelinersquos flood events
Y Y
Additional Travel Time
bull The additional travel time needed to detour around a flooded roadway expressed in minutes
bull In the unlikely event there is no detour available use a 12-hour travel time per one-way trap but provide a detailed area street map as supporting documentation
Y Y
Value of Traffic Delay
bull The value of service associated with lost time in traffic
bull For example - FEMA standard average value of $3344vehiclehour of delay
bull Consider updating FEMA and GSA standard values to reflect current New York City area labor rates and fuel costs
Y Y
NYC Mayorrsquos Office of Recovery and Resiliency Climate Resiliency Design Guidelines
49APPENDIX 4 - PROJECT BENEFITS CATEGORIES
Table 17 ndash Guidance on quantitative unit benefit calculations for extreme heat hazard measures
Measure General Guidance ndash Unit Benefit Information and Data Requirements
Applicable Benefit Category
Applicable Typical Facility Typology
Dire
ct B
enefi
ts
Indi
rect
Ben
efits
Oth
er P
oten
tial
Ben
efits
Bui
ldin
g St
ruct
ures
Com
plex
Fa
cilit
ies
Tran
spor
tatio
nSt
reet
scap
es
Plaz
as
Park
Fea
ture
s
Green Roof
bull Unit benefit range over PUL = $470SF to $373SF of green roof area ($719SF standard value)
bull Assumed PUL = 40 yearsbull Apply standard value unit benefit to green
roof area to estimate measure benefitbull Higher range values more applicable
to residential and commercial building streetscape projects
Y Y Y Y Y Y
Bioswale Rain Garden Meadow Mix
bull Unit benefit range over PUL = $396SF to $211SF of area ($730SF standard value)
bull Assumed PUL = 30 yearsbull Apply standard value unit benefit to bioswale
rain gardenmeadow mix area to estimate total measure benefit
Y Y Y Y Y Y
Cool Roof
bull Unit benefit range over PUL = $117 to $3151SF of material area ($144SF standard value)
bull Assumed PUL = 20 yearsbull Apply standard value unit benefit to cool roof
area to estimate total measure benefitbull Higher range values more applicable to
residential building streetscape projects
Y Y Y Y Y
Light-Colored PaversLight-Colored Materials
bull Unit benefit range over PUL = $0774 to $204SF of material area ($0866SF standard value)
bull Assumed PUL = 30 yearsbull Apply standard value unit benefit to material
area to estimate total measure benefit
Y Y Y Y
Table 17 provides general guidance on how to quantitatively calculate benefits from efforts to address climate stressors See Section IIIE for more information
NYC Mayorrsquos Office of Recovery and Resiliency Climate Resiliency Design Guidelines
50APPENDIX 4 - PROJECT BENEFITS CATEGORIES
Table 17 ndash Guidance on quantitative unit benefit calculations for extreme heat hazard measures
Measure General Guidance ndash Unit Benefit Information and Data Requirements
Applicable Benefit Category
Applicable Typical Facility Typology
Dire
ct B
enefi
ts
Indi
rect
Ben
efits
Oth
er P
oten
tial
Ben
efits
Bui
ldin
g St
ruct
ures
Com
plex
Fa
cilit
ies
Tran
spor
tatio
nSt
reet
scap
es
Plaz
as
Park
Fea
ture
s
Tree Planting
bull Unit benefit range over PUL = $1005 to $77154Tree ($1855Tree standard value)
bull Assumed PUL = 30 yearsbull Apply standard value unit benefit to number of
trees to estimate total measure benefitbull Higher range values more applicable
to residential and commercial building streetscape projects
Y Y Y Y Y Y
Planter Box Tree
bull Unit benefit range over PUL = $212 to 16304Tree ($392Tree standard value)
bull Assumed PUL = 15 yearsbull Apply standard value unit benefit to number of
trees to estimate total measure benefitbull Higher range values more applicable
to residential and commercial building streetscape projects
Y Y Y Y Y
Shade Canopy
bull Unit benefit range over PUL = $0363 to $396SF ($0458SF standard value)
bull Assumed PUL = 15 yearsbull Apply standard value unit benefit to area of
shade canopy estimate total measure benefitbull Higher range values more applicable
to residential and commercial building streetscape projects
Y Y Y Y
Permeable Grass Pavers
bull Unit benefit range over PUL = $0258SF to $0521SF of pavers ($0363SF standard value)
bull Assumed PUL = 30 yearsbull Apply standard value unit benefit to paver
area to estimate total measure benefit
Y Y Y Y Y
For the purposes of the BCA refer to the following facility typologies bull ldquoBuilding Structuresrdquo include critical small building sites such as EMS or FDNY stations and non-critical small building sites such as
libraries or comfort stationsbull ldquoComplex Facilitiesrdquo include critical infrastructure such as wastewater treatment sites pump stations water filtration plants and similar
large or complex facilitiesbull ldquoTransportationStreetscapePlazasrdquo include roadway reconstruction streetscape improvements street raising plazas and other
transportation-related infrastructurebull ldquoPark Featuresrdquo include parks and similar public recreational facility with natural landscape features
NYC Mayorrsquos Office of Recovery and Resiliency Climate Resiliency Design Guidelines
51APPENDIX 5 - EXAMPLE PLANNING DECISION TREE
This decision tree provides a summarized example approach for how to implement these Guidelines Projects with a total cost greater than $50 million are recommended to conduct a full qualitative and quantitative climate change risk assessment and BCA while projects below $50 million are recommended to conduct a qualitative risk assessment and BCA
Define Project
1) Operational goals and criticality level2) Useful life3) Location in the current flood plain future floodplain and or zone
of tidal inundation and the project arearsquos score on the heat vulnerability index
Evaluate Project Risks According to Probability and Magnitude of Consequence
bull Extreme Heat bull Precipitationbull Sea Level Risebull Coastal Surge
High Level Identification and Assessment of Risk Mitigation Alternatives and Co-benefits
(qualitative)
Detailed Identification and Assessment of Risk Mitigation Alternatives and Co-benefits (qualitative and quantitative)
High Level Estimate of Costs and Benefits of Design Alternatives
(qualitative)
Detailed Estimate of Costs and Benefits of Design Alternatives
(qualitative and quantitative)
Decision Point Which climate change risks require mitigation
Decision Point Evaluate risk mitigation benefits and costs to
determine final resilient design alternative or if no action is required
Decision Point Is the total project cost above $50 million
Below $50 million Above $50 million
APPENDIX 5 - EXAMPLE PLANNING DECISION TREE
NYC Mayorrsquos Office of Recovery and Resiliency Climate Resiliency Design Guidelines
52
Project Title
Design Strategies Checklist (not exhaustive)
Extreme Heat Comments Extreme Precipitation Comments Sea Level Rise amp Storm Surge Comments
Select Site in Low Heat Vulnerability Index area Select High Elevation Site Select High Elevation Site
Minimize East-West Building Orientation Green Roof Raise Building Floor Elevation
Passive Solar Cooling and Ventilation Systems
Protect Below Grade Areas from Flooding Waterproof Building Envelope
Cool Roof (SRI appropriate) On-site Stormwater Management (gray) Elevate Critical Building Functions
Green Roof (extensive) Reduce Impervious Areas Elevate Critical Equipment
Vegetative Structures Permeable Pavement Perimeter Floodwall100 Levee (passive or active)
Enhanced HVAC System including space layout optimization and system scalability
Increase Green Spaces and Planted Areas DryWet Floodproofing
More Efficient Building Envelope Other Utility Redundancy Design101
Parking Lot Shading Resilient Materials amp Landscape Treatments
Light Colored Pavements (appropriate SRI) Design for Storm Surge Outflow
Increase Planted Areas Install Backwater Flow Prevention
Permeable Surfaces Design for Scour
Open-grid Pavement Raise Road Elevation
Other Other
This appendix provides a template for identifying possible design strategies to address climate change risks as described throughout the Guidelines
APPENDIX 6 - DESIGN STRATEGIES CHECKLIST
100 Permanent perimeter flood walls are not permitted to meet floodproofing requirements in buildings with substantial improvements andor damages 101 Utility redundancy design should be pursued for critical systems not all building systems
APPENDIX 6 - DESIGN STRATEGIES CHECKLIST
NYC Mayorrsquos Office of Recovery and Resiliency Climate Resiliency Design Guidelines
53APPENDIX 7 - CLIMATE CHANGE RISK ASSESSMENT RESOURCES
These Guidelines provide data on climate change hazards and recommend how that data can inform resilient design A risk assessment is a tool to help project managers and designers evaluate risk levels as well as select and prioritize resilient design strategies A high level risk assessment is recommended for all City capital projects with a total cost of under $50 million Projects above $50 million are recommended to conduct an in-depth assessment
Risk assessments use quantified estimates of the probability and magnitude of consequence of an event occurring to prioritize responses ldquoProbabilityrdquo is an assessment of the likelihood of a hazard occurring while ldquomagnituderdquo describes the hazardrsquos potential impact Risk assessment tools such as the examples listed below can be used to define and score these categories Projects that score higher across both probability and magnitude can be prioritized for investment and risk mitigation action Projects that score lower across both criteria may require no action beyond meeting code The results are typically charted on a risk matrix and an example is provided on the next page
The climate change risk management frameworks below offer templates for how to integrate climate change projections into a risk assessment process Refer to these resources for examples and further information
bull Vulnerability Assessment and Adaptation Framework is prepared by the Federal Highway Administration (FHWA) While developed for transportation planning this risk assessment framework has broad applicability for evaluating asset vulnerability to climate change Available at httpswwwfhwadotgovenvironmentsustainabilityresilienceadaptation_framework
bull US Climate Resilience Toolkit The US Global Change Research Program offers a step by step risk assessment
framework including tools and case studies at httpstoolkitclimategovsteps (see example on next page)
bull Coast Adapt Guidance on undertaking a risk assessment High level assessment httpscoastadaptcomausitesdefaultfilesfactsheetsT3M4_2_2nd_pass_risk_assessmentpdfDetailed assessment httpscoastadaptcomausitesdefaultfilesfactsheetsT3M4_3_3rd_pass_risk_assessmentpdf
bull Climate adaptation Risk uncertainty and decision-makingDownload the report here httpswwwukciporgukpublicationsRisk
The City plans to develop a NYC-specific process for integrating climate change data into existing risk management processes by April 2019
APPENDIX 7 - CLIMATE CHANGE RISK ASSESSMENT RESOURCES
NYC Mayorrsquos Office of Recovery and Resiliency Climate Resiliency Design Guidelines
54APPENDIX 7 - CLIMATE CHANGE RISK ASSESSMENT RESOURCES
The Risk Characterization Matrix below is an example from the US Climate Resilience Toolkit This tool can be used to assess the probability and magnitude of impact for identified risks The risk of coincident climate stressorsrisks (such as storm surge plus increased precipitation) can also be assessed as applicable
Figure 14 - Example of a climate change risk matrix (adapted from US Climate Resilience Toolkit)
Project teams can determine the magnitude of the impact (along the horizontal scale of 1 through 3 with 3 being the most severe) and the probabilitylikelihood of occurrence for each specific risk (along the vertical scale with 3 being the most likely) A score is typically assigned for each risk (Probabil-ity x Magnitude) and then charted on the matrix Based on the estimated probability and magnitude of consequence above the risks are ranked and prioritized for mitigation Factors to bear in mind include
bull Not all facility typologies have the same level of functional and operational importance during events or tolerance for disruption
bull Not all climate stressors and risks have the same level of impact on each project sitebull Not all identified risks can or should be mitigated fully
NYC Mayorrsquos Office of Recovery and Resiliency Climate Resiliency Design Guidelines
55WORKS CITED
A Stronger More Resilient New York PlaNYC Report of the NYC Special Initiative for Rebuilding and Resiliency The City of New York 2013
ldquoAccount for Climate Riskrdquo International Finance Corporation accessed March 27 2017 httpwwwifcorgwpswcmconnectTopics_Ext_ContentIFC_External_Corporate_SiteClimate+Business
PrioritiesAccount+for+Climate+Risk
American Society of Heating Refrigeration and Air-Conditioning Engineers (ASHRAE) Handbook -Fundamentals 2017
ldquoBaseline Standard Economic Value Methodology Reportrdquo Federal Emergency Management Agency July 2016
Benefit Cost Analysis Toolkit Software Version 530 Federal Emergency Management Agency (build date December 2016)
Criteria for Detention Facility Design New York City Department of Environmental Protection November 2012
Community Resilience Planning Guide for Buildings and Infrastructure Systems Vol 1 NIST Special Publication 1190 US Department of Commerce 2016
Cool and Green Roofing Manual NYC Department of Design and Construction 2007 httpwwwnycgovhtmlddcdownloadspdfcool_green_roof_manpdf
Building Resiliency Task Force US Urban Green Building Council New York 2013 httpurbangreencouncilforcecomBuildingResiliency
Design and Planning for Flood Resiliency Guidelines for NYC Parks New York City Department of Parks and Recreation 2017
httpswwwnycgovparksorgplanning-and-buildingplanningresiliency-plansflood-resiliency
Flooded Bus Barns and Buckled Rails Federal Transit Administration Office of Budget and Policy 2011 httpswwwhsdlorgabstractampdid=685187
Floodproofing Non-Residential Buildings FEMA P936 FEMA 2013 httpswwwfemagovmedia-library-data9a50c534fc5895799321dcdd4b6083e7P-936_8-20-13_508rpdf
ldquoGlossaryrdquo International Infrastructure Management Manual National Asset Management Support Group New Zealand 2011 httpwwwipweaorg
ldquoGreen Roof Metrics Draft Reportrdquo New York City Department of Parks and Recreation 2017
ldquoGuide to Rain Event Preparednessrdquo NYC Department of Environmental Protection httpwwwnycgovhtmldeppdfbrochuresflood-preparedness-flyerpdf
ldquoGuidelines and Discount Rates for Benefit-Cost Analysis of Federal Programsrdquo Appendix C Circular A-94 US Office of Management and Budget (OMB) 2017
ldquoGuidelines for the Design and Construction of Stormwater Management Systemsrdquo New York City Department of Environmental Protection July 2012
Horton R et al New York City Panel on Climate Change 2015 Report Ann NY Acad Sci ISSN 0077-892 New York 2015
Madrigano J et al ldquoA case-only study of vulnerability to heat wavendashrelated mortality in New York City (2000ndash2011)rdquo Environmental Health Perspectives 123672ndash678 2013
WORKS CITED
NYC Mayorrsquos Office of Recovery and Resiliency Climate Resiliency Design Guidelines
56WORKS CITED
enspMcGregor et al Two Degrees The Built Environment and Our Changing Climate Routledge Press 2013
NYC Green Codes Task Force US Green Building Council New York 2010 httpurbangreencouncilorgGreenCodes
NYCrsquos Risk Landscape A Guide to Hazard Mitigation NYC Emergency Management 2014
One New York The Plan for a Strong and Just City The City of New York 2015 httpwwwnycgovhtmlonenyc downloadspdfpublicationsOneNYCpdf
Ready to Respond Strategies for Multifamily Building Resilience Enterprise Green Communities 2015 httpswwwenterprisecommunityorgresources
Rosenzweig C et al Climate Change Adaptation in New York City Building a Risk Management Response New York City Panel on Climate Change 2010
httponlinelibrarywileycomdoi101111nyas20101196issue-1 issuetoc
ldquoSustainable Infrastructure Management Program Learning Environmentrdquo Water Environment Research Foundation accessed March 24 2017 httpsimplewerforg
Urban Waterfront Adaptive Strategies NYC Department of City Planning 2013 httpwww1nycgovsiteplanningplanssustainable-communitiesclimate-resiliencepagetab=1
Wastewater Resiliency Plan Climate Risk Assessment and Adaptation Study New York City Department of Environmental Protection October 2013
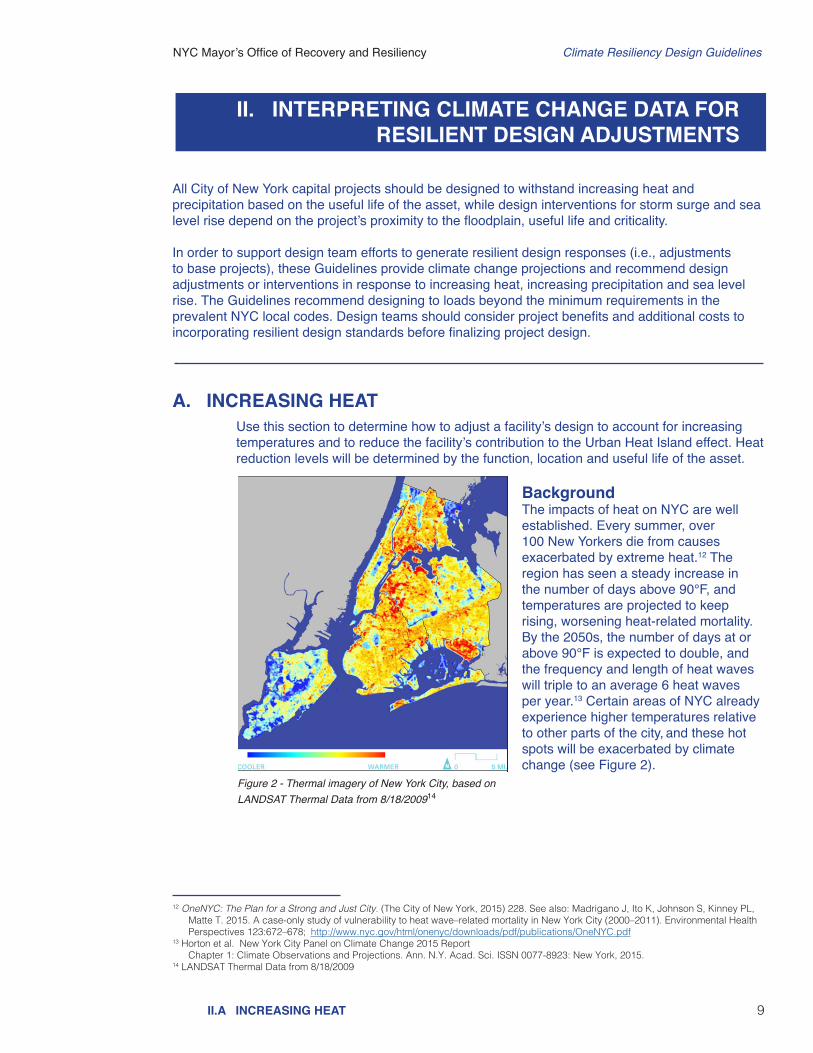
NYC Mayorrsquos Office of Recovery and Resiliency Climate Resiliency Design Guidelines
9IIA INCREASING HEAT
All City of New York capital projects should be designed to withstand increasing heat and precipitation based on the useful life of the asset while design interventions for storm surge and sea level rise depend on the projectrsquos proximity to the floodplain useful life and criticality In order to support design team efforts to generate resilient design responses (ie adjustments to base projects) these Guidelines provide climate change projections and recommend design adjustments or interventions in response to increasing heat increasing precipitation and sea level rise The Guidelines recommend designing to loads beyond the minimum requirements in the prevalent NYC local codes Design teams should consider project benefits and additional costs to incorporating resilient design standards before finalizing project design
A INCREASING HEATUse this section to determine how to adjust a facilityrsquos design to account for increasing temperatures and to reduce the facilityrsquos contribution to the Urban Heat Island effect Heat reduction levels will be determined by the function location and useful life of the asset
BackgroundThe impacts of heat on NYC are well established Every summer over 100 New Yorkers die from causes exacerbated by extreme heat12 The region has seen a steady increase in the number of days above 90degF and temperatures are projected to keep rising worsening heat-related mortality By the 2050s the number of days at or above 90degF is expected to double and the frequency and length of heat waves will triple to an average 6 heat waves per year13 Certain areas of NYC already experience higher temperatures relative to other parts of the city and these hot spots will be exacerbated by climate change (see Figure 2)
12 OneNYC The Plan for a Strong and Just City (The City of New York 2015) 228 See also Madrigano J Ito K Johnson S Kinney PL Matte T 2015 A case-only study of vulnerability to heat wavendashrelated mortality in New York City (2000ndash2011) Environmental Health Perspectives 123672ndash678 httpwwwnycgovhtmlonenycdownloadspdfpublicationsOneNYCpdf
13 Horton et al New York City Panel on Climate Change 2015 Report Chapter 1 Climate Observations and Projections Ann NY Acad Sci ISSN 0077-8923 New York 201514 LANDSAT Thermal Data from 8182009
Figure 2 - Thermal imagery of New York City based on LANDSAT Thermal Data from 818200914
II INTERPRETING CLIMATE CHANGE DATA FOR RESILIENT DESIGN ADJUSTMENTS
NYC Mayorrsquos Office of Recovery and Resiliency Climate Resiliency Design Guidelines
10IIA INCREASING HEAT
In Cool Neighborhoods NYC the City prioritizes strategies to study the Urban Heat Island effect and make targeted investments that benefit communities most vulnerable to heat15 New Yorkers are more or less vulnerable to heat based largely upon socio-economic factors including age income location tree coverage and the percentage of dark surfaces The NYC Department of Health and Mental Hygiene (DOHMH) developed a Heat Vulnerability Index (HVI) which highlights parts of the city where more residents face an increased risk of heat-related mortality Their vulnerability is due to their exposure and socio-economic conditions that determine their
Figure 3 - Heat Vulnerability Index (HVI) for New York City Community Districts (Source NYC DOHMH 2015) This analysis identifies physical social and economic factors associated with increased risk of heat-related morbidity and mortality17
The Guidelines recommend that project designers consider two aspects of the relationship between their project and increasing heat the way their project reduces the Urban Heat Island effect and the impact that increasing heat will have on the physical components of their project itself
bull Reduce Urban Heat Island effect materials in the built environment absorb the sunrsquos heat throughout the day and re-radiate it back into the atmosphere driving localized temperatures higher and increasing demands on cooling systems Air conditioning and ventilation equipment also push extra heat into the air contributing to a feedback loop that increases localized ambient temperatures and impacts the health of heat-vulnerable New Yorkers This section provides guidance on how new capital construction can reduce the contribution to ambient heat in the city
bull Minimize impact from increasing heat increasing heat can physically impact components of buildings and infrastructure damaging or stressing materials electrical systems and mechanical systems Rising temperatures will also stress energy and communications networks that buildings and other infrastructure rely upon18 This section provides climate data to be used to adjust and adapt heat-vulnerable components of assets
15 OneNYC 22816 To learn more about Heat Vulnerability Index see page 229 of OneNYC at httpwwwnycgovhtmlonenycdownloadspdf
publicationsOneNYCpdf17 See page 229 in the OneNYC plan to learn more about HVI18 Damiano H et al NYCrsquos Risk Landscape A Guide to Hazard Mitigation (NYC Emergency Management 2014) 103
Heat can be lethal for all but its impact on New Yorkers is not equal
sensitivity to heat Community districts in red and orange in Figure 3 are areas of highest vulnerability and these are particularly concentrated in east Brooklyn the south Bronx northern Manhattan and southeast Queens16 While all new capital projects should address heat impacts those sited in moderate to high vulnerable HVI areas should implement multiple strategies to reduce the Urban Heat Island and help address the high vulnerability in these neighborhoods
NYC Mayorrsquos Office of Recovery and Resiliency Climate Resiliency Design Guidelines
11IIA INCREASING HEAT
1 Urban Heat Island reductionNew capital construction should minimize its contribution to the Urban Heat Island effect The design interventions provided below offer benefits to the community and the facility through reduced heat loading reduced energy costs andor improved occupant health and thermal comfort The appropriate combination of design interventions will vary dependent on the project scope
a) Increase the solar reflectance of surfaces by utilizing light-colored pavement coatings and materials in combination with shading with a minimum target of 50 of the non-structure areas of facility sites19
Lighter reflective surfaces help reduce the Urban Heat Island effect heat loading and internal building temperatures and extend the lifespan of rooftops and heating ventilation and air conditioning (HVAC) equipment The City has taken steps towards reducing ambient temperatures such as implementing the NYC Cool Roofs program20 New buildings as well as existing buildings with roofs going through significant repairs are required by law to paint their roofs white This program intervention reduces a buildingrsquos contribution to Urban Heat Island effect and provides energy savings by coating the normally dark concrete roof surface with white paint allowing the roof to reflect solar radiation
b) Increase the shading of surfaces by planting trees or other vegetation in combination with cool pavements with a minimum target of 50 of the non-structure areas of facility sites
Shady areas with heat- and in coastal areas salt-tolerant vegetative species can help keep buildings cool and provide energy savings as well as lower temperatures
c) Meet Climate Zone 6 standards for fenestration and insulation (See Section ECC C402 in Chapter C4 of the 2016 NYC Energy Code) to improve efficiency of building envelopes
NYC is currently in Climate Zone 4 NYC already requires that small residential building envelopes are designed to meet higher insulation and fenestration requirements to improve energy efficiency21 All City capital projects including non-residential facilities should meet this standard
d) Select greenblue roofs andor other appropriate landscape elements that maximize cooling with help of landscape architects
The City already encourages the use of green and blue roofs on buildings to reduce the Urban Heat Island effect22 provide stormwater management and increase the useful life of the roof Besides replacing dark roof surfaces green roofs and vegetation also provide shade and keep the air cool through evapotranspiration by releasing moisture into the atmosphere Blue roofs coupled with light colored roofing material can provide stormwater management and rooftop cooling Some of these designs support the shading and solar reflectance goal in Step a) above Additionally City capital projects are subject to Leadership in Energy and Environmental Design (LEED) certification and green roofs can earn LEED credits23 Projects should integrate cooling strategies listed below based on project scope and a balance between costs and benefits
bull Green roofs or blue roofs on a broader range of facilities (including industrial buildings storage garages administration buildings etc)
19 Urban Green Council (2010) Green Codes Task Force Proposed code ldquoEF 12 Reduce Summer Heat with Cool Shady Building Lotsrdquo20 Local Law No 21 (2011) amended Chapter 12 of the NYC Building Code to update roof coating standards Also
see Cool and Green Roofing Manual (DDC) 2007 for more information on NYC standards for cool and green roofs httpwwwnycgovhtmlddcdownloadspdfcool_green_roof_manpdf
21 Read more about the code here httpswww1nycgovsitebuildingscodes2016-energy-conservation-codepage22 See Cool and Green Roofing Manual (DDC) 2007 for more information on NYC standards for cool and green roofs
httpwwwnycgov htmlddcdownloadspdfcool_green_roof_manpdf23 See Local Law No 32 (2016) for more information
NYC Mayorrsquos Office of Recovery and Resiliency Climate Resiliency Design Guidelines
12
2 Minimize impact from increasing heatThis section provides information to support making design adjustments to capital projects to reduce impacts to equipment structures landscapes and materials from rising average temperatures and increasing extreme heat events
a) Review forward-looking climate data provided in Table 1 and Table 2 Select heat projections according to the useful life of the facility and its primary
components then evaluate and address impacts in the steps below Table 1 provides design criteria for average temperatures and incidents of extreme heat events projected to different time periods across the 21st century Table 2 provides guidance on future 1 Dry Bulb Temperature and Cooling Degree Days for the NYC area The 1 Dry Bulb Temperature represents the ambient air temperature
IIA INCREASING HEAT
bull Vegetated structures such as shade trees and planters (to reduce heat loading on horizontal or vertical surfaces)
bull Bioswales rain gardens and bioretention24 bull Maximize planted permeable surfacesbull Other permeable surfaces (used for stormwater management these retain
moisture that evaporates as surface temperatures rise)25 bull Open-grid pavement system (at least 50 unbound)26 bull Evaluate site planning and building massing with regard to solar gainbull Solar panels for shading and to generate energy
Table 1 ndash Baseline and projected extreme heat events27
End of useful life
heat waves per year (3 or more consecutive days with max temperatures at or above 90degF)
days above 90degF
Annual average temperature
Baseline (1971-2000) 2 18 54degF
Through to 2039 4 33 572degF
2040-2069 7 57 606degF
2070-2099 9 87 643degF
Table 2 ndash Projections for 1 Dry Bulb temperature and Cooling Degree Days
Change in projected value for 2050s
Variable Baseline for Central Park (1971-2000)
Low estimate (10th percentile)
Middle range (25th to 75th percentile)
High estimate (90th percentile)
1 Dry Bulb temperature 91degF +3degF +4-6degF +7degF
Cooling Degree Days (base = 65degF) 1149 +37 +46-73 +87
Note Due to HVAC system typical useful life of 25 years or less only projections for the 2050s are shown Projections for the 2020s are not shown because it is anticipated that enough of a safety margin is employed already in current systems to withstand the temperature rise expected through the 2020s The NPCC is currently working on projections of 1 Wet Bulb temperatures which are expected to increase and may require systems to have higher moisture reducing capacity in addition to the enhanced cooling capacity
24 When siting bioswales consider groundwater levels and soil permeability and ensure that the site is not contaminated from past or present land uses A high water table may prohibit some applications
25 Urban Green Council (2010) Green Codes Task Force Proposed code ldquoSW 1 REDUCE EXCESSIVE PAVING OF SITESrdquo26 LEED Neighborhood Development v4 ldquoHeat island reductionrdquo credit27 Projected estimates for average temperatures are based upon 90th percentile change factor added to the baseline average annual
temperature from New York City Panel on Climate Change (2015)
NYC Mayorrsquos Office of Recovery and Resiliency Climate Resiliency Design Guidelines
13IIA INCREASING HEAT
b) Evaluate potential impacts on systems and materials Heat impacts on a facility are highly contingent on the facility type and should be reviewed on a case-by-case basis28 A decrease in the useful life or operational capacity of a facility or components of a facility may occur due to rising temperatures Interventions will also vary depending on whether the project is a new capital investment or a substantial improvement to an existing facility Factors to evaluate as applicable to project scope include but are not limited to
bull Thermal expansion warping softening or other forms of material change or degradation of structural integrity occurring at an accelerated rate by excessive heat
bull Health and safety impacts on occupants vulnerable to heat bull Increased failure or reduced efficiency of electrical or mechanical systems bull Prioritization of critical loads for systems and components at the facility andbull Moisture control needs for buildings with a higher standard for fenestration and
insulation
The results of this evaluation will inform steps taken in the step below
c) Reduce heat impacts Review and implement specific changes to the facility design based on assessments
above Develop a strategy based on the specific type of facility its operational profile and its useful life A Design Strategies Checklist is available for use in Appendix 6 as a resource to track design approaches Specific areas of focus are
bull Electricity outages High temperatures drive demand for air conditioning and can increase the risk of facility equipment failure potentially broader grid disruptions or brownouts2930 To manage this risk design City buildings and infrastructure to withstand periods without electricity using the following approaches in particular if they provide critical or essential services
Ǯ Identify and assess how much of the facilityrsquos load is critical (eg ldquocritical loadrdquo) including the necessary duration of the backup power supply (eg is backup power needed for 8 hours or multiple days) Determining what loads are critical and how long they should be powered for is essential for a facilityrsquos operations and what the role of the facility will have in an emergency situation31
Ǯ Depending on the size of the critical load and budget different backup power supply options could range from backup generators (eg diesel natural gas) to hybrid systems (eg solar + battery storage + appropriately sized generator) Each option has different trade-offs that should be considered in terms of cost feasibility and environmental impacts For shorter duration needs andor smaller critical loads buildings with existing solar systems should consider adding storage to provide a resiliency benefit In some cases co-generation systems may make sense from an economic and resiliency perspective especially if there
28 Sector- and facility-specific impacts vary greatly For examples of sector-specific impacts and design responses see Flooded Bus Barns and Buckled Rails (FTA 2011) and Ready to Respond Strategies for Multifamily Building Resilience (Enterprise Green Communities 2015)
29 McGregor et al (2013) Two Degrees The Built Environment and Our Changing Climate Routledge Press30 High temperatures also increase energy demand which can increase fossil fuel based greenhouse gas emissions31 The key roles of the facility that need to be identified are operational hours number of occupants and electrical loads needed for the
desired operations Electrical equipment and appliances for the desired operations may include - but are not limited to - safety lighting life-supporting systems fire protection systems telecommunications equipment mechanical systems to mitigate extreme temperatures and computing equipment Every facility is unique Operational characteristics and load profiles need to be established prior to sizing the equipment required to keep the facility in operational mode
NYC Mayorrsquos Office of Recovery and Resiliency Climate Resiliency Design Guidelines
14IIA INCREASING HEAT
is a significant heating andor cooling load in addition to electricity demand32
Ǯ Depending on the option assess need to invest in internal electricity rewiring and building energy management systems (eg switches reconfiguration of distribution infrastructure to isolate critical loads from non-critical loads and the ability to island from the broader grid during the event of a larger disruption software and hardware to manage the deployment of hybrid systems) andor need for external hookups for temporary generators and boilers33
bull Failure in facility ventilation electrical and air conditioning systems Some systems designed to meet the requirements of past climate may overheat and fail during extreme events Some design interventions include34
Ǯ Selecting systems with higher heat tolerance Ǯ Adding Energy Recovery Ventilation systems Ǯ Providing additional or redundant ventilation systems either mechanical or
natural to cool electrical equipment Ǯ Optimizing building layout by
bull segregating temperature sensitive electronics and computer control system from other systems
bull placing heat generating equipment like transformers and switchgear outdoors where permitted and
bull splitting the facility cooling loads among different HVAC systems in facility for redundancy and better zone control
bull Passive solar cooling and ventilation There are numerous design features that provide passive solar cooling for buildings to help maintain lower internal ambient temperatures with less air conditioning These features also help keep facilities habitable during extended grid failures when generators fail or must be reserved for critical functions Some design features include35
Ǯ Appropriate east-west orientation Ǯ Passive ventilation design Ǯ Vertically stacked double skin facades Ǯ Exterior window shades Ǯ Light colored exteriors Ǯ Shaded arcades Ǯ Thermally massive materials Ǯ High performance glazing Ǯ Operable windows
32 To learn more see the Building Resiliency Task Force report from Urban Green Council (2013)33 Ibid 34 Flooded Bus Barns and Buckled Rails FTA Office of Budget and Policy 201135 These and other examples are found in McGregor et al (2013) Two Degrees The Built Environment and Our Changing Climate
Routledge Press Also see Flooded Bus Barns and Buckled Rails FTA Office of Budget and Policy 2011
NYC Mayorrsquos Office of Recovery and Resiliency Climate Resiliency Design Guidelines
15IIB INCREASING PRECIPITATION
B INCREASING PRECIPITATIONThe intensity and frequency of precipitation events are projected to increase with climate change creating new challenges for stormwater management and impacts to the built environment such as
bull The potential for greater frequency of stormwater management systems being overwhelmed36
bull More frequent and severe flooding of buildings and infrastructure in areas across the city and
bull Greater variability in rainfall events annually including the chance of drought
The goal for this section is to guide stormwater management approaches including infiltration increases in on-site storage volume and where possible increases in sewer capacity to account for precipitation increases associated with climate change Designers should develop and consider design interventions that would decrease site contribution to sewer in-flows beyond the existing NYC Building Code requirements Given its complexity the Department of Environmental Protection (DEP) is also evaluating climate impacts to the sewer system on a drainage-wide level Proactive design such as increasing on-site infiltration and storm water retention can contribute to system resiliency on a site-specific basis
BackgroundNYCrsquos drainage systems are designed to handle approximately the current 3-year intensity-duration-frequency (IDF) event in most areas of the city where sewers were built prior to 1970 In locations with sewers built after 1970 the capacity was built to handle the 5-year event NYCrsquos network of drainage systems can experience flooding above those thresholds due to widespread precipitation events or by localized intense storms (sometimes called ldquocloudburstsrdquo) causing flooding and backups Climate change projections indicate that flooding resulting from multiple types of precipitation events may increase in frequency This increasing probability is forecast for all types of precipitation events in NYC although there is greater uncertainty around future short duration events Relying on sewers alone to manage extreme precipitation events will not be sufficient in a changing climate The City plans to reduce impervious areas and provide additional storage capacity to reduce flood damage For managing stormwater from larger storms such as at the 50- and 100-year recurrence intervals DEP is increasingly considering the role of streets and open space in managing flow this is referred to as a dual drainage design approach The City is piloting projects to test this dual drainage approach
Another set of interventions include Bluebelt best management practices (BMPs) such as constructed wetlands storm water ponds and stream restorations that emulate pre-development conditions to manage large volumes of water and green infrastructure37 which in NYC have generally been designed to reduce flooding and combined sewer overflow respectively They are not typically sized to manage precipitation events of the same magnitude as sewers which serve as primary drainage conveyance However Bluebelt BMPs green infrastructure and other stormwater management tools may provide an additional buffer for larger storm events by temporarily storing andor infiltrating runoff that would otherwise be directed into the sewer system For instance areas of open space commonly found in NYC may not provide adequate environments for trees and other plantings However in these cases other types of green infrastructure like permeable surfaces and subsurface detention and retention installations would still be considered feasible
36 NYC is already taking steps to address this problem which will worsen with climate change To learn more about how NYC is using green and gray infrastructure to manage stormwater visit httpwwwnycgovhtmldephtmlstormwaterindexshtml
37 NYC DEP NYC Green Infrastructure Program
NYC Mayorrsquos Office of Recovery and Resiliency Climate Resiliency Design Guidelines
16IIB INCREASING PRECIPITATION
The City led by DEP continues to develop its options for managing heavier storm events due to climate change DEP is examining approaches to evaluate sea level rise and rainfall intensity for stormwater management and where possible sewer capacity These efforts will integrate forward-looking climate data into the design of these capital assets and the compounding factors of heavier rain storms and sea level rise will likely require greater infiltration and on-site storm water retention capacity Agencies and consultants should work directly with DEP to develop strategies on a given site necessary to meet expected increases in rainfall intensities and frequencies
1 Precipitation design adjustment for on-site stormwater systems
Based upon the design storm required for the City facility in design follow the steps below and review recommended design interventions
a) Identify the duration of the design event required The current 50-year IDF can be used as a proxy for the future 5-year storm
(projected for the 2080s) Design on-site detentionretention systems to retain the volume associated with the current 50-year IDF curve (see Figure 4 below) Design the on-site system to release at the maximum rate as specified in 15 Rules of the City of NY (RCNY) Chapter 3138
b) Conduct sensitivity analysis Compare the retentiondetention required for the current 5-year IDF versus the
38 Refer to existing codes and standards as well when determining the existing required storm as NYC requires different sizes of design storms for infrastructure and buildings For example NYC Plumbing Code Chapter 11 and Title 15 of the Rules of the City of New York Chapter 31
02
04
06
10
20
40
60
100
200
-2316090
Rai
nfal
l Int
ensi
ty (
inch
es p
er h
our
)
DurationsruoHsetuniM
5 10 15 30 1 2 3 6 12 18
5-yr
10-yr25-yr
50-yr
100-yr
NEW YORK NEW YORK
Figure 4 - Current Intensity-Duration-Frequency Precipitation Curve for NYC adapted from US Department of Commerce Weather Bureau Technical Paper 25
NYC Mayorrsquos Office of Recovery and Resiliency Climate Resiliency Design Guidelines
17IIB INCREASING PRECIPITATION
c) Identify design interventions for managing increased precipitation40 There are different ways to manage stormwater better and avoid urban flooding after
intense rain Choose the right combination of interventions after considering the site location operational requirements cost benefits and useful life of the intervention Some examples of design interventions are
bull Minimize increases in impervious surfacebull Utilize strategies that infiltrate evaporate or reuse rainwater to achieve storm
water volume reductions Then choose strategies that detain (delay drainage) to manage the rate of the storm water flow into the Cityrsquos drainage system
bull Install stormwater infiltration detention and storage (eg bioswales41 green roofs blue roofs and other blue or green infrastructure storage basins or tanks)
bull Protect areas below grade from floodingbull Keep catch basin grates clearbull When implementing perimeter protections ensure that interior water
management is also accounted for andbull Explore interventions to protect underground utility and telecommunications
infrastructure from water damage
d) Use appropriate DEP guidelines to perform the above tasks using the higher design storm
The three currently prescribed DEP guidelines are as follows
bull Guidelines for the Design and Construction of Stormwater Management Systems July 201242
bull Criteria for Detention Facility Design November 201243 bull DEP Site Connection Proposal Application and Guidelines44
Note on stormwater standards As DEP updates stormwater standards and develops specific tools to evaluate impacts of increased precipitation and drainage strategies for on-site storm water management these changes will be reflected in future versions of these Guidelines However it is recommended that the designer should develop and consider design interventions that would increase the on-site storage beyond the existing requirements Also a methodology is under development that will establish a consistent citywide process for addressing legal grade which will have further implications for how extreme precipitation is managed
39 NYC DEP Standards for Stormwater Release Rates available at httpwwwnycgovhtmldephtmlenvironmental_reviewsstormwater_release_ratesshtml 40 Also see DEP Guide to Rain Event Preparedness at httpwwwnycgovhtmldeppdfbrochuresflood-preparedness-flyerpdf and
Ready to Respond Strategies for Multifamily Building Resilience at httpwwwenterprisecommunityorgresourcesready-respond-strategies-multifamily-building-resilience-1335641 When siting bioswales consider groundwater levels and soil permeability and ensure that the site is not contaminated from past or
present land uses A high water table may prohibit some applications42 Available at httpwwwnycgovhtmldephtmlstormwaterstormwater_management_constructionshtml43 Available at httpwwwnycgovhtmldeppdfwater_sewer30_criteria_for_detention_facility_design_06062012pdf44 Available at httpwwwnycgovhtmldeppdfwater_sewer24pdf
current 50 year IDF to determine the cost and benefits associated with complying with these Guidelines Use the Evaluation of Project Benefits section below and Appendix 4 for guidance on how to identify and assess benefits Given the results of the costbenefit analyses review the added benefit of designing retentiondetention using greater magnitude storms (eg 100-year) or lower (eg 25-year) The goal is to maximize retentiondetention capacity given site and cost constraints as well as through an evaluation of the benefit of adding capacity to detainretain water for larger storm events
NYC Mayorrsquos Office of Recovery and Resiliency Climate Resiliency Design Guidelines
18
2 Incorporating climate change projections into DEP drainage planning
The first line of defense for managing intense precipitation events does not require changes to the sewer system as described above For drainage and wastewater infrastructure planning in a changing climate the sewer network and wastewater infrastructure should be qualitatively evaluated from the upstream pipes to the regulator chambers pump stations interceptors and ultimately to the downstream outfall to determine the feasibility of incorporating climate change projections into the system design For DEP storm sewer projects FY 2021 or later in separately sewered drainage areas where the design is in the early stages and there is free discharge the agency will evaluate the feasibility of revising the design to incorporate climate projections into the design If the project (including the prescribed changes) passes the costbenefit analysis then DEP will consider incorporating climate change projections into the sizing However changes in one part of the system must be carefully evaluated For example any upsizing of the regulator chamber or the high point of the system can negatively impact the design and operation of the wastewater infrastructure and residencesbusinesses on the system and can lead to a diminished the level of service
DEP is in the process of developing a hydrologic and hydraulic (HampH) model to estimate runoff flow for future climate scenarios and is evaluating rainfall hyetographs for the existing and future rainfall scenarios to be included in the drainage planning process In addition DEP currently coordinates with ORR for drainage planning as a part of coastal resiliency projects A more detailed methodology to incorporate climate change projections into drainage planning will be developed for version 30 of the Climate Resiliency Design Guidelines to be released in April 2019
IIB INCREASING PRECIPITATION
NYC Mayorrsquos Office of Recovery and Resiliency Climate Resiliency Design Guidelines
19IIC SEA LEVEL RISE
non-critical components within a larger facility or campus (eg at a maintenance yard differentiate between structures and equipment) Critical components essential to the facilityrsquos functionality should be protected to the higher standard for criticality even if the facility itself may be non-critical Some examples of critical components include electrical distribution and switching areas motor-control centers chemical feed equipment boilers communications systems monitoring and safety equipment HVAC units fire alarms and suppression equipment furnaces elevators emergency fuel supplies emergency generators and hazardous material storage Component protection should also be evaluated if a facility is expected to be fully operational during a flood event or if it is expected to quickly resume full operations after an event
For buildings and infrastructure with a long useful life it is not always cost effective or operationally feasible to design a facility to be resilient to hazards faced at the end of its useful life In these cases the most resilient design will be one that provides extra protection against hazards in the initial decades while also leaving open design alternatives for updating resiliency measures as new data is provided or new risk assessments are completed This flexible adaptation pathways approach builds in options to protect assets later in life as demonstrated in an example shown in Figure 1 (in Section I)
Other considerations to keep in mind includebull These Guidelines apply to all City capital projects except coastal flood protection
systems which are designed to different standards than those provided here for
C SEA LEVEL RISEThis section provides tools to 1) determine if the project will be subject to tidal inundation during its useful life due to sea level rise and 2) incorporate sea level rise into flood protection levels of capital projects For projects in the current and future 1 annual chance floodplains sea level rise-adjusted design flood elevations (DFE) are provided and reflect the criticality of the asset and its useful life Background NYC has experienced the devastation of coastal storms most recently during Hurricane Sandy Sea level rise is projected to increase the depth extent and frequency of flooding from storm surge45 Sea level rise will also regularly inundate some low-lying areas during high tides Current flood protection heights are determined by using the base flood elevation established by the FEMA Preliminary Flood Insurance Rate Map (PFIRM) 201546 and the standard of protection for buildings in the floodplain in Appendix G of the NYC Building Code47 These Guidelines augment existing requirements for two primary purposes ensuring City facilities built today incorporate sea level rise and critical assets (as defined in Table 4) are protected to a higher level It is important to note that all projects and design interventions must comply with NYC Building Code
Designers should differentiate between critical and
45 New York City Panel on Climate Change Report Chapter 2 Sea Level Rise and Coastal Storms (2015)46 However NYC Building code G10222 requires that designers review both the PFIRM and the effective FIRM and use the more
restrictive of the two 47 For information on the differences between FEMA FIRM PFIRM and the Cityrsquos forward-looking flood maps see Appendix 3
Critical components essential to the facilityrsquos functionality should be protected to the higher standard for criticality even if the facility itself is non-critical
NYC Mayorrsquos Office of Recovery and Resiliency Climate Resiliency Design Guidelines
20IIC SEA LEVEL RISE
buildings and other physical infrastructure Many of NYCrsquos coastal flood protection systems are currently being developed to comply with FEMA accreditation for flood levee systems48 The City plans to develop further guidance for designing coastal protection projects
bull For information on the differences between FEMA FIRM PFIRM and the Cityrsquos forward-looking flood maps see Appendix 3
bull Coincident stressors from sea level rise should also be considered For example bridge scour may increase as sea levels rise Similarly flooding during heavy rainfall events can be worsened due to higher tailwater conditions associated with high sea levels Be aware of how different risks may interact and how different interventions can be deployed to address multiple hazards or provide other co-benefits
bull Note projects that require discretionary approval are required to incorporate sea level rise projections as part of the NYC Waterfront Revitalization Program49 and
bull A methodology is under development that will establish a consistent citywide process for addressing legal grade which will have further implications for how sea level rise and precipitation are managed
For more information see Section IE Designers should use the resources and methods described in this section to 1) assess tidal inundation due to sea level rise and 2) address risks in the current and future floodplains
1 Assessing tidal inundation due to sea level riseTidal flooding currently affects parts of NYC and is projected to worsen as sea levels rise and inundate low-lying coastal sites during high tides When determining a site location or establishing scope of substantial improvements for other types of coastal facilities the project team will consider alternative sites outside of zones threatened with regular inundation if resiliency actions are not taken Some facilities such as wastewater treatment plants and harbor facilities need to be near the coast for operational purposes
a) Determine tidal inundation risk from sea level rise Use the Flood Hazard Mapper (httpwwwnycgovfloodhazardmapper)50 to see if your
site is in an area inundated from high tide plus sea level rise within the projectrsquos useful life For example if the useful life ends between 2040 and 2069 choose the 2050s High Tide map) Determine risk only from high tide and sea level rise separate from flood events Follow the instructions in Figure 5 and refer to the example in Figure 6 to review inundation at the end of an assetrsquos useful life
48 For more information please visit httpwwwfemagovfema-levee-resources-library49 For more information visit httpwwwnycgovwrp50 The Flood Hazard Mapper relies on publicly available data to present these map resources Users should also refer to FEMA and the
NPCC for official information
Figure 5 - Flood Hazard Mapper high tide plus sea level rise at httpwwwnycgovfloodhazardmapper
NYC Mayorrsquos Office of Recovery and Resiliency Climate Resiliency Design Guidelines
21IIC SEA LEVEL RISE
b) Address flood risk If the Flood Hazard Mapper shows that the facility is expected to be inundated by
high tides within its useful life or if primary access roads are at risk of inundation consider alternative site options
- OR - If the site is not expected to be regularly inundated by tides proceed to the next
section 2 Addressing Risks in the Current Floodplain
Note on calculating tidal inundations with sea level rise if a project team is interested in understanding the depth of tidal inundation given climate change projections follow these steps First determine the Mean Higher High Water (MHHW) elevation in feet-NAVD 8851 datum nearest to the site If the MHHW data is unavailable from a site specific survey refer to httpwwwnycgovwrp for a list of MHHW elevations (NAVD88) at tide stations across the city52 Second add the high estimate (90th percentile) of expected sea level rise (see Table 8 in Appendix 2) for the year corresponding to the facilityrsquos useful life to the MHHW to determine the projected depth of tidal inundation with sea level rise
51 North American Vertical Datum of 1988 (NAVD 88) is the vertical control datum of orthometric height established for vertical control surveying in the US based upon the General Adjustment of the North American Datum of 1988
httpswwwngsnoaagovdatumsvertical52 SLR elevations at httpwwwnycgovwrp are adjusted to account for sea level rise since the last tidal epoch If no other resource is
available to determine MHHW use the NOAA Online Vertical Datum Transformation tool to calculate the MHHW in feet-NAVD
Figure 6 - Flood Hazard Mapper with high tide in the 2020s (left) and in the 2080s (right) at httpwwwnycgovfloodhazardmapper
NYC Mayorrsquos Office of Recovery and Resiliency Climate Resiliency Design Guidelines
22IIC SEA LEVEL RISE
2 Addressing risks in the current floodplain53
A facility located in the current 1 annual chance floodplain (PFIRM 2015)54 will face increasing risk of flooding during its useful life due to sea level rise increasing the depth of coastal storms This section provides a process for adjusting the design flood elevation required by code to account for sea level rise
a) Find the location of the facility using the Flood Hazard Mapper (httpwwwnycgovfloodhazardmapper) and follow the instructions in Figure 7
bull Choose to view the layer ldquoFEMA Preliminary FIRM 2015rdquo bull Click on the facility site in the 1 floodplain to view the base flood elevation
Figure 7 - Flood Hazard Mapper with FEMA PFIRM (2015) at wwwnycgovfloodhazardmapper
b) If the facility is not in the current 1 annual chance floodplain (PFIRM 2015) proceed to the next section ldquo3 Addressing risks in the future floodplainrdquo
- OR - If the facility is in the current 1 annual chance floodplain (PFIRM 2015) note
the base flood elevation (BFE) and proceed to Step c) below Please note if a facility has multiple BFEs or if the site is partially in the 1 annual chance floodplain it is recommended to use the highest BFE as the current BFE for the entire site
c) Establish a sea level rise-adjusted DFE Use the current base flood elevation at your site the facilityrsquos useful life and its
criticality level to determine the design flood elevation using Table 4 (on the next page) as a basis of design
53 This process for adjusting the design flood elevation to account for sea level rise satisfies the criteria of the climate-informed science approach described at the state and federal level
54 FEMA updates its flood maps periodically As of April 2018 the most recent maps are the Preliminary Flood Insurance Rate Maps (PFIRM) available at DCPrsquos Flood Hazard Mapper (httpwwwnycgovfloodhazardmapper) Also note that NYC Building Code requires developers to use the PFIRM (2015) or the FIRM (2007) whichever is more restrictive For more information on these requirements please refer to Appendix G of the NYC Building Code Please note that the DCP maps are not official and all site locations should be confirmed with the official FEMA PFIRM NYC will provide information on the latest flood maps as they are updated
NYC Mayorrsquos Office of Recovery and Resiliency Climate Resiliency Design Guidelines
23IIC SEA LEVEL RISE
Table 4 - Determine the sea level rise-adjusted design flood elevation for critical and non-critical facilities55
Critical facilities
End of useful life Base Flood Elevation (BFE)56 in NAVD 88 + Freeboard57 + Sea Level Rise
Adjustment58= Design Flood Elevation (DFE) in
NAVD 88Through 2039 FEMA 1 (PFIRM) 24rdquo 6rdquo = FEMA 1 + 30rdquo
2040-2069 FEMA 1 (PFIRM) 24rdquo 16rdquo = FEMA 1 + 40rdquo2070-2099 FEMA 1 (PFIRM) 24rdquo 28rdquo = FEMA 1 + 52rdquo
2100+ FEMA 1 (PFIRM) 24rdquo 36rdquo = FEMA 1 + 60rdquoNon-critical facilities
End of useful life Base Flood Elevation (BFE) in NAVD 88 + Freeboard + Sea Level Rise
Adjustment = Design Flood Elevation (DFE) in
NAVD 88Through 2039 FEMA 1 (PFIRM) 12rdquo 6rdquo = FEMA 1 + 18rdquo
2040-2069 FEMA 1 (PFIRM) 12rdquo 16rdquo = FEMA 1 + 28rdquo2070-2099 FEMA 1 (PFIRM) 12rdquo 28rdquo = FEMA 1 + 40rdquo
2100+ FEMA 1 (PFIRM) 12rdquo 36rdquo = FEMA 1 + 48rdquoAdditional analysis should be conducted to incorporate wave action and wave run-up in DFE calculations especially in areas that are located within the FEMArsquos 1 annual chance Limit of Moderate Wave Action (LiMWA) zone Wave run up is the maximum vertical extent of wave uprush above surge
Definition of critical buildings and infrastructure for determining DFE in Table 4The criticality definitions below are for use in the application of the Guidelines only All items identified as critical in NYC Building Code Appendix G are critical in these guidelines however this list includes additional facilities that are not listed in Appendix G59 If a facility is not listed here it is considered non-critical for the purposes of determining freeboard
bull Hospitals and health care facilitiesbull Fire rescue ambulance and police stations and emergency vehicle garages bull Jails correctional facilities and detention facilities bull Facilities used in emergency response including emergency shelters emergency preparedness communication
operation centers communication towers electrical substations back-up generators fuel or water storage tanks power generating stations and other public utility facilities
bull Critical aviation facilities such as control towers air traffic control centers and hangars for aircraft used in emergency response
bull Major food distribution centers (with an annual expected volume of greater than 170000000 pounds)60 bull Buildings and other structures that manufacture process handle store dispose or use toxic or explosive
substances where the quantity of the material exceeds a threshold quantity established by the authority having jurisdiction and is sufficient to pose a threat to the public if released61
bull Infrastructure in transportation telecommunications or power networks including bridges tunnels (vehicular and rail) traffic signals (and other right of way elements including street lights and utilities) power transmission facilities substations circuit breaker houses city gate stations arterial roadways telecommunications central offices switching facilities etc
bull Ventilation buildings and fan plantsbull Operations centersbull Pumping stations (sanitary and stormwater)bull Train and transit maintenance yards and shopsbull Wastewater treatment plantsbull Water supply infrastructurebull Combined-sewer overflow (CSO) retention tanksbull Fueling stationsbull Waste transfer stations and bull Facilities where residents have limited mobility or ability including care facilities and nursing homes
55 If an industry standard does not include freeboard in its flood protection standards for particular infrastructure assets then only consider the sea level rise adjustment when determining flood protection levels
56 Note that NYC Building Code requires developers to use the PFIRM (2015) or the FIRM (2007) whichever is more restrictive For more information on these requirements please refer to Appendix G of the NYC Building Code
57 These freeboard values reflect NYC Building Code Appendix G Table 2-1 which establishes the minimum elevation of the top of lowest floor Appendix G requires other freeboard values for other parts of structures and in different parts of the floodplain Refer to Appendix G for the appropriate freeboard and use that value in Table 4 above
58 The sea level rise figures provided are for the middle of the 25th-75th percentile range projections from the NPCC These values do not necessarily indicate the average of all models
59 The structural occupancy categories outlined in Appendix G of the NYC Building Code are the same as ASCE 7 used for structural design For critical buildings structural design should comply with ASCE 7 and 24 for design class IV
60 This threshold represents the median volume of main food distributors in NYC according to statistics collected as part of the Five Borough Food Flow study in 2016 available at
httpswwwnycedccomsystemfilesfilesresource2016_food_supply-resiliency_study_resultspdf 61 The threshold quantity for hazardous materials is established by Chapter 7 of Title 24 of the NYC Administrative Code
NYC Mayorrsquos Office of Recovery and Resiliency Climate Resiliency Design Guidelines
24IIC SEA LEVEL RISE
Figure 9 ndash Outdoor emergency generator for the critical building
This case study provides an example of how to calculate a sea level rise-adjusted DFE based on the useful life of a hypothetical critical services building and its primary component
Step 1 Organize the site by various critical or primary components and their year of construction Determine their useful life along with the associated future year scenario for flood risk assessment In this example the building structure and the outside emergency generator are the most at-risk components from combined sea level rise and coastal storm surge
Step 2 Overlay the site footprint area over the effective current PFIRM or FIRM and the corresponding future year scenario FEMA 1 to identify flood risk to the site From overlaying the 2015 preliminary FEMA floodplain over the site it was determined that the site has a 1 annual chance of flooding with a base flood elevation of 13rsquo NAVD Step 3 Evaluate the criticality of each primary component of the facility based on the Guidelinesrsquo definition for critical infrastructure (Table 4) This (hypothetical) building is critical
Step 4 Use Table 4 to determine the sea level rise adjustment and freeboard requirements for each component and calculate the DFE for each that corresponds to its useful life period
Step 5 Compare the DFE of each component and the associated Guidelinesrsquo recommended DFE to calculate anticipated flood depth
CASE STUDY Adjusting the DFE for Sea Level Rise
Table 5 ndash Example of how to calculate a sea level rise-adjusted DFE for a critical facility
Construction year Components Useful
Life
Future Year Scenario
[Useful Life + Const
Year]
BFE in NAVD
88 (feet)
Freeboard + Sea
Level Rise Adjustment
(feet)
Adjusted DFE in
NAVD 88 (feet)
2010 Building Structure
70 years 2070-2099 130rsquo 2rsquo+23rsquo 173rsquo
2010Outdoor
Emergency Generator
25 years
Through 2039 130rsquo 2rsquo+05rsquo 155rsquo
Figure 8 - Example of how to locate a facility within the current floodplain and determine the BFE Figure 9 (inset) - Outdoor emergency generator at the facility
Figure 10 - This schematic shows how to determine the design flood elevation of a facility within the current 1 floodplain
Illustrative not to scale
NYC Mayorrsquos Office of Recovery and Resiliency Climate Resiliency Design Guidelines
25IIC SEA LEVEL RISE
Figure 11 - Flood Hazard Mapper with future 1 annual chance floodplain (adjusted for sea level rise) at httpwwwnycgovfloodhazardmapper
b) If the site is not in the future floodplain no flood protection is required for this facility
- OR - If the site is in the future floodplain identify the nearest adjacent base flood
elevation at the project site in the current 1 annual chance floodplain (PFIRM 2015) using the Flood Hazard Mapper62
c) Use Table 4 to determine the DFE Add freeboard and the sea level rise-adjustment to the nearest adjacent BFE on the
current 1 annual chance floodplain (PFIRM 2015) to determine the DFE
d) Apply the DFE calculation from Table 4 to the protected facility See Figures 12 and 13 for an illustration of how to calculate the DFE
62 Maps of future floodplains show the impacts of sea level rise alone and do not consider how changes in stormsrsquo climatology might also affect wave action and the full extent of the floodplain
3 Addressing risks in the future floodplainIf the facility is not in the current 1 annual chance floodplain (PFIRM 2015) it may still be at risk in the future from flooding as sea level rise increases the extent of the floodplain Follow the steps below to determine if your facility is located in the future floodplain and if so what sea level rise-adjusted DFE to use
a) Use the Flood Hazard Mapper (httpwwwnycgovfloodhazardmapper) to determine if the facility site will be in the future 1 annual chance floodplain
Assess if by the end of the facilityrsquos useful life the floodplain is projected to increase to encompass all or part of the project site For example if the useful life ends between 2040 and 2069 choose the 2050s floodplain map Refer to the steps in Figure 11 below
NYC Mayorrsquos Office of Recovery and Resiliency Climate Resiliency Design Guidelines
26IIC SEA LEVEL RISE
Figure 12 - This schematic map shows how to locate the nearest adjacent 1 floodplain elevation
Figure 13 -This schematic shows how to determine the design flood elevation of a facility that is outside of the current 1 floodplain
CASE STUDY Identifying a Base Flood Elevation (BFE) in the Future Floodplain
Illustrative not to scale
NYC Mayorrsquos Office of Recovery and Resiliency Climate Resiliency Design Guidelines
27IIC SEA LEVEL RISE
4 Identify appropriate design interventions
63 Additional resources for identifying adaptive strategies Urban Waterfront Adaptive Strategies (NYC Department of City Planning httpswww1nycgovassetsplanningdownloadpdfplans-studiessustainable-communitiesclimate-resilienceurban_waterfrontpdf Floodproofing Non-Residential Buildings (FEMA) at httpswwwfemagovmedia-libraryassetsdocuments34270 Ready to Respond Strategies for Multifamily Building Resilience (Enterprise Green Community) at
httpwwwenterprisecommunityorgresourcesready-respond-strategies-multifamily-building-resilience-1335664 While natural systems-based approaches ameliorate flooding their use for storm surge or wave mitigation would need to be quantified
before contributing towards the design flood elevation 65 For more information see FEMArsquos Floodproofing Non-Residential Buildings at httpswwwfemagovmedia-libraryassetsdocuments34270
Operational requirements and continuity plans can inform the selection of appropriate design interventions particularly in terms of how quickly a site needs to be up and running after a flood event Some examples of how functional uses can pair with interventions include
bull A facility that needs to be operating during or immediately after a flood event may need to be dry floodproofed using permanent barriers or designed for passive survivability (such as a police or fire station)
bull A facility that needs to recover quickly after an event could elevate prioritized equipment and have deployable barriers
bull A site that can recover over a longer duration of time could be temporarily inundated during an event (such as parks or plazas) The use of resilient materials and strategies can reduce costly damage caused by temporary inundation
Different design interventions should be chosen based on the specific operational requirements of the project however these must meet the ASCE 24 design requirements for Coastal VE Zones
For all projects at risk of current or future flooding select protections that meet the projectrsquos design flood elevation Consider project-specific factors including the site location operational requirements existing continuity planning and cost63 A Design Strategies Checklist in Appendix 6 is available for use as a resource to track possible design approaches Some examples of design alternatives are
bull Site relocation where feasible conduct alternative site analysis
bull Permanent barriers at a site (eg floodwalls)
bull Deployable flood barriers (eg stop logs flood doorsgates inflatable barriers)
bull Natural systems-based approaches (eg living shorelines restored wetlands)64
bull Prioritized protection of electrical mechanical and other critical or costly-to-replace equipment above the design flood elevation (eg motors and controller boilers and furnaces fuel storage tanks duct work alarm systems and suppression equipment electrical panels electrical distribution and switching areas gas and electric meters telecommunications equipment chemical feed equipment HVAC units and emergency generators)65
bull Dry floodproofing design a facility to prevent water from entering
bull Wet floodproofing design a facility to permit floodwaters to flow in and out of the structure without causing significant damage (eg elevate or protect critical equipment use water-resistant building materials below the design flood elevation include flood vents and pumps)
bull Design redundant telecommunications conduit entrances for multiple carrier entry Telecom conduit should run to diverse manholes when possible
bull Install backup power for telecom equipment with design consideration for such equipment (eg installation above DFE)
bull Install outdoor-rated disconnect switch for telecommunications equipment on the roofbull Explore interventions to protect underground utilities and other telecommunications
facilities from water damagebull Install backflow preventers backwater valves and sump pumps for all buildings and
infrastructure in the floodplain as well as behind flood barriersbull Shoreline improvements that reduce the height of waves or attenuate waves where
feasible
NYC Mayorrsquos Office of Recovery and Resiliency Climate Resiliency Design Guidelines
28IIIA GENERAL METHODOLOGY TO ESTIMATE PROJECT BENEFITSIIIB CATEGORIES OF PROJECT BENEFITS
Designing and constructing facilities to handle the future climate loads above the current NYC codes and standards based on projected useful life of the components provides resiliency benefits The incremental costs to implement the Guidelinesrsquo recommended design interventions should be compared with the incremental benefits to aid agencies in making decisions about resilient design strategies The project design team should evaluate benefits of the interventions designed to meet Guidelinesrsquo recommended criteria for all the climate stressors qualitatively andor quantitatively For projects with construction costs below $50 million the project design team is recommended to perform a qualitative benefits assessment on the interventions that meet the Guidelinesrsquo recommendations for all applicable climate stressors For critical facilities or projects with construction costs over $50 million the project design team is recommended to perform quantitative benefit calculations to identify the optimal interventions that meet Guidelinesrsquo recommended design criteria
A GENERAL METHODOLOGY TO ESTIMATE PROJECT BENEFITSThis general methodology to perform qualitative and quantitative benefit calculations is recommended for use by project design teams at the beginning of and during the design process This methodology enables estimation of project benefits for a high-level benefit-cost analysis (BCA) that can be applied to evaluate and compare resiliency features designed to address sea level rise with coastal storm surge increased precipitation and extreme heat events The type of benefits provided by interventions designed to meet the Guidelinesrsquo design criteria can vary by climate stressors and typology of the facilities The main guiding principle in development of the high-level BCA methodologies included in these Guidelines was to balance simplicity with accuracy The project benefits categories identified within the methodology may not cover all the potential benefits provided by every facility type within NYC In particular the benefits of planning for increased precipitation are difficult to quantify Hence the project design team should use their discretion to modify this general benefit calculation methodology as needed to meet their project goals and objectives The project design team should develop appropriate input data whether quantitative or qualitative needed to estimate project benefits
B CATEGORIES OF PROJECT BENEFITSThere are three types of project benefit categories - direct benefits indirect benefits and other benefits - that can be used to perform qualitative assessments and develop quantitative estimates of monetary benefits for intervention alternatives designed to meet the Guidelinesrsquo recommendations These project benefit categories will help to perform a high-level benefit-cost analysis that balances accuracy with an appropriate level of effort
bull Direct Benefits include reduced or avoided physical damages to facilities and contents reduced or avoided displacements for residential structures and reduced life cycle or OampM costs that can be quantified as a primary result of implementing a specific hazard mitigation measure Table 12 in Appendix 4 provides a list of direct benefits and basic guidance on estimating and documenting values for sea level rise and increased precipitation-related flood hazards Note that given the current state of practice it is not possible to quantify reduced or avoided physical damages or residential displacements that result from a specific extreme heat mitigation measures Therefore direct benefits applicable to extreme heat hazards are limited to reduced life cycle costs applicable to certain measures such as green roofs Refer to Table 15 for details on direct benefits for extreme heat hazards
III EVALUATION OF PROJECT BENEFITS
NYC Mayorrsquos Office of Recovery and Resiliency Climate Resiliency Design Guidelines
29IIIB CATEGORIES OF PROJECT BENEFITS
bull Indirect Benefits include reduced or avoided service losses for non-residential
buildings public facilities andor infrastructure (utilities roads and bridges) based on the value of service continuity andor emergency services to New Yorkers that can be quantified as a secondary result of implementing a specific hazard mitigation measure Table 13 in Appendix 4 provides a list of indirect benefits and basic guidance on estimating and documenting values for sea level rise and increased precipitation-related flood hazards Note that given the current state of practice on extreme heat it is not possible to quantify reduced or avoided service losses that result from a specific extreme heat mitigation measures Therefore indirect benefits applicable to extreme heat hazards are limited to reduced energy costs such as cool roofs green roofs or shade trees Refer to Table 15 in Appendix 4 for details on indirect benefits for extreme heat hazards
bull Other Benefits where applicable other potential benefits may include social benefits for residents such as avoided stress and anxiety avoided lost productivity environmentalecosystem service benefits avoided need for emergency services and other potential benefits that can be estimated as a result of implementing a specific hazard mitigation measure Table 14 in Appendix 4 provides a list of other potential benefits and basic guidance on estimating and documenting values for sea level rise and increased precipitation-related flood hazards
Note on the ecosystem service benefit category in Table 14 the stormwater management benefits of green infrastructure should be distributed between the extreme heat and increased precipitation hazards since these measures provide both significant reductions in rainfall runoff as well as Urban Heat Island mitigation through evapotranspiration However there is currently limited data available to quantify the actual distribution of stormwater management benefits between the two hazards For various dual-benefit providing interventions careful considerations should be given to identify the appropriate benefits category provided by the intervention with a goal to avoid duplication of quantified benefits In this methodology the stormwater management benefits of green infrastructure are applied to the increased precipitation hazard in order to avoid a duplication of benefits Note on real estate and quality of life benefits additionally it is important to note that two potential benefit categories shown in Table 14 - real estate and quality of lifehealthavoided casualties - were not included in the current BCA methodology for sea level rise or increased precipitation hazards Although these categories could increase project benefits for sea level rise and increased precipitation hazards they were only applied to measures that address extreme heat hazards such as green roofs trees and other plantings Refer to Table 15 for a detailed summary of other benefit categories quantified as unit benefits for extreme heat hazards
NYC Mayorrsquos Office of Recovery and Resiliency Climate Resiliency Design Guidelines
30IIIC WHICH METHODOLOGY TO USEIIID BCA METHODOLOGY FOR PROJECTS UNDER $50 MILLION
D BCA methodology for projects under $50 millionThe project design team should develop design alternatives to meet the Guidelinesrsquo criteria which may be in excess of NYC code and standards requirements (baseline conditions) It is assumed that the project design team will develop alternatives to address each of the following applicable climate stressors - sea level risecoastal storm surge increased precipitation and extreme heat - separately Tables 12-15 in Appendix 4 provides a list of typical direct indirect and other benefits provided by various intervention typologies to reduce impacts from climate stressors During the qualitative assessment the project design team should consider that intervention strategies will have varying levels of reliability effectiveness benefits and cost implications during the qualitative assessment
The project design team is recommended to develop appropriate evaluation criteria and metrics for each of the applicable project benefit categories For each alternative the project design team could use either a scoring weighting ranking or other type of qualitative assessment framework to assess each applicable project benefit categories with the developed evaluation criteria and metrics Table 6 provides an example template to evaluate alternatives using a set of general evaluation criteria and metrics using a color-coded rating system (and see Table 7 for an example of how to complete the template) The project design team can utilize a similar template customized to their project goals and objectives This assessment allows agencies to screen the qualitative benefits for various alternatives that would then lead to development of final project components to match the available budget and goals of the project
Projects with total costs below $50 million recommended to conduct a qualitative assessment to identify the optimal interventions that meet Guidelinesrsquo design criteria using the ldquoD) BCA methodology for projects under $50 millionrdquo methodology below
C WHICH METHODOLOGY TO USEProjects with a total cost above $50 million or are highly complex or critical facilities recommended to conduct both a qualitative and quantitative benefit calculation to identify the optimal interventions that meet Guidelinersquos design criteria using the ldquoE) BCA methodology for projects above $50 millionrdquo below A quantitative BCA also must include qualitative factors
NYC Mayorrsquos Office of Recovery and Resiliency Climate Resiliency Design Guidelines
31IIID BCA METHODOLOGY FOR PROJECTS UNDER $50 MILLION
Qualitative Color Scale Green=Least resource intensive alternative Purple=most resource intensive yellow=medium level of resource intensity
Qualitative Evaluation Factors Description Relative Color Rating System
First CostsAdditional construction costs needed to incorporate Guidelinesrsquo recommended resilient design over the baseline project costs
Highest cost ($$$) rated as Purple whereas lowest cost ($) rated as Green
ConstructabilityEase of Implementation
Construction techniques and site conditions such as presence of major utilities conflicts and other conditions which dictate the level of constructability required for each alternative
Difficult to construct rated as Purple whereas easiest to construct rated as Green
Environmental ImpactsCo-BenefitsPermitting
Impacts to the built and natural environment such as circulation noise and hazardous waste plus the level of effort required for permitting (eg interventions in water require highest level of permitting requirement) from each alternative in addition to the baseline project condition
Highest environmental impacts and highest level of effort required for permitting rated as Purple whereas the least impact and level of effort rated as Green
Operation and Maintenance (OampM)
Level of effort of additional manpower and cost of OampM for the alternatives over the baseline project OampM requirements
Highest level of effort and cost for OampM rated as Purple whereas the lowest is rated as Green
Reliability and Durability
Interventions that do not require human involvement or a facilityrsquos ability to withstand all the forces during a storm event (eg permanent solutions with higher reliability than deployable solution)
Interventions requiring human involvement (active measures) rated as Purple whereas interventions with minimal or no human involvement (passive measures) rated as Green
Risk Reduction Benefits Monetary benefits provided by each intervention alternative in avoided damages over the baseline condition
Lowest potential monetary benefit rated as Purple whereas as highest potential monetary benefit rated as Green
Quality of Life BenefitsVisual Aesthetics
Benefits either to the community such as recreation or safety or serve the community during emergency situations
Lowest potential quality of life benefits rated as Purple whereas as highest potential benefits rated as Green
Table 6 ndash Evaluation matrix for comparison of mitigation alternatives across the useful life of a project
Project title_______________________________________________________________________________
Evaluation Criteria
Baseline Condition (Designed to NYC Building Code and
Standards)
Resilient Design Alternatives for Managing__________________
Alternative 1
Alternative 2
Alternative 3
First Costs
ConstructabilityEase of ImplementationEnvironmental ImpactsCo-BenefitsPermitting
Operation and Maintenance (OampM)
Reliability and Durability
Risk Reduction Benefits
Quality of Life BenefitsVisual Aesthetics
NYC Mayorrsquos Office of Recovery and Resiliency Climate Resiliency Design Guidelines
32IIID BCA METHODOLOGY FOR PROJECTS UNDER $50 MILLION
Table 7 ndash Evaluation matrix for comparison of mitigation alternatives across the useful life of a project - COMPLETED EXAMPLE
Evaluation Criteria
Baseline Condition (Designed to NYC Building Code and
Standards)
Resilient Design Alternatives for Managing Coastal SurgeSLR
Alternative 1Flood proof building built on grade to Guidelines
DFE
Alternative 2 Elevate building structure above Guidelinesrsquo DFE
on columns
Alternative 3 Raise site grade by filing the building site footprint
to Guidelinesrsquo DFE
First CostsBaseline cost for building structure is $15 million
Incremental costs are within 5 over the baseline costs
Incremental costs are between 5-10 over baseline costs
Incremental costs are 20 and more over baseline costs
ConstructabilityEase of Implementation
Relatively easy to construct within site constraints
Similar to baseline conditions since construction requires additional flood proofing only
Moderate challenges to construct foundation structure for columns within site constraints
Extremely challenging to construct within the site constraints Potentially fatal flaw
Environmental ImpactsCo-BenefitsPermitting
No major impacts but may require additional effort to obtain DOB permits with flood proofing and deployable systems
No major impacts but may require additional effort to obtain DOB permits with flood proofing and deployable systems
No major impacts and relatively easy to permit
Potential drainage circulation impacts and challenges to obtain clean fill material for the site
Operation and Maintenance (OampM)
Major OampM costs associated with deployable systems
Major OampM costs associated with deployable systems
Moderate OampM costs associated with proposed elevator for access
Minimal OampM costs since deployable and elevators not required
Reliability and Durability
Least reliability with highest potential risk from flooding during to failure of deployable systems
Least reliability with highest potential risk from flooding during to failure of deployable systems
Moderate reliability with potential risk from flooding limited to elevator shaft only
Highest reliability since deployable are not required to protect building from flooding
Risk Reduction Benefits
Maximum flood risk reduction benefits assuming deployable and flood proofing is effective
Maximum flood risk reduction benefits assuming deployable and flood proofing is effective
Maximum flood risk reduction benefits
Maximum flood risk reduction benefits
Quality of Life BenefitsVisual Aesthetics
Facility may not be operational during the storm event
Facility may not be operational during the storm event
Facility can be potentially operational during the storm event
Facility can be potentially operational during the storm event
Qualitative Color Scale Green=Least resource intensive alternative Purple=most resource intensive yellow=medium level of resource intensity
A new non-critical facility with a building structure is proposed on a site that is currently in the 2015 Preliminary FEMA 1 annual chance floodplain with a BFE of 10rsquo (NAVD 88) The baseline conditions DFE to meet existing NYC codes and standards is 11rsquo (NAVD 88) Using the Guidelines recommended design criteria the facilityrsquos DFE is 133rsquo (NAVD 88) and existing grade is around 6rsquo (NAVD 88) The project design team develops three alternatives to meet the Guidelinesrsquo recommended DFE design for the facility Table 7 offers an example of how a qualitative assessment can be used to compare three resilient design alternatives using the evaluation criteria and metrics
CASE STUDY Example of How to Use the Evaluation Matrix
NYC Mayorrsquos Office of Recovery and Resiliency Climate Resiliency Design Guidelines
33IIIE BCA METHODOLOGY FOR PROJECTS OVER $50 MILLION
E BCA methodology for projects over $50 millionIn order for a project to be considered cost-effective a benefit-cost analysis (BCA) assesses if the benefits of a project outweigh its costs or in other words the benefit-cost ratio (BCR) is greater than 10 as illustrated in Equation 1
Equation 1 Benefit-Cost Ratio Formula
BCR =
Where BCR = Benefit-Cost Ratio
BENEFITS = Total project benefits
COSTS = Total project costs
BENEFITSCOSTS
These estimated project benefits are combined with the project costs which are defined as the differential construction and long-term operation and maintenance costs associated with constructing a proposed project to the Guidelinesrsquo recommended design level It is assumed that the baseline project will be designed to the most prevalent NYC codes and standards This benefit methodology should be used to determine the additional project benefit that the Guidelinesrsquo recommended design would provide over the baseline project benefit It is assumed that the project design team will develop alternatives to address each of the following applicable climate stressors - sea level risecoastal storm surge increased precipitation and extreme heat - separately For each alternative the project design team should use the following steps to determine the Benefit-Cost Ratio (BCR)
a) Determine project useful life for design interventions Determining the useful life of the proposed project is an important first step in the
detailed BCA assessment methodologies for two reasons First the project useful life determines what values must be used from the Guidelines to establish the future climate design conditions The various hazard tables in the Guidelines establish design requirements based on useful life ranges through 2039 2040-2069 2070-2099 and 2100+ (2100+ projections are only available for sea level rise) A review of these tables show that the design requirements needed to meet the projected climate hazards increase as the end of useful life range increases Second the useful life determines how long the project will need to be operated and maintained in order to remain technically sound and effective at reducing future damages and losses
b) Determine discount rate for project benefits calculation The cost-effectiveness of projects assessed using the BCR must be done on a net
present value basis meaning the present value of the benefits is compared to the present value of the costs Most project costs are computed for present value based on current cost estimates bids or cost guidance However project benefits - as well as project costs for operation and maintenance - accrue over time into the future and are computed on an annualized basis To address this issue the Present Value Coefficient (PVC) is used to bring these annualized project benefits and OampM costs into the present value As indicated by the formula in Equation 2 the PVC is a function of the Project Useful Life (PUL) and the Discount Rate (DR)
NYC Mayorrsquos Office of Recovery and Resiliency Climate Resiliency Design Guidelines
34
Equation 2 Present Value Coefficient (PVC) Formula
PVC =
Where PVC = Present Value Coefficient
PUL = BCA Project Useful Life based on project type
DR = Discount Rate
The project design team should coordinate with agencies and NYC OMB if needed to determine appropriate discount rates based on funding source project type and other factors This coordination should take place during project initiation phase where total project costs (design and construction) are over $50 million66
c) Develop input data to perform benefit calculations Tables 16 and 17 in Appendix 4 provide a list of typical input data by each climate
stressor needed to perform benefit analysis quantitatively on variety of facilities67 The project design team should use these tables as a reference to identify appropriate input data categories andor additional input data needed to perform benefit analysis on the project
d) Identify applicable project benefit categories to estimate benefits Tables 16 and 17 in Appendix 4 provide a list of typical project benefits by each climate
stressor needed to perform benefit analysis quantitatively on various types of projects The project design team should use these tables as a reference to identify appropriate project benefit categories for each climate stressor to perform benefit analysis on the project
e) Calculate benefits of recommended design interventions for each climate
stressor The input data and applicable project benefits can be assembled along with
incremental project cost data to analyze cost-effectiveness using the FEMA BCA Tool Damage-Frequency Assessment (DFA) module or similar software This analysis will provide a BCR for each alternative which can then be used to compare the alternatives that were developed to mitigate effects from applicable climate stressors The project design team can then use the results from this analysis to identify optimal interventions that provides a balanced solution that provides resiliency benefits within the available project budget
IIIE BCA METHODOLOGY FOR PROJECTS OVER $50 MILLION
[1 ndash (1 + DR) -(PUL)]DR
66 For example a NYC OMB March 2015 memorandum recommends using an annually updated DR as published each year in Appendix C of OMB Circular A-94 The current OMB-recommended discount rates from OMB A-94 Appendix C vary by project useful life and are as follows 21 DR for useful lives of 10 to 19 years 25 DR for useful lives of 20 to 29 years and 28 DR for useful lives of 30 years or greater By contrast FEMA hazard mitigation grants use a DR of 70 for all projects based on the Federal OMB A-94 rate for federally-funded mitigation measures Since these DRs will impact the PVC and the project benefits the project team must ensure that BCA results prepared using an OMB-recommended DR (21 to 28) be updated to reflect the Federal DR (70) when applying for FEMA mitigation grant funds
67 Note the data requirements for the sea level rise and increased precipitation hazards in Table 16 are more detailed than the requirements for the extreme heat hazards due to the less detailed level of analysis available for extreme heat
NYC Mayorrsquos Office of Recovery and Resiliency Climate Resiliency Design Guidelines
35
APPENDICES
NYC Mayorrsquos Office of Recovery and Resiliency Climate Resiliency Design Guidelines
36APPENDIX 1 ndash KEY TERMS
100-year flood (1 annual chance flood)
A flood that has a 1 probability of occurring in any given year The 100-year floodplain is the extent of the area of a flood that has a 1 chance of occurring or being exceeded in any given year
500-year flood (02 annual chance flood)
A flood that has a 02 probability of occurring in any given year The 500-year floodplain is the extent of the area of a flood that has a 02 chance of occurring or being exceeded in any given year
AdaptationAdjustment in natural or human systems to a new or changing environment that seeks to maximize beneficial opportunities or moderate negative effects Successful adaptations contribute to resiliency
Base flood elevation (BFE)The elevation of surface water resulting from a flood that has a 1 annual chance of occurring or being exceeded in any given year The BFE is shown on the Flood Insurance Rate Map (FIRM)69
BluebeltReference to the Department of Environmental Protectionrsquos (DEP) Bluebelt program to preserve natural drainage corridors including streams ponds and other wetland areas Preservation of these wetland systems allows them to perform their functions of conveying storing and filtering storm water
Climate
The average weather (or more rigorously a statistical description of the average in terms of the mean and variability) over a period of time usually 30 years These quantities are most often surface variables such as temperature precipitation and wind Climate in a wider sense is the state including a statistical description of the climate system70
Climate change
Changes in average weather conditions that persist over multiple decades or longer Climate change encompasses both increases and decreases in temperature as well as shifts in precipitation changing risk of certain types of severe weather events and changes to other variables of the climate system
Climate change riskThe chance that investments (such as in capital projects) can be affected by the physical impacts of climate change71 Risks are evaluated as a product of the probability of occurrence and the magnitude of damages or impacts including socioeconomic factors that would result if they did occur (consequences)
Climate change risk assessment
This assessment involves a detailed project-specific analysis that includes a vulnerability and risk assessment often followed by cost-benefit analysis to assess and select investments in climate change risk mitigation Risk is assessed as a function of the magnitude and probability of a given climate change hazard Examples resources are included in Appendix 7
Climate vulnerabilityThe degree to which systems and populations are affected by adverse impacts It is a function of the character magnitude and rate of climate change and variation to which a system is exposed its sensitivity and its adaptive capacity72
Cloudburst An extreme amount of rain in a short period of time often over a small geographic area73
Cooling Degree Day (CDD) A form of degree-day used to estimate the energy requirements for air conditioning or refrigeration when the daily mean temperature is above 65degF
68 All terms are from the US Global Change Research Program (USGCRP) glossary unless otherwise noted The USGCRP glossary is available at httpwwwglobalchangegovclimate-changeglossary
69 ldquoDefinitionsrdquo FEMA last modified March 1 2017 httpswwwfemagovnational-flood-insurance-programdefinitions70 UKCIP Glossary httpwwwukciporgukglossary71 ldquoAccount for Climate Riskrdquo International Finance Corporation 72 UKCIP Glossary httpwwwukciporgukglossary73 New York City Environmental Protection ldquoCloudburst Resiliency Planning Studyrdquo 2017 Available at httpwwwnycgovhtmldeppdfclimatenyc-cloudburst-studypdf
APPENDIX 1 - KEY TERMS68
NYC Mayorrsquos Office of Recovery and Resiliency Climate Resiliency Design Guidelines
37APPENDIX 1 ndash KEY TERMS
Design life The life expectancy of an asset or product as determined during design74 As opposed to useful life (see below)
Dry Bulb temperature The ambient air temperature measured by a thermometer
Extreme eventUnexpected unusual or unpredictable weather or flooding compared to historical or future projected distribution Extreme events include for example heat waves cold waves heavy rains periods of drought and flooding and severe storms
Facilities For the purposes of this document ldquofacilitiesrdquo refers to all types of buildings housing infrastructure structures and landscape features designed by or for the City of New York
Flexible adaptation pathwayResilience-building strategies that can evolve or be adapted over time as climate change risk assessments evaluations of adaptation strategies and monitoring continue75
Flood Insurance Rate Maps (FIRM)
Official flood map of a community on which FEMA has delineated the 1 annual chance floodplain and the base flood elevations (BFEs) applicable to the community76 The FIRM also includes the 02 floodplain annual chance floodplain and differentiates between special flood hazard areas (V A Coast A zones) and floodways The official FIRM is from the year 2007 while the 2015 PFIRM is currently required by NYC Building Code to calculate design flood elevations NYC DOB references the more restrictive of the two maps in both base flood elevation and flood hazard area (ie V versus A zone) Refer to Appendix 3 for more information
FreeboardAn additional amount of height above the base flood elevation used as a factor of safety (eg two feet above the base flood) in determining the level at which a facilitys lowest floor must be elevated or floodproofed to be in accordance with state or community floodplain management regulations77
Future time slices
Future periods defined by the NPCC for when climate change projections are available In this document the following decadal projections are associated with specific time spans2020s projection = present to 20392050s projection = 2040 to 20592080s projection = 2070 to 20992100s projection = end of century and beyond
Green infrastructureAn array of practices that use or mimic natural systems to manage urban stormwater runoff Water is either directed to engineered systems for infiltration or detained for longer periods before it enters the sewer system
Heat Vulnerability Index (HVI)Summarizes relative risk of adverse health effects from heat due to social and environmental factors Used to identify neighborhoods at higher risk during and after extreme heat events
Heat wave A period of three consecutive days where temperatures rise above 90degF or two consecutive days over 95 degrees78
New York City Panel on Climate Change (NPCC)
The body of leading climate and social scientists charged with making climate change projections for the metropolitan region79
74 Sustainable Infrastructure Management Program Learning Environment httpsimplewerforg 75 Rosenzweig C et al Climate Change Adaptation in New York City Building a Risk Management Response76 ldquoDefinitionsrdquo FEMA77 Ibid78 Horton R et al New York City Panel on Climate Change 2015 Report Chapter 1 Climate Observations and Projections Ann NY
Acad Sci ISSN 0077-8923 (New York 2015) 2579 For more information on the NPCC visit www1nycgovsiteorrchallengesnyc-panel-on-climate-changepage
NYC Mayorrsquos Office of Recovery and Resiliency Climate Resiliency Design Guidelines
38APPENDIX 1 ndash KEY TERMS
Open-grid pavement system
Pavements that consist of loose substrates supported by a grid of a more structurally sound grid or webbing Unbounded loose substrates in these systems transfer and store less heat than bound and compacted pavements and aid permeability Pavement is 50 pervious and contains vegetation in the open cells designed to allow percolation or infiltration of storm water through the surface into the soil below80
Preliminary Flood Insurance Rate Map (PFIRM)
Preliminary flood map developed by FEMA in 2015 for New York City that provides projected risks for flood hazards81 Refer to Appendix 3 for more information
Project useful life (PUL)
The period over which an asset or component is expected to be available for use by an entity This depends on regular and adequate maintenance This period of time typically exceeds the design life (see above) The combined effect of operational requirements and useful life is practical in assessing an investment in improving resilience82
Rain gardenAlso called ldquobioswalerdquo Planted areas designed to collect and manage stormwater that runs off streets sidewalks commercial and residential rooftops and other sources when it rains
Resiliency The ability to bounce back after change or adversity The capability of preparing for responding to and recovering from difficult conditions83
Sea level rise-adjusted design flood elevation
As defined in these Guidelines the increased height of the base flood elevation due to sea level rise plus freeboard depending on the criticality of the facility The sea level rise adjustment depends on the useful life of the facility
Storm surge An abnormal rise of water generated by a storm over and above predicted astronomical tides84
Substantial improvementAny repair reconstruction rehabilitation addition or improvement of a building or structure the cost which equals or exceeds 50 of the market value of the structure before the improvement or repairs started For more information see Appendix G of the NYC Building Code and 1 RCNY sect3606-0185
Tidal inundation Flooding which occurs at high tides due to climate-related sea level rise land subsidence andor the loss of natural barriers86
Urban Heat Island (UHI) effectThe tendency for higher air temperatures to persist in urban areas as a result of heat absorbed and emitted by buildings and asphalt tending to make cities warmer than the surrounding suburban and rural areas
Weather The state of the atmosphere at a given time with regard to temperature cloudiness precipitation wind and other meteorological conditions87
Wet Bulb temperatureThe temperature indicated when a thermometer bulb is covered with a water-saturated wick over which air is caused to flow at approximately 45 ms (900 ftmin) to reach the equilibrium temperature of water evaporating into the air when the heat of vaporization is supplied by the sensible heat of the air88
80 ldquoGlossaryrdquo US Green Building Council (2017) Available at httpwwwusgbcorgglossaryterm552581 ldquoPreliminary FEMA Map Productsrdquo FEMA Map Service Center Available at httpshazardsfemagovfemaportalprelimdownload82 ldquoGlossaryrdquo International Infrastructure Management Manual (2011) 83 A Stronger More Resilient New York (2013) 184 ldquoStorm Surge Overviewrdquo National Hurricane Center NOAA Available at httpswwwnhcnoaagovsurge85 ldquoFlood Resistant Constructionrdquo Appendix G New York City Building Code (2008) and 1 RCNY sect3606-01 available at httpswww1nycgovassetsbuildingsrules1_RCNY_3606-01pdf86 ldquoOcean Factsrdquo National Ocean Service NOAA Available at httpoceanservicenoaagovfactsnuisance-floodinghtml 87 UKCIP Glossary httpwwwukciporgukglossary88 ldquoASHRAE Terminologyrdquo ASHRAE Available at httpswwwashraeorgtechnical-resourcesauthoring-toolsterminology
NYC Mayorrsquos Office of Recovery and Resiliency Climate Resiliency Design Guidelines
39APPENDIX 2 - CLIMATE CHANGE PROJECTIONS
Climate change projections are provided by the New York City Panel on Climate Change (NPCC) The full NPCC report is available from the New York Academy of Sciences89 Tables 8-10 (below) were reproduced directly from the NPCC report while Table 2 (see Section IIA) was developed using the data underlying the NPCC report to inform the design of HVAC systems under warmer conditions
Table 8 ndash NYC sea level rise projections90
Baseline (2000-2004) 0 in
Low estimate (10th percentile)
Middle range (25th to 75th percentile)
High estimate (90th percentile)
2020s 2 in 4-8 in 10 in
2050s 8 in 11-21 in 30 in
2080s 13 in 18-39 in 58 in
2100 15 in 22-50 in 75 in
Note Projections are based on six-component approach that incorporates both local and global factors The model-based components are from 24 global climate models and two representative concentration pathways Projections are relative to the 2000-2004 base period
Table 9 ndash Mean annual changes91
a Temperature Baseline(1971-2000) 54degF
Low estimate (10th percentile)
Middle range (25th to 75th percentile)
High estimate (90th percentile)
2020s + 15degF +20-29degF +32degF
2050s +31degF +41-57degF +66degF
2080s +38degF +53-88degF +103degF
2100 +42degF +58-104degF +121F
b Precipitation Baseline(1971-2000) 501 in
Low estimate (10th percentile)
Middle range (25th to 75th percentile)
High estimate (90th percentile)
2020s -1 percent +1-8 +10
2050s +1 percent +4-11 +13
2080s +2 percent +5-13 +19
2100 -6 percent -1 to +19 +25
Note Based on 35 global climate models (GCMs) and two RCPs Baseline data cover the 1971ndash2000 base period and are from the NOAA National Climatic Data Center (NCDC) Shown are the low estimate (10th percentile) middle range (25th percentile to 75th percentile) and high estimate (90th percentile) These estimates are based on a ranking (from most to least) of the 70 (35 GCMs times 2 RCPs) projections The 90th percentile is defined as the value that 90 percent of the outcomes (or 63 of the 70 values) are the same or lower than Like all projections the NPCC climate change projections have uncertainty embedded within them Sources of uncertainty include data and modeling constraints the random nature of some parts of the climate system and limited understanding of some physical processes The NPCC characterizes levels of uncertainty using state-of-the-art climate models multiple scenarios of future greenhouse gas concentrations and recent peer-reviewed literature Even so the projections are not true probabilities and the potential for error should be acknowledged
89 The NPCC 2015 report is available at httponlinelibrarywileycomdoi101111nyas20151336issue-1issuetoc90 From New York City Panel on Climate Change 2015 Report Chapter 1 Climate Observations and Projections page 4191 From New York City Panel on Climate Change 2015 Report Chapter 1 Climate Observations and Projections page 30
APPENDIX 2 - CLIMATE CHANGE PROJECTIONS
NYC Mayorrsquos Office of Recovery and Resiliency Climate Resiliency Design Guidelines
40APPENDIX 2 - CLIMATE CHANGE PROJECTIONS
Table 10 ndash Extreme events92
2020s Baseline (1971-2000)
Low estimate(10th percentile)
Middle range(25th to 75th percentile)
High estimate (90th percentile)
Numbers of heat waves per year 2 3 3-4 4
Average heat wave duration (days) 4 5 5 5
Number of days per year with
Maximum temperature at or above 90degF 18 24 26-31 33
Maximum temperature at or above 100degF 04 07 1-2 2
Minimum temperature at or below 32degF 71 50 52-58 60
Rainfall at or above 1 inch 13 13 14-15 16
Rainfall at or above 2 inches 3 3 3-4 5
Rainfall at or above 4 inches 03 02 03ndash04 05
2050s Baseline (1971-2000)
Low estimate(10th percentile)
Middle range(25th to 75th percentile)
High estimate (90th percentile)
Numbers of heat waves per year 2 4 5-7 7
Average heat wave duration (days) 4 5 5-6 6
Number of days per year with
Maximum temperature at or above 90degF 18 32 39-52 57
Maximum temperature at or above 100degF 04 2 3-5 7
Minimum temperature at or below 32degF 71 37 42-48 52
Rainfall at or above 1 inch 13 13 14-16 17
Rainfall at or above 2 inches 3 3 4-4 5
Rainfall at or above 4 inches 03 03 03-04 05
2080s Baseline (1971-2000)
Low estimate(10th percentile)
Middle range(25th to 75th percentile)
High estimate (90th percentile)
Numbers of heat waves per year 2 5 6-9 9
Average heat wave duration (days) 4 5 5-7 8
Number of days per year with
Maximum temperature at or above 90degF 18 38 44-76 87
Maximum temperature at or above 100degF 04 2 4-14 20
Minimum temperature at or below 32degF 71 25 30-42 49
Rainfall at or above 1 inch 13 14 15-17 18
Rainfall at or above 2 inches 3 3 4-5 5
Rainfall at or above 4 inches 03 02 03-05 07
Note Projections for temperature and precipitation are based on 35 GCMs and 2 RCPs Baseline data are for the 1971 to 2000 base period and are from the NOAA National Climatic Data Center (NCDC) Shown are the low estimate (10th percentile) middle range (25th to 75th percentile) and high estimate (90th percentile) 30-year mean values from model-based outcomes Decimal places are shown for values less than one although this does not indicate higher precisioncertainty Heat waves are defined as three or more consecutive days with maximum temperatures at or above 90degF Like all projections the NPCC climate change projections have uncertainty embedded within them Sources of uncertainty include data and modeling constraints the random nature of some parts of the climate system and limited understanding of some physical processes The NPCC characterizes levels of uncertainty using state-of-the-art climate models multiple scenarios of future greenhouse gas concentrations and recent peer-reviewed literature Even so the projections are not true probabilities and the potential for error should be acknowledged
92 From New York City Panel on Climate Change 2015 Report Chapter 1 Climate Observations and Projections page 31
NYC Mayorrsquos Office of Recovery and Resiliency Climate Resiliency Design Guidelines
41APPENDIX 3 - DIFFERENTIATION OF FLOOD MAPS
These Guidelines reference several different kinds of flood maps and sources of design flood elevations These maps are described and differentiated below
Table 11 - Differentiation of flood maps used in NYC
Reference Title Data Source Information Provided Referenced By Link
2007 FIRM FEMA
Based on historical data from before 1983 identifies the current base flood (extent and elevation) as the flood that has a 1 chance of occurring in any given year also known as a 100-year flood The NYC Building Code requires that either the 2007 FIRM or 2015 PFIRM elevation be used whichever is higher
2014 NYC Building Code Appendix G
Climate Resiliency Design Guidelines
httpsmscfemagovportal
2015 PFIRM FEMA
Based on historical data identifies the current base flood (extents and elevation) as the flood that has a 1 chance of occurring in any given year also known as a 100-year flood The NYC Building Code requires that either the 2007 FIRM or 2015 PFIRM elevation be used whichever is higher The 2015 PFIRM is currently being reassessed by FEMA
2014 NYC Building Code Appendix G
Climate Resiliency Design Guidelines
httpshazardsfemagovfemaportalprelimdownload
httpwwwregion2coastalcomview-flood-maps-dataview-preliminary-flood-map-data
NYC Flood Hazard Mapper
NYC Department of City Planning
Maps current and future flood hazards in NYC including the following data layers 2007 FIRM and 2015 PFIRM high tide with sea level rise and PFIRM with sea level rise through 2100
Climate Resiliency Design Guidelines
Waterfront Revitalization Plan
httpwww1nycgovsiteplanningdata-mapsflood-hazard-mapperpage
ldquoTable 4 ndash Determine the sea level rise-adjusted design flood elevation for critical and non-critical facilitiesrdquo
ORR amp NPCC
Provides data to use when adding sea level rise to a given 2015 PFIRM or 2007 FIRM Base Flood Elevation (BFE) to calculate a Design Flood Elevation (DFE) Based on the criticality and expected useful life of a facility
Climate Resiliency Design Guidelines
See Section II on ldquoSea Level Riserdquo above
APPENDIX 3 - DIFFERENTIATION OF FLOOD MAPS
NYC Mayorrsquos Office of Recovery and Resiliency Climate Resiliency Design Guidelines
42APPENDIX 4 - PROJECT BENEFITS CATEGORIES
This appendix provides guidance on how to identify and assess benefits as a supplement to Sections IIID and IIIE
Table 12 lists typical direct benefits for reducing impacts from climate stressors and basic guidance for how to estimate them See Section IIID for more information
Table 13 lists typical indirect benefits for reducing impacts from climate stressors and basic guidance for how to estimate them See Section IIID for more information
Table 12 ndash Direct benefits for (1) sea level rise with coastal storm surge and (2) increased precipitation measures
Direct Benefit Basic Guidance for Estimating Values
Physical Damages (Structure Contents)
bull For flood-damaged buildings use depth damage functions developed by FEMA and USACE for structures and contents
bull Use depth damage functions in conjunction with Building Replacement Values (BRVs) and not market values BRVs typically range between $100 to $325SF for residential buildings and $120 to $450SF for commercial public buildings
bull For more complex structures or facilities use engineering estimates of flood damages or review historic flood damages documented from insurance claims repair records or FEMA Public Assistance claims from recent flood disasters
Residential Displacements
bull For flood-damaged buildings use depth damage functions developed by FEMA and USACE for residential displacements
Reduced Life CycleOperation and Maintenance (OampM) Costs93
bull Applicable only to projects that reduce overall life cycle costs or net annual OampM costs from baseline conditions
bull Input reduced annual OampM costs as a project benefit at a 1-year recurrence intervalbull Reduced overall life cycle costs can be input as a longer project useful life
Table 13 ndash Indirect benefits for (1) sea level rise with coastal storm surge and (2) increased precipitation measures
Indirect Benefit Basic Guidance for Estimating Values
Non-Residential Building Service Losses
bull Estimate service loss values and durations for non-residential buildings public buildings critical facilities and parksnatural features based on FEMA BCA guidance and standard values based on building use
Utility Service Losses94
bull Estimate utility service losses for water wastewater and electrical facilities based on the number of impacted customers FEMA per capita standard values for utility service ($105personday for potable water $49personday for wastewater $148personday for electrical)95
bull Estimate utility service loss durations based on engineering estimates or review historic flood damages losses documented from utility company records
bull This benefit can also apply to measures that increase energy efficiency
RoadBridge Service Losses
bull Estimate roadbridge service losses based on the average daily traffic (ADT) detour time and additional travel distance and FEMA and GSA standard values for road service ($3344vehiclehour of delay $0545mile)96
bull Estimate roadbridge service loss durations or review historic flood damages losses
Emergency Service Losses
bull Applicable only to projects that reduce or eliminate documented emergency service costs from baseline conditions
bull Examples of avoided emergency services costs include NYPD staffing to monitor barricades for flooded roads or NFDY staffing for water rescues of residents from flooded buildings or streets
APPENDIX 4 - PROJECT BENEFITS CATEGORIES
93 Reduced life cycle costs may be applicable to some measures that provide extreme heat benefits such as green roofs that can last longer than a standard roof if properly maintained
94 Reduced utility service costs may be applicable to some measures that provide extreme heat benefits such as cool roofs green roofs and shade trees
95 FEMA per capita standard values taken from FEMA BCA Toolkit Version 530 (Build Date 12222016) and developed in FEMArsquos Baseline Standard Economic Value Methodology Report (July 28 2016) Consider updating FEMA standard per capita values to reflect current New York City utility rates
96 Consider updating FEMA and GSA standard values to reflect current New York City area labor rates and fuel costs
NYC Mayorrsquos Office of Recovery and Resiliency Climate Resiliency Design Guidelines
43APPENDIX 4 - PROJECT BENEFITS CATEGORIES
Table 14 ndash Other potential benefits for (1) sea level rise with coastal storm surge and (2) increased precipitation measures
Other Benefit Basic Guidance for Estimating Values
Avoided Stress and Anxiety
bull Applicable only for projects that directly benefit occupants of residential structuresbull Use FEMA standard value for avoided mental stress and anxiety treatment costs of $2443person to
estimate benefit for all impacted residents97
Avoided Lost Productivity
bull Applicable only for projects that directly benefit occupants of residential structuresbull Use FEMA standard value for avoided lost worker productivity costs of $8736household to estimate
benefit for all impacted workers (conservatively assuming one worker per household)
Environmental Open Space
bull Applicable only for projects that create or acquire open space areas by acquisitionbull Use FEMA standard value for environmental open space based on the type of land acquired ($8308
Acreyear for Green open space $39545Acreyear for Riparian $6010Acreyear for Wetlands $554Acreyear for Forests $1799Year for Marine and estuary)97
CSO Volume Reduction
bull Applicable only for projects that provide Combined Sewer Overflow (CSO) abatement by reducing the volume of rainfall runoff
bull Use CSO abatement cost of $0015gallonsyear applied to increased precipitation hazard runoff volume for 5-year design storm98
Ecosystem Service99
bull Add stormwater management benefits of green infrastructure projects to increased precipitation hazards where avoided damages and service losses are not quantified
bull Unit benefits applicable to increased precipitation hazard includeo Green roofs $0133SFyear (PUL 40 years)o BioswaleRain GardenMeadow Mix $0020SFyear (PUL 30 years)o Permeable Grass Pavers $0020SFyear (PUL 30 years)o Tree Plantings $303Treeyear (PUL 30 years)o Planter Box Trees $101Treeyear (PUL 15 years)
Real Estate99
bull Potential real estate benefits from increased resilience of residential andor commercial propertiesstreetscapesneighborhoods included within the project scope
bull Benefit applied to extreme heat hazard for green infrastructure projects directly impacting residential or commercial properties
Quality of Life Health Benefits99
bull Potential quality of life benefits related to improved public health from the resilience measures included within the project scope
bull Benefit applied to extreme heat hazard for green infrastructure projects directly impacting residential or commercial properties
Table 14 lists other typical benefits for reducing impacts from climate stressors and basic guidance for how to estimate them See Section IIID for more information
97 FEMA standard values for avoided mental stress and anxiety and environmental open space values taken from FEMA BCA Toolkit Version 530 (Build Date 12222016)
98 CSO abatement cost taken from APG1 Report for NYC ldquoTechnical Approaches for Benefit-Cost Analysis of Hazard Mitigation Projects in Urban and Coastal Environmentsrdquo (April 2016)
99 Ecosystem Services Real Estate and Quality of LifeHealth benefits tend to be more applicable to green infrastructure measures that provide extreme heat benefits such as green roofs trees and other plantings
NYC Mayorrsquos Office of Recovery and Resiliency Climate Resiliency Design Guidelines
44APPENDIX 4 - PROJECT BENEFITS CATEGORIES
Table 15 ndash Potential benefits for extreme heat (Urban Heat Island) reduction measures
Category Benefit Basic Guidance for Estimating Values
Direct Benefit
Reduced Life Cycle Cost
bull Applicable only to measures such as green roofs that are expected to last longer than standard roofs
bull Compute total cost savings including annual OampM costs
Indirect Benefit
Energy Savings
bull Applicable to measures that reduce energy costs by providing cooling through increased shading andor evapotranspiration
bull Use New York Power Authority rates of $0148kWh for electricity and $0810Therm for natural gas
Other Potential Benefits
Air Quality bull Applicable to measures that absorb pollutants andor reduce carbon dioxide emissions
Acoustics bull Applicable to measures such as green roof or walls that reduce noise transfer
Quality of LifeHealth bull Potential quality of life benefits and related to improved public health
Real Estate bull Applicable to measures that provide residential real estate benefits from increased resilience of propertiesstreetscapesneighborhoods
Retail Sales Marketing
bull Applicable to measures that provide commercial property benefits from increased aesthetics resulting in increased marketing and sales for streetscapesneighborhoods
Tax Credits Incentives
bull Applicable to resilience or green infrastructure measures such as green roofs that have accompanying Federal State or City tax credits or other incentives
Table 15 lists potential benefits for reducing impacts from heat and basic guidance for how to estimate them See Section IIID for more information
NYC Mayorrsquos Office of Recovery and Resiliency Climate Resiliency Design Guidelines
45APPENDIX 4 - PROJECT BENEFITS CATEGORIES
Table 16 ndash Guidance on quantitative calculations for (1) sea level rise with coastal storm surge and (2) increased precipitation measures
Data Input General Guidance ndash Basic Description
Applicable Benefit Category
Applicable Typical Facility Typology
Dire
ct B
enefi
ts
Indi
rect
Ben
efits
Oth
er P
oten
tial
Ben
efits
Bui
ldin
g St
ruct
ures
Com
plex
Fa
cilit
ies
Tran
spor
tatio
nSt
reet
scap
es
Plaz
as
Park
Fea
ture
s
First Floor Elevation (FFE)
bull The elevation of the first finished floor of the structure excluding basements
bull FFE measured from top of lowest floor (riverinenon-coastal high hazard areas) or bottom of lowest horizontal structural member (coastal high hazard areas)
Y Y Y Y
Building Replacement Value (BRV)
bull The unit cost to rebuild a structure of the same quality of construction
bull Not the same as market value
Y Y Y Y
Building Size
bull The total floor area of the building in square feet
bull Total Building Value = BRV x Building Sizebull Typical BRVs for NYC range between $100 to
$325SF for residential buildings and $120 to $450SF for commercialpublic buildings
Y Y Y Y
Structure Description
bull The type of building number of stories and foundation type (full basement partial basement no basement)
bull Collect more detailed foundation data for coastal flood zones
Y Y Y Y
Building Use bull Details related to residential housing commercial business and public use
Y Y Y Y Y
Building Type bull The primary use of building ndash residential commercial public and others
Y Y Y Y Y
Depth Damage Function (DDF)
bull Curves used to estimate structure damage contents damage and displacement of residential buildings based on flood depth
bull DDFs selection based on Structure Description Building Type Building Use
bull Structure DDFs based on percentage of Total Building Value
bull Contents DDFs based on percentage of Total Contents Value
bull Displacement DDFs based on number of displacement days x Displacement Cost
Y Y Y Y Y
Contents Value
bull The cost to replace structure contents (furnishings equipment)
bull Residential building Contents Values typically 50 BRV (FEMA DDFs) or 100 BRV (USACE DDFs)
bull Non-residential building Contents Values between 18 to over 100 depending on building use (USACE DDFs)
bull Total Contents Value = BRV x Building Size
Y Y Y Y Y
Table 16 provides general guidance on how to quantitatively calculate benefits from efforts to address from climate stressors See Section IIIE for more information
NYC Mayorrsquos Office of Recovery and Resiliency Climate Resiliency Design Guidelines
46APPENDIX 4 - PROJECT BENEFITS CATEGORIES
Table 16 ndash Guidance on quantitative calculations for (1) sea level rise with coastal storm surge and (2) increased precipitation measures
Data Input General Guidance ndash Basic Description
Applicable Benefit Category
Applicable Typical Facility Typology
Dire
ct B
enefi
ts
Indi
rect
Ben
efits
Oth
er P
oten
tial
Ben
efits
Bui
ldin
g St
ruct
ures
Com
plex
Fa
cilit
ies
Tran
spor
tatio
nSt
reet
scap
es
Plaz
as
Park
Fea
ture
s
Number of Residents (Residential)
bull Total number of occupants in a residential building
bull Typically estimated based on number of residential units x average number of individuals per household (based on current US Census data or use 25 individuals per household as a default)
Y Y Y Y Y
Displacement Cost (Residential)
bull The unit cost to lodge and feed displaced residents while flood damage is repaired
bull Average unit displacement cost of $415residential unitday recommended based on current FY2018 GSA Per Diem rates for New York City
Y Y Y Y Y
Value of Service (Non-Residential and Public)
bull The unit cost of service disruption and rental of temporary facilities while flood damage is repaired
bull Disruption costs for non-residential buildings typically range from $095 to $136SFmonth and rental costs range from $020 to $136SFmonth depending on building use
bull Value of service for public buildings ($day) is typically based on the annual operating budget for the City agency using the building prorated based on building size or population served by the building then divided by 365 daysyear
Y Y Y Y
Value of Service (Critical Facilities)
bull The unit cost of critical facilities (police fire emergency medical services) lost or delayed while flood damage is repaired
Y Y Y
Value of Service Duration
bull The duration of service disruption and rental of temporary facilities for non-residential buildings and critical facilities while flood damage is repaired
bull For non-residential buildingso Value of Service Durations vary from
4 months to over 30 months based on building use and the depth of flooding
o Total Value of Service Loss = (Disruption Cost x Building Area) = (Rental Cost x Building Area x Value of Service Duration)
bull For public buildings and critical facilitieso Value of Service Durations vary from 0
days to 720 months based on building use and the depth of flooding from FEMA FIA or USACE DDFs
o Total Value of Service Loss = (Value of Service) x (Service Loss Duration)
Y Y Y
NYC Mayorrsquos Office of Recovery and Resiliency Climate Resiliency Design Guidelines
47APPENDIX 4 - PROJECT BENEFITS CATEGORIES
Table 16 ndash Guidance on quantitative calculations for (1) sea level rise with coastal storm surge and (2) increased precipitation measures
Data Input General Guidance ndash Basic Description
Applicable Benefit Category
Applicable Typical Facility Typology
Dire
ct B
enefi
ts
Indi
rect
Ben
efits
Oth
er P
oten
tial
Ben
efits
Bui
ldin
g St
ruct
ures
Com
plex
Fa
cilit
ies
Tran
spor
tatio
nSt
reet
scap
es
Plaz
as
Park
Fea
ture
s
Engineering Estimates for Damages
bull Engineered estimate models of physical damages and service losses at the project site based on the Guidelines event recurrence interval(s) and flood depth(s)
Y Y Y Y Y Y
Historic Damages and Service Losses
bull Historic physical damages and service losses at the project site documented from previous flood events
bull Do not use routine maintenancebull The historic damage event recurrence interval
(RIs) andor flood depths must be determined updated for inflation to the present value and adjusted to match the Guidelines event RIsflood depths
Y Y Y Y Y Y
Facility Replacement Value
bull The unit cost to rebuild the facility
Impacted Area bull The geographic area impacted by the facility in the event of failure in acres
Y Y Y Y
Facility Capacity
bull The design capacity of the facilitybull For example - facility capacity expressed in
millions of gallons per day (MGD) for water and wastewater facilities or megawatts (MW) for electrical facilities
Y Y Y Y
Service Population
bull The number of impacted residents served by the facility
bull Typically estimated based on number of impacted residential customers x average number of individuals per household (based on current US Census data or use 25 individuals per household as a default)
bull Facilities serving mostly non-residentialpublic buildings andor critical facilities should focus on service losses rather than service population
Y Y Y
NYC Mayorrsquos Office of Recovery and Resiliency Climate Resiliency Design Guidelines
48APPENDIX 4 - PROJECT BENEFITS CATEGORIES
Table 16 ndash Guidance on quantitative calculations for (1) sea level rise with coastal storm surge and (2) increased precipitation measures
Data Input General Guidance ndash Basic Description
Applicable Benefit Category
Applicable Typical Facility Typology
Dire
ct B
enefi
ts
Indi
rect
Ben
efits
Oth
er P
oten
tial
Ben
efits
Bui
ldin
g St
ruct
ures
Com
plex
Fa
cilit
ies
Tran
spor
tatio
nSt
reet
scap
es
Plaz
as
Park
Fea
ture
s
Value of Service
bull Unit value of service provided by the facilitybull Example of FEMA standard values for complete
loss of utility service $105personday for potable water$49personday for wastewater$148personday for electrical
bull Consider updating FEMA standard per capita values to reflect current The New York City utility rates
Y Y
Roadway Elevations bull Roadway Elevations
Y Y
Roadway Replacement Value
bull Roadway Replacement ValueY Y
Inundation Area Map
bull Inundation Area Map developed by FEMA or through modeling by project design team
Y Y Y
Building Inventory of Inundation Area
bull The number and type of buildings within the streetscape and neighborhood inundated by the Guidelinersquos flood events
Y Y Y
Average Daily Traffic (ADT)
bull The average number of one-way traffic trips per day along the roadway(s) within the streetscapeneighborhood inundated by the Guidelinersquos flood events
Y Y
Additional Travel Time
bull The additional travel time needed to detour around a flooded roadway expressed in minutes
bull In the unlikely event there is no detour available use a 12-hour travel time per one-way trap but provide a detailed area street map as supporting documentation
Y Y
Value of Traffic Delay
bull The value of service associated with lost time in traffic
bull For example - FEMA standard average value of $3344vehiclehour of delay
bull Consider updating FEMA and GSA standard values to reflect current New York City area labor rates and fuel costs
Y Y
NYC Mayorrsquos Office of Recovery and Resiliency Climate Resiliency Design Guidelines
49APPENDIX 4 - PROJECT BENEFITS CATEGORIES
Table 17 ndash Guidance on quantitative unit benefit calculations for extreme heat hazard measures
Measure General Guidance ndash Unit Benefit Information and Data Requirements
Applicable Benefit Category
Applicable Typical Facility Typology
Dire
ct B
enefi
ts
Indi
rect
Ben
efits
Oth
er P
oten
tial
Ben
efits
Bui
ldin
g St
ruct
ures
Com
plex
Fa
cilit
ies
Tran
spor
tatio
nSt
reet
scap
es
Plaz
as
Park
Fea
ture
s
Green Roof
bull Unit benefit range over PUL = $470SF to $373SF of green roof area ($719SF standard value)
bull Assumed PUL = 40 yearsbull Apply standard value unit benefit to green
roof area to estimate measure benefitbull Higher range values more applicable
to residential and commercial building streetscape projects
Y Y Y Y Y Y
Bioswale Rain Garden Meadow Mix
bull Unit benefit range over PUL = $396SF to $211SF of area ($730SF standard value)
bull Assumed PUL = 30 yearsbull Apply standard value unit benefit to bioswale
rain gardenmeadow mix area to estimate total measure benefit
Y Y Y Y Y Y
Cool Roof
bull Unit benefit range over PUL = $117 to $3151SF of material area ($144SF standard value)
bull Assumed PUL = 20 yearsbull Apply standard value unit benefit to cool roof
area to estimate total measure benefitbull Higher range values more applicable to
residential building streetscape projects
Y Y Y Y Y
Light-Colored PaversLight-Colored Materials
bull Unit benefit range over PUL = $0774 to $204SF of material area ($0866SF standard value)
bull Assumed PUL = 30 yearsbull Apply standard value unit benefit to material
area to estimate total measure benefit
Y Y Y Y
Table 17 provides general guidance on how to quantitatively calculate benefits from efforts to address climate stressors See Section IIIE for more information
NYC Mayorrsquos Office of Recovery and Resiliency Climate Resiliency Design Guidelines
50APPENDIX 4 - PROJECT BENEFITS CATEGORIES
Table 17 ndash Guidance on quantitative unit benefit calculations for extreme heat hazard measures
Measure General Guidance ndash Unit Benefit Information and Data Requirements
Applicable Benefit Category
Applicable Typical Facility Typology
Dire
ct B
enefi
ts
Indi
rect
Ben
efits
Oth
er P
oten
tial
Ben
efits
Bui
ldin
g St
ruct
ures
Com
plex
Fa
cilit
ies
Tran
spor
tatio
nSt
reet
scap
es
Plaz
as
Park
Fea
ture
s
Tree Planting
bull Unit benefit range over PUL = $1005 to $77154Tree ($1855Tree standard value)
bull Assumed PUL = 30 yearsbull Apply standard value unit benefit to number of
trees to estimate total measure benefitbull Higher range values more applicable
to residential and commercial building streetscape projects
Y Y Y Y Y Y
Planter Box Tree
bull Unit benefit range over PUL = $212 to 16304Tree ($392Tree standard value)
bull Assumed PUL = 15 yearsbull Apply standard value unit benefit to number of
trees to estimate total measure benefitbull Higher range values more applicable
to residential and commercial building streetscape projects
Y Y Y Y Y
Shade Canopy
bull Unit benefit range over PUL = $0363 to $396SF ($0458SF standard value)
bull Assumed PUL = 15 yearsbull Apply standard value unit benefit to area of
shade canopy estimate total measure benefitbull Higher range values more applicable
to residential and commercial building streetscape projects
Y Y Y Y
Permeable Grass Pavers
bull Unit benefit range over PUL = $0258SF to $0521SF of pavers ($0363SF standard value)
bull Assumed PUL = 30 yearsbull Apply standard value unit benefit to paver
area to estimate total measure benefit
Y Y Y Y Y
For the purposes of the BCA refer to the following facility typologies bull ldquoBuilding Structuresrdquo include critical small building sites such as EMS or FDNY stations and non-critical small building sites such as
libraries or comfort stationsbull ldquoComplex Facilitiesrdquo include critical infrastructure such as wastewater treatment sites pump stations water filtration plants and similar
large or complex facilitiesbull ldquoTransportationStreetscapePlazasrdquo include roadway reconstruction streetscape improvements street raising plazas and other
transportation-related infrastructurebull ldquoPark Featuresrdquo include parks and similar public recreational facility with natural landscape features
NYC Mayorrsquos Office of Recovery and Resiliency Climate Resiliency Design Guidelines
51APPENDIX 5 - EXAMPLE PLANNING DECISION TREE
This decision tree provides a summarized example approach for how to implement these Guidelines Projects with a total cost greater than $50 million are recommended to conduct a full qualitative and quantitative climate change risk assessment and BCA while projects below $50 million are recommended to conduct a qualitative risk assessment and BCA
Define Project
1) Operational goals and criticality level2) Useful life3) Location in the current flood plain future floodplain and or zone
of tidal inundation and the project arearsquos score on the heat vulnerability index
Evaluate Project Risks According to Probability and Magnitude of Consequence
bull Extreme Heat bull Precipitationbull Sea Level Risebull Coastal Surge
High Level Identification and Assessment of Risk Mitigation Alternatives and Co-benefits
(qualitative)
Detailed Identification and Assessment of Risk Mitigation Alternatives and Co-benefits (qualitative and quantitative)
High Level Estimate of Costs and Benefits of Design Alternatives
(qualitative)
Detailed Estimate of Costs and Benefits of Design Alternatives
(qualitative and quantitative)
Decision Point Which climate change risks require mitigation
Decision Point Evaluate risk mitigation benefits and costs to
determine final resilient design alternative or if no action is required
Decision Point Is the total project cost above $50 million
Below $50 million Above $50 million
APPENDIX 5 - EXAMPLE PLANNING DECISION TREE
NYC Mayorrsquos Office of Recovery and Resiliency Climate Resiliency Design Guidelines
52
Project Title
Design Strategies Checklist (not exhaustive)
Extreme Heat Comments Extreme Precipitation Comments Sea Level Rise amp Storm Surge Comments
Select Site in Low Heat Vulnerability Index area Select High Elevation Site Select High Elevation Site
Minimize East-West Building Orientation Green Roof Raise Building Floor Elevation
Passive Solar Cooling and Ventilation Systems
Protect Below Grade Areas from Flooding Waterproof Building Envelope
Cool Roof (SRI appropriate) On-site Stormwater Management (gray) Elevate Critical Building Functions
Green Roof (extensive) Reduce Impervious Areas Elevate Critical Equipment
Vegetative Structures Permeable Pavement Perimeter Floodwall100 Levee (passive or active)
Enhanced HVAC System including space layout optimization and system scalability
Increase Green Spaces and Planted Areas DryWet Floodproofing
More Efficient Building Envelope Other Utility Redundancy Design101
Parking Lot Shading Resilient Materials amp Landscape Treatments
Light Colored Pavements (appropriate SRI) Design for Storm Surge Outflow
Increase Planted Areas Install Backwater Flow Prevention
Permeable Surfaces Design for Scour
Open-grid Pavement Raise Road Elevation
Other Other
This appendix provides a template for identifying possible design strategies to address climate change risks as described throughout the Guidelines
APPENDIX 6 - DESIGN STRATEGIES CHECKLIST
100 Permanent perimeter flood walls are not permitted to meet floodproofing requirements in buildings with substantial improvements andor damages 101 Utility redundancy design should be pursued for critical systems not all building systems
APPENDIX 6 - DESIGN STRATEGIES CHECKLIST
NYC Mayorrsquos Office of Recovery and Resiliency Climate Resiliency Design Guidelines
53APPENDIX 7 - CLIMATE CHANGE RISK ASSESSMENT RESOURCES
These Guidelines provide data on climate change hazards and recommend how that data can inform resilient design A risk assessment is a tool to help project managers and designers evaluate risk levels as well as select and prioritize resilient design strategies A high level risk assessment is recommended for all City capital projects with a total cost of under $50 million Projects above $50 million are recommended to conduct an in-depth assessment
Risk assessments use quantified estimates of the probability and magnitude of consequence of an event occurring to prioritize responses ldquoProbabilityrdquo is an assessment of the likelihood of a hazard occurring while ldquomagnituderdquo describes the hazardrsquos potential impact Risk assessment tools such as the examples listed below can be used to define and score these categories Projects that score higher across both probability and magnitude can be prioritized for investment and risk mitigation action Projects that score lower across both criteria may require no action beyond meeting code The results are typically charted on a risk matrix and an example is provided on the next page
The climate change risk management frameworks below offer templates for how to integrate climate change projections into a risk assessment process Refer to these resources for examples and further information
bull Vulnerability Assessment and Adaptation Framework is prepared by the Federal Highway Administration (FHWA) While developed for transportation planning this risk assessment framework has broad applicability for evaluating asset vulnerability to climate change Available at httpswwwfhwadotgovenvironmentsustainabilityresilienceadaptation_framework
bull US Climate Resilience Toolkit The US Global Change Research Program offers a step by step risk assessment
framework including tools and case studies at httpstoolkitclimategovsteps (see example on next page)
bull Coast Adapt Guidance on undertaking a risk assessment High level assessment httpscoastadaptcomausitesdefaultfilesfactsheetsT3M4_2_2nd_pass_risk_assessmentpdfDetailed assessment httpscoastadaptcomausitesdefaultfilesfactsheetsT3M4_3_3rd_pass_risk_assessmentpdf
bull Climate adaptation Risk uncertainty and decision-makingDownload the report here httpswwwukciporgukpublicationsRisk
The City plans to develop a NYC-specific process for integrating climate change data into existing risk management processes by April 2019
APPENDIX 7 - CLIMATE CHANGE RISK ASSESSMENT RESOURCES
NYC Mayorrsquos Office of Recovery and Resiliency Climate Resiliency Design Guidelines
54APPENDIX 7 - CLIMATE CHANGE RISK ASSESSMENT RESOURCES
The Risk Characterization Matrix below is an example from the US Climate Resilience Toolkit This tool can be used to assess the probability and magnitude of impact for identified risks The risk of coincident climate stressorsrisks (such as storm surge plus increased precipitation) can also be assessed as applicable
Figure 14 - Example of a climate change risk matrix (adapted from US Climate Resilience Toolkit)
Project teams can determine the magnitude of the impact (along the horizontal scale of 1 through 3 with 3 being the most severe) and the probabilitylikelihood of occurrence for each specific risk (along the vertical scale with 3 being the most likely) A score is typically assigned for each risk (Probabil-ity x Magnitude) and then charted on the matrix Based on the estimated probability and magnitude of consequence above the risks are ranked and prioritized for mitigation Factors to bear in mind include
bull Not all facility typologies have the same level of functional and operational importance during events or tolerance for disruption
bull Not all climate stressors and risks have the same level of impact on each project sitebull Not all identified risks can or should be mitigated fully
NYC Mayorrsquos Office of Recovery and Resiliency Climate Resiliency Design Guidelines
55WORKS CITED
A Stronger More Resilient New York PlaNYC Report of the NYC Special Initiative for Rebuilding and Resiliency The City of New York 2013
ldquoAccount for Climate Riskrdquo International Finance Corporation accessed March 27 2017 httpwwwifcorgwpswcmconnectTopics_Ext_ContentIFC_External_Corporate_SiteClimate+Business
PrioritiesAccount+for+Climate+Risk
American Society of Heating Refrigeration and Air-Conditioning Engineers (ASHRAE) Handbook -Fundamentals 2017
ldquoBaseline Standard Economic Value Methodology Reportrdquo Federal Emergency Management Agency July 2016
Benefit Cost Analysis Toolkit Software Version 530 Federal Emergency Management Agency (build date December 2016)
Criteria for Detention Facility Design New York City Department of Environmental Protection November 2012
Community Resilience Planning Guide for Buildings and Infrastructure Systems Vol 1 NIST Special Publication 1190 US Department of Commerce 2016
Cool and Green Roofing Manual NYC Department of Design and Construction 2007 httpwwwnycgovhtmlddcdownloadspdfcool_green_roof_manpdf
Building Resiliency Task Force US Urban Green Building Council New York 2013 httpurbangreencouncilforcecomBuildingResiliency
Design and Planning for Flood Resiliency Guidelines for NYC Parks New York City Department of Parks and Recreation 2017
httpswwwnycgovparksorgplanning-and-buildingplanningresiliency-plansflood-resiliency
Flooded Bus Barns and Buckled Rails Federal Transit Administration Office of Budget and Policy 2011 httpswwwhsdlorgabstractampdid=685187
Floodproofing Non-Residential Buildings FEMA P936 FEMA 2013 httpswwwfemagovmedia-library-data9a50c534fc5895799321dcdd4b6083e7P-936_8-20-13_508rpdf
ldquoGlossaryrdquo International Infrastructure Management Manual National Asset Management Support Group New Zealand 2011 httpwwwipweaorg
ldquoGreen Roof Metrics Draft Reportrdquo New York City Department of Parks and Recreation 2017
ldquoGuide to Rain Event Preparednessrdquo NYC Department of Environmental Protection httpwwwnycgovhtmldeppdfbrochuresflood-preparedness-flyerpdf
ldquoGuidelines and Discount Rates for Benefit-Cost Analysis of Federal Programsrdquo Appendix C Circular A-94 US Office of Management and Budget (OMB) 2017
ldquoGuidelines for the Design and Construction of Stormwater Management Systemsrdquo New York City Department of Environmental Protection July 2012
Horton R et al New York City Panel on Climate Change 2015 Report Ann NY Acad Sci ISSN 0077-892 New York 2015
Madrigano J et al ldquoA case-only study of vulnerability to heat wavendashrelated mortality in New York City (2000ndash2011)rdquo Environmental Health Perspectives 123672ndash678 2013
WORKS CITED
NYC Mayorrsquos Office of Recovery and Resiliency Climate Resiliency Design Guidelines
56WORKS CITED
enspMcGregor et al Two Degrees The Built Environment and Our Changing Climate Routledge Press 2013
NYC Green Codes Task Force US Green Building Council New York 2010 httpurbangreencouncilorgGreenCodes
NYCrsquos Risk Landscape A Guide to Hazard Mitigation NYC Emergency Management 2014
One New York The Plan for a Strong and Just City The City of New York 2015 httpwwwnycgovhtmlonenyc downloadspdfpublicationsOneNYCpdf
Ready to Respond Strategies for Multifamily Building Resilience Enterprise Green Communities 2015 httpswwwenterprisecommunityorgresources
Rosenzweig C et al Climate Change Adaptation in New York City Building a Risk Management Response New York City Panel on Climate Change 2010
httponlinelibrarywileycomdoi101111nyas20101196issue-1 issuetoc
ldquoSustainable Infrastructure Management Program Learning Environmentrdquo Water Environment Research Foundation accessed March 24 2017 httpsimplewerforg
Urban Waterfront Adaptive Strategies NYC Department of City Planning 2013 httpwww1nycgovsiteplanningplanssustainable-communitiesclimate-resiliencepagetab=1
Wastewater Resiliency Plan Climate Risk Assessment and Adaptation Study New York City Department of Environmental Protection October 2013
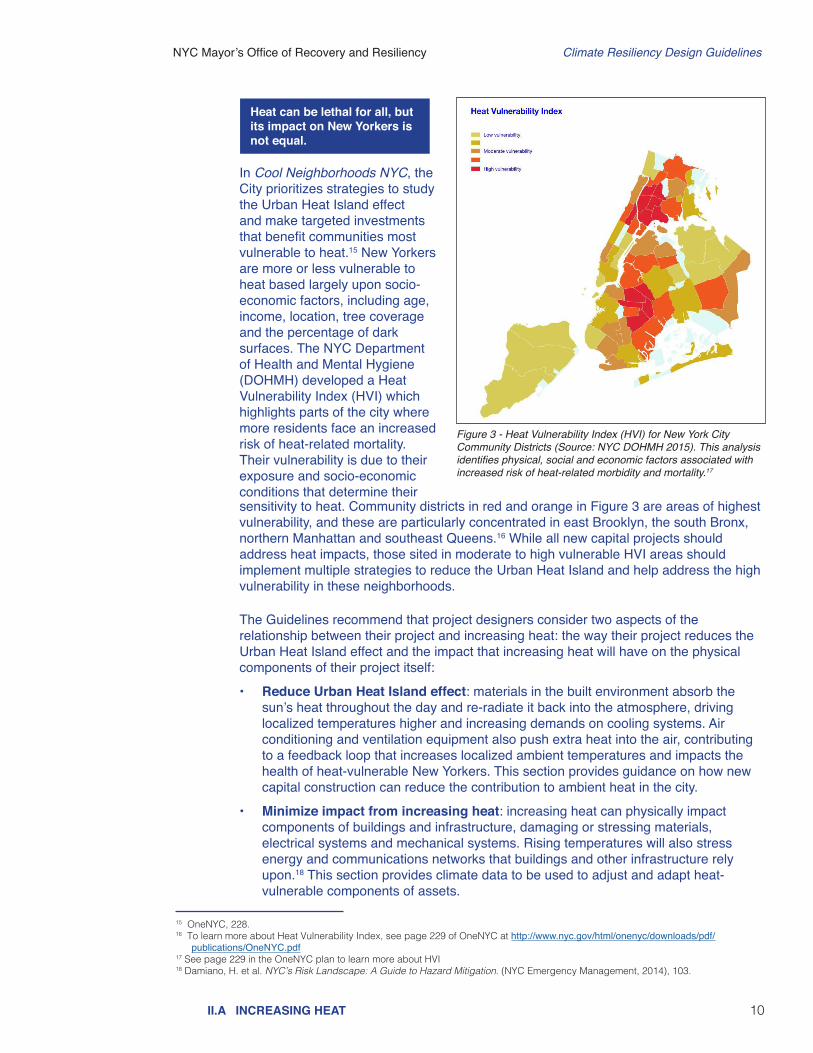
NYC Mayorrsquos Office of Recovery and Resiliency Climate Resiliency Design Guidelines
10IIA INCREASING HEAT
In Cool Neighborhoods NYC the City prioritizes strategies to study the Urban Heat Island effect and make targeted investments that benefit communities most vulnerable to heat15 New Yorkers are more or less vulnerable to heat based largely upon socio-economic factors including age income location tree coverage and the percentage of dark surfaces The NYC Department of Health and Mental Hygiene (DOHMH) developed a Heat Vulnerability Index (HVI) which highlights parts of the city where more residents face an increased risk of heat-related mortality Their vulnerability is due to their exposure and socio-economic conditions that determine their
Figure 3 - Heat Vulnerability Index (HVI) for New York City Community Districts (Source NYC DOHMH 2015) This analysis identifies physical social and economic factors associated with increased risk of heat-related morbidity and mortality17
The Guidelines recommend that project designers consider two aspects of the relationship between their project and increasing heat the way their project reduces the Urban Heat Island effect and the impact that increasing heat will have on the physical components of their project itself
bull Reduce Urban Heat Island effect materials in the built environment absorb the sunrsquos heat throughout the day and re-radiate it back into the atmosphere driving localized temperatures higher and increasing demands on cooling systems Air conditioning and ventilation equipment also push extra heat into the air contributing to a feedback loop that increases localized ambient temperatures and impacts the health of heat-vulnerable New Yorkers This section provides guidance on how new capital construction can reduce the contribution to ambient heat in the city
bull Minimize impact from increasing heat increasing heat can physically impact components of buildings and infrastructure damaging or stressing materials electrical systems and mechanical systems Rising temperatures will also stress energy and communications networks that buildings and other infrastructure rely upon18 This section provides climate data to be used to adjust and adapt heat-vulnerable components of assets
15 OneNYC 22816 To learn more about Heat Vulnerability Index see page 229 of OneNYC at httpwwwnycgovhtmlonenycdownloadspdf
publicationsOneNYCpdf17 See page 229 in the OneNYC plan to learn more about HVI18 Damiano H et al NYCrsquos Risk Landscape A Guide to Hazard Mitigation (NYC Emergency Management 2014) 103
Heat can be lethal for all but its impact on New Yorkers is not equal
sensitivity to heat Community districts in red and orange in Figure 3 are areas of highest vulnerability and these are particularly concentrated in east Brooklyn the south Bronx northern Manhattan and southeast Queens16 While all new capital projects should address heat impacts those sited in moderate to high vulnerable HVI areas should implement multiple strategies to reduce the Urban Heat Island and help address the high vulnerability in these neighborhoods
NYC Mayorrsquos Office of Recovery and Resiliency Climate Resiliency Design Guidelines
11IIA INCREASING HEAT
1 Urban Heat Island reductionNew capital construction should minimize its contribution to the Urban Heat Island effect The design interventions provided below offer benefits to the community and the facility through reduced heat loading reduced energy costs andor improved occupant health and thermal comfort The appropriate combination of design interventions will vary dependent on the project scope
a) Increase the solar reflectance of surfaces by utilizing light-colored pavement coatings and materials in combination with shading with a minimum target of 50 of the non-structure areas of facility sites19
Lighter reflective surfaces help reduce the Urban Heat Island effect heat loading and internal building temperatures and extend the lifespan of rooftops and heating ventilation and air conditioning (HVAC) equipment The City has taken steps towards reducing ambient temperatures such as implementing the NYC Cool Roofs program20 New buildings as well as existing buildings with roofs going through significant repairs are required by law to paint their roofs white This program intervention reduces a buildingrsquos contribution to Urban Heat Island effect and provides energy savings by coating the normally dark concrete roof surface with white paint allowing the roof to reflect solar radiation
b) Increase the shading of surfaces by planting trees or other vegetation in combination with cool pavements with a minimum target of 50 of the non-structure areas of facility sites
Shady areas with heat- and in coastal areas salt-tolerant vegetative species can help keep buildings cool and provide energy savings as well as lower temperatures
c) Meet Climate Zone 6 standards for fenestration and insulation (See Section ECC C402 in Chapter C4 of the 2016 NYC Energy Code) to improve efficiency of building envelopes
NYC is currently in Climate Zone 4 NYC already requires that small residential building envelopes are designed to meet higher insulation and fenestration requirements to improve energy efficiency21 All City capital projects including non-residential facilities should meet this standard
d) Select greenblue roofs andor other appropriate landscape elements that maximize cooling with help of landscape architects
The City already encourages the use of green and blue roofs on buildings to reduce the Urban Heat Island effect22 provide stormwater management and increase the useful life of the roof Besides replacing dark roof surfaces green roofs and vegetation also provide shade and keep the air cool through evapotranspiration by releasing moisture into the atmosphere Blue roofs coupled with light colored roofing material can provide stormwater management and rooftop cooling Some of these designs support the shading and solar reflectance goal in Step a) above Additionally City capital projects are subject to Leadership in Energy and Environmental Design (LEED) certification and green roofs can earn LEED credits23 Projects should integrate cooling strategies listed below based on project scope and a balance between costs and benefits
bull Green roofs or blue roofs on a broader range of facilities (including industrial buildings storage garages administration buildings etc)
19 Urban Green Council (2010) Green Codes Task Force Proposed code ldquoEF 12 Reduce Summer Heat with Cool Shady Building Lotsrdquo20 Local Law No 21 (2011) amended Chapter 12 of the NYC Building Code to update roof coating standards Also
see Cool and Green Roofing Manual (DDC) 2007 for more information on NYC standards for cool and green roofs httpwwwnycgovhtmlddcdownloadspdfcool_green_roof_manpdf
21 Read more about the code here httpswww1nycgovsitebuildingscodes2016-energy-conservation-codepage22 See Cool and Green Roofing Manual (DDC) 2007 for more information on NYC standards for cool and green roofs
httpwwwnycgov htmlddcdownloadspdfcool_green_roof_manpdf23 See Local Law No 32 (2016) for more information
NYC Mayorrsquos Office of Recovery and Resiliency Climate Resiliency Design Guidelines
12
2 Minimize impact from increasing heatThis section provides information to support making design adjustments to capital projects to reduce impacts to equipment structures landscapes and materials from rising average temperatures and increasing extreme heat events
a) Review forward-looking climate data provided in Table 1 and Table 2 Select heat projections according to the useful life of the facility and its primary
components then evaluate and address impacts in the steps below Table 1 provides design criteria for average temperatures and incidents of extreme heat events projected to different time periods across the 21st century Table 2 provides guidance on future 1 Dry Bulb Temperature and Cooling Degree Days for the NYC area The 1 Dry Bulb Temperature represents the ambient air temperature
IIA INCREASING HEAT
bull Vegetated structures such as shade trees and planters (to reduce heat loading on horizontal or vertical surfaces)
bull Bioswales rain gardens and bioretention24 bull Maximize planted permeable surfacesbull Other permeable surfaces (used for stormwater management these retain
moisture that evaporates as surface temperatures rise)25 bull Open-grid pavement system (at least 50 unbound)26 bull Evaluate site planning and building massing with regard to solar gainbull Solar panels for shading and to generate energy
Table 1 ndash Baseline and projected extreme heat events27
End of useful life
heat waves per year (3 or more consecutive days with max temperatures at or above 90degF)
days above 90degF
Annual average temperature
Baseline (1971-2000) 2 18 54degF
Through to 2039 4 33 572degF
2040-2069 7 57 606degF
2070-2099 9 87 643degF
Table 2 ndash Projections for 1 Dry Bulb temperature and Cooling Degree Days
Change in projected value for 2050s
Variable Baseline for Central Park (1971-2000)
Low estimate (10th percentile)
Middle range (25th to 75th percentile)
High estimate (90th percentile)
1 Dry Bulb temperature 91degF +3degF +4-6degF +7degF
Cooling Degree Days (base = 65degF) 1149 +37 +46-73 +87
Note Due to HVAC system typical useful life of 25 years or less only projections for the 2050s are shown Projections for the 2020s are not shown because it is anticipated that enough of a safety margin is employed already in current systems to withstand the temperature rise expected through the 2020s The NPCC is currently working on projections of 1 Wet Bulb temperatures which are expected to increase and may require systems to have higher moisture reducing capacity in addition to the enhanced cooling capacity
24 When siting bioswales consider groundwater levels and soil permeability and ensure that the site is not contaminated from past or present land uses A high water table may prohibit some applications
25 Urban Green Council (2010) Green Codes Task Force Proposed code ldquoSW 1 REDUCE EXCESSIVE PAVING OF SITESrdquo26 LEED Neighborhood Development v4 ldquoHeat island reductionrdquo credit27 Projected estimates for average temperatures are based upon 90th percentile change factor added to the baseline average annual
temperature from New York City Panel on Climate Change (2015)
NYC Mayorrsquos Office of Recovery and Resiliency Climate Resiliency Design Guidelines
13IIA INCREASING HEAT
b) Evaluate potential impacts on systems and materials Heat impacts on a facility are highly contingent on the facility type and should be reviewed on a case-by-case basis28 A decrease in the useful life or operational capacity of a facility or components of a facility may occur due to rising temperatures Interventions will also vary depending on whether the project is a new capital investment or a substantial improvement to an existing facility Factors to evaluate as applicable to project scope include but are not limited to
bull Thermal expansion warping softening or other forms of material change or degradation of structural integrity occurring at an accelerated rate by excessive heat
bull Health and safety impacts on occupants vulnerable to heat bull Increased failure or reduced efficiency of electrical or mechanical systems bull Prioritization of critical loads for systems and components at the facility andbull Moisture control needs for buildings with a higher standard for fenestration and
insulation
The results of this evaluation will inform steps taken in the step below
c) Reduce heat impacts Review and implement specific changes to the facility design based on assessments
above Develop a strategy based on the specific type of facility its operational profile and its useful life A Design Strategies Checklist is available for use in Appendix 6 as a resource to track design approaches Specific areas of focus are
bull Electricity outages High temperatures drive demand for air conditioning and can increase the risk of facility equipment failure potentially broader grid disruptions or brownouts2930 To manage this risk design City buildings and infrastructure to withstand periods without electricity using the following approaches in particular if they provide critical or essential services
Ǯ Identify and assess how much of the facilityrsquos load is critical (eg ldquocritical loadrdquo) including the necessary duration of the backup power supply (eg is backup power needed for 8 hours or multiple days) Determining what loads are critical and how long they should be powered for is essential for a facilityrsquos operations and what the role of the facility will have in an emergency situation31
Ǯ Depending on the size of the critical load and budget different backup power supply options could range from backup generators (eg diesel natural gas) to hybrid systems (eg solar + battery storage + appropriately sized generator) Each option has different trade-offs that should be considered in terms of cost feasibility and environmental impacts For shorter duration needs andor smaller critical loads buildings with existing solar systems should consider adding storage to provide a resiliency benefit In some cases co-generation systems may make sense from an economic and resiliency perspective especially if there
28 Sector- and facility-specific impacts vary greatly For examples of sector-specific impacts and design responses see Flooded Bus Barns and Buckled Rails (FTA 2011) and Ready to Respond Strategies for Multifamily Building Resilience (Enterprise Green Communities 2015)
29 McGregor et al (2013) Two Degrees The Built Environment and Our Changing Climate Routledge Press30 High temperatures also increase energy demand which can increase fossil fuel based greenhouse gas emissions31 The key roles of the facility that need to be identified are operational hours number of occupants and electrical loads needed for the
desired operations Electrical equipment and appliances for the desired operations may include - but are not limited to - safety lighting life-supporting systems fire protection systems telecommunications equipment mechanical systems to mitigate extreme temperatures and computing equipment Every facility is unique Operational characteristics and load profiles need to be established prior to sizing the equipment required to keep the facility in operational mode
NYC Mayorrsquos Office of Recovery and Resiliency Climate Resiliency Design Guidelines
14IIA INCREASING HEAT
is a significant heating andor cooling load in addition to electricity demand32
Ǯ Depending on the option assess need to invest in internal electricity rewiring and building energy management systems (eg switches reconfiguration of distribution infrastructure to isolate critical loads from non-critical loads and the ability to island from the broader grid during the event of a larger disruption software and hardware to manage the deployment of hybrid systems) andor need for external hookups for temporary generators and boilers33
bull Failure in facility ventilation electrical and air conditioning systems Some systems designed to meet the requirements of past climate may overheat and fail during extreme events Some design interventions include34
Ǯ Selecting systems with higher heat tolerance Ǯ Adding Energy Recovery Ventilation systems Ǯ Providing additional or redundant ventilation systems either mechanical or
natural to cool electrical equipment Ǯ Optimizing building layout by
bull segregating temperature sensitive electronics and computer control system from other systems
bull placing heat generating equipment like transformers and switchgear outdoors where permitted and
bull splitting the facility cooling loads among different HVAC systems in facility for redundancy and better zone control
bull Passive solar cooling and ventilation There are numerous design features that provide passive solar cooling for buildings to help maintain lower internal ambient temperatures with less air conditioning These features also help keep facilities habitable during extended grid failures when generators fail or must be reserved for critical functions Some design features include35
Ǯ Appropriate east-west orientation Ǯ Passive ventilation design Ǯ Vertically stacked double skin facades Ǯ Exterior window shades Ǯ Light colored exteriors Ǯ Shaded arcades Ǯ Thermally massive materials Ǯ High performance glazing Ǯ Operable windows
32 To learn more see the Building Resiliency Task Force report from Urban Green Council (2013)33 Ibid 34 Flooded Bus Barns and Buckled Rails FTA Office of Budget and Policy 201135 These and other examples are found in McGregor et al (2013) Two Degrees The Built Environment and Our Changing Climate
Routledge Press Also see Flooded Bus Barns and Buckled Rails FTA Office of Budget and Policy 2011
NYC Mayorrsquos Office of Recovery and Resiliency Climate Resiliency Design Guidelines
15IIB INCREASING PRECIPITATION
B INCREASING PRECIPITATIONThe intensity and frequency of precipitation events are projected to increase with climate change creating new challenges for stormwater management and impacts to the built environment such as
bull The potential for greater frequency of stormwater management systems being overwhelmed36
bull More frequent and severe flooding of buildings and infrastructure in areas across the city and
bull Greater variability in rainfall events annually including the chance of drought
The goal for this section is to guide stormwater management approaches including infiltration increases in on-site storage volume and where possible increases in sewer capacity to account for precipitation increases associated with climate change Designers should develop and consider design interventions that would decrease site contribution to sewer in-flows beyond the existing NYC Building Code requirements Given its complexity the Department of Environmental Protection (DEP) is also evaluating climate impacts to the sewer system on a drainage-wide level Proactive design such as increasing on-site infiltration and storm water retention can contribute to system resiliency on a site-specific basis
BackgroundNYCrsquos drainage systems are designed to handle approximately the current 3-year intensity-duration-frequency (IDF) event in most areas of the city where sewers were built prior to 1970 In locations with sewers built after 1970 the capacity was built to handle the 5-year event NYCrsquos network of drainage systems can experience flooding above those thresholds due to widespread precipitation events or by localized intense storms (sometimes called ldquocloudburstsrdquo) causing flooding and backups Climate change projections indicate that flooding resulting from multiple types of precipitation events may increase in frequency This increasing probability is forecast for all types of precipitation events in NYC although there is greater uncertainty around future short duration events Relying on sewers alone to manage extreme precipitation events will not be sufficient in a changing climate The City plans to reduce impervious areas and provide additional storage capacity to reduce flood damage For managing stormwater from larger storms such as at the 50- and 100-year recurrence intervals DEP is increasingly considering the role of streets and open space in managing flow this is referred to as a dual drainage design approach The City is piloting projects to test this dual drainage approach
Another set of interventions include Bluebelt best management practices (BMPs) such as constructed wetlands storm water ponds and stream restorations that emulate pre-development conditions to manage large volumes of water and green infrastructure37 which in NYC have generally been designed to reduce flooding and combined sewer overflow respectively They are not typically sized to manage precipitation events of the same magnitude as sewers which serve as primary drainage conveyance However Bluebelt BMPs green infrastructure and other stormwater management tools may provide an additional buffer for larger storm events by temporarily storing andor infiltrating runoff that would otherwise be directed into the sewer system For instance areas of open space commonly found in NYC may not provide adequate environments for trees and other plantings However in these cases other types of green infrastructure like permeable surfaces and subsurface detention and retention installations would still be considered feasible
36 NYC is already taking steps to address this problem which will worsen with climate change To learn more about how NYC is using green and gray infrastructure to manage stormwater visit httpwwwnycgovhtmldephtmlstormwaterindexshtml
37 NYC DEP NYC Green Infrastructure Program
NYC Mayorrsquos Office of Recovery and Resiliency Climate Resiliency Design Guidelines
16IIB INCREASING PRECIPITATION
The City led by DEP continues to develop its options for managing heavier storm events due to climate change DEP is examining approaches to evaluate sea level rise and rainfall intensity for stormwater management and where possible sewer capacity These efforts will integrate forward-looking climate data into the design of these capital assets and the compounding factors of heavier rain storms and sea level rise will likely require greater infiltration and on-site storm water retention capacity Agencies and consultants should work directly with DEP to develop strategies on a given site necessary to meet expected increases in rainfall intensities and frequencies
1 Precipitation design adjustment for on-site stormwater systems
Based upon the design storm required for the City facility in design follow the steps below and review recommended design interventions
a) Identify the duration of the design event required The current 50-year IDF can be used as a proxy for the future 5-year storm
(projected for the 2080s) Design on-site detentionretention systems to retain the volume associated with the current 50-year IDF curve (see Figure 4 below) Design the on-site system to release at the maximum rate as specified in 15 Rules of the City of NY (RCNY) Chapter 3138
b) Conduct sensitivity analysis Compare the retentiondetention required for the current 5-year IDF versus the
38 Refer to existing codes and standards as well when determining the existing required storm as NYC requires different sizes of design storms for infrastructure and buildings For example NYC Plumbing Code Chapter 11 and Title 15 of the Rules of the City of New York Chapter 31
02
04
06
10
20
40
60
100
200
-2316090
Rai
nfal
l Int
ensi
ty (
inch
es p
er h
our
)
DurationsruoHsetuniM
5 10 15 30 1 2 3 6 12 18
5-yr
10-yr25-yr
50-yr
100-yr
NEW YORK NEW YORK
Figure 4 - Current Intensity-Duration-Frequency Precipitation Curve for NYC adapted from US Department of Commerce Weather Bureau Technical Paper 25
NYC Mayorrsquos Office of Recovery and Resiliency Climate Resiliency Design Guidelines
17IIB INCREASING PRECIPITATION
c) Identify design interventions for managing increased precipitation40 There are different ways to manage stormwater better and avoid urban flooding after
intense rain Choose the right combination of interventions after considering the site location operational requirements cost benefits and useful life of the intervention Some examples of design interventions are
bull Minimize increases in impervious surfacebull Utilize strategies that infiltrate evaporate or reuse rainwater to achieve storm
water volume reductions Then choose strategies that detain (delay drainage) to manage the rate of the storm water flow into the Cityrsquos drainage system
bull Install stormwater infiltration detention and storage (eg bioswales41 green roofs blue roofs and other blue or green infrastructure storage basins or tanks)
bull Protect areas below grade from floodingbull Keep catch basin grates clearbull When implementing perimeter protections ensure that interior water
management is also accounted for andbull Explore interventions to protect underground utility and telecommunications
infrastructure from water damage
d) Use appropriate DEP guidelines to perform the above tasks using the higher design storm
The three currently prescribed DEP guidelines are as follows
bull Guidelines for the Design and Construction of Stormwater Management Systems July 201242
bull Criteria for Detention Facility Design November 201243 bull DEP Site Connection Proposal Application and Guidelines44
Note on stormwater standards As DEP updates stormwater standards and develops specific tools to evaluate impacts of increased precipitation and drainage strategies for on-site storm water management these changes will be reflected in future versions of these Guidelines However it is recommended that the designer should develop and consider design interventions that would increase the on-site storage beyond the existing requirements Also a methodology is under development that will establish a consistent citywide process for addressing legal grade which will have further implications for how extreme precipitation is managed
39 NYC DEP Standards for Stormwater Release Rates available at httpwwwnycgovhtmldephtmlenvironmental_reviewsstormwater_release_ratesshtml 40 Also see DEP Guide to Rain Event Preparedness at httpwwwnycgovhtmldeppdfbrochuresflood-preparedness-flyerpdf and
Ready to Respond Strategies for Multifamily Building Resilience at httpwwwenterprisecommunityorgresourcesready-respond-strategies-multifamily-building-resilience-1335641 When siting bioswales consider groundwater levels and soil permeability and ensure that the site is not contaminated from past or
present land uses A high water table may prohibit some applications42 Available at httpwwwnycgovhtmldephtmlstormwaterstormwater_management_constructionshtml43 Available at httpwwwnycgovhtmldeppdfwater_sewer30_criteria_for_detention_facility_design_06062012pdf44 Available at httpwwwnycgovhtmldeppdfwater_sewer24pdf
current 50 year IDF to determine the cost and benefits associated with complying with these Guidelines Use the Evaluation of Project Benefits section below and Appendix 4 for guidance on how to identify and assess benefits Given the results of the costbenefit analyses review the added benefit of designing retentiondetention using greater magnitude storms (eg 100-year) or lower (eg 25-year) The goal is to maximize retentiondetention capacity given site and cost constraints as well as through an evaluation of the benefit of adding capacity to detainretain water for larger storm events
NYC Mayorrsquos Office of Recovery and Resiliency Climate Resiliency Design Guidelines
18
2 Incorporating climate change projections into DEP drainage planning
The first line of defense for managing intense precipitation events does not require changes to the sewer system as described above For drainage and wastewater infrastructure planning in a changing climate the sewer network and wastewater infrastructure should be qualitatively evaluated from the upstream pipes to the regulator chambers pump stations interceptors and ultimately to the downstream outfall to determine the feasibility of incorporating climate change projections into the system design For DEP storm sewer projects FY 2021 or later in separately sewered drainage areas where the design is in the early stages and there is free discharge the agency will evaluate the feasibility of revising the design to incorporate climate projections into the design If the project (including the prescribed changes) passes the costbenefit analysis then DEP will consider incorporating climate change projections into the sizing However changes in one part of the system must be carefully evaluated For example any upsizing of the regulator chamber or the high point of the system can negatively impact the design and operation of the wastewater infrastructure and residencesbusinesses on the system and can lead to a diminished the level of service
DEP is in the process of developing a hydrologic and hydraulic (HampH) model to estimate runoff flow for future climate scenarios and is evaluating rainfall hyetographs for the existing and future rainfall scenarios to be included in the drainage planning process In addition DEP currently coordinates with ORR for drainage planning as a part of coastal resiliency projects A more detailed methodology to incorporate climate change projections into drainage planning will be developed for version 30 of the Climate Resiliency Design Guidelines to be released in April 2019
IIB INCREASING PRECIPITATION
NYC Mayorrsquos Office of Recovery and Resiliency Climate Resiliency Design Guidelines
19IIC SEA LEVEL RISE
non-critical components within a larger facility or campus (eg at a maintenance yard differentiate between structures and equipment) Critical components essential to the facilityrsquos functionality should be protected to the higher standard for criticality even if the facility itself may be non-critical Some examples of critical components include electrical distribution and switching areas motor-control centers chemical feed equipment boilers communications systems monitoring and safety equipment HVAC units fire alarms and suppression equipment furnaces elevators emergency fuel supplies emergency generators and hazardous material storage Component protection should also be evaluated if a facility is expected to be fully operational during a flood event or if it is expected to quickly resume full operations after an event
For buildings and infrastructure with a long useful life it is not always cost effective or operationally feasible to design a facility to be resilient to hazards faced at the end of its useful life In these cases the most resilient design will be one that provides extra protection against hazards in the initial decades while also leaving open design alternatives for updating resiliency measures as new data is provided or new risk assessments are completed This flexible adaptation pathways approach builds in options to protect assets later in life as demonstrated in an example shown in Figure 1 (in Section I)
Other considerations to keep in mind includebull These Guidelines apply to all City capital projects except coastal flood protection
systems which are designed to different standards than those provided here for
C SEA LEVEL RISEThis section provides tools to 1) determine if the project will be subject to tidal inundation during its useful life due to sea level rise and 2) incorporate sea level rise into flood protection levels of capital projects For projects in the current and future 1 annual chance floodplains sea level rise-adjusted design flood elevations (DFE) are provided and reflect the criticality of the asset and its useful life Background NYC has experienced the devastation of coastal storms most recently during Hurricane Sandy Sea level rise is projected to increase the depth extent and frequency of flooding from storm surge45 Sea level rise will also regularly inundate some low-lying areas during high tides Current flood protection heights are determined by using the base flood elevation established by the FEMA Preliminary Flood Insurance Rate Map (PFIRM) 201546 and the standard of protection for buildings in the floodplain in Appendix G of the NYC Building Code47 These Guidelines augment existing requirements for two primary purposes ensuring City facilities built today incorporate sea level rise and critical assets (as defined in Table 4) are protected to a higher level It is important to note that all projects and design interventions must comply with NYC Building Code
Designers should differentiate between critical and
45 New York City Panel on Climate Change Report Chapter 2 Sea Level Rise and Coastal Storms (2015)46 However NYC Building code G10222 requires that designers review both the PFIRM and the effective FIRM and use the more
restrictive of the two 47 For information on the differences between FEMA FIRM PFIRM and the Cityrsquos forward-looking flood maps see Appendix 3
Critical components essential to the facilityrsquos functionality should be protected to the higher standard for criticality even if the facility itself is non-critical
NYC Mayorrsquos Office of Recovery and Resiliency Climate Resiliency Design Guidelines
20IIC SEA LEVEL RISE
buildings and other physical infrastructure Many of NYCrsquos coastal flood protection systems are currently being developed to comply with FEMA accreditation for flood levee systems48 The City plans to develop further guidance for designing coastal protection projects
bull For information on the differences between FEMA FIRM PFIRM and the Cityrsquos forward-looking flood maps see Appendix 3
bull Coincident stressors from sea level rise should also be considered For example bridge scour may increase as sea levels rise Similarly flooding during heavy rainfall events can be worsened due to higher tailwater conditions associated with high sea levels Be aware of how different risks may interact and how different interventions can be deployed to address multiple hazards or provide other co-benefits
bull Note projects that require discretionary approval are required to incorporate sea level rise projections as part of the NYC Waterfront Revitalization Program49 and
bull A methodology is under development that will establish a consistent citywide process for addressing legal grade which will have further implications for how sea level rise and precipitation are managed
For more information see Section IE Designers should use the resources and methods described in this section to 1) assess tidal inundation due to sea level rise and 2) address risks in the current and future floodplains
1 Assessing tidal inundation due to sea level riseTidal flooding currently affects parts of NYC and is projected to worsen as sea levels rise and inundate low-lying coastal sites during high tides When determining a site location or establishing scope of substantial improvements for other types of coastal facilities the project team will consider alternative sites outside of zones threatened with regular inundation if resiliency actions are not taken Some facilities such as wastewater treatment plants and harbor facilities need to be near the coast for operational purposes
a) Determine tidal inundation risk from sea level rise Use the Flood Hazard Mapper (httpwwwnycgovfloodhazardmapper)50 to see if your
site is in an area inundated from high tide plus sea level rise within the projectrsquos useful life For example if the useful life ends between 2040 and 2069 choose the 2050s High Tide map) Determine risk only from high tide and sea level rise separate from flood events Follow the instructions in Figure 5 and refer to the example in Figure 6 to review inundation at the end of an assetrsquos useful life
48 For more information please visit httpwwwfemagovfema-levee-resources-library49 For more information visit httpwwwnycgovwrp50 The Flood Hazard Mapper relies on publicly available data to present these map resources Users should also refer to FEMA and the
NPCC for official information
Figure 5 - Flood Hazard Mapper high tide plus sea level rise at httpwwwnycgovfloodhazardmapper
NYC Mayorrsquos Office of Recovery and Resiliency Climate Resiliency Design Guidelines
21IIC SEA LEVEL RISE
b) Address flood risk If the Flood Hazard Mapper shows that the facility is expected to be inundated by
high tides within its useful life or if primary access roads are at risk of inundation consider alternative site options
- OR - If the site is not expected to be regularly inundated by tides proceed to the next
section 2 Addressing Risks in the Current Floodplain
Note on calculating tidal inundations with sea level rise if a project team is interested in understanding the depth of tidal inundation given climate change projections follow these steps First determine the Mean Higher High Water (MHHW) elevation in feet-NAVD 8851 datum nearest to the site If the MHHW data is unavailable from a site specific survey refer to httpwwwnycgovwrp for a list of MHHW elevations (NAVD88) at tide stations across the city52 Second add the high estimate (90th percentile) of expected sea level rise (see Table 8 in Appendix 2) for the year corresponding to the facilityrsquos useful life to the MHHW to determine the projected depth of tidal inundation with sea level rise
51 North American Vertical Datum of 1988 (NAVD 88) is the vertical control datum of orthometric height established for vertical control surveying in the US based upon the General Adjustment of the North American Datum of 1988
httpswwwngsnoaagovdatumsvertical52 SLR elevations at httpwwwnycgovwrp are adjusted to account for sea level rise since the last tidal epoch If no other resource is
available to determine MHHW use the NOAA Online Vertical Datum Transformation tool to calculate the MHHW in feet-NAVD
Figure 6 - Flood Hazard Mapper with high tide in the 2020s (left) and in the 2080s (right) at httpwwwnycgovfloodhazardmapper
NYC Mayorrsquos Office of Recovery and Resiliency Climate Resiliency Design Guidelines
22IIC SEA LEVEL RISE
2 Addressing risks in the current floodplain53
A facility located in the current 1 annual chance floodplain (PFIRM 2015)54 will face increasing risk of flooding during its useful life due to sea level rise increasing the depth of coastal storms This section provides a process for adjusting the design flood elevation required by code to account for sea level rise
a) Find the location of the facility using the Flood Hazard Mapper (httpwwwnycgovfloodhazardmapper) and follow the instructions in Figure 7
bull Choose to view the layer ldquoFEMA Preliminary FIRM 2015rdquo bull Click on the facility site in the 1 floodplain to view the base flood elevation
Figure 7 - Flood Hazard Mapper with FEMA PFIRM (2015) at wwwnycgovfloodhazardmapper
b) If the facility is not in the current 1 annual chance floodplain (PFIRM 2015) proceed to the next section ldquo3 Addressing risks in the future floodplainrdquo
- OR - If the facility is in the current 1 annual chance floodplain (PFIRM 2015) note
the base flood elevation (BFE) and proceed to Step c) below Please note if a facility has multiple BFEs or if the site is partially in the 1 annual chance floodplain it is recommended to use the highest BFE as the current BFE for the entire site
c) Establish a sea level rise-adjusted DFE Use the current base flood elevation at your site the facilityrsquos useful life and its
criticality level to determine the design flood elevation using Table 4 (on the next page) as a basis of design
53 This process for adjusting the design flood elevation to account for sea level rise satisfies the criteria of the climate-informed science approach described at the state and federal level
54 FEMA updates its flood maps periodically As of April 2018 the most recent maps are the Preliminary Flood Insurance Rate Maps (PFIRM) available at DCPrsquos Flood Hazard Mapper (httpwwwnycgovfloodhazardmapper) Also note that NYC Building Code requires developers to use the PFIRM (2015) or the FIRM (2007) whichever is more restrictive For more information on these requirements please refer to Appendix G of the NYC Building Code Please note that the DCP maps are not official and all site locations should be confirmed with the official FEMA PFIRM NYC will provide information on the latest flood maps as they are updated
NYC Mayorrsquos Office of Recovery and Resiliency Climate Resiliency Design Guidelines
23IIC SEA LEVEL RISE
Table 4 - Determine the sea level rise-adjusted design flood elevation for critical and non-critical facilities55
Critical facilities
End of useful life Base Flood Elevation (BFE)56 in NAVD 88 + Freeboard57 + Sea Level Rise
Adjustment58= Design Flood Elevation (DFE) in
NAVD 88Through 2039 FEMA 1 (PFIRM) 24rdquo 6rdquo = FEMA 1 + 30rdquo
2040-2069 FEMA 1 (PFIRM) 24rdquo 16rdquo = FEMA 1 + 40rdquo2070-2099 FEMA 1 (PFIRM) 24rdquo 28rdquo = FEMA 1 + 52rdquo
2100+ FEMA 1 (PFIRM) 24rdquo 36rdquo = FEMA 1 + 60rdquoNon-critical facilities
End of useful life Base Flood Elevation (BFE) in NAVD 88 + Freeboard + Sea Level Rise
Adjustment = Design Flood Elevation (DFE) in
NAVD 88Through 2039 FEMA 1 (PFIRM) 12rdquo 6rdquo = FEMA 1 + 18rdquo
2040-2069 FEMA 1 (PFIRM) 12rdquo 16rdquo = FEMA 1 + 28rdquo2070-2099 FEMA 1 (PFIRM) 12rdquo 28rdquo = FEMA 1 + 40rdquo
2100+ FEMA 1 (PFIRM) 12rdquo 36rdquo = FEMA 1 + 48rdquoAdditional analysis should be conducted to incorporate wave action and wave run-up in DFE calculations especially in areas that are located within the FEMArsquos 1 annual chance Limit of Moderate Wave Action (LiMWA) zone Wave run up is the maximum vertical extent of wave uprush above surge
Definition of critical buildings and infrastructure for determining DFE in Table 4The criticality definitions below are for use in the application of the Guidelines only All items identified as critical in NYC Building Code Appendix G are critical in these guidelines however this list includes additional facilities that are not listed in Appendix G59 If a facility is not listed here it is considered non-critical for the purposes of determining freeboard
bull Hospitals and health care facilitiesbull Fire rescue ambulance and police stations and emergency vehicle garages bull Jails correctional facilities and detention facilities bull Facilities used in emergency response including emergency shelters emergency preparedness communication
operation centers communication towers electrical substations back-up generators fuel or water storage tanks power generating stations and other public utility facilities
bull Critical aviation facilities such as control towers air traffic control centers and hangars for aircraft used in emergency response
bull Major food distribution centers (with an annual expected volume of greater than 170000000 pounds)60 bull Buildings and other structures that manufacture process handle store dispose or use toxic or explosive
substances where the quantity of the material exceeds a threshold quantity established by the authority having jurisdiction and is sufficient to pose a threat to the public if released61
bull Infrastructure in transportation telecommunications or power networks including bridges tunnels (vehicular and rail) traffic signals (and other right of way elements including street lights and utilities) power transmission facilities substations circuit breaker houses city gate stations arterial roadways telecommunications central offices switching facilities etc
bull Ventilation buildings and fan plantsbull Operations centersbull Pumping stations (sanitary and stormwater)bull Train and transit maintenance yards and shopsbull Wastewater treatment plantsbull Water supply infrastructurebull Combined-sewer overflow (CSO) retention tanksbull Fueling stationsbull Waste transfer stations and bull Facilities where residents have limited mobility or ability including care facilities and nursing homes
55 If an industry standard does not include freeboard in its flood protection standards for particular infrastructure assets then only consider the sea level rise adjustment when determining flood protection levels
56 Note that NYC Building Code requires developers to use the PFIRM (2015) or the FIRM (2007) whichever is more restrictive For more information on these requirements please refer to Appendix G of the NYC Building Code
57 These freeboard values reflect NYC Building Code Appendix G Table 2-1 which establishes the minimum elevation of the top of lowest floor Appendix G requires other freeboard values for other parts of structures and in different parts of the floodplain Refer to Appendix G for the appropriate freeboard and use that value in Table 4 above
58 The sea level rise figures provided are for the middle of the 25th-75th percentile range projections from the NPCC These values do not necessarily indicate the average of all models
59 The structural occupancy categories outlined in Appendix G of the NYC Building Code are the same as ASCE 7 used for structural design For critical buildings structural design should comply with ASCE 7 and 24 for design class IV
60 This threshold represents the median volume of main food distributors in NYC according to statistics collected as part of the Five Borough Food Flow study in 2016 available at
httpswwwnycedccomsystemfilesfilesresource2016_food_supply-resiliency_study_resultspdf 61 The threshold quantity for hazardous materials is established by Chapter 7 of Title 24 of the NYC Administrative Code
NYC Mayorrsquos Office of Recovery and Resiliency Climate Resiliency Design Guidelines
24IIC SEA LEVEL RISE
Figure 9 ndash Outdoor emergency generator for the critical building
This case study provides an example of how to calculate a sea level rise-adjusted DFE based on the useful life of a hypothetical critical services building and its primary component
Step 1 Organize the site by various critical or primary components and their year of construction Determine their useful life along with the associated future year scenario for flood risk assessment In this example the building structure and the outside emergency generator are the most at-risk components from combined sea level rise and coastal storm surge
Step 2 Overlay the site footprint area over the effective current PFIRM or FIRM and the corresponding future year scenario FEMA 1 to identify flood risk to the site From overlaying the 2015 preliminary FEMA floodplain over the site it was determined that the site has a 1 annual chance of flooding with a base flood elevation of 13rsquo NAVD Step 3 Evaluate the criticality of each primary component of the facility based on the Guidelinesrsquo definition for critical infrastructure (Table 4) This (hypothetical) building is critical
Step 4 Use Table 4 to determine the sea level rise adjustment and freeboard requirements for each component and calculate the DFE for each that corresponds to its useful life period
Step 5 Compare the DFE of each component and the associated Guidelinesrsquo recommended DFE to calculate anticipated flood depth
CASE STUDY Adjusting the DFE for Sea Level Rise
Table 5 ndash Example of how to calculate a sea level rise-adjusted DFE for a critical facility
Construction year Components Useful
Life
Future Year Scenario
[Useful Life + Const
Year]
BFE in NAVD
88 (feet)
Freeboard + Sea
Level Rise Adjustment
(feet)
Adjusted DFE in
NAVD 88 (feet)
2010 Building Structure
70 years 2070-2099 130rsquo 2rsquo+23rsquo 173rsquo
2010Outdoor
Emergency Generator
25 years
Through 2039 130rsquo 2rsquo+05rsquo 155rsquo
Figure 8 - Example of how to locate a facility within the current floodplain and determine the BFE Figure 9 (inset) - Outdoor emergency generator at the facility
Figure 10 - This schematic shows how to determine the design flood elevation of a facility within the current 1 floodplain
Illustrative not to scale
NYC Mayorrsquos Office of Recovery and Resiliency Climate Resiliency Design Guidelines
25IIC SEA LEVEL RISE
Figure 11 - Flood Hazard Mapper with future 1 annual chance floodplain (adjusted for sea level rise) at httpwwwnycgovfloodhazardmapper
b) If the site is not in the future floodplain no flood protection is required for this facility
- OR - If the site is in the future floodplain identify the nearest adjacent base flood
elevation at the project site in the current 1 annual chance floodplain (PFIRM 2015) using the Flood Hazard Mapper62
c) Use Table 4 to determine the DFE Add freeboard and the sea level rise-adjustment to the nearest adjacent BFE on the
current 1 annual chance floodplain (PFIRM 2015) to determine the DFE
d) Apply the DFE calculation from Table 4 to the protected facility See Figures 12 and 13 for an illustration of how to calculate the DFE
62 Maps of future floodplains show the impacts of sea level rise alone and do not consider how changes in stormsrsquo climatology might also affect wave action and the full extent of the floodplain
3 Addressing risks in the future floodplainIf the facility is not in the current 1 annual chance floodplain (PFIRM 2015) it may still be at risk in the future from flooding as sea level rise increases the extent of the floodplain Follow the steps below to determine if your facility is located in the future floodplain and if so what sea level rise-adjusted DFE to use
a) Use the Flood Hazard Mapper (httpwwwnycgovfloodhazardmapper) to determine if the facility site will be in the future 1 annual chance floodplain
Assess if by the end of the facilityrsquos useful life the floodplain is projected to increase to encompass all or part of the project site For example if the useful life ends between 2040 and 2069 choose the 2050s floodplain map Refer to the steps in Figure 11 below
NYC Mayorrsquos Office of Recovery and Resiliency Climate Resiliency Design Guidelines
26IIC SEA LEVEL RISE
Figure 12 - This schematic map shows how to locate the nearest adjacent 1 floodplain elevation
Figure 13 -This schematic shows how to determine the design flood elevation of a facility that is outside of the current 1 floodplain
CASE STUDY Identifying a Base Flood Elevation (BFE) in the Future Floodplain
Illustrative not to scale
NYC Mayorrsquos Office of Recovery and Resiliency Climate Resiliency Design Guidelines
27IIC SEA LEVEL RISE
4 Identify appropriate design interventions
63 Additional resources for identifying adaptive strategies Urban Waterfront Adaptive Strategies (NYC Department of City Planning httpswww1nycgovassetsplanningdownloadpdfplans-studiessustainable-communitiesclimate-resilienceurban_waterfrontpdf Floodproofing Non-Residential Buildings (FEMA) at httpswwwfemagovmedia-libraryassetsdocuments34270 Ready to Respond Strategies for Multifamily Building Resilience (Enterprise Green Community) at
httpwwwenterprisecommunityorgresourcesready-respond-strategies-multifamily-building-resilience-1335664 While natural systems-based approaches ameliorate flooding their use for storm surge or wave mitigation would need to be quantified
before contributing towards the design flood elevation 65 For more information see FEMArsquos Floodproofing Non-Residential Buildings at httpswwwfemagovmedia-libraryassetsdocuments34270
Operational requirements and continuity plans can inform the selection of appropriate design interventions particularly in terms of how quickly a site needs to be up and running after a flood event Some examples of how functional uses can pair with interventions include
bull A facility that needs to be operating during or immediately after a flood event may need to be dry floodproofed using permanent barriers or designed for passive survivability (such as a police or fire station)
bull A facility that needs to recover quickly after an event could elevate prioritized equipment and have deployable barriers
bull A site that can recover over a longer duration of time could be temporarily inundated during an event (such as parks or plazas) The use of resilient materials and strategies can reduce costly damage caused by temporary inundation
Different design interventions should be chosen based on the specific operational requirements of the project however these must meet the ASCE 24 design requirements for Coastal VE Zones
For all projects at risk of current or future flooding select protections that meet the projectrsquos design flood elevation Consider project-specific factors including the site location operational requirements existing continuity planning and cost63 A Design Strategies Checklist in Appendix 6 is available for use as a resource to track possible design approaches Some examples of design alternatives are
bull Site relocation where feasible conduct alternative site analysis
bull Permanent barriers at a site (eg floodwalls)
bull Deployable flood barriers (eg stop logs flood doorsgates inflatable barriers)
bull Natural systems-based approaches (eg living shorelines restored wetlands)64
bull Prioritized protection of electrical mechanical and other critical or costly-to-replace equipment above the design flood elevation (eg motors and controller boilers and furnaces fuel storage tanks duct work alarm systems and suppression equipment electrical panels electrical distribution and switching areas gas and electric meters telecommunications equipment chemical feed equipment HVAC units and emergency generators)65
bull Dry floodproofing design a facility to prevent water from entering
bull Wet floodproofing design a facility to permit floodwaters to flow in and out of the structure without causing significant damage (eg elevate or protect critical equipment use water-resistant building materials below the design flood elevation include flood vents and pumps)
bull Design redundant telecommunications conduit entrances for multiple carrier entry Telecom conduit should run to diverse manholes when possible
bull Install backup power for telecom equipment with design consideration for such equipment (eg installation above DFE)
bull Install outdoor-rated disconnect switch for telecommunications equipment on the roofbull Explore interventions to protect underground utilities and other telecommunications
facilities from water damagebull Install backflow preventers backwater valves and sump pumps for all buildings and
infrastructure in the floodplain as well as behind flood barriersbull Shoreline improvements that reduce the height of waves or attenuate waves where
feasible
NYC Mayorrsquos Office of Recovery and Resiliency Climate Resiliency Design Guidelines
28IIIA GENERAL METHODOLOGY TO ESTIMATE PROJECT BENEFITSIIIB CATEGORIES OF PROJECT BENEFITS
Designing and constructing facilities to handle the future climate loads above the current NYC codes and standards based on projected useful life of the components provides resiliency benefits The incremental costs to implement the Guidelinesrsquo recommended design interventions should be compared with the incremental benefits to aid agencies in making decisions about resilient design strategies The project design team should evaluate benefits of the interventions designed to meet Guidelinesrsquo recommended criteria for all the climate stressors qualitatively andor quantitatively For projects with construction costs below $50 million the project design team is recommended to perform a qualitative benefits assessment on the interventions that meet the Guidelinesrsquo recommendations for all applicable climate stressors For critical facilities or projects with construction costs over $50 million the project design team is recommended to perform quantitative benefit calculations to identify the optimal interventions that meet Guidelinesrsquo recommended design criteria
A GENERAL METHODOLOGY TO ESTIMATE PROJECT BENEFITSThis general methodology to perform qualitative and quantitative benefit calculations is recommended for use by project design teams at the beginning of and during the design process This methodology enables estimation of project benefits for a high-level benefit-cost analysis (BCA) that can be applied to evaluate and compare resiliency features designed to address sea level rise with coastal storm surge increased precipitation and extreme heat events The type of benefits provided by interventions designed to meet the Guidelinesrsquo design criteria can vary by climate stressors and typology of the facilities The main guiding principle in development of the high-level BCA methodologies included in these Guidelines was to balance simplicity with accuracy The project benefits categories identified within the methodology may not cover all the potential benefits provided by every facility type within NYC In particular the benefits of planning for increased precipitation are difficult to quantify Hence the project design team should use their discretion to modify this general benefit calculation methodology as needed to meet their project goals and objectives The project design team should develop appropriate input data whether quantitative or qualitative needed to estimate project benefits
B CATEGORIES OF PROJECT BENEFITSThere are three types of project benefit categories - direct benefits indirect benefits and other benefits - that can be used to perform qualitative assessments and develop quantitative estimates of monetary benefits for intervention alternatives designed to meet the Guidelinesrsquo recommendations These project benefit categories will help to perform a high-level benefit-cost analysis that balances accuracy with an appropriate level of effort
bull Direct Benefits include reduced or avoided physical damages to facilities and contents reduced or avoided displacements for residential structures and reduced life cycle or OampM costs that can be quantified as a primary result of implementing a specific hazard mitigation measure Table 12 in Appendix 4 provides a list of direct benefits and basic guidance on estimating and documenting values for sea level rise and increased precipitation-related flood hazards Note that given the current state of practice it is not possible to quantify reduced or avoided physical damages or residential displacements that result from a specific extreme heat mitigation measures Therefore direct benefits applicable to extreme heat hazards are limited to reduced life cycle costs applicable to certain measures such as green roofs Refer to Table 15 for details on direct benefits for extreme heat hazards
III EVALUATION OF PROJECT BENEFITS
NYC Mayorrsquos Office of Recovery and Resiliency Climate Resiliency Design Guidelines
29IIIB CATEGORIES OF PROJECT BENEFITS
bull Indirect Benefits include reduced or avoided service losses for non-residential
buildings public facilities andor infrastructure (utilities roads and bridges) based on the value of service continuity andor emergency services to New Yorkers that can be quantified as a secondary result of implementing a specific hazard mitigation measure Table 13 in Appendix 4 provides a list of indirect benefits and basic guidance on estimating and documenting values for sea level rise and increased precipitation-related flood hazards Note that given the current state of practice on extreme heat it is not possible to quantify reduced or avoided service losses that result from a specific extreme heat mitigation measures Therefore indirect benefits applicable to extreme heat hazards are limited to reduced energy costs such as cool roofs green roofs or shade trees Refer to Table 15 in Appendix 4 for details on indirect benefits for extreme heat hazards
bull Other Benefits where applicable other potential benefits may include social benefits for residents such as avoided stress and anxiety avoided lost productivity environmentalecosystem service benefits avoided need for emergency services and other potential benefits that can be estimated as a result of implementing a specific hazard mitigation measure Table 14 in Appendix 4 provides a list of other potential benefits and basic guidance on estimating and documenting values for sea level rise and increased precipitation-related flood hazards
Note on the ecosystem service benefit category in Table 14 the stormwater management benefits of green infrastructure should be distributed between the extreme heat and increased precipitation hazards since these measures provide both significant reductions in rainfall runoff as well as Urban Heat Island mitigation through evapotranspiration However there is currently limited data available to quantify the actual distribution of stormwater management benefits between the two hazards For various dual-benefit providing interventions careful considerations should be given to identify the appropriate benefits category provided by the intervention with a goal to avoid duplication of quantified benefits In this methodology the stormwater management benefits of green infrastructure are applied to the increased precipitation hazard in order to avoid a duplication of benefits Note on real estate and quality of life benefits additionally it is important to note that two potential benefit categories shown in Table 14 - real estate and quality of lifehealthavoided casualties - were not included in the current BCA methodology for sea level rise or increased precipitation hazards Although these categories could increase project benefits for sea level rise and increased precipitation hazards they were only applied to measures that address extreme heat hazards such as green roofs trees and other plantings Refer to Table 15 for a detailed summary of other benefit categories quantified as unit benefits for extreme heat hazards
NYC Mayorrsquos Office of Recovery and Resiliency Climate Resiliency Design Guidelines
30IIIC WHICH METHODOLOGY TO USEIIID BCA METHODOLOGY FOR PROJECTS UNDER $50 MILLION
D BCA methodology for projects under $50 millionThe project design team should develop design alternatives to meet the Guidelinesrsquo criteria which may be in excess of NYC code and standards requirements (baseline conditions) It is assumed that the project design team will develop alternatives to address each of the following applicable climate stressors - sea level risecoastal storm surge increased precipitation and extreme heat - separately Tables 12-15 in Appendix 4 provides a list of typical direct indirect and other benefits provided by various intervention typologies to reduce impacts from climate stressors During the qualitative assessment the project design team should consider that intervention strategies will have varying levels of reliability effectiveness benefits and cost implications during the qualitative assessment
The project design team is recommended to develop appropriate evaluation criteria and metrics for each of the applicable project benefit categories For each alternative the project design team could use either a scoring weighting ranking or other type of qualitative assessment framework to assess each applicable project benefit categories with the developed evaluation criteria and metrics Table 6 provides an example template to evaluate alternatives using a set of general evaluation criteria and metrics using a color-coded rating system (and see Table 7 for an example of how to complete the template) The project design team can utilize a similar template customized to their project goals and objectives This assessment allows agencies to screen the qualitative benefits for various alternatives that would then lead to development of final project components to match the available budget and goals of the project
Projects with total costs below $50 million recommended to conduct a qualitative assessment to identify the optimal interventions that meet Guidelinesrsquo design criteria using the ldquoD) BCA methodology for projects under $50 millionrdquo methodology below
C WHICH METHODOLOGY TO USEProjects with a total cost above $50 million or are highly complex or critical facilities recommended to conduct both a qualitative and quantitative benefit calculation to identify the optimal interventions that meet Guidelinersquos design criteria using the ldquoE) BCA methodology for projects above $50 millionrdquo below A quantitative BCA also must include qualitative factors
NYC Mayorrsquos Office of Recovery and Resiliency Climate Resiliency Design Guidelines
31IIID BCA METHODOLOGY FOR PROJECTS UNDER $50 MILLION
Qualitative Color Scale Green=Least resource intensive alternative Purple=most resource intensive yellow=medium level of resource intensity
Qualitative Evaluation Factors Description Relative Color Rating System
First CostsAdditional construction costs needed to incorporate Guidelinesrsquo recommended resilient design over the baseline project costs
Highest cost ($$$) rated as Purple whereas lowest cost ($) rated as Green
ConstructabilityEase of Implementation
Construction techniques and site conditions such as presence of major utilities conflicts and other conditions which dictate the level of constructability required for each alternative
Difficult to construct rated as Purple whereas easiest to construct rated as Green
Environmental ImpactsCo-BenefitsPermitting
Impacts to the built and natural environment such as circulation noise and hazardous waste plus the level of effort required for permitting (eg interventions in water require highest level of permitting requirement) from each alternative in addition to the baseline project condition
Highest environmental impacts and highest level of effort required for permitting rated as Purple whereas the least impact and level of effort rated as Green
Operation and Maintenance (OampM)
Level of effort of additional manpower and cost of OampM for the alternatives over the baseline project OampM requirements
Highest level of effort and cost for OampM rated as Purple whereas the lowest is rated as Green
Reliability and Durability
Interventions that do not require human involvement or a facilityrsquos ability to withstand all the forces during a storm event (eg permanent solutions with higher reliability than deployable solution)
Interventions requiring human involvement (active measures) rated as Purple whereas interventions with minimal or no human involvement (passive measures) rated as Green
Risk Reduction Benefits Monetary benefits provided by each intervention alternative in avoided damages over the baseline condition
Lowest potential monetary benefit rated as Purple whereas as highest potential monetary benefit rated as Green
Quality of Life BenefitsVisual Aesthetics
Benefits either to the community such as recreation or safety or serve the community during emergency situations
Lowest potential quality of life benefits rated as Purple whereas as highest potential benefits rated as Green
Table 6 ndash Evaluation matrix for comparison of mitigation alternatives across the useful life of a project
Project title_______________________________________________________________________________
Evaluation Criteria
Baseline Condition (Designed to NYC Building Code and
Standards)
Resilient Design Alternatives for Managing__________________
Alternative 1
Alternative 2
Alternative 3
First Costs
ConstructabilityEase of ImplementationEnvironmental ImpactsCo-BenefitsPermitting
Operation and Maintenance (OampM)
Reliability and Durability
Risk Reduction Benefits
Quality of Life BenefitsVisual Aesthetics
NYC Mayorrsquos Office of Recovery and Resiliency Climate Resiliency Design Guidelines
32IIID BCA METHODOLOGY FOR PROJECTS UNDER $50 MILLION
Table 7 ndash Evaluation matrix for comparison of mitigation alternatives across the useful life of a project - COMPLETED EXAMPLE
Evaluation Criteria
Baseline Condition (Designed to NYC Building Code and
Standards)
Resilient Design Alternatives for Managing Coastal SurgeSLR
Alternative 1Flood proof building built on grade to Guidelines
DFE
Alternative 2 Elevate building structure above Guidelinesrsquo DFE
on columns
Alternative 3 Raise site grade by filing the building site footprint
to Guidelinesrsquo DFE
First CostsBaseline cost for building structure is $15 million
Incremental costs are within 5 over the baseline costs
Incremental costs are between 5-10 over baseline costs
Incremental costs are 20 and more over baseline costs
ConstructabilityEase of Implementation
Relatively easy to construct within site constraints
Similar to baseline conditions since construction requires additional flood proofing only
Moderate challenges to construct foundation structure for columns within site constraints
Extremely challenging to construct within the site constraints Potentially fatal flaw
Environmental ImpactsCo-BenefitsPermitting
No major impacts but may require additional effort to obtain DOB permits with flood proofing and deployable systems
No major impacts but may require additional effort to obtain DOB permits with flood proofing and deployable systems
No major impacts and relatively easy to permit
Potential drainage circulation impacts and challenges to obtain clean fill material for the site
Operation and Maintenance (OampM)
Major OampM costs associated with deployable systems
Major OampM costs associated with deployable systems
Moderate OampM costs associated with proposed elevator for access
Minimal OampM costs since deployable and elevators not required
Reliability and Durability
Least reliability with highest potential risk from flooding during to failure of deployable systems
Least reliability with highest potential risk from flooding during to failure of deployable systems
Moderate reliability with potential risk from flooding limited to elevator shaft only
Highest reliability since deployable are not required to protect building from flooding
Risk Reduction Benefits
Maximum flood risk reduction benefits assuming deployable and flood proofing is effective
Maximum flood risk reduction benefits assuming deployable and flood proofing is effective
Maximum flood risk reduction benefits
Maximum flood risk reduction benefits
Quality of Life BenefitsVisual Aesthetics
Facility may not be operational during the storm event
Facility may not be operational during the storm event
Facility can be potentially operational during the storm event
Facility can be potentially operational during the storm event
Qualitative Color Scale Green=Least resource intensive alternative Purple=most resource intensive yellow=medium level of resource intensity
A new non-critical facility with a building structure is proposed on a site that is currently in the 2015 Preliminary FEMA 1 annual chance floodplain with a BFE of 10rsquo (NAVD 88) The baseline conditions DFE to meet existing NYC codes and standards is 11rsquo (NAVD 88) Using the Guidelines recommended design criteria the facilityrsquos DFE is 133rsquo (NAVD 88) and existing grade is around 6rsquo (NAVD 88) The project design team develops three alternatives to meet the Guidelinesrsquo recommended DFE design for the facility Table 7 offers an example of how a qualitative assessment can be used to compare three resilient design alternatives using the evaluation criteria and metrics
CASE STUDY Example of How to Use the Evaluation Matrix
NYC Mayorrsquos Office of Recovery and Resiliency Climate Resiliency Design Guidelines
33IIIE BCA METHODOLOGY FOR PROJECTS OVER $50 MILLION
E BCA methodology for projects over $50 millionIn order for a project to be considered cost-effective a benefit-cost analysis (BCA) assesses if the benefits of a project outweigh its costs or in other words the benefit-cost ratio (BCR) is greater than 10 as illustrated in Equation 1
Equation 1 Benefit-Cost Ratio Formula
BCR =
Where BCR = Benefit-Cost Ratio
BENEFITS = Total project benefits
COSTS = Total project costs
BENEFITSCOSTS
These estimated project benefits are combined with the project costs which are defined as the differential construction and long-term operation and maintenance costs associated with constructing a proposed project to the Guidelinesrsquo recommended design level It is assumed that the baseline project will be designed to the most prevalent NYC codes and standards This benefit methodology should be used to determine the additional project benefit that the Guidelinesrsquo recommended design would provide over the baseline project benefit It is assumed that the project design team will develop alternatives to address each of the following applicable climate stressors - sea level risecoastal storm surge increased precipitation and extreme heat - separately For each alternative the project design team should use the following steps to determine the Benefit-Cost Ratio (BCR)
a) Determine project useful life for design interventions Determining the useful life of the proposed project is an important first step in the
detailed BCA assessment methodologies for two reasons First the project useful life determines what values must be used from the Guidelines to establish the future climate design conditions The various hazard tables in the Guidelines establish design requirements based on useful life ranges through 2039 2040-2069 2070-2099 and 2100+ (2100+ projections are only available for sea level rise) A review of these tables show that the design requirements needed to meet the projected climate hazards increase as the end of useful life range increases Second the useful life determines how long the project will need to be operated and maintained in order to remain technically sound and effective at reducing future damages and losses
b) Determine discount rate for project benefits calculation The cost-effectiveness of projects assessed using the BCR must be done on a net
present value basis meaning the present value of the benefits is compared to the present value of the costs Most project costs are computed for present value based on current cost estimates bids or cost guidance However project benefits - as well as project costs for operation and maintenance - accrue over time into the future and are computed on an annualized basis To address this issue the Present Value Coefficient (PVC) is used to bring these annualized project benefits and OampM costs into the present value As indicated by the formula in Equation 2 the PVC is a function of the Project Useful Life (PUL) and the Discount Rate (DR)
NYC Mayorrsquos Office of Recovery and Resiliency Climate Resiliency Design Guidelines
34
Equation 2 Present Value Coefficient (PVC) Formula
PVC =
Where PVC = Present Value Coefficient
PUL = BCA Project Useful Life based on project type
DR = Discount Rate
The project design team should coordinate with agencies and NYC OMB if needed to determine appropriate discount rates based on funding source project type and other factors This coordination should take place during project initiation phase where total project costs (design and construction) are over $50 million66
c) Develop input data to perform benefit calculations Tables 16 and 17 in Appendix 4 provide a list of typical input data by each climate
stressor needed to perform benefit analysis quantitatively on variety of facilities67 The project design team should use these tables as a reference to identify appropriate input data categories andor additional input data needed to perform benefit analysis on the project
d) Identify applicable project benefit categories to estimate benefits Tables 16 and 17 in Appendix 4 provide a list of typical project benefits by each climate
stressor needed to perform benefit analysis quantitatively on various types of projects The project design team should use these tables as a reference to identify appropriate project benefit categories for each climate stressor to perform benefit analysis on the project
e) Calculate benefits of recommended design interventions for each climate
stressor The input data and applicable project benefits can be assembled along with
incremental project cost data to analyze cost-effectiveness using the FEMA BCA Tool Damage-Frequency Assessment (DFA) module or similar software This analysis will provide a BCR for each alternative which can then be used to compare the alternatives that were developed to mitigate effects from applicable climate stressors The project design team can then use the results from this analysis to identify optimal interventions that provides a balanced solution that provides resiliency benefits within the available project budget
IIIE BCA METHODOLOGY FOR PROJECTS OVER $50 MILLION
[1 ndash (1 + DR) -(PUL)]DR
66 For example a NYC OMB March 2015 memorandum recommends using an annually updated DR as published each year in Appendix C of OMB Circular A-94 The current OMB-recommended discount rates from OMB A-94 Appendix C vary by project useful life and are as follows 21 DR for useful lives of 10 to 19 years 25 DR for useful lives of 20 to 29 years and 28 DR for useful lives of 30 years or greater By contrast FEMA hazard mitigation grants use a DR of 70 for all projects based on the Federal OMB A-94 rate for federally-funded mitigation measures Since these DRs will impact the PVC and the project benefits the project team must ensure that BCA results prepared using an OMB-recommended DR (21 to 28) be updated to reflect the Federal DR (70) when applying for FEMA mitigation grant funds
67 Note the data requirements for the sea level rise and increased precipitation hazards in Table 16 are more detailed than the requirements for the extreme heat hazards due to the less detailed level of analysis available for extreme heat
NYC Mayorrsquos Office of Recovery and Resiliency Climate Resiliency Design Guidelines
35
APPENDICES
NYC Mayorrsquos Office of Recovery and Resiliency Climate Resiliency Design Guidelines
36APPENDIX 1 ndash KEY TERMS
100-year flood (1 annual chance flood)
A flood that has a 1 probability of occurring in any given year The 100-year floodplain is the extent of the area of a flood that has a 1 chance of occurring or being exceeded in any given year
500-year flood (02 annual chance flood)
A flood that has a 02 probability of occurring in any given year The 500-year floodplain is the extent of the area of a flood that has a 02 chance of occurring or being exceeded in any given year
AdaptationAdjustment in natural or human systems to a new or changing environment that seeks to maximize beneficial opportunities or moderate negative effects Successful adaptations contribute to resiliency
Base flood elevation (BFE)The elevation of surface water resulting from a flood that has a 1 annual chance of occurring or being exceeded in any given year The BFE is shown on the Flood Insurance Rate Map (FIRM)69
BluebeltReference to the Department of Environmental Protectionrsquos (DEP) Bluebelt program to preserve natural drainage corridors including streams ponds and other wetland areas Preservation of these wetland systems allows them to perform their functions of conveying storing and filtering storm water
Climate
The average weather (or more rigorously a statistical description of the average in terms of the mean and variability) over a period of time usually 30 years These quantities are most often surface variables such as temperature precipitation and wind Climate in a wider sense is the state including a statistical description of the climate system70
Climate change
Changes in average weather conditions that persist over multiple decades or longer Climate change encompasses both increases and decreases in temperature as well as shifts in precipitation changing risk of certain types of severe weather events and changes to other variables of the climate system
Climate change riskThe chance that investments (such as in capital projects) can be affected by the physical impacts of climate change71 Risks are evaluated as a product of the probability of occurrence and the magnitude of damages or impacts including socioeconomic factors that would result if they did occur (consequences)
Climate change risk assessment
This assessment involves a detailed project-specific analysis that includes a vulnerability and risk assessment often followed by cost-benefit analysis to assess and select investments in climate change risk mitigation Risk is assessed as a function of the magnitude and probability of a given climate change hazard Examples resources are included in Appendix 7
Climate vulnerabilityThe degree to which systems and populations are affected by adverse impacts It is a function of the character magnitude and rate of climate change and variation to which a system is exposed its sensitivity and its adaptive capacity72
Cloudburst An extreme amount of rain in a short period of time often over a small geographic area73
Cooling Degree Day (CDD) A form of degree-day used to estimate the energy requirements for air conditioning or refrigeration when the daily mean temperature is above 65degF
68 All terms are from the US Global Change Research Program (USGCRP) glossary unless otherwise noted The USGCRP glossary is available at httpwwwglobalchangegovclimate-changeglossary
69 ldquoDefinitionsrdquo FEMA last modified March 1 2017 httpswwwfemagovnational-flood-insurance-programdefinitions70 UKCIP Glossary httpwwwukciporgukglossary71 ldquoAccount for Climate Riskrdquo International Finance Corporation 72 UKCIP Glossary httpwwwukciporgukglossary73 New York City Environmental Protection ldquoCloudburst Resiliency Planning Studyrdquo 2017 Available at httpwwwnycgovhtmldeppdfclimatenyc-cloudburst-studypdf
APPENDIX 1 - KEY TERMS68
NYC Mayorrsquos Office of Recovery and Resiliency Climate Resiliency Design Guidelines
37APPENDIX 1 ndash KEY TERMS
Design life The life expectancy of an asset or product as determined during design74 As opposed to useful life (see below)
Dry Bulb temperature The ambient air temperature measured by a thermometer
Extreme eventUnexpected unusual or unpredictable weather or flooding compared to historical or future projected distribution Extreme events include for example heat waves cold waves heavy rains periods of drought and flooding and severe storms
Facilities For the purposes of this document ldquofacilitiesrdquo refers to all types of buildings housing infrastructure structures and landscape features designed by or for the City of New York
Flexible adaptation pathwayResilience-building strategies that can evolve or be adapted over time as climate change risk assessments evaluations of adaptation strategies and monitoring continue75
Flood Insurance Rate Maps (FIRM)
Official flood map of a community on which FEMA has delineated the 1 annual chance floodplain and the base flood elevations (BFEs) applicable to the community76 The FIRM also includes the 02 floodplain annual chance floodplain and differentiates between special flood hazard areas (V A Coast A zones) and floodways The official FIRM is from the year 2007 while the 2015 PFIRM is currently required by NYC Building Code to calculate design flood elevations NYC DOB references the more restrictive of the two maps in both base flood elevation and flood hazard area (ie V versus A zone) Refer to Appendix 3 for more information
FreeboardAn additional amount of height above the base flood elevation used as a factor of safety (eg two feet above the base flood) in determining the level at which a facilitys lowest floor must be elevated or floodproofed to be in accordance with state or community floodplain management regulations77
Future time slices
Future periods defined by the NPCC for when climate change projections are available In this document the following decadal projections are associated with specific time spans2020s projection = present to 20392050s projection = 2040 to 20592080s projection = 2070 to 20992100s projection = end of century and beyond
Green infrastructureAn array of practices that use or mimic natural systems to manage urban stormwater runoff Water is either directed to engineered systems for infiltration or detained for longer periods before it enters the sewer system
Heat Vulnerability Index (HVI)Summarizes relative risk of adverse health effects from heat due to social and environmental factors Used to identify neighborhoods at higher risk during and after extreme heat events
Heat wave A period of three consecutive days where temperatures rise above 90degF or two consecutive days over 95 degrees78
New York City Panel on Climate Change (NPCC)
The body of leading climate and social scientists charged with making climate change projections for the metropolitan region79
74 Sustainable Infrastructure Management Program Learning Environment httpsimplewerforg 75 Rosenzweig C et al Climate Change Adaptation in New York City Building a Risk Management Response76 ldquoDefinitionsrdquo FEMA77 Ibid78 Horton R et al New York City Panel on Climate Change 2015 Report Chapter 1 Climate Observations and Projections Ann NY
Acad Sci ISSN 0077-8923 (New York 2015) 2579 For more information on the NPCC visit www1nycgovsiteorrchallengesnyc-panel-on-climate-changepage
NYC Mayorrsquos Office of Recovery and Resiliency Climate Resiliency Design Guidelines
38APPENDIX 1 ndash KEY TERMS
Open-grid pavement system
Pavements that consist of loose substrates supported by a grid of a more structurally sound grid or webbing Unbounded loose substrates in these systems transfer and store less heat than bound and compacted pavements and aid permeability Pavement is 50 pervious and contains vegetation in the open cells designed to allow percolation or infiltration of storm water through the surface into the soil below80
Preliminary Flood Insurance Rate Map (PFIRM)
Preliminary flood map developed by FEMA in 2015 for New York City that provides projected risks for flood hazards81 Refer to Appendix 3 for more information
Project useful life (PUL)
The period over which an asset or component is expected to be available for use by an entity This depends on regular and adequate maintenance This period of time typically exceeds the design life (see above) The combined effect of operational requirements and useful life is practical in assessing an investment in improving resilience82
Rain gardenAlso called ldquobioswalerdquo Planted areas designed to collect and manage stormwater that runs off streets sidewalks commercial and residential rooftops and other sources when it rains
Resiliency The ability to bounce back after change or adversity The capability of preparing for responding to and recovering from difficult conditions83
Sea level rise-adjusted design flood elevation
As defined in these Guidelines the increased height of the base flood elevation due to sea level rise plus freeboard depending on the criticality of the facility The sea level rise adjustment depends on the useful life of the facility
Storm surge An abnormal rise of water generated by a storm over and above predicted astronomical tides84
Substantial improvementAny repair reconstruction rehabilitation addition or improvement of a building or structure the cost which equals or exceeds 50 of the market value of the structure before the improvement or repairs started For more information see Appendix G of the NYC Building Code and 1 RCNY sect3606-0185
Tidal inundation Flooding which occurs at high tides due to climate-related sea level rise land subsidence andor the loss of natural barriers86
Urban Heat Island (UHI) effectThe tendency for higher air temperatures to persist in urban areas as a result of heat absorbed and emitted by buildings and asphalt tending to make cities warmer than the surrounding suburban and rural areas
Weather The state of the atmosphere at a given time with regard to temperature cloudiness precipitation wind and other meteorological conditions87
Wet Bulb temperatureThe temperature indicated when a thermometer bulb is covered with a water-saturated wick over which air is caused to flow at approximately 45 ms (900 ftmin) to reach the equilibrium temperature of water evaporating into the air when the heat of vaporization is supplied by the sensible heat of the air88
80 ldquoGlossaryrdquo US Green Building Council (2017) Available at httpwwwusgbcorgglossaryterm552581 ldquoPreliminary FEMA Map Productsrdquo FEMA Map Service Center Available at httpshazardsfemagovfemaportalprelimdownload82 ldquoGlossaryrdquo International Infrastructure Management Manual (2011) 83 A Stronger More Resilient New York (2013) 184 ldquoStorm Surge Overviewrdquo National Hurricane Center NOAA Available at httpswwwnhcnoaagovsurge85 ldquoFlood Resistant Constructionrdquo Appendix G New York City Building Code (2008) and 1 RCNY sect3606-01 available at httpswww1nycgovassetsbuildingsrules1_RCNY_3606-01pdf86 ldquoOcean Factsrdquo National Ocean Service NOAA Available at httpoceanservicenoaagovfactsnuisance-floodinghtml 87 UKCIP Glossary httpwwwukciporgukglossary88 ldquoASHRAE Terminologyrdquo ASHRAE Available at httpswwwashraeorgtechnical-resourcesauthoring-toolsterminology
NYC Mayorrsquos Office of Recovery and Resiliency Climate Resiliency Design Guidelines
39APPENDIX 2 - CLIMATE CHANGE PROJECTIONS
Climate change projections are provided by the New York City Panel on Climate Change (NPCC) The full NPCC report is available from the New York Academy of Sciences89 Tables 8-10 (below) were reproduced directly from the NPCC report while Table 2 (see Section IIA) was developed using the data underlying the NPCC report to inform the design of HVAC systems under warmer conditions
Table 8 ndash NYC sea level rise projections90
Baseline (2000-2004) 0 in
Low estimate (10th percentile)
Middle range (25th to 75th percentile)
High estimate (90th percentile)
2020s 2 in 4-8 in 10 in
2050s 8 in 11-21 in 30 in
2080s 13 in 18-39 in 58 in
2100 15 in 22-50 in 75 in
Note Projections are based on six-component approach that incorporates both local and global factors The model-based components are from 24 global climate models and two representative concentration pathways Projections are relative to the 2000-2004 base period
Table 9 ndash Mean annual changes91
a Temperature Baseline(1971-2000) 54degF
Low estimate (10th percentile)
Middle range (25th to 75th percentile)
High estimate (90th percentile)
2020s + 15degF +20-29degF +32degF
2050s +31degF +41-57degF +66degF
2080s +38degF +53-88degF +103degF
2100 +42degF +58-104degF +121F
b Precipitation Baseline(1971-2000) 501 in
Low estimate (10th percentile)
Middle range (25th to 75th percentile)
High estimate (90th percentile)
2020s -1 percent +1-8 +10
2050s +1 percent +4-11 +13
2080s +2 percent +5-13 +19
2100 -6 percent -1 to +19 +25
Note Based on 35 global climate models (GCMs) and two RCPs Baseline data cover the 1971ndash2000 base period and are from the NOAA National Climatic Data Center (NCDC) Shown are the low estimate (10th percentile) middle range (25th percentile to 75th percentile) and high estimate (90th percentile) These estimates are based on a ranking (from most to least) of the 70 (35 GCMs times 2 RCPs) projections The 90th percentile is defined as the value that 90 percent of the outcomes (or 63 of the 70 values) are the same or lower than Like all projections the NPCC climate change projections have uncertainty embedded within them Sources of uncertainty include data and modeling constraints the random nature of some parts of the climate system and limited understanding of some physical processes The NPCC characterizes levels of uncertainty using state-of-the-art climate models multiple scenarios of future greenhouse gas concentrations and recent peer-reviewed literature Even so the projections are not true probabilities and the potential for error should be acknowledged
89 The NPCC 2015 report is available at httponlinelibrarywileycomdoi101111nyas20151336issue-1issuetoc90 From New York City Panel on Climate Change 2015 Report Chapter 1 Climate Observations and Projections page 4191 From New York City Panel on Climate Change 2015 Report Chapter 1 Climate Observations and Projections page 30
APPENDIX 2 - CLIMATE CHANGE PROJECTIONS
NYC Mayorrsquos Office of Recovery and Resiliency Climate Resiliency Design Guidelines
40APPENDIX 2 - CLIMATE CHANGE PROJECTIONS
Table 10 ndash Extreme events92
2020s Baseline (1971-2000)
Low estimate(10th percentile)
Middle range(25th to 75th percentile)
High estimate (90th percentile)
Numbers of heat waves per year 2 3 3-4 4
Average heat wave duration (days) 4 5 5 5
Number of days per year with
Maximum temperature at or above 90degF 18 24 26-31 33
Maximum temperature at or above 100degF 04 07 1-2 2
Minimum temperature at or below 32degF 71 50 52-58 60
Rainfall at or above 1 inch 13 13 14-15 16
Rainfall at or above 2 inches 3 3 3-4 5
Rainfall at or above 4 inches 03 02 03ndash04 05
2050s Baseline (1971-2000)
Low estimate(10th percentile)
Middle range(25th to 75th percentile)
High estimate (90th percentile)
Numbers of heat waves per year 2 4 5-7 7
Average heat wave duration (days) 4 5 5-6 6
Number of days per year with
Maximum temperature at or above 90degF 18 32 39-52 57
Maximum temperature at or above 100degF 04 2 3-5 7
Minimum temperature at or below 32degF 71 37 42-48 52
Rainfall at or above 1 inch 13 13 14-16 17
Rainfall at or above 2 inches 3 3 4-4 5
Rainfall at or above 4 inches 03 03 03-04 05
2080s Baseline (1971-2000)
Low estimate(10th percentile)
Middle range(25th to 75th percentile)
High estimate (90th percentile)
Numbers of heat waves per year 2 5 6-9 9
Average heat wave duration (days) 4 5 5-7 8
Number of days per year with
Maximum temperature at or above 90degF 18 38 44-76 87
Maximum temperature at or above 100degF 04 2 4-14 20
Minimum temperature at or below 32degF 71 25 30-42 49
Rainfall at or above 1 inch 13 14 15-17 18
Rainfall at or above 2 inches 3 3 4-5 5
Rainfall at or above 4 inches 03 02 03-05 07
Note Projections for temperature and precipitation are based on 35 GCMs and 2 RCPs Baseline data are for the 1971 to 2000 base period and are from the NOAA National Climatic Data Center (NCDC) Shown are the low estimate (10th percentile) middle range (25th to 75th percentile) and high estimate (90th percentile) 30-year mean values from model-based outcomes Decimal places are shown for values less than one although this does not indicate higher precisioncertainty Heat waves are defined as three or more consecutive days with maximum temperatures at or above 90degF Like all projections the NPCC climate change projections have uncertainty embedded within them Sources of uncertainty include data and modeling constraints the random nature of some parts of the climate system and limited understanding of some physical processes The NPCC characterizes levels of uncertainty using state-of-the-art climate models multiple scenarios of future greenhouse gas concentrations and recent peer-reviewed literature Even so the projections are not true probabilities and the potential for error should be acknowledged
92 From New York City Panel on Climate Change 2015 Report Chapter 1 Climate Observations and Projections page 31
NYC Mayorrsquos Office of Recovery and Resiliency Climate Resiliency Design Guidelines
41APPENDIX 3 - DIFFERENTIATION OF FLOOD MAPS
These Guidelines reference several different kinds of flood maps and sources of design flood elevations These maps are described and differentiated below
Table 11 - Differentiation of flood maps used in NYC
Reference Title Data Source Information Provided Referenced By Link
2007 FIRM FEMA
Based on historical data from before 1983 identifies the current base flood (extent and elevation) as the flood that has a 1 chance of occurring in any given year also known as a 100-year flood The NYC Building Code requires that either the 2007 FIRM or 2015 PFIRM elevation be used whichever is higher
2014 NYC Building Code Appendix G
Climate Resiliency Design Guidelines
httpsmscfemagovportal
2015 PFIRM FEMA
Based on historical data identifies the current base flood (extents and elevation) as the flood that has a 1 chance of occurring in any given year also known as a 100-year flood The NYC Building Code requires that either the 2007 FIRM or 2015 PFIRM elevation be used whichever is higher The 2015 PFIRM is currently being reassessed by FEMA
2014 NYC Building Code Appendix G
Climate Resiliency Design Guidelines
httpshazardsfemagovfemaportalprelimdownload
httpwwwregion2coastalcomview-flood-maps-dataview-preliminary-flood-map-data
NYC Flood Hazard Mapper
NYC Department of City Planning
Maps current and future flood hazards in NYC including the following data layers 2007 FIRM and 2015 PFIRM high tide with sea level rise and PFIRM with sea level rise through 2100
Climate Resiliency Design Guidelines
Waterfront Revitalization Plan
httpwww1nycgovsiteplanningdata-mapsflood-hazard-mapperpage
ldquoTable 4 ndash Determine the sea level rise-adjusted design flood elevation for critical and non-critical facilitiesrdquo
ORR amp NPCC
Provides data to use when adding sea level rise to a given 2015 PFIRM or 2007 FIRM Base Flood Elevation (BFE) to calculate a Design Flood Elevation (DFE) Based on the criticality and expected useful life of a facility
Climate Resiliency Design Guidelines
See Section II on ldquoSea Level Riserdquo above
APPENDIX 3 - DIFFERENTIATION OF FLOOD MAPS
NYC Mayorrsquos Office of Recovery and Resiliency Climate Resiliency Design Guidelines
42APPENDIX 4 - PROJECT BENEFITS CATEGORIES
This appendix provides guidance on how to identify and assess benefits as a supplement to Sections IIID and IIIE
Table 12 lists typical direct benefits for reducing impacts from climate stressors and basic guidance for how to estimate them See Section IIID for more information
Table 13 lists typical indirect benefits for reducing impacts from climate stressors and basic guidance for how to estimate them See Section IIID for more information
Table 12 ndash Direct benefits for (1) sea level rise with coastal storm surge and (2) increased precipitation measures
Direct Benefit Basic Guidance for Estimating Values
Physical Damages (Structure Contents)
bull For flood-damaged buildings use depth damage functions developed by FEMA and USACE for structures and contents
bull Use depth damage functions in conjunction with Building Replacement Values (BRVs) and not market values BRVs typically range between $100 to $325SF for residential buildings and $120 to $450SF for commercial public buildings
bull For more complex structures or facilities use engineering estimates of flood damages or review historic flood damages documented from insurance claims repair records or FEMA Public Assistance claims from recent flood disasters
Residential Displacements
bull For flood-damaged buildings use depth damage functions developed by FEMA and USACE for residential displacements
Reduced Life CycleOperation and Maintenance (OampM) Costs93
bull Applicable only to projects that reduce overall life cycle costs or net annual OampM costs from baseline conditions
bull Input reduced annual OampM costs as a project benefit at a 1-year recurrence intervalbull Reduced overall life cycle costs can be input as a longer project useful life
Table 13 ndash Indirect benefits for (1) sea level rise with coastal storm surge and (2) increased precipitation measures
Indirect Benefit Basic Guidance for Estimating Values
Non-Residential Building Service Losses
bull Estimate service loss values and durations for non-residential buildings public buildings critical facilities and parksnatural features based on FEMA BCA guidance and standard values based on building use
Utility Service Losses94
bull Estimate utility service losses for water wastewater and electrical facilities based on the number of impacted customers FEMA per capita standard values for utility service ($105personday for potable water $49personday for wastewater $148personday for electrical)95
bull Estimate utility service loss durations based on engineering estimates or review historic flood damages losses documented from utility company records
bull This benefit can also apply to measures that increase energy efficiency
RoadBridge Service Losses
bull Estimate roadbridge service losses based on the average daily traffic (ADT) detour time and additional travel distance and FEMA and GSA standard values for road service ($3344vehiclehour of delay $0545mile)96
bull Estimate roadbridge service loss durations or review historic flood damages losses
Emergency Service Losses
bull Applicable only to projects that reduce or eliminate documented emergency service costs from baseline conditions
bull Examples of avoided emergency services costs include NYPD staffing to monitor barricades for flooded roads or NFDY staffing for water rescues of residents from flooded buildings or streets
APPENDIX 4 - PROJECT BENEFITS CATEGORIES
93 Reduced life cycle costs may be applicable to some measures that provide extreme heat benefits such as green roofs that can last longer than a standard roof if properly maintained
94 Reduced utility service costs may be applicable to some measures that provide extreme heat benefits such as cool roofs green roofs and shade trees
95 FEMA per capita standard values taken from FEMA BCA Toolkit Version 530 (Build Date 12222016) and developed in FEMArsquos Baseline Standard Economic Value Methodology Report (July 28 2016) Consider updating FEMA standard per capita values to reflect current New York City utility rates
96 Consider updating FEMA and GSA standard values to reflect current New York City area labor rates and fuel costs
NYC Mayorrsquos Office of Recovery and Resiliency Climate Resiliency Design Guidelines
43APPENDIX 4 - PROJECT BENEFITS CATEGORIES
Table 14 ndash Other potential benefits for (1) sea level rise with coastal storm surge and (2) increased precipitation measures
Other Benefit Basic Guidance for Estimating Values
Avoided Stress and Anxiety
bull Applicable only for projects that directly benefit occupants of residential structuresbull Use FEMA standard value for avoided mental stress and anxiety treatment costs of $2443person to
estimate benefit for all impacted residents97
Avoided Lost Productivity
bull Applicable only for projects that directly benefit occupants of residential structuresbull Use FEMA standard value for avoided lost worker productivity costs of $8736household to estimate
benefit for all impacted workers (conservatively assuming one worker per household)
Environmental Open Space
bull Applicable only for projects that create or acquire open space areas by acquisitionbull Use FEMA standard value for environmental open space based on the type of land acquired ($8308
Acreyear for Green open space $39545Acreyear for Riparian $6010Acreyear for Wetlands $554Acreyear for Forests $1799Year for Marine and estuary)97
CSO Volume Reduction
bull Applicable only for projects that provide Combined Sewer Overflow (CSO) abatement by reducing the volume of rainfall runoff
bull Use CSO abatement cost of $0015gallonsyear applied to increased precipitation hazard runoff volume for 5-year design storm98
Ecosystem Service99
bull Add stormwater management benefits of green infrastructure projects to increased precipitation hazards where avoided damages and service losses are not quantified
bull Unit benefits applicable to increased precipitation hazard includeo Green roofs $0133SFyear (PUL 40 years)o BioswaleRain GardenMeadow Mix $0020SFyear (PUL 30 years)o Permeable Grass Pavers $0020SFyear (PUL 30 years)o Tree Plantings $303Treeyear (PUL 30 years)o Planter Box Trees $101Treeyear (PUL 15 years)
Real Estate99
bull Potential real estate benefits from increased resilience of residential andor commercial propertiesstreetscapesneighborhoods included within the project scope
bull Benefit applied to extreme heat hazard for green infrastructure projects directly impacting residential or commercial properties
Quality of Life Health Benefits99
bull Potential quality of life benefits related to improved public health from the resilience measures included within the project scope
bull Benefit applied to extreme heat hazard for green infrastructure projects directly impacting residential or commercial properties
Table 14 lists other typical benefits for reducing impacts from climate stressors and basic guidance for how to estimate them See Section IIID for more information
97 FEMA standard values for avoided mental stress and anxiety and environmental open space values taken from FEMA BCA Toolkit Version 530 (Build Date 12222016)
98 CSO abatement cost taken from APG1 Report for NYC ldquoTechnical Approaches for Benefit-Cost Analysis of Hazard Mitigation Projects in Urban and Coastal Environmentsrdquo (April 2016)
99 Ecosystem Services Real Estate and Quality of LifeHealth benefits tend to be more applicable to green infrastructure measures that provide extreme heat benefits such as green roofs trees and other plantings
NYC Mayorrsquos Office of Recovery and Resiliency Climate Resiliency Design Guidelines
44APPENDIX 4 - PROJECT BENEFITS CATEGORIES
Table 15 ndash Potential benefits for extreme heat (Urban Heat Island) reduction measures
Category Benefit Basic Guidance for Estimating Values
Direct Benefit
Reduced Life Cycle Cost
bull Applicable only to measures such as green roofs that are expected to last longer than standard roofs
bull Compute total cost savings including annual OampM costs
Indirect Benefit
Energy Savings
bull Applicable to measures that reduce energy costs by providing cooling through increased shading andor evapotranspiration
bull Use New York Power Authority rates of $0148kWh for electricity and $0810Therm for natural gas
Other Potential Benefits
Air Quality bull Applicable to measures that absorb pollutants andor reduce carbon dioxide emissions
Acoustics bull Applicable to measures such as green roof or walls that reduce noise transfer
Quality of LifeHealth bull Potential quality of life benefits and related to improved public health
Real Estate bull Applicable to measures that provide residential real estate benefits from increased resilience of propertiesstreetscapesneighborhoods
Retail Sales Marketing
bull Applicable to measures that provide commercial property benefits from increased aesthetics resulting in increased marketing and sales for streetscapesneighborhoods
Tax Credits Incentives
bull Applicable to resilience or green infrastructure measures such as green roofs that have accompanying Federal State or City tax credits or other incentives
Table 15 lists potential benefits for reducing impacts from heat and basic guidance for how to estimate them See Section IIID for more information
NYC Mayorrsquos Office of Recovery and Resiliency Climate Resiliency Design Guidelines
45APPENDIX 4 - PROJECT BENEFITS CATEGORIES
Table 16 ndash Guidance on quantitative calculations for (1) sea level rise with coastal storm surge and (2) increased precipitation measures
Data Input General Guidance ndash Basic Description
Applicable Benefit Category
Applicable Typical Facility Typology
Dire
ct B
enefi
ts
Indi
rect
Ben
efits
Oth
er P
oten
tial
Ben
efits
Bui
ldin
g St
ruct
ures
Com
plex
Fa
cilit
ies
Tran
spor
tatio
nSt
reet
scap
es
Plaz
as
Park
Fea
ture
s
First Floor Elevation (FFE)
bull The elevation of the first finished floor of the structure excluding basements
bull FFE measured from top of lowest floor (riverinenon-coastal high hazard areas) or bottom of lowest horizontal structural member (coastal high hazard areas)
Y Y Y Y
Building Replacement Value (BRV)
bull The unit cost to rebuild a structure of the same quality of construction
bull Not the same as market value
Y Y Y Y
Building Size
bull The total floor area of the building in square feet
bull Total Building Value = BRV x Building Sizebull Typical BRVs for NYC range between $100 to
$325SF for residential buildings and $120 to $450SF for commercialpublic buildings
Y Y Y Y
Structure Description
bull The type of building number of stories and foundation type (full basement partial basement no basement)
bull Collect more detailed foundation data for coastal flood zones
Y Y Y Y
Building Use bull Details related to residential housing commercial business and public use
Y Y Y Y Y
Building Type bull The primary use of building ndash residential commercial public and others
Y Y Y Y Y
Depth Damage Function (DDF)
bull Curves used to estimate structure damage contents damage and displacement of residential buildings based on flood depth
bull DDFs selection based on Structure Description Building Type Building Use
bull Structure DDFs based on percentage of Total Building Value
bull Contents DDFs based on percentage of Total Contents Value
bull Displacement DDFs based on number of displacement days x Displacement Cost
Y Y Y Y Y
Contents Value
bull The cost to replace structure contents (furnishings equipment)
bull Residential building Contents Values typically 50 BRV (FEMA DDFs) or 100 BRV (USACE DDFs)
bull Non-residential building Contents Values between 18 to over 100 depending on building use (USACE DDFs)
bull Total Contents Value = BRV x Building Size
Y Y Y Y Y
Table 16 provides general guidance on how to quantitatively calculate benefits from efforts to address from climate stressors See Section IIIE for more information
NYC Mayorrsquos Office of Recovery and Resiliency Climate Resiliency Design Guidelines
46APPENDIX 4 - PROJECT BENEFITS CATEGORIES
Table 16 ndash Guidance on quantitative calculations for (1) sea level rise with coastal storm surge and (2) increased precipitation measures
Data Input General Guidance ndash Basic Description
Applicable Benefit Category
Applicable Typical Facility Typology
Dire
ct B
enefi
ts
Indi
rect
Ben
efits
Oth
er P
oten
tial
Ben
efits
Bui
ldin
g St
ruct
ures
Com
plex
Fa
cilit
ies
Tran
spor
tatio
nSt
reet
scap
es
Plaz
as
Park
Fea
ture
s
Number of Residents (Residential)
bull Total number of occupants in a residential building
bull Typically estimated based on number of residential units x average number of individuals per household (based on current US Census data or use 25 individuals per household as a default)
Y Y Y Y Y
Displacement Cost (Residential)
bull The unit cost to lodge and feed displaced residents while flood damage is repaired
bull Average unit displacement cost of $415residential unitday recommended based on current FY2018 GSA Per Diem rates for New York City
Y Y Y Y Y
Value of Service (Non-Residential and Public)
bull The unit cost of service disruption and rental of temporary facilities while flood damage is repaired
bull Disruption costs for non-residential buildings typically range from $095 to $136SFmonth and rental costs range from $020 to $136SFmonth depending on building use
bull Value of service for public buildings ($day) is typically based on the annual operating budget for the City agency using the building prorated based on building size or population served by the building then divided by 365 daysyear
Y Y Y Y
Value of Service (Critical Facilities)
bull The unit cost of critical facilities (police fire emergency medical services) lost or delayed while flood damage is repaired
Y Y Y
Value of Service Duration
bull The duration of service disruption and rental of temporary facilities for non-residential buildings and critical facilities while flood damage is repaired
bull For non-residential buildingso Value of Service Durations vary from
4 months to over 30 months based on building use and the depth of flooding
o Total Value of Service Loss = (Disruption Cost x Building Area) = (Rental Cost x Building Area x Value of Service Duration)
bull For public buildings and critical facilitieso Value of Service Durations vary from 0
days to 720 months based on building use and the depth of flooding from FEMA FIA or USACE DDFs
o Total Value of Service Loss = (Value of Service) x (Service Loss Duration)
Y Y Y
NYC Mayorrsquos Office of Recovery and Resiliency Climate Resiliency Design Guidelines
47APPENDIX 4 - PROJECT BENEFITS CATEGORIES
Table 16 ndash Guidance on quantitative calculations for (1) sea level rise with coastal storm surge and (2) increased precipitation measures
Data Input General Guidance ndash Basic Description
Applicable Benefit Category
Applicable Typical Facility Typology
Dire
ct B
enefi
ts
Indi
rect
Ben
efits
Oth
er P
oten
tial
Ben
efits
Bui
ldin
g St
ruct
ures
Com
plex
Fa
cilit
ies
Tran
spor
tatio
nSt
reet
scap
es
Plaz
as
Park
Fea
ture
s
Engineering Estimates for Damages
bull Engineered estimate models of physical damages and service losses at the project site based on the Guidelines event recurrence interval(s) and flood depth(s)
Y Y Y Y Y Y
Historic Damages and Service Losses
bull Historic physical damages and service losses at the project site documented from previous flood events
bull Do not use routine maintenancebull The historic damage event recurrence interval
(RIs) andor flood depths must be determined updated for inflation to the present value and adjusted to match the Guidelines event RIsflood depths
Y Y Y Y Y Y
Facility Replacement Value
bull The unit cost to rebuild the facility
Impacted Area bull The geographic area impacted by the facility in the event of failure in acres
Y Y Y Y
Facility Capacity
bull The design capacity of the facilitybull For example - facility capacity expressed in
millions of gallons per day (MGD) for water and wastewater facilities or megawatts (MW) for electrical facilities
Y Y Y Y
Service Population
bull The number of impacted residents served by the facility
bull Typically estimated based on number of impacted residential customers x average number of individuals per household (based on current US Census data or use 25 individuals per household as a default)
bull Facilities serving mostly non-residentialpublic buildings andor critical facilities should focus on service losses rather than service population
Y Y Y
NYC Mayorrsquos Office of Recovery and Resiliency Climate Resiliency Design Guidelines
48APPENDIX 4 - PROJECT BENEFITS CATEGORIES
Table 16 ndash Guidance on quantitative calculations for (1) sea level rise with coastal storm surge and (2) increased precipitation measures
Data Input General Guidance ndash Basic Description
Applicable Benefit Category
Applicable Typical Facility Typology
Dire
ct B
enefi
ts
Indi
rect
Ben
efits
Oth
er P
oten
tial
Ben
efits
Bui
ldin
g St
ruct
ures
Com
plex
Fa
cilit
ies
Tran
spor
tatio
nSt
reet
scap
es
Plaz
as
Park
Fea
ture
s
Value of Service
bull Unit value of service provided by the facilitybull Example of FEMA standard values for complete
loss of utility service $105personday for potable water$49personday for wastewater$148personday for electrical
bull Consider updating FEMA standard per capita values to reflect current The New York City utility rates
Y Y
Roadway Elevations bull Roadway Elevations
Y Y
Roadway Replacement Value
bull Roadway Replacement ValueY Y
Inundation Area Map
bull Inundation Area Map developed by FEMA or through modeling by project design team
Y Y Y
Building Inventory of Inundation Area
bull The number and type of buildings within the streetscape and neighborhood inundated by the Guidelinersquos flood events
Y Y Y
Average Daily Traffic (ADT)
bull The average number of one-way traffic trips per day along the roadway(s) within the streetscapeneighborhood inundated by the Guidelinersquos flood events
Y Y
Additional Travel Time
bull The additional travel time needed to detour around a flooded roadway expressed in minutes
bull In the unlikely event there is no detour available use a 12-hour travel time per one-way trap but provide a detailed area street map as supporting documentation
Y Y
Value of Traffic Delay
bull The value of service associated with lost time in traffic
bull For example - FEMA standard average value of $3344vehiclehour of delay
bull Consider updating FEMA and GSA standard values to reflect current New York City area labor rates and fuel costs
Y Y
NYC Mayorrsquos Office of Recovery and Resiliency Climate Resiliency Design Guidelines
49APPENDIX 4 - PROJECT BENEFITS CATEGORIES
Table 17 ndash Guidance on quantitative unit benefit calculations for extreme heat hazard measures
Measure General Guidance ndash Unit Benefit Information and Data Requirements
Applicable Benefit Category
Applicable Typical Facility Typology
Dire
ct B
enefi
ts
Indi
rect
Ben
efits
Oth
er P
oten
tial
Ben
efits
Bui
ldin
g St
ruct
ures
Com
plex
Fa
cilit
ies
Tran
spor
tatio
nSt
reet
scap
es
Plaz
as
Park
Fea
ture
s
Green Roof
bull Unit benefit range over PUL = $470SF to $373SF of green roof area ($719SF standard value)
bull Assumed PUL = 40 yearsbull Apply standard value unit benefit to green
roof area to estimate measure benefitbull Higher range values more applicable
to residential and commercial building streetscape projects
Y Y Y Y Y Y
Bioswale Rain Garden Meadow Mix
bull Unit benefit range over PUL = $396SF to $211SF of area ($730SF standard value)
bull Assumed PUL = 30 yearsbull Apply standard value unit benefit to bioswale
rain gardenmeadow mix area to estimate total measure benefit
Y Y Y Y Y Y
Cool Roof
bull Unit benefit range over PUL = $117 to $3151SF of material area ($144SF standard value)
bull Assumed PUL = 20 yearsbull Apply standard value unit benefit to cool roof
area to estimate total measure benefitbull Higher range values more applicable to
residential building streetscape projects
Y Y Y Y Y
Light-Colored PaversLight-Colored Materials
bull Unit benefit range over PUL = $0774 to $204SF of material area ($0866SF standard value)
bull Assumed PUL = 30 yearsbull Apply standard value unit benefit to material
area to estimate total measure benefit
Y Y Y Y
Table 17 provides general guidance on how to quantitatively calculate benefits from efforts to address climate stressors See Section IIIE for more information
NYC Mayorrsquos Office of Recovery and Resiliency Climate Resiliency Design Guidelines
50APPENDIX 4 - PROJECT BENEFITS CATEGORIES
Table 17 ndash Guidance on quantitative unit benefit calculations for extreme heat hazard measures
Measure General Guidance ndash Unit Benefit Information and Data Requirements
Applicable Benefit Category
Applicable Typical Facility Typology
Dire
ct B
enefi
ts
Indi
rect
Ben
efits
Oth
er P
oten
tial
Ben
efits
Bui
ldin
g St
ruct
ures
Com
plex
Fa
cilit
ies
Tran
spor
tatio
nSt
reet
scap
es
Plaz
as
Park
Fea
ture
s
Tree Planting
bull Unit benefit range over PUL = $1005 to $77154Tree ($1855Tree standard value)
bull Assumed PUL = 30 yearsbull Apply standard value unit benefit to number of
trees to estimate total measure benefitbull Higher range values more applicable
to residential and commercial building streetscape projects
Y Y Y Y Y Y
Planter Box Tree
bull Unit benefit range over PUL = $212 to 16304Tree ($392Tree standard value)
bull Assumed PUL = 15 yearsbull Apply standard value unit benefit to number of
trees to estimate total measure benefitbull Higher range values more applicable
to residential and commercial building streetscape projects
Y Y Y Y Y
Shade Canopy
bull Unit benefit range over PUL = $0363 to $396SF ($0458SF standard value)
bull Assumed PUL = 15 yearsbull Apply standard value unit benefit to area of
shade canopy estimate total measure benefitbull Higher range values more applicable
to residential and commercial building streetscape projects
Y Y Y Y
Permeable Grass Pavers
bull Unit benefit range over PUL = $0258SF to $0521SF of pavers ($0363SF standard value)
bull Assumed PUL = 30 yearsbull Apply standard value unit benefit to paver
area to estimate total measure benefit
Y Y Y Y Y
For the purposes of the BCA refer to the following facility typologies bull ldquoBuilding Structuresrdquo include critical small building sites such as EMS or FDNY stations and non-critical small building sites such as
libraries or comfort stationsbull ldquoComplex Facilitiesrdquo include critical infrastructure such as wastewater treatment sites pump stations water filtration plants and similar
large or complex facilitiesbull ldquoTransportationStreetscapePlazasrdquo include roadway reconstruction streetscape improvements street raising plazas and other
transportation-related infrastructurebull ldquoPark Featuresrdquo include parks and similar public recreational facility with natural landscape features
NYC Mayorrsquos Office of Recovery and Resiliency Climate Resiliency Design Guidelines
51APPENDIX 5 - EXAMPLE PLANNING DECISION TREE
This decision tree provides a summarized example approach for how to implement these Guidelines Projects with a total cost greater than $50 million are recommended to conduct a full qualitative and quantitative climate change risk assessment and BCA while projects below $50 million are recommended to conduct a qualitative risk assessment and BCA
Define Project
1) Operational goals and criticality level2) Useful life3) Location in the current flood plain future floodplain and or zone
of tidal inundation and the project arearsquos score on the heat vulnerability index
Evaluate Project Risks According to Probability and Magnitude of Consequence
bull Extreme Heat bull Precipitationbull Sea Level Risebull Coastal Surge
High Level Identification and Assessment of Risk Mitigation Alternatives and Co-benefits
(qualitative)
Detailed Identification and Assessment of Risk Mitigation Alternatives and Co-benefits (qualitative and quantitative)
High Level Estimate of Costs and Benefits of Design Alternatives
(qualitative)
Detailed Estimate of Costs and Benefits of Design Alternatives
(qualitative and quantitative)
Decision Point Which climate change risks require mitigation
Decision Point Evaluate risk mitigation benefits and costs to
determine final resilient design alternative or if no action is required
Decision Point Is the total project cost above $50 million
Below $50 million Above $50 million
APPENDIX 5 - EXAMPLE PLANNING DECISION TREE
NYC Mayorrsquos Office of Recovery and Resiliency Climate Resiliency Design Guidelines
52
Project Title
Design Strategies Checklist (not exhaustive)
Extreme Heat Comments Extreme Precipitation Comments Sea Level Rise amp Storm Surge Comments
Select Site in Low Heat Vulnerability Index area Select High Elevation Site Select High Elevation Site
Minimize East-West Building Orientation Green Roof Raise Building Floor Elevation
Passive Solar Cooling and Ventilation Systems
Protect Below Grade Areas from Flooding Waterproof Building Envelope
Cool Roof (SRI appropriate) On-site Stormwater Management (gray) Elevate Critical Building Functions
Green Roof (extensive) Reduce Impervious Areas Elevate Critical Equipment
Vegetative Structures Permeable Pavement Perimeter Floodwall100 Levee (passive or active)
Enhanced HVAC System including space layout optimization and system scalability
Increase Green Spaces and Planted Areas DryWet Floodproofing
More Efficient Building Envelope Other Utility Redundancy Design101
Parking Lot Shading Resilient Materials amp Landscape Treatments
Light Colored Pavements (appropriate SRI) Design for Storm Surge Outflow
Increase Planted Areas Install Backwater Flow Prevention
Permeable Surfaces Design for Scour
Open-grid Pavement Raise Road Elevation
Other Other
This appendix provides a template for identifying possible design strategies to address climate change risks as described throughout the Guidelines
APPENDIX 6 - DESIGN STRATEGIES CHECKLIST
100 Permanent perimeter flood walls are not permitted to meet floodproofing requirements in buildings with substantial improvements andor damages 101 Utility redundancy design should be pursued for critical systems not all building systems
APPENDIX 6 - DESIGN STRATEGIES CHECKLIST
NYC Mayorrsquos Office of Recovery and Resiliency Climate Resiliency Design Guidelines
53APPENDIX 7 - CLIMATE CHANGE RISK ASSESSMENT RESOURCES
These Guidelines provide data on climate change hazards and recommend how that data can inform resilient design A risk assessment is a tool to help project managers and designers evaluate risk levels as well as select and prioritize resilient design strategies A high level risk assessment is recommended for all City capital projects with a total cost of under $50 million Projects above $50 million are recommended to conduct an in-depth assessment
Risk assessments use quantified estimates of the probability and magnitude of consequence of an event occurring to prioritize responses ldquoProbabilityrdquo is an assessment of the likelihood of a hazard occurring while ldquomagnituderdquo describes the hazardrsquos potential impact Risk assessment tools such as the examples listed below can be used to define and score these categories Projects that score higher across both probability and magnitude can be prioritized for investment and risk mitigation action Projects that score lower across both criteria may require no action beyond meeting code The results are typically charted on a risk matrix and an example is provided on the next page
The climate change risk management frameworks below offer templates for how to integrate climate change projections into a risk assessment process Refer to these resources for examples and further information
bull Vulnerability Assessment and Adaptation Framework is prepared by the Federal Highway Administration (FHWA) While developed for transportation planning this risk assessment framework has broad applicability for evaluating asset vulnerability to climate change Available at httpswwwfhwadotgovenvironmentsustainabilityresilienceadaptation_framework
bull US Climate Resilience Toolkit The US Global Change Research Program offers a step by step risk assessment
framework including tools and case studies at httpstoolkitclimategovsteps (see example on next page)
bull Coast Adapt Guidance on undertaking a risk assessment High level assessment httpscoastadaptcomausitesdefaultfilesfactsheetsT3M4_2_2nd_pass_risk_assessmentpdfDetailed assessment httpscoastadaptcomausitesdefaultfilesfactsheetsT3M4_3_3rd_pass_risk_assessmentpdf
bull Climate adaptation Risk uncertainty and decision-makingDownload the report here httpswwwukciporgukpublicationsRisk
The City plans to develop a NYC-specific process for integrating climate change data into existing risk management processes by April 2019
APPENDIX 7 - CLIMATE CHANGE RISK ASSESSMENT RESOURCES
NYC Mayorrsquos Office of Recovery and Resiliency Climate Resiliency Design Guidelines
54APPENDIX 7 - CLIMATE CHANGE RISK ASSESSMENT RESOURCES
The Risk Characterization Matrix below is an example from the US Climate Resilience Toolkit This tool can be used to assess the probability and magnitude of impact for identified risks The risk of coincident climate stressorsrisks (such as storm surge plus increased precipitation) can also be assessed as applicable
Figure 14 - Example of a climate change risk matrix (adapted from US Climate Resilience Toolkit)
Project teams can determine the magnitude of the impact (along the horizontal scale of 1 through 3 with 3 being the most severe) and the probabilitylikelihood of occurrence for each specific risk (along the vertical scale with 3 being the most likely) A score is typically assigned for each risk (Probabil-ity x Magnitude) and then charted on the matrix Based on the estimated probability and magnitude of consequence above the risks are ranked and prioritized for mitigation Factors to bear in mind include
bull Not all facility typologies have the same level of functional and operational importance during events or tolerance for disruption
bull Not all climate stressors and risks have the same level of impact on each project sitebull Not all identified risks can or should be mitigated fully
NYC Mayorrsquos Office of Recovery and Resiliency Climate Resiliency Design Guidelines
55WORKS CITED
A Stronger More Resilient New York PlaNYC Report of the NYC Special Initiative for Rebuilding and Resiliency The City of New York 2013
ldquoAccount for Climate Riskrdquo International Finance Corporation accessed March 27 2017 httpwwwifcorgwpswcmconnectTopics_Ext_ContentIFC_External_Corporate_SiteClimate+Business
PrioritiesAccount+for+Climate+Risk
American Society of Heating Refrigeration and Air-Conditioning Engineers (ASHRAE) Handbook -Fundamentals 2017
ldquoBaseline Standard Economic Value Methodology Reportrdquo Federal Emergency Management Agency July 2016
Benefit Cost Analysis Toolkit Software Version 530 Federal Emergency Management Agency (build date December 2016)
Criteria for Detention Facility Design New York City Department of Environmental Protection November 2012
Community Resilience Planning Guide for Buildings and Infrastructure Systems Vol 1 NIST Special Publication 1190 US Department of Commerce 2016
Cool and Green Roofing Manual NYC Department of Design and Construction 2007 httpwwwnycgovhtmlddcdownloadspdfcool_green_roof_manpdf
Building Resiliency Task Force US Urban Green Building Council New York 2013 httpurbangreencouncilforcecomBuildingResiliency
Design and Planning for Flood Resiliency Guidelines for NYC Parks New York City Department of Parks and Recreation 2017
httpswwwnycgovparksorgplanning-and-buildingplanningresiliency-plansflood-resiliency
Flooded Bus Barns and Buckled Rails Federal Transit Administration Office of Budget and Policy 2011 httpswwwhsdlorgabstractampdid=685187
Floodproofing Non-Residential Buildings FEMA P936 FEMA 2013 httpswwwfemagovmedia-library-data9a50c534fc5895799321dcdd4b6083e7P-936_8-20-13_508rpdf
ldquoGlossaryrdquo International Infrastructure Management Manual National Asset Management Support Group New Zealand 2011 httpwwwipweaorg
ldquoGreen Roof Metrics Draft Reportrdquo New York City Department of Parks and Recreation 2017
ldquoGuide to Rain Event Preparednessrdquo NYC Department of Environmental Protection httpwwwnycgovhtmldeppdfbrochuresflood-preparedness-flyerpdf
ldquoGuidelines and Discount Rates for Benefit-Cost Analysis of Federal Programsrdquo Appendix C Circular A-94 US Office of Management and Budget (OMB) 2017
ldquoGuidelines for the Design and Construction of Stormwater Management Systemsrdquo New York City Department of Environmental Protection July 2012
Horton R et al New York City Panel on Climate Change 2015 Report Ann NY Acad Sci ISSN 0077-892 New York 2015
Madrigano J et al ldquoA case-only study of vulnerability to heat wavendashrelated mortality in New York City (2000ndash2011)rdquo Environmental Health Perspectives 123672ndash678 2013
WORKS CITED
NYC Mayorrsquos Office of Recovery and Resiliency Climate Resiliency Design Guidelines
56WORKS CITED
enspMcGregor et al Two Degrees The Built Environment and Our Changing Climate Routledge Press 2013
NYC Green Codes Task Force US Green Building Council New York 2010 httpurbangreencouncilorgGreenCodes
NYCrsquos Risk Landscape A Guide to Hazard Mitigation NYC Emergency Management 2014
One New York The Plan for a Strong and Just City The City of New York 2015 httpwwwnycgovhtmlonenyc downloadspdfpublicationsOneNYCpdf
Ready to Respond Strategies for Multifamily Building Resilience Enterprise Green Communities 2015 httpswwwenterprisecommunityorgresources
Rosenzweig C et al Climate Change Adaptation in New York City Building a Risk Management Response New York City Panel on Climate Change 2010
httponlinelibrarywileycomdoi101111nyas20101196issue-1 issuetoc
ldquoSustainable Infrastructure Management Program Learning Environmentrdquo Water Environment Research Foundation accessed March 24 2017 httpsimplewerforg
Urban Waterfront Adaptive Strategies NYC Department of City Planning 2013 httpwww1nycgovsiteplanningplanssustainable-communitiesclimate-resiliencepagetab=1
Wastewater Resiliency Plan Climate Risk Assessment and Adaptation Study New York City Department of Environmental Protection October 2013
NYC Mayorrsquos Office of Recovery and Resiliency Climate Resiliency Design Guidelines
11IIA INCREASING HEAT
1 Urban Heat Island reductionNew capital construction should minimize its contribution to the Urban Heat Island effect The design interventions provided below offer benefits to the community and the facility through reduced heat loading reduced energy costs andor improved occupant health and thermal comfort The appropriate combination of design interventions will vary dependent on the project scope
a) Increase the solar reflectance of surfaces by utilizing light-colored pavement coatings and materials in combination with shading with a minimum target of 50 of the non-structure areas of facility sites19
Lighter reflective surfaces help reduce the Urban Heat Island effect heat loading and internal building temperatures and extend the lifespan of rooftops and heating ventilation and air conditioning (HVAC) equipment The City has taken steps towards reducing ambient temperatures such as implementing the NYC Cool Roofs program20 New buildings as well as existing buildings with roofs going through significant repairs are required by law to paint their roofs white This program intervention reduces a buildingrsquos contribution to Urban Heat Island effect and provides energy savings by coating the normally dark concrete roof surface with white paint allowing the roof to reflect solar radiation
b) Increase the shading of surfaces by planting trees or other vegetation in combination with cool pavements with a minimum target of 50 of the non-structure areas of facility sites
Shady areas with heat- and in coastal areas salt-tolerant vegetative species can help keep buildings cool and provide energy savings as well as lower temperatures
c) Meet Climate Zone 6 standards for fenestration and insulation (See Section ECC C402 in Chapter C4 of the 2016 NYC Energy Code) to improve efficiency of building envelopes
NYC is currently in Climate Zone 4 NYC already requires that small residential building envelopes are designed to meet higher insulation and fenestration requirements to improve energy efficiency21 All City capital projects including non-residential facilities should meet this standard
d) Select greenblue roofs andor other appropriate landscape elements that maximize cooling with help of landscape architects
The City already encourages the use of green and blue roofs on buildings to reduce the Urban Heat Island effect22 provide stormwater management and increase the useful life of the roof Besides replacing dark roof surfaces green roofs and vegetation also provide shade and keep the air cool through evapotranspiration by releasing moisture into the atmosphere Blue roofs coupled with light colored roofing material can provide stormwater management and rooftop cooling Some of these designs support the shading and solar reflectance goal in Step a) above Additionally City capital projects are subject to Leadership in Energy and Environmental Design (LEED) certification and green roofs can earn LEED credits23 Projects should integrate cooling strategies listed below based on project scope and a balance between costs and benefits
bull Green roofs or blue roofs on a broader range of facilities (including industrial buildings storage garages administration buildings etc)
19 Urban Green Council (2010) Green Codes Task Force Proposed code ldquoEF 12 Reduce Summer Heat with Cool Shady Building Lotsrdquo20 Local Law No 21 (2011) amended Chapter 12 of the NYC Building Code to update roof coating standards Also
see Cool and Green Roofing Manual (DDC) 2007 for more information on NYC standards for cool and green roofs httpwwwnycgovhtmlddcdownloadspdfcool_green_roof_manpdf
21 Read more about the code here httpswww1nycgovsitebuildingscodes2016-energy-conservation-codepage22 See Cool and Green Roofing Manual (DDC) 2007 for more information on NYC standards for cool and green roofs
httpwwwnycgov htmlddcdownloadspdfcool_green_roof_manpdf23 See Local Law No 32 (2016) for more information
NYC Mayorrsquos Office of Recovery and Resiliency Climate Resiliency Design Guidelines
12
2 Minimize impact from increasing heatThis section provides information to support making design adjustments to capital projects to reduce impacts to equipment structures landscapes and materials from rising average temperatures and increasing extreme heat events
a) Review forward-looking climate data provided in Table 1 and Table 2 Select heat projections according to the useful life of the facility and its primary
components then evaluate and address impacts in the steps below Table 1 provides design criteria for average temperatures and incidents of extreme heat events projected to different time periods across the 21st century Table 2 provides guidance on future 1 Dry Bulb Temperature and Cooling Degree Days for the NYC area The 1 Dry Bulb Temperature represents the ambient air temperature
IIA INCREASING HEAT
bull Vegetated structures such as shade trees and planters (to reduce heat loading on horizontal or vertical surfaces)
bull Bioswales rain gardens and bioretention24 bull Maximize planted permeable surfacesbull Other permeable surfaces (used for stormwater management these retain
moisture that evaporates as surface temperatures rise)25 bull Open-grid pavement system (at least 50 unbound)26 bull Evaluate site planning and building massing with regard to solar gainbull Solar panels for shading and to generate energy
Table 1 ndash Baseline and projected extreme heat events27
End of useful life
heat waves per year (3 or more consecutive days with max temperatures at or above 90degF)
days above 90degF
Annual average temperature
Baseline (1971-2000) 2 18 54degF
Through to 2039 4 33 572degF
2040-2069 7 57 606degF
2070-2099 9 87 643degF
Table 2 ndash Projections for 1 Dry Bulb temperature and Cooling Degree Days
Change in projected value for 2050s
Variable Baseline for Central Park (1971-2000)
Low estimate (10th percentile)
Middle range (25th to 75th percentile)
High estimate (90th percentile)
1 Dry Bulb temperature 91degF +3degF +4-6degF +7degF
Cooling Degree Days (base = 65degF) 1149 +37 +46-73 +87
Note Due to HVAC system typical useful life of 25 years or less only projections for the 2050s are shown Projections for the 2020s are not shown because it is anticipated that enough of a safety margin is employed already in current systems to withstand the temperature rise expected through the 2020s The NPCC is currently working on projections of 1 Wet Bulb temperatures which are expected to increase and may require systems to have higher moisture reducing capacity in addition to the enhanced cooling capacity
24 When siting bioswales consider groundwater levels and soil permeability and ensure that the site is not contaminated from past or present land uses A high water table may prohibit some applications
25 Urban Green Council (2010) Green Codes Task Force Proposed code ldquoSW 1 REDUCE EXCESSIVE PAVING OF SITESrdquo26 LEED Neighborhood Development v4 ldquoHeat island reductionrdquo credit27 Projected estimates for average temperatures are based upon 90th percentile change factor added to the baseline average annual
temperature from New York City Panel on Climate Change (2015)
NYC Mayorrsquos Office of Recovery and Resiliency Climate Resiliency Design Guidelines
13IIA INCREASING HEAT
b) Evaluate potential impacts on systems and materials Heat impacts on a facility are highly contingent on the facility type and should be reviewed on a case-by-case basis28 A decrease in the useful life or operational capacity of a facility or components of a facility may occur due to rising temperatures Interventions will also vary depending on whether the project is a new capital investment or a substantial improvement to an existing facility Factors to evaluate as applicable to project scope include but are not limited to
bull Thermal expansion warping softening or other forms of material change or degradation of structural integrity occurring at an accelerated rate by excessive heat
bull Health and safety impacts on occupants vulnerable to heat bull Increased failure or reduced efficiency of electrical or mechanical systems bull Prioritization of critical loads for systems and components at the facility andbull Moisture control needs for buildings with a higher standard for fenestration and
insulation
The results of this evaluation will inform steps taken in the step below
c) Reduce heat impacts Review and implement specific changes to the facility design based on assessments
above Develop a strategy based on the specific type of facility its operational profile and its useful life A Design Strategies Checklist is available for use in Appendix 6 as a resource to track design approaches Specific areas of focus are
bull Electricity outages High temperatures drive demand for air conditioning and can increase the risk of facility equipment failure potentially broader grid disruptions or brownouts2930 To manage this risk design City buildings and infrastructure to withstand periods without electricity using the following approaches in particular if they provide critical or essential services
Ǯ Identify and assess how much of the facilityrsquos load is critical (eg ldquocritical loadrdquo) including the necessary duration of the backup power supply (eg is backup power needed for 8 hours or multiple days) Determining what loads are critical and how long they should be powered for is essential for a facilityrsquos operations and what the role of the facility will have in an emergency situation31
Ǯ Depending on the size of the critical load and budget different backup power supply options could range from backup generators (eg diesel natural gas) to hybrid systems (eg solar + battery storage + appropriately sized generator) Each option has different trade-offs that should be considered in terms of cost feasibility and environmental impacts For shorter duration needs andor smaller critical loads buildings with existing solar systems should consider adding storage to provide a resiliency benefit In some cases co-generation systems may make sense from an economic and resiliency perspective especially if there
28 Sector- and facility-specific impacts vary greatly For examples of sector-specific impacts and design responses see Flooded Bus Barns and Buckled Rails (FTA 2011) and Ready to Respond Strategies for Multifamily Building Resilience (Enterprise Green Communities 2015)
29 McGregor et al (2013) Two Degrees The Built Environment and Our Changing Climate Routledge Press30 High temperatures also increase energy demand which can increase fossil fuel based greenhouse gas emissions31 The key roles of the facility that need to be identified are operational hours number of occupants and electrical loads needed for the
desired operations Electrical equipment and appliances for the desired operations may include - but are not limited to - safety lighting life-supporting systems fire protection systems telecommunications equipment mechanical systems to mitigate extreme temperatures and computing equipment Every facility is unique Operational characteristics and load profiles need to be established prior to sizing the equipment required to keep the facility in operational mode
NYC Mayorrsquos Office of Recovery and Resiliency Climate Resiliency Design Guidelines
14IIA INCREASING HEAT
is a significant heating andor cooling load in addition to electricity demand32
Ǯ Depending on the option assess need to invest in internal electricity rewiring and building energy management systems (eg switches reconfiguration of distribution infrastructure to isolate critical loads from non-critical loads and the ability to island from the broader grid during the event of a larger disruption software and hardware to manage the deployment of hybrid systems) andor need for external hookups for temporary generators and boilers33
bull Failure in facility ventilation electrical and air conditioning systems Some systems designed to meet the requirements of past climate may overheat and fail during extreme events Some design interventions include34
Ǯ Selecting systems with higher heat tolerance Ǯ Adding Energy Recovery Ventilation systems Ǯ Providing additional or redundant ventilation systems either mechanical or
natural to cool electrical equipment Ǯ Optimizing building layout by
bull segregating temperature sensitive electronics and computer control system from other systems
bull placing heat generating equipment like transformers and switchgear outdoors where permitted and
bull splitting the facility cooling loads among different HVAC systems in facility for redundancy and better zone control
bull Passive solar cooling and ventilation There are numerous design features that provide passive solar cooling for buildings to help maintain lower internal ambient temperatures with less air conditioning These features also help keep facilities habitable during extended grid failures when generators fail or must be reserved for critical functions Some design features include35
Ǯ Appropriate east-west orientation Ǯ Passive ventilation design Ǯ Vertically stacked double skin facades Ǯ Exterior window shades Ǯ Light colored exteriors Ǯ Shaded arcades Ǯ Thermally massive materials Ǯ High performance glazing Ǯ Operable windows
32 To learn more see the Building Resiliency Task Force report from Urban Green Council (2013)33 Ibid 34 Flooded Bus Barns and Buckled Rails FTA Office of Budget and Policy 201135 These and other examples are found in McGregor et al (2013) Two Degrees The Built Environment and Our Changing Climate
Routledge Press Also see Flooded Bus Barns and Buckled Rails FTA Office of Budget and Policy 2011
NYC Mayorrsquos Office of Recovery and Resiliency Climate Resiliency Design Guidelines
15IIB INCREASING PRECIPITATION
B INCREASING PRECIPITATIONThe intensity and frequency of precipitation events are projected to increase with climate change creating new challenges for stormwater management and impacts to the built environment such as
bull The potential for greater frequency of stormwater management systems being overwhelmed36
bull More frequent and severe flooding of buildings and infrastructure in areas across the city and
bull Greater variability in rainfall events annually including the chance of drought
The goal for this section is to guide stormwater management approaches including infiltration increases in on-site storage volume and where possible increases in sewer capacity to account for precipitation increases associated with climate change Designers should develop and consider design interventions that would decrease site contribution to sewer in-flows beyond the existing NYC Building Code requirements Given its complexity the Department of Environmental Protection (DEP) is also evaluating climate impacts to the sewer system on a drainage-wide level Proactive design such as increasing on-site infiltration and storm water retention can contribute to system resiliency on a site-specific basis
BackgroundNYCrsquos drainage systems are designed to handle approximately the current 3-year intensity-duration-frequency (IDF) event in most areas of the city where sewers were built prior to 1970 In locations with sewers built after 1970 the capacity was built to handle the 5-year event NYCrsquos network of drainage systems can experience flooding above those thresholds due to widespread precipitation events or by localized intense storms (sometimes called ldquocloudburstsrdquo) causing flooding and backups Climate change projections indicate that flooding resulting from multiple types of precipitation events may increase in frequency This increasing probability is forecast for all types of precipitation events in NYC although there is greater uncertainty around future short duration events Relying on sewers alone to manage extreme precipitation events will not be sufficient in a changing climate The City plans to reduce impervious areas and provide additional storage capacity to reduce flood damage For managing stormwater from larger storms such as at the 50- and 100-year recurrence intervals DEP is increasingly considering the role of streets and open space in managing flow this is referred to as a dual drainage design approach The City is piloting projects to test this dual drainage approach
Another set of interventions include Bluebelt best management practices (BMPs) such as constructed wetlands storm water ponds and stream restorations that emulate pre-development conditions to manage large volumes of water and green infrastructure37 which in NYC have generally been designed to reduce flooding and combined sewer overflow respectively They are not typically sized to manage precipitation events of the same magnitude as sewers which serve as primary drainage conveyance However Bluebelt BMPs green infrastructure and other stormwater management tools may provide an additional buffer for larger storm events by temporarily storing andor infiltrating runoff that would otherwise be directed into the sewer system For instance areas of open space commonly found in NYC may not provide adequate environments for trees and other plantings However in these cases other types of green infrastructure like permeable surfaces and subsurface detention and retention installations would still be considered feasible
36 NYC is already taking steps to address this problem which will worsen with climate change To learn more about how NYC is using green and gray infrastructure to manage stormwater visit httpwwwnycgovhtmldephtmlstormwaterindexshtml
37 NYC DEP NYC Green Infrastructure Program
NYC Mayorrsquos Office of Recovery and Resiliency Climate Resiliency Design Guidelines
16IIB INCREASING PRECIPITATION
The City led by DEP continues to develop its options for managing heavier storm events due to climate change DEP is examining approaches to evaluate sea level rise and rainfall intensity for stormwater management and where possible sewer capacity These efforts will integrate forward-looking climate data into the design of these capital assets and the compounding factors of heavier rain storms and sea level rise will likely require greater infiltration and on-site storm water retention capacity Agencies and consultants should work directly with DEP to develop strategies on a given site necessary to meet expected increases in rainfall intensities and frequencies
1 Precipitation design adjustment for on-site stormwater systems
Based upon the design storm required for the City facility in design follow the steps below and review recommended design interventions
a) Identify the duration of the design event required The current 50-year IDF can be used as a proxy for the future 5-year storm
(projected for the 2080s) Design on-site detentionretention systems to retain the volume associated with the current 50-year IDF curve (see Figure 4 below) Design the on-site system to release at the maximum rate as specified in 15 Rules of the City of NY (RCNY) Chapter 3138
b) Conduct sensitivity analysis Compare the retentiondetention required for the current 5-year IDF versus the
38 Refer to existing codes and standards as well when determining the existing required storm as NYC requires different sizes of design storms for infrastructure and buildings For example NYC Plumbing Code Chapter 11 and Title 15 of the Rules of the City of New York Chapter 31
02
04
06
10
20
40
60
100
200
-2316090
Rai
nfal
l Int
ensi
ty (
inch
es p
er h
our
)
DurationsruoHsetuniM
5 10 15 30 1 2 3 6 12 18
5-yr
10-yr25-yr
50-yr
100-yr
NEW YORK NEW YORK
Figure 4 - Current Intensity-Duration-Frequency Precipitation Curve for NYC adapted from US Department of Commerce Weather Bureau Technical Paper 25
NYC Mayorrsquos Office of Recovery and Resiliency Climate Resiliency Design Guidelines
17IIB INCREASING PRECIPITATION
c) Identify design interventions for managing increased precipitation40 There are different ways to manage stormwater better and avoid urban flooding after
intense rain Choose the right combination of interventions after considering the site location operational requirements cost benefits and useful life of the intervention Some examples of design interventions are
bull Minimize increases in impervious surfacebull Utilize strategies that infiltrate evaporate or reuse rainwater to achieve storm
water volume reductions Then choose strategies that detain (delay drainage) to manage the rate of the storm water flow into the Cityrsquos drainage system
bull Install stormwater infiltration detention and storage (eg bioswales41 green roofs blue roofs and other blue or green infrastructure storage basins or tanks)
bull Protect areas below grade from floodingbull Keep catch basin grates clearbull When implementing perimeter protections ensure that interior water
management is also accounted for andbull Explore interventions to protect underground utility and telecommunications
infrastructure from water damage
d) Use appropriate DEP guidelines to perform the above tasks using the higher design storm
The three currently prescribed DEP guidelines are as follows
bull Guidelines for the Design and Construction of Stormwater Management Systems July 201242
bull Criteria for Detention Facility Design November 201243 bull DEP Site Connection Proposal Application and Guidelines44
Note on stormwater standards As DEP updates stormwater standards and develops specific tools to evaluate impacts of increased precipitation and drainage strategies for on-site storm water management these changes will be reflected in future versions of these Guidelines However it is recommended that the designer should develop and consider design interventions that would increase the on-site storage beyond the existing requirements Also a methodology is under development that will establish a consistent citywide process for addressing legal grade which will have further implications for how extreme precipitation is managed
39 NYC DEP Standards for Stormwater Release Rates available at httpwwwnycgovhtmldephtmlenvironmental_reviewsstormwater_release_ratesshtml 40 Also see DEP Guide to Rain Event Preparedness at httpwwwnycgovhtmldeppdfbrochuresflood-preparedness-flyerpdf and
Ready to Respond Strategies for Multifamily Building Resilience at httpwwwenterprisecommunityorgresourcesready-respond-strategies-multifamily-building-resilience-1335641 When siting bioswales consider groundwater levels and soil permeability and ensure that the site is not contaminated from past or
present land uses A high water table may prohibit some applications42 Available at httpwwwnycgovhtmldephtmlstormwaterstormwater_management_constructionshtml43 Available at httpwwwnycgovhtmldeppdfwater_sewer30_criteria_for_detention_facility_design_06062012pdf44 Available at httpwwwnycgovhtmldeppdfwater_sewer24pdf
current 50 year IDF to determine the cost and benefits associated with complying with these Guidelines Use the Evaluation of Project Benefits section below and Appendix 4 for guidance on how to identify and assess benefits Given the results of the costbenefit analyses review the added benefit of designing retentiondetention using greater magnitude storms (eg 100-year) or lower (eg 25-year) The goal is to maximize retentiondetention capacity given site and cost constraints as well as through an evaluation of the benefit of adding capacity to detainretain water for larger storm events
NYC Mayorrsquos Office of Recovery and Resiliency Climate Resiliency Design Guidelines
18
2 Incorporating climate change projections into DEP drainage planning
The first line of defense for managing intense precipitation events does not require changes to the sewer system as described above For drainage and wastewater infrastructure planning in a changing climate the sewer network and wastewater infrastructure should be qualitatively evaluated from the upstream pipes to the regulator chambers pump stations interceptors and ultimately to the downstream outfall to determine the feasibility of incorporating climate change projections into the system design For DEP storm sewer projects FY 2021 or later in separately sewered drainage areas where the design is in the early stages and there is free discharge the agency will evaluate the feasibility of revising the design to incorporate climate projections into the design If the project (including the prescribed changes) passes the costbenefit analysis then DEP will consider incorporating climate change projections into the sizing However changes in one part of the system must be carefully evaluated For example any upsizing of the regulator chamber or the high point of the system can negatively impact the design and operation of the wastewater infrastructure and residencesbusinesses on the system and can lead to a diminished the level of service
DEP is in the process of developing a hydrologic and hydraulic (HampH) model to estimate runoff flow for future climate scenarios and is evaluating rainfall hyetographs for the existing and future rainfall scenarios to be included in the drainage planning process In addition DEP currently coordinates with ORR for drainage planning as a part of coastal resiliency projects A more detailed methodology to incorporate climate change projections into drainage planning will be developed for version 30 of the Climate Resiliency Design Guidelines to be released in April 2019
IIB INCREASING PRECIPITATION
NYC Mayorrsquos Office of Recovery and Resiliency Climate Resiliency Design Guidelines
19IIC SEA LEVEL RISE
non-critical components within a larger facility or campus (eg at a maintenance yard differentiate between structures and equipment) Critical components essential to the facilityrsquos functionality should be protected to the higher standard for criticality even if the facility itself may be non-critical Some examples of critical components include electrical distribution and switching areas motor-control centers chemical feed equipment boilers communications systems monitoring and safety equipment HVAC units fire alarms and suppression equipment furnaces elevators emergency fuel supplies emergency generators and hazardous material storage Component protection should also be evaluated if a facility is expected to be fully operational during a flood event or if it is expected to quickly resume full operations after an event
For buildings and infrastructure with a long useful life it is not always cost effective or operationally feasible to design a facility to be resilient to hazards faced at the end of its useful life In these cases the most resilient design will be one that provides extra protection against hazards in the initial decades while also leaving open design alternatives for updating resiliency measures as new data is provided or new risk assessments are completed This flexible adaptation pathways approach builds in options to protect assets later in life as demonstrated in an example shown in Figure 1 (in Section I)
Other considerations to keep in mind includebull These Guidelines apply to all City capital projects except coastal flood protection
systems which are designed to different standards than those provided here for
C SEA LEVEL RISEThis section provides tools to 1) determine if the project will be subject to tidal inundation during its useful life due to sea level rise and 2) incorporate sea level rise into flood protection levels of capital projects For projects in the current and future 1 annual chance floodplains sea level rise-adjusted design flood elevations (DFE) are provided and reflect the criticality of the asset and its useful life Background NYC has experienced the devastation of coastal storms most recently during Hurricane Sandy Sea level rise is projected to increase the depth extent and frequency of flooding from storm surge45 Sea level rise will also regularly inundate some low-lying areas during high tides Current flood protection heights are determined by using the base flood elevation established by the FEMA Preliminary Flood Insurance Rate Map (PFIRM) 201546 and the standard of protection for buildings in the floodplain in Appendix G of the NYC Building Code47 These Guidelines augment existing requirements for two primary purposes ensuring City facilities built today incorporate sea level rise and critical assets (as defined in Table 4) are protected to a higher level It is important to note that all projects and design interventions must comply with NYC Building Code
Designers should differentiate between critical and
45 New York City Panel on Climate Change Report Chapter 2 Sea Level Rise and Coastal Storms (2015)46 However NYC Building code G10222 requires that designers review both the PFIRM and the effective FIRM and use the more
restrictive of the two 47 For information on the differences between FEMA FIRM PFIRM and the Cityrsquos forward-looking flood maps see Appendix 3
Critical components essential to the facilityrsquos functionality should be protected to the higher standard for criticality even if the facility itself is non-critical
NYC Mayorrsquos Office of Recovery and Resiliency Climate Resiliency Design Guidelines
20IIC SEA LEVEL RISE
buildings and other physical infrastructure Many of NYCrsquos coastal flood protection systems are currently being developed to comply with FEMA accreditation for flood levee systems48 The City plans to develop further guidance for designing coastal protection projects
bull For information on the differences between FEMA FIRM PFIRM and the Cityrsquos forward-looking flood maps see Appendix 3
bull Coincident stressors from sea level rise should also be considered For example bridge scour may increase as sea levels rise Similarly flooding during heavy rainfall events can be worsened due to higher tailwater conditions associated with high sea levels Be aware of how different risks may interact and how different interventions can be deployed to address multiple hazards or provide other co-benefits
bull Note projects that require discretionary approval are required to incorporate sea level rise projections as part of the NYC Waterfront Revitalization Program49 and
bull A methodology is under development that will establish a consistent citywide process for addressing legal grade which will have further implications for how sea level rise and precipitation are managed
For more information see Section IE Designers should use the resources and methods described in this section to 1) assess tidal inundation due to sea level rise and 2) address risks in the current and future floodplains
1 Assessing tidal inundation due to sea level riseTidal flooding currently affects parts of NYC and is projected to worsen as sea levels rise and inundate low-lying coastal sites during high tides When determining a site location or establishing scope of substantial improvements for other types of coastal facilities the project team will consider alternative sites outside of zones threatened with regular inundation if resiliency actions are not taken Some facilities such as wastewater treatment plants and harbor facilities need to be near the coast for operational purposes
a) Determine tidal inundation risk from sea level rise Use the Flood Hazard Mapper (httpwwwnycgovfloodhazardmapper)50 to see if your
site is in an area inundated from high tide plus sea level rise within the projectrsquos useful life For example if the useful life ends between 2040 and 2069 choose the 2050s High Tide map) Determine risk only from high tide and sea level rise separate from flood events Follow the instructions in Figure 5 and refer to the example in Figure 6 to review inundation at the end of an assetrsquos useful life
48 For more information please visit httpwwwfemagovfema-levee-resources-library49 For more information visit httpwwwnycgovwrp50 The Flood Hazard Mapper relies on publicly available data to present these map resources Users should also refer to FEMA and the
NPCC for official information
Figure 5 - Flood Hazard Mapper high tide plus sea level rise at httpwwwnycgovfloodhazardmapper
NYC Mayorrsquos Office of Recovery and Resiliency Climate Resiliency Design Guidelines
21IIC SEA LEVEL RISE
b) Address flood risk If the Flood Hazard Mapper shows that the facility is expected to be inundated by
high tides within its useful life or if primary access roads are at risk of inundation consider alternative site options
- OR - If the site is not expected to be regularly inundated by tides proceed to the next
section 2 Addressing Risks in the Current Floodplain
Note on calculating tidal inundations with sea level rise if a project team is interested in understanding the depth of tidal inundation given climate change projections follow these steps First determine the Mean Higher High Water (MHHW) elevation in feet-NAVD 8851 datum nearest to the site If the MHHW data is unavailable from a site specific survey refer to httpwwwnycgovwrp for a list of MHHW elevations (NAVD88) at tide stations across the city52 Second add the high estimate (90th percentile) of expected sea level rise (see Table 8 in Appendix 2) for the year corresponding to the facilityrsquos useful life to the MHHW to determine the projected depth of tidal inundation with sea level rise
51 North American Vertical Datum of 1988 (NAVD 88) is the vertical control datum of orthometric height established for vertical control surveying in the US based upon the General Adjustment of the North American Datum of 1988
httpswwwngsnoaagovdatumsvertical52 SLR elevations at httpwwwnycgovwrp are adjusted to account for sea level rise since the last tidal epoch If no other resource is
available to determine MHHW use the NOAA Online Vertical Datum Transformation tool to calculate the MHHW in feet-NAVD
Figure 6 - Flood Hazard Mapper with high tide in the 2020s (left) and in the 2080s (right) at httpwwwnycgovfloodhazardmapper
NYC Mayorrsquos Office of Recovery and Resiliency Climate Resiliency Design Guidelines
22IIC SEA LEVEL RISE
2 Addressing risks in the current floodplain53
A facility located in the current 1 annual chance floodplain (PFIRM 2015)54 will face increasing risk of flooding during its useful life due to sea level rise increasing the depth of coastal storms This section provides a process for adjusting the design flood elevation required by code to account for sea level rise
a) Find the location of the facility using the Flood Hazard Mapper (httpwwwnycgovfloodhazardmapper) and follow the instructions in Figure 7
bull Choose to view the layer ldquoFEMA Preliminary FIRM 2015rdquo bull Click on the facility site in the 1 floodplain to view the base flood elevation
Figure 7 - Flood Hazard Mapper with FEMA PFIRM (2015) at wwwnycgovfloodhazardmapper
b) If the facility is not in the current 1 annual chance floodplain (PFIRM 2015) proceed to the next section ldquo3 Addressing risks in the future floodplainrdquo
- OR - If the facility is in the current 1 annual chance floodplain (PFIRM 2015) note
the base flood elevation (BFE) and proceed to Step c) below Please note if a facility has multiple BFEs or if the site is partially in the 1 annual chance floodplain it is recommended to use the highest BFE as the current BFE for the entire site
c) Establish a sea level rise-adjusted DFE Use the current base flood elevation at your site the facilityrsquos useful life and its
criticality level to determine the design flood elevation using Table 4 (on the next page) as a basis of design
53 This process for adjusting the design flood elevation to account for sea level rise satisfies the criteria of the climate-informed science approach described at the state and federal level
54 FEMA updates its flood maps periodically As of April 2018 the most recent maps are the Preliminary Flood Insurance Rate Maps (PFIRM) available at DCPrsquos Flood Hazard Mapper (httpwwwnycgovfloodhazardmapper) Also note that NYC Building Code requires developers to use the PFIRM (2015) or the FIRM (2007) whichever is more restrictive For more information on these requirements please refer to Appendix G of the NYC Building Code Please note that the DCP maps are not official and all site locations should be confirmed with the official FEMA PFIRM NYC will provide information on the latest flood maps as they are updated
NYC Mayorrsquos Office of Recovery and Resiliency Climate Resiliency Design Guidelines
23IIC SEA LEVEL RISE
Table 4 - Determine the sea level rise-adjusted design flood elevation for critical and non-critical facilities55
Critical facilities
End of useful life Base Flood Elevation (BFE)56 in NAVD 88 + Freeboard57 + Sea Level Rise
Adjustment58= Design Flood Elevation (DFE) in
NAVD 88Through 2039 FEMA 1 (PFIRM) 24rdquo 6rdquo = FEMA 1 + 30rdquo
2040-2069 FEMA 1 (PFIRM) 24rdquo 16rdquo = FEMA 1 + 40rdquo2070-2099 FEMA 1 (PFIRM) 24rdquo 28rdquo = FEMA 1 + 52rdquo
2100+ FEMA 1 (PFIRM) 24rdquo 36rdquo = FEMA 1 + 60rdquoNon-critical facilities
End of useful life Base Flood Elevation (BFE) in NAVD 88 + Freeboard + Sea Level Rise
Adjustment = Design Flood Elevation (DFE) in
NAVD 88Through 2039 FEMA 1 (PFIRM) 12rdquo 6rdquo = FEMA 1 + 18rdquo
2040-2069 FEMA 1 (PFIRM) 12rdquo 16rdquo = FEMA 1 + 28rdquo2070-2099 FEMA 1 (PFIRM) 12rdquo 28rdquo = FEMA 1 + 40rdquo
2100+ FEMA 1 (PFIRM) 12rdquo 36rdquo = FEMA 1 + 48rdquoAdditional analysis should be conducted to incorporate wave action and wave run-up in DFE calculations especially in areas that are located within the FEMArsquos 1 annual chance Limit of Moderate Wave Action (LiMWA) zone Wave run up is the maximum vertical extent of wave uprush above surge
Definition of critical buildings and infrastructure for determining DFE in Table 4The criticality definitions below are for use in the application of the Guidelines only All items identified as critical in NYC Building Code Appendix G are critical in these guidelines however this list includes additional facilities that are not listed in Appendix G59 If a facility is not listed here it is considered non-critical for the purposes of determining freeboard
bull Hospitals and health care facilitiesbull Fire rescue ambulance and police stations and emergency vehicle garages bull Jails correctional facilities and detention facilities bull Facilities used in emergency response including emergency shelters emergency preparedness communication
operation centers communication towers electrical substations back-up generators fuel or water storage tanks power generating stations and other public utility facilities
bull Critical aviation facilities such as control towers air traffic control centers and hangars for aircraft used in emergency response
bull Major food distribution centers (with an annual expected volume of greater than 170000000 pounds)60 bull Buildings and other structures that manufacture process handle store dispose or use toxic or explosive
substances where the quantity of the material exceeds a threshold quantity established by the authority having jurisdiction and is sufficient to pose a threat to the public if released61
bull Infrastructure in transportation telecommunications or power networks including bridges tunnels (vehicular and rail) traffic signals (and other right of way elements including street lights and utilities) power transmission facilities substations circuit breaker houses city gate stations arterial roadways telecommunications central offices switching facilities etc
bull Ventilation buildings and fan plantsbull Operations centersbull Pumping stations (sanitary and stormwater)bull Train and transit maintenance yards and shopsbull Wastewater treatment plantsbull Water supply infrastructurebull Combined-sewer overflow (CSO) retention tanksbull Fueling stationsbull Waste transfer stations and bull Facilities where residents have limited mobility or ability including care facilities and nursing homes
55 If an industry standard does not include freeboard in its flood protection standards for particular infrastructure assets then only consider the sea level rise adjustment when determining flood protection levels
56 Note that NYC Building Code requires developers to use the PFIRM (2015) or the FIRM (2007) whichever is more restrictive For more information on these requirements please refer to Appendix G of the NYC Building Code
57 These freeboard values reflect NYC Building Code Appendix G Table 2-1 which establishes the minimum elevation of the top of lowest floor Appendix G requires other freeboard values for other parts of structures and in different parts of the floodplain Refer to Appendix G for the appropriate freeboard and use that value in Table 4 above
58 The sea level rise figures provided are for the middle of the 25th-75th percentile range projections from the NPCC These values do not necessarily indicate the average of all models
59 The structural occupancy categories outlined in Appendix G of the NYC Building Code are the same as ASCE 7 used for structural design For critical buildings structural design should comply with ASCE 7 and 24 for design class IV
60 This threshold represents the median volume of main food distributors in NYC according to statistics collected as part of the Five Borough Food Flow study in 2016 available at
httpswwwnycedccomsystemfilesfilesresource2016_food_supply-resiliency_study_resultspdf 61 The threshold quantity for hazardous materials is established by Chapter 7 of Title 24 of the NYC Administrative Code
NYC Mayorrsquos Office of Recovery and Resiliency Climate Resiliency Design Guidelines
24IIC SEA LEVEL RISE
Figure 9 ndash Outdoor emergency generator for the critical building
This case study provides an example of how to calculate a sea level rise-adjusted DFE based on the useful life of a hypothetical critical services building and its primary component
Step 1 Organize the site by various critical or primary components and their year of construction Determine their useful life along with the associated future year scenario for flood risk assessment In this example the building structure and the outside emergency generator are the most at-risk components from combined sea level rise and coastal storm surge
Step 2 Overlay the site footprint area over the effective current PFIRM or FIRM and the corresponding future year scenario FEMA 1 to identify flood risk to the site From overlaying the 2015 preliminary FEMA floodplain over the site it was determined that the site has a 1 annual chance of flooding with a base flood elevation of 13rsquo NAVD Step 3 Evaluate the criticality of each primary component of the facility based on the Guidelinesrsquo definition for critical infrastructure (Table 4) This (hypothetical) building is critical
Step 4 Use Table 4 to determine the sea level rise adjustment and freeboard requirements for each component and calculate the DFE for each that corresponds to its useful life period
Step 5 Compare the DFE of each component and the associated Guidelinesrsquo recommended DFE to calculate anticipated flood depth
CASE STUDY Adjusting the DFE for Sea Level Rise
Table 5 ndash Example of how to calculate a sea level rise-adjusted DFE for a critical facility
Construction year Components Useful
Life
Future Year Scenario
[Useful Life + Const
Year]
BFE in NAVD
88 (feet)
Freeboard + Sea
Level Rise Adjustment
(feet)
Adjusted DFE in
NAVD 88 (feet)
2010 Building Structure
70 years 2070-2099 130rsquo 2rsquo+23rsquo 173rsquo
2010Outdoor
Emergency Generator
25 years
Through 2039 130rsquo 2rsquo+05rsquo 155rsquo
Figure 8 - Example of how to locate a facility within the current floodplain and determine the BFE Figure 9 (inset) - Outdoor emergency generator at the facility
Figure 10 - This schematic shows how to determine the design flood elevation of a facility within the current 1 floodplain
Illustrative not to scale
NYC Mayorrsquos Office of Recovery and Resiliency Climate Resiliency Design Guidelines
25IIC SEA LEVEL RISE
Figure 11 - Flood Hazard Mapper with future 1 annual chance floodplain (adjusted for sea level rise) at httpwwwnycgovfloodhazardmapper
b) If the site is not in the future floodplain no flood protection is required for this facility
- OR - If the site is in the future floodplain identify the nearest adjacent base flood
elevation at the project site in the current 1 annual chance floodplain (PFIRM 2015) using the Flood Hazard Mapper62
c) Use Table 4 to determine the DFE Add freeboard and the sea level rise-adjustment to the nearest adjacent BFE on the
current 1 annual chance floodplain (PFIRM 2015) to determine the DFE
d) Apply the DFE calculation from Table 4 to the protected facility See Figures 12 and 13 for an illustration of how to calculate the DFE
62 Maps of future floodplains show the impacts of sea level rise alone and do not consider how changes in stormsrsquo climatology might also affect wave action and the full extent of the floodplain
3 Addressing risks in the future floodplainIf the facility is not in the current 1 annual chance floodplain (PFIRM 2015) it may still be at risk in the future from flooding as sea level rise increases the extent of the floodplain Follow the steps below to determine if your facility is located in the future floodplain and if so what sea level rise-adjusted DFE to use
a) Use the Flood Hazard Mapper (httpwwwnycgovfloodhazardmapper) to determine if the facility site will be in the future 1 annual chance floodplain
Assess if by the end of the facilityrsquos useful life the floodplain is projected to increase to encompass all or part of the project site For example if the useful life ends between 2040 and 2069 choose the 2050s floodplain map Refer to the steps in Figure 11 below
NYC Mayorrsquos Office of Recovery and Resiliency Climate Resiliency Design Guidelines
26IIC SEA LEVEL RISE
Figure 12 - This schematic map shows how to locate the nearest adjacent 1 floodplain elevation
Figure 13 -This schematic shows how to determine the design flood elevation of a facility that is outside of the current 1 floodplain
CASE STUDY Identifying a Base Flood Elevation (BFE) in the Future Floodplain
Illustrative not to scale
NYC Mayorrsquos Office of Recovery and Resiliency Climate Resiliency Design Guidelines
27IIC SEA LEVEL RISE
4 Identify appropriate design interventions
63 Additional resources for identifying adaptive strategies Urban Waterfront Adaptive Strategies (NYC Department of City Planning httpswww1nycgovassetsplanningdownloadpdfplans-studiessustainable-communitiesclimate-resilienceurban_waterfrontpdf Floodproofing Non-Residential Buildings (FEMA) at httpswwwfemagovmedia-libraryassetsdocuments34270 Ready to Respond Strategies for Multifamily Building Resilience (Enterprise Green Community) at
httpwwwenterprisecommunityorgresourcesready-respond-strategies-multifamily-building-resilience-1335664 While natural systems-based approaches ameliorate flooding their use for storm surge or wave mitigation would need to be quantified
before contributing towards the design flood elevation 65 For more information see FEMArsquos Floodproofing Non-Residential Buildings at httpswwwfemagovmedia-libraryassetsdocuments34270
Operational requirements and continuity plans can inform the selection of appropriate design interventions particularly in terms of how quickly a site needs to be up and running after a flood event Some examples of how functional uses can pair with interventions include
bull A facility that needs to be operating during or immediately after a flood event may need to be dry floodproofed using permanent barriers or designed for passive survivability (such as a police or fire station)
bull A facility that needs to recover quickly after an event could elevate prioritized equipment and have deployable barriers
bull A site that can recover over a longer duration of time could be temporarily inundated during an event (such as parks or plazas) The use of resilient materials and strategies can reduce costly damage caused by temporary inundation
Different design interventions should be chosen based on the specific operational requirements of the project however these must meet the ASCE 24 design requirements for Coastal VE Zones
For all projects at risk of current or future flooding select protections that meet the projectrsquos design flood elevation Consider project-specific factors including the site location operational requirements existing continuity planning and cost63 A Design Strategies Checklist in Appendix 6 is available for use as a resource to track possible design approaches Some examples of design alternatives are
bull Site relocation where feasible conduct alternative site analysis
bull Permanent barriers at a site (eg floodwalls)
bull Deployable flood barriers (eg stop logs flood doorsgates inflatable barriers)
bull Natural systems-based approaches (eg living shorelines restored wetlands)64
bull Prioritized protection of electrical mechanical and other critical or costly-to-replace equipment above the design flood elevation (eg motors and controller boilers and furnaces fuel storage tanks duct work alarm systems and suppression equipment electrical panels electrical distribution and switching areas gas and electric meters telecommunications equipment chemical feed equipment HVAC units and emergency generators)65
bull Dry floodproofing design a facility to prevent water from entering
bull Wet floodproofing design a facility to permit floodwaters to flow in and out of the structure without causing significant damage (eg elevate or protect critical equipment use water-resistant building materials below the design flood elevation include flood vents and pumps)
bull Design redundant telecommunications conduit entrances for multiple carrier entry Telecom conduit should run to diverse manholes when possible
bull Install backup power for telecom equipment with design consideration for such equipment (eg installation above DFE)
bull Install outdoor-rated disconnect switch for telecommunications equipment on the roofbull Explore interventions to protect underground utilities and other telecommunications
facilities from water damagebull Install backflow preventers backwater valves and sump pumps for all buildings and
infrastructure in the floodplain as well as behind flood barriersbull Shoreline improvements that reduce the height of waves or attenuate waves where
feasible
NYC Mayorrsquos Office of Recovery and Resiliency Climate Resiliency Design Guidelines
28IIIA GENERAL METHODOLOGY TO ESTIMATE PROJECT BENEFITSIIIB CATEGORIES OF PROJECT BENEFITS
Designing and constructing facilities to handle the future climate loads above the current NYC codes and standards based on projected useful life of the components provides resiliency benefits The incremental costs to implement the Guidelinesrsquo recommended design interventions should be compared with the incremental benefits to aid agencies in making decisions about resilient design strategies The project design team should evaluate benefits of the interventions designed to meet Guidelinesrsquo recommended criteria for all the climate stressors qualitatively andor quantitatively For projects with construction costs below $50 million the project design team is recommended to perform a qualitative benefits assessment on the interventions that meet the Guidelinesrsquo recommendations for all applicable climate stressors For critical facilities or projects with construction costs over $50 million the project design team is recommended to perform quantitative benefit calculations to identify the optimal interventions that meet Guidelinesrsquo recommended design criteria
A GENERAL METHODOLOGY TO ESTIMATE PROJECT BENEFITSThis general methodology to perform qualitative and quantitative benefit calculations is recommended for use by project design teams at the beginning of and during the design process This methodology enables estimation of project benefits for a high-level benefit-cost analysis (BCA) that can be applied to evaluate and compare resiliency features designed to address sea level rise with coastal storm surge increased precipitation and extreme heat events The type of benefits provided by interventions designed to meet the Guidelinesrsquo design criteria can vary by climate stressors and typology of the facilities The main guiding principle in development of the high-level BCA methodologies included in these Guidelines was to balance simplicity with accuracy The project benefits categories identified within the methodology may not cover all the potential benefits provided by every facility type within NYC In particular the benefits of planning for increased precipitation are difficult to quantify Hence the project design team should use their discretion to modify this general benefit calculation methodology as needed to meet their project goals and objectives The project design team should develop appropriate input data whether quantitative or qualitative needed to estimate project benefits
B CATEGORIES OF PROJECT BENEFITSThere are three types of project benefit categories - direct benefits indirect benefits and other benefits - that can be used to perform qualitative assessments and develop quantitative estimates of monetary benefits for intervention alternatives designed to meet the Guidelinesrsquo recommendations These project benefit categories will help to perform a high-level benefit-cost analysis that balances accuracy with an appropriate level of effort
bull Direct Benefits include reduced or avoided physical damages to facilities and contents reduced or avoided displacements for residential structures and reduced life cycle or OampM costs that can be quantified as a primary result of implementing a specific hazard mitigation measure Table 12 in Appendix 4 provides a list of direct benefits and basic guidance on estimating and documenting values for sea level rise and increased precipitation-related flood hazards Note that given the current state of practice it is not possible to quantify reduced or avoided physical damages or residential displacements that result from a specific extreme heat mitigation measures Therefore direct benefits applicable to extreme heat hazards are limited to reduced life cycle costs applicable to certain measures such as green roofs Refer to Table 15 for details on direct benefits for extreme heat hazards
III EVALUATION OF PROJECT BENEFITS
NYC Mayorrsquos Office of Recovery and Resiliency Climate Resiliency Design Guidelines
29IIIB CATEGORIES OF PROJECT BENEFITS
bull Indirect Benefits include reduced or avoided service losses for non-residential
buildings public facilities andor infrastructure (utilities roads and bridges) based on the value of service continuity andor emergency services to New Yorkers that can be quantified as a secondary result of implementing a specific hazard mitigation measure Table 13 in Appendix 4 provides a list of indirect benefits and basic guidance on estimating and documenting values for sea level rise and increased precipitation-related flood hazards Note that given the current state of practice on extreme heat it is not possible to quantify reduced or avoided service losses that result from a specific extreme heat mitigation measures Therefore indirect benefits applicable to extreme heat hazards are limited to reduced energy costs such as cool roofs green roofs or shade trees Refer to Table 15 in Appendix 4 for details on indirect benefits for extreme heat hazards
bull Other Benefits where applicable other potential benefits may include social benefits for residents such as avoided stress and anxiety avoided lost productivity environmentalecosystem service benefits avoided need for emergency services and other potential benefits that can be estimated as a result of implementing a specific hazard mitigation measure Table 14 in Appendix 4 provides a list of other potential benefits and basic guidance on estimating and documenting values for sea level rise and increased precipitation-related flood hazards
Note on the ecosystem service benefit category in Table 14 the stormwater management benefits of green infrastructure should be distributed between the extreme heat and increased precipitation hazards since these measures provide both significant reductions in rainfall runoff as well as Urban Heat Island mitigation through evapotranspiration However there is currently limited data available to quantify the actual distribution of stormwater management benefits between the two hazards For various dual-benefit providing interventions careful considerations should be given to identify the appropriate benefits category provided by the intervention with a goal to avoid duplication of quantified benefits In this methodology the stormwater management benefits of green infrastructure are applied to the increased precipitation hazard in order to avoid a duplication of benefits Note on real estate and quality of life benefits additionally it is important to note that two potential benefit categories shown in Table 14 - real estate and quality of lifehealthavoided casualties - were not included in the current BCA methodology for sea level rise or increased precipitation hazards Although these categories could increase project benefits for sea level rise and increased precipitation hazards they were only applied to measures that address extreme heat hazards such as green roofs trees and other plantings Refer to Table 15 for a detailed summary of other benefit categories quantified as unit benefits for extreme heat hazards
NYC Mayorrsquos Office of Recovery and Resiliency Climate Resiliency Design Guidelines
30IIIC WHICH METHODOLOGY TO USEIIID BCA METHODOLOGY FOR PROJECTS UNDER $50 MILLION
D BCA methodology for projects under $50 millionThe project design team should develop design alternatives to meet the Guidelinesrsquo criteria which may be in excess of NYC code and standards requirements (baseline conditions) It is assumed that the project design team will develop alternatives to address each of the following applicable climate stressors - sea level risecoastal storm surge increased precipitation and extreme heat - separately Tables 12-15 in Appendix 4 provides a list of typical direct indirect and other benefits provided by various intervention typologies to reduce impacts from climate stressors During the qualitative assessment the project design team should consider that intervention strategies will have varying levels of reliability effectiveness benefits and cost implications during the qualitative assessment
The project design team is recommended to develop appropriate evaluation criteria and metrics for each of the applicable project benefit categories For each alternative the project design team could use either a scoring weighting ranking or other type of qualitative assessment framework to assess each applicable project benefit categories with the developed evaluation criteria and metrics Table 6 provides an example template to evaluate alternatives using a set of general evaluation criteria and metrics using a color-coded rating system (and see Table 7 for an example of how to complete the template) The project design team can utilize a similar template customized to their project goals and objectives This assessment allows agencies to screen the qualitative benefits for various alternatives that would then lead to development of final project components to match the available budget and goals of the project
Projects with total costs below $50 million recommended to conduct a qualitative assessment to identify the optimal interventions that meet Guidelinesrsquo design criteria using the ldquoD) BCA methodology for projects under $50 millionrdquo methodology below
C WHICH METHODOLOGY TO USEProjects with a total cost above $50 million or are highly complex or critical facilities recommended to conduct both a qualitative and quantitative benefit calculation to identify the optimal interventions that meet Guidelinersquos design criteria using the ldquoE) BCA methodology for projects above $50 millionrdquo below A quantitative BCA also must include qualitative factors
NYC Mayorrsquos Office of Recovery and Resiliency Climate Resiliency Design Guidelines
31IIID BCA METHODOLOGY FOR PROJECTS UNDER $50 MILLION
Qualitative Color Scale Green=Least resource intensive alternative Purple=most resource intensive yellow=medium level of resource intensity
Qualitative Evaluation Factors Description Relative Color Rating System
First CostsAdditional construction costs needed to incorporate Guidelinesrsquo recommended resilient design over the baseline project costs
Highest cost ($$$) rated as Purple whereas lowest cost ($) rated as Green
ConstructabilityEase of Implementation
Construction techniques and site conditions such as presence of major utilities conflicts and other conditions which dictate the level of constructability required for each alternative
Difficult to construct rated as Purple whereas easiest to construct rated as Green
Environmental ImpactsCo-BenefitsPermitting
Impacts to the built and natural environment such as circulation noise and hazardous waste plus the level of effort required for permitting (eg interventions in water require highest level of permitting requirement) from each alternative in addition to the baseline project condition
Highest environmental impacts and highest level of effort required for permitting rated as Purple whereas the least impact and level of effort rated as Green
Operation and Maintenance (OampM)
Level of effort of additional manpower and cost of OampM for the alternatives over the baseline project OampM requirements
Highest level of effort and cost for OampM rated as Purple whereas the lowest is rated as Green
Reliability and Durability
Interventions that do not require human involvement or a facilityrsquos ability to withstand all the forces during a storm event (eg permanent solutions with higher reliability than deployable solution)
Interventions requiring human involvement (active measures) rated as Purple whereas interventions with minimal or no human involvement (passive measures) rated as Green
Risk Reduction Benefits Monetary benefits provided by each intervention alternative in avoided damages over the baseline condition
Lowest potential monetary benefit rated as Purple whereas as highest potential monetary benefit rated as Green
Quality of Life BenefitsVisual Aesthetics
Benefits either to the community such as recreation or safety or serve the community during emergency situations
Lowest potential quality of life benefits rated as Purple whereas as highest potential benefits rated as Green
Table 6 ndash Evaluation matrix for comparison of mitigation alternatives across the useful life of a project
Project title_______________________________________________________________________________
Evaluation Criteria
Baseline Condition (Designed to NYC Building Code and
Standards)
Resilient Design Alternatives for Managing__________________
Alternative 1
Alternative 2
Alternative 3
First Costs
ConstructabilityEase of ImplementationEnvironmental ImpactsCo-BenefitsPermitting
Operation and Maintenance (OampM)
Reliability and Durability
Risk Reduction Benefits
Quality of Life BenefitsVisual Aesthetics
NYC Mayorrsquos Office of Recovery and Resiliency Climate Resiliency Design Guidelines
32IIID BCA METHODOLOGY FOR PROJECTS UNDER $50 MILLION
Table 7 ndash Evaluation matrix for comparison of mitigation alternatives across the useful life of a project - COMPLETED EXAMPLE
Evaluation Criteria
Baseline Condition (Designed to NYC Building Code and
Standards)
Resilient Design Alternatives for Managing Coastal SurgeSLR
Alternative 1Flood proof building built on grade to Guidelines
DFE
Alternative 2 Elevate building structure above Guidelinesrsquo DFE
on columns
Alternative 3 Raise site grade by filing the building site footprint
to Guidelinesrsquo DFE
First CostsBaseline cost for building structure is $15 million
Incremental costs are within 5 over the baseline costs
Incremental costs are between 5-10 over baseline costs
Incremental costs are 20 and more over baseline costs
ConstructabilityEase of Implementation
Relatively easy to construct within site constraints
Similar to baseline conditions since construction requires additional flood proofing only
Moderate challenges to construct foundation structure for columns within site constraints
Extremely challenging to construct within the site constraints Potentially fatal flaw
Environmental ImpactsCo-BenefitsPermitting
No major impacts but may require additional effort to obtain DOB permits with flood proofing and deployable systems
No major impacts but may require additional effort to obtain DOB permits with flood proofing and deployable systems
No major impacts and relatively easy to permit
Potential drainage circulation impacts and challenges to obtain clean fill material for the site
Operation and Maintenance (OampM)
Major OampM costs associated with deployable systems
Major OampM costs associated with deployable systems
Moderate OampM costs associated with proposed elevator for access
Minimal OampM costs since deployable and elevators not required
Reliability and Durability
Least reliability with highest potential risk from flooding during to failure of deployable systems
Least reliability with highest potential risk from flooding during to failure of deployable systems
Moderate reliability with potential risk from flooding limited to elevator shaft only
Highest reliability since deployable are not required to protect building from flooding
Risk Reduction Benefits
Maximum flood risk reduction benefits assuming deployable and flood proofing is effective
Maximum flood risk reduction benefits assuming deployable and flood proofing is effective
Maximum flood risk reduction benefits
Maximum flood risk reduction benefits
Quality of Life BenefitsVisual Aesthetics
Facility may not be operational during the storm event
Facility may not be operational during the storm event
Facility can be potentially operational during the storm event
Facility can be potentially operational during the storm event
Qualitative Color Scale Green=Least resource intensive alternative Purple=most resource intensive yellow=medium level of resource intensity
A new non-critical facility with a building structure is proposed on a site that is currently in the 2015 Preliminary FEMA 1 annual chance floodplain with a BFE of 10rsquo (NAVD 88) The baseline conditions DFE to meet existing NYC codes and standards is 11rsquo (NAVD 88) Using the Guidelines recommended design criteria the facilityrsquos DFE is 133rsquo (NAVD 88) and existing grade is around 6rsquo (NAVD 88) The project design team develops three alternatives to meet the Guidelinesrsquo recommended DFE design for the facility Table 7 offers an example of how a qualitative assessment can be used to compare three resilient design alternatives using the evaluation criteria and metrics
CASE STUDY Example of How to Use the Evaluation Matrix
NYC Mayorrsquos Office of Recovery and Resiliency Climate Resiliency Design Guidelines
33IIIE BCA METHODOLOGY FOR PROJECTS OVER $50 MILLION
E BCA methodology for projects over $50 millionIn order for a project to be considered cost-effective a benefit-cost analysis (BCA) assesses if the benefits of a project outweigh its costs or in other words the benefit-cost ratio (BCR) is greater than 10 as illustrated in Equation 1
Equation 1 Benefit-Cost Ratio Formula
BCR =
Where BCR = Benefit-Cost Ratio
BENEFITS = Total project benefits
COSTS = Total project costs
BENEFITSCOSTS
These estimated project benefits are combined with the project costs which are defined as the differential construction and long-term operation and maintenance costs associated with constructing a proposed project to the Guidelinesrsquo recommended design level It is assumed that the baseline project will be designed to the most prevalent NYC codes and standards This benefit methodology should be used to determine the additional project benefit that the Guidelinesrsquo recommended design would provide over the baseline project benefit It is assumed that the project design team will develop alternatives to address each of the following applicable climate stressors - sea level risecoastal storm surge increased precipitation and extreme heat - separately For each alternative the project design team should use the following steps to determine the Benefit-Cost Ratio (BCR)
a) Determine project useful life for design interventions Determining the useful life of the proposed project is an important first step in the
detailed BCA assessment methodologies for two reasons First the project useful life determines what values must be used from the Guidelines to establish the future climate design conditions The various hazard tables in the Guidelines establish design requirements based on useful life ranges through 2039 2040-2069 2070-2099 and 2100+ (2100+ projections are only available for sea level rise) A review of these tables show that the design requirements needed to meet the projected climate hazards increase as the end of useful life range increases Second the useful life determines how long the project will need to be operated and maintained in order to remain technically sound and effective at reducing future damages and losses
b) Determine discount rate for project benefits calculation The cost-effectiveness of projects assessed using the BCR must be done on a net
present value basis meaning the present value of the benefits is compared to the present value of the costs Most project costs are computed for present value based on current cost estimates bids or cost guidance However project benefits - as well as project costs for operation and maintenance - accrue over time into the future and are computed on an annualized basis To address this issue the Present Value Coefficient (PVC) is used to bring these annualized project benefits and OampM costs into the present value As indicated by the formula in Equation 2 the PVC is a function of the Project Useful Life (PUL) and the Discount Rate (DR)
NYC Mayorrsquos Office of Recovery and Resiliency Climate Resiliency Design Guidelines
34
Equation 2 Present Value Coefficient (PVC) Formula
PVC =
Where PVC = Present Value Coefficient
PUL = BCA Project Useful Life based on project type
DR = Discount Rate
The project design team should coordinate with agencies and NYC OMB if needed to determine appropriate discount rates based on funding source project type and other factors This coordination should take place during project initiation phase where total project costs (design and construction) are over $50 million66
c) Develop input data to perform benefit calculations Tables 16 and 17 in Appendix 4 provide a list of typical input data by each climate
stressor needed to perform benefit analysis quantitatively on variety of facilities67 The project design team should use these tables as a reference to identify appropriate input data categories andor additional input data needed to perform benefit analysis on the project
d) Identify applicable project benefit categories to estimate benefits Tables 16 and 17 in Appendix 4 provide a list of typical project benefits by each climate
stressor needed to perform benefit analysis quantitatively on various types of projects The project design team should use these tables as a reference to identify appropriate project benefit categories for each climate stressor to perform benefit analysis on the project
e) Calculate benefits of recommended design interventions for each climate
stressor The input data and applicable project benefits can be assembled along with
incremental project cost data to analyze cost-effectiveness using the FEMA BCA Tool Damage-Frequency Assessment (DFA) module or similar software This analysis will provide a BCR for each alternative which can then be used to compare the alternatives that were developed to mitigate effects from applicable climate stressors The project design team can then use the results from this analysis to identify optimal interventions that provides a balanced solution that provides resiliency benefits within the available project budget
IIIE BCA METHODOLOGY FOR PROJECTS OVER $50 MILLION
[1 ndash (1 + DR) -(PUL)]DR
66 For example a NYC OMB March 2015 memorandum recommends using an annually updated DR as published each year in Appendix C of OMB Circular A-94 The current OMB-recommended discount rates from OMB A-94 Appendix C vary by project useful life and are as follows 21 DR for useful lives of 10 to 19 years 25 DR for useful lives of 20 to 29 years and 28 DR for useful lives of 30 years or greater By contrast FEMA hazard mitigation grants use a DR of 70 for all projects based on the Federal OMB A-94 rate for federally-funded mitigation measures Since these DRs will impact the PVC and the project benefits the project team must ensure that BCA results prepared using an OMB-recommended DR (21 to 28) be updated to reflect the Federal DR (70) when applying for FEMA mitigation grant funds
67 Note the data requirements for the sea level rise and increased precipitation hazards in Table 16 are more detailed than the requirements for the extreme heat hazards due to the less detailed level of analysis available for extreme heat
NYC Mayorrsquos Office of Recovery and Resiliency Climate Resiliency Design Guidelines
35
APPENDICES
NYC Mayorrsquos Office of Recovery and Resiliency Climate Resiliency Design Guidelines
36APPENDIX 1 ndash KEY TERMS
100-year flood (1 annual chance flood)
A flood that has a 1 probability of occurring in any given year The 100-year floodplain is the extent of the area of a flood that has a 1 chance of occurring or being exceeded in any given year
500-year flood (02 annual chance flood)
A flood that has a 02 probability of occurring in any given year The 500-year floodplain is the extent of the area of a flood that has a 02 chance of occurring or being exceeded in any given year
AdaptationAdjustment in natural or human systems to a new or changing environment that seeks to maximize beneficial opportunities or moderate negative effects Successful adaptations contribute to resiliency
Base flood elevation (BFE)The elevation of surface water resulting from a flood that has a 1 annual chance of occurring or being exceeded in any given year The BFE is shown on the Flood Insurance Rate Map (FIRM)69
BluebeltReference to the Department of Environmental Protectionrsquos (DEP) Bluebelt program to preserve natural drainage corridors including streams ponds and other wetland areas Preservation of these wetland systems allows them to perform their functions of conveying storing and filtering storm water
Climate
The average weather (or more rigorously a statistical description of the average in terms of the mean and variability) over a period of time usually 30 years These quantities are most often surface variables such as temperature precipitation and wind Climate in a wider sense is the state including a statistical description of the climate system70
Climate change
Changes in average weather conditions that persist over multiple decades or longer Climate change encompasses both increases and decreases in temperature as well as shifts in precipitation changing risk of certain types of severe weather events and changes to other variables of the climate system
Climate change riskThe chance that investments (such as in capital projects) can be affected by the physical impacts of climate change71 Risks are evaluated as a product of the probability of occurrence and the magnitude of damages or impacts including socioeconomic factors that would result if they did occur (consequences)
Climate change risk assessment
This assessment involves a detailed project-specific analysis that includes a vulnerability and risk assessment often followed by cost-benefit analysis to assess and select investments in climate change risk mitigation Risk is assessed as a function of the magnitude and probability of a given climate change hazard Examples resources are included in Appendix 7
Climate vulnerabilityThe degree to which systems and populations are affected by adverse impacts It is a function of the character magnitude and rate of climate change and variation to which a system is exposed its sensitivity and its adaptive capacity72
Cloudburst An extreme amount of rain in a short period of time often over a small geographic area73
Cooling Degree Day (CDD) A form of degree-day used to estimate the energy requirements for air conditioning or refrigeration when the daily mean temperature is above 65degF
68 All terms are from the US Global Change Research Program (USGCRP) glossary unless otherwise noted The USGCRP glossary is available at httpwwwglobalchangegovclimate-changeglossary
69 ldquoDefinitionsrdquo FEMA last modified March 1 2017 httpswwwfemagovnational-flood-insurance-programdefinitions70 UKCIP Glossary httpwwwukciporgukglossary71 ldquoAccount for Climate Riskrdquo International Finance Corporation 72 UKCIP Glossary httpwwwukciporgukglossary73 New York City Environmental Protection ldquoCloudburst Resiliency Planning Studyrdquo 2017 Available at httpwwwnycgovhtmldeppdfclimatenyc-cloudburst-studypdf
APPENDIX 1 - KEY TERMS68
NYC Mayorrsquos Office of Recovery and Resiliency Climate Resiliency Design Guidelines
37APPENDIX 1 ndash KEY TERMS
Design life The life expectancy of an asset or product as determined during design74 As opposed to useful life (see below)
Dry Bulb temperature The ambient air temperature measured by a thermometer
Extreme eventUnexpected unusual or unpredictable weather or flooding compared to historical or future projected distribution Extreme events include for example heat waves cold waves heavy rains periods of drought and flooding and severe storms
Facilities For the purposes of this document ldquofacilitiesrdquo refers to all types of buildings housing infrastructure structures and landscape features designed by or for the City of New York
Flexible adaptation pathwayResilience-building strategies that can evolve or be adapted over time as climate change risk assessments evaluations of adaptation strategies and monitoring continue75
Flood Insurance Rate Maps (FIRM)
Official flood map of a community on which FEMA has delineated the 1 annual chance floodplain and the base flood elevations (BFEs) applicable to the community76 The FIRM also includes the 02 floodplain annual chance floodplain and differentiates between special flood hazard areas (V A Coast A zones) and floodways The official FIRM is from the year 2007 while the 2015 PFIRM is currently required by NYC Building Code to calculate design flood elevations NYC DOB references the more restrictive of the two maps in both base flood elevation and flood hazard area (ie V versus A zone) Refer to Appendix 3 for more information
FreeboardAn additional amount of height above the base flood elevation used as a factor of safety (eg two feet above the base flood) in determining the level at which a facilitys lowest floor must be elevated or floodproofed to be in accordance with state or community floodplain management regulations77
Future time slices
Future periods defined by the NPCC for when climate change projections are available In this document the following decadal projections are associated with specific time spans2020s projection = present to 20392050s projection = 2040 to 20592080s projection = 2070 to 20992100s projection = end of century and beyond
Green infrastructureAn array of practices that use or mimic natural systems to manage urban stormwater runoff Water is either directed to engineered systems for infiltration or detained for longer periods before it enters the sewer system
Heat Vulnerability Index (HVI)Summarizes relative risk of adverse health effects from heat due to social and environmental factors Used to identify neighborhoods at higher risk during and after extreme heat events
Heat wave A period of three consecutive days where temperatures rise above 90degF or two consecutive days over 95 degrees78
New York City Panel on Climate Change (NPCC)
The body of leading climate and social scientists charged with making climate change projections for the metropolitan region79
74 Sustainable Infrastructure Management Program Learning Environment httpsimplewerforg 75 Rosenzweig C et al Climate Change Adaptation in New York City Building a Risk Management Response76 ldquoDefinitionsrdquo FEMA77 Ibid78 Horton R et al New York City Panel on Climate Change 2015 Report Chapter 1 Climate Observations and Projections Ann NY
Acad Sci ISSN 0077-8923 (New York 2015) 2579 For more information on the NPCC visit www1nycgovsiteorrchallengesnyc-panel-on-climate-changepage
NYC Mayorrsquos Office of Recovery and Resiliency Climate Resiliency Design Guidelines
38APPENDIX 1 ndash KEY TERMS
Open-grid pavement system
Pavements that consist of loose substrates supported by a grid of a more structurally sound grid or webbing Unbounded loose substrates in these systems transfer and store less heat than bound and compacted pavements and aid permeability Pavement is 50 pervious and contains vegetation in the open cells designed to allow percolation or infiltration of storm water through the surface into the soil below80
Preliminary Flood Insurance Rate Map (PFIRM)
Preliminary flood map developed by FEMA in 2015 for New York City that provides projected risks for flood hazards81 Refer to Appendix 3 for more information
Project useful life (PUL)
The period over which an asset or component is expected to be available for use by an entity This depends on regular and adequate maintenance This period of time typically exceeds the design life (see above) The combined effect of operational requirements and useful life is practical in assessing an investment in improving resilience82
Rain gardenAlso called ldquobioswalerdquo Planted areas designed to collect and manage stormwater that runs off streets sidewalks commercial and residential rooftops and other sources when it rains
Resiliency The ability to bounce back after change or adversity The capability of preparing for responding to and recovering from difficult conditions83
Sea level rise-adjusted design flood elevation
As defined in these Guidelines the increased height of the base flood elevation due to sea level rise plus freeboard depending on the criticality of the facility The sea level rise adjustment depends on the useful life of the facility
Storm surge An abnormal rise of water generated by a storm over and above predicted astronomical tides84
Substantial improvementAny repair reconstruction rehabilitation addition or improvement of a building or structure the cost which equals or exceeds 50 of the market value of the structure before the improvement or repairs started For more information see Appendix G of the NYC Building Code and 1 RCNY sect3606-0185
Tidal inundation Flooding which occurs at high tides due to climate-related sea level rise land subsidence andor the loss of natural barriers86
Urban Heat Island (UHI) effectThe tendency for higher air temperatures to persist in urban areas as a result of heat absorbed and emitted by buildings and asphalt tending to make cities warmer than the surrounding suburban and rural areas
Weather The state of the atmosphere at a given time with regard to temperature cloudiness precipitation wind and other meteorological conditions87
Wet Bulb temperatureThe temperature indicated when a thermometer bulb is covered with a water-saturated wick over which air is caused to flow at approximately 45 ms (900 ftmin) to reach the equilibrium temperature of water evaporating into the air when the heat of vaporization is supplied by the sensible heat of the air88
80 ldquoGlossaryrdquo US Green Building Council (2017) Available at httpwwwusgbcorgglossaryterm552581 ldquoPreliminary FEMA Map Productsrdquo FEMA Map Service Center Available at httpshazardsfemagovfemaportalprelimdownload82 ldquoGlossaryrdquo International Infrastructure Management Manual (2011) 83 A Stronger More Resilient New York (2013) 184 ldquoStorm Surge Overviewrdquo National Hurricane Center NOAA Available at httpswwwnhcnoaagovsurge85 ldquoFlood Resistant Constructionrdquo Appendix G New York City Building Code (2008) and 1 RCNY sect3606-01 available at httpswww1nycgovassetsbuildingsrules1_RCNY_3606-01pdf86 ldquoOcean Factsrdquo National Ocean Service NOAA Available at httpoceanservicenoaagovfactsnuisance-floodinghtml 87 UKCIP Glossary httpwwwukciporgukglossary88 ldquoASHRAE Terminologyrdquo ASHRAE Available at httpswwwashraeorgtechnical-resourcesauthoring-toolsterminology
NYC Mayorrsquos Office of Recovery and Resiliency Climate Resiliency Design Guidelines
39APPENDIX 2 - CLIMATE CHANGE PROJECTIONS
Climate change projections are provided by the New York City Panel on Climate Change (NPCC) The full NPCC report is available from the New York Academy of Sciences89 Tables 8-10 (below) were reproduced directly from the NPCC report while Table 2 (see Section IIA) was developed using the data underlying the NPCC report to inform the design of HVAC systems under warmer conditions
Table 8 ndash NYC sea level rise projections90
Baseline (2000-2004) 0 in
Low estimate (10th percentile)
Middle range (25th to 75th percentile)
High estimate (90th percentile)
2020s 2 in 4-8 in 10 in
2050s 8 in 11-21 in 30 in
2080s 13 in 18-39 in 58 in
2100 15 in 22-50 in 75 in
Note Projections are based on six-component approach that incorporates both local and global factors The model-based components are from 24 global climate models and two representative concentration pathways Projections are relative to the 2000-2004 base period
Table 9 ndash Mean annual changes91
a Temperature Baseline(1971-2000) 54degF
Low estimate (10th percentile)
Middle range (25th to 75th percentile)
High estimate (90th percentile)
2020s + 15degF +20-29degF +32degF
2050s +31degF +41-57degF +66degF
2080s +38degF +53-88degF +103degF
2100 +42degF +58-104degF +121F
b Precipitation Baseline(1971-2000) 501 in
Low estimate (10th percentile)
Middle range (25th to 75th percentile)
High estimate (90th percentile)
2020s -1 percent +1-8 +10
2050s +1 percent +4-11 +13
2080s +2 percent +5-13 +19
2100 -6 percent -1 to +19 +25
Note Based on 35 global climate models (GCMs) and two RCPs Baseline data cover the 1971ndash2000 base period and are from the NOAA National Climatic Data Center (NCDC) Shown are the low estimate (10th percentile) middle range (25th percentile to 75th percentile) and high estimate (90th percentile) These estimates are based on a ranking (from most to least) of the 70 (35 GCMs times 2 RCPs) projections The 90th percentile is defined as the value that 90 percent of the outcomes (or 63 of the 70 values) are the same or lower than Like all projections the NPCC climate change projections have uncertainty embedded within them Sources of uncertainty include data and modeling constraints the random nature of some parts of the climate system and limited understanding of some physical processes The NPCC characterizes levels of uncertainty using state-of-the-art climate models multiple scenarios of future greenhouse gas concentrations and recent peer-reviewed literature Even so the projections are not true probabilities and the potential for error should be acknowledged
89 The NPCC 2015 report is available at httponlinelibrarywileycomdoi101111nyas20151336issue-1issuetoc90 From New York City Panel on Climate Change 2015 Report Chapter 1 Climate Observations and Projections page 4191 From New York City Panel on Climate Change 2015 Report Chapter 1 Climate Observations and Projections page 30
APPENDIX 2 - CLIMATE CHANGE PROJECTIONS
NYC Mayorrsquos Office of Recovery and Resiliency Climate Resiliency Design Guidelines
40APPENDIX 2 - CLIMATE CHANGE PROJECTIONS
Table 10 ndash Extreme events92
2020s Baseline (1971-2000)
Low estimate(10th percentile)
Middle range(25th to 75th percentile)
High estimate (90th percentile)
Numbers of heat waves per year 2 3 3-4 4
Average heat wave duration (days) 4 5 5 5
Number of days per year with
Maximum temperature at or above 90degF 18 24 26-31 33
Maximum temperature at or above 100degF 04 07 1-2 2
Minimum temperature at or below 32degF 71 50 52-58 60
Rainfall at or above 1 inch 13 13 14-15 16
Rainfall at or above 2 inches 3 3 3-4 5
Rainfall at or above 4 inches 03 02 03ndash04 05
2050s Baseline (1971-2000)
Low estimate(10th percentile)
Middle range(25th to 75th percentile)
High estimate (90th percentile)
Numbers of heat waves per year 2 4 5-7 7
Average heat wave duration (days) 4 5 5-6 6
Number of days per year with
Maximum temperature at or above 90degF 18 32 39-52 57
Maximum temperature at or above 100degF 04 2 3-5 7
Minimum temperature at or below 32degF 71 37 42-48 52
Rainfall at or above 1 inch 13 13 14-16 17
Rainfall at or above 2 inches 3 3 4-4 5
Rainfall at or above 4 inches 03 03 03-04 05
2080s Baseline (1971-2000)
Low estimate(10th percentile)
Middle range(25th to 75th percentile)
High estimate (90th percentile)
Numbers of heat waves per year 2 5 6-9 9
Average heat wave duration (days) 4 5 5-7 8
Number of days per year with
Maximum temperature at or above 90degF 18 38 44-76 87
Maximum temperature at or above 100degF 04 2 4-14 20
Minimum temperature at or below 32degF 71 25 30-42 49
Rainfall at or above 1 inch 13 14 15-17 18
Rainfall at or above 2 inches 3 3 4-5 5
Rainfall at or above 4 inches 03 02 03-05 07
Note Projections for temperature and precipitation are based on 35 GCMs and 2 RCPs Baseline data are for the 1971 to 2000 base period and are from the NOAA National Climatic Data Center (NCDC) Shown are the low estimate (10th percentile) middle range (25th to 75th percentile) and high estimate (90th percentile) 30-year mean values from model-based outcomes Decimal places are shown for values less than one although this does not indicate higher precisioncertainty Heat waves are defined as three or more consecutive days with maximum temperatures at or above 90degF Like all projections the NPCC climate change projections have uncertainty embedded within them Sources of uncertainty include data and modeling constraints the random nature of some parts of the climate system and limited understanding of some physical processes The NPCC characterizes levels of uncertainty using state-of-the-art climate models multiple scenarios of future greenhouse gas concentrations and recent peer-reviewed literature Even so the projections are not true probabilities and the potential for error should be acknowledged
92 From New York City Panel on Climate Change 2015 Report Chapter 1 Climate Observations and Projections page 31
NYC Mayorrsquos Office of Recovery and Resiliency Climate Resiliency Design Guidelines
41APPENDIX 3 - DIFFERENTIATION OF FLOOD MAPS
These Guidelines reference several different kinds of flood maps and sources of design flood elevations These maps are described and differentiated below
Table 11 - Differentiation of flood maps used in NYC
Reference Title Data Source Information Provided Referenced By Link
2007 FIRM FEMA
Based on historical data from before 1983 identifies the current base flood (extent and elevation) as the flood that has a 1 chance of occurring in any given year also known as a 100-year flood The NYC Building Code requires that either the 2007 FIRM or 2015 PFIRM elevation be used whichever is higher
2014 NYC Building Code Appendix G
Climate Resiliency Design Guidelines
httpsmscfemagovportal
2015 PFIRM FEMA
Based on historical data identifies the current base flood (extents and elevation) as the flood that has a 1 chance of occurring in any given year also known as a 100-year flood The NYC Building Code requires that either the 2007 FIRM or 2015 PFIRM elevation be used whichever is higher The 2015 PFIRM is currently being reassessed by FEMA
2014 NYC Building Code Appendix G
Climate Resiliency Design Guidelines
httpshazardsfemagovfemaportalprelimdownload
httpwwwregion2coastalcomview-flood-maps-dataview-preliminary-flood-map-data
NYC Flood Hazard Mapper
NYC Department of City Planning
Maps current and future flood hazards in NYC including the following data layers 2007 FIRM and 2015 PFIRM high tide with sea level rise and PFIRM with sea level rise through 2100
Climate Resiliency Design Guidelines
Waterfront Revitalization Plan
httpwww1nycgovsiteplanningdata-mapsflood-hazard-mapperpage
ldquoTable 4 ndash Determine the sea level rise-adjusted design flood elevation for critical and non-critical facilitiesrdquo
ORR amp NPCC
Provides data to use when adding sea level rise to a given 2015 PFIRM or 2007 FIRM Base Flood Elevation (BFE) to calculate a Design Flood Elevation (DFE) Based on the criticality and expected useful life of a facility
Climate Resiliency Design Guidelines
See Section II on ldquoSea Level Riserdquo above
APPENDIX 3 - DIFFERENTIATION OF FLOOD MAPS
NYC Mayorrsquos Office of Recovery and Resiliency Climate Resiliency Design Guidelines
42APPENDIX 4 - PROJECT BENEFITS CATEGORIES
This appendix provides guidance on how to identify and assess benefits as a supplement to Sections IIID and IIIE
Table 12 lists typical direct benefits for reducing impacts from climate stressors and basic guidance for how to estimate them See Section IIID for more information
Table 13 lists typical indirect benefits for reducing impacts from climate stressors and basic guidance for how to estimate them See Section IIID for more information
Table 12 ndash Direct benefits for (1) sea level rise with coastal storm surge and (2) increased precipitation measures
Direct Benefit Basic Guidance for Estimating Values
Physical Damages (Structure Contents)
bull For flood-damaged buildings use depth damage functions developed by FEMA and USACE for structures and contents
bull Use depth damage functions in conjunction with Building Replacement Values (BRVs) and not market values BRVs typically range between $100 to $325SF for residential buildings and $120 to $450SF for commercial public buildings
bull For more complex structures or facilities use engineering estimates of flood damages or review historic flood damages documented from insurance claims repair records or FEMA Public Assistance claims from recent flood disasters
Residential Displacements
bull For flood-damaged buildings use depth damage functions developed by FEMA and USACE for residential displacements
Reduced Life CycleOperation and Maintenance (OampM) Costs93
bull Applicable only to projects that reduce overall life cycle costs or net annual OampM costs from baseline conditions
bull Input reduced annual OampM costs as a project benefit at a 1-year recurrence intervalbull Reduced overall life cycle costs can be input as a longer project useful life
Table 13 ndash Indirect benefits for (1) sea level rise with coastal storm surge and (2) increased precipitation measures
Indirect Benefit Basic Guidance for Estimating Values
Non-Residential Building Service Losses
bull Estimate service loss values and durations for non-residential buildings public buildings critical facilities and parksnatural features based on FEMA BCA guidance and standard values based on building use
Utility Service Losses94
bull Estimate utility service losses for water wastewater and electrical facilities based on the number of impacted customers FEMA per capita standard values for utility service ($105personday for potable water $49personday for wastewater $148personday for electrical)95
bull Estimate utility service loss durations based on engineering estimates or review historic flood damages losses documented from utility company records
bull This benefit can also apply to measures that increase energy efficiency
RoadBridge Service Losses
bull Estimate roadbridge service losses based on the average daily traffic (ADT) detour time and additional travel distance and FEMA and GSA standard values for road service ($3344vehiclehour of delay $0545mile)96
bull Estimate roadbridge service loss durations or review historic flood damages losses
Emergency Service Losses
bull Applicable only to projects that reduce or eliminate documented emergency service costs from baseline conditions
bull Examples of avoided emergency services costs include NYPD staffing to monitor barricades for flooded roads or NFDY staffing for water rescues of residents from flooded buildings or streets
APPENDIX 4 - PROJECT BENEFITS CATEGORIES
93 Reduced life cycle costs may be applicable to some measures that provide extreme heat benefits such as green roofs that can last longer than a standard roof if properly maintained
94 Reduced utility service costs may be applicable to some measures that provide extreme heat benefits such as cool roofs green roofs and shade trees
95 FEMA per capita standard values taken from FEMA BCA Toolkit Version 530 (Build Date 12222016) and developed in FEMArsquos Baseline Standard Economic Value Methodology Report (July 28 2016) Consider updating FEMA standard per capita values to reflect current New York City utility rates
96 Consider updating FEMA and GSA standard values to reflect current New York City area labor rates and fuel costs
NYC Mayorrsquos Office of Recovery and Resiliency Climate Resiliency Design Guidelines
43APPENDIX 4 - PROJECT BENEFITS CATEGORIES
Table 14 ndash Other potential benefits for (1) sea level rise with coastal storm surge and (2) increased precipitation measures
Other Benefit Basic Guidance for Estimating Values
Avoided Stress and Anxiety
bull Applicable only for projects that directly benefit occupants of residential structuresbull Use FEMA standard value for avoided mental stress and anxiety treatment costs of $2443person to
estimate benefit for all impacted residents97
Avoided Lost Productivity
bull Applicable only for projects that directly benefit occupants of residential structuresbull Use FEMA standard value for avoided lost worker productivity costs of $8736household to estimate
benefit for all impacted workers (conservatively assuming one worker per household)
Environmental Open Space
bull Applicable only for projects that create or acquire open space areas by acquisitionbull Use FEMA standard value for environmental open space based on the type of land acquired ($8308
Acreyear for Green open space $39545Acreyear for Riparian $6010Acreyear for Wetlands $554Acreyear for Forests $1799Year for Marine and estuary)97
CSO Volume Reduction
bull Applicable only for projects that provide Combined Sewer Overflow (CSO) abatement by reducing the volume of rainfall runoff
bull Use CSO abatement cost of $0015gallonsyear applied to increased precipitation hazard runoff volume for 5-year design storm98
Ecosystem Service99
bull Add stormwater management benefits of green infrastructure projects to increased precipitation hazards where avoided damages and service losses are not quantified
bull Unit benefits applicable to increased precipitation hazard includeo Green roofs $0133SFyear (PUL 40 years)o BioswaleRain GardenMeadow Mix $0020SFyear (PUL 30 years)o Permeable Grass Pavers $0020SFyear (PUL 30 years)o Tree Plantings $303Treeyear (PUL 30 years)o Planter Box Trees $101Treeyear (PUL 15 years)
Real Estate99
bull Potential real estate benefits from increased resilience of residential andor commercial propertiesstreetscapesneighborhoods included within the project scope
bull Benefit applied to extreme heat hazard for green infrastructure projects directly impacting residential or commercial properties
Quality of Life Health Benefits99
bull Potential quality of life benefits related to improved public health from the resilience measures included within the project scope
bull Benefit applied to extreme heat hazard for green infrastructure projects directly impacting residential or commercial properties
Table 14 lists other typical benefits for reducing impacts from climate stressors and basic guidance for how to estimate them See Section IIID for more information
97 FEMA standard values for avoided mental stress and anxiety and environmental open space values taken from FEMA BCA Toolkit Version 530 (Build Date 12222016)
98 CSO abatement cost taken from APG1 Report for NYC ldquoTechnical Approaches for Benefit-Cost Analysis of Hazard Mitigation Projects in Urban and Coastal Environmentsrdquo (April 2016)
99 Ecosystem Services Real Estate and Quality of LifeHealth benefits tend to be more applicable to green infrastructure measures that provide extreme heat benefits such as green roofs trees and other plantings
NYC Mayorrsquos Office of Recovery and Resiliency Climate Resiliency Design Guidelines
44APPENDIX 4 - PROJECT BENEFITS CATEGORIES
Table 15 ndash Potential benefits for extreme heat (Urban Heat Island) reduction measures
Category Benefit Basic Guidance for Estimating Values
Direct Benefit
Reduced Life Cycle Cost
bull Applicable only to measures such as green roofs that are expected to last longer than standard roofs
bull Compute total cost savings including annual OampM costs
Indirect Benefit
Energy Savings
bull Applicable to measures that reduce energy costs by providing cooling through increased shading andor evapotranspiration
bull Use New York Power Authority rates of $0148kWh for electricity and $0810Therm for natural gas
Other Potential Benefits
Air Quality bull Applicable to measures that absorb pollutants andor reduce carbon dioxide emissions
Acoustics bull Applicable to measures such as green roof or walls that reduce noise transfer
Quality of LifeHealth bull Potential quality of life benefits and related to improved public health
Real Estate bull Applicable to measures that provide residential real estate benefits from increased resilience of propertiesstreetscapesneighborhoods
Retail Sales Marketing
bull Applicable to measures that provide commercial property benefits from increased aesthetics resulting in increased marketing and sales for streetscapesneighborhoods
Tax Credits Incentives
bull Applicable to resilience or green infrastructure measures such as green roofs that have accompanying Federal State or City tax credits or other incentives
Table 15 lists potential benefits for reducing impacts from heat and basic guidance for how to estimate them See Section IIID for more information
NYC Mayorrsquos Office of Recovery and Resiliency Climate Resiliency Design Guidelines
45APPENDIX 4 - PROJECT BENEFITS CATEGORIES
Table 16 ndash Guidance on quantitative calculations for (1) sea level rise with coastal storm surge and (2) increased precipitation measures
Data Input General Guidance ndash Basic Description
Applicable Benefit Category
Applicable Typical Facility Typology
Dire
ct B
enefi
ts
Indi
rect
Ben
efits
Oth
er P
oten
tial
Ben
efits
Bui
ldin
g St
ruct
ures
Com
plex
Fa
cilit
ies
Tran
spor
tatio
nSt
reet
scap
es
Plaz
as
Park
Fea
ture
s
First Floor Elevation (FFE)
bull The elevation of the first finished floor of the structure excluding basements
bull FFE measured from top of lowest floor (riverinenon-coastal high hazard areas) or bottom of lowest horizontal structural member (coastal high hazard areas)
Y Y Y Y
Building Replacement Value (BRV)
bull The unit cost to rebuild a structure of the same quality of construction
bull Not the same as market value
Y Y Y Y
Building Size
bull The total floor area of the building in square feet
bull Total Building Value = BRV x Building Sizebull Typical BRVs for NYC range between $100 to
$325SF for residential buildings and $120 to $450SF for commercialpublic buildings
Y Y Y Y
Structure Description
bull The type of building number of stories and foundation type (full basement partial basement no basement)
bull Collect more detailed foundation data for coastal flood zones
Y Y Y Y
Building Use bull Details related to residential housing commercial business and public use
Y Y Y Y Y
Building Type bull The primary use of building ndash residential commercial public and others
Y Y Y Y Y
Depth Damage Function (DDF)
bull Curves used to estimate structure damage contents damage and displacement of residential buildings based on flood depth
bull DDFs selection based on Structure Description Building Type Building Use
bull Structure DDFs based on percentage of Total Building Value
bull Contents DDFs based on percentage of Total Contents Value
bull Displacement DDFs based on number of displacement days x Displacement Cost
Y Y Y Y Y
Contents Value
bull The cost to replace structure contents (furnishings equipment)
bull Residential building Contents Values typically 50 BRV (FEMA DDFs) or 100 BRV (USACE DDFs)
bull Non-residential building Contents Values between 18 to over 100 depending on building use (USACE DDFs)
bull Total Contents Value = BRV x Building Size
Y Y Y Y Y
Table 16 provides general guidance on how to quantitatively calculate benefits from efforts to address from climate stressors See Section IIIE for more information
NYC Mayorrsquos Office of Recovery and Resiliency Climate Resiliency Design Guidelines
46APPENDIX 4 - PROJECT BENEFITS CATEGORIES
Table 16 ndash Guidance on quantitative calculations for (1) sea level rise with coastal storm surge and (2) increased precipitation measures
Data Input General Guidance ndash Basic Description
Applicable Benefit Category
Applicable Typical Facility Typology
Dire
ct B
enefi
ts
Indi
rect
Ben
efits
Oth
er P
oten
tial
Ben
efits
Bui
ldin
g St
ruct
ures
Com
plex
Fa
cilit
ies
Tran
spor
tatio
nSt
reet
scap
es
Plaz
as
Park
Fea
ture
s
Number of Residents (Residential)
bull Total number of occupants in a residential building
bull Typically estimated based on number of residential units x average number of individuals per household (based on current US Census data or use 25 individuals per household as a default)
Y Y Y Y Y
Displacement Cost (Residential)
bull The unit cost to lodge and feed displaced residents while flood damage is repaired
bull Average unit displacement cost of $415residential unitday recommended based on current FY2018 GSA Per Diem rates for New York City
Y Y Y Y Y
Value of Service (Non-Residential and Public)
bull The unit cost of service disruption and rental of temporary facilities while flood damage is repaired
bull Disruption costs for non-residential buildings typically range from $095 to $136SFmonth and rental costs range from $020 to $136SFmonth depending on building use
bull Value of service for public buildings ($day) is typically based on the annual operating budget for the City agency using the building prorated based on building size or population served by the building then divided by 365 daysyear
Y Y Y Y
Value of Service (Critical Facilities)
bull The unit cost of critical facilities (police fire emergency medical services) lost or delayed while flood damage is repaired
Y Y Y
Value of Service Duration
bull The duration of service disruption and rental of temporary facilities for non-residential buildings and critical facilities while flood damage is repaired
bull For non-residential buildingso Value of Service Durations vary from
4 months to over 30 months based on building use and the depth of flooding
o Total Value of Service Loss = (Disruption Cost x Building Area) = (Rental Cost x Building Area x Value of Service Duration)
bull For public buildings and critical facilitieso Value of Service Durations vary from 0
days to 720 months based on building use and the depth of flooding from FEMA FIA or USACE DDFs
o Total Value of Service Loss = (Value of Service) x (Service Loss Duration)
Y Y Y
NYC Mayorrsquos Office of Recovery and Resiliency Climate Resiliency Design Guidelines
47APPENDIX 4 - PROJECT BENEFITS CATEGORIES
Table 16 ndash Guidance on quantitative calculations for (1) sea level rise with coastal storm surge and (2) increased precipitation measures
Data Input General Guidance ndash Basic Description
Applicable Benefit Category
Applicable Typical Facility Typology
Dire
ct B
enefi
ts
Indi
rect
Ben
efits
Oth
er P
oten
tial
Ben
efits
Bui
ldin
g St
ruct
ures
Com
plex
Fa
cilit
ies
Tran
spor
tatio
nSt
reet
scap
es
Plaz
as
Park
Fea
ture
s
Engineering Estimates for Damages
bull Engineered estimate models of physical damages and service losses at the project site based on the Guidelines event recurrence interval(s) and flood depth(s)
Y Y Y Y Y Y
Historic Damages and Service Losses
bull Historic physical damages and service losses at the project site documented from previous flood events
bull Do not use routine maintenancebull The historic damage event recurrence interval
(RIs) andor flood depths must be determined updated for inflation to the present value and adjusted to match the Guidelines event RIsflood depths
Y Y Y Y Y Y
Facility Replacement Value
bull The unit cost to rebuild the facility
Impacted Area bull The geographic area impacted by the facility in the event of failure in acres
Y Y Y Y
Facility Capacity
bull The design capacity of the facilitybull For example - facility capacity expressed in
millions of gallons per day (MGD) for water and wastewater facilities or megawatts (MW) for electrical facilities
Y Y Y Y
Service Population
bull The number of impacted residents served by the facility
bull Typically estimated based on number of impacted residential customers x average number of individuals per household (based on current US Census data or use 25 individuals per household as a default)
bull Facilities serving mostly non-residentialpublic buildings andor critical facilities should focus on service losses rather than service population
Y Y Y
NYC Mayorrsquos Office of Recovery and Resiliency Climate Resiliency Design Guidelines
48APPENDIX 4 - PROJECT BENEFITS CATEGORIES
Table 16 ndash Guidance on quantitative calculations for (1) sea level rise with coastal storm surge and (2) increased precipitation measures
Data Input General Guidance ndash Basic Description
Applicable Benefit Category
Applicable Typical Facility Typology
Dire
ct B
enefi
ts
Indi
rect
Ben
efits
Oth
er P
oten
tial
Ben
efits
Bui
ldin
g St
ruct
ures
Com
plex
Fa
cilit
ies
Tran
spor
tatio
nSt
reet
scap
es
Plaz
as
Park
Fea
ture
s
Value of Service
bull Unit value of service provided by the facilitybull Example of FEMA standard values for complete
loss of utility service $105personday for potable water$49personday for wastewater$148personday for electrical
bull Consider updating FEMA standard per capita values to reflect current The New York City utility rates
Y Y
Roadway Elevations bull Roadway Elevations
Y Y
Roadway Replacement Value
bull Roadway Replacement ValueY Y
Inundation Area Map
bull Inundation Area Map developed by FEMA or through modeling by project design team
Y Y Y
Building Inventory of Inundation Area
bull The number and type of buildings within the streetscape and neighborhood inundated by the Guidelinersquos flood events
Y Y Y
Average Daily Traffic (ADT)
bull The average number of one-way traffic trips per day along the roadway(s) within the streetscapeneighborhood inundated by the Guidelinersquos flood events
Y Y
Additional Travel Time
bull The additional travel time needed to detour around a flooded roadway expressed in minutes
bull In the unlikely event there is no detour available use a 12-hour travel time per one-way trap but provide a detailed area street map as supporting documentation
Y Y
Value of Traffic Delay
bull The value of service associated with lost time in traffic
bull For example - FEMA standard average value of $3344vehiclehour of delay
bull Consider updating FEMA and GSA standard values to reflect current New York City area labor rates and fuel costs
Y Y
NYC Mayorrsquos Office of Recovery and Resiliency Climate Resiliency Design Guidelines
49APPENDIX 4 - PROJECT BENEFITS CATEGORIES
Table 17 ndash Guidance on quantitative unit benefit calculations for extreme heat hazard measures
Measure General Guidance ndash Unit Benefit Information and Data Requirements
Applicable Benefit Category
Applicable Typical Facility Typology
Dire
ct B
enefi
ts
Indi
rect
Ben
efits
Oth
er P
oten
tial
Ben
efits
Bui
ldin
g St
ruct
ures
Com
plex
Fa
cilit
ies
Tran
spor
tatio
nSt
reet
scap
es
Plaz
as
Park
Fea
ture
s
Green Roof
bull Unit benefit range over PUL = $470SF to $373SF of green roof area ($719SF standard value)
bull Assumed PUL = 40 yearsbull Apply standard value unit benefit to green
roof area to estimate measure benefitbull Higher range values more applicable
to residential and commercial building streetscape projects
Y Y Y Y Y Y
Bioswale Rain Garden Meadow Mix
bull Unit benefit range over PUL = $396SF to $211SF of area ($730SF standard value)
bull Assumed PUL = 30 yearsbull Apply standard value unit benefit to bioswale
rain gardenmeadow mix area to estimate total measure benefit
Y Y Y Y Y Y
Cool Roof
bull Unit benefit range over PUL = $117 to $3151SF of material area ($144SF standard value)
bull Assumed PUL = 20 yearsbull Apply standard value unit benefit to cool roof
area to estimate total measure benefitbull Higher range values more applicable to
residential building streetscape projects
Y Y Y Y Y
Light-Colored PaversLight-Colored Materials
bull Unit benefit range over PUL = $0774 to $204SF of material area ($0866SF standard value)
bull Assumed PUL = 30 yearsbull Apply standard value unit benefit to material
area to estimate total measure benefit
Y Y Y Y
Table 17 provides general guidance on how to quantitatively calculate benefits from efforts to address climate stressors See Section IIIE for more information
NYC Mayorrsquos Office of Recovery and Resiliency Climate Resiliency Design Guidelines
50APPENDIX 4 - PROJECT BENEFITS CATEGORIES
Table 17 ndash Guidance on quantitative unit benefit calculations for extreme heat hazard measures
Measure General Guidance ndash Unit Benefit Information and Data Requirements
Applicable Benefit Category
Applicable Typical Facility Typology
Dire
ct B
enefi
ts
Indi
rect
Ben
efits
Oth
er P
oten
tial
Ben
efits
Bui
ldin
g St
ruct
ures
Com
plex
Fa
cilit
ies
Tran
spor
tatio
nSt
reet
scap
es
Plaz
as
Park
Fea
ture
s
Tree Planting
bull Unit benefit range over PUL = $1005 to $77154Tree ($1855Tree standard value)
bull Assumed PUL = 30 yearsbull Apply standard value unit benefit to number of
trees to estimate total measure benefitbull Higher range values more applicable
to residential and commercial building streetscape projects
Y Y Y Y Y Y
Planter Box Tree
bull Unit benefit range over PUL = $212 to 16304Tree ($392Tree standard value)
bull Assumed PUL = 15 yearsbull Apply standard value unit benefit to number of
trees to estimate total measure benefitbull Higher range values more applicable
to residential and commercial building streetscape projects
Y Y Y Y Y
Shade Canopy
bull Unit benefit range over PUL = $0363 to $396SF ($0458SF standard value)
bull Assumed PUL = 15 yearsbull Apply standard value unit benefit to area of
shade canopy estimate total measure benefitbull Higher range values more applicable
to residential and commercial building streetscape projects
Y Y Y Y
Permeable Grass Pavers
bull Unit benefit range over PUL = $0258SF to $0521SF of pavers ($0363SF standard value)
bull Assumed PUL = 30 yearsbull Apply standard value unit benefit to paver
area to estimate total measure benefit
Y Y Y Y Y
For the purposes of the BCA refer to the following facility typologies bull ldquoBuilding Structuresrdquo include critical small building sites such as EMS or FDNY stations and non-critical small building sites such as
libraries or comfort stationsbull ldquoComplex Facilitiesrdquo include critical infrastructure such as wastewater treatment sites pump stations water filtration plants and similar
large or complex facilitiesbull ldquoTransportationStreetscapePlazasrdquo include roadway reconstruction streetscape improvements street raising plazas and other
transportation-related infrastructurebull ldquoPark Featuresrdquo include parks and similar public recreational facility with natural landscape features
NYC Mayorrsquos Office of Recovery and Resiliency Climate Resiliency Design Guidelines
51APPENDIX 5 - EXAMPLE PLANNING DECISION TREE
This decision tree provides a summarized example approach for how to implement these Guidelines Projects with a total cost greater than $50 million are recommended to conduct a full qualitative and quantitative climate change risk assessment and BCA while projects below $50 million are recommended to conduct a qualitative risk assessment and BCA
Define Project
1) Operational goals and criticality level2) Useful life3) Location in the current flood plain future floodplain and or zone
of tidal inundation and the project arearsquos score on the heat vulnerability index
Evaluate Project Risks According to Probability and Magnitude of Consequence
bull Extreme Heat bull Precipitationbull Sea Level Risebull Coastal Surge
High Level Identification and Assessment of Risk Mitigation Alternatives and Co-benefits
(qualitative)
Detailed Identification and Assessment of Risk Mitigation Alternatives and Co-benefits (qualitative and quantitative)
High Level Estimate of Costs and Benefits of Design Alternatives
(qualitative)
Detailed Estimate of Costs and Benefits of Design Alternatives
(qualitative and quantitative)
Decision Point Which climate change risks require mitigation
Decision Point Evaluate risk mitigation benefits and costs to
determine final resilient design alternative or if no action is required
Decision Point Is the total project cost above $50 million
Below $50 million Above $50 million
APPENDIX 5 - EXAMPLE PLANNING DECISION TREE
NYC Mayorrsquos Office of Recovery and Resiliency Climate Resiliency Design Guidelines
52
Project Title
Design Strategies Checklist (not exhaustive)
Extreme Heat Comments Extreme Precipitation Comments Sea Level Rise amp Storm Surge Comments
Select Site in Low Heat Vulnerability Index area Select High Elevation Site Select High Elevation Site
Minimize East-West Building Orientation Green Roof Raise Building Floor Elevation
Passive Solar Cooling and Ventilation Systems
Protect Below Grade Areas from Flooding Waterproof Building Envelope
Cool Roof (SRI appropriate) On-site Stormwater Management (gray) Elevate Critical Building Functions
Green Roof (extensive) Reduce Impervious Areas Elevate Critical Equipment
Vegetative Structures Permeable Pavement Perimeter Floodwall100 Levee (passive or active)
Enhanced HVAC System including space layout optimization and system scalability
Increase Green Spaces and Planted Areas DryWet Floodproofing
More Efficient Building Envelope Other Utility Redundancy Design101
Parking Lot Shading Resilient Materials amp Landscape Treatments
Light Colored Pavements (appropriate SRI) Design for Storm Surge Outflow
Increase Planted Areas Install Backwater Flow Prevention
Permeable Surfaces Design for Scour
Open-grid Pavement Raise Road Elevation
Other Other
This appendix provides a template for identifying possible design strategies to address climate change risks as described throughout the Guidelines
APPENDIX 6 - DESIGN STRATEGIES CHECKLIST
100 Permanent perimeter flood walls are not permitted to meet floodproofing requirements in buildings with substantial improvements andor damages 101 Utility redundancy design should be pursued for critical systems not all building systems
APPENDIX 6 - DESIGN STRATEGIES CHECKLIST
NYC Mayorrsquos Office of Recovery and Resiliency Climate Resiliency Design Guidelines
53APPENDIX 7 - CLIMATE CHANGE RISK ASSESSMENT RESOURCES
These Guidelines provide data on climate change hazards and recommend how that data can inform resilient design A risk assessment is a tool to help project managers and designers evaluate risk levels as well as select and prioritize resilient design strategies A high level risk assessment is recommended for all City capital projects with a total cost of under $50 million Projects above $50 million are recommended to conduct an in-depth assessment
Risk assessments use quantified estimates of the probability and magnitude of consequence of an event occurring to prioritize responses ldquoProbabilityrdquo is an assessment of the likelihood of a hazard occurring while ldquomagnituderdquo describes the hazardrsquos potential impact Risk assessment tools such as the examples listed below can be used to define and score these categories Projects that score higher across both probability and magnitude can be prioritized for investment and risk mitigation action Projects that score lower across both criteria may require no action beyond meeting code The results are typically charted on a risk matrix and an example is provided on the next page
The climate change risk management frameworks below offer templates for how to integrate climate change projections into a risk assessment process Refer to these resources for examples and further information
bull Vulnerability Assessment and Adaptation Framework is prepared by the Federal Highway Administration (FHWA) While developed for transportation planning this risk assessment framework has broad applicability for evaluating asset vulnerability to climate change Available at httpswwwfhwadotgovenvironmentsustainabilityresilienceadaptation_framework
bull US Climate Resilience Toolkit The US Global Change Research Program offers a step by step risk assessment
framework including tools and case studies at httpstoolkitclimategovsteps (see example on next page)
bull Coast Adapt Guidance on undertaking a risk assessment High level assessment httpscoastadaptcomausitesdefaultfilesfactsheetsT3M4_2_2nd_pass_risk_assessmentpdfDetailed assessment httpscoastadaptcomausitesdefaultfilesfactsheetsT3M4_3_3rd_pass_risk_assessmentpdf
bull Climate adaptation Risk uncertainty and decision-makingDownload the report here httpswwwukciporgukpublicationsRisk
The City plans to develop a NYC-specific process for integrating climate change data into existing risk management processes by April 2019
APPENDIX 7 - CLIMATE CHANGE RISK ASSESSMENT RESOURCES
NYC Mayorrsquos Office of Recovery and Resiliency Climate Resiliency Design Guidelines
54APPENDIX 7 - CLIMATE CHANGE RISK ASSESSMENT RESOURCES
The Risk Characterization Matrix below is an example from the US Climate Resilience Toolkit This tool can be used to assess the probability and magnitude of impact for identified risks The risk of coincident climate stressorsrisks (such as storm surge plus increased precipitation) can also be assessed as applicable
Figure 14 - Example of a climate change risk matrix (adapted from US Climate Resilience Toolkit)
Project teams can determine the magnitude of the impact (along the horizontal scale of 1 through 3 with 3 being the most severe) and the probabilitylikelihood of occurrence for each specific risk (along the vertical scale with 3 being the most likely) A score is typically assigned for each risk (Probabil-ity x Magnitude) and then charted on the matrix Based on the estimated probability and magnitude of consequence above the risks are ranked and prioritized for mitigation Factors to bear in mind include
bull Not all facility typologies have the same level of functional and operational importance during events or tolerance for disruption
bull Not all climate stressors and risks have the same level of impact on each project sitebull Not all identified risks can or should be mitigated fully
NYC Mayorrsquos Office of Recovery and Resiliency Climate Resiliency Design Guidelines
55WORKS CITED
A Stronger More Resilient New York PlaNYC Report of the NYC Special Initiative for Rebuilding and Resiliency The City of New York 2013
ldquoAccount for Climate Riskrdquo International Finance Corporation accessed March 27 2017 httpwwwifcorgwpswcmconnectTopics_Ext_ContentIFC_External_Corporate_SiteClimate+Business
PrioritiesAccount+for+Climate+Risk
American Society of Heating Refrigeration and Air-Conditioning Engineers (ASHRAE) Handbook -Fundamentals 2017
ldquoBaseline Standard Economic Value Methodology Reportrdquo Federal Emergency Management Agency July 2016
Benefit Cost Analysis Toolkit Software Version 530 Federal Emergency Management Agency (build date December 2016)
Criteria for Detention Facility Design New York City Department of Environmental Protection November 2012
Community Resilience Planning Guide for Buildings and Infrastructure Systems Vol 1 NIST Special Publication 1190 US Department of Commerce 2016
Cool and Green Roofing Manual NYC Department of Design and Construction 2007 httpwwwnycgovhtmlddcdownloadspdfcool_green_roof_manpdf
Building Resiliency Task Force US Urban Green Building Council New York 2013 httpurbangreencouncilforcecomBuildingResiliency
Design and Planning for Flood Resiliency Guidelines for NYC Parks New York City Department of Parks and Recreation 2017
httpswwwnycgovparksorgplanning-and-buildingplanningresiliency-plansflood-resiliency
Flooded Bus Barns and Buckled Rails Federal Transit Administration Office of Budget and Policy 2011 httpswwwhsdlorgabstractampdid=685187
Floodproofing Non-Residential Buildings FEMA P936 FEMA 2013 httpswwwfemagovmedia-library-data9a50c534fc5895799321dcdd4b6083e7P-936_8-20-13_508rpdf
ldquoGlossaryrdquo International Infrastructure Management Manual National Asset Management Support Group New Zealand 2011 httpwwwipweaorg
ldquoGreen Roof Metrics Draft Reportrdquo New York City Department of Parks and Recreation 2017
ldquoGuide to Rain Event Preparednessrdquo NYC Department of Environmental Protection httpwwwnycgovhtmldeppdfbrochuresflood-preparedness-flyerpdf
ldquoGuidelines and Discount Rates for Benefit-Cost Analysis of Federal Programsrdquo Appendix C Circular A-94 US Office of Management and Budget (OMB) 2017
ldquoGuidelines for the Design and Construction of Stormwater Management Systemsrdquo New York City Department of Environmental Protection July 2012
Horton R et al New York City Panel on Climate Change 2015 Report Ann NY Acad Sci ISSN 0077-892 New York 2015
Madrigano J et al ldquoA case-only study of vulnerability to heat wavendashrelated mortality in New York City (2000ndash2011)rdquo Environmental Health Perspectives 123672ndash678 2013
WORKS CITED
NYC Mayorrsquos Office of Recovery and Resiliency Climate Resiliency Design Guidelines
56WORKS CITED
enspMcGregor et al Two Degrees The Built Environment and Our Changing Climate Routledge Press 2013
NYC Green Codes Task Force US Green Building Council New York 2010 httpurbangreencouncilorgGreenCodes
NYCrsquos Risk Landscape A Guide to Hazard Mitigation NYC Emergency Management 2014
One New York The Plan for a Strong and Just City The City of New York 2015 httpwwwnycgovhtmlonenyc downloadspdfpublicationsOneNYCpdf
Ready to Respond Strategies for Multifamily Building Resilience Enterprise Green Communities 2015 httpswwwenterprisecommunityorgresources
Rosenzweig C et al Climate Change Adaptation in New York City Building a Risk Management Response New York City Panel on Climate Change 2010
httponlinelibrarywileycomdoi101111nyas20101196issue-1 issuetoc
ldquoSustainable Infrastructure Management Program Learning Environmentrdquo Water Environment Research Foundation accessed March 24 2017 httpsimplewerforg
Urban Waterfront Adaptive Strategies NYC Department of City Planning 2013 httpwww1nycgovsiteplanningplanssustainable-communitiesclimate-resiliencepagetab=1
Wastewater Resiliency Plan Climate Risk Assessment and Adaptation Study New York City Department of Environmental Protection October 2013
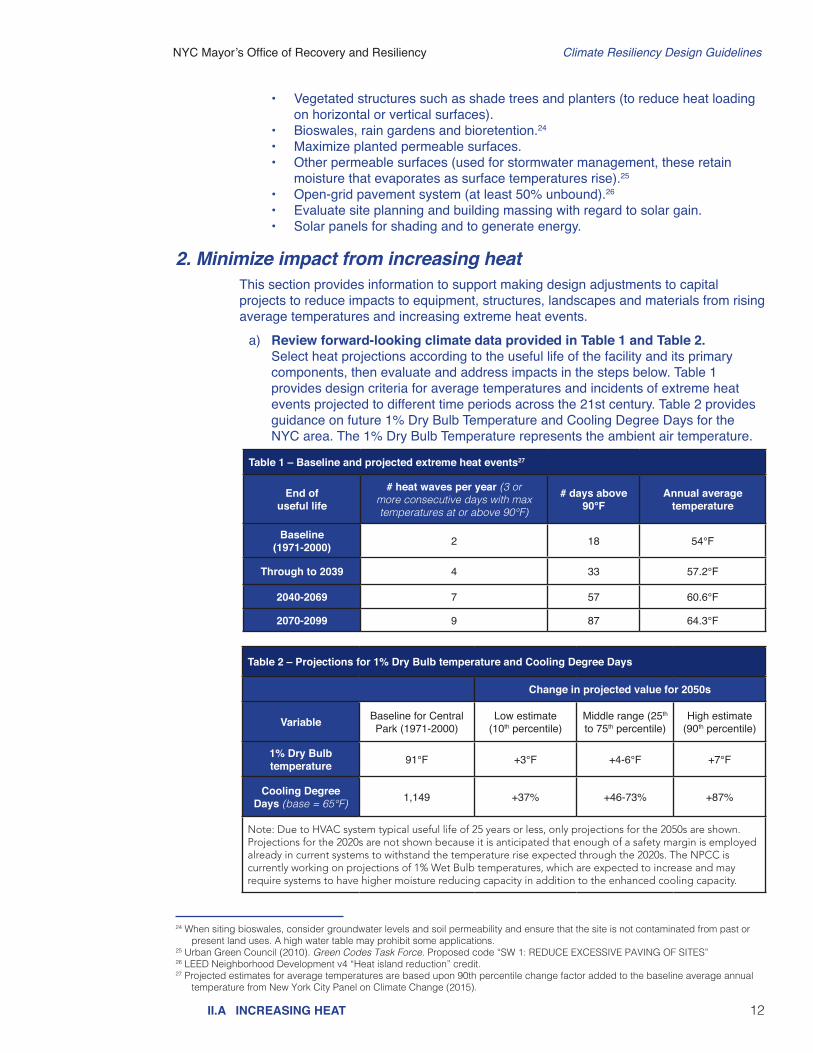
NYC Mayorrsquos Office of Recovery and Resiliency Climate Resiliency Design Guidelines
12
2 Minimize impact from increasing heatThis section provides information to support making design adjustments to capital projects to reduce impacts to equipment structures landscapes and materials from rising average temperatures and increasing extreme heat events
a) Review forward-looking climate data provided in Table 1 and Table 2 Select heat projections according to the useful life of the facility and its primary
components then evaluate and address impacts in the steps below Table 1 provides design criteria for average temperatures and incidents of extreme heat events projected to different time periods across the 21st century Table 2 provides guidance on future 1 Dry Bulb Temperature and Cooling Degree Days for the NYC area The 1 Dry Bulb Temperature represents the ambient air temperature
IIA INCREASING HEAT
bull Vegetated structures such as shade trees and planters (to reduce heat loading on horizontal or vertical surfaces)
bull Bioswales rain gardens and bioretention24 bull Maximize planted permeable surfacesbull Other permeable surfaces (used for stormwater management these retain
moisture that evaporates as surface temperatures rise)25 bull Open-grid pavement system (at least 50 unbound)26 bull Evaluate site planning and building massing with regard to solar gainbull Solar panels for shading and to generate energy
Table 1 ndash Baseline and projected extreme heat events27
End of useful life
heat waves per year (3 or more consecutive days with max temperatures at or above 90degF)
days above 90degF
Annual average temperature
Baseline (1971-2000) 2 18 54degF
Through to 2039 4 33 572degF
2040-2069 7 57 606degF
2070-2099 9 87 643degF
Table 2 ndash Projections for 1 Dry Bulb temperature and Cooling Degree Days
Change in projected value for 2050s
Variable Baseline for Central Park (1971-2000)
Low estimate (10th percentile)
Middle range (25th to 75th percentile)
High estimate (90th percentile)
1 Dry Bulb temperature 91degF +3degF +4-6degF +7degF
Cooling Degree Days (base = 65degF) 1149 +37 +46-73 +87
Note Due to HVAC system typical useful life of 25 years or less only projections for the 2050s are shown Projections for the 2020s are not shown because it is anticipated that enough of a safety margin is employed already in current systems to withstand the temperature rise expected through the 2020s The NPCC is currently working on projections of 1 Wet Bulb temperatures which are expected to increase and may require systems to have higher moisture reducing capacity in addition to the enhanced cooling capacity
24 When siting bioswales consider groundwater levels and soil permeability and ensure that the site is not contaminated from past or present land uses A high water table may prohibit some applications
25 Urban Green Council (2010) Green Codes Task Force Proposed code ldquoSW 1 REDUCE EXCESSIVE PAVING OF SITESrdquo26 LEED Neighborhood Development v4 ldquoHeat island reductionrdquo credit27 Projected estimates for average temperatures are based upon 90th percentile change factor added to the baseline average annual
temperature from New York City Panel on Climate Change (2015)
NYC Mayorrsquos Office of Recovery and Resiliency Climate Resiliency Design Guidelines
13IIA INCREASING HEAT
b) Evaluate potential impacts on systems and materials Heat impacts on a facility are highly contingent on the facility type and should be reviewed on a case-by-case basis28 A decrease in the useful life or operational capacity of a facility or components of a facility may occur due to rising temperatures Interventions will also vary depending on whether the project is a new capital investment or a substantial improvement to an existing facility Factors to evaluate as applicable to project scope include but are not limited to
bull Thermal expansion warping softening or other forms of material change or degradation of structural integrity occurring at an accelerated rate by excessive heat
bull Health and safety impacts on occupants vulnerable to heat bull Increased failure or reduced efficiency of electrical or mechanical systems bull Prioritization of critical loads for systems and components at the facility andbull Moisture control needs for buildings with a higher standard for fenestration and
insulation
The results of this evaluation will inform steps taken in the step below
c) Reduce heat impacts Review and implement specific changes to the facility design based on assessments
above Develop a strategy based on the specific type of facility its operational profile and its useful life A Design Strategies Checklist is available for use in Appendix 6 as a resource to track design approaches Specific areas of focus are
bull Electricity outages High temperatures drive demand for air conditioning and can increase the risk of facility equipment failure potentially broader grid disruptions or brownouts2930 To manage this risk design City buildings and infrastructure to withstand periods without electricity using the following approaches in particular if they provide critical or essential services
Ǯ Identify and assess how much of the facilityrsquos load is critical (eg ldquocritical loadrdquo) including the necessary duration of the backup power supply (eg is backup power needed for 8 hours or multiple days) Determining what loads are critical and how long they should be powered for is essential for a facilityrsquos operations and what the role of the facility will have in an emergency situation31
Ǯ Depending on the size of the critical load and budget different backup power supply options could range from backup generators (eg diesel natural gas) to hybrid systems (eg solar + battery storage + appropriately sized generator) Each option has different trade-offs that should be considered in terms of cost feasibility and environmental impacts For shorter duration needs andor smaller critical loads buildings with existing solar systems should consider adding storage to provide a resiliency benefit In some cases co-generation systems may make sense from an economic and resiliency perspective especially if there
28 Sector- and facility-specific impacts vary greatly For examples of sector-specific impacts and design responses see Flooded Bus Barns and Buckled Rails (FTA 2011) and Ready to Respond Strategies for Multifamily Building Resilience (Enterprise Green Communities 2015)
29 McGregor et al (2013) Two Degrees The Built Environment and Our Changing Climate Routledge Press30 High temperatures also increase energy demand which can increase fossil fuel based greenhouse gas emissions31 The key roles of the facility that need to be identified are operational hours number of occupants and electrical loads needed for the
desired operations Electrical equipment and appliances for the desired operations may include - but are not limited to - safety lighting life-supporting systems fire protection systems telecommunications equipment mechanical systems to mitigate extreme temperatures and computing equipment Every facility is unique Operational characteristics and load profiles need to be established prior to sizing the equipment required to keep the facility in operational mode
NYC Mayorrsquos Office of Recovery and Resiliency Climate Resiliency Design Guidelines
14IIA INCREASING HEAT
is a significant heating andor cooling load in addition to electricity demand32
Ǯ Depending on the option assess need to invest in internal electricity rewiring and building energy management systems (eg switches reconfiguration of distribution infrastructure to isolate critical loads from non-critical loads and the ability to island from the broader grid during the event of a larger disruption software and hardware to manage the deployment of hybrid systems) andor need for external hookups for temporary generators and boilers33
bull Failure in facility ventilation electrical and air conditioning systems Some systems designed to meet the requirements of past climate may overheat and fail during extreme events Some design interventions include34
Ǯ Selecting systems with higher heat tolerance Ǯ Adding Energy Recovery Ventilation systems Ǯ Providing additional or redundant ventilation systems either mechanical or
natural to cool electrical equipment Ǯ Optimizing building layout by
bull segregating temperature sensitive electronics and computer control system from other systems
bull placing heat generating equipment like transformers and switchgear outdoors where permitted and
bull splitting the facility cooling loads among different HVAC systems in facility for redundancy and better zone control
bull Passive solar cooling and ventilation There are numerous design features that provide passive solar cooling for buildings to help maintain lower internal ambient temperatures with less air conditioning These features also help keep facilities habitable during extended grid failures when generators fail or must be reserved for critical functions Some design features include35
Ǯ Appropriate east-west orientation Ǯ Passive ventilation design Ǯ Vertically stacked double skin facades Ǯ Exterior window shades Ǯ Light colored exteriors Ǯ Shaded arcades Ǯ Thermally massive materials Ǯ High performance glazing Ǯ Operable windows
32 To learn more see the Building Resiliency Task Force report from Urban Green Council (2013)33 Ibid 34 Flooded Bus Barns and Buckled Rails FTA Office of Budget and Policy 201135 These and other examples are found in McGregor et al (2013) Two Degrees The Built Environment and Our Changing Climate
Routledge Press Also see Flooded Bus Barns and Buckled Rails FTA Office of Budget and Policy 2011
NYC Mayorrsquos Office of Recovery and Resiliency Climate Resiliency Design Guidelines
15IIB INCREASING PRECIPITATION
B INCREASING PRECIPITATIONThe intensity and frequency of precipitation events are projected to increase with climate change creating new challenges for stormwater management and impacts to the built environment such as
bull The potential for greater frequency of stormwater management systems being overwhelmed36
bull More frequent and severe flooding of buildings and infrastructure in areas across the city and
bull Greater variability in rainfall events annually including the chance of drought
The goal for this section is to guide stormwater management approaches including infiltration increases in on-site storage volume and where possible increases in sewer capacity to account for precipitation increases associated with climate change Designers should develop and consider design interventions that would decrease site contribution to sewer in-flows beyond the existing NYC Building Code requirements Given its complexity the Department of Environmental Protection (DEP) is also evaluating climate impacts to the sewer system on a drainage-wide level Proactive design such as increasing on-site infiltration and storm water retention can contribute to system resiliency on a site-specific basis
BackgroundNYCrsquos drainage systems are designed to handle approximately the current 3-year intensity-duration-frequency (IDF) event in most areas of the city where sewers were built prior to 1970 In locations with sewers built after 1970 the capacity was built to handle the 5-year event NYCrsquos network of drainage systems can experience flooding above those thresholds due to widespread precipitation events or by localized intense storms (sometimes called ldquocloudburstsrdquo) causing flooding and backups Climate change projections indicate that flooding resulting from multiple types of precipitation events may increase in frequency This increasing probability is forecast for all types of precipitation events in NYC although there is greater uncertainty around future short duration events Relying on sewers alone to manage extreme precipitation events will not be sufficient in a changing climate The City plans to reduce impervious areas and provide additional storage capacity to reduce flood damage For managing stormwater from larger storms such as at the 50- and 100-year recurrence intervals DEP is increasingly considering the role of streets and open space in managing flow this is referred to as a dual drainage design approach The City is piloting projects to test this dual drainage approach
Another set of interventions include Bluebelt best management practices (BMPs) such as constructed wetlands storm water ponds and stream restorations that emulate pre-development conditions to manage large volumes of water and green infrastructure37 which in NYC have generally been designed to reduce flooding and combined sewer overflow respectively They are not typically sized to manage precipitation events of the same magnitude as sewers which serve as primary drainage conveyance However Bluebelt BMPs green infrastructure and other stormwater management tools may provide an additional buffer for larger storm events by temporarily storing andor infiltrating runoff that would otherwise be directed into the sewer system For instance areas of open space commonly found in NYC may not provide adequate environments for trees and other plantings However in these cases other types of green infrastructure like permeable surfaces and subsurface detention and retention installations would still be considered feasible
36 NYC is already taking steps to address this problem which will worsen with climate change To learn more about how NYC is using green and gray infrastructure to manage stormwater visit httpwwwnycgovhtmldephtmlstormwaterindexshtml
37 NYC DEP NYC Green Infrastructure Program
NYC Mayorrsquos Office of Recovery and Resiliency Climate Resiliency Design Guidelines
16IIB INCREASING PRECIPITATION
The City led by DEP continues to develop its options for managing heavier storm events due to climate change DEP is examining approaches to evaluate sea level rise and rainfall intensity for stormwater management and where possible sewer capacity These efforts will integrate forward-looking climate data into the design of these capital assets and the compounding factors of heavier rain storms and sea level rise will likely require greater infiltration and on-site storm water retention capacity Agencies and consultants should work directly with DEP to develop strategies on a given site necessary to meet expected increases in rainfall intensities and frequencies
1 Precipitation design adjustment for on-site stormwater systems
Based upon the design storm required for the City facility in design follow the steps below and review recommended design interventions
a) Identify the duration of the design event required The current 50-year IDF can be used as a proxy for the future 5-year storm
(projected for the 2080s) Design on-site detentionretention systems to retain the volume associated with the current 50-year IDF curve (see Figure 4 below) Design the on-site system to release at the maximum rate as specified in 15 Rules of the City of NY (RCNY) Chapter 3138
b) Conduct sensitivity analysis Compare the retentiondetention required for the current 5-year IDF versus the
38 Refer to existing codes and standards as well when determining the existing required storm as NYC requires different sizes of design storms for infrastructure and buildings For example NYC Plumbing Code Chapter 11 and Title 15 of the Rules of the City of New York Chapter 31
02
04
06
10
20
40
60
100
200
-2316090
Rai
nfal
l Int
ensi
ty (
inch
es p
er h
our
)
DurationsruoHsetuniM
5 10 15 30 1 2 3 6 12 18
5-yr
10-yr25-yr
50-yr
100-yr
NEW YORK NEW YORK
Figure 4 - Current Intensity-Duration-Frequency Precipitation Curve for NYC adapted from US Department of Commerce Weather Bureau Technical Paper 25
NYC Mayorrsquos Office of Recovery and Resiliency Climate Resiliency Design Guidelines
17IIB INCREASING PRECIPITATION
c) Identify design interventions for managing increased precipitation40 There are different ways to manage stormwater better and avoid urban flooding after
intense rain Choose the right combination of interventions after considering the site location operational requirements cost benefits and useful life of the intervention Some examples of design interventions are
bull Minimize increases in impervious surfacebull Utilize strategies that infiltrate evaporate or reuse rainwater to achieve storm
water volume reductions Then choose strategies that detain (delay drainage) to manage the rate of the storm water flow into the Cityrsquos drainage system
bull Install stormwater infiltration detention and storage (eg bioswales41 green roofs blue roofs and other blue or green infrastructure storage basins or tanks)
bull Protect areas below grade from floodingbull Keep catch basin grates clearbull When implementing perimeter protections ensure that interior water
management is also accounted for andbull Explore interventions to protect underground utility and telecommunications
infrastructure from water damage
d) Use appropriate DEP guidelines to perform the above tasks using the higher design storm
The three currently prescribed DEP guidelines are as follows
bull Guidelines for the Design and Construction of Stormwater Management Systems July 201242
bull Criteria for Detention Facility Design November 201243 bull DEP Site Connection Proposal Application and Guidelines44
Note on stormwater standards As DEP updates stormwater standards and develops specific tools to evaluate impacts of increased precipitation and drainage strategies for on-site storm water management these changes will be reflected in future versions of these Guidelines However it is recommended that the designer should develop and consider design interventions that would increase the on-site storage beyond the existing requirements Also a methodology is under development that will establish a consistent citywide process for addressing legal grade which will have further implications for how extreme precipitation is managed
39 NYC DEP Standards for Stormwater Release Rates available at httpwwwnycgovhtmldephtmlenvironmental_reviewsstormwater_release_ratesshtml 40 Also see DEP Guide to Rain Event Preparedness at httpwwwnycgovhtmldeppdfbrochuresflood-preparedness-flyerpdf and
Ready to Respond Strategies for Multifamily Building Resilience at httpwwwenterprisecommunityorgresourcesready-respond-strategies-multifamily-building-resilience-1335641 When siting bioswales consider groundwater levels and soil permeability and ensure that the site is not contaminated from past or
present land uses A high water table may prohibit some applications42 Available at httpwwwnycgovhtmldephtmlstormwaterstormwater_management_constructionshtml43 Available at httpwwwnycgovhtmldeppdfwater_sewer30_criteria_for_detention_facility_design_06062012pdf44 Available at httpwwwnycgovhtmldeppdfwater_sewer24pdf
current 50 year IDF to determine the cost and benefits associated with complying with these Guidelines Use the Evaluation of Project Benefits section below and Appendix 4 for guidance on how to identify and assess benefits Given the results of the costbenefit analyses review the added benefit of designing retentiondetention using greater magnitude storms (eg 100-year) or lower (eg 25-year) The goal is to maximize retentiondetention capacity given site and cost constraints as well as through an evaluation of the benefit of adding capacity to detainretain water for larger storm events
NYC Mayorrsquos Office of Recovery and Resiliency Climate Resiliency Design Guidelines
18
2 Incorporating climate change projections into DEP drainage planning
The first line of defense for managing intense precipitation events does not require changes to the sewer system as described above For drainage and wastewater infrastructure planning in a changing climate the sewer network and wastewater infrastructure should be qualitatively evaluated from the upstream pipes to the regulator chambers pump stations interceptors and ultimately to the downstream outfall to determine the feasibility of incorporating climate change projections into the system design For DEP storm sewer projects FY 2021 or later in separately sewered drainage areas where the design is in the early stages and there is free discharge the agency will evaluate the feasibility of revising the design to incorporate climate projections into the design If the project (including the prescribed changes) passes the costbenefit analysis then DEP will consider incorporating climate change projections into the sizing However changes in one part of the system must be carefully evaluated For example any upsizing of the regulator chamber or the high point of the system can negatively impact the design and operation of the wastewater infrastructure and residencesbusinesses on the system and can lead to a diminished the level of service
DEP is in the process of developing a hydrologic and hydraulic (HampH) model to estimate runoff flow for future climate scenarios and is evaluating rainfall hyetographs for the existing and future rainfall scenarios to be included in the drainage planning process In addition DEP currently coordinates with ORR for drainage planning as a part of coastal resiliency projects A more detailed methodology to incorporate climate change projections into drainage planning will be developed for version 30 of the Climate Resiliency Design Guidelines to be released in April 2019
IIB INCREASING PRECIPITATION
NYC Mayorrsquos Office of Recovery and Resiliency Climate Resiliency Design Guidelines
19IIC SEA LEVEL RISE
non-critical components within a larger facility or campus (eg at a maintenance yard differentiate between structures and equipment) Critical components essential to the facilityrsquos functionality should be protected to the higher standard for criticality even if the facility itself may be non-critical Some examples of critical components include electrical distribution and switching areas motor-control centers chemical feed equipment boilers communications systems monitoring and safety equipment HVAC units fire alarms and suppression equipment furnaces elevators emergency fuel supplies emergency generators and hazardous material storage Component protection should also be evaluated if a facility is expected to be fully operational during a flood event or if it is expected to quickly resume full operations after an event
For buildings and infrastructure with a long useful life it is not always cost effective or operationally feasible to design a facility to be resilient to hazards faced at the end of its useful life In these cases the most resilient design will be one that provides extra protection against hazards in the initial decades while also leaving open design alternatives for updating resiliency measures as new data is provided or new risk assessments are completed This flexible adaptation pathways approach builds in options to protect assets later in life as demonstrated in an example shown in Figure 1 (in Section I)
Other considerations to keep in mind includebull These Guidelines apply to all City capital projects except coastal flood protection
systems which are designed to different standards than those provided here for
C SEA LEVEL RISEThis section provides tools to 1) determine if the project will be subject to tidal inundation during its useful life due to sea level rise and 2) incorporate sea level rise into flood protection levels of capital projects For projects in the current and future 1 annual chance floodplains sea level rise-adjusted design flood elevations (DFE) are provided and reflect the criticality of the asset and its useful life Background NYC has experienced the devastation of coastal storms most recently during Hurricane Sandy Sea level rise is projected to increase the depth extent and frequency of flooding from storm surge45 Sea level rise will also regularly inundate some low-lying areas during high tides Current flood protection heights are determined by using the base flood elevation established by the FEMA Preliminary Flood Insurance Rate Map (PFIRM) 201546 and the standard of protection for buildings in the floodplain in Appendix G of the NYC Building Code47 These Guidelines augment existing requirements for two primary purposes ensuring City facilities built today incorporate sea level rise and critical assets (as defined in Table 4) are protected to a higher level It is important to note that all projects and design interventions must comply with NYC Building Code
Designers should differentiate between critical and
45 New York City Panel on Climate Change Report Chapter 2 Sea Level Rise and Coastal Storms (2015)46 However NYC Building code G10222 requires that designers review both the PFIRM and the effective FIRM and use the more
restrictive of the two 47 For information on the differences between FEMA FIRM PFIRM and the Cityrsquos forward-looking flood maps see Appendix 3
Critical components essential to the facilityrsquos functionality should be protected to the higher standard for criticality even if the facility itself is non-critical
NYC Mayorrsquos Office of Recovery and Resiliency Climate Resiliency Design Guidelines
20IIC SEA LEVEL RISE
buildings and other physical infrastructure Many of NYCrsquos coastal flood protection systems are currently being developed to comply with FEMA accreditation for flood levee systems48 The City plans to develop further guidance for designing coastal protection projects
bull For information on the differences between FEMA FIRM PFIRM and the Cityrsquos forward-looking flood maps see Appendix 3
bull Coincident stressors from sea level rise should also be considered For example bridge scour may increase as sea levels rise Similarly flooding during heavy rainfall events can be worsened due to higher tailwater conditions associated with high sea levels Be aware of how different risks may interact and how different interventions can be deployed to address multiple hazards or provide other co-benefits
bull Note projects that require discretionary approval are required to incorporate sea level rise projections as part of the NYC Waterfront Revitalization Program49 and
bull A methodology is under development that will establish a consistent citywide process for addressing legal grade which will have further implications for how sea level rise and precipitation are managed
For more information see Section IE Designers should use the resources and methods described in this section to 1) assess tidal inundation due to sea level rise and 2) address risks in the current and future floodplains
1 Assessing tidal inundation due to sea level riseTidal flooding currently affects parts of NYC and is projected to worsen as sea levels rise and inundate low-lying coastal sites during high tides When determining a site location or establishing scope of substantial improvements for other types of coastal facilities the project team will consider alternative sites outside of zones threatened with regular inundation if resiliency actions are not taken Some facilities such as wastewater treatment plants and harbor facilities need to be near the coast for operational purposes
a) Determine tidal inundation risk from sea level rise Use the Flood Hazard Mapper (httpwwwnycgovfloodhazardmapper)50 to see if your
site is in an area inundated from high tide plus sea level rise within the projectrsquos useful life For example if the useful life ends between 2040 and 2069 choose the 2050s High Tide map) Determine risk only from high tide and sea level rise separate from flood events Follow the instructions in Figure 5 and refer to the example in Figure 6 to review inundation at the end of an assetrsquos useful life
48 For more information please visit httpwwwfemagovfema-levee-resources-library49 For more information visit httpwwwnycgovwrp50 The Flood Hazard Mapper relies on publicly available data to present these map resources Users should also refer to FEMA and the
NPCC for official information
Figure 5 - Flood Hazard Mapper high tide plus sea level rise at httpwwwnycgovfloodhazardmapper
NYC Mayorrsquos Office of Recovery and Resiliency Climate Resiliency Design Guidelines
21IIC SEA LEVEL RISE
b) Address flood risk If the Flood Hazard Mapper shows that the facility is expected to be inundated by
high tides within its useful life or if primary access roads are at risk of inundation consider alternative site options
- OR - If the site is not expected to be regularly inundated by tides proceed to the next
section 2 Addressing Risks in the Current Floodplain
Note on calculating tidal inundations with sea level rise if a project team is interested in understanding the depth of tidal inundation given climate change projections follow these steps First determine the Mean Higher High Water (MHHW) elevation in feet-NAVD 8851 datum nearest to the site If the MHHW data is unavailable from a site specific survey refer to httpwwwnycgovwrp for a list of MHHW elevations (NAVD88) at tide stations across the city52 Second add the high estimate (90th percentile) of expected sea level rise (see Table 8 in Appendix 2) for the year corresponding to the facilityrsquos useful life to the MHHW to determine the projected depth of tidal inundation with sea level rise
51 North American Vertical Datum of 1988 (NAVD 88) is the vertical control datum of orthometric height established for vertical control surveying in the US based upon the General Adjustment of the North American Datum of 1988
httpswwwngsnoaagovdatumsvertical52 SLR elevations at httpwwwnycgovwrp are adjusted to account for sea level rise since the last tidal epoch If no other resource is
available to determine MHHW use the NOAA Online Vertical Datum Transformation tool to calculate the MHHW in feet-NAVD
Figure 6 - Flood Hazard Mapper with high tide in the 2020s (left) and in the 2080s (right) at httpwwwnycgovfloodhazardmapper
NYC Mayorrsquos Office of Recovery and Resiliency Climate Resiliency Design Guidelines
22IIC SEA LEVEL RISE
2 Addressing risks in the current floodplain53
A facility located in the current 1 annual chance floodplain (PFIRM 2015)54 will face increasing risk of flooding during its useful life due to sea level rise increasing the depth of coastal storms This section provides a process for adjusting the design flood elevation required by code to account for sea level rise
a) Find the location of the facility using the Flood Hazard Mapper (httpwwwnycgovfloodhazardmapper) and follow the instructions in Figure 7
bull Choose to view the layer ldquoFEMA Preliminary FIRM 2015rdquo bull Click on the facility site in the 1 floodplain to view the base flood elevation
Figure 7 - Flood Hazard Mapper with FEMA PFIRM (2015) at wwwnycgovfloodhazardmapper
b) If the facility is not in the current 1 annual chance floodplain (PFIRM 2015) proceed to the next section ldquo3 Addressing risks in the future floodplainrdquo
- OR - If the facility is in the current 1 annual chance floodplain (PFIRM 2015) note
the base flood elevation (BFE) and proceed to Step c) below Please note if a facility has multiple BFEs or if the site is partially in the 1 annual chance floodplain it is recommended to use the highest BFE as the current BFE for the entire site
c) Establish a sea level rise-adjusted DFE Use the current base flood elevation at your site the facilityrsquos useful life and its
criticality level to determine the design flood elevation using Table 4 (on the next page) as a basis of design
53 This process for adjusting the design flood elevation to account for sea level rise satisfies the criteria of the climate-informed science approach described at the state and federal level
54 FEMA updates its flood maps periodically As of April 2018 the most recent maps are the Preliminary Flood Insurance Rate Maps (PFIRM) available at DCPrsquos Flood Hazard Mapper (httpwwwnycgovfloodhazardmapper) Also note that NYC Building Code requires developers to use the PFIRM (2015) or the FIRM (2007) whichever is more restrictive For more information on these requirements please refer to Appendix G of the NYC Building Code Please note that the DCP maps are not official and all site locations should be confirmed with the official FEMA PFIRM NYC will provide information on the latest flood maps as they are updated
NYC Mayorrsquos Office of Recovery and Resiliency Climate Resiliency Design Guidelines
23IIC SEA LEVEL RISE
Table 4 - Determine the sea level rise-adjusted design flood elevation for critical and non-critical facilities55
Critical facilities
End of useful life Base Flood Elevation (BFE)56 in NAVD 88 + Freeboard57 + Sea Level Rise
Adjustment58= Design Flood Elevation (DFE) in
NAVD 88Through 2039 FEMA 1 (PFIRM) 24rdquo 6rdquo = FEMA 1 + 30rdquo
2040-2069 FEMA 1 (PFIRM) 24rdquo 16rdquo = FEMA 1 + 40rdquo2070-2099 FEMA 1 (PFIRM) 24rdquo 28rdquo = FEMA 1 + 52rdquo
2100+ FEMA 1 (PFIRM) 24rdquo 36rdquo = FEMA 1 + 60rdquoNon-critical facilities
End of useful life Base Flood Elevation (BFE) in NAVD 88 + Freeboard + Sea Level Rise
Adjustment = Design Flood Elevation (DFE) in
NAVD 88Through 2039 FEMA 1 (PFIRM) 12rdquo 6rdquo = FEMA 1 + 18rdquo
2040-2069 FEMA 1 (PFIRM) 12rdquo 16rdquo = FEMA 1 + 28rdquo2070-2099 FEMA 1 (PFIRM) 12rdquo 28rdquo = FEMA 1 + 40rdquo
2100+ FEMA 1 (PFIRM) 12rdquo 36rdquo = FEMA 1 + 48rdquoAdditional analysis should be conducted to incorporate wave action and wave run-up in DFE calculations especially in areas that are located within the FEMArsquos 1 annual chance Limit of Moderate Wave Action (LiMWA) zone Wave run up is the maximum vertical extent of wave uprush above surge
Definition of critical buildings and infrastructure for determining DFE in Table 4The criticality definitions below are for use in the application of the Guidelines only All items identified as critical in NYC Building Code Appendix G are critical in these guidelines however this list includes additional facilities that are not listed in Appendix G59 If a facility is not listed here it is considered non-critical for the purposes of determining freeboard
bull Hospitals and health care facilitiesbull Fire rescue ambulance and police stations and emergency vehicle garages bull Jails correctional facilities and detention facilities bull Facilities used in emergency response including emergency shelters emergency preparedness communication
operation centers communication towers electrical substations back-up generators fuel or water storage tanks power generating stations and other public utility facilities
bull Critical aviation facilities such as control towers air traffic control centers and hangars for aircraft used in emergency response
bull Major food distribution centers (with an annual expected volume of greater than 170000000 pounds)60 bull Buildings and other structures that manufacture process handle store dispose or use toxic or explosive
substances where the quantity of the material exceeds a threshold quantity established by the authority having jurisdiction and is sufficient to pose a threat to the public if released61
bull Infrastructure in transportation telecommunications or power networks including bridges tunnels (vehicular and rail) traffic signals (and other right of way elements including street lights and utilities) power transmission facilities substations circuit breaker houses city gate stations arterial roadways telecommunications central offices switching facilities etc
bull Ventilation buildings and fan plantsbull Operations centersbull Pumping stations (sanitary and stormwater)bull Train and transit maintenance yards and shopsbull Wastewater treatment plantsbull Water supply infrastructurebull Combined-sewer overflow (CSO) retention tanksbull Fueling stationsbull Waste transfer stations and bull Facilities where residents have limited mobility or ability including care facilities and nursing homes
55 If an industry standard does not include freeboard in its flood protection standards for particular infrastructure assets then only consider the sea level rise adjustment when determining flood protection levels
56 Note that NYC Building Code requires developers to use the PFIRM (2015) or the FIRM (2007) whichever is more restrictive For more information on these requirements please refer to Appendix G of the NYC Building Code
57 These freeboard values reflect NYC Building Code Appendix G Table 2-1 which establishes the minimum elevation of the top of lowest floor Appendix G requires other freeboard values for other parts of structures and in different parts of the floodplain Refer to Appendix G for the appropriate freeboard and use that value in Table 4 above
58 The sea level rise figures provided are for the middle of the 25th-75th percentile range projections from the NPCC These values do not necessarily indicate the average of all models
59 The structural occupancy categories outlined in Appendix G of the NYC Building Code are the same as ASCE 7 used for structural design For critical buildings structural design should comply with ASCE 7 and 24 for design class IV
60 This threshold represents the median volume of main food distributors in NYC according to statistics collected as part of the Five Borough Food Flow study in 2016 available at
httpswwwnycedccomsystemfilesfilesresource2016_food_supply-resiliency_study_resultspdf 61 The threshold quantity for hazardous materials is established by Chapter 7 of Title 24 of the NYC Administrative Code
NYC Mayorrsquos Office of Recovery and Resiliency Climate Resiliency Design Guidelines
24IIC SEA LEVEL RISE
Figure 9 ndash Outdoor emergency generator for the critical building
This case study provides an example of how to calculate a sea level rise-adjusted DFE based on the useful life of a hypothetical critical services building and its primary component
Step 1 Organize the site by various critical or primary components and their year of construction Determine their useful life along with the associated future year scenario for flood risk assessment In this example the building structure and the outside emergency generator are the most at-risk components from combined sea level rise and coastal storm surge
Step 2 Overlay the site footprint area over the effective current PFIRM or FIRM and the corresponding future year scenario FEMA 1 to identify flood risk to the site From overlaying the 2015 preliminary FEMA floodplain over the site it was determined that the site has a 1 annual chance of flooding with a base flood elevation of 13rsquo NAVD Step 3 Evaluate the criticality of each primary component of the facility based on the Guidelinesrsquo definition for critical infrastructure (Table 4) This (hypothetical) building is critical
Step 4 Use Table 4 to determine the sea level rise adjustment and freeboard requirements for each component and calculate the DFE for each that corresponds to its useful life period
Step 5 Compare the DFE of each component and the associated Guidelinesrsquo recommended DFE to calculate anticipated flood depth
CASE STUDY Adjusting the DFE for Sea Level Rise
Table 5 ndash Example of how to calculate a sea level rise-adjusted DFE for a critical facility
Construction year Components Useful
Life
Future Year Scenario
[Useful Life + Const
Year]
BFE in NAVD
88 (feet)
Freeboard + Sea
Level Rise Adjustment
(feet)
Adjusted DFE in
NAVD 88 (feet)
2010 Building Structure
70 years 2070-2099 130rsquo 2rsquo+23rsquo 173rsquo
2010Outdoor
Emergency Generator
25 years
Through 2039 130rsquo 2rsquo+05rsquo 155rsquo
Figure 8 - Example of how to locate a facility within the current floodplain and determine the BFE Figure 9 (inset) - Outdoor emergency generator at the facility
Figure 10 - This schematic shows how to determine the design flood elevation of a facility within the current 1 floodplain
Illustrative not to scale
NYC Mayorrsquos Office of Recovery and Resiliency Climate Resiliency Design Guidelines
25IIC SEA LEVEL RISE
Figure 11 - Flood Hazard Mapper with future 1 annual chance floodplain (adjusted for sea level rise) at httpwwwnycgovfloodhazardmapper
b) If the site is not in the future floodplain no flood protection is required for this facility
- OR - If the site is in the future floodplain identify the nearest adjacent base flood
elevation at the project site in the current 1 annual chance floodplain (PFIRM 2015) using the Flood Hazard Mapper62
c) Use Table 4 to determine the DFE Add freeboard and the sea level rise-adjustment to the nearest adjacent BFE on the
current 1 annual chance floodplain (PFIRM 2015) to determine the DFE
d) Apply the DFE calculation from Table 4 to the protected facility See Figures 12 and 13 for an illustration of how to calculate the DFE
62 Maps of future floodplains show the impacts of sea level rise alone and do not consider how changes in stormsrsquo climatology might also affect wave action and the full extent of the floodplain
3 Addressing risks in the future floodplainIf the facility is not in the current 1 annual chance floodplain (PFIRM 2015) it may still be at risk in the future from flooding as sea level rise increases the extent of the floodplain Follow the steps below to determine if your facility is located in the future floodplain and if so what sea level rise-adjusted DFE to use
a) Use the Flood Hazard Mapper (httpwwwnycgovfloodhazardmapper) to determine if the facility site will be in the future 1 annual chance floodplain
Assess if by the end of the facilityrsquos useful life the floodplain is projected to increase to encompass all or part of the project site For example if the useful life ends between 2040 and 2069 choose the 2050s floodplain map Refer to the steps in Figure 11 below
NYC Mayorrsquos Office of Recovery and Resiliency Climate Resiliency Design Guidelines
26IIC SEA LEVEL RISE
Figure 12 - This schematic map shows how to locate the nearest adjacent 1 floodplain elevation
Figure 13 -This schematic shows how to determine the design flood elevation of a facility that is outside of the current 1 floodplain
CASE STUDY Identifying a Base Flood Elevation (BFE) in the Future Floodplain
Illustrative not to scale
NYC Mayorrsquos Office of Recovery and Resiliency Climate Resiliency Design Guidelines
27IIC SEA LEVEL RISE
4 Identify appropriate design interventions
63 Additional resources for identifying adaptive strategies Urban Waterfront Adaptive Strategies (NYC Department of City Planning httpswww1nycgovassetsplanningdownloadpdfplans-studiessustainable-communitiesclimate-resilienceurban_waterfrontpdf Floodproofing Non-Residential Buildings (FEMA) at httpswwwfemagovmedia-libraryassetsdocuments34270 Ready to Respond Strategies for Multifamily Building Resilience (Enterprise Green Community) at
httpwwwenterprisecommunityorgresourcesready-respond-strategies-multifamily-building-resilience-1335664 While natural systems-based approaches ameliorate flooding their use for storm surge or wave mitigation would need to be quantified
before contributing towards the design flood elevation 65 For more information see FEMArsquos Floodproofing Non-Residential Buildings at httpswwwfemagovmedia-libraryassetsdocuments34270
Operational requirements and continuity plans can inform the selection of appropriate design interventions particularly in terms of how quickly a site needs to be up and running after a flood event Some examples of how functional uses can pair with interventions include
bull A facility that needs to be operating during or immediately after a flood event may need to be dry floodproofed using permanent barriers or designed for passive survivability (such as a police or fire station)
bull A facility that needs to recover quickly after an event could elevate prioritized equipment and have deployable barriers
bull A site that can recover over a longer duration of time could be temporarily inundated during an event (such as parks or plazas) The use of resilient materials and strategies can reduce costly damage caused by temporary inundation
Different design interventions should be chosen based on the specific operational requirements of the project however these must meet the ASCE 24 design requirements for Coastal VE Zones
For all projects at risk of current or future flooding select protections that meet the projectrsquos design flood elevation Consider project-specific factors including the site location operational requirements existing continuity planning and cost63 A Design Strategies Checklist in Appendix 6 is available for use as a resource to track possible design approaches Some examples of design alternatives are
bull Site relocation where feasible conduct alternative site analysis
bull Permanent barriers at a site (eg floodwalls)
bull Deployable flood barriers (eg stop logs flood doorsgates inflatable barriers)
bull Natural systems-based approaches (eg living shorelines restored wetlands)64
bull Prioritized protection of electrical mechanical and other critical or costly-to-replace equipment above the design flood elevation (eg motors and controller boilers and furnaces fuel storage tanks duct work alarm systems and suppression equipment electrical panels electrical distribution and switching areas gas and electric meters telecommunications equipment chemical feed equipment HVAC units and emergency generators)65
bull Dry floodproofing design a facility to prevent water from entering
bull Wet floodproofing design a facility to permit floodwaters to flow in and out of the structure without causing significant damage (eg elevate or protect critical equipment use water-resistant building materials below the design flood elevation include flood vents and pumps)
bull Design redundant telecommunications conduit entrances for multiple carrier entry Telecom conduit should run to diverse manholes when possible
bull Install backup power for telecom equipment with design consideration for such equipment (eg installation above DFE)
bull Install outdoor-rated disconnect switch for telecommunications equipment on the roofbull Explore interventions to protect underground utilities and other telecommunications
facilities from water damagebull Install backflow preventers backwater valves and sump pumps for all buildings and
infrastructure in the floodplain as well as behind flood barriersbull Shoreline improvements that reduce the height of waves or attenuate waves where
feasible
NYC Mayorrsquos Office of Recovery and Resiliency Climate Resiliency Design Guidelines
28IIIA GENERAL METHODOLOGY TO ESTIMATE PROJECT BENEFITSIIIB CATEGORIES OF PROJECT BENEFITS
Designing and constructing facilities to handle the future climate loads above the current NYC codes and standards based on projected useful life of the components provides resiliency benefits The incremental costs to implement the Guidelinesrsquo recommended design interventions should be compared with the incremental benefits to aid agencies in making decisions about resilient design strategies The project design team should evaluate benefits of the interventions designed to meet Guidelinesrsquo recommended criteria for all the climate stressors qualitatively andor quantitatively For projects with construction costs below $50 million the project design team is recommended to perform a qualitative benefits assessment on the interventions that meet the Guidelinesrsquo recommendations for all applicable climate stressors For critical facilities or projects with construction costs over $50 million the project design team is recommended to perform quantitative benefit calculations to identify the optimal interventions that meet Guidelinesrsquo recommended design criteria
A GENERAL METHODOLOGY TO ESTIMATE PROJECT BENEFITSThis general methodology to perform qualitative and quantitative benefit calculations is recommended for use by project design teams at the beginning of and during the design process This methodology enables estimation of project benefits for a high-level benefit-cost analysis (BCA) that can be applied to evaluate and compare resiliency features designed to address sea level rise with coastal storm surge increased precipitation and extreme heat events The type of benefits provided by interventions designed to meet the Guidelinesrsquo design criteria can vary by climate stressors and typology of the facilities The main guiding principle in development of the high-level BCA methodologies included in these Guidelines was to balance simplicity with accuracy The project benefits categories identified within the methodology may not cover all the potential benefits provided by every facility type within NYC In particular the benefits of planning for increased precipitation are difficult to quantify Hence the project design team should use their discretion to modify this general benefit calculation methodology as needed to meet their project goals and objectives The project design team should develop appropriate input data whether quantitative or qualitative needed to estimate project benefits
B CATEGORIES OF PROJECT BENEFITSThere are three types of project benefit categories - direct benefits indirect benefits and other benefits - that can be used to perform qualitative assessments and develop quantitative estimates of monetary benefits for intervention alternatives designed to meet the Guidelinesrsquo recommendations These project benefit categories will help to perform a high-level benefit-cost analysis that balances accuracy with an appropriate level of effort
bull Direct Benefits include reduced or avoided physical damages to facilities and contents reduced or avoided displacements for residential structures and reduced life cycle or OampM costs that can be quantified as a primary result of implementing a specific hazard mitigation measure Table 12 in Appendix 4 provides a list of direct benefits and basic guidance on estimating and documenting values for sea level rise and increased precipitation-related flood hazards Note that given the current state of practice it is not possible to quantify reduced or avoided physical damages or residential displacements that result from a specific extreme heat mitigation measures Therefore direct benefits applicable to extreme heat hazards are limited to reduced life cycle costs applicable to certain measures such as green roofs Refer to Table 15 for details on direct benefits for extreme heat hazards
III EVALUATION OF PROJECT BENEFITS
NYC Mayorrsquos Office of Recovery and Resiliency Climate Resiliency Design Guidelines
29IIIB CATEGORIES OF PROJECT BENEFITS
bull Indirect Benefits include reduced or avoided service losses for non-residential
buildings public facilities andor infrastructure (utilities roads and bridges) based on the value of service continuity andor emergency services to New Yorkers that can be quantified as a secondary result of implementing a specific hazard mitigation measure Table 13 in Appendix 4 provides a list of indirect benefits and basic guidance on estimating and documenting values for sea level rise and increased precipitation-related flood hazards Note that given the current state of practice on extreme heat it is not possible to quantify reduced or avoided service losses that result from a specific extreme heat mitigation measures Therefore indirect benefits applicable to extreme heat hazards are limited to reduced energy costs such as cool roofs green roofs or shade trees Refer to Table 15 in Appendix 4 for details on indirect benefits for extreme heat hazards
bull Other Benefits where applicable other potential benefits may include social benefits for residents such as avoided stress and anxiety avoided lost productivity environmentalecosystem service benefits avoided need for emergency services and other potential benefits that can be estimated as a result of implementing a specific hazard mitigation measure Table 14 in Appendix 4 provides a list of other potential benefits and basic guidance on estimating and documenting values for sea level rise and increased precipitation-related flood hazards
Note on the ecosystem service benefit category in Table 14 the stormwater management benefits of green infrastructure should be distributed between the extreme heat and increased precipitation hazards since these measures provide both significant reductions in rainfall runoff as well as Urban Heat Island mitigation through evapotranspiration However there is currently limited data available to quantify the actual distribution of stormwater management benefits between the two hazards For various dual-benefit providing interventions careful considerations should be given to identify the appropriate benefits category provided by the intervention with a goal to avoid duplication of quantified benefits In this methodology the stormwater management benefits of green infrastructure are applied to the increased precipitation hazard in order to avoid a duplication of benefits Note on real estate and quality of life benefits additionally it is important to note that two potential benefit categories shown in Table 14 - real estate and quality of lifehealthavoided casualties - were not included in the current BCA methodology for sea level rise or increased precipitation hazards Although these categories could increase project benefits for sea level rise and increased precipitation hazards they were only applied to measures that address extreme heat hazards such as green roofs trees and other plantings Refer to Table 15 for a detailed summary of other benefit categories quantified as unit benefits for extreme heat hazards
NYC Mayorrsquos Office of Recovery and Resiliency Climate Resiliency Design Guidelines
30IIIC WHICH METHODOLOGY TO USEIIID BCA METHODOLOGY FOR PROJECTS UNDER $50 MILLION
D BCA methodology for projects under $50 millionThe project design team should develop design alternatives to meet the Guidelinesrsquo criteria which may be in excess of NYC code and standards requirements (baseline conditions) It is assumed that the project design team will develop alternatives to address each of the following applicable climate stressors - sea level risecoastal storm surge increased precipitation and extreme heat - separately Tables 12-15 in Appendix 4 provides a list of typical direct indirect and other benefits provided by various intervention typologies to reduce impacts from climate stressors During the qualitative assessment the project design team should consider that intervention strategies will have varying levels of reliability effectiveness benefits and cost implications during the qualitative assessment
The project design team is recommended to develop appropriate evaluation criteria and metrics for each of the applicable project benefit categories For each alternative the project design team could use either a scoring weighting ranking or other type of qualitative assessment framework to assess each applicable project benefit categories with the developed evaluation criteria and metrics Table 6 provides an example template to evaluate alternatives using a set of general evaluation criteria and metrics using a color-coded rating system (and see Table 7 for an example of how to complete the template) The project design team can utilize a similar template customized to their project goals and objectives This assessment allows agencies to screen the qualitative benefits for various alternatives that would then lead to development of final project components to match the available budget and goals of the project
Projects with total costs below $50 million recommended to conduct a qualitative assessment to identify the optimal interventions that meet Guidelinesrsquo design criteria using the ldquoD) BCA methodology for projects under $50 millionrdquo methodology below
C WHICH METHODOLOGY TO USEProjects with a total cost above $50 million or are highly complex or critical facilities recommended to conduct both a qualitative and quantitative benefit calculation to identify the optimal interventions that meet Guidelinersquos design criteria using the ldquoE) BCA methodology for projects above $50 millionrdquo below A quantitative BCA also must include qualitative factors
NYC Mayorrsquos Office of Recovery and Resiliency Climate Resiliency Design Guidelines
31IIID BCA METHODOLOGY FOR PROJECTS UNDER $50 MILLION
Qualitative Color Scale Green=Least resource intensive alternative Purple=most resource intensive yellow=medium level of resource intensity
Qualitative Evaluation Factors Description Relative Color Rating System
First CostsAdditional construction costs needed to incorporate Guidelinesrsquo recommended resilient design over the baseline project costs
Highest cost ($$$) rated as Purple whereas lowest cost ($) rated as Green
ConstructabilityEase of Implementation
Construction techniques and site conditions such as presence of major utilities conflicts and other conditions which dictate the level of constructability required for each alternative
Difficult to construct rated as Purple whereas easiest to construct rated as Green
Environmental ImpactsCo-BenefitsPermitting
Impacts to the built and natural environment such as circulation noise and hazardous waste plus the level of effort required for permitting (eg interventions in water require highest level of permitting requirement) from each alternative in addition to the baseline project condition
Highest environmental impacts and highest level of effort required for permitting rated as Purple whereas the least impact and level of effort rated as Green
Operation and Maintenance (OampM)
Level of effort of additional manpower and cost of OampM for the alternatives over the baseline project OampM requirements
Highest level of effort and cost for OampM rated as Purple whereas the lowest is rated as Green
Reliability and Durability
Interventions that do not require human involvement or a facilityrsquos ability to withstand all the forces during a storm event (eg permanent solutions with higher reliability than deployable solution)
Interventions requiring human involvement (active measures) rated as Purple whereas interventions with minimal or no human involvement (passive measures) rated as Green
Risk Reduction Benefits Monetary benefits provided by each intervention alternative in avoided damages over the baseline condition
Lowest potential monetary benefit rated as Purple whereas as highest potential monetary benefit rated as Green
Quality of Life BenefitsVisual Aesthetics
Benefits either to the community such as recreation or safety or serve the community during emergency situations
Lowest potential quality of life benefits rated as Purple whereas as highest potential benefits rated as Green
Table 6 ndash Evaluation matrix for comparison of mitigation alternatives across the useful life of a project
Project title_______________________________________________________________________________
Evaluation Criteria
Baseline Condition (Designed to NYC Building Code and
Standards)
Resilient Design Alternatives for Managing__________________
Alternative 1
Alternative 2
Alternative 3
First Costs
ConstructabilityEase of ImplementationEnvironmental ImpactsCo-BenefitsPermitting
Operation and Maintenance (OampM)
Reliability and Durability
Risk Reduction Benefits
Quality of Life BenefitsVisual Aesthetics
NYC Mayorrsquos Office of Recovery and Resiliency Climate Resiliency Design Guidelines
32IIID BCA METHODOLOGY FOR PROJECTS UNDER $50 MILLION
Table 7 ndash Evaluation matrix for comparison of mitigation alternatives across the useful life of a project - COMPLETED EXAMPLE
Evaluation Criteria
Baseline Condition (Designed to NYC Building Code and
Standards)
Resilient Design Alternatives for Managing Coastal SurgeSLR
Alternative 1Flood proof building built on grade to Guidelines
DFE
Alternative 2 Elevate building structure above Guidelinesrsquo DFE
on columns
Alternative 3 Raise site grade by filing the building site footprint
to Guidelinesrsquo DFE
First CostsBaseline cost for building structure is $15 million
Incremental costs are within 5 over the baseline costs
Incremental costs are between 5-10 over baseline costs
Incremental costs are 20 and more over baseline costs
ConstructabilityEase of Implementation
Relatively easy to construct within site constraints
Similar to baseline conditions since construction requires additional flood proofing only
Moderate challenges to construct foundation structure for columns within site constraints
Extremely challenging to construct within the site constraints Potentially fatal flaw
Environmental ImpactsCo-BenefitsPermitting
No major impacts but may require additional effort to obtain DOB permits with flood proofing and deployable systems
No major impacts but may require additional effort to obtain DOB permits with flood proofing and deployable systems
No major impacts and relatively easy to permit
Potential drainage circulation impacts and challenges to obtain clean fill material for the site
Operation and Maintenance (OampM)
Major OampM costs associated with deployable systems
Major OampM costs associated with deployable systems
Moderate OampM costs associated with proposed elevator for access
Minimal OampM costs since deployable and elevators not required
Reliability and Durability
Least reliability with highest potential risk from flooding during to failure of deployable systems
Least reliability with highest potential risk from flooding during to failure of deployable systems
Moderate reliability with potential risk from flooding limited to elevator shaft only
Highest reliability since deployable are not required to protect building from flooding
Risk Reduction Benefits
Maximum flood risk reduction benefits assuming deployable and flood proofing is effective
Maximum flood risk reduction benefits assuming deployable and flood proofing is effective
Maximum flood risk reduction benefits
Maximum flood risk reduction benefits
Quality of Life BenefitsVisual Aesthetics
Facility may not be operational during the storm event
Facility may not be operational during the storm event
Facility can be potentially operational during the storm event
Facility can be potentially operational during the storm event
Qualitative Color Scale Green=Least resource intensive alternative Purple=most resource intensive yellow=medium level of resource intensity
A new non-critical facility with a building structure is proposed on a site that is currently in the 2015 Preliminary FEMA 1 annual chance floodplain with a BFE of 10rsquo (NAVD 88) The baseline conditions DFE to meet existing NYC codes and standards is 11rsquo (NAVD 88) Using the Guidelines recommended design criteria the facilityrsquos DFE is 133rsquo (NAVD 88) and existing grade is around 6rsquo (NAVD 88) The project design team develops three alternatives to meet the Guidelinesrsquo recommended DFE design for the facility Table 7 offers an example of how a qualitative assessment can be used to compare three resilient design alternatives using the evaluation criteria and metrics
CASE STUDY Example of How to Use the Evaluation Matrix
NYC Mayorrsquos Office of Recovery and Resiliency Climate Resiliency Design Guidelines
33IIIE BCA METHODOLOGY FOR PROJECTS OVER $50 MILLION
E BCA methodology for projects over $50 millionIn order for a project to be considered cost-effective a benefit-cost analysis (BCA) assesses if the benefits of a project outweigh its costs or in other words the benefit-cost ratio (BCR) is greater than 10 as illustrated in Equation 1
Equation 1 Benefit-Cost Ratio Formula
BCR =
Where BCR = Benefit-Cost Ratio
BENEFITS = Total project benefits
COSTS = Total project costs
BENEFITSCOSTS
These estimated project benefits are combined with the project costs which are defined as the differential construction and long-term operation and maintenance costs associated with constructing a proposed project to the Guidelinesrsquo recommended design level It is assumed that the baseline project will be designed to the most prevalent NYC codes and standards This benefit methodology should be used to determine the additional project benefit that the Guidelinesrsquo recommended design would provide over the baseline project benefit It is assumed that the project design team will develop alternatives to address each of the following applicable climate stressors - sea level risecoastal storm surge increased precipitation and extreme heat - separately For each alternative the project design team should use the following steps to determine the Benefit-Cost Ratio (BCR)
a) Determine project useful life for design interventions Determining the useful life of the proposed project is an important first step in the
detailed BCA assessment methodologies for two reasons First the project useful life determines what values must be used from the Guidelines to establish the future climate design conditions The various hazard tables in the Guidelines establish design requirements based on useful life ranges through 2039 2040-2069 2070-2099 and 2100+ (2100+ projections are only available for sea level rise) A review of these tables show that the design requirements needed to meet the projected climate hazards increase as the end of useful life range increases Second the useful life determines how long the project will need to be operated and maintained in order to remain technically sound and effective at reducing future damages and losses
b) Determine discount rate for project benefits calculation The cost-effectiveness of projects assessed using the BCR must be done on a net
present value basis meaning the present value of the benefits is compared to the present value of the costs Most project costs are computed for present value based on current cost estimates bids or cost guidance However project benefits - as well as project costs for operation and maintenance - accrue over time into the future and are computed on an annualized basis To address this issue the Present Value Coefficient (PVC) is used to bring these annualized project benefits and OampM costs into the present value As indicated by the formula in Equation 2 the PVC is a function of the Project Useful Life (PUL) and the Discount Rate (DR)
NYC Mayorrsquos Office of Recovery and Resiliency Climate Resiliency Design Guidelines
34
Equation 2 Present Value Coefficient (PVC) Formula
PVC =
Where PVC = Present Value Coefficient
PUL = BCA Project Useful Life based on project type
DR = Discount Rate
The project design team should coordinate with agencies and NYC OMB if needed to determine appropriate discount rates based on funding source project type and other factors This coordination should take place during project initiation phase where total project costs (design and construction) are over $50 million66
c) Develop input data to perform benefit calculations Tables 16 and 17 in Appendix 4 provide a list of typical input data by each climate
stressor needed to perform benefit analysis quantitatively on variety of facilities67 The project design team should use these tables as a reference to identify appropriate input data categories andor additional input data needed to perform benefit analysis on the project
d) Identify applicable project benefit categories to estimate benefits Tables 16 and 17 in Appendix 4 provide a list of typical project benefits by each climate
stressor needed to perform benefit analysis quantitatively on various types of projects The project design team should use these tables as a reference to identify appropriate project benefit categories for each climate stressor to perform benefit analysis on the project
e) Calculate benefits of recommended design interventions for each climate
stressor The input data and applicable project benefits can be assembled along with
incremental project cost data to analyze cost-effectiveness using the FEMA BCA Tool Damage-Frequency Assessment (DFA) module or similar software This analysis will provide a BCR for each alternative which can then be used to compare the alternatives that were developed to mitigate effects from applicable climate stressors The project design team can then use the results from this analysis to identify optimal interventions that provides a balanced solution that provides resiliency benefits within the available project budget
IIIE BCA METHODOLOGY FOR PROJECTS OVER $50 MILLION
[1 ndash (1 + DR) -(PUL)]DR
66 For example a NYC OMB March 2015 memorandum recommends using an annually updated DR as published each year in Appendix C of OMB Circular A-94 The current OMB-recommended discount rates from OMB A-94 Appendix C vary by project useful life and are as follows 21 DR for useful lives of 10 to 19 years 25 DR for useful lives of 20 to 29 years and 28 DR for useful lives of 30 years or greater By contrast FEMA hazard mitigation grants use a DR of 70 for all projects based on the Federal OMB A-94 rate for federally-funded mitigation measures Since these DRs will impact the PVC and the project benefits the project team must ensure that BCA results prepared using an OMB-recommended DR (21 to 28) be updated to reflect the Federal DR (70) when applying for FEMA mitigation grant funds
67 Note the data requirements for the sea level rise and increased precipitation hazards in Table 16 are more detailed than the requirements for the extreme heat hazards due to the less detailed level of analysis available for extreme heat
NYC Mayorrsquos Office of Recovery and Resiliency Climate Resiliency Design Guidelines
35
APPENDICES
NYC Mayorrsquos Office of Recovery and Resiliency Climate Resiliency Design Guidelines
36APPENDIX 1 ndash KEY TERMS
100-year flood (1 annual chance flood)
A flood that has a 1 probability of occurring in any given year The 100-year floodplain is the extent of the area of a flood that has a 1 chance of occurring or being exceeded in any given year
500-year flood (02 annual chance flood)
A flood that has a 02 probability of occurring in any given year The 500-year floodplain is the extent of the area of a flood that has a 02 chance of occurring or being exceeded in any given year
AdaptationAdjustment in natural or human systems to a new or changing environment that seeks to maximize beneficial opportunities or moderate negative effects Successful adaptations contribute to resiliency
Base flood elevation (BFE)The elevation of surface water resulting from a flood that has a 1 annual chance of occurring or being exceeded in any given year The BFE is shown on the Flood Insurance Rate Map (FIRM)69
BluebeltReference to the Department of Environmental Protectionrsquos (DEP) Bluebelt program to preserve natural drainage corridors including streams ponds and other wetland areas Preservation of these wetland systems allows them to perform their functions of conveying storing and filtering storm water
Climate
The average weather (or more rigorously a statistical description of the average in terms of the mean and variability) over a period of time usually 30 years These quantities are most often surface variables such as temperature precipitation and wind Climate in a wider sense is the state including a statistical description of the climate system70
Climate change
Changes in average weather conditions that persist over multiple decades or longer Climate change encompasses both increases and decreases in temperature as well as shifts in precipitation changing risk of certain types of severe weather events and changes to other variables of the climate system
Climate change riskThe chance that investments (such as in capital projects) can be affected by the physical impacts of climate change71 Risks are evaluated as a product of the probability of occurrence and the magnitude of damages or impacts including socioeconomic factors that would result if they did occur (consequences)
Climate change risk assessment
This assessment involves a detailed project-specific analysis that includes a vulnerability and risk assessment often followed by cost-benefit analysis to assess and select investments in climate change risk mitigation Risk is assessed as a function of the magnitude and probability of a given climate change hazard Examples resources are included in Appendix 7
Climate vulnerabilityThe degree to which systems and populations are affected by adverse impacts It is a function of the character magnitude and rate of climate change and variation to which a system is exposed its sensitivity and its adaptive capacity72
Cloudburst An extreme amount of rain in a short period of time often over a small geographic area73
Cooling Degree Day (CDD) A form of degree-day used to estimate the energy requirements for air conditioning or refrigeration when the daily mean temperature is above 65degF
68 All terms are from the US Global Change Research Program (USGCRP) glossary unless otherwise noted The USGCRP glossary is available at httpwwwglobalchangegovclimate-changeglossary
69 ldquoDefinitionsrdquo FEMA last modified March 1 2017 httpswwwfemagovnational-flood-insurance-programdefinitions70 UKCIP Glossary httpwwwukciporgukglossary71 ldquoAccount for Climate Riskrdquo International Finance Corporation 72 UKCIP Glossary httpwwwukciporgukglossary73 New York City Environmental Protection ldquoCloudburst Resiliency Planning Studyrdquo 2017 Available at httpwwwnycgovhtmldeppdfclimatenyc-cloudburst-studypdf
APPENDIX 1 - KEY TERMS68
NYC Mayorrsquos Office of Recovery and Resiliency Climate Resiliency Design Guidelines
37APPENDIX 1 ndash KEY TERMS
Design life The life expectancy of an asset or product as determined during design74 As opposed to useful life (see below)
Dry Bulb temperature The ambient air temperature measured by a thermometer
Extreme eventUnexpected unusual or unpredictable weather or flooding compared to historical or future projected distribution Extreme events include for example heat waves cold waves heavy rains periods of drought and flooding and severe storms
Facilities For the purposes of this document ldquofacilitiesrdquo refers to all types of buildings housing infrastructure structures and landscape features designed by or for the City of New York
Flexible adaptation pathwayResilience-building strategies that can evolve or be adapted over time as climate change risk assessments evaluations of adaptation strategies and monitoring continue75
Flood Insurance Rate Maps (FIRM)
Official flood map of a community on which FEMA has delineated the 1 annual chance floodplain and the base flood elevations (BFEs) applicable to the community76 The FIRM also includes the 02 floodplain annual chance floodplain and differentiates between special flood hazard areas (V A Coast A zones) and floodways The official FIRM is from the year 2007 while the 2015 PFIRM is currently required by NYC Building Code to calculate design flood elevations NYC DOB references the more restrictive of the two maps in both base flood elevation and flood hazard area (ie V versus A zone) Refer to Appendix 3 for more information
FreeboardAn additional amount of height above the base flood elevation used as a factor of safety (eg two feet above the base flood) in determining the level at which a facilitys lowest floor must be elevated or floodproofed to be in accordance with state or community floodplain management regulations77
Future time slices
Future periods defined by the NPCC for when climate change projections are available In this document the following decadal projections are associated with specific time spans2020s projection = present to 20392050s projection = 2040 to 20592080s projection = 2070 to 20992100s projection = end of century and beyond
Green infrastructureAn array of practices that use or mimic natural systems to manage urban stormwater runoff Water is either directed to engineered systems for infiltration or detained for longer periods before it enters the sewer system
Heat Vulnerability Index (HVI)Summarizes relative risk of adverse health effects from heat due to social and environmental factors Used to identify neighborhoods at higher risk during and after extreme heat events
Heat wave A period of three consecutive days where temperatures rise above 90degF or two consecutive days over 95 degrees78
New York City Panel on Climate Change (NPCC)
The body of leading climate and social scientists charged with making climate change projections for the metropolitan region79
74 Sustainable Infrastructure Management Program Learning Environment httpsimplewerforg 75 Rosenzweig C et al Climate Change Adaptation in New York City Building a Risk Management Response76 ldquoDefinitionsrdquo FEMA77 Ibid78 Horton R et al New York City Panel on Climate Change 2015 Report Chapter 1 Climate Observations and Projections Ann NY
Acad Sci ISSN 0077-8923 (New York 2015) 2579 For more information on the NPCC visit www1nycgovsiteorrchallengesnyc-panel-on-climate-changepage
NYC Mayorrsquos Office of Recovery and Resiliency Climate Resiliency Design Guidelines
38APPENDIX 1 ndash KEY TERMS
Open-grid pavement system
Pavements that consist of loose substrates supported by a grid of a more structurally sound grid or webbing Unbounded loose substrates in these systems transfer and store less heat than bound and compacted pavements and aid permeability Pavement is 50 pervious and contains vegetation in the open cells designed to allow percolation or infiltration of storm water through the surface into the soil below80
Preliminary Flood Insurance Rate Map (PFIRM)
Preliminary flood map developed by FEMA in 2015 for New York City that provides projected risks for flood hazards81 Refer to Appendix 3 for more information
Project useful life (PUL)
The period over which an asset or component is expected to be available for use by an entity This depends on regular and adequate maintenance This period of time typically exceeds the design life (see above) The combined effect of operational requirements and useful life is practical in assessing an investment in improving resilience82
Rain gardenAlso called ldquobioswalerdquo Planted areas designed to collect and manage stormwater that runs off streets sidewalks commercial and residential rooftops and other sources when it rains
Resiliency The ability to bounce back after change or adversity The capability of preparing for responding to and recovering from difficult conditions83
Sea level rise-adjusted design flood elevation
As defined in these Guidelines the increased height of the base flood elevation due to sea level rise plus freeboard depending on the criticality of the facility The sea level rise adjustment depends on the useful life of the facility
Storm surge An abnormal rise of water generated by a storm over and above predicted astronomical tides84
Substantial improvementAny repair reconstruction rehabilitation addition or improvement of a building or structure the cost which equals or exceeds 50 of the market value of the structure before the improvement or repairs started For more information see Appendix G of the NYC Building Code and 1 RCNY sect3606-0185
Tidal inundation Flooding which occurs at high tides due to climate-related sea level rise land subsidence andor the loss of natural barriers86
Urban Heat Island (UHI) effectThe tendency for higher air temperatures to persist in urban areas as a result of heat absorbed and emitted by buildings and asphalt tending to make cities warmer than the surrounding suburban and rural areas
Weather The state of the atmosphere at a given time with regard to temperature cloudiness precipitation wind and other meteorological conditions87
Wet Bulb temperatureThe temperature indicated when a thermometer bulb is covered with a water-saturated wick over which air is caused to flow at approximately 45 ms (900 ftmin) to reach the equilibrium temperature of water evaporating into the air when the heat of vaporization is supplied by the sensible heat of the air88
80 ldquoGlossaryrdquo US Green Building Council (2017) Available at httpwwwusgbcorgglossaryterm552581 ldquoPreliminary FEMA Map Productsrdquo FEMA Map Service Center Available at httpshazardsfemagovfemaportalprelimdownload82 ldquoGlossaryrdquo International Infrastructure Management Manual (2011) 83 A Stronger More Resilient New York (2013) 184 ldquoStorm Surge Overviewrdquo National Hurricane Center NOAA Available at httpswwwnhcnoaagovsurge85 ldquoFlood Resistant Constructionrdquo Appendix G New York City Building Code (2008) and 1 RCNY sect3606-01 available at httpswww1nycgovassetsbuildingsrules1_RCNY_3606-01pdf86 ldquoOcean Factsrdquo National Ocean Service NOAA Available at httpoceanservicenoaagovfactsnuisance-floodinghtml 87 UKCIP Glossary httpwwwukciporgukglossary88 ldquoASHRAE Terminologyrdquo ASHRAE Available at httpswwwashraeorgtechnical-resourcesauthoring-toolsterminology
NYC Mayorrsquos Office of Recovery and Resiliency Climate Resiliency Design Guidelines
39APPENDIX 2 - CLIMATE CHANGE PROJECTIONS
Climate change projections are provided by the New York City Panel on Climate Change (NPCC) The full NPCC report is available from the New York Academy of Sciences89 Tables 8-10 (below) were reproduced directly from the NPCC report while Table 2 (see Section IIA) was developed using the data underlying the NPCC report to inform the design of HVAC systems under warmer conditions
Table 8 ndash NYC sea level rise projections90
Baseline (2000-2004) 0 in
Low estimate (10th percentile)
Middle range (25th to 75th percentile)
High estimate (90th percentile)
2020s 2 in 4-8 in 10 in
2050s 8 in 11-21 in 30 in
2080s 13 in 18-39 in 58 in
2100 15 in 22-50 in 75 in
Note Projections are based on six-component approach that incorporates both local and global factors The model-based components are from 24 global climate models and two representative concentration pathways Projections are relative to the 2000-2004 base period
Table 9 ndash Mean annual changes91
a Temperature Baseline(1971-2000) 54degF
Low estimate (10th percentile)
Middle range (25th to 75th percentile)
High estimate (90th percentile)
2020s + 15degF +20-29degF +32degF
2050s +31degF +41-57degF +66degF
2080s +38degF +53-88degF +103degF
2100 +42degF +58-104degF +121F
b Precipitation Baseline(1971-2000) 501 in
Low estimate (10th percentile)
Middle range (25th to 75th percentile)
High estimate (90th percentile)
2020s -1 percent +1-8 +10
2050s +1 percent +4-11 +13
2080s +2 percent +5-13 +19
2100 -6 percent -1 to +19 +25
Note Based on 35 global climate models (GCMs) and two RCPs Baseline data cover the 1971ndash2000 base period and are from the NOAA National Climatic Data Center (NCDC) Shown are the low estimate (10th percentile) middle range (25th percentile to 75th percentile) and high estimate (90th percentile) These estimates are based on a ranking (from most to least) of the 70 (35 GCMs times 2 RCPs) projections The 90th percentile is defined as the value that 90 percent of the outcomes (or 63 of the 70 values) are the same or lower than Like all projections the NPCC climate change projections have uncertainty embedded within them Sources of uncertainty include data and modeling constraints the random nature of some parts of the climate system and limited understanding of some physical processes The NPCC characterizes levels of uncertainty using state-of-the-art climate models multiple scenarios of future greenhouse gas concentrations and recent peer-reviewed literature Even so the projections are not true probabilities and the potential for error should be acknowledged
89 The NPCC 2015 report is available at httponlinelibrarywileycomdoi101111nyas20151336issue-1issuetoc90 From New York City Panel on Climate Change 2015 Report Chapter 1 Climate Observations and Projections page 4191 From New York City Panel on Climate Change 2015 Report Chapter 1 Climate Observations and Projections page 30
APPENDIX 2 - CLIMATE CHANGE PROJECTIONS
NYC Mayorrsquos Office of Recovery and Resiliency Climate Resiliency Design Guidelines
40APPENDIX 2 - CLIMATE CHANGE PROJECTIONS
Table 10 ndash Extreme events92
2020s Baseline (1971-2000)
Low estimate(10th percentile)
Middle range(25th to 75th percentile)
High estimate (90th percentile)
Numbers of heat waves per year 2 3 3-4 4
Average heat wave duration (days) 4 5 5 5
Number of days per year with
Maximum temperature at or above 90degF 18 24 26-31 33
Maximum temperature at or above 100degF 04 07 1-2 2
Minimum temperature at or below 32degF 71 50 52-58 60
Rainfall at or above 1 inch 13 13 14-15 16
Rainfall at or above 2 inches 3 3 3-4 5
Rainfall at or above 4 inches 03 02 03ndash04 05
2050s Baseline (1971-2000)
Low estimate(10th percentile)
Middle range(25th to 75th percentile)
High estimate (90th percentile)
Numbers of heat waves per year 2 4 5-7 7
Average heat wave duration (days) 4 5 5-6 6
Number of days per year with
Maximum temperature at or above 90degF 18 32 39-52 57
Maximum temperature at or above 100degF 04 2 3-5 7
Minimum temperature at or below 32degF 71 37 42-48 52
Rainfall at or above 1 inch 13 13 14-16 17
Rainfall at or above 2 inches 3 3 4-4 5
Rainfall at or above 4 inches 03 03 03-04 05
2080s Baseline (1971-2000)
Low estimate(10th percentile)
Middle range(25th to 75th percentile)
High estimate (90th percentile)
Numbers of heat waves per year 2 5 6-9 9
Average heat wave duration (days) 4 5 5-7 8
Number of days per year with
Maximum temperature at or above 90degF 18 38 44-76 87
Maximum temperature at or above 100degF 04 2 4-14 20
Minimum temperature at or below 32degF 71 25 30-42 49
Rainfall at or above 1 inch 13 14 15-17 18
Rainfall at or above 2 inches 3 3 4-5 5
Rainfall at or above 4 inches 03 02 03-05 07
Note Projections for temperature and precipitation are based on 35 GCMs and 2 RCPs Baseline data are for the 1971 to 2000 base period and are from the NOAA National Climatic Data Center (NCDC) Shown are the low estimate (10th percentile) middle range (25th to 75th percentile) and high estimate (90th percentile) 30-year mean values from model-based outcomes Decimal places are shown for values less than one although this does not indicate higher precisioncertainty Heat waves are defined as three or more consecutive days with maximum temperatures at or above 90degF Like all projections the NPCC climate change projections have uncertainty embedded within them Sources of uncertainty include data and modeling constraints the random nature of some parts of the climate system and limited understanding of some physical processes The NPCC characterizes levels of uncertainty using state-of-the-art climate models multiple scenarios of future greenhouse gas concentrations and recent peer-reviewed literature Even so the projections are not true probabilities and the potential for error should be acknowledged
92 From New York City Panel on Climate Change 2015 Report Chapter 1 Climate Observations and Projections page 31
NYC Mayorrsquos Office of Recovery and Resiliency Climate Resiliency Design Guidelines
41APPENDIX 3 - DIFFERENTIATION OF FLOOD MAPS
These Guidelines reference several different kinds of flood maps and sources of design flood elevations These maps are described and differentiated below
Table 11 - Differentiation of flood maps used in NYC
Reference Title Data Source Information Provided Referenced By Link
2007 FIRM FEMA
Based on historical data from before 1983 identifies the current base flood (extent and elevation) as the flood that has a 1 chance of occurring in any given year also known as a 100-year flood The NYC Building Code requires that either the 2007 FIRM or 2015 PFIRM elevation be used whichever is higher
2014 NYC Building Code Appendix G
Climate Resiliency Design Guidelines
httpsmscfemagovportal
2015 PFIRM FEMA
Based on historical data identifies the current base flood (extents and elevation) as the flood that has a 1 chance of occurring in any given year also known as a 100-year flood The NYC Building Code requires that either the 2007 FIRM or 2015 PFIRM elevation be used whichever is higher The 2015 PFIRM is currently being reassessed by FEMA
2014 NYC Building Code Appendix G
Climate Resiliency Design Guidelines
httpshazardsfemagovfemaportalprelimdownload
httpwwwregion2coastalcomview-flood-maps-dataview-preliminary-flood-map-data
NYC Flood Hazard Mapper
NYC Department of City Planning
Maps current and future flood hazards in NYC including the following data layers 2007 FIRM and 2015 PFIRM high tide with sea level rise and PFIRM with sea level rise through 2100
Climate Resiliency Design Guidelines
Waterfront Revitalization Plan
httpwww1nycgovsiteplanningdata-mapsflood-hazard-mapperpage
ldquoTable 4 ndash Determine the sea level rise-adjusted design flood elevation for critical and non-critical facilitiesrdquo
ORR amp NPCC
Provides data to use when adding sea level rise to a given 2015 PFIRM or 2007 FIRM Base Flood Elevation (BFE) to calculate a Design Flood Elevation (DFE) Based on the criticality and expected useful life of a facility
Climate Resiliency Design Guidelines
See Section II on ldquoSea Level Riserdquo above
APPENDIX 3 - DIFFERENTIATION OF FLOOD MAPS
NYC Mayorrsquos Office of Recovery and Resiliency Climate Resiliency Design Guidelines
42APPENDIX 4 - PROJECT BENEFITS CATEGORIES
This appendix provides guidance on how to identify and assess benefits as a supplement to Sections IIID and IIIE
Table 12 lists typical direct benefits for reducing impacts from climate stressors and basic guidance for how to estimate them See Section IIID for more information
Table 13 lists typical indirect benefits for reducing impacts from climate stressors and basic guidance for how to estimate them See Section IIID for more information
Table 12 ndash Direct benefits for (1) sea level rise with coastal storm surge and (2) increased precipitation measures
Direct Benefit Basic Guidance for Estimating Values
Physical Damages (Structure Contents)
bull For flood-damaged buildings use depth damage functions developed by FEMA and USACE for structures and contents
bull Use depth damage functions in conjunction with Building Replacement Values (BRVs) and not market values BRVs typically range between $100 to $325SF for residential buildings and $120 to $450SF for commercial public buildings
bull For more complex structures or facilities use engineering estimates of flood damages or review historic flood damages documented from insurance claims repair records or FEMA Public Assistance claims from recent flood disasters
Residential Displacements
bull For flood-damaged buildings use depth damage functions developed by FEMA and USACE for residential displacements
Reduced Life CycleOperation and Maintenance (OampM) Costs93
bull Applicable only to projects that reduce overall life cycle costs or net annual OampM costs from baseline conditions
bull Input reduced annual OampM costs as a project benefit at a 1-year recurrence intervalbull Reduced overall life cycle costs can be input as a longer project useful life
Table 13 ndash Indirect benefits for (1) sea level rise with coastal storm surge and (2) increased precipitation measures
Indirect Benefit Basic Guidance for Estimating Values
Non-Residential Building Service Losses
bull Estimate service loss values and durations for non-residential buildings public buildings critical facilities and parksnatural features based on FEMA BCA guidance and standard values based on building use
Utility Service Losses94
bull Estimate utility service losses for water wastewater and electrical facilities based on the number of impacted customers FEMA per capita standard values for utility service ($105personday for potable water $49personday for wastewater $148personday for electrical)95
bull Estimate utility service loss durations based on engineering estimates or review historic flood damages losses documented from utility company records
bull This benefit can also apply to measures that increase energy efficiency
RoadBridge Service Losses
bull Estimate roadbridge service losses based on the average daily traffic (ADT) detour time and additional travel distance and FEMA and GSA standard values for road service ($3344vehiclehour of delay $0545mile)96
bull Estimate roadbridge service loss durations or review historic flood damages losses
Emergency Service Losses
bull Applicable only to projects that reduce or eliminate documented emergency service costs from baseline conditions
bull Examples of avoided emergency services costs include NYPD staffing to monitor barricades for flooded roads or NFDY staffing for water rescues of residents from flooded buildings or streets
APPENDIX 4 - PROJECT BENEFITS CATEGORIES
93 Reduced life cycle costs may be applicable to some measures that provide extreme heat benefits such as green roofs that can last longer than a standard roof if properly maintained
94 Reduced utility service costs may be applicable to some measures that provide extreme heat benefits such as cool roofs green roofs and shade trees
95 FEMA per capita standard values taken from FEMA BCA Toolkit Version 530 (Build Date 12222016) and developed in FEMArsquos Baseline Standard Economic Value Methodology Report (July 28 2016) Consider updating FEMA standard per capita values to reflect current New York City utility rates
96 Consider updating FEMA and GSA standard values to reflect current New York City area labor rates and fuel costs
NYC Mayorrsquos Office of Recovery and Resiliency Climate Resiliency Design Guidelines
43APPENDIX 4 - PROJECT BENEFITS CATEGORIES
Table 14 ndash Other potential benefits for (1) sea level rise with coastal storm surge and (2) increased precipitation measures
Other Benefit Basic Guidance for Estimating Values
Avoided Stress and Anxiety
bull Applicable only for projects that directly benefit occupants of residential structuresbull Use FEMA standard value for avoided mental stress and anxiety treatment costs of $2443person to
estimate benefit for all impacted residents97
Avoided Lost Productivity
bull Applicable only for projects that directly benefit occupants of residential structuresbull Use FEMA standard value for avoided lost worker productivity costs of $8736household to estimate
benefit for all impacted workers (conservatively assuming one worker per household)
Environmental Open Space
bull Applicable only for projects that create or acquire open space areas by acquisitionbull Use FEMA standard value for environmental open space based on the type of land acquired ($8308
Acreyear for Green open space $39545Acreyear for Riparian $6010Acreyear for Wetlands $554Acreyear for Forests $1799Year for Marine and estuary)97
CSO Volume Reduction
bull Applicable only for projects that provide Combined Sewer Overflow (CSO) abatement by reducing the volume of rainfall runoff
bull Use CSO abatement cost of $0015gallonsyear applied to increased precipitation hazard runoff volume for 5-year design storm98
Ecosystem Service99
bull Add stormwater management benefits of green infrastructure projects to increased precipitation hazards where avoided damages and service losses are not quantified
bull Unit benefits applicable to increased precipitation hazard includeo Green roofs $0133SFyear (PUL 40 years)o BioswaleRain GardenMeadow Mix $0020SFyear (PUL 30 years)o Permeable Grass Pavers $0020SFyear (PUL 30 years)o Tree Plantings $303Treeyear (PUL 30 years)o Planter Box Trees $101Treeyear (PUL 15 years)
Real Estate99
bull Potential real estate benefits from increased resilience of residential andor commercial propertiesstreetscapesneighborhoods included within the project scope
bull Benefit applied to extreme heat hazard for green infrastructure projects directly impacting residential or commercial properties
Quality of Life Health Benefits99
bull Potential quality of life benefits related to improved public health from the resilience measures included within the project scope
bull Benefit applied to extreme heat hazard for green infrastructure projects directly impacting residential or commercial properties
Table 14 lists other typical benefits for reducing impacts from climate stressors and basic guidance for how to estimate them See Section IIID for more information
97 FEMA standard values for avoided mental stress and anxiety and environmental open space values taken from FEMA BCA Toolkit Version 530 (Build Date 12222016)
98 CSO abatement cost taken from APG1 Report for NYC ldquoTechnical Approaches for Benefit-Cost Analysis of Hazard Mitigation Projects in Urban and Coastal Environmentsrdquo (April 2016)
99 Ecosystem Services Real Estate and Quality of LifeHealth benefits tend to be more applicable to green infrastructure measures that provide extreme heat benefits such as green roofs trees and other plantings
NYC Mayorrsquos Office of Recovery and Resiliency Climate Resiliency Design Guidelines
44APPENDIX 4 - PROJECT BENEFITS CATEGORIES
Table 15 ndash Potential benefits for extreme heat (Urban Heat Island) reduction measures
Category Benefit Basic Guidance for Estimating Values
Direct Benefit
Reduced Life Cycle Cost
bull Applicable only to measures such as green roofs that are expected to last longer than standard roofs
bull Compute total cost savings including annual OampM costs
Indirect Benefit
Energy Savings
bull Applicable to measures that reduce energy costs by providing cooling through increased shading andor evapotranspiration
bull Use New York Power Authority rates of $0148kWh for electricity and $0810Therm for natural gas
Other Potential Benefits
Air Quality bull Applicable to measures that absorb pollutants andor reduce carbon dioxide emissions
Acoustics bull Applicable to measures such as green roof or walls that reduce noise transfer
Quality of LifeHealth bull Potential quality of life benefits and related to improved public health
Real Estate bull Applicable to measures that provide residential real estate benefits from increased resilience of propertiesstreetscapesneighborhoods
Retail Sales Marketing
bull Applicable to measures that provide commercial property benefits from increased aesthetics resulting in increased marketing and sales for streetscapesneighborhoods
Tax Credits Incentives
bull Applicable to resilience or green infrastructure measures such as green roofs that have accompanying Federal State or City tax credits or other incentives
Table 15 lists potential benefits for reducing impacts from heat and basic guidance for how to estimate them See Section IIID for more information
NYC Mayorrsquos Office of Recovery and Resiliency Climate Resiliency Design Guidelines
45APPENDIX 4 - PROJECT BENEFITS CATEGORIES
Table 16 ndash Guidance on quantitative calculations for (1) sea level rise with coastal storm surge and (2) increased precipitation measures
Data Input General Guidance ndash Basic Description
Applicable Benefit Category
Applicable Typical Facility Typology
Dire
ct B
enefi
ts
Indi
rect
Ben
efits
Oth
er P
oten
tial
Ben
efits
Bui
ldin
g St
ruct
ures
Com
plex
Fa
cilit
ies
Tran
spor
tatio
nSt
reet
scap
es
Plaz
as
Park
Fea
ture
s
First Floor Elevation (FFE)
bull The elevation of the first finished floor of the structure excluding basements
bull FFE measured from top of lowest floor (riverinenon-coastal high hazard areas) or bottom of lowest horizontal structural member (coastal high hazard areas)
Y Y Y Y
Building Replacement Value (BRV)
bull The unit cost to rebuild a structure of the same quality of construction
bull Not the same as market value
Y Y Y Y
Building Size
bull The total floor area of the building in square feet
bull Total Building Value = BRV x Building Sizebull Typical BRVs for NYC range between $100 to
$325SF for residential buildings and $120 to $450SF for commercialpublic buildings
Y Y Y Y
Structure Description
bull The type of building number of stories and foundation type (full basement partial basement no basement)
bull Collect more detailed foundation data for coastal flood zones
Y Y Y Y
Building Use bull Details related to residential housing commercial business and public use
Y Y Y Y Y
Building Type bull The primary use of building ndash residential commercial public and others
Y Y Y Y Y
Depth Damage Function (DDF)
bull Curves used to estimate structure damage contents damage and displacement of residential buildings based on flood depth
bull DDFs selection based on Structure Description Building Type Building Use
bull Structure DDFs based on percentage of Total Building Value
bull Contents DDFs based on percentage of Total Contents Value
bull Displacement DDFs based on number of displacement days x Displacement Cost
Y Y Y Y Y
Contents Value
bull The cost to replace structure contents (furnishings equipment)
bull Residential building Contents Values typically 50 BRV (FEMA DDFs) or 100 BRV (USACE DDFs)
bull Non-residential building Contents Values between 18 to over 100 depending on building use (USACE DDFs)
bull Total Contents Value = BRV x Building Size
Y Y Y Y Y
Table 16 provides general guidance on how to quantitatively calculate benefits from efforts to address from climate stressors See Section IIIE for more information
NYC Mayorrsquos Office of Recovery and Resiliency Climate Resiliency Design Guidelines
46APPENDIX 4 - PROJECT BENEFITS CATEGORIES
Table 16 ndash Guidance on quantitative calculations for (1) sea level rise with coastal storm surge and (2) increased precipitation measures
Data Input General Guidance ndash Basic Description
Applicable Benefit Category
Applicable Typical Facility Typology
Dire
ct B
enefi
ts
Indi
rect
Ben
efits
Oth
er P
oten
tial
Ben
efits
Bui
ldin
g St
ruct
ures
Com
plex
Fa
cilit
ies
Tran
spor
tatio
nSt
reet
scap
es
Plaz
as
Park
Fea
ture
s
Number of Residents (Residential)
bull Total number of occupants in a residential building
bull Typically estimated based on number of residential units x average number of individuals per household (based on current US Census data or use 25 individuals per household as a default)
Y Y Y Y Y
Displacement Cost (Residential)
bull The unit cost to lodge and feed displaced residents while flood damage is repaired
bull Average unit displacement cost of $415residential unitday recommended based on current FY2018 GSA Per Diem rates for New York City
Y Y Y Y Y
Value of Service (Non-Residential and Public)
bull The unit cost of service disruption and rental of temporary facilities while flood damage is repaired
bull Disruption costs for non-residential buildings typically range from $095 to $136SFmonth and rental costs range from $020 to $136SFmonth depending on building use
bull Value of service for public buildings ($day) is typically based on the annual operating budget for the City agency using the building prorated based on building size or population served by the building then divided by 365 daysyear
Y Y Y Y
Value of Service (Critical Facilities)
bull The unit cost of critical facilities (police fire emergency medical services) lost or delayed while flood damage is repaired
Y Y Y
Value of Service Duration
bull The duration of service disruption and rental of temporary facilities for non-residential buildings and critical facilities while flood damage is repaired
bull For non-residential buildingso Value of Service Durations vary from
4 months to over 30 months based on building use and the depth of flooding
o Total Value of Service Loss = (Disruption Cost x Building Area) = (Rental Cost x Building Area x Value of Service Duration)
bull For public buildings and critical facilitieso Value of Service Durations vary from 0
days to 720 months based on building use and the depth of flooding from FEMA FIA or USACE DDFs
o Total Value of Service Loss = (Value of Service) x (Service Loss Duration)
Y Y Y
NYC Mayorrsquos Office of Recovery and Resiliency Climate Resiliency Design Guidelines
47APPENDIX 4 - PROJECT BENEFITS CATEGORIES
Table 16 ndash Guidance on quantitative calculations for (1) sea level rise with coastal storm surge and (2) increased precipitation measures
Data Input General Guidance ndash Basic Description
Applicable Benefit Category
Applicable Typical Facility Typology
Dire
ct B
enefi
ts
Indi
rect
Ben
efits
Oth
er P
oten
tial
Ben
efits
Bui
ldin
g St
ruct
ures
Com
plex
Fa
cilit
ies
Tran
spor
tatio
nSt
reet
scap
es
Plaz
as
Park
Fea
ture
s
Engineering Estimates for Damages
bull Engineered estimate models of physical damages and service losses at the project site based on the Guidelines event recurrence interval(s) and flood depth(s)
Y Y Y Y Y Y
Historic Damages and Service Losses
bull Historic physical damages and service losses at the project site documented from previous flood events
bull Do not use routine maintenancebull The historic damage event recurrence interval
(RIs) andor flood depths must be determined updated for inflation to the present value and adjusted to match the Guidelines event RIsflood depths
Y Y Y Y Y Y
Facility Replacement Value
bull The unit cost to rebuild the facility
Impacted Area bull The geographic area impacted by the facility in the event of failure in acres
Y Y Y Y
Facility Capacity
bull The design capacity of the facilitybull For example - facility capacity expressed in
millions of gallons per day (MGD) for water and wastewater facilities or megawatts (MW) for electrical facilities
Y Y Y Y
Service Population
bull The number of impacted residents served by the facility
bull Typically estimated based on number of impacted residential customers x average number of individuals per household (based on current US Census data or use 25 individuals per household as a default)
bull Facilities serving mostly non-residentialpublic buildings andor critical facilities should focus on service losses rather than service population
Y Y Y
NYC Mayorrsquos Office of Recovery and Resiliency Climate Resiliency Design Guidelines
48APPENDIX 4 - PROJECT BENEFITS CATEGORIES
Table 16 ndash Guidance on quantitative calculations for (1) sea level rise with coastal storm surge and (2) increased precipitation measures
Data Input General Guidance ndash Basic Description
Applicable Benefit Category
Applicable Typical Facility Typology
Dire
ct B
enefi
ts
Indi
rect
Ben
efits
Oth
er P
oten
tial
Ben
efits
Bui
ldin
g St
ruct
ures
Com
plex
Fa
cilit
ies
Tran
spor
tatio
nSt
reet
scap
es
Plaz
as
Park
Fea
ture
s
Value of Service
bull Unit value of service provided by the facilitybull Example of FEMA standard values for complete
loss of utility service $105personday for potable water$49personday for wastewater$148personday for electrical
bull Consider updating FEMA standard per capita values to reflect current The New York City utility rates
Y Y
Roadway Elevations bull Roadway Elevations
Y Y
Roadway Replacement Value
bull Roadway Replacement ValueY Y
Inundation Area Map
bull Inundation Area Map developed by FEMA or through modeling by project design team
Y Y Y
Building Inventory of Inundation Area
bull The number and type of buildings within the streetscape and neighborhood inundated by the Guidelinersquos flood events
Y Y Y
Average Daily Traffic (ADT)
bull The average number of one-way traffic trips per day along the roadway(s) within the streetscapeneighborhood inundated by the Guidelinersquos flood events
Y Y
Additional Travel Time
bull The additional travel time needed to detour around a flooded roadway expressed in minutes
bull In the unlikely event there is no detour available use a 12-hour travel time per one-way trap but provide a detailed area street map as supporting documentation
Y Y
Value of Traffic Delay
bull The value of service associated with lost time in traffic
bull For example - FEMA standard average value of $3344vehiclehour of delay
bull Consider updating FEMA and GSA standard values to reflect current New York City area labor rates and fuel costs
Y Y
NYC Mayorrsquos Office of Recovery and Resiliency Climate Resiliency Design Guidelines
49APPENDIX 4 - PROJECT BENEFITS CATEGORIES
Table 17 ndash Guidance on quantitative unit benefit calculations for extreme heat hazard measures
Measure General Guidance ndash Unit Benefit Information and Data Requirements
Applicable Benefit Category
Applicable Typical Facility Typology
Dire
ct B
enefi
ts
Indi
rect
Ben
efits
Oth
er P
oten
tial
Ben
efits
Bui
ldin
g St
ruct
ures
Com
plex
Fa
cilit
ies
Tran
spor
tatio
nSt
reet
scap
es
Plaz
as
Park
Fea
ture
s
Green Roof
bull Unit benefit range over PUL = $470SF to $373SF of green roof area ($719SF standard value)
bull Assumed PUL = 40 yearsbull Apply standard value unit benefit to green
roof area to estimate measure benefitbull Higher range values more applicable
to residential and commercial building streetscape projects
Y Y Y Y Y Y
Bioswale Rain Garden Meadow Mix
bull Unit benefit range over PUL = $396SF to $211SF of area ($730SF standard value)
bull Assumed PUL = 30 yearsbull Apply standard value unit benefit to bioswale
rain gardenmeadow mix area to estimate total measure benefit
Y Y Y Y Y Y
Cool Roof
bull Unit benefit range over PUL = $117 to $3151SF of material area ($144SF standard value)
bull Assumed PUL = 20 yearsbull Apply standard value unit benefit to cool roof
area to estimate total measure benefitbull Higher range values more applicable to
residential building streetscape projects
Y Y Y Y Y
Light-Colored PaversLight-Colored Materials
bull Unit benefit range over PUL = $0774 to $204SF of material area ($0866SF standard value)
bull Assumed PUL = 30 yearsbull Apply standard value unit benefit to material
area to estimate total measure benefit
Y Y Y Y
Table 17 provides general guidance on how to quantitatively calculate benefits from efforts to address climate stressors See Section IIIE for more information
NYC Mayorrsquos Office of Recovery and Resiliency Climate Resiliency Design Guidelines
50APPENDIX 4 - PROJECT BENEFITS CATEGORIES
Table 17 ndash Guidance on quantitative unit benefit calculations for extreme heat hazard measures
Measure General Guidance ndash Unit Benefit Information and Data Requirements
Applicable Benefit Category
Applicable Typical Facility Typology
Dire
ct B
enefi
ts
Indi
rect
Ben
efits
Oth
er P
oten
tial
Ben
efits
Bui
ldin
g St
ruct
ures
Com
plex
Fa
cilit
ies
Tran
spor
tatio
nSt
reet
scap
es
Plaz
as
Park
Fea
ture
s
Tree Planting
bull Unit benefit range over PUL = $1005 to $77154Tree ($1855Tree standard value)
bull Assumed PUL = 30 yearsbull Apply standard value unit benefit to number of
trees to estimate total measure benefitbull Higher range values more applicable
to residential and commercial building streetscape projects
Y Y Y Y Y Y
Planter Box Tree
bull Unit benefit range over PUL = $212 to 16304Tree ($392Tree standard value)
bull Assumed PUL = 15 yearsbull Apply standard value unit benefit to number of
trees to estimate total measure benefitbull Higher range values more applicable
to residential and commercial building streetscape projects
Y Y Y Y Y
Shade Canopy
bull Unit benefit range over PUL = $0363 to $396SF ($0458SF standard value)
bull Assumed PUL = 15 yearsbull Apply standard value unit benefit to area of
shade canopy estimate total measure benefitbull Higher range values more applicable
to residential and commercial building streetscape projects
Y Y Y Y
Permeable Grass Pavers
bull Unit benefit range over PUL = $0258SF to $0521SF of pavers ($0363SF standard value)
bull Assumed PUL = 30 yearsbull Apply standard value unit benefit to paver
area to estimate total measure benefit
Y Y Y Y Y
For the purposes of the BCA refer to the following facility typologies bull ldquoBuilding Structuresrdquo include critical small building sites such as EMS or FDNY stations and non-critical small building sites such as
libraries or comfort stationsbull ldquoComplex Facilitiesrdquo include critical infrastructure such as wastewater treatment sites pump stations water filtration plants and similar
large or complex facilitiesbull ldquoTransportationStreetscapePlazasrdquo include roadway reconstruction streetscape improvements street raising plazas and other
transportation-related infrastructurebull ldquoPark Featuresrdquo include parks and similar public recreational facility with natural landscape features
NYC Mayorrsquos Office of Recovery and Resiliency Climate Resiliency Design Guidelines
51APPENDIX 5 - EXAMPLE PLANNING DECISION TREE
This decision tree provides a summarized example approach for how to implement these Guidelines Projects with a total cost greater than $50 million are recommended to conduct a full qualitative and quantitative climate change risk assessment and BCA while projects below $50 million are recommended to conduct a qualitative risk assessment and BCA
Define Project
1) Operational goals and criticality level2) Useful life3) Location in the current flood plain future floodplain and or zone
of tidal inundation and the project arearsquos score on the heat vulnerability index
Evaluate Project Risks According to Probability and Magnitude of Consequence
bull Extreme Heat bull Precipitationbull Sea Level Risebull Coastal Surge
High Level Identification and Assessment of Risk Mitigation Alternatives and Co-benefits
(qualitative)
Detailed Identification and Assessment of Risk Mitigation Alternatives and Co-benefits (qualitative and quantitative)
High Level Estimate of Costs and Benefits of Design Alternatives
(qualitative)
Detailed Estimate of Costs and Benefits of Design Alternatives
(qualitative and quantitative)
Decision Point Which climate change risks require mitigation
Decision Point Evaluate risk mitigation benefits and costs to
determine final resilient design alternative or if no action is required
Decision Point Is the total project cost above $50 million
Below $50 million Above $50 million
APPENDIX 5 - EXAMPLE PLANNING DECISION TREE
NYC Mayorrsquos Office of Recovery and Resiliency Climate Resiliency Design Guidelines
52
Project Title
Design Strategies Checklist (not exhaustive)
Extreme Heat Comments Extreme Precipitation Comments Sea Level Rise amp Storm Surge Comments
Select Site in Low Heat Vulnerability Index area Select High Elevation Site Select High Elevation Site
Minimize East-West Building Orientation Green Roof Raise Building Floor Elevation
Passive Solar Cooling and Ventilation Systems
Protect Below Grade Areas from Flooding Waterproof Building Envelope
Cool Roof (SRI appropriate) On-site Stormwater Management (gray) Elevate Critical Building Functions
Green Roof (extensive) Reduce Impervious Areas Elevate Critical Equipment
Vegetative Structures Permeable Pavement Perimeter Floodwall100 Levee (passive or active)
Enhanced HVAC System including space layout optimization and system scalability
Increase Green Spaces and Planted Areas DryWet Floodproofing
More Efficient Building Envelope Other Utility Redundancy Design101
Parking Lot Shading Resilient Materials amp Landscape Treatments
Light Colored Pavements (appropriate SRI) Design for Storm Surge Outflow
Increase Planted Areas Install Backwater Flow Prevention
Permeable Surfaces Design for Scour
Open-grid Pavement Raise Road Elevation
Other Other
This appendix provides a template for identifying possible design strategies to address climate change risks as described throughout the Guidelines
APPENDIX 6 - DESIGN STRATEGIES CHECKLIST
100 Permanent perimeter flood walls are not permitted to meet floodproofing requirements in buildings with substantial improvements andor damages 101 Utility redundancy design should be pursued for critical systems not all building systems
APPENDIX 6 - DESIGN STRATEGIES CHECKLIST
NYC Mayorrsquos Office of Recovery and Resiliency Climate Resiliency Design Guidelines
53APPENDIX 7 - CLIMATE CHANGE RISK ASSESSMENT RESOURCES
These Guidelines provide data on climate change hazards and recommend how that data can inform resilient design A risk assessment is a tool to help project managers and designers evaluate risk levels as well as select and prioritize resilient design strategies A high level risk assessment is recommended for all City capital projects with a total cost of under $50 million Projects above $50 million are recommended to conduct an in-depth assessment
Risk assessments use quantified estimates of the probability and magnitude of consequence of an event occurring to prioritize responses ldquoProbabilityrdquo is an assessment of the likelihood of a hazard occurring while ldquomagnituderdquo describes the hazardrsquos potential impact Risk assessment tools such as the examples listed below can be used to define and score these categories Projects that score higher across both probability and magnitude can be prioritized for investment and risk mitigation action Projects that score lower across both criteria may require no action beyond meeting code The results are typically charted on a risk matrix and an example is provided on the next page
The climate change risk management frameworks below offer templates for how to integrate climate change projections into a risk assessment process Refer to these resources for examples and further information
bull Vulnerability Assessment and Adaptation Framework is prepared by the Federal Highway Administration (FHWA) While developed for transportation planning this risk assessment framework has broad applicability for evaluating asset vulnerability to climate change Available at httpswwwfhwadotgovenvironmentsustainabilityresilienceadaptation_framework
bull US Climate Resilience Toolkit The US Global Change Research Program offers a step by step risk assessment
framework including tools and case studies at httpstoolkitclimategovsteps (see example on next page)
bull Coast Adapt Guidance on undertaking a risk assessment High level assessment httpscoastadaptcomausitesdefaultfilesfactsheetsT3M4_2_2nd_pass_risk_assessmentpdfDetailed assessment httpscoastadaptcomausitesdefaultfilesfactsheetsT3M4_3_3rd_pass_risk_assessmentpdf
bull Climate adaptation Risk uncertainty and decision-makingDownload the report here httpswwwukciporgukpublicationsRisk
The City plans to develop a NYC-specific process for integrating climate change data into existing risk management processes by April 2019
APPENDIX 7 - CLIMATE CHANGE RISK ASSESSMENT RESOURCES
NYC Mayorrsquos Office of Recovery and Resiliency Climate Resiliency Design Guidelines
54APPENDIX 7 - CLIMATE CHANGE RISK ASSESSMENT RESOURCES
The Risk Characterization Matrix below is an example from the US Climate Resilience Toolkit This tool can be used to assess the probability and magnitude of impact for identified risks The risk of coincident climate stressorsrisks (such as storm surge plus increased precipitation) can also be assessed as applicable
Figure 14 - Example of a climate change risk matrix (adapted from US Climate Resilience Toolkit)
Project teams can determine the magnitude of the impact (along the horizontal scale of 1 through 3 with 3 being the most severe) and the probabilitylikelihood of occurrence for each specific risk (along the vertical scale with 3 being the most likely) A score is typically assigned for each risk (Probabil-ity x Magnitude) and then charted on the matrix Based on the estimated probability and magnitude of consequence above the risks are ranked and prioritized for mitigation Factors to bear in mind include
bull Not all facility typologies have the same level of functional and operational importance during events or tolerance for disruption
bull Not all climate stressors and risks have the same level of impact on each project sitebull Not all identified risks can or should be mitigated fully
NYC Mayorrsquos Office of Recovery and Resiliency Climate Resiliency Design Guidelines
55WORKS CITED
A Stronger More Resilient New York PlaNYC Report of the NYC Special Initiative for Rebuilding and Resiliency The City of New York 2013
ldquoAccount for Climate Riskrdquo International Finance Corporation accessed March 27 2017 httpwwwifcorgwpswcmconnectTopics_Ext_ContentIFC_External_Corporate_SiteClimate+Business
PrioritiesAccount+for+Climate+Risk
American Society of Heating Refrigeration and Air-Conditioning Engineers (ASHRAE) Handbook -Fundamentals 2017
ldquoBaseline Standard Economic Value Methodology Reportrdquo Federal Emergency Management Agency July 2016
Benefit Cost Analysis Toolkit Software Version 530 Federal Emergency Management Agency (build date December 2016)
Criteria for Detention Facility Design New York City Department of Environmental Protection November 2012
Community Resilience Planning Guide for Buildings and Infrastructure Systems Vol 1 NIST Special Publication 1190 US Department of Commerce 2016
Cool and Green Roofing Manual NYC Department of Design and Construction 2007 httpwwwnycgovhtmlddcdownloadspdfcool_green_roof_manpdf
Building Resiliency Task Force US Urban Green Building Council New York 2013 httpurbangreencouncilforcecomBuildingResiliency
Design and Planning for Flood Resiliency Guidelines for NYC Parks New York City Department of Parks and Recreation 2017
httpswwwnycgovparksorgplanning-and-buildingplanningresiliency-plansflood-resiliency
Flooded Bus Barns and Buckled Rails Federal Transit Administration Office of Budget and Policy 2011 httpswwwhsdlorgabstractampdid=685187
Floodproofing Non-Residential Buildings FEMA P936 FEMA 2013 httpswwwfemagovmedia-library-data9a50c534fc5895799321dcdd4b6083e7P-936_8-20-13_508rpdf
ldquoGlossaryrdquo International Infrastructure Management Manual National Asset Management Support Group New Zealand 2011 httpwwwipweaorg
ldquoGreen Roof Metrics Draft Reportrdquo New York City Department of Parks and Recreation 2017
ldquoGuide to Rain Event Preparednessrdquo NYC Department of Environmental Protection httpwwwnycgovhtmldeppdfbrochuresflood-preparedness-flyerpdf
ldquoGuidelines and Discount Rates for Benefit-Cost Analysis of Federal Programsrdquo Appendix C Circular A-94 US Office of Management and Budget (OMB) 2017
ldquoGuidelines for the Design and Construction of Stormwater Management Systemsrdquo New York City Department of Environmental Protection July 2012
Horton R et al New York City Panel on Climate Change 2015 Report Ann NY Acad Sci ISSN 0077-892 New York 2015
Madrigano J et al ldquoA case-only study of vulnerability to heat wavendashrelated mortality in New York City (2000ndash2011)rdquo Environmental Health Perspectives 123672ndash678 2013
WORKS CITED
NYC Mayorrsquos Office of Recovery and Resiliency Climate Resiliency Design Guidelines
56WORKS CITED
enspMcGregor et al Two Degrees The Built Environment and Our Changing Climate Routledge Press 2013
NYC Green Codes Task Force US Green Building Council New York 2010 httpurbangreencouncilorgGreenCodes
NYCrsquos Risk Landscape A Guide to Hazard Mitigation NYC Emergency Management 2014
One New York The Plan for a Strong and Just City The City of New York 2015 httpwwwnycgovhtmlonenyc downloadspdfpublicationsOneNYCpdf
Ready to Respond Strategies for Multifamily Building Resilience Enterprise Green Communities 2015 httpswwwenterprisecommunityorgresources
Rosenzweig C et al Climate Change Adaptation in New York City Building a Risk Management Response New York City Panel on Climate Change 2010
httponlinelibrarywileycomdoi101111nyas20101196issue-1 issuetoc
ldquoSustainable Infrastructure Management Program Learning Environmentrdquo Water Environment Research Foundation accessed March 24 2017 httpsimplewerforg
Urban Waterfront Adaptive Strategies NYC Department of City Planning 2013 httpwww1nycgovsiteplanningplanssustainable-communitiesclimate-resiliencepagetab=1
Wastewater Resiliency Plan Climate Risk Assessment and Adaptation Study New York City Department of Environmental Protection October 2013
NYC Mayorrsquos Office of Recovery and Resiliency Climate Resiliency Design Guidelines
15IIB INCREASING PRECIPITATION
B INCREASING PRECIPITATIONThe intensity and frequency of precipitation events are projected to increase with climate change creating new challenges for stormwater management and impacts to the built environment such as
bull The potential for greater frequency of stormwater management systems being overwhelmed36
bull More frequent and severe flooding of buildings and infrastructure in areas across the city and
bull Greater variability in rainfall events annually including the chance of drought
The goal for this section is to guide stormwater management approaches including infiltration increases in on-site storage volume and where possible increases in sewer capacity to account for precipitation increases associated with climate change Designers should develop and consider design interventions that would decrease site contribution to sewer in-flows beyond the existing NYC Building Code requirements Given its complexity the Department of Environmental Protection (DEP) is also evaluating climate impacts to the sewer system on a drainage-wide level Proactive design such as increasing on-site infiltration and storm water retention can contribute to system resiliency on a site-specific basis
BackgroundNYCrsquos drainage systems are designed to handle approximately the current 3-year intensity-duration-frequency (IDF) event in most areas of the city where sewers were built prior to 1970 In locations with sewers built after 1970 the capacity was built to handle the 5-year event NYCrsquos network of drainage systems can experience flooding above those thresholds due to widespread precipitation events or by localized intense storms (sometimes called ldquocloudburstsrdquo) causing flooding and backups Climate change projections indicate that flooding resulting from multiple types of precipitation events may increase in frequency This increasing probability is forecast for all types of precipitation events in NYC although there is greater uncertainty around future short duration events Relying on sewers alone to manage extreme precipitation events will not be sufficient in a changing climate The City plans to reduce impervious areas and provide additional storage capacity to reduce flood damage For managing stormwater from larger storms such as at the 50- and 100-year recurrence intervals DEP is increasingly considering the role of streets and open space in managing flow this is referred to as a dual drainage design approach The City is piloting projects to test this dual drainage approach
Another set of interventions include Bluebelt best management practices (BMPs) such as constructed wetlands storm water ponds and stream restorations that emulate pre-development conditions to manage large volumes of water and green infrastructure37 which in NYC have generally been designed to reduce flooding and combined sewer overflow respectively They are not typically sized to manage precipitation events of the same magnitude as sewers which serve as primary drainage conveyance However Bluebelt BMPs green infrastructure and other stormwater management tools may provide an additional buffer for larger storm events by temporarily storing andor infiltrating runoff that would otherwise be directed into the sewer system For instance areas of open space commonly found in NYC may not provide adequate environments for trees and other plantings However in these cases other types of green infrastructure like permeable surfaces and subsurface detention and retention installations would still be considered feasible
36 NYC is already taking steps to address this problem which will worsen with climate change To learn more about how NYC is using green and gray infrastructure to manage stormwater visit httpwwwnycgovhtmldephtmlstormwaterindexshtml
37 NYC DEP NYC Green Infrastructure Program
NYC Mayorrsquos Office of Recovery and Resiliency Climate Resiliency Design Guidelines
16IIB INCREASING PRECIPITATION
The City led by DEP continues to develop its options for managing heavier storm events due to climate change DEP is examining approaches to evaluate sea level rise and rainfall intensity for stormwater management and where possible sewer capacity These efforts will integrate forward-looking climate data into the design of these capital assets and the compounding factors of heavier rain storms and sea level rise will likely require greater infiltration and on-site storm water retention capacity Agencies and consultants should work directly with DEP to develop strategies on a given site necessary to meet expected increases in rainfall intensities and frequencies
1 Precipitation design adjustment for on-site stormwater systems
Based upon the design storm required for the City facility in design follow the steps below and review recommended design interventions
a) Identify the duration of the design event required The current 50-year IDF can be used as a proxy for the future 5-year storm
(projected for the 2080s) Design on-site detentionretention systems to retain the volume associated with the current 50-year IDF curve (see Figure 4 below) Design the on-site system to release at the maximum rate as specified in 15 Rules of the City of NY (RCNY) Chapter 3138
b) Conduct sensitivity analysis Compare the retentiondetention required for the current 5-year IDF versus the
38 Refer to existing codes and standards as well when determining the existing required storm as NYC requires different sizes of design storms for infrastructure and buildings For example NYC Plumbing Code Chapter 11 and Title 15 of the Rules of the City of New York Chapter 31
02
04
06
10
20
40
60
100
200
-2316090
Rai
nfal
l Int
ensi
ty (
inch
es p
er h
our
)
DurationsruoHsetuniM
5 10 15 30 1 2 3 6 12 18
5-yr
10-yr25-yr
50-yr
100-yr
NEW YORK NEW YORK
Figure 4 - Current Intensity-Duration-Frequency Precipitation Curve for NYC adapted from US Department of Commerce Weather Bureau Technical Paper 25
NYC Mayorrsquos Office of Recovery and Resiliency Climate Resiliency Design Guidelines
17IIB INCREASING PRECIPITATION
c) Identify design interventions for managing increased precipitation40 There are different ways to manage stormwater better and avoid urban flooding after
intense rain Choose the right combination of interventions after considering the site location operational requirements cost benefits and useful life of the intervention Some examples of design interventions are
bull Minimize increases in impervious surfacebull Utilize strategies that infiltrate evaporate or reuse rainwater to achieve storm
water volume reductions Then choose strategies that detain (delay drainage) to manage the rate of the storm water flow into the Cityrsquos drainage system
bull Install stormwater infiltration detention and storage (eg bioswales41 green roofs blue roofs and other blue or green infrastructure storage basins or tanks)
bull Protect areas below grade from floodingbull Keep catch basin grates clearbull When implementing perimeter protections ensure that interior water
management is also accounted for andbull Explore interventions to protect underground utility and telecommunications
infrastructure from water damage
d) Use appropriate DEP guidelines to perform the above tasks using the higher design storm
The three currently prescribed DEP guidelines are as follows
bull Guidelines for the Design and Construction of Stormwater Management Systems July 201242
bull Criteria for Detention Facility Design November 201243 bull DEP Site Connection Proposal Application and Guidelines44
Note on stormwater standards As DEP updates stormwater standards and develops specific tools to evaluate impacts of increased precipitation and drainage strategies for on-site storm water management these changes will be reflected in future versions of these Guidelines However it is recommended that the designer should develop and consider design interventions that would increase the on-site storage beyond the existing requirements Also a methodology is under development that will establish a consistent citywide process for addressing legal grade which will have further implications for how extreme precipitation is managed
39 NYC DEP Standards for Stormwater Release Rates available at httpwwwnycgovhtmldephtmlenvironmental_reviewsstormwater_release_ratesshtml 40 Also see DEP Guide to Rain Event Preparedness at httpwwwnycgovhtmldeppdfbrochuresflood-preparedness-flyerpdf and
Ready to Respond Strategies for Multifamily Building Resilience at httpwwwenterprisecommunityorgresourcesready-respond-strategies-multifamily-building-resilience-1335641 When siting bioswales consider groundwater levels and soil permeability and ensure that the site is not contaminated from past or
present land uses A high water table may prohibit some applications42 Available at httpwwwnycgovhtmldephtmlstormwaterstormwater_management_constructionshtml43 Available at httpwwwnycgovhtmldeppdfwater_sewer30_criteria_for_detention_facility_design_06062012pdf44 Available at httpwwwnycgovhtmldeppdfwater_sewer24pdf
current 50 year IDF to determine the cost and benefits associated with complying with these Guidelines Use the Evaluation of Project Benefits section below and Appendix 4 for guidance on how to identify and assess benefits Given the results of the costbenefit analyses review the added benefit of designing retentiondetention using greater magnitude storms (eg 100-year) or lower (eg 25-year) The goal is to maximize retentiondetention capacity given site and cost constraints as well as through an evaluation of the benefit of adding capacity to detainretain water for larger storm events
NYC Mayorrsquos Office of Recovery and Resiliency Climate Resiliency Design Guidelines
18
2 Incorporating climate change projections into DEP drainage planning
The first line of defense for managing intense precipitation events does not require changes to the sewer system as described above For drainage and wastewater infrastructure planning in a changing climate the sewer network and wastewater infrastructure should be qualitatively evaluated from the upstream pipes to the regulator chambers pump stations interceptors and ultimately to the downstream outfall to determine the feasibility of incorporating climate change projections into the system design For DEP storm sewer projects FY 2021 or later in separately sewered drainage areas where the design is in the early stages and there is free discharge the agency will evaluate the feasibility of revising the design to incorporate climate projections into the design If the project (including the prescribed changes) passes the costbenefit analysis then DEP will consider incorporating climate change projections into the sizing However changes in one part of the system must be carefully evaluated For example any upsizing of the regulator chamber or the high point of the system can negatively impact the design and operation of the wastewater infrastructure and residencesbusinesses on the system and can lead to a diminished the level of service
DEP is in the process of developing a hydrologic and hydraulic (HampH) model to estimate runoff flow for future climate scenarios and is evaluating rainfall hyetographs for the existing and future rainfall scenarios to be included in the drainage planning process In addition DEP currently coordinates with ORR for drainage planning as a part of coastal resiliency projects A more detailed methodology to incorporate climate change projections into drainage planning will be developed for version 30 of the Climate Resiliency Design Guidelines to be released in April 2019
IIB INCREASING PRECIPITATION
NYC Mayorrsquos Office of Recovery and Resiliency Climate Resiliency Design Guidelines
19IIC SEA LEVEL RISE
non-critical components within a larger facility or campus (eg at a maintenance yard differentiate between structures and equipment) Critical components essential to the facilityrsquos functionality should be protected to the higher standard for criticality even if the facility itself may be non-critical Some examples of critical components include electrical distribution and switching areas motor-control centers chemical feed equipment boilers communications systems monitoring and safety equipment HVAC units fire alarms and suppression equipment furnaces elevators emergency fuel supplies emergency generators and hazardous material storage Component protection should also be evaluated if a facility is expected to be fully operational during a flood event or if it is expected to quickly resume full operations after an event
For buildings and infrastructure with a long useful life it is not always cost effective or operationally feasible to design a facility to be resilient to hazards faced at the end of its useful life In these cases the most resilient design will be one that provides extra protection against hazards in the initial decades while also leaving open design alternatives for updating resiliency measures as new data is provided or new risk assessments are completed This flexible adaptation pathways approach builds in options to protect assets later in life as demonstrated in an example shown in Figure 1 (in Section I)
Other considerations to keep in mind includebull These Guidelines apply to all City capital projects except coastal flood protection
systems which are designed to different standards than those provided here for
C SEA LEVEL RISEThis section provides tools to 1) determine if the project will be subject to tidal inundation during its useful life due to sea level rise and 2) incorporate sea level rise into flood protection levels of capital projects For projects in the current and future 1 annual chance floodplains sea level rise-adjusted design flood elevations (DFE) are provided and reflect the criticality of the asset and its useful life Background NYC has experienced the devastation of coastal storms most recently during Hurricane Sandy Sea level rise is projected to increase the depth extent and frequency of flooding from storm surge45 Sea level rise will also regularly inundate some low-lying areas during high tides Current flood protection heights are determined by using the base flood elevation established by the FEMA Preliminary Flood Insurance Rate Map (PFIRM) 201546 and the standard of protection for buildings in the floodplain in Appendix G of the NYC Building Code47 These Guidelines augment existing requirements for two primary purposes ensuring City facilities built today incorporate sea level rise and critical assets (as defined in Table 4) are protected to a higher level It is important to note that all projects and design interventions must comply with NYC Building Code
Designers should differentiate between critical and
45 New York City Panel on Climate Change Report Chapter 2 Sea Level Rise and Coastal Storms (2015)46 However NYC Building code G10222 requires that designers review both the PFIRM and the effective FIRM and use the more
restrictive of the two 47 For information on the differences between FEMA FIRM PFIRM and the Cityrsquos forward-looking flood maps see Appendix 3
Critical components essential to the facilityrsquos functionality should be protected to the higher standard for criticality even if the facility itself is non-critical
NYC Mayorrsquos Office of Recovery and Resiliency Climate Resiliency Design Guidelines
20IIC SEA LEVEL RISE
buildings and other physical infrastructure Many of NYCrsquos coastal flood protection systems are currently being developed to comply with FEMA accreditation for flood levee systems48 The City plans to develop further guidance for designing coastal protection projects
bull For information on the differences between FEMA FIRM PFIRM and the Cityrsquos forward-looking flood maps see Appendix 3
bull Coincident stressors from sea level rise should also be considered For example bridge scour may increase as sea levels rise Similarly flooding during heavy rainfall events can be worsened due to higher tailwater conditions associated with high sea levels Be aware of how different risks may interact and how different interventions can be deployed to address multiple hazards or provide other co-benefits
bull Note projects that require discretionary approval are required to incorporate sea level rise projections as part of the NYC Waterfront Revitalization Program49 and
bull A methodology is under development that will establish a consistent citywide process for addressing legal grade which will have further implications for how sea level rise and precipitation are managed
For more information see Section IE Designers should use the resources and methods described in this section to 1) assess tidal inundation due to sea level rise and 2) address risks in the current and future floodplains
1 Assessing tidal inundation due to sea level riseTidal flooding currently affects parts of NYC and is projected to worsen as sea levels rise and inundate low-lying coastal sites during high tides When determining a site location or establishing scope of substantial improvements for other types of coastal facilities the project team will consider alternative sites outside of zones threatened with regular inundation if resiliency actions are not taken Some facilities such as wastewater treatment plants and harbor facilities need to be near the coast for operational purposes
a) Determine tidal inundation risk from sea level rise Use the Flood Hazard Mapper (httpwwwnycgovfloodhazardmapper)50 to see if your
site is in an area inundated from high tide plus sea level rise within the projectrsquos useful life For example if the useful life ends between 2040 and 2069 choose the 2050s High Tide map) Determine risk only from high tide and sea level rise separate from flood events Follow the instructions in Figure 5 and refer to the example in Figure 6 to review inundation at the end of an assetrsquos useful life
48 For more information please visit httpwwwfemagovfema-levee-resources-library49 For more information visit httpwwwnycgovwrp50 The Flood Hazard Mapper relies on publicly available data to present these map resources Users should also refer to FEMA and the
NPCC for official information
Figure 5 - Flood Hazard Mapper high tide plus sea level rise at httpwwwnycgovfloodhazardmapper
NYC Mayorrsquos Office of Recovery and Resiliency Climate Resiliency Design Guidelines
21IIC SEA LEVEL RISE
b) Address flood risk If the Flood Hazard Mapper shows that the facility is expected to be inundated by
high tides within its useful life or if primary access roads are at risk of inundation consider alternative site options
- OR - If the site is not expected to be regularly inundated by tides proceed to the next
section 2 Addressing Risks in the Current Floodplain
Note on calculating tidal inundations with sea level rise if a project team is interested in understanding the depth of tidal inundation given climate change projections follow these steps First determine the Mean Higher High Water (MHHW) elevation in feet-NAVD 8851 datum nearest to the site If the MHHW data is unavailable from a site specific survey refer to httpwwwnycgovwrp for a list of MHHW elevations (NAVD88) at tide stations across the city52 Second add the high estimate (90th percentile) of expected sea level rise (see Table 8 in Appendix 2) for the year corresponding to the facilityrsquos useful life to the MHHW to determine the projected depth of tidal inundation with sea level rise
51 North American Vertical Datum of 1988 (NAVD 88) is the vertical control datum of orthometric height established for vertical control surveying in the US based upon the General Adjustment of the North American Datum of 1988
httpswwwngsnoaagovdatumsvertical52 SLR elevations at httpwwwnycgovwrp are adjusted to account for sea level rise since the last tidal epoch If no other resource is
available to determine MHHW use the NOAA Online Vertical Datum Transformation tool to calculate the MHHW in feet-NAVD
Figure 6 - Flood Hazard Mapper with high tide in the 2020s (left) and in the 2080s (right) at httpwwwnycgovfloodhazardmapper
NYC Mayorrsquos Office of Recovery and Resiliency Climate Resiliency Design Guidelines
22IIC SEA LEVEL RISE
2 Addressing risks in the current floodplain53
A facility located in the current 1 annual chance floodplain (PFIRM 2015)54 will face increasing risk of flooding during its useful life due to sea level rise increasing the depth of coastal storms This section provides a process for adjusting the design flood elevation required by code to account for sea level rise
a) Find the location of the facility using the Flood Hazard Mapper (httpwwwnycgovfloodhazardmapper) and follow the instructions in Figure 7
bull Choose to view the layer ldquoFEMA Preliminary FIRM 2015rdquo bull Click on the facility site in the 1 floodplain to view the base flood elevation
Figure 7 - Flood Hazard Mapper with FEMA PFIRM (2015) at wwwnycgovfloodhazardmapper
b) If the facility is not in the current 1 annual chance floodplain (PFIRM 2015) proceed to the next section ldquo3 Addressing risks in the future floodplainrdquo
- OR - If the facility is in the current 1 annual chance floodplain (PFIRM 2015) note
the base flood elevation (BFE) and proceed to Step c) below Please note if a facility has multiple BFEs or if the site is partially in the 1 annual chance floodplain it is recommended to use the highest BFE as the current BFE for the entire site
c) Establish a sea level rise-adjusted DFE Use the current base flood elevation at your site the facilityrsquos useful life and its
criticality level to determine the design flood elevation using Table 4 (on the next page) as a basis of design
53 This process for adjusting the design flood elevation to account for sea level rise satisfies the criteria of the climate-informed science approach described at the state and federal level
54 FEMA updates its flood maps periodically As of April 2018 the most recent maps are the Preliminary Flood Insurance Rate Maps (PFIRM) available at DCPrsquos Flood Hazard Mapper (httpwwwnycgovfloodhazardmapper) Also note that NYC Building Code requires developers to use the PFIRM (2015) or the FIRM (2007) whichever is more restrictive For more information on these requirements please refer to Appendix G of the NYC Building Code Please note that the DCP maps are not official and all site locations should be confirmed with the official FEMA PFIRM NYC will provide information on the latest flood maps as they are updated
NYC Mayorrsquos Office of Recovery and Resiliency Climate Resiliency Design Guidelines
23IIC SEA LEVEL RISE
Table 4 - Determine the sea level rise-adjusted design flood elevation for critical and non-critical facilities55
Critical facilities
End of useful life Base Flood Elevation (BFE)56 in NAVD 88 + Freeboard57 + Sea Level Rise
Adjustment58= Design Flood Elevation (DFE) in
NAVD 88Through 2039 FEMA 1 (PFIRM) 24rdquo 6rdquo = FEMA 1 + 30rdquo
2040-2069 FEMA 1 (PFIRM) 24rdquo 16rdquo = FEMA 1 + 40rdquo2070-2099 FEMA 1 (PFIRM) 24rdquo 28rdquo = FEMA 1 + 52rdquo
2100+ FEMA 1 (PFIRM) 24rdquo 36rdquo = FEMA 1 + 60rdquoNon-critical facilities
End of useful life Base Flood Elevation (BFE) in NAVD 88 + Freeboard + Sea Level Rise
Adjustment = Design Flood Elevation (DFE) in
NAVD 88Through 2039 FEMA 1 (PFIRM) 12rdquo 6rdquo = FEMA 1 + 18rdquo
2040-2069 FEMA 1 (PFIRM) 12rdquo 16rdquo = FEMA 1 + 28rdquo2070-2099 FEMA 1 (PFIRM) 12rdquo 28rdquo = FEMA 1 + 40rdquo
2100+ FEMA 1 (PFIRM) 12rdquo 36rdquo = FEMA 1 + 48rdquoAdditional analysis should be conducted to incorporate wave action and wave run-up in DFE calculations especially in areas that are located within the FEMArsquos 1 annual chance Limit of Moderate Wave Action (LiMWA) zone Wave run up is the maximum vertical extent of wave uprush above surge
Definition of critical buildings and infrastructure for determining DFE in Table 4The criticality definitions below are for use in the application of the Guidelines only All items identified as critical in NYC Building Code Appendix G are critical in these guidelines however this list includes additional facilities that are not listed in Appendix G59 If a facility is not listed here it is considered non-critical for the purposes of determining freeboard
bull Hospitals and health care facilitiesbull Fire rescue ambulance and police stations and emergency vehicle garages bull Jails correctional facilities and detention facilities bull Facilities used in emergency response including emergency shelters emergency preparedness communication
operation centers communication towers electrical substations back-up generators fuel or water storage tanks power generating stations and other public utility facilities
bull Critical aviation facilities such as control towers air traffic control centers and hangars for aircraft used in emergency response
bull Major food distribution centers (with an annual expected volume of greater than 170000000 pounds)60 bull Buildings and other structures that manufacture process handle store dispose or use toxic or explosive
substances where the quantity of the material exceeds a threshold quantity established by the authority having jurisdiction and is sufficient to pose a threat to the public if released61
bull Infrastructure in transportation telecommunications or power networks including bridges tunnels (vehicular and rail) traffic signals (and other right of way elements including street lights and utilities) power transmission facilities substations circuit breaker houses city gate stations arterial roadways telecommunications central offices switching facilities etc
bull Ventilation buildings and fan plantsbull Operations centersbull Pumping stations (sanitary and stormwater)bull Train and transit maintenance yards and shopsbull Wastewater treatment plantsbull Water supply infrastructurebull Combined-sewer overflow (CSO) retention tanksbull Fueling stationsbull Waste transfer stations and bull Facilities where residents have limited mobility or ability including care facilities and nursing homes
55 If an industry standard does not include freeboard in its flood protection standards for particular infrastructure assets then only consider the sea level rise adjustment when determining flood protection levels
56 Note that NYC Building Code requires developers to use the PFIRM (2015) or the FIRM (2007) whichever is more restrictive For more information on these requirements please refer to Appendix G of the NYC Building Code
57 These freeboard values reflect NYC Building Code Appendix G Table 2-1 which establishes the minimum elevation of the top of lowest floor Appendix G requires other freeboard values for other parts of structures and in different parts of the floodplain Refer to Appendix G for the appropriate freeboard and use that value in Table 4 above
58 The sea level rise figures provided are for the middle of the 25th-75th percentile range projections from the NPCC These values do not necessarily indicate the average of all models
59 The structural occupancy categories outlined in Appendix G of the NYC Building Code are the same as ASCE 7 used for structural design For critical buildings structural design should comply with ASCE 7 and 24 for design class IV
60 This threshold represents the median volume of main food distributors in NYC according to statistics collected as part of the Five Borough Food Flow study in 2016 available at
httpswwwnycedccomsystemfilesfilesresource2016_food_supply-resiliency_study_resultspdf 61 The threshold quantity for hazardous materials is established by Chapter 7 of Title 24 of the NYC Administrative Code
NYC Mayorrsquos Office of Recovery and Resiliency Climate Resiliency Design Guidelines
24IIC SEA LEVEL RISE
Figure 9 ndash Outdoor emergency generator for the critical building
This case study provides an example of how to calculate a sea level rise-adjusted DFE based on the useful life of a hypothetical critical services building and its primary component
Step 1 Organize the site by various critical or primary components and their year of construction Determine their useful life along with the associated future year scenario for flood risk assessment In this example the building structure and the outside emergency generator are the most at-risk components from combined sea level rise and coastal storm surge
Step 2 Overlay the site footprint area over the effective current PFIRM or FIRM and the corresponding future year scenario FEMA 1 to identify flood risk to the site From overlaying the 2015 preliminary FEMA floodplain over the site it was determined that the site has a 1 annual chance of flooding with a base flood elevation of 13rsquo NAVD Step 3 Evaluate the criticality of each primary component of the facility based on the Guidelinesrsquo definition for critical infrastructure (Table 4) This (hypothetical) building is critical
Step 4 Use Table 4 to determine the sea level rise adjustment and freeboard requirements for each component and calculate the DFE for each that corresponds to its useful life period
Step 5 Compare the DFE of each component and the associated Guidelinesrsquo recommended DFE to calculate anticipated flood depth
CASE STUDY Adjusting the DFE for Sea Level Rise
Table 5 ndash Example of how to calculate a sea level rise-adjusted DFE for a critical facility
Construction year Components Useful
Life
Future Year Scenario
[Useful Life + Const
Year]
BFE in NAVD
88 (feet)
Freeboard + Sea
Level Rise Adjustment
(feet)
Adjusted DFE in
NAVD 88 (feet)
2010 Building Structure
70 years 2070-2099 130rsquo 2rsquo+23rsquo 173rsquo
2010Outdoor
Emergency Generator
25 years
Through 2039 130rsquo 2rsquo+05rsquo 155rsquo
Figure 8 - Example of how to locate a facility within the current floodplain and determine the BFE Figure 9 (inset) - Outdoor emergency generator at the facility
Figure 10 - This schematic shows how to determine the design flood elevation of a facility within the current 1 floodplain
Illustrative not to scale
NYC Mayorrsquos Office of Recovery and Resiliency Climate Resiliency Design Guidelines
25IIC SEA LEVEL RISE
Figure 11 - Flood Hazard Mapper with future 1 annual chance floodplain (adjusted for sea level rise) at httpwwwnycgovfloodhazardmapper
b) If the site is not in the future floodplain no flood protection is required for this facility
- OR - If the site is in the future floodplain identify the nearest adjacent base flood
elevation at the project site in the current 1 annual chance floodplain (PFIRM 2015) using the Flood Hazard Mapper62
c) Use Table 4 to determine the DFE Add freeboard and the sea level rise-adjustment to the nearest adjacent BFE on the
current 1 annual chance floodplain (PFIRM 2015) to determine the DFE
d) Apply the DFE calculation from Table 4 to the protected facility See Figures 12 and 13 for an illustration of how to calculate the DFE
62 Maps of future floodplains show the impacts of sea level rise alone and do not consider how changes in stormsrsquo climatology might also affect wave action and the full extent of the floodplain
3 Addressing risks in the future floodplainIf the facility is not in the current 1 annual chance floodplain (PFIRM 2015) it may still be at risk in the future from flooding as sea level rise increases the extent of the floodplain Follow the steps below to determine if your facility is located in the future floodplain and if so what sea level rise-adjusted DFE to use
a) Use the Flood Hazard Mapper (httpwwwnycgovfloodhazardmapper) to determine if the facility site will be in the future 1 annual chance floodplain
Assess if by the end of the facilityrsquos useful life the floodplain is projected to increase to encompass all or part of the project site For example if the useful life ends between 2040 and 2069 choose the 2050s floodplain map Refer to the steps in Figure 11 below
NYC Mayorrsquos Office of Recovery and Resiliency Climate Resiliency Design Guidelines
26IIC SEA LEVEL RISE
Figure 12 - This schematic map shows how to locate the nearest adjacent 1 floodplain elevation
Figure 13 -This schematic shows how to determine the design flood elevation of a facility that is outside of the current 1 floodplain
CASE STUDY Identifying a Base Flood Elevation (BFE) in the Future Floodplain
Illustrative not to scale
NYC Mayorrsquos Office of Recovery and Resiliency Climate Resiliency Design Guidelines
27IIC SEA LEVEL RISE
4 Identify appropriate design interventions
63 Additional resources for identifying adaptive strategies Urban Waterfront Adaptive Strategies (NYC Department of City Planning httpswww1nycgovassetsplanningdownloadpdfplans-studiessustainable-communitiesclimate-resilienceurban_waterfrontpdf Floodproofing Non-Residential Buildings (FEMA) at httpswwwfemagovmedia-libraryassetsdocuments34270 Ready to Respond Strategies for Multifamily Building Resilience (Enterprise Green Community) at
httpwwwenterprisecommunityorgresourcesready-respond-strategies-multifamily-building-resilience-1335664 While natural systems-based approaches ameliorate flooding their use for storm surge or wave mitigation would need to be quantified
before contributing towards the design flood elevation 65 For more information see FEMArsquos Floodproofing Non-Residential Buildings at httpswwwfemagovmedia-libraryassetsdocuments34270
Operational requirements and continuity plans can inform the selection of appropriate design interventions particularly in terms of how quickly a site needs to be up and running after a flood event Some examples of how functional uses can pair with interventions include
bull A facility that needs to be operating during or immediately after a flood event may need to be dry floodproofed using permanent barriers or designed for passive survivability (such as a police or fire station)
bull A facility that needs to recover quickly after an event could elevate prioritized equipment and have deployable barriers
bull A site that can recover over a longer duration of time could be temporarily inundated during an event (such as parks or plazas) The use of resilient materials and strategies can reduce costly damage caused by temporary inundation
Different design interventions should be chosen based on the specific operational requirements of the project however these must meet the ASCE 24 design requirements for Coastal VE Zones
For all projects at risk of current or future flooding select protections that meet the projectrsquos design flood elevation Consider project-specific factors including the site location operational requirements existing continuity planning and cost63 A Design Strategies Checklist in Appendix 6 is available for use as a resource to track possible design approaches Some examples of design alternatives are
bull Site relocation where feasible conduct alternative site analysis
bull Permanent barriers at a site (eg floodwalls)
bull Deployable flood barriers (eg stop logs flood doorsgates inflatable barriers)
bull Natural systems-based approaches (eg living shorelines restored wetlands)64
bull Prioritized protection of electrical mechanical and other critical or costly-to-replace equipment above the design flood elevation (eg motors and controller boilers and furnaces fuel storage tanks duct work alarm systems and suppression equipment electrical panels electrical distribution and switching areas gas and electric meters telecommunications equipment chemical feed equipment HVAC units and emergency generators)65
bull Dry floodproofing design a facility to prevent water from entering
bull Wet floodproofing design a facility to permit floodwaters to flow in and out of the structure without causing significant damage (eg elevate or protect critical equipment use water-resistant building materials below the design flood elevation include flood vents and pumps)
bull Design redundant telecommunications conduit entrances for multiple carrier entry Telecom conduit should run to diverse manholes when possible
bull Install backup power for telecom equipment with design consideration for such equipment (eg installation above DFE)
bull Install outdoor-rated disconnect switch for telecommunications equipment on the roofbull Explore interventions to protect underground utilities and other telecommunications
facilities from water damagebull Install backflow preventers backwater valves and sump pumps for all buildings and
infrastructure in the floodplain as well as behind flood barriersbull Shoreline improvements that reduce the height of waves or attenuate waves where
feasible
NYC Mayorrsquos Office of Recovery and Resiliency Climate Resiliency Design Guidelines
28IIIA GENERAL METHODOLOGY TO ESTIMATE PROJECT BENEFITSIIIB CATEGORIES OF PROJECT BENEFITS
Designing and constructing facilities to handle the future climate loads above the current NYC codes and standards based on projected useful life of the components provides resiliency benefits The incremental costs to implement the Guidelinesrsquo recommended design interventions should be compared with the incremental benefits to aid agencies in making decisions about resilient design strategies The project design team should evaluate benefits of the interventions designed to meet Guidelinesrsquo recommended criteria for all the climate stressors qualitatively andor quantitatively For projects with construction costs below $50 million the project design team is recommended to perform a qualitative benefits assessment on the interventions that meet the Guidelinesrsquo recommendations for all applicable climate stressors For critical facilities or projects with construction costs over $50 million the project design team is recommended to perform quantitative benefit calculations to identify the optimal interventions that meet Guidelinesrsquo recommended design criteria
A GENERAL METHODOLOGY TO ESTIMATE PROJECT BENEFITSThis general methodology to perform qualitative and quantitative benefit calculations is recommended for use by project design teams at the beginning of and during the design process This methodology enables estimation of project benefits for a high-level benefit-cost analysis (BCA) that can be applied to evaluate and compare resiliency features designed to address sea level rise with coastal storm surge increased precipitation and extreme heat events The type of benefits provided by interventions designed to meet the Guidelinesrsquo design criteria can vary by climate stressors and typology of the facilities The main guiding principle in development of the high-level BCA methodologies included in these Guidelines was to balance simplicity with accuracy The project benefits categories identified within the methodology may not cover all the potential benefits provided by every facility type within NYC In particular the benefits of planning for increased precipitation are difficult to quantify Hence the project design team should use their discretion to modify this general benefit calculation methodology as needed to meet their project goals and objectives The project design team should develop appropriate input data whether quantitative or qualitative needed to estimate project benefits
B CATEGORIES OF PROJECT BENEFITSThere are three types of project benefit categories - direct benefits indirect benefits and other benefits - that can be used to perform qualitative assessments and develop quantitative estimates of monetary benefits for intervention alternatives designed to meet the Guidelinesrsquo recommendations These project benefit categories will help to perform a high-level benefit-cost analysis that balances accuracy with an appropriate level of effort
bull Direct Benefits include reduced or avoided physical damages to facilities and contents reduced or avoided displacements for residential structures and reduced life cycle or OampM costs that can be quantified as a primary result of implementing a specific hazard mitigation measure Table 12 in Appendix 4 provides a list of direct benefits and basic guidance on estimating and documenting values for sea level rise and increased precipitation-related flood hazards Note that given the current state of practice it is not possible to quantify reduced or avoided physical damages or residential displacements that result from a specific extreme heat mitigation measures Therefore direct benefits applicable to extreme heat hazards are limited to reduced life cycle costs applicable to certain measures such as green roofs Refer to Table 15 for details on direct benefits for extreme heat hazards
III EVALUATION OF PROJECT BENEFITS
NYC Mayorrsquos Office of Recovery and Resiliency Climate Resiliency Design Guidelines
29IIIB CATEGORIES OF PROJECT BENEFITS
bull Indirect Benefits include reduced or avoided service losses for non-residential
buildings public facilities andor infrastructure (utilities roads and bridges) based on the value of service continuity andor emergency services to New Yorkers that can be quantified as a secondary result of implementing a specific hazard mitigation measure Table 13 in Appendix 4 provides a list of indirect benefits and basic guidance on estimating and documenting values for sea level rise and increased precipitation-related flood hazards Note that given the current state of practice on extreme heat it is not possible to quantify reduced or avoided service losses that result from a specific extreme heat mitigation measures Therefore indirect benefits applicable to extreme heat hazards are limited to reduced energy costs such as cool roofs green roofs or shade trees Refer to Table 15 in Appendix 4 for details on indirect benefits for extreme heat hazards
bull Other Benefits where applicable other potential benefits may include social benefits for residents such as avoided stress and anxiety avoided lost productivity environmentalecosystem service benefits avoided need for emergency services and other potential benefits that can be estimated as a result of implementing a specific hazard mitigation measure Table 14 in Appendix 4 provides a list of other potential benefits and basic guidance on estimating and documenting values for sea level rise and increased precipitation-related flood hazards
Note on the ecosystem service benefit category in Table 14 the stormwater management benefits of green infrastructure should be distributed between the extreme heat and increased precipitation hazards since these measures provide both significant reductions in rainfall runoff as well as Urban Heat Island mitigation through evapotranspiration However there is currently limited data available to quantify the actual distribution of stormwater management benefits between the two hazards For various dual-benefit providing interventions careful considerations should be given to identify the appropriate benefits category provided by the intervention with a goal to avoid duplication of quantified benefits In this methodology the stormwater management benefits of green infrastructure are applied to the increased precipitation hazard in order to avoid a duplication of benefits Note on real estate and quality of life benefits additionally it is important to note that two potential benefit categories shown in Table 14 - real estate and quality of lifehealthavoided casualties - were not included in the current BCA methodology for sea level rise or increased precipitation hazards Although these categories could increase project benefits for sea level rise and increased precipitation hazards they were only applied to measures that address extreme heat hazards such as green roofs trees and other plantings Refer to Table 15 for a detailed summary of other benefit categories quantified as unit benefits for extreme heat hazards
NYC Mayorrsquos Office of Recovery and Resiliency Climate Resiliency Design Guidelines
30IIIC WHICH METHODOLOGY TO USEIIID BCA METHODOLOGY FOR PROJECTS UNDER $50 MILLION
D BCA methodology for projects under $50 millionThe project design team should develop design alternatives to meet the Guidelinesrsquo criteria which may be in excess of NYC code and standards requirements (baseline conditions) It is assumed that the project design team will develop alternatives to address each of the following applicable climate stressors - sea level risecoastal storm surge increased precipitation and extreme heat - separately Tables 12-15 in Appendix 4 provides a list of typical direct indirect and other benefits provided by various intervention typologies to reduce impacts from climate stressors During the qualitative assessment the project design team should consider that intervention strategies will have varying levels of reliability effectiveness benefits and cost implications during the qualitative assessment
The project design team is recommended to develop appropriate evaluation criteria and metrics for each of the applicable project benefit categories For each alternative the project design team could use either a scoring weighting ranking or other type of qualitative assessment framework to assess each applicable project benefit categories with the developed evaluation criteria and metrics Table 6 provides an example template to evaluate alternatives using a set of general evaluation criteria and metrics using a color-coded rating system (and see Table 7 for an example of how to complete the template) The project design team can utilize a similar template customized to their project goals and objectives This assessment allows agencies to screen the qualitative benefits for various alternatives that would then lead to development of final project components to match the available budget and goals of the project
Projects with total costs below $50 million recommended to conduct a qualitative assessment to identify the optimal interventions that meet Guidelinesrsquo design criteria using the ldquoD) BCA methodology for projects under $50 millionrdquo methodology below
C WHICH METHODOLOGY TO USEProjects with a total cost above $50 million or are highly complex or critical facilities recommended to conduct both a qualitative and quantitative benefit calculation to identify the optimal interventions that meet Guidelinersquos design criteria using the ldquoE) BCA methodology for projects above $50 millionrdquo below A quantitative BCA also must include qualitative factors
NYC Mayorrsquos Office of Recovery and Resiliency Climate Resiliency Design Guidelines
31IIID BCA METHODOLOGY FOR PROJECTS UNDER $50 MILLION
Qualitative Color Scale Green=Least resource intensive alternative Purple=most resource intensive yellow=medium level of resource intensity
Qualitative Evaluation Factors Description Relative Color Rating System
First CostsAdditional construction costs needed to incorporate Guidelinesrsquo recommended resilient design over the baseline project costs
Highest cost ($$$) rated as Purple whereas lowest cost ($) rated as Green
ConstructabilityEase of Implementation
Construction techniques and site conditions such as presence of major utilities conflicts and other conditions which dictate the level of constructability required for each alternative
Difficult to construct rated as Purple whereas easiest to construct rated as Green
Environmental ImpactsCo-BenefitsPermitting
Impacts to the built and natural environment such as circulation noise and hazardous waste plus the level of effort required for permitting (eg interventions in water require highest level of permitting requirement) from each alternative in addition to the baseline project condition
Highest environmental impacts and highest level of effort required for permitting rated as Purple whereas the least impact and level of effort rated as Green
Operation and Maintenance (OampM)
Level of effort of additional manpower and cost of OampM for the alternatives over the baseline project OampM requirements
Highest level of effort and cost for OampM rated as Purple whereas the lowest is rated as Green
Reliability and Durability
Interventions that do not require human involvement or a facilityrsquos ability to withstand all the forces during a storm event (eg permanent solutions with higher reliability than deployable solution)
Interventions requiring human involvement (active measures) rated as Purple whereas interventions with minimal or no human involvement (passive measures) rated as Green
Risk Reduction Benefits Monetary benefits provided by each intervention alternative in avoided damages over the baseline condition
Lowest potential monetary benefit rated as Purple whereas as highest potential monetary benefit rated as Green
Quality of Life BenefitsVisual Aesthetics
Benefits either to the community such as recreation or safety or serve the community during emergency situations
Lowest potential quality of life benefits rated as Purple whereas as highest potential benefits rated as Green
Table 6 ndash Evaluation matrix for comparison of mitigation alternatives across the useful life of a project
Project title_______________________________________________________________________________
Evaluation Criteria
Baseline Condition (Designed to NYC Building Code and
Standards)
Resilient Design Alternatives for Managing__________________
Alternative 1
Alternative 2
Alternative 3
First Costs
ConstructabilityEase of ImplementationEnvironmental ImpactsCo-BenefitsPermitting
Operation and Maintenance (OampM)
Reliability and Durability
Risk Reduction Benefits
Quality of Life BenefitsVisual Aesthetics
NYC Mayorrsquos Office of Recovery and Resiliency Climate Resiliency Design Guidelines
32IIID BCA METHODOLOGY FOR PROJECTS UNDER $50 MILLION
Table 7 ndash Evaluation matrix for comparison of mitigation alternatives across the useful life of a project - COMPLETED EXAMPLE
Evaluation Criteria
Baseline Condition (Designed to NYC Building Code and
Standards)
Resilient Design Alternatives for Managing Coastal SurgeSLR
Alternative 1Flood proof building built on grade to Guidelines
DFE
Alternative 2 Elevate building structure above Guidelinesrsquo DFE
on columns
Alternative 3 Raise site grade by filing the building site footprint
to Guidelinesrsquo DFE
First CostsBaseline cost for building structure is $15 million
Incremental costs are within 5 over the baseline costs
Incremental costs are between 5-10 over baseline costs
Incremental costs are 20 and more over baseline costs
ConstructabilityEase of Implementation
Relatively easy to construct within site constraints
Similar to baseline conditions since construction requires additional flood proofing only
Moderate challenges to construct foundation structure for columns within site constraints
Extremely challenging to construct within the site constraints Potentially fatal flaw
Environmental ImpactsCo-BenefitsPermitting
No major impacts but may require additional effort to obtain DOB permits with flood proofing and deployable systems
No major impacts but may require additional effort to obtain DOB permits with flood proofing and deployable systems
No major impacts and relatively easy to permit
Potential drainage circulation impacts and challenges to obtain clean fill material for the site
Operation and Maintenance (OampM)
Major OampM costs associated with deployable systems
Major OampM costs associated with deployable systems
Moderate OampM costs associated with proposed elevator for access
Minimal OampM costs since deployable and elevators not required
Reliability and Durability
Least reliability with highest potential risk from flooding during to failure of deployable systems
Least reliability with highest potential risk from flooding during to failure of deployable systems
Moderate reliability with potential risk from flooding limited to elevator shaft only
Highest reliability since deployable are not required to protect building from flooding
Risk Reduction Benefits
Maximum flood risk reduction benefits assuming deployable and flood proofing is effective
Maximum flood risk reduction benefits assuming deployable and flood proofing is effective
Maximum flood risk reduction benefits
Maximum flood risk reduction benefits
Quality of Life BenefitsVisual Aesthetics
Facility may not be operational during the storm event
Facility may not be operational during the storm event
Facility can be potentially operational during the storm event
Facility can be potentially operational during the storm event
Qualitative Color Scale Green=Least resource intensive alternative Purple=most resource intensive yellow=medium level of resource intensity
A new non-critical facility with a building structure is proposed on a site that is currently in the 2015 Preliminary FEMA 1 annual chance floodplain with a BFE of 10rsquo (NAVD 88) The baseline conditions DFE to meet existing NYC codes and standards is 11rsquo (NAVD 88) Using the Guidelines recommended design criteria the facilityrsquos DFE is 133rsquo (NAVD 88) and existing grade is around 6rsquo (NAVD 88) The project design team develops three alternatives to meet the Guidelinesrsquo recommended DFE design for the facility Table 7 offers an example of how a qualitative assessment can be used to compare three resilient design alternatives using the evaluation criteria and metrics
CASE STUDY Example of How to Use the Evaluation Matrix
NYC Mayorrsquos Office of Recovery and Resiliency Climate Resiliency Design Guidelines
33IIIE BCA METHODOLOGY FOR PROJECTS OVER $50 MILLION
E BCA methodology for projects over $50 millionIn order for a project to be considered cost-effective a benefit-cost analysis (BCA) assesses if the benefits of a project outweigh its costs or in other words the benefit-cost ratio (BCR) is greater than 10 as illustrated in Equation 1
Equation 1 Benefit-Cost Ratio Formula
BCR =
Where BCR = Benefit-Cost Ratio
BENEFITS = Total project benefits
COSTS = Total project costs
BENEFITSCOSTS
These estimated project benefits are combined with the project costs which are defined as the differential construction and long-term operation and maintenance costs associated with constructing a proposed project to the Guidelinesrsquo recommended design level It is assumed that the baseline project will be designed to the most prevalent NYC codes and standards This benefit methodology should be used to determine the additional project benefit that the Guidelinesrsquo recommended design would provide over the baseline project benefit It is assumed that the project design team will develop alternatives to address each of the following applicable climate stressors - sea level risecoastal storm surge increased precipitation and extreme heat - separately For each alternative the project design team should use the following steps to determine the Benefit-Cost Ratio (BCR)
a) Determine project useful life for design interventions Determining the useful life of the proposed project is an important first step in the
detailed BCA assessment methodologies for two reasons First the project useful life determines what values must be used from the Guidelines to establish the future climate design conditions The various hazard tables in the Guidelines establish design requirements based on useful life ranges through 2039 2040-2069 2070-2099 and 2100+ (2100+ projections are only available for sea level rise) A review of these tables show that the design requirements needed to meet the projected climate hazards increase as the end of useful life range increases Second the useful life determines how long the project will need to be operated and maintained in order to remain technically sound and effective at reducing future damages and losses
b) Determine discount rate for project benefits calculation The cost-effectiveness of projects assessed using the BCR must be done on a net
present value basis meaning the present value of the benefits is compared to the present value of the costs Most project costs are computed for present value based on current cost estimates bids or cost guidance However project benefits - as well as project costs for operation and maintenance - accrue over time into the future and are computed on an annualized basis To address this issue the Present Value Coefficient (PVC) is used to bring these annualized project benefits and OampM costs into the present value As indicated by the formula in Equation 2 the PVC is a function of the Project Useful Life (PUL) and the Discount Rate (DR)
NYC Mayorrsquos Office of Recovery and Resiliency Climate Resiliency Design Guidelines
34
Equation 2 Present Value Coefficient (PVC) Formula
PVC =
Where PVC = Present Value Coefficient
PUL = BCA Project Useful Life based on project type
DR = Discount Rate
The project design team should coordinate with agencies and NYC OMB if needed to determine appropriate discount rates based on funding source project type and other factors This coordination should take place during project initiation phase where total project costs (design and construction) are over $50 million66
c) Develop input data to perform benefit calculations Tables 16 and 17 in Appendix 4 provide a list of typical input data by each climate
stressor needed to perform benefit analysis quantitatively on variety of facilities67 The project design team should use these tables as a reference to identify appropriate input data categories andor additional input data needed to perform benefit analysis on the project
d) Identify applicable project benefit categories to estimate benefits Tables 16 and 17 in Appendix 4 provide a list of typical project benefits by each climate
stressor needed to perform benefit analysis quantitatively on various types of projects The project design team should use these tables as a reference to identify appropriate project benefit categories for each climate stressor to perform benefit analysis on the project
e) Calculate benefits of recommended design interventions for each climate
stressor The input data and applicable project benefits can be assembled along with
incremental project cost data to analyze cost-effectiveness using the FEMA BCA Tool Damage-Frequency Assessment (DFA) module or similar software This analysis will provide a BCR for each alternative which can then be used to compare the alternatives that were developed to mitigate effects from applicable climate stressors The project design team can then use the results from this analysis to identify optimal interventions that provides a balanced solution that provides resiliency benefits within the available project budget
IIIE BCA METHODOLOGY FOR PROJECTS OVER $50 MILLION
[1 ndash (1 + DR) -(PUL)]DR
66 For example a NYC OMB March 2015 memorandum recommends using an annually updated DR as published each year in Appendix C of OMB Circular A-94 The current OMB-recommended discount rates from OMB A-94 Appendix C vary by project useful life and are as follows 21 DR for useful lives of 10 to 19 years 25 DR for useful lives of 20 to 29 years and 28 DR for useful lives of 30 years or greater By contrast FEMA hazard mitigation grants use a DR of 70 for all projects based on the Federal OMB A-94 rate for federally-funded mitigation measures Since these DRs will impact the PVC and the project benefits the project team must ensure that BCA results prepared using an OMB-recommended DR (21 to 28) be updated to reflect the Federal DR (70) when applying for FEMA mitigation grant funds
67 Note the data requirements for the sea level rise and increased precipitation hazards in Table 16 are more detailed than the requirements for the extreme heat hazards due to the less detailed level of analysis available for extreme heat
NYC Mayorrsquos Office of Recovery and Resiliency Climate Resiliency Design Guidelines
35
APPENDICES
NYC Mayorrsquos Office of Recovery and Resiliency Climate Resiliency Design Guidelines
36APPENDIX 1 ndash KEY TERMS
100-year flood (1 annual chance flood)
A flood that has a 1 probability of occurring in any given year The 100-year floodplain is the extent of the area of a flood that has a 1 chance of occurring or being exceeded in any given year
500-year flood (02 annual chance flood)
A flood that has a 02 probability of occurring in any given year The 500-year floodplain is the extent of the area of a flood that has a 02 chance of occurring or being exceeded in any given year
AdaptationAdjustment in natural or human systems to a new or changing environment that seeks to maximize beneficial opportunities or moderate negative effects Successful adaptations contribute to resiliency
Base flood elevation (BFE)The elevation of surface water resulting from a flood that has a 1 annual chance of occurring or being exceeded in any given year The BFE is shown on the Flood Insurance Rate Map (FIRM)69
BluebeltReference to the Department of Environmental Protectionrsquos (DEP) Bluebelt program to preserve natural drainage corridors including streams ponds and other wetland areas Preservation of these wetland systems allows them to perform their functions of conveying storing and filtering storm water
Climate
The average weather (or more rigorously a statistical description of the average in terms of the mean and variability) over a period of time usually 30 years These quantities are most often surface variables such as temperature precipitation and wind Climate in a wider sense is the state including a statistical description of the climate system70
Climate change
Changes in average weather conditions that persist over multiple decades or longer Climate change encompasses both increases and decreases in temperature as well as shifts in precipitation changing risk of certain types of severe weather events and changes to other variables of the climate system
Climate change riskThe chance that investments (such as in capital projects) can be affected by the physical impacts of climate change71 Risks are evaluated as a product of the probability of occurrence and the magnitude of damages or impacts including socioeconomic factors that would result if they did occur (consequences)
Climate change risk assessment
This assessment involves a detailed project-specific analysis that includes a vulnerability and risk assessment often followed by cost-benefit analysis to assess and select investments in climate change risk mitigation Risk is assessed as a function of the magnitude and probability of a given climate change hazard Examples resources are included in Appendix 7
Climate vulnerabilityThe degree to which systems and populations are affected by adverse impacts It is a function of the character magnitude and rate of climate change and variation to which a system is exposed its sensitivity and its adaptive capacity72
Cloudburst An extreme amount of rain in a short period of time often over a small geographic area73
Cooling Degree Day (CDD) A form of degree-day used to estimate the energy requirements for air conditioning or refrigeration when the daily mean temperature is above 65degF
68 All terms are from the US Global Change Research Program (USGCRP) glossary unless otherwise noted The USGCRP glossary is available at httpwwwglobalchangegovclimate-changeglossary
69 ldquoDefinitionsrdquo FEMA last modified March 1 2017 httpswwwfemagovnational-flood-insurance-programdefinitions70 UKCIP Glossary httpwwwukciporgukglossary71 ldquoAccount for Climate Riskrdquo International Finance Corporation 72 UKCIP Glossary httpwwwukciporgukglossary73 New York City Environmental Protection ldquoCloudburst Resiliency Planning Studyrdquo 2017 Available at httpwwwnycgovhtmldeppdfclimatenyc-cloudburst-studypdf
APPENDIX 1 - KEY TERMS68
NYC Mayorrsquos Office of Recovery and Resiliency Climate Resiliency Design Guidelines
37APPENDIX 1 ndash KEY TERMS
Design life The life expectancy of an asset or product as determined during design74 As opposed to useful life (see below)
Dry Bulb temperature The ambient air temperature measured by a thermometer
Extreme eventUnexpected unusual or unpredictable weather or flooding compared to historical or future projected distribution Extreme events include for example heat waves cold waves heavy rains periods of drought and flooding and severe storms
Facilities For the purposes of this document ldquofacilitiesrdquo refers to all types of buildings housing infrastructure structures and landscape features designed by or for the City of New York
Flexible adaptation pathwayResilience-building strategies that can evolve or be adapted over time as climate change risk assessments evaluations of adaptation strategies and monitoring continue75
Flood Insurance Rate Maps (FIRM)
Official flood map of a community on which FEMA has delineated the 1 annual chance floodplain and the base flood elevations (BFEs) applicable to the community76 The FIRM also includes the 02 floodplain annual chance floodplain and differentiates between special flood hazard areas (V A Coast A zones) and floodways The official FIRM is from the year 2007 while the 2015 PFIRM is currently required by NYC Building Code to calculate design flood elevations NYC DOB references the more restrictive of the two maps in both base flood elevation and flood hazard area (ie V versus A zone) Refer to Appendix 3 for more information
FreeboardAn additional amount of height above the base flood elevation used as a factor of safety (eg two feet above the base flood) in determining the level at which a facilitys lowest floor must be elevated or floodproofed to be in accordance with state or community floodplain management regulations77
Future time slices
Future periods defined by the NPCC for when climate change projections are available In this document the following decadal projections are associated with specific time spans2020s projection = present to 20392050s projection = 2040 to 20592080s projection = 2070 to 20992100s projection = end of century and beyond
Green infrastructureAn array of practices that use or mimic natural systems to manage urban stormwater runoff Water is either directed to engineered systems for infiltration or detained for longer periods before it enters the sewer system
Heat Vulnerability Index (HVI)Summarizes relative risk of adverse health effects from heat due to social and environmental factors Used to identify neighborhoods at higher risk during and after extreme heat events
Heat wave A period of three consecutive days where temperatures rise above 90degF or two consecutive days over 95 degrees78
New York City Panel on Climate Change (NPCC)
The body of leading climate and social scientists charged with making climate change projections for the metropolitan region79
74 Sustainable Infrastructure Management Program Learning Environment httpsimplewerforg 75 Rosenzweig C et al Climate Change Adaptation in New York City Building a Risk Management Response76 ldquoDefinitionsrdquo FEMA77 Ibid78 Horton R et al New York City Panel on Climate Change 2015 Report Chapter 1 Climate Observations and Projections Ann NY
Acad Sci ISSN 0077-8923 (New York 2015) 2579 For more information on the NPCC visit www1nycgovsiteorrchallengesnyc-panel-on-climate-changepage
NYC Mayorrsquos Office of Recovery and Resiliency Climate Resiliency Design Guidelines
38APPENDIX 1 ndash KEY TERMS
Open-grid pavement system
Pavements that consist of loose substrates supported by a grid of a more structurally sound grid or webbing Unbounded loose substrates in these systems transfer and store less heat than bound and compacted pavements and aid permeability Pavement is 50 pervious and contains vegetation in the open cells designed to allow percolation or infiltration of storm water through the surface into the soil below80
Preliminary Flood Insurance Rate Map (PFIRM)
Preliminary flood map developed by FEMA in 2015 for New York City that provides projected risks for flood hazards81 Refer to Appendix 3 for more information
Project useful life (PUL)
The period over which an asset or component is expected to be available for use by an entity This depends on regular and adequate maintenance This period of time typically exceeds the design life (see above) The combined effect of operational requirements and useful life is practical in assessing an investment in improving resilience82
Rain gardenAlso called ldquobioswalerdquo Planted areas designed to collect and manage stormwater that runs off streets sidewalks commercial and residential rooftops and other sources when it rains
Resiliency The ability to bounce back after change or adversity The capability of preparing for responding to and recovering from difficult conditions83
Sea level rise-adjusted design flood elevation
As defined in these Guidelines the increased height of the base flood elevation due to sea level rise plus freeboard depending on the criticality of the facility The sea level rise adjustment depends on the useful life of the facility
Storm surge An abnormal rise of water generated by a storm over and above predicted astronomical tides84
Substantial improvementAny repair reconstruction rehabilitation addition or improvement of a building or structure the cost which equals or exceeds 50 of the market value of the structure before the improvement or repairs started For more information see Appendix G of the NYC Building Code and 1 RCNY sect3606-0185
Tidal inundation Flooding which occurs at high tides due to climate-related sea level rise land subsidence andor the loss of natural barriers86
Urban Heat Island (UHI) effectThe tendency for higher air temperatures to persist in urban areas as a result of heat absorbed and emitted by buildings and asphalt tending to make cities warmer than the surrounding suburban and rural areas
Weather The state of the atmosphere at a given time with regard to temperature cloudiness precipitation wind and other meteorological conditions87
Wet Bulb temperatureThe temperature indicated when a thermometer bulb is covered with a water-saturated wick over which air is caused to flow at approximately 45 ms (900 ftmin) to reach the equilibrium temperature of water evaporating into the air when the heat of vaporization is supplied by the sensible heat of the air88
80 ldquoGlossaryrdquo US Green Building Council (2017) Available at httpwwwusgbcorgglossaryterm552581 ldquoPreliminary FEMA Map Productsrdquo FEMA Map Service Center Available at httpshazardsfemagovfemaportalprelimdownload82 ldquoGlossaryrdquo International Infrastructure Management Manual (2011) 83 A Stronger More Resilient New York (2013) 184 ldquoStorm Surge Overviewrdquo National Hurricane Center NOAA Available at httpswwwnhcnoaagovsurge85 ldquoFlood Resistant Constructionrdquo Appendix G New York City Building Code (2008) and 1 RCNY sect3606-01 available at httpswww1nycgovassetsbuildingsrules1_RCNY_3606-01pdf86 ldquoOcean Factsrdquo National Ocean Service NOAA Available at httpoceanservicenoaagovfactsnuisance-floodinghtml 87 UKCIP Glossary httpwwwukciporgukglossary88 ldquoASHRAE Terminologyrdquo ASHRAE Available at httpswwwashraeorgtechnical-resourcesauthoring-toolsterminology
NYC Mayorrsquos Office of Recovery and Resiliency Climate Resiliency Design Guidelines
39APPENDIX 2 - CLIMATE CHANGE PROJECTIONS
Climate change projections are provided by the New York City Panel on Climate Change (NPCC) The full NPCC report is available from the New York Academy of Sciences89 Tables 8-10 (below) were reproduced directly from the NPCC report while Table 2 (see Section IIA) was developed using the data underlying the NPCC report to inform the design of HVAC systems under warmer conditions
Table 8 ndash NYC sea level rise projections90
Baseline (2000-2004) 0 in
Low estimate (10th percentile)
Middle range (25th to 75th percentile)
High estimate (90th percentile)
2020s 2 in 4-8 in 10 in
2050s 8 in 11-21 in 30 in
2080s 13 in 18-39 in 58 in
2100 15 in 22-50 in 75 in
Note Projections are based on six-component approach that incorporates both local and global factors The model-based components are from 24 global climate models and two representative concentration pathways Projections are relative to the 2000-2004 base period
Table 9 ndash Mean annual changes91
a Temperature Baseline(1971-2000) 54degF
Low estimate (10th percentile)
Middle range (25th to 75th percentile)
High estimate (90th percentile)
2020s + 15degF +20-29degF +32degF
2050s +31degF +41-57degF +66degF
2080s +38degF +53-88degF +103degF
2100 +42degF +58-104degF +121F
b Precipitation Baseline(1971-2000) 501 in
Low estimate (10th percentile)
Middle range (25th to 75th percentile)
High estimate (90th percentile)
2020s -1 percent +1-8 +10
2050s +1 percent +4-11 +13
2080s +2 percent +5-13 +19
2100 -6 percent -1 to +19 +25
Note Based on 35 global climate models (GCMs) and two RCPs Baseline data cover the 1971ndash2000 base period and are from the NOAA National Climatic Data Center (NCDC) Shown are the low estimate (10th percentile) middle range (25th percentile to 75th percentile) and high estimate (90th percentile) These estimates are based on a ranking (from most to least) of the 70 (35 GCMs times 2 RCPs) projections The 90th percentile is defined as the value that 90 percent of the outcomes (or 63 of the 70 values) are the same or lower than Like all projections the NPCC climate change projections have uncertainty embedded within them Sources of uncertainty include data and modeling constraints the random nature of some parts of the climate system and limited understanding of some physical processes The NPCC characterizes levels of uncertainty using state-of-the-art climate models multiple scenarios of future greenhouse gas concentrations and recent peer-reviewed literature Even so the projections are not true probabilities and the potential for error should be acknowledged
89 The NPCC 2015 report is available at httponlinelibrarywileycomdoi101111nyas20151336issue-1issuetoc90 From New York City Panel on Climate Change 2015 Report Chapter 1 Climate Observations and Projections page 4191 From New York City Panel on Climate Change 2015 Report Chapter 1 Climate Observations and Projections page 30
APPENDIX 2 - CLIMATE CHANGE PROJECTIONS
NYC Mayorrsquos Office of Recovery and Resiliency Climate Resiliency Design Guidelines
40APPENDIX 2 - CLIMATE CHANGE PROJECTIONS
Table 10 ndash Extreme events92
2020s Baseline (1971-2000)
Low estimate(10th percentile)
Middle range(25th to 75th percentile)
High estimate (90th percentile)
Numbers of heat waves per year 2 3 3-4 4
Average heat wave duration (days) 4 5 5 5
Number of days per year with
Maximum temperature at or above 90degF 18 24 26-31 33
Maximum temperature at or above 100degF 04 07 1-2 2
Minimum temperature at or below 32degF 71 50 52-58 60
Rainfall at or above 1 inch 13 13 14-15 16
Rainfall at or above 2 inches 3 3 3-4 5
Rainfall at or above 4 inches 03 02 03ndash04 05
2050s Baseline (1971-2000)
Low estimate(10th percentile)
Middle range(25th to 75th percentile)
High estimate (90th percentile)
Numbers of heat waves per year 2 4 5-7 7
Average heat wave duration (days) 4 5 5-6 6
Number of days per year with
Maximum temperature at or above 90degF 18 32 39-52 57
Maximum temperature at or above 100degF 04 2 3-5 7
Minimum temperature at or below 32degF 71 37 42-48 52
Rainfall at or above 1 inch 13 13 14-16 17
Rainfall at or above 2 inches 3 3 4-4 5
Rainfall at or above 4 inches 03 03 03-04 05
2080s Baseline (1971-2000)
Low estimate(10th percentile)
Middle range(25th to 75th percentile)
High estimate (90th percentile)
Numbers of heat waves per year 2 5 6-9 9
Average heat wave duration (days) 4 5 5-7 8
Number of days per year with
Maximum temperature at or above 90degF 18 38 44-76 87
Maximum temperature at or above 100degF 04 2 4-14 20
Minimum temperature at or below 32degF 71 25 30-42 49
Rainfall at or above 1 inch 13 14 15-17 18
Rainfall at or above 2 inches 3 3 4-5 5
Rainfall at or above 4 inches 03 02 03-05 07
Note Projections for temperature and precipitation are based on 35 GCMs and 2 RCPs Baseline data are for the 1971 to 2000 base period and are from the NOAA National Climatic Data Center (NCDC) Shown are the low estimate (10th percentile) middle range (25th to 75th percentile) and high estimate (90th percentile) 30-year mean values from model-based outcomes Decimal places are shown for values less than one although this does not indicate higher precisioncertainty Heat waves are defined as three or more consecutive days with maximum temperatures at or above 90degF Like all projections the NPCC climate change projections have uncertainty embedded within them Sources of uncertainty include data and modeling constraints the random nature of some parts of the climate system and limited understanding of some physical processes The NPCC characterizes levels of uncertainty using state-of-the-art climate models multiple scenarios of future greenhouse gas concentrations and recent peer-reviewed literature Even so the projections are not true probabilities and the potential for error should be acknowledged
92 From New York City Panel on Climate Change 2015 Report Chapter 1 Climate Observations and Projections page 31
NYC Mayorrsquos Office of Recovery and Resiliency Climate Resiliency Design Guidelines
41APPENDIX 3 - DIFFERENTIATION OF FLOOD MAPS
These Guidelines reference several different kinds of flood maps and sources of design flood elevations These maps are described and differentiated below
Table 11 - Differentiation of flood maps used in NYC
Reference Title Data Source Information Provided Referenced By Link
2007 FIRM FEMA
Based on historical data from before 1983 identifies the current base flood (extent and elevation) as the flood that has a 1 chance of occurring in any given year also known as a 100-year flood The NYC Building Code requires that either the 2007 FIRM or 2015 PFIRM elevation be used whichever is higher
2014 NYC Building Code Appendix G
Climate Resiliency Design Guidelines
httpsmscfemagovportal
2015 PFIRM FEMA
Based on historical data identifies the current base flood (extents and elevation) as the flood that has a 1 chance of occurring in any given year also known as a 100-year flood The NYC Building Code requires that either the 2007 FIRM or 2015 PFIRM elevation be used whichever is higher The 2015 PFIRM is currently being reassessed by FEMA
2014 NYC Building Code Appendix G
Climate Resiliency Design Guidelines
httpshazardsfemagovfemaportalprelimdownload
httpwwwregion2coastalcomview-flood-maps-dataview-preliminary-flood-map-data
NYC Flood Hazard Mapper
NYC Department of City Planning
Maps current and future flood hazards in NYC including the following data layers 2007 FIRM and 2015 PFIRM high tide with sea level rise and PFIRM with sea level rise through 2100
Climate Resiliency Design Guidelines
Waterfront Revitalization Plan
httpwww1nycgovsiteplanningdata-mapsflood-hazard-mapperpage
ldquoTable 4 ndash Determine the sea level rise-adjusted design flood elevation for critical and non-critical facilitiesrdquo
ORR amp NPCC
Provides data to use when adding sea level rise to a given 2015 PFIRM or 2007 FIRM Base Flood Elevation (BFE) to calculate a Design Flood Elevation (DFE) Based on the criticality and expected useful life of a facility
Climate Resiliency Design Guidelines
See Section II on ldquoSea Level Riserdquo above
APPENDIX 3 - DIFFERENTIATION OF FLOOD MAPS
NYC Mayorrsquos Office of Recovery and Resiliency Climate Resiliency Design Guidelines
42APPENDIX 4 - PROJECT BENEFITS CATEGORIES
This appendix provides guidance on how to identify and assess benefits as a supplement to Sections IIID and IIIE
Table 12 lists typical direct benefits for reducing impacts from climate stressors and basic guidance for how to estimate them See Section IIID for more information
Table 13 lists typical indirect benefits for reducing impacts from climate stressors and basic guidance for how to estimate them See Section IIID for more information
Table 12 ndash Direct benefits for (1) sea level rise with coastal storm surge and (2) increased precipitation measures
Direct Benefit Basic Guidance for Estimating Values
Physical Damages (Structure Contents)
bull For flood-damaged buildings use depth damage functions developed by FEMA and USACE for structures and contents
bull Use depth damage functions in conjunction with Building Replacement Values (BRVs) and not market values BRVs typically range between $100 to $325SF for residential buildings and $120 to $450SF for commercial public buildings
bull For more complex structures or facilities use engineering estimates of flood damages or review historic flood damages documented from insurance claims repair records or FEMA Public Assistance claims from recent flood disasters
Residential Displacements
bull For flood-damaged buildings use depth damage functions developed by FEMA and USACE for residential displacements
Reduced Life CycleOperation and Maintenance (OampM) Costs93
bull Applicable only to projects that reduce overall life cycle costs or net annual OampM costs from baseline conditions
bull Input reduced annual OampM costs as a project benefit at a 1-year recurrence intervalbull Reduced overall life cycle costs can be input as a longer project useful life
Table 13 ndash Indirect benefits for (1) sea level rise with coastal storm surge and (2) increased precipitation measures
Indirect Benefit Basic Guidance for Estimating Values
Non-Residential Building Service Losses
bull Estimate service loss values and durations for non-residential buildings public buildings critical facilities and parksnatural features based on FEMA BCA guidance and standard values based on building use
Utility Service Losses94
bull Estimate utility service losses for water wastewater and electrical facilities based on the number of impacted customers FEMA per capita standard values for utility service ($105personday for potable water $49personday for wastewater $148personday for electrical)95
bull Estimate utility service loss durations based on engineering estimates or review historic flood damages losses documented from utility company records
bull This benefit can also apply to measures that increase energy efficiency
RoadBridge Service Losses
bull Estimate roadbridge service losses based on the average daily traffic (ADT) detour time and additional travel distance and FEMA and GSA standard values for road service ($3344vehiclehour of delay $0545mile)96
bull Estimate roadbridge service loss durations or review historic flood damages losses
Emergency Service Losses
bull Applicable only to projects that reduce or eliminate documented emergency service costs from baseline conditions
bull Examples of avoided emergency services costs include NYPD staffing to monitor barricades for flooded roads or NFDY staffing for water rescues of residents from flooded buildings or streets
APPENDIX 4 - PROJECT BENEFITS CATEGORIES
93 Reduced life cycle costs may be applicable to some measures that provide extreme heat benefits such as green roofs that can last longer than a standard roof if properly maintained
94 Reduced utility service costs may be applicable to some measures that provide extreme heat benefits such as cool roofs green roofs and shade trees
95 FEMA per capita standard values taken from FEMA BCA Toolkit Version 530 (Build Date 12222016) and developed in FEMArsquos Baseline Standard Economic Value Methodology Report (July 28 2016) Consider updating FEMA standard per capita values to reflect current New York City utility rates
96 Consider updating FEMA and GSA standard values to reflect current New York City area labor rates and fuel costs
NYC Mayorrsquos Office of Recovery and Resiliency Climate Resiliency Design Guidelines
43APPENDIX 4 - PROJECT BENEFITS CATEGORIES
Table 14 ndash Other potential benefits for (1) sea level rise with coastal storm surge and (2) increased precipitation measures
Other Benefit Basic Guidance for Estimating Values
Avoided Stress and Anxiety
bull Applicable only for projects that directly benefit occupants of residential structuresbull Use FEMA standard value for avoided mental stress and anxiety treatment costs of $2443person to
estimate benefit for all impacted residents97
Avoided Lost Productivity
bull Applicable only for projects that directly benefit occupants of residential structuresbull Use FEMA standard value for avoided lost worker productivity costs of $8736household to estimate
benefit for all impacted workers (conservatively assuming one worker per household)
Environmental Open Space
bull Applicable only for projects that create or acquire open space areas by acquisitionbull Use FEMA standard value for environmental open space based on the type of land acquired ($8308
Acreyear for Green open space $39545Acreyear for Riparian $6010Acreyear for Wetlands $554Acreyear for Forests $1799Year for Marine and estuary)97
CSO Volume Reduction
bull Applicable only for projects that provide Combined Sewer Overflow (CSO) abatement by reducing the volume of rainfall runoff
bull Use CSO abatement cost of $0015gallonsyear applied to increased precipitation hazard runoff volume for 5-year design storm98
Ecosystem Service99
bull Add stormwater management benefits of green infrastructure projects to increased precipitation hazards where avoided damages and service losses are not quantified
bull Unit benefits applicable to increased precipitation hazard includeo Green roofs $0133SFyear (PUL 40 years)o BioswaleRain GardenMeadow Mix $0020SFyear (PUL 30 years)o Permeable Grass Pavers $0020SFyear (PUL 30 years)o Tree Plantings $303Treeyear (PUL 30 years)o Planter Box Trees $101Treeyear (PUL 15 years)
Real Estate99
bull Potential real estate benefits from increased resilience of residential andor commercial propertiesstreetscapesneighborhoods included within the project scope
bull Benefit applied to extreme heat hazard for green infrastructure projects directly impacting residential or commercial properties
Quality of Life Health Benefits99
bull Potential quality of life benefits related to improved public health from the resilience measures included within the project scope
bull Benefit applied to extreme heat hazard for green infrastructure projects directly impacting residential or commercial properties
Table 14 lists other typical benefits for reducing impacts from climate stressors and basic guidance for how to estimate them See Section IIID for more information
97 FEMA standard values for avoided mental stress and anxiety and environmental open space values taken from FEMA BCA Toolkit Version 530 (Build Date 12222016)
98 CSO abatement cost taken from APG1 Report for NYC ldquoTechnical Approaches for Benefit-Cost Analysis of Hazard Mitigation Projects in Urban and Coastal Environmentsrdquo (April 2016)
99 Ecosystem Services Real Estate and Quality of LifeHealth benefits tend to be more applicable to green infrastructure measures that provide extreme heat benefits such as green roofs trees and other plantings
NYC Mayorrsquos Office of Recovery and Resiliency Climate Resiliency Design Guidelines
44APPENDIX 4 - PROJECT BENEFITS CATEGORIES
Table 15 ndash Potential benefits for extreme heat (Urban Heat Island) reduction measures
Category Benefit Basic Guidance for Estimating Values
Direct Benefit
Reduced Life Cycle Cost
bull Applicable only to measures such as green roofs that are expected to last longer than standard roofs
bull Compute total cost savings including annual OampM costs
Indirect Benefit
Energy Savings
bull Applicable to measures that reduce energy costs by providing cooling through increased shading andor evapotranspiration
bull Use New York Power Authority rates of $0148kWh for electricity and $0810Therm for natural gas
Other Potential Benefits
Air Quality bull Applicable to measures that absorb pollutants andor reduce carbon dioxide emissions
Acoustics bull Applicable to measures such as green roof or walls that reduce noise transfer
Quality of LifeHealth bull Potential quality of life benefits and related to improved public health
Real Estate bull Applicable to measures that provide residential real estate benefits from increased resilience of propertiesstreetscapesneighborhoods
Retail Sales Marketing
bull Applicable to measures that provide commercial property benefits from increased aesthetics resulting in increased marketing and sales for streetscapesneighborhoods
Tax Credits Incentives
bull Applicable to resilience or green infrastructure measures such as green roofs that have accompanying Federal State or City tax credits or other incentives
Table 15 lists potential benefits for reducing impacts from heat and basic guidance for how to estimate them See Section IIID for more information
NYC Mayorrsquos Office of Recovery and Resiliency Climate Resiliency Design Guidelines
45APPENDIX 4 - PROJECT BENEFITS CATEGORIES
Table 16 ndash Guidance on quantitative calculations for (1) sea level rise with coastal storm surge and (2) increased precipitation measures
Data Input General Guidance ndash Basic Description
Applicable Benefit Category
Applicable Typical Facility Typology
Dire
ct B
enefi
ts
Indi
rect
Ben
efits
Oth
er P
oten
tial
Ben
efits
Bui
ldin
g St
ruct
ures
Com
plex
Fa
cilit
ies
Tran
spor
tatio
nSt
reet
scap
es
Plaz
as
Park
Fea
ture
s
First Floor Elevation (FFE)
bull The elevation of the first finished floor of the structure excluding basements
bull FFE measured from top of lowest floor (riverinenon-coastal high hazard areas) or bottom of lowest horizontal structural member (coastal high hazard areas)
Y Y Y Y
Building Replacement Value (BRV)
bull The unit cost to rebuild a structure of the same quality of construction
bull Not the same as market value
Y Y Y Y
Building Size
bull The total floor area of the building in square feet
bull Total Building Value = BRV x Building Sizebull Typical BRVs for NYC range between $100 to
$325SF for residential buildings and $120 to $450SF for commercialpublic buildings
Y Y Y Y
Structure Description
bull The type of building number of stories and foundation type (full basement partial basement no basement)
bull Collect more detailed foundation data for coastal flood zones
Y Y Y Y
Building Use bull Details related to residential housing commercial business and public use
Y Y Y Y Y
Building Type bull The primary use of building ndash residential commercial public and others
Y Y Y Y Y
Depth Damage Function (DDF)
bull Curves used to estimate structure damage contents damage and displacement of residential buildings based on flood depth
bull DDFs selection based on Structure Description Building Type Building Use
bull Structure DDFs based on percentage of Total Building Value
bull Contents DDFs based on percentage of Total Contents Value
bull Displacement DDFs based on number of displacement days x Displacement Cost
Y Y Y Y Y
Contents Value
bull The cost to replace structure contents (furnishings equipment)
bull Residential building Contents Values typically 50 BRV (FEMA DDFs) or 100 BRV (USACE DDFs)
bull Non-residential building Contents Values between 18 to over 100 depending on building use (USACE DDFs)
bull Total Contents Value = BRV x Building Size
Y Y Y Y Y
Table 16 provides general guidance on how to quantitatively calculate benefits from efforts to address from climate stressors See Section IIIE for more information
NYC Mayorrsquos Office of Recovery and Resiliency Climate Resiliency Design Guidelines
46APPENDIX 4 - PROJECT BENEFITS CATEGORIES
Table 16 ndash Guidance on quantitative calculations for (1) sea level rise with coastal storm surge and (2) increased precipitation measures
Data Input General Guidance ndash Basic Description
Applicable Benefit Category
Applicable Typical Facility Typology
Dire
ct B
enefi
ts
Indi
rect
Ben
efits
Oth
er P
oten
tial
Ben
efits
Bui
ldin
g St
ruct
ures
Com
plex
Fa
cilit
ies
Tran
spor
tatio
nSt
reet
scap
es
Plaz
as
Park
Fea
ture
s
Number of Residents (Residential)
bull Total number of occupants in a residential building
bull Typically estimated based on number of residential units x average number of individuals per household (based on current US Census data or use 25 individuals per household as a default)
Y Y Y Y Y
Displacement Cost (Residential)
bull The unit cost to lodge and feed displaced residents while flood damage is repaired
bull Average unit displacement cost of $415residential unitday recommended based on current FY2018 GSA Per Diem rates for New York City
Y Y Y Y Y
Value of Service (Non-Residential and Public)
bull The unit cost of service disruption and rental of temporary facilities while flood damage is repaired
bull Disruption costs for non-residential buildings typically range from $095 to $136SFmonth and rental costs range from $020 to $136SFmonth depending on building use
bull Value of service for public buildings ($day) is typically based on the annual operating budget for the City agency using the building prorated based on building size or population served by the building then divided by 365 daysyear
Y Y Y Y
Value of Service (Critical Facilities)
bull The unit cost of critical facilities (police fire emergency medical services) lost or delayed while flood damage is repaired
Y Y Y
Value of Service Duration
bull The duration of service disruption and rental of temporary facilities for non-residential buildings and critical facilities while flood damage is repaired
bull For non-residential buildingso Value of Service Durations vary from
4 months to over 30 months based on building use and the depth of flooding
o Total Value of Service Loss = (Disruption Cost x Building Area) = (Rental Cost x Building Area x Value of Service Duration)
bull For public buildings and critical facilitieso Value of Service Durations vary from 0
days to 720 months based on building use and the depth of flooding from FEMA FIA or USACE DDFs
o Total Value of Service Loss = (Value of Service) x (Service Loss Duration)
Y Y Y
NYC Mayorrsquos Office of Recovery and Resiliency Climate Resiliency Design Guidelines
47APPENDIX 4 - PROJECT BENEFITS CATEGORIES
Table 16 ndash Guidance on quantitative calculations for (1) sea level rise with coastal storm surge and (2) increased precipitation measures
Data Input General Guidance ndash Basic Description
Applicable Benefit Category
Applicable Typical Facility Typology
Dire
ct B
enefi
ts
Indi
rect
Ben
efits
Oth
er P
oten
tial
Ben
efits
Bui
ldin
g St
ruct
ures
Com
plex
Fa
cilit
ies
Tran
spor
tatio
nSt
reet
scap
es
Plaz
as
Park
Fea
ture
s
Engineering Estimates for Damages
bull Engineered estimate models of physical damages and service losses at the project site based on the Guidelines event recurrence interval(s) and flood depth(s)
Y Y Y Y Y Y
Historic Damages and Service Losses
bull Historic physical damages and service losses at the project site documented from previous flood events
bull Do not use routine maintenancebull The historic damage event recurrence interval
(RIs) andor flood depths must be determined updated for inflation to the present value and adjusted to match the Guidelines event RIsflood depths
Y Y Y Y Y Y
Facility Replacement Value
bull The unit cost to rebuild the facility
Impacted Area bull The geographic area impacted by the facility in the event of failure in acres
Y Y Y Y
Facility Capacity
bull The design capacity of the facilitybull For example - facility capacity expressed in
millions of gallons per day (MGD) for water and wastewater facilities or megawatts (MW) for electrical facilities
Y Y Y Y
Service Population
bull The number of impacted residents served by the facility
bull Typically estimated based on number of impacted residential customers x average number of individuals per household (based on current US Census data or use 25 individuals per household as a default)
bull Facilities serving mostly non-residentialpublic buildings andor critical facilities should focus on service losses rather than service population
Y Y Y
NYC Mayorrsquos Office of Recovery and Resiliency Climate Resiliency Design Guidelines
48APPENDIX 4 - PROJECT BENEFITS CATEGORIES
Table 16 ndash Guidance on quantitative calculations for (1) sea level rise with coastal storm surge and (2) increased precipitation measures
Data Input General Guidance ndash Basic Description
Applicable Benefit Category
Applicable Typical Facility Typology
Dire
ct B
enefi
ts
Indi
rect
Ben
efits
Oth
er P
oten
tial
Ben
efits
Bui
ldin
g St
ruct
ures
Com
plex
Fa
cilit
ies
Tran
spor
tatio
nSt
reet
scap
es
Plaz
as
Park
Fea
ture
s
Value of Service
bull Unit value of service provided by the facilitybull Example of FEMA standard values for complete
loss of utility service $105personday for potable water$49personday for wastewater$148personday for electrical
bull Consider updating FEMA standard per capita values to reflect current The New York City utility rates
Y Y
Roadway Elevations bull Roadway Elevations
Y Y
Roadway Replacement Value
bull Roadway Replacement ValueY Y
Inundation Area Map
bull Inundation Area Map developed by FEMA or through modeling by project design team
Y Y Y
Building Inventory of Inundation Area
bull The number and type of buildings within the streetscape and neighborhood inundated by the Guidelinersquos flood events
Y Y Y
Average Daily Traffic (ADT)
bull The average number of one-way traffic trips per day along the roadway(s) within the streetscapeneighborhood inundated by the Guidelinersquos flood events
Y Y
Additional Travel Time
bull The additional travel time needed to detour around a flooded roadway expressed in minutes
bull In the unlikely event there is no detour available use a 12-hour travel time per one-way trap but provide a detailed area street map as supporting documentation
Y Y
Value of Traffic Delay
bull The value of service associated with lost time in traffic
bull For example - FEMA standard average value of $3344vehiclehour of delay
bull Consider updating FEMA and GSA standard values to reflect current New York City area labor rates and fuel costs
Y Y
NYC Mayorrsquos Office of Recovery and Resiliency Climate Resiliency Design Guidelines
49APPENDIX 4 - PROJECT BENEFITS CATEGORIES
Table 17 ndash Guidance on quantitative unit benefit calculations for extreme heat hazard measures
Measure General Guidance ndash Unit Benefit Information and Data Requirements
Applicable Benefit Category
Applicable Typical Facility Typology
Dire
ct B
enefi
ts
Indi
rect
Ben
efits
Oth
er P
oten
tial
Ben
efits
Bui
ldin
g St
ruct
ures
Com
plex
Fa
cilit
ies
Tran
spor
tatio
nSt
reet
scap
es
Plaz
as
Park
Fea
ture
s
Green Roof
bull Unit benefit range over PUL = $470SF to $373SF of green roof area ($719SF standard value)
bull Assumed PUL = 40 yearsbull Apply standard value unit benefit to green
roof area to estimate measure benefitbull Higher range values more applicable
to residential and commercial building streetscape projects
Y Y Y Y Y Y
Bioswale Rain Garden Meadow Mix
bull Unit benefit range over PUL = $396SF to $211SF of area ($730SF standard value)
bull Assumed PUL = 30 yearsbull Apply standard value unit benefit to bioswale
rain gardenmeadow mix area to estimate total measure benefit
Y Y Y Y Y Y
Cool Roof
bull Unit benefit range over PUL = $117 to $3151SF of material area ($144SF standard value)
bull Assumed PUL = 20 yearsbull Apply standard value unit benefit to cool roof
area to estimate total measure benefitbull Higher range values more applicable to
residential building streetscape projects
Y Y Y Y Y
Light-Colored PaversLight-Colored Materials
bull Unit benefit range over PUL = $0774 to $204SF of material area ($0866SF standard value)
bull Assumed PUL = 30 yearsbull Apply standard value unit benefit to material
area to estimate total measure benefit
Y Y Y Y
Table 17 provides general guidance on how to quantitatively calculate benefits from efforts to address climate stressors See Section IIIE for more information
NYC Mayorrsquos Office of Recovery and Resiliency Climate Resiliency Design Guidelines
50APPENDIX 4 - PROJECT BENEFITS CATEGORIES
Table 17 ndash Guidance on quantitative unit benefit calculations for extreme heat hazard measures
Measure General Guidance ndash Unit Benefit Information and Data Requirements
Applicable Benefit Category
Applicable Typical Facility Typology
Dire
ct B
enefi
ts
Indi
rect
Ben
efits
Oth
er P
oten
tial
Ben
efits
Bui
ldin
g St
ruct
ures
Com
plex
Fa
cilit
ies
Tran
spor
tatio
nSt
reet
scap
es
Plaz
as
Park
Fea
ture
s
Tree Planting
bull Unit benefit range over PUL = $1005 to $77154Tree ($1855Tree standard value)
bull Assumed PUL = 30 yearsbull Apply standard value unit benefit to number of
trees to estimate total measure benefitbull Higher range values more applicable
to residential and commercial building streetscape projects
Y Y Y Y Y Y
Planter Box Tree
bull Unit benefit range over PUL = $212 to 16304Tree ($392Tree standard value)
bull Assumed PUL = 15 yearsbull Apply standard value unit benefit to number of
trees to estimate total measure benefitbull Higher range values more applicable
to residential and commercial building streetscape projects
Y Y Y Y Y
Shade Canopy
bull Unit benefit range over PUL = $0363 to $396SF ($0458SF standard value)
bull Assumed PUL = 15 yearsbull Apply standard value unit benefit to area of
shade canopy estimate total measure benefitbull Higher range values more applicable
to residential and commercial building streetscape projects
Y Y Y Y
Permeable Grass Pavers
bull Unit benefit range over PUL = $0258SF to $0521SF of pavers ($0363SF standard value)
bull Assumed PUL = 30 yearsbull Apply standard value unit benefit to paver
area to estimate total measure benefit
Y Y Y Y Y
For the purposes of the BCA refer to the following facility typologies bull ldquoBuilding Structuresrdquo include critical small building sites such as EMS or FDNY stations and non-critical small building sites such as
libraries or comfort stationsbull ldquoComplex Facilitiesrdquo include critical infrastructure such as wastewater treatment sites pump stations water filtration plants and similar
large or complex facilitiesbull ldquoTransportationStreetscapePlazasrdquo include roadway reconstruction streetscape improvements street raising plazas and other
transportation-related infrastructurebull ldquoPark Featuresrdquo include parks and similar public recreational facility with natural landscape features
NYC Mayorrsquos Office of Recovery and Resiliency Climate Resiliency Design Guidelines
51APPENDIX 5 - EXAMPLE PLANNING DECISION TREE
This decision tree provides a summarized example approach for how to implement these Guidelines Projects with a total cost greater than $50 million are recommended to conduct a full qualitative and quantitative climate change risk assessment and BCA while projects below $50 million are recommended to conduct a qualitative risk assessment and BCA
Define Project
1) Operational goals and criticality level2) Useful life3) Location in the current flood plain future floodplain and or zone
of tidal inundation and the project arearsquos score on the heat vulnerability index
Evaluate Project Risks According to Probability and Magnitude of Consequence
bull Extreme Heat bull Precipitationbull Sea Level Risebull Coastal Surge
High Level Identification and Assessment of Risk Mitigation Alternatives and Co-benefits
(qualitative)
Detailed Identification and Assessment of Risk Mitigation Alternatives and Co-benefits (qualitative and quantitative)
High Level Estimate of Costs and Benefits of Design Alternatives
(qualitative)
Detailed Estimate of Costs and Benefits of Design Alternatives
(qualitative and quantitative)
Decision Point Which climate change risks require mitigation
Decision Point Evaluate risk mitigation benefits and costs to
determine final resilient design alternative or if no action is required
Decision Point Is the total project cost above $50 million
Below $50 million Above $50 million
APPENDIX 5 - EXAMPLE PLANNING DECISION TREE
NYC Mayorrsquos Office of Recovery and Resiliency Climate Resiliency Design Guidelines
52
Project Title
Design Strategies Checklist (not exhaustive)
Extreme Heat Comments Extreme Precipitation Comments Sea Level Rise amp Storm Surge Comments
Select Site in Low Heat Vulnerability Index area Select High Elevation Site Select High Elevation Site
Minimize East-West Building Orientation Green Roof Raise Building Floor Elevation
Passive Solar Cooling and Ventilation Systems
Protect Below Grade Areas from Flooding Waterproof Building Envelope
Cool Roof (SRI appropriate) On-site Stormwater Management (gray) Elevate Critical Building Functions
Green Roof (extensive) Reduce Impervious Areas Elevate Critical Equipment
Vegetative Structures Permeable Pavement Perimeter Floodwall100 Levee (passive or active)
Enhanced HVAC System including space layout optimization and system scalability
Increase Green Spaces and Planted Areas DryWet Floodproofing
More Efficient Building Envelope Other Utility Redundancy Design101
Parking Lot Shading Resilient Materials amp Landscape Treatments
Light Colored Pavements (appropriate SRI) Design for Storm Surge Outflow
Increase Planted Areas Install Backwater Flow Prevention
Permeable Surfaces Design for Scour
Open-grid Pavement Raise Road Elevation
Other Other
This appendix provides a template for identifying possible design strategies to address climate change risks as described throughout the Guidelines
APPENDIX 6 - DESIGN STRATEGIES CHECKLIST
100 Permanent perimeter flood walls are not permitted to meet floodproofing requirements in buildings with substantial improvements andor damages 101 Utility redundancy design should be pursued for critical systems not all building systems
APPENDIX 6 - DESIGN STRATEGIES CHECKLIST
NYC Mayorrsquos Office of Recovery and Resiliency Climate Resiliency Design Guidelines
53APPENDIX 7 - CLIMATE CHANGE RISK ASSESSMENT RESOURCES
These Guidelines provide data on climate change hazards and recommend how that data can inform resilient design A risk assessment is a tool to help project managers and designers evaluate risk levels as well as select and prioritize resilient design strategies A high level risk assessment is recommended for all City capital projects with a total cost of under $50 million Projects above $50 million are recommended to conduct an in-depth assessment
Risk assessments use quantified estimates of the probability and magnitude of consequence of an event occurring to prioritize responses ldquoProbabilityrdquo is an assessment of the likelihood of a hazard occurring while ldquomagnituderdquo describes the hazardrsquos potential impact Risk assessment tools such as the examples listed below can be used to define and score these categories Projects that score higher across both probability and magnitude can be prioritized for investment and risk mitigation action Projects that score lower across both criteria may require no action beyond meeting code The results are typically charted on a risk matrix and an example is provided on the next page
The climate change risk management frameworks below offer templates for how to integrate climate change projections into a risk assessment process Refer to these resources for examples and further information
bull Vulnerability Assessment and Adaptation Framework is prepared by the Federal Highway Administration (FHWA) While developed for transportation planning this risk assessment framework has broad applicability for evaluating asset vulnerability to climate change Available at httpswwwfhwadotgovenvironmentsustainabilityresilienceadaptation_framework
bull US Climate Resilience Toolkit The US Global Change Research Program offers a step by step risk assessment
framework including tools and case studies at httpstoolkitclimategovsteps (see example on next page)
bull Coast Adapt Guidance on undertaking a risk assessment High level assessment httpscoastadaptcomausitesdefaultfilesfactsheetsT3M4_2_2nd_pass_risk_assessmentpdfDetailed assessment httpscoastadaptcomausitesdefaultfilesfactsheetsT3M4_3_3rd_pass_risk_assessmentpdf
bull Climate adaptation Risk uncertainty and decision-makingDownload the report here httpswwwukciporgukpublicationsRisk
The City plans to develop a NYC-specific process for integrating climate change data into existing risk management processes by April 2019
APPENDIX 7 - CLIMATE CHANGE RISK ASSESSMENT RESOURCES
NYC Mayorrsquos Office of Recovery and Resiliency Climate Resiliency Design Guidelines
54APPENDIX 7 - CLIMATE CHANGE RISK ASSESSMENT RESOURCES
The Risk Characterization Matrix below is an example from the US Climate Resilience Toolkit This tool can be used to assess the probability and magnitude of impact for identified risks The risk of coincident climate stressorsrisks (such as storm surge plus increased precipitation) can also be assessed as applicable
Figure 14 - Example of a climate change risk matrix (adapted from US Climate Resilience Toolkit)
Project teams can determine the magnitude of the impact (along the horizontal scale of 1 through 3 with 3 being the most severe) and the probabilitylikelihood of occurrence for each specific risk (along the vertical scale with 3 being the most likely) A score is typically assigned for each risk (Probabil-ity x Magnitude) and then charted on the matrix Based on the estimated probability and magnitude of consequence above the risks are ranked and prioritized for mitigation Factors to bear in mind include
bull Not all facility typologies have the same level of functional and operational importance during events or tolerance for disruption
bull Not all climate stressors and risks have the same level of impact on each project sitebull Not all identified risks can or should be mitigated fully
NYC Mayorrsquos Office of Recovery and Resiliency Climate Resiliency Design Guidelines
55WORKS CITED
A Stronger More Resilient New York PlaNYC Report of the NYC Special Initiative for Rebuilding and Resiliency The City of New York 2013
ldquoAccount for Climate Riskrdquo International Finance Corporation accessed March 27 2017 httpwwwifcorgwpswcmconnectTopics_Ext_ContentIFC_External_Corporate_SiteClimate+Business
PrioritiesAccount+for+Climate+Risk
American Society of Heating Refrigeration and Air-Conditioning Engineers (ASHRAE) Handbook -Fundamentals 2017
ldquoBaseline Standard Economic Value Methodology Reportrdquo Federal Emergency Management Agency July 2016
Benefit Cost Analysis Toolkit Software Version 530 Federal Emergency Management Agency (build date December 2016)
Criteria for Detention Facility Design New York City Department of Environmental Protection November 2012
Community Resilience Planning Guide for Buildings and Infrastructure Systems Vol 1 NIST Special Publication 1190 US Department of Commerce 2016
Cool and Green Roofing Manual NYC Department of Design and Construction 2007 httpwwwnycgovhtmlddcdownloadspdfcool_green_roof_manpdf
Building Resiliency Task Force US Urban Green Building Council New York 2013 httpurbangreencouncilforcecomBuildingResiliency
Design and Planning for Flood Resiliency Guidelines for NYC Parks New York City Department of Parks and Recreation 2017
httpswwwnycgovparksorgplanning-and-buildingplanningresiliency-plansflood-resiliency
Flooded Bus Barns and Buckled Rails Federal Transit Administration Office of Budget and Policy 2011 httpswwwhsdlorgabstractampdid=685187
Floodproofing Non-Residential Buildings FEMA P936 FEMA 2013 httpswwwfemagovmedia-library-data9a50c534fc5895799321dcdd4b6083e7P-936_8-20-13_508rpdf
ldquoGlossaryrdquo International Infrastructure Management Manual National Asset Management Support Group New Zealand 2011 httpwwwipweaorg
ldquoGreen Roof Metrics Draft Reportrdquo New York City Department of Parks and Recreation 2017
ldquoGuide to Rain Event Preparednessrdquo NYC Department of Environmental Protection httpwwwnycgovhtmldeppdfbrochuresflood-preparedness-flyerpdf
ldquoGuidelines and Discount Rates for Benefit-Cost Analysis of Federal Programsrdquo Appendix C Circular A-94 US Office of Management and Budget (OMB) 2017
ldquoGuidelines for the Design and Construction of Stormwater Management Systemsrdquo New York City Department of Environmental Protection July 2012
Horton R et al New York City Panel on Climate Change 2015 Report Ann NY Acad Sci ISSN 0077-892 New York 2015
Madrigano J et al ldquoA case-only study of vulnerability to heat wavendashrelated mortality in New York City (2000ndash2011)rdquo Environmental Health Perspectives 123672ndash678 2013
WORKS CITED
NYC Mayorrsquos Office of Recovery and Resiliency Climate Resiliency Design Guidelines
56WORKS CITED
enspMcGregor et al Two Degrees The Built Environment and Our Changing Climate Routledge Press 2013
NYC Green Codes Task Force US Green Building Council New York 2010 httpurbangreencouncilorgGreenCodes
NYCrsquos Risk Landscape A Guide to Hazard Mitigation NYC Emergency Management 2014
One New York The Plan for a Strong and Just City The City of New York 2015 httpwwwnycgovhtmlonenyc downloadspdfpublicationsOneNYCpdf
Ready to Respond Strategies for Multifamily Building Resilience Enterprise Green Communities 2015 httpswwwenterprisecommunityorgresources
Rosenzweig C et al Climate Change Adaptation in New York City Building a Risk Management Response New York City Panel on Climate Change 2010
httponlinelibrarywileycomdoi101111nyas20101196issue-1 issuetoc
ldquoSustainable Infrastructure Management Program Learning Environmentrdquo Water Environment Research Foundation accessed March 24 2017 httpsimplewerforg
Urban Waterfront Adaptive Strategies NYC Department of City Planning 2013 httpwww1nycgovsiteplanningplanssustainable-communitiesclimate-resiliencepagetab=1
Wastewater Resiliency Plan Climate Risk Assessment and Adaptation Study New York City Department of Environmental Protection October 2013
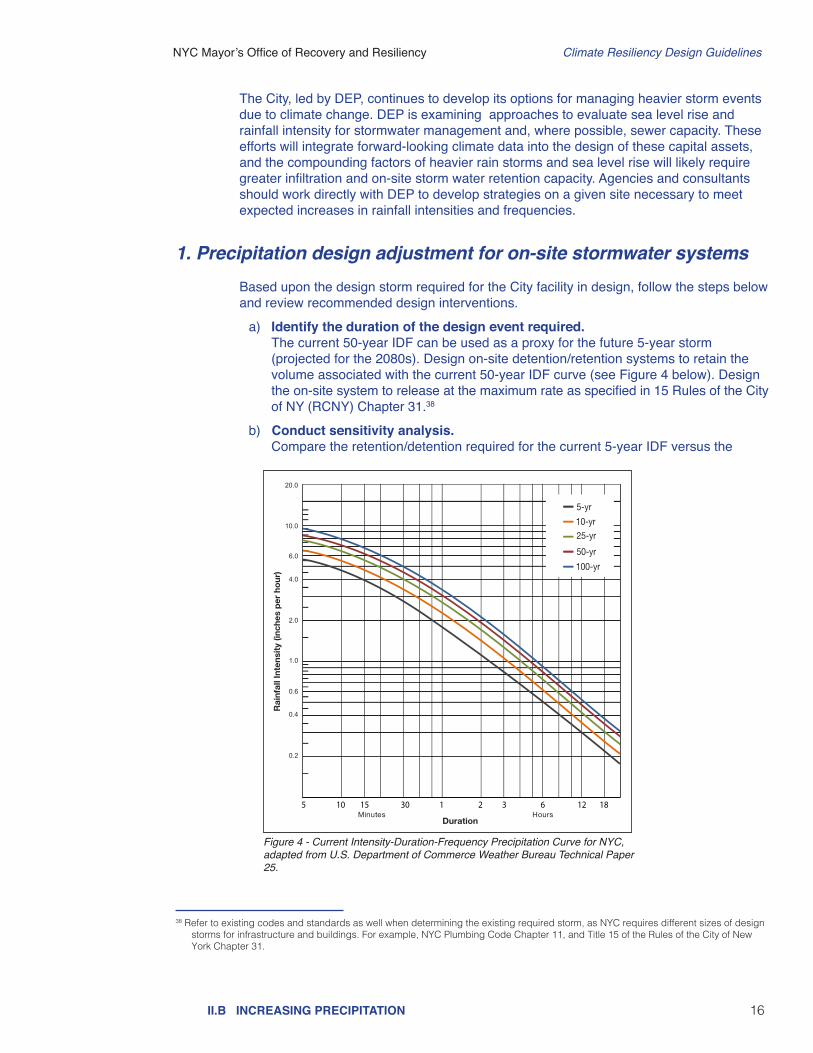
NYC Mayorrsquos Office of Recovery and Resiliency Climate Resiliency Design Guidelines
16IIB INCREASING PRECIPITATION
The City led by DEP continues to develop its options for managing heavier storm events due to climate change DEP is examining approaches to evaluate sea level rise and rainfall intensity for stormwater management and where possible sewer capacity These efforts will integrate forward-looking climate data into the design of these capital assets and the compounding factors of heavier rain storms and sea level rise will likely require greater infiltration and on-site storm water retention capacity Agencies and consultants should work directly with DEP to develop strategies on a given site necessary to meet expected increases in rainfall intensities and frequencies
1 Precipitation design adjustment for on-site stormwater systems
Based upon the design storm required for the City facility in design follow the steps below and review recommended design interventions
a) Identify the duration of the design event required The current 50-year IDF can be used as a proxy for the future 5-year storm
(projected for the 2080s) Design on-site detentionretention systems to retain the volume associated with the current 50-year IDF curve (see Figure 4 below) Design the on-site system to release at the maximum rate as specified in 15 Rules of the City of NY (RCNY) Chapter 3138
b) Conduct sensitivity analysis Compare the retentiondetention required for the current 5-year IDF versus the
38 Refer to existing codes and standards as well when determining the existing required storm as NYC requires different sizes of design storms for infrastructure and buildings For example NYC Plumbing Code Chapter 11 and Title 15 of the Rules of the City of New York Chapter 31
02
04
06
10
20
40
60
100
200
-2316090
Rai
nfal
l Int
ensi
ty (
inch
es p
er h
our
)
DurationsruoHsetuniM
5 10 15 30 1 2 3 6 12 18
5-yr
10-yr25-yr
50-yr
100-yr
NEW YORK NEW YORK
Figure 4 - Current Intensity-Duration-Frequency Precipitation Curve for NYC adapted from US Department of Commerce Weather Bureau Technical Paper 25
NYC Mayorrsquos Office of Recovery and Resiliency Climate Resiliency Design Guidelines
17IIB INCREASING PRECIPITATION
c) Identify design interventions for managing increased precipitation40 There are different ways to manage stormwater better and avoid urban flooding after
intense rain Choose the right combination of interventions after considering the site location operational requirements cost benefits and useful life of the intervention Some examples of design interventions are
bull Minimize increases in impervious surfacebull Utilize strategies that infiltrate evaporate or reuse rainwater to achieve storm
water volume reductions Then choose strategies that detain (delay drainage) to manage the rate of the storm water flow into the Cityrsquos drainage system
bull Install stormwater infiltration detention and storage (eg bioswales41 green roofs blue roofs and other blue or green infrastructure storage basins or tanks)
bull Protect areas below grade from floodingbull Keep catch basin grates clearbull When implementing perimeter protections ensure that interior water
management is also accounted for andbull Explore interventions to protect underground utility and telecommunications
infrastructure from water damage
d) Use appropriate DEP guidelines to perform the above tasks using the higher design storm
The three currently prescribed DEP guidelines are as follows
bull Guidelines for the Design and Construction of Stormwater Management Systems July 201242
bull Criteria for Detention Facility Design November 201243 bull DEP Site Connection Proposal Application and Guidelines44
Note on stormwater standards As DEP updates stormwater standards and develops specific tools to evaluate impacts of increased precipitation and drainage strategies for on-site storm water management these changes will be reflected in future versions of these Guidelines However it is recommended that the designer should develop and consider design interventions that would increase the on-site storage beyond the existing requirements Also a methodology is under development that will establish a consistent citywide process for addressing legal grade which will have further implications for how extreme precipitation is managed
39 NYC DEP Standards for Stormwater Release Rates available at httpwwwnycgovhtmldephtmlenvironmental_reviewsstormwater_release_ratesshtml 40 Also see DEP Guide to Rain Event Preparedness at httpwwwnycgovhtmldeppdfbrochuresflood-preparedness-flyerpdf and
Ready to Respond Strategies for Multifamily Building Resilience at httpwwwenterprisecommunityorgresourcesready-respond-strategies-multifamily-building-resilience-1335641 When siting bioswales consider groundwater levels and soil permeability and ensure that the site is not contaminated from past or
present land uses A high water table may prohibit some applications42 Available at httpwwwnycgovhtmldephtmlstormwaterstormwater_management_constructionshtml43 Available at httpwwwnycgovhtmldeppdfwater_sewer30_criteria_for_detention_facility_design_06062012pdf44 Available at httpwwwnycgovhtmldeppdfwater_sewer24pdf
current 50 year IDF to determine the cost and benefits associated with complying with these Guidelines Use the Evaluation of Project Benefits section below and Appendix 4 for guidance on how to identify and assess benefits Given the results of the costbenefit analyses review the added benefit of designing retentiondetention using greater magnitude storms (eg 100-year) or lower (eg 25-year) The goal is to maximize retentiondetention capacity given site and cost constraints as well as through an evaluation of the benefit of adding capacity to detainretain water for larger storm events
NYC Mayorrsquos Office of Recovery and Resiliency Climate Resiliency Design Guidelines
18
2 Incorporating climate change projections into DEP drainage planning
The first line of defense for managing intense precipitation events does not require changes to the sewer system as described above For drainage and wastewater infrastructure planning in a changing climate the sewer network and wastewater infrastructure should be qualitatively evaluated from the upstream pipes to the regulator chambers pump stations interceptors and ultimately to the downstream outfall to determine the feasibility of incorporating climate change projections into the system design For DEP storm sewer projects FY 2021 or later in separately sewered drainage areas where the design is in the early stages and there is free discharge the agency will evaluate the feasibility of revising the design to incorporate climate projections into the design If the project (including the prescribed changes) passes the costbenefit analysis then DEP will consider incorporating climate change projections into the sizing However changes in one part of the system must be carefully evaluated For example any upsizing of the regulator chamber or the high point of the system can negatively impact the design and operation of the wastewater infrastructure and residencesbusinesses on the system and can lead to a diminished the level of service
DEP is in the process of developing a hydrologic and hydraulic (HampH) model to estimate runoff flow for future climate scenarios and is evaluating rainfall hyetographs for the existing and future rainfall scenarios to be included in the drainage planning process In addition DEP currently coordinates with ORR for drainage planning as a part of coastal resiliency projects A more detailed methodology to incorporate climate change projections into drainage planning will be developed for version 30 of the Climate Resiliency Design Guidelines to be released in April 2019
IIB INCREASING PRECIPITATION
NYC Mayorrsquos Office of Recovery and Resiliency Climate Resiliency Design Guidelines
19IIC SEA LEVEL RISE
non-critical components within a larger facility or campus (eg at a maintenance yard differentiate between structures and equipment) Critical components essential to the facilityrsquos functionality should be protected to the higher standard for criticality even if the facility itself may be non-critical Some examples of critical components include electrical distribution and switching areas motor-control centers chemical feed equipment boilers communications systems monitoring and safety equipment HVAC units fire alarms and suppression equipment furnaces elevators emergency fuel supplies emergency generators and hazardous material storage Component protection should also be evaluated if a facility is expected to be fully operational during a flood event or if it is expected to quickly resume full operations after an event
For buildings and infrastructure with a long useful life it is not always cost effective or operationally feasible to design a facility to be resilient to hazards faced at the end of its useful life In these cases the most resilient design will be one that provides extra protection against hazards in the initial decades while also leaving open design alternatives for updating resiliency measures as new data is provided or new risk assessments are completed This flexible adaptation pathways approach builds in options to protect assets later in life as demonstrated in an example shown in Figure 1 (in Section I)
Other considerations to keep in mind includebull These Guidelines apply to all City capital projects except coastal flood protection
systems which are designed to different standards than those provided here for
C SEA LEVEL RISEThis section provides tools to 1) determine if the project will be subject to tidal inundation during its useful life due to sea level rise and 2) incorporate sea level rise into flood protection levels of capital projects For projects in the current and future 1 annual chance floodplains sea level rise-adjusted design flood elevations (DFE) are provided and reflect the criticality of the asset and its useful life Background NYC has experienced the devastation of coastal storms most recently during Hurricane Sandy Sea level rise is projected to increase the depth extent and frequency of flooding from storm surge45 Sea level rise will also regularly inundate some low-lying areas during high tides Current flood protection heights are determined by using the base flood elevation established by the FEMA Preliminary Flood Insurance Rate Map (PFIRM) 201546 and the standard of protection for buildings in the floodplain in Appendix G of the NYC Building Code47 These Guidelines augment existing requirements for two primary purposes ensuring City facilities built today incorporate sea level rise and critical assets (as defined in Table 4) are protected to a higher level It is important to note that all projects and design interventions must comply with NYC Building Code
Designers should differentiate between critical and
45 New York City Panel on Climate Change Report Chapter 2 Sea Level Rise and Coastal Storms (2015)46 However NYC Building code G10222 requires that designers review both the PFIRM and the effective FIRM and use the more
restrictive of the two 47 For information on the differences between FEMA FIRM PFIRM and the Cityrsquos forward-looking flood maps see Appendix 3
Critical components essential to the facilityrsquos functionality should be protected to the higher standard for criticality even if the facility itself is non-critical
NYC Mayorrsquos Office of Recovery and Resiliency Climate Resiliency Design Guidelines
20IIC SEA LEVEL RISE
buildings and other physical infrastructure Many of NYCrsquos coastal flood protection systems are currently being developed to comply with FEMA accreditation for flood levee systems48 The City plans to develop further guidance for designing coastal protection projects
bull For information on the differences between FEMA FIRM PFIRM and the Cityrsquos forward-looking flood maps see Appendix 3
bull Coincident stressors from sea level rise should also be considered For example bridge scour may increase as sea levels rise Similarly flooding during heavy rainfall events can be worsened due to higher tailwater conditions associated with high sea levels Be aware of how different risks may interact and how different interventions can be deployed to address multiple hazards or provide other co-benefits
bull Note projects that require discretionary approval are required to incorporate sea level rise projections as part of the NYC Waterfront Revitalization Program49 and
bull A methodology is under development that will establish a consistent citywide process for addressing legal grade which will have further implications for how sea level rise and precipitation are managed
For more information see Section IE Designers should use the resources and methods described in this section to 1) assess tidal inundation due to sea level rise and 2) address risks in the current and future floodplains
1 Assessing tidal inundation due to sea level riseTidal flooding currently affects parts of NYC and is projected to worsen as sea levels rise and inundate low-lying coastal sites during high tides When determining a site location or establishing scope of substantial improvements for other types of coastal facilities the project team will consider alternative sites outside of zones threatened with regular inundation if resiliency actions are not taken Some facilities such as wastewater treatment plants and harbor facilities need to be near the coast for operational purposes
a) Determine tidal inundation risk from sea level rise Use the Flood Hazard Mapper (httpwwwnycgovfloodhazardmapper)50 to see if your
site is in an area inundated from high tide plus sea level rise within the projectrsquos useful life For example if the useful life ends between 2040 and 2069 choose the 2050s High Tide map) Determine risk only from high tide and sea level rise separate from flood events Follow the instructions in Figure 5 and refer to the example in Figure 6 to review inundation at the end of an assetrsquos useful life
48 For more information please visit httpwwwfemagovfema-levee-resources-library49 For more information visit httpwwwnycgovwrp50 The Flood Hazard Mapper relies on publicly available data to present these map resources Users should also refer to FEMA and the
NPCC for official information
Figure 5 - Flood Hazard Mapper high tide plus sea level rise at httpwwwnycgovfloodhazardmapper
NYC Mayorrsquos Office of Recovery and Resiliency Climate Resiliency Design Guidelines
21IIC SEA LEVEL RISE
b) Address flood risk If the Flood Hazard Mapper shows that the facility is expected to be inundated by
high tides within its useful life or if primary access roads are at risk of inundation consider alternative site options
- OR - If the site is not expected to be regularly inundated by tides proceed to the next
section 2 Addressing Risks in the Current Floodplain
Note on calculating tidal inundations with sea level rise if a project team is interested in understanding the depth of tidal inundation given climate change projections follow these steps First determine the Mean Higher High Water (MHHW) elevation in feet-NAVD 8851 datum nearest to the site If the MHHW data is unavailable from a site specific survey refer to httpwwwnycgovwrp for a list of MHHW elevations (NAVD88) at tide stations across the city52 Second add the high estimate (90th percentile) of expected sea level rise (see Table 8 in Appendix 2) for the year corresponding to the facilityrsquos useful life to the MHHW to determine the projected depth of tidal inundation with sea level rise
51 North American Vertical Datum of 1988 (NAVD 88) is the vertical control datum of orthometric height established for vertical control surveying in the US based upon the General Adjustment of the North American Datum of 1988
httpswwwngsnoaagovdatumsvertical52 SLR elevations at httpwwwnycgovwrp are adjusted to account for sea level rise since the last tidal epoch If no other resource is
available to determine MHHW use the NOAA Online Vertical Datum Transformation tool to calculate the MHHW in feet-NAVD
Figure 6 - Flood Hazard Mapper with high tide in the 2020s (left) and in the 2080s (right) at httpwwwnycgovfloodhazardmapper
NYC Mayorrsquos Office of Recovery and Resiliency Climate Resiliency Design Guidelines
22IIC SEA LEVEL RISE
2 Addressing risks in the current floodplain53
A facility located in the current 1 annual chance floodplain (PFIRM 2015)54 will face increasing risk of flooding during its useful life due to sea level rise increasing the depth of coastal storms This section provides a process for adjusting the design flood elevation required by code to account for sea level rise
a) Find the location of the facility using the Flood Hazard Mapper (httpwwwnycgovfloodhazardmapper) and follow the instructions in Figure 7
bull Choose to view the layer ldquoFEMA Preliminary FIRM 2015rdquo bull Click on the facility site in the 1 floodplain to view the base flood elevation
Figure 7 - Flood Hazard Mapper with FEMA PFIRM (2015) at wwwnycgovfloodhazardmapper
b) If the facility is not in the current 1 annual chance floodplain (PFIRM 2015) proceed to the next section ldquo3 Addressing risks in the future floodplainrdquo
- OR - If the facility is in the current 1 annual chance floodplain (PFIRM 2015) note
the base flood elevation (BFE) and proceed to Step c) below Please note if a facility has multiple BFEs or if the site is partially in the 1 annual chance floodplain it is recommended to use the highest BFE as the current BFE for the entire site
c) Establish a sea level rise-adjusted DFE Use the current base flood elevation at your site the facilityrsquos useful life and its
criticality level to determine the design flood elevation using Table 4 (on the next page) as a basis of design
53 This process for adjusting the design flood elevation to account for sea level rise satisfies the criteria of the climate-informed science approach described at the state and federal level
54 FEMA updates its flood maps periodically As of April 2018 the most recent maps are the Preliminary Flood Insurance Rate Maps (PFIRM) available at DCPrsquos Flood Hazard Mapper (httpwwwnycgovfloodhazardmapper) Also note that NYC Building Code requires developers to use the PFIRM (2015) or the FIRM (2007) whichever is more restrictive For more information on these requirements please refer to Appendix G of the NYC Building Code Please note that the DCP maps are not official and all site locations should be confirmed with the official FEMA PFIRM NYC will provide information on the latest flood maps as they are updated
NYC Mayorrsquos Office of Recovery and Resiliency Climate Resiliency Design Guidelines
23IIC SEA LEVEL RISE
Table 4 - Determine the sea level rise-adjusted design flood elevation for critical and non-critical facilities55
Critical facilities
End of useful life Base Flood Elevation (BFE)56 in NAVD 88 + Freeboard57 + Sea Level Rise
Adjustment58= Design Flood Elevation (DFE) in
NAVD 88Through 2039 FEMA 1 (PFIRM) 24rdquo 6rdquo = FEMA 1 + 30rdquo
2040-2069 FEMA 1 (PFIRM) 24rdquo 16rdquo = FEMA 1 + 40rdquo2070-2099 FEMA 1 (PFIRM) 24rdquo 28rdquo = FEMA 1 + 52rdquo
2100+ FEMA 1 (PFIRM) 24rdquo 36rdquo = FEMA 1 + 60rdquoNon-critical facilities
End of useful life Base Flood Elevation (BFE) in NAVD 88 + Freeboard + Sea Level Rise
Adjustment = Design Flood Elevation (DFE) in
NAVD 88Through 2039 FEMA 1 (PFIRM) 12rdquo 6rdquo = FEMA 1 + 18rdquo
2040-2069 FEMA 1 (PFIRM) 12rdquo 16rdquo = FEMA 1 + 28rdquo2070-2099 FEMA 1 (PFIRM) 12rdquo 28rdquo = FEMA 1 + 40rdquo
2100+ FEMA 1 (PFIRM) 12rdquo 36rdquo = FEMA 1 + 48rdquoAdditional analysis should be conducted to incorporate wave action and wave run-up in DFE calculations especially in areas that are located within the FEMArsquos 1 annual chance Limit of Moderate Wave Action (LiMWA) zone Wave run up is the maximum vertical extent of wave uprush above surge
Definition of critical buildings and infrastructure for determining DFE in Table 4The criticality definitions below are for use in the application of the Guidelines only All items identified as critical in NYC Building Code Appendix G are critical in these guidelines however this list includes additional facilities that are not listed in Appendix G59 If a facility is not listed here it is considered non-critical for the purposes of determining freeboard
bull Hospitals and health care facilitiesbull Fire rescue ambulance and police stations and emergency vehicle garages bull Jails correctional facilities and detention facilities bull Facilities used in emergency response including emergency shelters emergency preparedness communication
operation centers communication towers electrical substations back-up generators fuel or water storage tanks power generating stations and other public utility facilities
bull Critical aviation facilities such as control towers air traffic control centers and hangars for aircraft used in emergency response
bull Major food distribution centers (with an annual expected volume of greater than 170000000 pounds)60 bull Buildings and other structures that manufacture process handle store dispose or use toxic or explosive
substances where the quantity of the material exceeds a threshold quantity established by the authority having jurisdiction and is sufficient to pose a threat to the public if released61
bull Infrastructure in transportation telecommunications or power networks including bridges tunnels (vehicular and rail) traffic signals (and other right of way elements including street lights and utilities) power transmission facilities substations circuit breaker houses city gate stations arterial roadways telecommunications central offices switching facilities etc
bull Ventilation buildings and fan plantsbull Operations centersbull Pumping stations (sanitary and stormwater)bull Train and transit maintenance yards and shopsbull Wastewater treatment plantsbull Water supply infrastructurebull Combined-sewer overflow (CSO) retention tanksbull Fueling stationsbull Waste transfer stations and bull Facilities where residents have limited mobility or ability including care facilities and nursing homes
55 If an industry standard does not include freeboard in its flood protection standards for particular infrastructure assets then only consider the sea level rise adjustment when determining flood protection levels
56 Note that NYC Building Code requires developers to use the PFIRM (2015) or the FIRM (2007) whichever is more restrictive For more information on these requirements please refer to Appendix G of the NYC Building Code
57 These freeboard values reflect NYC Building Code Appendix G Table 2-1 which establishes the minimum elevation of the top of lowest floor Appendix G requires other freeboard values for other parts of structures and in different parts of the floodplain Refer to Appendix G for the appropriate freeboard and use that value in Table 4 above
58 The sea level rise figures provided are for the middle of the 25th-75th percentile range projections from the NPCC These values do not necessarily indicate the average of all models
59 The structural occupancy categories outlined in Appendix G of the NYC Building Code are the same as ASCE 7 used for structural design For critical buildings structural design should comply with ASCE 7 and 24 for design class IV
60 This threshold represents the median volume of main food distributors in NYC according to statistics collected as part of the Five Borough Food Flow study in 2016 available at
httpswwwnycedccomsystemfilesfilesresource2016_food_supply-resiliency_study_resultspdf 61 The threshold quantity for hazardous materials is established by Chapter 7 of Title 24 of the NYC Administrative Code
NYC Mayorrsquos Office of Recovery and Resiliency Climate Resiliency Design Guidelines
24IIC SEA LEVEL RISE
Figure 9 ndash Outdoor emergency generator for the critical building
This case study provides an example of how to calculate a sea level rise-adjusted DFE based on the useful life of a hypothetical critical services building and its primary component
Step 1 Organize the site by various critical or primary components and their year of construction Determine their useful life along with the associated future year scenario for flood risk assessment In this example the building structure and the outside emergency generator are the most at-risk components from combined sea level rise and coastal storm surge
Step 2 Overlay the site footprint area over the effective current PFIRM or FIRM and the corresponding future year scenario FEMA 1 to identify flood risk to the site From overlaying the 2015 preliminary FEMA floodplain over the site it was determined that the site has a 1 annual chance of flooding with a base flood elevation of 13rsquo NAVD Step 3 Evaluate the criticality of each primary component of the facility based on the Guidelinesrsquo definition for critical infrastructure (Table 4) This (hypothetical) building is critical
Step 4 Use Table 4 to determine the sea level rise adjustment and freeboard requirements for each component and calculate the DFE for each that corresponds to its useful life period
Step 5 Compare the DFE of each component and the associated Guidelinesrsquo recommended DFE to calculate anticipated flood depth
CASE STUDY Adjusting the DFE for Sea Level Rise
Table 5 ndash Example of how to calculate a sea level rise-adjusted DFE for a critical facility
Construction year Components Useful
Life
Future Year Scenario
[Useful Life + Const
Year]
BFE in NAVD
88 (feet)
Freeboard + Sea
Level Rise Adjustment
(feet)
Adjusted DFE in
NAVD 88 (feet)
2010 Building Structure
70 years 2070-2099 130rsquo 2rsquo+23rsquo 173rsquo
2010Outdoor
Emergency Generator
25 years
Through 2039 130rsquo 2rsquo+05rsquo 155rsquo
Figure 8 - Example of how to locate a facility within the current floodplain and determine the BFE Figure 9 (inset) - Outdoor emergency generator at the facility
Figure 10 - This schematic shows how to determine the design flood elevation of a facility within the current 1 floodplain
Illustrative not to scale
NYC Mayorrsquos Office of Recovery and Resiliency Climate Resiliency Design Guidelines
25IIC SEA LEVEL RISE
Figure 11 - Flood Hazard Mapper with future 1 annual chance floodplain (adjusted for sea level rise) at httpwwwnycgovfloodhazardmapper
b) If the site is not in the future floodplain no flood protection is required for this facility
- OR - If the site is in the future floodplain identify the nearest adjacent base flood
elevation at the project site in the current 1 annual chance floodplain (PFIRM 2015) using the Flood Hazard Mapper62
c) Use Table 4 to determine the DFE Add freeboard and the sea level rise-adjustment to the nearest adjacent BFE on the
current 1 annual chance floodplain (PFIRM 2015) to determine the DFE
d) Apply the DFE calculation from Table 4 to the protected facility See Figures 12 and 13 for an illustration of how to calculate the DFE
62 Maps of future floodplains show the impacts of sea level rise alone and do not consider how changes in stormsrsquo climatology might also affect wave action and the full extent of the floodplain
3 Addressing risks in the future floodplainIf the facility is not in the current 1 annual chance floodplain (PFIRM 2015) it may still be at risk in the future from flooding as sea level rise increases the extent of the floodplain Follow the steps below to determine if your facility is located in the future floodplain and if so what sea level rise-adjusted DFE to use
a) Use the Flood Hazard Mapper (httpwwwnycgovfloodhazardmapper) to determine if the facility site will be in the future 1 annual chance floodplain
Assess if by the end of the facilityrsquos useful life the floodplain is projected to increase to encompass all or part of the project site For example if the useful life ends between 2040 and 2069 choose the 2050s floodplain map Refer to the steps in Figure 11 below
NYC Mayorrsquos Office of Recovery and Resiliency Climate Resiliency Design Guidelines
26IIC SEA LEVEL RISE
Figure 12 - This schematic map shows how to locate the nearest adjacent 1 floodplain elevation
Figure 13 -This schematic shows how to determine the design flood elevation of a facility that is outside of the current 1 floodplain
CASE STUDY Identifying a Base Flood Elevation (BFE) in the Future Floodplain
Illustrative not to scale
NYC Mayorrsquos Office of Recovery and Resiliency Climate Resiliency Design Guidelines
27IIC SEA LEVEL RISE
4 Identify appropriate design interventions
63 Additional resources for identifying adaptive strategies Urban Waterfront Adaptive Strategies (NYC Department of City Planning httpswww1nycgovassetsplanningdownloadpdfplans-studiessustainable-communitiesclimate-resilienceurban_waterfrontpdf Floodproofing Non-Residential Buildings (FEMA) at httpswwwfemagovmedia-libraryassetsdocuments34270 Ready to Respond Strategies for Multifamily Building Resilience (Enterprise Green Community) at
httpwwwenterprisecommunityorgresourcesready-respond-strategies-multifamily-building-resilience-1335664 While natural systems-based approaches ameliorate flooding their use for storm surge or wave mitigation would need to be quantified
before contributing towards the design flood elevation 65 For more information see FEMArsquos Floodproofing Non-Residential Buildings at httpswwwfemagovmedia-libraryassetsdocuments34270
Operational requirements and continuity plans can inform the selection of appropriate design interventions particularly in terms of how quickly a site needs to be up and running after a flood event Some examples of how functional uses can pair with interventions include
bull A facility that needs to be operating during or immediately after a flood event may need to be dry floodproofed using permanent barriers or designed for passive survivability (such as a police or fire station)
bull A facility that needs to recover quickly after an event could elevate prioritized equipment and have deployable barriers
bull A site that can recover over a longer duration of time could be temporarily inundated during an event (such as parks or plazas) The use of resilient materials and strategies can reduce costly damage caused by temporary inundation
Different design interventions should be chosen based on the specific operational requirements of the project however these must meet the ASCE 24 design requirements for Coastal VE Zones
For all projects at risk of current or future flooding select protections that meet the projectrsquos design flood elevation Consider project-specific factors including the site location operational requirements existing continuity planning and cost63 A Design Strategies Checklist in Appendix 6 is available for use as a resource to track possible design approaches Some examples of design alternatives are
bull Site relocation where feasible conduct alternative site analysis
bull Permanent barriers at a site (eg floodwalls)
bull Deployable flood barriers (eg stop logs flood doorsgates inflatable barriers)
bull Natural systems-based approaches (eg living shorelines restored wetlands)64
bull Prioritized protection of electrical mechanical and other critical or costly-to-replace equipment above the design flood elevation (eg motors and controller boilers and furnaces fuel storage tanks duct work alarm systems and suppression equipment electrical panels electrical distribution and switching areas gas and electric meters telecommunications equipment chemical feed equipment HVAC units and emergency generators)65
bull Dry floodproofing design a facility to prevent water from entering
bull Wet floodproofing design a facility to permit floodwaters to flow in and out of the structure without causing significant damage (eg elevate or protect critical equipment use water-resistant building materials below the design flood elevation include flood vents and pumps)
bull Design redundant telecommunications conduit entrances for multiple carrier entry Telecom conduit should run to diverse manholes when possible
bull Install backup power for telecom equipment with design consideration for such equipment (eg installation above DFE)
bull Install outdoor-rated disconnect switch for telecommunications equipment on the roofbull Explore interventions to protect underground utilities and other telecommunications
facilities from water damagebull Install backflow preventers backwater valves and sump pumps for all buildings and
infrastructure in the floodplain as well as behind flood barriersbull Shoreline improvements that reduce the height of waves or attenuate waves where
feasible
NYC Mayorrsquos Office of Recovery and Resiliency Climate Resiliency Design Guidelines
28IIIA GENERAL METHODOLOGY TO ESTIMATE PROJECT BENEFITSIIIB CATEGORIES OF PROJECT BENEFITS
Designing and constructing facilities to handle the future climate loads above the current NYC codes and standards based on projected useful life of the components provides resiliency benefits The incremental costs to implement the Guidelinesrsquo recommended design interventions should be compared with the incremental benefits to aid agencies in making decisions about resilient design strategies The project design team should evaluate benefits of the interventions designed to meet Guidelinesrsquo recommended criteria for all the climate stressors qualitatively andor quantitatively For projects with construction costs below $50 million the project design team is recommended to perform a qualitative benefits assessment on the interventions that meet the Guidelinesrsquo recommendations for all applicable climate stressors For critical facilities or projects with construction costs over $50 million the project design team is recommended to perform quantitative benefit calculations to identify the optimal interventions that meet Guidelinesrsquo recommended design criteria
A GENERAL METHODOLOGY TO ESTIMATE PROJECT BENEFITSThis general methodology to perform qualitative and quantitative benefit calculations is recommended for use by project design teams at the beginning of and during the design process This methodology enables estimation of project benefits for a high-level benefit-cost analysis (BCA) that can be applied to evaluate and compare resiliency features designed to address sea level rise with coastal storm surge increased precipitation and extreme heat events The type of benefits provided by interventions designed to meet the Guidelinesrsquo design criteria can vary by climate stressors and typology of the facilities The main guiding principle in development of the high-level BCA methodologies included in these Guidelines was to balance simplicity with accuracy The project benefits categories identified within the methodology may not cover all the potential benefits provided by every facility type within NYC In particular the benefits of planning for increased precipitation are difficult to quantify Hence the project design team should use their discretion to modify this general benefit calculation methodology as needed to meet their project goals and objectives The project design team should develop appropriate input data whether quantitative or qualitative needed to estimate project benefits
B CATEGORIES OF PROJECT BENEFITSThere are three types of project benefit categories - direct benefits indirect benefits and other benefits - that can be used to perform qualitative assessments and develop quantitative estimates of monetary benefits for intervention alternatives designed to meet the Guidelinesrsquo recommendations These project benefit categories will help to perform a high-level benefit-cost analysis that balances accuracy with an appropriate level of effort
bull Direct Benefits include reduced or avoided physical damages to facilities and contents reduced or avoided displacements for residential structures and reduced life cycle or OampM costs that can be quantified as a primary result of implementing a specific hazard mitigation measure Table 12 in Appendix 4 provides a list of direct benefits and basic guidance on estimating and documenting values for sea level rise and increased precipitation-related flood hazards Note that given the current state of practice it is not possible to quantify reduced or avoided physical damages or residential displacements that result from a specific extreme heat mitigation measures Therefore direct benefits applicable to extreme heat hazards are limited to reduced life cycle costs applicable to certain measures such as green roofs Refer to Table 15 for details on direct benefits for extreme heat hazards
III EVALUATION OF PROJECT BENEFITS
NYC Mayorrsquos Office of Recovery and Resiliency Climate Resiliency Design Guidelines
29IIIB CATEGORIES OF PROJECT BENEFITS
bull Indirect Benefits include reduced or avoided service losses for non-residential
buildings public facilities andor infrastructure (utilities roads and bridges) based on the value of service continuity andor emergency services to New Yorkers that can be quantified as a secondary result of implementing a specific hazard mitigation measure Table 13 in Appendix 4 provides a list of indirect benefits and basic guidance on estimating and documenting values for sea level rise and increased precipitation-related flood hazards Note that given the current state of practice on extreme heat it is not possible to quantify reduced or avoided service losses that result from a specific extreme heat mitigation measures Therefore indirect benefits applicable to extreme heat hazards are limited to reduced energy costs such as cool roofs green roofs or shade trees Refer to Table 15 in Appendix 4 for details on indirect benefits for extreme heat hazards
bull Other Benefits where applicable other potential benefits may include social benefits for residents such as avoided stress and anxiety avoided lost productivity environmentalecosystem service benefits avoided need for emergency services and other potential benefits that can be estimated as a result of implementing a specific hazard mitigation measure Table 14 in Appendix 4 provides a list of other potential benefits and basic guidance on estimating and documenting values for sea level rise and increased precipitation-related flood hazards
Note on the ecosystem service benefit category in Table 14 the stormwater management benefits of green infrastructure should be distributed between the extreme heat and increased precipitation hazards since these measures provide both significant reductions in rainfall runoff as well as Urban Heat Island mitigation through evapotranspiration However there is currently limited data available to quantify the actual distribution of stormwater management benefits between the two hazards For various dual-benefit providing interventions careful considerations should be given to identify the appropriate benefits category provided by the intervention with a goal to avoid duplication of quantified benefits In this methodology the stormwater management benefits of green infrastructure are applied to the increased precipitation hazard in order to avoid a duplication of benefits Note on real estate and quality of life benefits additionally it is important to note that two potential benefit categories shown in Table 14 - real estate and quality of lifehealthavoided casualties - were not included in the current BCA methodology for sea level rise or increased precipitation hazards Although these categories could increase project benefits for sea level rise and increased precipitation hazards they were only applied to measures that address extreme heat hazards such as green roofs trees and other plantings Refer to Table 15 for a detailed summary of other benefit categories quantified as unit benefits for extreme heat hazards
NYC Mayorrsquos Office of Recovery and Resiliency Climate Resiliency Design Guidelines
30IIIC WHICH METHODOLOGY TO USEIIID BCA METHODOLOGY FOR PROJECTS UNDER $50 MILLION
D BCA methodology for projects under $50 millionThe project design team should develop design alternatives to meet the Guidelinesrsquo criteria which may be in excess of NYC code and standards requirements (baseline conditions) It is assumed that the project design team will develop alternatives to address each of the following applicable climate stressors - sea level risecoastal storm surge increased precipitation and extreme heat - separately Tables 12-15 in Appendix 4 provides a list of typical direct indirect and other benefits provided by various intervention typologies to reduce impacts from climate stressors During the qualitative assessment the project design team should consider that intervention strategies will have varying levels of reliability effectiveness benefits and cost implications during the qualitative assessment
The project design team is recommended to develop appropriate evaluation criteria and metrics for each of the applicable project benefit categories For each alternative the project design team could use either a scoring weighting ranking or other type of qualitative assessment framework to assess each applicable project benefit categories with the developed evaluation criteria and metrics Table 6 provides an example template to evaluate alternatives using a set of general evaluation criteria and metrics using a color-coded rating system (and see Table 7 for an example of how to complete the template) The project design team can utilize a similar template customized to their project goals and objectives This assessment allows agencies to screen the qualitative benefits for various alternatives that would then lead to development of final project components to match the available budget and goals of the project
Projects with total costs below $50 million recommended to conduct a qualitative assessment to identify the optimal interventions that meet Guidelinesrsquo design criteria using the ldquoD) BCA methodology for projects under $50 millionrdquo methodology below
C WHICH METHODOLOGY TO USEProjects with a total cost above $50 million or are highly complex or critical facilities recommended to conduct both a qualitative and quantitative benefit calculation to identify the optimal interventions that meet Guidelinersquos design criteria using the ldquoE) BCA methodology for projects above $50 millionrdquo below A quantitative BCA also must include qualitative factors
NYC Mayorrsquos Office of Recovery and Resiliency Climate Resiliency Design Guidelines
31IIID BCA METHODOLOGY FOR PROJECTS UNDER $50 MILLION
Qualitative Color Scale Green=Least resource intensive alternative Purple=most resource intensive yellow=medium level of resource intensity
Qualitative Evaluation Factors Description Relative Color Rating System
First CostsAdditional construction costs needed to incorporate Guidelinesrsquo recommended resilient design over the baseline project costs
Highest cost ($$$) rated as Purple whereas lowest cost ($) rated as Green
ConstructabilityEase of Implementation
Construction techniques and site conditions such as presence of major utilities conflicts and other conditions which dictate the level of constructability required for each alternative
Difficult to construct rated as Purple whereas easiest to construct rated as Green
Environmental ImpactsCo-BenefitsPermitting
Impacts to the built and natural environment such as circulation noise and hazardous waste plus the level of effort required for permitting (eg interventions in water require highest level of permitting requirement) from each alternative in addition to the baseline project condition
Highest environmental impacts and highest level of effort required for permitting rated as Purple whereas the least impact and level of effort rated as Green
Operation and Maintenance (OampM)
Level of effort of additional manpower and cost of OampM for the alternatives over the baseline project OampM requirements
Highest level of effort and cost for OampM rated as Purple whereas the lowest is rated as Green
Reliability and Durability
Interventions that do not require human involvement or a facilityrsquos ability to withstand all the forces during a storm event (eg permanent solutions with higher reliability than deployable solution)
Interventions requiring human involvement (active measures) rated as Purple whereas interventions with minimal or no human involvement (passive measures) rated as Green
Risk Reduction Benefits Monetary benefits provided by each intervention alternative in avoided damages over the baseline condition
Lowest potential monetary benefit rated as Purple whereas as highest potential monetary benefit rated as Green
Quality of Life BenefitsVisual Aesthetics
Benefits either to the community such as recreation or safety or serve the community during emergency situations
Lowest potential quality of life benefits rated as Purple whereas as highest potential benefits rated as Green
Table 6 ndash Evaluation matrix for comparison of mitigation alternatives across the useful life of a project
Project title_______________________________________________________________________________
Evaluation Criteria
Baseline Condition (Designed to NYC Building Code and
Standards)
Resilient Design Alternatives for Managing__________________
Alternative 1
Alternative 2
Alternative 3
First Costs
ConstructabilityEase of ImplementationEnvironmental ImpactsCo-BenefitsPermitting
Operation and Maintenance (OampM)
Reliability and Durability
Risk Reduction Benefits
Quality of Life BenefitsVisual Aesthetics
NYC Mayorrsquos Office of Recovery and Resiliency Climate Resiliency Design Guidelines
32IIID BCA METHODOLOGY FOR PROJECTS UNDER $50 MILLION
Table 7 ndash Evaluation matrix for comparison of mitigation alternatives across the useful life of a project - COMPLETED EXAMPLE
Evaluation Criteria
Baseline Condition (Designed to NYC Building Code and
Standards)
Resilient Design Alternatives for Managing Coastal SurgeSLR
Alternative 1Flood proof building built on grade to Guidelines
DFE
Alternative 2 Elevate building structure above Guidelinesrsquo DFE
on columns
Alternative 3 Raise site grade by filing the building site footprint
to Guidelinesrsquo DFE
First CostsBaseline cost for building structure is $15 million
Incremental costs are within 5 over the baseline costs
Incremental costs are between 5-10 over baseline costs
Incremental costs are 20 and more over baseline costs
ConstructabilityEase of Implementation
Relatively easy to construct within site constraints
Similar to baseline conditions since construction requires additional flood proofing only
Moderate challenges to construct foundation structure for columns within site constraints
Extremely challenging to construct within the site constraints Potentially fatal flaw
Environmental ImpactsCo-BenefitsPermitting
No major impacts but may require additional effort to obtain DOB permits with flood proofing and deployable systems
No major impacts but may require additional effort to obtain DOB permits with flood proofing and deployable systems
No major impacts and relatively easy to permit
Potential drainage circulation impacts and challenges to obtain clean fill material for the site
Operation and Maintenance (OampM)
Major OampM costs associated with deployable systems
Major OampM costs associated with deployable systems
Moderate OampM costs associated with proposed elevator for access
Minimal OampM costs since deployable and elevators not required
Reliability and Durability
Least reliability with highest potential risk from flooding during to failure of deployable systems
Least reliability with highest potential risk from flooding during to failure of deployable systems
Moderate reliability with potential risk from flooding limited to elevator shaft only
Highest reliability since deployable are not required to protect building from flooding
Risk Reduction Benefits
Maximum flood risk reduction benefits assuming deployable and flood proofing is effective
Maximum flood risk reduction benefits assuming deployable and flood proofing is effective
Maximum flood risk reduction benefits
Maximum flood risk reduction benefits
Quality of Life BenefitsVisual Aesthetics
Facility may not be operational during the storm event
Facility may not be operational during the storm event
Facility can be potentially operational during the storm event
Facility can be potentially operational during the storm event
Qualitative Color Scale Green=Least resource intensive alternative Purple=most resource intensive yellow=medium level of resource intensity
A new non-critical facility with a building structure is proposed on a site that is currently in the 2015 Preliminary FEMA 1 annual chance floodplain with a BFE of 10rsquo (NAVD 88) The baseline conditions DFE to meet existing NYC codes and standards is 11rsquo (NAVD 88) Using the Guidelines recommended design criteria the facilityrsquos DFE is 133rsquo (NAVD 88) and existing grade is around 6rsquo (NAVD 88) The project design team develops three alternatives to meet the Guidelinesrsquo recommended DFE design for the facility Table 7 offers an example of how a qualitative assessment can be used to compare three resilient design alternatives using the evaluation criteria and metrics
CASE STUDY Example of How to Use the Evaluation Matrix
NYC Mayorrsquos Office of Recovery and Resiliency Climate Resiliency Design Guidelines
33IIIE BCA METHODOLOGY FOR PROJECTS OVER $50 MILLION
E BCA methodology for projects over $50 millionIn order for a project to be considered cost-effective a benefit-cost analysis (BCA) assesses if the benefits of a project outweigh its costs or in other words the benefit-cost ratio (BCR) is greater than 10 as illustrated in Equation 1
Equation 1 Benefit-Cost Ratio Formula
BCR =
Where BCR = Benefit-Cost Ratio
BENEFITS = Total project benefits
COSTS = Total project costs
BENEFITSCOSTS
These estimated project benefits are combined with the project costs which are defined as the differential construction and long-term operation and maintenance costs associated with constructing a proposed project to the Guidelinesrsquo recommended design level It is assumed that the baseline project will be designed to the most prevalent NYC codes and standards This benefit methodology should be used to determine the additional project benefit that the Guidelinesrsquo recommended design would provide over the baseline project benefit It is assumed that the project design team will develop alternatives to address each of the following applicable climate stressors - sea level risecoastal storm surge increased precipitation and extreme heat - separately For each alternative the project design team should use the following steps to determine the Benefit-Cost Ratio (BCR)
a) Determine project useful life for design interventions Determining the useful life of the proposed project is an important first step in the
detailed BCA assessment methodologies for two reasons First the project useful life determines what values must be used from the Guidelines to establish the future climate design conditions The various hazard tables in the Guidelines establish design requirements based on useful life ranges through 2039 2040-2069 2070-2099 and 2100+ (2100+ projections are only available for sea level rise) A review of these tables show that the design requirements needed to meet the projected climate hazards increase as the end of useful life range increases Second the useful life determines how long the project will need to be operated and maintained in order to remain technically sound and effective at reducing future damages and losses
b) Determine discount rate for project benefits calculation The cost-effectiveness of projects assessed using the BCR must be done on a net
present value basis meaning the present value of the benefits is compared to the present value of the costs Most project costs are computed for present value based on current cost estimates bids or cost guidance However project benefits - as well as project costs for operation and maintenance - accrue over time into the future and are computed on an annualized basis To address this issue the Present Value Coefficient (PVC) is used to bring these annualized project benefits and OampM costs into the present value As indicated by the formula in Equation 2 the PVC is a function of the Project Useful Life (PUL) and the Discount Rate (DR)
NYC Mayorrsquos Office of Recovery and Resiliency Climate Resiliency Design Guidelines
34
Equation 2 Present Value Coefficient (PVC) Formula
PVC =
Where PVC = Present Value Coefficient
PUL = BCA Project Useful Life based on project type
DR = Discount Rate
The project design team should coordinate with agencies and NYC OMB if needed to determine appropriate discount rates based on funding source project type and other factors This coordination should take place during project initiation phase where total project costs (design and construction) are over $50 million66
c) Develop input data to perform benefit calculations Tables 16 and 17 in Appendix 4 provide a list of typical input data by each climate
stressor needed to perform benefit analysis quantitatively on variety of facilities67 The project design team should use these tables as a reference to identify appropriate input data categories andor additional input data needed to perform benefit analysis on the project
d) Identify applicable project benefit categories to estimate benefits Tables 16 and 17 in Appendix 4 provide a list of typical project benefits by each climate
stressor needed to perform benefit analysis quantitatively on various types of projects The project design team should use these tables as a reference to identify appropriate project benefit categories for each climate stressor to perform benefit analysis on the project
e) Calculate benefits of recommended design interventions for each climate
stressor The input data and applicable project benefits can be assembled along with
incremental project cost data to analyze cost-effectiveness using the FEMA BCA Tool Damage-Frequency Assessment (DFA) module or similar software This analysis will provide a BCR for each alternative which can then be used to compare the alternatives that were developed to mitigate effects from applicable climate stressors The project design team can then use the results from this analysis to identify optimal interventions that provides a balanced solution that provides resiliency benefits within the available project budget
IIIE BCA METHODOLOGY FOR PROJECTS OVER $50 MILLION
[1 ndash (1 + DR) -(PUL)]DR
66 For example a NYC OMB March 2015 memorandum recommends using an annually updated DR as published each year in Appendix C of OMB Circular A-94 The current OMB-recommended discount rates from OMB A-94 Appendix C vary by project useful life and are as follows 21 DR for useful lives of 10 to 19 years 25 DR for useful lives of 20 to 29 years and 28 DR for useful lives of 30 years or greater By contrast FEMA hazard mitigation grants use a DR of 70 for all projects based on the Federal OMB A-94 rate for federally-funded mitigation measures Since these DRs will impact the PVC and the project benefits the project team must ensure that BCA results prepared using an OMB-recommended DR (21 to 28) be updated to reflect the Federal DR (70) when applying for FEMA mitigation grant funds
67 Note the data requirements for the sea level rise and increased precipitation hazards in Table 16 are more detailed than the requirements for the extreme heat hazards due to the less detailed level of analysis available for extreme heat
NYC Mayorrsquos Office of Recovery and Resiliency Climate Resiliency Design Guidelines
35
APPENDICES
NYC Mayorrsquos Office of Recovery and Resiliency Climate Resiliency Design Guidelines
36APPENDIX 1 ndash KEY TERMS
100-year flood (1 annual chance flood)
A flood that has a 1 probability of occurring in any given year The 100-year floodplain is the extent of the area of a flood that has a 1 chance of occurring or being exceeded in any given year
500-year flood (02 annual chance flood)
A flood that has a 02 probability of occurring in any given year The 500-year floodplain is the extent of the area of a flood that has a 02 chance of occurring or being exceeded in any given year
AdaptationAdjustment in natural or human systems to a new or changing environment that seeks to maximize beneficial opportunities or moderate negative effects Successful adaptations contribute to resiliency
Base flood elevation (BFE)The elevation of surface water resulting from a flood that has a 1 annual chance of occurring or being exceeded in any given year The BFE is shown on the Flood Insurance Rate Map (FIRM)69
BluebeltReference to the Department of Environmental Protectionrsquos (DEP) Bluebelt program to preserve natural drainage corridors including streams ponds and other wetland areas Preservation of these wetland systems allows them to perform their functions of conveying storing and filtering storm water
Climate
The average weather (or more rigorously a statistical description of the average in terms of the mean and variability) over a period of time usually 30 years These quantities are most often surface variables such as temperature precipitation and wind Climate in a wider sense is the state including a statistical description of the climate system70
Climate change
Changes in average weather conditions that persist over multiple decades or longer Climate change encompasses both increases and decreases in temperature as well as shifts in precipitation changing risk of certain types of severe weather events and changes to other variables of the climate system
Climate change riskThe chance that investments (such as in capital projects) can be affected by the physical impacts of climate change71 Risks are evaluated as a product of the probability of occurrence and the magnitude of damages or impacts including socioeconomic factors that would result if they did occur (consequences)
Climate change risk assessment
This assessment involves a detailed project-specific analysis that includes a vulnerability and risk assessment often followed by cost-benefit analysis to assess and select investments in climate change risk mitigation Risk is assessed as a function of the magnitude and probability of a given climate change hazard Examples resources are included in Appendix 7
Climate vulnerabilityThe degree to which systems and populations are affected by adverse impacts It is a function of the character magnitude and rate of climate change and variation to which a system is exposed its sensitivity and its adaptive capacity72
Cloudburst An extreme amount of rain in a short period of time often over a small geographic area73
Cooling Degree Day (CDD) A form of degree-day used to estimate the energy requirements for air conditioning or refrigeration when the daily mean temperature is above 65degF
68 All terms are from the US Global Change Research Program (USGCRP) glossary unless otherwise noted The USGCRP glossary is available at httpwwwglobalchangegovclimate-changeglossary
69 ldquoDefinitionsrdquo FEMA last modified March 1 2017 httpswwwfemagovnational-flood-insurance-programdefinitions70 UKCIP Glossary httpwwwukciporgukglossary71 ldquoAccount for Climate Riskrdquo International Finance Corporation 72 UKCIP Glossary httpwwwukciporgukglossary73 New York City Environmental Protection ldquoCloudburst Resiliency Planning Studyrdquo 2017 Available at httpwwwnycgovhtmldeppdfclimatenyc-cloudburst-studypdf
APPENDIX 1 - KEY TERMS68
NYC Mayorrsquos Office of Recovery and Resiliency Climate Resiliency Design Guidelines
37APPENDIX 1 ndash KEY TERMS
Design life The life expectancy of an asset or product as determined during design74 As opposed to useful life (see below)
Dry Bulb temperature The ambient air temperature measured by a thermometer
Extreme eventUnexpected unusual or unpredictable weather or flooding compared to historical or future projected distribution Extreme events include for example heat waves cold waves heavy rains periods of drought and flooding and severe storms
Facilities For the purposes of this document ldquofacilitiesrdquo refers to all types of buildings housing infrastructure structures and landscape features designed by or for the City of New York
Flexible adaptation pathwayResilience-building strategies that can evolve or be adapted over time as climate change risk assessments evaluations of adaptation strategies and monitoring continue75
Flood Insurance Rate Maps (FIRM)
Official flood map of a community on which FEMA has delineated the 1 annual chance floodplain and the base flood elevations (BFEs) applicable to the community76 The FIRM also includes the 02 floodplain annual chance floodplain and differentiates between special flood hazard areas (V A Coast A zones) and floodways The official FIRM is from the year 2007 while the 2015 PFIRM is currently required by NYC Building Code to calculate design flood elevations NYC DOB references the more restrictive of the two maps in both base flood elevation and flood hazard area (ie V versus A zone) Refer to Appendix 3 for more information
FreeboardAn additional amount of height above the base flood elevation used as a factor of safety (eg two feet above the base flood) in determining the level at which a facilitys lowest floor must be elevated or floodproofed to be in accordance with state or community floodplain management regulations77
Future time slices
Future periods defined by the NPCC for when climate change projections are available In this document the following decadal projections are associated with specific time spans2020s projection = present to 20392050s projection = 2040 to 20592080s projection = 2070 to 20992100s projection = end of century and beyond
Green infrastructureAn array of practices that use or mimic natural systems to manage urban stormwater runoff Water is either directed to engineered systems for infiltration or detained for longer periods before it enters the sewer system
Heat Vulnerability Index (HVI)Summarizes relative risk of adverse health effects from heat due to social and environmental factors Used to identify neighborhoods at higher risk during and after extreme heat events
Heat wave A period of three consecutive days where temperatures rise above 90degF or two consecutive days over 95 degrees78
New York City Panel on Climate Change (NPCC)
The body of leading climate and social scientists charged with making climate change projections for the metropolitan region79
74 Sustainable Infrastructure Management Program Learning Environment httpsimplewerforg 75 Rosenzweig C et al Climate Change Adaptation in New York City Building a Risk Management Response76 ldquoDefinitionsrdquo FEMA77 Ibid78 Horton R et al New York City Panel on Climate Change 2015 Report Chapter 1 Climate Observations and Projections Ann NY
Acad Sci ISSN 0077-8923 (New York 2015) 2579 For more information on the NPCC visit www1nycgovsiteorrchallengesnyc-panel-on-climate-changepage
NYC Mayorrsquos Office of Recovery and Resiliency Climate Resiliency Design Guidelines
38APPENDIX 1 ndash KEY TERMS
Open-grid pavement system
Pavements that consist of loose substrates supported by a grid of a more structurally sound grid or webbing Unbounded loose substrates in these systems transfer and store less heat than bound and compacted pavements and aid permeability Pavement is 50 pervious and contains vegetation in the open cells designed to allow percolation or infiltration of storm water through the surface into the soil below80
Preliminary Flood Insurance Rate Map (PFIRM)
Preliminary flood map developed by FEMA in 2015 for New York City that provides projected risks for flood hazards81 Refer to Appendix 3 for more information
Project useful life (PUL)
The period over which an asset or component is expected to be available for use by an entity This depends on regular and adequate maintenance This period of time typically exceeds the design life (see above) The combined effect of operational requirements and useful life is practical in assessing an investment in improving resilience82
Rain gardenAlso called ldquobioswalerdquo Planted areas designed to collect and manage stormwater that runs off streets sidewalks commercial and residential rooftops and other sources when it rains
Resiliency The ability to bounce back after change or adversity The capability of preparing for responding to and recovering from difficult conditions83
Sea level rise-adjusted design flood elevation
As defined in these Guidelines the increased height of the base flood elevation due to sea level rise plus freeboard depending on the criticality of the facility The sea level rise adjustment depends on the useful life of the facility
Storm surge An abnormal rise of water generated by a storm over and above predicted astronomical tides84
Substantial improvementAny repair reconstruction rehabilitation addition or improvement of a building or structure the cost which equals or exceeds 50 of the market value of the structure before the improvement or repairs started For more information see Appendix G of the NYC Building Code and 1 RCNY sect3606-0185
Tidal inundation Flooding which occurs at high tides due to climate-related sea level rise land subsidence andor the loss of natural barriers86
Urban Heat Island (UHI) effectThe tendency for higher air temperatures to persist in urban areas as a result of heat absorbed and emitted by buildings and asphalt tending to make cities warmer than the surrounding suburban and rural areas
Weather The state of the atmosphere at a given time with regard to temperature cloudiness precipitation wind and other meteorological conditions87
Wet Bulb temperatureThe temperature indicated when a thermometer bulb is covered with a water-saturated wick over which air is caused to flow at approximately 45 ms (900 ftmin) to reach the equilibrium temperature of water evaporating into the air when the heat of vaporization is supplied by the sensible heat of the air88
80 ldquoGlossaryrdquo US Green Building Council (2017) Available at httpwwwusgbcorgglossaryterm552581 ldquoPreliminary FEMA Map Productsrdquo FEMA Map Service Center Available at httpshazardsfemagovfemaportalprelimdownload82 ldquoGlossaryrdquo International Infrastructure Management Manual (2011) 83 A Stronger More Resilient New York (2013) 184 ldquoStorm Surge Overviewrdquo National Hurricane Center NOAA Available at httpswwwnhcnoaagovsurge85 ldquoFlood Resistant Constructionrdquo Appendix G New York City Building Code (2008) and 1 RCNY sect3606-01 available at httpswww1nycgovassetsbuildingsrules1_RCNY_3606-01pdf86 ldquoOcean Factsrdquo National Ocean Service NOAA Available at httpoceanservicenoaagovfactsnuisance-floodinghtml 87 UKCIP Glossary httpwwwukciporgukglossary88 ldquoASHRAE Terminologyrdquo ASHRAE Available at httpswwwashraeorgtechnical-resourcesauthoring-toolsterminology
NYC Mayorrsquos Office of Recovery and Resiliency Climate Resiliency Design Guidelines
39APPENDIX 2 - CLIMATE CHANGE PROJECTIONS
Climate change projections are provided by the New York City Panel on Climate Change (NPCC) The full NPCC report is available from the New York Academy of Sciences89 Tables 8-10 (below) were reproduced directly from the NPCC report while Table 2 (see Section IIA) was developed using the data underlying the NPCC report to inform the design of HVAC systems under warmer conditions
Table 8 ndash NYC sea level rise projections90
Baseline (2000-2004) 0 in
Low estimate (10th percentile)
Middle range (25th to 75th percentile)
High estimate (90th percentile)
2020s 2 in 4-8 in 10 in
2050s 8 in 11-21 in 30 in
2080s 13 in 18-39 in 58 in
2100 15 in 22-50 in 75 in
Note Projections are based on six-component approach that incorporates both local and global factors The model-based components are from 24 global climate models and two representative concentration pathways Projections are relative to the 2000-2004 base period
Table 9 ndash Mean annual changes91
a Temperature Baseline(1971-2000) 54degF
Low estimate (10th percentile)
Middle range (25th to 75th percentile)
High estimate (90th percentile)
2020s + 15degF +20-29degF +32degF
2050s +31degF +41-57degF +66degF
2080s +38degF +53-88degF +103degF
2100 +42degF +58-104degF +121F
b Precipitation Baseline(1971-2000) 501 in
Low estimate (10th percentile)
Middle range (25th to 75th percentile)
High estimate (90th percentile)
2020s -1 percent +1-8 +10
2050s +1 percent +4-11 +13
2080s +2 percent +5-13 +19
2100 -6 percent -1 to +19 +25
Note Based on 35 global climate models (GCMs) and two RCPs Baseline data cover the 1971ndash2000 base period and are from the NOAA National Climatic Data Center (NCDC) Shown are the low estimate (10th percentile) middle range (25th percentile to 75th percentile) and high estimate (90th percentile) These estimates are based on a ranking (from most to least) of the 70 (35 GCMs times 2 RCPs) projections The 90th percentile is defined as the value that 90 percent of the outcomes (or 63 of the 70 values) are the same or lower than Like all projections the NPCC climate change projections have uncertainty embedded within them Sources of uncertainty include data and modeling constraints the random nature of some parts of the climate system and limited understanding of some physical processes The NPCC characterizes levels of uncertainty using state-of-the-art climate models multiple scenarios of future greenhouse gas concentrations and recent peer-reviewed literature Even so the projections are not true probabilities and the potential for error should be acknowledged
89 The NPCC 2015 report is available at httponlinelibrarywileycomdoi101111nyas20151336issue-1issuetoc90 From New York City Panel on Climate Change 2015 Report Chapter 1 Climate Observations and Projections page 4191 From New York City Panel on Climate Change 2015 Report Chapter 1 Climate Observations and Projections page 30
APPENDIX 2 - CLIMATE CHANGE PROJECTIONS
NYC Mayorrsquos Office of Recovery and Resiliency Climate Resiliency Design Guidelines
40APPENDIX 2 - CLIMATE CHANGE PROJECTIONS
Table 10 ndash Extreme events92
2020s Baseline (1971-2000)
Low estimate(10th percentile)
Middle range(25th to 75th percentile)
High estimate (90th percentile)
Numbers of heat waves per year 2 3 3-4 4
Average heat wave duration (days) 4 5 5 5
Number of days per year with
Maximum temperature at or above 90degF 18 24 26-31 33
Maximum temperature at or above 100degF 04 07 1-2 2
Minimum temperature at or below 32degF 71 50 52-58 60
Rainfall at or above 1 inch 13 13 14-15 16
Rainfall at or above 2 inches 3 3 3-4 5
Rainfall at or above 4 inches 03 02 03ndash04 05
2050s Baseline (1971-2000)
Low estimate(10th percentile)
Middle range(25th to 75th percentile)
High estimate (90th percentile)
Numbers of heat waves per year 2 4 5-7 7
Average heat wave duration (days) 4 5 5-6 6
Number of days per year with
Maximum temperature at or above 90degF 18 32 39-52 57
Maximum temperature at or above 100degF 04 2 3-5 7
Minimum temperature at or below 32degF 71 37 42-48 52
Rainfall at or above 1 inch 13 13 14-16 17
Rainfall at or above 2 inches 3 3 4-4 5
Rainfall at or above 4 inches 03 03 03-04 05
2080s Baseline (1971-2000)
Low estimate(10th percentile)
Middle range(25th to 75th percentile)
High estimate (90th percentile)
Numbers of heat waves per year 2 5 6-9 9
Average heat wave duration (days) 4 5 5-7 8
Number of days per year with
Maximum temperature at or above 90degF 18 38 44-76 87
Maximum temperature at or above 100degF 04 2 4-14 20
Minimum temperature at or below 32degF 71 25 30-42 49
Rainfall at or above 1 inch 13 14 15-17 18
Rainfall at or above 2 inches 3 3 4-5 5
Rainfall at or above 4 inches 03 02 03-05 07
Note Projections for temperature and precipitation are based on 35 GCMs and 2 RCPs Baseline data are for the 1971 to 2000 base period and are from the NOAA National Climatic Data Center (NCDC) Shown are the low estimate (10th percentile) middle range (25th to 75th percentile) and high estimate (90th percentile) 30-year mean values from model-based outcomes Decimal places are shown for values less than one although this does not indicate higher precisioncertainty Heat waves are defined as three or more consecutive days with maximum temperatures at or above 90degF Like all projections the NPCC climate change projections have uncertainty embedded within them Sources of uncertainty include data and modeling constraints the random nature of some parts of the climate system and limited understanding of some physical processes The NPCC characterizes levels of uncertainty using state-of-the-art climate models multiple scenarios of future greenhouse gas concentrations and recent peer-reviewed literature Even so the projections are not true probabilities and the potential for error should be acknowledged
92 From New York City Panel on Climate Change 2015 Report Chapter 1 Climate Observations and Projections page 31
NYC Mayorrsquos Office of Recovery and Resiliency Climate Resiliency Design Guidelines
41APPENDIX 3 - DIFFERENTIATION OF FLOOD MAPS
These Guidelines reference several different kinds of flood maps and sources of design flood elevations These maps are described and differentiated below
Table 11 - Differentiation of flood maps used in NYC
Reference Title Data Source Information Provided Referenced By Link
2007 FIRM FEMA
Based on historical data from before 1983 identifies the current base flood (extent and elevation) as the flood that has a 1 chance of occurring in any given year also known as a 100-year flood The NYC Building Code requires that either the 2007 FIRM or 2015 PFIRM elevation be used whichever is higher
2014 NYC Building Code Appendix G
Climate Resiliency Design Guidelines
httpsmscfemagovportal
2015 PFIRM FEMA
Based on historical data identifies the current base flood (extents and elevation) as the flood that has a 1 chance of occurring in any given year also known as a 100-year flood The NYC Building Code requires that either the 2007 FIRM or 2015 PFIRM elevation be used whichever is higher The 2015 PFIRM is currently being reassessed by FEMA
2014 NYC Building Code Appendix G
Climate Resiliency Design Guidelines
httpshazardsfemagovfemaportalprelimdownload
httpwwwregion2coastalcomview-flood-maps-dataview-preliminary-flood-map-data
NYC Flood Hazard Mapper
NYC Department of City Planning
Maps current and future flood hazards in NYC including the following data layers 2007 FIRM and 2015 PFIRM high tide with sea level rise and PFIRM with sea level rise through 2100
Climate Resiliency Design Guidelines
Waterfront Revitalization Plan
httpwww1nycgovsiteplanningdata-mapsflood-hazard-mapperpage
ldquoTable 4 ndash Determine the sea level rise-adjusted design flood elevation for critical and non-critical facilitiesrdquo
ORR amp NPCC
Provides data to use when adding sea level rise to a given 2015 PFIRM or 2007 FIRM Base Flood Elevation (BFE) to calculate a Design Flood Elevation (DFE) Based on the criticality and expected useful life of a facility
Climate Resiliency Design Guidelines
See Section II on ldquoSea Level Riserdquo above
APPENDIX 3 - DIFFERENTIATION OF FLOOD MAPS
NYC Mayorrsquos Office of Recovery and Resiliency Climate Resiliency Design Guidelines
42APPENDIX 4 - PROJECT BENEFITS CATEGORIES
This appendix provides guidance on how to identify and assess benefits as a supplement to Sections IIID and IIIE
Table 12 lists typical direct benefits for reducing impacts from climate stressors and basic guidance for how to estimate them See Section IIID for more information
Table 13 lists typical indirect benefits for reducing impacts from climate stressors and basic guidance for how to estimate them See Section IIID for more information
Table 12 ndash Direct benefits for (1) sea level rise with coastal storm surge and (2) increased precipitation measures
Direct Benefit Basic Guidance for Estimating Values
Physical Damages (Structure Contents)
bull For flood-damaged buildings use depth damage functions developed by FEMA and USACE for structures and contents
bull Use depth damage functions in conjunction with Building Replacement Values (BRVs) and not market values BRVs typically range between $100 to $325SF for residential buildings and $120 to $450SF for commercial public buildings
bull For more complex structures or facilities use engineering estimates of flood damages or review historic flood damages documented from insurance claims repair records or FEMA Public Assistance claims from recent flood disasters
Residential Displacements
bull For flood-damaged buildings use depth damage functions developed by FEMA and USACE for residential displacements
Reduced Life CycleOperation and Maintenance (OampM) Costs93
bull Applicable only to projects that reduce overall life cycle costs or net annual OampM costs from baseline conditions
bull Input reduced annual OampM costs as a project benefit at a 1-year recurrence intervalbull Reduced overall life cycle costs can be input as a longer project useful life
Table 13 ndash Indirect benefits for (1) sea level rise with coastal storm surge and (2) increased precipitation measures
Indirect Benefit Basic Guidance for Estimating Values
Non-Residential Building Service Losses
bull Estimate service loss values and durations for non-residential buildings public buildings critical facilities and parksnatural features based on FEMA BCA guidance and standard values based on building use
Utility Service Losses94
bull Estimate utility service losses for water wastewater and electrical facilities based on the number of impacted customers FEMA per capita standard values for utility service ($105personday for potable water $49personday for wastewater $148personday for electrical)95
bull Estimate utility service loss durations based on engineering estimates or review historic flood damages losses documented from utility company records
bull This benefit can also apply to measures that increase energy efficiency
RoadBridge Service Losses
bull Estimate roadbridge service losses based on the average daily traffic (ADT) detour time and additional travel distance and FEMA and GSA standard values for road service ($3344vehiclehour of delay $0545mile)96
bull Estimate roadbridge service loss durations or review historic flood damages losses
Emergency Service Losses
bull Applicable only to projects that reduce or eliminate documented emergency service costs from baseline conditions
bull Examples of avoided emergency services costs include NYPD staffing to monitor barricades for flooded roads or NFDY staffing for water rescues of residents from flooded buildings or streets
APPENDIX 4 - PROJECT BENEFITS CATEGORIES
93 Reduced life cycle costs may be applicable to some measures that provide extreme heat benefits such as green roofs that can last longer than a standard roof if properly maintained
94 Reduced utility service costs may be applicable to some measures that provide extreme heat benefits such as cool roofs green roofs and shade trees
95 FEMA per capita standard values taken from FEMA BCA Toolkit Version 530 (Build Date 12222016) and developed in FEMArsquos Baseline Standard Economic Value Methodology Report (July 28 2016) Consider updating FEMA standard per capita values to reflect current New York City utility rates
96 Consider updating FEMA and GSA standard values to reflect current New York City area labor rates and fuel costs
NYC Mayorrsquos Office of Recovery and Resiliency Climate Resiliency Design Guidelines
43APPENDIX 4 - PROJECT BENEFITS CATEGORIES
Table 14 ndash Other potential benefits for (1) sea level rise with coastal storm surge and (2) increased precipitation measures
Other Benefit Basic Guidance for Estimating Values
Avoided Stress and Anxiety
bull Applicable only for projects that directly benefit occupants of residential structuresbull Use FEMA standard value for avoided mental stress and anxiety treatment costs of $2443person to
estimate benefit for all impacted residents97
Avoided Lost Productivity
bull Applicable only for projects that directly benefit occupants of residential structuresbull Use FEMA standard value for avoided lost worker productivity costs of $8736household to estimate
benefit for all impacted workers (conservatively assuming one worker per household)
Environmental Open Space
bull Applicable only for projects that create or acquire open space areas by acquisitionbull Use FEMA standard value for environmental open space based on the type of land acquired ($8308
Acreyear for Green open space $39545Acreyear for Riparian $6010Acreyear for Wetlands $554Acreyear for Forests $1799Year for Marine and estuary)97
CSO Volume Reduction
bull Applicable only for projects that provide Combined Sewer Overflow (CSO) abatement by reducing the volume of rainfall runoff
bull Use CSO abatement cost of $0015gallonsyear applied to increased precipitation hazard runoff volume for 5-year design storm98
Ecosystem Service99
bull Add stormwater management benefits of green infrastructure projects to increased precipitation hazards where avoided damages and service losses are not quantified
bull Unit benefits applicable to increased precipitation hazard includeo Green roofs $0133SFyear (PUL 40 years)o BioswaleRain GardenMeadow Mix $0020SFyear (PUL 30 years)o Permeable Grass Pavers $0020SFyear (PUL 30 years)o Tree Plantings $303Treeyear (PUL 30 years)o Planter Box Trees $101Treeyear (PUL 15 years)
Real Estate99
bull Potential real estate benefits from increased resilience of residential andor commercial propertiesstreetscapesneighborhoods included within the project scope
bull Benefit applied to extreme heat hazard for green infrastructure projects directly impacting residential or commercial properties
Quality of Life Health Benefits99
bull Potential quality of life benefits related to improved public health from the resilience measures included within the project scope
bull Benefit applied to extreme heat hazard for green infrastructure projects directly impacting residential or commercial properties
Table 14 lists other typical benefits for reducing impacts from climate stressors and basic guidance for how to estimate them See Section IIID for more information
97 FEMA standard values for avoided mental stress and anxiety and environmental open space values taken from FEMA BCA Toolkit Version 530 (Build Date 12222016)
98 CSO abatement cost taken from APG1 Report for NYC ldquoTechnical Approaches for Benefit-Cost Analysis of Hazard Mitigation Projects in Urban and Coastal Environmentsrdquo (April 2016)
99 Ecosystem Services Real Estate and Quality of LifeHealth benefits tend to be more applicable to green infrastructure measures that provide extreme heat benefits such as green roofs trees and other plantings
NYC Mayorrsquos Office of Recovery and Resiliency Climate Resiliency Design Guidelines
44APPENDIX 4 - PROJECT BENEFITS CATEGORIES
Table 15 ndash Potential benefits for extreme heat (Urban Heat Island) reduction measures
Category Benefit Basic Guidance for Estimating Values
Direct Benefit
Reduced Life Cycle Cost
bull Applicable only to measures such as green roofs that are expected to last longer than standard roofs
bull Compute total cost savings including annual OampM costs
Indirect Benefit
Energy Savings
bull Applicable to measures that reduce energy costs by providing cooling through increased shading andor evapotranspiration
bull Use New York Power Authority rates of $0148kWh for electricity and $0810Therm for natural gas
Other Potential Benefits
Air Quality bull Applicable to measures that absorb pollutants andor reduce carbon dioxide emissions
Acoustics bull Applicable to measures such as green roof or walls that reduce noise transfer
Quality of LifeHealth bull Potential quality of life benefits and related to improved public health
Real Estate bull Applicable to measures that provide residential real estate benefits from increased resilience of propertiesstreetscapesneighborhoods
Retail Sales Marketing
bull Applicable to measures that provide commercial property benefits from increased aesthetics resulting in increased marketing and sales for streetscapesneighborhoods
Tax Credits Incentives
bull Applicable to resilience or green infrastructure measures such as green roofs that have accompanying Federal State or City tax credits or other incentives
Table 15 lists potential benefits for reducing impacts from heat and basic guidance for how to estimate them See Section IIID for more information
NYC Mayorrsquos Office of Recovery and Resiliency Climate Resiliency Design Guidelines
45APPENDIX 4 - PROJECT BENEFITS CATEGORIES
Table 16 ndash Guidance on quantitative calculations for (1) sea level rise with coastal storm surge and (2) increased precipitation measures
Data Input General Guidance ndash Basic Description
Applicable Benefit Category
Applicable Typical Facility Typology
Dire
ct B
enefi
ts
Indi
rect
Ben
efits
Oth
er P
oten
tial
Ben
efits
Bui
ldin
g St
ruct
ures
Com
plex
Fa
cilit
ies
Tran
spor
tatio
nSt
reet
scap
es
Plaz
as
Park
Fea
ture
s
First Floor Elevation (FFE)
bull The elevation of the first finished floor of the structure excluding basements
bull FFE measured from top of lowest floor (riverinenon-coastal high hazard areas) or bottom of lowest horizontal structural member (coastal high hazard areas)
Y Y Y Y
Building Replacement Value (BRV)
bull The unit cost to rebuild a structure of the same quality of construction
bull Not the same as market value
Y Y Y Y
Building Size
bull The total floor area of the building in square feet
bull Total Building Value = BRV x Building Sizebull Typical BRVs for NYC range between $100 to
$325SF for residential buildings and $120 to $450SF for commercialpublic buildings
Y Y Y Y
Structure Description
bull The type of building number of stories and foundation type (full basement partial basement no basement)
bull Collect more detailed foundation data for coastal flood zones
Y Y Y Y
Building Use bull Details related to residential housing commercial business and public use
Y Y Y Y Y
Building Type bull The primary use of building ndash residential commercial public and others
Y Y Y Y Y
Depth Damage Function (DDF)
bull Curves used to estimate structure damage contents damage and displacement of residential buildings based on flood depth
bull DDFs selection based on Structure Description Building Type Building Use
bull Structure DDFs based on percentage of Total Building Value
bull Contents DDFs based on percentage of Total Contents Value
bull Displacement DDFs based on number of displacement days x Displacement Cost
Y Y Y Y Y
Contents Value
bull The cost to replace structure contents (furnishings equipment)
bull Residential building Contents Values typically 50 BRV (FEMA DDFs) or 100 BRV (USACE DDFs)
bull Non-residential building Contents Values between 18 to over 100 depending on building use (USACE DDFs)
bull Total Contents Value = BRV x Building Size
Y Y Y Y Y
Table 16 provides general guidance on how to quantitatively calculate benefits from efforts to address from climate stressors See Section IIIE for more information
NYC Mayorrsquos Office of Recovery and Resiliency Climate Resiliency Design Guidelines
46APPENDIX 4 - PROJECT BENEFITS CATEGORIES
Table 16 ndash Guidance on quantitative calculations for (1) sea level rise with coastal storm surge and (2) increased precipitation measures
Data Input General Guidance ndash Basic Description
Applicable Benefit Category
Applicable Typical Facility Typology
Dire
ct B
enefi
ts
Indi
rect
Ben
efits
Oth
er P
oten
tial
Ben
efits
Bui
ldin
g St
ruct
ures
Com
plex
Fa
cilit
ies
Tran
spor
tatio
nSt
reet
scap
es
Plaz
as
Park
Fea
ture
s
Number of Residents (Residential)
bull Total number of occupants in a residential building
bull Typically estimated based on number of residential units x average number of individuals per household (based on current US Census data or use 25 individuals per household as a default)
Y Y Y Y Y
Displacement Cost (Residential)
bull The unit cost to lodge and feed displaced residents while flood damage is repaired
bull Average unit displacement cost of $415residential unitday recommended based on current FY2018 GSA Per Diem rates for New York City
Y Y Y Y Y
Value of Service (Non-Residential and Public)
bull The unit cost of service disruption and rental of temporary facilities while flood damage is repaired
bull Disruption costs for non-residential buildings typically range from $095 to $136SFmonth and rental costs range from $020 to $136SFmonth depending on building use
bull Value of service for public buildings ($day) is typically based on the annual operating budget for the City agency using the building prorated based on building size or population served by the building then divided by 365 daysyear
Y Y Y Y
Value of Service (Critical Facilities)
bull The unit cost of critical facilities (police fire emergency medical services) lost or delayed while flood damage is repaired
Y Y Y
Value of Service Duration
bull The duration of service disruption and rental of temporary facilities for non-residential buildings and critical facilities while flood damage is repaired
bull For non-residential buildingso Value of Service Durations vary from
4 months to over 30 months based on building use and the depth of flooding
o Total Value of Service Loss = (Disruption Cost x Building Area) = (Rental Cost x Building Area x Value of Service Duration)
bull For public buildings and critical facilitieso Value of Service Durations vary from 0
days to 720 months based on building use and the depth of flooding from FEMA FIA or USACE DDFs
o Total Value of Service Loss = (Value of Service) x (Service Loss Duration)
Y Y Y
NYC Mayorrsquos Office of Recovery and Resiliency Climate Resiliency Design Guidelines
47APPENDIX 4 - PROJECT BENEFITS CATEGORIES
Table 16 ndash Guidance on quantitative calculations for (1) sea level rise with coastal storm surge and (2) increased precipitation measures
Data Input General Guidance ndash Basic Description
Applicable Benefit Category
Applicable Typical Facility Typology
Dire
ct B
enefi
ts
Indi
rect
Ben
efits
Oth
er P
oten
tial
Ben
efits
Bui
ldin
g St
ruct
ures
Com
plex
Fa
cilit
ies
Tran
spor
tatio
nSt
reet
scap
es
Plaz
as
Park
Fea
ture
s
Engineering Estimates for Damages
bull Engineered estimate models of physical damages and service losses at the project site based on the Guidelines event recurrence interval(s) and flood depth(s)
Y Y Y Y Y Y
Historic Damages and Service Losses
bull Historic physical damages and service losses at the project site documented from previous flood events
bull Do not use routine maintenancebull The historic damage event recurrence interval
(RIs) andor flood depths must be determined updated for inflation to the present value and adjusted to match the Guidelines event RIsflood depths
Y Y Y Y Y Y
Facility Replacement Value
bull The unit cost to rebuild the facility
Impacted Area bull The geographic area impacted by the facility in the event of failure in acres
Y Y Y Y
Facility Capacity
bull The design capacity of the facilitybull For example - facility capacity expressed in
millions of gallons per day (MGD) for water and wastewater facilities or megawatts (MW) for electrical facilities
Y Y Y Y
Service Population
bull The number of impacted residents served by the facility
bull Typically estimated based on number of impacted residential customers x average number of individuals per household (based on current US Census data or use 25 individuals per household as a default)
bull Facilities serving mostly non-residentialpublic buildings andor critical facilities should focus on service losses rather than service population
Y Y Y
NYC Mayorrsquos Office of Recovery and Resiliency Climate Resiliency Design Guidelines
48APPENDIX 4 - PROJECT BENEFITS CATEGORIES
Table 16 ndash Guidance on quantitative calculations for (1) sea level rise with coastal storm surge and (2) increased precipitation measures
Data Input General Guidance ndash Basic Description
Applicable Benefit Category
Applicable Typical Facility Typology
Dire
ct B
enefi
ts
Indi
rect
Ben
efits
Oth
er P
oten
tial
Ben
efits
Bui
ldin
g St
ruct
ures
Com
plex
Fa
cilit
ies
Tran
spor
tatio
nSt
reet
scap
es
Plaz
as
Park
Fea
ture
s
Value of Service
bull Unit value of service provided by the facilitybull Example of FEMA standard values for complete
loss of utility service $105personday for potable water$49personday for wastewater$148personday for electrical
bull Consider updating FEMA standard per capita values to reflect current The New York City utility rates
Y Y
Roadway Elevations bull Roadway Elevations
Y Y
Roadway Replacement Value
bull Roadway Replacement ValueY Y
Inundation Area Map
bull Inundation Area Map developed by FEMA or through modeling by project design team
Y Y Y
Building Inventory of Inundation Area
bull The number and type of buildings within the streetscape and neighborhood inundated by the Guidelinersquos flood events
Y Y Y
Average Daily Traffic (ADT)
bull The average number of one-way traffic trips per day along the roadway(s) within the streetscapeneighborhood inundated by the Guidelinersquos flood events
Y Y
Additional Travel Time
bull The additional travel time needed to detour around a flooded roadway expressed in minutes
bull In the unlikely event there is no detour available use a 12-hour travel time per one-way trap but provide a detailed area street map as supporting documentation
Y Y
Value of Traffic Delay
bull The value of service associated with lost time in traffic
bull For example - FEMA standard average value of $3344vehiclehour of delay
bull Consider updating FEMA and GSA standard values to reflect current New York City area labor rates and fuel costs
Y Y
NYC Mayorrsquos Office of Recovery and Resiliency Climate Resiliency Design Guidelines
49APPENDIX 4 - PROJECT BENEFITS CATEGORIES
Table 17 ndash Guidance on quantitative unit benefit calculations for extreme heat hazard measures
Measure General Guidance ndash Unit Benefit Information and Data Requirements
Applicable Benefit Category
Applicable Typical Facility Typology
Dire
ct B
enefi
ts
Indi
rect
Ben
efits
Oth
er P
oten
tial
Ben
efits
Bui
ldin
g St
ruct
ures
Com
plex
Fa
cilit
ies
Tran
spor
tatio
nSt
reet
scap
es
Plaz
as
Park
Fea
ture
s
Green Roof
bull Unit benefit range over PUL = $470SF to $373SF of green roof area ($719SF standard value)
bull Assumed PUL = 40 yearsbull Apply standard value unit benefit to green
roof area to estimate measure benefitbull Higher range values more applicable
to residential and commercial building streetscape projects
Y Y Y Y Y Y
Bioswale Rain Garden Meadow Mix
bull Unit benefit range over PUL = $396SF to $211SF of area ($730SF standard value)
bull Assumed PUL = 30 yearsbull Apply standard value unit benefit to bioswale
rain gardenmeadow mix area to estimate total measure benefit
Y Y Y Y Y Y
Cool Roof
bull Unit benefit range over PUL = $117 to $3151SF of material area ($144SF standard value)
bull Assumed PUL = 20 yearsbull Apply standard value unit benefit to cool roof
area to estimate total measure benefitbull Higher range values more applicable to
residential building streetscape projects
Y Y Y Y Y
Light-Colored PaversLight-Colored Materials
bull Unit benefit range over PUL = $0774 to $204SF of material area ($0866SF standard value)
bull Assumed PUL = 30 yearsbull Apply standard value unit benefit to material
area to estimate total measure benefit
Y Y Y Y
Table 17 provides general guidance on how to quantitatively calculate benefits from efforts to address climate stressors See Section IIIE for more information
NYC Mayorrsquos Office of Recovery and Resiliency Climate Resiliency Design Guidelines
50APPENDIX 4 - PROJECT BENEFITS CATEGORIES
Table 17 ndash Guidance on quantitative unit benefit calculations for extreme heat hazard measures
Measure General Guidance ndash Unit Benefit Information and Data Requirements
Applicable Benefit Category
Applicable Typical Facility Typology
Dire
ct B
enefi
ts
Indi
rect
Ben
efits
Oth
er P
oten
tial
Ben
efits
Bui
ldin
g St
ruct
ures
Com
plex
Fa
cilit
ies
Tran
spor
tatio
nSt
reet
scap
es
Plaz
as
Park
Fea
ture
s
Tree Planting
bull Unit benefit range over PUL = $1005 to $77154Tree ($1855Tree standard value)
bull Assumed PUL = 30 yearsbull Apply standard value unit benefit to number of
trees to estimate total measure benefitbull Higher range values more applicable
to residential and commercial building streetscape projects
Y Y Y Y Y Y
Planter Box Tree
bull Unit benefit range over PUL = $212 to 16304Tree ($392Tree standard value)
bull Assumed PUL = 15 yearsbull Apply standard value unit benefit to number of
trees to estimate total measure benefitbull Higher range values more applicable
to residential and commercial building streetscape projects
Y Y Y Y Y
Shade Canopy
bull Unit benefit range over PUL = $0363 to $396SF ($0458SF standard value)
bull Assumed PUL = 15 yearsbull Apply standard value unit benefit to area of
shade canopy estimate total measure benefitbull Higher range values more applicable
to residential and commercial building streetscape projects
Y Y Y Y
Permeable Grass Pavers
bull Unit benefit range over PUL = $0258SF to $0521SF of pavers ($0363SF standard value)
bull Assumed PUL = 30 yearsbull Apply standard value unit benefit to paver
area to estimate total measure benefit
Y Y Y Y Y
For the purposes of the BCA refer to the following facility typologies bull ldquoBuilding Structuresrdquo include critical small building sites such as EMS or FDNY stations and non-critical small building sites such as
libraries or comfort stationsbull ldquoComplex Facilitiesrdquo include critical infrastructure such as wastewater treatment sites pump stations water filtration plants and similar
large or complex facilitiesbull ldquoTransportationStreetscapePlazasrdquo include roadway reconstruction streetscape improvements street raising plazas and other
transportation-related infrastructurebull ldquoPark Featuresrdquo include parks and similar public recreational facility with natural landscape features
NYC Mayorrsquos Office of Recovery and Resiliency Climate Resiliency Design Guidelines
51APPENDIX 5 - EXAMPLE PLANNING DECISION TREE
This decision tree provides a summarized example approach for how to implement these Guidelines Projects with a total cost greater than $50 million are recommended to conduct a full qualitative and quantitative climate change risk assessment and BCA while projects below $50 million are recommended to conduct a qualitative risk assessment and BCA
Define Project
1) Operational goals and criticality level2) Useful life3) Location in the current flood plain future floodplain and or zone
of tidal inundation and the project arearsquos score on the heat vulnerability index
Evaluate Project Risks According to Probability and Magnitude of Consequence
bull Extreme Heat bull Precipitationbull Sea Level Risebull Coastal Surge
High Level Identification and Assessment of Risk Mitigation Alternatives and Co-benefits
(qualitative)
Detailed Identification and Assessment of Risk Mitigation Alternatives and Co-benefits (qualitative and quantitative)
High Level Estimate of Costs and Benefits of Design Alternatives
(qualitative)
Detailed Estimate of Costs and Benefits of Design Alternatives
(qualitative and quantitative)
Decision Point Which climate change risks require mitigation
Decision Point Evaluate risk mitigation benefits and costs to
determine final resilient design alternative or if no action is required
Decision Point Is the total project cost above $50 million
Below $50 million Above $50 million
APPENDIX 5 - EXAMPLE PLANNING DECISION TREE
NYC Mayorrsquos Office of Recovery and Resiliency Climate Resiliency Design Guidelines
52
Project Title
Design Strategies Checklist (not exhaustive)
Extreme Heat Comments Extreme Precipitation Comments Sea Level Rise amp Storm Surge Comments
Select Site in Low Heat Vulnerability Index area Select High Elevation Site Select High Elevation Site
Minimize East-West Building Orientation Green Roof Raise Building Floor Elevation
Passive Solar Cooling and Ventilation Systems
Protect Below Grade Areas from Flooding Waterproof Building Envelope
Cool Roof (SRI appropriate) On-site Stormwater Management (gray) Elevate Critical Building Functions
Green Roof (extensive) Reduce Impervious Areas Elevate Critical Equipment
Vegetative Structures Permeable Pavement Perimeter Floodwall100 Levee (passive or active)
Enhanced HVAC System including space layout optimization and system scalability
Increase Green Spaces and Planted Areas DryWet Floodproofing
More Efficient Building Envelope Other Utility Redundancy Design101
Parking Lot Shading Resilient Materials amp Landscape Treatments
Light Colored Pavements (appropriate SRI) Design for Storm Surge Outflow
Increase Planted Areas Install Backwater Flow Prevention
Permeable Surfaces Design for Scour
Open-grid Pavement Raise Road Elevation
Other Other
This appendix provides a template for identifying possible design strategies to address climate change risks as described throughout the Guidelines
APPENDIX 6 - DESIGN STRATEGIES CHECKLIST
100 Permanent perimeter flood walls are not permitted to meet floodproofing requirements in buildings with substantial improvements andor damages 101 Utility redundancy design should be pursued for critical systems not all building systems
APPENDIX 6 - DESIGN STRATEGIES CHECKLIST
NYC Mayorrsquos Office of Recovery and Resiliency Climate Resiliency Design Guidelines
53APPENDIX 7 - CLIMATE CHANGE RISK ASSESSMENT RESOURCES
These Guidelines provide data on climate change hazards and recommend how that data can inform resilient design A risk assessment is a tool to help project managers and designers evaluate risk levels as well as select and prioritize resilient design strategies A high level risk assessment is recommended for all City capital projects with a total cost of under $50 million Projects above $50 million are recommended to conduct an in-depth assessment
Risk assessments use quantified estimates of the probability and magnitude of consequence of an event occurring to prioritize responses ldquoProbabilityrdquo is an assessment of the likelihood of a hazard occurring while ldquomagnituderdquo describes the hazardrsquos potential impact Risk assessment tools such as the examples listed below can be used to define and score these categories Projects that score higher across both probability and magnitude can be prioritized for investment and risk mitigation action Projects that score lower across both criteria may require no action beyond meeting code The results are typically charted on a risk matrix and an example is provided on the next page
The climate change risk management frameworks below offer templates for how to integrate climate change projections into a risk assessment process Refer to these resources for examples and further information
bull Vulnerability Assessment and Adaptation Framework is prepared by the Federal Highway Administration (FHWA) While developed for transportation planning this risk assessment framework has broad applicability for evaluating asset vulnerability to climate change Available at httpswwwfhwadotgovenvironmentsustainabilityresilienceadaptation_framework
bull US Climate Resilience Toolkit The US Global Change Research Program offers a step by step risk assessment
framework including tools and case studies at httpstoolkitclimategovsteps (see example on next page)
bull Coast Adapt Guidance on undertaking a risk assessment High level assessment httpscoastadaptcomausitesdefaultfilesfactsheetsT3M4_2_2nd_pass_risk_assessmentpdfDetailed assessment httpscoastadaptcomausitesdefaultfilesfactsheetsT3M4_3_3rd_pass_risk_assessmentpdf
bull Climate adaptation Risk uncertainty and decision-makingDownload the report here httpswwwukciporgukpublicationsRisk
The City plans to develop a NYC-specific process for integrating climate change data into existing risk management processes by April 2019
APPENDIX 7 - CLIMATE CHANGE RISK ASSESSMENT RESOURCES
NYC Mayorrsquos Office of Recovery and Resiliency Climate Resiliency Design Guidelines
54APPENDIX 7 - CLIMATE CHANGE RISK ASSESSMENT RESOURCES
The Risk Characterization Matrix below is an example from the US Climate Resilience Toolkit This tool can be used to assess the probability and magnitude of impact for identified risks The risk of coincident climate stressorsrisks (such as storm surge plus increased precipitation) can also be assessed as applicable
Figure 14 - Example of a climate change risk matrix (adapted from US Climate Resilience Toolkit)
Project teams can determine the magnitude of the impact (along the horizontal scale of 1 through 3 with 3 being the most severe) and the probabilitylikelihood of occurrence for each specific risk (along the vertical scale with 3 being the most likely) A score is typically assigned for each risk (Probabil-ity x Magnitude) and then charted on the matrix Based on the estimated probability and magnitude of consequence above the risks are ranked and prioritized for mitigation Factors to bear in mind include
bull Not all facility typologies have the same level of functional and operational importance during events or tolerance for disruption
bull Not all climate stressors and risks have the same level of impact on each project sitebull Not all identified risks can or should be mitigated fully
NYC Mayorrsquos Office of Recovery and Resiliency Climate Resiliency Design Guidelines
55WORKS CITED
A Stronger More Resilient New York PlaNYC Report of the NYC Special Initiative for Rebuilding and Resiliency The City of New York 2013
ldquoAccount for Climate Riskrdquo International Finance Corporation accessed March 27 2017 httpwwwifcorgwpswcmconnectTopics_Ext_ContentIFC_External_Corporate_SiteClimate+Business
PrioritiesAccount+for+Climate+Risk
American Society of Heating Refrigeration and Air-Conditioning Engineers (ASHRAE) Handbook -Fundamentals 2017
ldquoBaseline Standard Economic Value Methodology Reportrdquo Federal Emergency Management Agency July 2016
Benefit Cost Analysis Toolkit Software Version 530 Federal Emergency Management Agency (build date December 2016)
Criteria for Detention Facility Design New York City Department of Environmental Protection November 2012
Community Resilience Planning Guide for Buildings and Infrastructure Systems Vol 1 NIST Special Publication 1190 US Department of Commerce 2016
Cool and Green Roofing Manual NYC Department of Design and Construction 2007 httpwwwnycgovhtmlddcdownloadspdfcool_green_roof_manpdf
Building Resiliency Task Force US Urban Green Building Council New York 2013 httpurbangreencouncilforcecomBuildingResiliency
Design and Planning for Flood Resiliency Guidelines for NYC Parks New York City Department of Parks and Recreation 2017
httpswwwnycgovparksorgplanning-and-buildingplanningresiliency-plansflood-resiliency
Flooded Bus Barns and Buckled Rails Federal Transit Administration Office of Budget and Policy 2011 httpswwwhsdlorgabstractampdid=685187
Floodproofing Non-Residential Buildings FEMA P936 FEMA 2013 httpswwwfemagovmedia-library-data9a50c534fc5895799321dcdd4b6083e7P-936_8-20-13_508rpdf
ldquoGlossaryrdquo International Infrastructure Management Manual National Asset Management Support Group New Zealand 2011 httpwwwipweaorg
ldquoGreen Roof Metrics Draft Reportrdquo New York City Department of Parks and Recreation 2017
ldquoGuide to Rain Event Preparednessrdquo NYC Department of Environmental Protection httpwwwnycgovhtmldeppdfbrochuresflood-preparedness-flyerpdf
ldquoGuidelines and Discount Rates for Benefit-Cost Analysis of Federal Programsrdquo Appendix C Circular A-94 US Office of Management and Budget (OMB) 2017
ldquoGuidelines for the Design and Construction of Stormwater Management Systemsrdquo New York City Department of Environmental Protection July 2012
Horton R et al New York City Panel on Climate Change 2015 Report Ann NY Acad Sci ISSN 0077-892 New York 2015
Madrigano J et al ldquoA case-only study of vulnerability to heat wavendashrelated mortality in New York City (2000ndash2011)rdquo Environmental Health Perspectives 123672ndash678 2013
WORKS CITED
NYC Mayorrsquos Office of Recovery and Resiliency Climate Resiliency Design Guidelines
56WORKS CITED
enspMcGregor et al Two Degrees The Built Environment and Our Changing Climate Routledge Press 2013
NYC Green Codes Task Force US Green Building Council New York 2010 httpurbangreencouncilorgGreenCodes
NYCrsquos Risk Landscape A Guide to Hazard Mitigation NYC Emergency Management 2014
One New York The Plan for a Strong and Just City The City of New York 2015 httpwwwnycgovhtmlonenyc downloadspdfpublicationsOneNYCpdf
Ready to Respond Strategies for Multifamily Building Resilience Enterprise Green Communities 2015 httpswwwenterprisecommunityorgresources
Rosenzweig C et al Climate Change Adaptation in New York City Building a Risk Management Response New York City Panel on Climate Change 2010
httponlinelibrarywileycomdoi101111nyas20101196issue-1 issuetoc
ldquoSustainable Infrastructure Management Program Learning Environmentrdquo Water Environment Research Foundation accessed March 24 2017 httpsimplewerforg
Urban Waterfront Adaptive Strategies NYC Department of City Planning 2013 httpwww1nycgovsiteplanningplanssustainable-communitiesclimate-resiliencepagetab=1
Wastewater Resiliency Plan Climate Risk Assessment and Adaptation Study New York City Department of Environmental Protection October 2013
NYC Mayorrsquos Office of Recovery and Resiliency Climate Resiliency Design Guidelines
19IIC SEA LEVEL RISE
non-critical components within a larger facility or campus (eg at a maintenance yard differentiate between structures and equipment) Critical components essential to the facilityrsquos functionality should be protected to the higher standard for criticality even if the facility itself may be non-critical Some examples of critical components include electrical distribution and switching areas motor-control centers chemical feed equipment boilers communications systems monitoring and safety equipment HVAC units fire alarms and suppression equipment furnaces elevators emergency fuel supplies emergency generators and hazardous material storage Component protection should also be evaluated if a facility is expected to be fully operational during a flood event or if it is expected to quickly resume full operations after an event
For buildings and infrastructure with a long useful life it is not always cost effective or operationally feasible to design a facility to be resilient to hazards faced at the end of its useful life In these cases the most resilient design will be one that provides extra protection against hazards in the initial decades while also leaving open design alternatives for updating resiliency measures as new data is provided or new risk assessments are completed This flexible adaptation pathways approach builds in options to protect assets later in life as demonstrated in an example shown in Figure 1 (in Section I)
Other considerations to keep in mind includebull These Guidelines apply to all City capital projects except coastal flood protection
systems which are designed to different standards than those provided here for
C SEA LEVEL RISEThis section provides tools to 1) determine if the project will be subject to tidal inundation during its useful life due to sea level rise and 2) incorporate sea level rise into flood protection levels of capital projects For projects in the current and future 1 annual chance floodplains sea level rise-adjusted design flood elevations (DFE) are provided and reflect the criticality of the asset and its useful life Background NYC has experienced the devastation of coastal storms most recently during Hurricane Sandy Sea level rise is projected to increase the depth extent and frequency of flooding from storm surge45 Sea level rise will also regularly inundate some low-lying areas during high tides Current flood protection heights are determined by using the base flood elevation established by the FEMA Preliminary Flood Insurance Rate Map (PFIRM) 201546 and the standard of protection for buildings in the floodplain in Appendix G of the NYC Building Code47 These Guidelines augment existing requirements for two primary purposes ensuring City facilities built today incorporate sea level rise and critical assets (as defined in Table 4) are protected to a higher level It is important to note that all projects and design interventions must comply with NYC Building Code
Designers should differentiate between critical and
45 New York City Panel on Climate Change Report Chapter 2 Sea Level Rise and Coastal Storms (2015)46 However NYC Building code G10222 requires that designers review both the PFIRM and the effective FIRM and use the more
restrictive of the two 47 For information on the differences between FEMA FIRM PFIRM and the Cityrsquos forward-looking flood maps see Appendix 3
Critical components essential to the facilityrsquos functionality should be protected to the higher standard for criticality even if the facility itself is non-critical
NYC Mayorrsquos Office of Recovery and Resiliency Climate Resiliency Design Guidelines
20IIC SEA LEVEL RISE
buildings and other physical infrastructure Many of NYCrsquos coastal flood protection systems are currently being developed to comply with FEMA accreditation for flood levee systems48 The City plans to develop further guidance for designing coastal protection projects
bull For information on the differences between FEMA FIRM PFIRM and the Cityrsquos forward-looking flood maps see Appendix 3
bull Coincident stressors from sea level rise should also be considered For example bridge scour may increase as sea levels rise Similarly flooding during heavy rainfall events can be worsened due to higher tailwater conditions associated with high sea levels Be aware of how different risks may interact and how different interventions can be deployed to address multiple hazards or provide other co-benefits
bull Note projects that require discretionary approval are required to incorporate sea level rise projections as part of the NYC Waterfront Revitalization Program49 and
bull A methodology is under development that will establish a consistent citywide process for addressing legal grade which will have further implications for how sea level rise and precipitation are managed
For more information see Section IE Designers should use the resources and methods described in this section to 1) assess tidal inundation due to sea level rise and 2) address risks in the current and future floodplains
1 Assessing tidal inundation due to sea level riseTidal flooding currently affects parts of NYC and is projected to worsen as sea levels rise and inundate low-lying coastal sites during high tides When determining a site location or establishing scope of substantial improvements for other types of coastal facilities the project team will consider alternative sites outside of zones threatened with regular inundation if resiliency actions are not taken Some facilities such as wastewater treatment plants and harbor facilities need to be near the coast for operational purposes
a) Determine tidal inundation risk from sea level rise Use the Flood Hazard Mapper (httpwwwnycgovfloodhazardmapper)50 to see if your
site is in an area inundated from high tide plus sea level rise within the projectrsquos useful life For example if the useful life ends between 2040 and 2069 choose the 2050s High Tide map) Determine risk only from high tide and sea level rise separate from flood events Follow the instructions in Figure 5 and refer to the example in Figure 6 to review inundation at the end of an assetrsquos useful life
48 For more information please visit httpwwwfemagovfema-levee-resources-library49 For more information visit httpwwwnycgovwrp50 The Flood Hazard Mapper relies on publicly available data to present these map resources Users should also refer to FEMA and the
NPCC for official information
Figure 5 - Flood Hazard Mapper high tide plus sea level rise at httpwwwnycgovfloodhazardmapper
NYC Mayorrsquos Office of Recovery and Resiliency Climate Resiliency Design Guidelines
21IIC SEA LEVEL RISE
b) Address flood risk If the Flood Hazard Mapper shows that the facility is expected to be inundated by
high tides within its useful life or if primary access roads are at risk of inundation consider alternative site options
- OR - If the site is not expected to be regularly inundated by tides proceed to the next
section 2 Addressing Risks in the Current Floodplain
Note on calculating tidal inundations with sea level rise if a project team is interested in understanding the depth of tidal inundation given climate change projections follow these steps First determine the Mean Higher High Water (MHHW) elevation in feet-NAVD 8851 datum nearest to the site If the MHHW data is unavailable from a site specific survey refer to httpwwwnycgovwrp for a list of MHHW elevations (NAVD88) at tide stations across the city52 Second add the high estimate (90th percentile) of expected sea level rise (see Table 8 in Appendix 2) for the year corresponding to the facilityrsquos useful life to the MHHW to determine the projected depth of tidal inundation with sea level rise
51 North American Vertical Datum of 1988 (NAVD 88) is the vertical control datum of orthometric height established for vertical control surveying in the US based upon the General Adjustment of the North American Datum of 1988
httpswwwngsnoaagovdatumsvertical52 SLR elevations at httpwwwnycgovwrp are adjusted to account for sea level rise since the last tidal epoch If no other resource is
available to determine MHHW use the NOAA Online Vertical Datum Transformation tool to calculate the MHHW in feet-NAVD
Figure 6 - Flood Hazard Mapper with high tide in the 2020s (left) and in the 2080s (right) at httpwwwnycgovfloodhazardmapper
NYC Mayorrsquos Office of Recovery and Resiliency Climate Resiliency Design Guidelines
22IIC SEA LEVEL RISE
2 Addressing risks in the current floodplain53
A facility located in the current 1 annual chance floodplain (PFIRM 2015)54 will face increasing risk of flooding during its useful life due to sea level rise increasing the depth of coastal storms This section provides a process for adjusting the design flood elevation required by code to account for sea level rise
a) Find the location of the facility using the Flood Hazard Mapper (httpwwwnycgovfloodhazardmapper) and follow the instructions in Figure 7
bull Choose to view the layer ldquoFEMA Preliminary FIRM 2015rdquo bull Click on the facility site in the 1 floodplain to view the base flood elevation
Figure 7 - Flood Hazard Mapper with FEMA PFIRM (2015) at wwwnycgovfloodhazardmapper
b) If the facility is not in the current 1 annual chance floodplain (PFIRM 2015) proceed to the next section ldquo3 Addressing risks in the future floodplainrdquo
- OR - If the facility is in the current 1 annual chance floodplain (PFIRM 2015) note
the base flood elevation (BFE) and proceed to Step c) below Please note if a facility has multiple BFEs or if the site is partially in the 1 annual chance floodplain it is recommended to use the highest BFE as the current BFE for the entire site
c) Establish a sea level rise-adjusted DFE Use the current base flood elevation at your site the facilityrsquos useful life and its
criticality level to determine the design flood elevation using Table 4 (on the next page) as a basis of design
53 This process for adjusting the design flood elevation to account for sea level rise satisfies the criteria of the climate-informed science approach described at the state and federal level
54 FEMA updates its flood maps periodically As of April 2018 the most recent maps are the Preliminary Flood Insurance Rate Maps (PFIRM) available at DCPrsquos Flood Hazard Mapper (httpwwwnycgovfloodhazardmapper) Also note that NYC Building Code requires developers to use the PFIRM (2015) or the FIRM (2007) whichever is more restrictive For more information on these requirements please refer to Appendix G of the NYC Building Code Please note that the DCP maps are not official and all site locations should be confirmed with the official FEMA PFIRM NYC will provide information on the latest flood maps as they are updated
NYC Mayorrsquos Office of Recovery and Resiliency Climate Resiliency Design Guidelines
23IIC SEA LEVEL RISE
Table 4 - Determine the sea level rise-adjusted design flood elevation for critical and non-critical facilities55
Critical facilities
End of useful life Base Flood Elevation (BFE)56 in NAVD 88 + Freeboard57 + Sea Level Rise
Adjustment58= Design Flood Elevation (DFE) in
NAVD 88Through 2039 FEMA 1 (PFIRM) 24rdquo 6rdquo = FEMA 1 + 30rdquo
2040-2069 FEMA 1 (PFIRM) 24rdquo 16rdquo = FEMA 1 + 40rdquo2070-2099 FEMA 1 (PFIRM) 24rdquo 28rdquo = FEMA 1 + 52rdquo
2100+ FEMA 1 (PFIRM) 24rdquo 36rdquo = FEMA 1 + 60rdquoNon-critical facilities
End of useful life Base Flood Elevation (BFE) in NAVD 88 + Freeboard + Sea Level Rise
Adjustment = Design Flood Elevation (DFE) in
NAVD 88Through 2039 FEMA 1 (PFIRM) 12rdquo 6rdquo = FEMA 1 + 18rdquo
2040-2069 FEMA 1 (PFIRM) 12rdquo 16rdquo = FEMA 1 + 28rdquo2070-2099 FEMA 1 (PFIRM) 12rdquo 28rdquo = FEMA 1 + 40rdquo
2100+ FEMA 1 (PFIRM) 12rdquo 36rdquo = FEMA 1 + 48rdquoAdditional analysis should be conducted to incorporate wave action and wave run-up in DFE calculations especially in areas that are located within the FEMArsquos 1 annual chance Limit of Moderate Wave Action (LiMWA) zone Wave run up is the maximum vertical extent of wave uprush above surge
Definition of critical buildings and infrastructure for determining DFE in Table 4The criticality definitions below are for use in the application of the Guidelines only All items identified as critical in NYC Building Code Appendix G are critical in these guidelines however this list includes additional facilities that are not listed in Appendix G59 If a facility is not listed here it is considered non-critical for the purposes of determining freeboard
bull Hospitals and health care facilitiesbull Fire rescue ambulance and police stations and emergency vehicle garages bull Jails correctional facilities and detention facilities bull Facilities used in emergency response including emergency shelters emergency preparedness communication
operation centers communication towers electrical substations back-up generators fuel or water storage tanks power generating stations and other public utility facilities
bull Critical aviation facilities such as control towers air traffic control centers and hangars for aircraft used in emergency response
bull Major food distribution centers (with an annual expected volume of greater than 170000000 pounds)60 bull Buildings and other structures that manufacture process handle store dispose or use toxic or explosive
substances where the quantity of the material exceeds a threshold quantity established by the authority having jurisdiction and is sufficient to pose a threat to the public if released61
bull Infrastructure in transportation telecommunications or power networks including bridges tunnels (vehicular and rail) traffic signals (and other right of way elements including street lights and utilities) power transmission facilities substations circuit breaker houses city gate stations arterial roadways telecommunications central offices switching facilities etc
bull Ventilation buildings and fan plantsbull Operations centersbull Pumping stations (sanitary and stormwater)bull Train and transit maintenance yards and shopsbull Wastewater treatment plantsbull Water supply infrastructurebull Combined-sewer overflow (CSO) retention tanksbull Fueling stationsbull Waste transfer stations and bull Facilities where residents have limited mobility or ability including care facilities and nursing homes
55 If an industry standard does not include freeboard in its flood protection standards for particular infrastructure assets then only consider the sea level rise adjustment when determining flood protection levels
56 Note that NYC Building Code requires developers to use the PFIRM (2015) or the FIRM (2007) whichever is more restrictive For more information on these requirements please refer to Appendix G of the NYC Building Code
57 These freeboard values reflect NYC Building Code Appendix G Table 2-1 which establishes the minimum elevation of the top of lowest floor Appendix G requires other freeboard values for other parts of structures and in different parts of the floodplain Refer to Appendix G for the appropriate freeboard and use that value in Table 4 above
58 The sea level rise figures provided are for the middle of the 25th-75th percentile range projections from the NPCC These values do not necessarily indicate the average of all models
59 The structural occupancy categories outlined in Appendix G of the NYC Building Code are the same as ASCE 7 used for structural design For critical buildings structural design should comply with ASCE 7 and 24 for design class IV
60 This threshold represents the median volume of main food distributors in NYC according to statistics collected as part of the Five Borough Food Flow study in 2016 available at
httpswwwnycedccomsystemfilesfilesresource2016_food_supply-resiliency_study_resultspdf 61 The threshold quantity for hazardous materials is established by Chapter 7 of Title 24 of the NYC Administrative Code
NYC Mayorrsquos Office of Recovery and Resiliency Climate Resiliency Design Guidelines
24IIC SEA LEVEL RISE
Figure 9 ndash Outdoor emergency generator for the critical building
This case study provides an example of how to calculate a sea level rise-adjusted DFE based on the useful life of a hypothetical critical services building and its primary component
Step 1 Organize the site by various critical or primary components and their year of construction Determine their useful life along with the associated future year scenario for flood risk assessment In this example the building structure and the outside emergency generator are the most at-risk components from combined sea level rise and coastal storm surge
Step 2 Overlay the site footprint area over the effective current PFIRM or FIRM and the corresponding future year scenario FEMA 1 to identify flood risk to the site From overlaying the 2015 preliminary FEMA floodplain over the site it was determined that the site has a 1 annual chance of flooding with a base flood elevation of 13rsquo NAVD Step 3 Evaluate the criticality of each primary component of the facility based on the Guidelinesrsquo definition for critical infrastructure (Table 4) This (hypothetical) building is critical
Step 4 Use Table 4 to determine the sea level rise adjustment and freeboard requirements for each component and calculate the DFE for each that corresponds to its useful life period
Step 5 Compare the DFE of each component and the associated Guidelinesrsquo recommended DFE to calculate anticipated flood depth
CASE STUDY Adjusting the DFE for Sea Level Rise
Table 5 ndash Example of how to calculate a sea level rise-adjusted DFE for a critical facility
Construction year Components Useful
Life
Future Year Scenario
[Useful Life + Const
Year]
BFE in NAVD
88 (feet)
Freeboard + Sea
Level Rise Adjustment
(feet)
Adjusted DFE in
NAVD 88 (feet)
2010 Building Structure
70 years 2070-2099 130rsquo 2rsquo+23rsquo 173rsquo
2010Outdoor
Emergency Generator
25 years
Through 2039 130rsquo 2rsquo+05rsquo 155rsquo
Figure 8 - Example of how to locate a facility within the current floodplain and determine the BFE Figure 9 (inset) - Outdoor emergency generator at the facility
Figure 10 - This schematic shows how to determine the design flood elevation of a facility within the current 1 floodplain
Illustrative not to scale
NYC Mayorrsquos Office of Recovery and Resiliency Climate Resiliency Design Guidelines
25IIC SEA LEVEL RISE
Figure 11 - Flood Hazard Mapper with future 1 annual chance floodplain (adjusted for sea level rise) at httpwwwnycgovfloodhazardmapper
b) If the site is not in the future floodplain no flood protection is required for this facility
- OR - If the site is in the future floodplain identify the nearest adjacent base flood
elevation at the project site in the current 1 annual chance floodplain (PFIRM 2015) using the Flood Hazard Mapper62
c) Use Table 4 to determine the DFE Add freeboard and the sea level rise-adjustment to the nearest adjacent BFE on the
current 1 annual chance floodplain (PFIRM 2015) to determine the DFE
d) Apply the DFE calculation from Table 4 to the protected facility See Figures 12 and 13 for an illustration of how to calculate the DFE
62 Maps of future floodplains show the impacts of sea level rise alone and do not consider how changes in stormsrsquo climatology might also affect wave action and the full extent of the floodplain
3 Addressing risks in the future floodplainIf the facility is not in the current 1 annual chance floodplain (PFIRM 2015) it may still be at risk in the future from flooding as sea level rise increases the extent of the floodplain Follow the steps below to determine if your facility is located in the future floodplain and if so what sea level rise-adjusted DFE to use
a) Use the Flood Hazard Mapper (httpwwwnycgovfloodhazardmapper) to determine if the facility site will be in the future 1 annual chance floodplain
Assess if by the end of the facilityrsquos useful life the floodplain is projected to increase to encompass all or part of the project site For example if the useful life ends between 2040 and 2069 choose the 2050s floodplain map Refer to the steps in Figure 11 below
NYC Mayorrsquos Office of Recovery and Resiliency Climate Resiliency Design Guidelines
26IIC SEA LEVEL RISE
Figure 12 - This schematic map shows how to locate the nearest adjacent 1 floodplain elevation
Figure 13 -This schematic shows how to determine the design flood elevation of a facility that is outside of the current 1 floodplain
CASE STUDY Identifying a Base Flood Elevation (BFE) in the Future Floodplain
Illustrative not to scale
NYC Mayorrsquos Office of Recovery and Resiliency Climate Resiliency Design Guidelines
27IIC SEA LEVEL RISE
4 Identify appropriate design interventions
63 Additional resources for identifying adaptive strategies Urban Waterfront Adaptive Strategies (NYC Department of City Planning httpswww1nycgovassetsplanningdownloadpdfplans-studiessustainable-communitiesclimate-resilienceurban_waterfrontpdf Floodproofing Non-Residential Buildings (FEMA) at httpswwwfemagovmedia-libraryassetsdocuments34270 Ready to Respond Strategies for Multifamily Building Resilience (Enterprise Green Community) at
httpwwwenterprisecommunityorgresourcesready-respond-strategies-multifamily-building-resilience-1335664 While natural systems-based approaches ameliorate flooding their use for storm surge or wave mitigation would need to be quantified
before contributing towards the design flood elevation 65 For more information see FEMArsquos Floodproofing Non-Residential Buildings at httpswwwfemagovmedia-libraryassetsdocuments34270
Operational requirements and continuity plans can inform the selection of appropriate design interventions particularly in terms of how quickly a site needs to be up and running after a flood event Some examples of how functional uses can pair with interventions include
bull A facility that needs to be operating during or immediately after a flood event may need to be dry floodproofed using permanent barriers or designed for passive survivability (such as a police or fire station)
bull A facility that needs to recover quickly after an event could elevate prioritized equipment and have deployable barriers
bull A site that can recover over a longer duration of time could be temporarily inundated during an event (such as parks or plazas) The use of resilient materials and strategies can reduce costly damage caused by temporary inundation
Different design interventions should be chosen based on the specific operational requirements of the project however these must meet the ASCE 24 design requirements for Coastal VE Zones
For all projects at risk of current or future flooding select protections that meet the projectrsquos design flood elevation Consider project-specific factors including the site location operational requirements existing continuity planning and cost63 A Design Strategies Checklist in Appendix 6 is available for use as a resource to track possible design approaches Some examples of design alternatives are
bull Site relocation where feasible conduct alternative site analysis
bull Permanent barriers at a site (eg floodwalls)
bull Deployable flood barriers (eg stop logs flood doorsgates inflatable barriers)
bull Natural systems-based approaches (eg living shorelines restored wetlands)64
bull Prioritized protection of electrical mechanical and other critical or costly-to-replace equipment above the design flood elevation (eg motors and controller boilers and furnaces fuel storage tanks duct work alarm systems and suppression equipment electrical panels electrical distribution and switching areas gas and electric meters telecommunications equipment chemical feed equipment HVAC units and emergency generators)65
bull Dry floodproofing design a facility to prevent water from entering
bull Wet floodproofing design a facility to permit floodwaters to flow in and out of the structure without causing significant damage (eg elevate or protect critical equipment use water-resistant building materials below the design flood elevation include flood vents and pumps)
bull Design redundant telecommunications conduit entrances for multiple carrier entry Telecom conduit should run to diverse manholes when possible
bull Install backup power for telecom equipment with design consideration for such equipment (eg installation above DFE)
bull Install outdoor-rated disconnect switch for telecommunications equipment on the roofbull Explore interventions to protect underground utilities and other telecommunications
facilities from water damagebull Install backflow preventers backwater valves and sump pumps for all buildings and
infrastructure in the floodplain as well as behind flood barriersbull Shoreline improvements that reduce the height of waves or attenuate waves where
feasible
NYC Mayorrsquos Office of Recovery and Resiliency Climate Resiliency Design Guidelines
28IIIA GENERAL METHODOLOGY TO ESTIMATE PROJECT BENEFITSIIIB CATEGORIES OF PROJECT BENEFITS
Designing and constructing facilities to handle the future climate loads above the current NYC codes and standards based on projected useful life of the components provides resiliency benefits The incremental costs to implement the Guidelinesrsquo recommended design interventions should be compared with the incremental benefits to aid agencies in making decisions about resilient design strategies The project design team should evaluate benefits of the interventions designed to meet Guidelinesrsquo recommended criteria for all the climate stressors qualitatively andor quantitatively For projects with construction costs below $50 million the project design team is recommended to perform a qualitative benefits assessment on the interventions that meet the Guidelinesrsquo recommendations for all applicable climate stressors For critical facilities or projects with construction costs over $50 million the project design team is recommended to perform quantitative benefit calculations to identify the optimal interventions that meet Guidelinesrsquo recommended design criteria
A GENERAL METHODOLOGY TO ESTIMATE PROJECT BENEFITSThis general methodology to perform qualitative and quantitative benefit calculations is recommended for use by project design teams at the beginning of and during the design process This methodology enables estimation of project benefits for a high-level benefit-cost analysis (BCA) that can be applied to evaluate and compare resiliency features designed to address sea level rise with coastal storm surge increased precipitation and extreme heat events The type of benefits provided by interventions designed to meet the Guidelinesrsquo design criteria can vary by climate stressors and typology of the facilities The main guiding principle in development of the high-level BCA methodologies included in these Guidelines was to balance simplicity with accuracy The project benefits categories identified within the methodology may not cover all the potential benefits provided by every facility type within NYC In particular the benefits of planning for increased precipitation are difficult to quantify Hence the project design team should use their discretion to modify this general benefit calculation methodology as needed to meet their project goals and objectives The project design team should develop appropriate input data whether quantitative or qualitative needed to estimate project benefits
B CATEGORIES OF PROJECT BENEFITSThere are three types of project benefit categories - direct benefits indirect benefits and other benefits - that can be used to perform qualitative assessments and develop quantitative estimates of monetary benefits for intervention alternatives designed to meet the Guidelinesrsquo recommendations These project benefit categories will help to perform a high-level benefit-cost analysis that balances accuracy with an appropriate level of effort
bull Direct Benefits include reduced or avoided physical damages to facilities and contents reduced or avoided displacements for residential structures and reduced life cycle or OampM costs that can be quantified as a primary result of implementing a specific hazard mitigation measure Table 12 in Appendix 4 provides a list of direct benefits and basic guidance on estimating and documenting values for sea level rise and increased precipitation-related flood hazards Note that given the current state of practice it is not possible to quantify reduced or avoided physical damages or residential displacements that result from a specific extreme heat mitigation measures Therefore direct benefits applicable to extreme heat hazards are limited to reduced life cycle costs applicable to certain measures such as green roofs Refer to Table 15 for details on direct benefits for extreme heat hazards
III EVALUATION OF PROJECT BENEFITS
NYC Mayorrsquos Office of Recovery and Resiliency Climate Resiliency Design Guidelines
29IIIB CATEGORIES OF PROJECT BENEFITS
bull Indirect Benefits include reduced or avoided service losses for non-residential
buildings public facilities andor infrastructure (utilities roads and bridges) based on the value of service continuity andor emergency services to New Yorkers that can be quantified as a secondary result of implementing a specific hazard mitigation measure Table 13 in Appendix 4 provides a list of indirect benefits and basic guidance on estimating and documenting values for sea level rise and increased precipitation-related flood hazards Note that given the current state of practice on extreme heat it is not possible to quantify reduced or avoided service losses that result from a specific extreme heat mitigation measures Therefore indirect benefits applicable to extreme heat hazards are limited to reduced energy costs such as cool roofs green roofs or shade trees Refer to Table 15 in Appendix 4 for details on indirect benefits for extreme heat hazards
bull Other Benefits where applicable other potential benefits may include social benefits for residents such as avoided stress and anxiety avoided lost productivity environmentalecosystem service benefits avoided need for emergency services and other potential benefits that can be estimated as a result of implementing a specific hazard mitigation measure Table 14 in Appendix 4 provides a list of other potential benefits and basic guidance on estimating and documenting values for sea level rise and increased precipitation-related flood hazards
Note on the ecosystem service benefit category in Table 14 the stormwater management benefits of green infrastructure should be distributed between the extreme heat and increased precipitation hazards since these measures provide both significant reductions in rainfall runoff as well as Urban Heat Island mitigation through evapotranspiration However there is currently limited data available to quantify the actual distribution of stormwater management benefits between the two hazards For various dual-benefit providing interventions careful considerations should be given to identify the appropriate benefits category provided by the intervention with a goal to avoid duplication of quantified benefits In this methodology the stormwater management benefits of green infrastructure are applied to the increased precipitation hazard in order to avoid a duplication of benefits Note on real estate and quality of life benefits additionally it is important to note that two potential benefit categories shown in Table 14 - real estate and quality of lifehealthavoided casualties - were not included in the current BCA methodology for sea level rise or increased precipitation hazards Although these categories could increase project benefits for sea level rise and increased precipitation hazards they were only applied to measures that address extreme heat hazards such as green roofs trees and other plantings Refer to Table 15 for a detailed summary of other benefit categories quantified as unit benefits for extreme heat hazards
NYC Mayorrsquos Office of Recovery and Resiliency Climate Resiliency Design Guidelines
30IIIC WHICH METHODOLOGY TO USEIIID BCA METHODOLOGY FOR PROJECTS UNDER $50 MILLION
D BCA methodology for projects under $50 millionThe project design team should develop design alternatives to meet the Guidelinesrsquo criteria which may be in excess of NYC code and standards requirements (baseline conditions) It is assumed that the project design team will develop alternatives to address each of the following applicable climate stressors - sea level risecoastal storm surge increased precipitation and extreme heat - separately Tables 12-15 in Appendix 4 provides a list of typical direct indirect and other benefits provided by various intervention typologies to reduce impacts from climate stressors During the qualitative assessment the project design team should consider that intervention strategies will have varying levels of reliability effectiveness benefits and cost implications during the qualitative assessment
The project design team is recommended to develop appropriate evaluation criteria and metrics for each of the applicable project benefit categories For each alternative the project design team could use either a scoring weighting ranking or other type of qualitative assessment framework to assess each applicable project benefit categories with the developed evaluation criteria and metrics Table 6 provides an example template to evaluate alternatives using a set of general evaluation criteria and metrics using a color-coded rating system (and see Table 7 for an example of how to complete the template) The project design team can utilize a similar template customized to their project goals and objectives This assessment allows agencies to screen the qualitative benefits for various alternatives that would then lead to development of final project components to match the available budget and goals of the project
Projects with total costs below $50 million recommended to conduct a qualitative assessment to identify the optimal interventions that meet Guidelinesrsquo design criteria using the ldquoD) BCA methodology for projects under $50 millionrdquo methodology below
C WHICH METHODOLOGY TO USEProjects with a total cost above $50 million or are highly complex or critical facilities recommended to conduct both a qualitative and quantitative benefit calculation to identify the optimal interventions that meet Guidelinersquos design criteria using the ldquoE) BCA methodology for projects above $50 millionrdquo below A quantitative BCA also must include qualitative factors
NYC Mayorrsquos Office of Recovery and Resiliency Climate Resiliency Design Guidelines
31IIID BCA METHODOLOGY FOR PROJECTS UNDER $50 MILLION
Qualitative Color Scale Green=Least resource intensive alternative Purple=most resource intensive yellow=medium level of resource intensity
Qualitative Evaluation Factors Description Relative Color Rating System
First CostsAdditional construction costs needed to incorporate Guidelinesrsquo recommended resilient design over the baseline project costs
Highest cost ($$$) rated as Purple whereas lowest cost ($) rated as Green
ConstructabilityEase of Implementation
Construction techniques and site conditions such as presence of major utilities conflicts and other conditions which dictate the level of constructability required for each alternative
Difficult to construct rated as Purple whereas easiest to construct rated as Green
Environmental ImpactsCo-BenefitsPermitting
Impacts to the built and natural environment such as circulation noise and hazardous waste plus the level of effort required for permitting (eg interventions in water require highest level of permitting requirement) from each alternative in addition to the baseline project condition
Highest environmental impacts and highest level of effort required for permitting rated as Purple whereas the least impact and level of effort rated as Green
Operation and Maintenance (OampM)
Level of effort of additional manpower and cost of OampM for the alternatives over the baseline project OampM requirements
Highest level of effort and cost for OampM rated as Purple whereas the lowest is rated as Green
Reliability and Durability
Interventions that do not require human involvement or a facilityrsquos ability to withstand all the forces during a storm event (eg permanent solutions with higher reliability than deployable solution)
Interventions requiring human involvement (active measures) rated as Purple whereas interventions with minimal or no human involvement (passive measures) rated as Green
Risk Reduction Benefits Monetary benefits provided by each intervention alternative in avoided damages over the baseline condition
Lowest potential monetary benefit rated as Purple whereas as highest potential monetary benefit rated as Green
Quality of Life BenefitsVisual Aesthetics
Benefits either to the community such as recreation or safety or serve the community during emergency situations
Lowest potential quality of life benefits rated as Purple whereas as highest potential benefits rated as Green
Table 6 ndash Evaluation matrix for comparison of mitigation alternatives across the useful life of a project
Project title_______________________________________________________________________________
Evaluation Criteria
Baseline Condition (Designed to NYC Building Code and
Standards)
Resilient Design Alternatives for Managing__________________
Alternative 1
Alternative 2
Alternative 3
First Costs
ConstructabilityEase of ImplementationEnvironmental ImpactsCo-BenefitsPermitting
Operation and Maintenance (OampM)
Reliability and Durability
Risk Reduction Benefits
Quality of Life BenefitsVisual Aesthetics
NYC Mayorrsquos Office of Recovery and Resiliency Climate Resiliency Design Guidelines
32IIID BCA METHODOLOGY FOR PROJECTS UNDER $50 MILLION
Table 7 ndash Evaluation matrix for comparison of mitigation alternatives across the useful life of a project - COMPLETED EXAMPLE
Evaluation Criteria
Baseline Condition (Designed to NYC Building Code and
Standards)
Resilient Design Alternatives for Managing Coastal SurgeSLR
Alternative 1Flood proof building built on grade to Guidelines
DFE
Alternative 2 Elevate building structure above Guidelinesrsquo DFE
on columns
Alternative 3 Raise site grade by filing the building site footprint
to Guidelinesrsquo DFE
First CostsBaseline cost for building structure is $15 million
Incremental costs are within 5 over the baseline costs
Incremental costs are between 5-10 over baseline costs
Incremental costs are 20 and more over baseline costs
ConstructabilityEase of Implementation
Relatively easy to construct within site constraints
Similar to baseline conditions since construction requires additional flood proofing only
Moderate challenges to construct foundation structure for columns within site constraints
Extremely challenging to construct within the site constraints Potentially fatal flaw
Environmental ImpactsCo-BenefitsPermitting
No major impacts but may require additional effort to obtain DOB permits with flood proofing and deployable systems
No major impacts but may require additional effort to obtain DOB permits with flood proofing and deployable systems
No major impacts and relatively easy to permit
Potential drainage circulation impacts and challenges to obtain clean fill material for the site
Operation and Maintenance (OampM)
Major OampM costs associated with deployable systems
Major OampM costs associated with deployable systems
Moderate OampM costs associated with proposed elevator for access
Minimal OampM costs since deployable and elevators not required
Reliability and Durability
Least reliability with highest potential risk from flooding during to failure of deployable systems
Least reliability with highest potential risk from flooding during to failure of deployable systems
Moderate reliability with potential risk from flooding limited to elevator shaft only
Highest reliability since deployable are not required to protect building from flooding
Risk Reduction Benefits
Maximum flood risk reduction benefits assuming deployable and flood proofing is effective
Maximum flood risk reduction benefits assuming deployable and flood proofing is effective
Maximum flood risk reduction benefits
Maximum flood risk reduction benefits
Quality of Life BenefitsVisual Aesthetics
Facility may not be operational during the storm event
Facility may not be operational during the storm event
Facility can be potentially operational during the storm event
Facility can be potentially operational during the storm event
Qualitative Color Scale Green=Least resource intensive alternative Purple=most resource intensive yellow=medium level of resource intensity
A new non-critical facility with a building structure is proposed on a site that is currently in the 2015 Preliminary FEMA 1 annual chance floodplain with a BFE of 10rsquo (NAVD 88) The baseline conditions DFE to meet existing NYC codes and standards is 11rsquo (NAVD 88) Using the Guidelines recommended design criteria the facilityrsquos DFE is 133rsquo (NAVD 88) and existing grade is around 6rsquo (NAVD 88) The project design team develops three alternatives to meet the Guidelinesrsquo recommended DFE design for the facility Table 7 offers an example of how a qualitative assessment can be used to compare three resilient design alternatives using the evaluation criteria and metrics
CASE STUDY Example of How to Use the Evaluation Matrix
NYC Mayorrsquos Office of Recovery and Resiliency Climate Resiliency Design Guidelines
33IIIE BCA METHODOLOGY FOR PROJECTS OVER $50 MILLION
E BCA methodology for projects over $50 millionIn order for a project to be considered cost-effective a benefit-cost analysis (BCA) assesses if the benefits of a project outweigh its costs or in other words the benefit-cost ratio (BCR) is greater than 10 as illustrated in Equation 1
Equation 1 Benefit-Cost Ratio Formula
BCR =
Where BCR = Benefit-Cost Ratio
BENEFITS = Total project benefits
COSTS = Total project costs
BENEFITSCOSTS
These estimated project benefits are combined with the project costs which are defined as the differential construction and long-term operation and maintenance costs associated with constructing a proposed project to the Guidelinesrsquo recommended design level It is assumed that the baseline project will be designed to the most prevalent NYC codes and standards This benefit methodology should be used to determine the additional project benefit that the Guidelinesrsquo recommended design would provide over the baseline project benefit It is assumed that the project design team will develop alternatives to address each of the following applicable climate stressors - sea level risecoastal storm surge increased precipitation and extreme heat - separately For each alternative the project design team should use the following steps to determine the Benefit-Cost Ratio (BCR)
a) Determine project useful life for design interventions Determining the useful life of the proposed project is an important first step in the
detailed BCA assessment methodologies for two reasons First the project useful life determines what values must be used from the Guidelines to establish the future climate design conditions The various hazard tables in the Guidelines establish design requirements based on useful life ranges through 2039 2040-2069 2070-2099 and 2100+ (2100+ projections are only available for sea level rise) A review of these tables show that the design requirements needed to meet the projected climate hazards increase as the end of useful life range increases Second the useful life determines how long the project will need to be operated and maintained in order to remain technically sound and effective at reducing future damages and losses
b) Determine discount rate for project benefits calculation The cost-effectiveness of projects assessed using the BCR must be done on a net
present value basis meaning the present value of the benefits is compared to the present value of the costs Most project costs are computed for present value based on current cost estimates bids or cost guidance However project benefits - as well as project costs for operation and maintenance - accrue over time into the future and are computed on an annualized basis To address this issue the Present Value Coefficient (PVC) is used to bring these annualized project benefits and OampM costs into the present value As indicated by the formula in Equation 2 the PVC is a function of the Project Useful Life (PUL) and the Discount Rate (DR)
NYC Mayorrsquos Office of Recovery and Resiliency Climate Resiliency Design Guidelines
34
Equation 2 Present Value Coefficient (PVC) Formula
PVC =
Where PVC = Present Value Coefficient
PUL = BCA Project Useful Life based on project type
DR = Discount Rate
The project design team should coordinate with agencies and NYC OMB if needed to determine appropriate discount rates based on funding source project type and other factors This coordination should take place during project initiation phase where total project costs (design and construction) are over $50 million66
c) Develop input data to perform benefit calculations Tables 16 and 17 in Appendix 4 provide a list of typical input data by each climate
stressor needed to perform benefit analysis quantitatively on variety of facilities67 The project design team should use these tables as a reference to identify appropriate input data categories andor additional input data needed to perform benefit analysis on the project
d) Identify applicable project benefit categories to estimate benefits Tables 16 and 17 in Appendix 4 provide a list of typical project benefits by each climate
stressor needed to perform benefit analysis quantitatively on various types of projects The project design team should use these tables as a reference to identify appropriate project benefit categories for each climate stressor to perform benefit analysis on the project
e) Calculate benefits of recommended design interventions for each climate
stressor The input data and applicable project benefits can be assembled along with
incremental project cost data to analyze cost-effectiveness using the FEMA BCA Tool Damage-Frequency Assessment (DFA) module or similar software This analysis will provide a BCR for each alternative which can then be used to compare the alternatives that were developed to mitigate effects from applicable climate stressors The project design team can then use the results from this analysis to identify optimal interventions that provides a balanced solution that provides resiliency benefits within the available project budget
IIIE BCA METHODOLOGY FOR PROJECTS OVER $50 MILLION
[1 ndash (1 + DR) -(PUL)]DR
66 For example a NYC OMB March 2015 memorandum recommends using an annually updated DR as published each year in Appendix C of OMB Circular A-94 The current OMB-recommended discount rates from OMB A-94 Appendix C vary by project useful life and are as follows 21 DR for useful lives of 10 to 19 years 25 DR for useful lives of 20 to 29 years and 28 DR for useful lives of 30 years or greater By contrast FEMA hazard mitigation grants use a DR of 70 for all projects based on the Federal OMB A-94 rate for federally-funded mitigation measures Since these DRs will impact the PVC and the project benefits the project team must ensure that BCA results prepared using an OMB-recommended DR (21 to 28) be updated to reflect the Federal DR (70) when applying for FEMA mitigation grant funds
67 Note the data requirements for the sea level rise and increased precipitation hazards in Table 16 are more detailed than the requirements for the extreme heat hazards due to the less detailed level of analysis available for extreme heat
NYC Mayorrsquos Office of Recovery and Resiliency Climate Resiliency Design Guidelines
35
APPENDICES
NYC Mayorrsquos Office of Recovery and Resiliency Climate Resiliency Design Guidelines
36APPENDIX 1 ndash KEY TERMS
100-year flood (1 annual chance flood)
A flood that has a 1 probability of occurring in any given year The 100-year floodplain is the extent of the area of a flood that has a 1 chance of occurring or being exceeded in any given year
500-year flood (02 annual chance flood)
A flood that has a 02 probability of occurring in any given year The 500-year floodplain is the extent of the area of a flood that has a 02 chance of occurring or being exceeded in any given year
AdaptationAdjustment in natural or human systems to a new or changing environment that seeks to maximize beneficial opportunities or moderate negative effects Successful adaptations contribute to resiliency
Base flood elevation (BFE)The elevation of surface water resulting from a flood that has a 1 annual chance of occurring or being exceeded in any given year The BFE is shown on the Flood Insurance Rate Map (FIRM)69
BluebeltReference to the Department of Environmental Protectionrsquos (DEP) Bluebelt program to preserve natural drainage corridors including streams ponds and other wetland areas Preservation of these wetland systems allows them to perform their functions of conveying storing and filtering storm water
Climate
The average weather (or more rigorously a statistical description of the average in terms of the mean and variability) over a period of time usually 30 years These quantities are most often surface variables such as temperature precipitation and wind Climate in a wider sense is the state including a statistical description of the climate system70
Climate change
Changes in average weather conditions that persist over multiple decades or longer Climate change encompasses both increases and decreases in temperature as well as shifts in precipitation changing risk of certain types of severe weather events and changes to other variables of the climate system
Climate change riskThe chance that investments (such as in capital projects) can be affected by the physical impacts of climate change71 Risks are evaluated as a product of the probability of occurrence and the magnitude of damages or impacts including socioeconomic factors that would result if they did occur (consequences)
Climate change risk assessment
This assessment involves a detailed project-specific analysis that includes a vulnerability and risk assessment often followed by cost-benefit analysis to assess and select investments in climate change risk mitigation Risk is assessed as a function of the magnitude and probability of a given climate change hazard Examples resources are included in Appendix 7
Climate vulnerabilityThe degree to which systems and populations are affected by adverse impacts It is a function of the character magnitude and rate of climate change and variation to which a system is exposed its sensitivity and its adaptive capacity72
Cloudburst An extreme amount of rain in a short period of time often over a small geographic area73
Cooling Degree Day (CDD) A form of degree-day used to estimate the energy requirements for air conditioning or refrigeration when the daily mean temperature is above 65degF
68 All terms are from the US Global Change Research Program (USGCRP) glossary unless otherwise noted The USGCRP glossary is available at httpwwwglobalchangegovclimate-changeglossary
69 ldquoDefinitionsrdquo FEMA last modified March 1 2017 httpswwwfemagovnational-flood-insurance-programdefinitions70 UKCIP Glossary httpwwwukciporgukglossary71 ldquoAccount for Climate Riskrdquo International Finance Corporation 72 UKCIP Glossary httpwwwukciporgukglossary73 New York City Environmental Protection ldquoCloudburst Resiliency Planning Studyrdquo 2017 Available at httpwwwnycgovhtmldeppdfclimatenyc-cloudburst-studypdf
APPENDIX 1 - KEY TERMS68
NYC Mayorrsquos Office of Recovery and Resiliency Climate Resiliency Design Guidelines
37APPENDIX 1 ndash KEY TERMS
Design life The life expectancy of an asset or product as determined during design74 As opposed to useful life (see below)
Dry Bulb temperature The ambient air temperature measured by a thermometer
Extreme eventUnexpected unusual or unpredictable weather or flooding compared to historical or future projected distribution Extreme events include for example heat waves cold waves heavy rains periods of drought and flooding and severe storms
Facilities For the purposes of this document ldquofacilitiesrdquo refers to all types of buildings housing infrastructure structures and landscape features designed by or for the City of New York
Flexible adaptation pathwayResilience-building strategies that can evolve or be adapted over time as climate change risk assessments evaluations of adaptation strategies and monitoring continue75
Flood Insurance Rate Maps (FIRM)
Official flood map of a community on which FEMA has delineated the 1 annual chance floodplain and the base flood elevations (BFEs) applicable to the community76 The FIRM also includes the 02 floodplain annual chance floodplain and differentiates between special flood hazard areas (V A Coast A zones) and floodways The official FIRM is from the year 2007 while the 2015 PFIRM is currently required by NYC Building Code to calculate design flood elevations NYC DOB references the more restrictive of the two maps in both base flood elevation and flood hazard area (ie V versus A zone) Refer to Appendix 3 for more information
FreeboardAn additional amount of height above the base flood elevation used as a factor of safety (eg two feet above the base flood) in determining the level at which a facilitys lowest floor must be elevated or floodproofed to be in accordance with state or community floodplain management regulations77
Future time slices
Future periods defined by the NPCC for when climate change projections are available In this document the following decadal projections are associated with specific time spans2020s projection = present to 20392050s projection = 2040 to 20592080s projection = 2070 to 20992100s projection = end of century and beyond
Green infrastructureAn array of practices that use or mimic natural systems to manage urban stormwater runoff Water is either directed to engineered systems for infiltration or detained for longer periods before it enters the sewer system
Heat Vulnerability Index (HVI)Summarizes relative risk of adverse health effects from heat due to social and environmental factors Used to identify neighborhoods at higher risk during and after extreme heat events
Heat wave A period of three consecutive days where temperatures rise above 90degF or two consecutive days over 95 degrees78
New York City Panel on Climate Change (NPCC)
The body of leading climate and social scientists charged with making climate change projections for the metropolitan region79
74 Sustainable Infrastructure Management Program Learning Environment httpsimplewerforg 75 Rosenzweig C et al Climate Change Adaptation in New York City Building a Risk Management Response76 ldquoDefinitionsrdquo FEMA77 Ibid78 Horton R et al New York City Panel on Climate Change 2015 Report Chapter 1 Climate Observations and Projections Ann NY
Acad Sci ISSN 0077-8923 (New York 2015) 2579 For more information on the NPCC visit www1nycgovsiteorrchallengesnyc-panel-on-climate-changepage
NYC Mayorrsquos Office of Recovery and Resiliency Climate Resiliency Design Guidelines
38APPENDIX 1 ndash KEY TERMS
Open-grid pavement system
Pavements that consist of loose substrates supported by a grid of a more structurally sound grid or webbing Unbounded loose substrates in these systems transfer and store less heat than bound and compacted pavements and aid permeability Pavement is 50 pervious and contains vegetation in the open cells designed to allow percolation or infiltration of storm water through the surface into the soil below80
Preliminary Flood Insurance Rate Map (PFIRM)
Preliminary flood map developed by FEMA in 2015 for New York City that provides projected risks for flood hazards81 Refer to Appendix 3 for more information
Project useful life (PUL)
The period over which an asset or component is expected to be available for use by an entity This depends on regular and adequate maintenance This period of time typically exceeds the design life (see above) The combined effect of operational requirements and useful life is practical in assessing an investment in improving resilience82
Rain gardenAlso called ldquobioswalerdquo Planted areas designed to collect and manage stormwater that runs off streets sidewalks commercial and residential rooftops and other sources when it rains
Resiliency The ability to bounce back after change or adversity The capability of preparing for responding to and recovering from difficult conditions83
Sea level rise-adjusted design flood elevation
As defined in these Guidelines the increased height of the base flood elevation due to sea level rise plus freeboard depending on the criticality of the facility The sea level rise adjustment depends on the useful life of the facility
Storm surge An abnormal rise of water generated by a storm over and above predicted astronomical tides84
Substantial improvementAny repair reconstruction rehabilitation addition or improvement of a building or structure the cost which equals or exceeds 50 of the market value of the structure before the improvement or repairs started For more information see Appendix G of the NYC Building Code and 1 RCNY sect3606-0185
Tidal inundation Flooding which occurs at high tides due to climate-related sea level rise land subsidence andor the loss of natural barriers86
Urban Heat Island (UHI) effectThe tendency for higher air temperatures to persist in urban areas as a result of heat absorbed and emitted by buildings and asphalt tending to make cities warmer than the surrounding suburban and rural areas
Weather The state of the atmosphere at a given time with regard to temperature cloudiness precipitation wind and other meteorological conditions87
Wet Bulb temperatureThe temperature indicated when a thermometer bulb is covered with a water-saturated wick over which air is caused to flow at approximately 45 ms (900 ftmin) to reach the equilibrium temperature of water evaporating into the air when the heat of vaporization is supplied by the sensible heat of the air88
80 ldquoGlossaryrdquo US Green Building Council (2017) Available at httpwwwusgbcorgglossaryterm552581 ldquoPreliminary FEMA Map Productsrdquo FEMA Map Service Center Available at httpshazardsfemagovfemaportalprelimdownload82 ldquoGlossaryrdquo International Infrastructure Management Manual (2011) 83 A Stronger More Resilient New York (2013) 184 ldquoStorm Surge Overviewrdquo National Hurricane Center NOAA Available at httpswwwnhcnoaagovsurge85 ldquoFlood Resistant Constructionrdquo Appendix G New York City Building Code (2008) and 1 RCNY sect3606-01 available at httpswww1nycgovassetsbuildingsrules1_RCNY_3606-01pdf86 ldquoOcean Factsrdquo National Ocean Service NOAA Available at httpoceanservicenoaagovfactsnuisance-floodinghtml 87 UKCIP Glossary httpwwwukciporgukglossary88 ldquoASHRAE Terminologyrdquo ASHRAE Available at httpswwwashraeorgtechnical-resourcesauthoring-toolsterminology
NYC Mayorrsquos Office of Recovery and Resiliency Climate Resiliency Design Guidelines
39APPENDIX 2 - CLIMATE CHANGE PROJECTIONS
Climate change projections are provided by the New York City Panel on Climate Change (NPCC) The full NPCC report is available from the New York Academy of Sciences89 Tables 8-10 (below) were reproduced directly from the NPCC report while Table 2 (see Section IIA) was developed using the data underlying the NPCC report to inform the design of HVAC systems under warmer conditions
Table 8 ndash NYC sea level rise projections90
Baseline (2000-2004) 0 in
Low estimate (10th percentile)
Middle range (25th to 75th percentile)
High estimate (90th percentile)
2020s 2 in 4-8 in 10 in
2050s 8 in 11-21 in 30 in
2080s 13 in 18-39 in 58 in
2100 15 in 22-50 in 75 in
Note Projections are based on six-component approach that incorporates both local and global factors The model-based components are from 24 global climate models and two representative concentration pathways Projections are relative to the 2000-2004 base period
Table 9 ndash Mean annual changes91
a Temperature Baseline(1971-2000) 54degF
Low estimate (10th percentile)
Middle range (25th to 75th percentile)
High estimate (90th percentile)
2020s + 15degF +20-29degF +32degF
2050s +31degF +41-57degF +66degF
2080s +38degF +53-88degF +103degF
2100 +42degF +58-104degF +121F
b Precipitation Baseline(1971-2000) 501 in
Low estimate (10th percentile)
Middle range (25th to 75th percentile)
High estimate (90th percentile)
2020s -1 percent +1-8 +10
2050s +1 percent +4-11 +13
2080s +2 percent +5-13 +19
2100 -6 percent -1 to +19 +25
Note Based on 35 global climate models (GCMs) and two RCPs Baseline data cover the 1971ndash2000 base period and are from the NOAA National Climatic Data Center (NCDC) Shown are the low estimate (10th percentile) middle range (25th percentile to 75th percentile) and high estimate (90th percentile) These estimates are based on a ranking (from most to least) of the 70 (35 GCMs times 2 RCPs) projections The 90th percentile is defined as the value that 90 percent of the outcomes (or 63 of the 70 values) are the same or lower than Like all projections the NPCC climate change projections have uncertainty embedded within them Sources of uncertainty include data and modeling constraints the random nature of some parts of the climate system and limited understanding of some physical processes The NPCC characterizes levels of uncertainty using state-of-the-art climate models multiple scenarios of future greenhouse gas concentrations and recent peer-reviewed literature Even so the projections are not true probabilities and the potential for error should be acknowledged
89 The NPCC 2015 report is available at httponlinelibrarywileycomdoi101111nyas20151336issue-1issuetoc90 From New York City Panel on Climate Change 2015 Report Chapter 1 Climate Observations and Projections page 4191 From New York City Panel on Climate Change 2015 Report Chapter 1 Climate Observations and Projections page 30
APPENDIX 2 - CLIMATE CHANGE PROJECTIONS
NYC Mayorrsquos Office of Recovery and Resiliency Climate Resiliency Design Guidelines
40APPENDIX 2 - CLIMATE CHANGE PROJECTIONS
Table 10 ndash Extreme events92
2020s Baseline (1971-2000)
Low estimate(10th percentile)
Middle range(25th to 75th percentile)
High estimate (90th percentile)
Numbers of heat waves per year 2 3 3-4 4
Average heat wave duration (days) 4 5 5 5
Number of days per year with
Maximum temperature at or above 90degF 18 24 26-31 33
Maximum temperature at or above 100degF 04 07 1-2 2
Minimum temperature at or below 32degF 71 50 52-58 60
Rainfall at or above 1 inch 13 13 14-15 16
Rainfall at or above 2 inches 3 3 3-4 5
Rainfall at or above 4 inches 03 02 03ndash04 05
2050s Baseline (1971-2000)
Low estimate(10th percentile)
Middle range(25th to 75th percentile)
High estimate (90th percentile)
Numbers of heat waves per year 2 4 5-7 7
Average heat wave duration (days) 4 5 5-6 6
Number of days per year with
Maximum temperature at or above 90degF 18 32 39-52 57
Maximum temperature at or above 100degF 04 2 3-5 7
Minimum temperature at or below 32degF 71 37 42-48 52
Rainfall at or above 1 inch 13 13 14-16 17
Rainfall at or above 2 inches 3 3 4-4 5
Rainfall at or above 4 inches 03 03 03-04 05
2080s Baseline (1971-2000)
Low estimate(10th percentile)
Middle range(25th to 75th percentile)
High estimate (90th percentile)
Numbers of heat waves per year 2 5 6-9 9
Average heat wave duration (days) 4 5 5-7 8
Number of days per year with
Maximum temperature at or above 90degF 18 38 44-76 87
Maximum temperature at or above 100degF 04 2 4-14 20
Minimum temperature at or below 32degF 71 25 30-42 49
Rainfall at or above 1 inch 13 14 15-17 18
Rainfall at or above 2 inches 3 3 4-5 5
Rainfall at or above 4 inches 03 02 03-05 07
Note Projections for temperature and precipitation are based on 35 GCMs and 2 RCPs Baseline data are for the 1971 to 2000 base period and are from the NOAA National Climatic Data Center (NCDC) Shown are the low estimate (10th percentile) middle range (25th to 75th percentile) and high estimate (90th percentile) 30-year mean values from model-based outcomes Decimal places are shown for values less than one although this does not indicate higher precisioncertainty Heat waves are defined as three or more consecutive days with maximum temperatures at or above 90degF Like all projections the NPCC climate change projections have uncertainty embedded within them Sources of uncertainty include data and modeling constraints the random nature of some parts of the climate system and limited understanding of some physical processes The NPCC characterizes levels of uncertainty using state-of-the-art climate models multiple scenarios of future greenhouse gas concentrations and recent peer-reviewed literature Even so the projections are not true probabilities and the potential for error should be acknowledged
92 From New York City Panel on Climate Change 2015 Report Chapter 1 Climate Observations and Projections page 31
NYC Mayorrsquos Office of Recovery and Resiliency Climate Resiliency Design Guidelines
41APPENDIX 3 - DIFFERENTIATION OF FLOOD MAPS
These Guidelines reference several different kinds of flood maps and sources of design flood elevations These maps are described and differentiated below
Table 11 - Differentiation of flood maps used in NYC
Reference Title Data Source Information Provided Referenced By Link
2007 FIRM FEMA
Based on historical data from before 1983 identifies the current base flood (extent and elevation) as the flood that has a 1 chance of occurring in any given year also known as a 100-year flood The NYC Building Code requires that either the 2007 FIRM or 2015 PFIRM elevation be used whichever is higher
2014 NYC Building Code Appendix G
Climate Resiliency Design Guidelines
httpsmscfemagovportal
2015 PFIRM FEMA
Based on historical data identifies the current base flood (extents and elevation) as the flood that has a 1 chance of occurring in any given year also known as a 100-year flood The NYC Building Code requires that either the 2007 FIRM or 2015 PFIRM elevation be used whichever is higher The 2015 PFIRM is currently being reassessed by FEMA
2014 NYC Building Code Appendix G
Climate Resiliency Design Guidelines
httpshazardsfemagovfemaportalprelimdownload
httpwwwregion2coastalcomview-flood-maps-dataview-preliminary-flood-map-data
NYC Flood Hazard Mapper
NYC Department of City Planning
Maps current and future flood hazards in NYC including the following data layers 2007 FIRM and 2015 PFIRM high tide with sea level rise and PFIRM with sea level rise through 2100
Climate Resiliency Design Guidelines
Waterfront Revitalization Plan
httpwww1nycgovsiteplanningdata-mapsflood-hazard-mapperpage
ldquoTable 4 ndash Determine the sea level rise-adjusted design flood elevation for critical and non-critical facilitiesrdquo
ORR amp NPCC
Provides data to use when adding sea level rise to a given 2015 PFIRM or 2007 FIRM Base Flood Elevation (BFE) to calculate a Design Flood Elevation (DFE) Based on the criticality and expected useful life of a facility
Climate Resiliency Design Guidelines
See Section II on ldquoSea Level Riserdquo above
APPENDIX 3 - DIFFERENTIATION OF FLOOD MAPS
NYC Mayorrsquos Office of Recovery and Resiliency Climate Resiliency Design Guidelines
42APPENDIX 4 - PROJECT BENEFITS CATEGORIES
This appendix provides guidance on how to identify and assess benefits as a supplement to Sections IIID and IIIE
Table 12 lists typical direct benefits for reducing impacts from climate stressors and basic guidance for how to estimate them See Section IIID for more information
Table 13 lists typical indirect benefits for reducing impacts from climate stressors and basic guidance for how to estimate them See Section IIID for more information
Table 12 ndash Direct benefits for (1) sea level rise with coastal storm surge and (2) increased precipitation measures
Direct Benefit Basic Guidance for Estimating Values
Physical Damages (Structure Contents)
bull For flood-damaged buildings use depth damage functions developed by FEMA and USACE for structures and contents
bull Use depth damage functions in conjunction with Building Replacement Values (BRVs) and not market values BRVs typically range between $100 to $325SF for residential buildings and $120 to $450SF for commercial public buildings
bull For more complex structures or facilities use engineering estimates of flood damages or review historic flood damages documented from insurance claims repair records or FEMA Public Assistance claims from recent flood disasters
Residential Displacements
bull For flood-damaged buildings use depth damage functions developed by FEMA and USACE for residential displacements
Reduced Life CycleOperation and Maintenance (OampM) Costs93
bull Applicable only to projects that reduce overall life cycle costs or net annual OampM costs from baseline conditions
bull Input reduced annual OampM costs as a project benefit at a 1-year recurrence intervalbull Reduced overall life cycle costs can be input as a longer project useful life
Table 13 ndash Indirect benefits for (1) sea level rise with coastal storm surge and (2) increased precipitation measures
Indirect Benefit Basic Guidance for Estimating Values
Non-Residential Building Service Losses
bull Estimate service loss values and durations for non-residential buildings public buildings critical facilities and parksnatural features based on FEMA BCA guidance and standard values based on building use
Utility Service Losses94
bull Estimate utility service losses for water wastewater and electrical facilities based on the number of impacted customers FEMA per capita standard values for utility service ($105personday for potable water $49personday for wastewater $148personday for electrical)95
bull Estimate utility service loss durations based on engineering estimates or review historic flood damages losses documented from utility company records
bull This benefit can also apply to measures that increase energy efficiency
RoadBridge Service Losses
bull Estimate roadbridge service losses based on the average daily traffic (ADT) detour time and additional travel distance and FEMA and GSA standard values for road service ($3344vehiclehour of delay $0545mile)96
bull Estimate roadbridge service loss durations or review historic flood damages losses
Emergency Service Losses
bull Applicable only to projects that reduce or eliminate documented emergency service costs from baseline conditions
bull Examples of avoided emergency services costs include NYPD staffing to monitor barricades for flooded roads or NFDY staffing for water rescues of residents from flooded buildings or streets
APPENDIX 4 - PROJECT BENEFITS CATEGORIES
93 Reduced life cycle costs may be applicable to some measures that provide extreme heat benefits such as green roofs that can last longer than a standard roof if properly maintained
94 Reduced utility service costs may be applicable to some measures that provide extreme heat benefits such as cool roofs green roofs and shade trees
95 FEMA per capita standard values taken from FEMA BCA Toolkit Version 530 (Build Date 12222016) and developed in FEMArsquos Baseline Standard Economic Value Methodology Report (July 28 2016) Consider updating FEMA standard per capita values to reflect current New York City utility rates
96 Consider updating FEMA and GSA standard values to reflect current New York City area labor rates and fuel costs
NYC Mayorrsquos Office of Recovery and Resiliency Climate Resiliency Design Guidelines
43APPENDIX 4 - PROJECT BENEFITS CATEGORIES
Table 14 ndash Other potential benefits for (1) sea level rise with coastal storm surge and (2) increased precipitation measures
Other Benefit Basic Guidance for Estimating Values
Avoided Stress and Anxiety
bull Applicable only for projects that directly benefit occupants of residential structuresbull Use FEMA standard value for avoided mental stress and anxiety treatment costs of $2443person to
estimate benefit for all impacted residents97
Avoided Lost Productivity
bull Applicable only for projects that directly benefit occupants of residential structuresbull Use FEMA standard value for avoided lost worker productivity costs of $8736household to estimate
benefit for all impacted workers (conservatively assuming one worker per household)
Environmental Open Space
bull Applicable only for projects that create or acquire open space areas by acquisitionbull Use FEMA standard value for environmental open space based on the type of land acquired ($8308
Acreyear for Green open space $39545Acreyear for Riparian $6010Acreyear for Wetlands $554Acreyear for Forests $1799Year for Marine and estuary)97
CSO Volume Reduction
bull Applicable only for projects that provide Combined Sewer Overflow (CSO) abatement by reducing the volume of rainfall runoff
bull Use CSO abatement cost of $0015gallonsyear applied to increased precipitation hazard runoff volume for 5-year design storm98
Ecosystem Service99
bull Add stormwater management benefits of green infrastructure projects to increased precipitation hazards where avoided damages and service losses are not quantified
bull Unit benefits applicable to increased precipitation hazard includeo Green roofs $0133SFyear (PUL 40 years)o BioswaleRain GardenMeadow Mix $0020SFyear (PUL 30 years)o Permeable Grass Pavers $0020SFyear (PUL 30 years)o Tree Plantings $303Treeyear (PUL 30 years)o Planter Box Trees $101Treeyear (PUL 15 years)
Real Estate99
bull Potential real estate benefits from increased resilience of residential andor commercial propertiesstreetscapesneighborhoods included within the project scope
bull Benefit applied to extreme heat hazard for green infrastructure projects directly impacting residential or commercial properties
Quality of Life Health Benefits99
bull Potential quality of life benefits related to improved public health from the resilience measures included within the project scope
bull Benefit applied to extreme heat hazard for green infrastructure projects directly impacting residential or commercial properties
Table 14 lists other typical benefits for reducing impacts from climate stressors and basic guidance for how to estimate them See Section IIID for more information
97 FEMA standard values for avoided mental stress and anxiety and environmental open space values taken from FEMA BCA Toolkit Version 530 (Build Date 12222016)
98 CSO abatement cost taken from APG1 Report for NYC ldquoTechnical Approaches for Benefit-Cost Analysis of Hazard Mitigation Projects in Urban and Coastal Environmentsrdquo (April 2016)
99 Ecosystem Services Real Estate and Quality of LifeHealth benefits tend to be more applicable to green infrastructure measures that provide extreme heat benefits such as green roofs trees and other plantings
NYC Mayorrsquos Office of Recovery and Resiliency Climate Resiliency Design Guidelines
44APPENDIX 4 - PROJECT BENEFITS CATEGORIES
Table 15 ndash Potential benefits for extreme heat (Urban Heat Island) reduction measures
Category Benefit Basic Guidance for Estimating Values
Direct Benefit
Reduced Life Cycle Cost
bull Applicable only to measures such as green roofs that are expected to last longer than standard roofs
bull Compute total cost savings including annual OampM costs
Indirect Benefit
Energy Savings
bull Applicable to measures that reduce energy costs by providing cooling through increased shading andor evapotranspiration
bull Use New York Power Authority rates of $0148kWh for electricity and $0810Therm for natural gas
Other Potential Benefits
Air Quality bull Applicable to measures that absorb pollutants andor reduce carbon dioxide emissions
Acoustics bull Applicable to measures such as green roof or walls that reduce noise transfer
Quality of LifeHealth bull Potential quality of life benefits and related to improved public health
Real Estate bull Applicable to measures that provide residential real estate benefits from increased resilience of propertiesstreetscapesneighborhoods
Retail Sales Marketing
bull Applicable to measures that provide commercial property benefits from increased aesthetics resulting in increased marketing and sales for streetscapesneighborhoods
Tax Credits Incentives
bull Applicable to resilience or green infrastructure measures such as green roofs that have accompanying Federal State or City tax credits or other incentives
Table 15 lists potential benefits for reducing impacts from heat and basic guidance for how to estimate them See Section IIID for more information
NYC Mayorrsquos Office of Recovery and Resiliency Climate Resiliency Design Guidelines
45APPENDIX 4 - PROJECT BENEFITS CATEGORIES
Table 16 ndash Guidance on quantitative calculations for (1) sea level rise with coastal storm surge and (2) increased precipitation measures
Data Input General Guidance ndash Basic Description
Applicable Benefit Category
Applicable Typical Facility Typology
Dire
ct B
enefi
ts
Indi
rect
Ben
efits
Oth
er P
oten
tial
Ben
efits
Bui
ldin
g St
ruct
ures
Com
plex
Fa
cilit
ies
Tran
spor
tatio
nSt
reet
scap
es
Plaz
as
Park
Fea
ture
s
First Floor Elevation (FFE)
bull The elevation of the first finished floor of the structure excluding basements
bull FFE measured from top of lowest floor (riverinenon-coastal high hazard areas) or bottom of lowest horizontal structural member (coastal high hazard areas)
Y Y Y Y
Building Replacement Value (BRV)
bull The unit cost to rebuild a structure of the same quality of construction
bull Not the same as market value
Y Y Y Y
Building Size
bull The total floor area of the building in square feet
bull Total Building Value = BRV x Building Sizebull Typical BRVs for NYC range between $100 to
$325SF for residential buildings and $120 to $450SF for commercialpublic buildings
Y Y Y Y
Structure Description
bull The type of building number of stories and foundation type (full basement partial basement no basement)
bull Collect more detailed foundation data for coastal flood zones
Y Y Y Y
Building Use bull Details related to residential housing commercial business and public use
Y Y Y Y Y
Building Type bull The primary use of building ndash residential commercial public and others
Y Y Y Y Y
Depth Damage Function (DDF)
bull Curves used to estimate structure damage contents damage and displacement of residential buildings based on flood depth
bull DDFs selection based on Structure Description Building Type Building Use
bull Structure DDFs based on percentage of Total Building Value
bull Contents DDFs based on percentage of Total Contents Value
bull Displacement DDFs based on number of displacement days x Displacement Cost
Y Y Y Y Y
Contents Value
bull The cost to replace structure contents (furnishings equipment)
bull Residential building Contents Values typically 50 BRV (FEMA DDFs) or 100 BRV (USACE DDFs)
bull Non-residential building Contents Values between 18 to over 100 depending on building use (USACE DDFs)
bull Total Contents Value = BRV x Building Size
Y Y Y Y Y
Table 16 provides general guidance on how to quantitatively calculate benefits from efforts to address from climate stressors See Section IIIE for more information
NYC Mayorrsquos Office of Recovery and Resiliency Climate Resiliency Design Guidelines
46APPENDIX 4 - PROJECT BENEFITS CATEGORIES
Table 16 ndash Guidance on quantitative calculations for (1) sea level rise with coastal storm surge and (2) increased precipitation measures
Data Input General Guidance ndash Basic Description
Applicable Benefit Category
Applicable Typical Facility Typology
Dire
ct B
enefi
ts
Indi
rect
Ben
efits
Oth
er P
oten
tial
Ben
efits
Bui
ldin
g St
ruct
ures
Com
plex
Fa
cilit
ies
Tran
spor
tatio
nSt
reet
scap
es
Plaz
as
Park
Fea
ture
s
Number of Residents (Residential)
bull Total number of occupants in a residential building
bull Typically estimated based on number of residential units x average number of individuals per household (based on current US Census data or use 25 individuals per household as a default)
Y Y Y Y Y
Displacement Cost (Residential)
bull The unit cost to lodge and feed displaced residents while flood damage is repaired
bull Average unit displacement cost of $415residential unitday recommended based on current FY2018 GSA Per Diem rates for New York City
Y Y Y Y Y
Value of Service (Non-Residential and Public)
bull The unit cost of service disruption and rental of temporary facilities while flood damage is repaired
bull Disruption costs for non-residential buildings typically range from $095 to $136SFmonth and rental costs range from $020 to $136SFmonth depending on building use
bull Value of service for public buildings ($day) is typically based on the annual operating budget for the City agency using the building prorated based on building size or population served by the building then divided by 365 daysyear
Y Y Y Y
Value of Service (Critical Facilities)
bull The unit cost of critical facilities (police fire emergency medical services) lost or delayed while flood damage is repaired
Y Y Y
Value of Service Duration
bull The duration of service disruption and rental of temporary facilities for non-residential buildings and critical facilities while flood damage is repaired
bull For non-residential buildingso Value of Service Durations vary from
4 months to over 30 months based on building use and the depth of flooding
o Total Value of Service Loss = (Disruption Cost x Building Area) = (Rental Cost x Building Area x Value of Service Duration)
bull For public buildings and critical facilitieso Value of Service Durations vary from 0
days to 720 months based on building use and the depth of flooding from FEMA FIA or USACE DDFs
o Total Value of Service Loss = (Value of Service) x (Service Loss Duration)
Y Y Y
NYC Mayorrsquos Office of Recovery and Resiliency Climate Resiliency Design Guidelines
47APPENDIX 4 - PROJECT BENEFITS CATEGORIES
Table 16 ndash Guidance on quantitative calculations for (1) sea level rise with coastal storm surge and (2) increased precipitation measures
Data Input General Guidance ndash Basic Description
Applicable Benefit Category
Applicable Typical Facility Typology
Dire
ct B
enefi
ts
Indi
rect
Ben
efits
Oth
er P
oten
tial
Ben
efits
Bui
ldin
g St
ruct
ures
Com
plex
Fa
cilit
ies
Tran
spor
tatio
nSt
reet
scap
es
Plaz
as
Park
Fea
ture
s
Engineering Estimates for Damages
bull Engineered estimate models of physical damages and service losses at the project site based on the Guidelines event recurrence interval(s) and flood depth(s)
Y Y Y Y Y Y
Historic Damages and Service Losses
bull Historic physical damages and service losses at the project site documented from previous flood events
bull Do not use routine maintenancebull The historic damage event recurrence interval
(RIs) andor flood depths must be determined updated for inflation to the present value and adjusted to match the Guidelines event RIsflood depths
Y Y Y Y Y Y
Facility Replacement Value
bull The unit cost to rebuild the facility
Impacted Area bull The geographic area impacted by the facility in the event of failure in acres
Y Y Y Y
Facility Capacity
bull The design capacity of the facilitybull For example - facility capacity expressed in
millions of gallons per day (MGD) for water and wastewater facilities or megawatts (MW) for electrical facilities
Y Y Y Y
Service Population
bull The number of impacted residents served by the facility
bull Typically estimated based on number of impacted residential customers x average number of individuals per household (based on current US Census data or use 25 individuals per household as a default)
bull Facilities serving mostly non-residentialpublic buildings andor critical facilities should focus on service losses rather than service population
Y Y Y
NYC Mayorrsquos Office of Recovery and Resiliency Climate Resiliency Design Guidelines
48APPENDIX 4 - PROJECT BENEFITS CATEGORIES
Table 16 ndash Guidance on quantitative calculations for (1) sea level rise with coastal storm surge and (2) increased precipitation measures
Data Input General Guidance ndash Basic Description
Applicable Benefit Category
Applicable Typical Facility Typology
Dire
ct B
enefi
ts
Indi
rect
Ben
efits
Oth
er P
oten
tial
Ben
efits
Bui
ldin
g St
ruct
ures
Com
plex
Fa
cilit
ies
Tran
spor
tatio
nSt
reet
scap
es
Plaz
as
Park
Fea
ture
s
Value of Service
bull Unit value of service provided by the facilitybull Example of FEMA standard values for complete
loss of utility service $105personday for potable water$49personday for wastewater$148personday for electrical
bull Consider updating FEMA standard per capita values to reflect current The New York City utility rates
Y Y
Roadway Elevations bull Roadway Elevations
Y Y
Roadway Replacement Value
bull Roadway Replacement ValueY Y
Inundation Area Map
bull Inundation Area Map developed by FEMA or through modeling by project design team
Y Y Y
Building Inventory of Inundation Area
bull The number and type of buildings within the streetscape and neighborhood inundated by the Guidelinersquos flood events
Y Y Y
Average Daily Traffic (ADT)
bull The average number of one-way traffic trips per day along the roadway(s) within the streetscapeneighborhood inundated by the Guidelinersquos flood events
Y Y
Additional Travel Time
bull The additional travel time needed to detour around a flooded roadway expressed in minutes
bull In the unlikely event there is no detour available use a 12-hour travel time per one-way trap but provide a detailed area street map as supporting documentation
Y Y
Value of Traffic Delay
bull The value of service associated with lost time in traffic
bull For example - FEMA standard average value of $3344vehiclehour of delay
bull Consider updating FEMA and GSA standard values to reflect current New York City area labor rates and fuel costs
Y Y
NYC Mayorrsquos Office of Recovery and Resiliency Climate Resiliency Design Guidelines
49APPENDIX 4 - PROJECT BENEFITS CATEGORIES
Table 17 ndash Guidance on quantitative unit benefit calculations for extreme heat hazard measures
Measure General Guidance ndash Unit Benefit Information and Data Requirements
Applicable Benefit Category
Applicable Typical Facility Typology
Dire
ct B
enefi
ts
Indi
rect
Ben
efits
Oth
er P
oten
tial
Ben
efits
Bui
ldin
g St
ruct
ures
Com
plex
Fa
cilit
ies
Tran
spor
tatio
nSt
reet
scap
es
Plaz
as
Park
Fea
ture
s
Green Roof
bull Unit benefit range over PUL = $470SF to $373SF of green roof area ($719SF standard value)
bull Assumed PUL = 40 yearsbull Apply standard value unit benefit to green
roof area to estimate measure benefitbull Higher range values more applicable
to residential and commercial building streetscape projects
Y Y Y Y Y Y
Bioswale Rain Garden Meadow Mix
bull Unit benefit range over PUL = $396SF to $211SF of area ($730SF standard value)
bull Assumed PUL = 30 yearsbull Apply standard value unit benefit to bioswale
rain gardenmeadow mix area to estimate total measure benefit
Y Y Y Y Y Y
Cool Roof
bull Unit benefit range over PUL = $117 to $3151SF of material area ($144SF standard value)
bull Assumed PUL = 20 yearsbull Apply standard value unit benefit to cool roof
area to estimate total measure benefitbull Higher range values more applicable to
residential building streetscape projects
Y Y Y Y Y
Light-Colored PaversLight-Colored Materials
bull Unit benefit range over PUL = $0774 to $204SF of material area ($0866SF standard value)
bull Assumed PUL = 30 yearsbull Apply standard value unit benefit to material
area to estimate total measure benefit
Y Y Y Y
Table 17 provides general guidance on how to quantitatively calculate benefits from efforts to address climate stressors See Section IIIE for more information
NYC Mayorrsquos Office of Recovery and Resiliency Climate Resiliency Design Guidelines
50APPENDIX 4 - PROJECT BENEFITS CATEGORIES
Table 17 ndash Guidance on quantitative unit benefit calculations for extreme heat hazard measures
Measure General Guidance ndash Unit Benefit Information and Data Requirements
Applicable Benefit Category
Applicable Typical Facility Typology
Dire
ct B
enefi
ts
Indi
rect
Ben
efits
Oth
er P
oten
tial
Ben
efits
Bui
ldin
g St
ruct
ures
Com
plex
Fa
cilit
ies
Tran
spor
tatio
nSt
reet
scap
es
Plaz
as
Park
Fea
ture
s
Tree Planting
bull Unit benefit range over PUL = $1005 to $77154Tree ($1855Tree standard value)
bull Assumed PUL = 30 yearsbull Apply standard value unit benefit to number of
trees to estimate total measure benefitbull Higher range values more applicable
to residential and commercial building streetscape projects
Y Y Y Y Y Y
Planter Box Tree
bull Unit benefit range over PUL = $212 to 16304Tree ($392Tree standard value)
bull Assumed PUL = 15 yearsbull Apply standard value unit benefit to number of
trees to estimate total measure benefitbull Higher range values more applicable
to residential and commercial building streetscape projects
Y Y Y Y Y
Shade Canopy
bull Unit benefit range over PUL = $0363 to $396SF ($0458SF standard value)
bull Assumed PUL = 15 yearsbull Apply standard value unit benefit to area of
shade canopy estimate total measure benefitbull Higher range values more applicable
to residential and commercial building streetscape projects
Y Y Y Y
Permeable Grass Pavers
bull Unit benefit range over PUL = $0258SF to $0521SF of pavers ($0363SF standard value)
bull Assumed PUL = 30 yearsbull Apply standard value unit benefit to paver
area to estimate total measure benefit
Y Y Y Y Y
For the purposes of the BCA refer to the following facility typologies bull ldquoBuilding Structuresrdquo include critical small building sites such as EMS or FDNY stations and non-critical small building sites such as
libraries or comfort stationsbull ldquoComplex Facilitiesrdquo include critical infrastructure such as wastewater treatment sites pump stations water filtration plants and similar
large or complex facilitiesbull ldquoTransportationStreetscapePlazasrdquo include roadway reconstruction streetscape improvements street raising plazas and other
transportation-related infrastructurebull ldquoPark Featuresrdquo include parks and similar public recreational facility with natural landscape features
NYC Mayorrsquos Office of Recovery and Resiliency Climate Resiliency Design Guidelines
51APPENDIX 5 - EXAMPLE PLANNING DECISION TREE
This decision tree provides a summarized example approach for how to implement these Guidelines Projects with a total cost greater than $50 million are recommended to conduct a full qualitative and quantitative climate change risk assessment and BCA while projects below $50 million are recommended to conduct a qualitative risk assessment and BCA
Define Project
1) Operational goals and criticality level2) Useful life3) Location in the current flood plain future floodplain and or zone
of tidal inundation and the project arearsquos score on the heat vulnerability index
Evaluate Project Risks According to Probability and Magnitude of Consequence
bull Extreme Heat bull Precipitationbull Sea Level Risebull Coastal Surge
High Level Identification and Assessment of Risk Mitigation Alternatives and Co-benefits
(qualitative)
Detailed Identification and Assessment of Risk Mitigation Alternatives and Co-benefits (qualitative and quantitative)
High Level Estimate of Costs and Benefits of Design Alternatives
(qualitative)
Detailed Estimate of Costs and Benefits of Design Alternatives
(qualitative and quantitative)
Decision Point Which climate change risks require mitigation
Decision Point Evaluate risk mitigation benefits and costs to
determine final resilient design alternative or if no action is required
Decision Point Is the total project cost above $50 million
Below $50 million Above $50 million
APPENDIX 5 - EXAMPLE PLANNING DECISION TREE
NYC Mayorrsquos Office of Recovery and Resiliency Climate Resiliency Design Guidelines
52
Project Title
Design Strategies Checklist (not exhaustive)
Extreme Heat Comments Extreme Precipitation Comments Sea Level Rise amp Storm Surge Comments
Select Site in Low Heat Vulnerability Index area Select High Elevation Site Select High Elevation Site
Minimize East-West Building Orientation Green Roof Raise Building Floor Elevation
Passive Solar Cooling and Ventilation Systems
Protect Below Grade Areas from Flooding Waterproof Building Envelope
Cool Roof (SRI appropriate) On-site Stormwater Management (gray) Elevate Critical Building Functions
Green Roof (extensive) Reduce Impervious Areas Elevate Critical Equipment
Vegetative Structures Permeable Pavement Perimeter Floodwall100 Levee (passive or active)
Enhanced HVAC System including space layout optimization and system scalability
Increase Green Spaces and Planted Areas DryWet Floodproofing
More Efficient Building Envelope Other Utility Redundancy Design101
Parking Lot Shading Resilient Materials amp Landscape Treatments
Light Colored Pavements (appropriate SRI) Design for Storm Surge Outflow
Increase Planted Areas Install Backwater Flow Prevention
Permeable Surfaces Design for Scour
Open-grid Pavement Raise Road Elevation
Other Other
This appendix provides a template for identifying possible design strategies to address climate change risks as described throughout the Guidelines
APPENDIX 6 - DESIGN STRATEGIES CHECKLIST
100 Permanent perimeter flood walls are not permitted to meet floodproofing requirements in buildings with substantial improvements andor damages 101 Utility redundancy design should be pursued for critical systems not all building systems
APPENDIX 6 - DESIGN STRATEGIES CHECKLIST
NYC Mayorrsquos Office of Recovery and Resiliency Climate Resiliency Design Guidelines
53APPENDIX 7 - CLIMATE CHANGE RISK ASSESSMENT RESOURCES
These Guidelines provide data on climate change hazards and recommend how that data can inform resilient design A risk assessment is a tool to help project managers and designers evaluate risk levels as well as select and prioritize resilient design strategies A high level risk assessment is recommended for all City capital projects with a total cost of under $50 million Projects above $50 million are recommended to conduct an in-depth assessment
Risk assessments use quantified estimates of the probability and magnitude of consequence of an event occurring to prioritize responses ldquoProbabilityrdquo is an assessment of the likelihood of a hazard occurring while ldquomagnituderdquo describes the hazardrsquos potential impact Risk assessment tools such as the examples listed below can be used to define and score these categories Projects that score higher across both probability and magnitude can be prioritized for investment and risk mitigation action Projects that score lower across both criteria may require no action beyond meeting code The results are typically charted on a risk matrix and an example is provided on the next page
The climate change risk management frameworks below offer templates for how to integrate climate change projections into a risk assessment process Refer to these resources for examples and further information
bull Vulnerability Assessment and Adaptation Framework is prepared by the Federal Highway Administration (FHWA) While developed for transportation planning this risk assessment framework has broad applicability for evaluating asset vulnerability to climate change Available at httpswwwfhwadotgovenvironmentsustainabilityresilienceadaptation_framework
bull US Climate Resilience Toolkit The US Global Change Research Program offers a step by step risk assessment
framework including tools and case studies at httpstoolkitclimategovsteps (see example on next page)
bull Coast Adapt Guidance on undertaking a risk assessment High level assessment httpscoastadaptcomausitesdefaultfilesfactsheetsT3M4_2_2nd_pass_risk_assessmentpdfDetailed assessment httpscoastadaptcomausitesdefaultfilesfactsheetsT3M4_3_3rd_pass_risk_assessmentpdf
bull Climate adaptation Risk uncertainty and decision-makingDownload the report here httpswwwukciporgukpublicationsRisk
The City plans to develop a NYC-specific process for integrating climate change data into existing risk management processes by April 2019
APPENDIX 7 - CLIMATE CHANGE RISK ASSESSMENT RESOURCES
NYC Mayorrsquos Office of Recovery and Resiliency Climate Resiliency Design Guidelines
54APPENDIX 7 - CLIMATE CHANGE RISK ASSESSMENT RESOURCES
The Risk Characterization Matrix below is an example from the US Climate Resilience Toolkit This tool can be used to assess the probability and magnitude of impact for identified risks The risk of coincident climate stressorsrisks (such as storm surge plus increased precipitation) can also be assessed as applicable
Figure 14 - Example of a climate change risk matrix (adapted from US Climate Resilience Toolkit)
Project teams can determine the magnitude of the impact (along the horizontal scale of 1 through 3 with 3 being the most severe) and the probabilitylikelihood of occurrence for each specific risk (along the vertical scale with 3 being the most likely) A score is typically assigned for each risk (Probabil-ity x Magnitude) and then charted on the matrix Based on the estimated probability and magnitude of consequence above the risks are ranked and prioritized for mitigation Factors to bear in mind include
bull Not all facility typologies have the same level of functional and operational importance during events or tolerance for disruption
bull Not all climate stressors and risks have the same level of impact on each project sitebull Not all identified risks can or should be mitigated fully
NYC Mayorrsquos Office of Recovery and Resiliency Climate Resiliency Design Guidelines
55WORKS CITED
A Stronger More Resilient New York PlaNYC Report of the NYC Special Initiative for Rebuilding and Resiliency The City of New York 2013
ldquoAccount for Climate Riskrdquo International Finance Corporation accessed March 27 2017 httpwwwifcorgwpswcmconnectTopics_Ext_ContentIFC_External_Corporate_SiteClimate+Business
PrioritiesAccount+for+Climate+Risk
American Society of Heating Refrigeration and Air-Conditioning Engineers (ASHRAE) Handbook -Fundamentals 2017
ldquoBaseline Standard Economic Value Methodology Reportrdquo Federal Emergency Management Agency July 2016
Benefit Cost Analysis Toolkit Software Version 530 Federal Emergency Management Agency (build date December 2016)
Criteria for Detention Facility Design New York City Department of Environmental Protection November 2012
Community Resilience Planning Guide for Buildings and Infrastructure Systems Vol 1 NIST Special Publication 1190 US Department of Commerce 2016
Cool and Green Roofing Manual NYC Department of Design and Construction 2007 httpwwwnycgovhtmlddcdownloadspdfcool_green_roof_manpdf
Building Resiliency Task Force US Urban Green Building Council New York 2013 httpurbangreencouncilforcecomBuildingResiliency
Design and Planning for Flood Resiliency Guidelines for NYC Parks New York City Department of Parks and Recreation 2017
httpswwwnycgovparksorgplanning-and-buildingplanningresiliency-plansflood-resiliency
Flooded Bus Barns and Buckled Rails Federal Transit Administration Office of Budget and Policy 2011 httpswwwhsdlorgabstractampdid=685187
Floodproofing Non-Residential Buildings FEMA P936 FEMA 2013 httpswwwfemagovmedia-library-data9a50c534fc5895799321dcdd4b6083e7P-936_8-20-13_508rpdf
ldquoGlossaryrdquo International Infrastructure Management Manual National Asset Management Support Group New Zealand 2011 httpwwwipweaorg
ldquoGreen Roof Metrics Draft Reportrdquo New York City Department of Parks and Recreation 2017
ldquoGuide to Rain Event Preparednessrdquo NYC Department of Environmental Protection httpwwwnycgovhtmldeppdfbrochuresflood-preparedness-flyerpdf
ldquoGuidelines and Discount Rates for Benefit-Cost Analysis of Federal Programsrdquo Appendix C Circular A-94 US Office of Management and Budget (OMB) 2017
ldquoGuidelines for the Design and Construction of Stormwater Management Systemsrdquo New York City Department of Environmental Protection July 2012
Horton R et al New York City Panel on Climate Change 2015 Report Ann NY Acad Sci ISSN 0077-892 New York 2015
Madrigano J et al ldquoA case-only study of vulnerability to heat wavendashrelated mortality in New York City (2000ndash2011)rdquo Environmental Health Perspectives 123672ndash678 2013
WORKS CITED
NYC Mayorrsquos Office of Recovery and Resiliency Climate Resiliency Design Guidelines
56WORKS CITED
enspMcGregor et al Two Degrees The Built Environment and Our Changing Climate Routledge Press 2013
NYC Green Codes Task Force US Green Building Council New York 2010 httpurbangreencouncilorgGreenCodes
NYCrsquos Risk Landscape A Guide to Hazard Mitigation NYC Emergency Management 2014
One New York The Plan for a Strong and Just City The City of New York 2015 httpwwwnycgovhtmlonenyc downloadspdfpublicationsOneNYCpdf
Ready to Respond Strategies for Multifamily Building Resilience Enterprise Green Communities 2015 httpswwwenterprisecommunityorgresources
Rosenzweig C et al Climate Change Adaptation in New York City Building a Risk Management Response New York City Panel on Climate Change 2010
httponlinelibrarywileycomdoi101111nyas20101196issue-1 issuetoc
ldquoSustainable Infrastructure Management Program Learning Environmentrdquo Water Environment Research Foundation accessed March 24 2017 httpsimplewerforg
Urban Waterfront Adaptive Strategies NYC Department of City Planning 2013 httpwww1nycgovsiteplanningplanssustainable-communitiesclimate-resiliencepagetab=1
Wastewater Resiliency Plan Climate Risk Assessment and Adaptation Study New York City Department of Environmental Protection October 2013
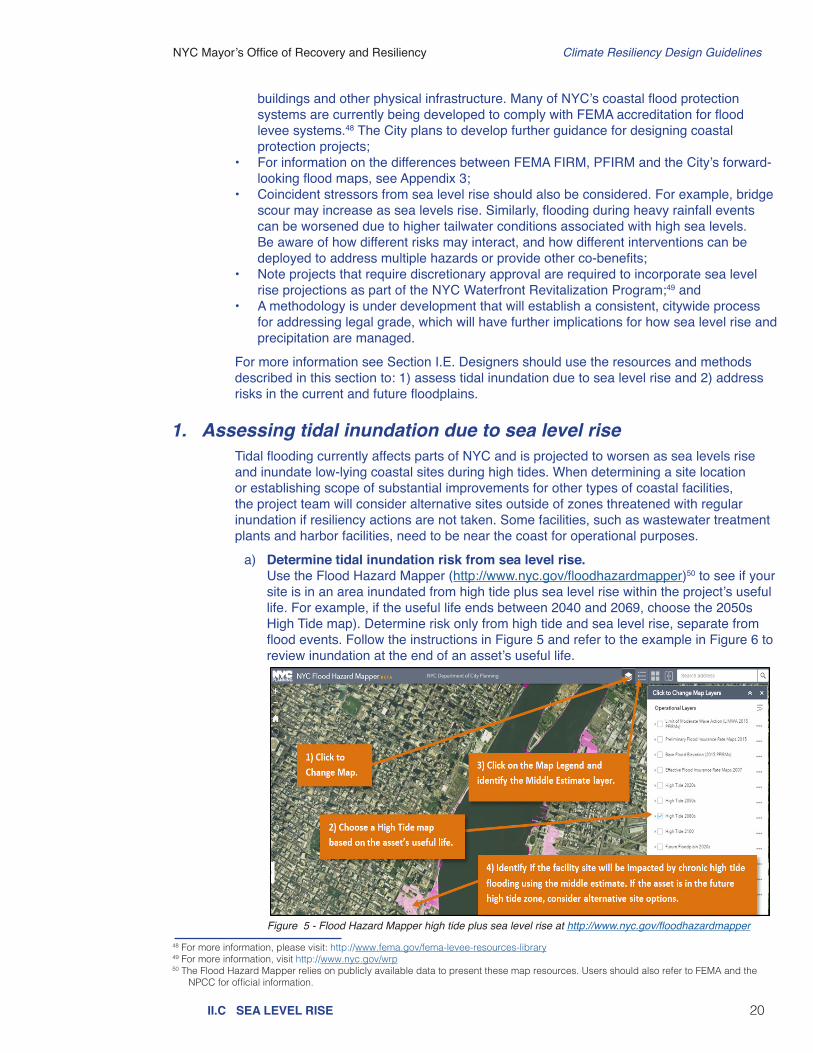
NYC Mayorrsquos Office of Recovery and Resiliency Climate Resiliency Design Guidelines
20IIC SEA LEVEL RISE
buildings and other physical infrastructure Many of NYCrsquos coastal flood protection systems are currently being developed to comply with FEMA accreditation for flood levee systems48 The City plans to develop further guidance for designing coastal protection projects
bull For information on the differences between FEMA FIRM PFIRM and the Cityrsquos forward-looking flood maps see Appendix 3
bull Coincident stressors from sea level rise should also be considered For example bridge scour may increase as sea levels rise Similarly flooding during heavy rainfall events can be worsened due to higher tailwater conditions associated with high sea levels Be aware of how different risks may interact and how different interventions can be deployed to address multiple hazards or provide other co-benefits
bull Note projects that require discretionary approval are required to incorporate sea level rise projections as part of the NYC Waterfront Revitalization Program49 and
bull A methodology is under development that will establish a consistent citywide process for addressing legal grade which will have further implications for how sea level rise and precipitation are managed
For more information see Section IE Designers should use the resources and methods described in this section to 1) assess tidal inundation due to sea level rise and 2) address risks in the current and future floodplains
1 Assessing tidal inundation due to sea level riseTidal flooding currently affects parts of NYC and is projected to worsen as sea levels rise and inundate low-lying coastal sites during high tides When determining a site location or establishing scope of substantial improvements for other types of coastal facilities the project team will consider alternative sites outside of zones threatened with regular inundation if resiliency actions are not taken Some facilities such as wastewater treatment plants and harbor facilities need to be near the coast for operational purposes
a) Determine tidal inundation risk from sea level rise Use the Flood Hazard Mapper (httpwwwnycgovfloodhazardmapper)50 to see if your
site is in an area inundated from high tide plus sea level rise within the projectrsquos useful life For example if the useful life ends between 2040 and 2069 choose the 2050s High Tide map) Determine risk only from high tide and sea level rise separate from flood events Follow the instructions in Figure 5 and refer to the example in Figure 6 to review inundation at the end of an assetrsquos useful life
48 For more information please visit httpwwwfemagovfema-levee-resources-library49 For more information visit httpwwwnycgovwrp50 The Flood Hazard Mapper relies on publicly available data to present these map resources Users should also refer to FEMA and the
NPCC for official information
Figure 5 - Flood Hazard Mapper high tide plus sea level rise at httpwwwnycgovfloodhazardmapper
NYC Mayorrsquos Office of Recovery and Resiliency Climate Resiliency Design Guidelines
21IIC SEA LEVEL RISE
b) Address flood risk If the Flood Hazard Mapper shows that the facility is expected to be inundated by
high tides within its useful life or if primary access roads are at risk of inundation consider alternative site options
- OR - If the site is not expected to be regularly inundated by tides proceed to the next
section 2 Addressing Risks in the Current Floodplain
Note on calculating tidal inundations with sea level rise if a project team is interested in understanding the depth of tidal inundation given climate change projections follow these steps First determine the Mean Higher High Water (MHHW) elevation in feet-NAVD 8851 datum nearest to the site If the MHHW data is unavailable from a site specific survey refer to httpwwwnycgovwrp for a list of MHHW elevations (NAVD88) at tide stations across the city52 Second add the high estimate (90th percentile) of expected sea level rise (see Table 8 in Appendix 2) for the year corresponding to the facilityrsquos useful life to the MHHW to determine the projected depth of tidal inundation with sea level rise
51 North American Vertical Datum of 1988 (NAVD 88) is the vertical control datum of orthometric height established for vertical control surveying in the US based upon the General Adjustment of the North American Datum of 1988
httpswwwngsnoaagovdatumsvertical52 SLR elevations at httpwwwnycgovwrp are adjusted to account for sea level rise since the last tidal epoch If no other resource is
available to determine MHHW use the NOAA Online Vertical Datum Transformation tool to calculate the MHHW in feet-NAVD
Figure 6 - Flood Hazard Mapper with high tide in the 2020s (left) and in the 2080s (right) at httpwwwnycgovfloodhazardmapper
NYC Mayorrsquos Office of Recovery and Resiliency Climate Resiliency Design Guidelines
22IIC SEA LEVEL RISE
2 Addressing risks in the current floodplain53
A facility located in the current 1 annual chance floodplain (PFIRM 2015)54 will face increasing risk of flooding during its useful life due to sea level rise increasing the depth of coastal storms This section provides a process for adjusting the design flood elevation required by code to account for sea level rise
a) Find the location of the facility using the Flood Hazard Mapper (httpwwwnycgovfloodhazardmapper) and follow the instructions in Figure 7
bull Choose to view the layer ldquoFEMA Preliminary FIRM 2015rdquo bull Click on the facility site in the 1 floodplain to view the base flood elevation
Figure 7 - Flood Hazard Mapper with FEMA PFIRM (2015) at wwwnycgovfloodhazardmapper
b) If the facility is not in the current 1 annual chance floodplain (PFIRM 2015) proceed to the next section ldquo3 Addressing risks in the future floodplainrdquo
- OR - If the facility is in the current 1 annual chance floodplain (PFIRM 2015) note
the base flood elevation (BFE) and proceed to Step c) below Please note if a facility has multiple BFEs or if the site is partially in the 1 annual chance floodplain it is recommended to use the highest BFE as the current BFE for the entire site
c) Establish a sea level rise-adjusted DFE Use the current base flood elevation at your site the facilityrsquos useful life and its
criticality level to determine the design flood elevation using Table 4 (on the next page) as a basis of design
53 This process for adjusting the design flood elevation to account for sea level rise satisfies the criteria of the climate-informed science approach described at the state and federal level
54 FEMA updates its flood maps periodically As of April 2018 the most recent maps are the Preliminary Flood Insurance Rate Maps (PFIRM) available at DCPrsquos Flood Hazard Mapper (httpwwwnycgovfloodhazardmapper) Also note that NYC Building Code requires developers to use the PFIRM (2015) or the FIRM (2007) whichever is more restrictive For more information on these requirements please refer to Appendix G of the NYC Building Code Please note that the DCP maps are not official and all site locations should be confirmed with the official FEMA PFIRM NYC will provide information on the latest flood maps as they are updated
NYC Mayorrsquos Office of Recovery and Resiliency Climate Resiliency Design Guidelines
23IIC SEA LEVEL RISE
Table 4 - Determine the sea level rise-adjusted design flood elevation for critical and non-critical facilities55
Critical facilities
End of useful life Base Flood Elevation (BFE)56 in NAVD 88 + Freeboard57 + Sea Level Rise
Adjustment58= Design Flood Elevation (DFE) in
NAVD 88Through 2039 FEMA 1 (PFIRM) 24rdquo 6rdquo = FEMA 1 + 30rdquo
2040-2069 FEMA 1 (PFIRM) 24rdquo 16rdquo = FEMA 1 + 40rdquo2070-2099 FEMA 1 (PFIRM) 24rdquo 28rdquo = FEMA 1 + 52rdquo
2100+ FEMA 1 (PFIRM) 24rdquo 36rdquo = FEMA 1 + 60rdquoNon-critical facilities
End of useful life Base Flood Elevation (BFE) in NAVD 88 + Freeboard + Sea Level Rise
Adjustment = Design Flood Elevation (DFE) in
NAVD 88Through 2039 FEMA 1 (PFIRM) 12rdquo 6rdquo = FEMA 1 + 18rdquo
2040-2069 FEMA 1 (PFIRM) 12rdquo 16rdquo = FEMA 1 + 28rdquo2070-2099 FEMA 1 (PFIRM) 12rdquo 28rdquo = FEMA 1 + 40rdquo
2100+ FEMA 1 (PFIRM) 12rdquo 36rdquo = FEMA 1 + 48rdquoAdditional analysis should be conducted to incorporate wave action and wave run-up in DFE calculations especially in areas that are located within the FEMArsquos 1 annual chance Limit of Moderate Wave Action (LiMWA) zone Wave run up is the maximum vertical extent of wave uprush above surge
Definition of critical buildings and infrastructure for determining DFE in Table 4The criticality definitions below are for use in the application of the Guidelines only All items identified as critical in NYC Building Code Appendix G are critical in these guidelines however this list includes additional facilities that are not listed in Appendix G59 If a facility is not listed here it is considered non-critical for the purposes of determining freeboard
bull Hospitals and health care facilitiesbull Fire rescue ambulance and police stations and emergency vehicle garages bull Jails correctional facilities and detention facilities bull Facilities used in emergency response including emergency shelters emergency preparedness communication
operation centers communication towers electrical substations back-up generators fuel or water storage tanks power generating stations and other public utility facilities
bull Critical aviation facilities such as control towers air traffic control centers and hangars for aircraft used in emergency response
bull Major food distribution centers (with an annual expected volume of greater than 170000000 pounds)60 bull Buildings and other structures that manufacture process handle store dispose or use toxic or explosive
substances where the quantity of the material exceeds a threshold quantity established by the authority having jurisdiction and is sufficient to pose a threat to the public if released61
bull Infrastructure in transportation telecommunications or power networks including bridges tunnels (vehicular and rail) traffic signals (and other right of way elements including street lights and utilities) power transmission facilities substations circuit breaker houses city gate stations arterial roadways telecommunications central offices switching facilities etc
bull Ventilation buildings and fan plantsbull Operations centersbull Pumping stations (sanitary and stormwater)bull Train and transit maintenance yards and shopsbull Wastewater treatment plantsbull Water supply infrastructurebull Combined-sewer overflow (CSO) retention tanksbull Fueling stationsbull Waste transfer stations and bull Facilities where residents have limited mobility or ability including care facilities and nursing homes
55 If an industry standard does not include freeboard in its flood protection standards for particular infrastructure assets then only consider the sea level rise adjustment when determining flood protection levels
56 Note that NYC Building Code requires developers to use the PFIRM (2015) or the FIRM (2007) whichever is more restrictive For more information on these requirements please refer to Appendix G of the NYC Building Code
57 These freeboard values reflect NYC Building Code Appendix G Table 2-1 which establishes the minimum elevation of the top of lowest floor Appendix G requires other freeboard values for other parts of structures and in different parts of the floodplain Refer to Appendix G for the appropriate freeboard and use that value in Table 4 above
58 The sea level rise figures provided are for the middle of the 25th-75th percentile range projections from the NPCC These values do not necessarily indicate the average of all models
59 The structural occupancy categories outlined in Appendix G of the NYC Building Code are the same as ASCE 7 used for structural design For critical buildings structural design should comply with ASCE 7 and 24 for design class IV
60 This threshold represents the median volume of main food distributors in NYC according to statistics collected as part of the Five Borough Food Flow study in 2016 available at
httpswwwnycedccomsystemfilesfilesresource2016_food_supply-resiliency_study_resultspdf 61 The threshold quantity for hazardous materials is established by Chapter 7 of Title 24 of the NYC Administrative Code
NYC Mayorrsquos Office of Recovery and Resiliency Climate Resiliency Design Guidelines
24IIC SEA LEVEL RISE
Figure 9 ndash Outdoor emergency generator for the critical building
This case study provides an example of how to calculate a sea level rise-adjusted DFE based on the useful life of a hypothetical critical services building and its primary component
Step 1 Organize the site by various critical or primary components and their year of construction Determine their useful life along with the associated future year scenario for flood risk assessment In this example the building structure and the outside emergency generator are the most at-risk components from combined sea level rise and coastal storm surge
Step 2 Overlay the site footprint area over the effective current PFIRM or FIRM and the corresponding future year scenario FEMA 1 to identify flood risk to the site From overlaying the 2015 preliminary FEMA floodplain over the site it was determined that the site has a 1 annual chance of flooding with a base flood elevation of 13rsquo NAVD Step 3 Evaluate the criticality of each primary component of the facility based on the Guidelinesrsquo definition for critical infrastructure (Table 4) This (hypothetical) building is critical
Step 4 Use Table 4 to determine the sea level rise adjustment and freeboard requirements for each component and calculate the DFE for each that corresponds to its useful life period
Step 5 Compare the DFE of each component and the associated Guidelinesrsquo recommended DFE to calculate anticipated flood depth
CASE STUDY Adjusting the DFE for Sea Level Rise
Table 5 ndash Example of how to calculate a sea level rise-adjusted DFE for a critical facility
Construction year Components Useful
Life
Future Year Scenario
[Useful Life + Const
Year]
BFE in NAVD
88 (feet)
Freeboard + Sea
Level Rise Adjustment
(feet)
Adjusted DFE in
NAVD 88 (feet)
2010 Building Structure
70 years 2070-2099 130rsquo 2rsquo+23rsquo 173rsquo
2010Outdoor
Emergency Generator
25 years
Through 2039 130rsquo 2rsquo+05rsquo 155rsquo
Figure 8 - Example of how to locate a facility within the current floodplain and determine the BFE Figure 9 (inset) - Outdoor emergency generator at the facility
Figure 10 - This schematic shows how to determine the design flood elevation of a facility within the current 1 floodplain
Illustrative not to scale
NYC Mayorrsquos Office of Recovery and Resiliency Climate Resiliency Design Guidelines
25IIC SEA LEVEL RISE
Figure 11 - Flood Hazard Mapper with future 1 annual chance floodplain (adjusted for sea level rise) at httpwwwnycgovfloodhazardmapper
b) If the site is not in the future floodplain no flood protection is required for this facility
- OR - If the site is in the future floodplain identify the nearest adjacent base flood
elevation at the project site in the current 1 annual chance floodplain (PFIRM 2015) using the Flood Hazard Mapper62
c) Use Table 4 to determine the DFE Add freeboard and the sea level rise-adjustment to the nearest adjacent BFE on the
current 1 annual chance floodplain (PFIRM 2015) to determine the DFE
d) Apply the DFE calculation from Table 4 to the protected facility See Figures 12 and 13 for an illustration of how to calculate the DFE
62 Maps of future floodplains show the impacts of sea level rise alone and do not consider how changes in stormsrsquo climatology might also affect wave action and the full extent of the floodplain
3 Addressing risks in the future floodplainIf the facility is not in the current 1 annual chance floodplain (PFIRM 2015) it may still be at risk in the future from flooding as sea level rise increases the extent of the floodplain Follow the steps below to determine if your facility is located in the future floodplain and if so what sea level rise-adjusted DFE to use
a) Use the Flood Hazard Mapper (httpwwwnycgovfloodhazardmapper) to determine if the facility site will be in the future 1 annual chance floodplain
Assess if by the end of the facilityrsquos useful life the floodplain is projected to increase to encompass all or part of the project site For example if the useful life ends between 2040 and 2069 choose the 2050s floodplain map Refer to the steps in Figure 11 below
NYC Mayorrsquos Office of Recovery and Resiliency Climate Resiliency Design Guidelines
26IIC SEA LEVEL RISE
Figure 12 - This schematic map shows how to locate the nearest adjacent 1 floodplain elevation
Figure 13 -This schematic shows how to determine the design flood elevation of a facility that is outside of the current 1 floodplain
CASE STUDY Identifying a Base Flood Elevation (BFE) in the Future Floodplain
Illustrative not to scale
NYC Mayorrsquos Office of Recovery and Resiliency Climate Resiliency Design Guidelines
27IIC SEA LEVEL RISE
4 Identify appropriate design interventions
63 Additional resources for identifying adaptive strategies Urban Waterfront Adaptive Strategies (NYC Department of City Planning httpswww1nycgovassetsplanningdownloadpdfplans-studiessustainable-communitiesclimate-resilienceurban_waterfrontpdf Floodproofing Non-Residential Buildings (FEMA) at httpswwwfemagovmedia-libraryassetsdocuments34270 Ready to Respond Strategies for Multifamily Building Resilience (Enterprise Green Community) at
httpwwwenterprisecommunityorgresourcesready-respond-strategies-multifamily-building-resilience-1335664 While natural systems-based approaches ameliorate flooding their use for storm surge or wave mitigation would need to be quantified
before contributing towards the design flood elevation 65 For more information see FEMArsquos Floodproofing Non-Residential Buildings at httpswwwfemagovmedia-libraryassetsdocuments34270
Operational requirements and continuity plans can inform the selection of appropriate design interventions particularly in terms of how quickly a site needs to be up and running after a flood event Some examples of how functional uses can pair with interventions include
bull A facility that needs to be operating during or immediately after a flood event may need to be dry floodproofed using permanent barriers or designed for passive survivability (such as a police or fire station)
bull A facility that needs to recover quickly after an event could elevate prioritized equipment and have deployable barriers
bull A site that can recover over a longer duration of time could be temporarily inundated during an event (such as parks or plazas) The use of resilient materials and strategies can reduce costly damage caused by temporary inundation
Different design interventions should be chosen based on the specific operational requirements of the project however these must meet the ASCE 24 design requirements for Coastal VE Zones
For all projects at risk of current or future flooding select protections that meet the projectrsquos design flood elevation Consider project-specific factors including the site location operational requirements existing continuity planning and cost63 A Design Strategies Checklist in Appendix 6 is available for use as a resource to track possible design approaches Some examples of design alternatives are
bull Site relocation where feasible conduct alternative site analysis
bull Permanent barriers at a site (eg floodwalls)
bull Deployable flood barriers (eg stop logs flood doorsgates inflatable barriers)
bull Natural systems-based approaches (eg living shorelines restored wetlands)64
bull Prioritized protection of electrical mechanical and other critical or costly-to-replace equipment above the design flood elevation (eg motors and controller boilers and furnaces fuel storage tanks duct work alarm systems and suppression equipment electrical panels electrical distribution and switching areas gas and electric meters telecommunications equipment chemical feed equipment HVAC units and emergency generators)65
bull Dry floodproofing design a facility to prevent water from entering
bull Wet floodproofing design a facility to permit floodwaters to flow in and out of the structure without causing significant damage (eg elevate or protect critical equipment use water-resistant building materials below the design flood elevation include flood vents and pumps)
bull Design redundant telecommunications conduit entrances for multiple carrier entry Telecom conduit should run to diverse manholes when possible
bull Install backup power for telecom equipment with design consideration for such equipment (eg installation above DFE)
bull Install outdoor-rated disconnect switch for telecommunications equipment on the roofbull Explore interventions to protect underground utilities and other telecommunications
facilities from water damagebull Install backflow preventers backwater valves and sump pumps for all buildings and
infrastructure in the floodplain as well as behind flood barriersbull Shoreline improvements that reduce the height of waves or attenuate waves where
feasible
NYC Mayorrsquos Office of Recovery and Resiliency Climate Resiliency Design Guidelines
28IIIA GENERAL METHODOLOGY TO ESTIMATE PROJECT BENEFITSIIIB CATEGORIES OF PROJECT BENEFITS
Designing and constructing facilities to handle the future climate loads above the current NYC codes and standards based on projected useful life of the components provides resiliency benefits The incremental costs to implement the Guidelinesrsquo recommended design interventions should be compared with the incremental benefits to aid agencies in making decisions about resilient design strategies The project design team should evaluate benefits of the interventions designed to meet Guidelinesrsquo recommended criteria for all the climate stressors qualitatively andor quantitatively For projects with construction costs below $50 million the project design team is recommended to perform a qualitative benefits assessment on the interventions that meet the Guidelinesrsquo recommendations for all applicable climate stressors For critical facilities or projects with construction costs over $50 million the project design team is recommended to perform quantitative benefit calculations to identify the optimal interventions that meet Guidelinesrsquo recommended design criteria
A GENERAL METHODOLOGY TO ESTIMATE PROJECT BENEFITSThis general methodology to perform qualitative and quantitative benefit calculations is recommended for use by project design teams at the beginning of and during the design process This methodology enables estimation of project benefits for a high-level benefit-cost analysis (BCA) that can be applied to evaluate and compare resiliency features designed to address sea level rise with coastal storm surge increased precipitation and extreme heat events The type of benefits provided by interventions designed to meet the Guidelinesrsquo design criteria can vary by climate stressors and typology of the facilities The main guiding principle in development of the high-level BCA methodologies included in these Guidelines was to balance simplicity with accuracy The project benefits categories identified within the methodology may not cover all the potential benefits provided by every facility type within NYC In particular the benefits of planning for increased precipitation are difficult to quantify Hence the project design team should use their discretion to modify this general benefit calculation methodology as needed to meet their project goals and objectives The project design team should develop appropriate input data whether quantitative or qualitative needed to estimate project benefits
B CATEGORIES OF PROJECT BENEFITSThere are three types of project benefit categories - direct benefits indirect benefits and other benefits - that can be used to perform qualitative assessments and develop quantitative estimates of monetary benefits for intervention alternatives designed to meet the Guidelinesrsquo recommendations These project benefit categories will help to perform a high-level benefit-cost analysis that balances accuracy with an appropriate level of effort
bull Direct Benefits include reduced or avoided physical damages to facilities and contents reduced or avoided displacements for residential structures and reduced life cycle or OampM costs that can be quantified as a primary result of implementing a specific hazard mitigation measure Table 12 in Appendix 4 provides a list of direct benefits and basic guidance on estimating and documenting values for sea level rise and increased precipitation-related flood hazards Note that given the current state of practice it is not possible to quantify reduced or avoided physical damages or residential displacements that result from a specific extreme heat mitigation measures Therefore direct benefits applicable to extreme heat hazards are limited to reduced life cycle costs applicable to certain measures such as green roofs Refer to Table 15 for details on direct benefits for extreme heat hazards
III EVALUATION OF PROJECT BENEFITS
NYC Mayorrsquos Office of Recovery and Resiliency Climate Resiliency Design Guidelines
29IIIB CATEGORIES OF PROJECT BENEFITS
bull Indirect Benefits include reduced or avoided service losses for non-residential
buildings public facilities andor infrastructure (utilities roads and bridges) based on the value of service continuity andor emergency services to New Yorkers that can be quantified as a secondary result of implementing a specific hazard mitigation measure Table 13 in Appendix 4 provides a list of indirect benefits and basic guidance on estimating and documenting values for sea level rise and increased precipitation-related flood hazards Note that given the current state of practice on extreme heat it is not possible to quantify reduced or avoided service losses that result from a specific extreme heat mitigation measures Therefore indirect benefits applicable to extreme heat hazards are limited to reduced energy costs such as cool roofs green roofs or shade trees Refer to Table 15 in Appendix 4 for details on indirect benefits for extreme heat hazards
bull Other Benefits where applicable other potential benefits may include social benefits for residents such as avoided stress and anxiety avoided lost productivity environmentalecosystem service benefits avoided need for emergency services and other potential benefits that can be estimated as a result of implementing a specific hazard mitigation measure Table 14 in Appendix 4 provides a list of other potential benefits and basic guidance on estimating and documenting values for sea level rise and increased precipitation-related flood hazards
Note on the ecosystem service benefit category in Table 14 the stormwater management benefits of green infrastructure should be distributed between the extreme heat and increased precipitation hazards since these measures provide both significant reductions in rainfall runoff as well as Urban Heat Island mitigation through evapotranspiration However there is currently limited data available to quantify the actual distribution of stormwater management benefits between the two hazards For various dual-benefit providing interventions careful considerations should be given to identify the appropriate benefits category provided by the intervention with a goal to avoid duplication of quantified benefits In this methodology the stormwater management benefits of green infrastructure are applied to the increased precipitation hazard in order to avoid a duplication of benefits Note on real estate and quality of life benefits additionally it is important to note that two potential benefit categories shown in Table 14 - real estate and quality of lifehealthavoided casualties - were not included in the current BCA methodology for sea level rise or increased precipitation hazards Although these categories could increase project benefits for sea level rise and increased precipitation hazards they were only applied to measures that address extreme heat hazards such as green roofs trees and other plantings Refer to Table 15 for a detailed summary of other benefit categories quantified as unit benefits for extreme heat hazards
NYC Mayorrsquos Office of Recovery and Resiliency Climate Resiliency Design Guidelines
30IIIC WHICH METHODOLOGY TO USEIIID BCA METHODOLOGY FOR PROJECTS UNDER $50 MILLION
D BCA methodology for projects under $50 millionThe project design team should develop design alternatives to meet the Guidelinesrsquo criteria which may be in excess of NYC code and standards requirements (baseline conditions) It is assumed that the project design team will develop alternatives to address each of the following applicable climate stressors - sea level risecoastal storm surge increased precipitation and extreme heat - separately Tables 12-15 in Appendix 4 provides a list of typical direct indirect and other benefits provided by various intervention typologies to reduce impacts from climate stressors During the qualitative assessment the project design team should consider that intervention strategies will have varying levels of reliability effectiveness benefits and cost implications during the qualitative assessment
The project design team is recommended to develop appropriate evaluation criteria and metrics for each of the applicable project benefit categories For each alternative the project design team could use either a scoring weighting ranking or other type of qualitative assessment framework to assess each applicable project benefit categories with the developed evaluation criteria and metrics Table 6 provides an example template to evaluate alternatives using a set of general evaluation criteria and metrics using a color-coded rating system (and see Table 7 for an example of how to complete the template) The project design team can utilize a similar template customized to their project goals and objectives This assessment allows agencies to screen the qualitative benefits for various alternatives that would then lead to development of final project components to match the available budget and goals of the project
Projects with total costs below $50 million recommended to conduct a qualitative assessment to identify the optimal interventions that meet Guidelinesrsquo design criteria using the ldquoD) BCA methodology for projects under $50 millionrdquo methodology below
C WHICH METHODOLOGY TO USEProjects with a total cost above $50 million or are highly complex or critical facilities recommended to conduct both a qualitative and quantitative benefit calculation to identify the optimal interventions that meet Guidelinersquos design criteria using the ldquoE) BCA methodology for projects above $50 millionrdquo below A quantitative BCA also must include qualitative factors
NYC Mayorrsquos Office of Recovery and Resiliency Climate Resiliency Design Guidelines
31IIID BCA METHODOLOGY FOR PROJECTS UNDER $50 MILLION
Qualitative Color Scale Green=Least resource intensive alternative Purple=most resource intensive yellow=medium level of resource intensity
Qualitative Evaluation Factors Description Relative Color Rating System
First CostsAdditional construction costs needed to incorporate Guidelinesrsquo recommended resilient design over the baseline project costs
Highest cost ($$$) rated as Purple whereas lowest cost ($) rated as Green
ConstructabilityEase of Implementation
Construction techniques and site conditions such as presence of major utilities conflicts and other conditions which dictate the level of constructability required for each alternative
Difficult to construct rated as Purple whereas easiest to construct rated as Green
Environmental ImpactsCo-BenefitsPermitting
Impacts to the built and natural environment such as circulation noise and hazardous waste plus the level of effort required for permitting (eg interventions in water require highest level of permitting requirement) from each alternative in addition to the baseline project condition
Highest environmental impacts and highest level of effort required for permitting rated as Purple whereas the least impact and level of effort rated as Green
Operation and Maintenance (OampM)
Level of effort of additional manpower and cost of OampM for the alternatives over the baseline project OampM requirements
Highest level of effort and cost for OampM rated as Purple whereas the lowest is rated as Green
Reliability and Durability
Interventions that do not require human involvement or a facilityrsquos ability to withstand all the forces during a storm event (eg permanent solutions with higher reliability than deployable solution)
Interventions requiring human involvement (active measures) rated as Purple whereas interventions with minimal or no human involvement (passive measures) rated as Green
Risk Reduction Benefits Monetary benefits provided by each intervention alternative in avoided damages over the baseline condition
Lowest potential monetary benefit rated as Purple whereas as highest potential monetary benefit rated as Green
Quality of Life BenefitsVisual Aesthetics
Benefits either to the community such as recreation or safety or serve the community during emergency situations
Lowest potential quality of life benefits rated as Purple whereas as highest potential benefits rated as Green
Table 6 ndash Evaluation matrix for comparison of mitigation alternatives across the useful life of a project
Project title_______________________________________________________________________________
Evaluation Criteria
Baseline Condition (Designed to NYC Building Code and
Standards)
Resilient Design Alternatives for Managing__________________
Alternative 1
Alternative 2
Alternative 3
First Costs
ConstructabilityEase of ImplementationEnvironmental ImpactsCo-BenefitsPermitting
Operation and Maintenance (OampM)
Reliability and Durability
Risk Reduction Benefits
Quality of Life BenefitsVisual Aesthetics
NYC Mayorrsquos Office of Recovery and Resiliency Climate Resiliency Design Guidelines
32IIID BCA METHODOLOGY FOR PROJECTS UNDER $50 MILLION
Table 7 ndash Evaluation matrix for comparison of mitigation alternatives across the useful life of a project - COMPLETED EXAMPLE
Evaluation Criteria
Baseline Condition (Designed to NYC Building Code and
Standards)
Resilient Design Alternatives for Managing Coastal SurgeSLR
Alternative 1Flood proof building built on grade to Guidelines
DFE
Alternative 2 Elevate building structure above Guidelinesrsquo DFE
on columns
Alternative 3 Raise site grade by filing the building site footprint
to Guidelinesrsquo DFE
First CostsBaseline cost for building structure is $15 million
Incremental costs are within 5 over the baseline costs
Incremental costs are between 5-10 over baseline costs
Incremental costs are 20 and more over baseline costs
ConstructabilityEase of Implementation
Relatively easy to construct within site constraints
Similar to baseline conditions since construction requires additional flood proofing only
Moderate challenges to construct foundation structure for columns within site constraints
Extremely challenging to construct within the site constraints Potentially fatal flaw
Environmental ImpactsCo-BenefitsPermitting
No major impacts but may require additional effort to obtain DOB permits with flood proofing and deployable systems
No major impacts but may require additional effort to obtain DOB permits with flood proofing and deployable systems
No major impacts and relatively easy to permit
Potential drainage circulation impacts and challenges to obtain clean fill material for the site
Operation and Maintenance (OampM)
Major OampM costs associated with deployable systems
Major OampM costs associated with deployable systems
Moderate OampM costs associated with proposed elevator for access
Minimal OampM costs since deployable and elevators not required
Reliability and Durability
Least reliability with highest potential risk from flooding during to failure of deployable systems
Least reliability with highest potential risk from flooding during to failure of deployable systems
Moderate reliability with potential risk from flooding limited to elevator shaft only
Highest reliability since deployable are not required to protect building from flooding
Risk Reduction Benefits
Maximum flood risk reduction benefits assuming deployable and flood proofing is effective
Maximum flood risk reduction benefits assuming deployable and flood proofing is effective
Maximum flood risk reduction benefits
Maximum flood risk reduction benefits
Quality of Life BenefitsVisual Aesthetics
Facility may not be operational during the storm event
Facility may not be operational during the storm event
Facility can be potentially operational during the storm event
Facility can be potentially operational during the storm event
Qualitative Color Scale Green=Least resource intensive alternative Purple=most resource intensive yellow=medium level of resource intensity
A new non-critical facility with a building structure is proposed on a site that is currently in the 2015 Preliminary FEMA 1 annual chance floodplain with a BFE of 10rsquo (NAVD 88) The baseline conditions DFE to meet existing NYC codes and standards is 11rsquo (NAVD 88) Using the Guidelines recommended design criteria the facilityrsquos DFE is 133rsquo (NAVD 88) and existing grade is around 6rsquo (NAVD 88) The project design team develops three alternatives to meet the Guidelinesrsquo recommended DFE design for the facility Table 7 offers an example of how a qualitative assessment can be used to compare three resilient design alternatives using the evaluation criteria and metrics
CASE STUDY Example of How to Use the Evaluation Matrix
NYC Mayorrsquos Office of Recovery and Resiliency Climate Resiliency Design Guidelines
33IIIE BCA METHODOLOGY FOR PROJECTS OVER $50 MILLION
E BCA methodology for projects over $50 millionIn order for a project to be considered cost-effective a benefit-cost analysis (BCA) assesses if the benefits of a project outweigh its costs or in other words the benefit-cost ratio (BCR) is greater than 10 as illustrated in Equation 1
Equation 1 Benefit-Cost Ratio Formula
BCR =
Where BCR = Benefit-Cost Ratio
BENEFITS = Total project benefits
COSTS = Total project costs
BENEFITSCOSTS
These estimated project benefits are combined with the project costs which are defined as the differential construction and long-term operation and maintenance costs associated with constructing a proposed project to the Guidelinesrsquo recommended design level It is assumed that the baseline project will be designed to the most prevalent NYC codes and standards This benefit methodology should be used to determine the additional project benefit that the Guidelinesrsquo recommended design would provide over the baseline project benefit It is assumed that the project design team will develop alternatives to address each of the following applicable climate stressors - sea level risecoastal storm surge increased precipitation and extreme heat - separately For each alternative the project design team should use the following steps to determine the Benefit-Cost Ratio (BCR)
a) Determine project useful life for design interventions Determining the useful life of the proposed project is an important first step in the
detailed BCA assessment methodologies for two reasons First the project useful life determines what values must be used from the Guidelines to establish the future climate design conditions The various hazard tables in the Guidelines establish design requirements based on useful life ranges through 2039 2040-2069 2070-2099 and 2100+ (2100+ projections are only available for sea level rise) A review of these tables show that the design requirements needed to meet the projected climate hazards increase as the end of useful life range increases Second the useful life determines how long the project will need to be operated and maintained in order to remain technically sound and effective at reducing future damages and losses
b) Determine discount rate for project benefits calculation The cost-effectiveness of projects assessed using the BCR must be done on a net
present value basis meaning the present value of the benefits is compared to the present value of the costs Most project costs are computed for present value based on current cost estimates bids or cost guidance However project benefits - as well as project costs for operation and maintenance - accrue over time into the future and are computed on an annualized basis To address this issue the Present Value Coefficient (PVC) is used to bring these annualized project benefits and OampM costs into the present value As indicated by the formula in Equation 2 the PVC is a function of the Project Useful Life (PUL) and the Discount Rate (DR)
NYC Mayorrsquos Office of Recovery and Resiliency Climate Resiliency Design Guidelines
34
Equation 2 Present Value Coefficient (PVC) Formula
PVC =
Where PVC = Present Value Coefficient
PUL = BCA Project Useful Life based on project type
DR = Discount Rate
The project design team should coordinate with agencies and NYC OMB if needed to determine appropriate discount rates based on funding source project type and other factors This coordination should take place during project initiation phase where total project costs (design and construction) are over $50 million66
c) Develop input data to perform benefit calculations Tables 16 and 17 in Appendix 4 provide a list of typical input data by each climate
stressor needed to perform benefit analysis quantitatively on variety of facilities67 The project design team should use these tables as a reference to identify appropriate input data categories andor additional input data needed to perform benefit analysis on the project
d) Identify applicable project benefit categories to estimate benefits Tables 16 and 17 in Appendix 4 provide a list of typical project benefits by each climate
stressor needed to perform benefit analysis quantitatively on various types of projects The project design team should use these tables as a reference to identify appropriate project benefit categories for each climate stressor to perform benefit analysis on the project
e) Calculate benefits of recommended design interventions for each climate
stressor The input data and applicable project benefits can be assembled along with
incremental project cost data to analyze cost-effectiveness using the FEMA BCA Tool Damage-Frequency Assessment (DFA) module or similar software This analysis will provide a BCR for each alternative which can then be used to compare the alternatives that were developed to mitigate effects from applicable climate stressors The project design team can then use the results from this analysis to identify optimal interventions that provides a balanced solution that provides resiliency benefits within the available project budget
IIIE BCA METHODOLOGY FOR PROJECTS OVER $50 MILLION
[1 ndash (1 + DR) -(PUL)]DR
66 For example a NYC OMB March 2015 memorandum recommends using an annually updated DR as published each year in Appendix C of OMB Circular A-94 The current OMB-recommended discount rates from OMB A-94 Appendix C vary by project useful life and are as follows 21 DR for useful lives of 10 to 19 years 25 DR for useful lives of 20 to 29 years and 28 DR for useful lives of 30 years or greater By contrast FEMA hazard mitigation grants use a DR of 70 for all projects based on the Federal OMB A-94 rate for federally-funded mitigation measures Since these DRs will impact the PVC and the project benefits the project team must ensure that BCA results prepared using an OMB-recommended DR (21 to 28) be updated to reflect the Federal DR (70) when applying for FEMA mitigation grant funds
67 Note the data requirements for the sea level rise and increased precipitation hazards in Table 16 are more detailed than the requirements for the extreme heat hazards due to the less detailed level of analysis available for extreme heat
NYC Mayorrsquos Office of Recovery and Resiliency Climate Resiliency Design Guidelines
35
APPENDICES
NYC Mayorrsquos Office of Recovery and Resiliency Climate Resiliency Design Guidelines
36APPENDIX 1 ndash KEY TERMS
100-year flood (1 annual chance flood)
A flood that has a 1 probability of occurring in any given year The 100-year floodplain is the extent of the area of a flood that has a 1 chance of occurring or being exceeded in any given year
500-year flood (02 annual chance flood)
A flood that has a 02 probability of occurring in any given year The 500-year floodplain is the extent of the area of a flood that has a 02 chance of occurring or being exceeded in any given year
AdaptationAdjustment in natural or human systems to a new or changing environment that seeks to maximize beneficial opportunities or moderate negative effects Successful adaptations contribute to resiliency
Base flood elevation (BFE)The elevation of surface water resulting from a flood that has a 1 annual chance of occurring or being exceeded in any given year The BFE is shown on the Flood Insurance Rate Map (FIRM)69
BluebeltReference to the Department of Environmental Protectionrsquos (DEP) Bluebelt program to preserve natural drainage corridors including streams ponds and other wetland areas Preservation of these wetland systems allows them to perform their functions of conveying storing and filtering storm water
Climate
The average weather (or more rigorously a statistical description of the average in terms of the mean and variability) over a period of time usually 30 years These quantities are most often surface variables such as temperature precipitation and wind Climate in a wider sense is the state including a statistical description of the climate system70
Climate change
Changes in average weather conditions that persist over multiple decades or longer Climate change encompasses both increases and decreases in temperature as well as shifts in precipitation changing risk of certain types of severe weather events and changes to other variables of the climate system
Climate change riskThe chance that investments (such as in capital projects) can be affected by the physical impacts of climate change71 Risks are evaluated as a product of the probability of occurrence and the magnitude of damages or impacts including socioeconomic factors that would result if they did occur (consequences)
Climate change risk assessment
This assessment involves a detailed project-specific analysis that includes a vulnerability and risk assessment often followed by cost-benefit analysis to assess and select investments in climate change risk mitigation Risk is assessed as a function of the magnitude and probability of a given climate change hazard Examples resources are included in Appendix 7
Climate vulnerabilityThe degree to which systems and populations are affected by adverse impacts It is a function of the character magnitude and rate of climate change and variation to which a system is exposed its sensitivity and its adaptive capacity72
Cloudburst An extreme amount of rain in a short period of time often over a small geographic area73
Cooling Degree Day (CDD) A form of degree-day used to estimate the energy requirements for air conditioning or refrigeration when the daily mean temperature is above 65degF
68 All terms are from the US Global Change Research Program (USGCRP) glossary unless otherwise noted The USGCRP glossary is available at httpwwwglobalchangegovclimate-changeglossary
69 ldquoDefinitionsrdquo FEMA last modified March 1 2017 httpswwwfemagovnational-flood-insurance-programdefinitions70 UKCIP Glossary httpwwwukciporgukglossary71 ldquoAccount for Climate Riskrdquo International Finance Corporation 72 UKCIP Glossary httpwwwukciporgukglossary73 New York City Environmental Protection ldquoCloudburst Resiliency Planning Studyrdquo 2017 Available at httpwwwnycgovhtmldeppdfclimatenyc-cloudburst-studypdf
APPENDIX 1 - KEY TERMS68
NYC Mayorrsquos Office of Recovery and Resiliency Climate Resiliency Design Guidelines
37APPENDIX 1 ndash KEY TERMS
Design life The life expectancy of an asset or product as determined during design74 As opposed to useful life (see below)
Dry Bulb temperature The ambient air temperature measured by a thermometer
Extreme eventUnexpected unusual or unpredictable weather or flooding compared to historical or future projected distribution Extreme events include for example heat waves cold waves heavy rains periods of drought and flooding and severe storms
Facilities For the purposes of this document ldquofacilitiesrdquo refers to all types of buildings housing infrastructure structures and landscape features designed by or for the City of New York
Flexible adaptation pathwayResilience-building strategies that can evolve or be adapted over time as climate change risk assessments evaluations of adaptation strategies and monitoring continue75
Flood Insurance Rate Maps (FIRM)
Official flood map of a community on which FEMA has delineated the 1 annual chance floodplain and the base flood elevations (BFEs) applicable to the community76 The FIRM also includes the 02 floodplain annual chance floodplain and differentiates between special flood hazard areas (V A Coast A zones) and floodways The official FIRM is from the year 2007 while the 2015 PFIRM is currently required by NYC Building Code to calculate design flood elevations NYC DOB references the more restrictive of the two maps in both base flood elevation and flood hazard area (ie V versus A zone) Refer to Appendix 3 for more information
FreeboardAn additional amount of height above the base flood elevation used as a factor of safety (eg two feet above the base flood) in determining the level at which a facilitys lowest floor must be elevated or floodproofed to be in accordance with state or community floodplain management regulations77
Future time slices
Future periods defined by the NPCC for when climate change projections are available In this document the following decadal projections are associated with specific time spans2020s projection = present to 20392050s projection = 2040 to 20592080s projection = 2070 to 20992100s projection = end of century and beyond
Green infrastructureAn array of practices that use or mimic natural systems to manage urban stormwater runoff Water is either directed to engineered systems for infiltration or detained for longer periods before it enters the sewer system
Heat Vulnerability Index (HVI)Summarizes relative risk of adverse health effects from heat due to social and environmental factors Used to identify neighborhoods at higher risk during and after extreme heat events
Heat wave A period of three consecutive days where temperatures rise above 90degF or two consecutive days over 95 degrees78
New York City Panel on Climate Change (NPCC)
The body of leading climate and social scientists charged with making climate change projections for the metropolitan region79
74 Sustainable Infrastructure Management Program Learning Environment httpsimplewerforg 75 Rosenzweig C et al Climate Change Adaptation in New York City Building a Risk Management Response76 ldquoDefinitionsrdquo FEMA77 Ibid78 Horton R et al New York City Panel on Climate Change 2015 Report Chapter 1 Climate Observations and Projections Ann NY
Acad Sci ISSN 0077-8923 (New York 2015) 2579 For more information on the NPCC visit www1nycgovsiteorrchallengesnyc-panel-on-climate-changepage
NYC Mayorrsquos Office of Recovery and Resiliency Climate Resiliency Design Guidelines
38APPENDIX 1 ndash KEY TERMS
Open-grid pavement system
Pavements that consist of loose substrates supported by a grid of a more structurally sound grid or webbing Unbounded loose substrates in these systems transfer and store less heat than bound and compacted pavements and aid permeability Pavement is 50 pervious and contains vegetation in the open cells designed to allow percolation or infiltration of storm water through the surface into the soil below80
Preliminary Flood Insurance Rate Map (PFIRM)
Preliminary flood map developed by FEMA in 2015 for New York City that provides projected risks for flood hazards81 Refer to Appendix 3 for more information
Project useful life (PUL)
The period over which an asset or component is expected to be available for use by an entity This depends on regular and adequate maintenance This period of time typically exceeds the design life (see above) The combined effect of operational requirements and useful life is practical in assessing an investment in improving resilience82
Rain gardenAlso called ldquobioswalerdquo Planted areas designed to collect and manage stormwater that runs off streets sidewalks commercial and residential rooftops and other sources when it rains
Resiliency The ability to bounce back after change or adversity The capability of preparing for responding to and recovering from difficult conditions83
Sea level rise-adjusted design flood elevation
As defined in these Guidelines the increased height of the base flood elevation due to sea level rise plus freeboard depending on the criticality of the facility The sea level rise adjustment depends on the useful life of the facility
Storm surge An abnormal rise of water generated by a storm over and above predicted astronomical tides84
Substantial improvementAny repair reconstruction rehabilitation addition or improvement of a building or structure the cost which equals or exceeds 50 of the market value of the structure before the improvement or repairs started For more information see Appendix G of the NYC Building Code and 1 RCNY sect3606-0185
Tidal inundation Flooding which occurs at high tides due to climate-related sea level rise land subsidence andor the loss of natural barriers86
Urban Heat Island (UHI) effectThe tendency for higher air temperatures to persist in urban areas as a result of heat absorbed and emitted by buildings and asphalt tending to make cities warmer than the surrounding suburban and rural areas
Weather The state of the atmosphere at a given time with regard to temperature cloudiness precipitation wind and other meteorological conditions87
Wet Bulb temperatureThe temperature indicated when a thermometer bulb is covered with a water-saturated wick over which air is caused to flow at approximately 45 ms (900 ftmin) to reach the equilibrium temperature of water evaporating into the air when the heat of vaporization is supplied by the sensible heat of the air88
80 ldquoGlossaryrdquo US Green Building Council (2017) Available at httpwwwusgbcorgglossaryterm552581 ldquoPreliminary FEMA Map Productsrdquo FEMA Map Service Center Available at httpshazardsfemagovfemaportalprelimdownload82 ldquoGlossaryrdquo International Infrastructure Management Manual (2011) 83 A Stronger More Resilient New York (2013) 184 ldquoStorm Surge Overviewrdquo National Hurricane Center NOAA Available at httpswwwnhcnoaagovsurge85 ldquoFlood Resistant Constructionrdquo Appendix G New York City Building Code (2008) and 1 RCNY sect3606-01 available at httpswww1nycgovassetsbuildingsrules1_RCNY_3606-01pdf86 ldquoOcean Factsrdquo National Ocean Service NOAA Available at httpoceanservicenoaagovfactsnuisance-floodinghtml 87 UKCIP Glossary httpwwwukciporgukglossary88 ldquoASHRAE Terminologyrdquo ASHRAE Available at httpswwwashraeorgtechnical-resourcesauthoring-toolsterminology
NYC Mayorrsquos Office of Recovery and Resiliency Climate Resiliency Design Guidelines
39APPENDIX 2 - CLIMATE CHANGE PROJECTIONS
Climate change projections are provided by the New York City Panel on Climate Change (NPCC) The full NPCC report is available from the New York Academy of Sciences89 Tables 8-10 (below) were reproduced directly from the NPCC report while Table 2 (see Section IIA) was developed using the data underlying the NPCC report to inform the design of HVAC systems under warmer conditions
Table 8 ndash NYC sea level rise projections90
Baseline (2000-2004) 0 in
Low estimate (10th percentile)
Middle range (25th to 75th percentile)
High estimate (90th percentile)
2020s 2 in 4-8 in 10 in
2050s 8 in 11-21 in 30 in
2080s 13 in 18-39 in 58 in
2100 15 in 22-50 in 75 in
Note Projections are based on six-component approach that incorporates both local and global factors The model-based components are from 24 global climate models and two representative concentration pathways Projections are relative to the 2000-2004 base period
Table 9 ndash Mean annual changes91
a Temperature Baseline(1971-2000) 54degF
Low estimate (10th percentile)
Middle range (25th to 75th percentile)
High estimate (90th percentile)
2020s + 15degF +20-29degF +32degF
2050s +31degF +41-57degF +66degF
2080s +38degF +53-88degF +103degF
2100 +42degF +58-104degF +121F
b Precipitation Baseline(1971-2000) 501 in
Low estimate (10th percentile)
Middle range (25th to 75th percentile)
High estimate (90th percentile)
2020s -1 percent +1-8 +10
2050s +1 percent +4-11 +13
2080s +2 percent +5-13 +19
2100 -6 percent -1 to +19 +25
Note Based on 35 global climate models (GCMs) and two RCPs Baseline data cover the 1971ndash2000 base period and are from the NOAA National Climatic Data Center (NCDC) Shown are the low estimate (10th percentile) middle range (25th percentile to 75th percentile) and high estimate (90th percentile) These estimates are based on a ranking (from most to least) of the 70 (35 GCMs times 2 RCPs) projections The 90th percentile is defined as the value that 90 percent of the outcomes (or 63 of the 70 values) are the same or lower than Like all projections the NPCC climate change projections have uncertainty embedded within them Sources of uncertainty include data and modeling constraints the random nature of some parts of the climate system and limited understanding of some physical processes The NPCC characterizes levels of uncertainty using state-of-the-art climate models multiple scenarios of future greenhouse gas concentrations and recent peer-reviewed literature Even so the projections are not true probabilities and the potential for error should be acknowledged
89 The NPCC 2015 report is available at httponlinelibrarywileycomdoi101111nyas20151336issue-1issuetoc90 From New York City Panel on Climate Change 2015 Report Chapter 1 Climate Observations and Projections page 4191 From New York City Panel on Climate Change 2015 Report Chapter 1 Climate Observations and Projections page 30
APPENDIX 2 - CLIMATE CHANGE PROJECTIONS
NYC Mayorrsquos Office of Recovery and Resiliency Climate Resiliency Design Guidelines
40APPENDIX 2 - CLIMATE CHANGE PROJECTIONS
Table 10 ndash Extreme events92
2020s Baseline (1971-2000)
Low estimate(10th percentile)
Middle range(25th to 75th percentile)
High estimate (90th percentile)
Numbers of heat waves per year 2 3 3-4 4
Average heat wave duration (days) 4 5 5 5
Number of days per year with
Maximum temperature at or above 90degF 18 24 26-31 33
Maximum temperature at or above 100degF 04 07 1-2 2
Minimum temperature at or below 32degF 71 50 52-58 60
Rainfall at or above 1 inch 13 13 14-15 16
Rainfall at or above 2 inches 3 3 3-4 5
Rainfall at or above 4 inches 03 02 03ndash04 05
2050s Baseline (1971-2000)
Low estimate(10th percentile)
Middle range(25th to 75th percentile)
High estimate (90th percentile)
Numbers of heat waves per year 2 4 5-7 7
Average heat wave duration (days) 4 5 5-6 6
Number of days per year with
Maximum temperature at or above 90degF 18 32 39-52 57
Maximum temperature at or above 100degF 04 2 3-5 7
Minimum temperature at or below 32degF 71 37 42-48 52
Rainfall at or above 1 inch 13 13 14-16 17
Rainfall at or above 2 inches 3 3 4-4 5
Rainfall at or above 4 inches 03 03 03-04 05
2080s Baseline (1971-2000)
Low estimate(10th percentile)
Middle range(25th to 75th percentile)
High estimate (90th percentile)
Numbers of heat waves per year 2 5 6-9 9
Average heat wave duration (days) 4 5 5-7 8
Number of days per year with
Maximum temperature at or above 90degF 18 38 44-76 87
Maximum temperature at or above 100degF 04 2 4-14 20
Minimum temperature at or below 32degF 71 25 30-42 49
Rainfall at or above 1 inch 13 14 15-17 18
Rainfall at or above 2 inches 3 3 4-5 5
Rainfall at or above 4 inches 03 02 03-05 07
Note Projections for temperature and precipitation are based on 35 GCMs and 2 RCPs Baseline data are for the 1971 to 2000 base period and are from the NOAA National Climatic Data Center (NCDC) Shown are the low estimate (10th percentile) middle range (25th to 75th percentile) and high estimate (90th percentile) 30-year mean values from model-based outcomes Decimal places are shown for values less than one although this does not indicate higher precisioncertainty Heat waves are defined as three or more consecutive days with maximum temperatures at or above 90degF Like all projections the NPCC climate change projections have uncertainty embedded within them Sources of uncertainty include data and modeling constraints the random nature of some parts of the climate system and limited understanding of some physical processes The NPCC characterizes levels of uncertainty using state-of-the-art climate models multiple scenarios of future greenhouse gas concentrations and recent peer-reviewed literature Even so the projections are not true probabilities and the potential for error should be acknowledged
92 From New York City Panel on Climate Change 2015 Report Chapter 1 Climate Observations and Projections page 31
NYC Mayorrsquos Office of Recovery and Resiliency Climate Resiliency Design Guidelines
41APPENDIX 3 - DIFFERENTIATION OF FLOOD MAPS
These Guidelines reference several different kinds of flood maps and sources of design flood elevations These maps are described and differentiated below
Table 11 - Differentiation of flood maps used in NYC
Reference Title Data Source Information Provided Referenced By Link
2007 FIRM FEMA
Based on historical data from before 1983 identifies the current base flood (extent and elevation) as the flood that has a 1 chance of occurring in any given year also known as a 100-year flood The NYC Building Code requires that either the 2007 FIRM or 2015 PFIRM elevation be used whichever is higher
2014 NYC Building Code Appendix G
Climate Resiliency Design Guidelines
httpsmscfemagovportal
2015 PFIRM FEMA
Based on historical data identifies the current base flood (extents and elevation) as the flood that has a 1 chance of occurring in any given year also known as a 100-year flood The NYC Building Code requires that either the 2007 FIRM or 2015 PFIRM elevation be used whichever is higher The 2015 PFIRM is currently being reassessed by FEMA
2014 NYC Building Code Appendix G
Climate Resiliency Design Guidelines
httpshazardsfemagovfemaportalprelimdownload
httpwwwregion2coastalcomview-flood-maps-dataview-preliminary-flood-map-data
NYC Flood Hazard Mapper
NYC Department of City Planning
Maps current and future flood hazards in NYC including the following data layers 2007 FIRM and 2015 PFIRM high tide with sea level rise and PFIRM with sea level rise through 2100
Climate Resiliency Design Guidelines
Waterfront Revitalization Plan
httpwww1nycgovsiteplanningdata-mapsflood-hazard-mapperpage
ldquoTable 4 ndash Determine the sea level rise-adjusted design flood elevation for critical and non-critical facilitiesrdquo
ORR amp NPCC
Provides data to use when adding sea level rise to a given 2015 PFIRM or 2007 FIRM Base Flood Elevation (BFE) to calculate a Design Flood Elevation (DFE) Based on the criticality and expected useful life of a facility
Climate Resiliency Design Guidelines
See Section II on ldquoSea Level Riserdquo above
APPENDIX 3 - DIFFERENTIATION OF FLOOD MAPS
NYC Mayorrsquos Office of Recovery and Resiliency Climate Resiliency Design Guidelines
42APPENDIX 4 - PROJECT BENEFITS CATEGORIES
This appendix provides guidance on how to identify and assess benefits as a supplement to Sections IIID and IIIE
Table 12 lists typical direct benefits for reducing impacts from climate stressors and basic guidance for how to estimate them See Section IIID for more information
Table 13 lists typical indirect benefits for reducing impacts from climate stressors and basic guidance for how to estimate them See Section IIID for more information
Table 12 ndash Direct benefits for (1) sea level rise with coastal storm surge and (2) increased precipitation measures
Direct Benefit Basic Guidance for Estimating Values
Physical Damages (Structure Contents)
bull For flood-damaged buildings use depth damage functions developed by FEMA and USACE for structures and contents
bull Use depth damage functions in conjunction with Building Replacement Values (BRVs) and not market values BRVs typically range between $100 to $325SF for residential buildings and $120 to $450SF for commercial public buildings
bull For more complex structures or facilities use engineering estimates of flood damages or review historic flood damages documented from insurance claims repair records or FEMA Public Assistance claims from recent flood disasters
Residential Displacements
bull For flood-damaged buildings use depth damage functions developed by FEMA and USACE for residential displacements
Reduced Life CycleOperation and Maintenance (OampM) Costs93
bull Applicable only to projects that reduce overall life cycle costs or net annual OampM costs from baseline conditions
bull Input reduced annual OampM costs as a project benefit at a 1-year recurrence intervalbull Reduced overall life cycle costs can be input as a longer project useful life
Table 13 ndash Indirect benefits for (1) sea level rise with coastal storm surge and (2) increased precipitation measures
Indirect Benefit Basic Guidance for Estimating Values
Non-Residential Building Service Losses
bull Estimate service loss values and durations for non-residential buildings public buildings critical facilities and parksnatural features based on FEMA BCA guidance and standard values based on building use
Utility Service Losses94
bull Estimate utility service losses for water wastewater and electrical facilities based on the number of impacted customers FEMA per capita standard values for utility service ($105personday for potable water $49personday for wastewater $148personday for electrical)95
bull Estimate utility service loss durations based on engineering estimates or review historic flood damages losses documented from utility company records
bull This benefit can also apply to measures that increase energy efficiency
RoadBridge Service Losses
bull Estimate roadbridge service losses based on the average daily traffic (ADT) detour time and additional travel distance and FEMA and GSA standard values for road service ($3344vehiclehour of delay $0545mile)96
bull Estimate roadbridge service loss durations or review historic flood damages losses
Emergency Service Losses
bull Applicable only to projects that reduce or eliminate documented emergency service costs from baseline conditions
bull Examples of avoided emergency services costs include NYPD staffing to monitor barricades for flooded roads or NFDY staffing for water rescues of residents from flooded buildings or streets
APPENDIX 4 - PROJECT BENEFITS CATEGORIES
93 Reduced life cycle costs may be applicable to some measures that provide extreme heat benefits such as green roofs that can last longer than a standard roof if properly maintained
94 Reduced utility service costs may be applicable to some measures that provide extreme heat benefits such as cool roofs green roofs and shade trees
95 FEMA per capita standard values taken from FEMA BCA Toolkit Version 530 (Build Date 12222016) and developed in FEMArsquos Baseline Standard Economic Value Methodology Report (July 28 2016) Consider updating FEMA standard per capita values to reflect current New York City utility rates
96 Consider updating FEMA and GSA standard values to reflect current New York City area labor rates and fuel costs
NYC Mayorrsquos Office of Recovery and Resiliency Climate Resiliency Design Guidelines
43APPENDIX 4 - PROJECT BENEFITS CATEGORIES
Table 14 ndash Other potential benefits for (1) sea level rise with coastal storm surge and (2) increased precipitation measures
Other Benefit Basic Guidance for Estimating Values
Avoided Stress and Anxiety
bull Applicable only for projects that directly benefit occupants of residential structuresbull Use FEMA standard value for avoided mental stress and anxiety treatment costs of $2443person to
estimate benefit for all impacted residents97
Avoided Lost Productivity
bull Applicable only for projects that directly benefit occupants of residential structuresbull Use FEMA standard value for avoided lost worker productivity costs of $8736household to estimate
benefit for all impacted workers (conservatively assuming one worker per household)
Environmental Open Space
bull Applicable only for projects that create or acquire open space areas by acquisitionbull Use FEMA standard value for environmental open space based on the type of land acquired ($8308
Acreyear for Green open space $39545Acreyear for Riparian $6010Acreyear for Wetlands $554Acreyear for Forests $1799Year for Marine and estuary)97
CSO Volume Reduction
bull Applicable only for projects that provide Combined Sewer Overflow (CSO) abatement by reducing the volume of rainfall runoff
bull Use CSO abatement cost of $0015gallonsyear applied to increased precipitation hazard runoff volume for 5-year design storm98
Ecosystem Service99
bull Add stormwater management benefits of green infrastructure projects to increased precipitation hazards where avoided damages and service losses are not quantified
bull Unit benefits applicable to increased precipitation hazard includeo Green roofs $0133SFyear (PUL 40 years)o BioswaleRain GardenMeadow Mix $0020SFyear (PUL 30 years)o Permeable Grass Pavers $0020SFyear (PUL 30 years)o Tree Plantings $303Treeyear (PUL 30 years)o Planter Box Trees $101Treeyear (PUL 15 years)
Real Estate99
bull Potential real estate benefits from increased resilience of residential andor commercial propertiesstreetscapesneighborhoods included within the project scope
bull Benefit applied to extreme heat hazard for green infrastructure projects directly impacting residential or commercial properties
Quality of Life Health Benefits99
bull Potential quality of life benefits related to improved public health from the resilience measures included within the project scope
bull Benefit applied to extreme heat hazard for green infrastructure projects directly impacting residential or commercial properties
Table 14 lists other typical benefits for reducing impacts from climate stressors and basic guidance for how to estimate them See Section IIID for more information
97 FEMA standard values for avoided mental stress and anxiety and environmental open space values taken from FEMA BCA Toolkit Version 530 (Build Date 12222016)
98 CSO abatement cost taken from APG1 Report for NYC ldquoTechnical Approaches for Benefit-Cost Analysis of Hazard Mitigation Projects in Urban and Coastal Environmentsrdquo (April 2016)
99 Ecosystem Services Real Estate and Quality of LifeHealth benefits tend to be more applicable to green infrastructure measures that provide extreme heat benefits such as green roofs trees and other plantings
NYC Mayorrsquos Office of Recovery and Resiliency Climate Resiliency Design Guidelines
44APPENDIX 4 - PROJECT BENEFITS CATEGORIES
Table 15 ndash Potential benefits for extreme heat (Urban Heat Island) reduction measures
Category Benefit Basic Guidance for Estimating Values
Direct Benefit
Reduced Life Cycle Cost
bull Applicable only to measures such as green roofs that are expected to last longer than standard roofs
bull Compute total cost savings including annual OampM costs
Indirect Benefit
Energy Savings
bull Applicable to measures that reduce energy costs by providing cooling through increased shading andor evapotranspiration
bull Use New York Power Authority rates of $0148kWh for electricity and $0810Therm for natural gas
Other Potential Benefits
Air Quality bull Applicable to measures that absorb pollutants andor reduce carbon dioxide emissions
Acoustics bull Applicable to measures such as green roof or walls that reduce noise transfer
Quality of LifeHealth bull Potential quality of life benefits and related to improved public health
Real Estate bull Applicable to measures that provide residential real estate benefits from increased resilience of propertiesstreetscapesneighborhoods
Retail Sales Marketing
bull Applicable to measures that provide commercial property benefits from increased aesthetics resulting in increased marketing and sales for streetscapesneighborhoods
Tax Credits Incentives
bull Applicable to resilience or green infrastructure measures such as green roofs that have accompanying Federal State or City tax credits or other incentives
Table 15 lists potential benefits for reducing impacts from heat and basic guidance for how to estimate them See Section IIID for more information
NYC Mayorrsquos Office of Recovery and Resiliency Climate Resiliency Design Guidelines
45APPENDIX 4 - PROJECT BENEFITS CATEGORIES
Table 16 ndash Guidance on quantitative calculations for (1) sea level rise with coastal storm surge and (2) increased precipitation measures
Data Input General Guidance ndash Basic Description
Applicable Benefit Category
Applicable Typical Facility Typology
Dire
ct B
enefi
ts
Indi
rect
Ben
efits
Oth
er P
oten
tial
Ben
efits
Bui
ldin
g St
ruct
ures
Com
plex
Fa
cilit
ies
Tran
spor
tatio
nSt
reet
scap
es
Plaz
as
Park
Fea
ture
s
First Floor Elevation (FFE)
bull The elevation of the first finished floor of the structure excluding basements
bull FFE measured from top of lowest floor (riverinenon-coastal high hazard areas) or bottom of lowest horizontal structural member (coastal high hazard areas)
Y Y Y Y
Building Replacement Value (BRV)
bull The unit cost to rebuild a structure of the same quality of construction
bull Not the same as market value
Y Y Y Y
Building Size
bull The total floor area of the building in square feet
bull Total Building Value = BRV x Building Sizebull Typical BRVs for NYC range between $100 to
$325SF for residential buildings and $120 to $450SF for commercialpublic buildings
Y Y Y Y
Structure Description
bull The type of building number of stories and foundation type (full basement partial basement no basement)
bull Collect more detailed foundation data for coastal flood zones
Y Y Y Y
Building Use bull Details related to residential housing commercial business and public use
Y Y Y Y Y
Building Type bull The primary use of building ndash residential commercial public and others
Y Y Y Y Y
Depth Damage Function (DDF)
bull Curves used to estimate structure damage contents damage and displacement of residential buildings based on flood depth
bull DDFs selection based on Structure Description Building Type Building Use
bull Structure DDFs based on percentage of Total Building Value
bull Contents DDFs based on percentage of Total Contents Value
bull Displacement DDFs based on number of displacement days x Displacement Cost
Y Y Y Y Y
Contents Value
bull The cost to replace structure contents (furnishings equipment)
bull Residential building Contents Values typically 50 BRV (FEMA DDFs) or 100 BRV (USACE DDFs)
bull Non-residential building Contents Values between 18 to over 100 depending on building use (USACE DDFs)
bull Total Contents Value = BRV x Building Size
Y Y Y Y Y
Table 16 provides general guidance on how to quantitatively calculate benefits from efforts to address from climate stressors See Section IIIE for more information
NYC Mayorrsquos Office of Recovery and Resiliency Climate Resiliency Design Guidelines
46APPENDIX 4 - PROJECT BENEFITS CATEGORIES
Table 16 ndash Guidance on quantitative calculations for (1) sea level rise with coastal storm surge and (2) increased precipitation measures
Data Input General Guidance ndash Basic Description
Applicable Benefit Category
Applicable Typical Facility Typology
Dire
ct B
enefi
ts
Indi
rect
Ben
efits
Oth
er P
oten
tial
Ben
efits
Bui
ldin
g St
ruct
ures
Com
plex
Fa
cilit
ies
Tran
spor
tatio
nSt
reet
scap
es
Plaz
as
Park
Fea
ture
s
Number of Residents (Residential)
bull Total number of occupants in a residential building
bull Typically estimated based on number of residential units x average number of individuals per household (based on current US Census data or use 25 individuals per household as a default)
Y Y Y Y Y
Displacement Cost (Residential)
bull The unit cost to lodge and feed displaced residents while flood damage is repaired
bull Average unit displacement cost of $415residential unitday recommended based on current FY2018 GSA Per Diem rates for New York City
Y Y Y Y Y
Value of Service (Non-Residential and Public)
bull The unit cost of service disruption and rental of temporary facilities while flood damage is repaired
bull Disruption costs for non-residential buildings typically range from $095 to $136SFmonth and rental costs range from $020 to $136SFmonth depending on building use
bull Value of service for public buildings ($day) is typically based on the annual operating budget for the City agency using the building prorated based on building size or population served by the building then divided by 365 daysyear
Y Y Y Y
Value of Service (Critical Facilities)
bull The unit cost of critical facilities (police fire emergency medical services) lost or delayed while flood damage is repaired
Y Y Y
Value of Service Duration
bull The duration of service disruption and rental of temporary facilities for non-residential buildings and critical facilities while flood damage is repaired
bull For non-residential buildingso Value of Service Durations vary from
4 months to over 30 months based on building use and the depth of flooding
o Total Value of Service Loss = (Disruption Cost x Building Area) = (Rental Cost x Building Area x Value of Service Duration)
bull For public buildings and critical facilitieso Value of Service Durations vary from 0
days to 720 months based on building use and the depth of flooding from FEMA FIA or USACE DDFs
o Total Value of Service Loss = (Value of Service) x (Service Loss Duration)
Y Y Y
NYC Mayorrsquos Office of Recovery and Resiliency Climate Resiliency Design Guidelines
47APPENDIX 4 - PROJECT BENEFITS CATEGORIES
Table 16 ndash Guidance on quantitative calculations for (1) sea level rise with coastal storm surge and (2) increased precipitation measures
Data Input General Guidance ndash Basic Description
Applicable Benefit Category
Applicable Typical Facility Typology
Dire
ct B
enefi
ts
Indi
rect
Ben
efits
Oth
er P
oten
tial
Ben
efits
Bui
ldin
g St
ruct
ures
Com
plex
Fa
cilit
ies
Tran
spor
tatio
nSt
reet
scap
es
Plaz
as
Park
Fea
ture
s
Engineering Estimates for Damages
bull Engineered estimate models of physical damages and service losses at the project site based on the Guidelines event recurrence interval(s) and flood depth(s)
Y Y Y Y Y Y
Historic Damages and Service Losses
bull Historic physical damages and service losses at the project site documented from previous flood events
bull Do not use routine maintenancebull The historic damage event recurrence interval
(RIs) andor flood depths must be determined updated for inflation to the present value and adjusted to match the Guidelines event RIsflood depths
Y Y Y Y Y Y
Facility Replacement Value
bull The unit cost to rebuild the facility
Impacted Area bull The geographic area impacted by the facility in the event of failure in acres
Y Y Y Y
Facility Capacity
bull The design capacity of the facilitybull For example - facility capacity expressed in
millions of gallons per day (MGD) for water and wastewater facilities or megawatts (MW) for electrical facilities
Y Y Y Y
Service Population
bull The number of impacted residents served by the facility
bull Typically estimated based on number of impacted residential customers x average number of individuals per household (based on current US Census data or use 25 individuals per household as a default)
bull Facilities serving mostly non-residentialpublic buildings andor critical facilities should focus on service losses rather than service population
Y Y Y
NYC Mayorrsquos Office of Recovery and Resiliency Climate Resiliency Design Guidelines
48APPENDIX 4 - PROJECT BENEFITS CATEGORIES
Table 16 ndash Guidance on quantitative calculations for (1) sea level rise with coastal storm surge and (2) increased precipitation measures
Data Input General Guidance ndash Basic Description
Applicable Benefit Category
Applicable Typical Facility Typology
Dire
ct B
enefi
ts
Indi
rect
Ben
efits
Oth
er P
oten
tial
Ben
efits
Bui
ldin
g St
ruct
ures
Com
plex
Fa
cilit
ies
Tran
spor
tatio
nSt
reet
scap
es
Plaz
as
Park
Fea
ture
s
Value of Service
bull Unit value of service provided by the facilitybull Example of FEMA standard values for complete
loss of utility service $105personday for potable water$49personday for wastewater$148personday for electrical
bull Consider updating FEMA standard per capita values to reflect current The New York City utility rates
Y Y
Roadway Elevations bull Roadway Elevations
Y Y
Roadway Replacement Value
bull Roadway Replacement ValueY Y
Inundation Area Map
bull Inundation Area Map developed by FEMA or through modeling by project design team
Y Y Y
Building Inventory of Inundation Area
bull The number and type of buildings within the streetscape and neighborhood inundated by the Guidelinersquos flood events
Y Y Y
Average Daily Traffic (ADT)
bull The average number of one-way traffic trips per day along the roadway(s) within the streetscapeneighborhood inundated by the Guidelinersquos flood events
Y Y
Additional Travel Time
bull The additional travel time needed to detour around a flooded roadway expressed in minutes
bull In the unlikely event there is no detour available use a 12-hour travel time per one-way trap but provide a detailed area street map as supporting documentation
Y Y
Value of Traffic Delay
bull The value of service associated with lost time in traffic
bull For example - FEMA standard average value of $3344vehiclehour of delay
bull Consider updating FEMA and GSA standard values to reflect current New York City area labor rates and fuel costs
Y Y
NYC Mayorrsquos Office of Recovery and Resiliency Climate Resiliency Design Guidelines
49APPENDIX 4 - PROJECT BENEFITS CATEGORIES
Table 17 ndash Guidance on quantitative unit benefit calculations for extreme heat hazard measures
Measure General Guidance ndash Unit Benefit Information and Data Requirements
Applicable Benefit Category
Applicable Typical Facility Typology
Dire
ct B
enefi
ts
Indi
rect
Ben
efits
Oth
er P
oten
tial
Ben
efits
Bui
ldin
g St
ruct
ures
Com
plex
Fa
cilit
ies
Tran
spor
tatio
nSt
reet
scap
es
Plaz
as
Park
Fea
ture
s
Green Roof
bull Unit benefit range over PUL = $470SF to $373SF of green roof area ($719SF standard value)
bull Assumed PUL = 40 yearsbull Apply standard value unit benefit to green
roof area to estimate measure benefitbull Higher range values more applicable
to residential and commercial building streetscape projects
Y Y Y Y Y Y
Bioswale Rain Garden Meadow Mix
bull Unit benefit range over PUL = $396SF to $211SF of area ($730SF standard value)
bull Assumed PUL = 30 yearsbull Apply standard value unit benefit to bioswale
rain gardenmeadow mix area to estimate total measure benefit
Y Y Y Y Y Y
Cool Roof
bull Unit benefit range over PUL = $117 to $3151SF of material area ($144SF standard value)
bull Assumed PUL = 20 yearsbull Apply standard value unit benefit to cool roof
area to estimate total measure benefitbull Higher range values more applicable to
residential building streetscape projects
Y Y Y Y Y
Light-Colored PaversLight-Colored Materials
bull Unit benefit range over PUL = $0774 to $204SF of material area ($0866SF standard value)
bull Assumed PUL = 30 yearsbull Apply standard value unit benefit to material
area to estimate total measure benefit
Y Y Y Y
Table 17 provides general guidance on how to quantitatively calculate benefits from efforts to address climate stressors See Section IIIE for more information
NYC Mayorrsquos Office of Recovery and Resiliency Climate Resiliency Design Guidelines
50APPENDIX 4 - PROJECT BENEFITS CATEGORIES
Table 17 ndash Guidance on quantitative unit benefit calculations for extreme heat hazard measures
Measure General Guidance ndash Unit Benefit Information and Data Requirements
Applicable Benefit Category
Applicable Typical Facility Typology
Dire
ct B
enefi
ts
Indi
rect
Ben
efits
Oth
er P
oten
tial
Ben
efits
Bui
ldin
g St
ruct
ures
Com
plex
Fa
cilit
ies
Tran
spor
tatio
nSt
reet
scap
es
Plaz
as
Park
Fea
ture
s
Tree Planting
bull Unit benefit range over PUL = $1005 to $77154Tree ($1855Tree standard value)
bull Assumed PUL = 30 yearsbull Apply standard value unit benefit to number of
trees to estimate total measure benefitbull Higher range values more applicable
to residential and commercial building streetscape projects
Y Y Y Y Y Y
Planter Box Tree
bull Unit benefit range over PUL = $212 to 16304Tree ($392Tree standard value)
bull Assumed PUL = 15 yearsbull Apply standard value unit benefit to number of
trees to estimate total measure benefitbull Higher range values more applicable
to residential and commercial building streetscape projects
Y Y Y Y Y
Shade Canopy
bull Unit benefit range over PUL = $0363 to $396SF ($0458SF standard value)
bull Assumed PUL = 15 yearsbull Apply standard value unit benefit to area of
shade canopy estimate total measure benefitbull Higher range values more applicable
to residential and commercial building streetscape projects
Y Y Y Y
Permeable Grass Pavers
bull Unit benefit range over PUL = $0258SF to $0521SF of pavers ($0363SF standard value)
bull Assumed PUL = 30 yearsbull Apply standard value unit benefit to paver
area to estimate total measure benefit
Y Y Y Y Y
For the purposes of the BCA refer to the following facility typologies bull ldquoBuilding Structuresrdquo include critical small building sites such as EMS or FDNY stations and non-critical small building sites such as
libraries or comfort stationsbull ldquoComplex Facilitiesrdquo include critical infrastructure such as wastewater treatment sites pump stations water filtration plants and similar
large or complex facilitiesbull ldquoTransportationStreetscapePlazasrdquo include roadway reconstruction streetscape improvements street raising plazas and other
transportation-related infrastructurebull ldquoPark Featuresrdquo include parks and similar public recreational facility with natural landscape features
NYC Mayorrsquos Office of Recovery and Resiliency Climate Resiliency Design Guidelines
51APPENDIX 5 - EXAMPLE PLANNING DECISION TREE
This decision tree provides a summarized example approach for how to implement these Guidelines Projects with a total cost greater than $50 million are recommended to conduct a full qualitative and quantitative climate change risk assessment and BCA while projects below $50 million are recommended to conduct a qualitative risk assessment and BCA
Define Project
1) Operational goals and criticality level2) Useful life3) Location in the current flood plain future floodplain and or zone
of tidal inundation and the project arearsquos score on the heat vulnerability index
Evaluate Project Risks According to Probability and Magnitude of Consequence
bull Extreme Heat bull Precipitationbull Sea Level Risebull Coastal Surge
High Level Identification and Assessment of Risk Mitigation Alternatives and Co-benefits
(qualitative)
Detailed Identification and Assessment of Risk Mitigation Alternatives and Co-benefits (qualitative and quantitative)
High Level Estimate of Costs and Benefits of Design Alternatives
(qualitative)
Detailed Estimate of Costs and Benefits of Design Alternatives
(qualitative and quantitative)
Decision Point Which climate change risks require mitigation
Decision Point Evaluate risk mitigation benefits and costs to
determine final resilient design alternative or if no action is required
Decision Point Is the total project cost above $50 million
Below $50 million Above $50 million
APPENDIX 5 - EXAMPLE PLANNING DECISION TREE
NYC Mayorrsquos Office of Recovery and Resiliency Climate Resiliency Design Guidelines
52
Project Title
Design Strategies Checklist (not exhaustive)
Extreme Heat Comments Extreme Precipitation Comments Sea Level Rise amp Storm Surge Comments
Select Site in Low Heat Vulnerability Index area Select High Elevation Site Select High Elevation Site
Minimize East-West Building Orientation Green Roof Raise Building Floor Elevation
Passive Solar Cooling and Ventilation Systems
Protect Below Grade Areas from Flooding Waterproof Building Envelope
Cool Roof (SRI appropriate) On-site Stormwater Management (gray) Elevate Critical Building Functions
Green Roof (extensive) Reduce Impervious Areas Elevate Critical Equipment
Vegetative Structures Permeable Pavement Perimeter Floodwall100 Levee (passive or active)
Enhanced HVAC System including space layout optimization and system scalability
Increase Green Spaces and Planted Areas DryWet Floodproofing
More Efficient Building Envelope Other Utility Redundancy Design101
Parking Lot Shading Resilient Materials amp Landscape Treatments
Light Colored Pavements (appropriate SRI) Design for Storm Surge Outflow
Increase Planted Areas Install Backwater Flow Prevention
Permeable Surfaces Design for Scour
Open-grid Pavement Raise Road Elevation
Other Other
This appendix provides a template for identifying possible design strategies to address climate change risks as described throughout the Guidelines
APPENDIX 6 - DESIGN STRATEGIES CHECKLIST
100 Permanent perimeter flood walls are not permitted to meet floodproofing requirements in buildings with substantial improvements andor damages 101 Utility redundancy design should be pursued for critical systems not all building systems
APPENDIX 6 - DESIGN STRATEGIES CHECKLIST
NYC Mayorrsquos Office of Recovery and Resiliency Climate Resiliency Design Guidelines
53APPENDIX 7 - CLIMATE CHANGE RISK ASSESSMENT RESOURCES
These Guidelines provide data on climate change hazards and recommend how that data can inform resilient design A risk assessment is a tool to help project managers and designers evaluate risk levels as well as select and prioritize resilient design strategies A high level risk assessment is recommended for all City capital projects with a total cost of under $50 million Projects above $50 million are recommended to conduct an in-depth assessment
Risk assessments use quantified estimates of the probability and magnitude of consequence of an event occurring to prioritize responses ldquoProbabilityrdquo is an assessment of the likelihood of a hazard occurring while ldquomagnituderdquo describes the hazardrsquos potential impact Risk assessment tools such as the examples listed below can be used to define and score these categories Projects that score higher across both probability and magnitude can be prioritized for investment and risk mitigation action Projects that score lower across both criteria may require no action beyond meeting code The results are typically charted on a risk matrix and an example is provided on the next page
The climate change risk management frameworks below offer templates for how to integrate climate change projections into a risk assessment process Refer to these resources for examples and further information
bull Vulnerability Assessment and Adaptation Framework is prepared by the Federal Highway Administration (FHWA) While developed for transportation planning this risk assessment framework has broad applicability for evaluating asset vulnerability to climate change Available at httpswwwfhwadotgovenvironmentsustainabilityresilienceadaptation_framework
bull US Climate Resilience Toolkit The US Global Change Research Program offers a step by step risk assessment
framework including tools and case studies at httpstoolkitclimategovsteps (see example on next page)
bull Coast Adapt Guidance on undertaking a risk assessment High level assessment httpscoastadaptcomausitesdefaultfilesfactsheetsT3M4_2_2nd_pass_risk_assessmentpdfDetailed assessment httpscoastadaptcomausitesdefaultfilesfactsheetsT3M4_3_3rd_pass_risk_assessmentpdf
bull Climate adaptation Risk uncertainty and decision-makingDownload the report here httpswwwukciporgukpublicationsRisk
The City plans to develop a NYC-specific process for integrating climate change data into existing risk management processes by April 2019
APPENDIX 7 - CLIMATE CHANGE RISK ASSESSMENT RESOURCES
NYC Mayorrsquos Office of Recovery and Resiliency Climate Resiliency Design Guidelines
54APPENDIX 7 - CLIMATE CHANGE RISK ASSESSMENT RESOURCES
The Risk Characterization Matrix below is an example from the US Climate Resilience Toolkit This tool can be used to assess the probability and magnitude of impact for identified risks The risk of coincident climate stressorsrisks (such as storm surge plus increased precipitation) can also be assessed as applicable
Figure 14 - Example of a climate change risk matrix (adapted from US Climate Resilience Toolkit)
Project teams can determine the magnitude of the impact (along the horizontal scale of 1 through 3 with 3 being the most severe) and the probabilitylikelihood of occurrence for each specific risk (along the vertical scale with 3 being the most likely) A score is typically assigned for each risk (Probabil-ity x Magnitude) and then charted on the matrix Based on the estimated probability and magnitude of consequence above the risks are ranked and prioritized for mitigation Factors to bear in mind include
bull Not all facility typologies have the same level of functional and operational importance during events or tolerance for disruption
bull Not all climate stressors and risks have the same level of impact on each project sitebull Not all identified risks can or should be mitigated fully
NYC Mayorrsquos Office of Recovery and Resiliency Climate Resiliency Design Guidelines
55WORKS CITED
A Stronger More Resilient New York PlaNYC Report of the NYC Special Initiative for Rebuilding and Resiliency The City of New York 2013
ldquoAccount for Climate Riskrdquo International Finance Corporation accessed March 27 2017 httpwwwifcorgwpswcmconnectTopics_Ext_ContentIFC_External_Corporate_SiteClimate+Business
PrioritiesAccount+for+Climate+Risk
American Society of Heating Refrigeration and Air-Conditioning Engineers (ASHRAE) Handbook -Fundamentals 2017
ldquoBaseline Standard Economic Value Methodology Reportrdquo Federal Emergency Management Agency July 2016
Benefit Cost Analysis Toolkit Software Version 530 Federal Emergency Management Agency (build date December 2016)
Criteria for Detention Facility Design New York City Department of Environmental Protection November 2012
Community Resilience Planning Guide for Buildings and Infrastructure Systems Vol 1 NIST Special Publication 1190 US Department of Commerce 2016
Cool and Green Roofing Manual NYC Department of Design and Construction 2007 httpwwwnycgovhtmlddcdownloadspdfcool_green_roof_manpdf
Building Resiliency Task Force US Urban Green Building Council New York 2013 httpurbangreencouncilforcecomBuildingResiliency
Design and Planning for Flood Resiliency Guidelines for NYC Parks New York City Department of Parks and Recreation 2017
httpswwwnycgovparksorgplanning-and-buildingplanningresiliency-plansflood-resiliency
Flooded Bus Barns and Buckled Rails Federal Transit Administration Office of Budget and Policy 2011 httpswwwhsdlorgabstractampdid=685187
Floodproofing Non-Residential Buildings FEMA P936 FEMA 2013 httpswwwfemagovmedia-library-data9a50c534fc5895799321dcdd4b6083e7P-936_8-20-13_508rpdf
ldquoGlossaryrdquo International Infrastructure Management Manual National Asset Management Support Group New Zealand 2011 httpwwwipweaorg
ldquoGreen Roof Metrics Draft Reportrdquo New York City Department of Parks and Recreation 2017
ldquoGuide to Rain Event Preparednessrdquo NYC Department of Environmental Protection httpwwwnycgovhtmldeppdfbrochuresflood-preparedness-flyerpdf
ldquoGuidelines and Discount Rates for Benefit-Cost Analysis of Federal Programsrdquo Appendix C Circular A-94 US Office of Management and Budget (OMB) 2017
ldquoGuidelines for the Design and Construction of Stormwater Management Systemsrdquo New York City Department of Environmental Protection July 2012
Horton R et al New York City Panel on Climate Change 2015 Report Ann NY Acad Sci ISSN 0077-892 New York 2015
Madrigano J et al ldquoA case-only study of vulnerability to heat wavendashrelated mortality in New York City (2000ndash2011)rdquo Environmental Health Perspectives 123672ndash678 2013
WORKS CITED
NYC Mayorrsquos Office of Recovery and Resiliency Climate Resiliency Design Guidelines
56WORKS CITED
enspMcGregor et al Two Degrees The Built Environment and Our Changing Climate Routledge Press 2013
NYC Green Codes Task Force US Green Building Council New York 2010 httpurbangreencouncilorgGreenCodes
NYCrsquos Risk Landscape A Guide to Hazard Mitigation NYC Emergency Management 2014
One New York The Plan for a Strong and Just City The City of New York 2015 httpwwwnycgovhtmlonenyc downloadspdfpublicationsOneNYCpdf
Ready to Respond Strategies for Multifamily Building Resilience Enterprise Green Communities 2015 httpswwwenterprisecommunityorgresources
Rosenzweig C et al Climate Change Adaptation in New York City Building a Risk Management Response New York City Panel on Climate Change 2010
httponlinelibrarywileycomdoi101111nyas20101196issue-1 issuetoc
ldquoSustainable Infrastructure Management Program Learning Environmentrdquo Water Environment Research Foundation accessed March 24 2017 httpsimplewerforg
Urban Waterfront Adaptive Strategies NYC Department of City Planning 2013 httpwww1nycgovsiteplanningplanssustainable-communitiesclimate-resiliencepagetab=1
Wastewater Resiliency Plan Climate Risk Assessment and Adaptation Study New York City Department of Environmental Protection October 2013
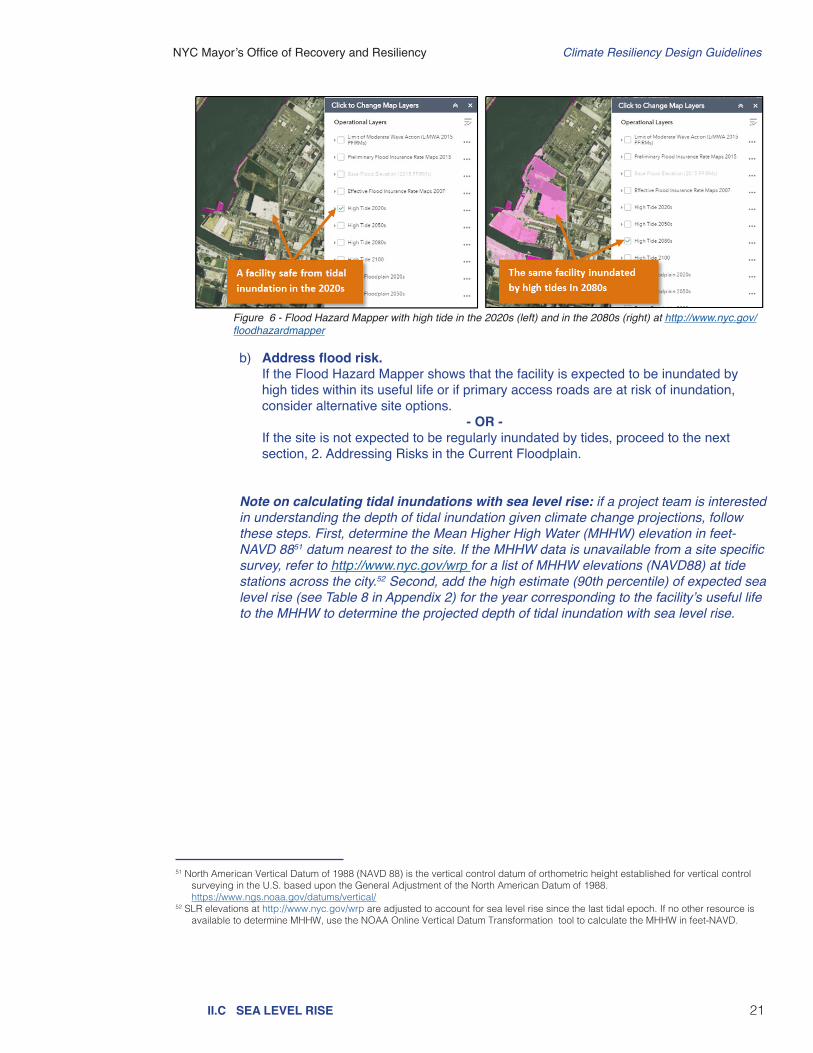
NYC Mayorrsquos Office of Recovery and Resiliency Climate Resiliency Design Guidelines
21IIC SEA LEVEL RISE
b) Address flood risk If the Flood Hazard Mapper shows that the facility is expected to be inundated by
high tides within its useful life or if primary access roads are at risk of inundation consider alternative site options
- OR - If the site is not expected to be regularly inundated by tides proceed to the next
section 2 Addressing Risks in the Current Floodplain
Note on calculating tidal inundations with sea level rise if a project team is interested in understanding the depth of tidal inundation given climate change projections follow these steps First determine the Mean Higher High Water (MHHW) elevation in feet-NAVD 8851 datum nearest to the site If the MHHW data is unavailable from a site specific survey refer to httpwwwnycgovwrp for a list of MHHW elevations (NAVD88) at tide stations across the city52 Second add the high estimate (90th percentile) of expected sea level rise (see Table 8 in Appendix 2) for the year corresponding to the facilityrsquos useful life to the MHHW to determine the projected depth of tidal inundation with sea level rise
51 North American Vertical Datum of 1988 (NAVD 88) is the vertical control datum of orthometric height established for vertical control surveying in the US based upon the General Adjustment of the North American Datum of 1988
httpswwwngsnoaagovdatumsvertical52 SLR elevations at httpwwwnycgovwrp are adjusted to account for sea level rise since the last tidal epoch If no other resource is
available to determine MHHW use the NOAA Online Vertical Datum Transformation tool to calculate the MHHW in feet-NAVD
Figure 6 - Flood Hazard Mapper with high tide in the 2020s (left) and in the 2080s (right) at httpwwwnycgovfloodhazardmapper
NYC Mayorrsquos Office of Recovery and Resiliency Climate Resiliency Design Guidelines
22IIC SEA LEVEL RISE
2 Addressing risks in the current floodplain53
A facility located in the current 1 annual chance floodplain (PFIRM 2015)54 will face increasing risk of flooding during its useful life due to sea level rise increasing the depth of coastal storms This section provides a process for adjusting the design flood elevation required by code to account for sea level rise
a) Find the location of the facility using the Flood Hazard Mapper (httpwwwnycgovfloodhazardmapper) and follow the instructions in Figure 7
bull Choose to view the layer ldquoFEMA Preliminary FIRM 2015rdquo bull Click on the facility site in the 1 floodplain to view the base flood elevation
Figure 7 - Flood Hazard Mapper with FEMA PFIRM (2015) at wwwnycgovfloodhazardmapper
b) If the facility is not in the current 1 annual chance floodplain (PFIRM 2015) proceed to the next section ldquo3 Addressing risks in the future floodplainrdquo
- OR - If the facility is in the current 1 annual chance floodplain (PFIRM 2015) note
the base flood elevation (BFE) and proceed to Step c) below Please note if a facility has multiple BFEs or if the site is partially in the 1 annual chance floodplain it is recommended to use the highest BFE as the current BFE for the entire site
c) Establish a sea level rise-adjusted DFE Use the current base flood elevation at your site the facilityrsquos useful life and its
criticality level to determine the design flood elevation using Table 4 (on the next page) as a basis of design
53 This process for adjusting the design flood elevation to account for sea level rise satisfies the criteria of the climate-informed science approach described at the state and federal level
54 FEMA updates its flood maps periodically As of April 2018 the most recent maps are the Preliminary Flood Insurance Rate Maps (PFIRM) available at DCPrsquos Flood Hazard Mapper (httpwwwnycgovfloodhazardmapper) Also note that NYC Building Code requires developers to use the PFIRM (2015) or the FIRM (2007) whichever is more restrictive For more information on these requirements please refer to Appendix G of the NYC Building Code Please note that the DCP maps are not official and all site locations should be confirmed with the official FEMA PFIRM NYC will provide information on the latest flood maps as they are updated
NYC Mayorrsquos Office of Recovery and Resiliency Climate Resiliency Design Guidelines
23IIC SEA LEVEL RISE
Table 4 - Determine the sea level rise-adjusted design flood elevation for critical and non-critical facilities55
Critical facilities
End of useful life Base Flood Elevation (BFE)56 in NAVD 88 + Freeboard57 + Sea Level Rise
Adjustment58= Design Flood Elevation (DFE) in
NAVD 88Through 2039 FEMA 1 (PFIRM) 24rdquo 6rdquo = FEMA 1 + 30rdquo
2040-2069 FEMA 1 (PFIRM) 24rdquo 16rdquo = FEMA 1 + 40rdquo2070-2099 FEMA 1 (PFIRM) 24rdquo 28rdquo = FEMA 1 + 52rdquo
2100+ FEMA 1 (PFIRM) 24rdquo 36rdquo = FEMA 1 + 60rdquoNon-critical facilities
End of useful life Base Flood Elevation (BFE) in NAVD 88 + Freeboard + Sea Level Rise
Adjustment = Design Flood Elevation (DFE) in
NAVD 88Through 2039 FEMA 1 (PFIRM) 12rdquo 6rdquo = FEMA 1 + 18rdquo
2040-2069 FEMA 1 (PFIRM) 12rdquo 16rdquo = FEMA 1 + 28rdquo2070-2099 FEMA 1 (PFIRM) 12rdquo 28rdquo = FEMA 1 + 40rdquo
2100+ FEMA 1 (PFIRM) 12rdquo 36rdquo = FEMA 1 + 48rdquoAdditional analysis should be conducted to incorporate wave action and wave run-up in DFE calculations especially in areas that are located within the FEMArsquos 1 annual chance Limit of Moderate Wave Action (LiMWA) zone Wave run up is the maximum vertical extent of wave uprush above surge
Definition of critical buildings and infrastructure for determining DFE in Table 4The criticality definitions below are for use in the application of the Guidelines only All items identified as critical in NYC Building Code Appendix G are critical in these guidelines however this list includes additional facilities that are not listed in Appendix G59 If a facility is not listed here it is considered non-critical for the purposes of determining freeboard
bull Hospitals and health care facilitiesbull Fire rescue ambulance and police stations and emergency vehicle garages bull Jails correctional facilities and detention facilities bull Facilities used in emergency response including emergency shelters emergency preparedness communication
operation centers communication towers electrical substations back-up generators fuel or water storage tanks power generating stations and other public utility facilities
bull Critical aviation facilities such as control towers air traffic control centers and hangars for aircraft used in emergency response
bull Major food distribution centers (with an annual expected volume of greater than 170000000 pounds)60 bull Buildings and other structures that manufacture process handle store dispose or use toxic or explosive
substances where the quantity of the material exceeds a threshold quantity established by the authority having jurisdiction and is sufficient to pose a threat to the public if released61
bull Infrastructure in transportation telecommunications or power networks including bridges tunnels (vehicular and rail) traffic signals (and other right of way elements including street lights and utilities) power transmission facilities substations circuit breaker houses city gate stations arterial roadways telecommunications central offices switching facilities etc
bull Ventilation buildings and fan plantsbull Operations centersbull Pumping stations (sanitary and stormwater)bull Train and transit maintenance yards and shopsbull Wastewater treatment plantsbull Water supply infrastructurebull Combined-sewer overflow (CSO) retention tanksbull Fueling stationsbull Waste transfer stations and bull Facilities where residents have limited mobility or ability including care facilities and nursing homes
55 If an industry standard does not include freeboard in its flood protection standards for particular infrastructure assets then only consider the sea level rise adjustment when determining flood protection levels
56 Note that NYC Building Code requires developers to use the PFIRM (2015) or the FIRM (2007) whichever is more restrictive For more information on these requirements please refer to Appendix G of the NYC Building Code
57 These freeboard values reflect NYC Building Code Appendix G Table 2-1 which establishes the minimum elevation of the top of lowest floor Appendix G requires other freeboard values for other parts of structures and in different parts of the floodplain Refer to Appendix G for the appropriate freeboard and use that value in Table 4 above
58 The sea level rise figures provided are for the middle of the 25th-75th percentile range projections from the NPCC These values do not necessarily indicate the average of all models
59 The structural occupancy categories outlined in Appendix G of the NYC Building Code are the same as ASCE 7 used for structural design For critical buildings structural design should comply with ASCE 7 and 24 for design class IV
60 This threshold represents the median volume of main food distributors in NYC according to statistics collected as part of the Five Borough Food Flow study in 2016 available at
httpswwwnycedccomsystemfilesfilesresource2016_food_supply-resiliency_study_resultspdf 61 The threshold quantity for hazardous materials is established by Chapter 7 of Title 24 of the NYC Administrative Code
NYC Mayorrsquos Office of Recovery and Resiliency Climate Resiliency Design Guidelines
24IIC SEA LEVEL RISE
Figure 9 ndash Outdoor emergency generator for the critical building
This case study provides an example of how to calculate a sea level rise-adjusted DFE based on the useful life of a hypothetical critical services building and its primary component
Step 1 Organize the site by various critical or primary components and their year of construction Determine their useful life along with the associated future year scenario for flood risk assessment In this example the building structure and the outside emergency generator are the most at-risk components from combined sea level rise and coastal storm surge
Step 2 Overlay the site footprint area over the effective current PFIRM or FIRM and the corresponding future year scenario FEMA 1 to identify flood risk to the site From overlaying the 2015 preliminary FEMA floodplain over the site it was determined that the site has a 1 annual chance of flooding with a base flood elevation of 13rsquo NAVD Step 3 Evaluate the criticality of each primary component of the facility based on the Guidelinesrsquo definition for critical infrastructure (Table 4) This (hypothetical) building is critical
Step 4 Use Table 4 to determine the sea level rise adjustment and freeboard requirements for each component and calculate the DFE for each that corresponds to its useful life period
Step 5 Compare the DFE of each component and the associated Guidelinesrsquo recommended DFE to calculate anticipated flood depth
CASE STUDY Adjusting the DFE for Sea Level Rise
Table 5 ndash Example of how to calculate a sea level rise-adjusted DFE for a critical facility
Construction year Components Useful
Life
Future Year Scenario
[Useful Life + Const
Year]
BFE in NAVD
88 (feet)
Freeboard + Sea
Level Rise Adjustment
(feet)
Adjusted DFE in
NAVD 88 (feet)
2010 Building Structure
70 years 2070-2099 130rsquo 2rsquo+23rsquo 173rsquo
2010Outdoor
Emergency Generator
25 years
Through 2039 130rsquo 2rsquo+05rsquo 155rsquo
Figure 8 - Example of how to locate a facility within the current floodplain and determine the BFE Figure 9 (inset) - Outdoor emergency generator at the facility
Figure 10 - This schematic shows how to determine the design flood elevation of a facility within the current 1 floodplain
Illustrative not to scale
NYC Mayorrsquos Office of Recovery and Resiliency Climate Resiliency Design Guidelines
25IIC SEA LEVEL RISE
Figure 11 - Flood Hazard Mapper with future 1 annual chance floodplain (adjusted for sea level rise) at httpwwwnycgovfloodhazardmapper
b) If the site is not in the future floodplain no flood protection is required for this facility
- OR - If the site is in the future floodplain identify the nearest adjacent base flood
elevation at the project site in the current 1 annual chance floodplain (PFIRM 2015) using the Flood Hazard Mapper62
c) Use Table 4 to determine the DFE Add freeboard and the sea level rise-adjustment to the nearest adjacent BFE on the
current 1 annual chance floodplain (PFIRM 2015) to determine the DFE
d) Apply the DFE calculation from Table 4 to the protected facility See Figures 12 and 13 for an illustration of how to calculate the DFE
62 Maps of future floodplains show the impacts of sea level rise alone and do not consider how changes in stormsrsquo climatology might also affect wave action and the full extent of the floodplain
3 Addressing risks in the future floodplainIf the facility is not in the current 1 annual chance floodplain (PFIRM 2015) it may still be at risk in the future from flooding as sea level rise increases the extent of the floodplain Follow the steps below to determine if your facility is located in the future floodplain and if so what sea level rise-adjusted DFE to use
a) Use the Flood Hazard Mapper (httpwwwnycgovfloodhazardmapper) to determine if the facility site will be in the future 1 annual chance floodplain
Assess if by the end of the facilityrsquos useful life the floodplain is projected to increase to encompass all or part of the project site For example if the useful life ends between 2040 and 2069 choose the 2050s floodplain map Refer to the steps in Figure 11 below
NYC Mayorrsquos Office of Recovery and Resiliency Climate Resiliency Design Guidelines
26IIC SEA LEVEL RISE
Figure 12 - This schematic map shows how to locate the nearest adjacent 1 floodplain elevation
Figure 13 -This schematic shows how to determine the design flood elevation of a facility that is outside of the current 1 floodplain
CASE STUDY Identifying a Base Flood Elevation (BFE) in the Future Floodplain
Illustrative not to scale
NYC Mayorrsquos Office of Recovery and Resiliency Climate Resiliency Design Guidelines
27IIC SEA LEVEL RISE
4 Identify appropriate design interventions
63 Additional resources for identifying adaptive strategies Urban Waterfront Adaptive Strategies (NYC Department of City Planning httpswww1nycgovassetsplanningdownloadpdfplans-studiessustainable-communitiesclimate-resilienceurban_waterfrontpdf Floodproofing Non-Residential Buildings (FEMA) at httpswwwfemagovmedia-libraryassetsdocuments34270 Ready to Respond Strategies for Multifamily Building Resilience (Enterprise Green Community) at
httpwwwenterprisecommunityorgresourcesready-respond-strategies-multifamily-building-resilience-1335664 While natural systems-based approaches ameliorate flooding their use for storm surge or wave mitigation would need to be quantified
before contributing towards the design flood elevation 65 For more information see FEMArsquos Floodproofing Non-Residential Buildings at httpswwwfemagovmedia-libraryassetsdocuments34270
Operational requirements and continuity plans can inform the selection of appropriate design interventions particularly in terms of how quickly a site needs to be up and running after a flood event Some examples of how functional uses can pair with interventions include
bull A facility that needs to be operating during or immediately after a flood event may need to be dry floodproofed using permanent barriers or designed for passive survivability (such as a police or fire station)
bull A facility that needs to recover quickly after an event could elevate prioritized equipment and have deployable barriers
bull A site that can recover over a longer duration of time could be temporarily inundated during an event (such as parks or plazas) The use of resilient materials and strategies can reduce costly damage caused by temporary inundation
Different design interventions should be chosen based on the specific operational requirements of the project however these must meet the ASCE 24 design requirements for Coastal VE Zones
For all projects at risk of current or future flooding select protections that meet the projectrsquos design flood elevation Consider project-specific factors including the site location operational requirements existing continuity planning and cost63 A Design Strategies Checklist in Appendix 6 is available for use as a resource to track possible design approaches Some examples of design alternatives are
bull Site relocation where feasible conduct alternative site analysis
bull Permanent barriers at a site (eg floodwalls)
bull Deployable flood barriers (eg stop logs flood doorsgates inflatable barriers)
bull Natural systems-based approaches (eg living shorelines restored wetlands)64
bull Prioritized protection of electrical mechanical and other critical or costly-to-replace equipment above the design flood elevation (eg motors and controller boilers and furnaces fuel storage tanks duct work alarm systems and suppression equipment electrical panels electrical distribution and switching areas gas and electric meters telecommunications equipment chemical feed equipment HVAC units and emergency generators)65
bull Dry floodproofing design a facility to prevent water from entering
bull Wet floodproofing design a facility to permit floodwaters to flow in and out of the structure without causing significant damage (eg elevate or protect critical equipment use water-resistant building materials below the design flood elevation include flood vents and pumps)
bull Design redundant telecommunications conduit entrances for multiple carrier entry Telecom conduit should run to diverse manholes when possible
bull Install backup power for telecom equipment with design consideration for such equipment (eg installation above DFE)
bull Install outdoor-rated disconnect switch for telecommunications equipment on the roofbull Explore interventions to protect underground utilities and other telecommunications
facilities from water damagebull Install backflow preventers backwater valves and sump pumps for all buildings and
infrastructure in the floodplain as well as behind flood barriersbull Shoreline improvements that reduce the height of waves or attenuate waves where
feasible
NYC Mayorrsquos Office of Recovery and Resiliency Climate Resiliency Design Guidelines
28IIIA GENERAL METHODOLOGY TO ESTIMATE PROJECT BENEFITSIIIB CATEGORIES OF PROJECT BENEFITS
Designing and constructing facilities to handle the future climate loads above the current NYC codes and standards based on projected useful life of the components provides resiliency benefits The incremental costs to implement the Guidelinesrsquo recommended design interventions should be compared with the incremental benefits to aid agencies in making decisions about resilient design strategies The project design team should evaluate benefits of the interventions designed to meet Guidelinesrsquo recommended criteria for all the climate stressors qualitatively andor quantitatively For projects with construction costs below $50 million the project design team is recommended to perform a qualitative benefits assessment on the interventions that meet the Guidelinesrsquo recommendations for all applicable climate stressors For critical facilities or projects with construction costs over $50 million the project design team is recommended to perform quantitative benefit calculations to identify the optimal interventions that meet Guidelinesrsquo recommended design criteria
A GENERAL METHODOLOGY TO ESTIMATE PROJECT BENEFITSThis general methodology to perform qualitative and quantitative benefit calculations is recommended for use by project design teams at the beginning of and during the design process This methodology enables estimation of project benefits for a high-level benefit-cost analysis (BCA) that can be applied to evaluate and compare resiliency features designed to address sea level rise with coastal storm surge increased precipitation and extreme heat events The type of benefits provided by interventions designed to meet the Guidelinesrsquo design criteria can vary by climate stressors and typology of the facilities The main guiding principle in development of the high-level BCA methodologies included in these Guidelines was to balance simplicity with accuracy The project benefits categories identified within the methodology may not cover all the potential benefits provided by every facility type within NYC In particular the benefits of planning for increased precipitation are difficult to quantify Hence the project design team should use their discretion to modify this general benefit calculation methodology as needed to meet their project goals and objectives The project design team should develop appropriate input data whether quantitative or qualitative needed to estimate project benefits
B CATEGORIES OF PROJECT BENEFITSThere are three types of project benefit categories - direct benefits indirect benefits and other benefits - that can be used to perform qualitative assessments and develop quantitative estimates of monetary benefits for intervention alternatives designed to meet the Guidelinesrsquo recommendations These project benefit categories will help to perform a high-level benefit-cost analysis that balances accuracy with an appropriate level of effort
bull Direct Benefits include reduced or avoided physical damages to facilities and contents reduced or avoided displacements for residential structures and reduced life cycle or OampM costs that can be quantified as a primary result of implementing a specific hazard mitigation measure Table 12 in Appendix 4 provides a list of direct benefits and basic guidance on estimating and documenting values for sea level rise and increased precipitation-related flood hazards Note that given the current state of practice it is not possible to quantify reduced or avoided physical damages or residential displacements that result from a specific extreme heat mitigation measures Therefore direct benefits applicable to extreme heat hazards are limited to reduced life cycle costs applicable to certain measures such as green roofs Refer to Table 15 for details on direct benefits for extreme heat hazards
III EVALUATION OF PROJECT BENEFITS
NYC Mayorrsquos Office of Recovery and Resiliency Climate Resiliency Design Guidelines
29IIIB CATEGORIES OF PROJECT BENEFITS
bull Indirect Benefits include reduced or avoided service losses for non-residential
buildings public facilities andor infrastructure (utilities roads and bridges) based on the value of service continuity andor emergency services to New Yorkers that can be quantified as a secondary result of implementing a specific hazard mitigation measure Table 13 in Appendix 4 provides a list of indirect benefits and basic guidance on estimating and documenting values for sea level rise and increased precipitation-related flood hazards Note that given the current state of practice on extreme heat it is not possible to quantify reduced or avoided service losses that result from a specific extreme heat mitigation measures Therefore indirect benefits applicable to extreme heat hazards are limited to reduced energy costs such as cool roofs green roofs or shade trees Refer to Table 15 in Appendix 4 for details on indirect benefits for extreme heat hazards
bull Other Benefits where applicable other potential benefits may include social benefits for residents such as avoided stress and anxiety avoided lost productivity environmentalecosystem service benefits avoided need for emergency services and other potential benefits that can be estimated as a result of implementing a specific hazard mitigation measure Table 14 in Appendix 4 provides a list of other potential benefits and basic guidance on estimating and documenting values for sea level rise and increased precipitation-related flood hazards
Note on the ecosystem service benefit category in Table 14 the stormwater management benefits of green infrastructure should be distributed between the extreme heat and increased precipitation hazards since these measures provide both significant reductions in rainfall runoff as well as Urban Heat Island mitigation through evapotranspiration However there is currently limited data available to quantify the actual distribution of stormwater management benefits between the two hazards For various dual-benefit providing interventions careful considerations should be given to identify the appropriate benefits category provided by the intervention with a goal to avoid duplication of quantified benefits In this methodology the stormwater management benefits of green infrastructure are applied to the increased precipitation hazard in order to avoid a duplication of benefits Note on real estate and quality of life benefits additionally it is important to note that two potential benefit categories shown in Table 14 - real estate and quality of lifehealthavoided casualties - were not included in the current BCA methodology for sea level rise or increased precipitation hazards Although these categories could increase project benefits for sea level rise and increased precipitation hazards they were only applied to measures that address extreme heat hazards such as green roofs trees and other plantings Refer to Table 15 for a detailed summary of other benefit categories quantified as unit benefits for extreme heat hazards
NYC Mayorrsquos Office of Recovery and Resiliency Climate Resiliency Design Guidelines
30IIIC WHICH METHODOLOGY TO USEIIID BCA METHODOLOGY FOR PROJECTS UNDER $50 MILLION
D BCA methodology for projects under $50 millionThe project design team should develop design alternatives to meet the Guidelinesrsquo criteria which may be in excess of NYC code and standards requirements (baseline conditions) It is assumed that the project design team will develop alternatives to address each of the following applicable climate stressors - sea level risecoastal storm surge increased precipitation and extreme heat - separately Tables 12-15 in Appendix 4 provides a list of typical direct indirect and other benefits provided by various intervention typologies to reduce impacts from climate stressors During the qualitative assessment the project design team should consider that intervention strategies will have varying levels of reliability effectiveness benefits and cost implications during the qualitative assessment
The project design team is recommended to develop appropriate evaluation criteria and metrics for each of the applicable project benefit categories For each alternative the project design team could use either a scoring weighting ranking or other type of qualitative assessment framework to assess each applicable project benefit categories with the developed evaluation criteria and metrics Table 6 provides an example template to evaluate alternatives using a set of general evaluation criteria and metrics using a color-coded rating system (and see Table 7 for an example of how to complete the template) The project design team can utilize a similar template customized to their project goals and objectives This assessment allows agencies to screen the qualitative benefits for various alternatives that would then lead to development of final project components to match the available budget and goals of the project
Projects with total costs below $50 million recommended to conduct a qualitative assessment to identify the optimal interventions that meet Guidelinesrsquo design criteria using the ldquoD) BCA methodology for projects under $50 millionrdquo methodology below
C WHICH METHODOLOGY TO USEProjects with a total cost above $50 million or are highly complex or critical facilities recommended to conduct both a qualitative and quantitative benefit calculation to identify the optimal interventions that meet Guidelinersquos design criteria using the ldquoE) BCA methodology for projects above $50 millionrdquo below A quantitative BCA also must include qualitative factors
NYC Mayorrsquos Office of Recovery and Resiliency Climate Resiliency Design Guidelines
31IIID BCA METHODOLOGY FOR PROJECTS UNDER $50 MILLION
Qualitative Color Scale Green=Least resource intensive alternative Purple=most resource intensive yellow=medium level of resource intensity
Qualitative Evaluation Factors Description Relative Color Rating System
First CostsAdditional construction costs needed to incorporate Guidelinesrsquo recommended resilient design over the baseline project costs
Highest cost ($$$) rated as Purple whereas lowest cost ($) rated as Green
ConstructabilityEase of Implementation
Construction techniques and site conditions such as presence of major utilities conflicts and other conditions which dictate the level of constructability required for each alternative
Difficult to construct rated as Purple whereas easiest to construct rated as Green
Environmental ImpactsCo-BenefitsPermitting
Impacts to the built and natural environment such as circulation noise and hazardous waste plus the level of effort required for permitting (eg interventions in water require highest level of permitting requirement) from each alternative in addition to the baseline project condition
Highest environmental impacts and highest level of effort required for permitting rated as Purple whereas the least impact and level of effort rated as Green
Operation and Maintenance (OampM)
Level of effort of additional manpower and cost of OampM for the alternatives over the baseline project OampM requirements
Highest level of effort and cost for OampM rated as Purple whereas the lowest is rated as Green
Reliability and Durability
Interventions that do not require human involvement or a facilityrsquos ability to withstand all the forces during a storm event (eg permanent solutions with higher reliability than deployable solution)
Interventions requiring human involvement (active measures) rated as Purple whereas interventions with minimal or no human involvement (passive measures) rated as Green
Risk Reduction Benefits Monetary benefits provided by each intervention alternative in avoided damages over the baseline condition
Lowest potential monetary benefit rated as Purple whereas as highest potential monetary benefit rated as Green
Quality of Life BenefitsVisual Aesthetics
Benefits either to the community such as recreation or safety or serve the community during emergency situations
Lowest potential quality of life benefits rated as Purple whereas as highest potential benefits rated as Green
Table 6 ndash Evaluation matrix for comparison of mitigation alternatives across the useful life of a project
Project title_______________________________________________________________________________
Evaluation Criteria
Baseline Condition (Designed to NYC Building Code and
Standards)
Resilient Design Alternatives for Managing__________________
Alternative 1
Alternative 2
Alternative 3
First Costs
ConstructabilityEase of ImplementationEnvironmental ImpactsCo-BenefitsPermitting
Operation and Maintenance (OampM)
Reliability and Durability
Risk Reduction Benefits
Quality of Life BenefitsVisual Aesthetics
NYC Mayorrsquos Office of Recovery and Resiliency Climate Resiliency Design Guidelines
32IIID BCA METHODOLOGY FOR PROJECTS UNDER $50 MILLION
Table 7 ndash Evaluation matrix for comparison of mitigation alternatives across the useful life of a project - COMPLETED EXAMPLE
Evaluation Criteria
Baseline Condition (Designed to NYC Building Code and
Standards)
Resilient Design Alternatives for Managing Coastal SurgeSLR
Alternative 1Flood proof building built on grade to Guidelines
DFE
Alternative 2 Elevate building structure above Guidelinesrsquo DFE
on columns
Alternative 3 Raise site grade by filing the building site footprint
to Guidelinesrsquo DFE
First CostsBaseline cost for building structure is $15 million
Incremental costs are within 5 over the baseline costs
Incremental costs are between 5-10 over baseline costs
Incremental costs are 20 and more over baseline costs
ConstructabilityEase of Implementation
Relatively easy to construct within site constraints
Similar to baseline conditions since construction requires additional flood proofing only
Moderate challenges to construct foundation structure for columns within site constraints
Extremely challenging to construct within the site constraints Potentially fatal flaw
Environmental ImpactsCo-BenefitsPermitting
No major impacts but may require additional effort to obtain DOB permits with flood proofing and deployable systems
No major impacts but may require additional effort to obtain DOB permits with flood proofing and deployable systems
No major impacts and relatively easy to permit
Potential drainage circulation impacts and challenges to obtain clean fill material for the site
Operation and Maintenance (OampM)
Major OampM costs associated with deployable systems
Major OampM costs associated with deployable systems
Moderate OampM costs associated with proposed elevator for access
Minimal OampM costs since deployable and elevators not required
Reliability and Durability
Least reliability with highest potential risk from flooding during to failure of deployable systems
Least reliability with highest potential risk from flooding during to failure of deployable systems
Moderate reliability with potential risk from flooding limited to elevator shaft only
Highest reliability since deployable are not required to protect building from flooding
Risk Reduction Benefits
Maximum flood risk reduction benefits assuming deployable and flood proofing is effective
Maximum flood risk reduction benefits assuming deployable and flood proofing is effective
Maximum flood risk reduction benefits
Maximum flood risk reduction benefits
Quality of Life BenefitsVisual Aesthetics
Facility may not be operational during the storm event
Facility may not be operational during the storm event
Facility can be potentially operational during the storm event
Facility can be potentially operational during the storm event
Qualitative Color Scale Green=Least resource intensive alternative Purple=most resource intensive yellow=medium level of resource intensity
A new non-critical facility with a building structure is proposed on a site that is currently in the 2015 Preliminary FEMA 1 annual chance floodplain with a BFE of 10rsquo (NAVD 88) The baseline conditions DFE to meet existing NYC codes and standards is 11rsquo (NAVD 88) Using the Guidelines recommended design criteria the facilityrsquos DFE is 133rsquo (NAVD 88) and existing grade is around 6rsquo (NAVD 88) The project design team develops three alternatives to meet the Guidelinesrsquo recommended DFE design for the facility Table 7 offers an example of how a qualitative assessment can be used to compare three resilient design alternatives using the evaluation criteria and metrics
CASE STUDY Example of How to Use the Evaluation Matrix
NYC Mayorrsquos Office of Recovery and Resiliency Climate Resiliency Design Guidelines
33IIIE BCA METHODOLOGY FOR PROJECTS OVER $50 MILLION
E BCA methodology for projects over $50 millionIn order for a project to be considered cost-effective a benefit-cost analysis (BCA) assesses if the benefits of a project outweigh its costs or in other words the benefit-cost ratio (BCR) is greater than 10 as illustrated in Equation 1
Equation 1 Benefit-Cost Ratio Formula
BCR =
Where BCR = Benefit-Cost Ratio
BENEFITS = Total project benefits
COSTS = Total project costs
BENEFITSCOSTS
These estimated project benefits are combined with the project costs which are defined as the differential construction and long-term operation and maintenance costs associated with constructing a proposed project to the Guidelinesrsquo recommended design level It is assumed that the baseline project will be designed to the most prevalent NYC codes and standards This benefit methodology should be used to determine the additional project benefit that the Guidelinesrsquo recommended design would provide over the baseline project benefit It is assumed that the project design team will develop alternatives to address each of the following applicable climate stressors - sea level risecoastal storm surge increased precipitation and extreme heat - separately For each alternative the project design team should use the following steps to determine the Benefit-Cost Ratio (BCR)
a) Determine project useful life for design interventions Determining the useful life of the proposed project is an important first step in the
detailed BCA assessment methodologies for two reasons First the project useful life determines what values must be used from the Guidelines to establish the future climate design conditions The various hazard tables in the Guidelines establish design requirements based on useful life ranges through 2039 2040-2069 2070-2099 and 2100+ (2100+ projections are only available for sea level rise) A review of these tables show that the design requirements needed to meet the projected climate hazards increase as the end of useful life range increases Second the useful life determines how long the project will need to be operated and maintained in order to remain technically sound and effective at reducing future damages and losses
b) Determine discount rate for project benefits calculation The cost-effectiveness of projects assessed using the BCR must be done on a net
present value basis meaning the present value of the benefits is compared to the present value of the costs Most project costs are computed for present value based on current cost estimates bids or cost guidance However project benefits - as well as project costs for operation and maintenance - accrue over time into the future and are computed on an annualized basis To address this issue the Present Value Coefficient (PVC) is used to bring these annualized project benefits and OampM costs into the present value As indicated by the formula in Equation 2 the PVC is a function of the Project Useful Life (PUL) and the Discount Rate (DR)
NYC Mayorrsquos Office of Recovery and Resiliency Climate Resiliency Design Guidelines
34
Equation 2 Present Value Coefficient (PVC) Formula
PVC =
Where PVC = Present Value Coefficient
PUL = BCA Project Useful Life based on project type
DR = Discount Rate
The project design team should coordinate with agencies and NYC OMB if needed to determine appropriate discount rates based on funding source project type and other factors This coordination should take place during project initiation phase where total project costs (design and construction) are over $50 million66
c) Develop input data to perform benefit calculations Tables 16 and 17 in Appendix 4 provide a list of typical input data by each climate
stressor needed to perform benefit analysis quantitatively on variety of facilities67 The project design team should use these tables as a reference to identify appropriate input data categories andor additional input data needed to perform benefit analysis on the project
d) Identify applicable project benefit categories to estimate benefits Tables 16 and 17 in Appendix 4 provide a list of typical project benefits by each climate
stressor needed to perform benefit analysis quantitatively on various types of projects The project design team should use these tables as a reference to identify appropriate project benefit categories for each climate stressor to perform benefit analysis on the project
e) Calculate benefits of recommended design interventions for each climate
stressor The input data and applicable project benefits can be assembled along with
incremental project cost data to analyze cost-effectiveness using the FEMA BCA Tool Damage-Frequency Assessment (DFA) module or similar software This analysis will provide a BCR for each alternative which can then be used to compare the alternatives that were developed to mitigate effects from applicable climate stressors The project design team can then use the results from this analysis to identify optimal interventions that provides a balanced solution that provides resiliency benefits within the available project budget
IIIE BCA METHODOLOGY FOR PROJECTS OVER $50 MILLION
[1 ndash (1 + DR) -(PUL)]DR
66 For example a NYC OMB March 2015 memorandum recommends using an annually updated DR as published each year in Appendix C of OMB Circular A-94 The current OMB-recommended discount rates from OMB A-94 Appendix C vary by project useful life and are as follows 21 DR for useful lives of 10 to 19 years 25 DR for useful lives of 20 to 29 years and 28 DR for useful lives of 30 years or greater By contrast FEMA hazard mitigation grants use a DR of 70 for all projects based on the Federal OMB A-94 rate for federally-funded mitigation measures Since these DRs will impact the PVC and the project benefits the project team must ensure that BCA results prepared using an OMB-recommended DR (21 to 28) be updated to reflect the Federal DR (70) when applying for FEMA mitigation grant funds
67 Note the data requirements for the sea level rise and increased precipitation hazards in Table 16 are more detailed than the requirements for the extreme heat hazards due to the less detailed level of analysis available for extreme heat
NYC Mayorrsquos Office of Recovery and Resiliency Climate Resiliency Design Guidelines
35
APPENDICES
NYC Mayorrsquos Office of Recovery and Resiliency Climate Resiliency Design Guidelines
36APPENDIX 1 ndash KEY TERMS
100-year flood (1 annual chance flood)
A flood that has a 1 probability of occurring in any given year The 100-year floodplain is the extent of the area of a flood that has a 1 chance of occurring or being exceeded in any given year
500-year flood (02 annual chance flood)
A flood that has a 02 probability of occurring in any given year The 500-year floodplain is the extent of the area of a flood that has a 02 chance of occurring or being exceeded in any given year
AdaptationAdjustment in natural or human systems to a new or changing environment that seeks to maximize beneficial opportunities or moderate negative effects Successful adaptations contribute to resiliency
Base flood elevation (BFE)The elevation of surface water resulting from a flood that has a 1 annual chance of occurring or being exceeded in any given year The BFE is shown on the Flood Insurance Rate Map (FIRM)69
BluebeltReference to the Department of Environmental Protectionrsquos (DEP) Bluebelt program to preserve natural drainage corridors including streams ponds and other wetland areas Preservation of these wetland systems allows them to perform their functions of conveying storing and filtering storm water
Climate
The average weather (or more rigorously a statistical description of the average in terms of the mean and variability) over a period of time usually 30 years These quantities are most often surface variables such as temperature precipitation and wind Climate in a wider sense is the state including a statistical description of the climate system70
Climate change
Changes in average weather conditions that persist over multiple decades or longer Climate change encompasses both increases and decreases in temperature as well as shifts in precipitation changing risk of certain types of severe weather events and changes to other variables of the climate system
Climate change riskThe chance that investments (such as in capital projects) can be affected by the physical impacts of climate change71 Risks are evaluated as a product of the probability of occurrence and the magnitude of damages or impacts including socioeconomic factors that would result if they did occur (consequences)
Climate change risk assessment
This assessment involves a detailed project-specific analysis that includes a vulnerability and risk assessment often followed by cost-benefit analysis to assess and select investments in climate change risk mitigation Risk is assessed as a function of the magnitude and probability of a given climate change hazard Examples resources are included in Appendix 7
Climate vulnerabilityThe degree to which systems and populations are affected by adverse impacts It is a function of the character magnitude and rate of climate change and variation to which a system is exposed its sensitivity and its adaptive capacity72
Cloudburst An extreme amount of rain in a short period of time often over a small geographic area73
Cooling Degree Day (CDD) A form of degree-day used to estimate the energy requirements for air conditioning or refrigeration when the daily mean temperature is above 65degF
68 All terms are from the US Global Change Research Program (USGCRP) glossary unless otherwise noted The USGCRP glossary is available at httpwwwglobalchangegovclimate-changeglossary
69 ldquoDefinitionsrdquo FEMA last modified March 1 2017 httpswwwfemagovnational-flood-insurance-programdefinitions70 UKCIP Glossary httpwwwukciporgukglossary71 ldquoAccount for Climate Riskrdquo International Finance Corporation 72 UKCIP Glossary httpwwwukciporgukglossary73 New York City Environmental Protection ldquoCloudburst Resiliency Planning Studyrdquo 2017 Available at httpwwwnycgovhtmldeppdfclimatenyc-cloudburst-studypdf
APPENDIX 1 - KEY TERMS68
NYC Mayorrsquos Office of Recovery and Resiliency Climate Resiliency Design Guidelines
37APPENDIX 1 ndash KEY TERMS
Design life The life expectancy of an asset or product as determined during design74 As opposed to useful life (see below)
Dry Bulb temperature The ambient air temperature measured by a thermometer
Extreme eventUnexpected unusual or unpredictable weather or flooding compared to historical or future projected distribution Extreme events include for example heat waves cold waves heavy rains periods of drought and flooding and severe storms
Facilities For the purposes of this document ldquofacilitiesrdquo refers to all types of buildings housing infrastructure structures and landscape features designed by or for the City of New York
Flexible adaptation pathwayResilience-building strategies that can evolve or be adapted over time as climate change risk assessments evaluations of adaptation strategies and monitoring continue75
Flood Insurance Rate Maps (FIRM)
Official flood map of a community on which FEMA has delineated the 1 annual chance floodplain and the base flood elevations (BFEs) applicable to the community76 The FIRM also includes the 02 floodplain annual chance floodplain and differentiates between special flood hazard areas (V A Coast A zones) and floodways The official FIRM is from the year 2007 while the 2015 PFIRM is currently required by NYC Building Code to calculate design flood elevations NYC DOB references the more restrictive of the two maps in both base flood elevation and flood hazard area (ie V versus A zone) Refer to Appendix 3 for more information
FreeboardAn additional amount of height above the base flood elevation used as a factor of safety (eg two feet above the base flood) in determining the level at which a facilitys lowest floor must be elevated or floodproofed to be in accordance with state or community floodplain management regulations77
Future time slices
Future periods defined by the NPCC for when climate change projections are available In this document the following decadal projections are associated with specific time spans2020s projection = present to 20392050s projection = 2040 to 20592080s projection = 2070 to 20992100s projection = end of century and beyond
Green infrastructureAn array of practices that use or mimic natural systems to manage urban stormwater runoff Water is either directed to engineered systems for infiltration or detained for longer periods before it enters the sewer system
Heat Vulnerability Index (HVI)Summarizes relative risk of adverse health effects from heat due to social and environmental factors Used to identify neighborhoods at higher risk during and after extreme heat events
Heat wave A period of three consecutive days where temperatures rise above 90degF or two consecutive days over 95 degrees78
New York City Panel on Climate Change (NPCC)
The body of leading climate and social scientists charged with making climate change projections for the metropolitan region79
74 Sustainable Infrastructure Management Program Learning Environment httpsimplewerforg 75 Rosenzweig C et al Climate Change Adaptation in New York City Building a Risk Management Response76 ldquoDefinitionsrdquo FEMA77 Ibid78 Horton R et al New York City Panel on Climate Change 2015 Report Chapter 1 Climate Observations and Projections Ann NY
Acad Sci ISSN 0077-8923 (New York 2015) 2579 For more information on the NPCC visit www1nycgovsiteorrchallengesnyc-panel-on-climate-changepage
NYC Mayorrsquos Office of Recovery and Resiliency Climate Resiliency Design Guidelines
38APPENDIX 1 ndash KEY TERMS
Open-grid pavement system
Pavements that consist of loose substrates supported by a grid of a more structurally sound grid or webbing Unbounded loose substrates in these systems transfer and store less heat than bound and compacted pavements and aid permeability Pavement is 50 pervious and contains vegetation in the open cells designed to allow percolation or infiltration of storm water through the surface into the soil below80
Preliminary Flood Insurance Rate Map (PFIRM)
Preliminary flood map developed by FEMA in 2015 for New York City that provides projected risks for flood hazards81 Refer to Appendix 3 for more information
Project useful life (PUL)
The period over which an asset or component is expected to be available for use by an entity This depends on regular and adequate maintenance This period of time typically exceeds the design life (see above) The combined effect of operational requirements and useful life is practical in assessing an investment in improving resilience82
Rain gardenAlso called ldquobioswalerdquo Planted areas designed to collect and manage stormwater that runs off streets sidewalks commercial and residential rooftops and other sources when it rains
Resiliency The ability to bounce back after change or adversity The capability of preparing for responding to and recovering from difficult conditions83
Sea level rise-adjusted design flood elevation
As defined in these Guidelines the increased height of the base flood elevation due to sea level rise plus freeboard depending on the criticality of the facility The sea level rise adjustment depends on the useful life of the facility
Storm surge An abnormal rise of water generated by a storm over and above predicted astronomical tides84
Substantial improvementAny repair reconstruction rehabilitation addition or improvement of a building or structure the cost which equals or exceeds 50 of the market value of the structure before the improvement or repairs started For more information see Appendix G of the NYC Building Code and 1 RCNY sect3606-0185
Tidal inundation Flooding which occurs at high tides due to climate-related sea level rise land subsidence andor the loss of natural barriers86
Urban Heat Island (UHI) effectThe tendency for higher air temperatures to persist in urban areas as a result of heat absorbed and emitted by buildings and asphalt tending to make cities warmer than the surrounding suburban and rural areas
Weather The state of the atmosphere at a given time with regard to temperature cloudiness precipitation wind and other meteorological conditions87
Wet Bulb temperatureThe temperature indicated when a thermometer bulb is covered with a water-saturated wick over which air is caused to flow at approximately 45 ms (900 ftmin) to reach the equilibrium temperature of water evaporating into the air when the heat of vaporization is supplied by the sensible heat of the air88
80 ldquoGlossaryrdquo US Green Building Council (2017) Available at httpwwwusgbcorgglossaryterm552581 ldquoPreliminary FEMA Map Productsrdquo FEMA Map Service Center Available at httpshazardsfemagovfemaportalprelimdownload82 ldquoGlossaryrdquo International Infrastructure Management Manual (2011) 83 A Stronger More Resilient New York (2013) 184 ldquoStorm Surge Overviewrdquo National Hurricane Center NOAA Available at httpswwwnhcnoaagovsurge85 ldquoFlood Resistant Constructionrdquo Appendix G New York City Building Code (2008) and 1 RCNY sect3606-01 available at httpswww1nycgovassetsbuildingsrules1_RCNY_3606-01pdf86 ldquoOcean Factsrdquo National Ocean Service NOAA Available at httpoceanservicenoaagovfactsnuisance-floodinghtml 87 UKCIP Glossary httpwwwukciporgukglossary88 ldquoASHRAE Terminologyrdquo ASHRAE Available at httpswwwashraeorgtechnical-resourcesauthoring-toolsterminology
NYC Mayorrsquos Office of Recovery and Resiliency Climate Resiliency Design Guidelines
39APPENDIX 2 - CLIMATE CHANGE PROJECTIONS
Climate change projections are provided by the New York City Panel on Climate Change (NPCC) The full NPCC report is available from the New York Academy of Sciences89 Tables 8-10 (below) were reproduced directly from the NPCC report while Table 2 (see Section IIA) was developed using the data underlying the NPCC report to inform the design of HVAC systems under warmer conditions
Table 8 ndash NYC sea level rise projections90
Baseline (2000-2004) 0 in
Low estimate (10th percentile)
Middle range (25th to 75th percentile)
High estimate (90th percentile)
2020s 2 in 4-8 in 10 in
2050s 8 in 11-21 in 30 in
2080s 13 in 18-39 in 58 in
2100 15 in 22-50 in 75 in
Note Projections are based on six-component approach that incorporates both local and global factors The model-based components are from 24 global climate models and two representative concentration pathways Projections are relative to the 2000-2004 base period
Table 9 ndash Mean annual changes91
a Temperature Baseline(1971-2000) 54degF
Low estimate (10th percentile)
Middle range (25th to 75th percentile)
High estimate (90th percentile)
2020s + 15degF +20-29degF +32degF
2050s +31degF +41-57degF +66degF
2080s +38degF +53-88degF +103degF
2100 +42degF +58-104degF +121F
b Precipitation Baseline(1971-2000) 501 in
Low estimate (10th percentile)
Middle range (25th to 75th percentile)
High estimate (90th percentile)
2020s -1 percent +1-8 +10
2050s +1 percent +4-11 +13
2080s +2 percent +5-13 +19
2100 -6 percent -1 to +19 +25
Note Based on 35 global climate models (GCMs) and two RCPs Baseline data cover the 1971ndash2000 base period and are from the NOAA National Climatic Data Center (NCDC) Shown are the low estimate (10th percentile) middle range (25th percentile to 75th percentile) and high estimate (90th percentile) These estimates are based on a ranking (from most to least) of the 70 (35 GCMs times 2 RCPs) projections The 90th percentile is defined as the value that 90 percent of the outcomes (or 63 of the 70 values) are the same or lower than Like all projections the NPCC climate change projections have uncertainty embedded within them Sources of uncertainty include data and modeling constraints the random nature of some parts of the climate system and limited understanding of some physical processes The NPCC characterizes levels of uncertainty using state-of-the-art climate models multiple scenarios of future greenhouse gas concentrations and recent peer-reviewed literature Even so the projections are not true probabilities and the potential for error should be acknowledged
89 The NPCC 2015 report is available at httponlinelibrarywileycomdoi101111nyas20151336issue-1issuetoc90 From New York City Panel on Climate Change 2015 Report Chapter 1 Climate Observations and Projections page 4191 From New York City Panel on Climate Change 2015 Report Chapter 1 Climate Observations and Projections page 30
APPENDIX 2 - CLIMATE CHANGE PROJECTIONS
NYC Mayorrsquos Office of Recovery and Resiliency Climate Resiliency Design Guidelines
40APPENDIX 2 - CLIMATE CHANGE PROJECTIONS
Table 10 ndash Extreme events92
2020s Baseline (1971-2000)
Low estimate(10th percentile)
Middle range(25th to 75th percentile)
High estimate (90th percentile)
Numbers of heat waves per year 2 3 3-4 4
Average heat wave duration (days) 4 5 5 5
Number of days per year with
Maximum temperature at or above 90degF 18 24 26-31 33
Maximum temperature at or above 100degF 04 07 1-2 2
Minimum temperature at or below 32degF 71 50 52-58 60
Rainfall at or above 1 inch 13 13 14-15 16
Rainfall at or above 2 inches 3 3 3-4 5
Rainfall at or above 4 inches 03 02 03ndash04 05
2050s Baseline (1971-2000)
Low estimate(10th percentile)
Middle range(25th to 75th percentile)
High estimate (90th percentile)
Numbers of heat waves per year 2 4 5-7 7
Average heat wave duration (days) 4 5 5-6 6
Number of days per year with
Maximum temperature at or above 90degF 18 32 39-52 57
Maximum temperature at or above 100degF 04 2 3-5 7
Minimum temperature at or below 32degF 71 37 42-48 52
Rainfall at or above 1 inch 13 13 14-16 17
Rainfall at or above 2 inches 3 3 4-4 5
Rainfall at or above 4 inches 03 03 03-04 05
2080s Baseline (1971-2000)
Low estimate(10th percentile)
Middle range(25th to 75th percentile)
High estimate (90th percentile)
Numbers of heat waves per year 2 5 6-9 9
Average heat wave duration (days) 4 5 5-7 8
Number of days per year with
Maximum temperature at or above 90degF 18 38 44-76 87
Maximum temperature at or above 100degF 04 2 4-14 20
Minimum temperature at or below 32degF 71 25 30-42 49
Rainfall at or above 1 inch 13 14 15-17 18
Rainfall at or above 2 inches 3 3 4-5 5
Rainfall at or above 4 inches 03 02 03-05 07
Note Projections for temperature and precipitation are based on 35 GCMs and 2 RCPs Baseline data are for the 1971 to 2000 base period and are from the NOAA National Climatic Data Center (NCDC) Shown are the low estimate (10th percentile) middle range (25th to 75th percentile) and high estimate (90th percentile) 30-year mean values from model-based outcomes Decimal places are shown for values less than one although this does not indicate higher precisioncertainty Heat waves are defined as three or more consecutive days with maximum temperatures at or above 90degF Like all projections the NPCC climate change projections have uncertainty embedded within them Sources of uncertainty include data and modeling constraints the random nature of some parts of the climate system and limited understanding of some physical processes The NPCC characterizes levels of uncertainty using state-of-the-art climate models multiple scenarios of future greenhouse gas concentrations and recent peer-reviewed literature Even so the projections are not true probabilities and the potential for error should be acknowledged
92 From New York City Panel on Climate Change 2015 Report Chapter 1 Climate Observations and Projections page 31
NYC Mayorrsquos Office of Recovery and Resiliency Climate Resiliency Design Guidelines
41APPENDIX 3 - DIFFERENTIATION OF FLOOD MAPS
These Guidelines reference several different kinds of flood maps and sources of design flood elevations These maps are described and differentiated below
Table 11 - Differentiation of flood maps used in NYC
Reference Title Data Source Information Provided Referenced By Link
2007 FIRM FEMA
Based on historical data from before 1983 identifies the current base flood (extent and elevation) as the flood that has a 1 chance of occurring in any given year also known as a 100-year flood The NYC Building Code requires that either the 2007 FIRM or 2015 PFIRM elevation be used whichever is higher
2014 NYC Building Code Appendix G
Climate Resiliency Design Guidelines
httpsmscfemagovportal
2015 PFIRM FEMA
Based on historical data identifies the current base flood (extents and elevation) as the flood that has a 1 chance of occurring in any given year also known as a 100-year flood The NYC Building Code requires that either the 2007 FIRM or 2015 PFIRM elevation be used whichever is higher The 2015 PFIRM is currently being reassessed by FEMA
2014 NYC Building Code Appendix G
Climate Resiliency Design Guidelines
httpshazardsfemagovfemaportalprelimdownload
httpwwwregion2coastalcomview-flood-maps-dataview-preliminary-flood-map-data
NYC Flood Hazard Mapper
NYC Department of City Planning
Maps current and future flood hazards in NYC including the following data layers 2007 FIRM and 2015 PFIRM high tide with sea level rise and PFIRM with sea level rise through 2100
Climate Resiliency Design Guidelines
Waterfront Revitalization Plan
httpwww1nycgovsiteplanningdata-mapsflood-hazard-mapperpage
ldquoTable 4 ndash Determine the sea level rise-adjusted design flood elevation for critical and non-critical facilitiesrdquo
ORR amp NPCC
Provides data to use when adding sea level rise to a given 2015 PFIRM or 2007 FIRM Base Flood Elevation (BFE) to calculate a Design Flood Elevation (DFE) Based on the criticality and expected useful life of a facility
Climate Resiliency Design Guidelines
See Section II on ldquoSea Level Riserdquo above
APPENDIX 3 - DIFFERENTIATION OF FLOOD MAPS
NYC Mayorrsquos Office of Recovery and Resiliency Climate Resiliency Design Guidelines
42APPENDIX 4 - PROJECT BENEFITS CATEGORIES
This appendix provides guidance on how to identify and assess benefits as a supplement to Sections IIID and IIIE
Table 12 lists typical direct benefits for reducing impacts from climate stressors and basic guidance for how to estimate them See Section IIID for more information
Table 13 lists typical indirect benefits for reducing impacts from climate stressors and basic guidance for how to estimate them See Section IIID for more information
Table 12 ndash Direct benefits for (1) sea level rise with coastal storm surge and (2) increased precipitation measures
Direct Benefit Basic Guidance for Estimating Values
Physical Damages (Structure Contents)
bull For flood-damaged buildings use depth damage functions developed by FEMA and USACE for structures and contents
bull Use depth damage functions in conjunction with Building Replacement Values (BRVs) and not market values BRVs typically range between $100 to $325SF for residential buildings and $120 to $450SF for commercial public buildings
bull For more complex structures or facilities use engineering estimates of flood damages or review historic flood damages documented from insurance claims repair records or FEMA Public Assistance claims from recent flood disasters
Residential Displacements
bull For flood-damaged buildings use depth damage functions developed by FEMA and USACE for residential displacements
Reduced Life CycleOperation and Maintenance (OampM) Costs93
bull Applicable only to projects that reduce overall life cycle costs or net annual OampM costs from baseline conditions
bull Input reduced annual OampM costs as a project benefit at a 1-year recurrence intervalbull Reduced overall life cycle costs can be input as a longer project useful life
Table 13 ndash Indirect benefits for (1) sea level rise with coastal storm surge and (2) increased precipitation measures
Indirect Benefit Basic Guidance for Estimating Values
Non-Residential Building Service Losses
bull Estimate service loss values and durations for non-residential buildings public buildings critical facilities and parksnatural features based on FEMA BCA guidance and standard values based on building use
Utility Service Losses94
bull Estimate utility service losses for water wastewater and electrical facilities based on the number of impacted customers FEMA per capita standard values for utility service ($105personday for potable water $49personday for wastewater $148personday for electrical)95
bull Estimate utility service loss durations based on engineering estimates or review historic flood damages losses documented from utility company records
bull This benefit can also apply to measures that increase energy efficiency
RoadBridge Service Losses
bull Estimate roadbridge service losses based on the average daily traffic (ADT) detour time and additional travel distance and FEMA and GSA standard values for road service ($3344vehiclehour of delay $0545mile)96
bull Estimate roadbridge service loss durations or review historic flood damages losses
Emergency Service Losses
bull Applicable only to projects that reduce or eliminate documented emergency service costs from baseline conditions
bull Examples of avoided emergency services costs include NYPD staffing to monitor barricades for flooded roads or NFDY staffing for water rescues of residents from flooded buildings or streets
APPENDIX 4 - PROJECT BENEFITS CATEGORIES
93 Reduced life cycle costs may be applicable to some measures that provide extreme heat benefits such as green roofs that can last longer than a standard roof if properly maintained
94 Reduced utility service costs may be applicable to some measures that provide extreme heat benefits such as cool roofs green roofs and shade trees
95 FEMA per capita standard values taken from FEMA BCA Toolkit Version 530 (Build Date 12222016) and developed in FEMArsquos Baseline Standard Economic Value Methodology Report (July 28 2016) Consider updating FEMA standard per capita values to reflect current New York City utility rates
96 Consider updating FEMA and GSA standard values to reflect current New York City area labor rates and fuel costs
NYC Mayorrsquos Office of Recovery and Resiliency Climate Resiliency Design Guidelines
43APPENDIX 4 - PROJECT BENEFITS CATEGORIES
Table 14 ndash Other potential benefits for (1) sea level rise with coastal storm surge and (2) increased precipitation measures
Other Benefit Basic Guidance for Estimating Values
Avoided Stress and Anxiety
bull Applicable only for projects that directly benefit occupants of residential structuresbull Use FEMA standard value for avoided mental stress and anxiety treatment costs of $2443person to
estimate benefit for all impacted residents97
Avoided Lost Productivity
bull Applicable only for projects that directly benefit occupants of residential structuresbull Use FEMA standard value for avoided lost worker productivity costs of $8736household to estimate
benefit for all impacted workers (conservatively assuming one worker per household)
Environmental Open Space
bull Applicable only for projects that create or acquire open space areas by acquisitionbull Use FEMA standard value for environmental open space based on the type of land acquired ($8308
Acreyear for Green open space $39545Acreyear for Riparian $6010Acreyear for Wetlands $554Acreyear for Forests $1799Year for Marine and estuary)97
CSO Volume Reduction
bull Applicable only for projects that provide Combined Sewer Overflow (CSO) abatement by reducing the volume of rainfall runoff
bull Use CSO abatement cost of $0015gallonsyear applied to increased precipitation hazard runoff volume for 5-year design storm98
Ecosystem Service99
bull Add stormwater management benefits of green infrastructure projects to increased precipitation hazards where avoided damages and service losses are not quantified
bull Unit benefits applicable to increased precipitation hazard includeo Green roofs $0133SFyear (PUL 40 years)o BioswaleRain GardenMeadow Mix $0020SFyear (PUL 30 years)o Permeable Grass Pavers $0020SFyear (PUL 30 years)o Tree Plantings $303Treeyear (PUL 30 years)o Planter Box Trees $101Treeyear (PUL 15 years)
Real Estate99
bull Potential real estate benefits from increased resilience of residential andor commercial propertiesstreetscapesneighborhoods included within the project scope
bull Benefit applied to extreme heat hazard for green infrastructure projects directly impacting residential or commercial properties
Quality of Life Health Benefits99
bull Potential quality of life benefits related to improved public health from the resilience measures included within the project scope
bull Benefit applied to extreme heat hazard for green infrastructure projects directly impacting residential or commercial properties
Table 14 lists other typical benefits for reducing impacts from climate stressors and basic guidance for how to estimate them See Section IIID for more information
97 FEMA standard values for avoided mental stress and anxiety and environmental open space values taken from FEMA BCA Toolkit Version 530 (Build Date 12222016)
98 CSO abatement cost taken from APG1 Report for NYC ldquoTechnical Approaches for Benefit-Cost Analysis of Hazard Mitigation Projects in Urban and Coastal Environmentsrdquo (April 2016)
99 Ecosystem Services Real Estate and Quality of LifeHealth benefits tend to be more applicable to green infrastructure measures that provide extreme heat benefits such as green roofs trees and other plantings
NYC Mayorrsquos Office of Recovery and Resiliency Climate Resiliency Design Guidelines
44APPENDIX 4 - PROJECT BENEFITS CATEGORIES
Table 15 ndash Potential benefits for extreme heat (Urban Heat Island) reduction measures
Category Benefit Basic Guidance for Estimating Values
Direct Benefit
Reduced Life Cycle Cost
bull Applicable only to measures such as green roofs that are expected to last longer than standard roofs
bull Compute total cost savings including annual OampM costs
Indirect Benefit
Energy Savings
bull Applicable to measures that reduce energy costs by providing cooling through increased shading andor evapotranspiration
bull Use New York Power Authority rates of $0148kWh for electricity and $0810Therm for natural gas
Other Potential Benefits
Air Quality bull Applicable to measures that absorb pollutants andor reduce carbon dioxide emissions
Acoustics bull Applicable to measures such as green roof or walls that reduce noise transfer
Quality of LifeHealth bull Potential quality of life benefits and related to improved public health
Real Estate bull Applicable to measures that provide residential real estate benefits from increased resilience of propertiesstreetscapesneighborhoods
Retail Sales Marketing
bull Applicable to measures that provide commercial property benefits from increased aesthetics resulting in increased marketing and sales for streetscapesneighborhoods
Tax Credits Incentives
bull Applicable to resilience or green infrastructure measures such as green roofs that have accompanying Federal State or City tax credits or other incentives
Table 15 lists potential benefits for reducing impacts from heat and basic guidance for how to estimate them See Section IIID for more information
NYC Mayorrsquos Office of Recovery and Resiliency Climate Resiliency Design Guidelines
45APPENDIX 4 - PROJECT BENEFITS CATEGORIES
Table 16 ndash Guidance on quantitative calculations for (1) sea level rise with coastal storm surge and (2) increased precipitation measures
Data Input General Guidance ndash Basic Description
Applicable Benefit Category
Applicable Typical Facility Typology
Dire
ct B
enefi
ts
Indi
rect
Ben
efits
Oth
er P
oten
tial
Ben
efits
Bui
ldin
g St
ruct
ures
Com
plex
Fa
cilit
ies
Tran
spor
tatio
nSt
reet
scap
es
Plaz
as
Park
Fea
ture
s
First Floor Elevation (FFE)
bull The elevation of the first finished floor of the structure excluding basements
bull FFE measured from top of lowest floor (riverinenon-coastal high hazard areas) or bottom of lowest horizontal structural member (coastal high hazard areas)
Y Y Y Y
Building Replacement Value (BRV)
bull The unit cost to rebuild a structure of the same quality of construction
bull Not the same as market value
Y Y Y Y
Building Size
bull The total floor area of the building in square feet
bull Total Building Value = BRV x Building Sizebull Typical BRVs for NYC range between $100 to
$325SF for residential buildings and $120 to $450SF for commercialpublic buildings
Y Y Y Y
Structure Description
bull The type of building number of stories and foundation type (full basement partial basement no basement)
bull Collect more detailed foundation data for coastal flood zones
Y Y Y Y
Building Use bull Details related to residential housing commercial business and public use
Y Y Y Y Y
Building Type bull The primary use of building ndash residential commercial public and others
Y Y Y Y Y
Depth Damage Function (DDF)
bull Curves used to estimate structure damage contents damage and displacement of residential buildings based on flood depth
bull DDFs selection based on Structure Description Building Type Building Use
bull Structure DDFs based on percentage of Total Building Value
bull Contents DDFs based on percentage of Total Contents Value
bull Displacement DDFs based on number of displacement days x Displacement Cost
Y Y Y Y Y
Contents Value
bull The cost to replace structure contents (furnishings equipment)
bull Residential building Contents Values typically 50 BRV (FEMA DDFs) or 100 BRV (USACE DDFs)
bull Non-residential building Contents Values between 18 to over 100 depending on building use (USACE DDFs)
bull Total Contents Value = BRV x Building Size
Y Y Y Y Y
Table 16 provides general guidance on how to quantitatively calculate benefits from efforts to address from climate stressors See Section IIIE for more information
NYC Mayorrsquos Office of Recovery and Resiliency Climate Resiliency Design Guidelines
46APPENDIX 4 - PROJECT BENEFITS CATEGORIES
Table 16 ndash Guidance on quantitative calculations for (1) sea level rise with coastal storm surge and (2) increased precipitation measures
Data Input General Guidance ndash Basic Description
Applicable Benefit Category
Applicable Typical Facility Typology
Dire
ct B
enefi
ts
Indi
rect
Ben
efits
Oth
er P
oten
tial
Ben
efits
Bui
ldin
g St
ruct
ures
Com
plex
Fa
cilit
ies
Tran
spor
tatio
nSt
reet
scap
es
Plaz
as
Park
Fea
ture
s
Number of Residents (Residential)
bull Total number of occupants in a residential building
bull Typically estimated based on number of residential units x average number of individuals per household (based on current US Census data or use 25 individuals per household as a default)
Y Y Y Y Y
Displacement Cost (Residential)
bull The unit cost to lodge and feed displaced residents while flood damage is repaired
bull Average unit displacement cost of $415residential unitday recommended based on current FY2018 GSA Per Diem rates for New York City
Y Y Y Y Y
Value of Service (Non-Residential and Public)
bull The unit cost of service disruption and rental of temporary facilities while flood damage is repaired
bull Disruption costs for non-residential buildings typically range from $095 to $136SFmonth and rental costs range from $020 to $136SFmonth depending on building use
bull Value of service for public buildings ($day) is typically based on the annual operating budget for the City agency using the building prorated based on building size or population served by the building then divided by 365 daysyear
Y Y Y Y
Value of Service (Critical Facilities)
bull The unit cost of critical facilities (police fire emergency medical services) lost or delayed while flood damage is repaired
Y Y Y
Value of Service Duration
bull The duration of service disruption and rental of temporary facilities for non-residential buildings and critical facilities while flood damage is repaired
bull For non-residential buildingso Value of Service Durations vary from
4 months to over 30 months based on building use and the depth of flooding
o Total Value of Service Loss = (Disruption Cost x Building Area) = (Rental Cost x Building Area x Value of Service Duration)
bull For public buildings and critical facilitieso Value of Service Durations vary from 0
days to 720 months based on building use and the depth of flooding from FEMA FIA or USACE DDFs
o Total Value of Service Loss = (Value of Service) x (Service Loss Duration)
Y Y Y
NYC Mayorrsquos Office of Recovery and Resiliency Climate Resiliency Design Guidelines
47APPENDIX 4 - PROJECT BENEFITS CATEGORIES
Table 16 ndash Guidance on quantitative calculations for (1) sea level rise with coastal storm surge and (2) increased precipitation measures
Data Input General Guidance ndash Basic Description
Applicable Benefit Category
Applicable Typical Facility Typology
Dire
ct B
enefi
ts
Indi
rect
Ben
efits
Oth
er P
oten
tial
Ben
efits
Bui
ldin
g St
ruct
ures
Com
plex
Fa
cilit
ies
Tran
spor
tatio
nSt
reet
scap
es
Plaz
as
Park
Fea
ture
s
Engineering Estimates for Damages
bull Engineered estimate models of physical damages and service losses at the project site based on the Guidelines event recurrence interval(s) and flood depth(s)
Y Y Y Y Y Y
Historic Damages and Service Losses
bull Historic physical damages and service losses at the project site documented from previous flood events
bull Do not use routine maintenancebull The historic damage event recurrence interval
(RIs) andor flood depths must be determined updated for inflation to the present value and adjusted to match the Guidelines event RIsflood depths
Y Y Y Y Y Y
Facility Replacement Value
bull The unit cost to rebuild the facility
Impacted Area bull The geographic area impacted by the facility in the event of failure in acres
Y Y Y Y
Facility Capacity
bull The design capacity of the facilitybull For example - facility capacity expressed in
millions of gallons per day (MGD) for water and wastewater facilities or megawatts (MW) for electrical facilities
Y Y Y Y
Service Population
bull The number of impacted residents served by the facility
bull Typically estimated based on number of impacted residential customers x average number of individuals per household (based on current US Census data or use 25 individuals per household as a default)
bull Facilities serving mostly non-residentialpublic buildings andor critical facilities should focus on service losses rather than service population
Y Y Y
NYC Mayorrsquos Office of Recovery and Resiliency Climate Resiliency Design Guidelines
48APPENDIX 4 - PROJECT BENEFITS CATEGORIES
Table 16 ndash Guidance on quantitative calculations for (1) sea level rise with coastal storm surge and (2) increased precipitation measures
Data Input General Guidance ndash Basic Description
Applicable Benefit Category
Applicable Typical Facility Typology
Dire
ct B
enefi
ts
Indi
rect
Ben
efits
Oth
er P
oten
tial
Ben
efits
Bui
ldin
g St
ruct
ures
Com
plex
Fa
cilit
ies
Tran
spor
tatio
nSt
reet
scap
es
Plaz
as
Park
Fea
ture
s
Value of Service
bull Unit value of service provided by the facilitybull Example of FEMA standard values for complete
loss of utility service $105personday for potable water$49personday for wastewater$148personday for electrical
bull Consider updating FEMA standard per capita values to reflect current The New York City utility rates
Y Y
Roadway Elevations bull Roadway Elevations
Y Y
Roadway Replacement Value
bull Roadway Replacement ValueY Y
Inundation Area Map
bull Inundation Area Map developed by FEMA or through modeling by project design team
Y Y Y
Building Inventory of Inundation Area
bull The number and type of buildings within the streetscape and neighborhood inundated by the Guidelinersquos flood events
Y Y Y
Average Daily Traffic (ADT)
bull The average number of one-way traffic trips per day along the roadway(s) within the streetscapeneighborhood inundated by the Guidelinersquos flood events
Y Y
Additional Travel Time
bull The additional travel time needed to detour around a flooded roadway expressed in minutes
bull In the unlikely event there is no detour available use a 12-hour travel time per one-way trap but provide a detailed area street map as supporting documentation
Y Y
Value of Traffic Delay
bull The value of service associated with lost time in traffic
bull For example - FEMA standard average value of $3344vehiclehour of delay
bull Consider updating FEMA and GSA standard values to reflect current New York City area labor rates and fuel costs
Y Y
NYC Mayorrsquos Office of Recovery and Resiliency Climate Resiliency Design Guidelines
49APPENDIX 4 - PROJECT BENEFITS CATEGORIES
Table 17 ndash Guidance on quantitative unit benefit calculations for extreme heat hazard measures
Measure General Guidance ndash Unit Benefit Information and Data Requirements
Applicable Benefit Category
Applicable Typical Facility Typology
Dire
ct B
enefi
ts
Indi
rect
Ben
efits
Oth
er P
oten
tial
Ben
efits
Bui
ldin
g St
ruct
ures
Com
plex
Fa
cilit
ies
Tran
spor
tatio
nSt
reet
scap
es
Plaz
as
Park
Fea
ture
s
Green Roof
bull Unit benefit range over PUL = $470SF to $373SF of green roof area ($719SF standard value)
bull Assumed PUL = 40 yearsbull Apply standard value unit benefit to green
roof area to estimate measure benefitbull Higher range values more applicable
to residential and commercial building streetscape projects
Y Y Y Y Y Y
Bioswale Rain Garden Meadow Mix
bull Unit benefit range over PUL = $396SF to $211SF of area ($730SF standard value)
bull Assumed PUL = 30 yearsbull Apply standard value unit benefit to bioswale
rain gardenmeadow mix area to estimate total measure benefit
Y Y Y Y Y Y
Cool Roof
bull Unit benefit range over PUL = $117 to $3151SF of material area ($144SF standard value)
bull Assumed PUL = 20 yearsbull Apply standard value unit benefit to cool roof
area to estimate total measure benefitbull Higher range values more applicable to
residential building streetscape projects
Y Y Y Y Y
Light-Colored PaversLight-Colored Materials
bull Unit benefit range over PUL = $0774 to $204SF of material area ($0866SF standard value)
bull Assumed PUL = 30 yearsbull Apply standard value unit benefit to material
area to estimate total measure benefit
Y Y Y Y
Table 17 provides general guidance on how to quantitatively calculate benefits from efforts to address climate stressors See Section IIIE for more information
NYC Mayorrsquos Office of Recovery and Resiliency Climate Resiliency Design Guidelines
50APPENDIX 4 - PROJECT BENEFITS CATEGORIES
Table 17 ndash Guidance on quantitative unit benefit calculations for extreme heat hazard measures
Measure General Guidance ndash Unit Benefit Information and Data Requirements
Applicable Benefit Category
Applicable Typical Facility Typology
Dire
ct B
enefi
ts
Indi
rect
Ben
efits
Oth
er P
oten
tial
Ben
efits
Bui
ldin
g St
ruct
ures
Com
plex
Fa
cilit
ies
Tran
spor
tatio
nSt
reet
scap
es
Plaz
as
Park
Fea
ture
s
Tree Planting
bull Unit benefit range over PUL = $1005 to $77154Tree ($1855Tree standard value)
bull Assumed PUL = 30 yearsbull Apply standard value unit benefit to number of
trees to estimate total measure benefitbull Higher range values more applicable
to residential and commercial building streetscape projects
Y Y Y Y Y Y
Planter Box Tree
bull Unit benefit range over PUL = $212 to 16304Tree ($392Tree standard value)
bull Assumed PUL = 15 yearsbull Apply standard value unit benefit to number of
trees to estimate total measure benefitbull Higher range values more applicable
to residential and commercial building streetscape projects
Y Y Y Y Y
Shade Canopy
bull Unit benefit range over PUL = $0363 to $396SF ($0458SF standard value)
bull Assumed PUL = 15 yearsbull Apply standard value unit benefit to area of
shade canopy estimate total measure benefitbull Higher range values more applicable
to residential and commercial building streetscape projects
Y Y Y Y
Permeable Grass Pavers
bull Unit benefit range over PUL = $0258SF to $0521SF of pavers ($0363SF standard value)
bull Assumed PUL = 30 yearsbull Apply standard value unit benefit to paver
area to estimate total measure benefit
Y Y Y Y Y
For the purposes of the BCA refer to the following facility typologies bull ldquoBuilding Structuresrdquo include critical small building sites such as EMS or FDNY stations and non-critical small building sites such as
libraries or comfort stationsbull ldquoComplex Facilitiesrdquo include critical infrastructure such as wastewater treatment sites pump stations water filtration plants and similar
large or complex facilitiesbull ldquoTransportationStreetscapePlazasrdquo include roadway reconstruction streetscape improvements street raising plazas and other
transportation-related infrastructurebull ldquoPark Featuresrdquo include parks and similar public recreational facility with natural landscape features
NYC Mayorrsquos Office of Recovery and Resiliency Climate Resiliency Design Guidelines
51APPENDIX 5 - EXAMPLE PLANNING DECISION TREE
This decision tree provides a summarized example approach for how to implement these Guidelines Projects with a total cost greater than $50 million are recommended to conduct a full qualitative and quantitative climate change risk assessment and BCA while projects below $50 million are recommended to conduct a qualitative risk assessment and BCA
Define Project
1) Operational goals and criticality level2) Useful life3) Location in the current flood plain future floodplain and or zone
of tidal inundation and the project arearsquos score on the heat vulnerability index
Evaluate Project Risks According to Probability and Magnitude of Consequence
bull Extreme Heat bull Precipitationbull Sea Level Risebull Coastal Surge
High Level Identification and Assessment of Risk Mitigation Alternatives and Co-benefits
(qualitative)
Detailed Identification and Assessment of Risk Mitigation Alternatives and Co-benefits (qualitative and quantitative)
High Level Estimate of Costs and Benefits of Design Alternatives
(qualitative)
Detailed Estimate of Costs and Benefits of Design Alternatives
(qualitative and quantitative)
Decision Point Which climate change risks require mitigation
Decision Point Evaluate risk mitigation benefits and costs to
determine final resilient design alternative or if no action is required
Decision Point Is the total project cost above $50 million
Below $50 million Above $50 million
APPENDIX 5 - EXAMPLE PLANNING DECISION TREE
NYC Mayorrsquos Office of Recovery and Resiliency Climate Resiliency Design Guidelines
52
Project Title
Design Strategies Checklist (not exhaustive)
Extreme Heat Comments Extreme Precipitation Comments Sea Level Rise amp Storm Surge Comments
Select Site in Low Heat Vulnerability Index area Select High Elevation Site Select High Elevation Site
Minimize East-West Building Orientation Green Roof Raise Building Floor Elevation
Passive Solar Cooling and Ventilation Systems
Protect Below Grade Areas from Flooding Waterproof Building Envelope
Cool Roof (SRI appropriate) On-site Stormwater Management (gray) Elevate Critical Building Functions
Green Roof (extensive) Reduce Impervious Areas Elevate Critical Equipment
Vegetative Structures Permeable Pavement Perimeter Floodwall100 Levee (passive or active)
Enhanced HVAC System including space layout optimization and system scalability
Increase Green Spaces and Planted Areas DryWet Floodproofing
More Efficient Building Envelope Other Utility Redundancy Design101
Parking Lot Shading Resilient Materials amp Landscape Treatments
Light Colored Pavements (appropriate SRI) Design for Storm Surge Outflow
Increase Planted Areas Install Backwater Flow Prevention
Permeable Surfaces Design for Scour
Open-grid Pavement Raise Road Elevation
Other Other
This appendix provides a template for identifying possible design strategies to address climate change risks as described throughout the Guidelines
APPENDIX 6 - DESIGN STRATEGIES CHECKLIST
100 Permanent perimeter flood walls are not permitted to meet floodproofing requirements in buildings with substantial improvements andor damages 101 Utility redundancy design should be pursued for critical systems not all building systems
APPENDIX 6 - DESIGN STRATEGIES CHECKLIST
NYC Mayorrsquos Office of Recovery and Resiliency Climate Resiliency Design Guidelines
53APPENDIX 7 - CLIMATE CHANGE RISK ASSESSMENT RESOURCES
These Guidelines provide data on climate change hazards and recommend how that data can inform resilient design A risk assessment is a tool to help project managers and designers evaluate risk levels as well as select and prioritize resilient design strategies A high level risk assessment is recommended for all City capital projects with a total cost of under $50 million Projects above $50 million are recommended to conduct an in-depth assessment
Risk assessments use quantified estimates of the probability and magnitude of consequence of an event occurring to prioritize responses ldquoProbabilityrdquo is an assessment of the likelihood of a hazard occurring while ldquomagnituderdquo describes the hazardrsquos potential impact Risk assessment tools such as the examples listed below can be used to define and score these categories Projects that score higher across both probability and magnitude can be prioritized for investment and risk mitigation action Projects that score lower across both criteria may require no action beyond meeting code The results are typically charted on a risk matrix and an example is provided on the next page
The climate change risk management frameworks below offer templates for how to integrate climate change projections into a risk assessment process Refer to these resources for examples and further information
bull Vulnerability Assessment and Adaptation Framework is prepared by the Federal Highway Administration (FHWA) While developed for transportation planning this risk assessment framework has broad applicability for evaluating asset vulnerability to climate change Available at httpswwwfhwadotgovenvironmentsustainabilityresilienceadaptation_framework
bull US Climate Resilience Toolkit The US Global Change Research Program offers a step by step risk assessment
framework including tools and case studies at httpstoolkitclimategovsteps (see example on next page)
bull Coast Adapt Guidance on undertaking a risk assessment High level assessment httpscoastadaptcomausitesdefaultfilesfactsheetsT3M4_2_2nd_pass_risk_assessmentpdfDetailed assessment httpscoastadaptcomausitesdefaultfilesfactsheetsT3M4_3_3rd_pass_risk_assessmentpdf
bull Climate adaptation Risk uncertainty and decision-makingDownload the report here httpswwwukciporgukpublicationsRisk
The City plans to develop a NYC-specific process for integrating climate change data into existing risk management processes by April 2019
APPENDIX 7 - CLIMATE CHANGE RISK ASSESSMENT RESOURCES
NYC Mayorrsquos Office of Recovery and Resiliency Climate Resiliency Design Guidelines
54APPENDIX 7 - CLIMATE CHANGE RISK ASSESSMENT RESOURCES
The Risk Characterization Matrix below is an example from the US Climate Resilience Toolkit This tool can be used to assess the probability and magnitude of impact for identified risks The risk of coincident climate stressorsrisks (such as storm surge plus increased precipitation) can also be assessed as applicable
Figure 14 - Example of a climate change risk matrix (adapted from US Climate Resilience Toolkit)
Project teams can determine the magnitude of the impact (along the horizontal scale of 1 through 3 with 3 being the most severe) and the probabilitylikelihood of occurrence for each specific risk (along the vertical scale with 3 being the most likely) A score is typically assigned for each risk (Probabil-ity x Magnitude) and then charted on the matrix Based on the estimated probability and magnitude of consequence above the risks are ranked and prioritized for mitigation Factors to bear in mind include
bull Not all facility typologies have the same level of functional and operational importance during events or tolerance for disruption
bull Not all climate stressors and risks have the same level of impact on each project sitebull Not all identified risks can or should be mitigated fully
NYC Mayorrsquos Office of Recovery and Resiliency Climate Resiliency Design Guidelines
55WORKS CITED
A Stronger More Resilient New York PlaNYC Report of the NYC Special Initiative for Rebuilding and Resiliency The City of New York 2013
ldquoAccount for Climate Riskrdquo International Finance Corporation accessed March 27 2017 httpwwwifcorgwpswcmconnectTopics_Ext_ContentIFC_External_Corporate_SiteClimate+Business
PrioritiesAccount+for+Climate+Risk
American Society of Heating Refrigeration and Air-Conditioning Engineers (ASHRAE) Handbook -Fundamentals 2017
ldquoBaseline Standard Economic Value Methodology Reportrdquo Federal Emergency Management Agency July 2016
Benefit Cost Analysis Toolkit Software Version 530 Federal Emergency Management Agency (build date December 2016)
Criteria for Detention Facility Design New York City Department of Environmental Protection November 2012
Community Resilience Planning Guide for Buildings and Infrastructure Systems Vol 1 NIST Special Publication 1190 US Department of Commerce 2016
Cool and Green Roofing Manual NYC Department of Design and Construction 2007 httpwwwnycgovhtmlddcdownloadspdfcool_green_roof_manpdf
Building Resiliency Task Force US Urban Green Building Council New York 2013 httpurbangreencouncilforcecomBuildingResiliency
Design and Planning for Flood Resiliency Guidelines for NYC Parks New York City Department of Parks and Recreation 2017
httpswwwnycgovparksorgplanning-and-buildingplanningresiliency-plansflood-resiliency
Flooded Bus Barns and Buckled Rails Federal Transit Administration Office of Budget and Policy 2011 httpswwwhsdlorgabstractampdid=685187
Floodproofing Non-Residential Buildings FEMA P936 FEMA 2013 httpswwwfemagovmedia-library-data9a50c534fc5895799321dcdd4b6083e7P-936_8-20-13_508rpdf
ldquoGlossaryrdquo International Infrastructure Management Manual National Asset Management Support Group New Zealand 2011 httpwwwipweaorg
ldquoGreen Roof Metrics Draft Reportrdquo New York City Department of Parks and Recreation 2017
ldquoGuide to Rain Event Preparednessrdquo NYC Department of Environmental Protection httpwwwnycgovhtmldeppdfbrochuresflood-preparedness-flyerpdf
ldquoGuidelines and Discount Rates for Benefit-Cost Analysis of Federal Programsrdquo Appendix C Circular A-94 US Office of Management and Budget (OMB) 2017
ldquoGuidelines for the Design and Construction of Stormwater Management Systemsrdquo New York City Department of Environmental Protection July 2012
Horton R et al New York City Panel on Climate Change 2015 Report Ann NY Acad Sci ISSN 0077-892 New York 2015
Madrigano J et al ldquoA case-only study of vulnerability to heat wavendashrelated mortality in New York City (2000ndash2011)rdquo Environmental Health Perspectives 123672ndash678 2013
WORKS CITED
NYC Mayorrsquos Office of Recovery and Resiliency Climate Resiliency Design Guidelines
56WORKS CITED
enspMcGregor et al Two Degrees The Built Environment and Our Changing Climate Routledge Press 2013
NYC Green Codes Task Force US Green Building Council New York 2010 httpurbangreencouncilorgGreenCodes
NYCrsquos Risk Landscape A Guide to Hazard Mitigation NYC Emergency Management 2014
One New York The Plan for a Strong and Just City The City of New York 2015 httpwwwnycgovhtmlonenyc downloadspdfpublicationsOneNYCpdf
Ready to Respond Strategies for Multifamily Building Resilience Enterprise Green Communities 2015 httpswwwenterprisecommunityorgresources
Rosenzweig C et al Climate Change Adaptation in New York City Building a Risk Management Response New York City Panel on Climate Change 2010
httponlinelibrarywileycomdoi101111nyas20101196issue-1 issuetoc
ldquoSustainable Infrastructure Management Program Learning Environmentrdquo Water Environment Research Foundation accessed March 24 2017 httpsimplewerforg
Urban Waterfront Adaptive Strategies NYC Department of City Planning 2013 httpwww1nycgovsiteplanningplanssustainable-communitiesclimate-resiliencepagetab=1
Wastewater Resiliency Plan Climate Risk Assessment and Adaptation Study New York City Department of Environmental Protection October 2013
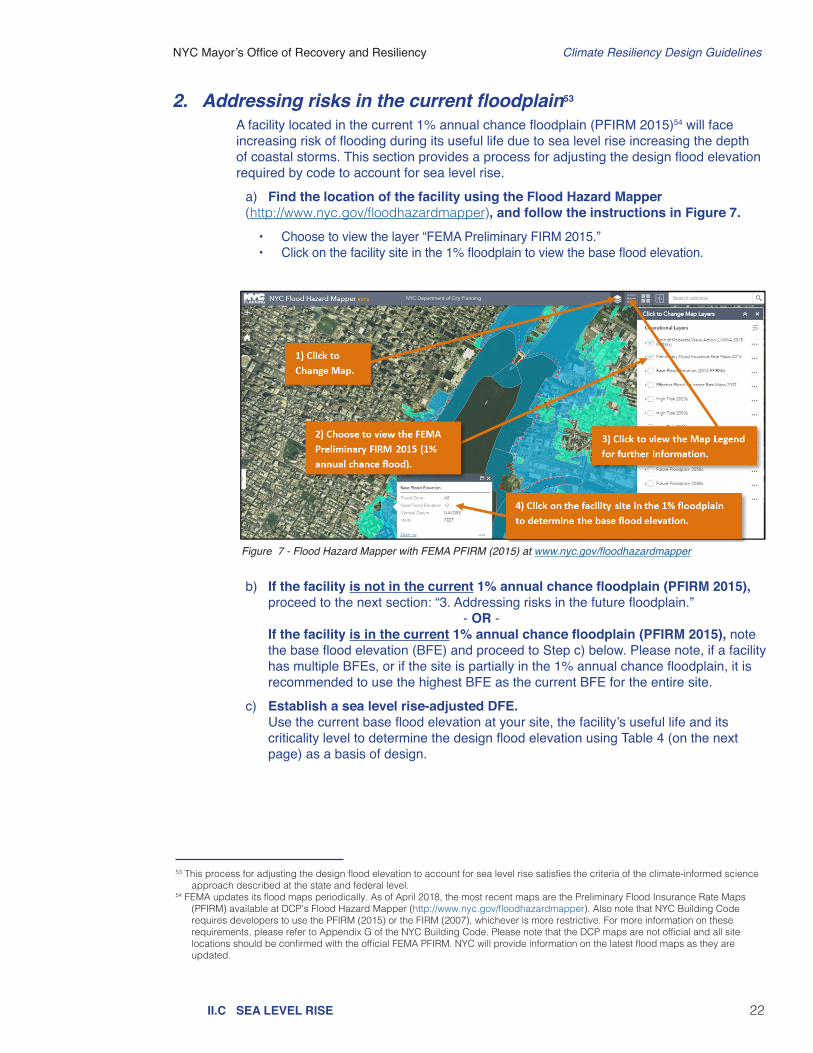
NYC Mayorrsquos Office of Recovery and Resiliency Climate Resiliency Design Guidelines
22IIC SEA LEVEL RISE
2 Addressing risks in the current floodplain53
A facility located in the current 1 annual chance floodplain (PFIRM 2015)54 will face increasing risk of flooding during its useful life due to sea level rise increasing the depth of coastal storms This section provides a process for adjusting the design flood elevation required by code to account for sea level rise
a) Find the location of the facility using the Flood Hazard Mapper (httpwwwnycgovfloodhazardmapper) and follow the instructions in Figure 7
bull Choose to view the layer ldquoFEMA Preliminary FIRM 2015rdquo bull Click on the facility site in the 1 floodplain to view the base flood elevation
Figure 7 - Flood Hazard Mapper with FEMA PFIRM (2015) at wwwnycgovfloodhazardmapper
b) If the facility is not in the current 1 annual chance floodplain (PFIRM 2015) proceed to the next section ldquo3 Addressing risks in the future floodplainrdquo
- OR - If the facility is in the current 1 annual chance floodplain (PFIRM 2015) note
the base flood elevation (BFE) and proceed to Step c) below Please note if a facility has multiple BFEs or if the site is partially in the 1 annual chance floodplain it is recommended to use the highest BFE as the current BFE for the entire site
c) Establish a sea level rise-adjusted DFE Use the current base flood elevation at your site the facilityrsquos useful life and its
criticality level to determine the design flood elevation using Table 4 (on the next page) as a basis of design
53 This process for adjusting the design flood elevation to account for sea level rise satisfies the criteria of the climate-informed science approach described at the state and federal level
54 FEMA updates its flood maps periodically As of April 2018 the most recent maps are the Preliminary Flood Insurance Rate Maps (PFIRM) available at DCPrsquos Flood Hazard Mapper (httpwwwnycgovfloodhazardmapper) Also note that NYC Building Code requires developers to use the PFIRM (2015) or the FIRM (2007) whichever is more restrictive For more information on these requirements please refer to Appendix G of the NYC Building Code Please note that the DCP maps are not official and all site locations should be confirmed with the official FEMA PFIRM NYC will provide information on the latest flood maps as they are updated
NYC Mayorrsquos Office of Recovery and Resiliency Climate Resiliency Design Guidelines
23IIC SEA LEVEL RISE
Table 4 - Determine the sea level rise-adjusted design flood elevation for critical and non-critical facilities55
Critical facilities
End of useful life Base Flood Elevation (BFE)56 in NAVD 88 + Freeboard57 + Sea Level Rise
Adjustment58= Design Flood Elevation (DFE) in
NAVD 88Through 2039 FEMA 1 (PFIRM) 24rdquo 6rdquo = FEMA 1 + 30rdquo
2040-2069 FEMA 1 (PFIRM) 24rdquo 16rdquo = FEMA 1 + 40rdquo2070-2099 FEMA 1 (PFIRM) 24rdquo 28rdquo = FEMA 1 + 52rdquo
2100+ FEMA 1 (PFIRM) 24rdquo 36rdquo = FEMA 1 + 60rdquoNon-critical facilities
End of useful life Base Flood Elevation (BFE) in NAVD 88 + Freeboard + Sea Level Rise
Adjustment = Design Flood Elevation (DFE) in
NAVD 88Through 2039 FEMA 1 (PFIRM) 12rdquo 6rdquo = FEMA 1 + 18rdquo
2040-2069 FEMA 1 (PFIRM) 12rdquo 16rdquo = FEMA 1 + 28rdquo2070-2099 FEMA 1 (PFIRM) 12rdquo 28rdquo = FEMA 1 + 40rdquo
2100+ FEMA 1 (PFIRM) 12rdquo 36rdquo = FEMA 1 + 48rdquoAdditional analysis should be conducted to incorporate wave action and wave run-up in DFE calculations especially in areas that are located within the FEMArsquos 1 annual chance Limit of Moderate Wave Action (LiMWA) zone Wave run up is the maximum vertical extent of wave uprush above surge
Definition of critical buildings and infrastructure for determining DFE in Table 4The criticality definitions below are for use in the application of the Guidelines only All items identified as critical in NYC Building Code Appendix G are critical in these guidelines however this list includes additional facilities that are not listed in Appendix G59 If a facility is not listed here it is considered non-critical for the purposes of determining freeboard
bull Hospitals and health care facilitiesbull Fire rescue ambulance and police stations and emergency vehicle garages bull Jails correctional facilities and detention facilities bull Facilities used in emergency response including emergency shelters emergency preparedness communication
operation centers communication towers electrical substations back-up generators fuel or water storage tanks power generating stations and other public utility facilities
bull Critical aviation facilities such as control towers air traffic control centers and hangars for aircraft used in emergency response
bull Major food distribution centers (with an annual expected volume of greater than 170000000 pounds)60 bull Buildings and other structures that manufacture process handle store dispose or use toxic or explosive
substances where the quantity of the material exceeds a threshold quantity established by the authority having jurisdiction and is sufficient to pose a threat to the public if released61
bull Infrastructure in transportation telecommunications or power networks including bridges tunnels (vehicular and rail) traffic signals (and other right of way elements including street lights and utilities) power transmission facilities substations circuit breaker houses city gate stations arterial roadways telecommunications central offices switching facilities etc
bull Ventilation buildings and fan plantsbull Operations centersbull Pumping stations (sanitary and stormwater)bull Train and transit maintenance yards and shopsbull Wastewater treatment plantsbull Water supply infrastructurebull Combined-sewer overflow (CSO) retention tanksbull Fueling stationsbull Waste transfer stations and bull Facilities where residents have limited mobility or ability including care facilities and nursing homes
55 If an industry standard does not include freeboard in its flood protection standards for particular infrastructure assets then only consider the sea level rise adjustment when determining flood protection levels
56 Note that NYC Building Code requires developers to use the PFIRM (2015) or the FIRM (2007) whichever is more restrictive For more information on these requirements please refer to Appendix G of the NYC Building Code
57 These freeboard values reflect NYC Building Code Appendix G Table 2-1 which establishes the minimum elevation of the top of lowest floor Appendix G requires other freeboard values for other parts of structures and in different parts of the floodplain Refer to Appendix G for the appropriate freeboard and use that value in Table 4 above
58 The sea level rise figures provided are for the middle of the 25th-75th percentile range projections from the NPCC These values do not necessarily indicate the average of all models
59 The structural occupancy categories outlined in Appendix G of the NYC Building Code are the same as ASCE 7 used for structural design For critical buildings structural design should comply with ASCE 7 and 24 for design class IV
60 This threshold represents the median volume of main food distributors in NYC according to statistics collected as part of the Five Borough Food Flow study in 2016 available at
httpswwwnycedccomsystemfilesfilesresource2016_food_supply-resiliency_study_resultspdf 61 The threshold quantity for hazardous materials is established by Chapter 7 of Title 24 of the NYC Administrative Code
NYC Mayorrsquos Office of Recovery and Resiliency Climate Resiliency Design Guidelines
24IIC SEA LEVEL RISE
Figure 9 ndash Outdoor emergency generator for the critical building
This case study provides an example of how to calculate a sea level rise-adjusted DFE based on the useful life of a hypothetical critical services building and its primary component
Step 1 Organize the site by various critical or primary components and their year of construction Determine their useful life along with the associated future year scenario for flood risk assessment In this example the building structure and the outside emergency generator are the most at-risk components from combined sea level rise and coastal storm surge
Step 2 Overlay the site footprint area over the effective current PFIRM or FIRM and the corresponding future year scenario FEMA 1 to identify flood risk to the site From overlaying the 2015 preliminary FEMA floodplain over the site it was determined that the site has a 1 annual chance of flooding with a base flood elevation of 13rsquo NAVD Step 3 Evaluate the criticality of each primary component of the facility based on the Guidelinesrsquo definition for critical infrastructure (Table 4) This (hypothetical) building is critical
Step 4 Use Table 4 to determine the sea level rise adjustment and freeboard requirements for each component and calculate the DFE for each that corresponds to its useful life period
Step 5 Compare the DFE of each component and the associated Guidelinesrsquo recommended DFE to calculate anticipated flood depth
CASE STUDY Adjusting the DFE for Sea Level Rise
Table 5 ndash Example of how to calculate a sea level rise-adjusted DFE for a critical facility
Construction year Components Useful
Life
Future Year Scenario
[Useful Life + Const
Year]
BFE in NAVD
88 (feet)
Freeboard + Sea
Level Rise Adjustment
(feet)
Adjusted DFE in
NAVD 88 (feet)
2010 Building Structure
70 years 2070-2099 130rsquo 2rsquo+23rsquo 173rsquo
2010Outdoor
Emergency Generator
25 years
Through 2039 130rsquo 2rsquo+05rsquo 155rsquo
Figure 8 - Example of how to locate a facility within the current floodplain and determine the BFE Figure 9 (inset) - Outdoor emergency generator at the facility
Figure 10 - This schematic shows how to determine the design flood elevation of a facility within the current 1 floodplain
Illustrative not to scale
NYC Mayorrsquos Office of Recovery and Resiliency Climate Resiliency Design Guidelines
25IIC SEA LEVEL RISE
Figure 11 - Flood Hazard Mapper with future 1 annual chance floodplain (adjusted for sea level rise) at httpwwwnycgovfloodhazardmapper
b) If the site is not in the future floodplain no flood protection is required for this facility
- OR - If the site is in the future floodplain identify the nearest adjacent base flood
elevation at the project site in the current 1 annual chance floodplain (PFIRM 2015) using the Flood Hazard Mapper62
c) Use Table 4 to determine the DFE Add freeboard and the sea level rise-adjustment to the nearest adjacent BFE on the
current 1 annual chance floodplain (PFIRM 2015) to determine the DFE
d) Apply the DFE calculation from Table 4 to the protected facility See Figures 12 and 13 for an illustration of how to calculate the DFE
62 Maps of future floodplains show the impacts of sea level rise alone and do not consider how changes in stormsrsquo climatology might also affect wave action and the full extent of the floodplain
3 Addressing risks in the future floodplainIf the facility is not in the current 1 annual chance floodplain (PFIRM 2015) it may still be at risk in the future from flooding as sea level rise increases the extent of the floodplain Follow the steps below to determine if your facility is located in the future floodplain and if so what sea level rise-adjusted DFE to use
a) Use the Flood Hazard Mapper (httpwwwnycgovfloodhazardmapper) to determine if the facility site will be in the future 1 annual chance floodplain
Assess if by the end of the facilityrsquos useful life the floodplain is projected to increase to encompass all or part of the project site For example if the useful life ends between 2040 and 2069 choose the 2050s floodplain map Refer to the steps in Figure 11 below
NYC Mayorrsquos Office of Recovery and Resiliency Climate Resiliency Design Guidelines
26IIC SEA LEVEL RISE
Figure 12 - This schematic map shows how to locate the nearest adjacent 1 floodplain elevation
Figure 13 -This schematic shows how to determine the design flood elevation of a facility that is outside of the current 1 floodplain
CASE STUDY Identifying a Base Flood Elevation (BFE) in the Future Floodplain
Illustrative not to scale
NYC Mayorrsquos Office of Recovery and Resiliency Climate Resiliency Design Guidelines
27IIC SEA LEVEL RISE
4 Identify appropriate design interventions
63 Additional resources for identifying adaptive strategies Urban Waterfront Adaptive Strategies (NYC Department of City Planning httpswww1nycgovassetsplanningdownloadpdfplans-studiessustainable-communitiesclimate-resilienceurban_waterfrontpdf Floodproofing Non-Residential Buildings (FEMA) at httpswwwfemagovmedia-libraryassetsdocuments34270 Ready to Respond Strategies for Multifamily Building Resilience (Enterprise Green Community) at
httpwwwenterprisecommunityorgresourcesready-respond-strategies-multifamily-building-resilience-1335664 While natural systems-based approaches ameliorate flooding their use for storm surge or wave mitigation would need to be quantified
before contributing towards the design flood elevation 65 For more information see FEMArsquos Floodproofing Non-Residential Buildings at httpswwwfemagovmedia-libraryassetsdocuments34270
Operational requirements and continuity plans can inform the selection of appropriate design interventions particularly in terms of how quickly a site needs to be up and running after a flood event Some examples of how functional uses can pair with interventions include
bull A facility that needs to be operating during or immediately after a flood event may need to be dry floodproofed using permanent barriers or designed for passive survivability (such as a police or fire station)
bull A facility that needs to recover quickly after an event could elevate prioritized equipment and have deployable barriers
bull A site that can recover over a longer duration of time could be temporarily inundated during an event (such as parks or plazas) The use of resilient materials and strategies can reduce costly damage caused by temporary inundation
Different design interventions should be chosen based on the specific operational requirements of the project however these must meet the ASCE 24 design requirements for Coastal VE Zones
For all projects at risk of current or future flooding select protections that meet the projectrsquos design flood elevation Consider project-specific factors including the site location operational requirements existing continuity planning and cost63 A Design Strategies Checklist in Appendix 6 is available for use as a resource to track possible design approaches Some examples of design alternatives are
bull Site relocation where feasible conduct alternative site analysis
bull Permanent barriers at a site (eg floodwalls)
bull Deployable flood barriers (eg stop logs flood doorsgates inflatable barriers)
bull Natural systems-based approaches (eg living shorelines restored wetlands)64
bull Prioritized protection of electrical mechanical and other critical or costly-to-replace equipment above the design flood elevation (eg motors and controller boilers and furnaces fuel storage tanks duct work alarm systems and suppression equipment electrical panels electrical distribution and switching areas gas and electric meters telecommunications equipment chemical feed equipment HVAC units and emergency generators)65
bull Dry floodproofing design a facility to prevent water from entering
bull Wet floodproofing design a facility to permit floodwaters to flow in and out of the structure without causing significant damage (eg elevate or protect critical equipment use water-resistant building materials below the design flood elevation include flood vents and pumps)
bull Design redundant telecommunications conduit entrances for multiple carrier entry Telecom conduit should run to diverse manholes when possible
bull Install backup power for telecom equipment with design consideration for such equipment (eg installation above DFE)
bull Install outdoor-rated disconnect switch for telecommunications equipment on the roofbull Explore interventions to protect underground utilities and other telecommunications
facilities from water damagebull Install backflow preventers backwater valves and sump pumps for all buildings and
infrastructure in the floodplain as well as behind flood barriersbull Shoreline improvements that reduce the height of waves or attenuate waves where
feasible
NYC Mayorrsquos Office of Recovery and Resiliency Climate Resiliency Design Guidelines
28IIIA GENERAL METHODOLOGY TO ESTIMATE PROJECT BENEFITSIIIB CATEGORIES OF PROJECT BENEFITS
Designing and constructing facilities to handle the future climate loads above the current NYC codes and standards based on projected useful life of the components provides resiliency benefits The incremental costs to implement the Guidelinesrsquo recommended design interventions should be compared with the incremental benefits to aid agencies in making decisions about resilient design strategies The project design team should evaluate benefits of the interventions designed to meet Guidelinesrsquo recommended criteria for all the climate stressors qualitatively andor quantitatively For projects with construction costs below $50 million the project design team is recommended to perform a qualitative benefits assessment on the interventions that meet the Guidelinesrsquo recommendations for all applicable climate stressors For critical facilities or projects with construction costs over $50 million the project design team is recommended to perform quantitative benefit calculations to identify the optimal interventions that meet Guidelinesrsquo recommended design criteria
A GENERAL METHODOLOGY TO ESTIMATE PROJECT BENEFITSThis general methodology to perform qualitative and quantitative benefit calculations is recommended for use by project design teams at the beginning of and during the design process This methodology enables estimation of project benefits for a high-level benefit-cost analysis (BCA) that can be applied to evaluate and compare resiliency features designed to address sea level rise with coastal storm surge increased precipitation and extreme heat events The type of benefits provided by interventions designed to meet the Guidelinesrsquo design criteria can vary by climate stressors and typology of the facilities The main guiding principle in development of the high-level BCA methodologies included in these Guidelines was to balance simplicity with accuracy The project benefits categories identified within the methodology may not cover all the potential benefits provided by every facility type within NYC In particular the benefits of planning for increased precipitation are difficult to quantify Hence the project design team should use their discretion to modify this general benefit calculation methodology as needed to meet their project goals and objectives The project design team should develop appropriate input data whether quantitative or qualitative needed to estimate project benefits
B CATEGORIES OF PROJECT BENEFITSThere are three types of project benefit categories - direct benefits indirect benefits and other benefits - that can be used to perform qualitative assessments and develop quantitative estimates of monetary benefits for intervention alternatives designed to meet the Guidelinesrsquo recommendations These project benefit categories will help to perform a high-level benefit-cost analysis that balances accuracy with an appropriate level of effort
bull Direct Benefits include reduced or avoided physical damages to facilities and contents reduced or avoided displacements for residential structures and reduced life cycle or OampM costs that can be quantified as a primary result of implementing a specific hazard mitigation measure Table 12 in Appendix 4 provides a list of direct benefits and basic guidance on estimating and documenting values for sea level rise and increased precipitation-related flood hazards Note that given the current state of practice it is not possible to quantify reduced or avoided physical damages or residential displacements that result from a specific extreme heat mitigation measures Therefore direct benefits applicable to extreme heat hazards are limited to reduced life cycle costs applicable to certain measures such as green roofs Refer to Table 15 for details on direct benefits for extreme heat hazards
III EVALUATION OF PROJECT BENEFITS
NYC Mayorrsquos Office of Recovery and Resiliency Climate Resiliency Design Guidelines
29IIIB CATEGORIES OF PROJECT BENEFITS
bull Indirect Benefits include reduced or avoided service losses for non-residential
buildings public facilities andor infrastructure (utilities roads and bridges) based on the value of service continuity andor emergency services to New Yorkers that can be quantified as a secondary result of implementing a specific hazard mitigation measure Table 13 in Appendix 4 provides a list of indirect benefits and basic guidance on estimating and documenting values for sea level rise and increased precipitation-related flood hazards Note that given the current state of practice on extreme heat it is not possible to quantify reduced or avoided service losses that result from a specific extreme heat mitigation measures Therefore indirect benefits applicable to extreme heat hazards are limited to reduced energy costs such as cool roofs green roofs or shade trees Refer to Table 15 in Appendix 4 for details on indirect benefits for extreme heat hazards
bull Other Benefits where applicable other potential benefits may include social benefits for residents such as avoided stress and anxiety avoided lost productivity environmentalecosystem service benefits avoided need for emergency services and other potential benefits that can be estimated as a result of implementing a specific hazard mitigation measure Table 14 in Appendix 4 provides a list of other potential benefits and basic guidance on estimating and documenting values for sea level rise and increased precipitation-related flood hazards
Note on the ecosystem service benefit category in Table 14 the stormwater management benefits of green infrastructure should be distributed between the extreme heat and increased precipitation hazards since these measures provide both significant reductions in rainfall runoff as well as Urban Heat Island mitigation through evapotranspiration However there is currently limited data available to quantify the actual distribution of stormwater management benefits between the two hazards For various dual-benefit providing interventions careful considerations should be given to identify the appropriate benefits category provided by the intervention with a goal to avoid duplication of quantified benefits In this methodology the stormwater management benefits of green infrastructure are applied to the increased precipitation hazard in order to avoid a duplication of benefits Note on real estate and quality of life benefits additionally it is important to note that two potential benefit categories shown in Table 14 - real estate and quality of lifehealthavoided casualties - were not included in the current BCA methodology for sea level rise or increased precipitation hazards Although these categories could increase project benefits for sea level rise and increased precipitation hazards they were only applied to measures that address extreme heat hazards such as green roofs trees and other plantings Refer to Table 15 for a detailed summary of other benefit categories quantified as unit benefits for extreme heat hazards
NYC Mayorrsquos Office of Recovery and Resiliency Climate Resiliency Design Guidelines
30IIIC WHICH METHODOLOGY TO USEIIID BCA METHODOLOGY FOR PROJECTS UNDER $50 MILLION
D BCA methodology for projects under $50 millionThe project design team should develop design alternatives to meet the Guidelinesrsquo criteria which may be in excess of NYC code and standards requirements (baseline conditions) It is assumed that the project design team will develop alternatives to address each of the following applicable climate stressors - sea level risecoastal storm surge increased precipitation and extreme heat - separately Tables 12-15 in Appendix 4 provides a list of typical direct indirect and other benefits provided by various intervention typologies to reduce impacts from climate stressors During the qualitative assessment the project design team should consider that intervention strategies will have varying levels of reliability effectiveness benefits and cost implications during the qualitative assessment
The project design team is recommended to develop appropriate evaluation criteria and metrics for each of the applicable project benefit categories For each alternative the project design team could use either a scoring weighting ranking or other type of qualitative assessment framework to assess each applicable project benefit categories with the developed evaluation criteria and metrics Table 6 provides an example template to evaluate alternatives using a set of general evaluation criteria and metrics using a color-coded rating system (and see Table 7 for an example of how to complete the template) The project design team can utilize a similar template customized to their project goals and objectives This assessment allows agencies to screen the qualitative benefits for various alternatives that would then lead to development of final project components to match the available budget and goals of the project
Projects with total costs below $50 million recommended to conduct a qualitative assessment to identify the optimal interventions that meet Guidelinesrsquo design criteria using the ldquoD) BCA methodology for projects under $50 millionrdquo methodology below
C WHICH METHODOLOGY TO USEProjects with a total cost above $50 million or are highly complex or critical facilities recommended to conduct both a qualitative and quantitative benefit calculation to identify the optimal interventions that meet Guidelinersquos design criteria using the ldquoE) BCA methodology for projects above $50 millionrdquo below A quantitative BCA also must include qualitative factors
NYC Mayorrsquos Office of Recovery and Resiliency Climate Resiliency Design Guidelines
31IIID BCA METHODOLOGY FOR PROJECTS UNDER $50 MILLION
Qualitative Color Scale Green=Least resource intensive alternative Purple=most resource intensive yellow=medium level of resource intensity
Qualitative Evaluation Factors Description Relative Color Rating System
First CostsAdditional construction costs needed to incorporate Guidelinesrsquo recommended resilient design over the baseline project costs
Highest cost ($$$) rated as Purple whereas lowest cost ($) rated as Green
ConstructabilityEase of Implementation
Construction techniques and site conditions such as presence of major utilities conflicts and other conditions which dictate the level of constructability required for each alternative
Difficult to construct rated as Purple whereas easiest to construct rated as Green
Environmental ImpactsCo-BenefitsPermitting
Impacts to the built and natural environment such as circulation noise and hazardous waste plus the level of effort required for permitting (eg interventions in water require highest level of permitting requirement) from each alternative in addition to the baseline project condition
Highest environmental impacts and highest level of effort required for permitting rated as Purple whereas the least impact and level of effort rated as Green
Operation and Maintenance (OampM)
Level of effort of additional manpower and cost of OampM for the alternatives over the baseline project OampM requirements
Highest level of effort and cost for OampM rated as Purple whereas the lowest is rated as Green
Reliability and Durability
Interventions that do not require human involvement or a facilityrsquos ability to withstand all the forces during a storm event (eg permanent solutions with higher reliability than deployable solution)
Interventions requiring human involvement (active measures) rated as Purple whereas interventions with minimal or no human involvement (passive measures) rated as Green
Risk Reduction Benefits Monetary benefits provided by each intervention alternative in avoided damages over the baseline condition
Lowest potential monetary benefit rated as Purple whereas as highest potential monetary benefit rated as Green
Quality of Life BenefitsVisual Aesthetics
Benefits either to the community such as recreation or safety or serve the community during emergency situations
Lowest potential quality of life benefits rated as Purple whereas as highest potential benefits rated as Green
Table 6 ndash Evaluation matrix for comparison of mitigation alternatives across the useful life of a project
Project title_______________________________________________________________________________
Evaluation Criteria
Baseline Condition (Designed to NYC Building Code and
Standards)
Resilient Design Alternatives for Managing__________________
Alternative 1
Alternative 2
Alternative 3
First Costs
ConstructabilityEase of ImplementationEnvironmental ImpactsCo-BenefitsPermitting
Operation and Maintenance (OampM)
Reliability and Durability
Risk Reduction Benefits
Quality of Life BenefitsVisual Aesthetics
NYC Mayorrsquos Office of Recovery and Resiliency Climate Resiliency Design Guidelines
32IIID BCA METHODOLOGY FOR PROJECTS UNDER $50 MILLION
Table 7 ndash Evaluation matrix for comparison of mitigation alternatives across the useful life of a project - COMPLETED EXAMPLE
Evaluation Criteria
Baseline Condition (Designed to NYC Building Code and
Standards)
Resilient Design Alternatives for Managing Coastal SurgeSLR
Alternative 1Flood proof building built on grade to Guidelines
DFE
Alternative 2 Elevate building structure above Guidelinesrsquo DFE
on columns
Alternative 3 Raise site grade by filing the building site footprint
to Guidelinesrsquo DFE
First CostsBaseline cost for building structure is $15 million
Incremental costs are within 5 over the baseline costs
Incremental costs are between 5-10 over baseline costs
Incremental costs are 20 and more over baseline costs
ConstructabilityEase of Implementation
Relatively easy to construct within site constraints
Similar to baseline conditions since construction requires additional flood proofing only
Moderate challenges to construct foundation structure for columns within site constraints
Extremely challenging to construct within the site constraints Potentially fatal flaw
Environmental ImpactsCo-BenefitsPermitting
No major impacts but may require additional effort to obtain DOB permits with flood proofing and deployable systems
No major impacts but may require additional effort to obtain DOB permits with flood proofing and deployable systems
No major impacts and relatively easy to permit
Potential drainage circulation impacts and challenges to obtain clean fill material for the site
Operation and Maintenance (OampM)
Major OampM costs associated with deployable systems
Major OampM costs associated with deployable systems
Moderate OampM costs associated with proposed elevator for access
Minimal OampM costs since deployable and elevators not required
Reliability and Durability
Least reliability with highest potential risk from flooding during to failure of deployable systems
Least reliability with highest potential risk from flooding during to failure of deployable systems
Moderate reliability with potential risk from flooding limited to elevator shaft only
Highest reliability since deployable are not required to protect building from flooding
Risk Reduction Benefits
Maximum flood risk reduction benefits assuming deployable and flood proofing is effective
Maximum flood risk reduction benefits assuming deployable and flood proofing is effective
Maximum flood risk reduction benefits
Maximum flood risk reduction benefits
Quality of Life BenefitsVisual Aesthetics
Facility may not be operational during the storm event
Facility may not be operational during the storm event
Facility can be potentially operational during the storm event
Facility can be potentially operational during the storm event
Qualitative Color Scale Green=Least resource intensive alternative Purple=most resource intensive yellow=medium level of resource intensity
A new non-critical facility with a building structure is proposed on a site that is currently in the 2015 Preliminary FEMA 1 annual chance floodplain with a BFE of 10rsquo (NAVD 88) The baseline conditions DFE to meet existing NYC codes and standards is 11rsquo (NAVD 88) Using the Guidelines recommended design criteria the facilityrsquos DFE is 133rsquo (NAVD 88) and existing grade is around 6rsquo (NAVD 88) The project design team develops three alternatives to meet the Guidelinesrsquo recommended DFE design for the facility Table 7 offers an example of how a qualitative assessment can be used to compare three resilient design alternatives using the evaluation criteria and metrics
CASE STUDY Example of How to Use the Evaluation Matrix
NYC Mayorrsquos Office of Recovery and Resiliency Climate Resiliency Design Guidelines
33IIIE BCA METHODOLOGY FOR PROJECTS OVER $50 MILLION
E BCA methodology for projects over $50 millionIn order for a project to be considered cost-effective a benefit-cost analysis (BCA) assesses if the benefits of a project outweigh its costs or in other words the benefit-cost ratio (BCR) is greater than 10 as illustrated in Equation 1
Equation 1 Benefit-Cost Ratio Formula
BCR =
Where BCR = Benefit-Cost Ratio
BENEFITS = Total project benefits
COSTS = Total project costs
BENEFITSCOSTS
These estimated project benefits are combined with the project costs which are defined as the differential construction and long-term operation and maintenance costs associated with constructing a proposed project to the Guidelinesrsquo recommended design level It is assumed that the baseline project will be designed to the most prevalent NYC codes and standards This benefit methodology should be used to determine the additional project benefit that the Guidelinesrsquo recommended design would provide over the baseline project benefit It is assumed that the project design team will develop alternatives to address each of the following applicable climate stressors - sea level risecoastal storm surge increased precipitation and extreme heat - separately For each alternative the project design team should use the following steps to determine the Benefit-Cost Ratio (BCR)
a) Determine project useful life for design interventions Determining the useful life of the proposed project is an important first step in the
detailed BCA assessment methodologies for two reasons First the project useful life determines what values must be used from the Guidelines to establish the future climate design conditions The various hazard tables in the Guidelines establish design requirements based on useful life ranges through 2039 2040-2069 2070-2099 and 2100+ (2100+ projections are only available for sea level rise) A review of these tables show that the design requirements needed to meet the projected climate hazards increase as the end of useful life range increases Second the useful life determines how long the project will need to be operated and maintained in order to remain technically sound and effective at reducing future damages and losses
b) Determine discount rate for project benefits calculation The cost-effectiveness of projects assessed using the BCR must be done on a net
present value basis meaning the present value of the benefits is compared to the present value of the costs Most project costs are computed for present value based on current cost estimates bids or cost guidance However project benefits - as well as project costs for operation and maintenance - accrue over time into the future and are computed on an annualized basis To address this issue the Present Value Coefficient (PVC) is used to bring these annualized project benefits and OampM costs into the present value As indicated by the formula in Equation 2 the PVC is a function of the Project Useful Life (PUL) and the Discount Rate (DR)
NYC Mayorrsquos Office of Recovery and Resiliency Climate Resiliency Design Guidelines
34
Equation 2 Present Value Coefficient (PVC) Formula
PVC =
Where PVC = Present Value Coefficient
PUL = BCA Project Useful Life based on project type
DR = Discount Rate
The project design team should coordinate with agencies and NYC OMB if needed to determine appropriate discount rates based on funding source project type and other factors This coordination should take place during project initiation phase where total project costs (design and construction) are over $50 million66
c) Develop input data to perform benefit calculations Tables 16 and 17 in Appendix 4 provide a list of typical input data by each climate
stressor needed to perform benefit analysis quantitatively on variety of facilities67 The project design team should use these tables as a reference to identify appropriate input data categories andor additional input data needed to perform benefit analysis on the project
d) Identify applicable project benefit categories to estimate benefits Tables 16 and 17 in Appendix 4 provide a list of typical project benefits by each climate
stressor needed to perform benefit analysis quantitatively on various types of projects The project design team should use these tables as a reference to identify appropriate project benefit categories for each climate stressor to perform benefit analysis on the project
e) Calculate benefits of recommended design interventions for each climate
stressor The input data and applicable project benefits can be assembled along with
incremental project cost data to analyze cost-effectiveness using the FEMA BCA Tool Damage-Frequency Assessment (DFA) module or similar software This analysis will provide a BCR for each alternative which can then be used to compare the alternatives that were developed to mitigate effects from applicable climate stressors The project design team can then use the results from this analysis to identify optimal interventions that provides a balanced solution that provides resiliency benefits within the available project budget
IIIE BCA METHODOLOGY FOR PROJECTS OVER $50 MILLION
[1 ndash (1 + DR) -(PUL)]DR
66 For example a NYC OMB March 2015 memorandum recommends using an annually updated DR as published each year in Appendix C of OMB Circular A-94 The current OMB-recommended discount rates from OMB A-94 Appendix C vary by project useful life and are as follows 21 DR for useful lives of 10 to 19 years 25 DR for useful lives of 20 to 29 years and 28 DR for useful lives of 30 years or greater By contrast FEMA hazard mitigation grants use a DR of 70 for all projects based on the Federal OMB A-94 rate for federally-funded mitigation measures Since these DRs will impact the PVC and the project benefits the project team must ensure that BCA results prepared using an OMB-recommended DR (21 to 28) be updated to reflect the Federal DR (70) when applying for FEMA mitigation grant funds
67 Note the data requirements for the sea level rise and increased precipitation hazards in Table 16 are more detailed than the requirements for the extreme heat hazards due to the less detailed level of analysis available for extreme heat
NYC Mayorrsquos Office of Recovery and Resiliency Climate Resiliency Design Guidelines
35
APPENDICES
NYC Mayorrsquos Office of Recovery and Resiliency Climate Resiliency Design Guidelines
36APPENDIX 1 ndash KEY TERMS
100-year flood (1 annual chance flood)
A flood that has a 1 probability of occurring in any given year The 100-year floodplain is the extent of the area of a flood that has a 1 chance of occurring or being exceeded in any given year
500-year flood (02 annual chance flood)
A flood that has a 02 probability of occurring in any given year The 500-year floodplain is the extent of the area of a flood that has a 02 chance of occurring or being exceeded in any given year
AdaptationAdjustment in natural or human systems to a new or changing environment that seeks to maximize beneficial opportunities or moderate negative effects Successful adaptations contribute to resiliency
Base flood elevation (BFE)The elevation of surface water resulting from a flood that has a 1 annual chance of occurring or being exceeded in any given year The BFE is shown on the Flood Insurance Rate Map (FIRM)69
BluebeltReference to the Department of Environmental Protectionrsquos (DEP) Bluebelt program to preserve natural drainage corridors including streams ponds and other wetland areas Preservation of these wetland systems allows them to perform their functions of conveying storing and filtering storm water
Climate
The average weather (or more rigorously a statistical description of the average in terms of the mean and variability) over a period of time usually 30 years These quantities are most often surface variables such as temperature precipitation and wind Climate in a wider sense is the state including a statistical description of the climate system70
Climate change
Changes in average weather conditions that persist over multiple decades or longer Climate change encompasses both increases and decreases in temperature as well as shifts in precipitation changing risk of certain types of severe weather events and changes to other variables of the climate system
Climate change riskThe chance that investments (such as in capital projects) can be affected by the physical impacts of climate change71 Risks are evaluated as a product of the probability of occurrence and the magnitude of damages or impacts including socioeconomic factors that would result if they did occur (consequences)
Climate change risk assessment
This assessment involves a detailed project-specific analysis that includes a vulnerability and risk assessment often followed by cost-benefit analysis to assess and select investments in climate change risk mitigation Risk is assessed as a function of the magnitude and probability of a given climate change hazard Examples resources are included in Appendix 7
Climate vulnerabilityThe degree to which systems and populations are affected by adverse impacts It is a function of the character magnitude and rate of climate change and variation to which a system is exposed its sensitivity and its adaptive capacity72
Cloudburst An extreme amount of rain in a short period of time often over a small geographic area73
Cooling Degree Day (CDD) A form of degree-day used to estimate the energy requirements for air conditioning or refrigeration when the daily mean temperature is above 65degF
68 All terms are from the US Global Change Research Program (USGCRP) glossary unless otherwise noted The USGCRP glossary is available at httpwwwglobalchangegovclimate-changeglossary
69 ldquoDefinitionsrdquo FEMA last modified March 1 2017 httpswwwfemagovnational-flood-insurance-programdefinitions70 UKCIP Glossary httpwwwukciporgukglossary71 ldquoAccount for Climate Riskrdquo International Finance Corporation 72 UKCIP Glossary httpwwwukciporgukglossary73 New York City Environmental Protection ldquoCloudburst Resiliency Planning Studyrdquo 2017 Available at httpwwwnycgovhtmldeppdfclimatenyc-cloudburst-studypdf
APPENDIX 1 - KEY TERMS68
NYC Mayorrsquos Office of Recovery and Resiliency Climate Resiliency Design Guidelines
37APPENDIX 1 ndash KEY TERMS
Design life The life expectancy of an asset or product as determined during design74 As opposed to useful life (see below)
Dry Bulb temperature The ambient air temperature measured by a thermometer
Extreme eventUnexpected unusual or unpredictable weather or flooding compared to historical or future projected distribution Extreme events include for example heat waves cold waves heavy rains periods of drought and flooding and severe storms
Facilities For the purposes of this document ldquofacilitiesrdquo refers to all types of buildings housing infrastructure structures and landscape features designed by or for the City of New York
Flexible adaptation pathwayResilience-building strategies that can evolve or be adapted over time as climate change risk assessments evaluations of adaptation strategies and monitoring continue75
Flood Insurance Rate Maps (FIRM)
Official flood map of a community on which FEMA has delineated the 1 annual chance floodplain and the base flood elevations (BFEs) applicable to the community76 The FIRM also includes the 02 floodplain annual chance floodplain and differentiates between special flood hazard areas (V A Coast A zones) and floodways The official FIRM is from the year 2007 while the 2015 PFIRM is currently required by NYC Building Code to calculate design flood elevations NYC DOB references the more restrictive of the two maps in both base flood elevation and flood hazard area (ie V versus A zone) Refer to Appendix 3 for more information
FreeboardAn additional amount of height above the base flood elevation used as a factor of safety (eg two feet above the base flood) in determining the level at which a facilitys lowest floor must be elevated or floodproofed to be in accordance with state or community floodplain management regulations77
Future time slices
Future periods defined by the NPCC for when climate change projections are available In this document the following decadal projections are associated with specific time spans2020s projection = present to 20392050s projection = 2040 to 20592080s projection = 2070 to 20992100s projection = end of century and beyond
Green infrastructureAn array of practices that use or mimic natural systems to manage urban stormwater runoff Water is either directed to engineered systems for infiltration or detained for longer periods before it enters the sewer system
Heat Vulnerability Index (HVI)Summarizes relative risk of adverse health effects from heat due to social and environmental factors Used to identify neighborhoods at higher risk during and after extreme heat events
Heat wave A period of three consecutive days where temperatures rise above 90degF or two consecutive days over 95 degrees78
New York City Panel on Climate Change (NPCC)
The body of leading climate and social scientists charged with making climate change projections for the metropolitan region79
74 Sustainable Infrastructure Management Program Learning Environment httpsimplewerforg 75 Rosenzweig C et al Climate Change Adaptation in New York City Building a Risk Management Response76 ldquoDefinitionsrdquo FEMA77 Ibid78 Horton R et al New York City Panel on Climate Change 2015 Report Chapter 1 Climate Observations and Projections Ann NY
Acad Sci ISSN 0077-8923 (New York 2015) 2579 For more information on the NPCC visit www1nycgovsiteorrchallengesnyc-panel-on-climate-changepage
NYC Mayorrsquos Office of Recovery and Resiliency Climate Resiliency Design Guidelines
38APPENDIX 1 ndash KEY TERMS
Open-grid pavement system
Pavements that consist of loose substrates supported by a grid of a more structurally sound grid or webbing Unbounded loose substrates in these systems transfer and store less heat than bound and compacted pavements and aid permeability Pavement is 50 pervious and contains vegetation in the open cells designed to allow percolation or infiltration of storm water through the surface into the soil below80
Preliminary Flood Insurance Rate Map (PFIRM)
Preliminary flood map developed by FEMA in 2015 for New York City that provides projected risks for flood hazards81 Refer to Appendix 3 for more information
Project useful life (PUL)
The period over which an asset or component is expected to be available for use by an entity This depends on regular and adequate maintenance This period of time typically exceeds the design life (see above) The combined effect of operational requirements and useful life is practical in assessing an investment in improving resilience82
Rain gardenAlso called ldquobioswalerdquo Planted areas designed to collect and manage stormwater that runs off streets sidewalks commercial and residential rooftops and other sources when it rains
Resiliency The ability to bounce back after change or adversity The capability of preparing for responding to and recovering from difficult conditions83
Sea level rise-adjusted design flood elevation
As defined in these Guidelines the increased height of the base flood elevation due to sea level rise plus freeboard depending on the criticality of the facility The sea level rise adjustment depends on the useful life of the facility
Storm surge An abnormal rise of water generated by a storm over and above predicted astronomical tides84
Substantial improvementAny repair reconstruction rehabilitation addition or improvement of a building or structure the cost which equals or exceeds 50 of the market value of the structure before the improvement or repairs started For more information see Appendix G of the NYC Building Code and 1 RCNY sect3606-0185
Tidal inundation Flooding which occurs at high tides due to climate-related sea level rise land subsidence andor the loss of natural barriers86
Urban Heat Island (UHI) effectThe tendency for higher air temperatures to persist in urban areas as a result of heat absorbed and emitted by buildings and asphalt tending to make cities warmer than the surrounding suburban and rural areas
Weather The state of the atmosphere at a given time with regard to temperature cloudiness precipitation wind and other meteorological conditions87
Wet Bulb temperatureThe temperature indicated when a thermometer bulb is covered with a water-saturated wick over which air is caused to flow at approximately 45 ms (900 ftmin) to reach the equilibrium temperature of water evaporating into the air when the heat of vaporization is supplied by the sensible heat of the air88
80 ldquoGlossaryrdquo US Green Building Council (2017) Available at httpwwwusgbcorgglossaryterm552581 ldquoPreliminary FEMA Map Productsrdquo FEMA Map Service Center Available at httpshazardsfemagovfemaportalprelimdownload82 ldquoGlossaryrdquo International Infrastructure Management Manual (2011) 83 A Stronger More Resilient New York (2013) 184 ldquoStorm Surge Overviewrdquo National Hurricane Center NOAA Available at httpswwwnhcnoaagovsurge85 ldquoFlood Resistant Constructionrdquo Appendix G New York City Building Code (2008) and 1 RCNY sect3606-01 available at httpswww1nycgovassetsbuildingsrules1_RCNY_3606-01pdf86 ldquoOcean Factsrdquo National Ocean Service NOAA Available at httpoceanservicenoaagovfactsnuisance-floodinghtml 87 UKCIP Glossary httpwwwukciporgukglossary88 ldquoASHRAE Terminologyrdquo ASHRAE Available at httpswwwashraeorgtechnical-resourcesauthoring-toolsterminology
NYC Mayorrsquos Office of Recovery and Resiliency Climate Resiliency Design Guidelines
39APPENDIX 2 - CLIMATE CHANGE PROJECTIONS
Climate change projections are provided by the New York City Panel on Climate Change (NPCC) The full NPCC report is available from the New York Academy of Sciences89 Tables 8-10 (below) were reproduced directly from the NPCC report while Table 2 (see Section IIA) was developed using the data underlying the NPCC report to inform the design of HVAC systems under warmer conditions
Table 8 ndash NYC sea level rise projections90
Baseline (2000-2004) 0 in
Low estimate (10th percentile)
Middle range (25th to 75th percentile)
High estimate (90th percentile)
2020s 2 in 4-8 in 10 in
2050s 8 in 11-21 in 30 in
2080s 13 in 18-39 in 58 in
2100 15 in 22-50 in 75 in
Note Projections are based on six-component approach that incorporates both local and global factors The model-based components are from 24 global climate models and two representative concentration pathways Projections are relative to the 2000-2004 base period
Table 9 ndash Mean annual changes91
a Temperature Baseline(1971-2000) 54degF
Low estimate (10th percentile)
Middle range (25th to 75th percentile)
High estimate (90th percentile)
2020s + 15degF +20-29degF +32degF
2050s +31degF +41-57degF +66degF
2080s +38degF +53-88degF +103degF
2100 +42degF +58-104degF +121F
b Precipitation Baseline(1971-2000) 501 in
Low estimate (10th percentile)
Middle range (25th to 75th percentile)
High estimate (90th percentile)
2020s -1 percent +1-8 +10
2050s +1 percent +4-11 +13
2080s +2 percent +5-13 +19
2100 -6 percent -1 to +19 +25
Note Based on 35 global climate models (GCMs) and two RCPs Baseline data cover the 1971ndash2000 base period and are from the NOAA National Climatic Data Center (NCDC) Shown are the low estimate (10th percentile) middle range (25th percentile to 75th percentile) and high estimate (90th percentile) These estimates are based on a ranking (from most to least) of the 70 (35 GCMs times 2 RCPs) projections The 90th percentile is defined as the value that 90 percent of the outcomes (or 63 of the 70 values) are the same or lower than Like all projections the NPCC climate change projections have uncertainty embedded within them Sources of uncertainty include data and modeling constraints the random nature of some parts of the climate system and limited understanding of some physical processes The NPCC characterizes levels of uncertainty using state-of-the-art climate models multiple scenarios of future greenhouse gas concentrations and recent peer-reviewed literature Even so the projections are not true probabilities and the potential for error should be acknowledged
89 The NPCC 2015 report is available at httponlinelibrarywileycomdoi101111nyas20151336issue-1issuetoc90 From New York City Panel on Climate Change 2015 Report Chapter 1 Climate Observations and Projections page 4191 From New York City Panel on Climate Change 2015 Report Chapter 1 Climate Observations and Projections page 30
APPENDIX 2 - CLIMATE CHANGE PROJECTIONS
NYC Mayorrsquos Office of Recovery and Resiliency Climate Resiliency Design Guidelines
40APPENDIX 2 - CLIMATE CHANGE PROJECTIONS
Table 10 ndash Extreme events92
2020s Baseline (1971-2000)
Low estimate(10th percentile)
Middle range(25th to 75th percentile)
High estimate (90th percentile)
Numbers of heat waves per year 2 3 3-4 4
Average heat wave duration (days) 4 5 5 5
Number of days per year with
Maximum temperature at or above 90degF 18 24 26-31 33
Maximum temperature at or above 100degF 04 07 1-2 2
Minimum temperature at or below 32degF 71 50 52-58 60
Rainfall at or above 1 inch 13 13 14-15 16
Rainfall at or above 2 inches 3 3 3-4 5
Rainfall at or above 4 inches 03 02 03ndash04 05
2050s Baseline (1971-2000)
Low estimate(10th percentile)
Middle range(25th to 75th percentile)
High estimate (90th percentile)
Numbers of heat waves per year 2 4 5-7 7
Average heat wave duration (days) 4 5 5-6 6
Number of days per year with
Maximum temperature at or above 90degF 18 32 39-52 57
Maximum temperature at or above 100degF 04 2 3-5 7
Minimum temperature at or below 32degF 71 37 42-48 52
Rainfall at or above 1 inch 13 13 14-16 17
Rainfall at or above 2 inches 3 3 4-4 5
Rainfall at or above 4 inches 03 03 03-04 05
2080s Baseline (1971-2000)
Low estimate(10th percentile)
Middle range(25th to 75th percentile)
High estimate (90th percentile)
Numbers of heat waves per year 2 5 6-9 9
Average heat wave duration (days) 4 5 5-7 8
Number of days per year with
Maximum temperature at or above 90degF 18 38 44-76 87
Maximum temperature at or above 100degF 04 2 4-14 20
Minimum temperature at or below 32degF 71 25 30-42 49
Rainfall at or above 1 inch 13 14 15-17 18
Rainfall at or above 2 inches 3 3 4-5 5
Rainfall at or above 4 inches 03 02 03-05 07
Note Projections for temperature and precipitation are based on 35 GCMs and 2 RCPs Baseline data are for the 1971 to 2000 base period and are from the NOAA National Climatic Data Center (NCDC) Shown are the low estimate (10th percentile) middle range (25th to 75th percentile) and high estimate (90th percentile) 30-year mean values from model-based outcomes Decimal places are shown for values less than one although this does not indicate higher precisioncertainty Heat waves are defined as three or more consecutive days with maximum temperatures at or above 90degF Like all projections the NPCC climate change projections have uncertainty embedded within them Sources of uncertainty include data and modeling constraints the random nature of some parts of the climate system and limited understanding of some physical processes The NPCC characterizes levels of uncertainty using state-of-the-art climate models multiple scenarios of future greenhouse gas concentrations and recent peer-reviewed literature Even so the projections are not true probabilities and the potential for error should be acknowledged
92 From New York City Panel on Climate Change 2015 Report Chapter 1 Climate Observations and Projections page 31
NYC Mayorrsquos Office of Recovery and Resiliency Climate Resiliency Design Guidelines
41APPENDIX 3 - DIFFERENTIATION OF FLOOD MAPS
These Guidelines reference several different kinds of flood maps and sources of design flood elevations These maps are described and differentiated below
Table 11 - Differentiation of flood maps used in NYC
Reference Title Data Source Information Provided Referenced By Link
2007 FIRM FEMA
Based on historical data from before 1983 identifies the current base flood (extent and elevation) as the flood that has a 1 chance of occurring in any given year also known as a 100-year flood The NYC Building Code requires that either the 2007 FIRM or 2015 PFIRM elevation be used whichever is higher
2014 NYC Building Code Appendix G
Climate Resiliency Design Guidelines
httpsmscfemagovportal
2015 PFIRM FEMA
Based on historical data identifies the current base flood (extents and elevation) as the flood that has a 1 chance of occurring in any given year also known as a 100-year flood The NYC Building Code requires that either the 2007 FIRM or 2015 PFIRM elevation be used whichever is higher The 2015 PFIRM is currently being reassessed by FEMA
2014 NYC Building Code Appendix G
Climate Resiliency Design Guidelines
httpshazardsfemagovfemaportalprelimdownload
httpwwwregion2coastalcomview-flood-maps-dataview-preliminary-flood-map-data
NYC Flood Hazard Mapper
NYC Department of City Planning
Maps current and future flood hazards in NYC including the following data layers 2007 FIRM and 2015 PFIRM high tide with sea level rise and PFIRM with sea level rise through 2100
Climate Resiliency Design Guidelines
Waterfront Revitalization Plan
httpwww1nycgovsiteplanningdata-mapsflood-hazard-mapperpage
ldquoTable 4 ndash Determine the sea level rise-adjusted design flood elevation for critical and non-critical facilitiesrdquo
ORR amp NPCC
Provides data to use when adding sea level rise to a given 2015 PFIRM or 2007 FIRM Base Flood Elevation (BFE) to calculate a Design Flood Elevation (DFE) Based on the criticality and expected useful life of a facility
Climate Resiliency Design Guidelines
See Section II on ldquoSea Level Riserdquo above
APPENDIX 3 - DIFFERENTIATION OF FLOOD MAPS
NYC Mayorrsquos Office of Recovery and Resiliency Climate Resiliency Design Guidelines
42APPENDIX 4 - PROJECT BENEFITS CATEGORIES
This appendix provides guidance on how to identify and assess benefits as a supplement to Sections IIID and IIIE
Table 12 lists typical direct benefits for reducing impacts from climate stressors and basic guidance for how to estimate them See Section IIID for more information
Table 13 lists typical indirect benefits for reducing impacts from climate stressors and basic guidance for how to estimate them See Section IIID for more information
Table 12 ndash Direct benefits for (1) sea level rise with coastal storm surge and (2) increased precipitation measures
Direct Benefit Basic Guidance for Estimating Values
Physical Damages (Structure Contents)
bull For flood-damaged buildings use depth damage functions developed by FEMA and USACE for structures and contents
bull Use depth damage functions in conjunction with Building Replacement Values (BRVs) and not market values BRVs typically range between $100 to $325SF for residential buildings and $120 to $450SF for commercial public buildings
bull For more complex structures or facilities use engineering estimates of flood damages or review historic flood damages documented from insurance claims repair records or FEMA Public Assistance claims from recent flood disasters
Residential Displacements
bull For flood-damaged buildings use depth damage functions developed by FEMA and USACE for residential displacements
Reduced Life CycleOperation and Maintenance (OampM) Costs93
bull Applicable only to projects that reduce overall life cycle costs or net annual OampM costs from baseline conditions
bull Input reduced annual OampM costs as a project benefit at a 1-year recurrence intervalbull Reduced overall life cycle costs can be input as a longer project useful life
Table 13 ndash Indirect benefits for (1) sea level rise with coastal storm surge and (2) increased precipitation measures
Indirect Benefit Basic Guidance for Estimating Values
Non-Residential Building Service Losses
bull Estimate service loss values and durations for non-residential buildings public buildings critical facilities and parksnatural features based on FEMA BCA guidance and standard values based on building use
Utility Service Losses94
bull Estimate utility service losses for water wastewater and electrical facilities based on the number of impacted customers FEMA per capita standard values for utility service ($105personday for potable water $49personday for wastewater $148personday for electrical)95
bull Estimate utility service loss durations based on engineering estimates or review historic flood damages losses documented from utility company records
bull This benefit can also apply to measures that increase energy efficiency
RoadBridge Service Losses
bull Estimate roadbridge service losses based on the average daily traffic (ADT) detour time and additional travel distance and FEMA and GSA standard values for road service ($3344vehiclehour of delay $0545mile)96
bull Estimate roadbridge service loss durations or review historic flood damages losses
Emergency Service Losses
bull Applicable only to projects that reduce or eliminate documented emergency service costs from baseline conditions
bull Examples of avoided emergency services costs include NYPD staffing to monitor barricades for flooded roads or NFDY staffing for water rescues of residents from flooded buildings or streets
APPENDIX 4 - PROJECT BENEFITS CATEGORIES
93 Reduced life cycle costs may be applicable to some measures that provide extreme heat benefits such as green roofs that can last longer than a standard roof if properly maintained
94 Reduced utility service costs may be applicable to some measures that provide extreme heat benefits such as cool roofs green roofs and shade trees
95 FEMA per capita standard values taken from FEMA BCA Toolkit Version 530 (Build Date 12222016) and developed in FEMArsquos Baseline Standard Economic Value Methodology Report (July 28 2016) Consider updating FEMA standard per capita values to reflect current New York City utility rates
96 Consider updating FEMA and GSA standard values to reflect current New York City area labor rates and fuel costs
NYC Mayorrsquos Office of Recovery and Resiliency Climate Resiliency Design Guidelines
43APPENDIX 4 - PROJECT BENEFITS CATEGORIES
Table 14 ndash Other potential benefits for (1) sea level rise with coastal storm surge and (2) increased precipitation measures
Other Benefit Basic Guidance for Estimating Values
Avoided Stress and Anxiety
bull Applicable only for projects that directly benefit occupants of residential structuresbull Use FEMA standard value for avoided mental stress and anxiety treatment costs of $2443person to
estimate benefit for all impacted residents97
Avoided Lost Productivity
bull Applicable only for projects that directly benefit occupants of residential structuresbull Use FEMA standard value for avoided lost worker productivity costs of $8736household to estimate
benefit for all impacted workers (conservatively assuming one worker per household)
Environmental Open Space
bull Applicable only for projects that create or acquire open space areas by acquisitionbull Use FEMA standard value for environmental open space based on the type of land acquired ($8308
Acreyear for Green open space $39545Acreyear for Riparian $6010Acreyear for Wetlands $554Acreyear for Forests $1799Year for Marine and estuary)97
CSO Volume Reduction
bull Applicable only for projects that provide Combined Sewer Overflow (CSO) abatement by reducing the volume of rainfall runoff
bull Use CSO abatement cost of $0015gallonsyear applied to increased precipitation hazard runoff volume for 5-year design storm98
Ecosystem Service99
bull Add stormwater management benefits of green infrastructure projects to increased precipitation hazards where avoided damages and service losses are not quantified
bull Unit benefits applicable to increased precipitation hazard includeo Green roofs $0133SFyear (PUL 40 years)o BioswaleRain GardenMeadow Mix $0020SFyear (PUL 30 years)o Permeable Grass Pavers $0020SFyear (PUL 30 years)o Tree Plantings $303Treeyear (PUL 30 years)o Planter Box Trees $101Treeyear (PUL 15 years)
Real Estate99
bull Potential real estate benefits from increased resilience of residential andor commercial propertiesstreetscapesneighborhoods included within the project scope
bull Benefit applied to extreme heat hazard for green infrastructure projects directly impacting residential or commercial properties
Quality of Life Health Benefits99
bull Potential quality of life benefits related to improved public health from the resilience measures included within the project scope
bull Benefit applied to extreme heat hazard for green infrastructure projects directly impacting residential or commercial properties
Table 14 lists other typical benefits for reducing impacts from climate stressors and basic guidance for how to estimate them See Section IIID for more information
97 FEMA standard values for avoided mental stress and anxiety and environmental open space values taken from FEMA BCA Toolkit Version 530 (Build Date 12222016)
98 CSO abatement cost taken from APG1 Report for NYC ldquoTechnical Approaches for Benefit-Cost Analysis of Hazard Mitigation Projects in Urban and Coastal Environmentsrdquo (April 2016)
99 Ecosystem Services Real Estate and Quality of LifeHealth benefits tend to be more applicable to green infrastructure measures that provide extreme heat benefits such as green roofs trees and other plantings
NYC Mayorrsquos Office of Recovery and Resiliency Climate Resiliency Design Guidelines
44APPENDIX 4 - PROJECT BENEFITS CATEGORIES
Table 15 ndash Potential benefits for extreme heat (Urban Heat Island) reduction measures
Category Benefit Basic Guidance for Estimating Values
Direct Benefit
Reduced Life Cycle Cost
bull Applicable only to measures such as green roofs that are expected to last longer than standard roofs
bull Compute total cost savings including annual OampM costs
Indirect Benefit
Energy Savings
bull Applicable to measures that reduce energy costs by providing cooling through increased shading andor evapotranspiration
bull Use New York Power Authority rates of $0148kWh for electricity and $0810Therm for natural gas
Other Potential Benefits
Air Quality bull Applicable to measures that absorb pollutants andor reduce carbon dioxide emissions
Acoustics bull Applicable to measures such as green roof or walls that reduce noise transfer
Quality of LifeHealth bull Potential quality of life benefits and related to improved public health
Real Estate bull Applicable to measures that provide residential real estate benefits from increased resilience of propertiesstreetscapesneighborhoods
Retail Sales Marketing
bull Applicable to measures that provide commercial property benefits from increased aesthetics resulting in increased marketing and sales for streetscapesneighborhoods
Tax Credits Incentives
bull Applicable to resilience or green infrastructure measures such as green roofs that have accompanying Federal State or City tax credits or other incentives
Table 15 lists potential benefits for reducing impacts from heat and basic guidance for how to estimate them See Section IIID for more information
NYC Mayorrsquos Office of Recovery and Resiliency Climate Resiliency Design Guidelines
45APPENDIX 4 - PROJECT BENEFITS CATEGORIES
Table 16 ndash Guidance on quantitative calculations for (1) sea level rise with coastal storm surge and (2) increased precipitation measures
Data Input General Guidance ndash Basic Description
Applicable Benefit Category
Applicable Typical Facility Typology
Dire
ct B
enefi
ts
Indi
rect
Ben
efits
Oth
er P
oten
tial
Ben
efits
Bui
ldin
g St
ruct
ures
Com
plex
Fa
cilit
ies
Tran
spor
tatio
nSt
reet
scap
es
Plaz
as
Park
Fea
ture
s
First Floor Elevation (FFE)
bull The elevation of the first finished floor of the structure excluding basements
bull FFE measured from top of lowest floor (riverinenon-coastal high hazard areas) or bottom of lowest horizontal structural member (coastal high hazard areas)
Y Y Y Y
Building Replacement Value (BRV)
bull The unit cost to rebuild a structure of the same quality of construction
bull Not the same as market value
Y Y Y Y
Building Size
bull The total floor area of the building in square feet
bull Total Building Value = BRV x Building Sizebull Typical BRVs for NYC range between $100 to
$325SF for residential buildings and $120 to $450SF for commercialpublic buildings
Y Y Y Y
Structure Description
bull The type of building number of stories and foundation type (full basement partial basement no basement)
bull Collect more detailed foundation data for coastal flood zones
Y Y Y Y
Building Use bull Details related to residential housing commercial business and public use
Y Y Y Y Y
Building Type bull The primary use of building ndash residential commercial public and others
Y Y Y Y Y
Depth Damage Function (DDF)
bull Curves used to estimate structure damage contents damage and displacement of residential buildings based on flood depth
bull DDFs selection based on Structure Description Building Type Building Use
bull Structure DDFs based on percentage of Total Building Value
bull Contents DDFs based on percentage of Total Contents Value
bull Displacement DDFs based on number of displacement days x Displacement Cost
Y Y Y Y Y
Contents Value
bull The cost to replace structure contents (furnishings equipment)
bull Residential building Contents Values typically 50 BRV (FEMA DDFs) or 100 BRV (USACE DDFs)
bull Non-residential building Contents Values between 18 to over 100 depending on building use (USACE DDFs)
bull Total Contents Value = BRV x Building Size
Y Y Y Y Y
Table 16 provides general guidance on how to quantitatively calculate benefits from efforts to address from climate stressors See Section IIIE for more information
NYC Mayorrsquos Office of Recovery and Resiliency Climate Resiliency Design Guidelines
46APPENDIX 4 - PROJECT BENEFITS CATEGORIES
Table 16 ndash Guidance on quantitative calculations for (1) sea level rise with coastal storm surge and (2) increased precipitation measures
Data Input General Guidance ndash Basic Description
Applicable Benefit Category
Applicable Typical Facility Typology
Dire
ct B
enefi
ts
Indi
rect
Ben
efits
Oth
er P
oten
tial
Ben
efits
Bui
ldin
g St
ruct
ures
Com
plex
Fa
cilit
ies
Tran
spor
tatio
nSt
reet
scap
es
Plaz
as
Park
Fea
ture
s
Number of Residents (Residential)
bull Total number of occupants in a residential building
bull Typically estimated based on number of residential units x average number of individuals per household (based on current US Census data or use 25 individuals per household as a default)
Y Y Y Y Y
Displacement Cost (Residential)
bull The unit cost to lodge and feed displaced residents while flood damage is repaired
bull Average unit displacement cost of $415residential unitday recommended based on current FY2018 GSA Per Diem rates for New York City
Y Y Y Y Y
Value of Service (Non-Residential and Public)
bull The unit cost of service disruption and rental of temporary facilities while flood damage is repaired
bull Disruption costs for non-residential buildings typically range from $095 to $136SFmonth and rental costs range from $020 to $136SFmonth depending on building use
bull Value of service for public buildings ($day) is typically based on the annual operating budget for the City agency using the building prorated based on building size or population served by the building then divided by 365 daysyear
Y Y Y Y
Value of Service (Critical Facilities)
bull The unit cost of critical facilities (police fire emergency medical services) lost or delayed while flood damage is repaired
Y Y Y
Value of Service Duration
bull The duration of service disruption and rental of temporary facilities for non-residential buildings and critical facilities while flood damage is repaired
bull For non-residential buildingso Value of Service Durations vary from
4 months to over 30 months based on building use and the depth of flooding
o Total Value of Service Loss = (Disruption Cost x Building Area) = (Rental Cost x Building Area x Value of Service Duration)
bull For public buildings and critical facilitieso Value of Service Durations vary from 0
days to 720 months based on building use and the depth of flooding from FEMA FIA or USACE DDFs
o Total Value of Service Loss = (Value of Service) x (Service Loss Duration)
Y Y Y
NYC Mayorrsquos Office of Recovery and Resiliency Climate Resiliency Design Guidelines
47APPENDIX 4 - PROJECT BENEFITS CATEGORIES
Table 16 ndash Guidance on quantitative calculations for (1) sea level rise with coastal storm surge and (2) increased precipitation measures
Data Input General Guidance ndash Basic Description
Applicable Benefit Category
Applicable Typical Facility Typology
Dire
ct B
enefi
ts
Indi
rect
Ben
efits
Oth
er P
oten
tial
Ben
efits
Bui
ldin
g St
ruct
ures
Com
plex
Fa
cilit
ies
Tran
spor
tatio
nSt
reet
scap
es
Plaz
as
Park
Fea
ture
s
Engineering Estimates for Damages
bull Engineered estimate models of physical damages and service losses at the project site based on the Guidelines event recurrence interval(s) and flood depth(s)
Y Y Y Y Y Y
Historic Damages and Service Losses
bull Historic physical damages and service losses at the project site documented from previous flood events
bull Do not use routine maintenancebull The historic damage event recurrence interval
(RIs) andor flood depths must be determined updated for inflation to the present value and adjusted to match the Guidelines event RIsflood depths
Y Y Y Y Y Y
Facility Replacement Value
bull The unit cost to rebuild the facility
Impacted Area bull The geographic area impacted by the facility in the event of failure in acres
Y Y Y Y
Facility Capacity
bull The design capacity of the facilitybull For example - facility capacity expressed in
millions of gallons per day (MGD) for water and wastewater facilities or megawatts (MW) for electrical facilities
Y Y Y Y
Service Population
bull The number of impacted residents served by the facility
bull Typically estimated based on number of impacted residential customers x average number of individuals per household (based on current US Census data or use 25 individuals per household as a default)
bull Facilities serving mostly non-residentialpublic buildings andor critical facilities should focus on service losses rather than service population
Y Y Y
NYC Mayorrsquos Office of Recovery and Resiliency Climate Resiliency Design Guidelines
48APPENDIX 4 - PROJECT BENEFITS CATEGORIES
Table 16 ndash Guidance on quantitative calculations for (1) sea level rise with coastal storm surge and (2) increased precipitation measures
Data Input General Guidance ndash Basic Description
Applicable Benefit Category
Applicable Typical Facility Typology
Dire
ct B
enefi
ts
Indi
rect
Ben
efits
Oth
er P
oten
tial
Ben
efits
Bui
ldin
g St
ruct
ures
Com
plex
Fa
cilit
ies
Tran
spor
tatio
nSt
reet
scap
es
Plaz
as
Park
Fea
ture
s
Value of Service
bull Unit value of service provided by the facilitybull Example of FEMA standard values for complete
loss of utility service $105personday for potable water$49personday for wastewater$148personday for electrical
bull Consider updating FEMA standard per capita values to reflect current The New York City utility rates
Y Y
Roadway Elevations bull Roadway Elevations
Y Y
Roadway Replacement Value
bull Roadway Replacement ValueY Y
Inundation Area Map
bull Inundation Area Map developed by FEMA or through modeling by project design team
Y Y Y
Building Inventory of Inundation Area
bull The number and type of buildings within the streetscape and neighborhood inundated by the Guidelinersquos flood events
Y Y Y
Average Daily Traffic (ADT)
bull The average number of one-way traffic trips per day along the roadway(s) within the streetscapeneighborhood inundated by the Guidelinersquos flood events
Y Y
Additional Travel Time
bull The additional travel time needed to detour around a flooded roadway expressed in minutes
bull In the unlikely event there is no detour available use a 12-hour travel time per one-way trap but provide a detailed area street map as supporting documentation
Y Y
Value of Traffic Delay
bull The value of service associated with lost time in traffic
bull For example - FEMA standard average value of $3344vehiclehour of delay
bull Consider updating FEMA and GSA standard values to reflect current New York City area labor rates and fuel costs
Y Y
NYC Mayorrsquos Office of Recovery and Resiliency Climate Resiliency Design Guidelines
49APPENDIX 4 - PROJECT BENEFITS CATEGORIES
Table 17 ndash Guidance on quantitative unit benefit calculations for extreme heat hazard measures
Measure General Guidance ndash Unit Benefit Information and Data Requirements
Applicable Benefit Category
Applicable Typical Facility Typology
Dire
ct B
enefi
ts
Indi
rect
Ben
efits
Oth
er P
oten
tial
Ben
efits
Bui
ldin
g St
ruct
ures
Com
plex
Fa
cilit
ies
Tran
spor
tatio
nSt
reet
scap
es
Plaz
as
Park
Fea
ture
s
Green Roof
bull Unit benefit range over PUL = $470SF to $373SF of green roof area ($719SF standard value)
bull Assumed PUL = 40 yearsbull Apply standard value unit benefit to green
roof area to estimate measure benefitbull Higher range values more applicable
to residential and commercial building streetscape projects
Y Y Y Y Y Y
Bioswale Rain Garden Meadow Mix
bull Unit benefit range over PUL = $396SF to $211SF of area ($730SF standard value)
bull Assumed PUL = 30 yearsbull Apply standard value unit benefit to bioswale
rain gardenmeadow mix area to estimate total measure benefit
Y Y Y Y Y Y
Cool Roof
bull Unit benefit range over PUL = $117 to $3151SF of material area ($144SF standard value)
bull Assumed PUL = 20 yearsbull Apply standard value unit benefit to cool roof
area to estimate total measure benefitbull Higher range values more applicable to
residential building streetscape projects
Y Y Y Y Y
Light-Colored PaversLight-Colored Materials
bull Unit benefit range over PUL = $0774 to $204SF of material area ($0866SF standard value)
bull Assumed PUL = 30 yearsbull Apply standard value unit benefit to material
area to estimate total measure benefit
Y Y Y Y
Table 17 provides general guidance on how to quantitatively calculate benefits from efforts to address climate stressors See Section IIIE for more information
NYC Mayorrsquos Office of Recovery and Resiliency Climate Resiliency Design Guidelines
50APPENDIX 4 - PROJECT BENEFITS CATEGORIES
Table 17 ndash Guidance on quantitative unit benefit calculations for extreme heat hazard measures
Measure General Guidance ndash Unit Benefit Information and Data Requirements
Applicable Benefit Category
Applicable Typical Facility Typology
Dire
ct B
enefi
ts
Indi
rect
Ben
efits
Oth
er P
oten
tial
Ben
efits
Bui
ldin
g St
ruct
ures
Com
plex
Fa
cilit
ies
Tran
spor
tatio
nSt
reet
scap
es
Plaz
as
Park
Fea
ture
s
Tree Planting
bull Unit benefit range over PUL = $1005 to $77154Tree ($1855Tree standard value)
bull Assumed PUL = 30 yearsbull Apply standard value unit benefit to number of
trees to estimate total measure benefitbull Higher range values more applicable
to residential and commercial building streetscape projects
Y Y Y Y Y Y
Planter Box Tree
bull Unit benefit range over PUL = $212 to 16304Tree ($392Tree standard value)
bull Assumed PUL = 15 yearsbull Apply standard value unit benefit to number of
trees to estimate total measure benefitbull Higher range values more applicable
to residential and commercial building streetscape projects
Y Y Y Y Y
Shade Canopy
bull Unit benefit range over PUL = $0363 to $396SF ($0458SF standard value)
bull Assumed PUL = 15 yearsbull Apply standard value unit benefit to area of
shade canopy estimate total measure benefitbull Higher range values more applicable
to residential and commercial building streetscape projects
Y Y Y Y
Permeable Grass Pavers
bull Unit benefit range over PUL = $0258SF to $0521SF of pavers ($0363SF standard value)
bull Assumed PUL = 30 yearsbull Apply standard value unit benefit to paver
area to estimate total measure benefit
Y Y Y Y Y
For the purposes of the BCA refer to the following facility typologies bull ldquoBuilding Structuresrdquo include critical small building sites such as EMS or FDNY stations and non-critical small building sites such as
libraries or comfort stationsbull ldquoComplex Facilitiesrdquo include critical infrastructure such as wastewater treatment sites pump stations water filtration plants and similar
large or complex facilitiesbull ldquoTransportationStreetscapePlazasrdquo include roadway reconstruction streetscape improvements street raising plazas and other
transportation-related infrastructurebull ldquoPark Featuresrdquo include parks and similar public recreational facility with natural landscape features
NYC Mayorrsquos Office of Recovery and Resiliency Climate Resiliency Design Guidelines
51APPENDIX 5 - EXAMPLE PLANNING DECISION TREE
This decision tree provides a summarized example approach for how to implement these Guidelines Projects with a total cost greater than $50 million are recommended to conduct a full qualitative and quantitative climate change risk assessment and BCA while projects below $50 million are recommended to conduct a qualitative risk assessment and BCA
Define Project
1) Operational goals and criticality level2) Useful life3) Location in the current flood plain future floodplain and or zone
of tidal inundation and the project arearsquos score on the heat vulnerability index
Evaluate Project Risks According to Probability and Magnitude of Consequence
bull Extreme Heat bull Precipitationbull Sea Level Risebull Coastal Surge
High Level Identification and Assessment of Risk Mitigation Alternatives and Co-benefits
(qualitative)
Detailed Identification and Assessment of Risk Mitigation Alternatives and Co-benefits (qualitative and quantitative)
High Level Estimate of Costs and Benefits of Design Alternatives
(qualitative)
Detailed Estimate of Costs and Benefits of Design Alternatives
(qualitative and quantitative)
Decision Point Which climate change risks require mitigation
Decision Point Evaluate risk mitigation benefits and costs to
determine final resilient design alternative or if no action is required
Decision Point Is the total project cost above $50 million
Below $50 million Above $50 million
APPENDIX 5 - EXAMPLE PLANNING DECISION TREE
NYC Mayorrsquos Office of Recovery and Resiliency Climate Resiliency Design Guidelines
52
Project Title
Design Strategies Checklist (not exhaustive)
Extreme Heat Comments Extreme Precipitation Comments Sea Level Rise amp Storm Surge Comments
Select Site in Low Heat Vulnerability Index area Select High Elevation Site Select High Elevation Site
Minimize East-West Building Orientation Green Roof Raise Building Floor Elevation
Passive Solar Cooling and Ventilation Systems
Protect Below Grade Areas from Flooding Waterproof Building Envelope
Cool Roof (SRI appropriate) On-site Stormwater Management (gray) Elevate Critical Building Functions
Green Roof (extensive) Reduce Impervious Areas Elevate Critical Equipment
Vegetative Structures Permeable Pavement Perimeter Floodwall100 Levee (passive or active)
Enhanced HVAC System including space layout optimization and system scalability
Increase Green Spaces and Planted Areas DryWet Floodproofing
More Efficient Building Envelope Other Utility Redundancy Design101
Parking Lot Shading Resilient Materials amp Landscape Treatments
Light Colored Pavements (appropriate SRI) Design for Storm Surge Outflow
Increase Planted Areas Install Backwater Flow Prevention
Permeable Surfaces Design for Scour
Open-grid Pavement Raise Road Elevation
Other Other
This appendix provides a template for identifying possible design strategies to address climate change risks as described throughout the Guidelines
APPENDIX 6 - DESIGN STRATEGIES CHECKLIST
100 Permanent perimeter flood walls are not permitted to meet floodproofing requirements in buildings with substantial improvements andor damages 101 Utility redundancy design should be pursued for critical systems not all building systems
APPENDIX 6 - DESIGN STRATEGIES CHECKLIST
NYC Mayorrsquos Office of Recovery and Resiliency Climate Resiliency Design Guidelines
53APPENDIX 7 - CLIMATE CHANGE RISK ASSESSMENT RESOURCES
These Guidelines provide data on climate change hazards and recommend how that data can inform resilient design A risk assessment is a tool to help project managers and designers evaluate risk levels as well as select and prioritize resilient design strategies A high level risk assessment is recommended for all City capital projects with a total cost of under $50 million Projects above $50 million are recommended to conduct an in-depth assessment
Risk assessments use quantified estimates of the probability and magnitude of consequence of an event occurring to prioritize responses ldquoProbabilityrdquo is an assessment of the likelihood of a hazard occurring while ldquomagnituderdquo describes the hazardrsquos potential impact Risk assessment tools such as the examples listed below can be used to define and score these categories Projects that score higher across both probability and magnitude can be prioritized for investment and risk mitigation action Projects that score lower across both criteria may require no action beyond meeting code The results are typically charted on a risk matrix and an example is provided on the next page
The climate change risk management frameworks below offer templates for how to integrate climate change projections into a risk assessment process Refer to these resources for examples and further information
bull Vulnerability Assessment and Adaptation Framework is prepared by the Federal Highway Administration (FHWA) While developed for transportation planning this risk assessment framework has broad applicability for evaluating asset vulnerability to climate change Available at httpswwwfhwadotgovenvironmentsustainabilityresilienceadaptation_framework
bull US Climate Resilience Toolkit The US Global Change Research Program offers a step by step risk assessment
framework including tools and case studies at httpstoolkitclimategovsteps (see example on next page)
bull Coast Adapt Guidance on undertaking a risk assessment High level assessment httpscoastadaptcomausitesdefaultfilesfactsheetsT3M4_2_2nd_pass_risk_assessmentpdfDetailed assessment httpscoastadaptcomausitesdefaultfilesfactsheetsT3M4_3_3rd_pass_risk_assessmentpdf
bull Climate adaptation Risk uncertainty and decision-makingDownload the report here httpswwwukciporgukpublicationsRisk
The City plans to develop a NYC-specific process for integrating climate change data into existing risk management processes by April 2019
APPENDIX 7 - CLIMATE CHANGE RISK ASSESSMENT RESOURCES
NYC Mayorrsquos Office of Recovery and Resiliency Climate Resiliency Design Guidelines
54APPENDIX 7 - CLIMATE CHANGE RISK ASSESSMENT RESOURCES
The Risk Characterization Matrix below is an example from the US Climate Resilience Toolkit This tool can be used to assess the probability and magnitude of impact for identified risks The risk of coincident climate stressorsrisks (such as storm surge plus increased precipitation) can also be assessed as applicable
Figure 14 - Example of a climate change risk matrix (adapted from US Climate Resilience Toolkit)
Project teams can determine the magnitude of the impact (along the horizontal scale of 1 through 3 with 3 being the most severe) and the probabilitylikelihood of occurrence for each specific risk (along the vertical scale with 3 being the most likely) A score is typically assigned for each risk (Probabil-ity x Magnitude) and then charted on the matrix Based on the estimated probability and magnitude of consequence above the risks are ranked and prioritized for mitigation Factors to bear in mind include
bull Not all facility typologies have the same level of functional and operational importance during events or tolerance for disruption
bull Not all climate stressors and risks have the same level of impact on each project sitebull Not all identified risks can or should be mitigated fully
NYC Mayorrsquos Office of Recovery and Resiliency Climate Resiliency Design Guidelines
55WORKS CITED
A Stronger More Resilient New York PlaNYC Report of the NYC Special Initiative for Rebuilding and Resiliency The City of New York 2013
ldquoAccount for Climate Riskrdquo International Finance Corporation accessed March 27 2017 httpwwwifcorgwpswcmconnectTopics_Ext_ContentIFC_External_Corporate_SiteClimate+Business
PrioritiesAccount+for+Climate+Risk
American Society of Heating Refrigeration and Air-Conditioning Engineers (ASHRAE) Handbook -Fundamentals 2017
ldquoBaseline Standard Economic Value Methodology Reportrdquo Federal Emergency Management Agency July 2016
Benefit Cost Analysis Toolkit Software Version 530 Federal Emergency Management Agency (build date December 2016)
Criteria for Detention Facility Design New York City Department of Environmental Protection November 2012
Community Resilience Planning Guide for Buildings and Infrastructure Systems Vol 1 NIST Special Publication 1190 US Department of Commerce 2016
Cool and Green Roofing Manual NYC Department of Design and Construction 2007 httpwwwnycgovhtmlddcdownloadspdfcool_green_roof_manpdf
Building Resiliency Task Force US Urban Green Building Council New York 2013 httpurbangreencouncilforcecomBuildingResiliency
Design and Planning for Flood Resiliency Guidelines for NYC Parks New York City Department of Parks and Recreation 2017
httpswwwnycgovparksorgplanning-and-buildingplanningresiliency-plansflood-resiliency
Flooded Bus Barns and Buckled Rails Federal Transit Administration Office of Budget and Policy 2011 httpswwwhsdlorgabstractampdid=685187
Floodproofing Non-Residential Buildings FEMA P936 FEMA 2013 httpswwwfemagovmedia-library-data9a50c534fc5895799321dcdd4b6083e7P-936_8-20-13_508rpdf
ldquoGlossaryrdquo International Infrastructure Management Manual National Asset Management Support Group New Zealand 2011 httpwwwipweaorg
ldquoGreen Roof Metrics Draft Reportrdquo New York City Department of Parks and Recreation 2017
ldquoGuide to Rain Event Preparednessrdquo NYC Department of Environmental Protection httpwwwnycgovhtmldeppdfbrochuresflood-preparedness-flyerpdf
ldquoGuidelines and Discount Rates for Benefit-Cost Analysis of Federal Programsrdquo Appendix C Circular A-94 US Office of Management and Budget (OMB) 2017
ldquoGuidelines for the Design and Construction of Stormwater Management Systemsrdquo New York City Department of Environmental Protection July 2012
Horton R et al New York City Panel on Climate Change 2015 Report Ann NY Acad Sci ISSN 0077-892 New York 2015
Madrigano J et al ldquoA case-only study of vulnerability to heat wavendashrelated mortality in New York City (2000ndash2011)rdquo Environmental Health Perspectives 123672ndash678 2013
WORKS CITED
NYC Mayorrsquos Office of Recovery and Resiliency Climate Resiliency Design Guidelines
56WORKS CITED
enspMcGregor et al Two Degrees The Built Environment and Our Changing Climate Routledge Press 2013
NYC Green Codes Task Force US Green Building Council New York 2010 httpurbangreencouncilorgGreenCodes
NYCrsquos Risk Landscape A Guide to Hazard Mitigation NYC Emergency Management 2014
One New York The Plan for a Strong and Just City The City of New York 2015 httpwwwnycgovhtmlonenyc downloadspdfpublicationsOneNYCpdf
Ready to Respond Strategies for Multifamily Building Resilience Enterprise Green Communities 2015 httpswwwenterprisecommunityorgresources
Rosenzweig C et al Climate Change Adaptation in New York City Building a Risk Management Response New York City Panel on Climate Change 2010
httponlinelibrarywileycomdoi101111nyas20101196issue-1 issuetoc
ldquoSustainable Infrastructure Management Program Learning Environmentrdquo Water Environment Research Foundation accessed March 24 2017 httpsimplewerforg
Urban Waterfront Adaptive Strategies NYC Department of City Planning 2013 httpwww1nycgovsiteplanningplanssustainable-communitiesclimate-resiliencepagetab=1
Wastewater Resiliency Plan Climate Risk Assessment and Adaptation Study New York City Department of Environmental Protection October 2013
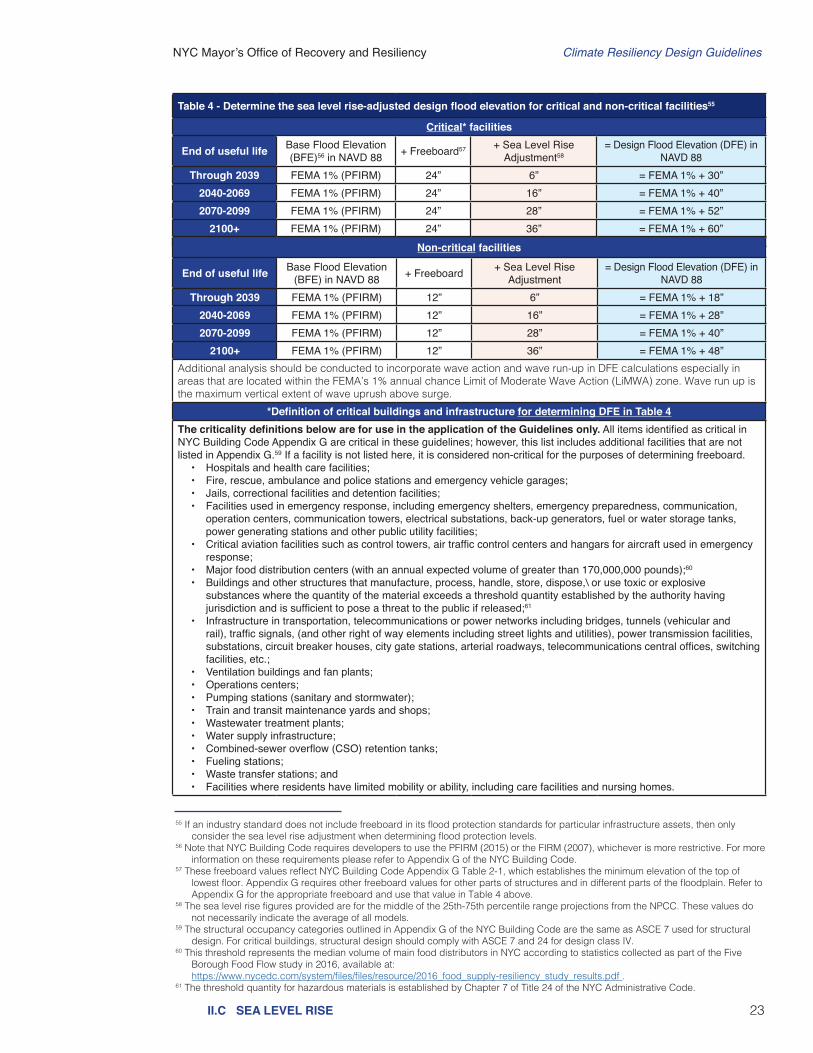
NYC Mayorrsquos Office of Recovery and Resiliency Climate Resiliency Design Guidelines
23IIC SEA LEVEL RISE
Table 4 - Determine the sea level rise-adjusted design flood elevation for critical and non-critical facilities55
Critical facilities
End of useful life Base Flood Elevation (BFE)56 in NAVD 88 + Freeboard57 + Sea Level Rise
Adjustment58= Design Flood Elevation (DFE) in
NAVD 88Through 2039 FEMA 1 (PFIRM) 24rdquo 6rdquo = FEMA 1 + 30rdquo
2040-2069 FEMA 1 (PFIRM) 24rdquo 16rdquo = FEMA 1 + 40rdquo2070-2099 FEMA 1 (PFIRM) 24rdquo 28rdquo = FEMA 1 + 52rdquo
2100+ FEMA 1 (PFIRM) 24rdquo 36rdquo = FEMA 1 + 60rdquoNon-critical facilities
End of useful life Base Flood Elevation (BFE) in NAVD 88 + Freeboard + Sea Level Rise
Adjustment = Design Flood Elevation (DFE) in
NAVD 88Through 2039 FEMA 1 (PFIRM) 12rdquo 6rdquo = FEMA 1 + 18rdquo
2040-2069 FEMA 1 (PFIRM) 12rdquo 16rdquo = FEMA 1 + 28rdquo2070-2099 FEMA 1 (PFIRM) 12rdquo 28rdquo = FEMA 1 + 40rdquo
2100+ FEMA 1 (PFIRM) 12rdquo 36rdquo = FEMA 1 + 48rdquoAdditional analysis should be conducted to incorporate wave action and wave run-up in DFE calculations especially in areas that are located within the FEMArsquos 1 annual chance Limit of Moderate Wave Action (LiMWA) zone Wave run up is the maximum vertical extent of wave uprush above surge
Definition of critical buildings and infrastructure for determining DFE in Table 4The criticality definitions below are for use in the application of the Guidelines only All items identified as critical in NYC Building Code Appendix G are critical in these guidelines however this list includes additional facilities that are not listed in Appendix G59 If a facility is not listed here it is considered non-critical for the purposes of determining freeboard
bull Hospitals and health care facilitiesbull Fire rescue ambulance and police stations and emergency vehicle garages bull Jails correctional facilities and detention facilities bull Facilities used in emergency response including emergency shelters emergency preparedness communication
operation centers communication towers electrical substations back-up generators fuel or water storage tanks power generating stations and other public utility facilities
bull Critical aviation facilities such as control towers air traffic control centers and hangars for aircraft used in emergency response
bull Major food distribution centers (with an annual expected volume of greater than 170000000 pounds)60 bull Buildings and other structures that manufacture process handle store dispose or use toxic or explosive
substances where the quantity of the material exceeds a threshold quantity established by the authority having jurisdiction and is sufficient to pose a threat to the public if released61
bull Infrastructure in transportation telecommunications or power networks including bridges tunnels (vehicular and rail) traffic signals (and other right of way elements including street lights and utilities) power transmission facilities substations circuit breaker houses city gate stations arterial roadways telecommunications central offices switching facilities etc
bull Ventilation buildings and fan plantsbull Operations centersbull Pumping stations (sanitary and stormwater)bull Train and transit maintenance yards and shopsbull Wastewater treatment plantsbull Water supply infrastructurebull Combined-sewer overflow (CSO) retention tanksbull Fueling stationsbull Waste transfer stations and bull Facilities where residents have limited mobility or ability including care facilities and nursing homes
55 If an industry standard does not include freeboard in its flood protection standards for particular infrastructure assets then only consider the sea level rise adjustment when determining flood protection levels
56 Note that NYC Building Code requires developers to use the PFIRM (2015) or the FIRM (2007) whichever is more restrictive For more information on these requirements please refer to Appendix G of the NYC Building Code
57 These freeboard values reflect NYC Building Code Appendix G Table 2-1 which establishes the minimum elevation of the top of lowest floor Appendix G requires other freeboard values for other parts of structures and in different parts of the floodplain Refer to Appendix G for the appropriate freeboard and use that value in Table 4 above
58 The sea level rise figures provided are for the middle of the 25th-75th percentile range projections from the NPCC These values do not necessarily indicate the average of all models
59 The structural occupancy categories outlined in Appendix G of the NYC Building Code are the same as ASCE 7 used for structural design For critical buildings structural design should comply with ASCE 7 and 24 for design class IV
60 This threshold represents the median volume of main food distributors in NYC according to statistics collected as part of the Five Borough Food Flow study in 2016 available at
httpswwwnycedccomsystemfilesfilesresource2016_food_supply-resiliency_study_resultspdf 61 The threshold quantity for hazardous materials is established by Chapter 7 of Title 24 of the NYC Administrative Code
NYC Mayorrsquos Office of Recovery and Resiliency Climate Resiliency Design Guidelines
24IIC SEA LEVEL RISE
Figure 9 ndash Outdoor emergency generator for the critical building
This case study provides an example of how to calculate a sea level rise-adjusted DFE based on the useful life of a hypothetical critical services building and its primary component
Step 1 Organize the site by various critical or primary components and their year of construction Determine their useful life along with the associated future year scenario for flood risk assessment In this example the building structure and the outside emergency generator are the most at-risk components from combined sea level rise and coastal storm surge
Step 2 Overlay the site footprint area over the effective current PFIRM or FIRM and the corresponding future year scenario FEMA 1 to identify flood risk to the site From overlaying the 2015 preliminary FEMA floodplain over the site it was determined that the site has a 1 annual chance of flooding with a base flood elevation of 13rsquo NAVD Step 3 Evaluate the criticality of each primary component of the facility based on the Guidelinesrsquo definition for critical infrastructure (Table 4) This (hypothetical) building is critical
Step 4 Use Table 4 to determine the sea level rise adjustment and freeboard requirements for each component and calculate the DFE for each that corresponds to its useful life period
Step 5 Compare the DFE of each component and the associated Guidelinesrsquo recommended DFE to calculate anticipated flood depth
CASE STUDY Adjusting the DFE for Sea Level Rise
Table 5 ndash Example of how to calculate a sea level rise-adjusted DFE for a critical facility
Construction year Components Useful
Life
Future Year Scenario
[Useful Life + Const
Year]
BFE in NAVD
88 (feet)
Freeboard + Sea
Level Rise Adjustment
(feet)
Adjusted DFE in
NAVD 88 (feet)
2010 Building Structure
70 years 2070-2099 130rsquo 2rsquo+23rsquo 173rsquo
2010Outdoor
Emergency Generator
25 years
Through 2039 130rsquo 2rsquo+05rsquo 155rsquo
Figure 8 - Example of how to locate a facility within the current floodplain and determine the BFE Figure 9 (inset) - Outdoor emergency generator at the facility
Figure 10 - This schematic shows how to determine the design flood elevation of a facility within the current 1 floodplain
Illustrative not to scale
NYC Mayorrsquos Office of Recovery and Resiliency Climate Resiliency Design Guidelines
25IIC SEA LEVEL RISE
Figure 11 - Flood Hazard Mapper with future 1 annual chance floodplain (adjusted for sea level rise) at httpwwwnycgovfloodhazardmapper
b) If the site is not in the future floodplain no flood protection is required for this facility
- OR - If the site is in the future floodplain identify the nearest adjacent base flood
elevation at the project site in the current 1 annual chance floodplain (PFIRM 2015) using the Flood Hazard Mapper62
c) Use Table 4 to determine the DFE Add freeboard and the sea level rise-adjustment to the nearest adjacent BFE on the
current 1 annual chance floodplain (PFIRM 2015) to determine the DFE
d) Apply the DFE calculation from Table 4 to the protected facility See Figures 12 and 13 for an illustration of how to calculate the DFE
62 Maps of future floodplains show the impacts of sea level rise alone and do not consider how changes in stormsrsquo climatology might also affect wave action and the full extent of the floodplain
3 Addressing risks in the future floodplainIf the facility is not in the current 1 annual chance floodplain (PFIRM 2015) it may still be at risk in the future from flooding as sea level rise increases the extent of the floodplain Follow the steps below to determine if your facility is located in the future floodplain and if so what sea level rise-adjusted DFE to use
a) Use the Flood Hazard Mapper (httpwwwnycgovfloodhazardmapper) to determine if the facility site will be in the future 1 annual chance floodplain
Assess if by the end of the facilityrsquos useful life the floodplain is projected to increase to encompass all or part of the project site For example if the useful life ends between 2040 and 2069 choose the 2050s floodplain map Refer to the steps in Figure 11 below
NYC Mayorrsquos Office of Recovery and Resiliency Climate Resiliency Design Guidelines
26IIC SEA LEVEL RISE
Figure 12 - This schematic map shows how to locate the nearest adjacent 1 floodplain elevation
Figure 13 -This schematic shows how to determine the design flood elevation of a facility that is outside of the current 1 floodplain
CASE STUDY Identifying a Base Flood Elevation (BFE) in the Future Floodplain
Illustrative not to scale
NYC Mayorrsquos Office of Recovery and Resiliency Climate Resiliency Design Guidelines
27IIC SEA LEVEL RISE
4 Identify appropriate design interventions
63 Additional resources for identifying adaptive strategies Urban Waterfront Adaptive Strategies (NYC Department of City Planning httpswww1nycgovassetsplanningdownloadpdfplans-studiessustainable-communitiesclimate-resilienceurban_waterfrontpdf Floodproofing Non-Residential Buildings (FEMA) at httpswwwfemagovmedia-libraryassetsdocuments34270 Ready to Respond Strategies for Multifamily Building Resilience (Enterprise Green Community) at
httpwwwenterprisecommunityorgresourcesready-respond-strategies-multifamily-building-resilience-1335664 While natural systems-based approaches ameliorate flooding their use for storm surge or wave mitigation would need to be quantified
before contributing towards the design flood elevation 65 For more information see FEMArsquos Floodproofing Non-Residential Buildings at httpswwwfemagovmedia-libraryassetsdocuments34270
Operational requirements and continuity plans can inform the selection of appropriate design interventions particularly in terms of how quickly a site needs to be up and running after a flood event Some examples of how functional uses can pair with interventions include
bull A facility that needs to be operating during or immediately after a flood event may need to be dry floodproofed using permanent barriers or designed for passive survivability (such as a police or fire station)
bull A facility that needs to recover quickly after an event could elevate prioritized equipment and have deployable barriers
bull A site that can recover over a longer duration of time could be temporarily inundated during an event (such as parks or plazas) The use of resilient materials and strategies can reduce costly damage caused by temporary inundation
Different design interventions should be chosen based on the specific operational requirements of the project however these must meet the ASCE 24 design requirements for Coastal VE Zones
For all projects at risk of current or future flooding select protections that meet the projectrsquos design flood elevation Consider project-specific factors including the site location operational requirements existing continuity planning and cost63 A Design Strategies Checklist in Appendix 6 is available for use as a resource to track possible design approaches Some examples of design alternatives are
bull Site relocation where feasible conduct alternative site analysis
bull Permanent barriers at a site (eg floodwalls)
bull Deployable flood barriers (eg stop logs flood doorsgates inflatable barriers)
bull Natural systems-based approaches (eg living shorelines restored wetlands)64
bull Prioritized protection of electrical mechanical and other critical or costly-to-replace equipment above the design flood elevation (eg motors and controller boilers and furnaces fuel storage tanks duct work alarm systems and suppression equipment electrical panels electrical distribution and switching areas gas and electric meters telecommunications equipment chemical feed equipment HVAC units and emergency generators)65
bull Dry floodproofing design a facility to prevent water from entering
bull Wet floodproofing design a facility to permit floodwaters to flow in and out of the structure without causing significant damage (eg elevate or protect critical equipment use water-resistant building materials below the design flood elevation include flood vents and pumps)
bull Design redundant telecommunications conduit entrances for multiple carrier entry Telecom conduit should run to diverse manholes when possible
bull Install backup power for telecom equipment with design consideration for such equipment (eg installation above DFE)
bull Install outdoor-rated disconnect switch for telecommunications equipment on the roofbull Explore interventions to protect underground utilities and other telecommunications
facilities from water damagebull Install backflow preventers backwater valves and sump pumps for all buildings and
infrastructure in the floodplain as well as behind flood barriersbull Shoreline improvements that reduce the height of waves or attenuate waves where
feasible
NYC Mayorrsquos Office of Recovery and Resiliency Climate Resiliency Design Guidelines
28IIIA GENERAL METHODOLOGY TO ESTIMATE PROJECT BENEFITSIIIB CATEGORIES OF PROJECT BENEFITS
Designing and constructing facilities to handle the future climate loads above the current NYC codes and standards based on projected useful life of the components provides resiliency benefits The incremental costs to implement the Guidelinesrsquo recommended design interventions should be compared with the incremental benefits to aid agencies in making decisions about resilient design strategies The project design team should evaluate benefits of the interventions designed to meet Guidelinesrsquo recommended criteria for all the climate stressors qualitatively andor quantitatively For projects with construction costs below $50 million the project design team is recommended to perform a qualitative benefits assessment on the interventions that meet the Guidelinesrsquo recommendations for all applicable climate stressors For critical facilities or projects with construction costs over $50 million the project design team is recommended to perform quantitative benefit calculations to identify the optimal interventions that meet Guidelinesrsquo recommended design criteria
A GENERAL METHODOLOGY TO ESTIMATE PROJECT BENEFITSThis general methodology to perform qualitative and quantitative benefit calculations is recommended for use by project design teams at the beginning of and during the design process This methodology enables estimation of project benefits for a high-level benefit-cost analysis (BCA) that can be applied to evaluate and compare resiliency features designed to address sea level rise with coastal storm surge increased precipitation and extreme heat events The type of benefits provided by interventions designed to meet the Guidelinesrsquo design criteria can vary by climate stressors and typology of the facilities The main guiding principle in development of the high-level BCA methodologies included in these Guidelines was to balance simplicity with accuracy The project benefits categories identified within the methodology may not cover all the potential benefits provided by every facility type within NYC In particular the benefits of planning for increased precipitation are difficult to quantify Hence the project design team should use their discretion to modify this general benefit calculation methodology as needed to meet their project goals and objectives The project design team should develop appropriate input data whether quantitative or qualitative needed to estimate project benefits
B CATEGORIES OF PROJECT BENEFITSThere are three types of project benefit categories - direct benefits indirect benefits and other benefits - that can be used to perform qualitative assessments and develop quantitative estimates of monetary benefits for intervention alternatives designed to meet the Guidelinesrsquo recommendations These project benefit categories will help to perform a high-level benefit-cost analysis that balances accuracy with an appropriate level of effort
bull Direct Benefits include reduced or avoided physical damages to facilities and contents reduced or avoided displacements for residential structures and reduced life cycle or OampM costs that can be quantified as a primary result of implementing a specific hazard mitigation measure Table 12 in Appendix 4 provides a list of direct benefits and basic guidance on estimating and documenting values for sea level rise and increased precipitation-related flood hazards Note that given the current state of practice it is not possible to quantify reduced or avoided physical damages or residential displacements that result from a specific extreme heat mitigation measures Therefore direct benefits applicable to extreme heat hazards are limited to reduced life cycle costs applicable to certain measures such as green roofs Refer to Table 15 for details on direct benefits for extreme heat hazards
III EVALUATION OF PROJECT BENEFITS
NYC Mayorrsquos Office of Recovery and Resiliency Climate Resiliency Design Guidelines
29IIIB CATEGORIES OF PROJECT BENEFITS
bull Indirect Benefits include reduced or avoided service losses for non-residential
buildings public facilities andor infrastructure (utilities roads and bridges) based on the value of service continuity andor emergency services to New Yorkers that can be quantified as a secondary result of implementing a specific hazard mitigation measure Table 13 in Appendix 4 provides a list of indirect benefits and basic guidance on estimating and documenting values for sea level rise and increased precipitation-related flood hazards Note that given the current state of practice on extreme heat it is not possible to quantify reduced or avoided service losses that result from a specific extreme heat mitigation measures Therefore indirect benefits applicable to extreme heat hazards are limited to reduced energy costs such as cool roofs green roofs or shade trees Refer to Table 15 in Appendix 4 for details on indirect benefits for extreme heat hazards
bull Other Benefits where applicable other potential benefits may include social benefits for residents such as avoided stress and anxiety avoided lost productivity environmentalecosystem service benefits avoided need for emergency services and other potential benefits that can be estimated as a result of implementing a specific hazard mitigation measure Table 14 in Appendix 4 provides a list of other potential benefits and basic guidance on estimating and documenting values for sea level rise and increased precipitation-related flood hazards
Note on the ecosystem service benefit category in Table 14 the stormwater management benefits of green infrastructure should be distributed between the extreme heat and increased precipitation hazards since these measures provide both significant reductions in rainfall runoff as well as Urban Heat Island mitigation through evapotranspiration However there is currently limited data available to quantify the actual distribution of stormwater management benefits between the two hazards For various dual-benefit providing interventions careful considerations should be given to identify the appropriate benefits category provided by the intervention with a goal to avoid duplication of quantified benefits In this methodology the stormwater management benefits of green infrastructure are applied to the increased precipitation hazard in order to avoid a duplication of benefits Note on real estate and quality of life benefits additionally it is important to note that two potential benefit categories shown in Table 14 - real estate and quality of lifehealthavoided casualties - were not included in the current BCA methodology for sea level rise or increased precipitation hazards Although these categories could increase project benefits for sea level rise and increased precipitation hazards they were only applied to measures that address extreme heat hazards such as green roofs trees and other plantings Refer to Table 15 for a detailed summary of other benefit categories quantified as unit benefits for extreme heat hazards
NYC Mayorrsquos Office of Recovery and Resiliency Climate Resiliency Design Guidelines
30IIIC WHICH METHODOLOGY TO USEIIID BCA METHODOLOGY FOR PROJECTS UNDER $50 MILLION
D BCA methodology for projects under $50 millionThe project design team should develop design alternatives to meet the Guidelinesrsquo criteria which may be in excess of NYC code and standards requirements (baseline conditions) It is assumed that the project design team will develop alternatives to address each of the following applicable climate stressors - sea level risecoastal storm surge increased precipitation and extreme heat - separately Tables 12-15 in Appendix 4 provides a list of typical direct indirect and other benefits provided by various intervention typologies to reduce impacts from climate stressors During the qualitative assessment the project design team should consider that intervention strategies will have varying levels of reliability effectiveness benefits and cost implications during the qualitative assessment
The project design team is recommended to develop appropriate evaluation criteria and metrics for each of the applicable project benefit categories For each alternative the project design team could use either a scoring weighting ranking or other type of qualitative assessment framework to assess each applicable project benefit categories with the developed evaluation criteria and metrics Table 6 provides an example template to evaluate alternatives using a set of general evaluation criteria and metrics using a color-coded rating system (and see Table 7 for an example of how to complete the template) The project design team can utilize a similar template customized to their project goals and objectives This assessment allows agencies to screen the qualitative benefits for various alternatives that would then lead to development of final project components to match the available budget and goals of the project
Projects with total costs below $50 million recommended to conduct a qualitative assessment to identify the optimal interventions that meet Guidelinesrsquo design criteria using the ldquoD) BCA methodology for projects under $50 millionrdquo methodology below
C WHICH METHODOLOGY TO USEProjects with a total cost above $50 million or are highly complex or critical facilities recommended to conduct both a qualitative and quantitative benefit calculation to identify the optimal interventions that meet Guidelinersquos design criteria using the ldquoE) BCA methodology for projects above $50 millionrdquo below A quantitative BCA also must include qualitative factors
NYC Mayorrsquos Office of Recovery and Resiliency Climate Resiliency Design Guidelines
31IIID BCA METHODOLOGY FOR PROJECTS UNDER $50 MILLION
Qualitative Color Scale Green=Least resource intensive alternative Purple=most resource intensive yellow=medium level of resource intensity
Qualitative Evaluation Factors Description Relative Color Rating System
First CostsAdditional construction costs needed to incorporate Guidelinesrsquo recommended resilient design over the baseline project costs
Highest cost ($$$) rated as Purple whereas lowest cost ($) rated as Green
ConstructabilityEase of Implementation
Construction techniques and site conditions such as presence of major utilities conflicts and other conditions which dictate the level of constructability required for each alternative
Difficult to construct rated as Purple whereas easiest to construct rated as Green
Environmental ImpactsCo-BenefitsPermitting
Impacts to the built and natural environment such as circulation noise and hazardous waste plus the level of effort required for permitting (eg interventions in water require highest level of permitting requirement) from each alternative in addition to the baseline project condition
Highest environmental impacts and highest level of effort required for permitting rated as Purple whereas the least impact and level of effort rated as Green
Operation and Maintenance (OampM)
Level of effort of additional manpower and cost of OampM for the alternatives over the baseline project OampM requirements
Highest level of effort and cost for OampM rated as Purple whereas the lowest is rated as Green
Reliability and Durability
Interventions that do not require human involvement or a facilityrsquos ability to withstand all the forces during a storm event (eg permanent solutions with higher reliability than deployable solution)
Interventions requiring human involvement (active measures) rated as Purple whereas interventions with minimal or no human involvement (passive measures) rated as Green
Risk Reduction Benefits Monetary benefits provided by each intervention alternative in avoided damages over the baseline condition
Lowest potential monetary benefit rated as Purple whereas as highest potential monetary benefit rated as Green
Quality of Life BenefitsVisual Aesthetics
Benefits either to the community such as recreation or safety or serve the community during emergency situations
Lowest potential quality of life benefits rated as Purple whereas as highest potential benefits rated as Green
Table 6 ndash Evaluation matrix for comparison of mitigation alternatives across the useful life of a project
Project title_______________________________________________________________________________
Evaluation Criteria
Baseline Condition (Designed to NYC Building Code and
Standards)
Resilient Design Alternatives for Managing__________________
Alternative 1
Alternative 2
Alternative 3
First Costs
ConstructabilityEase of ImplementationEnvironmental ImpactsCo-BenefitsPermitting
Operation and Maintenance (OampM)
Reliability and Durability
Risk Reduction Benefits
Quality of Life BenefitsVisual Aesthetics
NYC Mayorrsquos Office of Recovery and Resiliency Climate Resiliency Design Guidelines
32IIID BCA METHODOLOGY FOR PROJECTS UNDER $50 MILLION
Table 7 ndash Evaluation matrix for comparison of mitigation alternatives across the useful life of a project - COMPLETED EXAMPLE
Evaluation Criteria
Baseline Condition (Designed to NYC Building Code and
Standards)
Resilient Design Alternatives for Managing Coastal SurgeSLR
Alternative 1Flood proof building built on grade to Guidelines
DFE
Alternative 2 Elevate building structure above Guidelinesrsquo DFE
on columns
Alternative 3 Raise site grade by filing the building site footprint
to Guidelinesrsquo DFE
First CostsBaseline cost for building structure is $15 million
Incremental costs are within 5 over the baseline costs
Incremental costs are between 5-10 over baseline costs
Incremental costs are 20 and more over baseline costs
ConstructabilityEase of Implementation
Relatively easy to construct within site constraints
Similar to baseline conditions since construction requires additional flood proofing only
Moderate challenges to construct foundation structure for columns within site constraints
Extremely challenging to construct within the site constraints Potentially fatal flaw
Environmental ImpactsCo-BenefitsPermitting
No major impacts but may require additional effort to obtain DOB permits with flood proofing and deployable systems
No major impacts but may require additional effort to obtain DOB permits with flood proofing and deployable systems
No major impacts and relatively easy to permit
Potential drainage circulation impacts and challenges to obtain clean fill material for the site
Operation and Maintenance (OampM)
Major OampM costs associated with deployable systems
Major OampM costs associated with deployable systems
Moderate OampM costs associated with proposed elevator for access
Minimal OampM costs since deployable and elevators not required
Reliability and Durability
Least reliability with highest potential risk from flooding during to failure of deployable systems
Least reliability with highest potential risk from flooding during to failure of deployable systems
Moderate reliability with potential risk from flooding limited to elevator shaft only
Highest reliability since deployable are not required to protect building from flooding
Risk Reduction Benefits
Maximum flood risk reduction benefits assuming deployable and flood proofing is effective
Maximum flood risk reduction benefits assuming deployable and flood proofing is effective
Maximum flood risk reduction benefits
Maximum flood risk reduction benefits
Quality of Life BenefitsVisual Aesthetics
Facility may not be operational during the storm event
Facility may not be operational during the storm event
Facility can be potentially operational during the storm event
Facility can be potentially operational during the storm event
Qualitative Color Scale Green=Least resource intensive alternative Purple=most resource intensive yellow=medium level of resource intensity
A new non-critical facility with a building structure is proposed on a site that is currently in the 2015 Preliminary FEMA 1 annual chance floodplain with a BFE of 10rsquo (NAVD 88) The baseline conditions DFE to meet existing NYC codes and standards is 11rsquo (NAVD 88) Using the Guidelines recommended design criteria the facilityrsquos DFE is 133rsquo (NAVD 88) and existing grade is around 6rsquo (NAVD 88) The project design team develops three alternatives to meet the Guidelinesrsquo recommended DFE design for the facility Table 7 offers an example of how a qualitative assessment can be used to compare three resilient design alternatives using the evaluation criteria and metrics
CASE STUDY Example of How to Use the Evaluation Matrix
NYC Mayorrsquos Office of Recovery and Resiliency Climate Resiliency Design Guidelines
33IIIE BCA METHODOLOGY FOR PROJECTS OVER $50 MILLION
E BCA methodology for projects over $50 millionIn order for a project to be considered cost-effective a benefit-cost analysis (BCA) assesses if the benefits of a project outweigh its costs or in other words the benefit-cost ratio (BCR) is greater than 10 as illustrated in Equation 1
Equation 1 Benefit-Cost Ratio Formula
BCR =
Where BCR = Benefit-Cost Ratio
BENEFITS = Total project benefits
COSTS = Total project costs
BENEFITSCOSTS
These estimated project benefits are combined with the project costs which are defined as the differential construction and long-term operation and maintenance costs associated with constructing a proposed project to the Guidelinesrsquo recommended design level It is assumed that the baseline project will be designed to the most prevalent NYC codes and standards This benefit methodology should be used to determine the additional project benefit that the Guidelinesrsquo recommended design would provide over the baseline project benefit It is assumed that the project design team will develop alternatives to address each of the following applicable climate stressors - sea level risecoastal storm surge increased precipitation and extreme heat - separately For each alternative the project design team should use the following steps to determine the Benefit-Cost Ratio (BCR)
a) Determine project useful life for design interventions Determining the useful life of the proposed project is an important first step in the
detailed BCA assessment methodologies for two reasons First the project useful life determines what values must be used from the Guidelines to establish the future climate design conditions The various hazard tables in the Guidelines establish design requirements based on useful life ranges through 2039 2040-2069 2070-2099 and 2100+ (2100+ projections are only available for sea level rise) A review of these tables show that the design requirements needed to meet the projected climate hazards increase as the end of useful life range increases Second the useful life determines how long the project will need to be operated and maintained in order to remain technically sound and effective at reducing future damages and losses
b) Determine discount rate for project benefits calculation The cost-effectiveness of projects assessed using the BCR must be done on a net
present value basis meaning the present value of the benefits is compared to the present value of the costs Most project costs are computed for present value based on current cost estimates bids or cost guidance However project benefits - as well as project costs for operation and maintenance - accrue over time into the future and are computed on an annualized basis To address this issue the Present Value Coefficient (PVC) is used to bring these annualized project benefits and OampM costs into the present value As indicated by the formula in Equation 2 the PVC is a function of the Project Useful Life (PUL) and the Discount Rate (DR)
NYC Mayorrsquos Office of Recovery and Resiliency Climate Resiliency Design Guidelines
34
Equation 2 Present Value Coefficient (PVC) Formula
PVC =
Where PVC = Present Value Coefficient
PUL = BCA Project Useful Life based on project type
DR = Discount Rate
The project design team should coordinate with agencies and NYC OMB if needed to determine appropriate discount rates based on funding source project type and other factors This coordination should take place during project initiation phase where total project costs (design and construction) are over $50 million66
c) Develop input data to perform benefit calculations Tables 16 and 17 in Appendix 4 provide a list of typical input data by each climate
stressor needed to perform benefit analysis quantitatively on variety of facilities67 The project design team should use these tables as a reference to identify appropriate input data categories andor additional input data needed to perform benefit analysis on the project
d) Identify applicable project benefit categories to estimate benefits Tables 16 and 17 in Appendix 4 provide a list of typical project benefits by each climate
stressor needed to perform benefit analysis quantitatively on various types of projects The project design team should use these tables as a reference to identify appropriate project benefit categories for each climate stressor to perform benefit analysis on the project
e) Calculate benefits of recommended design interventions for each climate
stressor The input data and applicable project benefits can be assembled along with
incremental project cost data to analyze cost-effectiveness using the FEMA BCA Tool Damage-Frequency Assessment (DFA) module or similar software This analysis will provide a BCR for each alternative which can then be used to compare the alternatives that were developed to mitigate effects from applicable climate stressors The project design team can then use the results from this analysis to identify optimal interventions that provides a balanced solution that provides resiliency benefits within the available project budget
IIIE BCA METHODOLOGY FOR PROJECTS OVER $50 MILLION
[1 ndash (1 + DR) -(PUL)]DR
66 For example a NYC OMB March 2015 memorandum recommends using an annually updated DR as published each year in Appendix C of OMB Circular A-94 The current OMB-recommended discount rates from OMB A-94 Appendix C vary by project useful life and are as follows 21 DR for useful lives of 10 to 19 years 25 DR for useful lives of 20 to 29 years and 28 DR for useful lives of 30 years or greater By contrast FEMA hazard mitigation grants use a DR of 70 for all projects based on the Federal OMB A-94 rate for federally-funded mitigation measures Since these DRs will impact the PVC and the project benefits the project team must ensure that BCA results prepared using an OMB-recommended DR (21 to 28) be updated to reflect the Federal DR (70) when applying for FEMA mitigation grant funds
67 Note the data requirements for the sea level rise and increased precipitation hazards in Table 16 are more detailed than the requirements for the extreme heat hazards due to the less detailed level of analysis available for extreme heat
NYC Mayorrsquos Office of Recovery and Resiliency Climate Resiliency Design Guidelines
35
APPENDICES
NYC Mayorrsquos Office of Recovery and Resiliency Climate Resiliency Design Guidelines
36APPENDIX 1 ndash KEY TERMS
100-year flood (1 annual chance flood)
A flood that has a 1 probability of occurring in any given year The 100-year floodplain is the extent of the area of a flood that has a 1 chance of occurring or being exceeded in any given year
500-year flood (02 annual chance flood)
A flood that has a 02 probability of occurring in any given year The 500-year floodplain is the extent of the area of a flood that has a 02 chance of occurring or being exceeded in any given year
AdaptationAdjustment in natural or human systems to a new or changing environment that seeks to maximize beneficial opportunities or moderate negative effects Successful adaptations contribute to resiliency
Base flood elevation (BFE)The elevation of surface water resulting from a flood that has a 1 annual chance of occurring or being exceeded in any given year The BFE is shown on the Flood Insurance Rate Map (FIRM)69
BluebeltReference to the Department of Environmental Protectionrsquos (DEP) Bluebelt program to preserve natural drainage corridors including streams ponds and other wetland areas Preservation of these wetland systems allows them to perform their functions of conveying storing and filtering storm water
Climate
The average weather (or more rigorously a statistical description of the average in terms of the mean and variability) over a period of time usually 30 years These quantities are most often surface variables such as temperature precipitation and wind Climate in a wider sense is the state including a statistical description of the climate system70
Climate change
Changes in average weather conditions that persist over multiple decades or longer Climate change encompasses both increases and decreases in temperature as well as shifts in precipitation changing risk of certain types of severe weather events and changes to other variables of the climate system
Climate change riskThe chance that investments (such as in capital projects) can be affected by the physical impacts of climate change71 Risks are evaluated as a product of the probability of occurrence and the magnitude of damages or impacts including socioeconomic factors that would result if they did occur (consequences)
Climate change risk assessment
This assessment involves a detailed project-specific analysis that includes a vulnerability and risk assessment often followed by cost-benefit analysis to assess and select investments in climate change risk mitigation Risk is assessed as a function of the magnitude and probability of a given climate change hazard Examples resources are included in Appendix 7
Climate vulnerabilityThe degree to which systems and populations are affected by adverse impacts It is a function of the character magnitude and rate of climate change and variation to which a system is exposed its sensitivity and its adaptive capacity72
Cloudburst An extreme amount of rain in a short period of time often over a small geographic area73
Cooling Degree Day (CDD) A form of degree-day used to estimate the energy requirements for air conditioning or refrigeration when the daily mean temperature is above 65degF
68 All terms are from the US Global Change Research Program (USGCRP) glossary unless otherwise noted The USGCRP glossary is available at httpwwwglobalchangegovclimate-changeglossary
69 ldquoDefinitionsrdquo FEMA last modified March 1 2017 httpswwwfemagovnational-flood-insurance-programdefinitions70 UKCIP Glossary httpwwwukciporgukglossary71 ldquoAccount for Climate Riskrdquo International Finance Corporation 72 UKCIP Glossary httpwwwukciporgukglossary73 New York City Environmental Protection ldquoCloudburst Resiliency Planning Studyrdquo 2017 Available at httpwwwnycgovhtmldeppdfclimatenyc-cloudburst-studypdf
APPENDIX 1 - KEY TERMS68
NYC Mayorrsquos Office of Recovery and Resiliency Climate Resiliency Design Guidelines
37APPENDIX 1 ndash KEY TERMS
Design life The life expectancy of an asset or product as determined during design74 As opposed to useful life (see below)
Dry Bulb temperature The ambient air temperature measured by a thermometer
Extreme eventUnexpected unusual or unpredictable weather or flooding compared to historical or future projected distribution Extreme events include for example heat waves cold waves heavy rains periods of drought and flooding and severe storms
Facilities For the purposes of this document ldquofacilitiesrdquo refers to all types of buildings housing infrastructure structures and landscape features designed by or for the City of New York
Flexible adaptation pathwayResilience-building strategies that can evolve or be adapted over time as climate change risk assessments evaluations of adaptation strategies and monitoring continue75
Flood Insurance Rate Maps (FIRM)
Official flood map of a community on which FEMA has delineated the 1 annual chance floodplain and the base flood elevations (BFEs) applicable to the community76 The FIRM also includes the 02 floodplain annual chance floodplain and differentiates between special flood hazard areas (V A Coast A zones) and floodways The official FIRM is from the year 2007 while the 2015 PFIRM is currently required by NYC Building Code to calculate design flood elevations NYC DOB references the more restrictive of the two maps in both base flood elevation and flood hazard area (ie V versus A zone) Refer to Appendix 3 for more information
FreeboardAn additional amount of height above the base flood elevation used as a factor of safety (eg two feet above the base flood) in determining the level at which a facilitys lowest floor must be elevated or floodproofed to be in accordance with state or community floodplain management regulations77
Future time slices
Future periods defined by the NPCC for when climate change projections are available In this document the following decadal projections are associated with specific time spans2020s projection = present to 20392050s projection = 2040 to 20592080s projection = 2070 to 20992100s projection = end of century and beyond
Green infrastructureAn array of practices that use or mimic natural systems to manage urban stormwater runoff Water is either directed to engineered systems for infiltration or detained for longer periods before it enters the sewer system
Heat Vulnerability Index (HVI)Summarizes relative risk of adverse health effects from heat due to social and environmental factors Used to identify neighborhoods at higher risk during and after extreme heat events
Heat wave A period of three consecutive days where temperatures rise above 90degF or two consecutive days over 95 degrees78
New York City Panel on Climate Change (NPCC)
The body of leading climate and social scientists charged with making climate change projections for the metropolitan region79
74 Sustainable Infrastructure Management Program Learning Environment httpsimplewerforg 75 Rosenzweig C et al Climate Change Adaptation in New York City Building a Risk Management Response76 ldquoDefinitionsrdquo FEMA77 Ibid78 Horton R et al New York City Panel on Climate Change 2015 Report Chapter 1 Climate Observations and Projections Ann NY
Acad Sci ISSN 0077-8923 (New York 2015) 2579 For more information on the NPCC visit www1nycgovsiteorrchallengesnyc-panel-on-climate-changepage
NYC Mayorrsquos Office of Recovery and Resiliency Climate Resiliency Design Guidelines
38APPENDIX 1 ndash KEY TERMS
Open-grid pavement system
Pavements that consist of loose substrates supported by a grid of a more structurally sound grid or webbing Unbounded loose substrates in these systems transfer and store less heat than bound and compacted pavements and aid permeability Pavement is 50 pervious and contains vegetation in the open cells designed to allow percolation or infiltration of storm water through the surface into the soil below80
Preliminary Flood Insurance Rate Map (PFIRM)
Preliminary flood map developed by FEMA in 2015 for New York City that provides projected risks for flood hazards81 Refer to Appendix 3 for more information
Project useful life (PUL)
The period over which an asset or component is expected to be available for use by an entity This depends on regular and adequate maintenance This period of time typically exceeds the design life (see above) The combined effect of operational requirements and useful life is practical in assessing an investment in improving resilience82
Rain gardenAlso called ldquobioswalerdquo Planted areas designed to collect and manage stormwater that runs off streets sidewalks commercial and residential rooftops and other sources when it rains
Resiliency The ability to bounce back after change or adversity The capability of preparing for responding to and recovering from difficult conditions83
Sea level rise-adjusted design flood elevation
As defined in these Guidelines the increased height of the base flood elevation due to sea level rise plus freeboard depending on the criticality of the facility The sea level rise adjustment depends on the useful life of the facility
Storm surge An abnormal rise of water generated by a storm over and above predicted astronomical tides84
Substantial improvementAny repair reconstruction rehabilitation addition or improvement of a building or structure the cost which equals or exceeds 50 of the market value of the structure before the improvement or repairs started For more information see Appendix G of the NYC Building Code and 1 RCNY sect3606-0185
Tidal inundation Flooding which occurs at high tides due to climate-related sea level rise land subsidence andor the loss of natural barriers86
Urban Heat Island (UHI) effectThe tendency for higher air temperatures to persist in urban areas as a result of heat absorbed and emitted by buildings and asphalt tending to make cities warmer than the surrounding suburban and rural areas
Weather The state of the atmosphere at a given time with regard to temperature cloudiness precipitation wind and other meteorological conditions87
Wet Bulb temperatureThe temperature indicated when a thermometer bulb is covered with a water-saturated wick over which air is caused to flow at approximately 45 ms (900 ftmin) to reach the equilibrium temperature of water evaporating into the air when the heat of vaporization is supplied by the sensible heat of the air88
80 ldquoGlossaryrdquo US Green Building Council (2017) Available at httpwwwusgbcorgglossaryterm552581 ldquoPreliminary FEMA Map Productsrdquo FEMA Map Service Center Available at httpshazardsfemagovfemaportalprelimdownload82 ldquoGlossaryrdquo International Infrastructure Management Manual (2011) 83 A Stronger More Resilient New York (2013) 184 ldquoStorm Surge Overviewrdquo National Hurricane Center NOAA Available at httpswwwnhcnoaagovsurge85 ldquoFlood Resistant Constructionrdquo Appendix G New York City Building Code (2008) and 1 RCNY sect3606-01 available at httpswww1nycgovassetsbuildingsrules1_RCNY_3606-01pdf86 ldquoOcean Factsrdquo National Ocean Service NOAA Available at httpoceanservicenoaagovfactsnuisance-floodinghtml 87 UKCIP Glossary httpwwwukciporgukglossary88 ldquoASHRAE Terminologyrdquo ASHRAE Available at httpswwwashraeorgtechnical-resourcesauthoring-toolsterminology
NYC Mayorrsquos Office of Recovery and Resiliency Climate Resiliency Design Guidelines
39APPENDIX 2 - CLIMATE CHANGE PROJECTIONS
Climate change projections are provided by the New York City Panel on Climate Change (NPCC) The full NPCC report is available from the New York Academy of Sciences89 Tables 8-10 (below) were reproduced directly from the NPCC report while Table 2 (see Section IIA) was developed using the data underlying the NPCC report to inform the design of HVAC systems under warmer conditions
Table 8 ndash NYC sea level rise projections90
Baseline (2000-2004) 0 in
Low estimate (10th percentile)
Middle range (25th to 75th percentile)
High estimate (90th percentile)
2020s 2 in 4-8 in 10 in
2050s 8 in 11-21 in 30 in
2080s 13 in 18-39 in 58 in
2100 15 in 22-50 in 75 in
Note Projections are based on six-component approach that incorporates both local and global factors The model-based components are from 24 global climate models and two representative concentration pathways Projections are relative to the 2000-2004 base period
Table 9 ndash Mean annual changes91
a Temperature Baseline(1971-2000) 54degF
Low estimate (10th percentile)
Middle range (25th to 75th percentile)
High estimate (90th percentile)
2020s + 15degF +20-29degF +32degF
2050s +31degF +41-57degF +66degF
2080s +38degF +53-88degF +103degF
2100 +42degF +58-104degF +121F
b Precipitation Baseline(1971-2000) 501 in
Low estimate (10th percentile)
Middle range (25th to 75th percentile)
High estimate (90th percentile)
2020s -1 percent +1-8 +10
2050s +1 percent +4-11 +13
2080s +2 percent +5-13 +19
2100 -6 percent -1 to +19 +25
Note Based on 35 global climate models (GCMs) and two RCPs Baseline data cover the 1971ndash2000 base period and are from the NOAA National Climatic Data Center (NCDC) Shown are the low estimate (10th percentile) middle range (25th percentile to 75th percentile) and high estimate (90th percentile) These estimates are based on a ranking (from most to least) of the 70 (35 GCMs times 2 RCPs) projections The 90th percentile is defined as the value that 90 percent of the outcomes (or 63 of the 70 values) are the same or lower than Like all projections the NPCC climate change projections have uncertainty embedded within them Sources of uncertainty include data and modeling constraints the random nature of some parts of the climate system and limited understanding of some physical processes The NPCC characterizes levels of uncertainty using state-of-the-art climate models multiple scenarios of future greenhouse gas concentrations and recent peer-reviewed literature Even so the projections are not true probabilities and the potential for error should be acknowledged
89 The NPCC 2015 report is available at httponlinelibrarywileycomdoi101111nyas20151336issue-1issuetoc90 From New York City Panel on Climate Change 2015 Report Chapter 1 Climate Observations and Projections page 4191 From New York City Panel on Climate Change 2015 Report Chapter 1 Climate Observations and Projections page 30
APPENDIX 2 - CLIMATE CHANGE PROJECTIONS
NYC Mayorrsquos Office of Recovery and Resiliency Climate Resiliency Design Guidelines
40APPENDIX 2 - CLIMATE CHANGE PROJECTIONS
Table 10 ndash Extreme events92
2020s Baseline (1971-2000)
Low estimate(10th percentile)
Middle range(25th to 75th percentile)
High estimate (90th percentile)
Numbers of heat waves per year 2 3 3-4 4
Average heat wave duration (days) 4 5 5 5
Number of days per year with
Maximum temperature at or above 90degF 18 24 26-31 33
Maximum temperature at or above 100degF 04 07 1-2 2
Minimum temperature at or below 32degF 71 50 52-58 60
Rainfall at or above 1 inch 13 13 14-15 16
Rainfall at or above 2 inches 3 3 3-4 5
Rainfall at or above 4 inches 03 02 03ndash04 05
2050s Baseline (1971-2000)
Low estimate(10th percentile)
Middle range(25th to 75th percentile)
High estimate (90th percentile)
Numbers of heat waves per year 2 4 5-7 7
Average heat wave duration (days) 4 5 5-6 6
Number of days per year with
Maximum temperature at or above 90degF 18 32 39-52 57
Maximum temperature at or above 100degF 04 2 3-5 7
Minimum temperature at or below 32degF 71 37 42-48 52
Rainfall at or above 1 inch 13 13 14-16 17
Rainfall at or above 2 inches 3 3 4-4 5
Rainfall at or above 4 inches 03 03 03-04 05
2080s Baseline (1971-2000)
Low estimate(10th percentile)
Middle range(25th to 75th percentile)
High estimate (90th percentile)
Numbers of heat waves per year 2 5 6-9 9
Average heat wave duration (days) 4 5 5-7 8
Number of days per year with
Maximum temperature at or above 90degF 18 38 44-76 87
Maximum temperature at or above 100degF 04 2 4-14 20
Minimum temperature at or below 32degF 71 25 30-42 49
Rainfall at or above 1 inch 13 14 15-17 18
Rainfall at or above 2 inches 3 3 4-5 5
Rainfall at or above 4 inches 03 02 03-05 07
Note Projections for temperature and precipitation are based on 35 GCMs and 2 RCPs Baseline data are for the 1971 to 2000 base period and are from the NOAA National Climatic Data Center (NCDC) Shown are the low estimate (10th percentile) middle range (25th to 75th percentile) and high estimate (90th percentile) 30-year mean values from model-based outcomes Decimal places are shown for values less than one although this does not indicate higher precisioncertainty Heat waves are defined as three or more consecutive days with maximum temperatures at or above 90degF Like all projections the NPCC climate change projections have uncertainty embedded within them Sources of uncertainty include data and modeling constraints the random nature of some parts of the climate system and limited understanding of some physical processes The NPCC characterizes levels of uncertainty using state-of-the-art climate models multiple scenarios of future greenhouse gas concentrations and recent peer-reviewed literature Even so the projections are not true probabilities and the potential for error should be acknowledged
92 From New York City Panel on Climate Change 2015 Report Chapter 1 Climate Observations and Projections page 31
NYC Mayorrsquos Office of Recovery and Resiliency Climate Resiliency Design Guidelines
41APPENDIX 3 - DIFFERENTIATION OF FLOOD MAPS
These Guidelines reference several different kinds of flood maps and sources of design flood elevations These maps are described and differentiated below
Table 11 - Differentiation of flood maps used in NYC
Reference Title Data Source Information Provided Referenced By Link
2007 FIRM FEMA
Based on historical data from before 1983 identifies the current base flood (extent and elevation) as the flood that has a 1 chance of occurring in any given year also known as a 100-year flood The NYC Building Code requires that either the 2007 FIRM or 2015 PFIRM elevation be used whichever is higher
2014 NYC Building Code Appendix G
Climate Resiliency Design Guidelines
httpsmscfemagovportal
2015 PFIRM FEMA
Based on historical data identifies the current base flood (extents and elevation) as the flood that has a 1 chance of occurring in any given year also known as a 100-year flood The NYC Building Code requires that either the 2007 FIRM or 2015 PFIRM elevation be used whichever is higher The 2015 PFIRM is currently being reassessed by FEMA
2014 NYC Building Code Appendix G
Climate Resiliency Design Guidelines
httpshazardsfemagovfemaportalprelimdownload
httpwwwregion2coastalcomview-flood-maps-dataview-preliminary-flood-map-data
NYC Flood Hazard Mapper
NYC Department of City Planning
Maps current and future flood hazards in NYC including the following data layers 2007 FIRM and 2015 PFIRM high tide with sea level rise and PFIRM with sea level rise through 2100
Climate Resiliency Design Guidelines
Waterfront Revitalization Plan
httpwww1nycgovsiteplanningdata-mapsflood-hazard-mapperpage
ldquoTable 4 ndash Determine the sea level rise-adjusted design flood elevation for critical and non-critical facilitiesrdquo
ORR amp NPCC
Provides data to use when adding sea level rise to a given 2015 PFIRM or 2007 FIRM Base Flood Elevation (BFE) to calculate a Design Flood Elevation (DFE) Based on the criticality and expected useful life of a facility
Climate Resiliency Design Guidelines
See Section II on ldquoSea Level Riserdquo above
APPENDIX 3 - DIFFERENTIATION OF FLOOD MAPS
NYC Mayorrsquos Office of Recovery and Resiliency Climate Resiliency Design Guidelines
42APPENDIX 4 - PROJECT BENEFITS CATEGORIES
This appendix provides guidance on how to identify and assess benefits as a supplement to Sections IIID and IIIE
Table 12 lists typical direct benefits for reducing impacts from climate stressors and basic guidance for how to estimate them See Section IIID for more information
Table 13 lists typical indirect benefits for reducing impacts from climate stressors and basic guidance for how to estimate them See Section IIID for more information
Table 12 ndash Direct benefits for (1) sea level rise with coastal storm surge and (2) increased precipitation measures
Direct Benefit Basic Guidance for Estimating Values
Physical Damages (Structure Contents)
bull For flood-damaged buildings use depth damage functions developed by FEMA and USACE for structures and contents
bull Use depth damage functions in conjunction with Building Replacement Values (BRVs) and not market values BRVs typically range between $100 to $325SF for residential buildings and $120 to $450SF for commercial public buildings
bull For more complex structures or facilities use engineering estimates of flood damages or review historic flood damages documented from insurance claims repair records or FEMA Public Assistance claims from recent flood disasters
Residential Displacements
bull For flood-damaged buildings use depth damage functions developed by FEMA and USACE for residential displacements
Reduced Life CycleOperation and Maintenance (OampM) Costs93
bull Applicable only to projects that reduce overall life cycle costs or net annual OampM costs from baseline conditions
bull Input reduced annual OampM costs as a project benefit at a 1-year recurrence intervalbull Reduced overall life cycle costs can be input as a longer project useful life
Table 13 ndash Indirect benefits for (1) sea level rise with coastal storm surge and (2) increased precipitation measures
Indirect Benefit Basic Guidance for Estimating Values
Non-Residential Building Service Losses
bull Estimate service loss values and durations for non-residential buildings public buildings critical facilities and parksnatural features based on FEMA BCA guidance and standard values based on building use
Utility Service Losses94
bull Estimate utility service losses for water wastewater and electrical facilities based on the number of impacted customers FEMA per capita standard values for utility service ($105personday for potable water $49personday for wastewater $148personday for electrical)95
bull Estimate utility service loss durations based on engineering estimates or review historic flood damages losses documented from utility company records
bull This benefit can also apply to measures that increase energy efficiency
RoadBridge Service Losses
bull Estimate roadbridge service losses based on the average daily traffic (ADT) detour time and additional travel distance and FEMA and GSA standard values for road service ($3344vehiclehour of delay $0545mile)96
bull Estimate roadbridge service loss durations or review historic flood damages losses
Emergency Service Losses
bull Applicable only to projects that reduce or eliminate documented emergency service costs from baseline conditions
bull Examples of avoided emergency services costs include NYPD staffing to monitor barricades for flooded roads or NFDY staffing for water rescues of residents from flooded buildings or streets
APPENDIX 4 - PROJECT BENEFITS CATEGORIES
93 Reduced life cycle costs may be applicable to some measures that provide extreme heat benefits such as green roofs that can last longer than a standard roof if properly maintained
94 Reduced utility service costs may be applicable to some measures that provide extreme heat benefits such as cool roofs green roofs and shade trees
95 FEMA per capita standard values taken from FEMA BCA Toolkit Version 530 (Build Date 12222016) and developed in FEMArsquos Baseline Standard Economic Value Methodology Report (July 28 2016) Consider updating FEMA standard per capita values to reflect current New York City utility rates
96 Consider updating FEMA and GSA standard values to reflect current New York City area labor rates and fuel costs
NYC Mayorrsquos Office of Recovery and Resiliency Climate Resiliency Design Guidelines
43APPENDIX 4 - PROJECT BENEFITS CATEGORIES
Table 14 ndash Other potential benefits for (1) sea level rise with coastal storm surge and (2) increased precipitation measures
Other Benefit Basic Guidance for Estimating Values
Avoided Stress and Anxiety
bull Applicable only for projects that directly benefit occupants of residential structuresbull Use FEMA standard value for avoided mental stress and anxiety treatment costs of $2443person to
estimate benefit for all impacted residents97
Avoided Lost Productivity
bull Applicable only for projects that directly benefit occupants of residential structuresbull Use FEMA standard value for avoided lost worker productivity costs of $8736household to estimate
benefit for all impacted workers (conservatively assuming one worker per household)
Environmental Open Space
bull Applicable only for projects that create or acquire open space areas by acquisitionbull Use FEMA standard value for environmental open space based on the type of land acquired ($8308
Acreyear for Green open space $39545Acreyear for Riparian $6010Acreyear for Wetlands $554Acreyear for Forests $1799Year for Marine and estuary)97
CSO Volume Reduction
bull Applicable only for projects that provide Combined Sewer Overflow (CSO) abatement by reducing the volume of rainfall runoff
bull Use CSO abatement cost of $0015gallonsyear applied to increased precipitation hazard runoff volume for 5-year design storm98
Ecosystem Service99
bull Add stormwater management benefits of green infrastructure projects to increased precipitation hazards where avoided damages and service losses are not quantified
bull Unit benefits applicable to increased precipitation hazard includeo Green roofs $0133SFyear (PUL 40 years)o BioswaleRain GardenMeadow Mix $0020SFyear (PUL 30 years)o Permeable Grass Pavers $0020SFyear (PUL 30 years)o Tree Plantings $303Treeyear (PUL 30 years)o Planter Box Trees $101Treeyear (PUL 15 years)
Real Estate99
bull Potential real estate benefits from increased resilience of residential andor commercial propertiesstreetscapesneighborhoods included within the project scope
bull Benefit applied to extreme heat hazard for green infrastructure projects directly impacting residential or commercial properties
Quality of Life Health Benefits99
bull Potential quality of life benefits related to improved public health from the resilience measures included within the project scope
bull Benefit applied to extreme heat hazard for green infrastructure projects directly impacting residential or commercial properties
Table 14 lists other typical benefits for reducing impacts from climate stressors and basic guidance for how to estimate them See Section IIID for more information
97 FEMA standard values for avoided mental stress and anxiety and environmental open space values taken from FEMA BCA Toolkit Version 530 (Build Date 12222016)
98 CSO abatement cost taken from APG1 Report for NYC ldquoTechnical Approaches for Benefit-Cost Analysis of Hazard Mitigation Projects in Urban and Coastal Environmentsrdquo (April 2016)
99 Ecosystem Services Real Estate and Quality of LifeHealth benefits tend to be more applicable to green infrastructure measures that provide extreme heat benefits such as green roofs trees and other plantings
NYC Mayorrsquos Office of Recovery and Resiliency Climate Resiliency Design Guidelines
44APPENDIX 4 - PROJECT BENEFITS CATEGORIES
Table 15 ndash Potential benefits for extreme heat (Urban Heat Island) reduction measures
Category Benefit Basic Guidance for Estimating Values
Direct Benefit
Reduced Life Cycle Cost
bull Applicable only to measures such as green roofs that are expected to last longer than standard roofs
bull Compute total cost savings including annual OampM costs
Indirect Benefit
Energy Savings
bull Applicable to measures that reduce energy costs by providing cooling through increased shading andor evapotranspiration
bull Use New York Power Authority rates of $0148kWh for electricity and $0810Therm for natural gas
Other Potential Benefits
Air Quality bull Applicable to measures that absorb pollutants andor reduce carbon dioxide emissions
Acoustics bull Applicable to measures such as green roof or walls that reduce noise transfer
Quality of LifeHealth bull Potential quality of life benefits and related to improved public health
Real Estate bull Applicable to measures that provide residential real estate benefits from increased resilience of propertiesstreetscapesneighborhoods
Retail Sales Marketing
bull Applicable to measures that provide commercial property benefits from increased aesthetics resulting in increased marketing and sales for streetscapesneighborhoods
Tax Credits Incentives
bull Applicable to resilience or green infrastructure measures such as green roofs that have accompanying Federal State or City tax credits or other incentives
Table 15 lists potential benefits for reducing impacts from heat and basic guidance for how to estimate them See Section IIID for more information
NYC Mayorrsquos Office of Recovery and Resiliency Climate Resiliency Design Guidelines
45APPENDIX 4 - PROJECT BENEFITS CATEGORIES
Table 16 ndash Guidance on quantitative calculations for (1) sea level rise with coastal storm surge and (2) increased precipitation measures
Data Input General Guidance ndash Basic Description
Applicable Benefit Category
Applicable Typical Facility Typology
Dire
ct B
enefi
ts
Indi
rect
Ben
efits
Oth
er P
oten
tial
Ben
efits
Bui
ldin
g St
ruct
ures
Com
plex
Fa
cilit
ies
Tran
spor
tatio
nSt
reet
scap
es
Plaz
as
Park
Fea
ture
s
First Floor Elevation (FFE)
bull The elevation of the first finished floor of the structure excluding basements
bull FFE measured from top of lowest floor (riverinenon-coastal high hazard areas) or bottom of lowest horizontal structural member (coastal high hazard areas)
Y Y Y Y
Building Replacement Value (BRV)
bull The unit cost to rebuild a structure of the same quality of construction
bull Not the same as market value
Y Y Y Y
Building Size
bull The total floor area of the building in square feet
bull Total Building Value = BRV x Building Sizebull Typical BRVs for NYC range between $100 to
$325SF for residential buildings and $120 to $450SF for commercialpublic buildings
Y Y Y Y
Structure Description
bull The type of building number of stories and foundation type (full basement partial basement no basement)
bull Collect more detailed foundation data for coastal flood zones
Y Y Y Y
Building Use bull Details related to residential housing commercial business and public use
Y Y Y Y Y
Building Type bull The primary use of building ndash residential commercial public and others
Y Y Y Y Y
Depth Damage Function (DDF)
bull Curves used to estimate structure damage contents damage and displacement of residential buildings based on flood depth
bull DDFs selection based on Structure Description Building Type Building Use
bull Structure DDFs based on percentage of Total Building Value
bull Contents DDFs based on percentage of Total Contents Value
bull Displacement DDFs based on number of displacement days x Displacement Cost
Y Y Y Y Y
Contents Value
bull The cost to replace structure contents (furnishings equipment)
bull Residential building Contents Values typically 50 BRV (FEMA DDFs) or 100 BRV (USACE DDFs)
bull Non-residential building Contents Values between 18 to over 100 depending on building use (USACE DDFs)
bull Total Contents Value = BRV x Building Size
Y Y Y Y Y
Table 16 provides general guidance on how to quantitatively calculate benefits from efforts to address from climate stressors See Section IIIE for more information
NYC Mayorrsquos Office of Recovery and Resiliency Climate Resiliency Design Guidelines
46APPENDIX 4 - PROJECT BENEFITS CATEGORIES
Table 16 ndash Guidance on quantitative calculations for (1) sea level rise with coastal storm surge and (2) increased precipitation measures
Data Input General Guidance ndash Basic Description
Applicable Benefit Category
Applicable Typical Facility Typology
Dire
ct B
enefi
ts
Indi
rect
Ben
efits
Oth
er P
oten
tial
Ben
efits
Bui
ldin
g St
ruct
ures
Com
plex
Fa
cilit
ies
Tran
spor
tatio
nSt
reet
scap
es
Plaz
as
Park
Fea
ture
s
Number of Residents (Residential)
bull Total number of occupants in a residential building
bull Typically estimated based on number of residential units x average number of individuals per household (based on current US Census data or use 25 individuals per household as a default)
Y Y Y Y Y
Displacement Cost (Residential)
bull The unit cost to lodge and feed displaced residents while flood damage is repaired
bull Average unit displacement cost of $415residential unitday recommended based on current FY2018 GSA Per Diem rates for New York City
Y Y Y Y Y
Value of Service (Non-Residential and Public)
bull The unit cost of service disruption and rental of temporary facilities while flood damage is repaired
bull Disruption costs for non-residential buildings typically range from $095 to $136SFmonth and rental costs range from $020 to $136SFmonth depending on building use
bull Value of service for public buildings ($day) is typically based on the annual operating budget for the City agency using the building prorated based on building size or population served by the building then divided by 365 daysyear
Y Y Y Y
Value of Service (Critical Facilities)
bull The unit cost of critical facilities (police fire emergency medical services) lost or delayed while flood damage is repaired
Y Y Y
Value of Service Duration
bull The duration of service disruption and rental of temporary facilities for non-residential buildings and critical facilities while flood damage is repaired
bull For non-residential buildingso Value of Service Durations vary from
4 months to over 30 months based on building use and the depth of flooding
o Total Value of Service Loss = (Disruption Cost x Building Area) = (Rental Cost x Building Area x Value of Service Duration)
bull For public buildings and critical facilitieso Value of Service Durations vary from 0
days to 720 months based on building use and the depth of flooding from FEMA FIA or USACE DDFs
o Total Value of Service Loss = (Value of Service) x (Service Loss Duration)
Y Y Y
NYC Mayorrsquos Office of Recovery and Resiliency Climate Resiliency Design Guidelines
47APPENDIX 4 - PROJECT BENEFITS CATEGORIES
Table 16 ndash Guidance on quantitative calculations for (1) sea level rise with coastal storm surge and (2) increased precipitation measures
Data Input General Guidance ndash Basic Description
Applicable Benefit Category
Applicable Typical Facility Typology
Dire
ct B
enefi
ts
Indi
rect
Ben
efits
Oth
er P
oten
tial
Ben
efits
Bui
ldin
g St
ruct
ures
Com
plex
Fa
cilit
ies
Tran
spor
tatio
nSt
reet
scap
es
Plaz
as
Park
Fea
ture
s
Engineering Estimates for Damages
bull Engineered estimate models of physical damages and service losses at the project site based on the Guidelines event recurrence interval(s) and flood depth(s)
Y Y Y Y Y Y
Historic Damages and Service Losses
bull Historic physical damages and service losses at the project site documented from previous flood events
bull Do not use routine maintenancebull The historic damage event recurrence interval
(RIs) andor flood depths must be determined updated for inflation to the present value and adjusted to match the Guidelines event RIsflood depths
Y Y Y Y Y Y
Facility Replacement Value
bull The unit cost to rebuild the facility
Impacted Area bull The geographic area impacted by the facility in the event of failure in acres
Y Y Y Y
Facility Capacity
bull The design capacity of the facilitybull For example - facility capacity expressed in
millions of gallons per day (MGD) for water and wastewater facilities or megawatts (MW) for electrical facilities
Y Y Y Y
Service Population
bull The number of impacted residents served by the facility
bull Typically estimated based on number of impacted residential customers x average number of individuals per household (based on current US Census data or use 25 individuals per household as a default)
bull Facilities serving mostly non-residentialpublic buildings andor critical facilities should focus on service losses rather than service population
Y Y Y
NYC Mayorrsquos Office of Recovery and Resiliency Climate Resiliency Design Guidelines
48APPENDIX 4 - PROJECT BENEFITS CATEGORIES
Table 16 ndash Guidance on quantitative calculations for (1) sea level rise with coastal storm surge and (2) increased precipitation measures
Data Input General Guidance ndash Basic Description
Applicable Benefit Category
Applicable Typical Facility Typology
Dire
ct B
enefi
ts
Indi
rect
Ben
efits
Oth
er P
oten
tial
Ben
efits
Bui
ldin
g St
ruct
ures
Com
plex
Fa
cilit
ies
Tran
spor
tatio
nSt
reet
scap
es
Plaz
as
Park
Fea
ture
s
Value of Service
bull Unit value of service provided by the facilitybull Example of FEMA standard values for complete
loss of utility service $105personday for potable water$49personday for wastewater$148personday for electrical
bull Consider updating FEMA standard per capita values to reflect current The New York City utility rates
Y Y
Roadway Elevations bull Roadway Elevations
Y Y
Roadway Replacement Value
bull Roadway Replacement ValueY Y
Inundation Area Map
bull Inundation Area Map developed by FEMA or through modeling by project design team
Y Y Y
Building Inventory of Inundation Area
bull The number and type of buildings within the streetscape and neighborhood inundated by the Guidelinersquos flood events
Y Y Y
Average Daily Traffic (ADT)
bull The average number of one-way traffic trips per day along the roadway(s) within the streetscapeneighborhood inundated by the Guidelinersquos flood events
Y Y
Additional Travel Time
bull The additional travel time needed to detour around a flooded roadway expressed in minutes
bull In the unlikely event there is no detour available use a 12-hour travel time per one-way trap but provide a detailed area street map as supporting documentation
Y Y
Value of Traffic Delay
bull The value of service associated with lost time in traffic
bull For example - FEMA standard average value of $3344vehiclehour of delay
bull Consider updating FEMA and GSA standard values to reflect current New York City area labor rates and fuel costs
Y Y
NYC Mayorrsquos Office of Recovery and Resiliency Climate Resiliency Design Guidelines
49APPENDIX 4 - PROJECT BENEFITS CATEGORIES
Table 17 ndash Guidance on quantitative unit benefit calculations for extreme heat hazard measures
Measure General Guidance ndash Unit Benefit Information and Data Requirements
Applicable Benefit Category
Applicable Typical Facility Typology
Dire
ct B
enefi
ts
Indi
rect
Ben
efits
Oth
er P
oten
tial
Ben
efits
Bui
ldin
g St
ruct
ures
Com
plex
Fa
cilit
ies
Tran
spor
tatio
nSt
reet
scap
es
Plaz
as
Park
Fea
ture
s
Green Roof
bull Unit benefit range over PUL = $470SF to $373SF of green roof area ($719SF standard value)
bull Assumed PUL = 40 yearsbull Apply standard value unit benefit to green
roof area to estimate measure benefitbull Higher range values more applicable
to residential and commercial building streetscape projects
Y Y Y Y Y Y
Bioswale Rain Garden Meadow Mix
bull Unit benefit range over PUL = $396SF to $211SF of area ($730SF standard value)
bull Assumed PUL = 30 yearsbull Apply standard value unit benefit to bioswale
rain gardenmeadow mix area to estimate total measure benefit
Y Y Y Y Y Y
Cool Roof
bull Unit benefit range over PUL = $117 to $3151SF of material area ($144SF standard value)
bull Assumed PUL = 20 yearsbull Apply standard value unit benefit to cool roof
area to estimate total measure benefitbull Higher range values more applicable to
residential building streetscape projects
Y Y Y Y Y
Light-Colored PaversLight-Colored Materials
bull Unit benefit range over PUL = $0774 to $204SF of material area ($0866SF standard value)
bull Assumed PUL = 30 yearsbull Apply standard value unit benefit to material
area to estimate total measure benefit
Y Y Y Y
Table 17 provides general guidance on how to quantitatively calculate benefits from efforts to address climate stressors See Section IIIE for more information
NYC Mayorrsquos Office of Recovery and Resiliency Climate Resiliency Design Guidelines
50APPENDIX 4 - PROJECT BENEFITS CATEGORIES
Table 17 ndash Guidance on quantitative unit benefit calculations for extreme heat hazard measures
Measure General Guidance ndash Unit Benefit Information and Data Requirements
Applicable Benefit Category
Applicable Typical Facility Typology
Dire
ct B
enefi
ts
Indi
rect
Ben
efits
Oth
er P
oten
tial
Ben
efits
Bui
ldin
g St
ruct
ures
Com
plex
Fa
cilit
ies
Tran
spor
tatio
nSt
reet
scap
es
Plaz
as
Park
Fea
ture
s
Tree Planting
bull Unit benefit range over PUL = $1005 to $77154Tree ($1855Tree standard value)
bull Assumed PUL = 30 yearsbull Apply standard value unit benefit to number of
trees to estimate total measure benefitbull Higher range values more applicable
to residential and commercial building streetscape projects
Y Y Y Y Y Y
Planter Box Tree
bull Unit benefit range over PUL = $212 to 16304Tree ($392Tree standard value)
bull Assumed PUL = 15 yearsbull Apply standard value unit benefit to number of
trees to estimate total measure benefitbull Higher range values more applicable
to residential and commercial building streetscape projects
Y Y Y Y Y
Shade Canopy
bull Unit benefit range over PUL = $0363 to $396SF ($0458SF standard value)
bull Assumed PUL = 15 yearsbull Apply standard value unit benefit to area of
shade canopy estimate total measure benefitbull Higher range values more applicable
to residential and commercial building streetscape projects
Y Y Y Y
Permeable Grass Pavers
bull Unit benefit range over PUL = $0258SF to $0521SF of pavers ($0363SF standard value)
bull Assumed PUL = 30 yearsbull Apply standard value unit benefit to paver
area to estimate total measure benefit
Y Y Y Y Y
For the purposes of the BCA refer to the following facility typologies bull ldquoBuilding Structuresrdquo include critical small building sites such as EMS or FDNY stations and non-critical small building sites such as
libraries or comfort stationsbull ldquoComplex Facilitiesrdquo include critical infrastructure such as wastewater treatment sites pump stations water filtration plants and similar
large or complex facilitiesbull ldquoTransportationStreetscapePlazasrdquo include roadway reconstruction streetscape improvements street raising plazas and other
transportation-related infrastructurebull ldquoPark Featuresrdquo include parks and similar public recreational facility with natural landscape features
NYC Mayorrsquos Office of Recovery and Resiliency Climate Resiliency Design Guidelines
51APPENDIX 5 - EXAMPLE PLANNING DECISION TREE
This decision tree provides a summarized example approach for how to implement these Guidelines Projects with a total cost greater than $50 million are recommended to conduct a full qualitative and quantitative climate change risk assessment and BCA while projects below $50 million are recommended to conduct a qualitative risk assessment and BCA
Define Project
1) Operational goals and criticality level2) Useful life3) Location in the current flood plain future floodplain and or zone
of tidal inundation and the project arearsquos score on the heat vulnerability index
Evaluate Project Risks According to Probability and Magnitude of Consequence
bull Extreme Heat bull Precipitationbull Sea Level Risebull Coastal Surge
High Level Identification and Assessment of Risk Mitigation Alternatives and Co-benefits
(qualitative)
Detailed Identification and Assessment of Risk Mitigation Alternatives and Co-benefits (qualitative and quantitative)
High Level Estimate of Costs and Benefits of Design Alternatives
(qualitative)
Detailed Estimate of Costs and Benefits of Design Alternatives
(qualitative and quantitative)
Decision Point Which climate change risks require mitigation
Decision Point Evaluate risk mitigation benefits and costs to
determine final resilient design alternative or if no action is required
Decision Point Is the total project cost above $50 million
Below $50 million Above $50 million
APPENDIX 5 - EXAMPLE PLANNING DECISION TREE
NYC Mayorrsquos Office of Recovery and Resiliency Climate Resiliency Design Guidelines
52
Project Title
Design Strategies Checklist (not exhaustive)
Extreme Heat Comments Extreme Precipitation Comments Sea Level Rise amp Storm Surge Comments
Select Site in Low Heat Vulnerability Index area Select High Elevation Site Select High Elevation Site
Minimize East-West Building Orientation Green Roof Raise Building Floor Elevation
Passive Solar Cooling and Ventilation Systems
Protect Below Grade Areas from Flooding Waterproof Building Envelope
Cool Roof (SRI appropriate) On-site Stormwater Management (gray) Elevate Critical Building Functions
Green Roof (extensive) Reduce Impervious Areas Elevate Critical Equipment
Vegetative Structures Permeable Pavement Perimeter Floodwall100 Levee (passive or active)
Enhanced HVAC System including space layout optimization and system scalability
Increase Green Spaces and Planted Areas DryWet Floodproofing
More Efficient Building Envelope Other Utility Redundancy Design101
Parking Lot Shading Resilient Materials amp Landscape Treatments
Light Colored Pavements (appropriate SRI) Design for Storm Surge Outflow
Increase Planted Areas Install Backwater Flow Prevention
Permeable Surfaces Design for Scour
Open-grid Pavement Raise Road Elevation
Other Other
This appendix provides a template for identifying possible design strategies to address climate change risks as described throughout the Guidelines
APPENDIX 6 - DESIGN STRATEGIES CHECKLIST
100 Permanent perimeter flood walls are not permitted to meet floodproofing requirements in buildings with substantial improvements andor damages 101 Utility redundancy design should be pursued for critical systems not all building systems
APPENDIX 6 - DESIGN STRATEGIES CHECKLIST
NYC Mayorrsquos Office of Recovery and Resiliency Climate Resiliency Design Guidelines
53APPENDIX 7 - CLIMATE CHANGE RISK ASSESSMENT RESOURCES
These Guidelines provide data on climate change hazards and recommend how that data can inform resilient design A risk assessment is a tool to help project managers and designers evaluate risk levels as well as select and prioritize resilient design strategies A high level risk assessment is recommended for all City capital projects with a total cost of under $50 million Projects above $50 million are recommended to conduct an in-depth assessment
Risk assessments use quantified estimates of the probability and magnitude of consequence of an event occurring to prioritize responses ldquoProbabilityrdquo is an assessment of the likelihood of a hazard occurring while ldquomagnituderdquo describes the hazardrsquos potential impact Risk assessment tools such as the examples listed below can be used to define and score these categories Projects that score higher across both probability and magnitude can be prioritized for investment and risk mitigation action Projects that score lower across both criteria may require no action beyond meeting code The results are typically charted on a risk matrix and an example is provided on the next page
The climate change risk management frameworks below offer templates for how to integrate climate change projections into a risk assessment process Refer to these resources for examples and further information
bull Vulnerability Assessment and Adaptation Framework is prepared by the Federal Highway Administration (FHWA) While developed for transportation planning this risk assessment framework has broad applicability for evaluating asset vulnerability to climate change Available at httpswwwfhwadotgovenvironmentsustainabilityresilienceadaptation_framework
bull US Climate Resilience Toolkit The US Global Change Research Program offers a step by step risk assessment
framework including tools and case studies at httpstoolkitclimategovsteps (see example on next page)
bull Coast Adapt Guidance on undertaking a risk assessment High level assessment httpscoastadaptcomausitesdefaultfilesfactsheetsT3M4_2_2nd_pass_risk_assessmentpdfDetailed assessment httpscoastadaptcomausitesdefaultfilesfactsheetsT3M4_3_3rd_pass_risk_assessmentpdf
bull Climate adaptation Risk uncertainty and decision-makingDownload the report here httpswwwukciporgukpublicationsRisk
The City plans to develop a NYC-specific process for integrating climate change data into existing risk management processes by April 2019
APPENDIX 7 - CLIMATE CHANGE RISK ASSESSMENT RESOURCES
NYC Mayorrsquos Office of Recovery and Resiliency Climate Resiliency Design Guidelines
54APPENDIX 7 - CLIMATE CHANGE RISK ASSESSMENT RESOURCES
The Risk Characterization Matrix below is an example from the US Climate Resilience Toolkit This tool can be used to assess the probability and magnitude of impact for identified risks The risk of coincident climate stressorsrisks (such as storm surge plus increased precipitation) can also be assessed as applicable
Figure 14 - Example of a climate change risk matrix (adapted from US Climate Resilience Toolkit)
Project teams can determine the magnitude of the impact (along the horizontal scale of 1 through 3 with 3 being the most severe) and the probabilitylikelihood of occurrence for each specific risk (along the vertical scale with 3 being the most likely) A score is typically assigned for each risk (Probabil-ity x Magnitude) and then charted on the matrix Based on the estimated probability and magnitude of consequence above the risks are ranked and prioritized for mitigation Factors to bear in mind include
bull Not all facility typologies have the same level of functional and operational importance during events or tolerance for disruption
bull Not all climate stressors and risks have the same level of impact on each project sitebull Not all identified risks can or should be mitigated fully
NYC Mayorrsquos Office of Recovery and Resiliency Climate Resiliency Design Guidelines
55WORKS CITED
A Stronger More Resilient New York PlaNYC Report of the NYC Special Initiative for Rebuilding and Resiliency The City of New York 2013
ldquoAccount for Climate Riskrdquo International Finance Corporation accessed March 27 2017 httpwwwifcorgwpswcmconnectTopics_Ext_ContentIFC_External_Corporate_SiteClimate+Business
PrioritiesAccount+for+Climate+Risk
American Society of Heating Refrigeration and Air-Conditioning Engineers (ASHRAE) Handbook -Fundamentals 2017
ldquoBaseline Standard Economic Value Methodology Reportrdquo Federal Emergency Management Agency July 2016
Benefit Cost Analysis Toolkit Software Version 530 Federal Emergency Management Agency (build date December 2016)
Criteria for Detention Facility Design New York City Department of Environmental Protection November 2012
Community Resilience Planning Guide for Buildings and Infrastructure Systems Vol 1 NIST Special Publication 1190 US Department of Commerce 2016
Cool and Green Roofing Manual NYC Department of Design and Construction 2007 httpwwwnycgovhtmlddcdownloadspdfcool_green_roof_manpdf
Building Resiliency Task Force US Urban Green Building Council New York 2013 httpurbangreencouncilforcecomBuildingResiliency
Design and Planning for Flood Resiliency Guidelines for NYC Parks New York City Department of Parks and Recreation 2017
httpswwwnycgovparksorgplanning-and-buildingplanningresiliency-plansflood-resiliency
Flooded Bus Barns and Buckled Rails Federal Transit Administration Office of Budget and Policy 2011 httpswwwhsdlorgabstractampdid=685187
Floodproofing Non-Residential Buildings FEMA P936 FEMA 2013 httpswwwfemagovmedia-library-data9a50c534fc5895799321dcdd4b6083e7P-936_8-20-13_508rpdf
ldquoGlossaryrdquo International Infrastructure Management Manual National Asset Management Support Group New Zealand 2011 httpwwwipweaorg
ldquoGreen Roof Metrics Draft Reportrdquo New York City Department of Parks and Recreation 2017
ldquoGuide to Rain Event Preparednessrdquo NYC Department of Environmental Protection httpwwwnycgovhtmldeppdfbrochuresflood-preparedness-flyerpdf
ldquoGuidelines and Discount Rates for Benefit-Cost Analysis of Federal Programsrdquo Appendix C Circular A-94 US Office of Management and Budget (OMB) 2017
ldquoGuidelines for the Design and Construction of Stormwater Management Systemsrdquo New York City Department of Environmental Protection July 2012
Horton R et al New York City Panel on Climate Change 2015 Report Ann NY Acad Sci ISSN 0077-892 New York 2015
Madrigano J et al ldquoA case-only study of vulnerability to heat wavendashrelated mortality in New York City (2000ndash2011)rdquo Environmental Health Perspectives 123672ndash678 2013
WORKS CITED
NYC Mayorrsquos Office of Recovery and Resiliency Climate Resiliency Design Guidelines
56WORKS CITED
enspMcGregor et al Two Degrees The Built Environment and Our Changing Climate Routledge Press 2013
NYC Green Codes Task Force US Green Building Council New York 2010 httpurbangreencouncilorgGreenCodes
NYCrsquos Risk Landscape A Guide to Hazard Mitigation NYC Emergency Management 2014
One New York The Plan for a Strong and Just City The City of New York 2015 httpwwwnycgovhtmlonenyc downloadspdfpublicationsOneNYCpdf
Ready to Respond Strategies for Multifamily Building Resilience Enterprise Green Communities 2015 httpswwwenterprisecommunityorgresources
Rosenzweig C et al Climate Change Adaptation in New York City Building a Risk Management Response New York City Panel on Climate Change 2010
httponlinelibrarywileycomdoi101111nyas20101196issue-1 issuetoc
ldquoSustainable Infrastructure Management Program Learning Environmentrdquo Water Environment Research Foundation accessed March 24 2017 httpsimplewerforg
Urban Waterfront Adaptive Strategies NYC Department of City Planning 2013 httpwww1nycgovsiteplanningplanssustainable-communitiesclimate-resiliencepagetab=1
Wastewater Resiliency Plan Climate Risk Assessment and Adaptation Study New York City Department of Environmental Protection October 2013
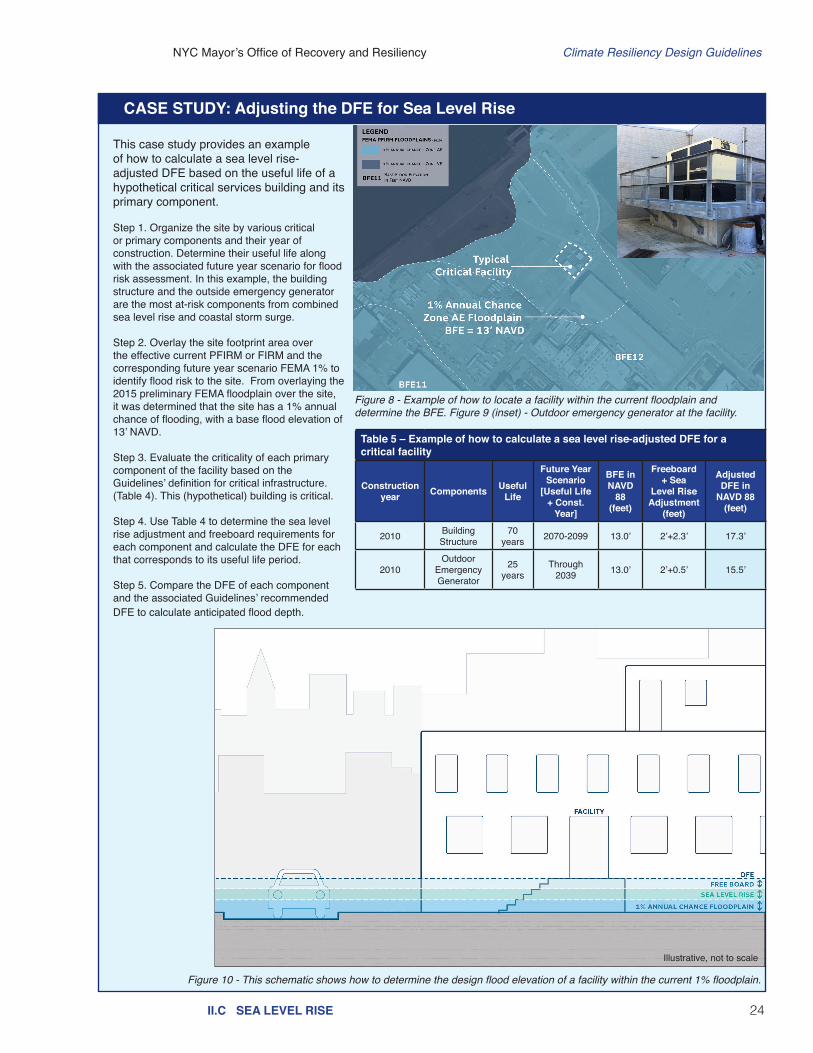
NYC Mayorrsquos Office of Recovery and Resiliency Climate Resiliency Design Guidelines
24IIC SEA LEVEL RISE
Figure 9 ndash Outdoor emergency generator for the critical building
This case study provides an example of how to calculate a sea level rise-adjusted DFE based on the useful life of a hypothetical critical services building and its primary component
Step 1 Organize the site by various critical or primary components and their year of construction Determine their useful life along with the associated future year scenario for flood risk assessment In this example the building structure and the outside emergency generator are the most at-risk components from combined sea level rise and coastal storm surge
Step 2 Overlay the site footprint area over the effective current PFIRM or FIRM and the corresponding future year scenario FEMA 1 to identify flood risk to the site From overlaying the 2015 preliminary FEMA floodplain over the site it was determined that the site has a 1 annual chance of flooding with a base flood elevation of 13rsquo NAVD Step 3 Evaluate the criticality of each primary component of the facility based on the Guidelinesrsquo definition for critical infrastructure (Table 4) This (hypothetical) building is critical
Step 4 Use Table 4 to determine the sea level rise adjustment and freeboard requirements for each component and calculate the DFE for each that corresponds to its useful life period
Step 5 Compare the DFE of each component and the associated Guidelinesrsquo recommended DFE to calculate anticipated flood depth
CASE STUDY Adjusting the DFE for Sea Level Rise
Table 5 ndash Example of how to calculate a sea level rise-adjusted DFE for a critical facility
Construction year Components Useful
Life
Future Year Scenario
[Useful Life + Const
Year]
BFE in NAVD
88 (feet)
Freeboard + Sea
Level Rise Adjustment
(feet)
Adjusted DFE in
NAVD 88 (feet)
2010 Building Structure
70 years 2070-2099 130rsquo 2rsquo+23rsquo 173rsquo
2010Outdoor
Emergency Generator
25 years
Through 2039 130rsquo 2rsquo+05rsquo 155rsquo
Figure 8 - Example of how to locate a facility within the current floodplain and determine the BFE Figure 9 (inset) - Outdoor emergency generator at the facility
Figure 10 - This schematic shows how to determine the design flood elevation of a facility within the current 1 floodplain
Illustrative not to scale
NYC Mayorrsquos Office of Recovery and Resiliency Climate Resiliency Design Guidelines
25IIC SEA LEVEL RISE
Figure 11 - Flood Hazard Mapper with future 1 annual chance floodplain (adjusted for sea level rise) at httpwwwnycgovfloodhazardmapper
b) If the site is not in the future floodplain no flood protection is required for this facility
- OR - If the site is in the future floodplain identify the nearest adjacent base flood
elevation at the project site in the current 1 annual chance floodplain (PFIRM 2015) using the Flood Hazard Mapper62
c) Use Table 4 to determine the DFE Add freeboard and the sea level rise-adjustment to the nearest adjacent BFE on the
current 1 annual chance floodplain (PFIRM 2015) to determine the DFE
d) Apply the DFE calculation from Table 4 to the protected facility See Figures 12 and 13 for an illustration of how to calculate the DFE
62 Maps of future floodplains show the impacts of sea level rise alone and do not consider how changes in stormsrsquo climatology might also affect wave action and the full extent of the floodplain
3 Addressing risks in the future floodplainIf the facility is not in the current 1 annual chance floodplain (PFIRM 2015) it may still be at risk in the future from flooding as sea level rise increases the extent of the floodplain Follow the steps below to determine if your facility is located in the future floodplain and if so what sea level rise-adjusted DFE to use
a) Use the Flood Hazard Mapper (httpwwwnycgovfloodhazardmapper) to determine if the facility site will be in the future 1 annual chance floodplain
Assess if by the end of the facilityrsquos useful life the floodplain is projected to increase to encompass all or part of the project site For example if the useful life ends between 2040 and 2069 choose the 2050s floodplain map Refer to the steps in Figure 11 below
NYC Mayorrsquos Office of Recovery and Resiliency Climate Resiliency Design Guidelines
26IIC SEA LEVEL RISE
Figure 12 - This schematic map shows how to locate the nearest adjacent 1 floodplain elevation
Figure 13 -This schematic shows how to determine the design flood elevation of a facility that is outside of the current 1 floodplain
CASE STUDY Identifying a Base Flood Elevation (BFE) in the Future Floodplain
Illustrative not to scale
NYC Mayorrsquos Office of Recovery and Resiliency Climate Resiliency Design Guidelines
27IIC SEA LEVEL RISE
4 Identify appropriate design interventions
63 Additional resources for identifying adaptive strategies Urban Waterfront Adaptive Strategies (NYC Department of City Planning httpswww1nycgovassetsplanningdownloadpdfplans-studiessustainable-communitiesclimate-resilienceurban_waterfrontpdf Floodproofing Non-Residential Buildings (FEMA) at httpswwwfemagovmedia-libraryassetsdocuments34270 Ready to Respond Strategies for Multifamily Building Resilience (Enterprise Green Community) at
httpwwwenterprisecommunityorgresourcesready-respond-strategies-multifamily-building-resilience-1335664 While natural systems-based approaches ameliorate flooding their use for storm surge or wave mitigation would need to be quantified
before contributing towards the design flood elevation 65 For more information see FEMArsquos Floodproofing Non-Residential Buildings at httpswwwfemagovmedia-libraryassetsdocuments34270
Operational requirements and continuity plans can inform the selection of appropriate design interventions particularly in terms of how quickly a site needs to be up and running after a flood event Some examples of how functional uses can pair with interventions include
bull A facility that needs to be operating during or immediately after a flood event may need to be dry floodproofed using permanent barriers or designed for passive survivability (such as a police or fire station)
bull A facility that needs to recover quickly after an event could elevate prioritized equipment and have deployable barriers
bull A site that can recover over a longer duration of time could be temporarily inundated during an event (such as parks or plazas) The use of resilient materials and strategies can reduce costly damage caused by temporary inundation
Different design interventions should be chosen based on the specific operational requirements of the project however these must meet the ASCE 24 design requirements for Coastal VE Zones
For all projects at risk of current or future flooding select protections that meet the projectrsquos design flood elevation Consider project-specific factors including the site location operational requirements existing continuity planning and cost63 A Design Strategies Checklist in Appendix 6 is available for use as a resource to track possible design approaches Some examples of design alternatives are
bull Site relocation where feasible conduct alternative site analysis
bull Permanent barriers at a site (eg floodwalls)
bull Deployable flood barriers (eg stop logs flood doorsgates inflatable barriers)
bull Natural systems-based approaches (eg living shorelines restored wetlands)64
bull Prioritized protection of electrical mechanical and other critical or costly-to-replace equipment above the design flood elevation (eg motors and controller boilers and furnaces fuel storage tanks duct work alarm systems and suppression equipment electrical panels electrical distribution and switching areas gas and electric meters telecommunications equipment chemical feed equipment HVAC units and emergency generators)65
bull Dry floodproofing design a facility to prevent water from entering
bull Wet floodproofing design a facility to permit floodwaters to flow in and out of the structure without causing significant damage (eg elevate or protect critical equipment use water-resistant building materials below the design flood elevation include flood vents and pumps)
bull Design redundant telecommunications conduit entrances for multiple carrier entry Telecom conduit should run to diverse manholes when possible
bull Install backup power for telecom equipment with design consideration for such equipment (eg installation above DFE)
bull Install outdoor-rated disconnect switch for telecommunications equipment on the roofbull Explore interventions to protect underground utilities and other telecommunications
facilities from water damagebull Install backflow preventers backwater valves and sump pumps for all buildings and
infrastructure in the floodplain as well as behind flood barriersbull Shoreline improvements that reduce the height of waves or attenuate waves where
feasible
NYC Mayorrsquos Office of Recovery and Resiliency Climate Resiliency Design Guidelines
28IIIA GENERAL METHODOLOGY TO ESTIMATE PROJECT BENEFITSIIIB CATEGORIES OF PROJECT BENEFITS
Designing and constructing facilities to handle the future climate loads above the current NYC codes and standards based on projected useful life of the components provides resiliency benefits The incremental costs to implement the Guidelinesrsquo recommended design interventions should be compared with the incremental benefits to aid agencies in making decisions about resilient design strategies The project design team should evaluate benefits of the interventions designed to meet Guidelinesrsquo recommended criteria for all the climate stressors qualitatively andor quantitatively For projects with construction costs below $50 million the project design team is recommended to perform a qualitative benefits assessment on the interventions that meet the Guidelinesrsquo recommendations for all applicable climate stressors For critical facilities or projects with construction costs over $50 million the project design team is recommended to perform quantitative benefit calculations to identify the optimal interventions that meet Guidelinesrsquo recommended design criteria
A GENERAL METHODOLOGY TO ESTIMATE PROJECT BENEFITSThis general methodology to perform qualitative and quantitative benefit calculations is recommended for use by project design teams at the beginning of and during the design process This methodology enables estimation of project benefits for a high-level benefit-cost analysis (BCA) that can be applied to evaluate and compare resiliency features designed to address sea level rise with coastal storm surge increased precipitation and extreme heat events The type of benefits provided by interventions designed to meet the Guidelinesrsquo design criteria can vary by climate stressors and typology of the facilities The main guiding principle in development of the high-level BCA methodologies included in these Guidelines was to balance simplicity with accuracy The project benefits categories identified within the methodology may not cover all the potential benefits provided by every facility type within NYC In particular the benefits of planning for increased precipitation are difficult to quantify Hence the project design team should use their discretion to modify this general benefit calculation methodology as needed to meet their project goals and objectives The project design team should develop appropriate input data whether quantitative or qualitative needed to estimate project benefits
B CATEGORIES OF PROJECT BENEFITSThere are three types of project benefit categories - direct benefits indirect benefits and other benefits - that can be used to perform qualitative assessments and develop quantitative estimates of monetary benefits for intervention alternatives designed to meet the Guidelinesrsquo recommendations These project benefit categories will help to perform a high-level benefit-cost analysis that balances accuracy with an appropriate level of effort
bull Direct Benefits include reduced or avoided physical damages to facilities and contents reduced or avoided displacements for residential structures and reduced life cycle or OampM costs that can be quantified as a primary result of implementing a specific hazard mitigation measure Table 12 in Appendix 4 provides a list of direct benefits and basic guidance on estimating and documenting values for sea level rise and increased precipitation-related flood hazards Note that given the current state of practice it is not possible to quantify reduced or avoided physical damages or residential displacements that result from a specific extreme heat mitigation measures Therefore direct benefits applicable to extreme heat hazards are limited to reduced life cycle costs applicable to certain measures such as green roofs Refer to Table 15 for details on direct benefits for extreme heat hazards
III EVALUATION OF PROJECT BENEFITS
NYC Mayorrsquos Office of Recovery and Resiliency Climate Resiliency Design Guidelines
29IIIB CATEGORIES OF PROJECT BENEFITS
bull Indirect Benefits include reduced or avoided service losses for non-residential
buildings public facilities andor infrastructure (utilities roads and bridges) based on the value of service continuity andor emergency services to New Yorkers that can be quantified as a secondary result of implementing a specific hazard mitigation measure Table 13 in Appendix 4 provides a list of indirect benefits and basic guidance on estimating and documenting values for sea level rise and increased precipitation-related flood hazards Note that given the current state of practice on extreme heat it is not possible to quantify reduced or avoided service losses that result from a specific extreme heat mitigation measures Therefore indirect benefits applicable to extreme heat hazards are limited to reduced energy costs such as cool roofs green roofs or shade trees Refer to Table 15 in Appendix 4 for details on indirect benefits for extreme heat hazards
bull Other Benefits where applicable other potential benefits may include social benefits for residents such as avoided stress and anxiety avoided lost productivity environmentalecosystem service benefits avoided need for emergency services and other potential benefits that can be estimated as a result of implementing a specific hazard mitigation measure Table 14 in Appendix 4 provides a list of other potential benefits and basic guidance on estimating and documenting values for sea level rise and increased precipitation-related flood hazards
Note on the ecosystem service benefit category in Table 14 the stormwater management benefits of green infrastructure should be distributed between the extreme heat and increased precipitation hazards since these measures provide both significant reductions in rainfall runoff as well as Urban Heat Island mitigation through evapotranspiration However there is currently limited data available to quantify the actual distribution of stormwater management benefits between the two hazards For various dual-benefit providing interventions careful considerations should be given to identify the appropriate benefits category provided by the intervention with a goal to avoid duplication of quantified benefits In this methodology the stormwater management benefits of green infrastructure are applied to the increased precipitation hazard in order to avoid a duplication of benefits Note on real estate and quality of life benefits additionally it is important to note that two potential benefit categories shown in Table 14 - real estate and quality of lifehealthavoided casualties - were not included in the current BCA methodology for sea level rise or increased precipitation hazards Although these categories could increase project benefits for sea level rise and increased precipitation hazards they were only applied to measures that address extreme heat hazards such as green roofs trees and other plantings Refer to Table 15 for a detailed summary of other benefit categories quantified as unit benefits for extreme heat hazards
NYC Mayorrsquos Office of Recovery and Resiliency Climate Resiliency Design Guidelines
30IIIC WHICH METHODOLOGY TO USEIIID BCA METHODOLOGY FOR PROJECTS UNDER $50 MILLION
D BCA methodology for projects under $50 millionThe project design team should develop design alternatives to meet the Guidelinesrsquo criteria which may be in excess of NYC code and standards requirements (baseline conditions) It is assumed that the project design team will develop alternatives to address each of the following applicable climate stressors - sea level risecoastal storm surge increased precipitation and extreme heat - separately Tables 12-15 in Appendix 4 provides a list of typical direct indirect and other benefits provided by various intervention typologies to reduce impacts from climate stressors During the qualitative assessment the project design team should consider that intervention strategies will have varying levels of reliability effectiveness benefits and cost implications during the qualitative assessment
The project design team is recommended to develop appropriate evaluation criteria and metrics for each of the applicable project benefit categories For each alternative the project design team could use either a scoring weighting ranking or other type of qualitative assessment framework to assess each applicable project benefit categories with the developed evaluation criteria and metrics Table 6 provides an example template to evaluate alternatives using a set of general evaluation criteria and metrics using a color-coded rating system (and see Table 7 for an example of how to complete the template) The project design team can utilize a similar template customized to their project goals and objectives This assessment allows agencies to screen the qualitative benefits for various alternatives that would then lead to development of final project components to match the available budget and goals of the project
Projects with total costs below $50 million recommended to conduct a qualitative assessment to identify the optimal interventions that meet Guidelinesrsquo design criteria using the ldquoD) BCA methodology for projects under $50 millionrdquo methodology below
C WHICH METHODOLOGY TO USEProjects with a total cost above $50 million or are highly complex or critical facilities recommended to conduct both a qualitative and quantitative benefit calculation to identify the optimal interventions that meet Guidelinersquos design criteria using the ldquoE) BCA methodology for projects above $50 millionrdquo below A quantitative BCA also must include qualitative factors
NYC Mayorrsquos Office of Recovery and Resiliency Climate Resiliency Design Guidelines
31IIID BCA METHODOLOGY FOR PROJECTS UNDER $50 MILLION
Qualitative Color Scale Green=Least resource intensive alternative Purple=most resource intensive yellow=medium level of resource intensity
Qualitative Evaluation Factors Description Relative Color Rating System
First CostsAdditional construction costs needed to incorporate Guidelinesrsquo recommended resilient design over the baseline project costs
Highest cost ($$$) rated as Purple whereas lowest cost ($) rated as Green
ConstructabilityEase of Implementation
Construction techniques and site conditions such as presence of major utilities conflicts and other conditions which dictate the level of constructability required for each alternative
Difficult to construct rated as Purple whereas easiest to construct rated as Green
Environmental ImpactsCo-BenefitsPermitting
Impacts to the built and natural environment such as circulation noise and hazardous waste plus the level of effort required for permitting (eg interventions in water require highest level of permitting requirement) from each alternative in addition to the baseline project condition
Highest environmental impacts and highest level of effort required for permitting rated as Purple whereas the least impact and level of effort rated as Green
Operation and Maintenance (OampM)
Level of effort of additional manpower and cost of OampM for the alternatives over the baseline project OampM requirements
Highest level of effort and cost for OampM rated as Purple whereas the lowest is rated as Green
Reliability and Durability
Interventions that do not require human involvement or a facilityrsquos ability to withstand all the forces during a storm event (eg permanent solutions with higher reliability than deployable solution)
Interventions requiring human involvement (active measures) rated as Purple whereas interventions with minimal or no human involvement (passive measures) rated as Green
Risk Reduction Benefits Monetary benefits provided by each intervention alternative in avoided damages over the baseline condition
Lowest potential monetary benefit rated as Purple whereas as highest potential monetary benefit rated as Green
Quality of Life BenefitsVisual Aesthetics
Benefits either to the community such as recreation or safety or serve the community during emergency situations
Lowest potential quality of life benefits rated as Purple whereas as highest potential benefits rated as Green
Table 6 ndash Evaluation matrix for comparison of mitigation alternatives across the useful life of a project
Project title_______________________________________________________________________________
Evaluation Criteria
Baseline Condition (Designed to NYC Building Code and
Standards)
Resilient Design Alternatives for Managing__________________
Alternative 1
Alternative 2
Alternative 3
First Costs
ConstructabilityEase of ImplementationEnvironmental ImpactsCo-BenefitsPermitting
Operation and Maintenance (OampM)
Reliability and Durability
Risk Reduction Benefits
Quality of Life BenefitsVisual Aesthetics
NYC Mayorrsquos Office of Recovery and Resiliency Climate Resiliency Design Guidelines
32IIID BCA METHODOLOGY FOR PROJECTS UNDER $50 MILLION
Table 7 ndash Evaluation matrix for comparison of mitigation alternatives across the useful life of a project - COMPLETED EXAMPLE
Evaluation Criteria
Baseline Condition (Designed to NYC Building Code and
Standards)
Resilient Design Alternatives for Managing Coastal SurgeSLR
Alternative 1Flood proof building built on grade to Guidelines
DFE
Alternative 2 Elevate building structure above Guidelinesrsquo DFE
on columns
Alternative 3 Raise site grade by filing the building site footprint
to Guidelinesrsquo DFE
First CostsBaseline cost for building structure is $15 million
Incremental costs are within 5 over the baseline costs
Incremental costs are between 5-10 over baseline costs
Incremental costs are 20 and more over baseline costs
ConstructabilityEase of Implementation
Relatively easy to construct within site constraints
Similar to baseline conditions since construction requires additional flood proofing only
Moderate challenges to construct foundation structure for columns within site constraints
Extremely challenging to construct within the site constraints Potentially fatal flaw
Environmental ImpactsCo-BenefitsPermitting
No major impacts but may require additional effort to obtain DOB permits with flood proofing and deployable systems
No major impacts but may require additional effort to obtain DOB permits with flood proofing and deployable systems
No major impacts and relatively easy to permit
Potential drainage circulation impacts and challenges to obtain clean fill material for the site
Operation and Maintenance (OampM)
Major OampM costs associated with deployable systems
Major OampM costs associated with deployable systems
Moderate OampM costs associated with proposed elevator for access
Minimal OampM costs since deployable and elevators not required
Reliability and Durability
Least reliability with highest potential risk from flooding during to failure of deployable systems
Least reliability with highest potential risk from flooding during to failure of deployable systems
Moderate reliability with potential risk from flooding limited to elevator shaft only
Highest reliability since deployable are not required to protect building from flooding
Risk Reduction Benefits
Maximum flood risk reduction benefits assuming deployable and flood proofing is effective
Maximum flood risk reduction benefits assuming deployable and flood proofing is effective
Maximum flood risk reduction benefits
Maximum flood risk reduction benefits
Quality of Life BenefitsVisual Aesthetics
Facility may not be operational during the storm event
Facility may not be operational during the storm event
Facility can be potentially operational during the storm event
Facility can be potentially operational during the storm event
Qualitative Color Scale Green=Least resource intensive alternative Purple=most resource intensive yellow=medium level of resource intensity
A new non-critical facility with a building structure is proposed on a site that is currently in the 2015 Preliminary FEMA 1 annual chance floodplain with a BFE of 10rsquo (NAVD 88) The baseline conditions DFE to meet existing NYC codes and standards is 11rsquo (NAVD 88) Using the Guidelines recommended design criteria the facilityrsquos DFE is 133rsquo (NAVD 88) and existing grade is around 6rsquo (NAVD 88) The project design team develops three alternatives to meet the Guidelinesrsquo recommended DFE design for the facility Table 7 offers an example of how a qualitative assessment can be used to compare three resilient design alternatives using the evaluation criteria and metrics
CASE STUDY Example of How to Use the Evaluation Matrix
NYC Mayorrsquos Office of Recovery and Resiliency Climate Resiliency Design Guidelines
33IIIE BCA METHODOLOGY FOR PROJECTS OVER $50 MILLION
E BCA methodology for projects over $50 millionIn order for a project to be considered cost-effective a benefit-cost analysis (BCA) assesses if the benefits of a project outweigh its costs or in other words the benefit-cost ratio (BCR) is greater than 10 as illustrated in Equation 1
Equation 1 Benefit-Cost Ratio Formula
BCR =
Where BCR = Benefit-Cost Ratio
BENEFITS = Total project benefits
COSTS = Total project costs
BENEFITSCOSTS
These estimated project benefits are combined with the project costs which are defined as the differential construction and long-term operation and maintenance costs associated with constructing a proposed project to the Guidelinesrsquo recommended design level It is assumed that the baseline project will be designed to the most prevalent NYC codes and standards This benefit methodology should be used to determine the additional project benefit that the Guidelinesrsquo recommended design would provide over the baseline project benefit It is assumed that the project design team will develop alternatives to address each of the following applicable climate stressors - sea level risecoastal storm surge increased precipitation and extreme heat - separately For each alternative the project design team should use the following steps to determine the Benefit-Cost Ratio (BCR)
a) Determine project useful life for design interventions Determining the useful life of the proposed project is an important first step in the
detailed BCA assessment methodologies for two reasons First the project useful life determines what values must be used from the Guidelines to establish the future climate design conditions The various hazard tables in the Guidelines establish design requirements based on useful life ranges through 2039 2040-2069 2070-2099 and 2100+ (2100+ projections are only available for sea level rise) A review of these tables show that the design requirements needed to meet the projected climate hazards increase as the end of useful life range increases Second the useful life determines how long the project will need to be operated and maintained in order to remain technically sound and effective at reducing future damages and losses
b) Determine discount rate for project benefits calculation The cost-effectiveness of projects assessed using the BCR must be done on a net
present value basis meaning the present value of the benefits is compared to the present value of the costs Most project costs are computed for present value based on current cost estimates bids or cost guidance However project benefits - as well as project costs for operation and maintenance - accrue over time into the future and are computed on an annualized basis To address this issue the Present Value Coefficient (PVC) is used to bring these annualized project benefits and OampM costs into the present value As indicated by the formula in Equation 2 the PVC is a function of the Project Useful Life (PUL) and the Discount Rate (DR)
NYC Mayorrsquos Office of Recovery and Resiliency Climate Resiliency Design Guidelines
34
Equation 2 Present Value Coefficient (PVC) Formula
PVC =
Where PVC = Present Value Coefficient
PUL = BCA Project Useful Life based on project type
DR = Discount Rate
The project design team should coordinate with agencies and NYC OMB if needed to determine appropriate discount rates based on funding source project type and other factors This coordination should take place during project initiation phase where total project costs (design and construction) are over $50 million66
c) Develop input data to perform benefit calculations Tables 16 and 17 in Appendix 4 provide a list of typical input data by each climate
stressor needed to perform benefit analysis quantitatively on variety of facilities67 The project design team should use these tables as a reference to identify appropriate input data categories andor additional input data needed to perform benefit analysis on the project
d) Identify applicable project benefit categories to estimate benefits Tables 16 and 17 in Appendix 4 provide a list of typical project benefits by each climate
stressor needed to perform benefit analysis quantitatively on various types of projects The project design team should use these tables as a reference to identify appropriate project benefit categories for each climate stressor to perform benefit analysis on the project
e) Calculate benefits of recommended design interventions for each climate
stressor The input data and applicable project benefits can be assembled along with
incremental project cost data to analyze cost-effectiveness using the FEMA BCA Tool Damage-Frequency Assessment (DFA) module or similar software This analysis will provide a BCR for each alternative which can then be used to compare the alternatives that were developed to mitigate effects from applicable climate stressors The project design team can then use the results from this analysis to identify optimal interventions that provides a balanced solution that provides resiliency benefits within the available project budget
IIIE BCA METHODOLOGY FOR PROJECTS OVER $50 MILLION
[1 ndash (1 + DR) -(PUL)]DR
66 For example a NYC OMB March 2015 memorandum recommends using an annually updated DR as published each year in Appendix C of OMB Circular A-94 The current OMB-recommended discount rates from OMB A-94 Appendix C vary by project useful life and are as follows 21 DR for useful lives of 10 to 19 years 25 DR for useful lives of 20 to 29 years and 28 DR for useful lives of 30 years or greater By contrast FEMA hazard mitigation grants use a DR of 70 for all projects based on the Federal OMB A-94 rate for federally-funded mitigation measures Since these DRs will impact the PVC and the project benefits the project team must ensure that BCA results prepared using an OMB-recommended DR (21 to 28) be updated to reflect the Federal DR (70) when applying for FEMA mitigation grant funds
67 Note the data requirements for the sea level rise and increased precipitation hazards in Table 16 are more detailed than the requirements for the extreme heat hazards due to the less detailed level of analysis available for extreme heat
NYC Mayorrsquos Office of Recovery and Resiliency Climate Resiliency Design Guidelines
35
APPENDICES
NYC Mayorrsquos Office of Recovery and Resiliency Climate Resiliency Design Guidelines
36APPENDIX 1 ndash KEY TERMS
100-year flood (1 annual chance flood)
A flood that has a 1 probability of occurring in any given year The 100-year floodplain is the extent of the area of a flood that has a 1 chance of occurring or being exceeded in any given year
500-year flood (02 annual chance flood)
A flood that has a 02 probability of occurring in any given year The 500-year floodplain is the extent of the area of a flood that has a 02 chance of occurring or being exceeded in any given year
AdaptationAdjustment in natural or human systems to a new or changing environment that seeks to maximize beneficial opportunities or moderate negative effects Successful adaptations contribute to resiliency
Base flood elevation (BFE)The elevation of surface water resulting from a flood that has a 1 annual chance of occurring or being exceeded in any given year The BFE is shown on the Flood Insurance Rate Map (FIRM)69
BluebeltReference to the Department of Environmental Protectionrsquos (DEP) Bluebelt program to preserve natural drainage corridors including streams ponds and other wetland areas Preservation of these wetland systems allows them to perform their functions of conveying storing and filtering storm water
Climate
The average weather (or more rigorously a statistical description of the average in terms of the mean and variability) over a period of time usually 30 years These quantities are most often surface variables such as temperature precipitation and wind Climate in a wider sense is the state including a statistical description of the climate system70
Climate change
Changes in average weather conditions that persist over multiple decades or longer Climate change encompasses both increases and decreases in temperature as well as shifts in precipitation changing risk of certain types of severe weather events and changes to other variables of the climate system
Climate change riskThe chance that investments (such as in capital projects) can be affected by the physical impacts of climate change71 Risks are evaluated as a product of the probability of occurrence and the magnitude of damages or impacts including socioeconomic factors that would result if they did occur (consequences)
Climate change risk assessment
This assessment involves a detailed project-specific analysis that includes a vulnerability and risk assessment often followed by cost-benefit analysis to assess and select investments in climate change risk mitigation Risk is assessed as a function of the magnitude and probability of a given climate change hazard Examples resources are included in Appendix 7
Climate vulnerabilityThe degree to which systems and populations are affected by adverse impacts It is a function of the character magnitude and rate of climate change and variation to which a system is exposed its sensitivity and its adaptive capacity72
Cloudburst An extreme amount of rain in a short period of time often over a small geographic area73
Cooling Degree Day (CDD) A form of degree-day used to estimate the energy requirements for air conditioning or refrigeration when the daily mean temperature is above 65degF
68 All terms are from the US Global Change Research Program (USGCRP) glossary unless otherwise noted The USGCRP glossary is available at httpwwwglobalchangegovclimate-changeglossary
69 ldquoDefinitionsrdquo FEMA last modified March 1 2017 httpswwwfemagovnational-flood-insurance-programdefinitions70 UKCIP Glossary httpwwwukciporgukglossary71 ldquoAccount for Climate Riskrdquo International Finance Corporation 72 UKCIP Glossary httpwwwukciporgukglossary73 New York City Environmental Protection ldquoCloudburst Resiliency Planning Studyrdquo 2017 Available at httpwwwnycgovhtmldeppdfclimatenyc-cloudburst-studypdf
APPENDIX 1 - KEY TERMS68
NYC Mayorrsquos Office of Recovery and Resiliency Climate Resiliency Design Guidelines
37APPENDIX 1 ndash KEY TERMS
Design life The life expectancy of an asset or product as determined during design74 As opposed to useful life (see below)
Dry Bulb temperature The ambient air temperature measured by a thermometer
Extreme eventUnexpected unusual or unpredictable weather or flooding compared to historical or future projected distribution Extreme events include for example heat waves cold waves heavy rains periods of drought and flooding and severe storms
Facilities For the purposes of this document ldquofacilitiesrdquo refers to all types of buildings housing infrastructure structures and landscape features designed by or for the City of New York
Flexible adaptation pathwayResilience-building strategies that can evolve or be adapted over time as climate change risk assessments evaluations of adaptation strategies and monitoring continue75
Flood Insurance Rate Maps (FIRM)
Official flood map of a community on which FEMA has delineated the 1 annual chance floodplain and the base flood elevations (BFEs) applicable to the community76 The FIRM also includes the 02 floodplain annual chance floodplain and differentiates between special flood hazard areas (V A Coast A zones) and floodways The official FIRM is from the year 2007 while the 2015 PFIRM is currently required by NYC Building Code to calculate design flood elevations NYC DOB references the more restrictive of the two maps in both base flood elevation and flood hazard area (ie V versus A zone) Refer to Appendix 3 for more information
FreeboardAn additional amount of height above the base flood elevation used as a factor of safety (eg two feet above the base flood) in determining the level at which a facilitys lowest floor must be elevated or floodproofed to be in accordance with state or community floodplain management regulations77
Future time slices
Future periods defined by the NPCC for when climate change projections are available In this document the following decadal projections are associated with specific time spans2020s projection = present to 20392050s projection = 2040 to 20592080s projection = 2070 to 20992100s projection = end of century and beyond
Green infrastructureAn array of practices that use or mimic natural systems to manage urban stormwater runoff Water is either directed to engineered systems for infiltration or detained for longer periods before it enters the sewer system
Heat Vulnerability Index (HVI)Summarizes relative risk of adverse health effects from heat due to social and environmental factors Used to identify neighborhoods at higher risk during and after extreme heat events
Heat wave A period of three consecutive days where temperatures rise above 90degF or two consecutive days over 95 degrees78
New York City Panel on Climate Change (NPCC)
The body of leading climate and social scientists charged with making climate change projections for the metropolitan region79
74 Sustainable Infrastructure Management Program Learning Environment httpsimplewerforg 75 Rosenzweig C et al Climate Change Adaptation in New York City Building a Risk Management Response76 ldquoDefinitionsrdquo FEMA77 Ibid78 Horton R et al New York City Panel on Climate Change 2015 Report Chapter 1 Climate Observations and Projections Ann NY
Acad Sci ISSN 0077-8923 (New York 2015) 2579 For more information on the NPCC visit www1nycgovsiteorrchallengesnyc-panel-on-climate-changepage
NYC Mayorrsquos Office of Recovery and Resiliency Climate Resiliency Design Guidelines
38APPENDIX 1 ndash KEY TERMS
Open-grid pavement system
Pavements that consist of loose substrates supported by a grid of a more structurally sound grid or webbing Unbounded loose substrates in these systems transfer and store less heat than bound and compacted pavements and aid permeability Pavement is 50 pervious and contains vegetation in the open cells designed to allow percolation or infiltration of storm water through the surface into the soil below80
Preliminary Flood Insurance Rate Map (PFIRM)
Preliminary flood map developed by FEMA in 2015 for New York City that provides projected risks for flood hazards81 Refer to Appendix 3 for more information
Project useful life (PUL)
The period over which an asset or component is expected to be available for use by an entity This depends on regular and adequate maintenance This period of time typically exceeds the design life (see above) The combined effect of operational requirements and useful life is practical in assessing an investment in improving resilience82
Rain gardenAlso called ldquobioswalerdquo Planted areas designed to collect and manage stormwater that runs off streets sidewalks commercial and residential rooftops and other sources when it rains
Resiliency The ability to bounce back after change or adversity The capability of preparing for responding to and recovering from difficult conditions83
Sea level rise-adjusted design flood elevation
As defined in these Guidelines the increased height of the base flood elevation due to sea level rise plus freeboard depending on the criticality of the facility The sea level rise adjustment depends on the useful life of the facility
Storm surge An abnormal rise of water generated by a storm over and above predicted astronomical tides84
Substantial improvementAny repair reconstruction rehabilitation addition or improvement of a building or structure the cost which equals or exceeds 50 of the market value of the structure before the improvement or repairs started For more information see Appendix G of the NYC Building Code and 1 RCNY sect3606-0185
Tidal inundation Flooding which occurs at high tides due to climate-related sea level rise land subsidence andor the loss of natural barriers86
Urban Heat Island (UHI) effectThe tendency for higher air temperatures to persist in urban areas as a result of heat absorbed and emitted by buildings and asphalt tending to make cities warmer than the surrounding suburban and rural areas
Weather The state of the atmosphere at a given time with regard to temperature cloudiness precipitation wind and other meteorological conditions87
Wet Bulb temperatureThe temperature indicated when a thermometer bulb is covered with a water-saturated wick over which air is caused to flow at approximately 45 ms (900 ftmin) to reach the equilibrium temperature of water evaporating into the air when the heat of vaporization is supplied by the sensible heat of the air88
80 ldquoGlossaryrdquo US Green Building Council (2017) Available at httpwwwusgbcorgglossaryterm552581 ldquoPreliminary FEMA Map Productsrdquo FEMA Map Service Center Available at httpshazardsfemagovfemaportalprelimdownload82 ldquoGlossaryrdquo International Infrastructure Management Manual (2011) 83 A Stronger More Resilient New York (2013) 184 ldquoStorm Surge Overviewrdquo National Hurricane Center NOAA Available at httpswwwnhcnoaagovsurge85 ldquoFlood Resistant Constructionrdquo Appendix G New York City Building Code (2008) and 1 RCNY sect3606-01 available at httpswww1nycgovassetsbuildingsrules1_RCNY_3606-01pdf86 ldquoOcean Factsrdquo National Ocean Service NOAA Available at httpoceanservicenoaagovfactsnuisance-floodinghtml 87 UKCIP Glossary httpwwwukciporgukglossary88 ldquoASHRAE Terminologyrdquo ASHRAE Available at httpswwwashraeorgtechnical-resourcesauthoring-toolsterminology
NYC Mayorrsquos Office of Recovery and Resiliency Climate Resiliency Design Guidelines
39APPENDIX 2 - CLIMATE CHANGE PROJECTIONS
Climate change projections are provided by the New York City Panel on Climate Change (NPCC) The full NPCC report is available from the New York Academy of Sciences89 Tables 8-10 (below) were reproduced directly from the NPCC report while Table 2 (see Section IIA) was developed using the data underlying the NPCC report to inform the design of HVAC systems under warmer conditions
Table 8 ndash NYC sea level rise projections90
Baseline (2000-2004) 0 in
Low estimate (10th percentile)
Middle range (25th to 75th percentile)
High estimate (90th percentile)
2020s 2 in 4-8 in 10 in
2050s 8 in 11-21 in 30 in
2080s 13 in 18-39 in 58 in
2100 15 in 22-50 in 75 in
Note Projections are based on six-component approach that incorporates both local and global factors The model-based components are from 24 global climate models and two representative concentration pathways Projections are relative to the 2000-2004 base period
Table 9 ndash Mean annual changes91
a Temperature Baseline(1971-2000) 54degF
Low estimate (10th percentile)
Middle range (25th to 75th percentile)
High estimate (90th percentile)
2020s + 15degF +20-29degF +32degF
2050s +31degF +41-57degF +66degF
2080s +38degF +53-88degF +103degF
2100 +42degF +58-104degF +121F
b Precipitation Baseline(1971-2000) 501 in
Low estimate (10th percentile)
Middle range (25th to 75th percentile)
High estimate (90th percentile)
2020s -1 percent +1-8 +10
2050s +1 percent +4-11 +13
2080s +2 percent +5-13 +19
2100 -6 percent -1 to +19 +25
Note Based on 35 global climate models (GCMs) and two RCPs Baseline data cover the 1971ndash2000 base period and are from the NOAA National Climatic Data Center (NCDC) Shown are the low estimate (10th percentile) middle range (25th percentile to 75th percentile) and high estimate (90th percentile) These estimates are based on a ranking (from most to least) of the 70 (35 GCMs times 2 RCPs) projections The 90th percentile is defined as the value that 90 percent of the outcomes (or 63 of the 70 values) are the same or lower than Like all projections the NPCC climate change projections have uncertainty embedded within them Sources of uncertainty include data and modeling constraints the random nature of some parts of the climate system and limited understanding of some physical processes The NPCC characterizes levels of uncertainty using state-of-the-art climate models multiple scenarios of future greenhouse gas concentrations and recent peer-reviewed literature Even so the projections are not true probabilities and the potential for error should be acknowledged
89 The NPCC 2015 report is available at httponlinelibrarywileycomdoi101111nyas20151336issue-1issuetoc90 From New York City Panel on Climate Change 2015 Report Chapter 1 Climate Observations and Projections page 4191 From New York City Panel on Climate Change 2015 Report Chapter 1 Climate Observations and Projections page 30
APPENDIX 2 - CLIMATE CHANGE PROJECTIONS
NYC Mayorrsquos Office of Recovery and Resiliency Climate Resiliency Design Guidelines
40APPENDIX 2 - CLIMATE CHANGE PROJECTIONS
Table 10 ndash Extreme events92
2020s Baseline (1971-2000)
Low estimate(10th percentile)
Middle range(25th to 75th percentile)
High estimate (90th percentile)
Numbers of heat waves per year 2 3 3-4 4
Average heat wave duration (days) 4 5 5 5
Number of days per year with
Maximum temperature at or above 90degF 18 24 26-31 33
Maximum temperature at or above 100degF 04 07 1-2 2
Minimum temperature at or below 32degF 71 50 52-58 60
Rainfall at or above 1 inch 13 13 14-15 16
Rainfall at or above 2 inches 3 3 3-4 5
Rainfall at or above 4 inches 03 02 03ndash04 05
2050s Baseline (1971-2000)
Low estimate(10th percentile)
Middle range(25th to 75th percentile)
High estimate (90th percentile)
Numbers of heat waves per year 2 4 5-7 7
Average heat wave duration (days) 4 5 5-6 6
Number of days per year with
Maximum temperature at or above 90degF 18 32 39-52 57
Maximum temperature at or above 100degF 04 2 3-5 7
Minimum temperature at or below 32degF 71 37 42-48 52
Rainfall at or above 1 inch 13 13 14-16 17
Rainfall at or above 2 inches 3 3 4-4 5
Rainfall at or above 4 inches 03 03 03-04 05
2080s Baseline (1971-2000)
Low estimate(10th percentile)
Middle range(25th to 75th percentile)
High estimate (90th percentile)
Numbers of heat waves per year 2 5 6-9 9
Average heat wave duration (days) 4 5 5-7 8
Number of days per year with
Maximum temperature at or above 90degF 18 38 44-76 87
Maximum temperature at or above 100degF 04 2 4-14 20
Minimum temperature at or below 32degF 71 25 30-42 49
Rainfall at or above 1 inch 13 14 15-17 18
Rainfall at or above 2 inches 3 3 4-5 5
Rainfall at or above 4 inches 03 02 03-05 07
Note Projections for temperature and precipitation are based on 35 GCMs and 2 RCPs Baseline data are for the 1971 to 2000 base period and are from the NOAA National Climatic Data Center (NCDC) Shown are the low estimate (10th percentile) middle range (25th to 75th percentile) and high estimate (90th percentile) 30-year mean values from model-based outcomes Decimal places are shown for values less than one although this does not indicate higher precisioncertainty Heat waves are defined as three or more consecutive days with maximum temperatures at or above 90degF Like all projections the NPCC climate change projections have uncertainty embedded within them Sources of uncertainty include data and modeling constraints the random nature of some parts of the climate system and limited understanding of some physical processes The NPCC characterizes levels of uncertainty using state-of-the-art climate models multiple scenarios of future greenhouse gas concentrations and recent peer-reviewed literature Even so the projections are not true probabilities and the potential for error should be acknowledged
92 From New York City Panel on Climate Change 2015 Report Chapter 1 Climate Observations and Projections page 31
NYC Mayorrsquos Office of Recovery and Resiliency Climate Resiliency Design Guidelines
41APPENDIX 3 - DIFFERENTIATION OF FLOOD MAPS
These Guidelines reference several different kinds of flood maps and sources of design flood elevations These maps are described and differentiated below
Table 11 - Differentiation of flood maps used in NYC
Reference Title Data Source Information Provided Referenced By Link
2007 FIRM FEMA
Based on historical data from before 1983 identifies the current base flood (extent and elevation) as the flood that has a 1 chance of occurring in any given year also known as a 100-year flood The NYC Building Code requires that either the 2007 FIRM or 2015 PFIRM elevation be used whichever is higher
2014 NYC Building Code Appendix G
Climate Resiliency Design Guidelines
httpsmscfemagovportal
2015 PFIRM FEMA
Based on historical data identifies the current base flood (extents and elevation) as the flood that has a 1 chance of occurring in any given year also known as a 100-year flood The NYC Building Code requires that either the 2007 FIRM or 2015 PFIRM elevation be used whichever is higher The 2015 PFIRM is currently being reassessed by FEMA
2014 NYC Building Code Appendix G
Climate Resiliency Design Guidelines
httpshazardsfemagovfemaportalprelimdownload
httpwwwregion2coastalcomview-flood-maps-dataview-preliminary-flood-map-data
NYC Flood Hazard Mapper
NYC Department of City Planning
Maps current and future flood hazards in NYC including the following data layers 2007 FIRM and 2015 PFIRM high tide with sea level rise and PFIRM with sea level rise through 2100
Climate Resiliency Design Guidelines
Waterfront Revitalization Plan
httpwww1nycgovsiteplanningdata-mapsflood-hazard-mapperpage
ldquoTable 4 ndash Determine the sea level rise-adjusted design flood elevation for critical and non-critical facilitiesrdquo
ORR amp NPCC
Provides data to use when adding sea level rise to a given 2015 PFIRM or 2007 FIRM Base Flood Elevation (BFE) to calculate a Design Flood Elevation (DFE) Based on the criticality and expected useful life of a facility
Climate Resiliency Design Guidelines
See Section II on ldquoSea Level Riserdquo above
APPENDIX 3 - DIFFERENTIATION OF FLOOD MAPS
NYC Mayorrsquos Office of Recovery and Resiliency Climate Resiliency Design Guidelines
42APPENDIX 4 - PROJECT BENEFITS CATEGORIES
This appendix provides guidance on how to identify and assess benefits as a supplement to Sections IIID and IIIE
Table 12 lists typical direct benefits for reducing impacts from climate stressors and basic guidance for how to estimate them See Section IIID for more information
Table 13 lists typical indirect benefits for reducing impacts from climate stressors and basic guidance for how to estimate them See Section IIID for more information
Table 12 ndash Direct benefits for (1) sea level rise with coastal storm surge and (2) increased precipitation measures
Direct Benefit Basic Guidance for Estimating Values
Physical Damages (Structure Contents)
bull For flood-damaged buildings use depth damage functions developed by FEMA and USACE for structures and contents
bull Use depth damage functions in conjunction with Building Replacement Values (BRVs) and not market values BRVs typically range between $100 to $325SF for residential buildings and $120 to $450SF for commercial public buildings
bull For more complex structures or facilities use engineering estimates of flood damages or review historic flood damages documented from insurance claims repair records or FEMA Public Assistance claims from recent flood disasters
Residential Displacements
bull For flood-damaged buildings use depth damage functions developed by FEMA and USACE for residential displacements
Reduced Life CycleOperation and Maintenance (OampM) Costs93
bull Applicable only to projects that reduce overall life cycle costs or net annual OampM costs from baseline conditions
bull Input reduced annual OampM costs as a project benefit at a 1-year recurrence intervalbull Reduced overall life cycle costs can be input as a longer project useful life
Table 13 ndash Indirect benefits for (1) sea level rise with coastal storm surge and (2) increased precipitation measures
Indirect Benefit Basic Guidance for Estimating Values
Non-Residential Building Service Losses
bull Estimate service loss values and durations for non-residential buildings public buildings critical facilities and parksnatural features based on FEMA BCA guidance and standard values based on building use
Utility Service Losses94
bull Estimate utility service losses for water wastewater and electrical facilities based on the number of impacted customers FEMA per capita standard values for utility service ($105personday for potable water $49personday for wastewater $148personday for electrical)95
bull Estimate utility service loss durations based on engineering estimates or review historic flood damages losses documented from utility company records
bull This benefit can also apply to measures that increase energy efficiency
RoadBridge Service Losses
bull Estimate roadbridge service losses based on the average daily traffic (ADT) detour time and additional travel distance and FEMA and GSA standard values for road service ($3344vehiclehour of delay $0545mile)96
bull Estimate roadbridge service loss durations or review historic flood damages losses
Emergency Service Losses
bull Applicable only to projects that reduce or eliminate documented emergency service costs from baseline conditions
bull Examples of avoided emergency services costs include NYPD staffing to monitor barricades for flooded roads or NFDY staffing for water rescues of residents from flooded buildings or streets
APPENDIX 4 - PROJECT BENEFITS CATEGORIES
93 Reduced life cycle costs may be applicable to some measures that provide extreme heat benefits such as green roofs that can last longer than a standard roof if properly maintained
94 Reduced utility service costs may be applicable to some measures that provide extreme heat benefits such as cool roofs green roofs and shade trees
95 FEMA per capita standard values taken from FEMA BCA Toolkit Version 530 (Build Date 12222016) and developed in FEMArsquos Baseline Standard Economic Value Methodology Report (July 28 2016) Consider updating FEMA standard per capita values to reflect current New York City utility rates
96 Consider updating FEMA and GSA standard values to reflect current New York City area labor rates and fuel costs
NYC Mayorrsquos Office of Recovery and Resiliency Climate Resiliency Design Guidelines
43APPENDIX 4 - PROJECT BENEFITS CATEGORIES
Table 14 ndash Other potential benefits for (1) sea level rise with coastal storm surge and (2) increased precipitation measures
Other Benefit Basic Guidance for Estimating Values
Avoided Stress and Anxiety
bull Applicable only for projects that directly benefit occupants of residential structuresbull Use FEMA standard value for avoided mental stress and anxiety treatment costs of $2443person to
estimate benefit for all impacted residents97
Avoided Lost Productivity
bull Applicable only for projects that directly benefit occupants of residential structuresbull Use FEMA standard value for avoided lost worker productivity costs of $8736household to estimate
benefit for all impacted workers (conservatively assuming one worker per household)
Environmental Open Space
bull Applicable only for projects that create or acquire open space areas by acquisitionbull Use FEMA standard value for environmental open space based on the type of land acquired ($8308
Acreyear for Green open space $39545Acreyear for Riparian $6010Acreyear for Wetlands $554Acreyear for Forests $1799Year for Marine and estuary)97
CSO Volume Reduction
bull Applicable only for projects that provide Combined Sewer Overflow (CSO) abatement by reducing the volume of rainfall runoff
bull Use CSO abatement cost of $0015gallonsyear applied to increased precipitation hazard runoff volume for 5-year design storm98
Ecosystem Service99
bull Add stormwater management benefits of green infrastructure projects to increased precipitation hazards where avoided damages and service losses are not quantified
bull Unit benefits applicable to increased precipitation hazard includeo Green roofs $0133SFyear (PUL 40 years)o BioswaleRain GardenMeadow Mix $0020SFyear (PUL 30 years)o Permeable Grass Pavers $0020SFyear (PUL 30 years)o Tree Plantings $303Treeyear (PUL 30 years)o Planter Box Trees $101Treeyear (PUL 15 years)
Real Estate99
bull Potential real estate benefits from increased resilience of residential andor commercial propertiesstreetscapesneighborhoods included within the project scope
bull Benefit applied to extreme heat hazard for green infrastructure projects directly impacting residential or commercial properties
Quality of Life Health Benefits99
bull Potential quality of life benefits related to improved public health from the resilience measures included within the project scope
bull Benefit applied to extreme heat hazard for green infrastructure projects directly impacting residential or commercial properties
Table 14 lists other typical benefits for reducing impacts from climate stressors and basic guidance for how to estimate them See Section IIID for more information
97 FEMA standard values for avoided mental stress and anxiety and environmental open space values taken from FEMA BCA Toolkit Version 530 (Build Date 12222016)
98 CSO abatement cost taken from APG1 Report for NYC ldquoTechnical Approaches for Benefit-Cost Analysis of Hazard Mitigation Projects in Urban and Coastal Environmentsrdquo (April 2016)
99 Ecosystem Services Real Estate and Quality of LifeHealth benefits tend to be more applicable to green infrastructure measures that provide extreme heat benefits such as green roofs trees and other plantings
NYC Mayorrsquos Office of Recovery and Resiliency Climate Resiliency Design Guidelines
44APPENDIX 4 - PROJECT BENEFITS CATEGORIES
Table 15 ndash Potential benefits for extreme heat (Urban Heat Island) reduction measures
Category Benefit Basic Guidance for Estimating Values
Direct Benefit
Reduced Life Cycle Cost
bull Applicable only to measures such as green roofs that are expected to last longer than standard roofs
bull Compute total cost savings including annual OampM costs
Indirect Benefit
Energy Savings
bull Applicable to measures that reduce energy costs by providing cooling through increased shading andor evapotranspiration
bull Use New York Power Authority rates of $0148kWh for electricity and $0810Therm for natural gas
Other Potential Benefits
Air Quality bull Applicable to measures that absorb pollutants andor reduce carbon dioxide emissions
Acoustics bull Applicable to measures such as green roof or walls that reduce noise transfer
Quality of LifeHealth bull Potential quality of life benefits and related to improved public health
Real Estate bull Applicable to measures that provide residential real estate benefits from increased resilience of propertiesstreetscapesneighborhoods
Retail Sales Marketing
bull Applicable to measures that provide commercial property benefits from increased aesthetics resulting in increased marketing and sales for streetscapesneighborhoods
Tax Credits Incentives
bull Applicable to resilience or green infrastructure measures such as green roofs that have accompanying Federal State or City tax credits or other incentives
Table 15 lists potential benefits for reducing impacts from heat and basic guidance for how to estimate them See Section IIID for more information
NYC Mayorrsquos Office of Recovery and Resiliency Climate Resiliency Design Guidelines
45APPENDIX 4 - PROJECT BENEFITS CATEGORIES
Table 16 ndash Guidance on quantitative calculations for (1) sea level rise with coastal storm surge and (2) increased precipitation measures
Data Input General Guidance ndash Basic Description
Applicable Benefit Category
Applicable Typical Facility Typology
Dire
ct B
enefi
ts
Indi
rect
Ben
efits
Oth
er P
oten
tial
Ben
efits
Bui
ldin
g St
ruct
ures
Com
plex
Fa
cilit
ies
Tran
spor
tatio
nSt
reet
scap
es
Plaz
as
Park
Fea
ture
s
First Floor Elevation (FFE)
bull The elevation of the first finished floor of the structure excluding basements
bull FFE measured from top of lowest floor (riverinenon-coastal high hazard areas) or bottom of lowest horizontal structural member (coastal high hazard areas)
Y Y Y Y
Building Replacement Value (BRV)
bull The unit cost to rebuild a structure of the same quality of construction
bull Not the same as market value
Y Y Y Y
Building Size
bull The total floor area of the building in square feet
bull Total Building Value = BRV x Building Sizebull Typical BRVs for NYC range between $100 to
$325SF for residential buildings and $120 to $450SF for commercialpublic buildings
Y Y Y Y
Structure Description
bull The type of building number of stories and foundation type (full basement partial basement no basement)
bull Collect more detailed foundation data for coastal flood zones
Y Y Y Y
Building Use bull Details related to residential housing commercial business and public use
Y Y Y Y Y
Building Type bull The primary use of building ndash residential commercial public and others
Y Y Y Y Y
Depth Damage Function (DDF)
bull Curves used to estimate structure damage contents damage and displacement of residential buildings based on flood depth
bull DDFs selection based on Structure Description Building Type Building Use
bull Structure DDFs based on percentage of Total Building Value
bull Contents DDFs based on percentage of Total Contents Value
bull Displacement DDFs based on number of displacement days x Displacement Cost
Y Y Y Y Y
Contents Value
bull The cost to replace structure contents (furnishings equipment)
bull Residential building Contents Values typically 50 BRV (FEMA DDFs) or 100 BRV (USACE DDFs)
bull Non-residential building Contents Values between 18 to over 100 depending on building use (USACE DDFs)
bull Total Contents Value = BRV x Building Size
Y Y Y Y Y
Table 16 provides general guidance on how to quantitatively calculate benefits from efforts to address from climate stressors See Section IIIE for more information
NYC Mayorrsquos Office of Recovery and Resiliency Climate Resiliency Design Guidelines
46APPENDIX 4 - PROJECT BENEFITS CATEGORIES
Table 16 ndash Guidance on quantitative calculations for (1) sea level rise with coastal storm surge and (2) increased precipitation measures
Data Input General Guidance ndash Basic Description
Applicable Benefit Category
Applicable Typical Facility Typology
Dire
ct B
enefi
ts
Indi
rect
Ben
efits
Oth
er P
oten
tial
Ben
efits
Bui
ldin
g St
ruct
ures
Com
plex
Fa
cilit
ies
Tran
spor
tatio
nSt
reet
scap
es
Plaz
as
Park
Fea
ture
s
Number of Residents (Residential)
bull Total number of occupants in a residential building
bull Typically estimated based on number of residential units x average number of individuals per household (based on current US Census data or use 25 individuals per household as a default)
Y Y Y Y Y
Displacement Cost (Residential)
bull The unit cost to lodge and feed displaced residents while flood damage is repaired
bull Average unit displacement cost of $415residential unitday recommended based on current FY2018 GSA Per Diem rates for New York City
Y Y Y Y Y
Value of Service (Non-Residential and Public)
bull The unit cost of service disruption and rental of temporary facilities while flood damage is repaired
bull Disruption costs for non-residential buildings typically range from $095 to $136SFmonth and rental costs range from $020 to $136SFmonth depending on building use
bull Value of service for public buildings ($day) is typically based on the annual operating budget for the City agency using the building prorated based on building size or population served by the building then divided by 365 daysyear
Y Y Y Y
Value of Service (Critical Facilities)
bull The unit cost of critical facilities (police fire emergency medical services) lost or delayed while flood damage is repaired
Y Y Y
Value of Service Duration
bull The duration of service disruption and rental of temporary facilities for non-residential buildings and critical facilities while flood damage is repaired
bull For non-residential buildingso Value of Service Durations vary from
4 months to over 30 months based on building use and the depth of flooding
o Total Value of Service Loss = (Disruption Cost x Building Area) = (Rental Cost x Building Area x Value of Service Duration)
bull For public buildings and critical facilitieso Value of Service Durations vary from 0
days to 720 months based on building use and the depth of flooding from FEMA FIA or USACE DDFs
o Total Value of Service Loss = (Value of Service) x (Service Loss Duration)
Y Y Y
NYC Mayorrsquos Office of Recovery and Resiliency Climate Resiliency Design Guidelines
47APPENDIX 4 - PROJECT BENEFITS CATEGORIES
Table 16 ndash Guidance on quantitative calculations for (1) sea level rise with coastal storm surge and (2) increased precipitation measures
Data Input General Guidance ndash Basic Description
Applicable Benefit Category
Applicable Typical Facility Typology
Dire
ct B
enefi
ts
Indi
rect
Ben
efits
Oth
er P
oten
tial
Ben
efits
Bui
ldin
g St
ruct
ures
Com
plex
Fa
cilit
ies
Tran
spor
tatio
nSt
reet
scap
es
Plaz
as
Park
Fea
ture
s
Engineering Estimates for Damages
bull Engineered estimate models of physical damages and service losses at the project site based on the Guidelines event recurrence interval(s) and flood depth(s)
Y Y Y Y Y Y
Historic Damages and Service Losses
bull Historic physical damages and service losses at the project site documented from previous flood events
bull Do not use routine maintenancebull The historic damage event recurrence interval
(RIs) andor flood depths must be determined updated for inflation to the present value and adjusted to match the Guidelines event RIsflood depths
Y Y Y Y Y Y
Facility Replacement Value
bull The unit cost to rebuild the facility
Impacted Area bull The geographic area impacted by the facility in the event of failure in acres
Y Y Y Y
Facility Capacity
bull The design capacity of the facilitybull For example - facility capacity expressed in
millions of gallons per day (MGD) for water and wastewater facilities or megawatts (MW) for electrical facilities
Y Y Y Y
Service Population
bull The number of impacted residents served by the facility
bull Typically estimated based on number of impacted residential customers x average number of individuals per household (based on current US Census data or use 25 individuals per household as a default)
bull Facilities serving mostly non-residentialpublic buildings andor critical facilities should focus on service losses rather than service population
Y Y Y
NYC Mayorrsquos Office of Recovery and Resiliency Climate Resiliency Design Guidelines
48APPENDIX 4 - PROJECT BENEFITS CATEGORIES
Table 16 ndash Guidance on quantitative calculations for (1) sea level rise with coastal storm surge and (2) increased precipitation measures
Data Input General Guidance ndash Basic Description
Applicable Benefit Category
Applicable Typical Facility Typology
Dire
ct B
enefi
ts
Indi
rect
Ben
efits
Oth
er P
oten
tial
Ben
efits
Bui
ldin
g St
ruct
ures
Com
plex
Fa
cilit
ies
Tran
spor
tatio
nSt
reet
scap
es
Plaz
as
Park
Fea
ture
s
Value of Service
bull Unit value of service provided by the facilitybull Example of FEMA standard values for complete
loss of utility service $105personday for potable water$49personday for wastewater$148personday for electrical
bull Consider updating FEMA standard per capita values to reflect current The New York City utility rates
Y Y
Roadway Elevations bull Roadway Elevations
Y Y
Roadway Replacement Value
bull Roadway Replacement ValueY Y
Inundation Area Map
bull Inundation Area Map developed by FEMA or through modeling by project design team
Y Y Y
Building Inventory of Inundation Area
bull The number and type of buildings within the streetscape and neighborhood inundated by the Guidelinersquos flood events
Y Y Y
Average Daily Traffic (ADT)
bull The average number of one-way traffic trips per day along the roadway(s) within the streetscapeneighborhood inundated by the Guidelinersquos flood events
Y Y
Additional Travel Time
bull The additional travel time needed to detour around a flooded roadway expressed in minutes
bull In the unlikely event there is no detour available use a 12-hour travel time per one-way trap but provide a detailed area street map as supporting documentation
Y Y
Value of Traffic Delay
bull The value of service associated with lost time in traffic
bull For example - FEMA standard average value of $3344vehiclehour of delay
bull Consider updating FEMA and GSA standard values to reflect current New York City area labor rates and fuel costs
Y Y
NYC Mayorrsquos Office of Recovery and Resiliency Climate Resiliency Design Guidelines
49APPENDIX 4 - PROJECT BENEFITS CATEGORIES
Table 17 ndash Guidance on quantitative unit benefit calculations for extreme heat hazard measures
Measure General Guidance ndash Unit Benefit Information and Data Requirements
Applicable Benefit Category
Applicable Typical Facility Typology
Dire
ct B
enefi
ts
Indi
rect
Ben
efits
Oth
er P
oten
tial
Ben
efits
Bui
ldin
g St
ruct
ures
Com
plex
Fa
cilit
ies
Tran
spor
tatio
nSt
reet
scap
es
Plaz
as
Park
Fea
ture
s
Green Roof
bull Unit benefit range over PUL = $470SF to $373SF of green roof area ($719SF standard value)
bull Assumed PUL = 40 yearsbull Apply standard value unit benefit to green
roof area to estimate measure benefitbull Higher range values more applicable
to residential and commercial building streetscape projects
Y Y Y Y Y Y
Bioswale Rain Garden Meadow Mix
bull Unit benefit range over PUL = $396SF to $211SF of area ($730SF standard value)
bull Assumed PUL = 30 yearsbull Apply standard value unit benefit to bioswale
rain gardenmeadow mix area to estimate total measure benefit
Y Y Y Y Y Y
Cool Roof
bull Unit benefit range over PUL = $117 to $3151SF of material area ($144SF standard value)
bull Assumed PUL = 20 yearsbull Apply standard value unit benefit to cool roof
area to estimate total measure benefitbull Higher range values more applicable to
residential building streetscape projects
Y Y Y Y Y
Light-Colored PaversLight-Colored Materials
bull Unit benefit range over PUL = $0774 to $204SF of material area ($0866SF standard value)
bull Assumed PUL = 30 yearsbull Apply standard value unit benefit to material
area to estimate total measure benefit
Y Y Y Y
Table 17 provides general guidance on how to quantitatively calculate benefits from efforts to address climate stressors See Section IIIE for more information
NYC Mayorrsquos Office of Recovery and Resiliency Climate Resiliency Design Guidelines
50APPENDIX 4 - PROJECT BENEFITS CATEGORIES
Table 17 ndash Guidance on quantitative unit benefit calculations for extreme heat hazard measures
Measure General Guidance ndash Unit Benefit Information and Data Requirements
Applicable Benefit Category
Applicable Typical Facility Typology
Dire
ct B
enefi
ts
Indi
rect
Ben
efits
Oth
er P
oten
tial
Ben
efits
Bui
ldin
g St
ruct
ures
Com
plex
Fa
cilit
ies
Tran
spor
tatio
nSt
reet
scap
es
Plaz
as
Park
Fea
ture
s
Tree Planting
bull Unit benefit range over PUL = $1005 to $77154Tree ($1855Tree standard value)
bull Assumed PUL = 30 yearsbull Apply standard value unit benefit to number of
trees to estimate total measure benefitbull Higher range values more applicable
to residential and commercial building streetscape projects
Y Y Y Y Y Y
Planter Box Tree
bull Unit benefit range over PUL = $212 to 16304Tree ($392Tree standard value)
bull Assumed PUL = 15 yearsbull Apply standard value unit benefit to number of
trees to estimate total measure benefitbull Higher range values more applicable
to residential and commercial building streetscape projects
Y Y Y Y Y
Shade Canopy
bull Unit benefit range over PUL = $0363 to $396SF ($0458SF standard value)
bull Assumed PUL = 15 yearsbull Apply standard value unit benefit to area of
shade canopy estimate total measure benefitbull Higher range values more applicable
to residential and commercial building streetscape projects
Y Y Y Y
Permeable Grass Pavers
bull Unit benefit range over PUL = $0258SF to $0521SF of pavers ($0363SF standard value)
bull Assumed PUL = 30 yearsbull Apply standard value unit benefit to paver
area to estimate total measure benefit
Y Y Y Y Y
For the purposes of the BCA refer to the following facility typologies bull ldquoBuilding Structuresrdquo include critical small building sites such as EMS or FDNY stations and non-critical small building sites such as
libraries or comfort stationsbull ldquoComplex Facilitiesrdquo include critical infrastructure such as wastewater treatment sites pump stations water filtration plants and similar
large or complex facilitiesbull ldquoTransportationStreetscapePlazasrdquo include roadway reconstruction streetscape improvements street raising plazas and other
transportation-related infrastructurebull ldquoPark Featuresrdquo include parks and similar public recreational facility with natural landscape features
NYC Mayorrsquos Office of Recovery and Resiliency Climate Resiliency Design Guidelines
51APPENDIX 5 - EXAMPLE PLANNING DECISION TREE
This decision tree provides a summarized example approach for how to implement these Guidelines Projects with a total cost greater than $50 million are recommended to conduct a full qualitative and quantitative climate change risk assessment and BCA while projects below $50 million are recommended to conduct a qualitative risk assessment and BCA
Define Project
1) Operational goals and criticality level2) Useful life3) Location in the current flood plain future floodplain and or zone
of tidal inundation and the project arearsquos score on the heat vulnerability index
Evaluate Project Risks According to Probability and Magnitude of Consequence
bull Extreme Heat bull Precipitationbull Sea Level Risebull Coastal Surge
High Level Identification and Assessment of Risk Mitigation Alternatives and Co-benefits
(qualitative)
Detailed Identification and Assessment of Risk Mitigation Alternatives and Co-benefits (qualitative and quantitative)
High Level Estimate of Costs and Benefits of Design Alternatives
(qualitative)
Detailed Estimate of Costs and Benefits of Design Alternatives
(qualitative and quantitative)
Decision Point Which climate change risks require mitigation
Decision Point Evaluate risk mitigation benefits and costs to
determine final resilient design alternative or if no action is required
Decision Point Is the total project cost above $50 million
Below $50 million Above $50 million
APPENDIX 5 - EXAMPLE PLANNING DECISION TREE
NYC Mayorrsquos Office of Recovery and Resiliency Climate Resiliency Design Guidelines
52
Project Title
Design Strategies Checklist (not exhaustive)
Extreme Heat Comments Extreme Precipitation Comments Sea Level Rise amp Storm Surge Comments
Select Site in Low Heat Vulnerability Index area Select High Elevation Site Select High Elevation Site
Minimize East-West Building Orientation Green Roof Raise Building Floor Elevation
Passive Solar Cooling and Ventilation Systems
Protect Below Grade Areas from Flooding Waterproof Building Envelope
Cool Roof (SRI appropriate) On-site Stormwater Management (gray) Elevate Critical Building Functions
Green Roof (extensive) Reduce Impervious Areas Elevate Critical Equipment
Vegetative Structures Permeable Pavement Perimeter Floodwall100 Levee (passive or active)
Enhanced HVAC System including space layout optimization and system scalability
Increase Green Spaces and Planted Areas DryWet Floodproofing
More Efficient Building Envelope Other Utility Redundancy Design101
Parking Lot Shading Resilient Materials amp Landscape Treatments
Light Colored Pavements (appropriate SRI) Design for Storm Surge Outflow
Increase Planted Areas Install Backwater Flow Prevention
Permeable Surfaces Design for Scour
Open-grid Pavement Raise Road Elevation
Other Other
This appendix provides a template for identifying possible design strategies to address climate change risks as described throughout the Guidelines
APPENDIX 6 - DESIGN STRATEGIES CHECKLIST
100 Permanent perimeter flood walls are not permitted to meet floodproofing requirements in buildings with substantial improvements andor damages 101 Utility redundancy design should be pursued for critical systems not all building systems
APPENDIX 6 - DESIGN STRATEGIES CHECKLIST
NYC Mayorrsquos Office of Recovery and Resiliency Climate Resiliency Design Guidelines
53APPENDIX 7 - CLIMATE CHANGE RISK ASSESSMENT RESOURCES
These Guidelines provide data on climate change hazards and recommend how that data can inform resilient design A risk assessment is a tool to help project managers and designers evaluate risk levels as well as select and prioritize resilient design strategies A high level risk assessment is recommended for all City capital projects with a total cost of under $50 million Projects above $50 million are recommended to conduct an in-depth assessment
Risk assessments use quantified estimates of the probability and magnitude of consequence of an event occurring to prioritize responses ldquoProbabilityrdquo is an assessment of the likelihood of a hazard occurring while ldquomagnituderdquo describes the hazardrsquos potential impact Risk assessment tools such as the examples listed below can be used to define and score these categories Projects that score higher across both probability and magnitude can be prioritized for investment and risk mitigation action Projects that score lower across both criteria may require no action beyond meeting code The results are typically charted on a risk matrix and an example is provided on the next page
The climate change risk management frameworks below offer templates for how to integrate climate change projections into a risk assessment process Refer to these resources for examples and further information
bull Vulnerability Assessment and Adaptation Framework is prepared by the Federal Highway Administration (FHWA) While developed for transportation planning this risk assessment framework has broad applicability for evaluating asset vulnerability to climate change Available at httpswwwfhwadotgovenvironmentsustainabilityresilienceadaptation_framework
bull US Climate Resilience Toolkit The US Global Change Research Program offers a step by step risk assessment
framework including tools and case studies at httpstoolkitclimategovsteps (see example on next page)
bull Coast Adapt Guidance on undertaking a risk assessment High level assessment httpscoastadaptcomausitesdefaultfilesfactsheetsT3M4_2_2nd_pass_risk_assessmentpdfDetailed assessment httpscoastadaptcomausitesdefaultfilesfactsheetsT3M4_3_3rd_pass_risk_assessmentpdf
bull Climate adaptation Risk uncertainty and decision-makingDownload the report here httpswwwukciporgukpublicationsRisk
The City plans to develop a NYC-specific process for integrating climate change data into existing risk management processes by April 2019
APPENDIX 7 - CLIMATE CHANGE RISK ASSESSMENT RESOURCES
NYC Mayorrsquos Office of Recovery and Resiliency Climate Resiliency Design Guidelines
54APPENDIX 7 - CLIMATE CHANGE RISK ASSESSMENT RESOURCES
The Risk Characterization Matrix below is an example from the US Climate Resilience Toolkit This tool can be used to assess the probability and magnitude of impact for identified risks The risk of coincident climate stressorsrisks (such as storm surge plus increased precipitation) can also be assessed as applicable
Figure 14 - Example of a climate change risk matrix (adapted from US Climate Resilience Toolkit)
Project teams can determine the magnitude of the impact (along the horizontal scale of 1 through 3 with 3 being the most severe) and the probabilitylikelihood of occurrence for each specific risk (along the vertical scale with 3 being the most likely) A score is typically assigned for each risk (Probabil-ity x Magnitude) and then charted on the matrix Based on the estimated probability and magnitude of consequence above the risks are ranked and prioritized for mitigation Factors to bear in mind include
bull Not all facility typologies have the same level of functional and operational importance during events or tolerance for disruption
bull Not all climate stressors and risks have the same level of impact on each project sitebull Not all identified risks can or should be mitigated fully
NYC Mayorrsquos Office of Recovery and Resiliency Climate Resiliency Design Guidelines
55WORKS CITED
A Stronger More Resilient New York PlaNYC Report of the NYC Special Initiative for Rebuilding and Resiliency The City of New York 2013
ldquoAccount for Climate Riskrdquo International Finance Corporation accessed March 27 2017 httpwwwifcorgwpswcmconnectTopics_Ext_ContentIFC_External_Corporate_SiteClimate+Business
PrioritiesAccount+for+Climate+Risk
American Society of Heating Refrigeration and Air-Conditioning Engineers (ASHRAE) Handbook -Fundamentals 2017
ldquoBaseline Standard Economic Value Methodology Reportrdquo Federal Emergency Management Agency July 2016
Benefit Cost Analysis Toolkit Software Version 530 Federal Emergency Management Agency (build date December 2016)
Criteria for Detention Facility Design New York City Department of Environmental Protection November 2012
Community Resilience Planning Guide for Buildings and Infrastructure Systems Vol 1 NIST Special Publication 1190 US Department of Commerce 2016
Cool and Green Roofing Manual NYC Department of Design and Construction 2007 httpwwwnycgovhtmlddcdownloadspdfcool_green_roof_manpdf
Building Resiliency Task Force US Urban Green Building Council New York 2013 httpurbangreencouncilforcecomBuildingResiliency
Design and Planning for Flood Resiliency Guidelines for NYC Parks New York City Department of Parks and Recreation 2017
httpswwwnycgovparksorgplanning-and-buildingplanningresiliency-plansflood-resiliency
Flooded Bus Barns and Buckled Rails Federal Transit Administration Office of Budget and Policy 2011 httpswwwhsdlorgabstractampdid=685187
Floodproofing Non-Residential Buildings FEMA P936 FEMA 2013 httpswwwfemagovmedia-library-data9a50c534fc5895799321dcdd4b6083e7P-936_8-20-13_508rpdf
ldquoGlossaryrdquo International Infrastructure Management Manual National Asset Management Support Group New Zealand 2011 httpwwwipweaorg
ldquoGreen Roof Metrics Draft Reportrdquo New York City Department of Parks and Recreation 2017
ldquoGuide to Rain Event Preparednessrdquo NYC Department of Environmental Protection httpwwwnycgovhtmldeppdfbrochuresflood-preparedness-flyerpdf
ldquoGuidelines and Discount Rates for Benefit-Cost Analysis of Federal Programsrdquo Appendix C Circular A-94 US Office of Management and Budget (OMB) 2017
ldquoGuidelines for the Design and Construction of Stormwater Management Systemsrdquo New York City Department of Environmental Protection July 2012
Horton R et al New York City Panel on Climate Change 2015 Report Ann NY Acad Sci ISSN 0077-892 New York 2015
Madrigano J et al ldquoA case-only study of vulnerability to heat wavendashrelated mortality in New York City (2000ndash2011)rdquo Environmental Health Perspectives 123672ndash678 2013
WORKS CITED
NYC Mayorrsquos Office of Recovery and Resiliency Climate Resiliency Design Guidelines
56WORKS CITED
enspMcGregor et al Two Degrees The Built Environment and Our Changing Climate Routledge Press 2013
NYC Green Codes Task Force US Green Building Council New York 2010 httpurbangreencouncilorgGreenCodes
NYCrsquos Risk Landscape A Guide to Hazard Mitigation NYC Emergency Management 2014
One New York The Plan for a Strong and Just City The City of New York 2015 httpwwwnycgovhtmlonenyc downloadspdfpublicationsOneNYCpdf
Ready to Respond Strategies for Multifamily Building Resilience Enterprise Green Communities 2015 httpswwwenterprisecommunityorgresources
Rosenzweig C et al Climate Change Adaptation in New York City Building a Risk Management Response New York City Panel on Climate Change 2010
httponlinelibrarywileycomdoi101111nyas20101196issue-1 issuetoc
ldquoSustainable Infrastructure Management Program Learning Environmentrdquo Water Environment Research Foundation accessed March 24 2017 httpsimplewerforg
Urban Waterfront Adaptive Strategies NYC Department of City Planning 2013 httpwww1nycgovsiteplanningplanssustainable-communitiesclimate-resiliencepagetab=1
Wastewater Resiliency Plan Climate Risk Assessment and Adaptation Study New York City Department of Environmental Protection October 2013
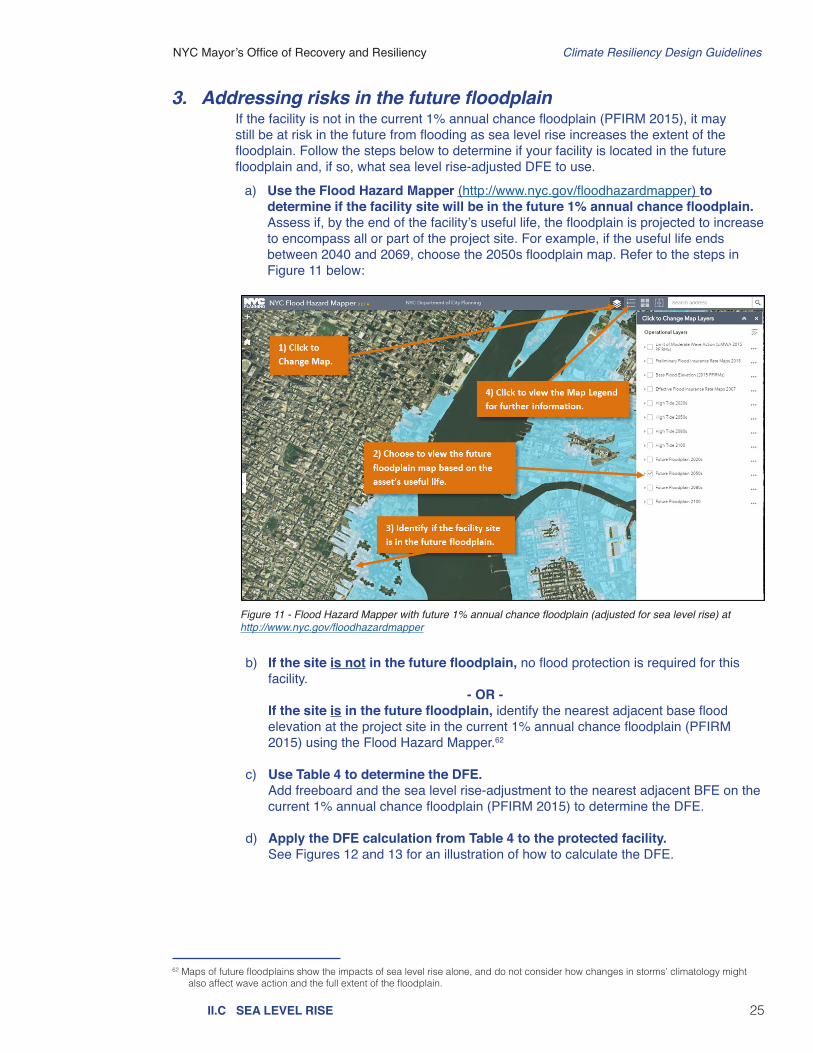
NYC Mayorrsquos Office of Recovery and Resiliency Climate Resiliency Design Guidelines
25IIC SEA LEVEL RISE
Figure 11 - Flood Hazard Mapper with future 1 annual chance floodplain (adjusted for sea level rise) at httpwwwnycgovfloodhazardmapper
b) If the site is not in the future floodplain no flood protection is required for this facility
- OR - If the site is in the future floodplain identify the nearest adjacent base flood
elevation at the project site in the current 1 annual chance floodplain (PFIRM 2015) using the Flood Hazard Mapper62
c) Use Table 4 to determine the DFE Add freeboard and the sea level rise-adjustment to the nearest adjacent BFE on the
current 1 annual chance floodplain (PFIRM 2015) to determine the DFE
d) Apply the DFE calculation from Table 4 to the protected facility See Figures 12 and 13 for an illustration of how to calculate the DFE
62 Maps of future floodplains show the impacts of sea level rise alone and do not consider how changes in stormsrsquo climatology might also affect wave action and the full extent of the floodplain
3 Addressing risks in the future floodplainIf the facility is not in the current 1 annual chance floodplain (PFIRM 2015) it may still be at risk in the future from flooding as sea level rise increases the extent of the floodplain Follow the steps below to determine if your facility is located in the future floodplain and if so what sea level rise-adjusted DFE to use
a) Use the Flood Hazard Mapper (httpwwwnycgovfloodhazardmapper) to determine if the facility site will be in the future 1 annual chance floodplain
Assess if by the end of the facilityrsquos useful life the floodplain is projected to increase to encompass all or part of the project site For example if the useful life ends between 2040 and 2069 choose the 2050s floodplain map Refer to the steps in Figure 11 below
NYC Mayorrsquos Office of Recovery and Resiliency Climate Resiliency Design Guidelines
26IIC SEA LEVEL RISE
Figure 12 - This schematic map shows how to locate the nearest adjacent 1 floodplain elevation
Figure 13 -This schematic shows how to determine the design flood elevation of a facility that is outside of the current 1 floodplain
CASE STUDY Identifying a Base Flood Elevation (BFE) in the Future Floodplain
Illustrative not to scale
NYC Mayorrsquos Office of Recovery and Resiliency Climate Resiliency Design Guidelines
27IIC SEA LEVEL RISE
4 Identify appropriate design interventions
63 Additional resources for identifying adaptive strategies Urban Waterfront Adaptive Strategies (NYC Department of City Planning httpswww1nycgovassetsplanningdownloadpdfplans-studiessustainable-communitiesclimate-resilienceurban_waterfrontpdf Floodproofing Non-Residential Buildings (FEMA) at httpswwwfemagovmedia-libraryassetsdocuments34270 Ready to Respond Strategies for Multifamily Building Resilience (Enterprise Green Community) at
httpwwwenterprisecommunityorgresourcesready-respond-strategies-multifamily-building-resilience-1335664 While natural systems-based approaches ameliorate flooding their use for storm surge or wave mitigation would need to be quantified
before contributing towards the design flood elevation 65 For more information see FEMArsquos Floodproofing Non-Residential Buildings at httpswwwfemagovmedia-libraryassetsdocuments34270
Operational requirements and continuity plans can inform the selection of appropriate design interventions particularly in terms of how quickly a site needs to be up and running after a flood event Some examples of how functional uses can pair with interventions include
bull A facility that needs to be operating during or immediately after a flood event may need to be dry floodproofed using permanent barriers or designed for passive survivability (such as a police or fire station)
bull A facility that needs to recover quickly after an event could elevate prioritized equipment and have deployable barriers
bull A site that can recover over a longer duration of time could be temporarily inundated during an event (such as parks or plazas) The use of resilient materials and strategies can reduce costly damage caused by temporary inundation
Different design interventions should be chosen based on the specific operational requirements of the project however these must meet the ASCE 24 design requirements for Coastal VE Zones
For all projects at risk of current or future flooding select protections that meet the projectrsquos design flood elevation Consider project-specific factors including the site location operational requirements existing continuity planning and cost63 A Design Strategies Checklist in Appendix 6 is available for use as a resource to track possible design approaches Some examples of design alternatives are
bull Site relocation where feasible conduct alternative site analysis
bull Permanent barriers at a site (eg floodwalls)
bull Deployable flood barriers (eg stop logs flood doorsgates inflatable barriers)
bull Natural systems-based approaches (eg living shorelines restored wetlands)64
bull Prioritized protection of electrical mechanical and other critical or costly-to-replace equipment above the design flood elevation (eg motors and controller boilers and furnaces fuel storage tanks duct work alarm systems and suppression equipment electrical panels electrical distribution and switching areas gas and electric meters telecommunications equipment chemical feed equipment HVAC units and emergency generators)65
bull Dry floodproofing design a facility to prevent water from entering
bull Wet floodproofing design a facility to permit floodwaters to flow in and out of the structure without causing significant damage (eg elevate or protect critical equipment use water-resistant building materials below the design flood elevation include flood vents and pumps)
bull Design redundant telecommunications conduit entrances for multiple carrier entry Telecom conduit should run to diverse manholes when possible
bull Install backup power for telecom equipment with design consideration for such equipment (eg installation above DFE)
bull Install outdoor-rated disconnect switch for telecommunications equipment on the roofbull Explore interventions to protect underground utilities and other telecommunications
facilities from water damagebull Install backflow preventers backwater valves and sump pumps for all buildings and
infrastructure in the floodplain as well as behind flood barriersbull Shoreline improvements that reduce the height of waves or attenuate waves where
feasible
NYC Mayorrsquos Office of Recovery and Resiliency Climate Resiliency Design Guidelines
28IIIA GENERAL METHODOLOGY TO ESTIMATE PROJECT BENEFITSIIIB CATEGORIES OF PROJECT BENEFITS
Designing and constructing facilities to handle the future climate loads above the current NYC codes and standards based on projected useful life of the components provides resiliency benefits The incremental costs to implement the Guidelinesrsquo recommended design interventions should be compared with the incremental benefits to aid agencies in making decisions about resilient design strategies The project design team should evaluate benefits of the interventions designed to meet Guidelinesrsquo recommended criteria for all the climate stressors qualitatively andor quantitatively For projects with construction costs below $50 million the project design team is recommended to perform a qualitative benefits assessment on the interventions that meet the Guidelinesrsquo recommendations for all applicable climate stressors For critical facilities or projects with construction costs over $50 million the project design team is recommended to perform quantitative benefit calculations to identify the optimal interventions that meet Guidelinesrsquo recommended design criteria
A GENERAL METHODOLOGY TO ESTIMATE PROJECT BENEFITSThis general methodology to perform qualitative and quantitative benefit calculations is recommended for use by project design teams at the beginning of and during the design process This methodology enables estimation of project benefits for a high-level benefit-cost analysis (BCA) that can be applied to evaluate and compare resiliency features designed to address sea level rise with coastal storm surge increased precipitation and extreme heat events The type of benefits provided by interventions designed to meet the Guidelinesrsquo design criteria can vary by climate stressors and typology of the facilities The main guiding principle in development of the high-level BCA methodologies included in these Guidelines was to balance simplicity with accuracy The project benefits categories identified within the methodology may not cover all the potential benefits provided by every facility type within NYC In particular the benefits of planning for increased precipitation are difficult to quantify Hence the project design team should use their discretion to modify this general benefit calculation methodology as needed to meet their project goals and objectives The project design team should develop appropriate input data whether quantitative or qualitative needed to estimate project benefits
B CATEGORIES OF PROJECT BENEFITSThere are three types of project benefit categories - direct benefits indirect benefits and other benefits - that can be used to perform qualitative assessments and develop quantitative estimates of monetary benefits for intervention alternatives designed to meet the Guidelinesrsquo recommendations These project benefit categories will help to perform a high-level benefit-cost analysis that balances accuracy with an appropriate level of effort
bull Direct Benefits include reduced or avoided physical damages to facilities and contents reduced or avoided displacements for residential structures and reduced life cycle or OampM costs that can be quantified as a primary result of implementing a specific hazard mitigation measure Table 12 in Appendix 4 provides a list of direct benefits and basic guidance on estimating and documenting values for sea level rise and increased precipitation-related flood hazards Note that given the current state of practice it is not possible to quantify reduced or avoided physical damages or residential displacements that result from a specific extreme heat mitigation measures Therefore direct benefits applicable to extreme heat hazards are limited to reduced life cycle costs applicable to certain measures such as green roofs Refer to Table 15 for details on direct benefits for extreme heat hazards
III EVALUATION OF PROJECT BENEFITS
NYC Mayorrsquos Office of Recovery and Resiliency Climate Resiliency Design Guidelines
29IIIB CATEGORIES OF PROJECT BENEFITS
bull Indirect Benefits include reduced or avoided service losses for non-residential
buildings public facilities andor infrastructure (utilities roads and bridges) based on the value of service continuity andor emergency services to New Yorkers that can be quantified as a secondary result of implementing a specific hazard mitigation measure Table 13 in Appendix 4 provides a list of indirect benefits and basic guidance on estimating and documenting values for sea level rise and increased precipitation-related flood hazards Note that given the current state of practice on extreme heat it is not possible to quantify reduced or avoided service losses that result from a specific extreme heat mitigation measures Therefore indirect benefits applicable to extreme heat hazards are limited to reduced energy costs such as cool roofs green roofs or shade trees Refer to Table 15 in Appendix 4 for details on indirect benefits for extreme heat hazards
bull Other Benefits where applicable other potential benefits may include social benefits for residents such as avoided stress and anxiety avoided lost productivity environmentalecosystem service benefits avoided need for emergency services and other potential benefits that can be estimated as a result of implementing a specific hazard mitigation measure Table 14 in Appendix 4 provides a list of other potential benefits and basic guidance on estimating and documenting values for sea level rise and increased precipitation-related flood hazards
Note on the ecosystem service benefit category in Table 14 the stormwater management benefits of green infrastructure should be distributed between the extreme heat and increased precipitation hazards since these measures provide both significant reductions in rainfall runoff as well as Urban Heat Island mitigation through evapotranspiration However there is currently limited data available to quantify the actual distribution of stormwater management benefits between the two hazards For various dual-benefit providing interventions careful considerations should be given to identify the appropriate benefits category provided by the intervention with a goal to avoid duplication of quantified benefits In this methodology the stormwater management benefits of green infrastructure are applied to the increased precipitation hazard in order to avoid a duplication of benefits Note on real estate and quality of life benefits additionally it is important to note that two potential benefit categories shown in Table 14 - real estate and quality of lifehealthavoided casualties - were not included in the current BCA methodology for sea level rise or increased precipitation hazards Although these categories could increase project benefits for sea level rise and increased precipitation hazards they were only applied to measures that address extreme heat hazards such as green roofs trees and other plantings Refer to Table 15 for a detailed summary of other benefit categories quantified as unit benefits for extreme heat hazards
NYC Mayorrsquos Office of Recovery and Resiliency Climate Resiliency Design Guidelines
30IIIC WHICH METHODOLOGY TO USEIIID BCA METHODOLOGY FOR PROJECTS UNDER $50 MILLION
D BCA methodology for projects under $50 millionThe project design team should develop design alternatives to meet the Guidelinesrsquo criteria which may be in excess of NYC code and standards requirements (baseline conditions) It is assumed that the project design team will develop alternatives to address each of the following applicable climate stressors - sea level risecoastal storm surge increased precipitation and extreme heat - separately Tables 12-15 in Appendix 4 provides a list of typical direct indirect and other benefits provided by various intervention typologies to reduce impacts from climate stressors During the qualitative assessment the project design team should consider that intervention strategies will have varying levels of reliability effectiveness benefits and cost implications during the qualitative assessment
The project design team is recommended to develop appropriate evaluation criteria and metrics for each of the applicable project benefit categories For each alternative the project design team could use either a scoring weighting ranking or other type of qualitative assessment framework to assess each applicable project benefit categories with the developed evaluation criteria and metrics Table 6 provides an example template to evaluate alternatives using a set of general evaluation criteria and metrics using a color-coded rating system (and see Table 7 for an example of how to complete the template) The project design team can utilize a similar template customized to their project goals and objectives This assessment allows agencies to screen the qualitative benefits for various alternatives that would then lead to development of final project components to match the available budget and goals of the project
Projects with total costs below $50 million recommended to conduct a qualitative assessment to identify the optimal interventions that meet Guidelinesrsquo design criteria using the ldquoD) BCA methodology for projects under $50 millionrdquo methodology below
C WHICH METHODOLOGY TO USEProjects with a total cost above $50 million or are highly complex or critical facilities recommended to conduct both a qualitative and quantitative benefit calculation to identify the optimal interventions that meet Guidelinersquos design criteria using the ldquoE) BCA methodology for projects above $50 millionrdquo below A quantitative BCA also must include qualitative factors
NYC Mayorrsquos Office of Recovery and Resiliency Climate Resiliency Design Guidelines
31IIID BCA METHODOLOGY FOR PROJECTS UNDER $50 MILLION
Qualitative Color Scale Green=Least resource intensive alternative Purple=most resource intensive yellow=medium level of resource intensity
Qualitative Evaluation Factors Description Relative Color Rating System
First CostsAdditional construction costs needed to incorporate Guidelinesrsquo recommended resilient design over the baseline project costs
Highest cost ($$$) rated as Purple whereas lowest cost ($) rated as Green
ConstructabilityEase of Implementation
Construction techniques and site conditions such as presence of major utilities conflicts and other conditions which dictate the level of constructability required for each alternative
Difficult to construct rated as Purple whereas easiest to construct rated as Green
Environmental ImpactsCo-BenefitsPermitting
Impacts to the built and natural environment such as circulation noise and hazardous waste plus the level of effort required for permitting (eg interventions in water require highest level of permitting requirement) from each alternative in addition to the baseline project condition
Highest environmental impacts and highest level of effort required for permitting rated as Purple whereas the least impact and level of effort rated as Green
Operation and Maintenance (OampM)
Level of effort of additional manpower and cost of OampM for the alternatives over the baseline project OampM requirements
Highest level of effort and cost for OampM rated as Purple whereas the lowest is rated as Green
Reliability and Durability
Interventions that do not require human involvement or a facilityrsquos ability to withstand all the forces during a storm event (eg permanent solutions with higher reliability than deployable solution)
Interventions requiring human involvement (active measures) rated as Purple whereas interventions with minimal or no human involvement (passive measures) rated as Green
Risk Reduction Benefits Monetary benefits provided by each intervention alternative in avoided damages over the baseline condition
Lowest potential monetary benefit rated as Purple whereas as highest potential monetary benefit rated as Green
Quality of Life BenefitsVisual Aesthetics
Benefits either to the community such as recreation or safety or serve the community during emergency situations
Lowest potential quality of life benefits rated as Purple whereas as highest potential benefits rated as Green
Table 6 ndash Evaluation matrix for comparison of mitigation alternatives across the useful life of a project
Project title_______________________________________________________________________________
Evaluation Criteria
Baseline Condition (Designed to NYC Building Code and
Standards)
Resilient Design Alternatives for Managing__________________
Alternative 1
Alternative 2
Alternative 3
First Costs
ConstructabilityEase of ImplementationEnvironmental ImpactsCo-BenefitsPermitting
Operation and Maintenance (OampM)
Reliability and Durability
Risk Reduction Benefits
Quality of Life BenefitsVisual Aesthetics
NYC Mayorrsquos Office of Recovery and Resiliency Climate Resiliency Design Guidelines
32IIID BCA METHODOLOGY FOR PROJECTS UNDER $50 MILLION
Table 7 ndash Evaluation matrix for comparison of mitigation alternatives across the useful life of a project - COMPLETED EXAMPLE
Evaluation Criteria
Baseline Condition (Designed to NYC Building Code and
Standards)
Resilient Design Alternatives for Managing Coastal SurgeSLR
Alternative 1Flood proof building built on grade to Guidelines
DFE
Alternative 2 Elevate building structure above Guidelinesrsquo DFE
on columns
Alternative 3 Raise site grade by filing the building site footprint
to Guidelinesrsquo DFE
First CostsBaseline cost for building structure is $15 million
Incremental costs are within 5 over the baseline costs
Incremental costs are between 5-10 over baseline costs
Incremental costs are 20 and more over baseline costs
ConstructabilityEase of Implementation
Relatively easy to construct within site constraints
Similar to baseline conditions since construction requires additional flood proofing only
Moderate challenges to construct foundation structure for columns within site constraints
Extremely challenging to construct within the site constraints Potentially fatal flaw
Environmental ImpactsCo-BenefitsPermitting
No major impacts but may require additional effort to obtain DOB permits with flood proofing and deployable systems
No major impacts but may require additional effort to obtain DOB permits with flood proofing and deployable systems
No major impacts and relatively easy to permit
Potential drainage circulation impacts and challenges to obtain clean fill material for the site
Operation and Maintenance (OampM)
Major OampM costs associated with deployable systems
Major OampM costs associated with deployable systems
Moderate OampM costs associated with proposed elevator for access
Minimal OampM costs since deployable and elevators not required
Reliability and Durability
Least reliability with highest potential risk from flooding during to failure of deployable systems
Least reliability with highest potential risk from flooding during to failure of deployable systems
Moderate reliability with potential risk from flooding limited to elevator shaft only
Highest reliability since deployable are not required to protect building from flooding
Risk Reduction Benefits
Maximum flood risk reduction benefits assuming deployable and flood proofing is effective
Maximum flood risk reduction benefits assuming deployable and flood proofing is effective
Maximum flood risk reduction benefits
Maximum flood risk reduction benefits
Quality of Life BenefitsVisual Aesthetics
Facility may not be operational during the storm event
Facility may not be operational during the storm event
Facility can be potentially operational during the storm event
Facility can be potentially operational during the storm event
Qualitative Color Scale Green=Least resource intensive alternative Purple=most resource intensive yellow=medium level of resource intensity
A new non-critical facility with a building structure is proposed on a site that is currently in the 2015 Preliminary FEMA 1 annual chance floodplain with a BFE of 10rsquo (NAVD 88) The baseline conditions DFE to meet existing NYC codes and standards is 11rsquo (NAVD 88) Using the Guidelines recommended design criteria the facilityrsquos DFE is 133rsquo (NAVD 88) and existing grade is around 6rsquo (NAVD 88) The project design team develops three alternatives to meet the Guidelinesrsquo recommended DFE design for the facility Table 7 offers an example of how a qualitative assessment can be used to compare three resilient design alternatives using the evaluation criteria and metrics
CASE STUDY Example of How to Use the Evaluation Matrix
NYC Mayorrsquos Office of Recovery and Resiliency Climate Resiliency Design Guidelines
33IIIE BCA METHODOLOGY FOR PROJECTS OVER $50 MILLION
E BCA methodology for projects over $50 millionIn order for a project to be considered cost-effective a benefit-cost analysis (BCA) assesses if the benefits of a project outweigh its costs or in other words the benefit-cost ratio (BCR) is greater than 10 as illustrated in Equation 1
Equation 1 Benefit-Cost Ratio Formula
BCR =
Where BCR = Benefit-Cost Ratio
BENEFITS = Total project benefits
COSTS = Total project costs
BENEFITSCOSTS
These estimated project benefits are combined with the project costs which are defined as the differential construction and long-term operation and maintenance costs associated with constructing a proposed project to the Guidelinesrsquo recommended design level It is assumed that the baseline project will be designed to the most prevalent NYC codes and standards This benefit methodology should be used to determine the additional project benefit that the Guidelinesrsquo recommended design would provide over the baseline project benefit It is assumed that the project design team will develop alternatives to address each of the following applicable climate stressors - sea level risecoastal storm surge increased precipitation and extreme heat - separately For each alternative the project design team should use the following steps to determine the Benefit-Cost Ratio (BCR)
a) Determine project useful life for design interventions Determining the useful life of the proposed project is an important first step in the
detailed BCA assessment methodologies for two reasons First the project useful life determines what values must be used from the Guidelines to establish the future climate design conditions The various hazard tables in the Guidelines establish design requirements based on useful life ranges through 2039 2040-2069 2070-2099 and 2100+ (2100+ projections are only available for sea level rise) A review of these tables show that the design requirements needed to meet the projected climate hazards increase as the end of useful life range increases Second the useful life determines how long the project will need to be operated and maintained in order to remain technically sound and effective at reducing future damages and losses
b) Determine discount rate for project benefits calculation The cost-effectiveness of projects assessed using the BCR must be done on a net
present value basis meaning the present value of the benefits is compared to the present value of the costs Most project costs are computed for present value based on current cost estimates bids or cost guidance However project benefits - as well as project costs for operation and maintenance - accrue over time into the future and are computed on an annualized basis To address this issue the Present Value Coefficient (PVC) is used to bring these annualized project benefits and OampM costs into the present value As indicated by the formula in Equation 2 the PVC is a function of the Project Useful Life (PUL) and the Discount Rate (DR)
NYC Mayorrsquos Office of Recovery and Resiliency Climate Resiliency Design Guidelines
34
Equation 2 Present Value Coefficient (PVC) Formula
PVC =
Where PVC = Present Value Coefficient
PUL = BCA Project Useful Life based on project type
DR = Discount Rate
The project design team should coordinate with agencies and NYC OMB if needed to determine appropriate discount rates based on funding source project type and other factors This coordination should take place during project initiation phase where total project costs (design and construction) are over $50 million66
c) Develop input data to perform benefit calculations Tables 16 and 17 in Appendix 4 provide a list of typical input data by each climate
stressor needed to perform benefit analysis quantitatively on variety of facilities67 The project design team should use these tables as a reference to identify appropriate input data categories andor additional input data needed to perform benefit analysis on the project
d) Identify applicable project benefit categories to estimate benefits Tables 16 and 17 in Appendix 4 provide a list of typical project benefits by each climate
stressor needed to perform benefit analysis quantitatively on various types of projects The project design team should use these tables as a reference to identify appropriate project benefit categories for each climate stressor to perform benefit analysis on the project
e) Calculate benefits of recommended design interventions for each climate
stressor The input data and applicable project benefits can be assembled along with
incremental project cost data to analyze cost-effectiveness using the FEMA BCA Tool Damage-Frequency Assessment (DFA) module or similar software This analysis will provide a BCR for each alternative which can then be used to compare the alternatives that were developed to mitigate effects from applicable climate stressors The project design team can then use the results from this analysis to identify optimal interventions that provides a balanced solution that provides resiliency benefits within the available project budget
IIIE BCA METHODOLOGY FOR PROJECTS OVER $50 MILLION
[1 ndash (1 + DR) -(PUL)]DR
66 For example a NYC OMB March 2015 memorandum recommends using an annually updated DR as published each year in Appendix C of OMB Circular A-94 The current OMB-recommended discount rates from OMB A-94 Appendix C vary by project useful life and are as follows 21 DR for useful lives of 10 to 19 years 25 DR for useful lives of 20 to 29 years and 28 DR for useful lives of 30 years or greater By contrast FEMA hazard mitigation grants use a DR of 70 for all projects based on the Federal OMB A-94 rate for federally-funded mitigation measures Since these DRs will impact the PVC and the project benefits the project team must ensure that BCA results prepared using an OMB-recommended DR (21 to 28) be updated to reflect the Federal DR (70) when applying for FEMA mitigation grant funds
67 Note the data requirements for the sea level rise and increased precipitation hazards in Table 16 are more detailed than the requirements for the extreme heat hazards due to the less detailed level of analysis available for extreme heat
NYC Mayorrsquos Office of Recovery and Resiliency Climate Resiliency Design Guidelines
35
APPENDICES
NYC Mayorrsquos Office of Recovery and Resiliency Climate Resiliency Design Guidelines
36APPENDIX 1 ndash KEY TERMS
100-year flood (1 annual chance flood)
A flood that has a 1 probability of occurring in any given year The 100-year floodplain is the extent of the area of a flood that has a 1 chance of occurring or being exceeded in any given year
500-year flood (02 annual chance flood)
A flood that has a 02 probability of occurring in any given year The 500-year floodplain is the extent of the area of a flood that has a 02 chance of occurring or being exceeded in any given year
AdaptationAdjustment in natural or human systems to a new or changing environment that seeks to maximize beneficial opportunities or moderate negative effects Successful adaptations contribute to resiliency
Base flood elevation (BFE)The elevation of surface water resulting from a flood that has a 1 annual chance of occurring or being exceeded in any given year The BFE is shown on the Flood Insurance Rate Map (FIRM)69
BluebeltReference to the Department of Environmental Protectionrsquos (DEP) Bluebelt program to preserve natural drainage corridors including streams ponds and other wetland areas Preservation of these wetland systems allows them to perform their functions of conveying storing and filtering storm water
Climate
The average weather (or more rigorously a statistical description of the average in terms of the mean and variability) over a period of time usually 30 years These quantities are most often surface variables such as temperature precipitation and wind Climate in a wider sense is the state including a statistical description of the climate system70
Climate change
Changes in average weather conditions that persist over multiple decades or longer Climate change encompasses both increases and decreases in temperature as well as shifts in precipitation changing risk of certain types of severe weather events and changes to other variables of the climate system
Climate change riskThe chance that investments (such as in capital projects) can be affected by the physical impacts of climate change71 Risks are evaluated as a product of the probability of occurrence and the magnitude of damages or impacts including socioeconomic factors that would result if they did occur (consequences)
Climate change risk assessment
This assessment involves a detailed project-specific analysis that includes a vulnerability and risk assessment often followed by cost-benefit analysis to assess and select investments in climate change risk mitigation Risk is assessed as a function of the magnitude and probability of a given climate change hazard Examples resources are included in Appendix 7
Climate vulnerabilityThe degree to which systems and populations are affected by adverse impacts It is a function of the character magnitude and rate of climate change and variation to which a system is exposed its sensitivity and its adaptive capacity72
Cloudburst An extreme amount of rain in a short period of time often over a small geographic area73
Cooling Degree Day (CDD) A form of degree-day used to estimate the energy requirements for air conditioning or refrigeration when the daily mean temperature is above 65degF
68 All terms are from the US Global Change Research Program (USGCRP) glossary unless otherwise noted The USGCRP glossary is available at httpwwwglobalchangegovclimate-changeglossary
69 ldquoDefinitionsrdquo FEMA last modified March 1 2017 httpswwwfemagovnational-flood-insurance-programdefinitions70 UKCIP Glossary httpwwwukciporgukglossary71 ldquoAccount for Climate Riskrdquo International Finance Corporation 72 UKCIP Glossary httpwwwukciporgukglossary73 New York City Environmental Protection ldquoCloudburst Resiliency Planning Studyrdquo 2017 Available at httpwwwnycgovhtmldeppdfclimatenyc-cloudburst-studypdf
APPENDIX 1 - KEY TERMS68
NYC Mayorrsquos Office of Recovery and Resiliency Climate Resiliency Design Guidelines
37APPENDIX 1 ndash KEY TERMS
Design life The life expectancy of an asset or product as determined during design74 As opposed to useful life (see below)
Dry Bulb temperature The ambient air temperature measured by a thermometer
Extreme eventUnexpected unusual or unpredictable weather or flooding compared to historical or future projected distribution Extreme events include for example heat waves cold waves heavy rains periods of drought and flooding and severe storms
Facilities For the purposes of this document ldquofacilitiesrdquo refers to all types of buildings housing infrastructure structures and landscape features designed by or for the City of New York
Flexible adaptation pathwayResilience-building strategies that can evolve or be adapted over time as climate change risk assessments evaluations of adaptation strategies and monitoring continue75
Flood Insurance Rate Maps (FIRM)
Official flood map of a community on which FEMA has delineated the 1 annual chance floodplain and the base flood elevations (BFEs) applicable to the community76 The FIRM also includes the 02 floodplain annual chance floodplain and differentiates between special flood hazard areas (V A Coast A zones) and floodways The official FIRM is from the year 2007 while the 2015 PFIRM is currently required by NYC Building Code to calculate design flood elevations NYC DOB references the more restrictive of the two maps in both base flood elevation and flood hazard area (ie V versus A zone) Refer to Appendix 3 for more information
FreeboardAn additional amount of height above the base flood elevation used as a factor of safety (eg two feet above the base flood) in determining the level at which a facilitys lowest floor must be elevated or floodproofed to be in accordance with state or community floodplain management regulations77
Future time slices
Future periods defined by the NPCC for when climate change projections are available In this document the following decadal projections are associated with specific time spans2020s projection = present to 20392050s projection = 2040 to 20592080s projection = 2070 to 20992100s projection = end of century and beyond
Green infrastructureAn array of practices that use or mimic natural systems to manage urban stormwater runoff Water is either directed to engineered systems for infiltration or detained for longer periods before it enters the sewer system
Heat Vulnerability Index (HVI)Summarizes relative risk of adverse health effects from heat due to social and environmental factors Used to identify neighborhoods at higher risk during and after extreme heat events
Heat wave A period of three consecutive days where temperatures rise above 90degF or two consecutive days over 95 degrees78
New York City Panel on Climate Change (NPCC)
The body of leading climate and social scientists charged with making climate change projections for the metropolitan region79
74 Sustainable Infrastructure Management Program Learning Environment httpsimplewerforg 75 Rosenzweig C et al Climate Change Adaptation in New York City Building a Risk Management Response76 ldquoDefinitionsrdquo FEMA77 Ibid78 Horton R et al New York City Panel on Climate Change 2015 Report Chapter 1 Climate Observations and Projections Ann NY
Acad Sci ISSN 0077-8923 (New York 2015) 2579 For more information on the NPCC visit www1nycgovsiteorrchallengesnyc-panel-on-climate-changepage
NYC Mayorrsquos Office of Recovery and Resiliency Climate Resiliency Design Guidelines
38APPENDIX 1 ndash KEY TERMS
Open-grid pavement system
Pavements that consist of loose substrates supported by a grid of a more structurally sound grid or webbing Unbounded loose substrates in these systems transfer and store less heat than bound and compacted pavements and aid permeability Pavement is 50 pervious and contains vegetation in the open cells designed to allow percolation or infiltration of storm water through the surface into the soil below80
Preliminary Flood Insurance Rate Map (PFIRM)
Preliminary flood map developed by FEMA in 2015 for New York City that provides projected risks for flood hazards81 Refer to Appendix 3 for more information
Project useful life (PUL)
The period over which an asset or component is expected to be available for use by an entity This depends on regular and adequate maintenance This period of time typically exceeds the design life (see above) The combined effect of operational requirements and useful life is practical in assessing an investment in improving resilience82
Rain gardenAlso called ldquobioswalerdquo Planted areas designed to collect and manage stormwater that runs off streets sidewalks commercial and residential rooftops and other sources when it rains
Resiliency The ability to bounce back after change or adversity The capability of preparing for responding to and recovering from difficult conditions83
Sea level rise-adjusted design flood elevation
As defined in these Guidelines the increased height of the base flood elevation due to sea level rise plus freeboard depending on the criticality of the facility The sea level rise adjustment depends on the useful life of the facility
Storm surge An abnormal rise of water generated by a storm over and above predicted astronomical tides84
Substantial improvementAny repair reconstruction rehabilitation addition or improvement of a building or structure the cost which equals or exceeds 50 of the market value of the structure before the improvement or repairs started For more information see Appendix G of the NYC Building Code and 1 RCNY sect3606-0185
Tidal inundation Flooding which occurs at high tides due to climate-related sea level rise land subsidence andor the loss of natural barriers86
Urban Heat Island (UHI) effectThe tendency for higher air temperatures to persist in urban areas as a result of heat absorbed and emitted by buildings and asphalt tending to make cities warmer than the surrounding suburban and rural areas
Weather The state of the atmosphere at a given time with regard to temperature cloudiness precipitation wind and other meteorological conditions87
Wet Bulb temperatureThe temperature indicated when a thermometer bulb is covered with a water-saturated wick over which air is caused to flow at approximately 45 ms (900 ftmin) to reach the equilibrium temperature of water evaporating into the air when the heat of vaporization is supplied by the sensible heat of the air88
80 ldquoGlossaryrdquo US Green Building Council (2017) Available at httpwwwusgbcorgglossaryterm552581 ldquoPreliminary FEMA Map Productsrdquo FEMA Map Service Center Available at httpshazardsfemagovfemaportalprelimdownload82 ldquoGlossaryrdquo International Infrastructure Management Manual (2011) 83 A Stronger More Resilient New York (2013) 184 ldquoStorm Surge Overviewrdquo National Hurricane Center NOAA Available at httpswwwnhcnoaagovsurge85 ldquoFlood Resistant Constructionrdquo Appendix G New York City Building Code (2008) and 1 RCNY sect3606-01 available at httpswww1nycgovassetsbuildingsrules1_RCNY_3606-01pdf86 ldquoOcean Factsrdquo National Ocean Service NOAA Available at httpoceanservicenoaagovfactsnuisance-floodinghtml 87 UKCIP Glossary httpwwwukciporgukglossary88 ldquoASHRAE Terminologyrdquo ASHRAE Available at httpswwwashraeorgtechnical-resourcesauthoring-toolsterminology
NYC Mayorrsquos Office of Recovery and Resiliency Climate Resiliency Design Guidelines
39APPENDIX 2 - CLIMATE CHANGE PROJECTIONS
Climate change projections are provided by the New York City Panel on Climate Change (NPCC) The full NPCC report is available from the New York Academy of Sciences89 Tables 8-10 (below) were reproduced directly from the NPCC report while Table 2 (see Section IIA) was developed using the data underlying the NPCC report to inform the design of HVAC systems under warmer conditions
Table 8 ndash NYC sea level rise projections90
Baseline (2000-2004) 0 in
Low estimate (10th percentile)
Middle range (25th to 75th percentile)
High estimate (90th percentile)
2020s 2 in 4-8 in 10 in
2050s 8 in 11-21 in 30 in
2080s 13 in 18-39 in 58 in
2100 15 in 22-50 in 75 in
Note Projections are based on six-component approach that incorporates both local and global factors The model-based components are from 24 global climate models and two representative concentration pathways Projections are relative to the 2000-2004 base period
Table 9 ndash Mean annual changes91
a Temperature Baseline(1971-2000) 54degF
Low estimate (10th percentile)
Middle range (25th to 75th percentile)
High estimate (90th percentile)
2020s + 15degF +20-29degF +32degF
2050s +31degF +41-57degF +66degF
2080s +38degF +53-88degF +103degF
2100 +42degF +58-104degF +121F
b Precipitation Baseline(1971-2000) 501 in
Low estimate (10th percentile)
Middle range (25th to 75th percentile)
High estimate (90th percentile)
2020s -1 percent +1-8 +10
2050s +1 percent +4-11 +13
2080s +2 percent +5-13 +19
2100 -6 percent -1 to +19 +25
Note Based on 35 global climate models (GCMs) and two RCPs Baseline data cover the 1971ndash2000 base period and are from the NOAA National Climatic Data Center (NCDC) Shown are the low estimate (10th percentile) middle range (25th percentile to 75th percentile) and high estimate (90th percentile) These estimates are based on a ranking (from most to least) of the 70 (35 GCMs times 2 RCPs) projections The 90th percentile is defined as the value that 90 percent of the outcomes (or 63 of the 70 values) are the same or lower than Like all projections the NPCC climate change projections have uncertainty embedded within them Sources of uncertainty include data and modeling constraints the random nature of some parts of the climate system and limited understanding of some physical processes The NPCC characterizes levels of uncertainty using state-of-the-art climate models multiple scenarios of future greenhouse gas concentrations and recent peer-reviewed literature Even so the projections are not true probabilities and the potential for error should be acknowledged
89 The NPCC 2015 report is available at httponlinelibrarywileycomdoi101111nyas20151336issue-1issuetoc90 From New York City Panel on Climate Change 2015 Report Chapter 1 Climate Observations and Projections page 4191 From New York City Panel on Climate Change 2015 Report Chapter 1 Climate Observations and Projections page 30
APPENDIX 2 - CLIMATE CHANGE PROJECTIONS
NYC Mayorrsquos Office of Recovery and Resiliency Climate Resiliency Design Guidelines
40APPENDIX 2 - CLIMATE CHANGE PROJECTIONS
Table 10 ndash Extreme events92
2020s Baseline (1971-2000)
Low estimate(10th percentile)
Middle range(25th to 75th percentile)
High estimate (90th percentile)
Numbers of heat waves per year 2 3 3-4 4
Average heat wave duration (days) 4 5 5 5
Number of days per year with
Maximum temperature at or above 90degF 18 24 26-31 33
Maximum temperature at or above 100degF 04 07 1-2 2
Minimum temperature at or below 32degF 71 50 52-58 60
Rainfall at or above 1 inch 13 13 14-15 16
Rainfall at or above 2 inches 3 3 3-4 5
Rainfall at or above 4 inches 03 02 03ndash04 05
2050s Baseline (1971-2000)
Low estimate(10th percentile)
Middle range(25th to 75th percentile)
High estimate (90th percentile)
Numbers of heat waves per year 2 4 5-7 7
Average heat wave duration (days) 4 5 5-6 6
Number of days per year with
Maximum temperature at or above 90degF 18 32 39-52 57
Maximum temperature at or above 100degF 04 2 3-5 7
Minimum temperature at or below 32degF 71 37 42-48 52
Rainfall at or above 1 inch 13 13 14-16 17
Rainfall at or above 2 inches 3 3 4-4 5
Rainfall at or above 4 inches 03 03 03-04 05
2080s Baseline (1971-2000)
Low estimate(10th percentile)
Middle range(25th to 75th percentile)
High estimate (90th percentile)
Numbers of heat waves per year 2 5 6-9 9
Average heat wave duration (days) 4 5 5-7 8
Number of days per year with
Maximum temperature at or above 90degF 18 38 44-76 87
Maximum temperature at or above 100degF 04 2 4-14 20
Minimum temperature at or below 32degF 71 25 30-42 49
Rainfall at or above 1 inch 13 14 15-17 18
Rainfall at or above 2 inches 3 3 4-5 5
Rainfall at or above 4 inches 03 02 03-05 07
Note Projections for temperature and precipitation are based on 35 GCMs and 2 RCPs Baseline data are for the 1971 to 2000 base period and are from the NOAA National Climatic Data Center (NCDC) Shown are the low estimate (10th percentile) middle range (25th to 75th percentile) and high estimate (90th percentile) 30-year mean values from model-based outcomes Decimal places are shown for values less than one although this does not indicate higher precisioncertainty Heat waves are defined as three or more consecutive days with maximum temperatures at or above 90degF Like all projections the NPCC climate change projections have uncertainty embedded within them Sources of uncertainty include data and modeling constraints the random nature of some parts of the climate system and limited understanding of some physical processes The NPCC characterizes levels of uncertainty using state-of-the-art climate models multiple scenarios of future greenhouse gas concentrations and recent peer-reviewed literature Even so the projections are not true probabilities and the potential for error should be acknowledged
92 From New York City Panel on Climate Change 2015 Report Chapter 1 Climate Observations and Projections page 31
NYC Mayorrsquos Office of Recovery and Resiliency Climate Resiliency Design Guidelines
41APPENDIX 3 - DIFFERENTIATION OF FLOOD MAPS
These Guidelines reference several different kinds of flood maps and sources of design flood elevations These maps are described and differentiated below
Table 11 - Differentiation of flood maps used in NYC
Reference Title Data Source Information Provided Referenced By Link
2007 FIRM FEMA
Based on historical data from before 1983 identifies the current base flood (extent and elevation) as the flood that has a 1 chance of occurring in any given year also known as a 100-year flood The NYC Building Code requires that either the 2007 FIRM or 2015 PFIRM elevation be used whichever is higher
2014 NYC Building Code Appendix G
Climate Resiliency Design Guidelines
httpsmscfemagovportal
2015 PFIRM FEMA
Based on historical data identifies the current base flood (extents and elevation) as the flood that has a 1 chance of occurring in any given year also known as a 100-year flood The NYC Building Code requires that either the 2007 FIRM or 2015 PFIRM elevation be used whichever is higher The 2015 PFIRM is currently being reassessed by FEMA
2014 NYC Building Code Appendix G
Climate Resiliency Design Guidelines
httpshazardsfemagovfemaportalprelimdownload
httpwwwregion2coastalcomview-flood-maps-dataview-preliminary-flood-map-data
NYC Flood Hazard Mapper
NYC Department of City Planning
Maps current and future flood hazards in NYC including the following data layers 2007 FIRM and 2015 PFIRM high tide with sea level rise and PFIRM with sea level rise through 2100
Climate Resiliency Design Guidelines
Waterfront Revitalization Plan
httpwww1nycgovsiteplanningdata-mapsflood-hazard-mapperpage
ldquoTable 4 ndash Determine the sea level rise-adjusted design flood elevation for critical and non-critical facilitiesrdquo
ORR amp NPCC
Provides data to use when adding sea level rise to a given 2015 PFIRM or 2007 FIRM Base Flood Elevation (BFE) to calculate a Design Flood Elevation (DFE) Based on the criticality and expected useful life of a facility
Climate Resiliency Design Guidelines
See Section II on ldquoSea Level Riserdquo above
APPENDIX 3 - DIFFERENTIATION OF FLOOD MAPS
NYC Mayorrsquos Office of Recovery and Resiliency Climate Resiliency Design Guidelines
42APPENDIX 4 - PROJECT BENEFITS CATEGORIES
This appendix provides guidance on how to identify and assess benefits as a supplement to Sections IIID and IIIE
Table 12 lists typical direct benefits for reducing impacts from climate stressors and basic guidance for how to estimate them See Section IIID for more information
Table 13 lists typical indirect benefits for reducing impacts from climate stressors and basic guidance for how to estimate them See Section IIID for more information
Table 12 ndash Direct benefits for (1) sea level rise with coastal storm surge and (2) increased precipitation measures
Direct Benefit Basic Guidance for Estimating Values
Physical Damages (Structure Contents)
bull For flood-damaged buildings use depth damage functions developed by FEMA and USACE for structures and contents
bull Use depth damage functions in conjunction with Building Replacement Values (BRVs) and not market values BRVs typically range between $100 to $325SF for residential buildings and $120 to $450SF for commercial public buildings
bull For more complex structures or facilities use engineering estimates of flood damages or review historic flood damages documented from insurance claims repair records or FEMA Public Assistance claims from recent flood disasters
Residential Displacements
bull For flood-damaged buildings use depth damage functions developed by FEMA and USACE for residential displacements
Reduced Life CycleOperation and Maintenance (OampM) Costs93
bull Applicable only to projects that reduce overall life cycle costs or net annual OampM costs from baseline conditions
bull Input reduced annual OampM costs as a project benefit at a 1-year recurrence intervalbull Reduced overall life cycle costs can be input as a longer project useful life
Table 13 ndash Indirect benefits for (1) sea level rise with coastal storm surge and (2) increased precipitation measures
Indirect Benefit Basic Guidance for Estimating Values
Non-Residential Building Service Losses
bull Estimate service loss values and durations for non-residential buildings public buildings critical facilities and parksnatural features based on FEMA BCA guidance and standard values based on building use
Utility Service Losses94
bull Estimate utility service losses for water wastewater and electrical facilities based on the number of impacted customers FEMA per capita standard values for utility service ($105personday for potable water $49personday for wastewater $148personday for electrical)95
bull Estimate utility service loss durations based on engineering estimates or review historic flood damages losses documented from utility company records
bull This benefit can also apply to measures that increase energy efficiency
RoadBridge Service Losses
bull Estimate roadbridge service losses based on the average daily traffic (ADT) detour time and additional travel distance and FEMA and GSA standard values for road service ($3344vehiclehour of delay $0545mile)96
bull Estimate roadbridge service loss durations or review historic flood damages losses
Emergency Service Losses
bull Applicable only to projects that reduce or eliminate documented emergency service costs from baseline conditions
bull Examples of avoided emergency services costs include NYPD staffing to monitor barricades for flooded roads or NFDY staffing for water rescues of residents from flooded buildings or streets
APPENDIX 4 - PROJECT BENEFITS CATEGORIES
93 Reduced life cycle costs may be applicable to some measures that provide extreme heat benefits such as green roofs that can last longer than a standard roof if properly maintained
94 Reduced utility service costs may be applicable to some measures that provide extreme heat benefits such as cool roofs green roofs and shade trees
95 FEMA per capita standard values taken from FEMA BCA Toolkit Version 530 (Build Date 12222016) and developed in FEMArsquos Baseline Standard Economic Value Methodology Report (July 28 2016) Consider updating FEMA standard per capita values to reflect current New York City utility rates
96 Consider updating FEMA and GSA standard values to reflect current New York City area labor rates and fuel costs
NYC Mayorrsquos Office of Recovery and Resiliency Climate Resiliency Design Guidelines
43APPENDIX 4 - PROJECT BENEFITS CATEGORIES
Table 14 ndash Other potential benefits for (1) sea level rise with coastal storm surge and (2) increased precipitation measures
Other Benefit Basic Guidance for Estimating Values
Avoided Stress and Anxiety
bull Applicable only for projects that directly benefit occupants of residential structuresbull Use FEMA standard value for avoided mental stress and anxiety treatment costs of $2443person to
estimate benefit for all impacted residents97
Avoided Lost Productivity
bull Applicable only for projects that directly benefit occupants of residential structuresbull Use FEMA standard value for avoided lost worker productivity costs of $8736household to estimate
benefit for all impacted workers (conservatively assuming one worker per household)
Environmental Open Space
bull Applicable only for projects that create or acquire open space areas by acquisitionbull Use FEMA standard value for environmental open space based on the type of land acquired ($8308
Acreyear for Green open space $39545Acreyear for Riparian $6010Acreyear for Wetlands $554Acreyear for Forests $1799Year for Marine and estuary)97
CSO Volume Reduction
bull Applicable only for projects that provide Combined Sewer Overflow (CSO) abatement by reducing the volume of rainfall runoff
bull Use CSO abatement cost of $0015gallonsyear applied to increased precipitation hazard runoff volume for 5-year design storm98
Ecosystem Service99
bull Add stormwater management benefits of green infrastructure projects to increased precipitation hazards where avoided damages and service losses are not quantified
bull Unit benefits applicable to increased precipitation hazard includeo Green roofs $0133SFyear (PUL 40 years)o BioswaleRain GardenMeadow Mix $0020SFyear (PUL 30 years)o Permeable Grass Pavers $0020SFyear (PUL 30 years)o Tree Plantings $303Treeyear (PUL 30 years)o Planter Box Trees $101Treeyear (PUL 15 years)
Real Estate99
bull Potential real estate benefits from increased resilience of residential andor commercial propertiesstreetscapesneighborhoods included within the project scope
bull Benefit applied to extreme heat hazard for green infrastructure projects directly impacting residential or commercial properties
Quality of Life Health Benefits99
bull Potential quality of life benefits related to improved public health from the resilience measures included within the project scope
bull Benefit applied to extreme heat hazard for green infrastructure projects directly impacting residential or commercial properties
Table 14 lists other typical benefits for reducing impacts from climate stressors and basic guidance for how to estimate them See Section IIID for more information
97 FEMA standard values for avoided mental stress and anxiety and environmental open space values taken from FEMA BCA Toolkit Version 530 (Build Date 12222016)
98 CSO abatement cost taken from APG1 Report for NYC ldquoTechnical Approaches for Benefit-Cost Analysis of Hazard Mitigation Projects in Urban and Coastal Environmentsrdquo (April 2016)
99 Ecosystem Services Real Estate and Quality of LifeHealth benefits tend to be more applicable to green infrastructure measures that provide extreme heat benefits such as green roofs trees and other plantings
NYC Mayorrsquos Office of Recovery and Resiliency Climate Resiliency Design Guidelines
44APPENDIX 4 - PROJECT BENEFITS CATEGORIES
Table 15 ndash Potential benefits for extreme heat (Urban Heat Island) reduction measures
Category Benefit Basic Guidance for Estimating Values
Direct Benefit
Reduced Life Cycle Cost
bull Applicable only to measures such as green roofs that are expected to last longer than standard roofs
bull Compute total cost savings including annual OampM costs
Indirect Benefit
Energy Savings
bull Applicable to measures that reduce energy costs by providing cooling through increased shading andor evapotranspiration
bull Use New York Power Authority rates of $0148kWh for electricity and $0810Therm for natural gas
Other Potential Benefits
Air Quality bull Applicable to measures that absorb pollutants andor reduce carbon dioxide emissions
Acoustics bull Applicable to measures such as green roof or walls that reduce noise transfer
Quality of LifeHealth bull Potential quality of life benefits and related to improved public health
Real Estate bull Applicable to measures that provide residential real estate benefits from increased resilience of propertiesstreetscapesneighborhoods
Retail Sales Marketing
bull Applicable to measures that provide commercial property benefits from increased aesthetics resulting in increased marketing and sales for streetscapesneighborhoods
Tax Credits Incentives
bull Applicable to resilience or green infrastructure measures such as green roofs that have accompanying Federal State or City tax credits or other incentives
Table 15 lists potential benefits for reducing impacts from heat and basic guidance for how to estimate them See Section IIID for more information
NYC Mayorrsquos Office of Recovery and Resiliency Climate Resiliency Design Guidelines
45APPENDIX 4 - PROJECT BENEFITS CATEGORIES
Table 16 ndash Guidance on quantitative calculations for (1) sea level rise with coastal storm surge and (2) increased precipitation measures
Data Input General Guidance ndash Basic Description
Applicable Benefit Category
Applicable Typical Facility Typology
Dire
ct B
enefi
ts
Indi
rect
Ben
efits
Oth
er P
oten
tial
Ben
efits
Bui
ldin
g St
ruct
ures
Com
plex
Fa
cilit
ies
Tran
spor
tatio
nSt
reet
scap
es
Plaz
as
Park
Fea
ture
s
First Floor Elevation (FFE)
bull The elevation of the first finished floor of the structure excluding basements
bull FFE measured from top of lowest floor (riverinenon-coastal high hazard areas) or bottom of lowest horizontal structural member (coastal high hazard areas)
Y Y Y Y
Building Replacement Value (BRV)
bull The unit cost to rebuild a structure of the same quality of construction
bull Not the same as market value
Y Y Y Y
Building Size
bull The total floor area of the building in square feet
bull Total Building Value = BRV x Building Sizebull Typical BRVs for NYC range between $100 to
$325SF for residential buildings and $120 to $450SF for commercialpublic buildings
Y Y Y Y
Structure Description
bull The type of building number of stories and foundation type (full basement partial basement no basement)
bull Collect more detailed foundation data for coastal flood zones
Y Y Y Y
Building Use bull Details related to residential housing commercial business and public use
Y Y Y Y Y
Building Type bull The primary use of building ndash residential commercial public and others
Y Y Y Y Y
Depth Damage Function (DDF)
bull Curves used to estimate structure damage contents damage and displacement of residential buildings based on flood depth
bull DDFs selection based on Structure Description Building Type Building Use
bull Structure DDFs based on percentage of Total Building Value
bull Contents DDFs based on percentage of Total Contents Value
bull Displacement DDFs based on number of displacement days x Displacement Cost
Y Y Y Y Y
Contents Value
bull The cost to replace structure contents (furnishings equipment)
bull Residential building Contents Values typically 50 BRV (FEMA DDFs) or 100 BRV (USACE DDFs)
bull Non-residential building Contents Values between 18 to over 100 depending on building use (USACE DDFs)
bull Total Contents Value = BRV x Building Size
Y Y Y Y Y
Table 16 provides general guidance on how to quantitatively calculate benefits from efforts to address from climate stressors See Section IIIE for more information
NYC Mayorrsquos Office of Recovery and Resiliency Climate Resiliency Design Guidelines
46APPENDIX 4 - PROJECT BENEFITS CATEGORIES
Table 16 ndash Guidance on quantitative calculations for (1) sea level rise with coastal storm surge and (2) increased precipitation measures
Data Input General Guidance ndash Basic Description
Applicable Benefit Category
Applicable Typical Facility Typology
Dire
ct B
enefi
ts
Indi
rect
Ben
efits
Oth
er P
oten
tial
Ben
efits
Bui
ldin
g St
ruct
ures
Com
plex
Fa
cilit
ies
Tran
spor
tatio
nSt
reet
scap
es
Plaz
as
Park
Fea
ture
s
Number of Residents (Residential)
bull Total number of occupants in a residential building
bull Typically estimated based on number of residential units x average number of individuals per household (based on current US Census data or use 25 individuals per household as a default)
Y Y Y Y Y
Displacement Cost (Residential)
bull The unit cost to lodge and feed displaced residents while flood damage is repaired
bull Average unit displacement cost of $415residential unitday recommended based on current FY2018 GSA Per Diem rates for New York City
Y Y Y Y Y
Value of Service (Non-Residential and Public)
bull The unit cost of service disruption and rental of temporary facilities while flood damage is repaired
bull Disruption costs for non-residential buildings typically range from $095 to $136SFmonth and rental costs range from $020 to $136SFmonth depending on building use
bull Value of service for public buildings ($day) is typically based on the annual operating budget for the City agency using the building prorated based on building size or population served by the building then divided by 365 daysyear
Y Y Y Y
Value of Service (Critical Facilities)
bull The unit cost of critical facilities (police fire emergency medical services) lost or delayed while flood damage is repaired
Y Y Y
Value of Service Duration
bull The duration of service disruption and rental of temporary facilities for non-residential buildings and critical facilities while flood damage is repaired
bull For non-residential buildingso Value of Service Durations vary from
4 months to over 30 months based on building use and the depth of flooding
o Total Value of Service Loss = (Disruption Cost x Building Area) = (Rental Cost x Building Area x Value of Service Duration)
bull For public buildings and critical facilitieso Value of Service Durations vary from 0
days to 720 months based on building use and the depth of flooding from FEMA FIA or USACE DDFs
o Total Value of Service Loss = (Value of Service) x (Service Loss Duration)
Y Y Y
NYC Mayorrsquos Office of Recovery and Resiliency Climate Resiliency Design Guidelines
47APPENDIX 4 - PROJECT BENEFITS CATEGORIES
Table 16 ndash Guidance on quantitative calculations for (1) sea level rise with coastal storm surge and (2) increased precipitation measures
Data Input General Guidance ndash Basic Description
Applicable Benefit Category
Applicable Typical Facility Typology
Dire
ct B
enefi
ts
Indi
rect
Ben
efits
Oth
er P
oten
tial
Ben
efits
Bui
ldin
g St
ruct
ures
Com
plex
Fa
cilit
ies
Tran
spor
tatio
nSt
reet
scap
es
Plaz
as
Park
Fea
ture
s
Engineering Estimates for Damages
bull Engineered estimate models of physical damages and service losses at the project site based on the Guidelines event recurrence interval(s) and flood depth(s)
Y Y Y Y Y Y
Historic Damages and Service Losses
bull Historic physical damages and service losses at the project site documented from previous flood events
bull Do not use routine maintenancebull The historic damage event recurrence interval
(RIs) andor flood depths must be determined updated for inflation to the present value and adjusted to match the Guidelines event RIsflood depths
Y Y Y Y Y Y
Facility Replacement Value
bull The unit cost to rebuild the facility
Impacted Area bull The geographic area impacted by the facility in the event of failure in acres
Y Y Y Y
Facility Capacity
bull The design capacity of the facilitybull For example - facility capacity expressed in
millions of gallons per day (MGD) for water and wastewater facilities or megawatts (MW) for electrical facilities
Y Y Y Y
Service Population
bull The number of impacted residents served by the facility
bull Typically estimated based on number of impacted residential customers x average number of individuals per household (based on current US Census data or use 25 individuals per household as a default)
bull Facilities serving mostly non-residentialpublic buildings andor critical facilities should focus on service losses rather than service population
Y Y Y
NYC Mayorrsquos Office of Recovery and Resiliency Climate Resiliency Design Guidelines
48APPENDIX 4 - PROJECT BENEFITS CATEGORIES
Table 16 ndash Guidance on quantitative calculations for (1) sea level rise with coastal storm surge and (2) increased precipitation measures
Data Input General Guidance ndash Basic Description
Applicable Benefit Category
Applicable Typical Facility Typology
Dire
ct B
enefi
ts
Indi
rect
Ben
efits
Oth
er P
oten
tial
Ben
efits
Bui
ldin
g St
ruct
ures
Com
plex
Fa
cilit
ies
Tran
spor
tatio
nSt
reet
scap
es
Plaz
as
Park
Fea
ture
s
Value of Service
bull Unit value of service provided by the facilitybull Example of FEMA standard values for complete
loss of utility service $105personday for potable water$49personday for wastewater$148personday for electrical
bull Consider updating FEMA standard per capita values to reflect current The New York City utility rates
Y Y
Roadway Elevations bull Roadway Elevations
Y Y
Roadway Replacement Value
bull Roadway Replacement ValueY Y
Inundation Area Map
bull Inundation Area Map developed by FEMA or through modeling by project design team
Y Y Y
Building Inventory of Inundation Area
bull The number and type of buildings within the streetscape and neighborhood inundated by the Guidelinersquos flood events
Y Y Y
Average Daily Traffic (ADT)
bull The average number of one-way traffic trips per day along the roadway(s) within the streetscapeneighborhood inundated by the Guidelinersquos flood events
Y Y
Additional Travel Time
bull The additional travel time needed to detour around a flooded roadway expressed in minutes
bull In the unlikely event there is no detour available use a 12-hour travel time per one-way trap but provide a detailed area street map as supporting documentation
Y Y
Value of Traffic Delay
bull The value of service associated with lost time in traffic
bull For example - FEMA standard average value of $3344vehiclehour of delay
bull Consider updating FEMA and GSA standard values to reflect current New York City area labor rates and fuel costs
Y Y
NYC Mayorrsquos Office of Recovery and Resiliency Climate Resiliency Design Guidelines
49APPENDIX 4 - PROJECT BENEFITS CATEGORIES
Table 17 ndash Guidance on quantitative unit benefit calculations for extreme heat hazard measures
Measure General Guidance ndash Unit Benefit Information and Data Requirements
Applicable Benefit Category
Applicable Typical Facility Typology
Dire
ct B
enefi
ts
Indi
rect
Ben
efits
Oth
er P
oten
tial
Ben
efits
Bui
ldin
g St
ruct
ures
Com
plex
Fa
cilit
ies
Tran
spor
tatio
nSt
reet
scap
es
Plaz
as
Park
Fea
ture
s
Green Roof
bull Unit benefit range over PUL = $470SF to $373SF of green roof area ($719SF standard value)
bull Assumed PUL = 40 yearsbull Apply standard value unit benefit to green
roof area to estimate measure benefitbull Higher range values more applicable
to residential and commercial building streetscape projects
Y Y Y Y Y Y
Bioswale Rain Garden Meadow Mix
bull Unit benefit range over PUL = $396SF to $211SF of area ($730SF standard value)
bull Assumed PUL = 30 yearsbull Apply standard value unit benefit to bioswale
rain gardenmeadow mix area to estimate total measure benefit
Y Y Y Y Y Y
Cool Roof
bull Unit benefit range over PUL = $117 to $3151SF of material area ($144SF standard value)
bull Assumed PUL = 20 yearsbull Apply standard value unit benefit to cool roof
area to estimate total measure benefitbull Higher range values more applicable to
residential building streetscape projects
Y Y Y Y Y
Light-Colored PaversLight-Colored Materials
bull Unit benefit range over PUL = $0774 to $204SF of material area ($0866SF standard value)
bull Assumed PUL = 30 yearsbull Apply standard value unit benefit to material
area to estimate total measure benefit
Y Y Y Y
Table 17 provides general guidance on how to quantitatively calculate benefits from efforts to address climate stressors See Section IIIE for more information
NYC Mayorrsquos Office of Recovery and Resiliency Climate Resiliency Design Guidelines
50APPENDIX 4 - PROJECT BENEFITS CATEGORIES
Table 17 ndash Guidance on quantitative unit benefit calculations for extreme heat hazard measures
Measure General Guidance ndash Unit Benefit Information and Data Requirements
Applicable Benefit Category
Applicable Typical Facility Typology
Dire
ct B
enefi
ts
Indi
rect
Ben
efits
Oth
er P
oten
tial
Ben
efits
Bui
ldin
g St
ruct
ures
Com
plex
Fa
cilit
ies
Tran
spor
tatio
nSt
reet
scap
es
Plaz
as
Park
Fea
ture
s
Tree Planting
bull Unit benefit range over PUL = $1005 to $77154Tree ($1855Tree standard value)
bull Assumed PUL = 30 yearsbull Apply standard value unit benefit to number of
trees to estimate total measure benefitbull Higher range values more applicable
to residential and commercial building streetscape projects
Y Y Y Y Y Y
Planter Box Tree
bull Unit benefit range over PUL = $212 to 16304Tree ($392Tree standard value)
bull Assumed PUL = 15 yearsbull Apply standard value unit benefit to number of
trees to estimate total measure benefitbull Higher range values more applicable
to residential and commercial building streetscape projects
Y Y Y Y Y
Shade Canopy
bull Unit benefit range over PUL = $0363 to $396SF ($0458SF standard value)
bull Assumed PUL = 15 yearsbull Apply standard value unit benefit to area of
shade canopy estimate total measure benefitbull Higher range values more applicable
to residential and commercial building streetscape projects
Y Y Y Y
Permeable Grass Pavers
bull Unit benefit range over PUL = $0258SF to $0521SF of pavers ($0363SF standard value)
bull Assumed PUL = 30 yearsbull Apply standard value unit benefit to paver
area to estimate total measure benefit
Y Y Y Y Y
For the purposes of the BCA refer to the following facility typologies bull ldquoBuilding Structuresrdquo include critical small building sites such as EMS or FDNY stations and non-critical small building sites such as
libraries or comfort stationsbull ldquoComplex Facilitiesrdquo include critical infrastructure such as wastewater treatment sites pump stations water filtration plants and similar
large or complex facilitiesbull ldquoTransportationStreetscapePlazasrdquo include roadway reconstruction streetscape improvements street raising plazas and other
transportation-related infrastructurebull ldquoPark Featuresrdquo include parks and similar public recreational facility with natural landscape features
NYC Mayorrsquos Office of Recovery and Resiliency Climate Resiliency Design Guidelines
51APPENDIX 5 - EXAMPLE PLANNING DECISION TREE
This decision tree provides a summarized example approach for how to implement these Guidelines Projects with a total cost greater than $50 million are recommended to conduct a full qualitative and quantitative climate change risk assessment and BCA while projects below $50 million are recommended to conduct a qualitative risk assessment and BCA
Define Project
1) Operational goals and criticality level2) Useful life3) Location in the current flood plain future floodplain and or zone
of tidal inundation and the project arearsquos score on the heat vulnerability index
Evaluate Project Risks According to Probability and Magnitude of Consequence
bull Extreme Heat bull Precipitationbull Sea Level Risebull Coastal Surge
High Level Identification and Assessment of Risk Mitigation Alternatives and Co-benefits
(qualitative)
Detailed Identification and Assessment of Risk Mitigation Alternatives and Co-benefits (qualitative and quantitative)
High Level Estimate of Costs and Benefits of Design Alternatives
(qualitative)
Detailed Estimate of Costs and Benefits of Design Alternatives
(qualitative and quantitative)
Decision Point Which climate change risks require mitigation
Decision Point Evaluate risk mitigation benefits and costs to
determine final resilient design alternative or if no action is required
Decision Point Is the total project cost above $50 million
Below $50 million Above $50 million
APPENDIX 5 - EXAMPLE PLANNING DECISION TREE
NYC Mayorrsquos Office of Recovery and Resiliency Climate Resiliency Design Guidelines
52
Project Title
Design Strategies Checklist (not exhaustive)
Extreme Heat Comments Extreme Precipitation Comments Sea Level Rise amp Storm Surge Comments
Select Site in Low Heat Vulnerability Index area Select High Elevation Site Select High Elevation Site
Minimize East-West Building Orientation Green Roof Raise Building Floor Elevation
Passive Solar Cooling and Ventilation Systems
Protect Below Grade Areas from Flooding Waterproof Building Envelope
Cool Roof (SRI appropriate) On-site Stormwater Management (gray) Elevate Critical Building Functions
Green Roof (extensive) Reduce Impervious Areas Elevate Critical Equipment
Vegetative Structures Permeable Pavement Perimeter Floodwall100 Levee (passive or active)
Enhanced HVAC System including space layout optimization and system scalability
Increase Green Spaces and Planted Areas DryWet Floodproofing
More Efficient Building Envelope Other Utility Redundancy Design101
Parking Lot Shading Resilient Materials amp Landscape Treatments
Light Colored Pavements (appropriate SRI) Design for Storm Surge Outflow
Increase Planted Areas Install Backwater Flow Prevention
Permeable Surfaces Design for Scour
Open-grid Pavement Raise Road Elevation
Other Other
This appendix provides a template for identifying possible design strategies to address climate change risks as described throughout the Guidelines
APPENDIX 6 - DESIGN STRATEGIES CHECKLIST
100 Permanent perimeter flood walls are not permitted to meet floodproofing requirements in buildings with substantial improvements andor damages 101 Utility redundancy design should be pursued for critical systems not all building systems
APPENDIX 6 - DESIGN STRATEGIES CHECKLIST
NYC Mayorrsquos Office of Recovery and Resiliency Climate Resiliency Design Guidelines
53APPENDIX 7 - CLIMATE CHANGE RISK ASSESSMENT RESOURCES
These Guidelines provide data on climate change hazards and recommend how that data can inform resilient design A risk assessment is a tool to help project managers and designers evaluate risk levels as well as select and prioritize resilient design strategies A high level risk assessment is recommended for all City capital projects with a total cost of under $50 million Projects above $50 million are recommended to conduct an in-depth assessment
Risk assessments use quantified estimates of the probability and magnitude of consequence of an event occurring to prioritize responses ldquoProbabilityrdquo is an assessment of the likelihood of a hazard occurring while ldquomagnituderdquo describes the hazardrsquos potential impact Risk assessment tools such as the examples listed below can be used to define and score these categories Projects that score higher across both probability and magnitude can be prioritized for investment and risk mitigation action Projects that score lower across both criteria may require no action beyond meeting code The results are typically charted on a risk matrix and an example is provided on the next page
The climate change risk management frameworks below offer templates for how to integrate climate change projections into a risk assessment process Refer to these resources for examples and further information
bull Vulnerability Assessment and Adaptation Framework is prepared by the Federal Highway Administration (FHWA) While developed for transportation planning this risk assessment framework has broad applicability for evaluating asset vulnerability to climate change Available at httpswwwfhwadotgovenvironmentsustainabilityresilienceadaptation_framework
bull US Climate Resilience Toolkit The US Global Change Research Program offers a step by step risk assessment
framework including tools and case studies at httpstoolkitclimategovsteps (see example on next page)
bull Coast Adapt Guidance on undertaking a risk assessment High level assessment httpscoastadaptcomausitesdefaultfilesfactsheetsT3M4_2_2nd_pass_risk_assessmentpdfDetailed assessment httpscoastadaptcomausitesdefaultfilesfactsheetsT3M4_3_3rd_pass_risk_assessmentpdf
bull Climate adaptation Risk uncertainty and decision-makingDownload the report here httpswwwukciporgukpublicationsRisk
The City plans to develop a NYC-specific process for integrating climate change data into existing risk management processes by April 2019
APPENDIX 7 - CLIMATE CHANGE RISK ASSESSMENT RESOURCES
NYC Mayorrsquos Office of Recovery and Resiliency Climate Resiliency Design Guidelines
54APPENDIX 7 - CLIMATE CHANGE RISK ASSESSMENT RESOURCES
The Risk Characterization Matrix below is an example from the US Climate Resilience Toolkit This tool can be used to assess the probability and magnitude of impact for identified risks The risk of coincident climate stressorsrisks (such as storm surge plus increased precipitation) can also be assessed as applicable
Figure 14 - Example of a climate change risk matrix (adapted from US Climate Resilience Toolkit)
Project teams can determine the magnitude of the impact (along the horizontal scale of 1 through 3 with 3 being the most severe) and the probabilitylikelihood of occurrence for each specific risk (along the vertical scale with 3 being the most likely) A score is typically assigned for each risk (Probabil-ity x Magnitude) and then charted on the matrix Based on the estimated probability and magnitude of consequence above the risks are ranked and prioritized for mitigation Factors to bear in mind include
bull Not all facility typologies have the same level of functional and operational importance during events or tolerance for disruption
bull Not all climate stressors and risks have the same level of impact on each project sitebull Not all identified risks can or should be mitigated fully
NYC Mayorrsquos Office of Recovery and Resiliency Climate Resiliency Design Guidelines
55WORKS CITED
A Stronger More Resilient New York PlaNYC Report of the NYC Special Initiative for Rebuilding and Resiliency The City of New York 2013
ldquoAccount for Climate Riskrdquo International Finance Corporation accessed March 27 2017 httpwwwifcorgwpswcmconnectTopics_Ext_ContentIFC_External_Corporate_SiteClimate+Business
PrioritiesAccount+for+Climate+Risk
American Society of Heating Refrigeration and Air-Conditioning Engineers (ASHRAE) Handbook -Fundamentals 2017
ldquoBaseline Standard Economic Value Methodology Reportrdquo Federal Emergency Management Agency July 2016
Benefit Cost Analysis Toolkit Software Version 530 Federal Emergency Management Agency (build date December 2016)
Criteria for Detention Facility Design New York City Department of Environmental Protection November 2012
Community Resilience Planning Guide for Buildings and Infrastructure Systems Vol 1 NIST Special Publication 1190 US Department of Commerce 2016
Cool and Green Roofing Manual NYC Department of Design and Construction 2007 httpwwwnycgovhtmlddcdownloadspdfcool_green_roof_manpdf
Building Resiliency Task Force US Urban Green Building Council New York 2013 httpurbangreencouncilforcecomBuildingResiliency
Design and Planning for Flood Resiliency Guidelines for NYC Parks New York City Department of Parks and Recreation 2017
httpswwwnycgovparksorgplanning-and-buildingplanningresiliency-plansflood-resiliency
Flooded Bus Barns and Buckled Rails Federal Transit Administration Office of Budget and Policy 2011 httpswwwhsdlorgabstractampdid=685187
Floodproofing Non-Residential Buildings FEMA P936 FEMA 2013 httpswwwfemagovmedia-library-data9a50c534fc5895799321dcdd4b6083e7P-936_8-20-13_508rpdf
ldquoGlossaryrdquo International Infrastructure Management Manual National Asset Management Support Group New Zealand 2011 httpwwwipweaorg
ldquoGreen Roof Metrics Draft Reportrdquo New York City Department of Parks and Recreation 2017
ldquoGuide to Rain Event Preparednessrdquo NYC Department of Environmental Protection httpwwwnycgovhtmldeppdfbrochuresflood-preparedness-flyerpdf
ldquoGuidelines and Discount Rates for Benefit-Cost Analysis of Federal Programsrdquo Appendix C Circular A-94 US Office of Management and Budget (OMB) 2017
ldquoGuidelines for the Design and Construction of Stormwater Management Systemsrdquo New York City Department of Environmental Protection July 2012
Horton R et al New York City Panel on Climate Change 2015 Report Ann NY Acad Sci ISSN 0077-892 New York 2015
Madrigano J et al ldquoA case-only study of vulnerability to heat wavendashrelated mortality in New York City (2000ndash2011)rdquo Environmental Health Perspectives 123672ndash678 2013
WORKS CITED
NYC Mayorrsquos Office of Recovery and Resiliency Climate Resiliency Design Guidelines
56WORKS CITED
enspMcGregor et al Two Degrees The Built Environment and Our Changing Climate Routledge Press 2013
NYC Green Codes Task Force US Green Building Council New York 2010 httpurbangreencouncilorgGreenCodes
NYCrsquos Risk Landscape A Guide to Hazard Mitigation NYC Emergency Management 2014
One New York The Plan for a Strong and Just City The City of New York 2015 httpwwwnycgovhtmlonenyc downloadspdfpublicationsOneNYCpdf
Ready to Respond Strategies for Multifamily Building Resilience Enterprise Green Communities 2015 httpswwwenterprisecommunityorgresources
Rosenzweig C et al Climate Change Adaptation in New York City Building a Risk Management Response New York City Panel on Climate Change 2010
httponlinelibrarywileycomdoi101111nyas20101196issue-1 issuetoc
ldquoSustainable Infrastructure Management Program Learning Environmentrdquo Water Environment Research Foundation accessed March 24 2017 httpsimplewerforg
Urban Waterfront Adaptive Strategies NYC Department of City Planning 2013 httpwww1nycgovsiteplanningplanssustainable-communitiesclimate-resiliencepagetab=1
Wastewater Resiliency Plan Climate Risk Assessment and Adaptation Study New York City Department of Environmental Protection October 2013
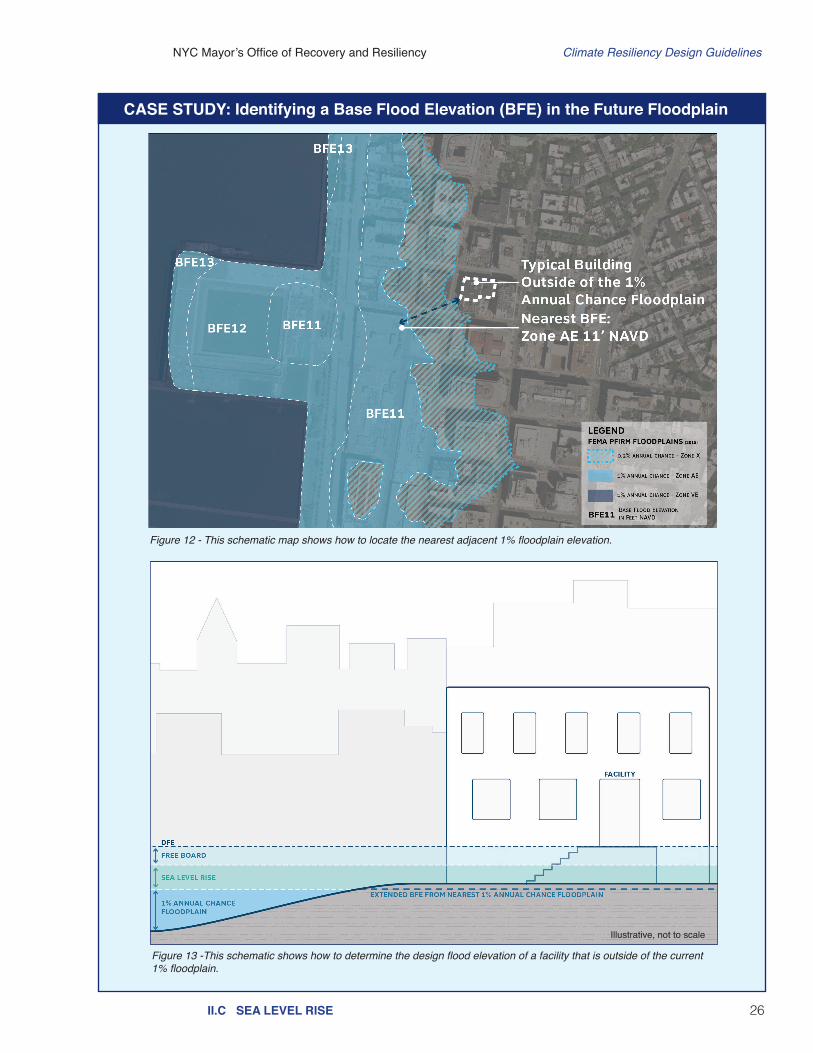
NYC Mayorrsquos Office of Recovery and Resiliency Climate Resiliency Design Guidelines
26IIC SEA LEVEL RISE
Figure 12 - This schematic map shows how to locate the nearest adjacent 1 floodplain elevation
Figure 13 -This schematic shows how to determine the design flood elevation of a facility that is outside of the current 1 floodplain
CASE STUDY Identifying a Base Flood Elevation (BFE) in the Future Floodplain
Illustrative not to scale
NYC Mayorrsquos Office of Recovery and Resiliency Climate Resiliency Design Guidelines
27IIC SEA LEVEL RISE
4 Identify appropriate design interventions
63 Additional resources for identifying adaptive strategies Urban Waterfront Adaptive Strategies (NYC Department of City Planning httpswww1nycgovassetsplanningdownloadpdfplans-studiessustainable-communitiesclimate-resilienceurban_waterfrontpdf Floodproofing Non-Residential Buildings (FEMA) at httpswwwfemagovmedia-libraryassetsdocuments34270 Ready to Respond Strategies for Multifamily Building Resilience (Enterprise Green Community) at
httpwwwenterprisecommunityorgresourcesready-respond-strategies-multifamily-building-resilience-1335664 While natural systems-based approaches ameliorate flooding their use for storm surge or wave mitigation would need to be quantified
before contributing towards the design flood elevation 65 For more information see FEMArsquos Floodproofing Non-Residential Buildings at httpswwwfemagovmedia-libraryassetsdocuments34270
Operational requirements and continuity plans can inform the selection of appropriate design interventions particularly in terms of how quickly a site needs to be up and running after a flood event Some examples of how functional uses can pair with interventions include
bull A facility that needs to be operating during or immediately after a flood event may need to be dry floodproofed using permanent barriers or designed for passive survivability (such as a police or fire station)
bull A facility that needs to recover quickly after an event could elevate prioritized equipment and have deployable barriers
bull A site that can recover over a longer duration of time could be temporarily inundated during an event (such as parks or plazas) The use of resilient materials and strategies can reduce costly damage caused by temporary inundation
Different design interventions should be chosen based on the specific operational requirements of the project however these must meet the ASCE 24 design requirements for Coastal VE Zones
For all projects at risk of current or future flooding select protections that meet the projectrsquos design flood elevation Consider project-specific factors including the site location operational requirements existing continuity planning and cost63 A Design Strategies Checklist in Appendix 6 is available for use as a resource to track possible design approaches Some examples of design alternatives are
bull Site relocation where feasible conduct alternative site analysis
bull Permanent barriers at a site (eg floodwalls)
bull Deployable flood barriers (eg stop logs flood doorsgates inflatable barriers)
bull Natural systems-based approaches (eg living shorelines restored wetlands)64
bull Prioritized protection of electrical mechanical and other critical or costly-to-replace equipment above the design flood elevation (eg motors and controller boilers and furnaces fuel storage tanks duct work alarm systems and suppression equipment electrical panels electrical distribution and switching areas gas and electric meters telecommunications equipment chemical feed equipment HVAC units and emergency generators)65
bull Dry floodproofing design a facility to prevent water from entering
bull Wet floodproofing design a facility to permit floodwaters to flow in and out of the structure without causing significant damage (eg elevate or protect critical equipment use water-resistant building materials below the design flood elevation include flood vents and pumps)
bull Design redundant telecommunications conduit entrances for multiple carrier entry Telecom conduit should run to diverse manholes when possible
bull Install backup power for telecom equipment with design consideration for such equipment (eg installation above DFE)
bull Install outdoor-rated disconnect switch for telecommunications equipment on the roofbull Explore interventions to protect underground utilities and other telecommunications
facilities from water damagebull Install backflow preventers backwater valves and sump pumps for all buildings and
infrastructure in the floodplain as well as behind flood barriersbull Shoreline improvements that reduce the height of waves or attenuate waves where
feasible
NYC Mayorrsquos Office of Recovery and Resiliency Climate Resiliency Design Guidelines
28IIIA GENERAL METHODOLOGY TO ESTIMATE PROJECT BENEFITSIIIB CATEGORIES OF PROJECT BENEFITS
Designing and constructing facilities to handle the future climate loads above the current NYC codes and standards based on projected useful life of the components provides resiliency benefits The incremental costs to implement the Guidelinesrsquo recommended design interventions should be compared with the incremental benefits to aid agencies in making decisions about resilient design strategies The project design team should evaluate benefits of the interventions designed to meet Guidelinesrsquo recommended criteria for all the climate stressors qualitatively andor quantitatively For projects with construction costs below $50 million the project design team is recommended to perform a qualitative benefits assessment on the interventions that meet the Guidelinesrsquo recommendations for all applicable climate stressors For critical facilities or projects with construction costs over $50 million the project design team is recommended to perform quantitative benefit calculations to identify the optimal interventions that meet Guidelinesrsquo recommended design criteria
A GENERAL METHODOLOGY TO ESTIMATE PROJECT BENEFITSThis general methodology to perform qualitative and quantitative benefit calculations is recommended for use by project design teams at the beginning of and during the design process This methodology enables estimation of project benefits for a high-level benefit-cost analysis (BCA) that can be applied to evaluate and compare resiliency features designed to address sea level rise with coastal storm surge increased precipitation and extreme heat events The type of benefits provided by interventions designed to meet the Guidelinesrsquo design criteria can vary by climate stressors and typology of the facilities The main guiding principle in development of the high-level BCA methodologies included in these Guidelines was to balance simplicity with accuracy The project benefits categories identified within the methodology may not cover all the potential benefits provided by every facility type within NYC In particular the benefits of planning for increased precipitation are difficult to quantify Hence the project design team should use their discretion to modify this general benefit calculation methodology as needed to meet their project goals and objectives The project design team should develop appropriate input data whether quantitative or qualitative needed to estimate project benefits
B CATEGORIES OF PROJECT BENEFITSThere are three types of project benefit categories - direct benefits indirect benefits and other benefits - that can be used to perform qualitative assessments and develop quantitative estimates of monetary benefits for intervention alternatives designed to meet the Guidelinesrsquo recommendations These project benefit categories will help to perform a high-level benefit-cost analysis that balances accuracy with an appropriate level of effort
bull Direct Benefits include reduced or avoided physical damages to facilities and contents reduced or avoided displacements for residential structures and reduced life cycle or OampM costs that can be quantified as a primary result of implementing a specific hazard mitigation measure Table 12 in Appendix 4 provides a list of direct benefits and basic guidance on estimating and documenting values for sea level rise and increased precipitation-related flood hazards Note that given the current state of practice it is not possible to quantify reduced or avoided physical damages or residential displacements that result from a specific extreme heat mitigation measures Therefore direct benefits applicable to extreme heat hazards are limited to reduced life cycle costs applicable to certain measures such as green roofs Refer to Table 15 for details on direct benefits for extreme heat hazards
III EVALUATION OF PROJECT BENEFITS
NYC Mayorrsquos Office of Recovery and Resiliency Climate Resiliency Design Guidelines
29IIIB CATEGORIES OF PROJECT BENEFITS
bull Indirect Benefits include reduced or avoided service losses for non-residential
buildings public facilities andor infrastructure (utilities roads and bridges) based on the value of service continuity andor emergency services to New Yorkers that can be quantified as a secondary result of implementing a specific hazard mitigation measure Table 13 in Appendix 4 provides a list of indirect benefits and basic guidance on estimating and documenting values for sea level rise and increased precipitation-related flood hazards Note that given the current state of practice on extreme heat it is not possible to quantify reduced or avoided service losses that result from a specific extreme heat mitigation measures Therefore indirect benefits applicable to extreme heat hazards are limited to reduced energy costs such as cool roofs green roofs or shade trees Refer to Table 15 in Appendix 4 for details on indirect benefits for extreme heat hazards
bull Other Benefits where applicable other potential benefits may include social benefits for residents such as avoided stress and anxiety avoided lost productivity environmentalecosystem service benefits avoided need for emergency services and other potential benefits that can be estimated as a result of implementing a specific hazard mitigation measure Table 14 in Appendix 4 provides a list of other potential benefits and basic guidance on estimating and documenting values for sea level rise and increased precipitation-related flood hazards
Note on the ecosystem service benefit category in Table 14 the stormwater management benefits of green infrastructure should be distributed between the extreme heat and increased precipitation hazards since these measures provide both significant reductions in rainfall runoff as well as Urban Heat Island mitigation through evapotranspiration However there is currently limited data available to quantify the actual distribution of stormwater management benefits between the two hazards For various dual-benefit providing interventions careful considerations should be given to identify the appropriate benefits category provided by the intervention with a goal to avoid duplication of quantified benefits In this methodology the stormwater management benefits of green infrastructure are applied to the increased precipitation hazard in order to avoid a duplication of benefits Note on real estate and quality of life benefits additionally it is important to note that two potential benefit categories shown in Table 14 - real estate and quality of lifehealthavoided casualties - were not included in the current BCA methodology for sea level rise or increased precipitation hazards Although these categories could increase project benefits for sea level rise and increased precipitation hazards they were only applied to measures that address extreme heat hazards such as green roofs trees and other plantings Refer to Table 15 for a detailed summary of other benefit categories quantified as unit benefits for extreme heat hazards
NYC Mayorrsquos Office of Recovery and Resiliency Climate Resiliency Design Guidelines
30IIIC WHICH METHODOLOGY TO USEIIID BCA METHODOLOGY FOR PROJECTS UNDER $50 MILLION
D BCA methodology for projects under $50 millionThe project design team should develop design alternatives to meet the Guidelinesrsquo criteria which may be in excess of NYC code and standards requirements (baseline conditions) It is assumed that the project design team will develop alternatives to address each of the following applicable climate stressors - sea level risecoastal storm surge increased precipitation and extreme heat - separately Tables 12-15 in Appendix 4 provides a list of typical direct indirect and other benefits provided by various intervention typologies to reduce impacts from climate stressors During the qualitative assessment the project design team should consider that intervention strategies will have varying levels of reliability effectiveness benefits and cost implications during the qualitative assessment
The project design team is recommended to develop appropriate evaluation criteria and metrics for each of the applicable project benefit categories For each alternative the project design team could use either a scoring weighting ranking or other type of qualitative assessment framework to assess each applicable project benefit categories with the developed evaluation criteria and metrics Table 6 provides an example template to evaluate alternatives using a set of general evaluation criteria and metrics using a color-coded rating system (and see Table 7 for an example of how to complete the template) The project design team can utilize a similar template customized to their project goals and objectives This assessment allows agencies to screen the qualitative benefits for various alternatives that would then lead to development of final project components to match the available budget and goals of the project
Projects with total costs below $50 million recommended to conduct a qualitative assessment to identify the optimal interventions that meet Guidelinesrsquo design criteria using the ldquoD) BCA methodology for projects under $50 millionrdquo methodology below
C WHICH METHODOLOGY TO USEProjects with a total cost above $50 million or are highly complex or critical facilities recommended to conduct both a qualitative and quantitative benefit calculation to identify the optimal interventions that meet Guidelinersquos design criteria using the ldquoE) BCA methodology for projects above $50 millionrdquo below A quantitative BCA also must include qualitative factors
NYC Mayorrsquos Office of Recovery and Resiliency Climate Resiliency Design Guidelines
31IIID BCA METHODOLOGY FOR PROJECTS UNDER $50 MILLION
Qualitative Color Scale Green=Least resource intensive alternative Purple=most resource intensive yellow=medium level of resource intensity
Qualitative Evaluation Factors Description Relative Color Rating System
First CostsAdditional construction costs needed to incorporate Guidelinesrsquo recommended resilient design over the baseline project costs
Highest cost ($$$) rated as Purple whereas lowest cost ($) rated as Green
ConstructabilityEase of Implementation
Construction techniques and site conditions such as presence of major utilities conflicts and other conditions which dictate the level of constructability required for each alternative
Difficult to construct rated as Purple whereas easiest to construct rated as Green
Environmental ImpactsCo-BenefitsPermitting
Impacts to the built and natural environment such as circulation noise and hazardous waste plus the level of effort required for permitting (eg interventions in water require highest level of permitting requirement) from each alternative in addition to the baseline project condition
Highest environmental impacts and highest level of effort required for permitting rated as Purple whereas the least impact and level of effort rated as Green
Operation and Maintenance (OampM)
Level of effort of additional manpower and cost of OampM for the alternatives over the baseline project OampM requirements
Highest level of effort and cost for OampM rated as Purple whereas the lowest is rated as Green
Reliability and Durability
Interventions that do not require human involvement or a facilityrsquos ability to withstand all the forces during a storm event (eg permanent solutions with higher reliability than deployable solution)
Interventions requiring human involvement (active measures) rated as Purple whereas interventions with minimal or no human involvement (passive measures) rated as Green
Risk Reduction Benefits Monetary benefits provided by each intervention alternative in avoided damages over the baseline condition
Lowest potential monetary benefit rated as Purple whereas as highest potential monetary benefit rated as Green
Quality of Life BenefitsVisual Aesthetics
Benefits either to the community such as recreation or safety or serve the community during emergency situations
Lowest potential quality of life benefits rated as Purple whereas as highest potential benefits rated as Green
Table 6 ndash Evaluation matrix for comparison of mitigation alternatives across the useful life of a project
Project title_______________________________________________________________________________
Evaluation Criteria
Baseline Condition (Designed to NYC Building Code and
Standards)
Resilient Design Alternatives for Managing__________________
Alternative 1
Alternative 2
Alternative 3
First Costs
ConstructabilityEase of ImplementationEnvironmental ImpactsCo-BenefitsPermitting
Operation and Maintenance (OampM)
Reliability and Durability
Risk Reduction Benefits
Quality of Life BenefitsVisual Aesthetics
NYC Mayorrsquos Office of Recovery and Resiliency Climate Resiliency Design Guidelines
32IIID BCA METHODOLOGY FOR PROJECTS UNDER $50 MILLION
Table 7 ndash Evaluation matrix for comparison of mitigation alternatives across the useful life of a project - COMPLETED EXAMPLE
Evaluation Criteria
Baseline Condition (Designed to NYC Building Code and
Standards)
Resilient Design Alternatives for Managing Coastal SurgeSLR
Alternative 1Flood proof building built on grade to Guidelines
DFE
Alternative 2 Elevate building structure above Guidelinesrsquo DFE
on columns
Alternative 3 Raise site grade by filing the building site footprint
to Guidelinesrsquo DFE
First CostsBaseline cost for building structure is $15 million
Incremental costs are within 5 over the baseline costs
Incremental costs are between 5-10 over baseline costs
Incremental costs are 20 and more over baseline costs
ConstructabilityEase of Implementation
Relatively easy to construct within site constraints
Similar to baseline conditions since construction requires additional flood proofing only
Moderate challenges to construct foundation structure for columns within site constraints
Extremely challenging to construct within the site constraints Potentially fatal flaw
Environmental ImpactsCo-BenefitsPermitting
No major impacts but may require additional effort to obtain DOB permits with flood proofing and deployable systems
No major impacts but may require additional effort to obtain DOB permits with flood proofing and deployable systems
No major impacts and relatively easy to permit
Potential drainage circulation impacts and challenges to obtain clean fill material for the site
Operation and Maintenance (OampM)
Major OampM costs associated with deployable systems
Major OampM costs associated with deployable systems
Moderate OampM costs associated with proposed elevator for access
Minimal OampM costs since deployable and elevators not required
Reliability and Durability
Least reliability with highest potential risk from flooding during to failure of deployable systems
Least reliability with highest potential risk from flooding during to failure of deployable systems
Moderate reliability with potential risk from flooding limited to elevator shaft only
Highest reliability since deployable are not required to protect building from flooding
Risk Reduction Benefits
Maximum flood risk reduction benefits assuming deployable and flood proofing is effective
Maximum flood risk reduction benefits assuming deployable and flood proofing is effective
Maximum flood risk reduction benefits
Maximum flood risk reduction benefits
Quality of Life BenefitsVisual Aesthetics
Facility may not be operational during the storm event
Facility may not be operational during the storm event
Facility can be potentially operational during the storm event
Facility can be potentially operational during the storm event
Qualitative Color Scale Green=Least resource intensive alternative Purple=most resource intensive yellow=medium level of resource intensity
A new non-critical facility with a building structure is proposed on a site that is currently in the 2015 Preliminary FEMA 1 annual chance floodplain with a BFE of 10rsquo (NAVD 88) The baseline conditions DFE to meet existing NYC codes and standards is 11rsquo (NAVD 88) Using the Guidelines recommended design criteria the facilityrsquos DFE is 133rsquo (NAVD 88) and existing grade is around 6rsquo (NAVD 88) The project design team develops three alternatives to meet the Guidelinesrsquo recommended DFE design for the facility Table 7 offers an example of how a qualitative assessment can be used to compare three resilient design alternatives using the evaluation criteria and metrics
CASE STUDY Example of How to Use the Evaluation Matrix
NYC Mayorrsquos Office of Recovery and Resiliency Climate Resiliency Design Guidelines
33IIIE BCA METHODOLOGY FOR PROJECTS OVER $50 MILLION
E BCA methodology for projects over $50 millionIn order for a project to be considered cost-effective a benefit-cost analysis (BCA) assesses if the benefits of a project outweigh its costs or in other words the benefit-cost ratio (BCR) is greater than 10 as illustrated in Equation 1
Equation 1 Benefit-Cost Ratio Formula
BCR =
Where BCR = Benefit-Cost Ratio
BENEFITS = Total project benefits
COSTS = Total project costs
BENEFITSCOSTS
These estimated project benefits are combined with the project costs which are defined as the differential construction and long-term operation and maintenance costs associated with constructing a proposed project to the Guidelinesrsquo recommended design level It is assumed that the baseline project will be designed to the most prevalent NYC codes and standards This benefit methodology should be used to determine the additional project benefit that the Guidelinesrsquo recommended design would provide over the baseline project benefit It is assumed that the project design team will develop alternatives to address each of the following applicable climate stressors - sea level risecoastal storm surge increased precipitation and extreme heat - separately For each alternative the project design team should use the following steps to determine the Benefit-Cost Ratio (BCR)
a) Determine project useful life for design interventions Determining the useful life of the proposed project is an important first step in the
detailed BCA assessment methodologies for two reasons First the project useful life determines what values must be used from the Guidelines to establish the future climate design conditions The various hazard tables in the Guidelines establish design requirements based on useful life ranges through 2039 2040-2069 2070-2099 and 2100+ (2100+ projections are only available for sea level rise) A review of these tables show that the design requirements needed to meet the projected climate hazards increase as the end of useful life range increases Second the useful life determines how long the project will need to be operated and maintained in order to remain technically sound and effective at reducing future damages and losses
b) Determine discount rate for project benefits calculation The cost-effectiveness of projects assessed using the BCR must be done on a net
present value basis meaning the present value of the benefits is compared to the present value of the costs Most project costs are computed for present value based on current cost estimates bids or cost guidance However project benefits - as well as project costs for operation and maintenance - accrue over time into the future and are computed on an annualized basis To address this issue the Present Value Coefficient (PVC) is used to bring these annualized project benefits and OampM costs into the present value As indicated by the formula in Equation 2 the PVC is a function of the Project Useful Life (PUL) and the Discount Rate (DR)
NYC Mayorrsquos Office of Recovery and Resiliency Climate Resiliency Design Guidelines
34
Equation 2 Present Value Coefficient (PVC) Formula
PVC =
Where PVC = Present Value Coefficient
PUL = BCA Project Useful Life based on project type
DR = Discount Rate
The project design team should coordinate with agencies and NYC OMB if needed to determine appropriate discount rates based on funding source project type and other factors This coordination should take place during project initiation phase where total project costs (design and construction) are over $50 million66
c) Develop input data to perform benefit calculations Tables 16 and 17 in Appendix 4 provide a list of typical input data by each climate
stressor needed to perform benefit analysis quantitatively on variety of facilities67 The project design team should use these tables as a reference to identify appropriate input data categories andor additional input data needed to perform benefit analysis on the project
d) Identify applicable project benefit categories to estimate benefits Tables 16 and 17 in Appendix 4 provide a list of typical project benefits by each climate
stressor needed to perform benefit analysis quantitatively on various types of projects The project design team should use these tables as a reference to identify appropriate project benefit categories for each climate stressor to perform benefit analysis on the project
e) Calculate benefits of recommended design interventions for each climate
stressor The input data and applicable project benefits can be assembled along with
incremental project cost data to analyze cost-effectiveness using the FEMA BCA Tool Damage-Frequency Assessment (DFA) module or similar software This analysis will provide a BCR for each alternative which can then be used to compare the alternatives that were developed to mitigate effects from applicable climate stressors The project design team can then use the results from this analysis to identify optimal interventions that provides a balanced solution that provides resiliency benefits within the available project budget
IIIE BCA METHODOLOGY FOR PROJECTS OVER $50 MILLION
[1 ndash (1 + DR) -(PUL)]DR
66 For example a NYC OMB March 2015 memorandum recommends using an annually updated DR as published each year in Appendix C of OMB Circular A-94 The current OMB-recommended discount rates from OMB A-94 Appendix C vary by project useful life and are as follows 21 DR for useful lives of 10 to 19 years 25 DR for useful lives of 20 to 29 years and 28 DR for useful lives of 30 years or greater By contrast FEMA hazard mitigation grants use a DR of 70 for all projects based on the Federal OMB A-94 rate for federally-funded mitigation measures Since these DRs will impact the PVC and the project benefits the project team must ensure that BCA results prepared using an OMB-recommended DR (21 to 28) be updated to reflect the Federal DR (70) when applying for FEMA mitigation grant funds
67 Note the data requirements for the sea level rise and increased precipitation hazards in Table 16 are more detailed than the requirements for the extreme heat hazards due to the less detailed level of analysis available for extreme heat
NYC Mayorrsquos Office of Recovery and Resiliency Climate Resiliency Design Guidelines
35
APPENDICES
NYC Mayorrsquos Office of Recovery and Resiliency Climate Resiliency Design Guidelines
36APPENDIX 1 ndash KEY TERMS
100-year flood (1 annual chance flood)
A flood that has a 1 probability of occurring in any given year The 100-year floodplain is the extent of the area of a flood that has a 1 chance of occurring or being exceeded in any given year
500-year flood (02 annual chance flood)
A flood that has a 02 probability of occurring in any given year The 500-year floodplain is the extent of the area of a flood that has a 02 chance of occurring or being exceeded in any given year
AdaptationAdjustment in natural or human systems to a new or changing environment that seeks to maximize beneficial opportunities or moderate negative effects Successful adaptations contribute to resiliency
Base flood elevation (BFE)The elevation of surface water resulting from a flood that has a 1 annual chance of occurring or being exceeded in any given year The BFE is shown on the Flood Insurance Rate Map (FIRM)69
BluebeltReference to the Department of Environmental Protectionrsquos (DEP) Bluebelt program to preserve natural drainage corridors including streams ponds and other wetland areas Preservation of these wetland systems allows them to perform their functions of conveying storing and filtering storm water
Climate
The average weather (or more rigorously a statistical description of the average in terms of the mean and variability) over a period of time usually 30 years These quantities are most often surface variables such as temperature precipitation and wind Climate in a wider sense is the state including a statistical description of the climate system70
Climate change
Changes in average weather conditions that persist over multiple decades or longer Climate change encompasses both increases and decreases in temperature as well as shifts in precipitation changing risk of certain types of severe weather events and changes to other variables of the climate system
Climate change riskThe chance that investments (such as in capital projects) can be affected by the physical impacts of climate change71 Risks are evaluated as a product of the probability of occurrence and the magnitude of damages or impacts including socioeconomic factors that would result if they did occur (consequences)
Climate change risk assessment
This assessment involves a detailed project-specific analysis that includes a vulnerability and risk assessment often followed by cost-benefit analysis to assess and select investments in climate change risk mitigation Risk is assessed as a function of the magnitude and probability of a given climate change hazard Examples resources are included in Appendix 7
Climate vulnerabilityThe degree to which systems and populations are affected by adverse impacts It is a function of the character magnitude and rate of climate change and variation to which a system is exposed its sensitivity and its adaptive capacity72
Cloudburst An extreme amount of rain in a short period of time often over a small geographic area73
Cooling Degree Day (CDD) A form of degree-day used to estimate the energy requirements for air conditioning or refrigeration when the daily mean temperature is above 65degF
68 All terms are from the US Global Change Research Program (USGCRP) glossary unless otherwise noted The USGCRP glossary is available at httpwwwglobalchangegovclimate-changeglossary
69 ldquoDefinitionsrdquo FEMA last modified March 1 2017 httpswwwfemagovnational-flood-insurance-programdefinitions70 UKCIP Glossary httpwwwukciporgukglossary71 ldquoAccount for Climate Riskrdquo International Finance Corporation 72 UKCIP Glossary httpwwwukciporgukglossary73 New York City Environmental Protection ldquoCloudburst Resiliency Planning Studyrdquo 2017 Available at httpwwwnycgovhtmldeppdfclimatenyc-cloudburst-studypdf
APPENDIX 1 - KEY TERMS68
NYC Mayorrsquos Office of Recovery and Resiliency Climate Resiliency Design Guidelines
37APPENDIX 1 ndash KEY TERMS
Design life The life expectancy of an asset or product as determined during design74 As opposed to useful life (see below)
Dry Bulb temperature The ambient air temperature measured by a thermometer
Extreme eventUnexpected unusual or unpredictable weather or flooding compared to historical or future projected distribution Extreme events include for example heat waves cold waves heavy rains periods of drought and flooding and severe storms
Facilities For the purposes of this document ldquofacilitiesrdquo refers to all types of buildings housing infrastructure structures and landscape features designed by or for the City of New York
Flexible adaptation pathwayResilience-building strategies that can evolve or be adapted over time as climate change risk assessments evaluations of adaptation strategies and monitoring continue75
Flood Insurance Rate Maps (FIRM)
Official flood map of a community on which FEMA has delineated the 1 annual chance floodplain and the base flood elevations (BFEs) applicable to the community76 The FIRM also includes the 02 floodplain annual chance floodplain and differentiates between special flood hazard areas (V A Coast A zones) and floodways The official FIRM is from the year 2007 while the 2015 PFIRM is currently required by NYC Building Code to calculate design flood elevations NYC DOB references the more restrictive of the two maps in both base flood elevation and flood hazard area (ie V versus A zone) Refer to Appendix 3 for more information
FreeboardAn additional amount of height above the base flood elevation used as a factor of safety (eg two feet above the base flood) in determining the level at which a facilitys lowest floor must be elevated or floodproofed to be in accordance with state or community floodplain management regulations77
Future time slices
Future periods defined by the NPCC for when climate change projections are available In this document the following decadal projections are associated with specific time spans2020s projection = present to 20392050s projection = 2040 to 20592080s projection = 2070 to 20992100s projection = end of century and beyond
Green infrastructureAn array of practices that use or mimic natural systems to manage urban stormwater runoff Water is either directed to engineered systems for infiltration or detained for longer periods before it enters the sewer system
Heat Vulnerability Index (HVI)Summarizes relative risk of adverse health effects from heat due to social and environmental factors Used to identify neighborhoods at higher risk during and after extreme heat events
Heat wave A period of three consecutive days where temperatures rise above 90degF or two consecutive days over 95 degrees78
New York City Panel on Climate Change (NPCC)
The body of leading climate and social scientists charged with making climate change projections for the metropolitan region79
74 Sustainable Infrastructure Management Program Learning Environment httpsimplewerforg 75 Rosenzweig C et al Climate Change Adaptation in New York City Building a Risk Management Response76 ldquoDefinitionsrdquo FEMA77 Ibid78 Horton R et al New York City Panel on Climate Change 2015 Report Chapter 1 Climate Observations and Projections Ann NY
Acad Sci ISSN 0077-8923 (New York 2015) 2579 For more information on the NPCC visit www1nycgovsiteorrchallengesnyc-panel-on-climate-changepage
NYC Mayorrsquos Office of Recovery and Resiliency Climate Resiliency Design Guidelines
38APPENDIX 1 ndash KEY TERMS
Open-grid pavement system
Pavements that consist of loose substrates supported by a grid of a more structurally sound grid or webbing Unbounded loose substrates in these systems transfer and store less heat than bound and compacted pavements and aid permeability Pavement is 50 pervious and contains vegetation in the open cells designed to allow percolation or infiltration of storm water through the surface into the soil below80
Preliminary Flood Insurance Rate Map (PFIRM)
Preliminary flood map developed by FEMA in 2015 for New York City that provides projected risks for flood hazards81 Refer to Appendix 3 for more information
Project useful life (PUL)
The period over which an asset or component is expected to be available for use by an entity This depends on regular and adequate maintenance This period of time typically exceeds the design life (see above) The combined effect of operational requirements and useful life is practical in assessing an investment in improving resilience82
Rain gardenAlso called ldquobioswalerdquo Planted areas designed to collect and manage stormwater that runs off streets sidewalks commercial and residential rooftops and other sources when it rains
Resiliency The ability to bounce back after change or adversity The capability of preparing for responding to and recovering from difficult conditions83
Sea level rise-adjusted design flood elevation
As defined in these Guidelines the increased height of the base flood elevation due to sea level rise plus freeboard depending on the criticality of the facility The sea level rise adjustment depends on the useful life of the facility
Storm surge An abnormal rise of water generated by a storm over and above predicted astronomical tides84
Substantial improvementAny repair reconstruction rehabilitation addition or improvement of a building or structure the cost which equals or exceeds 50 of the market value of the structure before the improvement or repairs started For more information see Appendix G of the NYC Building Code and 1 RCNY sect3606-0185
Tidal inundation Flooding which occurs at high tides due to climate-related sea level rise land subsidence andor the loss of natural barriers86
Urban Heat Island (UHI) effectThe tendency for higher air temperatures to persist in urban areas as a result of heat absorbed and emitted by buildings and asphalt tending to make cities warmer than the surrounding suburban and rural areas
Weather The state of the atmosphere at a given time with regard to temperature cloudiness precipitation wind and other meteorological conditions87
Wet Bulb temperatureThe temperature indicated when a thermometer bulb is covered with a water-saturated wick over which air is caused to flow at approximately 45 ms (900 ftmin) to reach the equilibrium temperature of water evaporating into the air when the heat of vaporization is supplied by the sensible heat of the air88
80 ldquoGlossaryrdquo US Green Building Council (2017) Available at httpwwwusgbcorgglossaryterm552581 ldquoPreliminary FEMA Map Productsrdquo FEMA Map Service Center Available at httpshazardsfemagovfemaportalprelimdownload82 ldquoGlossaryrdquo International Infrastructure Management Manual (2011) 83 A Stronger More Resilient New York (2013) 184 ldquoStorm Surge Overviewrdquo National Hurricane Center NOAA Available at httpswwwnhcnoaagovsurge85 ldquoFlood Resistant Constructionrdquo Appendix G New York City Building Code (2008) and 1 RCNY sect3606-01 available at httpswww1nycgovassetsbuildingsrules1_RCNY_3606-01pdf86 ldquoOcean Factsrdquo National Ocean Service NOAA Available at httpoceanservicenoaagovfactsnuisance-floodinghtml 87 UKCIP Glossary httpwwwukciporgukglossary88 ldquoASHRAE Terminologyrdquo ASHRAE Available at httpswwwashraeorgtechnical-resourcesauthoring-toolsterminology
NYC Mayorrsquos Office of Recovery and Resiliency Climate Resiliency Design Guidelines
39APPENDIX 2 - CLIMATE CHANGE PROJECTIONS
Climate change projections are provided by the New York City Panel on Climate Change (NPCC) The full NPCC report is available from the New York Academy of Sciences89 Tables 8-10 (below) were reproduced directly from the NPCC report while Table 2 (see Section IIA) was developed using the data underlying the NPCC report to inform the design of HVAC systems under warmer conditions
Table 8 ndash NYC sea level rise projections90
Baseline (2000-2004) 0 in
Low estimate (10th percentile)
Middle range (25th to 75th percentile)
High estimate (90th percentile)
2020s 2 in 4-8 in 10 in
2050s 8 in 11-21 in 30 in
2080s 13 in 18-39 in 58 in
2100 15 in 22-50 in 75 in
Note Projections are based on six-component approach that incorporates both local and global factors The model-based components are from 24 global climate models and two representative concentration pathways Projections are relative to the 2000-2004 base period
Table 9 ndash Mean annual changes91
a Temperature Baseline(1971-2000) 54degF
Low estimate (10th percentile)
Middle range (25th to 75th percentile)
High estimate (90th percentile)
2020s + 15degF +20-29degF +32degF
2050s +31degF +41-57degF +66degF
2080s +38degF +53-88degF +103degF
2100 +42degF +58-104degF +121F
b Precipitation Baseline(1971-2000) 501 in
Low estimate (10th percentile)
Middle range (25th to 75th percentile)
High estimate (90th percentile)
2020s -1 percent +1-8 +10
2050s +1 percent +4-11 +13
2080s +2 percent +5-13 +19
2100 -6 percent -1 to +19 +25
Note Based on 35 global climate models (GCMs) and two RCPs Baseline data cover the 1971ndash2000 base period and are from the NOAA National Climatic Data Center (NCDC) Shown are the low estimate (10th percentile) middle range (25th percentile to 75th percentile) and high estimate (90th percentile) These estimates are based on a ranking (from most to least) of the 70 (35 GCMs times 2 RCPs) projections The 90th percentile is defined as the value that 90 percent of the outcomes (or 63 of the 70 values) are the same or lower than Like all projections the NPCC climate change projections have uncertainty embedded within them Sources of uncertainty include data and modeling constraints the random nature of some parts of the climate system and limited understanding of some physical processes The NPCC characterizes levels of uncertainty using state-of-the-art climate models multiple scenarios of future greenhouse gas concentrations and recent peer-reviewed literature Even so the projections are not true probabilities and the potential for error should be acknowledged
89 The NPCC 2015 report is available at httponlinelibrarywileycomdoi101111nyas20151336issue-1issuetoc90 From New York City Panel on Climate Change 2015 Report Chapter 1 Climate Observations and Projections page 4191 From New York City Panel on Climate Change 2015 Report Chapter 1 Climate Observations and Projections page 30
APPENDIX 2 - CLIMATE CHANGE PROJECTIONS
NYC Mayorrsquos Office of Recovery and Resiliency Climate Resiliency Design Guidelines
40APPENDIX 2 - CLIMATE CHANGE PROJECTIONS
Table 10 ndash Extreme events92
2020s Baseline (1971-2000)
Low estimate(10th percentile)
Middle range(25th to 75th percentile)
High estimate (90th percentile)
Numbers of heat waves per year 2 3 3-4 4
Average heat wave duration (days) 4 5 5 5
Number of days per year with
Maximum temperature at or above 90degF 18 24 26-31 33
Maximum temperature at or above 100degF 04 07 1-2 2
Minimum temperature at or below 32degF 71 50 52-58 60
Rainfall at or above 1 inch 13 13 14-15 16
Rainfall at or above 2 inches 3 3 3-4 5
Rainfall at or above 4 inches 03 02 03ndash04 05
2050s Baseline (1971-2000)
Low estimate(10th percentile)
Middle range(25th to 75th percentile)
High estimate (90th percentile)
Numbers of heat waves per year 2 4 5-7 7
Average heat wave duration (days) 4 5 5-6 6
Number of days per year with
Maximum temperature at or above 90degF 18 32 39-52 57
Maximum temperature at or above 100degF 04 2 3-5 7
Minimum temperature at or below 32degF 71 37 42-48 52
Rainfall at or above 1 inch 13 13 14-16 17
Rainfall at or above 2 inches 3 3 4-4 5
Rainfall at or above 4 inches 03 03 03-04 05
2080s Baseline (1971-2000)
Low estimate(10th percentile)
Middle range(25th to 75th percentile)
High estimate (90th percentile)
Numbers of heat waves per year 2 5 6-9 9
Average heat wave duration (days) 4 5 5-7 8
Number of days per year with
Maximum temperature at or above 90degF 18 38 44-76 87
Maximum temperature at or above 100degF 04 2 4-14 20
Minimum temperature at or below 32degF 71 25 30-42 49
Rainfall at or above 1 inch 13 14 15-17 18
Rainfall at or above 2 inches 3 3 4-5 5
Rainfall at or above 4 inches 03 02 03-05 07
Note Projections for temperature and precipitation are based on 35 GCMs and 2 RCPs Baseline data are for the 1971 to 2000 base period and are from the NOAA National Climatic Data Center (NCDC) Shown are the low estimate (10th percentile) middle range (25th to 75th percentile) and high estimate (90th percentile) 30-year mean values from model-based outcomes Decimal places are shown for values less than one although this does not indicate higher precisioncertainty Heat waves are defined as three or more consecutive days with maximum temperatures at or above 90degF Like all projections the NPCC climate change projections have uncertainty embedded within them Sources of uncertainty include data and modeling constraints the random nature of some parts of the climate system and limited understanding of some physical processes The NPCC characterizes levels of uncertainty using state-of-the-art climate models multiple scenarios of future greenhouse gas concentrations and recent peer-reviewed literature Even so the projections are not true probabilities and the potential for error should be acknowledged
92 From New York City Panel on Climate Change 2015 Report Chapter 1 Climate Observations and Projections page 31
NYC Mayorrsquos Office of Recovery and Resiliency Climate Resiliency Design Guidelines
41APPENDIX 3 - DIFFERENTIATION OF FLOOD MAPS
These Guidelines reference several different kinds of flood maps and sources of design flood elevations These maps are described and differentiated below
Table 11 - Differentiation of flood maps used in NYC
Reference Title Data Source Information Provided Referenced By Link
2007 FIRM FEMA
Based on historical data from before 1983 identifies the current base flood (extent and elevation) as the flood that has a 1 chance of occurring in any given year also known as a 100-year flood The NYC Building Code requires that either the 2007 FIRM or 2015 PFIRM elevation be used whichever is higher
2014 NYC Building Code Appendix G
Climate Resiliency Design Guidelines
httpsmscfemagovportal
2015 PFIRM FEMA
Based on historical data identifies the current base flood (extents and elevation) as the flood that has a 1 chance of occurring in any given year also known as a 100-year flood The NYC Building Code requires that either the 2007 FIRM or 2015 PFIRM elevation be used whichever is higher The 2015 PFIRM is currently being reassessed by FEMA
2014 NYC Building Code Appendix G
Climate Resiliency Design Guidelines
httpshazardsfemagovfemaportalprelimdownload
httpwwwregion2coastalcomview-flood-maps-dataview-preliminary-flood-map-data
NYC Flood Hazard Mapper
NYC Department of City Planning
Maps current and future flood hazards in NYC including the following data layers 2007 FIRM and 2015 PFIRM high tide with sea level rise and PFIRM with sea level rise through 2100
Climate Resiliency Design Guidelines
Waterfront Revitalization Plan
httpwww1nycgovsiteplanningdata-mapsflood-hazard-mapperpage
ldquoTable 4 ndash Determine the sea level rise-adjusted design flood elevation for critical and non-critical facilitiesrdquo
ORR amp NPCC
Provides data to use when adding sea level rise to a given 2015 PFIRM or 2007 FIRM Base Flood Elevation (BFE) to calculate a Design Flood Elevation (DFE) Based on the criticality and expected useful life of a facility
Climate Resiliency Design Guidelines
See Section II on ldquoSea Level Riserdquo above
APPENDIX 3 - DIFFERENTIATION OF FLOOD MAPS
NYC Mayorrsquos Office of Recovery and Resiliency Climate Resiliency Design Guidelines
42APPENDIX 4 - PROJECT BENEFITS CATEGORIES
This appendix provides guidance on how to identify and assess benefits as a supplement to Sections IIID and IIIE
Table 12 lists typical direct benefits for reducing impacts from climate stressors and basic guidance for how to estimate them See Section IIID for more information
Table 13 lists typical indirect benefits for reducing impacts from climate stressors and basic guidance for how to estimate them See Section IIID for more information
Table 12 ndash Direct benefits for (1) sea level rise with coastal storm surge and (2) increased precipitation measures
Direct Benefit Basic Guidance for Estimating Values
Physical Damages (Structure Contents)
bull For flood-damaged buildings use depth damage functions developed by FEMA and USACE for structures and contents
bull Use depth damage functions in conjunction with Building Replacement Values (BRVs) and not market values BRVs typically range between $100 to $325SF for residential buildings and $120 to $450SF for commercial public buildings
bull For more complex structures or facilities use engineering estimates of flood damages or review historic flood damages documented from insurance claims repair records or FEMA Public Assistance claims from recent flood disasters
Residential Displacements
bull For flood-damaged buildings use depth damage functions developed by FEMA and USACE for residential displacements
Reduced Life CycleOperation and Maintenance (OampM) Costs93
bull Applicable only to projects that reduce overall life cycle costs or net annual OampM costs from baseline conditions
bull Input reduced annual OampM costs as a project benefit at a 1-year recurrence intervalbull Reduced overall life cycle costs can be input as a longer project useful life
Table 13 ndash Indirect benefits for (1) sea level rise with coastal storm surge and (2) increased precipitation measures
Indirect Benefit Basic Guidance for Estimating Values
Non-Residential Building Service Losses
bull Estimate service loss values and durations for non-residential buildings public buildings critical facilities and parksnatural features based on FEMA BCA guidance and standard values based on building use
Utility Service Losses94
bull Estimate utility service losses for water wastewater and electrical facilities based on the number of impacted customers FEMA per capita standard values for utility service ($105personday for potable water $49personday for wastewater $148personday for electrical)95
bull Estimate utility service loss durations based on engineering estimates or review historic flood damages losses documented from utility company records
bull This benefit can also apply to measures that increase energy efficiency
RoadBridge Service Losses
bull Estimate roadbridge service losses based on the average daily traffic (ADT) detour time and additional travel distance and FEMA and GSA standard values for road service ($3344vehiclehour of delay $0545mile)96
bull Estimate roadbridge service loss durations or review historic flood damages losses
Emergency Service Losses
bull Applicable only to projects that reduce or eliminate documented emergency service costs from baseline conditions
bull Examples of avoided emergency services costs include NYPD staffing to monitor barricades for flooded roads or NFDY staffing for water rescues of residents from flooded buildings or streets
APPENDIX 4 - PROJECT BENEFITS CATEGORIES
93 Reduced life cycle costs may be applicable to some measures that provide extreme heat benefits such as green roofs that can last longer than a standard roof if properly maintained
94 Reduced utility service costs may be applicable to some measures that provide extreme heat benefits such as cool roofs green roofs and shade trees
95 FEMA per capita standard values taken from FEMA BCA Toolkit Version 530 (Build Date 12222016) and developed in FEMArsquos Baseline Standard Economic Value Methodology Report (July 28 2016) Consider updating FEMA standard per capita values to reflect current New York City utility rates
96 Consider updating FEMA and GSA standard values to reflect current New York City area labor rates and fuel costs
NYC Mayorrsquos Office of Recovery and Resiliency Climate Resiliency Design Guidelines
43APPENDIX 4 - PROJECT BENEFITS CATEGORIES
Table 14 ndash Other potential benefits for (1) sea level rise with coastal storm surge and (2) increased precipitation measures
Other Benefit Basic Guidance for Estimating Values
Avoided Stress and Anxiety
bull Applicable only for projects that directly benefit occupants of residential structuresbull Use FEMA standard value for avoided mental stress and anxiety treatment costs of $2443person to
estimate benefit for all impacted residents97
Avoided Lost Productivity
bull Applicable only for projects that directly benefit occupants of residential structuresbull Use FEMA standard value for avoided lost worker productivity costs of $8736household to estimate
benefit for all impacted workers (conservatively assuming one worker per household)
Environmental Open Space
bull Applicable only for projects that create or acquire open space areas by acquisitionbull Use FEMA standard value for environmental open space based on the type of land acquired ($8308
Acreyear for Green open space $39545Acreyear for Riparian $6010Acreyear for Wetlands $554Acreyear for Forests $1799Year for Marine and estuary)97
CSO Volume Reduction
bull Applicable only for projects that provide Combined Sewer Overflow (CSO) abatement by reducing the volume of rainfall runoff
bull Use CSO abatement cost of $0015gallonsyear applied to increased precipitation hazard runoff volume for 5-year design storm98
Ecosystem Service99
bull Add stormwater management benefits of green infrastructure projects to increased precipitation hazards where avoided damages and service losses are not quantified
bull Unit benefits applicable to increased precipitation hazard includeo Green roofs $0133SFyear (PUL 40 years)o BioswaleRain GardenMeadow Mix $0020SFyear (PUL 30 years)o Permeable Grass Pavers $0020SFyear (PUL 30 years)o Tree Plantings $303Treeyear (PUL 30 years)o Planter Box Trees $101Treeyear (PUL 15 years)
Real Estate99
bull Potential real estate benefits from increased resilience of residential andor commercial propertiesstreetscapesneighborhoods included within the project scope
bull Benefit applied to extreme heat hazard for green infrastructure projects directly impacting residential or commercial properties
Quality of Life Health Benefits99
bull Potential quality of life benefits related to improved public health from the resilience measures included within the project scope
bull Benefit applied to extreme heat hazard for green infrastructure projects directly impacting residential or commercial properties
Table 14 lists other typical benefits for reducing impacts from climate stressors and basic guidance for how to estimate them See Section IIID for more information
97 FEMA standard values for avoided mental stress and anxiety and environmental open space values taken from FEMA BCA Toolkit Version 530 (Build Date 12222016)
98 CSO abatement cost taken from APG1 Report for NYC ldquoTechnical Approaches for Benefit-Cost Analysis of Hazard Mitigation Projects in Urban and Coastal Environmentsrdquo (April 2016)
99 Ecosystem Services Real Estate and Quality of LifeHealth benefits tend to be more applicable to green infrastructure measures that provide extreme heat benefits such as green roofs trees and other plantings
NYC Mayorrsquos Office of Recovery and Resiliency Climate Resiliency Design Guidelines
44APPENDIX 4 - PROJECT BENEFITS CATEGORIES
Table 15 ndash Potential benefits for extreme heat (Urban Heat Island) reduction measures
Category Benefit Basic Guidance for Estimating Values
Direct Benefit
Reduced Life Cycle Cost
bull Applicable only to measures such as green roofs that are expected to last longer than standard roofs
bull Compute total cost savings including annual OampM costs
Indirect Benefit
Energy Savings
bull Applicable to measures that reduce energy costs by providing cooling through increased shading andor evapotranspiration
bull Use New York Power Authority rates of $0148kWh for electricity and $0810Therm for natural gas
Other Potential Benefits
Air Quality bull Applicable to measures that absorb pollutants andor reduce carbon dioxide emissions
Acoustics bull Applicable to measures such as green roof or walls that reduce noise transfer
Quality of LifeHealth bull Potential quality of life benefits and related to improved public health
Real Estate bull Applicable to measures that provide residential real estate benefits from increased resilience of propertiesstreetscapesneighborhoods
Retail Sales Marketing
bull Applicable to measures that provide commercial property benefits from increased aesthetics resulting in increased marketing and sales for streetscapesneighborhoods
Tax Credits Incentives
bull Applicable to resilience or green infrastructure measures such as green roofs that have accompanying Federal State or City tax credits or other incentives
Table 15 lists potential benefits for reducing impacts from heat and basic guidance for how to estimate them See Section IIID for more information
NYC Mayorrsquos Office of Recovery and Resiliency Climate Resiliency Design Guidelines
45APPENDIX 4 - PROJECT BENEFITS CATEGORIES
Table 16 ndash Guidance on quantitative calculations for (1) sea level rise with coastal storm surge and (2) increased precipitation measures
Data Input General Guidance ndash Basic Description
Applicable Benefit Category
Applicable Typical Facility Typology
Dire
ct B
enefi
ts
Indi
rect
Ben
efits
Oth
er P
oten
tial
Ben
efits
Bui
ldin
g St
ruct
ures
Com
plex
Fa
cilit
ies
Tran
spor
tatio
nSt
reet
scap
es
Plaz
as
Park
Fea
ture
s
First Floor Elevation (FFE)
bull The elevation of the first finished floor of the structure excluding basements
bull FFE measured from top of lowest floor (riverinenon-coastal high hazard areas) or bottom of lowest horizontal structural member (coastal high hazard areas)
Y Y Y Y
Building Replacement Value (BRV)
bull The unit cost to rebuild a structure of the same quality of construction
bull Not the same as market value
Y Y Y Y
Building Size
bull The total floor area of the building in square feet
bull Total Building Value = BRV x Building Sizebull Typical BRVs for NYC range between $100 to
$325SF for residential buildings and $120 to $450SF for commercialpublic buildings
Y Y Y Y
Structure Description
bull The type of building number of stories and foundation type (full basement partial basement no basement)
bull Collect more detailed foundation data for coastal flood zones
Y Y Y Y
Building Use bull Details related to residential housing commercial business and public use
Y Y Y Y Y
Building Type bull The primary use of building ndash residential commercial public and others
Y Y Y Y Y
Depth Damage Function (DDF)
bull Curves used to estimate structure damage contents damage and displacement of residential buildings based on flood depth
bull DDFs selection based on Structure Description Building Type Building Use
bull Structure DDFs based on percentage of Total Building Value
bull Contents DDFs based on percentage of Total Contents Value
bull Displacement DDFs based on number of displacement days x Displacement Cost
Y Y Y Y Y
Contents Value
bull The cost to replace structure contents (furnishings equipment)
bull Residential building Contents Values typically 50 BRV (FEMA DDFs) or 100 BRV (USACE DDFs)
bull Non-residential building Contents Values between 18 to over 100 depending on building use (USACE DDFs)
bull Total Contents Value = BRV x Building Size
Y Y Y Y Y
Table 16 provides general guidance on how to quantitatively calculate benefits from efforts to address from climate stressors See Section IIIE for more information
NYC Mayorrsquos Office of Recovery and Resiliency Climate Resiliency Design Guidelines
46APPENDIX 4 - PROJECT BENEFITS CATEGORIES
Table 16 ndash Guidance on quantitative calculations for (1) sea level rise with coastal storm surge and (2) increased precipitation measures
Data Input General Guidance ndash Basic Description
Applicable Benefit Category
Applicable Typical Facility Typology
Dire
ct B
enefi
ts
Indi
rect
Ben
efits
Oth
er P
oten
tial
Ben
efits
Bui
ldin
g St
ruct
ures
Com
plex
Fa
cilit
ies
Tran
spor
tatio
nSt
reet
scap
es
Plaz
as
Park
Fea
ture
s
Number of Residents (Residential)
bull Total number of occupants in a residential building
bull Typically estimated based on number of residential units x average number of individuals per household (based on current US Census data or use 25 individuals per household as a default)
Y Y Y Y Y
Displacement Cost (Residential)
bull The unit cost to lodge and feed displaced residents while flood damage is repaired
bull Average unit displacement cost of $415residential unitday recommended based on current FY2018 GSA Per Diem rates for New York City
Y Y Y Y Y
Value of Service (Non-Residential and Public)
bull The unit cost of service disruption and rental of temporary facilities while flood damage is repaired
bull Disruption costs for non-residential buildings typically range from $095 to $136SFmonth and rental costs range from $020 to $136SFmonth depending on building use
bull Value of service for public buildings ($day) is typically based on the annual operating budget for the City agency using the building prorated based on building size or population served by the building then divided by 365 daysyear
Y Y Y Y
Value of Service (Critical Facilities)
bull The unit cost of critical facilities (police fire emergency medical services) lost or delayed while flood damage is repaired
Y Y Y
Value of Service Duration
bull The duration of service disruption and rental of temporary facilities for non-residential buildings and critical facilities while flood damage is repaired
bull For non-residential buildingso Value of Service Durations vary from
4 months to over 30 months based on building use and the depth of flooding
o Total Value of Service Loss = (Disruption Cost x Building Area) = (Rental Cost x Building Area x Value of Service Duration)
bull For public buildings and critical facilitieso Value of Service Durations vary from 0
days to 720 months based on building use and the depth of flooding from FEMA FIA or USACE DDFs
o Total Value of Service Loss = (Value of Service) x (Service Loss Duration)
Y Y Y
NYC Mayorrsquos Office of Recovery and Resiliency Climate Resiliency Design Guidelines
47APPENDIX 4 - PROJECT BENEFITS CATEGORIES
Table 16 ndash Guidance on quantitative calculations for (1) sea level rise with coastal storm surge and (2) increased precipitation measures
Data Input General Guidance ndash Basic Description
Applicable Benefit Category
Applicable Typical Facility Typology
Dire
ct B
enefi
ts
Indi
rect
Ben
efits
Oth
er P
oten
tial
Ben
efits
Bui
ldin
g St
ruct
ures
Com
plex
Fa
cilit
ies
Tran
spor
tatio
nSt
reet
scap
es
Plaz
as
Park
Fea
ture
s
Engineering Estimates for Damages
bull Engineered estimate models of physical damages and service losses at the project site based on the Guidelines event recurrence interval(s) and flood depth(s)
Y Y Y Y Y Y
Historic Damages and Service Losses
bull Historic physical damages and service losses at the project site documented from previous flood events
bull Do not use routine maintenancebull The historic damage event recurrence interval
(RIs) andor flood depths must be determined updated for inflation to the present value and adjusted to match the Guidelines event RIsflood depths
Y Y Y Y Y Y
Facility Replacement Value
bull The unit cost to rebuild the facility
Impacted Area bull The geographic area impacted by the facility in the event of failure in acres
Y Y Y Y
Facility Capacity
bull The design capacity of the facilitybull For example - facility capacity expressed in
millions of gallons per day (MGD) for water and wastewater facilities or megawatts (MW) for electrical facilities
Y Y Y Y
Service Population
bull The number of impacted residents served by the facility
bull Typically estimated based on number of impacted residential customers x average number of individuals per household (based on current US Census data or use 25 individuals per household as a default)
bull Facilities serving mostly non-residentialpublic buildings andor critical facilities should focus on service losses rather than service population
Y Y Y
NYC Mayorrsquos Office of Recovery and Resiliency Climate Resiliency Design Guidelines
48APPENDIX 4 - PROJECT BENEFITS CATEGORIES
Table 16 ndash Guidance on quantitative calculations for (1) sea level rise with coastal storm surge and (2) increased precipitation measures
Data Input General Guidance ndash Basic Description
Applicable Benefit Category
Applicable Typical Facility Typology
Dire
ct B
enefi
ts
Indi
rect
Ben
efits
Oth
er P
oten
tial
Ben
efits
Bui
ldin
g St
ruct
ures
Com
plex
Fa
cilit
ies
Tran
spor
tatio
nSt
reet
scap
es
Plaz
as
Park
Fea
ture
s
Value of Service
bull Unit value of service provided by the facilitybull Example of FEMA standard values for complete
loss of utility service $105personday for potable water$49personday for wastewater$148personday for electrical
bull Consider updating FEMA standard per capita values to reflect current The New York City utility rates
Y Y
Roadway Elevations bull Roadway Elevations
Y Y
Roadway Replacement Value
bull Roadway Replacement ValueY Y
Inundation Area Map
bull Inundation Area Map developed by FEMA or through modeling by project design team
Y Y Y
Building Inventory of Inundation Area
bull The number and type of buildings within the streetscape and neighborhood inundated by the Guidelinersquos flood events
Y Y Y
Average Daily Traffic (ADT)
bull The average number of one-way traffic trips per day along the roadway(s) within the streetscapeneighborhood inundated by the Guidelinersquos flood events
Y Y
Additional Travel Time
bull The additional travel time needed to detour around a flooded roadway expressed in minutes
bull In the unlikely event there is no detour available use a 12-hour travel time per one-way trap but provide a detailed area street map as supporting documentation
Y Y
Value of Traffic Delay
bull The value of service associated with lost time in traffic
bull For example - FEMA standard average value of $3344vehiclehour of delay
bull Consider updating FEMA and GSA standard values to reflect current New York City area labor rates and fuel costs
Y Y
NYC Mayorrsquos Office of Recovery and Resiliency Climate Resiliency Design Guidelines
49APPENDIX 4 - PROJECT BENEFITS CATEGORIES
Table 17 ndash Guidance on quantitative unit benefit calculations for extreme heat hazard measures
Measure General Guidance ndash Unit Benefit Information and Data Requirements
Applicable Benefit Category
Applicable Typical Facility Typology
Dire
ct B
enefi
ts
Indi
rect
Ben
efits
Oth
er P
oten
tial
Ben
efits
Bui
ldin
g St
ruct
ures
Com
plex
Fa
cilit
ies
Tran
spor
tatio
nSt
reet
scap
es
Plaz
as
Park
Fea
ture
s
Green Roof
bull Unit benefit range over PUL = $470SF to $373SF of green roof area ($719SF standard value)
bull Assumed PUL = 40 yearsbull Apply standard value unit benefit to green
roof area to estimate measure benefitbull Higher range values more applicable
to residential and commercial building streetscape projects
Y Y Y Y Y Y
Bioswale Rain Garden Meadow Mix
bull Unit benefit range over PUL = $396SF to $211SF of area ($730SF standard value)
bull Assumed PUL = 30 yearsbull Apply standard value unit benefit to bioswale
rain gardenmeadow mix area to estimate total measure benefit
Y Y Y Y Y Y
Cool Roof
bull Unit benefit range over PUL = $117 to $3151SF of material area ($144SF standard value)
bull Assumed PUL = 20 yearsbull Apply standard value unit benefit to cool roof
area to estimate total measure benefitbull Higher range values more applicable to
residential building streetscape projects
Y Y Y Y Y
Light-Colored PaversLight-Colored Materials
bull Unit benefit range over PUL = $0774 to $204SF of material area ($0866SF standard value)
bull Assumed PUL = 30 yearsbull Apply standard value unit benefit to material
area to estimate total measure benefit
Y Y Y Y
Table 17 provides general guidance on how to quantitatively calculate benefits from efforts to address climate stressors See Section IIIE for more information
NYC Mayorrsquos Office of Recovery and Resiliency Climate Resiliency Design Guidelines
50APPENDIX 4 - PROJECT BENEFITS CATEGORIES
Table 17 ndash Guidance on quantitative unit benefit calculations for extreme heat hazard measures
Measure General Guidance ndash Unit Benefit Information and Data Requirements
Applicable Benefit Category
Applicable Typical Facility Typology
Dire
ct B
enefi
ts
Indi
rect
Ben
efits
Oth
er P
oten
tial
Ben
efits
Bui
ldin
g St
ruct
ures
Com
plex
Fa
cilit
ies
Tran
spor
tatio
nSt
reet
scap
es
Plaz
as
Park
Fea
ture
s
Tree Planting
bull Unit benefit range over PUL = $1005 to $77154Tree ($1855Tree standard value)
bull Assumed PUL = 30 yearsbull Apply standard value unit benefit to number of
trees to estimate total measure benefitbull Higher range values more applicable
to residential and commercial building streetscape projects
Y Y Y Y Y Y
Planter Box Tree
bull Unit benefit range over PUL = $212 to 16304Tree ($392Tree standard value)
bull Assumed PUL = 15 yearsbull Apply standard value unit benefit to number of
trees to estimate total measure benefitbull Higher range values more applicable
to residential and commercial building streetscape projects
Y Y Y Y Y
Shade Canopy
bull Unit benefit range over PUL = $0363 to $396SF ($0458SF standard value)
bull Assumed PUL = 15 yearsbull Apply standard value unit benefit to area of
shade canopy estimate total measure benefitbull Higher range values more applicable
to residential and commercial building streetscape projects
Y Y Y Y
Permeable Grass Pavers
bull Unit benefit range over PUL = $0258SF to $0521SF of pavers ($0363SF standard value)
bull Assumed PUL = 30 yearsbull Apply standard value unit benefit to paver
area to estimate total measure benefit
Y Y Y Y Y
For the purposes of the BCA refer to the following facility typologies bull ldquoBuilding Structuresrdquo include critical small building sites such as EMS or FDNY stations and non-critical small building sites such as
libraries or comfort stationsbull ldquoComplex Facilitiesrdquo include critical infrastructure such as wastewater treatment sites pump stations water filtration plants and similar
large or complex facilitiesbull ldquoTransportationStreetscapePlazasrdquo include roadway reconstruction streetscape improvements street raising plazas and other
transportation-related infrastructurebull ldquoPark Featuresrdquo include parks and similar public recreational facility with natural landscape features
NYC Mayorrsquos Office of Recovery and Resiliency Climate Resiliency Design Guidelines
51APPENDIX 5 - EXAMPLE PLANNING DECISION TREE
This decision tree provides a summarized example approach for how to implement these Guidelines Projects with a total cost greater than $50 million are recommended to conduct a full qualitative and quantitative climate change risk assessment and BCA while projects below $50 million are recommended to conduct a qualitative risk assessment and BCA
Define Project
1) Operational goals and criticality level2) Useful life3) Location in the current flood plain future floodplain and or zone
of tidal inundation and the project arearsquos score on the heat vulnerability index
Evaluate Project Risks According to Probability and Magnitude of Consequence
bull Extreme Heat bull Precipitationbull Sea Level Risebull Coastal Surge
High Level Identification and Assessment of Risk Mitigation Alternatives and Co-benefits
(qualitative)
Detailed Identification and Assessment of Risk Mitigation Alternatives and Co-benefits (qualitative and quantitative)
High Level Estimate of Costs and Benefits of Design Alternatives
(qualitative)
Detailed Estimate of Costs and Benefits of Design Alternatives
(qualitative and quantitative)
Decision Point Which climate change risks require mitigation
Decision Point Evaluate risk mitigation benefits and costs to
determine final resilient design alternative or if no action is required
Decision Point Is the total project cost above $50 million
Below $50 million Above $50 million
APPENDIX 5 - EXAMPLE PLANNING DECISION TREE
NYC Mayorrsquos Office of Recovery and Resiliency Climate Resiliency Design Guidelines
52
Project Title
Design Strategies Checklist (not exhaustive)
Extreme Heat Comments Extreme Precipitation Comments Sea Level Rise amp Storm Surge Comments
Select Site in Low Heat Vulnerability Index area Select High Elevation Site Select High Elevation Site
Minimize East-West Building Orientation Green Roof Raise Building Floor Elevation
Passive Solar Cooling and Ventilation Systems
Protect Below Grade Areas from Flooding Waterproof Building Envelope
Cool Roof (SRI appropriate) On-site Stormwater Management (gray) Elevate Critical Building Functions
Green Roof (extensive) Reduce Impervious Areas Elevate Critical Equipment
Vegetative Structures Permeable Pavement Perimeter Floodwall100 Levee (passive or active)
Enhanced HVAC System including space layout optimization and system scalability
Increase Green Spaces and Planted Areas DryWet Floodproofing
More Efficient Building Envelope Other Utility Redundancy Design101
Parking Lot Shading Resilient Materials amp Landscape Treatments
Light Colored Pavements (appropriate SRI) Design for Storm Surge Outflow
Increase Planted Areas Install Backwater Flow Prevention
Permeable Surfaces Design for Scour
Open-grid Pavement Raise Road Elevation
Other Other
This appendix provides a template for identifying possible design strategies to address climate change risks as described throughout the Guidelines
APPENDIX 6 - DESIGN STRATEGIES CHECKLIST
100 Permanent perimeter flood walls are not permitted to meet floodproofing requirements in buildings with substantial improvements andor damages 101 Utility redundancy design should be pursued for critical systems not all building systems
APPENDIX 6 - DESIGN STRATEGIES CHECKLIST
NYC Mayorrsquos Office of Recovery and Resiliency Climate Resiliency Design Guidelines
53APPENDIX 7 - CLIMATE CHANGE RISK ASSESSMENT RESOURCES
These Guidelines provide data on climate change hazards and recommend how that data can inform resilient design A risk assessment is a tool to help project managers and designers evaluate risk levels as well as select and prioritize resilient design strategies A high level risk assessment is recommended for all City capital projects with a total cost of under $50 million Projects above $50 million are recommended to conduct an in-depth assessment
Risk assessments use quantified estimates of the probability and magnitude of consequence of an event occurring to prioritize responses ldquoProbabilityrdquo is an assessment of the likelihood of a hazard occurring while ldquomagnituderdquo describes the hazardrsquos potential impact Risk assessment tools such as the examples listed below can be used to define and score these categories Projects that score higher across both probability and magnitude can be prioritized for investment and risk mitigation action Projects that score lower across both criteria may require no action beyond meeting code The results are typically charted on a risk matrix and an example is provided on the next page
The climate change risk management frameworks below offer templates for how to integrate climate change projections into a risk assessment process Refer to these resources for examples and further information
bull Vulnerability Assessment and Adaptation Framework is prepared by the Federal Highway Administration (FHWA) While developed for transportation planning this risk assessment framework has broad applicability for evaluating asset vulnerability to climate change Available at httpswwwfhwadotgovenvironmentsustainabilityresilienceadaptation_framework
bull US Climate Resilience Toolkit The US Global Change Research Program offers a step by step risk assessment
framework including tools and case studies at httpstoolkitclimategovsteps (see example on next page)
bull Coast Adapt Guidance on undertaking a risk assessment High level assessment httpscoastadaptcomausitesdefaultfilesfactsheetsT3M4_2_2nd_pass_risk_assessmentpdfDetailed assessment httpscoastadaptcomausitesdefaultfilesfactsheetsT3M4_3_3rd_pass_risk_assessmentpdf
bull Climate adaptation Risk uncertainty and decision-makingDownload the report here httpswwwukciporgukpublicationsRisk
The City plans to develop a NYC-specific process for integrating climate change data into existing risk management processes by April 2019
APPENDIX 7 - CLIMATE CHANGE RISK ASSESSMENT RESOURCES
NYC Mayorrsquos Office of Recovery and Resiliency Climate Resiliency Design Guidelines
54APPENDIX 7 - CLIMATE CHANGE RISK ASSESSMENT RESOURCES
The Risk Characterization Matrix below is an example from the US Climate Resilience Toolkit This tool can be used to assess the probability and magnitude of impact for identified risks The risk of coincident climate stressorsrisks (such as storm surge plus increased precipitation) can also be assessed as applicable
Figure 14 - Example of a climate change risk matrix (adapted from US Climate Resilience Toolkit)
Project teams can determine the magnitude of the impact (along the horizontal scale of 1 through 3 with 3 being the most severe) and the probabilitylikelihood of occurrence for each specific risk (along the vertical scale with 3 being the most likely) A score is typically assigned for each risk (Probabil-ity x Magnitude) and then charted on the matrix Based on the estimated probability and magnitude of consequence above the risks are ranked and prioritized for mitigation Factors to bear in mind include
bull Not all facility typologies have the same level of functional and operational importance during events or tolerance for disruption
bull Not all climate stressors and risks have the same level of impact on each project sitebull Not all identified risks can or should be mitigated fully
NYC Mayorrsquos Office of Recovery and Resiliency Climate Resiliency Design Guidelines
55WORKS CITED
A Stronger More Resilient New York PlaNYC Report of the NYC Special Initiative for Rebuilding and Resiliency The City of New York 2013
ldquoAccount for Climate Riskrdquo International Finance Corporation accessed March 27 2017 httpwwwifcorgwpswcmconnectTopics_Ext_ContentIFC_External_Corporate_SiteClimate+Business
PrioritiesAccount+for+Climate+Risk
American Society of Heating Refrigeration and Air-Conditioning Engineers (ASHRAE) Handbook -Fundamentals 2017
ldquoBaseline Standard Economic Value Methodology Reportrdquo Federal Emergency Management Agency July 2016
Benefit Cost Analysis Toolkit Software Version 530 Federal Emergency Management Agency (build date December 2016)
Criteria for Detention Facility Design New York City Department of Environmental Protection November 2012
Community Resilience Planning Guide for Buildings and Infrastructure Systems Vol 1 NIST Special Publication 1190 US Department of Commerce 2016
Cool and Green Roofing Manual NYC Department of Design and Construction 2007 httpwwwnycgovhtmlddcdownloadspdfcool_green_roof_manpdf
Building Resiliency Task Force US Urban Green Building Council New York 2013 httpurbangreencouncilforcecomBuildingResiliency
Design and Planning for Flood Resiliency Guidelines for NYC Parks New York City Department of Parks and Recreation 2017
httpswwwnycgovparksorgplanning-and-buildingplanningresiliency-plansflood-resiliency
Flooded Bus Barns and Buckled Rails Federal Transit Administration Office of Budget and Policy 2011 httpswwwhsdlorgabstractampdid=685187
Floodproofing Non-Residential Buildings FEMA P936 FEMA 2013 httpswwwfemagovmedia-library-data9a50c534fc5895799321dcdd4b6083e7P-936_8-20-13_508rpdf
ldquoGlossaryrdquo International Infrastructure Management Manual National Asset Management Support Group New Zealand 2011 httpwwwipweaorg
ldquoGreen Roof Metrics Draft Reportrdquo New York City Department of Parks and Recreation 2017
ldquoGuide to Rain Event Preparednessrdquo NYC Department of Environmental Protection httpwwwnycgovhtmldeppdfbrochuresflood-preparedness-flyerpdf
ldquoGuidelines and Discount Rates for Benefit-Cost Analysis of Federal Programsrdquo Appendix C Circular A-94 US Office of Management and Budget (OMB) 2017
ldquoGuidelines for the Design and Construction of Stormwater Management Systemsrdquo New York City Department of Environmental Protection July 2012
Horton R et al New York City Panel on Climate Change 2015 Report Ann NY Acad Sci ISSN 0077-892 New York 2015
Madrigano J et al ldquoA case-only study of vulnerability to heat wavendashrelated mortality in New York City (2000ndash2011)rdquo Environmental Health Perspectives 123672ndash678 2013
WORKS CITED
NYC Mayorrsquos Office of Recovery and Resiliency Climate Resiliency Design Guidelines
56WORKS CITED
enspMcGregor et al Two Degrees The Built Environment and Our Changing Climate Routledge Press 2013
NYC Green Codes Task Force US Green Building Council New York 2010 httpurbangreencouncilorgGreenCodes
NYCrsquos Risk Landscape A Guide to Hazard Mitigation NYC Emergency Management 2014
One New York The Plan for a Strong and Just City The City of New York 2015 httpwwwnycgovhtmlonenyc downloadspdfpublicationsOneNYCpdf
Ready to Respond Strategies for Multifamily Building Resilience Enterprise Green Communities 2015 httpswwwenterprisecommunityorgresources
Rosenzweig C et al Climate Change Adaptation in New York City Building a Risk Management Response New York City Panel on Climate Change 2010
httponlinelibrarywileycomdoi101111nyas20101196issue-1 issuetoc
ldquoSustainable Infrastructure Management Program Learning Environmentrdquo Water Environment Research Foundation accessed March 24 2017 httpsimplewerforg
Urban Waterfront Adaptive Strategies NYC Department of City Planning 2013 httpwww1nycgovsiteplanningplanssustainable-communitiesclimate-resiliencepagetab=1
Wastewater Resiliency Plan Climate Risk Assessment and Adaptation Study New York City Department of Environmental Protection October 2013
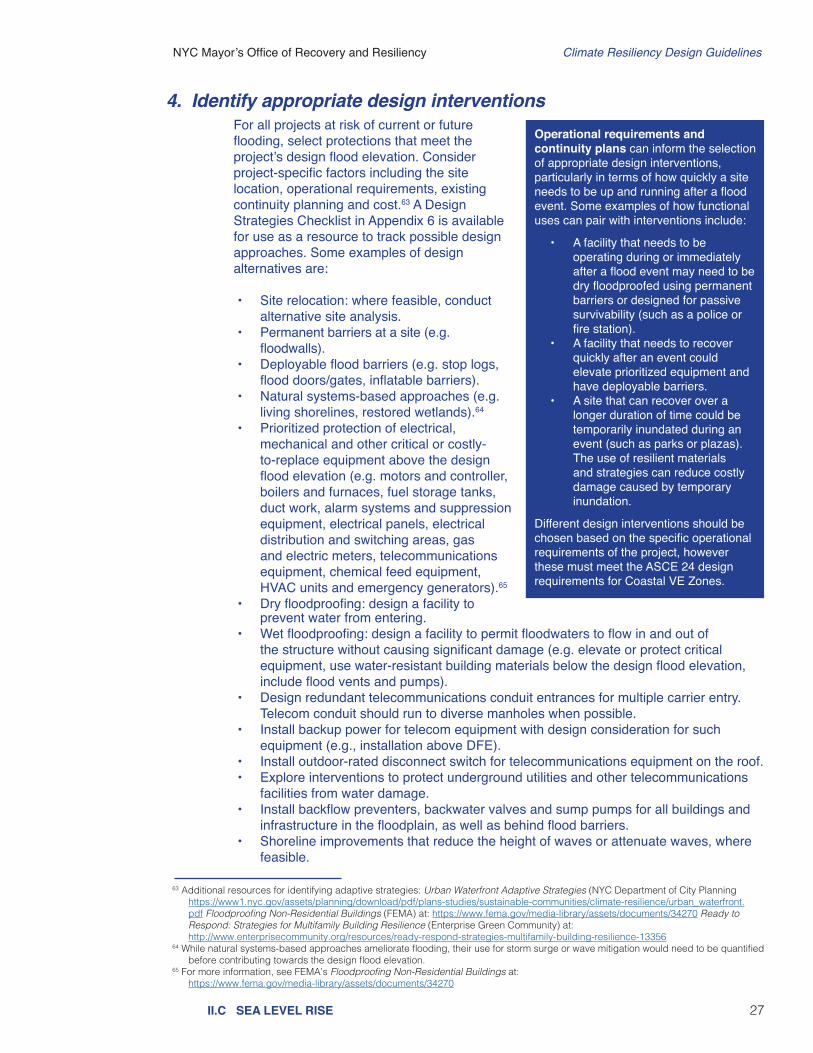
NYC Mayorrsquos Office of Recovery and Resiliency Climate Resiliency Design Guidelines
27IIC SEA LEVEL RISE
4 Identify appropriate design interventions
63 Additional resources for identifying adaptive strategies Urban Waterfront Adaptive Strategies (NYC Department of City Planning httpswww1nycgovassetsplanningdownloadpdfplans-studiessustainable-communitiesclimate-resilienceurban_waterfrontpdf Floodproofing Non-Residential Buildings (FEMA) at httpswwwfemagovmedia-libraryassetsdocuments34270 Ready to Respond Strategies for Multifamily Building Resilience (Enterprise Green Community) at
httpwwwenterprisecommunityorgresourcesready-respond-strategies-multifamily-building-resilience-1335664 While natural systems-based approaches ameliorate flooding their use for storm surge or wave mitigation would need to be quantified
before contributing towards the design flood elevation 65 For more information see FEMArsquos Floodproofing Non-Residential Buildings at httpswwwfemagovmedia-libraryassetsdocuments34270
Operational requirements and continuity plans can inform the selection of appropriate design interventions particularly in terms of how quickly a site needs to be up and running after a flood event Some examples of how functional uses can pair with interventions include
bull A facility that needs to be operating during or immediately after a flood event may need to be dry floodproofed using permanent barriers or designed for passive survivability (such as a police or fire station)
bull A facility that needs to recover quickly after an event could elevate prioritized equipment and have deployable barriers
bull A site that can recover over a longer duration of time could be temporarily inundated during an event (such as parks or plazas) The use of resilient materials and strategies can reduce costly damage caused by temporary inundation
Different design interventions should be chosen based on the specific operational requirements of the project however these must meet the ASCE 24 design requirements for Coastal VE Zones
For all projects at risk of current or future flooding select protections that meet the projectrsquos design flood elevation Consider project-specific factors including the site location operational requirements existing continuity planning and cost63 A Design Strategies Checklist in Appendix 6 is available for use as a resource to track possible design approaches Some examples of design alternatives are
bull Site relocation where feasible conduct alternative site analysis
bull Permanent barriers at a site (eg floodwalls)
bull Deployable flood barriers (eg stop logs flood doorsgates inflatable barriers)
bull Natural systems-based approaches (eg living shorelines restored wetlands)64
bull Prioritized protection of electrical mechanical and other critical or costly-to-replace equipment above the design flood elevation (eg motors and controller boilers and furnaces fuel storage tanks duct work alarm systems and suppression equipment electrical panels electrical distribution and switching areas gas and electric meters telecommunications equipment chemical feed equipment HVAC units and emergency generators)65
bull Dry floodproofing design a facility to prevent water from entering
bull Wet floodproofing design a facility to permit floodwaters to flow in and out of the structure without causing significant damage (eg elevate or protect critical equipment use water-resistant building materials below the design flood elevation include flood vents and pumps)
bull Design redundant telecommunications conduit entrances for multiple carrier entry Telecom conduit should run to diverse manholes when possible
bull Install backup power for telecom equipment with design consideration for such equipment (eg installation above DFE)
bull Install outdoor-rated disconnect switch for telecommunications equipment on the roofbull Explore interventions to protect underground utilities and other telecommunications
facilities from water damagebull Install backflow preventers backwater valves and sump pumps for all buildings and
infrastructure in the floodplain as well as behind flood barriersbull Shoreline improvements that reduce the height of waves or attenuate waves where
feasible
NYC Mayorrsquos Office of Recovery and Resiliency Climate Resiliency Design Guidelines
28IIIA GENERAL METHODOLOGY TO ESTIMATE PROJECT BENEFITSIIIB CATEGORIES OF PROJECT BENEFITS
Designing and constructing facilities to handle the future climate loads above the current NYC codes and standards based on projected useful life of the components provides resiliency benefits The incremental costs to implement the Guidelinesrsquo recommended design interventions should be compared with the incremental benefits to aid agencies in making decisions about resilient design strategies The project design team should evaluate benefits of the interventions designed to meet Guidelinesrsquo recommended criteria for all the climate stressors qualitatively andor quantitatively For projects with construction costs below $50 million the project design team is recommended to perform a qualitative benefits assessment on the interventions that meet the Guidelinesrsquo recommendations for all applicable climate stressors For critical facilities or projects with construction costs over $50 million the project design team is recommended to perform quantitative benefit calculations to identify the optimal interventions that meet Guidelinesrsquo recommended design criteria
A GENERAL METHODOLOGY TO ESTIMATE PROJECT BENEFITSThis general methodology to perform qualitative and quantitative benefit calculations is recommended for use by project design teams at the beginning of and during the design process This methodology enables estimation of project benefits for a high-level benefit-cost analysis (BCA) that can be applied to evaluate and compare resiliency features designed to address sea level rise with coastal storm surge increased precipitation and extreme heat events The type of benefits provided by interventions designed to meet the Guidelinesrsquo design criteria can vary by climate stressors and typology of the facilities The main guiding principle in development of the high-level BCA methodologies included in these Guidelines was to balance simplicity with accuracy The project benefits categories identified within the methodology may not cover all the potential benefits provided by every facility type within NYC In particular the benefits of planning for increased precipitation are difficult to quantify Hence the project design team should use their discretion to modify this general benefit calculation methodology as needed to meet their project goals and objectives The project design team should develop appropriate input data whether quantitative or qualitative needed to estimate project benefits
B CATEGORIES OF PROJECT BENEFITSThere are three types of project benefit categories - direct benefits indirect benefits and other benefits - that can be used to perform qualitative assessments and develop quantitative estimates of monetary benefits for intervention alternatives designed to meet the Guidelinesrsquo recommendations These project benefit categories will help to perform a high-level benefit-cost analysis that balances accuracy with an appropriate level of effort
bull Direct Benefits include reduced or avoided physical damages to facilities and contents reduced or avoided displacements for residential structures and reduced life cycle or OampM costs that can be quantified as a primary result of implementing a specific hazard mitigation measure Table 12 in Appendix 4 provides a list of direct benefits and basic guidance on estimating and documenting values for sea level rise and increased precipitation-related flood hazards Note that given the current state of practice it is not possible to quantify reduced or avoided physical damages or residential displacements that result from a specific extreme heat mitigation measures Therefore direct benefits applicable to extreme heat hazards are limited to reduced life cycle costs applicable to certain measures such as green roofs Refer to Table 15 for details on direct benefits for extreme heat hazards
III EVALUATION OF PROJECT BENEFITS
NYC Mayorrsquos Office of Recovery and Resiliency Climate Resiliency Design Guidelines
29IIIB CATEGORIES OF PROJECT BENEFITS
bull Indirect Benefits include reduced or avoided service losses for non-residential
buildings public facilities andor infrastructure (utilities roads and bridges) based on the value of service continuity andor emergency services to New Yorkers that can be quantified as a secondary result of implementing a specific hazard mitigation measure Table 13 in Appendix 4 provides a list of indirect benefits and basic guidance on estimating and documenting values for sea level rise and increased precipitation-related flood hazards Note that given the current state of practice on extreme heat it is not possible to quantify reduced or avoided service losses that result from a specific extreme heat mitigation measures Therefore indirect benefits applicable to extreme heat hazards are limited to reduced energy costs such as cool roofs green roofs or shade trees Refer to Table 15 in Appendix 4 for details on indirect benefits for extreme heat hazards
bull Other Benefits where applicable other potential benefits may include social benefits for residents such as avoided stress and anxiety avoided lost productivity environmentalecosystem service benefits avoided need for emergency services and other potential benefits that can be estimated as a result of implementing a specific hazard mitigation measure Table 14 in Appendix 4 provides a list of other potential benefits and basic guidance on estimating and documenting values for sea level rise and increased precipitation-related flood hazards
Note on the ecosystem service benefit category in Table 14 the stormwater management benefits of green infrastructure should be distributed between the extreme heat and increased precipitation hazards since these measures provide both significant reductions in rainfall runoff as well as Urban Heat Island mitigation through evapotranspiration However there is currently limited data available to quantify the actual distribution of stormwater management benefits between the two hazards For various dual-benefit providing interventions careful considerations should be given to identify the appropriate benefits category provided by the intervention with a goal to avoid duplication of quantified benefits In this methodology the stormwater management benefits of green infrastructure are applied to the increased precipitation hazard in order to avoid a duplication of benefits Note on real estate and quality of life benefits additionally it is important to note that two potential benefit categories shown in Table 14 - real estate and quality of lifehealthavoided casualties - were not included in the current BCA methodology for sea level rise or increased precipitation hazards Although these categories could increase project benefits for sea level rise and increased precipitation hazards they were only applied to measures that address extreme heat hazards such as green roofs trees and other plantings Refer to Table 15 for a detailed summary of other benefit categories quantified as unit benefits for extreme heat hazards
NYC Mayorrsquos Office of Recovery and Resiliency Climate Resiliency Design Guidelines
30IIIC WHICH METHODOLOGY TO USEIIID BCA METHODOLOGY FOR PROJECTS UNDER $50 MILLION
D BCA methodology for projects under $50 millionThe project design team should develop design alternatives to meet the Guidelinesrsquo criteria which may be in excess of NYC code and standards requirements (baseline conditions) It is assumed that the project design team will develop alternatives to address each of the following applicable climate stressors - sea level risecoastal storm surge increased precipitation and extreme heat - separately Tables 12-15 in Appendix 4 provides a list of typical direct indirect and other benefits provided by various intervention typologies to reduce impacts from climate stressors During the qualitative assessment the project design team should consider that intervention strategies will have varying levels of reliability effectiveness benefits and cost implications during the qualitative assessment
The project design team is recommended to develop appropriate evaluation criteria and metrics for each of the applicable project benefit categories For each alternative the project design team could use either a scoring weighting ranking or other type of qualitative assessment framework to assess each applicable project benefit categories with the developed evaluation criteria and metrics Table 6 provides an example template to evaluate alternatives using a set of general evaluation criteria and metrics using a color-coded rating system (and see Table 7 for an example of how to complete the template) The project design team can utilize a similar template customized to their project goals and objectives This assessment allows agencies to screen the qualitative benefits for various alternatives that would then lead to development of final project components to match the available budget and goals of the project
Projects with total costs below $50 million recommended to conduct a qualitative assessment to identify the optimal interventions that meet Guidelinesrsquo design criteria using the ldquoD) BCA methodology for projects under $50 millionrdquo methodology below
C WHICH METHODOLOGY TO USEProjects with a total cost above $50 million or are highly complex or critical facilities recommended to conduct both a qualitative and quantitative benefit calculation to identify the optimal interventions that meet Guidelinersquos design criteria using the ldquoE) BCA methodology for projects above $50 millionrdquo below A quantitative BCA also must include qualitative factors
NYC Mayorrsquos Office of Recovery and Resiliency Climate Resiliency Design Guidelines
31IIID BCA METHODOLOGY FOR PROJECTS UNDER $50 MILLION
Qualitative Color Scale Green=Least resource intensive alternative Purple=most resource intensive yellow=medium level of resource intensity
Qualitative Evaluation Factors Description Relative Color Rating System
First CostsAdditional construction costs needed to incorporate Guidelinesrsquo recommended resilient design over the baseline project costs
Highest cost ($$$) rated as Purple whereas lowest cost ($) rated as Green
ConstructabilityEase of Implementation
Construction techniques and site conditions such as presence of major utilities conflicts and other conditions which dictate the level of constructability required for each alternative
Difficult to construct rated as Purple whereas easiest to construct rated as Green
Environmental ImpactsCo-BenefitsPermitting
Impacts to the built and natural environment such as circulation noise and hazardous waste plus the level of effort required for permitting (eg interventions in water require highest level of permitting requirement) from each alternative in addition to the baseline project condition
Highest environmental impacts and highest level of effort required for permitting rated as Purple whereas the least impact and level of effort rated as Green
Operation and Maintenance (OampM)
Level of effort of additional manpower and cost of OampM for the alternatives over the baseline project OampM requirements
Highest level of effort and cost for OampM rated as Purple whereas the lowest is rated as Green
Reliability and Durability
Interventions that do not require human involvement or a facilityrsquos ability to withstand all the forces during a storm event (eg permanent solutions with higher reliability than deployable solution)
Interventions requiring human involvement (active measures) rated as Purple whereas interventions with minimal or no human involvement (passive measures) rated as Green
Risk Reduction Benefits Monetary benefits provided by each intervention alternative in avoided damages over the baseline condition
Lowest potential monetary benefit rated as Purple whereas as highest potential monetary benefit rated as Green
Quality of Life BenefitsVisual Aesthetics
Benefits either to the community such as recreation or safety or serve the community during emergency situations
Lowest potential quality of life benefits rated as Purple whereas as highest potential benefits rated as Green
Table 6 ndash Evaluation matrix for comparison of mitigation alternatives across the useful life of a project
Project title_______________________________________________________________________________
Evaluation Criteria
Baseline Condition (Designed to NYC Building Code and
Standards)
Resilient Design Alternatives for Managing__________________
Alternative 1
Alternative 2
Alternative 3
First Costs
ConstructabilityEase of ImplementationEnvironmental ImpactsCo-BenefitsPermitting
Operation and Maintenance (OampM)
Reliability and Durability
Risk Reduction Benefits
Quality of Life BenefitsVisual Aesthetics
NYC Mayorrsquos Office of Recovery and Resiliency Climate Resiliency Design Guidelines
32IIID BCA METHODOLOGY FOR PROJECTS UNDER $50 MILLION
Table 7 ndash Evaluation matrix for comparison of mitigation alternatives across the useful life of a project - COMPLETED EXAMPLE
Evaluation Criteria
Baseline Condition (Designed to NYC Building Code and
Standards)
Resilient Design Alternatives for Managing Coastal SurgeSLR
Alternative 1Flood proof building built on grade to Guidelines
DFE
Alternative 2 Elevate building structure above Guidelinesrsquo DFE
on columns
Alternative 3 Raise site grade by filing the building site footprint
to Guidelinesrsquo DFE
First CostsBaseline cost for building structure is $15 million
Incremental costs are within 5 over the baseline costs
Incremental costs are between 5-10 over baseline costs
Incremental costs are 20 and more over baseline costs
ConstructabilityEase of Implementation
Relatively easy to construct within site constraints
Similar to baseline conditions since construction requires additional flood proofing only
Moderate challenges to construct foundation structure for columns within site constraints
Extremely challenging to construct within the site constraints Potentially fatal flaw
Environmental ImpactsCo-BenefitsPermitting
No major impacts but may require additional effort to obtain DOB permits with flood proofing and deployable systems
No major impacts but may require additional effort to obtain DOB permits with flood proofing and deployable systems
No major impacts and relatively easy to permit
Potential drainage circulation impacts and challenges to obtain clean fill material for the site
Operation and Maintenance (OampM)
Major OampM costs associated with deployable systems
Major OampM costs associated with deployable systems
Moderate OampM costs associated with proposed elevator for access
Minimal OampM costs since deployable and elevators not required
Reliability and Durability
Least reliability with highest potential risk from flooding during to failure of deployable systems
Least reliability with highest potential risk from flooding during to failure of deployable systems
Moderate reliability with potential risk from flooding limited to elevator shaft only
Highest reliability since deployable are not required to protect building from flooding
Risk Reduction Benefits
Maximum flood risk reduction benefits assuming deployable and flood proofing is effective
Maximum flood risk reduction benefits assuming deployable and flood proofing is effective
Maximum flood risk reduction benefits
Maximum flood risk reduction benefits
Quality of Life BenefitsVisual Aesthetics
Facility may not be operational during the storm event
Facility may not be operational during the storm event
Facility can be potentially operational during the storm event
Facility can be potentially operational during the storm event
Qualitative Color Scale Green=Least resource intensive alternative Purple=most resource intensive yellow=medium level of resource intensity
A new non-critical facility with a building structure is proposed on a site that is currently in the 2015 Preliminary FEMA 1 annual chance floodplain with a BFE of 10rsquo (NAVD 88) The baseline conditions DFE to meet existing NYC codes and standards is 11rsquo (NAVD 88) Using the Guidelines recommended design criteria the facilityrsquos DFE is 133rsquo (NAVD 88) and existing grade is around 6rsquo (NAVD 88) The project design team develops three alternatives to meet the Guidelinesrsquo recommended DFE design for the facility Table 7 offers an example of how a qualitative assessment can be used to compare three resilient design alternatives using the evaluation criteria and metrics
CASE STUDY Example of How to Use the Evaluation Matrix
NYC Mayorrsquos Office of Recovery and Resiliency Climate Resiliency Design Guidelines
33IIIE BCA METHODOLOGY FOR PROJECTS OVER $50 MILLION
E BCA methodology for projects over $50 millionIn order for a project to be considered cost-effective a benefit-cost analysis (BCA) assesses if the benefits of a project outweigh its costs or in other words the benefit-cost ratio (BCR) is greater than 10 as illustrated in Equation 1
Equation 1 Benefit-Cost Ratio Formula
BCR =
Where BCR = Benefit-Cost Ratio
BENEFITS = Total project benefits
COSTS = Total project costs
BENEFITSCOSTS
These estimated project benefits are combined with the project costs which are defined as the differential construction and long-term operation and maintenance costs associated with constructing a proposed project to the Guidelinesrsquo recommended design level It is assumed that the baseline project will be designed to the most prevalent NYC codes and standards This benefit methodology should be used to determine the additional project benefit that the Guidelinesrsquo recommended design would provide over the baseline project benefit It is assumed that the project design team will develop alternatives to address each of the following applicable climate stressors - sea level risecoastal storm surge increased precipitation and extreme heat - separately For each alternative the project design team should use the following steps to determine the Benefit-Cost Ratio (BCR)
a) Determine project useful life for design interventions Determining the useful life of the proposed project is an important first step in the
detailed BCA assessment methodologies for two reasons First the project useful life determines what values must be used from the Guidelines to establish the future climate design conditions The various hazard tables in the Guidelines establish design requirements based on useful life ranges through 2039 2040-2069 2070-2099 and 2100+ (2100+ projections are only available for sea level rise) A review of these tables show that the design requirements needed to meet the projected climate hazards increase as the end of useful life range increases Second the useful life determines how long the project will need to be operated and maintained in order to remain technically sound and effective at reducing future damages and losses
b) Determine discount rate for project benefits calculation The cost-effectiveness of projects assessed using the BCR must be done on a net
present value basis meaning the present value of the benefits is compared to the present value of the costs Most project costs are computed for present value based on current cost estimates bids or cost guidance However project benefits - as well as project costs for operation and maintenance - accrue over time into the future and are computed on an annualized basis To address this issue the Present Value Coefficient (PVC) is used to bring these annualized project benefits and OampM costs into the present value As indicated by the formula in Equation 2 the PVC is a function of the Project Useful Life (PUL) and the Discount Rate (DR)
NYC Mayorrsquos Office of Recovery and Resiliency Climate Resiliency Design Guidelines
34
Equation 2 Present Value Coefficient (PVC) Formula
PVC =
Where PVC = Present Value Coefficient
PUL = BCA Project Useful Life based on project type
DR = Discount Rate
The project design team should coordinate with agencies and NYC OMB if needed to determine appropriate discount rates based on funding source project type and other factors This coordination should take place during project initiation phase where total project costs (design and construction) are over $50 million66
c) Develop input data to perform benefit calculations Tables 16 and 17 in Appendix 4 provide a list of typical input data by each climate
stressor needed to perform benefit analysis quantitatively on variety of facilities67 The project design team should use these tables as a reference to identify appropriate input data categories andor additional input data needed to perform benefit analysis on the project
d) Identify applicable project benefit categories to estimate benefits Tables 16 and 17 in Appendix 4 provide a list of typical project benefits by each climate
stressor needed to perform benefit analysis quantitatively on various types of projects The project design team should use these tables as a reference to identify appropriate project benefit categories for each climate stressor to perform benefit analysis on the project
e) Calculate benefits of recommended design interventions for each climate
stressor The input data and applicable project benefits can be assembled along with
incremental project cost data to analyze cost-effectiveness using the FEMA BCA Tool Damage-Frequency Assessment (DFA) module or similar software This analysis will provide a BCR for each alternative which can then be used to compare the alternatives that were developed to mitigate effects from applicable climate stressors The project design team can then use the results from this analysis to identify optimal interventions that provides a balanced solution that provides resiliency benefits within the available project budget
IIIE BCA METHODOLOGY FOR PROJECTS OVER $50 MILLION
[1 ndash (1 + DR) -(PUL)]DR
66 For example a NYC OMB March 2015 memorandum recommends using an annually updated DR as published each year in Appendix C of OMB Circular A-94 The current OMB-recommended discount rates from OMB A-94 Appendix C vary by project useful life and are as follows 21 DR for useful lives of 10 to 19 years 25 DR for useful lives of 20 to 29 years and 28 DR for useful lives of 30 years or greater By contrast FEMA hazard mitigation grants use a DR of 70 for all projects based on the Federal OMB A-94 rate for federally-funded mitigation measures Since these DRs will impact the PVC and the project benefits the project team must ensure that BCA results prepared using an OMB-recommended DR (21 to 28) be updated to reflect the Federal DR (70) when applying for FEMA mitigation grant funds
67 Note the data requirements for the sea level rise and increased precipitation hazards in Table 16 are more detailed than the requirements for the extreme heat hazards due to the less detailed level of analysis available for extreme heat
NYC Mayorrsquos Office of Recovery and Resiliency Climate Resiliency Design Guidelines
35
APPENDICES
NYC Mayorrsquos Office of Recovery and Resiliency Climate Resiliency Design Guidelines
36APPENDIX 1 ndash KEY TERMS
100-year flood (1 annual chance flood)
A flood that has a 1 probability of occurring in any given year The 100-year floodplain is the extent of the area of a flood that has a 1 chance of occurring or being exceeded in any given year
500-year flood (02 annual chance flood)
A flood that has a 02 probability of occurring in any given year The 500-year floodplain is the extent of the area of a flood that has a 02 chance of occurring or being exceeded in any given year
AdaptationAdjustment in natural or human systems to a new or changing environment that seeks to maximize beneficial opportunities or moderate negative effects Successful adaptations contribute to resiliency
Base flood elevation (BFE)The elevation of surface water resulting from a flood that has a 1 annual chance of occurring or being exceeded in any given year The BFE is shown on the Flood Insurance Rate Map (FIRM)69
BluebeltReference to the Department of Environmental Protectionrsquos (DEP) Bluebelt program to preserve natural drainage corridors including streams ponds and other wetland areas Preservation of these wetland systems allows them to perform their functions of conveying storing and filtering storm water
Climate
The average weather (or more rigorously a statistical description of the average in terms of the mean and variability) over a period of time usually 30 years These quantities are most often surface variables such as temperature precipitation and wind Climate in a wider sense is the state including a statistical description of the climate system70
Climate change
Changes in average weather conditions that persist over multiple decades or longer Climate change encompasses both increases and decreases in temperature as well as shifts in precipitation changing risk of certain types of severe weather events and changes to other variables of the climate system
Climate change riskThe chance that investments (such as in capital projects) can be affected by the physical impacts of climate change71 Risks are evaluated as a product of the probability of occurrence and the magnitude of damages or impacts including socioeconomic factors that would result if they did occur (consequences)
Climate change risk assessment
This assessment involves a detailed project-specific analysis that includes a vulnerability and risk assessment often followed by cost-benefit analysis to assess and select investments in climate change risk mitigation Risk is assessed as a function of the magnitude and probability of a given climate change hazard Examples resources are included in Appendix 7
Climate vulnerabilityThe degree to which systems and populations are affected by adverse impacts It is a function of the character magnitude and rate of climate change and variation to which a system is exposed its sensitivity and its adaptive capacity72
Cloudburst An extreme amount of rain in a short period of time often over a small geographic area73
Cooling Degree Day (CDD) A form of degree-day used to estimate the energy requirements for air conditioning or refrigeration when the daily mean temperature is above 65degF
68 All terms are from the US Global Change Research Program (USGCRP) glossary unless otherwise noted The USGCRP glossary is available at httpwwwglobalchangegovclimate-changeglossary
69 ldquoDefinitionsrdquo FEMA last modified March 1 2017 httpswwwfemagovnational-flood-insurance-programdefinitions70 UKCIP Glossary httpwwwukciporgukglossary71 ldquoAccount for Climate Riskrdquo International Finance Corporation 72 UKCIP Glossary httpwwwukciporgukglossary73 New York City Environmental Protection ldquoCloudburst Resiliency Planning Studyrdquo 2017 Available at httpwwwnycgovhtmldeppdfclimatenyc-cloudburst-studypdf
APPENDIX 1 - KEY TERMS68
NYC Mayorrsquos Office of Recovery and Resiliency Climate Resiliency Design Guidelines
37APPENDIX 1 ndash KEY TERMS
Design life The life expectancy of an asset or product as determined during design74 As opposed to useful life (see below)
Dry Bulb temperature The ambient air temperature measured by a thermometer
Extreme eventUnexpected unusual or unpredictable weather or flooding compared to historical or future projected distribution Extreme events include for example heat waves cold waves heavy rains periods of drought and flooding and severe storms
Facilities For the purposes of this document ldquofacilitiesrdquo refers to all types of buildings housing infrastructure structures and landscape features designed by or for the City of New York
Flexible adaptation pathwayResilience-building strategies that can evolve or be adapted over time as climate change risk assessments evaluations of adaptation strategies and monitoring continue75
Flood Insurance Rate Maps (FIRM)
Official flood map of a community on which FEMA has delineated the 1 annual chance floodplain and the base flood elevations (BFEs) applicable to the community76 The FIRM also includes the 02 floodplain annual chance floodplain and differentiates between special flood hazard areas (V A Coast A zones) and floodways The official FIRM is from the year 2007 while the 2015 PFIRM is currently required by NYC Building Code to calculate design flood elevations NYC DOB references the more restrictive of the two maps in both base flood elevation and flood hazard area (ie V versus A zone) Refer to Appendix 3 for more information
FreeboardAn additional amount of height above the base flood elevation used as a factor of safety (eg two feet above the base flood) in determining the level at which a facilitys lowest floor must be elevated or floodproofed to be in accordance with state or community floodplain management regulations77
Future time slices
Future periods defined by the NPCC for when climate change projections are available In this document the following decadal projections are associated with specific time spans2020s projection = present to 20392050s projection = 2040 to 20592080s projection = 2070 to 20992100s projection = end of century and beyond
Green infrastructureAn array of practices that use or mimic natural systems to manage urban stormwater runoff Water is either directed to engineered systems for infiltration or detained for longer periods before it enters the sewer system
Heat Vulnerability Index (HVI)Summarizes relative risk of adverse health effects from heat due to social and environmental factors Used to identify neighborhoods at higher risk during and after extreme heat events
Heat wave A period of three consecutive days where temperatures rise above 90degF or two consecutive days over 95 degrees78
New York City Panel on Climate Change (NPCC)
The body of leading climate and social scientists charged with making climate change projections for the metropolitan region79
74 Sustainable Infrastructure Management Program Learning Environment httpsimplewerforg 75 Rosenzweig C et al Climate Change Adaptation in New York City Building a Risk Management Response76 ldquoDefinitionsrdquo FEMA77 Ibid78 Horton R et al New York City Panel on Climate Change 2015 Report Chapter 1 Climate Observations and Projections Ann NY
Acad Sci ISSN 0077-8923 (New York 2015) 2579 For more information on the NPCC visit www1nycgovsiteorrchallengesnyc-panel-on-climate-changepage
NYC Mayorrsquos Office of Recovery and Resiliency Climate Resiliency Design Guidelines
38APPENDIX 1 ndash KEY TERMS
Open-grid pavement system
Pavements that consist of loose substrates supported by a grid of a more structurally sound grid or webbing Unbounded loose substrates in these systems transfer and store less heat than bound and compacted pavements and aid permeability Pavement is 50 pervious and contains vegetation in the open cells designed to allow percolation or infiltration of storm water through the surface into the soil below80
Preliminary Flood Insurance Rate Map (PFIRM)
Preliminary flood map developed by FEMA in 2015 for New York City that provides projected risks for flood hazards81 Refer to Appendix 3 for more information
Project useful life (PUL)
The period over which an asset or component is expected to be available for use by an entity This depends on regular and adequate maintenance This period of time typically exceeds the design life (see above) The combined effect of operational requirements and useful life is practical in assessing an investment in improving resilience82
Rain gardenAlso called ldquobioswalerdquo Planted areas designed to collect and manage stormwater that runs off streets sidewalks commercial and residential rooftops and other sources when it rains
Resiliency The ability to bounce back after change or adversity The capability of preparing for responding to and recovering from difficult conditions83
Sea level rise-adjusted design flood elevation
As defined in these Guidelines the increased height of the base flood elevation due to sea level rise plus freeboard depending on the criticality of the facility The sea level rise adjustment depends on the useful life of the facility
Storm surge An abnormal rise of water generated by a storm over and above predicted astronomical tides84
Substantial improvementAny repair reconstruction rehabilitation addition or improvement of a building or structure the cost which equals or exceeds 50 of the market value of the structure before the improvement or repairs started For more information see Appendix G of the NYC Building Code and 1 RCNY sect3606-0185
Tidal inundation Flooding which occurs at high tides due to climate-related sea level rise land subsidence andor the loss of natural barriers86
Urban Heat Island (UHI) effectThe tendency for higher air temperatures to persist in urban areas as a result of heat absorbed and emitted by buildings and asphalt tending to make cities warmer than the surrounding suburban and rural areas
Weather The state of the atmosphere at a given time with regard to temperature cloudiness precipitation wind and other meteorological conditions87
Wet Bulb temperatureThe temperature indicated when a thermometer bulb is covered with a water-saturated wick over which air is caused to flow at approximately 45 ms (900 ftmin) to reach the equilibrium temperature of water evaporating into the air when the heat of vaporization is supplied by the sensible heat of the air88
80 ldquoGlossaryrdquo US Green Building Council (2017) Available at httpwwwusgbcorgglossaryterm552581 ldquoPreliminary FEMA Map Productsrdquo FEMA Map Service Center Available at httpshazardsfemagovfemaportalprelimdownload82 ldquoGlossaryrdquo International Infrastructure Management Manual (2011) 83 A Stronger More Resilient New York (2013) 184 ldquoStorm Surge Overviewrdquo National Hurricane Center NOAA Available at httpswwwnhcnoaagovsurge85 ldquoFlood Resistant Constructionrdquo Appendix G New York City Building Code (2008) and 1 RCNY sect3606-01 available at httpswww1nycgovassetsbuildingsrules1_RCNY_3606-01pdf86 ldquoOcean Factsrdquo National Ocean Service NOAA Available at httpoceanservicenoaagovfactsnuisance-floodinghtml 87 UKCIP Glossary httpwwwukciporgukglossary88 ldquoASHRAE Terminologyrdquo ASHRAE Available at httpswwwashraeorgtechnical-resourcesauthoring-toolsterminology
NYC Mayorrsquos Office of Recovery and Resiliency Climate Resiliency Design Guidelines
39APPENDIX 2 - CLIMATE CHANGE PROJECTIONS
Climate change projections are provided by the New York City Panel on Climate Change (NPCC) The full NPCC report is available from the New York Academy of Sciences89 Tables 8-10 (below) were reproduced directly from the NPCC report while Table 2 (see Section IIA) was developed using the data underlying the NPCC report to inform the design of HVAC systems under warmer conditions
Table 8 ndash NYC sea level rise projections90
Baseline (2000-2004) 0 in
Low estimate (10th percentile)
Middle range (25th to 75th percentile)
High estimate (90th percentile)
2020s 2 in 4-8 in 10 in
2050s 8 in 11-21 in 30 in
2080s 13 in 18-39 in 58 in
2100 15 in 22-50 in 75 in
Note Projections are based on six-component approach that incorporates both local and global factors The model-based components are from 24 global climate models and two representative concentration pathways Projections are relative to the 2000-2004 base period
Table 9 ndash Mean annual changes91
a Temperature Baseline(1971-2000) 54degF
Low estimate (10th percentile)
Middle range (25th to 75th percentile)
High estimate (90th percentile)
2020s + 15degF +20-29degF +32degF
2050s +31degF +41-57degF +66degF
2080s +38degF +53-88degF +103degF
2100 +42degF +58-104degF +121F
b Precipitation Baseline(1971-2000) 501 in
Low estimate (10th percentile)
Middle range (25th to 75th percentile)
High estimate (90th percentile)
2020s -1 percent +1-8 +10
2050s +1 percent +4-11 +13
2080s +2 percent +5-13 +19
2100 -6 percent -1 to +19 +25
Note Based on 35 global climate models (GCMs) and two RCPs Baseline data cover the 1971ndash2000 base period and are from the NOAA National Climatic Data Center (NCDC) Shown are the low estimate (10th percentile) middle range (25th percentile to 75th percentile) and high estimate (90th percentile) These estimates are based on a ranking (from most to least) of the 70 (35 GCMs times 2 RCPs) projections The 90th percentile is defined as the value that 90 percent of the outcomes (or 63 of the 70 values) are the same or lower than Like all projections the NPCC climate change projections have uncertainty embedded within them Sources of uncertainty include data and modeling constraints the random nature of some parts of the climate system and limited understanding of some physical processes The NPCC characterizes levels of uncertainty using state-of-the-art climate models multiple scenarios of future greenhouse gas concentrations and recent peer-reviewed literature Even so the projections are not true probabilities and the potential for error should be acknowledged
89 The NPCC 2015 report is available at httponlinelibrarywileycomdoi101111nyas20151336issue-1issuetoc90 From New York City Panel on Climate Change 2015 Report Chapter 1 Climate Observations and Projections page 4191 From New York City Panel on Climate Change 2015 Report Chapter 1 Climate Observations and Projections page 30
APPENDIX 2 - CLIMATE CHANGE PROJECTIONS
NYC Mayorrsquos Office of Recovery and Resiliency Climate Resiliency Design Guidelines
40APPENDIX 2 - CLIMATE CHANGE PROJECTIONS
Table 10 ndash Extreme events92
2020s Baseline (1971-2000)
Low estimate(10th percentile)
Middle range(25th to 75th percentile)
High estimate (90th percentile)
Numbers of heat waves per year 2 3 3-4 4
Average heat wave duration (days) 4 5 5 5
Number of days per year with
Maximum temperature at or above 90degF 18 24 26-31 33
Maximum temperature at or above 100degF 04 07 1-2 2
Minimum temperature at or below 32degF 71 50 52-58 60
Rainfall at or above 1 inch 13 13 14-15 16
Rainfall at or above 2 inches 3 3 3-4 5
Rainfall at or above 4 inches 03 02 03ndash04 05
2050s Baseline (1971-2000)
Low estimate(10th percentile)
Middle range(25th to 75th percentile)
High estimate (90th percentile)
Numbers of heat waves per year 2 4 5-7 7
Average heat wave duration (days) 4 5 5-6 6
Number of days per year with
Maximum temperature at or above 90degF 18 32 39-52 57
Maximum temperature at or above 100degF 04 2 3-5 7
Minimum temperature at or below 32degF 71 37 42-48 52
Rainfall at or above 1 inch 13 13 14-16 17
Rainfall at or above 2 inches 3 3 4-4 5
Rainfall at or above 4 inches 03 03 03-04 05
2080s Baseline (1971-2000)
Low estimate(10th percentile)
Middle range(25th to 75th percentile)
High estimate (90th percentile)
Numbers of heat waves per year 2 5 6-9 9
Average heat wave duration (days) 4 5 5-7 8
Number of days per year with
Maximum temperature at or above 90degF 18 38 44-76 87
Maximum temperature at or above 100degF 04 2 4-14 20
Minimum temperature at or below 32degF 71 25 30-42 49
Rainfall at or above 1 inch 13 14 15-17 18
Rainfall at or above 2 inches 3 3 4-5 5
Rainfall at or above 4 inches 03 02 03-05 07
Note Projections for temperature and precipitation are based on 35 GCMs and 2 RCPs Baseline data are for the 1971 to 2000 base period and are from the NOAA National Climatic Data Center (NCDC) Shown are the low estimate (10th percentile) middle range (25th to 75th percentile) and high estimate (90th percentile) 30-year mean values from model-based outcomes Decimal places are shown for values less than one although this does not indicate higher precisioncertainty Heat waves are defined as three or more consecutive days with maximum temperatures at or above 90degF Like all projections the NPCC climate change projections have uncertainty embedded within them Sources of uncertainty include data and modeling constraints the random nature of some parts of the climate system and limited understanding of some physical processes The NPCC characterizes levels of uncertainty using state-of-the-art climate models multiple scenarios of future greenhouse gas concentrations and recent peer-reviewed literature Even so the projections are not true probabilities and the potential for error should be acknowledged
92 From New York City Panel on Climate Change 2015 Report Chapter 1 Climate Observations and Projections page 31
NYC Mayorrsquos Office of Recovery and Resiliency Climate Resiliency Design Guidelines
41APPENDIX 3 - DIFFERENTIATION OF FLOOD MAPS
These Guidelines reference several different kinds of flood maps and sources of design flood elevations These maps are described and differentiated below
Table 11 - Differentiation of flood maps used in NYC
Reference Title Data Source Information Provided Referenced By Link
2007 FIRM FEMA
Based on historical data from before 1983 identifies the current base flood (extent and elevation) as the flood that has a 1 chance of occurring in any given year also known as a 100-year flood The NYC Building Code requires that either the 2007 FIRM or 2015 PFIRM elevation be used whichever is higher
2014 NYC Building Code Appendix G
Climate Resiliency Design Guidelines
httpsmscfemagovportal
2015 PFIRM FEMA
Based on historical data identifies the current base flood (extents and elevation) as the flood that has a 1 chance of occurring in any given year also known as a 100-year flood The NYC Building Code requires that either the 2007 FIRM or 2015 PFIRM elevation be used whichever is higher The 2015 PFIRM is currently being reassessed by FEMA
2014 NYC Building Code Appendix G
Climate Resiliency Design Guidelines
httpshazardsfemagovfemaportalprelimdownload
httpwwwregion2coastalcomview-flood-maps-dataview-preliminary-flood-map-data
NYC Flood Hazard Mapper
NYC Department of City Planning
Maps current and future flood hazards in NYC including the following data layers 2007 FIRM and 2015 PFIRM high tide with sea level rise and PFIRM with sea level rise through 2100
Climate Resiliency Design Guidelines
Waterfront Revitalization Plan
httpwww1nycgovsiteplanningdata-mapsflood-hazard-mapperpage
ldquoTable 4 ndash Determine the sea level rise-adjusted design flood elevation for critical and non-critical facilitiesrdquo
ORR amp NPCC
Provides data to use when adding sea level rise to a given 2015 PFIRM or 2007 FIRM Base Flood Elevation (BFE) to calculate a Design Flood Elevation (DFE) Based on the criticality and expected useful life of a facility
Climate Resiliency Design Guidelines
See Section II on ldquoSea Level Riserdquo above
APPENDIX 3 - DIFFERENTIATION OF FLOOD MAPS
NYC Mayorrsquos Office of Recovery and Resiliency Climate Resiliency Design Guidelines
42APPENDIX 4 - PROJECT BENEFITS CATEGORIES
This appendix provides guidance on how to identify and assess benefits as a supplement to Sections IIID and IIIE
Table 12 lists typical direct benefits for reducing impacts from climate stressors and basic guidance for how to estimate them See Section IIID for more information
Table 13 lists typical indirect benefits for reducing impacts from climate stressors and basic guidance for how to estimate them See Section IIID for more information
Table 12 ndash Direct benefits for (1) sea level rise with coastal storm surge and (2) increased precipitation measures
Direct Benefit Basic Guidance for Estimating Values
Physical Damages (Structure Contents)
bull For flood-damaged buildings use depth damage functions developed by FEMA and USACE for structures and contents
bull Use depth damage functions in conjunction with Building Replacement Values (BRVs) and not market values BRVs typically range between $100 to $325SF for residential buildings and $120 to $450SF for commercial public buildings
bull For more complex structures or facilities use engineering estimates of flood damages or review historic flood damages documented from insurance claims repair records or FEMA Public Assistance claims from recent flood disasters
Residential Displacements
bull For flood-damaged buildings use depth damage functions developed by FEMA and USACE for residential displacements
Reduced Life CycleOperation and Maintenance (OampM) Costs93
bull Applicable only to projects that reduce overall life cycle costs or net annual OampM costs from baseline conditions
bull Input reduced annual OampM costs as a project benefit at a 1-year recurrence intervalbull Reduced overall life cycle costs can be input as a longer project useful life
Table 13 ndash Indirect benefits for (1) sea level rise with coastal storm surge and (2) increased precipitation measures
Indirect Benefit Basic Guidance for Estimating Values
Non-Residential Building Service Losses
bull Estimate service loss values and durations for non-residential buildings public buildings critical facilities and parksnatural features based on FEMA BCA guidance and standard values based on building use
Utility Service Losses94
bull Estimate utility service losses for water wastewater and electrical facilities based on the number of impacted customers FEMA per capita standard values for utility service ($105personday for potable water $49personday for wastewater $148personday for electrical)95
bull Estimate utility service loss durations based on engineering estimates or review historic flood damages losses documented from utility company records
bull This benefit can also apply to measures that increase energy efficiency
RoadBridge Service Losses
bull Estimate roadbridge service losses based on the average daily traffic (ADT) detour time and additional travel distance and FEMA and GSA standard values for road service ($3344vehiclehour of delay $0545mile)96
bull Estimate roadbridge service loss durations or review historic flood damages losses
Emergency Service Losses
bull Applicable only to projects that reduce or eliminate documented emergency service costs from baseline conditions
bull Examples of avoided emergency services costs include NYPD staffing to monitor barricades for flooded roads or NFDY staffing for water rescues of residents from flooded buildings or streets
APPENDIX 4 - PROJECT BENEFITS CATEGORIES
93 Reduced life cycle costs may be applicable to some measures that provide extreme heat benefits such as green roofs that can last longer than a standard roof if properly maintained
94 Reduced utility service costs may be applicable to some measures that provide extreme heat benefits such as cool roofs green roofs and shade trees
95 FEMA per capita standard values taken from FEMA BCA Toolkit Version 530 (Build Date 12222016) and developed in FEMArsquos Baseline Standard Economic Value Methodology Report (July 28 2016) Consider updating FEMA standard per capita values to reflect current New York City utility rates
96 Consider updating FEMA and GSA standard values to reflect current New York City area labor rates and fuel costs
NYC Mayorrsquos Office of Recovery and Resiliency Climate Resiliency Design Guidelines
43APPENDIX 4 - PROJECT BENEFITS CATEGORIES
Table 14 ndash Other potential benefits for (1) sea level rise with coastal storm surge and (2) increased precipitation measures
Other Benefit Basic Guidance for Estimating Values
Avoided Stress and Anxiety
bull Applicable only for projects that directly benefit occupants of residential structuresbull Use FEMA standard value for avoided mental stress and anxiety treatment costs of $2443person to
estimate benefit for all impacted residents97
Avoided Lost Productivity
bull Applicable only for projects that directly benefit occupants of residential structuresbull Use FEMA standard value for avoided lost worker productivity costs of $8736household to estimate
benefit for all impacted workers (conservatively assuming one worker per household)
Environmental Open Space
bull Applicable only for projects that create or acquire open space areas by acquisitionbull Use FEMA standard value for environmental open space based on the type of land acquired ($8308
Acreyear for Green open space $39545Acreyear for Riparian $6010Acreyear for Wetlands $554Acreyear for Forests $1799Year for Marine and estuary)97
CSO Volume Reduction
bull Applicable only for projects that provide Combined Sewer Overflow (CSO) abatement by reducing the volume of rainfall runoff
bull Use CSO abatement cost of $0015gallonsyear applied to increased precipitation hazard runoff volume for 5-year design storm98
Ecosystem Service99
bull Add stormwater management benefits of green infrastructure projects to increased precipitation hazards where avoided damages and service losses are not quantified
bull Unit benefits applicable to increased precipitation hazard includeo Green roofs $0133SFyear (PUL 40 years)o BioswaleRain GardenMeadow Mix $0020SFyear (PUL 30 years)o Permeable Grass Pavers $0020SFyear (PUL 30 years)o Tree Plantings $303Treeyear (PUL 30 years)o Planter Box Trees $101Treeyear (PUL 15 years)
Real Estate99
bull Potential real estate benefits from increased resilience of residential andor commercial propertiesstreetscapesneighborhoods included within the project scope
bull Benefit applied to extreme heat hazard for green infrastructure projects directly impacting residential or commercial properties
Quality of Life Health Benefits99
bull Potential quality of life benefits related to improved public health from the resilience measures included within the project scope
bull Benefit applied to extreme heat hazard for green infrastructure projects directly impacting residential or commercial properties
Table 14 lists other typical benefits for reducing impacts from climate stressors and basic guidance for how to estimate them See Section IIID for more information
97 FEMA standard values for avoided mental stress and anxiety and environmental open space values taken from FEMA BCA Toolkit Version 530 (Build Date 12222016)
98 CSO abatement cost taken from APG1 Report for NYC ldquoTechnical Approaches for Benefit-Cost Analysis of Hazard Mitigation Projects in Urban and Coastal Environmentsrdquo (April 2016)
99 Ecosystem Services Real Estate and Quality of LifeHealth benefits tend to be more applicable to green infrastructure measures that provide extreme heat benefits such as green roofs trees and other plantings
NYC Mayorrsquos Office of Recovery and Resiliency Climate Resiliency Design Guidelines
44APPENDIX 4 - PROJECT BENEFITS CATEGORIES
Table 15 ndash Potential benefits for extreme heat (Urban Heat Island) reduction measures
Category Benefit Basic Guidance for Estimating Values
Direct Benefit
Reduced Life Cycle Cost
bull Applicable only to measures such as green roofs that are expected to last longer than standard roofs
bull Compute total cost savings including annual OampM costs
Indirect Benefit
Energy Savings
bull Applicable to measures that reduce energy costs by providing cooling through increased shading andor evapotranspiration
bull Use New York Power Authority rates of $0148kWh for electricity and $0810Therm for natural gas
Other Potential Benefits
Air Quality bull Applicable to measures that absorb pollutants andor reduce carbon dioxide emissions
Acoustics bull Applicable to measures such as green roof or walls that reduce noise transfer
Quality of LifeHealth bull Potential quality of life benefits and related to improved public health
Real Estate bull Applicable to measures that provide residential real estate benefits from increased resilience of propertiesstreetscapesneighborhoods
Retail Sales Marketing
bull Applicable to measures that provide commercial property benefits from increased aesthetics resulting in increased marketing and sales for streetscapesneighborhoods
Tax Credits Incentives
bull Applicable to resilience or green infrastructure measures such as green roofs that have accompanying Federal State or City tax credits or other incentives
Table 15 lists potential benefits for reducing impacts from heat and basic guidance for how to estimate them See Section IIID for more information
NYC Mayorrsquos Office of Recovery and Resiliency Climate Resiliency Design Guidelines
45APPENDIX 4 - PROJECT BENEFITS CATEGORIES
Table 16 ndash Guidance on quantitative calculations for (1) sea level rise with coastal storm surge and (2) increased precipitation measures
Data Input General Guidance ndash Basic Description
Applicable Benefit Category
Applicable Typical Facility Typology
Dire
ct B
enefi
ts
Indi
rect
Ben
efits
Oth
er P
oten
tial
Ben
efits
Bui
ldin
g St
ruct
ures
Com
plex
Fa
cilit
ies
Tran
spor
tatio
nSt
reet
scap
es
Plaz
as
Park
Fea
ture
s
First Floor Elevation (FFE)
bull The elevation of the first finished floor of the structure excluding basements
bull FFE measured from top of lowest floor (riverinenon-coastal high hazard areas) or bottom of lowest horizontal structural member (coastal high hazard areas)
Y Y Y Y
Building Replacement Value (BRV)
bull The unit cost to rebuild a structure of the same quality of construction
bull Not the same as market value
Y Y Y Y
Building Size
bull The total floor area of the building in square feet
bull Total Building Value = BRV x Building Sizebull Typical BRVs for NYC range between $100 to
$325SF for residential buildings and $120 to $450SF for commercialpublic buildings
Y Y Y Y
Structure Description
bull The type of building number of stories and foundation type (full basement partial basement no basement)
bull Collect more detailed foundation data for coastal flood zones
Y Y Y Y
Building Use bull Details related to residential housing commercial business and public use
Y Y Y Y Y
Building Type bull The primary use of building ndash residential commercial public and others
Y Y Y Y Y
Depth Damage Function (DDF)
bull Curves used to estimate structure damage contents damage and displacement of residential buildings based on flood depth
bull DDFs selection based on Structure Description Building Type Building Use
bull Structure DDFs based on percentage of Total Building Value
bull Contents DDFs based on percentage of Total Contents Value
bull Displacement DDFs based on number of displacement days x Displacement Cost
Y Y Y Y Y
Contents Value
bull The cost to replace structure contents (furnishings equipment)
bull Residential building Contents Values typically 50 BRV (FEMA DDFs) or 100 BRV (USACE DDFs)
bull Non-residential building Contents Values between 18 to over 100 depending on building use (USACE DDFs)
bull Total Contents Value = BRV x Building Size
Y Y Y Y Y
Table 16 provides general guidance on how to quantitatively calculate benefits from efforts to address from climate stressors See Section IIIE for more information
NYC Mayorrsquos Office of Recovery and Resiliency Climate Resiliency Design Guidelines
46APPENDIX 4 - PROJECT BENEFITS CATEGORIES
Table 16 ndash Guidance on quantitative calculations for (1) sea level rise with coastal storm surge and (2) increased precipitation measures
Data Input General Guidance ndash Basic Description
Applicable Benefit Category
Applicable Typical Facility Typology
Dire
ct B
enefi
ts
Indi
rect
Ben
efits
Oth
er P
oten
tial
Ben
efits
Bui
ldin
g St
ruct
ures
Com
plex
Fa
cilit
ies
Tran
spor
tatio
nSt
reet
scap
es
Plaz
as
Park
Fea
ture
s
Number of Residents (Residential)
bull Total number of occupants in a residential building
bull Typically estimated based on number of residential units x average number of individuals per household (based on current US Census data or use 25 individuals per household as a default)
Y Y Y Y Y
Displacement Cost (Residential)
bull The unit cost to lodge and feed displaced residents while flood damage is repaired
bull Average unit displacement cost of $415residential unitday recommended based on current FY2018 GSA Per Diem rates for New York City
Y Y Y Y Y
Value of Service (Non-Residential and Public)
bull The unit cost of service disruption and rental of temporary facilities while flood damage is repaired
bull Disruption costs for non-residential buildings typically range from $095 to $136SFmonth and rental costs range from $020 to $136SFmonth depending on building use
bull Value of service for public buildings ($day) is typically based on the annual operating budget for the City agency using the building prorated based on building size or population served by the building then divided by 365 daysyear
Y Y Y Y
Value of Service (Critical Facilities)
bull The unit cost of critical facilities (police fire emergency medical services) lost or delayed while flood damage is repaired
Y Y Y
Value of Service Duration
bull The duration of service disruption and rental of temporary facilities for non-residential buildings and critical facilities while flood damage is repaired
bull For non-residential buildingso Value of Service Durations vary from
4 months to over 30 months based on building use and the depth of flooding
o Total Value of Service Loss = (Disruption Cost x Building Area) = (Rental Cost x Building Area x Value of Service Duration)
bull For public buildings and critical facilitieso Value of Service Durations vary from 0
days to 720 months based on building use and the depth of flooding from FEMA FIA or USACE DDFs
o Total Value of Service Loss = (Value of Service) x (Service Loss Duration)
Y Y Y
NYC Mayorrsquos Office of Recovery and Resiliency Climate Resiliency Design Guidelines
47APPENDIX 4 - PROJECT BENEFITS CATEGORIES
Table 16 ndash Guidance on quantitative calculations for (1) sea level rise with coastal storm surge and (2) increased precipitation measures
Data Input General Guidance ndash Basic Description
Applicable Benefit Category
Applicable Typical Facility Typology
Dire
ct B
enefi
ts
Indi
rect
Ben
efits
Oth
er P
oten
tial
Ben
efits
Bui
ldin
g St
ruct
ures
Com
plex
Fa
cilit
ies
Tran
spor
tatio
nSt
reet
scap
es
Plaz
as
Park
Fea
ture
s
Engineering Estimates for Damages
bull Engineered estimate models of physical damages and service losses at the project site based on the Guidelines event recurrence interval(s) and flood depth(s)
Y Y Y Y Y Y
Historic Damages and Service Losses
bull Historic physical damages and service losses at the project site documented from previous flood events
bull Do not use routine maintenancebull The historic damage event recurrence interval
(RIs) andor flood depths must be determined updated for inflation to the present value and adjusted to match the Guidelines event RIsflood depths
Y Y Y Y Y Y
Facility Replacement Value
bull The unit cost to rebuild the facility
Impacted Area bull The geographic area impacted by the facility in the event of failure in acres
Y Y Y Y
Facility Capacity
bull The design capacity of the facilitybull For example - facility capacity expressed in
millions of gallons per day (MGD) for water and wastewater facilities or megawatts (MW) for electrical facilities
Y Y Y Y
Service Population
bull The number of impacted residents served by the facility
bull Typically estimated based on number of impacted residential customers x average number of individuals per household (based on current US Census data or use 25 individuals per household as a default)
bull Facilities serving mostly non-residentialpublic buildings andor critical facilities should focus on service losses rather than service population
Y Y Y
NYC Mayorrsquos Office of Recovery and Resiliency Climate Resiliency Design Guidelines
48APPENDIX 4 - PROJECT BENEFITS CATEGORIES
Table 16 ndash Guidance on quantitative calculations for (1) sea level rise with coastal storm surge and (2) increased precipitation measures
Data Input General Guidance ndash Basic Description
Applicable Benefit Category
Applicable Typical Facility Typology
Dire
ct B
enefi
ts
Indi
rect
Ben
efits
Oth
er P
oten
tial
Ben
efits
Bui
ldin
g St
ruct
ures
Com
plex
Fa
cilit
ies
Tran
spor
tatio
nSt
reet
scap
es
Plaz
as
Park
Fea
ture
s
Value of Service
bull Unit value of service provided by the facilitybull Example of FEMA standard values for complete
loss of utility service $105personday for potable water$49personday for wastewater$148personday for electrical
bull Consider updating FEMA standard per capita values to reflect current The New York City utility rates
Y Y
Roadway Elevations bull Roadway Elevations
Y Y
Roadway Replacement Value
bull Roadway Replacement ValueY Y
Inundation Area Map
bull Inundation Area Map developed by FEMA or through modeling by project design team
Y Y Y
Building Inventory of Inundation Area
bull The number and type of buildings within the streetscape and neighborhood inundated by the Guidelinersquos flood events
Y Y Y
Average Daily Traffic (ADT)
bull The average number of one-way traffic trips per day along the roadway(s) within the streetscapeneighborhood inundated by the Guidelinersquos flood events
Y Y
Additional Travel Time
bull The additional travel time needed to detour around a flooded roadway expressed in minutes
bull In the unlikely event there is no detour available use a 12-hour travel time per one-way trap but provide a detailed area street map as supporting documentation
Y Y
Value of Traffic Delay
bull The value of service associated with lost time in traffic
bull For example - FEMA standard average value of $3344vehiclehour of delay
bull Consider updating FEMA and GSA standard values to reflect current New York City area labor rates and fuel costs
Y Y
NYC Mayorrsquos Office of Recovery and Resiliency Climate Resiliency Design Guidelines
49APPENDIX 4 - PROJECT BENEFITS CATEGORIES
Table 17 ndash Guidance on quantitative unit benefit calculations for extreme heat hazard measures
Measure General Guidance ndash Unit Benefit Information and Data Requirements
Applicable Benefit Category
Applicable Typical Facility Typology
Dire
ct B
enefi
ts
Indi
rect
Ben
efits
Oth
er P
oten
tial
Ben
efits
Bui
ldin
g St
ruct
ures
Com
plex
Fa
cilit
ies
Tran
spor
tatio
nSt
reet
scap
es
Plaz
as
Park
Fea
ture
s
Green Roof
bull Unit benefit range over PUL = $470SF to $373SF of green roof area ($719SF standard value)
bull Assumed PUL = 40 yearsbull Apply standard value unit benefit to green
roof area to estimate measure benefitbull Higher range values more applicable
to residential and commercial building streetscape projects
Y Y Y Y Y Y
Bioswale Rain Garden Meadow Mix
bull Unit benefit range over PUL = $396SF to $211SF of area ($730SF standard value)
bull Assumed PUL = 30 yearsbull Apply standard value unit benefit to bioswale
rain gardenmeadow mix area to estimate total measure benefit
Y Y Y Y Y Y
Cool Roof
bull Unit benefit range over PUL = $117 to $3151SF of material area ($144SF standard value)
bull Assumed PUL = 20 yearsbull Apply standard value unit benefit to cool roof
area to estimate total measure benefitbull Higher range values more applicable to
residential building streetscape projects
Y Y Y Y Y
Light-Colored PaversLight-Colored Materials
bull Unit benefit range over PUL = $0774 to $204SF of material area ($0866SF standard value)
bull Assumed PUL = 30 yearsbull Apply standard value unit benefit to material
area to estimate total measure benefit
Y Y Y Y
Table 17 provides general guidance on how to quantitatively calculate benefits from efforts to address climate stressors See Section IIIE for more information
NYC Mayorrsquos Office of Recovery and Resiliency Climate Resiliency Design Guidelines
50APPENDIX 4 - PROJECT BENEFITS CATEGORIES
Table 17 ndash Guidance on quantitative unit benefit calculations for extreme heat hazard measures
Measure General Guidance ndash Unit Benefit Information and Data Requirements
Applicable Benefit Category
Applicable Typical Facility Typology
Dire
ct B
enefi
ts
Indi
rect
Ben
efits
Oth
er P
oten
tial
Ben
efits
Bui
ldin
g St
ruct
ures
Com
plex
Fa
cilit
ies
Tran
spor
tatio
nSt
reet
scap
es
Plaz
as
Park
Fea
ture
s
Tree Planting
bull Unit benefit range over PUL = $1005 to $77154Tree ($1855Tree standard value)
bull Assumed PUL = 30 yearsbull Apply standard value unit benefit to number of
trees to estimate total measure benefitbull Higher range values more applicable
to residential and commercial building streetscape projects
Y Y Y Y Y Y
Planter Box Tree
bull Unit benefit range over PUL = $212 to 16304Tree ($392Tree standard value)
bull Assumed PUL = 15 yearsbull Apply standard value unit benefit to number of
trees to estimate total measure benefitbull Higher range values more applicable
to residential and commercial building streetscape projects
Y Y Y Y Y
Shade Canopy
bull Unit benefit range over PUL = $0363 to $396SF ($0458SF standard value)
bull Assumed PUL = 15 yearsbull Apply standard value unit benefit to area of
shade canopy estimate total measure benefitbull Higher range values more applicable
to residential and commercial building streetscape projects
Y Y Y Y
Permeable Grass Pavers
bull Unit benefit range over PUL = $0258SF to $0521SF of pavers ($0363SF standard value)
bull Assumed PUL = 30 yearsbull Apply standard value unit benefit to paver
area to estimate total measure benefit
Y Y Y Y Y
For the purposes of the BCA refer to the following facility typologies bull ldquoBuilding Structuresrdquo include critical small building sites such as EMS or FDNY stations and non-critical small building sites such as
libraries or comfort stationsbull ldquoComplex Facilitiesrdquo include critical infrastructure such as wastewater treatment sites pump stations water filtration plants and similar
large or complex facilitiesbull ldquoTransportationStreetscapePlazasrdquo include roadway reconstruction streetscape improvements street raising plazas and other
transportation-related infrastructurebull ldquoPark Featuresrdquo include parks and similar public recreational facility with natural landscape features
NYC Mayorrsquos Office of Recovery and Resiliency Climate Resiliency Design Guidelines
51APPENDIX 5 - EXAMPLE PLANNING DECISION TREE
This decision tree provides a summarized example approach for how to implement these Guidelines Projects with a total cost greater than $50 million are recommended to conduct a full qualitative and quantitative climate change risk assessment and BCA while projects below $50 million are recommended to conduct a qualitative risk assessment and BCA
Define Project
1) Operational goals and criticality level2) Useful life3) Location in the current flood plain future floodplain and or zone
of tidal inundation and the project arearsquos score on the heat vulnerability index
Evaluate Project Risks According to Probability and Magnitude of Consequence
bull Extreme Heat bull Precipitationbull Sea Level Risebull Coastal Surge
High Level Identification and Assessment of Risk Mitigation Alternatives and Co-benefits
(qualitative)
Detailed Identification and Assessment of Risk Mitigation Alternatives and Co-benefits (qualitative and quantitative)
High Level Estimate of Costs and Benefits of Design Alternatives
(qualitative)
Detailed Estimate of Costs and Benefits of Design Alternatives
(qualitative and quantitative)
Decision Point Which climate change risks require mitigation
Decision Point Evaluate risk mitigation benefits and costs to
determine final resilient design alternative or if no action is required
Decision Point Is the total project cost above $50 million
Below $50 million Above $50 million
APPENDIX 5 - EXAMPLE PLANNING DECISION TREE
NYC Mayorrsquos Office of Recovery and Resiliency Climate Resiliency Design Guidelines
52
Project Title
Design Strategies Checklist (not exhaustive)
Extreme Heat Comments Extreme Precipitation Comments Sea Level Rise amp Storm Surge Comments
Select Site in Low Heat Vulnerability Index area Select High Elevation Site Select High Elevation Site
Minimize East-West Building Orientation Green Roof Raise Building Floor Elevation
Passive Solar Cooling and Ventilation Systems
Protect Below Grade Areas from Flooding Waterproof Building Envelope
Cool Roof (SRI appropriate) On-site Stormwater Management (gray) Elevate Critical Building Functions
Green Roof (extensive) Reduce Impervious Areas Elevate Critical Equipment
Vegetative Structures Permeable Pavement Perimeter Floodwall100 Levee (passive or active)
Enhanced HVAC System including space layout optimization and system scalability
Increase Green Spaces and Planted Areas DryWet Floodproofing
More Efficient Building Envelope Other Utility Redundancy Design101
Parking Lot Shading Resilient Materials amp Landscape Treatments
Light Colored Pavements (appropriate SRI) Design for Storm Surge Outflow
Increase Planted Areas Install Backwater Flow Prevention
Permeable Surfaces Design for Scour
Open-grid Pavement Raise Road Elevation
Other Other
This appendix provides a template for identifying possible design strategies to address climate change risks as described throughout the Guidelines
APPENDIX 6 - DESIGN STRATEGIES CHECKLIST
100 Permanent perimeter flood walls are not permitted to meet floodproofing requirements in buildings with substantial improvements andor damages 101 Utility redundancy design should be pursued for critical systems not all building systems
APPENDIX 6 - DESIGN STRATEGIES CHECKLIST
NYC Mayorrsquos Office of Recovery and Resiliency Climate Resiliency Design Guidelines
53APPENDIX 7 - CLIMATE CHANGE RISK ASSESSMENT RESOURCES
These Guidelines provide data on climate change hazards and recommend how that data can inform resilient design A risk assessment is a tool to help project managers and designers evaluate risk levels as well as select and prioritize resilient design strategies A high level risk assessment is recommended for all City capital projects with a total cost of under $50 million Projects above $50 million are recommended to conduct an in-depth assessment
Risk assessments use quantified estimates of the probability and magnitude of consequence of an event occurring to prioritize responses ldquoProbabilityrdquo is an assessment of the likelihood of a hazard occurring while ldquomagnituderdquo describes the hazardrsquos potential impact Risk assessment tools such as the examples listed below can be used to define and score these categories Projects that score higher across both probability and magnitude can be prioritized for investment and risk mitigation action Projects that score lower across both criteria may require no action beyond meeting code The results are typically charted on a risk matrix and an example is provided on the next page
The climate change risk management frameworks below offer templates for how to integrate climate change projections into a risk assessment process Refer to these resources for examples and further information
bull Vulnerability Assessment and Adaptation Framework is prepared by the Federal Highway Administration (FHWA) While developed for transportation planning this risk assessment framework has broad applicability for evaluating asset vulnerability to climate change Available at httpswwwfhwadotgovenvironmentsustainabilityresilienceadaptation_framework
bull US Climate Resilience Toolkit The US Global Change Research Program offers a step by step risk assessment
framework including tools and case studies at httpstoolkitclimategovsteps (see example on next page)
bull Coast Adapt Guidance on undertaking a risk assessment High level assessment httpscoastadaptcomausitesdefaultfilesfactsheetsT3M4_2_2nd_pass_risk_assessmentpdfDetailed assessment httpscoastadaptcomausitesdefaultfilesfactsheetsT3M4_3_3rd_pass_risk_assessmentpdf
bull Climate adaptation Risk uncertainty and decision-makingDownload the report here httpswwwukciporgukpublicationsRisk
The City plans to develop a NYC-specific process for integrating climate change data into existing risk management processes by April 2019
APPENDIX 7 - CLIMATE CHANGE RISK ASSESSMENT RESOURCES
NYC Mayorrsquos Office of Recovery and Resiliency Climate Resiliency Design Guidelines
54APPENDIX 7 - CLIMATE CHANGE RISK ASSESSMENT RESOURCES
The Risk Characterization Matrix below is an example from the US Climate Resilience Toolkit This tool can be used to assess the probability and magnitude of impact for identified risks The risk of coincident climate stressorsrisks (such as storm surge plus increased precipitation) can also be assessed as applicable
Figure 14 - Example of a climate change risk matrix (adapted from US Climate Resilience Toolkit)
Project teams can determine the magnitude of the impact (along the horizontal scale of 1 through 3 with 3 being the most severe) and the probabilitylikelihood of occurrence for each specific risk (along the vertical scale with 3 being the most likely) A score is typically assigned for each risk (Probabil-ity x Magnitude) and then charted on the matrix Based on the estimated probability and magnitude of consequence above the risks are ranked and prioritized for mitigation Factors to bear in mind include
bull Not all facility typologies have the same level of functional and operational importance during events or tolerance for disruption
bull Not all climate stressors and risks have the same level of impact on each project sitebull Not all identified risks can or should be mitigated fully
NYC Mayorrsquos Office of Recovery and Resiliency Climate Resiliency Design Guidelines
55WORKS CITED
A Stronger More Resilient New York PlaNYC Report of the NYC Special Initiative for Rebuilding and Resiliency The City of New York 2013
ldquoAccount for Climate Riskrdquo International Finance Corporation accessed March 27 2017 httpwwwifcorgwpswcmconnectTopics_Ext_ContentIFC_External_Corporate_SiteClimate+Business
PrioritiesAccount+for+Climate+Risk
American Society of Heating Refrigeration and Air-Conditioning Engineers (ASHRAE) Handbook -Fundamentals 2017
ldquoBaseline Standard Economic Value Methodology Reportrdquo Federal Emergency Management Agency July 2016
Benefit Cost Analysis Toolkit Software Version 530 Federal Emergency Management Agency (build date December 2016)
Criteria for Detention Facility Design New York City Department of Environmental Protection November 2012
Community Resilience Planning Guide for Buildings and Infrastructure Systems Vol 1 NIST Special Publication 1190 US Department of Commerce 2016
Cool and Green Roofing Manual NYC Department of Design and Construction 2007 httpwwwnycgovhtmlddcdownloadspdfcool_green_roof_manpdf
Building Resiliency Task Force US Urban Green Building Council New York 2013 httpurbangreencouncilforcecomBuildingResiliency
Design and Planning for Flood Resiliency Guidelines for NYC Parks New York City Department of Parks and Recreation 2017
httpswwwnycgovparksorgplanning-and-buildingplanningresiliency-plansflood-resiliency
Flooded Bus Barns and Buckled Rails Federal Transit Administration Office of Budget and Policy 2011 httpswwwhsdlorgabstractampdid=685187
Floodproofing Non-Residential Buildings FEMA P936 FEMA 2013 httpswwwfemagovmedia-library-data9a50c534fc5895799321dcdd4b6083e7P-936_8-20-13_508rpdf
ldquoGlossaryrdquo International Infrastructure Management Manual National Asset Management Support Group New Zealand 2011 httpwwwipweaorg
ldquoGreen Roof Metrics Draft Reportrdquo New York City Department of Parks and Recreation 2017
ldquoGuide to Rain Event Preparednessrdquo NYC Department of Environmental Protection httpwwwnycgovhtmldeppdfbrochuresflood-preparedness-flyerpdf
ldquoGuidelines and Discount Rates for Benefit-Cost Analysis of Federal Programsrdquo Appendix C Circular A-94 US Office of Management and Budget (OMB) 2017
ldquoGuidelines for the Design and Construction of Stormwater Management Systemsrdquo New York City Department of Environmental Protection July 2012
Horton R et al New York City Panel on Climate Change 2015 Report Ann NY Acad Sci ISSN 0077-892 New York 2015
Madrigano J et al ldquoA case-only study of vulnerability to heat wavendashrelated mortality in New York City (2000ndash2011)rdquo Environmental Health Perspectives 123672ndash678 2013
WORKS CITED
NYC Mayorrsquos Office of Recovery and Resiliency Climate Resiliency Design Guidelines
56WORKS CITED
enspMcGregor et al Two Degrees The Built Environment and Our Changing Climate Routledge Press 2013
NYC Green Codes Task Force US Green Building Council New York 2010 httpurbangreencouncilorgGreenCodes
NYCrsquos Risk Landscape A Guide to Hazard Mitigation NYC Emergency Management 2014
One New York The Plan for a Strong and Just City The City of New York 2015 httpwwwnycgovhtmlonenyc downloadspdfpublicationsOneNYCpdf
Ready to Respond Strategies for Multifamily Building Resilience Enterprise Green Communities 2015 httpswwwenterprisecommunityorgresources
Rosenzweig C et al Climate Change Adaptation in New York City Building a Risk Management Response New York City Panel on Climate Change 2010
httponlinelibrarywileycomdoi101111nyas20101196issue-1 issuetoc
ldquoSustainable Infrastructure Management Program Learning Environmentrdquo Water Environment Research Foundation accessed March 24 2017 httpsimplewerforg
Urban Waterfront Adaptive Strategies NYC Department of City Planning 2013 httpwww1nycgovsiteplanningplanssustainable-communitiesclimate-resiliencepagetab=1
Wastewater Resiliency Plan Climate Risk Assessment and Adaptation Study New York City Department of Environmental Protection October 2013
NYC Mayorrsquos Office of Recovery and Resiliency Climate Resiliency Design Guidelines
29IIIB CATEGORIES OF PROJECT BENEFITS
bull Indirect Benefits include reduced or avoided service losses for non-residential
buildings public facilities andor infrastructure (utilities roads and bridges) based on the value of service continuity andor emergency services to New Yorkers that can be quantified as a secondary result of implementing a specific hazard mitigation measure Table 13 in Appendix 4 provides a list of indirect benefits and basic guidance on estimating and documenting values for sea level rise and increased precipitation-related flood hazards Note that given the current state of practice on extreme heat it is not possible to quantify reduced or avoided service losses that result from a specific extreme heat mitigation measures Therefore indirect benefits applicable to extreme heat hazards are limited to reduced energy costs such as cool roofs green roofs or shade trees Refer to Table 15 in Appendix 4 for details on indirect benefits for extreme heat hazards
bull Other Benefits where applicable other potential benefits may include social benefits for residents such as avoided stress and anxiety avoided lost productivity environmentalecosystem service benefits avoided need for emergency services and other potential benefits that can be estimated as a result of implementing a specific hazard mitigation measure Table 14 in Appendix 4 provides a list of other potential benefits and basic guidance on estimating and documenting values for sea level rise and increased precipitation-related flood hazards
Note on the ecosystem service benefit category in Table 14 the stormwater management benefits of green infrastructure should be distributed between the extreme heat and increased precipitation hazards since these measures provide both significant reductions in rainfall runoff as well as Urban Heat Island mitigation through evapotranspiration However there is currently limited data available to quantify the actual distribution of stormwater management benefits between the two hazards For various dual-benefit providing interventions careful considerations should be given to identify the appropriate benefits category provided by the intervention with a goal to avoid duplication of quantified benefits In this methodology the stormwater management benefits of green infrastructure are applied to the increased precipitation hazard in order to avoid a duplication of benefits Note on real estate and quality of life benefits additionally it is important to note that two potential benefit categories shown in Table 14 - real estate and quality of lifehealthavoided casualties - were not included in the current BCA methodology for sea level rise or increased precipitation hazards Although these categories could increase project benefits for sea level rise and increased precipitation hazards they were only applied to measures that address extreme heat hazards such as green roofs trees and other plantings Refer to Table 15 for a detailed summary of other benefit categories quantified as unit benefits for extreme heat hazards
NYC Mayorrsquos Office of Recovery and Resiliency Climate Resiliency Design Guidelines
30IIIC WHICH METHODOLOGY TO USEIIID BCA METHODOLOGY FOR PROJECTS UNDER $50 MILLION
D BCA methodology for projects under $50 millionThe project design team should develop design alternatives to meet the Guidelinesrsquo criteria which may be in excess of NYC code and standards requirements (baseline conditions) It is assumed that the project design team will develop alternatives to address each of the following applicable climate stressors - sea level risecoastal storm surge increased precipitation and extreme heat - separately Tables 12-15 in Appendix 4 provides a list of typical direct indirect and other benefits provided by various intervention typologies to reduce impacts from climate stressors During the qualitative assessment the project design team should consider that intervention strategies will have varying levels of reliability effectiveness benefits and cost implications during the qualitative assessment
The project design team is recommended to develop appropriate evaluation criteria and metrics for each of the applicable project benefit categories For each alternative the project design team could use either a scoring weighting ranking or other type of qualitative assessment framework to assess each applicable project benefit categories with the developed evaluation criteria and metrics Table 6 provides an example template to evaluate alternatives using a set of general evaluation criteria and metrics using a color-coded rating system (and see Table 7 for an example of how to complete the template) The project design team can utilize a similar template customized to their project goals and objectives This assessment allows agencies to screen the qualitative benefits for various alternatives that would then lead to development of final project components to match the available budget and goals of the project
Projects with total costs below $50 million recommended to conduct a qualitative assessment to identify the optimal interventions that meet Guidelinesrsquo design criteria using the ldquoD) BCA methodology for projects under $50 millionrdquo methodology below
C WHICH METHODOLOGY TO USEProjects with a total cost above $50 million or are highly complex or critical facilities recommended to conduct both a qualitative and quantitative benefit calculation to identify the optimal interventions that meet Guidelinersquos design criteria using the ldquoE) BCA methodology for projects above $50 millionrdquo below A quantitative BCA also must include qualitative factors
NYC Mayorrsquos Office of Recovery and Resiliency Climate Resiliency Design Guidelines
31IIID BCA METHODOLOGY FOR PROJECTS UNDER $50 MILLION
Qualitative Color Scale Green=Least resource intensive alternative Purple=most resource intensive yellow=medium level of resource intensity
Qualitative Evaluation Factors Description Relative Color Rating System
First CostsAdditional construction costs needed to incorporate Guidelinesrsquo recommended resilient design over the baseline project costs
Highest cost ($$$) rated as Purple whereas lowest cost ($) rated as Green
ConstructabilityEase of Implementation
Construction techniques and site conditions such as presence of major utilities conflicts and other conditions which dictate the level of constructability required for each alternative
Difficult to construct rated as Purple whereas easiest to construct rated as Green
Environmental ImpactsCo-BenefitsPermitting
Impacts to the built and natural environment such as circulation noise and hazardous waste plus the level of effort required for permitting (eg interventions in water require highest level of permitting requirement) from each alternative in addition to the baseline project condition
Highest environmental impacts and highest level of effort required for permitting rated as Purple whereas the least impact and level of effort rated as Green
Operation and Maintenance (OampM)
Level of effort of additional manpower and cost of OampM for the alternatives over the baseline project OampM requirements
Highest level of effort and cost for OampM rated as Purple whereas the lowest is rated as Green
Reliability and Durability
Interventions that do not require human involvement or a facilityrsquos ability to withstand all the forces during a storm event (eg permanent solutions with higher reliability than deployable solution)
Interventions requiring human involvement (active measures) rated as Purple whereas interventions with minimal or no human involvement (passive measures) rated as Green
Risk Reduction Benefits Monetary benefits provided by each intervention alternative in avoided damages over the baseline condition
Lowest potential monetary benefit rated as Purple whereas as highest potential monetary benefit rated as Green
Quality of Life BenefitsVisual Aesthetics
Benefits either to the community such as recreation or safety or serve the community during emergency situations
Lowest potential quality of life benefits rated as Purple whereas as highest potential benefits rated as Green
Table 6 ndash Evaluation matrix for comparison of mitigation alternatives across the useful life of a project
Project title_______________________________________________________________________________
Evaluation Criteria
Baseline Condition (Designed to NYC Building Code and
Standards)
Resilient Design Alternatives for Managing__________________
Alternative 1
Alternative 2
Alternative 3
First Costs
ConstructabilityEase of ImplementationEnvironmental ImpactsCo-BenefitsPermitting
Operation and Maintenance (OampM)
Reliability and Durability
Risk Reduction Benefits
Quality of Life BenefitsVisual Aesthetics
NYC Mayorrsquos Office of Recovery and Resiliency Climate Resiliency Design Guidelines
32IIID BCA METHODOLOGY FOR PROJECTS UNDER $50 MILLION
Table 7 ndash Evaluation matrix for comparison of mitigation alternatives across the useful life of a project - COMPLETED EXAMPLE
Evaluation Criteria
Baseline Condition (Designed to NYC Building Code and
Standards)
Resilient Design Alternatives for Managing Coastal SurgeSLR
Alternative 1Flood proof building built on grade to Guidelines
DFE
Alternative 2 Elevate building structure above Guidelinesrsquo DFE
on columns
Alternative 3 Raise site grade by filing the building site footprint
to Guidelinesrsquo DFE
First CostsBaseline cost for building structure is $15 million
Incremental costs are within 5 over the baseline costs
Incremental costs are between 5-10 over baseline costs
Incremental costs are 20 and more over baseline costs
ConstructabilityEase of Implementation
Relatively easy to construct within site constraints
Similar to baseline conditions since construction requires additional flood proofing only
Moderate challenges to construct foundation structure for columns within site constraints
Extremely challenging to construct within the site constraints Potentially fatal flaw
Environmental ImpactsCo-BenefitsPermitting
No major impacts but may require additional effort to obtain DOB permits with flood proofing and deployable systems
No major impacts but may require additional effort to obtain DOB permits with flood proofing and deployable systems
No major impacts and relatively easy to permit
Potential drainage circulation impacts and challenges to obtain clean fill material for the site
Operation and Maintenance (OampM)
Major OampM costs associated with deployable systems
Major OampM costs associated with deployable systems
Moderate OampM costs associated with proposed elevator for access
Minimal OampM costs since deployable and elevators not required
Reliability and Durability
Least reliability with highest potential risk from flooding during to failure of deployable systems
Least reliability with highest potential risk from flooding during to failure of deployable systems
Moderate reliability with potential risk from flooding limited to elevator shaft only
Highest reliability since deployable are not required to protect building from flooding
Risk Reduction Benefits
Maximum flood risk reduction benefits assuming deployable and flood proofing is effective
Maximum flood risk reduction benefits assuming deployable and flood proofing is effective
Maximum flood risk reduction benefits
Maximum flood risk reduction benefits
Quality of Life BenefitsVisual Aesthetics
Facility may not be operational during the storm event
Facility may not be operational during the storm event
Facility can be potentially operational during the storm event
Facility can be potentially operational during the storm event
Qualitative Color Scale Green=Least resource intensive alternative Purple=most resource intensive yellow=medium level of resource intensity
A new non-critical facility with a building structure is proposed on a site that is currently in the 2015 Preliminary FEMA 1 annual chance floodplain with a BFE of 10rsquo (NAVD 88) The baseline conditions DFE to meet existing NYC codes and standards is 11rsquo (NAVD 88) Using the Guidelines recommended design criteria the facilityrsquos DFE is 133rsquo (NAVD 88) and existing grade is around 6rsquo (NAVD 88) The project design team develops three alternatives to meet the Guidelinesrsquo recommended DFE design for the facility Table 7 offers an example of how a qualitative assessment can be used to compare three resilient design alternatives using the evaluation criteria and metrics
CASE STUDY Example of How to Use the Evaluation Matrix
NYC Mayorrsquos Office of Recovery and Resiliency Climate Resiliency Design Guidelines
33IIIE BCA METHODOLOGY FOR PROJECTS OVER $50 MILLION
E BCA methodology for projects over $50 millionIn order for a project to be considered cost-effective a benefit-cost analysis (BCA) assesses if the benefits of a project outweigh its costs or in other words the benefit-cost ratio (BCR) is greater than 10 as illustrated in Equation 1
Equation 1 Benefit-Cost Ratio Formula
BCR =
Where BCR = Benefit-Cost Ratio
BENEFITS = Total project benefits
COSTS = Total project costs
BENEFITSCOSTS
These estimated project benefits are combined with the project costs which are defined as the differential construction and long-term operation and maintenance costs associated with constructing a proposed project to the Guidelinesrsquo recommended design level It is assumed that the baseline project will be designed to the most prevalent NYC codes and standards This benefit methodology should be used to determine the additional project benefit that the Guidelinesrsquo recommended design would provide over the baseline project benefit It is assumed that the project design team will develop alternatives to address each of the following applicable climate stressors - sea level risecoastal storm surge increased precipitation and extreme heat - separately For each alternative the project design team should use the following steps to determine the Benefit-Cost Ratio (BCR)
a) Determine project useful life for design interventions Determining the useful life of the proposed project is an important first step in the
detailed BCA assessment methodologies for two reasons First the project useful life determines what values must be used from the Guidelines to establish the future climate design conditions The various hazard tables in the Guidelines establish design requirements based on useful life ranges through 2039 2040-2069 2070-2099 and 2100+ (2100+ projections are only available for sea level rise) A review of these tables show that the design requirements needed to meet the projected climate hazards increase as the end of useful life range increases Second the useful life determines how long the project will need to be operated and maintained in order to remain technically sound and effective at reducing future damages and losses
b) Determine discount rate for project benefits calculation The cost-effectiveness of projects assessed using the BCR must be done on a net
present value basis meaning the present value of the benefits is compared to the present value of the costs Most project costs are computed for present value based on current cost estimates bids or cost guidance However project benefits - as well as project costs for operation and maintenance - accrue over time into the future and are computed on an annualized basis To address this issue the Present Value Coefficient (PVC) is used to bring these annualized project benefits and OampM costs into the present value As indicated by the formula in Equation 2 the PVC is a function of the Project Useful Life (PUL) and the Discount Rate (DR)
NYC Mayorrsquos Office of Recovery and Resiliency Climate Resiliency Design Guidelines
34
Equation 2 Present Value Coefficient (PVC) Formula
PVC =
Where PVC = Present Value Coefficient
PUL = BCA Project Useful Life based on project type
DR = Discount Rate
The project design team should coordinate with agencies and NYC OMB if needed to determine appropriate discount rates based on funding source project type and other factors This coordination should take place during project initiation phase where total project costs (design and construction) are over $50 million66
c) Develop input data to perform benefit calculations Tables 16 and 17 in Appendix 4 provide a list of typical input data by each climate
stressor needed to perform benefit analysis quantitatively on variety of facilities67 The project design team should use these tables as a reference to identify appropriate input data categories andor additional input data needed to perform benefit analysis on the project
d) Identify applicable project benefit categories to estimate benefits Tables 16 and 17 in Appendix 4 provide a list of typical project benefits by each climate
stressor needed to perform benefit analysis quantitatively on various types of projects The project design team should use these tables as a reference to identify appropriate project benefit categories for each climate stressor to perform benefit analysis on the project
e) Calculate benefits of recommended design interventions for each climate
stressor The input data and applicable project benefits can be assembled along with
incremental project cost data to analyze cost-effectiveness using the FEMA BCA Tool Damage-Frequency Assessment (DFA) module or similar software This analysis will provide a BCR for each alternative which can then be used to compare the alternatives that were developed to mitigate effects from applicable climate stressors The project design team can then use the results from this analysis to identify optimal interventions that provides a balanced solution that provides resiliency benefits within the available project budget
IIIE BCA METHODOLOGY FOR PROJECTS OVER $50 MILLION
[1 ndash (1 + DR) -(PUL)]DR
66 For example a NYC OMB March 2015 memorandum recommends using an annually updated DR as published each year in Appendix C of OMB Circular A-94 The current OMB-recommended discount rates from OMB A-94 Appendix C vary by project useful life and are as follows 21 DR for useful lives of 10 to 19 years 25 DR for useful lives of 20 to 29 years and 28 DR for useful lives of 30 years or greater By contrast FEMA hazard mitigation grants use a DR of 70 for all projects based on the Federal OMB A-94 rate for federally-funded mitigation measures Since these DRs will impact the PVC and the project benefits the project team must ensure that BCA results prepared using an OMB-recommended DR (21 to 28) be updated to reflect the Federal DR (70) when applying for FEMA mitigation grant funds
67 Note the data requirements for the sea level rise and increased precipitation hazards in Table 16 are more detailed than the requirements for the extreme heat hazards due to the less detailed level of analysis available for extreme heat
NYC Mayorrsquos Office of Recovery and Resiliency Climate Resiliency Design Guidelines
35
APPENDICES
NYC Mayorrsquos Office of Recovery and Resiliency Climate Resiliency Design Guidelines
36APPENDIX 1 ndash KEY TERMS
100-year flood (1 annual chance flood)
A flood that has a 1 probability of occurring in any given year The 100-year floodplain is the extent of the area of a flood that has a 1 chance of occurring or being exceeded in any given year
500-year flood (02 annual chance flood)
A flood that has a 02 probability of occurring in any given year The 500-year floodplain is the extent of the area of a flood that has a 02 chance of occurring or being exceeded in any given year
AdaptationAdjustment in natural or human systems to a new or changing environment that seeks to maximize beneficial opportunities or moderate negative effects Successful adaptations contribute to resiliency
Base flood elevation (BFE)The elevation of surface water resulting from a flood that has a 1 annual chance of occurring or being exceeded in any given year The BFE is shown on the Flood Insurance Rate Map (FIRM)69
BluebeltReference to the Department of Environmental Protectionrsquos (DEP) Bluebelt program to preserve natural drainage corridors including streams ponds and other wetland areas Preservation of these wetland systems allows them to perform their functions of conveying storing and filtering storm water
Climate
The average weather (or more rigorously a statistical description of the average in terms of the mean and variability) over a period of time usually 30 years These quantities are most often surface variables such as temperature precipitation and wind Climate in a wider sense is the state including a statistical description of the climate system70
Climate change
Changes in average weather conditions that persist over multiple decades or longer Climate change encompasses both increases and decreases in temperature as well as shifts in precipitation changing risk of certain types of severe weather events and changes to other variables of the climate system
Climate change riskThe chance that investments (such as in capital projects) can be affected by the physical impacts of climate change71 Risks are evaluated as a product of the probability of occurrence and the magnitude of damages or impacts including socioeconomic factors that would result if they did occur (consequences)
Climate change risk assessment
This assessment involves a detailed project-specific analysis that includes a vulnerability and risk assessment often followed by cost-benefit analysis to assess and select investments in climate change risk mitigation Risk is assessed as a function of the magnitude and probability of a given climate change hazard Examples resources are included in Appendix 7
Climate vulnerabilityThe degree to which systems and populations are affected by adverse impacts It is a function of the character magnitude and rate of climate change and variation to which a system is exposed its sensitivity and its adaptive capacity72
Cloudburst An extreme amount of rain in a short period of time often over a small geographic area73
Cooling Degree Day (CDD) A form of degree-day used to estimate the energy requirements for air conditioning or refrigeration when the daily mean temperature is above 65degF
68 All terms are from the US Global Change Research Program (USGCRP) glossary unless otherwise noted The USGCRP glossary is available at httpwwwglobalchangegovclimate-changeglossary
69 ldquoDefinitionsrdquo FEMA last modified March 1 2017 httpswwwfemagovnational-flood-insurance-programdefinitions70 UKCIP Glossary httpwwwukciporgukglossary71 ldquoAccount for Climate Riskrdquo International Finance Corporation 72 UKCIP Glossary httpwwwukciporgukglossary73 New York City Environmental Protection ldquoCloudburst Resiliency Planning Studyrdquo 2017 Available at httpwwwnycgovhtmldeppdfclimatenyc-cloudburst-studypdf
APPENDIX 1 - KEY TERMS68
NYC Mayorrsquos Office of Recovery and Resiliency Climate Resiliency Design Guidelines
37APPENDIX 1 ndash KEY TERMS
Design life The life expectancy of an asset or product as determined during design74 As opposed to useful life (see below)
Dry Bulb temperature The ambient air temperature measured by a thermometer
Extreme eventUnexpected unusual or unpredictable weather or flooding compared to historical or future projected distribution Extreme events include for example heat waves cold waves heavy rains periods of drought and flooding and severe storms
Facilities For the purposes of this document ldquofacilitiesrdquo refers to all types of buildings housing infrastructure structures and landscape features designed by or for the City of New York
Flexible adaptation pathwayResilience-building strategies that can evolve or be adapted over time as climate change risk assessments evaluations of adaptation strategies and monitoring continue75
Flood Insurance Rate Maps (FIRM)
Official flood map of a community on which FEMA has delineated the 1 annual chance floodplain and the base flood elevations (BFEs) applicable to the community76 The FIRM also includes the 02 floodplain annual chance floodplain and differentiates between special flood hazard areas (V A Coast A zones) and floodways The official FIRM is from the year 2007 while the 2015 PFIRM is currently required by NYC Building Code to calculate design flood elevations NYC DOB references the more restrictive of the two maps in both base flood elevation and flood hazard area (ie V versus A zone) Refer to Appendix 3 for more information
FreeboardAn additional amount of height above the base flood elevation used as a factor of safety (eg two feet above the base flood) in determining the level at which a facilitys lowest floor must be elevated or floodproofed to be in accordance with state or community floodplain management regulations77
Future time slices
Future periods defined by the NPCC for when climate change projections are available In this document the following decadal projections are associated with specific time spans2020s projection = present to 20392050s projection = 2040 to 20592080s projection = 2070 to 20992100s projection = end of century and beyond
Green infrastructureAn array of practices that use or mimic natural systems to manage urban stormwater runoff Water is either directed to engineered systems for infiltration or detained for longer periods before it enters the sewer system
Heat Vulnerability Index (HVI)Summarizes relative risk of adverse health effects from heat due to social and environmental factors Used to identify neighborhoods at higher risk during and after extreme heat events
Heat wave A period of three consecutive days where temperatures rise above 90degF or two consecutive days over 95 degrees78
New York City Panel on Climate Change (NPCC)
The body of leading climate and social scientists charged with making climate change projections for the metropolitan region79
74 Sustainable Infrastructure Management Program Learning Environment httpsimplewerforg 75 Rosenzweig C et al Climate Change Adaptation in New York City Building a Risk Management Response76 ldquoDefinitionsrdquo FEMA77 Ibid78 Horton R et al New York City Panel on Climate Change 2015 Report Chapter 1 Climate Observations and Projections Ann NY
Acad Sci ISSN 0077-8923 (New York 2015) 2579 For more information on the NPCC visit www1nycgovsiteorrchallengesnyc-panel-on-climate-changepage
NYC Mayorrsquos Office of Recovery and Resiliency Climate Resiliency Design Guidelines
38APPENDIX 1 ndash KEY TERMS
Open-grid pavement system
Pavements that consist of loose substrates supported by a grid of a more structurally sound grid or webbing Unbounded loose substrates in these systems transfer and store less heat than bound and compacted pavements and aid permeability Pavement is 50 pervious and contains vegetation in the open cells designed to allow percolation or infiltration of storm water through the surface into the soil below80
Preliminary Flood Insurance Rate Map (PFIRM)
Preliminary flood map developed by FEMA in 2015 for New York City that provides projected risks for flood hazards81 Refer to Appendix 3 for more information
Project useful life (PUL)
The period over which an asset or component is expected to be available for use by an entity This depends on regular and adequate maintenance This period of time typically exceeds the design life (see above) The combined effect of operational requirements and useful life is practical in assessing an investment in improving resilience82
Rain gardenAlso called ldquobioswalerdquo Planted areas designed to collect and manage stormwater that runs off streets sidewalks commercial and residential rooftops and other sources when it rains
Resiliency The ability to bounce back after change or adversity The capability of preparing for responding to and recovering from difficult conditions83
Sea level rise-adjusted design flood elevation
As defined in these Guidelines the increased height of the base flood elevation due to sea level rise plus freeboard depending on the criticality of the facility The sea level rise adjustment depends on the useful life of the facility
Storm surge An abnormal rise of water generated by a storm over and above predicted astronomical tides84
Substantial improvementAny repair reconstruction rehabilitation addition or improvement of a building or structure the cost which equals or exceeds 50 of the market value of the structure before the improvement or repairs started For more information see Appendix G of the NYC Building Code and 1 RCNY sect3606-0185
Tidal inundation Flooding which occurs at high tides due to climate-related sea level rise land subsidence andor the loss of natural barriers86
Urban Heat Island (UHI) effectThe tendency for higher air temperatures to persist in urban areas as a result of heat absorbed and emitted by buildings and asphalt tending to make cities warmer than the surrounding suburban and rural areas
Weather The state of the atmosphere at a given time with regard to temperature cloudiness precipitation wind and other meteorological conditions87
Wet Bulb temperatureThe temperature indicated when a thermometer bulb is covered with a water-saturated wick over which air is caused to flow at approximately 45 ms (900 ftmin) to reach the equilibrium temperature of water evaporating into the air when the heat of vaporization is supplied by the sensible heat of the air88
80 ldquoGlossaryrdquo US Green Building Council (2017) Available at httpwwwusgbcorgglossaryterm552581 ldquoPreliminary FEMA Map Productsrdquo FEMA Map Service Center Available at httpshazardsfemagovfemaportalprelimdownload82 ldquoGlossaryrdquo International Infrastructure Management Manual (2011) 83 A Stronger More Resilient New York (2013) 184 ldquoStorm Surge Overviewrdquo National Hurricane Center NOAA Available at httpswwwnhcnoaagovsurge85 ldquoFlood Resistant Constructionrdquo Appendix G New York City Building Code (2008) and 1 RCNY sect3606-01 available at httpswww1nycgovassetsbuildingsrules1_RCNY_3606-01pdf86 ldquoOcean Factsrdquo National Ocean Service NOAA Available at httpoceanservicenoaagovfactsnuisance-floodinghtml 87 UKCIP Glossary httpwwwukciporgukglossary88 ldquoASHRAE Terminologyrdquo ASHRAE Available at httpswwwashraeorgtechnical-resourcesauthoring-toolsterminology
NYC Mayorrsquos Office of Recovery and Resiliency Climate Resiliency Design Guidelines
39APPENDIX 2 - CLIMATE CHANGE PROJECTIONS
Climate change projections are provided by the New York City Panel on Climate Change (NPCC) The full NPCC report is available from the New York Academy of Sciences89 Tables 8-10 (below) were reproduced directly from the NPCC report while Table 2 (see Section IIA) was developed using the data underlying the NPCC report to inform the design of HVAC systems under warmer conditions
Table 8 ndash NYC sea level rise projections90
Baseline (2000-2004) 0 in
Low estimate (10th percentile)
Middle range (25th to 75th percentile)
High estimate (90th percentile)
2020s 2 in 4-8 in 10 in
2050s 8 in 11-21 in 30 in
2080s 13 in 18-39 in 58 in
2100 15 in 22-50 in 75 in
Note Projections are based on six-component approach that incorporates both local and global factors The model-based components are from 24 global climate models and two representative concentration pathways Projections are relative to the 2000-2004 base period
Table 9 ndash Mean annual changes91
a Temperature Baseline(1971-2000) 54degF
Low estimate (10th percentile)
Middle range (25th to 75th percentile)
High estimate (90th percentile)
2020s + 15degF +20-29degF +32degF
2050s +31degF +41-57degF +66degF
2080s +38degF +53-88degF +103degF
2100 +42degF +58-104degF +121F
b Precipitation Baseline(1971-2000) 501 in
Low estimate (10th percentile)
Middle range (25th to 75th percentile)
High estimate (90th percentile)
2020s -1 percent +1-8 +10
2050s +1 percent +4-11 +13
2080s +2 percent +5-13 +19
2100 -6 percent -1 to +19 +25
Note Based on 35 global climate models (GCMs) and two RCPs Baseline data cover the 1971ndash2000 base period and are from the NOAA National Climatic Data Center (NCDC) Shown are the low estimate (10th percentile) middle range (25th percentile to 75th percentile) and high estimate (90th percentile) These estimates are based on a ranking (from most to least) of the 70 (35 GCMs times 2 RCPs) projections The 90th percentile is defined as the value that 90 percent of the outcomes (or 63 of the 70 values) are the same or lower than Like all projections the NPCC climate change projections have uncertainty embedded within them Sources of uncertainty include data and modeling constraints the random nature of some parts of the climate system and limited understanding of some physical processes The NPCC characterizes levels of uncertainty using state-of-the-art climate models multiple scenarios of future greenhouse gas concentrations and recent peer-reviewed literature Even so the projections are not true probabilities and the potential for error should be acknowledged
89 The NPCC 2015 report is available at httponlinelibrarywileycomdoi101111nyas20151336issue-1issuetoc90 From New York City Panel on Climate Change 2015 Report Chapter 1 Climate Observations and Projections page 4191 From New York City Panel on Climate Change 2015 Report Chapter 1 Climate Observations and Projections page 30
APPENDIX 2 - CLIMATE CHANGE PROJECTIONS
NYC Mayorrsquos Office of Recovery and Resiliency Climate Resiliency Design Guidelines
40APPENDIX 2 - CLIMATE CHANGE PROJECTIONS
Table 10 ndash Extreme events92
2020s Baseline (1971-2000)
Low estimate(10th percentile)
Middle range(25th to 75th percentile)
High estimate (90th percentile)
Numbers of heat waves per year 2 3 3-4 4
Average heat wave duration (days) 4 5 5 5
Number of days per year with
Maximum temperature at or above 90degF 18 24 26-31 33
Maximum temperature at or above 100degF 04 07 1-2 2
Minimum temperature at or below 32degF 71 50 52-58 60
Rainfall at or above 1 inch 13 13 14-15 16
Rainfall at or above 2 inches 3 3 3-4 5
Rainfall at or above 4 inches 03 02 03ndash04 05
2050s Baseline (1971-2000)
Low estimate(10th percentile)
Middle range(25th to 75th percentile)
High estimate (90th percentile)
Numbers of heat waves per year 2 4 5-7 7
Average heat wave duration (days) 4 5 5-6 6
Number of days per year with
Maximum temperature at or above 90degF 18 32 39-52 57
Maximum temperature at or above 100degF 04 2 3-5 7
Minimum temperature at or below 32degF 71 37 42-48 52
Rainfall at or above 1 inch 13 13 14-16 17
Rainfall at or above 2 inches 3 3 4-4 5
Rainfall at or above 4 inches 03 03 03-04 05
2080s Baseline (1971-2000)
Low estimate(10th percentile)
Middle range(25th to 75th percentile)
High estimate (90th percentile)
Numbers of heat waves per year 2 5 6-9 9
Average heat wave duration (days) 4 5 5-7 8
Number of days per year with
Maximum temperature at or above 90degF 18 38 44-76 87
Maximum temperature at or above 100degF 04 2 4-14 20
Minimum temperature at or below 32degF 71 25 30-42 49
Rainfall at or above 1 inch 13 14 15-17 18
Rainfall at or above 2 inches 3 3 4-5 5
Rainfall at or above 4 inches 03 02 03-05 07
Note Projections for temperature and precipitation are based on 35 GCMs and 2 RCPs Baseline data are for the 1971 to 2000 base period and are from the NOAA National Climatic Data Center (NCDC) Shown are the low estimate (10th percentile) middle range (25th to 75th percentile) and high estimate (90th percentile) 30-year mean values from model-based outcomes Decimal places are shown for values less than one although this does not indicate higher precisioncertainty Heat waves are defined as three or more consecutive days with maximum temperatures at or above 90degF Like all projections the NPCC climate change projections have uncertainty embedded within them Sources of uncertainty include data and modeling constraints the random nature of some parts of the climate system and limited understanding of some physical processes The NPCC characterizes levels of uncertainty using state-of-the-art climate models multiple scenarios of future greenhouse gas concentrations and recent peer-reviewed literature Even so the projections are not true probabilities and the potential for error should be acknowledged
92 From New York City Panel on Climate Change 2015 Report Chapter 1 Climate Observations and Projections page 31
NYC Mayorrsquos Office of Recovery and Resiliency Climate Resiliency Design Guidelines
41APPENDIX 3 - DIFFERENTIATION OF FLOOD MAPS
These Guidelines reference several different kinds of flood maps and sources of design flood elevations These maps are described and differentiated below
Table 11 - Differentiation of flood maps used in NYC
Reference Title Data Source Information Provided Referenced By Link
2007 FIRM FEMA
Based on historical data from before 1983 identifies the current base flood (extent and elevation) as the flood that has a 1 chance of occurring in any given year also known as a 100-year flood The NYC Building Code requires that either the 2007 FIRM or 2015 PFIRM elevation be used whichever is higher
2014 NYC Building Code Appendix G
Climate Resiliency Design Guidelines
httpsmscfemagovportal
2015 PFIRM FEMA
Based on historical data identifies the current base flood (extents and elevation) as the flood that has a 1 chance of occurring in any given year also known as a 100-year flood The NYC Building Code requires that either the 2007 FIRM or 2015 PFIRM elevation be used whichever is higher The 2015 PFIRM is currently being reassessed by FEMA
2014 NYC Building Code Appendix G
Climate Resiliency Design Guidelines
httpshazardsfemagovfemaportalprelimdownload
httpwwwregion2coastalcomview-flood-maps-dataview-preliminary-flood-map-data
NYC Flood Hazard Mapper
NYC Department of City Planning
Maps current and future flood hazards in NYC including the following data layers 2007 FIRM and 2015 PFIRM high tide with sea level rise and PFIRM with sea level rise through 2100
Climate Resiliency Design Guidelines
Waterfront Revitalization Plan
httpwww1nycgovsiteplanningdata-mapsflood-hazard-mapperpage
ldquoTable 4 ndash Determine the sea level rise-adjusted design flood elevation for critical and non-critical facilitiesrdquo
ORR amp NPCC
Provides data to use when adding sea level rise to a given 2015 PFIRM or 2007 FIRM Base Flood Elevation (BFE) to calculate a Design Flood Elevation (DFE) Based on the criticality and expected useful life of a facility
Climate Resiliency Design Guidelines
See Section II on ldquoSea Level Riserdquo above
APPENDIX 3 - DIFFERENTIATION OF FLOOD MAPS
NYC Mayorrsquos Office of Recovery and Resiliency Climate Resiliency Design Guidelines
42APPENDIX 4 - PROJECT BENEFITS CATEGORIES
This appendix provides guidance on how to identify and assess benefits as a supplement to Sections IIID and IIIE
Table 12 lists typical direct benefits for reducing impacts from climate stressors and basic guidance for how to estimate them See Section IIID for more information
Table 13 lists typical indirect benefits for reducing impacts from climate stressors and basic guidance for how to estimate them See Section IIID for more information
Table 12 ndash Direct benefits for (1) sea level rise with coastal storm surge and (2) increased precipitation measures
Direct Benefit Basic Guidance for Estimating Values
Physical Damages (Structure Contents)
bull For flood-damaged buildings use depth damage functions developed by FEMA and USACE for structures and contents
bull Use depth damage functions in conjunction with Building Replacement Values (BRVs) and not market values BRVs typically range between $100 to $325SF for residential buildings and $120 to $450SF for commercial public buildings
bull For more complex structures or facilities use engineering estimates of flood damages or review historic flood damages documented from insurance claims repair records or FEMA Public Assistance claims from recent flood disasters
Residential Displacements
bull For flood-damaged buildings use depth damage functions developed by FEMA and USACE for residential displacements
Reduced Life CycleOperation and Maintenance (OampM) Costs93
bull Applicable only to projects that reduce overall life cycle costs or net annual OampM costs from baseline conditions
bull Input reduced annual OampM costs as a project benefit at a 1-year recurrence intervalbull Reduced overall life cycle costs can be input as a longer project useful life
Table 13 ndash Indirect benefits for (1) sea level rise with coastal storm surge and (2) increased precipitation measures
Indirect Benefit Basic Guidance for Estimating Values
Non-Residential Building Service Losses
bull Estimate service loss values and durations for non-residential buildings public buildings critical facilities and parksnatural features based on FEMA BCA guidance and standard values based on building use
Utility Service Losses94
bull Estimate utility service losses for water wastewater and electrical facilities based on the number of impacted customers FEMA per capita standard values for utility service ($105personday for potable water $49personday for wastewater $148personday for electrical)95
bull Estimate utility service loss durations based on engineering estimates or review historic flood damages losses documented from utility company records
bull This benefit can also apply to measures that increase energy efficiency
RoadBridge Service Losses
bull Estimate roadbridge service losses based on the average daily traffic (ADT) detour time and additional travel distance and FEMA and GSA standard values for road service ($3344vehiclehour of delay $0545mile)96
bull Estimate roadbridge service loss durations or review historic flood damages losses
Emergency Service Losses
bull Applicable only to projects that reduce or eliminate documented emergency service costs from baseline conditions
bull Examples of avoided emergency services costs include NYPD staffing to monitor barricades for flooded roads or NFDY staffing for water rescues of residents from flooded buildings or streets
APPENDIX 4 - PROJECT BENEFITS CATEGORIES
93 Reduced life cycle costs may be applicable to some measures that provide extreme heat benefits such as green roofs that can last longer than a standard roof if properly maintained
94 Reduced utility service costs may be applicable to some measures that provide extreme heat benefits such as cool roofs green roofs and shade trees
95 FEMA per capita standard values taken from FEMA BCA Toolkit Version 530 (Build Date 12222016) and developed in FEMArsquos Baseline Standard Economic Value Methodology Report (July 28 2016) Consider updating FEMA standard per capita values to reflect current New York City utility rates
96 Consider updating FEMA and GSA standard values to reflect current New York City area labor rates and fuel costs
NYC Mayorrsquos Office of Recovery and Resiliency Climate Resiliency Design Guidelines
43APPENDIX 4 - PROJECT BENEFITS CATEGORIES
Table 14 ndash Other potential benefits for (1) sea level rise with coastal storm surge and (2) increased precipitation measures
Other Benefit Basic Guidance for Estimating Values
Avoided Stress and Anxiety
bull Applicable only for projects that directly benefit occupants of residential structuresbull Use FEMA standard value for avoided mental stress and anxiety treatment costs of $2443person to
estimate benefit for all impacted residents97
Avoided Lost Productivity
bull Applicable only for projects that directly benefit occupants of residential structuresbull Use FEMA standard value for avoided lost worker productivity costs of $8736household to estimate
benefit for all impacted workers (conservatively assuming one worker per household)
Environmental Open Space
bull Applicable only for projects that create or acquire open space areas by acquisitionbull Use FEMA standard value for environmental open space based on the type of land acquired ($8308
Acreyear for Green open space $39545Acreyear for Riparian $6010Acreyear for Wetlands $554Acreyear for Forests $1799Year for Marine and estuary)97
CSO Volume Reduction
bull Applicable only for projects that provide Combined Sewer Overflow (CSO) abatement by reducing the volume of rainfall runoff
bull Use CSO abatement cost of $0015gallonsyear applied to increased precipitation hazard runoff volume for 5-year design storm98
Ecosystem Service99
bull Add stormwater management benefits of green infrastructure projects to increased precipitation hazards where avoided damages and service losses are not quantified
bull Unit benefits applicable to increased precipitation hazard includeo Green roofs $0133SFyear (PUL 40 years)o BioswaleRain GardenMeadow Mix $0020SFyear (PUL 30 years)o Permeable Grass Pavers $0020SFyear (PUL 30 years)o Tree Plantings $303Treeyear (PUL 30 years)o Planter Box Trees $101Treeyear (PUL 15 years)
Real Estate99
bull Potential real estate benefits from increased resilience of residential andor commercial propertiesstreetscapesneighborhoods included within the project scope
bull Benefit applied to extreme heat hazard for green infrastructure projects directly impacting residential or commercial properties
Quality of Life Health Benefits99
bull Potential quality of life benefits related to improved public health from the resilience measures included within the project scope
bull Benefit applied to extreme heat hazard for green infrastructure projects directly impacting residential or commercial properties
Table 14 lists other typical benefits for reducing impacts from climate stressors and basic guidance for how to estimate them See Section IIID for more information
97 FEMA standard values for avoided mental stress and anxiety and environmental open space values taken from FEMA BCA Toolkit Version 530 (Build Date 12222016)
98 CSO abatement cost taken from APG1 Report for NYC ldquoTechnical Approaches for Benefit-Cost Analysis of Hazard Mitigation Projects in Urban and Coastal Environmentsrdquo (April 2016)
99 Ecosystem Services Real Estate and Quality of LifeHealth benefits tend to be more applicable to green infrastructure measures that provide extreme heat benefits such as green roofs trees and other plantings
NYC Mayorrsquos Office of Recovery and Resiliency Climate Resiliency Design Guidelines
44APPENDIX 4 - PROJECT BENEFITS CATEGORIES
Table 15 ndash Potential benefits for extreme heat (Urban Heat Island) reduction measures
Category Benefit Basic Guidance for Estimating Values
Direct Benefit
Reduced Life Cycle Cost
bull Applicable only to measures such as green roofs that are expected to last longer than standard roofs
bull Compute total cost savings including annual OampM costs
Indirect Benefit
Energy Savings
bull Applicable to measures that reduce energy costs by providing cooling through increased shading andor evapotranspiration
bull Use New York Power Authority rates of $0148kWh for electricity and $0810Therm for natural gas
Other Potential Benefits
Air Quality bull Applicable to measures that absorb pollutants andor reduce carbon dioxide emissions
Acoustics bull Applicable to measures such as green roof or walls that reduce noise transfer
Quality of LifeHealth bull Potential quality of life benefits and related to improved public health
Real Estate bull Applicable to measures that provide residential real estate benefits from increased resilience of propertiesstreetscapesneighborhoods
Retail Sales Marketing
bull Applicable to measures that provide commercial property benefits from increased aesthetics resulting in increased marketing and sales for streetscapesneighborhoods
Tax Credits Incentives
bull Applicable to resilience or green infrastructure measures such as green roofs that have accompanying Federal State or City tax credits or other incentives
Table 15 lists potential benefits for reducing impacts from heat and basic guidance for how to estimate them See Section IIID for more information
NYC Mayorrsquos Office of Recovery and Resiliency Climate Resiliency Design Guidelines
45APPENDIX 4 - PROJECT BENEFITS CATEGORIES
Table 16 ndash Guidance on quantitative calculations for (1) sea level rise with coastal storm surge and (2) increased precipitation measures
Data Input General Guidance ndash Basic Description
Applicable Benefit Category
Applicable Typical Facility Typology
Dire
ct B
enefi
ts
Indi
rect
Ben
efits
Oth
er P
oten
tial
Ben
efits
Bui
ldin
g St
ruct
ures
Com
plex
Fa
cilit
ies
Tran
spor
tatio
nSt
reet
scap
es
Plaz
as
Park
Fea
ture
s
First Floor Elevation (FFE)
bull The elevation of the first finished floor of the structure excluding basements
bull FFE measured from top of lowest floor (riverinenon-coastal high hazard areas) or bottom of lowest horizontal structural member (coastal high hazard areas)
Y Y Y Y
Building Replacement Value (BRV)
bull The unit cost to rebuild a structure of the same quality of construction
bull Not the same as market value
Y Y Y Y
Building Size
bull The total floor area of the building in square feet
bull Total Building Value = BRV x Building Sizebull Typical BRVs for NYC range between $100 to
$325SF for residential buildings and $120 to $450SF for commercialpublic buildings
Y Y Y Y
Structure Description
bull The type of building number of stories and foundation type (full basement partial basement no basement)
bull Collect more detailed foundation data for coastal flood zones
Y Y Y Y
Building Use bull Details related to residential housing commercial business and public use
Y Y Y Y Y
Building Type bull The primary use of building ndash residential commercial public and others
Y Y Y Y Y
Depth Damage Function (DDF)
bull Curves used to estimate structure damage contents damage and displacement of residential buildings based on flood depth
bull DDFs selection based on Structure Description Building Type Building Use
bull Structure DDFs based on percentage of Total Building Value
bull Contents DDFs based on percentage of Total Contents Value
bull Displacement DDFs based on number of displacement days x Displacement Cost
Y Y Y Y Y
Contents Value
bull The cost to replace structure contents (furnishings equipment)
bull Residential building Contents Values typically 50 BRV (FEMA DDFs) or 100 BRV (USACE DDFs)
bull Non-residential building Contents Values between 18 to over 100 depending on building use (USACE DDFs)
bull Total Contents Value = BRV x Building Size
Y Y Y Y Y
Table 16 provides general guidance on how to quantitatively calculate benefits from efforts to address from climate stressors See Section IIIE for more information
NYC Mayorrsquos Office of Recovery and Resiliency Climate Resiliency Design Guidelines
46APPENDIX 4 - PROJECT BENEFITS CATEGORIES
Table 16 ndash Guidance on quantitative calculations for (1) sea level rise with coastal storm surge and (2) increased precipitation measures
Data Input General Guidance ndash Basic Description
Applicable Benefit Category
Applicable Typical Facility Typology
Dire
ct B
enefi
ts
Indi
rect
Ben
efits
Oth
er P
oten
tial
Ben
efits
Bui
ldin
g St
ruct
ures
Com
plex
Fa
cilit
ies
Tran
spor
tatio
nSt
reet
scap
es
Plaz
as
Park
Fea
ture
s
Number of Residents (Residential)
bull Total number of occupants in a residential building
bull Typically estimated based on number of residential units x average number of individuals per household (based on current US Census data or use 25 individuals per household as a default)
Y Y Y Y Y
Displacement Cost (Residential)
bull The unit cost to lodge and feed displaced residents while flood damage is repaired
bull Average unit displacement cost of $415residential unitday recommended based on current FY2018 GSA Per Diem rates for New York City
Y Y Y Y Y
Value of Service (Non-Residential and Public)
bull The unit cost of service disruption and rental of temporary facilities while flood damage is repaired
bull Disruption costs for non-residential buildings typically range from $095 to $136SFmonth and rental costs range from $020 to $136SFmonth depending on building use
bull Value of service for public buildings ($day) is typically based on the annual operating budget for the City agency using the building prorated based on building size or population served by the building then divided by 365 daysyear
Y Y Y Y
Value of Service (Critical Facilities)
bull The unit cost of critical facilities (police fire emergency medical services) lost or delayed while flood damage is repaired
Y Y Y
Value of Service Duration
bull The duration of service disruption and rental of temporary facilities for non-residential buildings and critical facilities while flood damage is repaired
bull For non-residential buildingso Value of Service Durations vary from
4 months to over 30 months based on building use and the depth of flooding
o Total Value of Service Loss = (Disruption Cost x Building Area) = (Rental Cost x Building Area x Value of Service Duration)
bull For public buildings and critical facilitieso Value of Service Durations vary from 0
days to 720 months based on building use and the depth of flooding from FEMA FIA or USACE DDFs
o Total Value of Service Loss = (Value of Service) x (Service Loss Duration)
Y Y Y
NYC Mayorrsquos Office of Recovery and Resiliency Climate Resiliency Design Guidelines
47APPENDIX 4 - PROJECT BENEFITS CATEGORIES
Table 16 ndash Guidance on quantitative calculations for (1) sea level rise with coastal storm surge and (2) increased precipitation measures
Data Input General Guidance ndash Basic Description
Applicable Benefit Category
Applicable Typical Facility Typology
Dire
ct B
enefi
ts
Indi
rect
Ben
efits
Oth
er P
oten
tial
Ben
efits
Bui
ldin
g St
ruct
ures
Com
plex
Fa
cilit
ies
Tran
spor
tatio
nSt
reet
scap
es
Plaz
as
Park
Fea
ture
s
Engineering Estimates for Damages
bull Engineered estimate models of physical damages and service losses at the project site based on the Guidelines event recurrence interval(s) and flood depth(s)
Y Y Y Y Y Y
Historic Damages and Service Losses
bull Historic physical damages and service losses at the project site documented from previous flood events
bull Do not use routine maintenancebull The historic damage event recurrence interval
(RIs) andor flood depths must be determined updated for inflation to the present value and adjusted to match the Guidelines event RIsflood depths
Y Y Y Y Y Y
Facility Replacement Value
bull The unit cost to rebuild the facility
Impacted Area bull The geographic area impacted by the facility in the event of failure in acres
Y Y Y Y
Facility Capacity
bull The design capacity of the facilitybull For example - facility capacity expressed in
millions of gallons per day (MGD) for water and wastewater facilities or megawatts (MW) for electrical facilities
Y Y Y Y
Service Population
bull The number of impacted residents served by the facility
bull Typically estimated based on number of impacted residential customers x average number of individuals per household (based on current US Census data or use 25 individuals per household as a default)
bull Facilities serving mostly non-residentialpublic buildings andor critical facilities should focus on service losses rather than service population
Y Y Y
NYC Mayorrsquos Office of Recovery and Resiliency Climate Resiliency Design Guidelines
48APPENDIX 4 - PROJECT BENEFITS CATEGORIES
Table 16 ndash Guidance on quantitative calculations for (1) sea level rise with coastal storm surge and (2) increased precipitation measures
Data Input General Guidance ndash Basic Description
Applicable Benefit Category
Applicable Typical Facility Typology
Dire
ct B
enefi
ts
Indi
rect
Ben
efits
Oth
er P
oten
tial
Ben
efits
Bui
ldin
g St
ruct
ures
Com
plex
Fa
cilit
ies
Tran
spor
tatio
nSt
reet
scap
es
Plaz
as
Park
Fea
ture
s
Value of Service
bull Unit value of service provided by the facilitybull Example of FEMA standard values for complete
loss of utility service $105personday for potable water$49personday for wastewater$148personday for electrical
bull Consider updating FEMA standard per capita values to reflect current The New York City utility rates
Y Y
Roadway Elevations bull Roadway Elevations
Y Y
Roadway Replacement Value
bull Roadway Replacement ValueY Y
Inundation Area Map
bull Inundation Area Map developed by FEMA or through modeling by project design team
Y Y Y
Building Inventory of Inundation Area
bull The number and type of buildings within the streetscape and neighborhood inundated by the Guidelinersquos flood events
Y Y Y
Average Daily Traffic (ADT)
bull The average number of one-way traffic trips per day along the roadway(s) within the streetscapeneighborhood inundated by the Guidelinersquos flood events
Y Y
Additional Travel Time
bull The additional travel time needed to detour around a flooded roadway expressed in minutes
bull In the unlikely event there is no detour available use a 12-hour travel time per one-way trap but provide a detailed area street map as supporting documentation
Y Y
Value of Traffic Delay
bull The value of service associated with lost time in traffic
bull For example - FEMA standard average value of $3344vehiclehour of delay
bull Consider updating FEMA and GSA standard values to reflect current New York City area labor rates and fuel costs
Y Y
NYC Mayorrsquos Office of Recovery and Resiliency Climate Resiliency Design Guidelines
49APPENDIX 4 - PROJECT BENEFITS CATEGORIES
Table 17 ndash Guidance on quantitative unit benefit calculations for extreme heat hazard measures
Measure General Guidance ndash Unit Benefit Information and Data Requirements
Applicable Benefit Category
Applicable Typical Facility Typology
Dire
ct B
enefi
ts
Indi
rect
Ben
efits
Oth
er P
oten
tial
Ben
efits
Bui
ldin
g St
ruct
ures
Com
plex
Fa
cilit
ies
Tran
spor
tatio
nSt
reet
scap
es
Plaz
as
Park
Fea
ture
s
Green Roof
bull Unit benefit range over PUL = $470SF to $373SF of green roof area ($719SF standard value)
bull Assumed PUL = 40 yearsbull Apply standard value unit benefit to green
roof area to estimate measure benefitbull Higher range values more applicable
to residential and commercial building streetscape projects
Y Y Y Y Y Y
Bioswale Rain Garden Meadow Mix
bull Unit benefit range over PUL = $396SF to $211SF of area ($730SF standard value)
bull Assumed PUL = 30 yearsbull Apply standard value unit benefit to bioswale
rain gardenmeadow mix area to estimate total measure benefit
Y Y Y Y Y Y
Cool Roof
bull Unit benefit range over PUL = $117 to $3151SF of material area ($144SF standard value)
bull Assumed PUL = 20 yearsbull Apply standard value unit benefit to cool roof
area to estimate total measure benefitbull Higher range values more applicable to
residential building streetscape projects
Y Y Y Y Y
Light-Colored PaversLight-Colored Materials
bull Unit benefit range over PUL = $0774 to $204SF of material area ($0866SF standard value)
bull Assumed PUL = 30 yearsbull Apply standard value unit benefit to material
area to estimate total measure benefit
Y Y Y Y
Table 17 provides general guidance on how to quantitatively calculate benefits from efforts to address climate stressors See Section IIIE for more information
NYC Mayorrsquos Office of Recovery and Resiliency Climate Resiliency Design Guidelines
50APPENDIX 4 - PROJECT BENEFITS CATEGORIES
Table 17 ndash Guidance on quantitative unit benefit calculations for extreme heat hazard measures
Measure General Guidance ndash Unit Benefit Information and Data Requirements
Applicable Benefit Category
Applicable Typical Facility Typology
Dire
ct B
enefi
ts
Indi
rect
Ben
efits
Oth
er P
oten
tial
Ben
efits
Bui
ldin
g St
ruct
ures
Com
plex
Fa
cilit
ies
Tran
spor
tatio
nSt
reet
scap
es
Plaz
as
Park
Fea
ture
s
Tree Planting
bull Unit benefit range over PUL = $1005 to $77154Tree ($1855Tree standard value)
bull Assumed PUL = 30 yearsbull Apply standard value unit benefit to number of
trees to estimate total measure benefitbull Higher range values more applicable
to residential and commercial building streetscape projects
Y Y Y Y Y Y
Planter Box Tree
bull Unit benefit range over PUL = $212 to 16304Tree ($392Tree standard value)
bull Assumed PUL = 15 yearsbull Apply standard value unit benefit to number of
trees to estimate total measure benefitbull Higher range values more applicable
to residential and commercial building streetscape projects
Y Y Y Y Y
Shade Canopy
bull Unit benefit range over PUL = $0363 to $396SF ($0458SF standard value)
bull Assumed PUL = 15 yearsbull Apply standard value unit benefit to area of
shade canopy estimate total measure benefitbull Higher range values more applicable
to residential and commercial building streetscape projects
Y Y Y Y
Permeable Grass Pavers
bull Unit benefit range over PUL = $0258SF to $0521SF of pavers ($0363SF standard value)
bull Assumed PUL = 30 yearsbull Apply standard value unit benefit to paver
area to estimate total measure benefit
Y Y Y Y Y
For the purposes of the BCA refer to the following facility typologies bull ldquoBuilding Structuresrdquo include critical small building sites such as EMS or FDNY stations and non-critical small building sites such as
libraries or comfort stationsbull ldquoComplex Facilitiesrdquo include critical infrastructure such as wastewater treatment sites pump stations water filtration plants and similar
large or complex facilitiesbull ldquoTransportationStreetscapePlazasrdquo include roadway reconstruction streetscape improvements street raising plazas and other
transportation-related infrastructurebull ldquoPark Featuresrdquo include parks and similar public recreational facility with natural landscape features
NYC Mayorrsquos Office of Recovery and Resiliency Climate Resiliency Design Guidelines
51APPENDIX 5 - EXAMPLE PLANNING DECISION TREE
This decision tree provides a summarized example approach for how to implement these Guidelines Projects with a total cost greater than $50 million are recommended to conduct a full qualitative and quantitative climate change risk assessment and BCA while projects below $50 million are recommended to conduct a qualitative risk assessment and BCA
Define Project
1) Operational goals and criticality level2) Useful life3) Location in the current flood plain future floodplain and or zone
of tidal inundation and the project arearsquos score on the heat vulnerability index
Evaluate Project Risks According to Probability and Magnitude of Consequence
bull Extreme Heat bull Precipitationbull Sea Level Risebull Coastal Surge
High Level Identification and Assessment of Risk Mitigation Alternatives and Co-benefits
(qualitative)
Detailed Identification and Assessment of Risk Mitigation Alternatives and Co-benefits (qualitative and quantitative)
High Level Estimate of Costs and Benefits of Design Alternatives
(qualitative)
Detailed Estimate of Costs and Benefits of Design Alternatives
(qualitative and quantitative)
Decision Point Which climate change risks require mitigation
Decision Point Evaluate risk mitigation benefits and costs to
determine final resilient design alternative or if no action is required
Decision Point Is the total project cost above $50 million
Below $50 million Above $50 million
APPENDIX 5 - EXAMPLE PLANNING DECISION TREE
NYC Mayorrsquos Office of Recovery and Resiliency Climate Resiliency Design Guidelines
52
Project Title
Design Strategies Checklist (not exhaustive)
Extreme Heat Comments Extreme Precipitation Comments Sea Level Rise amp Storm Surge Comments
Select Site in Low Heat Vulnerability Index area Select High Elevation Site Select High Elevation Site
Minimize East-West Building Orientation Green Roof Raise Building Floor Elevation
Passive Solar Cooling and Ventilation Systems
Protect Below Grade Areas from Flooding Waterproof Building Envelope
Cool Roof (SRI appropriate) On-site Stormwater Management (gray) Elevate Critical Building Functions
Green Roof (extensive) Reduce Impervious Areas Elevate Critical Equipment
Vegetative Structures Permeable Pavement Perimeter Floodwall100 Levee (passive or active)
Enhanced HVAC System including space layout optimization and system scalability
Increase Green Spaces and Planted Areas DryWet Floodproofing
More Efficient Building Envelope Other Utility Redundancy Design101
Parking Lot Shading Resilient Materials amp Landscape Treatments
Light Colored Pavements (appropriate SRI) Design for Storm Surge Outflow
Increase Planted Areas Install Backwater Flow Prevention
Permeable Surfaces Design for Scour
Open-grid Pavement Raise Road Elevation
Other Other
This appendix provides a template for identifying possible design strategies to address climate change risks as described throughout the Guidelines
APPENDIX 6 - DESIGN STRATEGIES CHECKLIST
100 Permanent perimeter flood walls are not permitted to meet floodproofing requirements in buildings with substantial improvements andor damages 101 Utility redundancy design should be pursued for critical systems not all building systems
APPENDIX 6 - DESIGN STRATEGIES CHECKLIST
NYC Mayorrsquos Office of Recovery and Resiliency Climate Resiliency Design Guidelines
53APPENDIX 7 - CLIMATE CHANGE RISK ASSESSMENT RESOURCES
These Guidelines provide data on climate change hazards and recommend how that data can inform resilient design A risk assessment is a tool to help project managers and designers evaluate risk levels as well as select and prioritize resilient design strategies A high level risk assessment is recommended for all City capital projects with a total cost of under $50 million Projects above $50 million are recommended to conduct an in-depth assessment
Risk assessments use quantified estimates of the probability and magnitude of consequence of an event occurring to prioritize responses ldquoProbabilityrdquo is an assessment of the likelihood of a hazard occurring while ldquomagnituderdquo describes the hazardrsquos potential impact Risk assessment tools such as the examples listed below can be used to define and score these categories Projects that score higher across both probability and magnitude can be prioritized for investment and risk mitigation action Projects that score lower across both criteria may require no action beyond meeting code The results are typically charted on a risk matrix and an example is provided on the next page
The climate change risk management frameworks below offer templates for how to integrate climate change projections into a risk assessment process Refer to these resources for examples and further information
bull Vulnerability Assessment and Adaptation Framework is prepared by the Federal Highway Administration (FHWA) While developed for transportation planning this risk assessment framework has broad applicability for evaluating asset vulnerability to climate change Available at httpswwwfhwadotgovenvironmentsustainabilityresilienceadaptation_framework
bull US Climate Resilience Toolkit The US Global Change Research Program offers a step by step risk assessment
framework including tools and case studies at httpstoolkitclimategovsteps (see example on next page)
bull Coast Adapt Guidance on undertaking a risk assessment High level assessment httpscoastadaptcomausitesdefaultfilesfactsheetsT3M4_2_2nd_pass_risk_assessmentpdfDetailed assessment httpscoastadaptcomausitesdefaultfilesfactsheetsT3M4_3_3rd_pass_risk_assessmentpdf
bull Climate adaptation Risk uncertainty and decision-makingDownload the report here httpswwwukciporgukpublicationsRisk
The City plans to develop a NYC-specific process for integrating climate change data into existing risk management processes by April 2019
APPENDIX 7 - CLIMATE CHANGE RISK ASSESSMENT RESOURCES
NYC Mayorrsquos Office of Recovery and Resiliency Climate Resiliency Design Guidelines
54APPENDIX 7 - CLIMATE CHANGE RISK ASSESSMENT RESOURCES
The Risk Characterization Matrix below is an example from the US Climate Resilience Toolkit This tool can be used to assess the probability and magnitude of impact for identified risks The risk of coincident climate stressorsrisks (such as storm surge plus increased precipitation) can also be assessed as applicable
Figure 14 - Example of a climate change risk matrix (adapted from US Climate Resilience Toolkit)
Project teams can determine the magnitude of the impact (along the horizontal scale of 1 through 3 with 3 being the most severe) and the probabilitylikelihood of occurrence for each specific risk (along the vertical scale with 3 being the most likely) A score is typically assigned for each risk (Probabil-ity x Magnitude) and then charted on the matrix Based on the estimated probability and magnitude of consequence above the risks are ranked and prioritized for mitigation Factors to bear in mind include
bull Not all facility typologies have the same level of functional and operational importance during events or tolerance for disruption
bull Not all climate stressors and risks have the same level of impact on each project sitebull Not all identified risks can or should be mitigated fully
NYC Mayorrsquos Office of Recovery and Resiliency Climate Resiliency Design Guidelines
55WORKS CITED
A Stronger More Resilient New York PlaNYC Report of the NYC Special Initiative for Rebuilding and Resiliency The City of New York 2013
ldquoAccount for Climate Riskrdquo International Finance Corporation accessed March 27 2017 httpwwwifcorgwpswcmconnectTopics_Ext_ContentIFC_External_Corporate_SiteClimate+Business
PrioritiesAccount+for+Climate+Risk
American Society of Heating Refrigeration and Air-Conditioning Engineers (ASHRAE) Handbook -Fundamentals 2017
ldquoBaseline Standard Economic Value Methodology Reportrdquo Federal Emergency Management Agency July 2016
Benefit Cost Analysis Toolkit Software Version 530 Federal Emergency Management Agency (build date December 2016)
Criteria for Detention Facility Design New York City Department of Environmental Protection November 2012
Community Resilience Planning Guide for Buildings and Infrastructure Systems Vol 1 NIST Special Publication 1190 US Department of Commerce 2016
Cool and Green Roofing Manual NYC Department of Design and Construction 2007 httpwwwnycgovhtmlddcdownloadspdfcool_green_roof_manpdf
Building Resiliency Task Force US Urban Green Building Council New York 2013 httpurbangreencouncilforcecomBuildingResiliency
Design and Planning for Flood Resiliency Guidelines for NYC Parks New York City Department of Parks and Recreation 2017
httpswwwnycgovparksorgplanning-and-buildingplanningresiliency-plansflood-resiliency
Flooded Bus Barns and Buckled Rails Federal Transit Administration Office of Budget and Policy 2011 httpswwwhsdlorgabstractampdid=685187
Floodproofing Non-Residential Buildings FEMA P936 FEMA 2013 httpswwwfemagovmedia-library-data9a50c534fc5895799321dcdd4b6083e7P-936_8-20-13_508rpdf
ldquoGlossaryrdquo International Infrastructure Management Manual National Asset Management Support Group New Zealand 2011 httpwwwipweaorg
ldquoGreen Roof Metrics Draft Reportrdquo New York City Department of Parks and Recreation 2017
ldquoGuide to Rain Event Preparednessrdquo NYC Department of Environmental Protection httpwwwnycgovhtmldeppdfbrochuresflood-preparedness-flyerpdf
ldquoGuidelines and Discount Rates for Benefit-Cost Analysis of Federal Programsrdquo Appendix C Circular A-94 US Office of Management and Budget (OMB) 2017
ldquoGuidelines for the Design and Construction of Stormwater Management Systemsrdquo New York City Department of Environmental Protection July 2012
Horton R et al New York City Panel on Climate Change 2015 Report Ann NY Acad Sci ISSN 0077-892 New York 2015
Madrigano J et al ldquoA case-only study of vulnerability to heat wavendashrelated mortality in New York City (2000ndash2011)rdquo Environmental Health Perspectives 123672ndash678 2013
WORKS CITED
NYC Mayorrsquos Office of Recovery and Resiliency Climate Resiliency Design Guidelines
56WORKS CITED
enspMcGregor et al Two Degrees The Built Environment and Our Changing Climate Routledge Press 2013
NYC Green Codes Task Force US Green Building Council New York 2010 httpurbangreencouncilorgGreenCodes
NYCrsquos Risk Landscape A Guide to Hazard Mitigation NYC Emergency Management 2014
One New York The Plan for a Strong and Just City The City of New York 2015 httpwwwnycgovhtmlonenyc downloadspdfpublicationsOneNYCpdf
Ready to Respond Strategies for Multifamily Building Resilience Enterprise Green Communities 2015 httpswwwenterprisecommunityorgresources
Rosenzweig C et al Climate Change Adaptation in New York City Building a Risk Management Response New York City Panel on Climate Change 2010
httponlinelibrarywileycomdoi101111nyas20101196issue-1 issuetoc
ldquoSustainable Infrastructure Management Program Learning Environmentrdquo Water Environment Research Foundation accessed March 24 2017 httpsimplewerforg
Urban Waterfront Adaptive Strategies NYC Department of City Planning 2013 httpwww1nycgovsiteplanningplanssustainable-communitiesclimate-resiliencepagetab=1
Wastewater Resiliency Plan Climate Risk Assessment and Adaptation Study New York City Department of Environmental Protection October 2013
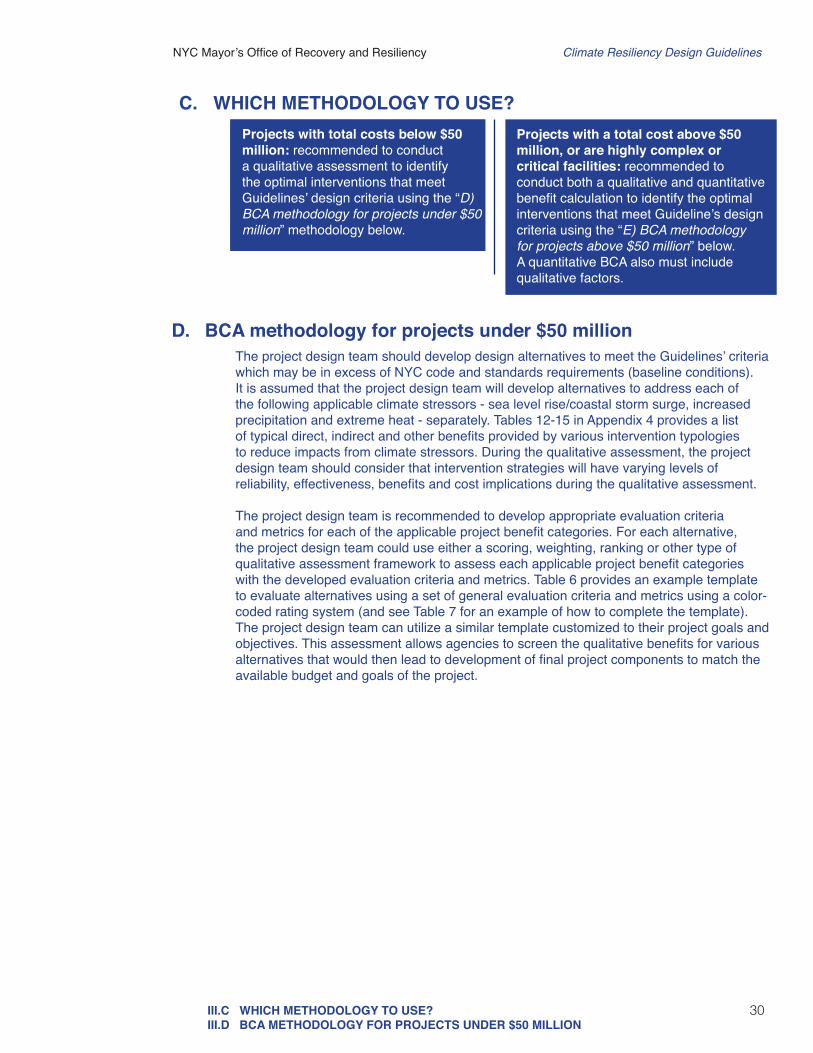
NYC Mayorrsquos Office of Recovery and Resiliency Climate Resiliency Design Guidelines
30IIIC WHICH METHODOLOGY TO USEIIID BCA METHODOLOGY FOR PROJECTS UNDER $50 MILLION
D BCA methodology for projects under $50 millionThe project design team should develop design alternatives to meet the Guidelinesrsquo criteria which may be in excess of NYC code and standards requirements (baseline conditions) It is assumed that the project design team will develop alternatives to address each of the following applicable climate stressors - sea level risecoastal storm surge increased precipitation and extreme heat - separately Tables 12-15 in Appendix 4 provides a list of typical direct indirect and other benefits provided by various intervention typologies to reduce impacts from climate stressors During the qualitative assessment the project design team should consider that intervention strategies will have varying levels of reliability effectiveness benefits and cost implications during the qualitative assessment
The project design team is recommended to develop appropriate evaluation criteria and metrics for each of the applicable project benefit categories For each alternative the project design team could use either a scoring weighting ranking or other type of qualitative assessment framework to assess each applicable project benefit categories with the developed evaluation criteria and metrics Table 6 provides an example template to evaluate alternatives using a set of general evaluation criteria and metrics using a color-coded rating system (and see Table 7 for an example of how to complete the template) The project design team can utilize a similar template customized to their project goals and objectives This assessment allows agencies to screen the qualitative benefits for various alternatives that would then lead to development of final project components to match the available budget and goals of the project
Projects with total costs below $50 million recommended to conduct a qualitative assessment to identify the optimal interventions that meet Guidelinesrsquo design criteria using the ldquoD) BCA methodology for projects under $50 millionrdquo methodology below
C WHICH METHODOLOGY TO USEProjects with a total cost above $50 million or are highly complex or critical facilities recommended to conduct both a qualitative and quantitative benefit calculation to identify the optimal interventions that meet Guidelinersquos design criteria using the ldquoE) BCA methodology for projects above $50 millionrdquo below A quantitative BCA also must include qualitative factors
NYC Mayorrsquos Office of Recovery and Resiliency Climate Resiliency Design Guidelines
31IIID BCA METHODOLOGY FOR PROJECTS UNDER $50 MILLION
Qualitative Color Scale Green=Least resource intensive alternative Purple=most resource intensive yellow=medium level of resource intensity
Qualitative Evaluation Factors Description Relative Color Rating System
First CostsAdditional construction costs needed to incorporate Guidelinesrsquo recommended resilient design over the baseline project costs
Highest cost ($$$) rated as Purple whereas lowest cost ($) rated as Green
ConstructabilityEase of Implementation
Construction techniques and site conditions such as presence of major utilities conflicts and other conditions which dictate the level of constructability required for each alternative
Difficult to construct rated as Purple whereas easiest to construct rated as Green
Environmental ImpactsCo-BenefitsPermitting
Impacts to the built and natural environment such as circulation noise and hazardous waste plus the level of effort required for permitting (eg interventions in water require highest level of permitting requirement) from each alternative in addition to the baseline project condition
Highest environmental impacts and highest level of effort required for permitting rated as Purple whereas the least impact and level of effort rated as Green
Operation and Maintenance (OampM)
Level of effort of additional manpower and cost of OampM for the alternatives over the baseline project OampM requirements
Highest level of effort and cost for OampM rated as Purple whereas the lowest is rated as Green
Reliability and Durability
Interventions that do not require human involvement or a facilityrsquos ability to withstand all the forces during a storm event (eg permanent solutions with higher reliability than deployable solution)
Interventions requiring human involvement (active measures) rated as Purple whereas interventions with minimal or no human involvement (passive measures) rated as Green
Risk Reduction Benefits Monetary benefits provided by each intervention alternative in avoided damages over the baseline condition
Lowest potential monetary benefit rated as Purple whereas as highest potential monetary benefit rated as Green
Quality of Life BenefitsVisual Aesthetics
Benefits either to the community such as recreation or safety or serve the community during emergency situations
Lowest potential quality of life benefits rated as Purple whereas as highest potential benefits rated as Green
Table 6 ndash Evaluation matrix for comparison of mitigation alternatives across the useful life of a project
Project title_______________________________________________________________________________
Evaluation Criteria
Baseline Condition (Designed to NYC Building Code and
Standards)
Resilient Design Alternatives for Managing__________________
Alternative 1
Alternative 2
Alternative 3
First Costs
ConstructabilityEase of ImplementationEnvironmental ImpactsCo-BenefitsPermitting
Operation and Maintenance (OampM)
Reliability and Durability
Risk Reduction Benefits
Quality of Life BenefitsVisual Aesthetics
NYC Mayorrsquos Office of Recovery and Resiliency Climate Resiliency Design Guidelines
32IIID BCA METHODOLOGY FOR PROJECTS UNDER $50 MILLION
Table 7 ndash Evaluation matrix for comparison of mitigation alternatives across the useful life of a project - COMPLETED EXAMPLE
Evaluation Criteria
Baseline Condition (Designed to NYC Building Code and
Standards)
Resilient Design Alternatives for Managing Coastal SurgeSLR
Alternative 1Flood proof building built on grade to Guidelines
DFE
Alternative 2 Elevate building structure above Guidelinesrsquo DFE
on columns
Alternative 3 Raise site grade by filing the building site footprint
to Guidelinesrsquo DFE
First CostsBaseline cost for building structure is $15 million
Incremental costs are within 5 over the baseline costs
Incremental costs are between 5-10 over baseline costs
Incremental costs are 20 and more over baseline costs
ConstructabilityEase of Implementation
Relatively easy to construct within site constraints
Similar to baseline conditions since construction requires additional flood proofing only
Moderate challenges to construct foundation structure for columns within site constraints
Extremely challenging to construct within the site constraints Potentially fatal flaw
Environmental ImpactsCo-BenefitsPermitting
No major impacts but may require additional effort to obtain DOB permits with flood proofing and deployable systems
No major impacts but may require additional effort to obtain DOB permits with flood proofing and deployable systems
No major impacts and relatively easy to permit
Potential drainage circulation impacts and challenges to obtain clean fill material for the site
Operation and Maintenance (OampM)
Major OampM costs associated with deployable systems
Major OampM costs associated with deployable systems
Moderate OampM costs associated with proposed elevator for access
Minimal OampM costs since deployable and elevators not required
Reliability and Durability
Least reliability with highest potential risk from flooding during to failure of deployable systems
Least reliability with highest potential risk from flooding during to failure of deployable systems
Moderate reliability with potential risk from flooding limited to elevator shaft only
Highest reliability since deployable are not required to protect building from flooding
Risk Reduction Benefits
Maximum flood risk reduction benefits assuming deployable and flood proofing is effective
Maximum flood risk reduction benefits assuming deployable and flood proofing is effective
Maximum flood risk reduction benefits
Maximum flood risk reduction benefits
Quality of Life BenefitsVisual Aesthetics
Facility may not be operational during the storm event
Facility may not be operational during the storm event
Facility can be potentially operational during the storm event
Facility can be potentially operational during the storm event
Qualitative Color Scale Green=Least resource intensive alternative Purple=most resource intensive yellow=medium level of resource intensity
A new non-critical facility with a building structure is proposed on a site that is currently in the 2015 Preliminary FEMA 1 annual chance floodplain with a BFE of 10rsquo (NAVD 88) The baseline conditions DFE to meet existing NYC codes and standards is 11rsquo (NAVD 88) Using the Guidelines recommended design criteria the facilityrsquos DFE is 133rsquo (NAVD 88) and existing grade is around 6rsquo (NAVD 88) The project design team develops three alternatives to meet the Guidelinesrsquo recommended DFE design for the facility Table 7 offers an example of how a qualitative assessment can be used to compare three resilient design alternatives using the evaluation criteria and metrics
CASE STUDY Example of How to Use the Evaluation Matrix
NYC Mayorrsquos Office of Recovery and Resiliency Climate Resiliency Design Guidelines
33IIIE BCA METHODOLOGY FOR PROJECTS OVER $50 MILLION
E BCA methodology for projects over $50 millionIn order for a project to be considered cost-effective a benefit-cost analysis (BCA) assesses if the benefits of a project outweigh its costs or in other words the benefit-cost ratio (BCR) is greater than 10 as illustrated in Equation 1
Equation 1 Benefit-Cost Ratio Formula
BCR =
Where BCR = Benefit-Cost Ratio
BENEFITS = Total project benefits
COSTS = Total project costs
BENEFITSCOSTS
These estimated project benefits are combined with the project costs which are defined as the differential construction and long-term operation and maintenance costs associated with constructing a proposed project to the Guidelinesrsquo recommended design level It is assumed that the baseline project will be designed to the most prevalent NYC codes and standards This benefit methodology should be used to determine the additional project benefit that the Guidelinesrsquo recommended design would provide over the baseline project benefit It is assumed that the project design team will develop alternatives to address each of the following applicable climate stressors - sea level risecoastal storm surge increased precipitation and extreme heat - separately For each alternative the project design team should use the following steps to determine the Benefit-Cost Ratio (BCR)
a) Determine project useful life for design interventions Determining the useful life of the proposed project is an important first step in the
detailed BCA assessment methodologies for two reasons First the project useful life determines what values must be used from the Guidelines to establish the future climate design conditions The various hazard tables in the Guidelines establish design requirements based on useful life ranges through 2039 2040-2069 2070-2099 and 2100+ (2100+ projections are only available for sea level rise) A review of these tables show that the design requirements needed to meet the projected climate hazards increase as the end of useful life range increases Second the useful life determines how long the project will need to be operated and maintained in order to remain technically sound and effective at reducing future damages and losses
b) Determine discount rate for project benefits calculation The cost-effectiveness of projects assessed using the BCR must be done on a net
present value basis meaning the present value of the benefits is compared to the present value of the costs Most project costs are computed for present value based on current cost estimates bids or cost guidance However project benefits - as well as project costs for operation and maintenance - accrue over time into the future and are computed on an annualized basis To address this issue the Present Value Coefficient (PVC) is used to bring these annualized project benefits and OampM costs into the present value As indicated by the formula in Equation 2 the PVC is a function of the Project Useful Life (PUL) and the Discount Rate (DR)
NYC Mayorrsquos Office of Recovery and Resiliency Climate Resiliency Design Guidelines
34
Equation 2 Present Value Coefficient (PVC) Formula
PVC =
Where PVC = Present Value Coefficient
PUL = BCA Project Useful Life based on project type
DR = Discount Rate
The project design team should coordinate with agencies and NYC OMB if needed to determine appropriate discount rates based on funding source project type and other factors This coordination should take place during project initiation phase where total project costs (design and construction) are over $50 million66
c) Develop input data to perform benefit calculations Tables 16 and 17 in Appendix 4 provide a list of typical input data by each climate
stressor needed to perform benefit analysis quantitatively on variety of facilities67 The project design team should use these tables as a reference to identify appropriate input data categories andor additional input data needed to perform benefit analysis on the project
d) Identify applicable project benefit categories to estimate benefits Tables 16 and 17 in Appendix 4 provide a list of typical project benefits by each climate
stressor needed to perform benefit analysis quantitatively on various types of projects The project design team should use these tables as a reference to identify appropriate project benefit categories for each climate stressor to perform benefit analysis on the project
e) Calculate benefits of recommended design interventions for each climate
stressor The input data and applicable project benefits can be assembled along with
incremental project cost data to analyze cost-effectiveness using the FEMA BCA Tool Damage-Frequency Assessment (DFA) module or similar software This analysis will provide a BCR for each alternative which can then be used to compare the alternatives that were developed to mitigate effects from applicable climate stressors The project design team can then use the results from this analysis to identify optimal interventions that provides a balanced solution that provides resiliency benefits within the available project budget
IIIE BCA METHODOLOGY FOR PROJECTS OVER $50 MILLION
[1 ndash (1 + DR) -(PUL)]DR
66 For example a NYC OMB March 2015 memorandum recommends using an annually updated DR as published each year in Appendix C of OMB Circular A-94 The current OMB-recommended discount rates from OMB A-94 Appendix C vary by project useful life and are as follows 21 DR for useful lives of 10 to 19 years 25 DR for useful lives of 20 to 29 years and 28 DR for useful lives of 30 years or greater By contrast FEMA hazard mitigation grants use a DR of 70 for all projects based on the Federal OMB A-94 rate for federally-funded mitigation measures Since these DRs will impact the PVC and the project benefits the project team must ensure that BCA results prepared using an OMB-recommended DR (21 to 28) be updated to reflect the Federal DR (70) when applying for FEMA mitigation grant funds
67 Note the data requirements for the sea level rise and increased precipitation hazards in Table 16 are more detailed than the requirements for the extreme heat hazards due to the less detailed level of analysis available for extreme heat
NYC Mayorrsquos Office of Recovery and Resiliency Climate Resiliency Design Guidelines
35
APPENDICES
NYC Mayorrsquos Office of Recovery and Resiliency Climate Resiliency Design Guidelines
36APPENDIX 1 ndash KEY TERMS
100-year flood (1 annual chance flood)
A flood that has a 1 probability of occurring in any given year The 100-year floodplain is the extent of the area of a flood that has a 1 chance of occurring or being exceeded in any given year
500-year flood (02 annual chance flood)
A flood that has a 02 probability of occurring in any given year The 500-year floodplain is the extent of the area of a flood that has a 02 chance of occurring or being exceeded in any given year
AdaptationAdjustment in natural or human systems to a new or changing environment that seeks to maximize beneficial opportunities or moderate negative effects Successful adaptations contribute to resiliency
Base flood elevation (BFE)The elevation of surface water resulting from a flood that has a 1 annual chance of occurring or being exceeded in any given year The BFE is shown on the Flood Insurance Rate Map (FIRM)69
BluebeltReference to the Department of Environmental Protectionrsquos (DEP) Bluebelt program to preserve natural drainage corridors including streams ponds and other wetland areas Preservation of these wetland systems allows them to perform their functions of conveying storing and filtering storm water
Climate
The average weather (or more rigorously a statistical description of the average in terms of the mean and variability) over a period of time usually 30 years These quantities are most often surface variables such as temperature precipitation and wind Climate in a wider sense is the state including a statistical description of the climate system70
Climate change
Changes in average weather conditions that persist over multiple decades or longer Climate change encompasses both increases and decreases in temperature as well as shifts in precipitation changing risk of certain types of severe weather events and changes to other variables of the climate system
Climate change riskThe chance that investments (such as in capital projects) can be affected by the physical impacts of climate change71 Risks are evaluated as a product of the probability of occurrence and the magnitude of damages or impacts including socioeconomic factors that would result if they did occur (consequences)
Climate change risk assessment
This assessment involves a detailed project-specific analysis that includes a vulnerability and risk assessment often followed by cost-benefit analysis to assess and select investments in climate change risk mitigation Risk is assessed as a function of the magnitude and probability of a given climate change hazard Examples resources are included in Appendix 7
Climate vulnerabilityThe degree to which systems and populations are affected by adverse impacts It is a function of the character magnitude and rate of climate change and variation to which a system is exposed its sensitivity and its adaptive capacity72
Cloudburst An extreme amount of rain in a short period of time often over a small geographic area73
Cooling Degree Day (CDD) A form of degree-day used to estimate the energy requirements for air conditioning or refrigeration when the daily mean temperature is above 65degF
68 All terms are from the US Global Change Research Program (USGCRP) glossary unless otherwise noted The USGCRP glossary is available at httpwwwglobalchangegovclimate-changeglossary
69 ldquoDefinitionsrdquo FEMA last modified March 1 2017 httpswwwfemagovnational-flood-insurance-programdefinitions70 UKCIP Glossary httpwwwukciporgukglossary71 ldquoAccount for Climate Riskrdquo International Finance Corporation 72 UKCIP Glossary httpwwwukciporgukglossary73 New York City Environmental Protection ldquoCloudburst Resiliency Planning Studyrdquo 2017 Available at httpwwwnycgovhtmldeppdfclimatenyc-cloudburst-studypdf
APPENDIX 1 - KEY TERMS68
NYC Mayorrsquos Office of Recovery and Resiliency Climate Resiliency Design Guidelines
37APPENDIX 1 ndash KEY TERMS
Design life The life expectancy of an asset or product as determined during design74 As opposed to useful life (see below)
Dry Bulb temperature The ambient air temperature measured by a thermometer
Extreme eventUnexpected unusual or unpredictable weather or flooding compared to historical or future projected distribution Extreme events include for example heat waves cold waves heavy rains periods of drought and flooding and severe storms
Facilities For the purposes of this document ldquofacilitiesrdquo refers to all types of buildings housing infrastructure structures and landscape features designed by or for the City of New York
Flexible adaptation pathwayResilience-building strategies that can evolve or be adapted over time as climate change risk assessments evaluations of adaptation strategies and monitoring continue75
Flood Insurance Rate Maps (FIRM)
Official flood map of a community on which FEMA has delineated the 1 annual chance floodplain and the base flood elevations (BFEs) applicable to the community76 The FIRM also includes the 02 floodplain annual chance floodplain and differentiates between special flood hazard areas (V A Coast A zones) and floodways The official FIRM is from the year 2007 while the 2015 PFIRM is currently required by NYC Building Code to calculate design flood elevations NYC DOB references the more restrictive of the two maps in both base flood elevation and flood hazard area (ie V versus A zone) Refer to Appendix 3 for more information
FreeboardAn additional amount of height above the base flood elevation used as a factor of safety (eg two feet above the base flood) in determining the level at which a facilitys lowest floor must be elevated or floodproofed to be in accordance with state or community floodplain management regulations77
Future time slices
Future periods defined by the NPCC for when climate change projections are available In this document the following decadal projections are associated with specific time spans2020s projection = present to 20392050s projection = 2040 to 20592080s projection = 2070 to 20992100s projection = end of century and beyond
Green infrastructureAn array of practices that use or mimic natural systems to manage urban stormwater runoff Water is either directed to engineered systems for infiltration or detained for longer periods before it enters the sewer system
Heat Vulnerability Index (HVI)Summarizes relative risk of adverse health effects from heat due to social and environmental factors Used to identify neighborhoods at higher risk during and after extreme heat events
Heat wave A period of three consecutive days where temperatures rise above 90degF or two consecutive days over 95 degrees78
New York City Panel on Climate Change (NPCC)
The body of leading climate and social scientists charged with making climate change projections for the metropolitan region79
74 Sustainable Infrastructure Management Program Learning Environment httpsimplewerforg 75 Rosenzweig C et al Climate Change Adaptation in New York City Building a Risk Management Response76 ldquoDefinitionsrdquo FEMA77 Ibid78 Horton R et al New York City Panel on Climate Change 2015 Report Chapter 1 Climate Observations and Projections Ann NY
Acad Sci ISSN 0077-8923 (New York 2015) 2579 For more information on the NPCC visit www1nycgovsiteorrchallengesnyc-panel-on-climate-changepage
NYC Mayorrsquos Office of Recovery and Resiliency Climate Resiliency Design Guidelines
38APPENDIX 1 ndash KEY TERMS
Open-grid pavement system
Pavements that consist of loose substrates supported by a grid of a more structurally sound grid or webbing Unbounded loose substrates in these systems transfer and store less heat than bound and compacted pavements and aid permeability Pavement is 50 pervious and contains vegetation in the open cells designed to allow percolation or infiltration of storm water through the surface into the soil below80
Preliminary Flood Insurance Rate Map (PFIRM)
Preliminary flood map developed by FEMA in 2015 for New York City that provides projected risks for flood hazards81 Refer to Appendix 3 for more information
Project useful life (PUL)
The period over which an asset or component is expected to be available for use by an entity This depends on regular and adequate maintenance This period of time typically exceeds the design life (see above) The combined effect of operational requirements and useful life is practical in assessing an investment in improving resilience82
Rain gardenAlso called ldquobioswalerdquo Planted areas designed to collect and manage stormwater that runs off streets sidewalks commercial and residential rooftops and other sources when it rains
Resiliency The ability to bounce back after change or adversity The capability of preparing for responding to and recovering from difficult conditions83
Sea level rise-adjusted design flood elevation
As defined in these Guidelines the increased height of the base flood elevation due to sea level rise plus freeboard depending on the criticality of the facility The sea level rise adjustment depends on the useful life of the facility
Storm surge An abnormal rise of water generated by a storm over and above predicted astronomical tides84
Substantial improvementAny repair reconstruction rehabilitation addition or improvement of a building or structure the cost which equals or exceeds 50 of the market value of the structure before the improvement or repairs started For more information see Appendix G of the NYC Building Code and 1 RCNY sect3606-0185
Tidal inundation Flooding which occurs at high tides due to climate-related sea level rise land subsidence andor the loss of natural barriers86
Urban Heat Island (UHI) effectThe tendency for higher air temperatures to persist in urban areas as a result of heat absorbed and emitted by buildings and asphalt tending to make cities warmer than the surrounding suburban and rural areas
Weather The state of the atmosphere at a given time with regard to temperature cloudiness precipitation wind and other meteorological conditions87
Wet Bulb temperatureThe temperature indicated when a thermometer bulb is covered with a water-saturated wick over which air is caused to flow at approximately 45 ms (900 ftmin) to reach the equilibrium temperature of water evaporating into the air when the heat of vaporization is supplied by the sensible heat of the air88
80 ldquoGlossaryrdquo US Green Building Council (2017) Available at httpwwwusgbcorgglossaryterm552581 ldquoPreliminary FEMA Map Productsrdquo FEMA Map Service Center Available at httpshazardsfemagovfemaportalprelimdownload82 ldquoGlossaryrdquo International Infrastructure Management Manual (2011) 83 A Stronger More Resilient New York (2013) 184 ldquoStorm Surge Overviewrdquo National Hurricane Center NOAA Available at httpswwwnhcnoaagovsurge85 ldquoFlood Resistant Constructionrdquo Appendix G New York City Building Code (2008) and 1 RCNY sect3606-01 available at httpswww1nycgovassetsbuildingsrules1_RCNY_3606-01pdf86 ldquoOcean Factsrdquo National Ocean Service NOAA Available at httpoceanservicenoaagovfactsnuisance-floodinghtml 87 UKCIP Glossary httpwwwukciporgukglossary88 ldquoASHRAE Terminologyrdquo ASHRAE Available at httpswwwashraeorgtechnical-resourcesauthoring-toolsterminology
NYC Mayorrsquos Office of Recovery and Resiliency Climate Resiliency Design Guidelines
39APPENDIX 2 - CLIMATE CHANGE PROJECTIONS
Climate change projections are provided by the New York City Panel on Climate Change (NPCC) The full NPCC report is available from the New York Academy of Sciences89 Tables 8-10 (below) were reproduced directly from the NPCC report while Table 2 (see Section IIA) was developed using the data underlying the NPCC report to inform the design of HVAC systems under warmer conditions
Table 8 ndash NYC sea level rise projections90
Baseline (2000-2004) 0 in
Low estimate (10th percentile)
Middle range (25th to 75th percentile)
High estimate (90th percentile)
2020s 2 in 4-8 in 10 in
2050s 8 in 11-21 in 30 in
2080s 13 in 18-39 in 58 in
2100 15 in 22-50 in 75 in
Note Projections are based on six-component approach that incorporates both local and global factors The model-based components are from 24 global climate models and two representative concentration pathways Projections are relative to the 2000-2004 base period
Table 9 ndash Mean annual changes91
a Temperature Baseline(1971-2000) 54degF
Low estimate (10th percentile)
Middle range (25th to 75th percentile)
High estimate (90th percentile)
2020s + 15degF +20-29degF +32degF
2050s +31degF +41-57degF +66degF
2080s +38degF +53-88degF +103degF
2100 +42degF +58-104degF +121F
b Precipitation Baseline(1971-2000) 501 in
Low estimate (10th percentile)
Middle range (25th to 75th percentile)
High estimate (90th percentile)
2020s -1 percent +1-8 +10
2050s +1 percent +4-11 +13
2080s +2 percent +5-13 +19
2100 -6 percent -1 to +19 +25
Note Based on 35 global climate models (GCMs) and two RCPs Baseline data cover the 1971ndash2000 base period and are from the NOAA National Climatic Data Center (NCDC) Shown are the low estimate (10th percentile) middle range (25th percentile to 75th percentile) and high estimate (90th percentile) These estimates are based on a ranking (from most to least) of the 70 (35 GCMs times 2 RCPs) projections The 90th percentile is defined as the value that 90 percent of the outcomes (or 63 of the 70 values) are the same or lower than Like all projections the NPCC climate change projections have uncertainty embedded within them Sources of uncertainty include data and modeling constraints the random nature of some parts of the climate system and limited understanding of some physical processes The NPCC characterizes levels of uncertainty using state-of-the-art climate models multiple scenarios of future greenhouse gas concentrations and recent peer-reviewed literature Even so the projections are not true probabilities and the potential for error should be acknowledged
89 The NPCC 2015 report is available at httponlinelibrarywileycomdoi101111nyas20151336issue-1issuetoc90 From New York City Panel on Climate Change 2015 Report Chapter 1 Climate Observations and Projections page 4191 From New York City Panel on Climate Change 2015 Report Chapter 1 Climate Observations and Projections page 30
APPENDIX 2 - CLIMATE CHANGE PROJECTIONS
NYC Mayorrsquos Office of Recovery and Resiliency Climate Resiliency Design Guidelines
40APPENDIX 2 - CLIMATE CHANGE PROJECTIONS
Table 10 ndash Extreme events92
2020s Baseline (1971-2000)
Low estimate(10th percentile)
Middle range(25th to 75th percentile)
High estimate (90th percentile)
Numbers of heat waves per year 2 3 3-4 4
Average heat wave duration (days) 4 5 5 5
Number of days per year with
Maximum temperature at or above 90degF 18 24 26-31 33
Maximum temperature at or above 100degF 04 07 1-2 2
Minimum temperature at or below 32degF 71 50 52-58 60
Rainfall at or above 1 inch 13 13 14-15 16
Rainfall at or above 2 inches 3 3 3-4 5
Rainfall at or above 4 inches 03 02 03ndash04 05
2050s Baseline (1971-2000)
Low estimate(10th percentile)
Middle range(25th to 75th percentile)
High estimate (90th percentile)
Numbers of heat waves per year 2 4 5-7 7
Average heat wave duration (days) 4 5 5-6 6
Number of days per year with
Maximum temperature at or above 90degF 18 32 39-52 57
Maximum temperature at or above 100degF 04 2 3-5 7
Minimum temperature at or below 32degF 71 37 42-48 52
Rainfall at or above 1 inch 13 13 14-16 17
Rainfall at or above 2 inches 3 3 4-4 5
Rainfall at or above 4 inches 03 03 03-04 05
2080s Baseline (1971-2000)
Low estimate(10th percentile)
Middle range(25th to 75th percentile)
High estimate (90th percentile)
Numbers of heat waves per year 2 5 6-9 9
Average heat wave duration (days) 4 5 5-7 8
Number of days per year with
Maximum temperature at or above 90degF 18 38 44-76 87
Maximum temperature at or above 100degF 04 2 4-14 20
Minimum temperature at or below 32degF 71 25 30-42 49
Rainfall at or above 1 inch 13 14 15-17 18
Rainfall at or above 2 inches 3 3 4-5 5
Rainfall at or above 4 inches 03 02 03-05 07
Note Projections for temperature and precipitation are based on 35 GCMs and 2 RCPs Baseline data are for the 1971 to 2000 base period and are from the NOAA National Climatic Data Center (NCDC) Shown are the low estimate (10th percentile) middle range (25th to 75th percentile) and high estimate (90th percentile) 30-year mean values from model-based outcomes Decimal places are shown for values less than one although this does not indicate higher precisioncertainty Heat waves are defined as three or more consecutive days with maximum temperatures at or above 90degF Like all projections the NPCC climate change projections have uncertainty embedded within them Sources of uncertainty include data and modeling constraints the random nature of some parts of the climate system and limited understanding of some physical processes The NPCC characterizes levels of uncertainty using state-of-the-art climate models multiple scenarios of future greenhouse gas concentrations and recent peer-reviewed literature Even so the projections are not true probabilities and the potential for error should be acknowledged
92 From New York City Panel on Climate Change 2015 Report Chapter 1 Climate Observations and Projections page 31
NYC Mayorrsquos Office of Recovery and Resiliency Climate Resiliency Design Guidelines
41APPENDIX 3 - DIFFERENTIATION OF FLOOD MAPS
These Guidelines reference several different kinds of flood maps and sources of design flood elevations These maps are described and differentiated below
Table 11 - Differentiation of flood maps used in NYC
Reference Title Data Source Information Provided Referenced By Link
2007 FIRM FEMA
Based on historical data from before 1983 identifies the current base flood (extent and elevation) as the flood that has a 1 chance of occurring in any given year also known as a 100-year flood The NYC Building Code requires that either the 2007 FIRM or 2015 PFIRM elevation be used whichever is higher
2014 NYC Building Code Appendix G
Climate Resiliency Design Guidelines
httpsmscfemagovportal
2015 PFIRM FEMA
Based on historical data identifies the current base flood (extents and elevation) as the flood that has a 1 chance of occurring in any given year also known as a 100-year flood The NYC Building Code requires that either the 2007 FIRM or 2015 PFIRM elevation be used whichever is higher The 2015 PFIRM is currently being reassessed by FEMA
2014 NYC Building Code Appendix G
Climate Resiliency Design Guidelines
httpshazardsfemagovfemaportalprelimdownload
httpwwwregion2coastalcomview-flood-maps-dataview-preliminary-flood-map-data
NYC Flood Hazard Mapper
NYC Department of City Planning
Maps current and future flood hazards in NYC including the following data layers 2007 FIRM and 2015 PFIRM high tide with sea level rise and PFIRM with sea level rise through 2100
Climate Resiliency Design Guidelines
Waterfront Revitalization Plan
httpwww1nycgovsiteplanningdata-mapsflood-hazard-mapperpage
ldquoTable 4 ndash Determine the sea level rise-adjusted design flood elevation for critical and non-critical facilitiesrdquo
ORR amp NPCC
Provides data to use when adding sea level rise to a given 2015 PFIRM or 2007 FIRM Base Flood Elevation (BFE) to calculate a Design Flood Elevation (DFE) Based on the criticality and expected useful life of a facility
Climate Resiliency Design Guidelines
See Section II on ldquoSea Level Riserdquo above
APPENDIX 3 - DIFFERENTIATION OF FLOOD MAPS
NYC Mayorrsquos Office of Recovery and Resiliency Climate Resiliency Design Guidelines
42APPENDIX 4 - PROJECT BENEFITS CATEGORIES
This appendix provides guidance on how to identify and assess benefits as a supplement to Sections IIID and IIIE
Table 12 lists typical direct benefits for reducing impacts from climate stressors and basic guidance for how to estimate them See Section IIID for more information
Table 13 lists typical indirect benefits for reducing impacts from climate stressors and basic guidance for how to estimate them See Section IIID for more information
Table 12 ndash Direct benefits for (1) sea level rise with coastal storm surge and (2) increased precipitation measures
Direct Benefit Basic Guidance for Estimating Values
Physical Damages (Structure Contents)
bull For flood-damaged buildings use depth damage functions developed by FEMA and USACE for structures and contents
bull Use depth damage functions in conjunction with Building Replacement Values (BRVs) and not market values BRVs typically range between $100 to $325SF for residential buildings and $120 to $450SF for commercial public buildings
bull For more complex structures or facilities use engineering estimates of flood damages or review historic flood damages documented from insurance claims repair records or FEMA Public Assistance claims from recent flood disasters
Residential Displacements
bull For flood-damaged buildings use depth damage functions developed by FEMA and USACE for residential displacements
Reduced Life CycleOperation and Maintenance (OampM) Costs93
bull Applicable only to projects that reduce overall life cycle costs or net annual OampM costs from baseline conditions
bull Input reduced annual OampM costs as a project benefit at a 1-year recurrence intervalbull Reduced overall life cycle costs can be input as a longer project useful life
Table 13 ndash Indirect benefits for (1) sea level rise with coastal storm surge and (2) increased precipitation measures
Indirect Benefit Basic Guidance for Estimating Values
Non-Residential Building Service Losses
bull Estimate service loss values and durations for non-residential buildings public buildings critical facilities and parksnatural features based on FEMA BCA guidance and standard values based on building use
Utility Service Losses94
bull Estimate utility service losses for water wastewater and electrical facilities based on the number of impacted customers FEMA per capita standard values for utility service ($105personday for potable water $49personday for wastewater $148personday for electrical)95
bull Estimate utility service loss durations based on engineering estimates or review historic flood damages losses documented from utility company records
bull This benefit can also apply to measures that increase energy efficiency
RoadBridge Service Losses
bull Estimate roadbridge service losses based on the average daily traffic (ADT) detour time and additional travel distance and FEMA and GSA standard values for road service ($3344vehiclehour of delay $0545mile)96
bull Estimate roadbridge service loss durations or review historic flood damages losses
Emergency Service Losses
bull Applicable only to projects that reduce or eliminate documented emergency service costs from baseline conditions
bull Examples of avoided emergency services costs include NYPD staffing to monitor barricades for flooded roads or NFDY staffing for water rescues of residents from flooded buildings or streets
APPENDIX 4 - PROJECT BENEFITS CATEGORIES
93 Reduced life cycle costs may be applicable to some measures that provide extreme heat benefits such as green roofs that can last longer than a standard roof if properly maintained
94 Reduced utility service costs may be applicable to some measures that provide extreme heat benefits such as cool roofs green roofs and shade trees
95 FEMA per capita standard values taken from FEMA BCA Toolkit Version 530 (Build Date 12222016) and developed in FEMArsquos Baseline Standard Economic Value Methodology Report (July 28 2016) Consider updating FEMA standard per capita values to reflect current New York City utility rates
96 Consider updating FEMA and GSA standard values to reflect current New York City area labor rates and fuel costs
NYC Mayorrsquos Office of Recovery and Resiliency Climate Resiliency Design Guidelines
43APPENDIX 4 - PROJECT BENEFITS CATEGORIES
Table 14 ndash Other potential benefits for (1) sea level rise with coastal storm surge and (2) increased precipitation measures
Other Benefit Basic Guidance for Estimating Values
Avoided Stress and Anxiety
bull Applicable only for projects that directly benefit occupants of residential structuresbull Use FEMA standard value for avoided mental stress and anxiety treatment costs of $2443person to
estimate benefit for all impacted residents97
Avoided Lost Productivity
bull Applicable only for projects that directly benefit occupants of residential structuresbull Use FEMA standard value for avoided lost worker productivity costs of $8736household to estimate
benefit for all impacted workers (conservatively assuming one worker per household)
Environmental Open Space
bull Applicable only for projects that create or acquire open space areas by acquisitionbull Use FEMA standard value for environmental open space based on the type of land acquired ($8308
Acreyear for Green open space $39545Acreyear for Riparian $6010Acreyear for Wetlands $554Acreyear for Forests $1799Year for Marine and estuary)97
CSO Volume Reduction
bull Applicable only for projects that provide Combined Sewer Overflow (CSO) abatement by reducing the volume of rainfall runoff
bull Use CSO abatement cost of $0015gallonsyear applied to increased precipitation hazard runoff volume for 5-year design storm98
Ecosystem Service99
bull Add stormwater management benefits of green infrastructure projects to increased precipitation hazards where avoided damages and service losses are not quantified
bull Unit benefits applicable to increased precipitation hazard includeo Green roofs $0133SFyear (PUL 40 years)o BioswaleRain GardenMeadow Mix $0020SFyear (PUL 30 years)o Permeable Grass Pavers $0020SFyear (PUL 30 years)o Tree Plantings $303Treeyear (PUL 30 years)o Planter Box Trees $101Treeyear (PUL 15 years)
Real Estate99
bull Potential real estate benefits from increased resilience of residential andor commercial propertiesstreetscapesneighborhoods included within the project scope
bull Benefit applied to extreme heat hazard for green infrastructure projects directly impacting residential or commercial properties
Quality of Life Health Benefits99
bull Potential quality of life benefits related to improved public health from the resilience measures included within the project scope
bull Benefit applied to extreme heat hazard for green infrastructure projects directly impacting residential or commercial properties
Table 14 lists other typical benefits for reducing impacts from climate stressors and basic guidance for how to estimate them See Section IIID for more information
97 FEMA standard values for avoided mental stress and anxiety and environmental open space values taken from FEMA BCA Toolkit Version 530 (Build Date 12222016)
98 CSO abatement cost taken from APG1 Report for NYC ldquoTechnical Approaches for Benefit-Cost Analysis of Hazard Mitigation Projects in Urban and Coastal Environmentsrdquo (April 2016)
99 Ecosystem Services Real Estate and Quality of LifeHealth benefits tend to be more applicable to green infrastructure measures that provide extreme heat benefits such as green roofs trees and other plantings
NYC Mayorrsquos Office of Recovery and Resiliency Climate Resiliency Design Guidelines
44APPENDIX 4 - PROJECT BENEFITS CATEGORIES
Table 15 ndash Potential benefits for extreme heat (Urban Heat Island) reduction measures
Category Benefit Basic Guidance for Estimating Values
Direct Benefit
Reduced Life Cycle Cost
bull Applicable only to measures such as green roofs that are expected to last longer than standard roofs
bull Compute total cost savings including annual OampM costs
Indirect Benefit
Energy Savings
bull Applicable to measures that reduce energy costs by providing cooling through increased shading andor evapotranspiration
bull Use New York Power Authority rates of $0148kWh for electricity and $0810Therm for natural gas
Other Potential Benefits
Air Quality bull Applicable to measures that absorb pollutants andor reduce carbon dioxide emissions
Acoustics bull Applicable to measures such as green roof or walls that reduce noise transfer
Quality of LifeHealth bull Potential quality of life benefits and related to improved public health
Real Estate bull Applicable to measures that provide residential real estate benefits from increased resilience of propertiesstreetscapesneighborhoods
Retail Sales Marketing
bull Applicable to measures that provide commercial property benefits from increased aesthetics resulting in increased marketing and sales for streetscapesneighborhoods
Tax Credits Incentives
bull Applicable to resilience or green infrastructure measures such as green roofs that have accompanying Federal State or City tax credits or other incentives
Table 15 lists potential benefits for reducing impacts from heat and basic guidance for how to estimate them See Section IIID for more information
NYC Mayorrsquos Office of Recovery and Resiliency Climate Resiliency Design Guidelines
45APPENDIX 4 - PROJECT BENEFITS CATEGORIES
Table 16 ndash Guidance on quantitative calculations for (1) sea level rise with coastal storm surge and (2) increased precipitation measures
Data Input General Guidance ndash Basic Description
Applicable Benefit Category
Applicable Typical Facility Typology
Dire
ct B
enefi
ts
Indi
rect
Ben
efits
Oth
er P
oten
tial
Ben
efits
Bui
ldin
g St
ruct
ures
Com
plex
Fa
cilit
ies
Tran
spor
tatio
nSt
reet
scap
es
Plaz
as
Park
Fea
ture
s
First Floor Elevation (FFE)
bull The elevation of the first finished floor of the structure excluding basements
bull FFE measured from top of lowest floor (riverinenon-coastal high hazard areas) or bottom of lowest horizontal structural member (coastal high hazard areas)
Y Y Y Y
Building Replacement Value (BRV)
bull The unit cost to rebuild a structure of the same quality of construction
bull Not the same as market value
Y Y Y Y
Building Size
bull The total floor area of the building in square feet
bull Total Building Value = BRV x Building Sizebull Typical BRVs for NYC range between $100 to
$325SF for residential buildings and $120 to $450SF for commercialpublic buildings
Y Y Y Y
Structure Description
bull The type of building number of stories and foundation type (full basement partial basement no basement)
bull Collect more detailed foundation data for coastal flood zones
Y Y Y Y
Building Use bull Details related to residential housing commercial business and public use
Y Y Y Y Y
Building Type bull The primary use of building ndash residential commercial public and others
Y Y Y Y Y
Depth Damage Function (DDF)
bull Curves used to estimate structure damage contents damage and displacement of residential buildings based on flood depth
bull DDFs selection based on Structure Description Building Type Building Use
bull Structure DDFs based on percentage of Total Building Value
bull Contents DDFs based on percentage of Total Contents Value
bull Displacement DDFs based on number of displacement days x Displacement Cost
Y Y Y Y Y
Contents Value
bull The cost to replace structure contents (furnishings equipment)
bull Residential building Contents Values typically 50 BRV (FEMA DDFs) or 100 BRV (USACE DDFs)
bull Non-residential building Contents Values between 18 to over 100 depending on building use (USACE DDFs)
bull Total Contents Value = BRV x Building Size
Y Y Y Y Y
Table 16 provides general guidance on how to quantitatively calculate benefits from efforts to address from climate stressors See Section IIIE for more information
NYC Mayorrsquos Office of Recovery and Resiliency Climate Resiliency Design Guidelines
46APPENDIX 4 - PROJECT BENEFITS CATEGORIES
Table 16 ndash Guidance on quantitative calculations for (1) sea level rise with coastal storm surge and (2) increased precipitation measures
Data Input General Guidance ndash Basic Description
Applicable Benefit Category
Applicable Typical Facility Typology
Dire
ct B
enefi
ts
Indi
rect
Ben
efits
Oth
er P
oten
tial
Ben
efits
Bui
ldin
g St
ruct
ures
Com
plex
Fa
cilit
ies
Tran
spor
tatio
nSt
reet
scap
es
Plaz
as
Park
Fea
ture
s
Number of Residents (Residential)
bull Total number of occupants in a residential building
bull Typically estimated based on number of residential units x average number of individuals per household (based on current US Census data or use 25 individuals per household as a default)
Y Y Y Y Y
Displacement Cost (Residential)
bull The unit cost to lodge and feed displaced residents while flood damage is repaired
bull Average unit displacement cost of $415residential unitday recommended based on current FY2018 GSA Per Diem rates for New York City
Y Y Y Y Y
Value of Service (Non-Residential and Public)
bull The unit cost of service disruption and rental of temporary facilities while flood damage is repaired
bull Disruption costs for non-residential buildings typically range from $095 to $136SFmonth and rental costs range from $020 to $136SFmonth depending on building use
bull Value of service for public buildings ($day) is typically based on the annual operating budget for the City agency using the building prorated based on building size or population served by the building then divided by 365 daysyear
Y Y Y Y
Value of Service (Critical Facilities)
bull The unit cost of critical facilities (police fire emergency medical services) lost or delayed while flood damage is repaired
Y Y Y
Value of Service Duration
bull The duration of service disruption and rental of temporary facilities for non-residential buildings and critical facilities while flood damage is repaired
bull For non-residential buildingso Value of Service Durations vary from
4 months to over 30 months based on building use and the depth of flooding
o Total Value of Service Loss = (Disruption Cost x Building Area) = (Rental Cost x Building Area x Value of Service Duration)
bull For public buildings and critical facilitieso Value of Service Durations vary from 0
days to 720 months based on building use and the depth of flooding from FEMA FIA or USACE DDFs
o Total Value of Service Loss = (Value of Service) x (Service Loss Duration)
Y Y Y
NYC Mayorrsquos Office of Recovery and Resiliency Climate Resiliency Design Guidelines
47APPENDIX 4 - PROJECT BENEFITS CATEGORIES
Table 16 ndash Guidance on quantitative calculations for (1) sea level rise with coastal storm surge and (2) increased precipitation measures
Data Input General Guidance ndash Basic Description
Applicable Benefit Category
Applicable Typical Facility Typology
Dire
ct B
enefi
ts
Indi
rect
Ben
efits
Oth
er P
oten
tial
Ben
efits
Bui
ldin
g St
ruct
ures
Com
plex
Fa
cilit
ies
Tran
spor
tatio
nSt
reet
scap
es
Plaz
as
Park
Fea
ture
s
Engineering Estimates for Damages
bull Engineered estimate models of physical damages and service losses at the project site based on the Guidelines event recurrence interval(s) and flood depth(s)
Y Y Y Y Y Y
Historic Damages and Service Losses
bull Historic physical damages and service losses at the project site documented from previous flood events
bull Do not use routine maintenancebull The historic damage event recurrence interval
(RIs) andor flood depths must be determined updated for inflation to the present value and adjusted to match the Guidelines event RIsflood depths
Y Y Y Y Y Y
Facility Replacement Value
bull The unit cost to rebuild the facility
Impacted Area bull The geographic area impacted by the facility in the event of failure in acres
Y Y Y Y
Facility Capacity
bull The design capacity of the facilitybull For example - facility capacity expressed in
millions of gallons per day (MGD) for water and wastewater facilities or megawatts (MW) for electrical facilities
Y Y Y Y
Service Population
bull The number of impacted residents served by the facility
bull Typically estimated based on number of impacted residential customers x average number of individuals per household (based on current US Census data or use 25 individuals per household as a default)
bull Facilities serving mostly non-residentialpublic buildings andor critical facilities should focus on service losses rather than service population
Y Y Y
NYC Mayorrsquos Office of Recovery and Resiliency Climate Resiliency Design Guidelines
48APPENDIX 4 - PROJECT BENEFITS CATEGORIES
Table 16 ndash Guidance on quantitative calculations for (1) sea level rise with coastal storm surge and (2) increased precipitation measures
Data Input General Guidance ndash Basic Description
Applicable Benefit Category
Applicable Typical Facility Typology
Dire
ct B
enefi
ts
Indi
rect
Ben
efits
Oth
er P
oten
tial
Ben
efits
Bui
ldin
g St
ruct
ures
Com
plex
Fa
cilit
ies
Tran
spor
tatio
nSt
reet
scap
es
Plaz
as
Park
Fea
ture
s
Value of Service
bull Unit value of service provided by the facilitybull Example of FEMA standard values for complete
loss of utility service $105personday for potable water$49personday for wastewater$148personday for electrical
bull Consider updating FEMA standard per capita values to reflect current The New York City utility rates
Y Y
Roadway Elevations bull Roadway Elevations
Y Y
Roadway Replacement Value
bull Roadway Replacement ValueY Y
Inundation Area Map
bull Inundation Area Map developed by FEMA or through modeling by project design team
Y Y Y
Building Inventory of Inundation Area
bull The number and type of buildings within the streetscape and neighborhood inundated by the Guidelinersquos flood events
Y Y Y
Average Daily Traffic (ADT)
bull The average number of one-way traffic trips per day along the roadway(s) within the streetscapeneighborhood inundated by the Guidelinersquos flood events
Y Y
Additional Travel Time
bull The additional travel time needed to detour around a flooded roadway expressed in minutes
bull In the unlikely event there is no detour available use a 12-hour travel time per one-way trap but provide a detailed area street map as supporting documentation
Y Y
Value of Traffic Delay
bull The value of service associated with lost time in traffic
bull For example - FEMA standard average value of $3344vehiclehour of delay
bull Consider updating FEMA and GSA standard values to reflect current New York City area labor rates and fuel costs
Y Y
NYC Mayorrsquos Office of Recovery and Resiliency Climate Resiliency Design Guidelines
49APPENDIX 4 - PROJECT BENEFITS CATEGORIES
Table 17 ndash Guidance on quantitative unit benefit calculations for extreme heat hazard measures
Measure General Guidance ndash Unit Benefit Information and Data Requirements
Applicable Benefit Category
Applicable Typical Facility Typology
Dire
ct B
enefi
ts
Indi
rect
Ben
efits
Oth
er P
oten
tial
Ben
efits
Bui
ldin
g St
ruct
ures
Com
plex
Fa
cilit
ies
Tran
spor
tatio
nSt
reet
scap
es
Plaz
as
Park
Fea
ture
s
Green Roof
bull Unit benefit range over PUL = $470SF to $373SF of green roof area ($719SF standard value)
bull Assumed PUL = 40 yearsbull Apply standard value unit benefit to green
roof area to estimate measure benefitbull Higher range values more applicable
to residential and commercial building streetscape projects
Y Y Y Y Y Y
Bioswale Rain Garden Meadow Mix
bull Unit benefit range over PUL = $396SF to $211SF of area ($730SF standard value)
bull Assumed PUL = 30 yearsbull Apply standard value unit benefit to bioswale
rain gardenmeadow mix area to estimate total measure benefit
Y Y Y Y Y Y
Cool Roof
bull Unit benefit range over PUL = $117 to $3151SF of material area ($144SF standard value)
bull Assumed PUL = 20 yearsbull Apply standard value unit benefit to cool roof
area to estimate total measure benefitbull Higher range values more applicable to
residential building streetscape projects
Y Y Y Y Y
Light-Colored PaversLight-Colored Materials
bull Unit benefit range over PUL = $0774 to $204SF of material area ($0866SF standard value)
bull Assumed PUL = 30 yearsbull Apply standard value unit benefit to material
area to estimate total measure benefit
Y Y Y Y
Table 17 provides general guidance on how to quantitatively calculate benefits from efforts to address climate stressors See Section IIIE for more information
NYC Mayorrsquos Office of Recovery and Resiliency Climate Resiliency Design Guidelines
50APPENDIX 4 - PROJECT BENEFITS CATEGORIES
Table 17 ndash Guidance on quantitative unit benefit calculations for extreme heat hazard measures
Measure General Guidance ndash Unit Benefit Information and Data Requirements
Applicable Benefit Category
Applicable Typical Facility Typology
Dire
ct B
enefi
ts
Indi
rect
Ben
efits
Oth
er P
oten
tial
Ben
efits
Bui
ldin
g St
ruct
ures
Com
plex
Fa
cilit
ies
Tran
spor
tatio
nSt
reet
scap
es
Plaz
as
Park
Fea
ture
s
Tree Planting
bull Unit benefit range over PUL = $1005 to $77154Tree ($1855Tree standard value)
bull Assumed PUL = 30 yearsbull Apply standard value unit benefit to number of
trees to estimate total measure benefitbull Higher range values more applicable
to residential and commercial building streetscape projects
Y Y Y Y Y Y
Planter Box Tree
bull Unit benefit range over PUL = $212 to 16304Tree ($392Tree standard value)
bull Assumed PUL = 15 yearsbull Apply standard value unit benefit to number of
trees to estimate total measure benefitbull Higher range values more applicable
to residential and commercial building streetscape projects
Y Y Y Y Y
Shade Canopy
bull Unit benefit range over PUL = $0363 to $396SF ($0458SF standard value)
bull Assumed PUL = 15 yearsbull Apply standard value unit benefit to area of
shade canopy estimate total measure benefitbull Higher range values more applicable
to residential and commercial building streetscape projects
Y Y Y Y
Permeable Grass Pavers
bull Unit benefit range over PUL = $0258SF to $0521SF of pavers ($0363SF standard value)
bull Assumed PUL = 30 yearsbull Apply standard value unit benefit to paver
area to estimate total measure benefit
Y Y Y Y Y
For the purposes of the BCA refer to the following facility typologies bull ldquoBuilding Structuresrdquo include critical small building sites such as EMS or FDNY stations and non-critical small building sites such as
libraries or comfort stationsbull ldquoComplex Facilitiesrdquo include critical infrastructure such as wastewater treatment sites pump stations water filtration plants and similar
large or complex facilitiesbull ldquoTransportationStreetscapePlazasrdquo include roadway reconstruction streetscape improvements street raising plazas and other
transportation-related infrastructurebull ldquoPark Featuresrdquo include parks and similar public recreational facility with natural landscape features
NYC Mayorrsquos Office of Recovery and Resiliency Climate Resiliency Design Guidelines
51APPENDIX 5 - EXAMPLE PLANNING DECISION TREE
This decision tree provides a summarized example approach for how to implement these Guidelines Projects with a total cost greater than $50 million are recommended to conduct a full qualitative and quantitative climate change risk assessment and BCA while projects below $50 million are recommended to conduct a qualitative risk assessment and BCA
Define Project
1) Operational goals and criticality level2) Useful life3) Location in the current flood plain future floodplain and or zone
of tidal inundation and the project arearsquos score on the heat vulnerability index
Evaluate Project Risks According to Probability and Magnitude of Consequence
bull Extreme Heat bull Precipitationbull Sea Level Risebull Coastal Surge
High Level Identification and Assessment of Risk Mitigation Alternatives and Co-benefits
(qualitative)
Detailed Identification and Assessment of Risk Mitigation Alternatives and Co-benefits (qualitative and quantitative)
High Level Estimate of Costs and Benefits of Design Alternatives
(qualitative)
Detailed Estimate of Costs and Benefits of Design Alternatives
(qualitative and quantitative)
Decision Point Which climate change risks require mitigation
Decision Point Evaluate risk mitigation benefits and costs to
determine final resilient design alternative or if no action is required
Decision Point Is the total project cost above $50 million
Below $50 million Above $50 million
APPENDIX 5 - EXAMPLE PLANNING DECISION TREE
NYC Mayorrsquos Office of Recovery and Resiliency Climate Resiliency Design Guidelines
52
Project Title
Design Strategies Checklist (not exhaustive)
Extreme Heat Comments Extreme Precipitation Comments Sea Level Rise amp Storm Surge Comments
Select Site in Low Heat Vulnerability Index area Select High Elevation Site Select High Elevation Site
Minimize East-West Building Orientation Green Roof Raise Building Floor Elevation
Passive Solar Cooling and Ventilation Systems
Protect Below Grade Areas from Flooding Waterproof Building Envelope
Cool Roof (SRI appropriate) On-site Stormwater Management (gray) Elevate Critical Building Functions
Green Roof (extensive) Reduce Impervious Areas Elevate Critical Equipment
Vegetative Structures Permeable Pavement Perimeter Floodwall100 Levee (passive or active)
Enhanced HVAC System including space layout optimization and system scalability
Increase Green Spaces and Planted Areas DryWet Floodproofing
More Efficient Building Envelope Other Utility Redundancy Design101
Parking Lot Shading Resilient Materials amp Landscape Treatments
Light Colored Pavements (appropriate SRI) Design for Storm Surge Outflow
Increase Planted Areas Install Backwater Flow Prevention
Permeable Surfaces Design for Scour
Open-grid Pavement Raise Road Elevation
Other Other
This appendix provides a template for identifying possible design strategies to address climate change risks as described throughout the Guidelines
APPENDIX 6 - DESIGN STRATEGIES CHECKLIST
100 Permanent perimeter flood walls are not permitted to meet floodproofing requirements in buildings with substantial improvements andor damages 101 Utility redundancy design should be pursued for critical systems not all building systems
APPENDIX 6 - DESIGN STRATEGIES CHECKLIST
NYC Mayorrsquos Office of Recovery and Resiliency Climate Resiliency Design Guidelines
53APPENDIX 7 - CLIMATE CHANGE RISK ASSESSMENT RESOURCES
These Guidelines provide data on climate change hazards and recommend how that data can inform resilient design A risk assessment is a tool to help project managers and designers evaluate risk levels as well as select and prioritize resilient design strategies A high level risk assessment is recommended for all City capital projects with a total cost of under $50 million Projects above $50 million are recommended to conduct an in-depth assessment
Risk assessments use quantified estimates of the probability and magnitude of consequence of an event occurring to prioritize responses ldquoProbabilityrdquo is an assessment of the likelihood of a hazard occurring while ldquomagnituderdquo describes the hazardrsquos potential impact Risk assessment tools such as the examples listed below can be used to define and score these categories Projects that score higher across both probability and magnitude can be prioritized for investment and risk mitigation action Projects that score lower across both criteria may require no action beyond meeting code The results are typically charted on a risk matrix and an example is provided on the next page
The climate change risk management frameworks below offer templates for how to integrate climate change projections into a risk assessment process Refer to these resources for examples and further information
bull Vulnerability Assessment and Adaptation Framework is prepared by the Federal Highway Administration (FHWA) While developed for transportation planning this risk assessment framework has broad applicability for evaluating asset vulnerability to climate change Available at httpswwwfhwadotgovenvironmentsustainabilityresilienceadaptation_framework
bull US Climate Resilience Toolkit The US Global Change Research Program offers a step by step risk assessment
framework including tools and case studies at httpstoolkitclimategovsteps (see example on next page)
bull Coast Adapt Guidance on undertaking a risk assessment High level assessment httpscoastadaptcomausitesdefaultfilesfactsheetsT3M4_2_2nd_pass_risk_assessmentpdfDetailed assessment httpscoastadaptcomausitesdefaultfilesfactsheetsT3M4_3_3rd_pass_risk_assessmentpdf
bull Climate adaptation Risk uncertainty and decision-makingDownload the report here httpswwwukciporgukpublicationsRisk
The City plans to develop a NYC-specific process for integrating climate change data into existing risk management processes by April 2019
APPENDIX 7 - CLIMATE CHANGE RISK ASSESSMENT RESOURCES
NYC Mayorrsquos Office of Recovery and Resiliency Climate Resiliency Design Guidelines
54APPENDIX 7 - CLIMATE CHANGE RISK ASSESSMENT RESOURCES
The Risk Characterization Matrix below is an example from the US Climate Resilience Toolkit This tool can be used to assess the probability and magnitude of impact for identified risks The risk of coincident climate stressorsrisks (such as storm surge plus increased precipitation) can also be assessed as applicable
Figure 14 - Example of a climate change risk matrix (adapted from US Climate Resilience Toolkit)
Project teams can determine the magnitude of the impact (along the horizontal scale of 1 through 3 with 3 being the most severe) and the probabilitylikelihood of occurrence for each specific risk (along the vertical scale with 3 being the most likely) A score is typically assigned for each risk (Probabil-ity x Magnitude) and then charted on the matrix Based on the estimated probability and magnitude of consequence above the risks are ranked and prioritized for mitigation Factors to bear in mind include
bull Not all facility typologies have the same level of functional and operational importance during events or tolerance for disruption
bull Not all climate stressors and risks have the same level of impact on each project sitebull Not all identified risks can or should be mitigated fully
NYC Mayorrsquos Office of Recovery and Resiliency Climate Resiliency Design Guidelines
55WORKS CITED
A Stronger More Resilient New York PlaNYC Report of the NYC Special Initiative for Rebuilding and Resiliency The City of New York 2013
ldquoAccount for Climate Riskrdquo International Finance Corporation accessed March 27 2017 httpwwwifcorgwpswcmconnectTopics_Ext_ContentIFC_External_Corporate_SiteClimate+Business
PrioritiesAccount+for+Climate+Risk
American Society of Heating Refrigeration and Air-Conditioning Engineers (ASHRAE) Handbook -Fundamentals 2017
ldquoBaseline Standard Economic Value Methodology Reportrdquo Federal Emergency Management Agency July 2016
Benefit Cost Analysis Toolkit Software Version 530 Federal Emergency Management Agency (build date December 2016)
Criteria for Detention Facility Design New York City Department of Environmental Protection November 2012
Community Resilience Planning Guide for Buildings and Infrastructure Systems Vol 1 NIST Special Publication 1190 US Department of Commerce 2016
Cool and Green Roofing Manual NYC Department of Design and Construction 2007 httpwwwnycgovhtmlddcdownloadspdfcool_green_roof_manpdf
Building Resiliency Task Force US Urban Green Building Council New York 2013 httpurbangreencouncilforcecomBuildingResiliency
Design and Planning for Flood Resiliency Guidelines for NYC Parks New York City Department of Parks and Recreation 2017
httpswwwnycgovparksorgplanning-and-buildingplanningresiliency-plansflood-resiliency
Flooded Bus Barns and Buckled Rails Federal Transit Administration Office of Budget and Policy 2011 httpswwwhsdlorgabstractampdid=685187
Floodproofing Non-Residential Buildings FEMA P936 FEMA 2013 httpswwwfemagovmedia-library-data9a50c534fc5895799321dcdd4b6083e7P-936_8-20-13_508rpdf
ldquoGlossaryrdquo International Infrastructure Management Manual National Asset Management Support Group New Zealand 2011 httpwwwipweaorg
ldquoGreen Roof Metrics Draft Reportrdquo New York City Department of Parks and Recreation 2017
ldquoGuide to Rain Event Preparednessrdquo NYC Department of Environmental Protection httpwwwnycgovhtmldeppdfbrochuresflood-preparedness-flyerpdf
ldquoGuidelines and Discount Rates for Benefit-Cost Analysis of Federal Programsrdquo Appendix C Circular A-94 US Office of Management and Budget (OMB) 2017
ldquoGuidelines for the Design and Construction of Stormwater Management Systemsrdquo New York City Department of Environmental Protection July 2012
Horton R et al New York City Panel on Climate Change 2015 Report Ann NY Acad Sci ISSN 0077-892 New York 2015
Madrigano J et al ldquoA case-only study of vulnerability to heat wavendashrelated mortality in New York City (2000ndash2011)rdquo Environmental Health Perspectives 123672ndash678 2013
WORKS CITED
NYC Mayorrsquos Office of Recovery and Resiliency Climate Resiliency Design Guidelines
56WORKS CITED
enspMcGregor et al Two Degrees The Built Environment and Our Changing Climate Routledge Press 2013
NYC Green Codes Task Force US Green Building Council New York 2010 httpurbangreencouncilorgGreenCodes
NYCrsquos Risk Landscape A Guide to Hazard Mitigation NYC Emergency Management 2014
One New York The Plan for a Strong and Just City The City of New York 2015 httpwwwnycgovhtmlonenyc downloadspdfpublicationsOneNYCpdf
Ready to Respond Strategies for Multifamily Building Resilience Enterprise Green Communities 2015 httpswwwenterprisecommunityorgresources
Rosenzweig C et al Climate Change Adaptation in New York City Building a Risk Management Response New York City Panel on Climate Change 2010
httponlinelibrarywileycomdoi101111nyas20101196issue-1 issuetoc
ldquoSustainable Infrastructure Management Program Learning Environmentrdquo Water Environment Research Foundation accessed March 24 2017 httpsimplewerforg
Urban Waterfront Adaptive Strategies NYC Department of City Planning 2013 httpwww1nycgovsiteplanningplanssustainable-communitiesclimate-resiliencepagetab=1
Wastewater Resiliency Plan Climate Risk Assessment and Adaptation Study New York City Department of Environmental Protection October 2013
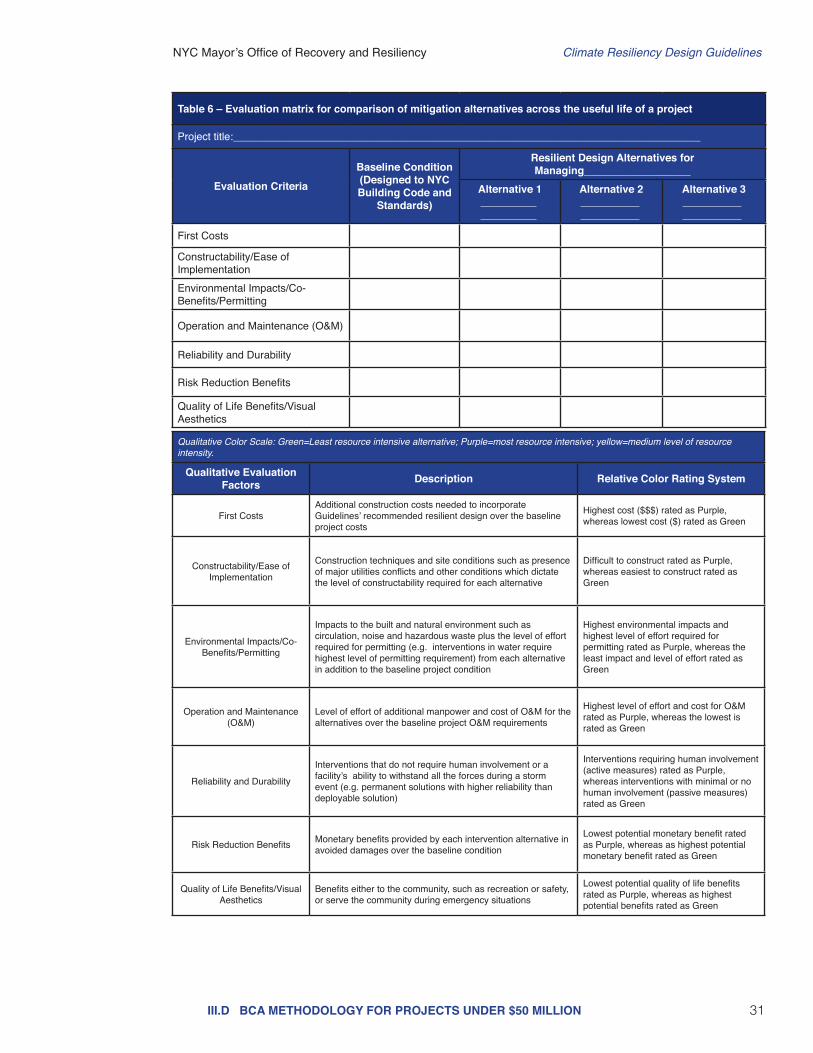
NYC Mayorrsquos Office of Recovery and Resiliency Climate Resiliency Design Guidelines
31IIID BCA METHODOLOGY FOR PROJECTS UNDER $50 MILLION
Qualitative Color Scale Green=Least resource intensive alternative Purple=most resource intensive yellow=medium level of resource intensity
Qualitative Evaluation Factors Description Relative Color Rating System
First CostsAdditional construction costs needed to incorporate Guidelinesrsquo recommended resilient design over the baseline project costs
Highest cost ($$$) rated as Purple whereas lowest cost ($) rated as Green
ConstructabilityEase of Implementation
Construction techniques and site conditions such as presence of major utilities conflicts and other conditions which dictate the level of constructability required for each alternative
Difficult to construct rated as Purple whereas easiest to construct rated as Green
Environmental ImpactsCo-BenefitsPermitting
Impacts to the built and natural environment such as circulation noise and hazardous waste plus the level of effort required for permitting (eg interventions in water require highest level of permitting requirement) from each alternative in addition to the baseline project condition
Highest environmental impacts and highest level of effort required for permitting rated as Purple whereas the least impact and level of effort rated as Green
Operation and Maintenance (OampM)
Level of effort of additional manpower and cost of OampM for the alternatives over the baseline project OampM requirements
Highest level of effort and cost for OampM rated as Purple whereas the lowest is rated as Green
Reliability and Durability
Interventions that do not require human involvement or a facilityrsquos ability to withstand all the forces during a storm event (eg permanent solutions with higher reliability than deployable solution)
Interventions requiring human involvement (active measures) rated as Purple whereas interventions with minimal or no human involvement (passive measures) rated as Green
Risk Reduction Benefits Monetary benefits provided by each intervention alternative in avoided damages over the baseline condition
Lowest potential monetary benefit rated as Purple whereas as highest potential monetary benefit rated as Green
Quality of Life BenefitsVisual Aesthetics
Benefits either to the community such as recreation or safety or serve the community during emergency situations
Lowest potential quality of life benefits rated as Purple whereas as highest potential benefits rated as Green
Table 6 ndash Evaluation matrix for comparison of mitigation alternatives across the useful life of a project
Project title_______________________________________________________________________________
Evaluation Criteria
Baseline Condition (Designed to NYC Building Code and
Standards)
Resilient Design Alternatives for Managing__________________
Alternative 1
Alternative 2
Alternative 3
First Costs
ConstructabilityEase of ImplementationEnvironmental ImpactsCo-BenefitsPermitting
Operation and Maintenance (OampM)
Reliability and Durability
Risk Reduction Benefits
Quality of Life BenefitsVisual Aesthetics
NYC Mayorrsquos Office of Recovery and Resiliency Climate Resiliency Design Guidelines
32IIID BCA METHODOLOGY FOR PROJECTS UNDER $50 MILLION
Table 7 ndash Evaluation matrix for comparison of mitigation alternatives across the useful life of a project - COMPLETED EXAMPLE
Evaluation Criteria
Baseline Condition (Designed to NYC Building Code and
Standards)
Resilient Design Alternatives for Managing Coastal SurgeSLR
Alternative 1Flood proof building built on grade to Guidelines
DFE
Alternative 2 Elevate building structure above Guidelinesrsquo DFE
on columns
Alternative 3 Raise site grade by filing the building site footprint
to Guidelinesrsquo DFE
First CostsBaseline cost for building structure is $15 million
Incremental costs are within 5 over the baseline costs
Incremental costs are between 5-10 over baseline costs
Incremental costs are 20 and more over baseline costs
ConstructabilityEase of Implementation
Relatively easy to construct within site constraints
Similar to baseline conditions since construction requires additional flood proofing only
Moderate challenges to construct foundation structure for columns within site constraints
Extremely challenging to construct within the site constraints Potentially fatal flaw
Environmental ImpactsCo-BenefitsPermitting
No major impacts but may require additional effort to obtain DOB permits with flood proofing and deployable systems
No major impacts but may require additional effort to obtain DOB permits with flood proofing and deployable systems
No major impacts and relatively easy to permit
Potential drainage circulation impacts and challenges to obtain clean fill material for the site
Operation and Maintenance (OampM)
Major OampM costs associated with deployable systems
Major OampM costs associated with deployable systems
Moderate OampM costs associated with proposed elevator for access
Minimal OampM costs since deployable and elevators not required
Reliability and Durability
Least reliability with highest potential risk from flooding during to failure of deployable systems
Least reliability with highest potential risk from flooding during to failure of deployable systems
Moderate reliability with potential risk from flooding limited to elevator shaft only
Highest reliability since deployable are not required to protect building from flooding
Risk Reduction Benefits
Maximum flood risk reduction benefits assuming deployable and flood proofing is effective
Maximum flood risk reduction benefits assuming deployable and flood proofing is effective
Maximum flood risk reduction benefits
Maximum flood risk reduction benefits
Quality of Life BenefitsVisual Aesthetics
Facility may not be operational during the storm event
Facility may not be operational during the storm event
Facility can be potentially operational during the storm event
Facility can be potentially operational during the storm event
Qualitative Color Scale Green=Least resource intensive alternative Purple=most resource intensive yellow=medium level of resource intensity
A new non-critical facility with a building structure is proposed on a site that is currently in the 2015 Preliminary FEMA 1 annual chance floodplain with a BFE of 10rsquo (NAVD 88) The baseline conditions DFE to meet existing NYC codes and standards is 11rsquo (NAVD 88) Using the Guidelines recommended design criteria the facilityrsquos DFE is 133rsquo (NAVD 88) and existing grade is around 6rsquo (NAVD 88) The project design team develops three alternatives to meet the Guidelinesrsquo recommended DFE design for the facility Table 7 offers an example of how a qualitative assessment can be used to compare three resilient design alternatives using the evaluation criteria and metrics
CASE STUDY Example of How to Use the Evaluation Matrix
NYC Mayorrsquos Office of Recovery and Resiliency Climate Resiliency Design Guidelines
33IIIE BCA METHODOLOGY FOR PROJECTS OVER $50 MILLION
E BCA methodology for projects over $50 millionIn order for a project to be considered cost-effective a benefit-cost analysis (BCA) assesses if the benefits of a project outweigh its costs or in other words the benefit-cost ratio (BCR) is greater than 10 as illustrated in Equation 1
Equation 1 Benefit-Cost Ratio Formula
BCR =
Where BCR = Benefit-Cost Ratio
BENEFITS = Total project benefits
COSTS = Total project costs
BENEFITSCOSTS
These estimated project benefits are combined with the project costs which are defined as the differential construction and long-term operation and maintenance costs associated with constructing a proposed project to the Guidelinesrsquo recommended design level It is assumed that the baseline project will be designed to the most prevalent NYC codes and standards This benefit methodology should be used to determine the additional project benefit that the Guidelinesrsquo recommended design would provide over the baseline project benefit It is assumed that the project design team will develop alternatives to address each of the following applicable climate stressors - sea level risecoastal storm surge increased precipitation and extreme heat - separately For each alternative the project design team should use the following steps to determine the Benefit-Cost Ratio (BCR)
a) Determine project useful life for design interventions Determining the useful life of the proposed project is an important first step in the
detailed BCA assessment methodologies for two reasons First the project useful life determines what values must be used from the Guidelines to establish the future climate design conditions The various hazard tables in the Guidelines establish design requirements based on useful life ranges through 2039 2040-2069 2070-2099 and 2100+ (2100+ projections are only available for sea level rise) A review of these tables show that the design requirements needed to meet the projected climate hazards increase as the end of useful life range increases Second the useful life determines how long the project will need to be operated and maintained in order to remain technically sound and effective at reducing future damages and losses
b) Determine discount rate for project benefits calculation The cost-effectiveness of projects assessed using the BCR must be done on a net
present value basis meaning the present value of the benefits is compared to the present value of the costs Most project costs are computed for present value based on current cost estimates bids or cost guidance However project benefits - as well as project costs for operation and maintenance - accrue over time into the future and are computed on an annualized basis To address this issue the Present Value Coefficient (PVC) is used to bring these annualized project benefits and OampM costs into the present value As indicated by the formula in Equation 2 the PVC is a function of the Project Useful Life (PUL) and the Discount Rate (DR)
NYC Mayorrsquos Office of Recovery and Resiliency Climate Resiliency Design Guidelines
34
Equation 2 Present Value Coefficient (PVC) Formula
PVC =
Where PVC = Present Value Coefficient
PUL = BCA Project Useful Life based on project type
DR = Discount Rate
The project design team should coordinate with agencies and NYC OMB if needed to determine appropriate discount rates based on funding source project type and other factors This coordination should take place during project initiation phase where total project costs (design and construction) are over $50 million66
c) Develop input data to perform benefit calculations Tables 16 and 17 in Appendix 4 provide a list of typical input data by each climate
stressor needed to perform benefit analysis quantitatively on variety of facilities67 The project design team should use these tables as a reference to identify appropriate input data categories andor additional input data needed to perform benefit analysis on the project
d) Identify applicable project benefit categories to estimate benefits Tables 16 and 17 in Appendix 4 provide a list of typical project benefits by each climate
stressor needed to perform benefit analysis quantitatively on various types of projects The project design team should use these tables as a reference to identify appropriate project benefit categories for each climate stressor to perform benefit analysis on the project
e) Calculate benefits of recommended design interventions for each climate
stressor The input data and applicable project benefits can be assembled along with
incremental project cost data to analyze cost-effectiveness using the FEMA BCA Tool Damage-Frequency Assessment (DFA) module or similar software This analysis will provide a BCR for each alternative which can then be used to compare the alternatives that were developed to mitigate effects from applicable climate stressors The project design team can then use the results from this analysis to identify optimal interventions that provides a balanced solution that provides resiliency benefits within the available project budget
IIIE BCA METHODOLOGY FOR PROJECTS OVER $50 MILLION
[1 ndash (1 + DR) -(PUL)]DR
66 For example a NYC OMB March 2015 memorandum recommends using an annually updated DR as published each year in Appendix C of OMB Circular A-94 The current OMB-recommended discount rates from OMB A-94 Appendix C vary by project useful life and are as follows 21 DR for useful lives of 10 to 19 years 25 DR for useful lives of 20 to 29 years and 28 DR for useful lives of 30 years or greater By contrast FEMA hazard mitigation grants use a DR of 70 for all projects based on the Federal OMB A-94 rate for federally-funded mitigation measures Since these DRs will impact the PVC and the project benefits the project team must ensure that BCA results prepared using an OMB-recommended DR (21 to 28) be updated to reflect the Federal DR (70) when applying for FEMA mitigation grant funds
67 Note the data requirements for the sea level rise and increased precipitation hazards in Table 16 are more detailed than the requirements for the extreme heat hazards due to the less detailed level of analysis available for extreme heat
NYC Mayorrsquos Office of Recovery and Resiliency Climate Resiliency Design Guidelines
35
APPENDICES
NYC Mayorrsquos Office of Recovery and Resiliency Climate Resiliency Design Guidelines
36APPENDIX 1 ndash KEY TERMS
100-year flood (1 annual chance flood)
A flood that has a 1 probability of occurring in any given year The 100-year floodplain is the extent of the area of a flood that has a 1 chance of occurring or being exceeded in any given year
500-year flood (02 annual chance flood)
A flood that has a 02 probability of occurring in any given year The 500-year floodplain is the extent of the area of a flood that has a 02 chance of occurring or being exceeded in any given year
AdaptationAdjustment in natural or human systems to a new or changing environment that seeks to maximize beneficial opportunities or moderate negative effects Successful adaptations contribute to resiliency
Base flood elevation (BFE)The elevation of surface water resulting from a flood that has a 1 annual chance of occurring or being exceeded in any given year The BFE is shown on the Flood Insurance Rate Map (FIRM)69
BluebeltReference to the Department of Environmental Protectionrsquos (DEP) Bluebelt program to preserve natural drainage corridors including streams ponds and other wetland areas Preservation of these wetland systems allows them to perform their functions of conveying storing and filtering storm water
Climate
The average weather (or more rigorously a statistical description of the average in terms of the mean and variability) over a period of time usually 30 years These quantities are most often surface variables such as temperature precipitation and wind Climate in a wider sense is the state including a statistical description of the climate system70
Climate change
Changes in average weather conditions that persist over multiple decades or longer Climate change encompasses both increases and decreases in temperature as well as shifts in precipitation changing risk of certain types of severe weather events and changes to other variables of the climate system
Climate change riskThe chance that investments (such as in capital projects) can be affected by the physical impacts of climate change71 Risks are evaluated as a product of the probability of occurrence and the magnitude of damages or impacts including socioeconomic factors that would result if they did occur (consequences)
Climate change risk assessment
This assessment involves a detailed project-specific analysis that includes a vulnerability and risk assessment often followed by cost-benefit analysis to assess and select investments in climate change risk mitigation Risk is assessed as a function of the magnitude and probability of a given climate change hazard Examples resources are included in Appendix 7
Climate vulnerabilityThe degree to which systems and populations are affected by adverse impacts It is a function of the character magnitude and rate of climate change and variation to which a system is exposed its sensitivity and its adaptive capacity72
Cloudburst An extreme amount of rain in a short period of time often over a small geographic area73
Cooling Degree Day (CDD) A form of degree-day used to estimate the energy requirements for air conditioning or refrigeration when the daily mean temperature is above 65degF
68 All terms are from the US Global Change Research Program (USGCRP) glossary unless otherwise noted The USGCRP glossary is available at httpwwwglobalchangegovclimate-changeglossary
69 ldquoDefinitionsrdquo FEMA last modified March 1 2017 httpswwwfemagovnational-flood-insurance-programdefinitions70 UKCIP Glossary httpwwwukciporgukglossary71 ldquoAccount for Climate Riskrdquo International Finance Corporation 72 UKCIP Glossary httpwwwukciporgukglossary73 New York City Environmental Protection ldquoCloudburst Resiliency Planning Studyrdquo 2017 Available at httpwwwnycgovhtmldeppdfclimatenyc-cloudburst-studypdf
APPENDIX 1 - KEY TERMS68
NYC Mayorrsquos Office of Recovery and Resiliency Climate Resiliency Design Guidelines
37APPENDIX 1 ndash KEY TERMS
Design life The life expectancy of an asset or product as determined during design74 As opposed to useful life (see below)
Dry Bulb temperature The ambient air temperature measured by a thermometer
Extreme eventUnexpected unusual or unpredictable weather or flooding compared to historical or future projected distribution Extreme events include for example heat waves cold waves heavy rains periods of drought and flooding and severe storms
Facilities For the purposes of this document ldquofacilitiesrdquo refers to all types of buildings housing infrastructure structures and landscape features designed by or for the City of New York
Flexible adaptation pathwayResilience-building strategies that can evolve or be adapted over time as climate change risk assessments evaluations of adaptation strategies and monitoring continue75
Flood Insurance Rate Maps (FIRM)
Official flood map of a community on which FEMA has delineated the 1 annual chance floodplain and the base flood elevations (BFEs) applicable to the community76 The FIRM also includes the 02 floodplain annual chance floodplain and differentiates between special flood hazard areas (V A Coast A zones) and floodways The official FIRM is from the year 2007 while the 2015 PFIRM is currently required by NYC Building Code to calculate design flood elevations NYC DOB references the more restrictive of the two maps in both base flood elevation and flood hazard area (ie V versus A zone) Refer to Appendix 3 for more information
FreeboardAn additional amount of height above the base flood elevation used as a factor of safety (eg two feet above the base flood) in determining the level at which a facilitys lowest floor must be elevated or floodproofed to be in accordance with state or community floodplain management regulations77
Future time slices
Future periods defined by the NPCC for when climate change projections are available In this document the following decadal projections are associated with specific time spans2020s projection = present to 20392050s projection = 2040 to 20592080s projection = 2070 to 20992100s projection = end of century and beyond
Green infrastructureAn array of practices that use or mimic natural systems to manage urban stormwater runoff Water is either directed to engineered systems for infiltration or detained for longer periods before it enters the sewer system
Heat Vulnerability Index (HVI)Summarizes relative risk of adverse health effects from heat due to social and environmental factors Used to identify neighborhoods at higher risk during and after extreme heat events
Heat wave A period of three consecutive days where temperatures rise above 90degF or two consecutive days over 95 degrees78
New York City Panel on Climate Change (NPCC)
The body of leading climate and social scientists charged with making climate change projections for the metropolitan region79
74 Sustainable Infrastructure Management Program Learning Environment httpsimplewerforg 75 Rosenzweig C et al Climate Change Adaptation in New York City Building a Risk Management Response76 ldquoDefinitionsrdquo FEMA77 Ibid78 Horton R et al New York City Panel on Climate Change 2015 Report Chapter 1 Climate Observations and Projections Ann NY
Acad Sci ISSN 0077-8923 (New York 2015) 2579 For more information on the NPCC visit www1nycgovsiteorrchallengesnyc-panel-on-climate-changepage
NYC Mayorrsquos Office of Recovery and Resiliency Climate Resiliency Design Guidelines
38APPENDIX 1 ndash KEY TERMS
Open-grid pavement system
Pavements that consist of loose substrates supported by a grid of a more structurally sound grid or webbing Unbounded loose substrates in these systems transfer and store less heat than bound and compacted pavements and aid permeability Pavement is 50 pervious and contains vegetation in the open cells designed to allow percolation or infiltration of storm water through the surface into the soil below80
Preliminary Flood Insurance Rate Map (PFIRM)
Preliminary flood map developed by FEMA in 2015 for New York City that provides projected risks for flood hazards81 Refer to Appendix 3 for more information
Project useful life (PUL)
The period over which an asset or component is expected to be available for use by an entity This depends on regular and adequate maintenance This period of time typically exceeds the design life (see above) The combined effect of operational requirements and useful life is practical in assessing an investment in improving resilience82
Rain gardenAlso called ldquobioswalerdquo Planted areas designed to collect and manage stormwater that runs off streets sidewalks commercial and residential rooftops and other sources when it rains
Resiliency The ability to bounce back after change or adversity The capability of preparing for responding to and recovering from difficult conditions83
Sea level rise-adjusted design flood elevation
As defined in these Guidelines the increased height of the base flood elevation due to sea level rise plus freeboard depending on the criticality of the facility The sea level rise adjustment depends on the useful life of the facility
Storm surge An abnormal rise of water generated by a storm over and above predicted astronomical tides84
Substantial improvementAny repair reconstruction rehabilitation addition or improvement of a building or structure the cost which equals or exceeds 50 of the market value of the structure before the improvement or repairs started For more information see Appendix G of the NYC Building Code and 1 RCNY sect3606-0185
Tidal inundation Flooding which occurs at high tides due to climate-related sea level rise land subsidence andor the loss of natural barriers86
Urban Heat Island (UHI) effectThe tendency for higher air temperatures to persist in urban areas as a result of heat absorbed and emitted by buildings and asphalt tending to make cities warmer than the surrounding suburban and rural areas
Weather The state of the atmosphere at a given time with regard to temperature cloudiness precipitation wind and other meteorological conditions87
Wet Bulb temperatureThe temperature indicated when a thermometer bulb is covered with a water-saturated wick over which air is caused to flow at approximately 45 ms (900 ftmin) to reach the equilibrium temperature of water evaporating into the air when the heat of vaporization is supplied by the sensible heat of the air88
80 ldquoGlossaryrdquo US Green Building Council (2017) Available at httpwwwusgbcorgglossaryterm552581 ldquoPreliminary FEMA Map Productsrdquo FEMA Map Service Center Available at httpshazardsfemagovfemaportalprelimdownload82 ldquoGlossaryrdquo International Infrastructure Management Manual (2011) 83 A Stronger More Resilient New York (2013) 184 ldquoStorm Surge Overviewrdquo National Hurricane Center NOAA Available at httpswwwnhcnoaagovsurge85 ldquoFlood Resistant Constructionrdquo Appendix G New York City Building Code (2008) and 1 RCNY sect3606-01 available at httpswww1nycgovassetsbuildingsrules1_RCNY_3606-01pdf86 ldquoOcean Factsrdquo National Ocean Service NOAA Available at httpoceanservicenoaagovfactsnuisance-floodinghtml 87 UKCIP Glossary httpwwwukciporgukglossary88 ldquoASHRAE Terminologyrdquo ASHRAE Available at httpswwwashraeorgtechnical-resourcesauthoring-toolsterminology
NYC Mayorrsquos Office of Recovery and Resiliency Climate Resiliency Design Guidelines
39APPENDIX 2 - CLIMATE CHANGE PROJECTIONS
Climate change projections are provided by the New York City Panel on Climate Change (NPCC) The full NPCC report is available from the New York Academy of Sciences89 Tables 8-10 (below) were reproduced directly from the NPCC report while Table 2 (see Section IIA) was developed using the data underlying the NPCC report to inform the design of HVAC systems under warmer conditions
Table 8 ndash NYC sea level rise projections90
Baseline (2000-2004) 0 in
Low estimate (10th percentile)
Middle range (25th to 75th percentile)
High estimate (90th percentile)
2020s 2 in 4-8 in 10 in
2050s 8 in 11-21 in 30 in
2080s 13 in 18-39 in 58 in
2100 15 in 22-50 in 75 in
Note Projections are based on six-component approach that incorporates both local and global factors The model-based components are from 24 global climate models and two representative concentration pathways Projections are relative to the 2000-2004 base period
Table 9 ndash Mean annual changes91
a Temperature Baseline(1971-2000) 54degF
Low estimate (10th percentile)
Middle range (25th to 75th percentile)
High estimate (90th percentile)
2020s + 15degF +20-29degF +32degF
2050s +31degF +41-57degF +66degF
2080s +38degF +53-88degF +103degF
2100 +42degF +58-104degF +121F
b Precipitation Baseline(1971-2000) 501 in
Low estimate (10th percentile)
Middle range (25th to 75th percentile)
High estimate (90th percentile)
2020s -1 percent +1-8 +10
2050s +1 percent +4-11 +13
2080s +2 percent +5-13 +19
2100 -6 percent -1 to +19 +25
Note Based on 35 global climate models (GCMs) and two RCPs Baseline data cover the 1971ndash2000 base period and are from the NOAA National Climatic Data Center (NCDC) Shown are the low estimate (10th percentile) middle range (25th percentile to 75th percentile) and high estimate (90th percentile) These estimates are based on a ranking (from most to least) of the 70 (35 GCMs times 2 RCPs) projections The 90th percentile is defined as the value that 90 percent of the outcomes (or 63 of the 70 values) are the same or lower than Like all projections the NPCC climate change projections have uncertainty embedded within them Sources of uncertainty include data and modeling constraints the random nature of some parts of the climate system and limited understanding of some physical processes The NPCC characterizes levels of uncertainty using state-of-the-art climate models multiple scenarios of future greenhouse gas concentrations and recent peer-reviewed literature Even so the projections are not true probabilities and the potential for error should be acknowledged
89 The NPCC 2015 report is available at httponlinelibrarywileycomdoi101111nyas20151336issue-1issuetoc90 From New York City Panel on Climate Change 2015 Report Chapter 1 Climate Observations and Projections page 4191 From New York City Panel on Climate Change 2015 Report Chapter 1 Climate Observations and Projections page 30
APPENDIX 2 - CLIMATE CHANGE PROJECTIONS
NYC Mayorrsquos Office of Recovery and Resiliency Climate Resiliency Design Guidelines
40APPENDIX 2 - CLIMATE CHANGE PROJECTIONS
Table 10 ndash Extreme events92
2020s Baseline (1971-2000)
Low estimate(10th percentile)
Middle range(25th to 75th percentile)
High estimate (90th percentile)
Numbers of heat waves per year 2 3 3-4 4
Average heat wave duration (days) 4 5 5 5
Number of days per year with
Maximum temperature at or above 90degF 18 24 26-31 33
Maximum temperature at or above 100degF 04 07 1-2 2
Minimum temperature at or below 32degF 71 50 52-58 60
Rainfall at or above 1 inch 13 13 14-15 16
Rainfall at or above 2 inches 3 3 3-4 5
Rainfall at or above 4 inches 03 02 03ndash04 05
2050s Baseline (1971-2000)
Low estimate(10th percentile)
Middle range(25th to 75th percentile)
High estimate (90th percentile)
Numbers of heat waves per year 2 4 5-7 7
Average heat wave duration (days) 4 5 5-6 6
Number of days per year with
Maximum temperature at or above 90degF 18 32 39-52 57
Maximum temperature at or above 100degF 04 2 3-5 7
Minimum temperature at or below 32degF 71 37 42-48 52
Rainfall at or above 1 inch 13 13 14-16 17
Rainfall at or above 2 inches 3 3 4-4 5
Rainfall at or above 4 inches 03 03 03-04 05
2080s Baseline (1971-2000)
Low estimate(10th percentile)
Middle range(25th to 75th percentile)
High estimate (90th percentile)
Numbers of heat waves per year 2 5 6-9 9
Average heat wave duration (days) 4 5 5-7 8
Number of days per year with
Maximum temperature at or above 90degF 18 38 44-76 87
Maximum temperature at or above 100degF 04 2 4-14 20
Minimum temperature at or below 32degF 71 25 30-42 49
Rainfall at or above 1 inch 13 14 15-17 18
Rainfall at or above 2 inches 3 3 4-5 5
Rainfall at or above 4 inches 03 02 03-05 07
Note Projections for temperature and precipitation are based on 35 GCMs and 2 RCPs Baseline data are for the 1971 to 2000 base period and are from the NOAA National Climatic Data Center (NCDC) Shown are the low estimate (10th percentile) middle range (25th to 75th percentile) and high estimate (90th percentile) 30-year mean values from model-based outcomes Decimal places are shown for values less than one although this does not indicate higher precisioncertainty Heat waves are defined as three or more consecutive days with maximum temperatures at or above 90degF Like all projections the NPCC climate change projections have uncertainty embedded within them Sources of uncertainty include data and modeling constraints the random nature of some parts of the climate system and limited understanding of some physical processes The NPCC characterizes levels of uncertainty using state-of-the-art climate models multiple scenarios of future greenhouse gas concentrations and recent peer-reviewed literature Even so the projections are not true probabilities and the potential for error should be acknowledged
92 From New York City Panel on Climate Change 2015 Report Chapter 1 Climate Observations and Projections page 31
NYC Mayorrsquos Office of Recovery and Resiliency Climate Resiliency Design Guidelines
41APPENDIX 3 - DIFFERENTIATION OF FLOOD MAPS
These Guidelines reference several different kinds of flood maps and sources of design flood elevations These maps are described and differentiated below
Table 11 - Differentiation of flood maps used in NYC
Reference Title Data Source Information Provided Referenced By Link
2007 FIRM FEMA
Based on historical data from before 1983 identifies the current base flood (extent and elevation) as the flood that has a 1 chance of occurring in any given year also known as a 100-year flood The NYC Building Code requires that either the 2007 FIRM or 2015 PFIRM elevation be used whichever is higher
2014 NYC Building Code Appendix G
Climate Resiliency Design Guidelines
httpsmscfemagovportal
2015 PFIRM FEMA
Based on historical data identifies the current base flood (extents and elevation) as the flood that has a 1 chance of occurring in any given year also known as a 100-year flood The NYC Building Code requires that either the 2007 FIRM or 2015 PFIRM elevation be used whichever is higher The 2015 PFIRM is currently being reassessed by FEMA
2014 NYC Building Code Appendix G
Climate Resiliency Design Guidelines
httpshazardsfemagovfemaportalprelimdownload
httpwwwregion2coastalcomview-flood-maps-dataview-preliminary-flood-map-data
NYC Flood Hazard Mapper
NYC Department of City Planning
Maps current and future flood hazards in NYC including the following data layers 2007 FIRM and 2015 PFIRM high tide with sea level rise and PFIRM with sea level rise through 2100
Climate Resiliency Design Guidelines
Waterfront Revitalization Plan
httpwww1nycgovsiteplanningdata-mapsflood-hazard-mapperpage
ldquoTable 4 ndash Determine the sea level rise-adjusted design flood elevation for critical and non-critical facilitiesrdquo
ORR amp NPCC
Provides data to use when adding sea level rise to a given 2015 PFIRM or 2007 FIRM Base Flood Elevation (BFE) to calculate a Design Flood Elevation (DFE) Based on the criticality and expected useful life of a facility
Climate Resiliency Design Guidelines
See Section II on ldquoSea Level Riserdquo above
APPENDIX 3 - DIFFERENTIATION OF FLOOD MAPS
NYC Mayorrsquos Office of Recovery and Resiliency Climate Resiliency Design Guidelines
42APPENDIX 4 - PROJECT BENEFITS CATEGORIES
This appendix provides guidance on how to identify and assess benefits as a supplement to Sections IIID and IIIE
Table 12 lists typical direct benefits for reducing impacts from climate stressors and basic guidance for how to estimate them See Section IIID for more information
Table 13 lists typical indirect benefits for reducing impacts from climate stressors and basic guidance for how to estimate them See Section IIID for more information
Table 12 ndash Direct benefits for (1) sea level rise with coastal storm surge and (2) increased precipitation measures
Direct Benefit Basic Guidance for Estimating Values
Physical Damages (Structure Contents)
bull For flood-damaged buildings use depth damage functions developed by FEMA and USACE for structures and contents
bull Use depth damage functions in conjunction with Building Replacement Values (BRVs) and not market values BRVs typically range between $100 to $325SF for residential buildings and $120 to $450SF for commercial public buildings
bull For more complex structures or facilities use engineering estimates of flood damages or review historic flood damages documented from insurance claims repair records or FEMA Public Assistance claims from recent flood disasters
Residential Displacements
bull For flood-damaged buildings use depth damage functions developed by FEMA and USACE for residential displacements
Reduced Life CycleOperation and Maintenance (OampM) Costs93
bull Applicable only to projects that reduce overall life cycle costs or net annual OampM costs from baseline conditions
bull Input reduced annual OampM costs as a project benefit at a 1-year recurrence intervalbull Reduced overall life cycle costs can be input as a longer project useful life
Table 13 ndash Indirect benefits for (1) sea level rise with coastal storm surge and (2) increased precipitation measures
Indirect Benefit Basic Guidance for Estimating Values
Non-Residential Building Service Losses
bull Estimate service loss values and durations for non-residential buildings public buildings critical facilities and parksnatural features based on FEMA BCA guidance and standard values based on building use
Utility Service Losses94
bull Estimate utility service losses for water wastewater and electrical facilities based on the number of impacted customers FEMA per capita standard values for utility service ($105personday for potable water $49personday for wastewater $148personday for electrical)95
bull Estimate utility service loss durations based on engineering estimates or review historic flood damages losses documented from utility company records
bull This benefit can also apply to measures that increase energy efficiency
RoadBridge Service Losses
bull Estimate roadbridge service losses based on the average daily traffic (ADT) detour time and additional travel distance and FEMA and GSA standard values for road service ($3344vehiclehour of delay $0545mile)96
bull Estimate roadbridge service loss durations or review historic flood damages losses
Emergency Service Losses
bull Applicable only to projects that reduce or eliminate documented emergency service costs from baseline conditions
bull Examples of avoided emergency services costs include NYPD staffing to monitor barricades for flooded roads or NFDY staffing for water rescues of residents from flooded buildings or streets
APPENDIX 4 - PROJECT BENEFITS CATEGORIES
93 Reduced life cycle costs may be applicable to some measures that provide extreme heat benefits such as green roofs that can last longer than a standard roof if properly maintained
94 Reduced utility service costs may be applicable to some measures that provide extreme heat benefits such as cool roofs green roofs and shade trees
95 FEMA per capita standard values taken from FEMA BCA Toolkit Version 530 (Build Date 12222016) and developed in FEMArsquos Baseline Standard Economic Value Methodology Report (July 28 2016) Consider updating FEMA standard per capita values to reflect current New York City utility rates
96 Consider updating FEMA and GSA standard values to reflect current New York City area labor rates and fuel costs
NYC Mayorrsquos Office of Recovery and Resiliency Climate Resiliency Design Guidelines
43APPENDIX 4 - PROJECT BENEFITS CATEGORIES
Table 14 ndash Other potential benefits for (1) sea level rise with coastal storm surge and (2) increased precipitation measures
Other Benefit Basic Guidance for Estimating Values
Avoided Stress and Anxiety
bull Applicable only for projects that directly benefit occupants of residential structuresbull Use FEMA standard value for avoided mental stress and anxiety treatment costs of $2443person to
estimate benefit for all impacted residents97
Avoided Lost Productivity
bull Applicable only for projects that directly benefit occupants of residential structuresbull Use FEMA standard value for avoided lost worker productivity costs of $8736household to estimate
benefit for all impacted workers (conservatively assuming one worker per household)
Environmental Open Space
bull Applicable only for projects that create or acquire open space areas by acquisitionbull Use FEMA standard value for environmental open space based on the type of land acquired ($8308
Acreyear for Green open space $39545Acreyear for Riparian $6010Acreyear for Wetlands $554Acreyear for Forests $1799Year for Marine and estuary)97
CSO Volume Reduction
bull Applicable only for projects that provide Combined Sewer Overflow (CSO) abatement by reducing the volume of rainfall runoff
bull Use CSO abatement cost of $0015gallonsyear applied to increased precipitation hazard runoff volume for 5-year design storm98
Ecosystem Service99
bull Add stormwater management benefits of green infrastructure projects to increased precipitation hazards where avoided damages and service losses are not quantified
bull Unit benefits applicable to increased precipitation hazard includeo Green roofs $0133SFyear (PUL 40 years)o BioswaleRain GardenMeadow Mix $0020SFyear (PUL 30 years)o Permeable Grass Pavers $0020SFyear (PUL 30 years)o Tree Plantings $303Treeyear (PUL 30 years)o Planter Box Trees $101Treeyear (PUL 15 years)
Real Estate99
bull Potential real estate benefits from increased resilience of residential andor commercial propertiesstreetscapesneighborhoods included within the project scope
bull Benefit applied to extreme heat hazard for green infrastructure projects directly impacting residential or commercial properties
Quality of Life Health Benefits99
bull Potential quality of life benefits related to improved public health from the resilience measures included within the project scope
bull Benefit applied to extreme heat hazard for green infrastructure projects directly impacting residential or commercial properties
Table 14 lists other typical benefits for reducing impacts from climate stressors and basic guidance for how to estimate them See Section IIID for more information
97 FEMA standard values for avoided mental stress and anxiety and environmental open space values taken from FEMA BCA Toolkit Version 530 (Build Date 12222016)
98 CSO abatement cost taken from APG1 Report for NYC ldquoTechnical Approaches for Benefit-Cost Analysis of Hazard Mitigation Projects in Urban and Coastal Environmentsrdquo (April 2016)
99 Ecosystem Services Real Estate and Quality of LifeHealth benefits tend to be more applicable to green infrastructure measures that provide extreme heat benefits such as green roofs trees and other plantings
NYC Mayorrsquos Office of Recovery and Resiliency Climate Resiliency Design Guidelines
44APPENDIX 4 - PROJECT BENEFITS CATEGORIES
Table 15 ndash Potential benefits for extreme heat (Urban Heat Island) reduction measures
Category Benefit Basic Guidance for Estimating Values
Direct Benefit
Reduced Life Cycle Cost
bull Applicable only to measures such as green roofs that are expected to last longer than standard roofs
bull Compute total cost savings including annual OampM costs
Indirect Benefit
Energy Savings
bull Applicable to measures that reduce energy costs by providing cooling through increased shading andor evapotranspiration
bull Use New York Power Authority rates of $0148kWh for electricity and $0810Therm for natural gas
Other Potential Benefits
Air Quality bull Applicable to measures that absorb pollutants andor reduce carbon dioxide emissions
Acoustics bull Applicable to measures such as green roof or walls that reduce noise transfer
Quality of LifeHealth bull Potential quality of life benefits and related to improved public health
Real Estate bull Applicable to measures that provide residential real estate benefits from increased resilience of propertiesstreetscapesneighborhoods
Retail Sales Marketing
bull Applicable to measures that provide commercial property benefits from increased aesthetics resulting in increased marketing and sales for streetscapesneighborhoods
Tax Credits Incentives
bull Applicable to resilience or green infrastructure measures such as green roofs that have accompanying Federal State or City tax credits or other incentives
Table 15 lists potential benefits for reducing impacts from heat and basic guidance for how to estimate them See Section IIID for more information
NYC Mayorrsquos Office of Recovery and Resiliency Climate Resiliency Design Guidelines
45APPENDIX 4 - PROJECT BENEFITS CATEGORIES
Table 16 ndash Guidance on quantitative calculations for (1) sea level rise with coastal storm surge and (2) increased precipitation measures
Data Input General Guidance ndash Basic Description
Applicable Benefit Category
Applicable Typical Facility Typology
Dire
ct B
enefi
ts
Indi
rect
Ben
efits
Oth
er P
oten
tial
Ben
efits
Bui
ldin
g St
ruct
ures
Com
plex
Fa
cilit
ies
Tran
spor
tatio
nSt
reet
scap
es
Plaz
as
Park
Fea
ture
s
First Floor Elevation (FFE)
bull The elevation of the first finished floor of the structure excluding basements
bull FFE measured from top of lowest floor (riverinenon-coastal high hazard areas) or bottom of lowest horizontal structural member (coastal high hazard areas)
Y Y Y Y
Building Replacement Value (BRV)
bull The unit cost to rebuild a structure of the same quality of construction
bull Not the same as market value
Y Y Y Y
Building Size
bull The total floor area of the building in square feet
bull Total Building Value = BRV x Building Sizebull Typical BRVs for NYC range between $100 to
$325SF for residential buildings and $120 to $450SF for commercialpublic buildings
Y Y Y Y
Structure Description
bull The type of building number of stories and foundation type (full basement partial basement no basement)
bull Collect more detailed foundation data for coastal flood zones
Y Y Y Y
Building Use bull Details related to residential housing commercial business and public use
Y Y Y Y Y
Building Type bull The primary use of building ndash residential commercial public and others
Y Y Y Y Y
Depth Damage Function (DDF)
bull Curves used to estimate structure damage contents damage and displacement of residential buildings based on flood depth
bull DDFs selection based on Structure Description Building Type Building Use
bull Structure DDFs based on percentage of Total Building Value
bull Contents DDFs based on percentage of Total Contents Value
bull Displacement DDFs based on number of displacement days x Displacement Cost
Y Y Y Y Y
Contents Value
bull The cost to replace structure contents (furnishings equipment)
bull Residential building Contents Values typically 50 BRV (FEMA DDFs) or 100 BRV (USACE DDFs)
bull Non-residential building Contents Values between 18 to over 100 depending on building use (USACE DDFs)
bull Total Contents Value = BRV x Building Size
Y Y Y Y Y
Table 16 provides general guidance on how to quantitatively calculate benefits from efforts to address from climate stressors See Section IIIE for more information
NYC Mayorrsquos Office of Recovery and Resiliency Climate Resiliency Design Guidelines
46APPENDIX 4 - PROJECT BENEFITS CATEGORIES
Table 16 ndash Guidance on quantitative calculations for (1) sea level rise with coastal storm surge and (2) increased precipitation measures
Data Input General Guidance ndash Basic Description
Applicable Benefit Category
Applicable Typical Facility Typology
Dire
ct B
enefi
ts
Indi
rect
Ben
efits
Oth
er P
oten
tial
Ben
efits
Bui
ldin
g St
ruct
ures
Com
plex
Fa
cilit
ies
Tran
spor
tatio
nSt
reet
scap
es
Plaz
as
Park
Fea
ture
s
Number of Residents (Residential)
bull Total number of occupants in a residential building
bull Typically estimated based on number of residential units x average number of individuals per household (based on current US Census data or use 25 individuals per household as a default)
Y Y Y Y Y
Displacement Cost (Residential)
bull The unit cost to lodge and feed displaced residents while flood damage is repaired
bull Average unit displacement cost of $415residential unitday recommended based on current FY2018 GSA Per Diem rates for New York City
Y Y Y Y Y
Value of Service (Non-Residential and Public)
bull The unit cost of service disruption and rental of temporary facilities while flood damage is repaired
bull Disruption costs for non-residential buildings typically range from $095 to $136SFmonth and rental costs range from $020 to $136SFmonth depending on building use
bull Value of service for public buildings ($day) is typically based on the annual operating budget for the City agency using the building prorated based on building size or population served by the building then divided by 365 daysyear
Y Y Y Y
Value of Service (Critical Facilities)
bull The unit cost of critical facilities (police fire emergency medical services) lost or delayed while flood damage is repaired
Y Y Y
Value of Service Duration
bull The duration of service disruption and rental of temporary facilities for non-residential buildings and critical facilities while flood damage is repaired
bull For non-residential buildingso Value of Service Durations vary from
4 months to over 30 months based on building use and the depth of flooding
o Total Value of Service Loss = (Disruption Cost x Building Area) = (Rental Cost x Building Area x Value of Service Duration)
bull For public buildings and critical facilitieso Value of Service Durations vary from 0
days to 720 months based on building use and the depth of flooding from FEMA FIA or USACE DDFs
o Total Value of Service Loss = (Value of Service) x (Service Loss Duration)
Y Y Y
NYC Mayorrsquos Office of Recovery and Resiliency Climate Resiliency Design Guidelines
47APPENDIX 4 - PROJECT BENEFITS CATEGORIES
Table 16 ndash Guidance on quantitative calculations for (1) sea level rise with coastal storm surge and (2) increased precipitation measures
Data Input General Guidance ndash Basic Description
Applicable Benefit Category
Applicable Typical Facility Typology
Dire
ct B
enefi
ts
Indi
rect
Ben
efits
Oth
er P
oten
tial
Ben
efits
Bui
ldin
g St
ruct
ures
Com
plex
Fa
cilit
ies
Tran
spor
tatio
nSt
reet
scap
es
Plaz
as
Park
Fea
ture
s
Engineering Estimates for Damages
bull Engineered estimate models of physical damages and service losses at the project site based on the Guidelines event recurrence interval(s) and flood depth(s)
Y Y Y Y Y Y
Historic Damages and Service Losses
bull Historic physical damages and service losses at the project site documented from previous flood events
bull Do not use routine maintenancebull The historic damage event recurrence interval
(RIs) andor flood depths must be determined updated for inflation to the present value and adjusted to match the Guidelines event RIsflood depths
Y Y Y Y Y Y
Facility Replacement Value
bull The unit cost to rebuild the facility
Impacted Area bull The geographic area impacted by the facility in the event of failure in acres
Y Y Y Y
Facility Capacity
bull The design capacity of the facilitybull For example - facility capacity expressed in
millions of gallons per day (MGD) for water and wastewater facilities or megawatts (MW) for electrical facilities
Y Y Y Y
Service Population
bull The number of impacted residents served by the facility
bull Typically estimated based on number of impacted residential customers x average number of individuals per household (based on current US Census data or use 25 individuals per household as a default)
bull Facilities serving mostly non-residentialpublic buildings andor critical facilities should focus on service losses rather than service population
Y Y Y
NYC Mayorrsquos Office of Recovery and Resiliency Climate Resiliency Design Guidelines
48APPENDIX 4 - PROJECT BENEFITS CATEGORIES
Table 16 ndash Guidance on quantitative calculations for (1) sea level rise with coastal storm surge and (2) increased precipitation measures
Data Input General Guidance ndash Basic Description
Applicable Benefit Category
Applicable Typical Facility Typology
Dire
ct B
enefi
ts
Indi
rect
Ben
efits
Oth
er P
oten
tial
Ben
efits
Bui
ldin
g St
ruct
ures
Com
plex
Fa
cilit
ies
Tran
spor
tatio
nSt
reet
scap
es
Plaz
as
Park
Fea
ture
s
Value of Service
bull Unit value of service provided by the facilitybull Example of FEMA standard values for complete
loss of utility service $105personday for potable water$49personday for wastewater$148personday for electrical
bull Consider updating FEMA standard per capita values to reflect current The New York City utility rates
Y Y
Roadway Elevations bull Roadway Elevations
Y Y
Roadway Replacement Value
bull Roadway Replacement ValueY Y
Inundation Area Map
bull Inundation Area Map developed by FEMA or through modeling by project design team
Y Y Y
Building Inventory of Inundation Area
bull The number and type of buildings within the streetscape and neighborhood inundated by the Guidelinersquos flood events
Y Y Y
Average Daily Traffic (ADT)
bull The average number of one-way traffic trips per day along the roadway(s) within the streetscapeneighborhood inundated by the Guidelinersquos flood events
Y Y
Additional Travel Time
bull The additional travel time needed to detour around a flooded roadway expressed in minutes
bull In the unlikely event there is no detour available use a 12-hour travel time per one-way trap but provide a detailed area street map as supporting documentation
Y Y
Value of Traffic Delay
bull The value of service associated with lost time in traffic
bull For example - FEMA standard average value of $3344vehiclehour of delay
bull Consider updating FEMA and GSA standard values to reflect current New York City area labor rates and fuel costs
Y Y
NYC Mayorrsquos Office of Recovery and Resiliency Climate Resiliency Design Guidelines
49APPENDIX 4 - PROJECT BENEFITS CATEGORIES
Table 17 ndash Guidance on quantitative unit benefit calculations for extreme heat hazard measures
Measure General Guidance ndash Unit Benefit Information and Data Requirements
Applicable Benefit Category
Applicable Typical Facility Typology
Dire
ct B
enefi
ts
Indi
rect
Ben
efits
Oth
er P
oten
tial
Ben
efits
Bui
ldin
g St
ruct
ures
Com
plex
Fa
cilit
ies
Tran
spor
tatio
nSt
reet
scap
es
Plaz
as
Park
Fea
ture
s
Green Roof
bull Unit benefit range over PUL = $470SF to $373SF of green roof area ($719SF standard value)
bull Assumed PUL = 40 yearsbull Apply standard value unit benefit to green
roof area to estimate measure benefitbull Higher range values more applicable
to residential and commercial building streetscape projects
Y Y Y Y Y Y
Bioswale Rain Garden Meadow Mix
bull Unit benefit range over PUL = $396SF to $211SF of area ($730SF standard value)
bull Assumed PUL = 30 yearsbull Apply standard value unit benefit to bioswale
rain gardenmeadow mix area to estimate total measure benefit
Y Y Y Y Y Y
Cool Roof
bull Unit benefit range over PUL = $117 to $3151SF of material area ($144SF standard value)
bull Assumed PUL = 20 yearsbull Apply standard value unit benefit to cool roof
area to estimate total measure benefitbull Higher range values more applicable to
residential building streetscape projects
Y Y Y Y Y
Light-Colored PaversLight-Colored Materials
bull Unit benefit range over PUL = $0774 to $204SF of material area ($0866SF standard value)
bull Assumed PUL = 30 yearsbull Apply standard value unit benefit to material
area to estimate total measure benefit
Y Y Y Y
Table 17 provides general guidance on how to quantitatively calculate benefits from efforts to address climate stressors See Section IIIE for more information
NYC Mayorrsquos Office of Recovery and Resiliency Climate Resiliency Design Guidelines
50APPENDIX 4 - PROJECT BENEFITS CATEGORIES
Table 17 ndash Guidance on quantitative unit benefit calculations for extreme heat hazard measures
Measure General Guidance ndash Unit Benefit Information and Data Requirements
Applicable Benefit Category
Applicable Typical Facility Typology
Dire
ct B
enefi
ts
Indi
rect
Ben
efits
Oth
er P
oten
tial
Ben
efits
Bui
ldin
g St
ruct
ures
Com
plex
Fa
cilit
ies
Tran
spor
tatio
nSt
reet
scap
es
Plaz
as
Park
Fea
ture
s
Tree Planting
bull Unit benefit range over PUL = $1005 to $77154Tree ($1855Tree standard value)
bull Assumed PUL = 30 yearsbull Apply standard value unit benefit to number of
trees to estimate total measure benefitbull Higher range values more applicable
to residential and commercial building streetscape projects
Y Y Y Y Y Y
Planter Box Tree
bull Unit benefit range over PUL = $212 to 16304Tree ($392Tree standard value)
bull Assumed PUL = 15 yearsbull Apply standard value unit benefit to number of
trees to estimate total measure benefitbull Higher range values more applicable
to residential and commercial building streetscape projects
Y Y Y Y Y
Shade Canopy
bull Unit benefit range over PUL = $0363 to $396SF ($0458SF standard value)
bull Assumed PUL = 15 yearsbull Apply standard value unit benefit to area of
shade canopy estimate total measure benefitbull Higher range values more applicable
to residential and commercial building streetscape projects
Y Y Y Y
Permeable Grass Pavers
bull Unit benefit range over PUL = $0258SF to $0521SF of pavers ($0363SF standard value)
bull Assumed PUL = 30 yearsbull Apply standard value unit benefit to paver
area to estimate total measure benefit
Y Y Y Y Y
For the purposes of the BCA refer to the following facility typologies bull ldquoBuilding Structuresrdquo include critical small building sites such as EMS or FDNY stations and non-critical small building sites such as
libraries or comfort stationsbull ldquoComplex Facilitiesrdquo include critical infrastructure such as wastewater treatment sites pump stations water filtration plants and similar
large or complex facilitiesbull ldquoTransportationStreetscapePlazasrdquo include roadway reconstruction streetscape improvements street raising plazas and other
transportation-related infrastructurebull ldquoPark Featuresrdquo include parks and similar public recreational facility with natural landscape features
NYC Mayorrsquos Office of Recovery and Resiliency Climate Resiliency Design Guidelines
51APPENDIX 5 - EXAMPLE PLANNING DECISION TREE
This decision tree provides a summarized example approach for how to implement these Guidelines Projects with a total cost greater than $50 million are recommended to conduct a full qualitative and quantitative climate change risk assessment and BCA while projects below $50 million are recommended to conduct a qualitative risk assessment and BCA
Define Project
1) Operational goals and criticality level2) Useful life3) Location in the current flood plain future floodplain and or zone
of tidal inundation and the project arearsquos score on the heat vulnerability index
Evaluate Project Risks According to Probability and Magnitude of Consequence
bull Extreme Heat bull Precipitationbull Sea Level Risebull Coastal Surge
High Level Identification and Assessment of Risk Mitigation Alternatives and Co-benefits
(qualitative)
Detailed Identification and Assessment of Risk Mitigation Alternatives and Co-benefits (qualitative and quantitative)
High Level Estimate of Costs and Benefits of Design Alternatives
(qualitative)
Detailed Estimate of Costs and Benefits of Design Alternatives
(qualitative and quantitative)
Decision Point Which climate change risks require mitigation
Decision Point Evaluate risk mitigation benefits and costs to
determine final resilient design alternative or if no action is required
Decision Point Is the total project cost above $50 million
Below $50 million Above $50 million
APPENDIX 5 - EXAMPLE PLANNING DECISION TREE
NYC Mayorrsquos Office of Recovery and Resiliency Climate Resiliency Design Guidelines
52
Project Title
Design Strategies Checklist (not exhaustive)
Extreme Heat Comments Extreme Precipitation Comments Sea Level Rise amp Storm Surge Comments
Select Site in Low Heat Vulnerability Index area Select High Elevation Site Select High Elevation Site
Minimize East-West Building Orientation Green Roof Raise Building Floor Elevation
Passive Solar Cooling and Ventilation Systems
Protect Below Grade Areas from Flooding Waterproof Building Envelope
Cool Roof (SRI appropriate) On-site Stormwater Management (gray) Elevate Critical Building Functions
Green Roof (extensive) Reduce Impervious Areas Elevate Critical Equipment
Vegetative Structures Permeable Pavement Perimeter Floodwall100 Levee (passive or active)
Enhanced HVAC System including space layout optimization and system scalability
Increase Green Spaces and Planted Areas DryWet Floodproofing
More Efficient Building Envelope Other Utility Redundancy Design101
Parking Lot Shading Resilient Materials amp Landscape Treatments
Light Colored Pavements (appropriate SRI) Design for Storm Surge Outflow
Increase Planted Areas Install Backwater Flow Prevention
Permeable Surfaces Design for Scour
Open-grid Pavement Raise Road Elevation
Other Other
This appendix provides a template for identifying possible design strategies to address climate change risks as described throughout the Guidelines
APPENDIX 6 - DESIGN STRATEGIES CHECKLIST
100 Permanent perimeter flood walls are not permitted to meet floodproofing requirements in buildings with substantial improvements andor damages 101 Utility redundancy design should be pursued for critical systems not all building systems
APPENDIX 6 - DESIGN STRATEGIES CHECKLIST
NYC Mayorrsquos Office of Recovery and Resiliency Climate Resiliency Design Guidelines
53APPENDIX 7 - CLIMATE CHANGE RISK ASSESSMENT RESOURCES
These Guidelines provide data on climate change hazards and recommend how that data can inform resilient design A risk assessment is a tool to help project managers and designers evaluate risk levels as well as select and prioritize resilient design strategies A high level risk assessment is recommended for all City capital projects with a total cost of under $50 million Projects above $50 million are recommended to conduct an in-depth assessment
Risk assessments use quantified estimates of the probability and magnitude of consequence of an event occurring to prioritize responses ldquoProbabilityrdquo is an assessment of the likelihood of a hazard occurring while ldquomagnituderdquo describes the hazardrsquos potential impact Risk assessment tools such as the examples listed below can be used to define and score these categories Projects that score higher across both probability and magnitude can be prioritized for investment and risk mitigation action Projects that score lower across both criteria may require no action beyond meeting code The results are typically charted on a risk matrix and an example is provided on the next page
The climate change risk management frameworks below offer templates for how to integrate climate change projections into a risk assessment process Refer to these resources for examples and further information
bull Vulnerability Assessment and Adaptation Framework is prepared by the Federal Highway Administration (FHWA) While developed for transportation planning this risk assessment framework has broad applicability for evaluating asset vulnerability to climate change Available at httpswwwfhwadotgovenvironmentsustainabilityresilienceadaptation_framework
bull US Climate Resilience Toolkit The US Global Change Research Program offers a step by step risk assessment
framework including tools and case studies at httpstoolkitclimategovsteps (see example on next page)
bull Coast Adapt Guidance on undertaking a risk assessment High level assessment httpscoastadaptcomausitesdefaultfilesfactsheetsT3M4_2_2nd_pass_risk_assessmentpdfDetailed assessment httpscoastadaptcomausitesdefaultfilesfactsheetsT3M4_3_3rd_pass_risk_assessmentpdf
bull Climate adaptation Risk uncertainty and decision-makingDownload the report here httpswwwukciporgukpublicationsRisk
The City plans to develop a NYC-specific process for integrating climate change data into existing risk management processes by April 2019
APPENDIX 7 - CLIMATE CHANGE RISK ASSESSMENT RESOURCES
NYC Mayorrsquos Office of Recovery and Resiliency Climate Resiliency Design Guidelines
54APPENDIX 7 - CLIMATE CHANGE RISK ASSESSMENT RESOURCES
The Risk Characterization Matrix below is an example from the US Climate Resilience Toolkit This tool can be used to assess the probability and magnitude of impact for identified risks The risk of coincident climate stressorsrisks (such as storm surge plus increased precipitation) can also be assessed as applicable
Figure 14 - Example of a climate change risk matrix (adapted from US Climate Resilience Toolkit)
Project teams can determine the magnitude of the impact (along the horizontal scale of 1 through 3 with 3 being the most severe) and the probabilitylikelihood of occurrence for each specific risk (along the vertical scale with 3 being the most likely) A score is typically assigned for each risk (Probabil-ity x Magnitude) and then charted on the matrix Based on the estimated probability and magnitude of consequence above the risks are ranked and prioritized for mitigation Factors to bear in mind include
bull Not all facility typologies have the same level of functional and operational importance during events or tolerance for disruption
bull Not all climate stressors and risks have the same level of impact on each project sitebull Not all identified risks can or should be mitigated fully
NYC Mayorrsquos Office of Recovery and Resiliency Climate Resiliency Design Guidelines
55WORKS CITED
A Stronger More Resilient New York PlaNYC Report of the NYC Special Initiative for Rebuilding and Resiliency The City of New York 2013
ldquoAccount for Climate Riskrdquo International Finance Corporation accessed March 27 2017 httpwwwifcorgwpswcmconnectTopics_Ext_ContentIFC_External_Corporate_SiteClimate+Business
PrioritiesAccount+for+Climate+Risk
American Society of Heating Refrigeration and Air-Conditioning Engineers (ASHRAE) Handbook -Fundamentals 2017
ldquoBaseline Standard Economic Value Methodology Reportrdquo Federal Emergency Management Agency July 2016
Benefit Cost Analysis Toolkit Software Version 530 Federal Emergency Management Agency (build date December 2016)
Criteria for Detention Facility Design New York City Department of Environmental Protection November 2012
Community Resilience Planning Guide for Buildings and Infrastructure Systems Vol 1 NIST Special Publication 1190 US Department of Commerce 2016
Cool and Green Roofing Manual NYC Department of Design and Construction 2007 httpwwwnycgovhtmlddcdownloadspdfcool_green_roof_manpdf
Building Resiliency Task Force US Urban Green Building Council New York 2013 httpurbangreencouncilforcecomBuildingResiliency
Design and Planning for Flood Resiliency Guidelines for NYC Parks New York City Department of Parks and Recreation 2017
httpswwwnycgovparksorgplanning-and-buildingplanningresiliency-plansflood-resiliency
Flooded Bus Barns and Buckled Rails Federal Transit Administration Office of Budget and Policy 2011 httpswwwhsdlorgabstractampdid=685187
Floodproofing Non-Residential Buildings FEMA P936 FEMA 2013 httpswwwfemagovmedia-library-data9a50c534fc5895799321dcdd4b6083e7P-936_8-20-13_508rpdf
ldquoGlossaryrdquo International Infrastructure Management Manual National Asset Management Support Group New Zealand 2011 httpwwwipweaorg
ldquoGreen Roof Metrics Draft Reportrdquo New York City Department of Parks and Recreation 2017
ldquoGuide to Rain Event Preparednessrdquo NYC Department of Environmental Protection httpwwwnycgovhtmldeppdfbrochuresflood-preparedness-flyerpdf
ldquoGuidelines and Discount Rates for Benefit-Cost Analysis of Federal Programsrdquo Appendix C Circular A-94 US Office of Management and Budget (OMB) 2017
ldquoGuidelines for the Design and Construction of Stormwater Management Systemsrdquo New York City Department of Environmental Protection July 2012
Horton R et al New York City Panel on Climate Change 2015 Report Ann NY Acad Sci ISSN 0077-892 New York 2015
Madrigano J et al ldquoA case-only study of vulnerability to heat wavendashrelated mortality in New York City (2000ndash2011)rdquo Environmental Health Perspectives 123672ndash678 2013
WORKS CITED
NYC Mayorrsquos Office of Recovery and Resiliency Climate Resiliency Design Guidelines
56WORKS CITED
enspMcGregor et al Two Degrees The Built Environment and Our Changing Climate Routledge Press 2013
NYC Green Codes Task Force US Green Building Council New York 2010 httpurbangreencouncilorgGreenCodes
NYCrsquos Risk Landscape A Guide to Hazard Mitigation NYC Emergency Management 2014
One New York The Plan for a Strong and Just City The City of New York 2015 httpwwwnycgovhtmlonenyc downloadspdfpublicationsOneNYCpdf
Ready to Respond Strategies for Multifamily Building Resilience Enterprise Green Communities 2015 httpswwwenterprisecommunityorgresources
Rosenzweig C et al Climate Change Adaptation in New York City Building a Risk Management Response New York City Panel on Climate Change 2010
httponlinelibrarywileycomdoi101111nyas20101196issue-1 issuetoc
ldquoSustainable Infrastructure Management Program Learning Environmentrdquo Water Environment Research Foundation accessed March 24 2017 httpsimplewerforg
Urban Waterfront Adaptive Strategies NYC Department of City Planning 2013 httpwww1nycgovsiteplanningplanssustainable-communitiesclimate-resiliencepagetab=1
Wastewater Resiliency Plan Climate Risk Assessment and Adaptation Study New York City Department of Environmental Protection October 2013
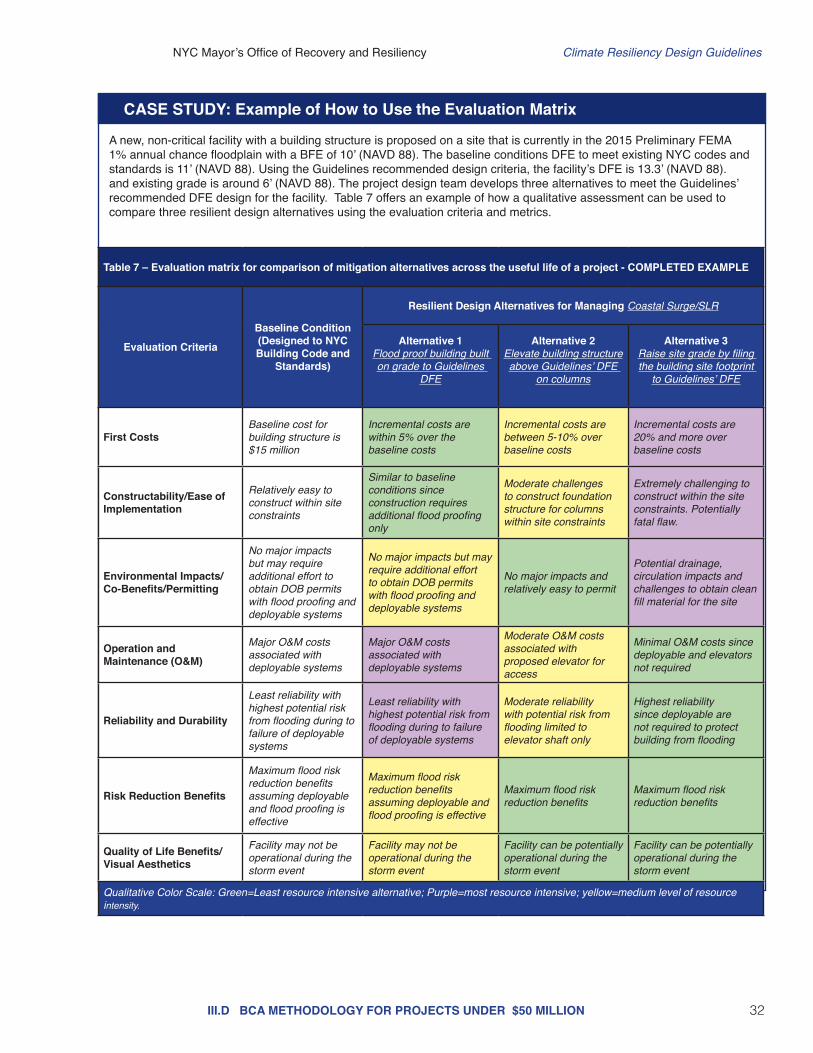
NYC Mayorrsquos Office of Recovery and Resiliency Climate Resiliency Design Guidelines
32IIID BCA METHODOLOGY FOR PROJECTS UNDER $50 MILLION
Table 7 ndash Evaluation matrix for comparison of mitigation alternatives across the useful life of a project - COMPLETED EXAMPLE
Evaluation Criteria
Baseline Condition (Designed to NYC Building Code and
Standards)
Resilient Design Alternatives for Managing Coastal SurgeSLR
Alternative 1Flood proof building built on grade to Guidelines
DFE
Alternative 2 Elevate building structure above Guidelinesrsquo DFE
on columns
Alternative 3 Raise site grade by filing the building site footprint
to Guidelinesrsquo DFE
First CostsBaseline cost for building structure is $15 million
Incremental costs are within 5 over the baseline costs
Incremental costs are between 5-10 over baseline costs
Incremental costs are 20 and more over baseline costs
ConstructabilityEase of Implementation
Relatively easy to construct within site constraints
Similar to baseline conditions since construction requires additional flood proofing only
Moderate challenges to construct foundation structure for columns within site constraints
Extremely challenging to construct within the site constraints Potentially fatal flaw
Environmental ImpactsCo-BenefitsPermitting
No major impacts but may require additional effort to obtain DOB permits with flood proofing and deployable systems
No major impacts but may require additional effort to obtain DOB permits with flood proofing and deployable systems
No major impacts and relatively easy to permit
Potential drainage circulation impacts and challenges to obtain clean fill material for the site
Operation and Maintenance (OampM)
Major OampM costs associated with deployable systems
Major OampM costs associated with deployable systems
Moderate OampM costs associated with proposed elevator for access
Minimal OampM costs since deployable and elevators not required
Reliability and Durability
Least reliability with highest potential risk from flooding during to failure of deployable systems
Least reliability with highest potential risk from flooding during to failure of deployable systems
Moderate reliability with potential risk from flooding limited to elevator shaft only
Highest reliability since deployable are not required to protect building from flooding
Risk Reduction Benefits
Maximum flood risk reduction benefits assuming deployable and flood proofing is effective
Maximum flood risk reduction benefits assuming deployable and flood proofing is effective
Maximum flood risk reduction benefits
Maximum flood risk reduction benefits
Quality of Life BenefitsVisual Aesthetics
Facility may not be operational during the storm event
Facility may not be operational during the storm event
Facility can be potentially operational during the storm event
Facility can be potentially operational during the storm event
Qualitative Color Scale Green=Least resource intensive alternative Purple=most resource intensive yellow=medium level of resource intensity
A new non-critical facility with a building structure is proposed on a site that is currently in the 2015 Preliminary FEMA 1 annual chance floodplain with a BFE of 10rsquo (NAVD 88) The baseline conditions DFE to meet existing NYC codes and standards is 11rsquo (NAVD 88) Using the Guidelines recommended design criteria the facilityrsquos DFE is 133rsquo (NAVD 88) and existing grade is around 6rsquo (NAVD 88) The project design team develops three alternatives to meet the Guidelinesrsquo recommended DFE design for the facility Table 7 offers an example of how a qualitative assessment can be used to compare three resilient design alternatives using the evaluation criteria and metrics
CASE STUDY Example of How to Use the Evaluation Matrix
NYC Mayorrsquos Office of Recovery and Resiliency Climate Resiliency Design Guidelines
33IIIE BCA METHODOLOGY FOR PROJECTS OVER $50 MILLION
E BCA methodology for projects over $50 millionIn order for a project to be considered cost-effective a benefit-cost analysis (BCA) assesses if the benefits of a project outweigh its costs or in other words the benefit-cost ratio (BCR) is greater than 10 as illustrated in Equation 1
Equation 1 Benefit-Cost Ratio Formula
BCR =
Where BCR = Benefit-Cost Ratio
BENEFITS = Total project benefits
COSTS = Total project costs
BENEFITSCOSTS
These estimated project benefits are combined with the project costs which are defined as the differential construction and long-term operation and maintenance costs associated with constructing a proposed project to the Guidelinesrsquo recommended design level It is assumed that the baseline project will be designed to the most prevalent NYC codes and standards This benefit methodology should be used to determine the additional project benefit that the Guidelinesrsquo recommended design would provide over the baseline project benefit It is assumed that the project design team will develop alternatives to address each of the following applicable climate stressors - sea level risecoastal storm surge increased precipitation and extreme heat - separately For each alternative the project design team should use the following steps to determine the Benefit-Cost Ratio (BCR)
a) Determine project useful life for design interventions Determining the useful life of the proposed project is an important first step in the
detailed BCA assessment methodologies for two reasons First the project useful life determines what values must be used from the Guidelines to establish the future climate design conditions The various hazard tables in the Guidelines establish design requirements based on useful life ranges through 2039 2040-2069 2070-2099 and 2100+ (2100+ projections are only available for sea level rise) A review of these tables show that the design requirements needed to meet the projected climate hazards increase as the end of useful life range increases Second the useful life determines how long the project will need to be operated and maintained in order to remain technically sound and effective at reducing future damages and losses
b) Determine discount rate for project benefits calculation The cost-effectiveness of projects assessed using the BCR must be done on a net
present value basis meaning the present value of the benefits is compared to the present value of the costs Most project costs are computed for present value based on current cost estimates bids or cost guidance However project benefits - as well as project costs for operation and maintenance - accrue over time into the future and are computed on an annualized basis To address this issue the Present Value Coefficient (PVC) is used to bring these annualized project benefits and OampM costs into the present value As indicated by the formula in Equation 2 the PVC is a function of the Project Useful Life (PUL) and the Discount Rate (DR)
NYC Mayorrsquos Office of Recovery and Resiliency Climate Resiliency Design Guidelines
34
Equation 2 Present Value Coefficient (PVC) Formula
PVC =
Where PVC = Present Value Coefficient
PUL = BCA Project Useful Life based on project type
DR = Discount Rate
The project design team should coordinate with agencies and NYC OMB if needed to determine appropriate discount rates based on funding source project type and other factors This coordination should take place during project initiation phase where total project costs (design and construction) are over $50 million66
c) Develop input data to perform benefit calculations Tables 16 and 17 in Appendix 4 provide a list of typical input data by each climate
stressor needed to perform benefit analysis quantitatively on variety of facilities67 The project design team should use these tables as a reference to identify appropriate input data categories andor additional input data needed to perform benefit analysis on the project
d) Identify applicable project benefit categories to estimate benefits Tables 16 and 17 in Appendix 4 provide a list of typical project benefits by each climate
stressor needed to perform benefit analysis quantitatively on various types of projects The project design team should use these tables as a reference to identify appropriate project benefit categories for each climate stressor to perform benefit analysis on the project
e) Calculate benefits of recommended design interventions for each climate
stressor The input data and applicable project benefits can be assembled along with
incremental project cost data to analyze cost-effectiveness using the FEMA BCA Tool Damage-Frequency Assessment (DFA) module or similar software This analysis will provide a BCR for each alternative which can then be used to compare the alternatives that were developed to mitigate effects from applicable climate stressors The project design team can then use the results from this analysis to identify optimal interventions that provides a balanced solution that provides resiliency benefits within the available project budget
IIIE BCA METHODOLOGY FOR PROJECTS OVER $50 MILLION
[1 ndash (1 + DR) -(PUL)]DR
66 For example a NYC OMB March 2015 memorandum recommends using an annually updated DR as published each year in Appendix C of OMB Circular A-94 The current OMB-recommended discount rates from OMB A-94 Appendix C vary by project useful life and are as follows 21 DR for useful lives of 10 to 19 years 25 DR for useful lives of 20 to 29 years and 28 DR for useful lives of 30 years or greater By contrast FEMA hazard mitigation grants use a DR of 70 for all projects based on the Federal OMB A-94 rate for federally-funded mitigation measures Since these DRs will impact the PVC and the project benefits the project team must ensure that BCA results prepared using an OMB-recommended DR (21 to 28) be updated to reflect the Federal DR (70) when applying for FEMA mitigation grant funds
67 Note the data requirements for the sea level rise and increased precipitation hazards in Table 16 are more detailed than the requirements for the extreme heat hazards due to the less detailed level of analysis available for extreme heat
NYC Mayorrsquos Office of Recovery and Resiliency Climate Resiliency Design Guidelines
35
APPENDICES
NYC Mayorrsquos Office of Recovery and Resiliency Climate Resiliency Design Guidelines
36APPENDIX 1 ndash KEY TERMS
100-year flood (1 annual chance flood)
A flood that has a 1 probability of occurring in any given year The 100-year floodplain is the extent of the area of a flood that has a 1 chance of occurring or being exceeded in any given year
500-year flood (02 annual chance flood)
A flood that has a 02 probability of occurring in any given year The 500-year floodplain is the extent of the area of a flood that has a 02 chance of occurring or being exceeded in any given year
AdaptationAdjustment in natural or human systems to a new or changing environment that seeks to maximize beneficial opportunities or moderate negative effects Successful adaptations contribute to resiliency
Base flood elevation (BFE)The elevation of surface water resulting from a flood that has a 1 annual chance of occurring or being exceeded in any given year The BFE is shown on the Flood Insurance Rate Map (FIRM)69
BluebeltReference to the Department of Environmental Protectionrsquos (DEP) Bluebelt program to preserve natural drainage corridors including streams ponds and other wetland areas Preservation of these wetland systems allows them to perform their functions of conveying storing and filtering storm water
Climate
The average weather (or more rigorously a statistical description of the average in terms of the mean and variability) over a period of time usually 30 years These quantities are most often surface variables such as temperature precipitation and wind Climate in a wider sense is the state including a statistical description of the climate system70
Climate change
Changes in average weather conditions that persist over multiple decades or longer Climate change encompasses both increases and decreases in temperature as well as shifts in precipitation changing risk of certain types of severe weather events and changes to other variables of the climate system
Climate change riskThe chance that investments (such as in capital projects) can be affected by the physical impacts of climate change71 Risks are evaluated as a product of the probability of occurrence and the magnitude of damages or impacts including socioeconomic factors that would result if they did occur (consequences)
Climate change risk assessment
This assessment involves a detailed project-specific analysis that includes a vulnerability and risk assessment often followed by cost-benefit analysis to assess and select investments in climate change risk mitigation Risk is assessed as a function of the magnitude and probability of a given climate change hazard Examples resources are included in Appendix 7
Climate vulnerabilityThe degree to which systems and populations are affected by adverse impacts It is a function of the character magnitude and rate of climate change and variation to which a system is exposed its sensitivity and its adaptive capacity72
Cloudburst An extreme amount of rain in a short period of time often over a small geographic area73
Cooling Degree Day (CDD) A form of degree-day used to estimate the energy requirements for air conditioning or refrigeration when the daily mean temperature is above 65degF
68 All terms are from the US Global Change Research Program (USGCRP) glossary unless otherwise noted The USGCRP glossary is available at httpwwwglobalchangegovclimate-changeglossary
69 ldquoDefinitionsrdquo FEMA last modified March 1 2017 httpswwwfemagovnational-flood-insurance-programdefinitions70 UKCIP Glossary httpwwwukciporgukglossary71 ldquoAccount for Climate Riskrdquo International Finance Corporation 72 UKCIP Glossary httpwwwukciporgukglossary73 New York City Environmental Protection ldquoCloudburst Resiliency Planning Studyrdquo 2017 Available at httpwwwnycgovhtmldeppdfclimatenyc-cloudburst-studypdf
APPENDIX 1 - KEY TERMS68
NYC Mayorrsquos Office of Recovery and Resiliency Climate Resiliency Design Guidelines
37APPENDIX 1 ndash KEY TERMS
Design life The life expectancy of an asset or product as determined during design74 As opposed to useful life (see below)
Dry Bulb temperature The ambient air temperature measured by a thermometer
Extreme eventUnexpected unusual or unpredictable weather or flooding compared to historical or future projected distribution Extreme events include for example heat waves cold waves heavy rains periods of drought and flooding and severe storms
Facilities For the purposes of this document ldquofacilitiesrdquo refers to all types of buildings housing infrastructure structures and landscape features designed by or for the City of New York
Flexible adaptation pathwayResilience-building strategies that can evolve or be adapted over time as climate change risk assessments evaluations of adaptation strategies and monitoring continue75
Flood Insurance Rate Maps (FIRM)
Official flood map of a community on which FEMA has delineated the 1 annual chance floodplain and the base flood elevations (BFEs) applicable to the community76 The FIRM also includes the 02 floodplain annual chance floodplain and differentiates between special flood hazard areas (V A Coast A zones) and floodways The official FIRM is from the year 2007 while the 2015 PFIRM is currently required by NYC Building Code to calculate design flood elevations NYC DOB references the more restrictive of the two maps in both base flood elevation and flood hazard area (ie V versus A zone) Refer to Appendix 3 for more information
FreeboardAn additional amount of height above the base flood elevation used as a factor of safety (eg two feet above the base flood) in determining the level at which a facilitys lowest floor must be elevated or floodproofed to be in accordance with state or community floodplain management regulations77
Future time slices
Future periods defined by the NPCC for when climate change projections are available In this document the following decadal projections are associated with specific time spans2020s projection = present to 20392050s projection = 2040 to 20592080s projection = 2070 to 20992100s projection = end of century and beyond
Green infrastructureAn array of practices that use or mimic natural systems to manage urban stormwater runoff Water is either directed to engineered systems for infiltration or detained for longer periods before it enters the sewer system
Heat Vulnerability Index (HVI)Summarizes relative risk of adverse health effects from heat due to social and environmental factors Used to identify neighborhoods at higher risk during and after extreme heat events
Heat wave A period of three consecutive days where temperatures rise above 90degF or two consecutive days over 95 degrees78
New York City Panel on Climate Change (NPCC)
The body of leading climate and social scientists charged with making climate change projections for the metropolitan region79
74 Sustainable Infrastructure Management Program Learning Environment httpsimplewerforg 75 Rosenzweig C et al Climate Change Adaptation in New York City Building a Risk Management Response76 ldquoDefinitionsrdquo FEMA77 Ibid78 Horton R et al New York City Panel on Climate Change 2015 Report Chapter 1 Climate Observations and Projections Ann NY
Acad Sci ISSN 0077-8923 (New York 2015) 2579 For more information on the NPCC visit www1nycgovsiteorrchallengesnyc-panel-on-climate-changepage
NYC Mayorrsquos Office of Recovery and Resiliency Climate Resiliency Design Guidelines
38APPENDIX 1 ndash KEY TERMS
Open-grid pavement system
Pavements that consist of loose substrates supported by a grid of a more structurally sound grid or webbing Unbounded loose substrates in these systems transfer and store less heat than bound and compacted pavements and aid permeability Pavement is 50 pervious and contains vegetation in the open cells designed to allow percolation or infiltration of storm water through the surface into the soil below80
Preliminary Flood Insurance Rate Map (PFIRM)
Preliminary flood map developed by FEMA in 2015 for New York City that provides projected risks for flood hazards81 Refer to Appendix 3 for more information
Project useful life (PUL)
The period over which an asset or component is expected to be available for use by an entity This depends on regular and adequate maintenance This period of time typically exceeds the design life (see above) The combined effect of operational requirements and useful life is practical in assessing an investment in improving resilience82
Rain gardenAlso called ldquobioswalerdquo Planted areas designed to collect and manage stormwater that runs off streets sidewalks commercial and residential rooftops and other sources when it rains
Resiliency The ability to bounce back after change or adversity The capability of preparing for responding to and recovering from difficult conditions83
Sea level rise-adjusted design flood elevation
As defined in these Guidelines the increased height of the base flood elevation due to sea level rise plus freeboard depending on the criticality of the facility The sea level rise adjustment depends on the useful life of the facility
Storm surge An abnormal rise of water generated by a storm over and above predicted astronomical tides84
Substantial improvementAny repair reconstruction rehabilitation addition or improvement of a building or structure the cost which equals or exceeds 50 of the market value of the structure before the improvement or repairs started For more information see Appendix G of the NYC Building Code and 1 RCNY sect3606-0185
Tidal inundation Flooding which occurs at high tides due to climate-related sea level rise land subsidence andor the loss of natural barriers86
Urban Heat Island (UHI) effectThe tendency for higher air temperatures to persist in urban areas as a result of heat absorbed and emitted by buildings and asphalt tending to make cities warmer than the surrounding suburban and rural areas
Weather The state of the atmosphere at a given time with regard to temperature cloudiness precipitation wind and other meteorological conditions87
Wet Bulb temperatureThe temperature indicated when a thermometer bulb is covered with a water-saturated wick over which air is caused to flow at approximately 45 ms (900 ftmin) to reach the equilibrium temperature of water evaporating into the air when the heat of vaporization is supplied by the sensible heat of the air88
80 ldquoGlossaryrdquo US Green Building Council (2017) Available at httpwwwusgbcorgglossaryterm552581 ldquoPreliminary FEMA Map Productsrdquo FEMA Map Service Center Available at httpshazardsfemagovfemaportalprelimdownload82 ldquoGlossaryrdquo International Infrastructure Management Manual (2011) 83 A Stronger More Resilient New York (2013) 184 ldquoStorm Surge Overviewrdquo National Hurricane Center NOAA Available at httpswwwnhcnoaagovsurge85 ldquoFlood Resistant Constructionrdquo Appendix G New York City Building Code (2008) and 1 RCNY sect3606-01 available at httpswww1nycgovassetsbuildingsrules1_RCNY_3606-01pdf86 ldquoOcean Factsrdquo National Ocean Service NOAA Available at httpoceanservicenoaagovfactsnuisance-floodinghtml 87 UKCIP Glossary httpwwwukciporgukglossary88 ldquoASHRAE Terminologyrdquo ASHRAE Available at httpswwwashraeorgtechnical-resourcesauthoring-toolsterminology
NYC Mayorrsquos Office of Recovery and Resiliency Climate Resiliency Design Guidelines
39APPENDIX 2 - CLIMATE CHANGE PROJECTIONS
Climate change projections are provided by the New York City Panel on Climate Change (NPCC) The full NPCC report is available from the New York Academy of Sciences89 Tables 8-10 (below) were reproduced directly from the NPCC report while Table 2 (see Section IIA) was developed using the data underlying the NPCC report to inform the design of HVAC systems under warmer conditions
Table 8 ndash NYC sea level rise projections90
Baseline (2000-2004) 0 in
Low estimate (10th percentile)
Middle range (25th to 75th percentile)
High estimate (90th percentile)
2020s 2 in 4-8 in 10 in
2050s 8 in 11-21 in 30 in
2080s 13 in 18-39 in 58 in
2100 15 in 22-50 in 75 in
Note Projections are based on six-component approach that incorporates both local and global factors The model-based components are from 24 global climate models and two representative concentration pathways Projections are relative to the 2000-2004 base period
Table 9 ndash Mean annual changes91
a Temperature Baseline(1971-2000) 54degF
Low estimate (10th percentile)
Middle range (25th to 75th percentile)
High estimate (90th percentile)
2020s + 15degF +20-29degF +32degF
2050s +31degF +41-57degF +66degF
2080s +38degF +53-88degF +103degF
2100 +42degF +58-104degF +121F
b Precipitation Baseline(1971-2000) 501 in
Low estimate (10th percentile)
Middle range (25th to 75th percentile)
High estimate (90th percentile)
2020s -1 percent +1-8 +10
2050s +1 percent +4-11 +13
2080s +2 percent +5-13 +19
2100 -6 percent -1 to +19 +25
Note Based on 35 global climate models (GCMs) and two RCPs Baseline data cover the 1971ndash2000 base period and are from the NOAA National Climatic Data Center (NCDC) Shown are the low estimate (10th percentile) middle range (25th percentile to 75th percentile) and high estimate (90th percentile) These estimates are based on a ranking (from most to least) of the 70 (35 GCMs times 2 RCPs) projections The 90th percentile is defined as the value that 90 percent of the outcomes (or 63 of the 70 values) are the same or lower than Like all projections the NPCC climate change projections have uncertainty embedded within them Sources of uncertainty include data and modeling constraints the random nature of some parts of the climate system and limited understanding of some physical processes The NPCC characterizes levels of uncertainty using state-of-the-art climate models multiple scenarios of future greenhouse gas concentrations and recent peer-reviewed literature Even so the projections are not true probabilities and the potential for error should be acknowledged
89 The NPCC 2015 report is available at httponlinelibrarywileycomdoi101111nyas20151336issue-1issuetoc90 From New York City Panel on Climate Change 2015 Report Chapter 1 Climate Observations and Projections page 4191 From New York City Panel on Climate Change 2015 Report Chapter 1 Climate Observations and Projections page 30
APPENDIX 2 - CLIMATE CHANGE PROJECTIONS
NYC Mayorrsquos Office of Recovery and Resiliency Climate Resiliency Design Guidelines
40APPENDIX 2 - CLIMATE CHANGE PROJECTIONS
Table 10 ndash Extreme events92
2020s Baseline (1971-2000)
Low estimate(10th percentile)
Middle range(25th to 75th percentile)
High estimate (90th percentile)
Numbers of heat waves per year 2 3 3-4 4
Average heat wave duration (days) 4 5 5 5
Number of days per year with
Maximum temperature at or above 90degF 18 24 26-31 33
Maximum temperature at or above 100degF 04 07 1-2 2
Minimum temperature at or below 32degF 71 50 52-58 60
Rainfall at or above 1 inch 13 13 14-15 16
Rainfall at or above 2 inches 3 3 3-4 5
Rainfall at or above 4 inches 03 02 03ndash04 05
2050s Baseline (1971-2000)
Low estimate(10th percentile)
Middle range(25th to 75th percentile)
High estimate (90th percentile)
Numbers of heat waves per year 2 4 5-7 7
Average heat wave duration (days) 4 5 5-6 6
Number of days per year with
Maximum temperature at or above 90degF 18 32 39-52 57
Maximum temperature at or above 100degF 04 2 3-5 7
Minimum temperature at or below 32degF 71 37 42-48 52
Rainfall at or above 1 inch 13 13 14-16 17
Rainfall at or above 2 inches 3 3 4-4 5
Rainfall at or above 4 inches 03 03 03-04 05
2080s Baseline (1971-2000)
Low estimate(10th percentile)
Middle range(25th to 75th percentile)
High estimate (90th percentile)
Numbers of heat waves per year 2 5 6-9 9
Average heat wave duration (days) 4 5 5-7 8
Number of days per year with
Maximum temperature at or above 90degF 18 38 44-76 87
Maximum temperature at or above 100degF 04 2 4-14 20
Minimum temperature at or below 32degF 71 25 30-42 49
Rainfall at or above 1 inch 13 14 15-17 18
Rainfall at or above 2 inches 3 3 4-5 5
Rainfall at or above 4 inches 03 02 03-05 07
Note Projections for temperature and precipitation are based on 35 GCMs and 2 RCPs Baseline data are for the 1971 to 2000 base period and are from the NOAA National Climatic Data Center (NCDC) Shown are the low estimate (10th percentile) middle range (25th to 75th percentile) and high estimate (90th percentile) 30-year mean values from model-based outcomes Decimal places are shown for values less than one although this does not indicate higher precisioncertainty Heat waves are defined as three or more consecutive days with maximum temperatures at or above 90degF Like all projections the NPCC climate change projections have uncertainty embedded within them Sources of uncertainty include data and modeling constraints the random nature of some parts of the climate system and limited understanding of some physical processes The NPCC characterizes levels of uncertainty using state-of-the-art climate models multiple scenarios of future greenhouse gas concentrations and recent peer-reviewed literature Even so the projections are not true probabilities and the potential for error should be acknowledged
92 From New York City Panel on Climate Change 2015 Report Chapter 1 Climate Observations and Projections page 31
NYC Mayorrsquos Office of Recovery and Resiliency Climate Resiliency Design Guidelines
41APPENDIX 3 - DIFFERENTIATION OF FLOOD MAPS
These Guidelines reference several different kinds of flood maps and sources of design flood elevations These maps are described and differentiated below
Table 11 - Differentiation of flood maps used in NYC
Reference Title Data Source Information Provided Referenced By Link
2007 FIRM FEMA
Based on historical data from before 1983 identifies the current base flood (extent and elevation) as the flood that has a 1 chance of occurring in any given year also known as a 100-year flood The NYC Building Code requires that either the 2007 FIRM or 2015 PFIRM elevation be used whichever is higher
2014 NYC Building Code Appendix G
Climate Resiliency Design Guidelines
httpsmscfemagovportal
2015 PFIRM FEMA
Based on historical data identifies the current base flood (extents and elevation) as the flood that has a 1 chance of occurring in any given year also known as a 100-year flood The NYC Building Code requires that either the 2007 FIRM or 2015 PFIRM elevation be used whichever is higher The 2015 PFIRM is currently being reassessed by FEMA
2014 NYC Building Code Appendix G
Climate Resiliency Design Guidelines
httpshazardsfemagovfemaportalprelimdownload
httpwwwregion2coastalcomview-flood-maps-dataview-preliminary-flood-map-data
NYC Flood Hazard Mapper
NYC Department of City Planning
Maps current and future flood hazards in NYC including the following data layers 2007 FIRM and 2015 PFIRM high tide with sea level rise and PFIRM with sea level rise through 2100
Climate Resiliency Design Guidelines
Waterfront Revitalization Plan
httpwww1nycgovsiteplanningdata-mapsflood-hazard-mapperpage
ldquoTable 4 ndash Determine the sea level rise-adjusted design flood elevation for critical and non-critical facilitiesrdquo
ORR amp NPCC
Provides data to use when adding sea level rise to a given 2015 PFIRM or 2007 FIRM Base Flood Elevation (BFE) to calculate a Design Flood Elevation (DFE) Based on the criticality and expected useful life of a facility
Climate Resiliency Design Guidelines
See Section II on ldquoSea Level Riserdquo above
APPENDIX 3 - DIFFERENTIATION OF FLOOD MAPS
NYC Mayorrsquos Office of Recovery and Resiliency Climate Resiliency Design Guidelines
42APPENDIX 4 - PROJECT BENEFITS CATEGORIES
This appendix provides guidance on how to identify and assess benefits as a supplement to Sections IIID and IIIE
Table 12 lists typical direct benefits for reducing impacts from climate stressors and basic guidance for how to estimate them See Section IIID for more information
Table 13 lists typical indirect benefits for reducing impacts from climate stressors and basic guidance for how to estimate them See Section IIID for more information
Table 12 ndash Direct benefits for (1) sea level rise with coastal storm surge and (2) increased precipitation measures
Direct Benefit Basic Guidance for Estimating Values
Physical Damages (Structure Contents)
bull For flood-damaged buildings use depth damage functions developed by FEMA and USACE for structures and contents
bull Use depth damage functions in conjunction with Building Replacement Values (BRVs) and not market values BRVs typically range between $100 to $325SF for residential buildings and $120 to $450SF for commercial public buildings
bull For more complex structures or facilities use engineering estimates of flood damages or review historic flood damages documented from insurance claims repair records or FEMA Public Assistance claims from recent flood disasters
Residential Displacements
bull For flood-damaged buildings use depth damage functions developed by FEMA and USACE for residential displacements
Reduced Life CycleOperation and Maintenance (OampM) Costs93
bull Applicable only to projects that reduce overall life cycle costs or net annual OampM costs from baseline conditions
bull Input reduced annual OampM costs as a project benefit at a 1-year recurrence intervalbull Reduced overall life cycle costs can be input as a longer project useful life
Table 13 ndash Indirect benefits for (1) sea level rise with coastal storm surge and (2) increased precipitation measures
Indirect Benefit Basic Guidance for Estimating Values
Non-Residential Building Service Losses
bull Estimate service loss values and durations for non-residential buildings public buildings critical facilities and parksnatural features based on FEMA BCA guidance and standard values based on building use
Utility Service Losses94
bull Estimate utility service losses for water wastewater and electrical facilities based on the number of impacted customers FEMA per capita standard values for utility service ($105personday for potable water $49personday for wastewater $148personday for electrical)95
bull Estimate utility service loss durations based on engineering estimates or review historic flood damages losses documented from utility company records
bull This benefit can also apply to measures that increase energy efficiency
RoadBridge Service Losses
bull Estimate roadbridge service losses based on the average daily traffic (ADT) detour time and additional travel distance and FEMA and GSA standard values for road service ($3344vehiclehour of delay $0545mile)96
bull Estimate roadbridge service loss durations or review historic flood damages losses
Emergency Service Losses
bull Applicable only to projects that reduce or eliminate documented emergency service costs from baseline conditions
bull Examples of avoided emergency services costs include NYPD staffing to monitor barricades for flooded roads or NFDY staffing for water rescues of residents from flooded buildings or streets
APPENDIX 4 - PROJECT BENEFITS CATEGORIES
93 Reduced life cycle costs may be applicable to some measures that provide extreme heat benefits such as green roofs that can last longer than a standard roof if properly maintained
94 Reduced utility service costs may be applicable to some measures that provide extreme heat benefits such as cool roofs green roofs and shade trees
95 FEMA per capita standard values taken from FEMA BCA Toolkit Version 530 (Build Date 12222016) and developed in FEMArsquos Baseline Standard Economic Value Methodology Report (July 28 2016) Consider updating FEMA standard per capita values to reflect current New York City utility rates
96 Consider updating FEMA and GSA standard values to reflect current New York City area labor rates and fuel costs
NYC Mayorrsquos Office of Recovery and Resiliency Climate Resiliency Design Guidelines
43APPENDIX 4 - PROJECT BENEFITS CATEGORIES
Table 14 ndash Other potential benefits for (1) sea level rise with coastal storm surge and (2) increased precipitation measures
Other Benefit Basic Guidance for Estimating Values
Avoided Stress and Anxiety
bull Applicable only for projects that directly benefit occupants of residential structuresbull Use FEMA standard value for avoided mental stress and anxiety treatment costs of $2443person to
estimate benefit for all impacted residents97
Avoided Lost Productivity
bull Applicable only for projects that directly benefit occupants of residential structuresbull Use FEMA standard value for avoided lost worker productivity costs of $8736household to estimate
benefit for all impacted workers (conservatively assuming one worker per household)
Environmental Open Space
bull Applicable only for projects that create or acquire open space areas by acquisitionbull Use FEMA standard value for environmental open space based on the type of land acquired ($8308
Acreyear for Green open space $39545Acreyear for Riparian $6010Acreyear for Wetlands $554Acreyear for Forests $1799Year for Marine and estuary)97
CSO Volume Reduction
bull Applicable only for projects that provide Combined Sewer Overflow (CSO) abatement by reducing the volume of rainfall runoff
bull Use CSO abatement cost of $0015gallonsyear applied to increased precipitation hazard runoff volume for 5-year design storm98
Ecosystem Service99
bull Add stormwater management benefits of green infrastructure projects to increased precipitation hazards where avoided damages and service losses are not quantified
bull Unit benefits applicable to increased precipitation hazard includeo Green roofs $0133SFyear (PUL 40 years)o BioswaleRain GardenMeadow Mix $0020SFyear (PUL 30 years)o Permeable Grass Pavers $0020SFyear (PUL 30 years)o Tree Plantings $303Treeyear (PUL 30 years)o Planter Box Trees $101Treeyear (PUL 15 years)
Real Estate99
bull Potential real estate benefits from increased resilience of residential andor commercial propertiesstreetscapesneighborhoods included within the project scope
bull Benefit applied to extreme heat hazard for green infrastructure projects directly impacting residential or commercial properties
Quality of Life Health Benefits99
bull Potential quality of life benefits related to improved public health from the resilience measures included within the project scope
bull Benefit applied to extreme heat hazard for green infrastructure projects directly impacting residential or commercial properties
Table 14 lists other typical benefits for reducing impacts from climate stressors and basic guidance for how to estimate them See Section IIID for more information
97 FEMA standard values for avoided mental stress and anxiety and environmental open space values taken from FEMA BCA Toolkit Version 530 (Build Date 12222016)
98 CSO abatement cost taken from APG1 Report for NYC ldquoTechnical Approaches for Benefit-Cost Analysis of Hazard Mitigation Projects in Urban and Coastal Environmentsrdquo (April 2016)
99 Ecosystem Services Real Estate and Quality of LifeHealth benefits tend to be more applicable to green infrastructure measures that provide extreme heat benefits such as green roofs trees and other plantings
NYC Mayorrsquos Office of Recovery and Resiliency Climate Resiliency Design Guidelines
44APPENDIX 4 - PROJECT BENEFITS CATEGORIES
Table 15 ndash Potential benefits for extreme heat (Urban Heat Island) reduction measures
Category Benefit Basic Guidance for Estimating Values
Direct Benefit
Reduced Life Cycle Cost
bull Applicable only to measures such as green roofs that are expected to last longer than standard roofs
bull Compute total cost savings including annual OampM costs
Indirect Benefit
Energy Savings
bull Applicable to measures that reduce energy costs by providing cooling through increased shading andor evapotranspiration
bull Use New York Power Authority rates of $0148kWh for electricity and $0810Therm for natural gas
Other Potential Benefits
Air Quality bull Applicable to measures that absorb pollutants andor reduce carbon dioxide emissions
Acoustics bull Applicable to measures such as green roof or walls that reduce noise transfer
Quality of LifeHealth bull Potential quality of life benefits and related to improved public health
Real Estate bull Applicable to measures that provide residential real estate benefits from increased resilience of propertiesstreetscapesneighborhoods
Retail Sales Marketing
bull Applicable to measures that provide commercial property benefits from increased aesthetics resulting in increased marketing and sales for streetscapesneighborhoods
Tax Credits Incentives
bull Applicable to resilience or green infrastructure measures such as green roofs that have accompanying Federal State or City tax credits or other incentives
Table 15 lists potential benefits for reducing impacts from heat and basic guidance for how to estimate them See Section IIID for more information
NYC Mayorrsquos Office of Recovery and Resiliency Climate Resiliency Design Guidelines
45APPENDIX 4 - PROJECT BENEFITS CATEGORIES
Table 16 ndash Guidance on quantitative calculations for (1) sea level rise with coastal storm surge and (2) increased precipitation measures
Data Input General Guidance ndash Basic Description
Applicable Benefit Category
Applicable Typical Facility Typology
Dire
ct B
enefi
ts
Indi
rect
Ben
efits
Oth
er P
oten
tial
Ben
efits
Bui
ldin
g St
ruct
ures
Com
plex
Fa
cilit
ies
Tran
spor
tatio
nSt
reet
scap
es
Plaz
as
Park
Fea
ture
s
First Floor Elevation (FFE)
bull The elevation of the first finished floor of the structure excluding basements
bull FFE measured from top of lowest floor (riverinenon-coastal high hazard areas) or bottom of lowest horizontal structural member (coastal high hazard areas)
Y Y Y Y
Building Replacement Value (BRV)
bull The unit cost to rebuild a structure of the same quality of construction
bull Not the same as market value
Y Y Y Y
Building Size
bull The total floor area of the building in square feet
bull Total Building Value = BRV x Building Sizebull Typical BRVs for NYC range between $100 to
$325SF for residential buildings and $120 to $450SF for commercialpublic buildings
Y Y Y Y
Structure Description
bull The type of building number of stories and foundation type (full basement partial basement no basement)
bull Collect more detailed foundation data for coastal flood zones
Y Y Y Y
Building Use bull Details related to residential housing commercial business and public use
Y Y Y Y Y
Building Type bull The primary use of building ndash residential commercial public and others
Y Y Y Y Y
Depth Damage Function (DDF)
bull Curves used to estimate structure damage contents damage and displacement of residential buildings based on flood depth
bull DDFs selection based on Structure Description Building Type Building Use
bull Structure DDFs based on percentage of Total Building Value
bull Contents DDFs based on percentage of Total Contents Value
bull Displacement DDFs based on number of displacement days x Displacement Cost
Y Y Y Y Y
Contents Value
bull The cost to replace structure contents (furnishings equipment)
bull Residential building Contents Values typically 50 BRV (FEMA DDFs) or 100 BRV (USACE DDFs)
bull Non-residential building Contents Values between 18 to over 100 depending on building use (USACE DDFs)
bull Total Contents Value = BRV x Building Size
Y Y Y Y Y
Table 16 provides general guidance on how to quantitatively calculate benefits from efforts to address from climate stressors See Section IIIE for more information
NYC Mayorrsquos Office of Recovery and Resiliency Climate Resiliency Design Guidelines
46APPENDIX 4 - PROJECT BENEFITS CATEGORIES
Table 16 ndash Guidance on quantitative calculations for (1) sea level rise with coastal storm surge and (2) increased precipitation measures
Data Input General Guidance ndash Basic Description
Applicable Benefit Category
Applicable Typical Facility Typology
Dire
ct B
enefi
ts
Indi
rect
Ben
efits
Oth
er P
oten
tial
Ben
efits
Bui
ldin
g St
ruct
ures
Com
plex
Fa
cilit
ies
Tran
spor
tatio
nSt
reet
scap
es
Plaz
as
Park
Fea
ture
s
Number of Residents (Residential)
bull Total number of occupants in a residential building
bull Typically estimated based on number of residential units x average number of individuals per household (based on current US Census data or use 25 individuals per household as a default)
Y Y Y Y Y
Displacement Cost (Residential)
bull The unit cost to lodge and feed displaced residents while flood damage is repaired
bull Average unit displacement cost of $415residential unitday recommended based on current FY2018 GSA Per Diem rates for New York City
Y Y Y Y Y
Value of Service (Non-Residential and Public)
bull The unit cost of service disruption and rental of temporary facilities while flood damage is repaired
bull Disruption costs for non-residential buildings typically range from $095 to $136SFmonth and rental costs range from $020 to $136SFmonth depending on building use
bull Value of service for public buildings ($day) is typically based on the annual operating budget for the City agency using the building prorated based on building size or population served by the building then divided by 365 daysyear
Y Y Y Y
Value of Service (Critical Facilities)
bull The unit cost of critical facilities (police fire emergency medical services) lost or delayed while flood damage is repaired
Y Y Y
Value of Service Duration
bull The duration of service disruption and rental of temporary facilities for non-residential buildings and critical facilities while flood damage is repaired
bull For non-residential buildingso Value of Service Durations vary from
4 months to over 30 months based on building use and the depth of flooding
o Total Value of Service Loss = (Disruption Cost x Building Area) = (Rental Cost x Building Area x Value of Service Duration)
bull For public buildings and critical facilitieso Value of Service Durations vary from 0
days to 720 months based on building use and the depth of flooding from FEMA FIA or USACE DDFs
o Total Value of Service Loss = (Value of Service) x (Service Loss Duration)
Y Y Y
NYC Mayorrsquos Office of Recovery and Resiliency Climate Resiliency Design Guidelines
47APPENDIX 4 - PROJECT BENEFITS CATEGORIES
Table 16 ndash Guidance on quantitative calculations for (1) sea level rise with coastal storm surge and (2) increased precipitation measures
Data Input General Guidance ndash Basic Description
Applicable Benefit Category
Applicable Typical Facility Typology
Dire
ct B
enefi
ts
Indi
rect
Ben
efits
Oth
er P
oten
tial
Ben
efits
Bui
ldin
g St
ruct
ures
Com
plex
Fa
cilit
ies
Tran
spor
tatio
nSt
reet
scap
es
Plaz
as
Park
Fea
ture
s
Engineering Estimates for Damages
bull Engineered estimate models of physical damages and service losses at the project site based on the Guidelines event recurrence interval(s) and flood depth(s)
Y Y Y Y Y Y
Historic Damages and Service Losses
bull Historic physical damages and service losses at the project site documented from previous flood events
bull Do not use routine maintenancebull The historic damage event recurrence interval
(RIs) andor flood depths must be determined updated for inflation to the present value and adjusted to match the Guidelines event RIsflood depths
Y Y Y Y Y Y
Facility Replacement Value
bull The unit cost to rebuild the facility
Impacted Area bull The geographic area impacted by the facility in the event of failure in acres
Y Y Y Y
Facility Capacity
bull The design capacity of the facilitybull For example - facility capacity expressed in
millions of gallons per day (MGD) for water and wastewater facilities or megawatts (MW) for electrical facilities
Y Y Y Y
Service Population
bull The number of impacted residents served by the facility
bull Typically estimated based on number of impacted residential customers x average number of individuals per household (based on current US Census data or use 25 individuals per household as a default)
bull Facilities serving mostly non-residentialpublic buildings andor critical facilities should focus on service losses rather than service population
Y Y Y
NYC Mayorrsquos Office of Recovery and Resiliency Climate Resiliency Design Guidelines
48APPENDIX 4 - PROJECT BENEFITS CATEGORIES
Table 16 ndash Guidance on quantitative calculations for (1) sea level rise with coastal storm surge and (2) increased precipitation measures
Data Input General Guidance ndash Basic Description
Applicable Benefit Category
Applicable Typical Facility Typology
Dire
ct B
enefi
ts
Indi
rect
Ben
efits
Oth
er P
oten
tial
Ben
efits
Bui
ldin
g St
ruct
ures
Com
plex
Fa
cilit
ies
Tran
spor
tatio
nSt
reet
scap
es
Plaz
as
Park
Fea
ture
s
Value of Service
bull Unit value of service provided by the facilitybull Example of FEMA standard values for complete
loss of utility service $105personday for potable water$49personday for wastewater$148personday for electrical
bull Consider updating FEMA standard per capita values to reflect current The New York City utility rates
Y Y
Roadway Elevations bull Roadway Elevations
Y Y
Roadway Replacement Value
bull Roadway Replacement ValueY Y
Inundation Area Map
bull Inundation Area Map developed by FEMA or through modeling by project design team
Y Y Y
Building Inventory of Inundation Area
bull The number and type of buildings within the streetscape and neighborhood inundated by the Guidelinersquos flood events
Y Y Y
Average Daily Traffic (ADT)
bull The average number of one-way traffic trips per day along the roadway(s) within the streetscapeneighborhood inundated by the Guidelinersquos flood events
Y Y
Additional Travel Time
bull The additional travel time needed to detour around a flooded roadway expressed in minutes
bull In the unlikely event there is no detour available use a 12-hour travel time per one-way trap but provide a detailed area street map as supporting documentation
Y Y
Value of Traffic Delay
bull The value of service associated with lost time in traffic
bull For example - FEMA standard average value of $3344vehiclehour of delay
bull Consider updating FEMA and GSA standard values to reflect current New York City area labor rates and fuel costs
Y Y
NYC Mayorrsquos Office of Recovery and Resiliency Climate Resiliency Design Guidelines
49APPENDIX 4 - PROJECT BENEFITS CATEGORIES
Table 17 ndash Guidance on quantitative unit benefit calculations for extreme heat hazard measures
Measure General Guidance ndash Unit Benefit Information and Data Requirements
Applicable Benefit Category
Applicable Typical Facility Typology
Dire
ct B
enefi
ts
Indi
rect
Ben
efits
Oth
er P
oten
tial
Ben
efits
Bui
ldin
g St
ruct
ures
Com
plex
Fa
cilit
ies
Tran
spor
tatio
nSt
reet
scap
es
Plaz
as
Park
Fea
ture
s
Green Roof
bull Unit benefit range over PUL = $470SF to $373SF of green roof area ($719SF standard value)
bull Assumed PUL = 40 yearsbull Apply standard value unit benefit to green
roof area to estimate measure benefitbull Higher range values more applicable
to residential and commercial building streetscape projects
Y Y Y Y Y Y
Bioswale Rain Garden Meadow Mix
bull Unit benefit range over PUL = $396SF to $211SF of area ($730SF standard value)
bull Assumed PUL = 30 yearsbull Apply standard value unit benefit to bioswale
rain gardenmeadow mix area to estimate total measure benefit
Y Y Y Y Y Y
Cool Roof
bull Unit benefit range over PUL = $117 to $3151SF of material area ($144SF standard value)
bull Assumed PUL = 20 yearsbull Apply standard value unit benefit to cool roof
area to estimate total measure benefitbull Higher range values more applicable to
residential building streetscape projects
Y Y Y Y Y
Light-Colored PaversLight-Colored Materials
bull Unit benefit range over PUL = $0774 to $204SF of material area ($0866SF standard value)
bull Assumed PUL = 30 yearsbull Apply standard value unit benefit to material
area to estimate total measure benefit
Y Y Y Y
Table 17 provides general guidance on how to quantitatively calculate benefits from efforts to address climate stressors See Section IIIE for more information
NYC Mayorrsquos Office of Recovery and Resiliency Climate Resiliency Design Guidelines
50APPENDIX 4 - PROJECT BENEFITS CATEGORIES
Table 17 ndash Guidance on quantitative unit benefit calculations for extreme heat hazard measures
Measure General Guidance ndash Unit Benefit Information and Data Requirements
Applicable Benefit Category
Applicable Typical Facility Typology
Dire
ct B
enefi
ts
Indi
rect
Ben
efits
Oth
er P
oten
tial
Ben
efits
Bui
ldin
g St
ruct
ures
Com
plex
Fa
cilit
ies
Tran
spor
tatio
nSt
reet
scap
es
Plaz
as
Park
Fea
ture
s
Tree Planting
bull Unit benefit range over PUL = $1005 to $77154Tree ($1855Tree standard value)
bull Assumed PUL = 30 yearsbull Apply standard value unit benefit to number of
trees to estimate total measure benefitbull Higher range values more applicable
to residential and commercial building streetscape projects
Y Y Y Y Y Y
Planter Box Tree
bull Unit benefit range over PUL = $212 to 16304Tree ($392Tree standard value)
bull Assumed PUL = 15 yearsbull Apply standard value unit benefit to number of
trees to estimate total measure benefitbull Higher range values more applicable
to residential and commercial building streetscape projects
Y Y Y Y Y
Shade Canopy
bull Unit benefit range over PUL = $0363 to $396SF ($0458SF standard value)
bull Assumed PUL = 15 yearsbull Apply standard value unit benefit to area of
shade canopy estimate total measure benefitbull Higher range values more applicable
to residential and commercial building streetscape projects
Y Y Y Y
Permeable Grass Pavers
bull Unit benefit range over PUL = $0258SF to $0521SF of pavers ($0363SF standard value)
bull Assumed PUL = 30 yearsbull Apply standard value unit benefit to paver
area to estimate total measure benefit
Y Y Y Y Y
For the purposes of the BCA refer to the following facility typologies bull ldquoBuilding Structuresrdquo include critical small building sites such as EMS or FDNY stations and non-critical small building sites such as
libraries or comfort stationsbull ldquoComplex Facilitiesrdquo include critical infrastructure such as wastewater treatment sites pump stations water filtration plants and similar
large or complex facilitiesbull ldquoTransportationStreetscapePlazasrdquo include roadway reconstruction streetscape improvements street raising plazas and other
transportation-related infrastructurebull ldquoPark Featuresrdquo include parks and similar public recreational facility with natural landscape features
NYC Mayorrsquos Office of Recovery and Resiliency Climate Resiliency Design Guidelines
51APPENDIX 5 - EXAMPLE PLANNING DECISION TREE
This decision tree provides a summarized example approach for how to implement these Guidelines Projects with a total cost greater than $50 million are recommended to conduct a full qualitative and quantitative climate change risk assessment and BCA while projects below $50 million are recommended to conduct a qualitative risk assessment and BCA
Define Project
1) Operational goals and criticality level2) Useful life3) Location in the current flood plain future floodplain and or zone
of tidal inundation and the project arearsquos score on the heat vulnerability index
Evaluate Project Risks According to Probability and Magnitude of Consequence
bull Extreme Heat bull Precipitationbull Sea Level Risebull Coastal Surge
High Level Identification and Assessment of Risk Mitigation Alternatives and Co-benefits
(qualitative)
Detailed Identification and Assessment of Risk Mitigation Alternatives and Co-benefits (qualitative and quantitative)
High Level Estimate of Costs and Benefits of Design Alternatives
(qualitative)
Detailed Estimate of Costs and Benefits of Design Alternatives
(qualitative and quantitative)
Decision Point Which climate change risks require mitigation
Decision Point Evaluate risk mitigation benefits and costs to
determine final resilient design alternative or if no action is required
Decision Point Is the total project cost above $50 million
Below $50 million Above $50 million
APPENDIX 5 - EXAMPLE PLANNING DECISION TREE
NYC Mayorrsquos Office of Recovery and Resiliency Climate Resiliency Design Guidelines
52
Project Title
Design Strategies Checklist (not exhaustive)
Extreme Heat Comments Extreme Precipitation Comments Sea Level Rise amp Storm Surge Comments
Select Site in Low Heat Vulnerability Index area Select High Elevation Site Select High Elevation Site
Minimize East-West Building Orientation Green Roof Raise Building Floor Elevation
Passive Solar Cooling and Ventilation Systems
Protect Below Grade Areas from Flooding Waterproof Building Envelope
Cool Roof (SRI appropriate) On-site Stormwater Management (gray) Elevate Critical Building Functions
Green Roof (extensive) Reduce Impervious Areas Elevate Critical Equipment
Vegetative Structures Permeable Pavement Perimeter Floodwall100 Levee (passive or active)
Enhanced HVAC System including space layout optimization and system scalability
Increase Green Spaces and Planted Areas DryWet Floodproofing
More Efficient Building Envelope Other Utility Redundancy Design101
Parking Lot Shading Resilient Materials amp Landscape Treatments
Light Colored Pavements (appropriate SRI) Design for Storm Surge Outflow
Increase Planted Areas Install Backwater Flow Prevention
Permeable Surfaces Design for Scour
Open-grid Pavement Raise Road Elevation
Other Other
This appendix provides a template for identifying possible design strategies to address climate change risks as described throughout the Guidelines
APPENDIX 6 - DESIGN STRATEGIES CHECKLIST
100 Permanent perimeter flood walls are not permitted to meet floodproofing requirements in buildings with substantial improvements andor damages 101 Utility redundancy design should be pursued for critical systems not all building systems
APPENDIX 6 - DESIGN STRATEGIES CHECKLIST
NYC Mayorrsquos Office of Recovery and Resiliency Climate Resiliency Design Guidelines
53APPENDIX 7 - CLIMATE CHANGE RISK ASSESSMENT RESOURCES
These Guidelines provide data on climate change hazards and recommend how that data can inform resilient design A risk assessment is a tool to help project managers and designers evaluate risk levels as well as select and prioritize resilient design strategies A high level risk assessment is recommended for all City capital projects with a total cost of under $50 million Projects above $50 million are recommended to conduct an in-depth assessment
Risk assessments use quantified estimates of the probability and magnitude of consequence of an event occurring to prioritize responses ldquoProbabilityrdquo is an assessment of the likelihood of a hazard occurring while ldquomagnituderdquo describes the hazardrsquos potential impact Risk assessment tools such as the examples listed below can be used to define and score these categories Projects that score higher across both probability and magnitude can be prioritized for investment and risk mitigation action Projects that score lower across both criteria may require no action beyond meeting code The results are typically charted on a risk matrix and an example is provided on the next page
The climate change risk management frameworks below offer templates for how to integrate climate change projections into a risk assessment process Refer to these resources for examples and further information
bull Vulnerability Assessment and Adaptation Framework is prepared by the Federal Highway Administration (FHWA) While developed for transportation planning this risk assessment framework has broad applicability for evaluating asset vulnerability to climate change Available at httpswwwfhwadotgovenvironmentsustainabilityresilienceadaptation_framework
bull US Climate Resilience Toolkit The US Global Change Research Program offers a step by step risk assessment
framework including tools and case studies at httpstoolkitclimategovsteps (see example on next page)
bull Coast Adapt Guidance on undertaking a risk assessment High level assessment httpscoastadaptcomausitesdefaultfilesfactsheetsT3M4_2_2nd_pass_risk_assessmentpdfDetailed assessment httpscoastadaptcomausitesdefaultfilesfactsheetsT3M4_3_3rd_pass_risk_assessmentpdf
bull Climate adaptation Risk uncertainty and decision-makingDownload the report here httpswwwukciporgukpublicationsRisk
The City plans to develop a NYC-specific process for integrating climate change data into existing risk management processes by April 2019
APPENDIX 7 - CLIMATE CHANGE RISK ASSESSMENT RESOURCES
NYC Mayorrsquos Office of Recovery and Resiliency Climate Resiliency Design Guidelines
54APPENDIX 7 - CLIMATE CHANGE RISK ASSESSMENT RESOURCES
The Risk Characterization Matrix below is an example from the US Climate Resilience Toolkit This tool can be used to assess the probability and magnitude of impact for identified risks The risk of coincident climate stressorsrisks (such as storm surge plus increased precipitation) can also be assessed as applicable
Figure 14 - Example of a climate change risk matrix (adapted from US Climate Resilience Toolkit)
Project teams can determine the magnitude of the impact (along the horizontal scale of 1 through 3 with 3 being the most severe) and the probabilitylikelihood of occurrence for each specific risk (along the vertical scale with 3 being the most likely) A score is typically assigned for each risk (Probabil-ity x Magnitude) and then charted on the matrix Based on the estimated probability and magnitude of consequence above the risks are ranked and prioritized for mitigation Factors to bear in mind include
bull Not all facility typologies have the same level of functional and operational importance during events or tolerance for disruption
bull Not all climate stressors and risks have the same level of impact on each project sitebull Not all identified risks can or should be mitigated fully
NYC Mayorrsquos Office of Recovery and Resiliency Climate Resiliency Design Guidelines
55WORKS CITED
A Stronger More Resilient New York PlaNYC Report of the NYC Special Initiative for Rebuilding and Resiliency The City of New York 2013
ldquoAccount for Climate Riskrdquo International Finance Corporation accessed March 27 2017 httpwwwifcorgwpswcmconnectTopics_Ext_ContentIFC_External_Corporate_SiteClimate+Business
PrioritiesAccount+for+Climate+Risk
American Society of Heating Refrigeration and Air-Conditioning Engineers (ASHRAE) Handbook -Fundamentals 2017
ldquoBaseline Standard Economic Value Methodology Reportrdquo Federal Emergency Management Agency July 2016
Benefit Cost Analysis Toolkit Software Version 530 Federal Emergency Management Agency (build date December 2016)
Criteria for Detention Facility Design New York City Department of Environmental Protection November 2012
Community Resilience Planning Guide for Buildings and Infrastructure Systems Vol 1 NIST Special Publication 1190 US Department of Commerce 2016
Cool and Green Roofing Manual NYC Department of Design and Construction 2007 httpwwwnycgovhtmlddcdownloadspdfcool_green_roof_manpdf
Building Resiliency Task Force US Urban Green Building Council New York 2013 httpurbangreencouncilforcecomBuildingResiliency
Design and Planning for Flood Resiliency Guidelines for NYC Parks New York City Department of Parks and Recreation 2017
httpswwwnycgovparksorgplanning-and-buildingplanningresiliency-plansflood-resiliency
Flooded Bus Barns and Buckled Rails Federal Transit Administration Office of Budget and Policy 2011 httpswwwhsdlorgabstractampdid=685187
Floodproofing Non-Residential Buildings FEMA P936 FEMA 2013 httpswwwfemagovmedia-library-data9a50c534fc5895799321dcdd4b6083e7P-936_8-20-13_508rpdf
ldquoGlossaryrdquo International Infrastructure Management Manual National Asset Management Support Group New Zealand 2011 httpwwwipweaorg
ldquoGreen Roof Metrics Draft Reportrdquo New York City Department of Parks and Recreation 2017
ldquoGuide to Rain Event Preparednessrdquo NYC Department of Environmental Protection httpwwwnycgovhtmldeppdfbrochuresflood-preparedness-flyerpdf
ldquoGuidelines and Discount Rates for Benefit-Cost Analysis of Federal Programsrdquo Appendix C Circular A-94 US Office of Management and Budget (OMB) 2017
ldquoGuidelines for the Design and Construction of Stormwater Management Systemsrdquo New York City Department of Environmental Protection July 2012
Horton R et al New York City Panel on Climate Change 2015 Report Ann NY Acad Sci ISSN 0077-892 New York 2015
Madrigano J et al ldquoA case-only study of vulnerability to heat wavendashrelated mortality in New York City (2000ndash2011)rdquo Environmental Health Perspectives 123672ndash678 2013
WORKS CITED
NYC Mayorrsquos Office of Recovery and Resiliency Climate Resiliency Design Guidelines
56WORKS CITED
enspMcGregor et al Two Degrees The Built Environment and Our Changing Climate Routledge Press 2013
NYC Green Codes Task Force US Green Building Council New York 2010 httpurbangreencouncilorgGreenCodes
NYCrsquos Risk Landscape A Guide to Hazard Mitigation NYC Emergency Management 2014
One New York The Plan for a Strong and Just City The City of New York 2015 httpwwwnycgovhtmlonenyc downloadspdfpublicationsOneNYCpdf
Ready to Respond Strategies for Multifamily Building Resilience Enterprise Green Communities 2015 httpswwwenterprisecommunityorgresources
Rosenzweig C et al Climate Change Adaptation in New York City Building a Risk Management Response New York City Panel on Climate Change 2010
httponlinelibrarywileycomdoi101111nyas20101196issue-1 issuetoc
ldquoSustainable Infrastructure Management Program Learning Environmentrdquo Water Environment Research Foundation accessed March 24 2017 httpsimplewerforg
Urban Waterfront Adaptive Strategies NYC Department of City Planning 2013 httpwww1nycgovsiteplanningplanssustainable-communitiesclimate-resiliencepagetab=1
Wastewater Resiliency Plan Climate Risk Assessment and Adaptation Study New York City Department of Environmental Protection October 2013
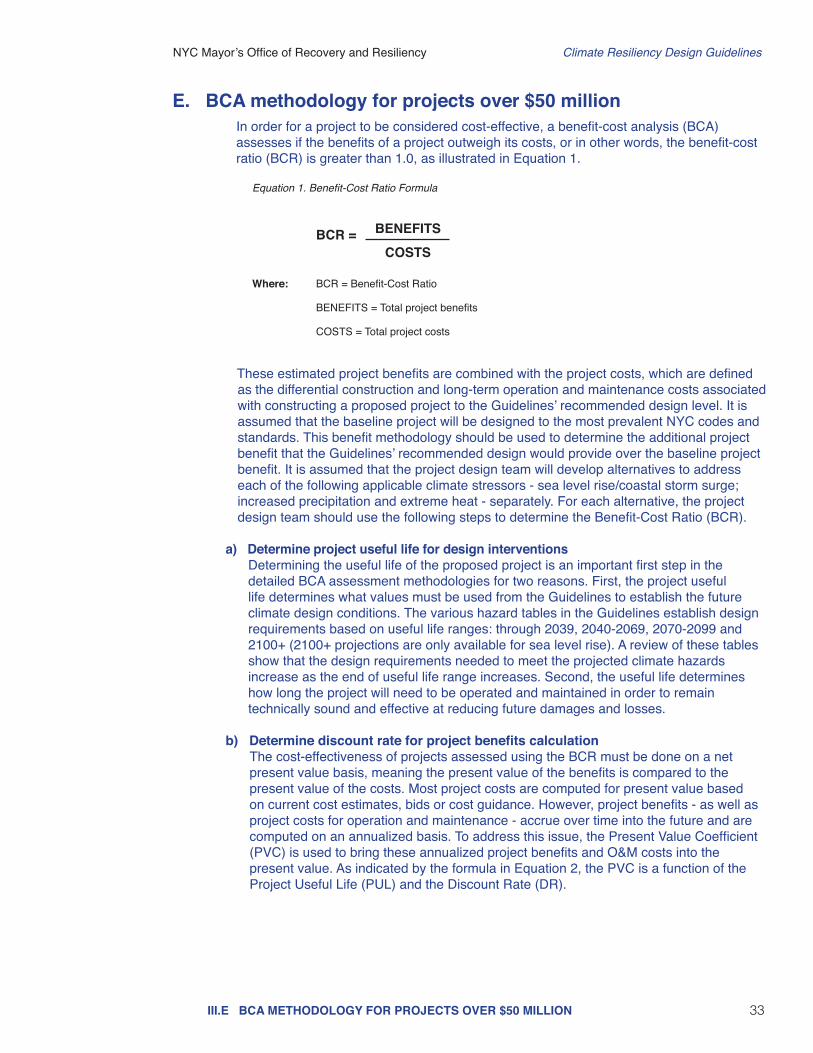
NYC Mayorrsquos Office of Recovery and Resiliency Climate Resiliency Design Guidelines
33IIIE BCA METHODOLOGY FOR PROJECTS OVER $50 MILLION
E BCA methodology for projects over $50 millionIn order for a project to be considered cost-effective a benefit-cost analysis (BCA) assesses if the benefits of a project outweigh its costs or in other words the benefit-cost ratio (BCR) is greater than 10 as illustrated in Equation 1
Equation 1 Benefit-Cost Ratio Formula
BCR =
Where BCR = Benefit-Cost Ratio
BENEFITS = Total project benefits
COSTS = Total project costs
BENEFITSCOSTS
These estimated project benefits are combined with the project costs which are defined as the differential construction and long-term operation and maintenance costs associated with constructing a proposed project to the Guidelinesrsquo recommended design level It is assumed that the baseline project will be designed to the most prevalent NYC codes and standards This benefit methodology should be used to determine the additional project benefit that the Guidelinesrsquo recommended design would provide over the baseline project benefit It is assumed that the project design team will develop alternatives to address each of the following applicable climate stressors - sea level risecoastal storm surge increased precipitation and extreme heat - separately For each alternative the project design team should use the following steps to determine the Benefit-Cost Ratio (BCR)
a) Determine project useful life for design interventions Determining the useful life of the proposed project is an important first step in the
detailed BCA assessment methodologies for two reasons First the project useful life determines what values must be used from the Guidelines to establish the future climate design conditions The various hazard tables in the Guidelines establish design requirements based on useful life ranges through 2039 2040-2069 2070-2099 and 2100+ (2100+ projections are only available for sea level rise) A review of these tables show that the design requirements needed to meet the projected climate hazards increase as the end of useful life range increases Second the useful life determines how long the project will need to be operated and maintained in order to remain technically sound and effective at reducing future damages and losses
b) Determine discount rate for project benefits calculation The cost-effectiveness of projects assessed using the BCR must be done on a net
present value basis meaning the present value of the benefits is compared to the present value of the costs Most project costs are computed for present value based on current cost estimates bids or cost guidance However project benefits - as well as project costs for operation and maintenance - accrue over time into the future and are computed on an annualized basis To address this issue the Present Value Coefficient (PVC) is used to bring these annualized project benefits and OampM costs into the present value As indicated by the formula in Equation 2 the PVC is a function of the Project Useful Life (PUL) and the Discount Rate (DR)
NYC Mayorrsquos Office of Recovery and Resiliency Climate Resiliency Design Guidelines
34
Equation 2 Present Value Coefficient (PVC) Formula
PVC =
Where PVC = Present Value Coefficient
PUL = BCA Project Useful Life based on project type
DR = Discount Rate
The project design team should coordinate with agencies and NYC OMB if needed to determine appropriate discount rates based on funding source project type and other factors This coordination should take place during project initiation phase where total project costs (design and construction) are over $50 million66
c) Develop input data to perform benefit calculations Tables 16 and 17 in Appendix 4 provide a list of typical input data by each climate
stressor needed to perform benefit analysis quantitatively on variety of facilities67 The project design team should use these tables as a reference to identify appropriate input data categories andor additional input data needed to perform benefit analysis on the project
d) Identify applicable project benefit categories to estimate benefits Tables 16 and 17 in Appendix 4 provide a list of typical project benefits by each climate
stressor needed to perform benefit analysis quantitatively on various types of projects The project design team should use these tables as a reference to identify appropriate project benefit categories for each climate stressor to perform benefit analysis on the project
e) Calculate benefits of recommended design interventions for each climate
stressor The input data and applicable project benefits can be assembled along with
incremental project cost data to analyze cost-effectiveness using the FEMA BCA Tool Damage-Frequency Assessment (DFA) module or similar software This analysis will provide a BCR for each alternative which can then be used to compare the alternatives that were developed to mitigate effects from applicable climate stressors The project design team can then use the results from this analysis to identify optimal interventions that provides a balanced solution that provides resiliency benefits within the available project budget
IIIE BCA METHODOLOGY FOR PROJECTS OVER $50 MILLION
[1 ndash (1 + DR) -(PUL)]DR
66 For example a NYC OMB March 2015 memorandum recommends using an annually updated DR as published each year in Appendix C of OMB Circular A-94 The current OMB-recommended discount rates from OMB A-94 Appendix C vary by project useful life and are as follows 21 DR for useful lives of 10 to 19 years 25 DR for useful lives of 20 to 29 years and 28 DR for useful lives of 30 years or greater By contrast FEMA hazard mitigation grants use a DR of 70 for all projects based on the Federal OMB A-94 rate for federally-funded mitigation measures Since these DRs will impact the PVC and the project benefits the project team must ensure that BCA results prepared using an OMB-recommended DR (21 to 28) be updated to reflect the Federal DR (70) when applying for FEMA mitigation grant funds
67 Note the data requirements for the sea level rise and increased precipitation hazards in Table 16 are more detailed than the requirements for the extreme heat hazards due to the less detailed level of analysis available for extreme heat
NYC Mayorrsquos Office of Recovery and Resiliency Climate Resiliency Design Guidelines
35
APPENDICES
NYC Mayorrsquos Office of Recovery and Resiliency Climate Resiliency Design Guidelines
36APPENDIX 1 ndash KEY TERMS
100-year flood (1 annual chance flood)
A flood that has a 1 probability of occurring in any given year The 100-year floodplain is the extent of the area of a flood that has a 1 chance of occurring or being exceeded in any given year
500-year flood (02 annual chance flood)
A flood that has a 02 probability of occurring in any given year The 500-year floodplain is the extent of the area of a flood that has a 02 chance of occurring or being exceeded in any given year
AdaptationAdjustment in natural or human systems to a new or changing environment that seeks to maximize beneficial opportunities or moderate negative effects Successful adaptations contribute to resiliency
Base flood elevation (BFE)The elevation of surface water resulting from a flood that has a 1 annual chance of occurring or being exceeded in any given year The BFE is shown on the Flood Insurance Rate Map (FIRM)69
BluebeltReference to the Department of Environmental Protectionrsquos (DEP) Bluebelt program to preserve natural drainage corridors including streams ponds and other wetland areas Preservation of these wetland systems allows them to perform their functions of conveying storing and filtering storm water
Climate
The average weather (or more rigorously a statistical description of the average in terms of the mean and variability) over a period of time usually 30 years These quantities are most often surface variables such as temperature precipitation and wind Climate in a wider sense is the state including a statistical description of the climate system70
Climate change
Changes in average weather conditions that persist over multiple decades or longer Climate change encompasses both increases and decreases in temperature as well as shifts in precipitation changing risk of certain types of severe weather events and changes to other variables of the climate system
Climate change riskThe chance that investments (such as in capital projects) can be affected by the physical impacts of climate change71 Risks are evaluated as a product of the probability of occurrence and the magnitude of damages or impacts including socioeconomic factors that would result if they did occur (consequences)
Climate change risk assessment
This assessment involves a detailed project-specific analysis that includes a vulnerability and risk assessment often followed by cost-benefit analysis to assess and select investments in climate change risk mitigation Risk is assessed as a function of the magnitude and probability of a given climate change hazard Examples resources are included in Appendix 7
Climate vulnerabilityThe degree to which systems and populations are affected by adverse impacts It is a function of the character magnitude and rate of climate change and variation to which a system is exposed its sensitivity and its adaptive capacity72
Cloudburst An extreme amount of rain in a short period of time often over a small geographic area73
Cooling Degree Day (CDD) A form of degree-day used to estimate the energy requirements for air conditioning or refrigeration when the daily mean temperature is above 65degF
68 All terms are from the US Global Change Research Program (USGCRP) glossary unless otherwise noted The USGCRP glossary is available at httpwwwglobalchangegovclimate-changeglossary
69 ldquoDefinitionsrdquo FEMA last modified March 1 2017 httpswwwfemagovnational-flood-insurance-programdefinitions70 UKCIP Glossary httpwwwukciporgukglossary71 ldquoAccount for Climate Riskrdquo International Finance Corporation 72 UKCIP Glossary httpwwwukciporgukglossary73 New York City Environmental Protection ldquoCloudburst Resiliency Planning Studyrdquo 2017 Available at httpwwwnycgovhtmldeppdfclimatenyc-cloudburst-studypdf
APPENDIX 1 - KEY TERMS68
NYC Mayorrsquos Office of Recovery and Resiliency Climate Resiliency Design Guidelines
37APPENDIX 1 ndash KEY TERMS
Design life The life expectancy of an asset or product as determined during design74 As opposed to useful life (see below)
Dry Bulb temperature The ambient air temperature measured by a thermometer
Extreme eventUnexpected unusual or unpredictable weather or flooding compared to historical or future projected distribution Extreme events include for example heat waves cold waves heavy rains periods of drought and flooding and severe storms
Facilities For the purposes of this document ldquofacilitiesrdquo refers to all types of buildings housing infrastructure structures and landscape features designed by or for the City of New York
Flexible adaptation pathwayResilience-building strategies that can evolve or be adapted over time as climate change risk assessments evaluations of adaptation strategies and monitoring continue75
Flood Insurance Rate Maps (FIRM)
Official flood map of a community on which FEMA has delineated the 1 annual chance floodplain and the base flood elevations (BFEs) applicable to the community76 The FIRM also includes the 02 floodplain annual chance floodplain and differentiates between special flood hazard areas (V A Coast A zones) and floodways The official FIRM is from the year 2007 while the 2015 PFIRM is currently required by NYC Building Code to calculate design flood elevations NYC DOB references the more restrictive of the two maps in both base flood elevation and flood hazard area (ie V versus A zone) Refer to Appendix 3 for more information
FreeboardAn additional amount of height above the base flood elevation used as a factor of safety (eg two feet above the base flood) in determining the level at which a facilitys lowest floor must be elevated or floodproofed to be in accordance with state or community floodplain management regulations77
Future time slices
Future periods defined by the NPCC for when climate change projections are available In this document the following decadal projections are associated with specific time spans2020s projection = present to 20392050s projection = 2040 to 20592080s projection = 2070 to 20992100s projection = end of century and beyond
Green infrastructureAn array of practices that use or mimic natural systems to manage urban stormwater runoff Water is either directed to engineered systems for infiltration or detained for longer periods before it enters the sewer system
Heat Vulnerability Index (HVI)Summarizes relative risk of adverse health effects from heat due to social and environmental factors Used to identify neighborhoods at higher risk during and after extreme heat events
Heat wave A period of three consecutive days where temperatures rise above 90degF or two consecutive days over 95 degrees78
New York City Panel on Climate Change (NPCC)
The body of leading climate and social scientists charged with making climate change projections for the metropolitan region79
74 Sustainable Infrastructure Management Program Learning Environment httpsimplewerforg 75 Rosenzweig C et al Climate Change Adaptation in New York City Building a Risk Management Response76 ldquoDefinitionsrdquo FEMA77 Ibid78 Horton R et al New York City Panel on Climate Change 2015 Report Chapter 1 Climate Observations and Projections Ann NY
Acad Sci ISSN 0077-8923 (New York 2015) 2579 For more information on the NPCC visit www1nycgovsiteorrchallengesnyc-panel-on-climate-changepage
NYC Mayorrsquos Office of Recovery and Resiliency Climate Resiliency Design Guidelines
38APPENDIX 1 ndash KEY TERMS
Open-grid pavement system
Pavements that consist of loose substrates supported by a grid of a more structurally sound grid or webbing Unbounded loose substrates in these systems transfer and store less heat than bound and compacted pavements and aid permeability Pavement is 50 pervious and contains vegetation in the open cells designed to allow percolation or infiltration of storm water through the surface into the soil below80
Preliminary Flood Insurance Rate Map (PFIRM)
Preliminary flood map developed by FEMA in 2015 for New York City that provides projected risks for flood hazards81 Refer to Appendix 3 for more information
Project useful life (PUL)
The period over which an asset or component is expected to be available for use by an entity This depends on regular and adequate maintenance This period of time typically exceeds the design life (see above) The combined effect of operational requirements and useful life is practical in assessing an investment in improving resilience82
Rain gardenAlso called ldquobioswalerdquo Planted areas designed to collect and manage stormwater that runs off streets sidewalks commercial and residential rooftops and other sources when it rains
Resiliency The ability to bounce back after change or adversity The capability of preparing for responding to and recovering from difficult conditions83
Sea level rise-adjusted design flood elevation
As defined in these Guidelines the increased height of the base flood elevation due to sea level rise plus freeboard depending on the criticality of the facility The sea level rise adjustment depends on the useful life of the facility
Storm surge An abnormal rise of water generated by a storm over and above predicted astronomical tides84
Substantial improvementAny repair reconstruction rehabilitation addition or improvement of a building or structure the cost which equals or exceeds 50 of the market value of the structure before the improvement or repairs started For more information see Appendix G of the NYC Building Code and 1 RCNY sect3606-0185
Tidal inundation Flooding which occurs at high tides due to climate-related sea level rise land subsidence andor the loss of natural barriers86
Urban Heat Island (UHI) effectThe tendency for higher air temperatures to persist in urban areas as a result of heat absorbed and emitted by buildings and asphalt tending to make cities warmer than the surrounding suburban and rural areas
Weather The state of the atmosphere at a given time with regard to temperature cloudiness precipitation wind and other meteorological conditions87
Wet Bulb temperatureThe temperature indicated when a thermometer bulb is covered with a water-saturated wick over which air is caused to flow at approximately 45 ms (900 ftmin) to reach the equilibrium temperature of water evaporating into the air when the heat of vaporization is supplied by the sensible heat of the air88
80 ldquoGlossaryrdquo US Green Building Council (2017) Available at httpwwwusgbcorgglossaryterm552581 ldquoPreliminary FEMA Map Productsrdquo FEMA Map Service Center Available at httpshazardsfemagovfemaportalprelimdownload82 ldquoGlossaryrdquo International Infrastructure Management Manual (2011) 83 A Stronger More Resilient New York (2013) 184 ldquoStorm Surge Overviewrdquo National Hurricane Center NOAA Available at httpswwwnhcnoaagovsurge85 ldquoFlood Resistant Constructionrdquo Appendix G New York City Building Code (2008) and 1 RCNY sect3606-01 available at httpswww1nycgovassetsbuildingsrules1_RCNY_3606-01pdf86 ldquoOcean Factsrdquo National Ocean Service NOAA Available at httpoceanservicenoaagovfactsnuisance-floodinghtml 87 UKCIP Glossary httpwwwukciporgukglossary88 ldquoASHRAE Terminologyrdquo ASHRAE Available at httpswwwashraeorgtechnical-resourcesauthoring-toolsterminology
NYC Mayorrsquos Office of Recovery and Resiliency Climate Resiliency Design Guidelines
39APPENDIX 2 - CLIMATE CHANGE PROJECTIONS
Climate change projections are provided by the New York City Panel on Climate Change (NPCC) The full NPCC report is available from the New York Academy of Sciences89 Tables 8-10 (below) were reproduced directly from the NPCC report while Table 2 (see Section IIA) was developed using the data underlying the NPCC report to inform the design of HVAC systems under warmer conditions
Table 8 ndash NYC sea level rise projections90
Baseline (2000-2004) 0 in
Low estimate (10th percentile)
Middle range (25th to 75th percentile)
High estimate (90th percentile)
2020s 2 in 4-8 in 10 in
2050s 8 in 11-21 in 30 in
2080s 13 in 18-39 in 58 in
2100 15 in 22-50 in 75 in
Note Projections are based on six-component approach that incorporates both local and global factors The model-based components are from 24 global climate models and two representative concentration pathways Projections are relative to the 2000-2004 base period
Table 9 ndash Mean annual changes91
a Temperature Baseline(1971-2000) 54degF
Low estimate (10th percentile)
Middle range (25th to 75th percentile)
High estimate (90th percentile)
2020s + 15degF +20-29degF +32degF
2050s +31degF +41-57degF +66degF
2080s +38degF +53-88degF +103degF
2100 +42degF +58-104degF +121F
b Precipitation Baseline(1971-2000) 501 in
Low estimate (10th percentile)
Middle range (25th to 75th percentile)
High estimate (90th percentile)
2020s -1 percent +1-8 +10
2050s +1 percent +4-11 +13
2080s +2 percent +5-13 +19
2100 -6 percent -1 to +19 +25
Note Based on 35 global climate models (GCMs) and two RCPs Baseline data cover the 1971ndash2000 base period and are from the NOAA National Climatic Data Center (NCDC) Shown are the low estimate (10th percentile) middle range (25th percentile to 75th percentile) and high estimate (90th percentile) These estimates are based on a ranking (from most to least) of the 70 (35 GCMs times 2 RCPs) projections The 90th percentile is defined as the value that 90 percent of the outcomes (or 63 of the 70 values) are the same or lower than Like all projections the NPCC climate change projections have uncertainty embedded within them Sources of uncertainty include data and modeling constraints the random nature of some parts of the climate system and limited understanding of some physical processes The NPCC characterizes levels of uncertainty using state-of-the-art climate models multiple scenarios of future greenhouse gas concentrations and recent peer-reviewed literature Even so the projections are not true probabilities and the potential for error should be acknowledged
89 The NPCC 2015 report is available at httponlinelibrarywileycomdoi101111nyas20151336issue-1issuetoc90 From New York City Panel on Climate Change 2015 Report Chapter 1 Climate Observations and Projections page 4191 From New York City Panel on Climate Change 2015 Report Chapter 1 Climate Observations and Projections page 30
APPENDIX 2 - CLIMATE CHANGE PROJECTIONS
NYC Mayorrsquos Office of Recovery and Resiliency Climate Resiliency Design Guidelines
40APPENDIX 2 - CLIMATE CHANGE PROJECTIONS
Table 10 ndash Extreme events92
2020s Baseline (1971-2000)
Low estimate(10th percentile)
Middle range(25th to 75th percentile)
High estimate (90th percentile)
Numbers of heat waves per year 2 3 3-4 4
Average heat wave duration (days) 4 5 5 5
Number of days per year with
Maximum temperature at or above 90degF 18 24 26-31 33
Maximum temperature at or above 100degF 04 07 1-2 2
Minimum temperature at or below 32degF 71 50 52-58 60
Rainfall at or above 1 inch 13 13 14-15 16
Rainfall at or above 2 inches 3 3 3-4 5
Rainfall at or above 4 inches 03 02 03ndash04 05
2050s Baseline (1971-2000)
Low estimate(10th percentile)
Middle range(25th to 75th percentile)
High estimate (90th percentile)
Numbers of heat waves per year 2 4 5-7 7
Average heat wave duration (days) 4 5 5-6 6
Number of days per year with
Maximum temperature at or above 90degF 18 32 39-52 57
Maximum temperature at or above 100degF 04 2 3-5 7
Minimum temperature at or below 32degF 71 37 42-48 52
Rainfall at or above 1 inch 13 13 14-16 17
Rainfall at or above 2 inches 3 3 4-4 5
Rainfall at or above 4 inches 03 03 03-04 05
2080s Baseline (1971-2000)
Low estimate(10th percentile)
Middle range(25th to 75th percentile)
High estimate (90th percentile)
Numbers of heat waves per year 2 5 6-9 9
Average heat wave duration (days) 4 5 5-7 8
Number of days per year with
Maximum temperature at or above 90degF 18 38 44-76 87
Maximum temperature at or above 100degF 04 2 4-14 20
Minimum temperature at or below 32degF 71 25 30-42 49
Rainfall at or above 1 inch 13 14 15-17 18
Rainfall at or above 2 inches 3 3 4-5 5
Rainfall at or above 4 inches 03 02 03-05 07
Note Projections for temperature and precipitation are based on 35 GCMs and 2 RCPs Baseline data are for the 1971 to 2000 base period and are from the NOAA National Climatic Data Center (NCDC) Shown are the low estimate (10th percentile) middle range (25th to 75th percentile) and high estimate (90th percentile) 30-year mean values from model-based outcomes Decimal places are shown for values less than one although this does not indicate higher precisioncertainty Heat waves are defined as three or more consecutive days with maximum temperatures at or above 90degF Like all projections the NPCC climate change projections have uncertainty embedded within them Sources of uncertainty include data and modeling constraints the random nature of some parts of the climate system and limited understanding of some physical processes The NPCC characterizes levels of uncertainty using state-of-the-art climate models multiple scenarios of future greenhouse gas concentrations and recent peer-reviewed literature Even so the projections are not true probabilities and the potential for error should be acknowledged
92 From New York City Panel on Climate Change 2015 Report Chapter 1 Climate Observations and Projections page 31
NYC Mayorrsquos Office of Recovery and Resiliency Climate Resiliency Design Guidelines
41APPENDIX 3 - DIFFERENTIATION OF FLOOD MAPS
These Guidelines reference several different kinds of flood maps and sources of design flood elevations These maps are described and differentiated below
Table 11 - Differentiation of flood maps used in NYC
Reference Title Data Source Information Provided Referenced By Link
2007 FIRM FEMA
Based on historical data from before 1983 identifies the current base flood (extent and elevation) as the flood that has a 1 chance of occurring in any given year also known as a 100-year flood The NYC Building Code requires that either the 2007 FIRM or 2015 PFIRM elevation be used whichever is higher
2014 NYC Building Code Appendix G
Climate Resiliency Design Guidelines
httpsmscfemagovportal
2015 PFIRM FEMA
Based on historical data identifies the current base flood (extents and elevation) as the flood that has a 1 chance of occurring in any given year also known as a 100-year flood The NYC Building Code requires that either the 2007 FIRM or 2015 PFIRM elevation be used whichever is higher The 2015 PFIRM is currently being reassessed by FEMA
2014 NYC Building Code Appendix G
Climate Resiliency Design Guidelines
httpshazardsfemagovfemaportalprelimdownload
httpwwwregion2coastalcomview-flood-maps-dataview-preliminary-flood-map-data
NYC Flood Hazard Mapper
NYC Department of City Planning
Maps current and future flood hazards in NYC including the following data layers 2007 FIRM and 2015 PFIRM high tide with sea level rise and PFIRM with sea level rise through 2100
Climate Resiliency Design Guidelines
Waterfront Revitalization Plan
httpwww1nycgovsiteplanningdata-mapsflood-hazard-mapperpage
ldquoTable 4 ndash Determine the sea level rise-adjusted design flood elevation for critical and non-critical facilitiesrdquo
ORR amp NPCC
Provides data to use when adding sea level rise to a given 2015 PFIRM or 2007 FIRM Base Flood Elevation (BFE) to calculate a Design Flood Elevation (DFE) Based on the criticality and expected useful life of a facility
Climate Resiliency Design Guidelines
See Section II on ldquoSea Level Riserdquo above
APPENDIX 3 - DIFFERENTIATION OF FLOOD MAPS
NYC Mayorrsquos Office of Recovery and Resiliency Climate Resiliency Design Guidelines
42APPENDIX 4 - PROJECT BENEFITS CATEGORIES
This appendix provides guidance on how to identify and assess benefits as a supplement to Sections IIID and IIIE
Table 12 lists typical direct benefits for reducing impacts from climate stressors and basic guidance for how to estimate them See Section IIID for more information
Table 13 lists typical indirect benefits for reducing impacts from climate stressors and basic guidance for how to estimate them See Section IIID for more information
Table 12 ndash Direct benefits for (1) sea level rise with coastal storm surge and (2) increased precipitation measures
Direct Benefit Basic Guidance for Estimating Values
Physical Damages (Structure Contents)
bull For flood-damaged buildings use depth damage functions developed by FEMA and USACE for structures and contents
bull Use depth damage functions in conjunction with Building Replacement Values (BRVs) and not market values BRVs typically range between $100 to $325SF for residential buildings and $120 to $450SF for commercial public buildings
bull For more complex structures or facilities use engineering estimates of flood damages or review historic flood damages documented from insurance claims repair records or FEMA Public Assistance claims from recent flood disasters
Residential Displacements
bull For flood-damaged buildings use depth damage functions developed by FEMA and USACE for residential displacements
Reduced Life CycleOperation and Maintenance (OampM) Costs93
bull Applicable only to projects that reduce overall life cycle costs or net annual OampM costs from baseline conditions
bull Input reduced annual OampM costs as a project benefit at a 1-year recurrence intervalbull Reduced overall life cycle costs can be input as a longer project useful life
Table 13 ndash Indirect benefits for (1) sea level rise with coastal storm surge and (2) increased precipitation measures
Indirect Benefit Basic Guidance for Estimating Values
Non-Residential Building Service Losses
bull Estimate service loss values and durations for non-residential buildings public buildings critical facilities and parksnatural features based on FEMA BCA guidance and standard values based on building use
Utility Service Losses94
bull Estimate utility service losses for water wastewater and electrical facilities based on the number of impacted customers FEMA per capita standard values for utility service ($105personday for potable water $49personday for wastewater $148personday for electrical)95
bull Estimate utility service loss durations based on engineering estimates or review historic flood damages losses documented from utility company records
bull This benefit can also apply to measures that increase energy efficiency
RoadBridge Service Losses
bull Estimate roadbridge service losses based on the average daily traffic (ADT) detour time and additional travel distance and FEMA and GSA standard values for road service ($3344vehiclehour of delay $0545mile)96
bull Estimate roadbridge service loss durations or review historic flood damages losses
Emergency Service Losses
bull Applicable only to projects that reduce or eliminate documented emergency service costs from baseline conditions
bull Examples of avoided emergency services costs include NYPD staffing to monitor barricades for flooded roads or NFDY staffing for water rescues of residents from flooded buildings or streets
APPENDIX 4 - PROJECT BENEFITS CATEGORIES
93 Reduced life cycle costs may be applicable to some measures that provide extreme heat benefits such as green roofs that can last longer than a standard roof if properly maintained
94 Reduced utility service costs may be applicable to some measures that provide extreme heat benefits such as cool roofs green roofs and shade trees
95 FEMA per capita standard values taken from FEMA BCA Toolkit Version 530 (Build Date 12222016) and developed in FEMArsquos Baseline Standard Economic Value Methodology Report (July 28 2016) Consider updating FEMA standard per capita values to reflect current New York City utility rates
96 Consider updating FEMA and GSA standard values to reflect current New York City area labor rates and fuel costs
NYC Mayorrsquos Office of Recovery and Resiliency Climate Resiliency Design Guidelines
43APPENDIX 4 - PROJECT BENEFITS CATEGORIES
Table 14 ndash Other potential benefits for (1) sea level rise with coastal storm surge and (2) increased precipitation measures
Other Benefit Basic Guidance for Estimating Values
Avoided Stress and Anxiety
bull Applicable only for projects that directly benefit occupants of residential structuresbull Use FEMA standard value for avoided mental stress and anxiety treatment costs of $2443person to
estimate benefit for all impacted residents97
Avoided Lost Productivity
bull Applicable only for projects that directly benefit occupants of residential structuresbull Use FEMA standard value for avoided lost worker productivity costs of $8736household to estimate
benefit for all impacted workers (conservatively assuming one worker per household)
Environmental Open Space
bull Applicable only for projects that create or acquire open space areas by acquisitionbull Use FEMA standard value for environmental open space based on the type of land acquired ($8308
Acreyear for Green open space $39545Acreyear for Riparian $6010Acreyear for Wetlands $554Acreyear for Forests $1799Year for Marine and estuary)97
CSO Volume Reduction
bull Applicable only for projects that provide Combined Sewer Overflow (CSO) abatement by reducing the volume of rainfall runoff
bull Use CSO abatement cost of $0015gallonsyear applied to increased precipitation hazard runoff volume for 5-year design storm98
Ecosystem Service99
bull Add stormwater management benefits of green infrastructure projects to increased precipitation hazards where avoided damages and service losses are not quantified
bull Unit benefits applicable to increased precipitation hazard includeo Green roofs $0133SFyear (PUL 40 years)o BioswaleRain GardenMeadow Mix $0020SFyear (PUL 30 years)o Permeable Grass Pavers $0020SFyear (PUL 30 years)o Tree Plantings $303Treeyear (PUL 30 years)o Planter Box Trees $101Treeyear (PUL 15 years)
Real Estate99
bull Potential real estate benefits from increased resilience of residential andor commercial propertiesstreetscapesneighborhoods included within the project scope
bull Benefit applied to extreme heat hazard for green infrastructure projects directly impacting residential or commercial properties
Quality of Life Health Benefits99
bull Potential quality of life benefits related to improved public health from the resilience measures included within the project scope
bull Benefit applied to extreme heat hazard for green infrastructure projects directly impacting residential or commercial properties
Table 14 lists other typical benefits for reducing impacts from climate stressors and basic guidance for how to estimate them See Section IIID for more information
97 FEMA standard values for avoided mental stress and anxiety and environmental open space values taken from FEMA BCA Toolkit Version 530 (Build Date 12222016)
98 CSO abatement cost taken from APG1 Report for NYC ldquoTechnical Approaches for Benefit-Cost Analysis of Hazard Mitigation Projects in Urban and Coastal Environmentsrdquo (April 2016)
99 Ecosystem Services Real Estate and Quality of LifeHealth benefits tend to be more applicable to green infrastructure measures that provide extreme heat benefits such as green roofs trees and other plantings
NYC Mayorrsquos Office of Recovery and Resiliency Climate Resiliency Design Guidelines
44APPENDIX 4 - PROJECT BENEFITS CATEGORIES
Table 15 ndash Potential benefits for extreme heat (Urban Heat Island) reduction measures
Category Benefit Basic Guidance for Estimating Values
Direct Benefit
Reduced Life Cycle Cost
bull Applicable only to measures such as green roofs that are expected to last longer than standard roofs
bull Compute total cost savings including annual OampM costs
Indirect Benefit
Energy Savings
bull Applicable to measures that reduce energy costs by providing cooling through increased shading andor evapotranspiration
bull Use New York Power Authority rates of $0148kWh for electricity and $0810Therm for natural gas
Other Potential Benefits
Air Quality bull Applicable to measures that absorb pollutants andor reduce carbon dioxide emissions
Acoustics bull Applicable to measures such as green roof or walls that reduce noise transfer
Quality of LifeHealth bull Potential quality of life benefits and related to improved public health
Real Estate bull Applicable to measures that provide residential real estate benefits from increased resilience of propertiesstreetscapesneighborhoods
Retail Sales Marketing
bull Applicable to measures that provide commercial property benefits from increased aesthetics resulting in increased marketing and sales for streetscapesneighborhoods
Tax Credits Incentives
bull Applicable to resilience or green infrastructure measures such as green roofs that have accompanying Federal State or City tax credits or other incentives
Table 15 lists potential benefits for reducing impacts from heat and basic guidance for how to estimate them See Section IIID for more information
NYC Mayorrsquos Office of Recovery and Resiliency Climate Resiliency Design Guidelines
45APPENDIX 4 - PROJECT BENEFITS CATEGORIES
Table 16 ndash Guidance on quantitative calculations for (1) sea level rise with coastal storm surge and (2) increased precipitation measures
Data Input General Guidance ndash Basic Description
Applicable Benefit Category
Applicable Typical Facility Typology
Dire
ct B
enefi
ts
Indi
rect
Ben
efits
Oth
er P
oten
tial
Ben
efits
Bui
ldin
g St
ruct
ures
Com
plex
Fa
cilit
ies
Tran
spor
tatio
nSt
reet
scap
es
Plaz
as
Park
Fea
ture
s
First Floor Elevation (FFE)
bull The elevation of the first finished floor of the structure excluding basements
bull FFE measured from top of lowest floor (riverinenon-coastal high hazard areas) or bottom of lowest horizontal structural member (coastal high hazard areas)
Y Y Y Y
Building Replacement Value (BRV)
bull The unit cost to rebuild a structure of the same quality of construction
bull Not the same as market value
Y Y Y Y
Building Size
bull The total floor area of the building in square feet
bull Total Building Value = BRV x Building Sizebull Typical BRVs for NYC range between $100 to
$325SF for residential buildings and $120 to $450SF for commercialpublic buildings
Y Y Y Y
Structure Description
bull The type of building number of stories and foundation type (full basement partial basement no basement)
bull Collect more detailed foundation data for coastal flood zones
Y Y Y Y
Building Use bull Details related to residential housing commercial business and public use
Y Y Y Y Y
Building Type bull The primary use of building ndash residential commercial public and others
Y Y Y Y Y
Depth Damage Function (DDF)
bull Curves used to estimate structure damage contents damage and displacement of residential buildings based on flood depth
bull DDFs selection based on Structure Description Building Type Building Use
bull Structure DDFs based on percentage of Total Building Value
bull Contents DDFs based on percentage of Total Contents Value
bull Displacement DDFs based on number of displacement days x Displacement Cost
Y Y Y Y Y
Contents Value
bull The cost to replace structure contents (furnishings equipment)
bull Residential building Contents Values typically 50 BRV (FEMA DDFs) or 100 BRV (USACE DDFs)
bull Non-residential building Contents Values between 18 to over 100 depending on building use (USACE DDFs)
bull Total Contents Value = BRV x Building Size
Y Y Y Y Y
Table 16 provides general guidance on how to quantitatively calculate benefits from efforts to address from climate stressors See Section IIIE for more information
NYC Mayorrsquos Office of Recovery and Resiliency Climate Resiliency Design Guidelines
46APPENDIX 4 - PROJECT BENEFITS CATEGORIES
Table 16 ndash Guidance on quantitative calculations for (1) sea level rise with coastal storm surge and (2) increased precipitation measures
Data Input General Guidance ndash Basic Description
Applicable Benefit Category
Applicable Typical Facility Typology
Dire
ct B
enefi
ts
Indi
rect
Ben
efits
Oth
er P
oten
tial
Ben
efits
Bui
ldin
g St
ruct
ures
Com
plex
Fa
cilit
ies
Tran
spor
tatio
nSt
reet
scap
es
Plaz
as
Park
Fea
ture
s
Number of Residents (Residential)
bull Total number of occupants in a residential building
bull Typically estimated based on number of residential units x average number of individuals per household (based on current US Census data or use 25 individuals per household as a default)
Y Y Y Y Y
Displacement Cost (Residential)
bull The unit cost to lodge and feed displaced residents while flood damage is repaired
bull Average unit displacement cost of $415residential unitday recommended based on current FY2018 GSA Per Diem rates for New York City
Y Y Y Y Y
Value of Service (Non-Residential and Public)
bull The unit cost of service disruption and rental of temporary facilities while flood damage is repaired
bull Disruption costs for non-residential buildings typically range from $095 to $136SFmonth and rental costs range from $020 to $136SFmonth depending on building use
bull Value of service for public buildings ($day) is typically based on the annual operating budget for the City agency using the building prorated based on building size or population served by the building then divided by 365 daysyear
Y Y Y Y
Value of Service (Critical Facilities)
bull The unit cost of critical facilities (police fire emergency medical services) lost or delayed while flood damage is repaired
Y Y Y
Value of Service Duration
bull The duration of service disruption and rental of temporary facilities for non-residential buildings and critical facilities while flood damage is repaired
bull For non-residential buildingso Value of Service Durations vary from
4 months to over 30 months based on building use and the depth of flooding
o Total Value of Service Loss = (Disruption Cost x Building Area) = (Rental Cost x Building Area x Value of Service Duration)
bull For public buildings and critical facilitieso Value of Service Durations vary from 0
days to 720 months based on building use and the depth of flooding from FEMA FIA or USACE DDFs
o Total Value of Service Loss = (Value of Service) x (Service Loss Duration)
Y Y Y
NYC Mayorrsquos Office of Recovery and Resiliency Climate Resiliency Design Guidelines
47APPENDIX 4 - PROJECT BENEFITS CATEGORIES
Table 16 ndash Guidance on quantitative calculations for (1) sea level rise with coastal storm surge and (2) increased precipitation measures
Data Input General Guidance ndash Basic Description
Applicable Benefit Category
Applicable Typical Facility Typology
Dire
ct B
enefi
ts
Indi
rect
Ben
efits
Oth
er P
oten
tial
Ben
efits
Bui
ldin
g St
ruct
ures
Com
plex
Fa
cilit
ies
Tran
spor
tatio
nSt
reet
scap
es
Plaz
as
Park
Fea
ture
s
Engineering Estimates for Damages
bull Engineered estimate models of physical damages and service losses at the project site based on the Guidelines event recurrence interval(s) and flood depth(s)
Y Y Y Y Y Y
Historic Damages and Service Losses
bull Historic physical damages and service losses at the project site documented from previous flood events
bull Do not use routine maintenancebull The historic damage event recurrence interval
(RIs) andor flood depths must be determined updated for inflation to the present value and adjusted to match the Guidelines event RIsflood depths
Y Y Y Y Y Y
Facility Replacement Value
bull The unit cost to rebuild the facility
Impacted Area bull The geographic area impacted by the facility in the event of failure in acres
Y Y Y Y
Facility Capacity
bull The design capacity of the facilitybull For example - facility capacity expressed in
millions of gallons per day (MGD) for water and wastewater facilities or megawatts (MW) for electrical facilities
Y Y Y Y
Service Population
bull The number of impacted residents served by the facility
bull Typically estimated based on number of impacted residential customers x average number of individuals per household (based on current US Census data or use 25 individuals per household as a default)
bull Facilities serving mostly non-residentialpublic buildings andor critical facilities should focus on service losses rather than service population
Y Y Y
NYC Mayorrsquos Office of Recovery and Resiliency Climate Resiliency Design Guidelines
48APPENDIX 4 - PROJECT BENEFITS CATEGORIES
Table 16 ndash Guidance on quantitative calculations for (1) sea level rise with coastal storm surge and (2) increased precipitation measures
Data Input General Guidance ndash Basic Description
Applicable Benefit Category
Applicable Typical Facility Typology
Dire
ct B
enefi
ts
Indi
rect
Ben
efits
Oth
er P
oten
tial
Ben
efits
Bui
ldin
g St
ruct
ures
Com
plex
Fa
cilit
ies
Tran
spor
tatio
nSt
reet
scap
es
Plaz
as
Park
Fea
ture
s
Value of Service
bull Unit value of service provided by the facilitybull Example of FEMA standard values for complete
loss of utility service $105personday for potable water$49personday for wastewater$148personday for electrical
bull Consider updating FEMA standard per capita values to reflect current The New York City utility rates
Y Y
Roadway Elevations bull Roadway Elevations
Y Y
Roadway Replacement Value
bull Roadway Replacement ValueY Y
Inundation Area Map
bull Inundation Area Map developed by FEMA or through modeling by project design team
Y Y Y
Building Inventory of Inundation Area
bull The number and type of buildings within the streetscape and neighborhood inundated by the Guidelinersquos flood events
Y Y Y
Average Daily Traffic (ADT)
bull The average number of one-way traffic trips per day along the roadway(s) within the streetscapeneighborhood inundated by the Guidelinersquos flood events
Y Y
Additional Travel Time
bull The additional travel time needed to detour around a flooded roadway expressed in minutes
bull In the unlikely event there is no detour available use a 12-hour travel time per one-way trap but provide a detailed area street map as supporting documentation
Y Y
Value of Traffic Delay
bull The value of service associated with lost time in traffic
bull For example - FEMA standard average value of $3344vehiclehour of delay
bull Consider updating FEMA and GSA standard values to reflect current New York City area labor rates and fuel costs
Y Y
NYC Mayorrsquos Office of Recovery and Resiliency Climate Resiliency Design Guidelines
49APPENDIX 4 - PROJECT BENEFITS CATEGORIES
Table 17 ndash Guidance on quantitative unit benefit calculations for extreme heat hazard measures
Measure General Guidance ndash Unit Benefit Information and Data Requirements
Applicable Benefit Category
Applicable Typical Facility Typology
Dire
ct B
enefi
ts
Indi
rect
Ben
efits
Oth
er P
oten
tial
Ben
efits
Bui
ldin
g St
ruct
ures
Com
plex
Fa
cilit
ies
Tran
spor
tatio
nSt
reet
scap
es
Plaz
as
Park
Fea
ture
s
Green Roof
bull Unit benefit range over PUL = $470SF to $373SF of green roof area ($719SF standard value)
bull Assumed PUL = 40 yearsbull Apply standard value unit benefit to green
roof area to estimate measure benefitbull Higher range values more applicable
to residential and commercial building streetscape projects
Y Y Y Y Y Y
Bioswale Rain Garden Meadow Mix
bull Unit benefit range over PUL = $396SF to $211SF of area ($730SF standard value)
bull Assumed PUL = 30 yearsbull Apply standard value unit benefit to bioswale
rain gardenmeadow mix area to estimate total measure benefit
Y Y Y Y Y Y
Cool Roof
bull Unit benefit range over PUL = $117 to $3151SF of material area ($144SF standard value)
bull Assumed PUL = 20 yearsbull Apply standard value unit benefit to cool roof
area to estimate total measure benefitbull Higher range values more applicable to
residential building streetscape projects
Y Y Y Y Y
Light-Colored PaversLight-Colored Materials
bull Unit benefit range over PUL = $0774 to $204SF of material area ($0866SF standard value)
bull Assumed PUL = 30 yearsbull Apply standard value unit benefit to material
area to estimate total measure benefit
Y Y Y Y
Table 17 provides general guidance on how to quantitatively calculate benefits from efforts to address climate stressors See Section IIIE for more information
NYC Mayorrsquos Office of Recovery and Resiliency Climate Resiliency Design Guidelines
50APPENDIX 4 - PROJECT BENEFITS CATEGORIES
Table 17 ndash Guidance on quantitative unit benefit calculations for extreme heat hazard measures
Measure General Guidance ndash Unit Benefit Information and Data Requirements
Applicable Benefit Category
Applicable Typical Facility Typology
Dire
ct B
enefi
ts
Indi
rect
Ben
efits
Oth
er P
oten
tial
Ben
efits
Bui
ldin
g St
ruct
ures
Com
plex
Fa
cilit
ies
Tran
spor
tatio
nSt
reet
scap
es
Plaz
as
Park
Fea
ture
s
Tree Planting
bull Unit benefit range over PUL = $1005 to $77154Tree ($1855Tree standard value)
bull Assumed PUL = 30 yearsbull Apply standard value unit benefit to number of
trees to estimate total measure benefitbull Higher range values more applicable
to residential and commercial building streetscape projects
Y Y Y Y Y Y
Planter Box Tree
bull Unit benefit range over PUL = $212 to 16304Tree ($392Tree standard value)
bull Assumed PUL = 15 yearsbull Apply standard value unit benefit to number of
trees to estimate total measure benefitbull Higher range values more applicable
to residential and commercial building streetscape projects
Y Y Y Y Y
Shade Canopy
bull Unit benefit range over PUL = $0363 to $396SF ($0458SF standard value)
bull Assumed PUL = 15 yearsbull Apply standard value unit benefit to area of
shade canopy estimate total measure benefitbull Higher range values more applicable
to residential and commercial building streetscape projects
Y Y Y Y
Permeable Grass Pavers
bull Unit benefit range over PUL = $0258SF to $0521SF of pavers ($0363SF standard value)
bull Assumed PUL = 30 yearsbull Apply standard value unit benefit to paver
area to estimate total measure benefit
Y Y Y Y Y
For the purposes of the BCA refer to the following facility typologies bull ldquoBuilding Structuresrdquo include critical small building sites such as EMS or FDNY stations and non-critical small building sites such as
libraries or comfort stationsbull ldquoComplex Facilitiesrdquo include critical infrastructure such as wastewater treatment sites pump stations water filtration plants and similar
large or complex facilitiesbull ldquoTransportationStreetscapePlazasrdquo include roadway reconstruction streetscape improvements street raising plazas and other
transportation-related infrastructurebull ldquoPark Featuresrdquo include parks and similar public recreational facility with natural landscape features
NYC Mayorrsquos Office of Recovery and Resiliency Climate Resiliency Design Guidelines
51APPENDIX 5 - EXAMPLE PLANNING DECISION TREE
This decision tree provides a summarized example approach for how to implement these Guidelines Projects with a total cost greater than $50 million are recommended to conduct a full qualitative and quantitative climate change risk assessment and BCA while projects below $50 million are recommended to conduct a qualitative risk assessment and BCA
Define Project
1) Operational goals and criticality level2) Useful life3) Location in the current flood plain future floodplain and or zone
of tidal inundation and the project arearsquos score on the heat vulnerability index
Evaluate Project Risks According to Probability and Magnitude of Consequence
bull Extreme Heat bull Precipitationbull Sea Level Risebull Coastal Surge
High Level Identification and Assessment of Risk Mitigation Alternatives and Co-benefits
(qualitative)
Detailed Identification and Assessment of Risk Mitigation Alternatives and Co-benefits (qualitative and quantitative)
High Level Estimate of Costs and Benefits of Design Alternatives
(qualitative)
Detailed Estimate of Costs and Benefits of Design Alternatives
(qualitative and quantitative)
Decision Point Which climate change risks require mitigation
Decision Point Evaluate risk mitigation benefits and costs to
determine final resilient design alternative or if no action is required
Decision Point Is the total project cost above $50 million
Below $50 million Above $50 million
APPENDIX 5 - EXAMPLE PLANNING DECISION TREE
NYC Mayorrsquos Office of Recovery and Resiliency Climate Resiliency Design Guidelines
52
Project Title
Design Strategies Checklist (not exhaustive)
Extreme Heat Comments Extreme Precipitation Comments Sea Level Rise amp Storm Surge Comments
Select Site in Low Heat Vulnerability Index area Select High Elevation Site Select High Elevation Site
Minimize East-West Building Orientation Green Roof Raise Building Floor Elevation
Passive Solar Cooling and Ventilation Systems
Protect Below Grade Areas from Flooding Waterproof Building Envelope
Cool Roof (SRI appropriate) On-site Stormwater Management (gray) Elevate Critical Building Functions
Green Roof (extensive) Reduce Impervious Areas Elevate Critical Equipment
Vegetative Structures Permeable Pavement Perimeter Floodwall100 Levee (passive or active)
Enhanced HVAC System including space layout optimization and system scalability
Increase Green Spaces and Planted Areas DryWet Floodproofing
More Efficient Building Envelope Other Utility Redundancy Design101
Parking Lot Shading Resilient Materials amp Landscape Treatments
Light Colored Pavements (appropriate SRI) Design for Storm Surge Outflow
Increase Planted Areas Install Backwater Flow Prevention
Permeable Surfaces Design for Scour
Open-grid Pavement Raise Road Elevation
Other Other
This appendix provides a template for identifying possible design strategies to address climate change risks as described throughout the Guidelines
APPENDIX 6 - DESIGN STRATEGIES CHECKLIST
100 Permanent perimeter flood walls are not permitted to meet floodproofing requirements in buildings with substantial improvements andor damages 101 Utility redundancy design should be pursued for critical systems not all building systems
APPENDIX 6 - DESIGN STRATEGIES CHECKLIST
NYC Mayorrsquos Office of Recovery and Resiliency Climate Resiliency Design Guidelines
53APPENDIX 7 - CLIMATE CHANGE RISK ASSESSMENT RESOURCES
These Guidelines provide data on climate change hazards and recommend how that data can inform resilient design A risk assessment is a tool to help project managers and designers evaluate risk levels as well as select and prioritize resilient design strategies A high level risk assessment is recommended for all City capital projects with a total cost of under $50 million Projects above $50 million are recommended to conduct an in-depth assessment
Risk assessments use quantified estimates of the probability and magnitude of consequence of an event occurring to prioritize responses ldquoProbabilityrdquo is an assessment of the likelihood of a hazard occurring while ldquomagnituderdquo describes the hazardrsquos potential impact Risk assessment tools such as the examples listed below can be used to define and score these categories Projects that score higher across both probability and magnitude can be prioritized for investment and risk mitigation action Projects that score lower across both criteria may require no action beyond meeting code The results are typically charted on a risk matrix and an example is provided on the next page
The climate change risk management frameworks below offer templates for how to integrate climate change projections into a risk assessment process Refer to these resources for examples and further information
bull Vulnerability Assessment and Adaptation Framework is prepared by the Federal Highway Administration (FHWA) While developed for transportation planning this risk assessment framework has broad applicability for evaluating asset vulnerability to climate change Available at httpswwwfhwadotgovenvironmentsustainabilityresilienceadaptation_framework
bull US Climate Resilience Toolkit The US Global Change Research Program offers a step by step risk assessment
framework including tools and case studies at httpstoolkitclimategovsteps (see example on next page)
bull Coast Adapt Guidance on undertaking a risk assessment High level assessment httpscoastadaptcomausitesdefaultfilesfactsheetsT3M4_2_2nd_pass_risk_assessmentpdfDetailed assessment httpscoastadaptcomausitesdefaultfilesfactsheetsT3M4_3_3rd_pass_risk_assessmentpdf
bull Climate adaptation Risk uncertainty and decision-makingDownload the report here httpswwwukciporgukpublicationsRisk
The City plans to develop a NYC-specific process for integrating climate change data into existing risk management processes by April 2019
APPENDIX 7 - CLIMATE CHANGE RISK ASSESSMENT RESOURCES
NYC Mayorrsquos Office of Recovery and Resiliency Climate Resiliency Design Guidelines
54APPENDIX 7 - CLIMATE CHANGE RISK ASSESSMENT RESOURCES
The Risk Characterization Matrix below is an example from the US Climate Resilience Toolkit This tool can be used to assess the probability and magnitude of impact for identified risks The risk of coincident climate stressorsrisks (such as storm surge plus increased precipitation) can also be assessed as applicable
Figure 14 - Example of a climate change risk matrix (adapted from US Climate Resilience Toolkit)
Project teams can determine the magnitude of the impact (along the horizontal scale of 1 through 3 with 3 being the most severe) and the probabilitylikelihood of occurrence for each specific risk (along the vertical scale with 3 being the most likely) A score is typically assigned for each risk (Probabil-ity x Magnitude) and then charted on the matrix Based on the estimated probability and magnitude of consequence above the risks are ranked and prioritized for mitigation Factors to bear in mind include
bull Not all facility typologies have the same level of functional and operational importance during events or tolerance for disruption
bull Not all climate stressors and risks have the same level of impact on each project sitebull Not all identified risks can or should be mitigated fully
NYC Mayorrsquos Office of Recovery and Resiliency Climate Resiliency Design Guidelines
55WORKS CITED
A Stronger More Resilient New York PlaNYC Report of the NYC Special Initiative for Rebuilding and Resiliency The City of New York 2013
ldquoAccount for Climate Riskrdquo International Finance Corporation accessed March 27 2017 httpwwwifcorgwpswcmconnectTopics_Ext_ContentIFC_External_Corporate_SiteClimate+Business
PrioritiesAccount+for+Climate+Risk
American Society of Heating Refrigeration and Air-Conditioning Engineers (ASHRAE) Handbook -Fundamentals 2017
ldquoBaseline Standard Economic Value Methodology Reportrdquo Federal Emergency Management Agency July 2016
Benefit Cost Analysis Toolkit Software Version 530 Federal Emergency Management Agency (build date December 2016)
Criteria for Detention Facility Design New York City Department of Environmental Protection November 2012
Community Resilience Planning Guide for Buildings and Infrastructure Systems Vol 1 NIST Special Publication 1190 US Department of Commerce 2016
Cool and Green Roofing Manual NYC Department of Design and Construction 2007 httpwwwnycgovhtmlddcdownloadspdfcool_green_roof_manpdf
Building Resiliency Task Force US Urban Green Building Council New York 2013 httpurbangreencouncilforcecomBuildingResiliency
Design and Planning for Flood Resiliency Guidelines for NYC Parks New York City Department of Parks and Recreation 2017
httpswwwnycgovparksorgplanning-and-buildingplanningresiliency-plansflood-resiliency
Flooded Bus Barns and Buckled Rails Federal Transit Administration Office of Budget and Policy 2011 httpswwwhsdlorgabstractampdid=685187
Floodproofing Non-Residential Buildings FEMA P936 FEMA 2013 httpswwwfemagovmedia-library-data9a50c534fc5895799321dcdd4b6083e7P-936_8-20-13_508rpdf
ldquoGlossaryrdquo International Infrastructure Management Manual National Asset Management Support Group New Zealand 2011 httpwwwipweaorg
ldquoGreen Roof Metrics Draft Reportrdquo New York City Department of Parks and Recreation 2017
ldquoGuide to Rain Event Preparednessrdquo NYC Department of Environmental Protection httpwwwnycgovhtmldeppdfbrochuresflood-preparedness-flyerpdf
ldquoGuidelines and Discount Rates for Benefit-Cost Analysis of Federal Programsrdquo Appendix C Circular A-94 US Office of Management and Budget (OMB) 2017
ldquoGuidelines for the Design and Construction of Stormwater Management Systemsrdquo New York City Department of Environmental Protection July 2012
Horton R et al New York City Panel on Climate Change 2015 Report Ann NY Acad Sci ISSN 0077-892 New York 2015
Madrigano J et al ldquoA case-only study of vulnerability to heat wavendashrelated mortality in New York City (2000ndash2011)rdquo Environmental Health Perspectives 123672ndash678 2013
WORKS CITED
NYC Mayorrsquos Office of Recovery and Resiliency Climate Resiliency Design Guidelines
56WORKS CITED
enspMcGregor et al Two Degrees The Built Environment and Our Changing Climate Routledge Press 2013
NYC Green Codes Task Force US Green Building Council New York 2010 httpurbangreencouncilorgGreenCodes
NYCrsquos Risk Landscape A Guide to Hazard Mitigation NYC Emergency Management 2014
One New York The Plan for a Strong and Just City The City of New York 2015 httpwwwnycgovhtmlonenyc downloadspdfpublicationsOneNYCpdf
Ready to Respond Strategies for Multifamily Building Resilience Enterprise Green Communities 2015 httpswwwenterprisecommunityorgresources
Rosenzweig C et al Climate Change Adaptation in New York City Building a Risk Management Response New York City Panel on Climate Change 2010
httponlinelibrarywileycomdoi101111nyas20101196issue-1 issuetoc
ldquoSustainable Infrastructure Management Program Learning Environmentrdquo Water Environment Research Foundation accessed March 24 2017 httpsimplewerforg
Urban Waterfront Adaptive Strategies NYC Department of City Planning 2013 httpwww1nycgovsiteplanningplanssustainable-communitiesclimate-resiliencepagetab=1
Wastewater Resiliency Plan Climate Risk Assessment and Adaptation Study New York City Department of Environmental Protection October 2013
NYC Mayorrsquos Office of Recovery and Resiliency Climate Resiliency Design Guidelines
34
Equation 2 Present Value Coefficient (PVC) Formula
PVC =
Where PVC = Present Value Coefficient
PUL = BCA Project Useful Life based on project type
DR = Discount Rate
The project design team should coordinate with agencies and NYC OMB if needed to determine appropriate discount rates based on funding source project type and other factors This coordination should take place during project initiation phase where total project costs (design and construction) are over $50 million66
c) Develop input data to perform benefit calculations Tables 16 and 17 in Appendix 4 provide a list of typical input data by each climate
stressor needed to perform benefit analysis quantitatively on variety of facilities67 The project design team should use these tables as a reference to identify appropriate input data categories andor additional input data needed to perform benefit analysis on the project
d) Identify applicable project benefit categories to estimate benefits Tables 16 and 17 in Appendix 4 provide a list of typical project benefits by each climate
stressor needed to perform benefit analysis quantitatively on various types of projects The project design team should use these tables as a reference to identify appropriate project benefit categories for each climate stressor to perform benefit analysis on the project
e) Calculate benefits of recommended design interventions for each climate
stressor The input data and applicable project benefits can be assembled along with
incremental project cost data to analyze cost-effectiveness using the FEMA BCA Tool Damage-Frequency Assessment (DFA) module or similar software This analysis will provide a BCR for each alternative which can then be used to compare the alternatives that were developed to mitigate effects from applicable climate stressors The project design team can then use the results from this analysis to identify optimal interventions that provides a balanced solution that provides resiliency benefits within the available project budget
IIIE BCA METHODOLOGY FOR PROJECTS OVER $50 MILLION
[1 ndash (1 + DR) -(PUL)]DR
66 For example a NYC OMB March 2015 memorandum recommends using an annually updated DR as published each year in Appendix C of OMB Circular A-94 The current OMB-recommended discount rates from OMB A-94 Appendix C vary by project useful life and are as follows 21 DR for useful lives of 10 to 19 years 25 DR for useful lives of 20 to 29 years and 28 DR for useful lives of 30 years or greater By contrast FEMA hazard mitigation grants use a DR of 70 for all projects based on the Federal OMB A-94 rate for federally-funded mitigation measures Since these DRs will impact the PVC and the project benefits the project team must ensure that BCA results prepared using an OMB-recommended DR (21 to 28) be updated to reflect the Federal DR (70) when applying for FEMA mitigation grant funds
67 Note the data requirements for the sea level rise and increased precipitation hazards in Table 16 are more detailed than the requirements for the extreme heat hazards due to the less detailed level of analysis available for extreme heat
NYC Mayorrsquos Office of Recovery and Resiliency Climate Resiliency Design Guidelines
35
APPENDICES
NYC Mayorrsquos Office of Recovery and Resiliency Climate Resiliency Design Guidelines
36APPENDIX 1 ndash KEY TERMS
100-year flood (1 annual chance flood)
A flood that has a 1 probability of occurring in any given year The 100-year floodplain is the extent of the area of a flood that has a 1 chance of occurring or being exceeded in any given year
500-year flood (02 annual chance flood)
A flood that has a 02 probability of occurring in any given year The 500-year floodplain is the extent of the area of a flood that has a 02 chance of occurring or being exceeded in any given year
AdaptationAdjustment in natural or human systems to a new or changing environment that seeks to maximize beneficial opportunities or moderate negative effects Successful adaptations contribute to resiliency
Base flood elevation (BFE)The elevation of surface water resulting from a flood that has a 1 annual chance of occurring or being exceeded in any given year The BFE is shown on the Flood Insurance Rate Map (FIRM)69
BluebeltReference to the Department of Environmental Protectionrsquos (DEP) Bluebelt program to preserve natural drainage corridors including streams ponds and other wetland areas Preservation of these wetland systems allows them to perform their functions of conveying storing and filtering storm water
Climate
The average weather (or more rigorously a statistical description of the average in terms of the mean and variability) over a period of time usually 30 years These quantities are most often surface variables such as temperature precipitation and wind Climate in a wider sense is the state including a statistical description of the climate system70
Climate change
Changes in average weather conditions that persist over multiple decades or longer Climate change encompasses both increases and decreases in temperature as well as shifts in precipitation changing risk of certain types of severe weather events and changes to other variables of the climate system
Climate change riskThe chance that investments (such as in capital projects) can be affected by the physical impacts of climate change71 Risks are evaluated as a product of the probability of occurrence and the magnitude of damages or impacts including socioeconomic factors that would result if they did occur (consequences)
Climate change risk assessment
This assessment involves a detailed project-specific analysis that includes a vulnerability and risk assessment often followed by cost-benefit analysis to assess and select investments in climate change risk mitigation Risk is assessed as a function of the magnitude and probability of a given climate change hazard Examples resources are included in Appendix 7
Climate vulnerabilityThe degree to which systems and populations are affected by adverse impacts It is a function of the character magnitude and rate of climate change and variation to which a system is exposed its sensitivity and its adaptive capacity72
Cloudburst An extreme amount of rain in a short period of time often over a small geographic area73
Cooling Degree Day (CDD) A form of degree-day used to estimate the energy requirements for air conditioning or refrigeration when the daily mean temperature is above 65degF
68 All terms are from the US Global Change Research Program (USGCRP) glossary unless otherwise noted The USGCRP glossary is available at httpwwwglobalchangegovclimate-changeglossary
69 ldquoDefinitionsrdquo FEMA last modified March 1 2017 httpswwwfemagovnational-flood-insurance-programdefinitions70 UKCIP Glossary httpwwwukciporgukglossary71 ldquoAccount for Climate Riskrdquo International Finance Corporation 72 UKCIP Glossary httpwwwukciporgukglossary73 New York City Environmental Protection ldquoCloudburst Resiliency Planning Studyrdquo 2017 Available at httpwwwnycgovhtmldeppdfclimatenyc-cloudburst-studypdf
APPENDIX 1 - KEY TERMS68
NYC Mayorrsquos Office of Recovery and Resiliency Climate Resiliency Design Guidelines
37APPENDIX 1 ndash KEY TERMS
Design life The life expectancy of an asset or product as determined during design74 As opposed to useful life (see below)
Dry Bulb temperature The ambient air temperature measured by a thermometer
Extreme eventUnexpected unusual or unpredictable weather or flooding compared to historical or future projected distribution Extreme events include for example heat waves cold waves heavy rains periods of drought and flooding and severe storms
Facilities For the purposes of this document ldquofacilitiesrdquo refers to all types of buildings housing infrastructure structures and landscape features designed by or for the City of New York
Flexible adaptation pathwayResilience-building strategies that can evolve or be adapted over time as climate change risk assessments evaluations of adaptation strategies and monitoring continue75
Flood Insurance Rate Maps (FIRM)
Official flood map of a community on which FEMA has delineated the 1 annual chance floodplain and the base flood elevations (BFEs) applicable to the community76 The FIRM also includes the 02 floodplain annual chance floodplain and differentiates between special flood hazard areas (V A Coast A zones) and floodways The official FIRM is from the year 2007 while the 2015 PFIRM is currently required by NYC Building Code to calculate design flood elevations NYC DOB references the more restrictive of the two maps in both base flood elevation and flood hazard area (ie V versus A zone) Refer to Appendix 3 for more information
FreeboardAn additional amount of height above the base flood elevation used as a factor of safety (eg two feet above the base flood) in determining the level at which a facilitys lowest floor must be elevated or floodproofed to be in accordance with state or community floodplain management regulations77
Future time slices
Future periods defined by the NPCC for when climate change projections are available In this document the following decadal projections are associated with specific time spans2020s projection = present to 20392050s projection = 2040 to 20592080s projection = 2070 to 20992100s projection = end of century and beyond
Green infrastructureAn array of practices that use or mimic natural systems to manage urban stormwater runoff Water is either directed to engineered systems for infiltration or detained for longer periods before it enters the sewer system
Heat Vulnerability Index (HVI)Summarizes relative risk of adverse health effects from heat due to social and environmental factors Used to identify neighborhoods at higher risk during and after extreme heat events
Heat wave A period of three consecutive days where temperatures rise above 90degF or two consecutive days over 95 degrees78
New York City Panel on Climate Change (NPCC)
The body of leading climate and social scientists charged with making climate change projections for the metropolitan region79
74 Sustainable Infrastructure Management Program Learning Environment httpsimplewerforg 75 Rosenzweig C et al Climate Change Adaptation in New York City Building a Risk Management Response76 ldquoDefinitionsrdquo FEMA77 Ibid78 Horton R et al New York City Panel on Climate Change 2015 Report Chapter 1 Climate Observations and Projections Ann NY
Acad Sci ISSN 0077-8923 (New York 2015) 2579 For more information on the NPCC visit www1nycgovsiteorrchallengesnyc-panel-on-climate-changepage
NYC Mayorrsquos Office of Recovery and Resiliency Climate Resiliency Design Guidelines
38APPENDIX 1 ndash KEY TERMS
Open-grid pavement system
Pavements that consist of loose substrates supported by a grid of a more structurally sound grid or webbing Unbounded loose substrates in these systems transfer and store less heat than bound and compacted pavements and aid permeability Pavement is 50 pervious and contains vegetation in the open cells designed to allow percolation or infiltration of storm water through the surface into the soil below80
Preliminary Flood Insurance Rate Map (PFIRM)
Preliminary flood map developed by FEMA in 2015 for New York City that provides projected risks for flood hazards81 Refer to Appendix 3 for more information
Project useful life (PUL)
The period over which an asset or component is expected to be available for use by an entity This depends on regular and adequate maintenance This period of time typically exceeds the design life (see above) The combined effect of operational requirements and useful life is practical in assessing an investment in improving resilience82
Rain gardenAlso called ldquobioswalerdquo Planted areas designed to collect and manage stormwater that runs off streets sidewalks commercial and residential rooftops and other sources when it rains
Resiliency The ability to bounce back after change or adversity The capability of preparing for responding to and recovering from difficult conditions83
Sea level rise-adjusted design flood elevation
As defined in these Guidelines the increased height of the base flood elevation due to sea level rise plus freeboard depending on the criticality of the facility The sea level rise adjustment depends on the useful life of the facility
Storm surge An abnormal rise of water generated by a storm over and above predicted astronomical tides84
Substantial improvementAny repair reconstruction rehabilitation addition or improvement of a building or structure the cost which equals or exceeds 50 of the market value of the structure before the improvement or repairs started For more information see Appendix G of the NYC Building Code and 1 RCNY sect3606-0185
Tidal inundation Flooding which occurs at high tides due to climate-related sea level rise land subsidence andor the loss of natural barriers86
Urban Heat Island (UHI) effectThe tendency for higher air temperatures to persist in urban areas as a result of heat absorbed and emitted by buildings and asphalt tending to make cities warmer than the surrounding suburban and rural areas
Weather The state of the atmosphere at a given time with regard to temperature cloudiness precipitation wind and other meteorological conditions87
Wet Bulb temperatureThe temperature indicated when a thermometer bulb is covered with a water-saturated wick over which air is caused to flow at approximately 45 ms (900 ftmin) to reach the equilibrium temperature of water evaporating into the air when the heat of vaporization is supplied by the sensible heat of the air88
80 ldquoGlossaryrdquo US Green Building Council (2017) Available at httpwwwusgbcorgglossaryterm552581 ldquoPreliminary FEMA Map Productsrdquo FEMA Map Service Center Available at httpshazardsfemagovfemaportalprelimdownload82 ldquoGlossaryrdquo International Infrastructure Management Manual (2011) 83 A Stronger More Resilient New York (2013) 184 ldquoStorm Surge Overviewrdquo National Hurricane Center NOAA Available at httpswwwnhcnoaagovsurge85 ldquoFlood Resistant Constructionrdquo Appendix G New York City Building Code (2008) and 1 RCNY sect3606-01 available at httpswww1nycgovassetsbuildingsrules1_RCNY_3606-01pdf86 ldquoOcean Factsrdquo National Ocean Service NOAA Available at httpoceanservicenoaagovfactsnuisance-floodinghtml 87 UKCIP Glossary httpwwwukciporgukglossary88 ldquoASHRAE Terminologyrdquo ASHRAE Available at httpswwwashraeorgtechnical-resourcesauthoring-toolsterminology
NYC Mayorrsquos Office of Recovery and Resiliency Climate Resiliency Design Guidelines
39APPENDIX 2 - CLIMATE CHANGE PROJECTIONS
Climate change projections are provided by the New York City Panel on Climate Change (NPCC) The full NPCC report is available from the New York Academy of Sciences89 Tables 8-10 (below) were reproduced directly from the NPCC report while Table 2 (see Section IIA) was developed using the data underlying the NPCC report to inform the design of HVAC systems under warmer conditions
Table 8 ndash NYC sea level rise projections90
Baseline (2000-2004) 0 in
Low estimate (10th percentile)
Middle range (25th to 75th percentile)
High estimate (90th percentile)
2020s 2 in 4-8 in 10 in
2050s 8 in 11-21 in 30 in
2080s 13 in 18-39 in 58 in
2100 15 in 22-50 in 75 in
Note Projections are based on six-component approach that incorporates both local and global factors The model-based components are from 24 global climate models and two representative concentration pathways Projections are relative to the 2000-2004 base period
Table 9 ndash Mean annual changes91
a Temperature Baseline(1971-2000) 54degF
Low estimate (10th percentile)
Middle range (25th to 75th percentile)
High estimate (90th percentile)
2020s + 15degF +20-29degF +32degF
2050s +31degF +41-57degF +66degF
2080s +38degF +53-88degF +103degF
2100 +42degF +58-104degF +121F
b Precipitation Baseline(1971-2000) 501 in
Low estimate (10th percentile)
Middle range (25th to 75th percentile)
High estimate (90th percentile)
2020s -1 percent +1-8 +10
2050s +1 percent +4-11 +13
2080s +2 percent +5-13 +19
2100 -6 percent -1 to +19 +25
Note Based on 35 global climate models (GCMs) and two RCPs Baseline data cover the 1971ndash2000 base period and are from the NOAA National Climatic Data Center (NCDC) Shown are the low estimate (10th percentile) middle range (25th percentile to 75th percentile) and high estimate (90th percentile) These estimates are based on a ranking (from most to least) of the 70 (35 GCMs times 2 RCPs) projections The 90th percentile is defined as the value that 90 percent of the outcomes (or 63 of the 70 values) are the same or lower than Like all projections the NPCC climate change projections have uncertainty embedded within them Sources of uncertainty include data and modeling constraints the random nature of some parts of the climate system and limited understanding of some physical processes The NPCC characterizes levels of uncertainty using state-of-the-art climate models multiple scenarios of future greenhouse gas concentrations and recent peer-reviewed literature Even so the projections are not true probabilities and the potential for error should be acknowledged
89 The NPCC 2015 report is available at httponlinelibrarywileycomdoi101111nyas20151336issue-1issuetoc90 From New York City Panel on Climate Change 2015 Report Chapter 1 Climate Observations and Projections page 4191 From New York City Panel on Climate Change 2015 Report Chapter 1 Climate Observations and Projections page 30
APPENDIX 2 - CLIMATE CHANGE PROJECTIONS
NYC Mayorrsquos Office of Recovery and Resiliency Climate Resiliency Design Guidelines
40APPENDIX 2 - CLIMATE CHANGE PROJECTIONS
Table 10 ndash Extreme events92
2020s Baseline (1971-2000)
Low estimate(10th percentile)
Middle range(25th to 75th percentile)
High estimate (90th percentile)
Numbers of heat waves per year 2 3 3-4 4
Average heat wave duration (days) 4 5 5 5
Number of days per year with
Maximum temperature at or above 90degF 18 24 26-31 33
Maximum temperature at or above 100degF 04 07 1-2 2
Minimum temperature at or below 32degF 71 50 52-58 60
Rainfall at or above 1 inch 13 13 14-15 16
Rainfall at or above 2 inches 3 3 3-4 5
Rainfall at or above 4 inches 03 02 03ndash04 05
2050s Baseline (1971-2000)
Low estimate(10th percentile)
Middle range(25th to 75th percentile)
High estimate (90th percentile)
Numbers of heat waves per year 2 4 5-7 7
Average heat wave duration (days) 4 5 5-6 6
Number of days per year with
Maximum temperature at or above 90degF 18 32 39-52 57
Maximum temperature at or above 100degF 04 2 3-5 7
Minimum temperature at or below 32degF 71 37 42-48 52
Rainfall at or above 1 inch 13 13 14-16 17
Rainfall at or above 2 inches 3 3 4-4 5
Rainfall at or above 4 inches 03 03 03-04 05
2080s Baseline (1971-2000)
Low estimate(10th percentile)
Middle range(25th to 75th percentile)
High estimate (90th percentile)
Numbers of heat waves per year 2 5 6-9 9
Average heat wave duration (days) 4 5 5-7 8
Number of days per year with
Maximum temperature at or above 90degF 18 38 44-76 87
Maximum temperature at or above 100degF 04 2 4-14 20
Minimum temperature at or below 32degF 71 25 30-42 49
Rainfall at or above 1 inch 13 14 15-17 18
Rainfall at or above 2 inches 3 3 4-5 5
Rainfall at or above 4 inches 03 02 03-05 07
Note Projections for temperature and precipitation are based on 35 GCMs and 2 RCPs Baseline data are for the 1971 to 2000 base period and are from the NOAA National Climatic Data Center (NCDC) Shown are the low estimate (10th percentile) middle range (25th to 75th percentile) and high estimate (90th percentile) 30-year mean values from model-based outcomes Decimal places are shown for values less than one although this does not indicate higher precisioncertainty Heat waves are defined as three or more consecutive days with maximum temperatures at or above 90degF Like all projections the NPCC climate change projections have uncertainty embedded within them Sources of uncertainty include data and modeling constraints the random nature of some parts of the climate system and limited understanding of some physical processes The NPCC characterizes levels of uncertainty using state-of-the-art climate models multiple scenarios of future greenhouse gas concentrations and recent peer-reviewed literature Even so the projections are not true probabilities and the potential for error should be acknowledged
92 From New York City Panel on Climate Change 2015 Report Chapter 1 Climate Observations and Projections page 31
NYC Mayorrsquos Office of Recovery and Resiliency Climate Resiliency Design Guidelines
41APPENDIX 3 - DIFFERENTIATION OF FLOOD MAPS
These Guidelines reference several different kinds of flood maps and sources of design flood elevations These maps are described and differentiated below
Table 11 - Differentiation of flood maps used in NYC
Reference Title Data Source Information Provided Referenced By Link
2007 FIRM FEMA
Based on historical data from before 1983 identifies the current base flood (extent and elevation) as the flood that has a 1 chance of occurring in any given year also known as a 100-year flood The NYC Building Code requires that either the 2007 FIRM or 2015 PFIRM elevation be used whichever is higher
2014 NYC Building Code Appendix G
Climate Resiliency Design Guidelines
httpsmscfemagovportal
2015 PFIRM FEMA
Based on historical data identifies the current base flood (extents and elevation) as the flood that has a 1 chance of occurring in any given year also known as a 100-year flood The NYC Building Code requires that either the 2007 FIRM or 2015 PFIRM elevation be used whichever is higher The 2015 PFIRM is currently being reassessed by FEMA
2014 NYC Building Code Appendix G
Climate Resiliency Design Guidelines
httpshazardsfemagovfemaportalprelimdownload
httpwwwregion2coastalcomview-flood-maps-dataview-preliminary-flood-map-data
NYC Flood Hazard Mapper
NYC Department of City Planning
Maps current and future flood hazards in NYC including the following data layers 2007 FIRM and 2015 PFIRM high tide with sea level rise and PFIRM with sea level rise through 2100
Climate Resiliency Design Guidelines
Waterfront Revitalization Plan
httpwww1nycgovsiteplanningdata-mapsflood-hazard-mapperpage
ldquoTable 4 ndash Determine the sea level rise-adjusted design flood elevation for critical and non-critical facilitiesrdquo
ORR amp NPCC
Provides data to use when adding sea level rise to a given 2015 PFIRM or 2007 FIRM Base Flood Elevation (BFE) to calculate a Design Flood Elevation (DFE) Based on the criticality and expected useful life of a facility
Climate Resiliency Design Guidelines
See Section II on ldquoSea Level Riserdquo above
APPENDIX 3 - DIFFERENTIATION OF FLOOD MAPS
NYC Mayorrsquos Office of Recovery and Resiliency Climate Resiliency Design Guidelines
42APPENDIX 4 - PROJECT BENEFITS CATEGORIES
This appendix provides guidance on how to identify and assess benefits as a supplement to Sections IIID and IIIE
Table 12 lists typical direct benefits for reducing impacts from climate stressors and basic guidance for how to estimate them See Section IIID for more information
Table 13 lists typical indirect benefits for reducing impacts from climate stressors and basic guidance for how to estimate them See Section IIID for more information
Table 12 ndash Direct benefits for (1) sea level rise with coastal storm surge and (2) increased precipitation measures
Direct Benefit Basic Guidance for Estimating Values
Physical Damages (Structure Contents)
bull For flood-damaged buildings use depth damage functions developed by FEMA and USACE for structures and contents
bull Use depth damage functions in conjunction with Building Replacement Values (BRVs) and not market values BRVs typically range between $100 to $325SF for residential buildings and $120 to $450SF for commercial public buildings
bull For more complex structures or facilities use engineering estimates of flood damages or review historic flood damages documented from insurance claims repair records or FEMA Public Assistance claims from recent flood disasters
Residential Displacements
bull For flood-damaged buildings use depth damage functions developed by FEMA and USACE for residential displacements
Reduced Life CycleOperation and Maintenance (OampM) Costs93
bull Applicable only to projects that reduce overall life cycle costs or net annual OampM costs from baseline conditions
bull Input reduced annual OampM costs as a project benefit at a 1-year recurrence intervalbull Reduced overall life cycle costs can be input as a longer project useful life
Table 13 ndash Indirect benefits for (1) sea level rise with coastal storm surge and (2) increased precipitation measures
Indirect Benefit Basic Guidance for Estimating Values
Non-Residential Building Service Losses
bull Estimate service loss values and durations for non-residential buildings public buildings critical facilities and parksnatural features based on FEMA BCA guidance and standard values based on building use
Utility Service Losses94
bull Estimate utility service losses for water wastewater and electrical facilities based on the number of impacted customers FEMA per capita standard values for utility service ($105personday for potable water $49personday for wastewater $148personday for electrical)95
bull Estimate utility service loss durations based on engineering estimates or review historic flood damages losses documented from utility company records
bull This benefit can also apply to measures that increase energy efficiency
RoadBridge Service Losses
bull Estimate roadbridge service losses based on the average daily traffic (ADT) detour time and additional travel distance and FEMA and GSA standard values for road service ($3344vehiclehour of delay $0545mile)96
bull Estimate roadbridge service loss durations or review historic flood damages losses
Emergency Service Losses
bull Applicable only to projects that reduce or eliminate documented emergency service costs from baseline conditions
bull Examples of avoided emergency services costs include NYPD staffing to monitor barricades for flooded roads or NFDY staffing for water rescues of residents from flooded buildings or streets
APPENDIX 4 - PROJECT BENEFITS CATEGORIES
93 Reduced life cycle costs may be applicable to some measures that provide extreme heat benefits such as green roofs that can last longer than a standard roof if properly maintained
94 Reduced utility service costs may be applicable to some measures that provide extreme heat benefits such as cool roofs green roofs and shade trees
95 FEMA per capita standard values taken from FEMA BCA Toolkit Version 530 (Build Date 12222016) and developed in FEMArsquos Baseline Standard Economic Value Methodology Report (July 28 2016) Consider updating FEMA standard per capita values to reflect current New York City utility rates
96 Consider updating FEMA and GSA standard values to reflect current New York City area labor rates and fuel costs
NYC Mayorrsquos Office of Recovery and Resiliency Climate Resiliency Design Guidelines
43APPENDIX 4 - PROJECT BENEFITS CATEGORIES
Table 14 ndash Other potential benefits for (1) sea level rise with coastal storm surge and (2) increased precipitation measures
Other Benefit Basic Guidance for Estimating Values
Avoided Stress and Anxiety
bull Applicable only for projects that directly benefit occupants of residential structuresbull Use FEMA standard value for avoided mental stress and anxiety treatment costs of $2443person to
estimate benefit for all impacted residents97
Avoided Lost Productivity
bull Applicable only for projects that directly benefit occupants of residential structuresbull Use FEMA standard value for avoided lost worker productivity costs of $8736household to estimate
benefit for all impacted workers (conservatively assuming one worker per household)
Environmental Open Space
bull Applicable only for projects that create or acquire open space areas by acquisitionbull Use FEMA standard value for environmental open space based on the type of land acquired ($8308
Acreyear for Green open space $39545Acreyear for Riparian $6010Acreyear for Wetlands $554Acreyear for Forests $1799Year for Marine and estuary)97
CSO Volume Reduction
bull Applicable only for projects that provide Combined Sewer Overflow (CSO) abatement by reducing the volume of rainfall runoff
bull Use CSO abatement cost of $0015gallonsyear applied to increased precipitation hazard runoff volume for 5-year design storm98
Ecosystem Service99
bull Add stormwater management benefits of green infrastructure projects to increased precipitation hazards where avoided damages and service losses are not quantified
bull Unit benefits applicable to increased precipitation hazard includeo Green roofs $0133SFyear (PUL 40 years)o BioswaleRain GardenMeadow Mix $0020SFyear (PUL 30 years)o Permeable Grass Pavers $0020SFyear (PUL 30 years)o Tree Plantings $303Treeyear (PUL 30 years)o Planter Box Trees $101Treeyear (PUL 15 years)
Real Estate99
bull Potential real estate benefits from increased resilience of residential andor commercial propertiesstreetscapesneighborhoods included within the project scope
bull Benefit applied to extreme heat hazard for green infrastructure projects directly impacting residential or commercial properties
Quality of Life Health Benefits99
bull Potential quality of life benefits related to improved public health from the resilience measures included within the project scope
bull Benefit applied to extreme heat hazard for green infrastructure projects directly impacting residential or commercial properties
Table 14 lists other typical benefits for reducing impacts from climate stressors and basic guidance for how to estimate them See Section IIID for more information
97 FEMA standard values for avoided mental stress and anxiety and environmental open space values taken from FEMA BCA Toolkit Version 530 (Build Date 12222016)
98 CSO abatement cost taken from APG1 Report for NYC ldquoTechnical Approaches for Benefit-Cost Analysis of Hazard Mitigation Projects in Urban and Coastal Environmentsrdquo (April 2016)
99 Ecosystem Services Real Estate and Quality of LifeHealth benefits tend to be more applicable to green infrastructure measures that provide extreme heat benefits such as green roofs trees and other plantings
NYC Mayorrsquos Office of Recovery and Resiliency Climate Resiliency Design Guidelines
44APPENDIX 4 - PROJECT BENEFITS CATEGORIES
Table 15 ndash Potential benefits for extreme heat (Urban Heat Island) reduction measures
Category Benefit Basic Guidance for Estimating Values
Direct Benefit
Reduced Life Cycle Cost
bull Applicable only to measures such as green roofs that are expected to last longer than standard roofs
bull Compute total cost savings including annual OampM costs
Indirect Benefit
Energy Savings
bull Applicable to measures that reduce energy costs by providing cooling through increased shading andor evapotranspiration
bull Use New York Power Authority rates of $0148kWh for electricity and $0810Therm for natural gas
Other Potential Benefits
Air Quality bull Applicable to measures that absorb pollutants andor reduce carbon dioxide emissions
Acoustics bull Applicable to measures such as green roof or walls that reduce noise transfer
Quality of LifeHealth bull Potential quality of life benefits and related to improved public health
Real Estate bull Applicable to measures that provide residential real estate benefits from increased resilience of propertiesstreetscapesneighborhoods
Retail Sales Marketing
bull Applicable to measures that provide commercial property benefits from increased aesthetics resulting in increased marketing and sales for streetscapesneighborhoods
Tax Credits Incentives
bull Applicable to resilience or green infrastructure measures such as green roofs that have accompanying Federal State or City tax credits or other incentives
Table 15 lists potential benefits for reducing impacts from heat and basic guidance for how to estimate them See Section IIID for more information
NYC Mayorrsquos Office of Recovery and Resiliency Climate Resiliency Design Guidelines
45APPENDIX 4 - PROJECT BENEFITS CATEGORIES
Table 16 ndash Guidance on quantitative calculations for (1) sea level rise with coastal storm surge and (2) increased precipitation measures
Data Input General Guidance ndash Basic Description
Applicable Benefit Category
Applicable Typical Facility Typology
Dire
ct B
enefi
ts
Indi
rect
Ben
efits
Oth
er P
oten
tial
Ben
efits
Bui
ldin
g St
ruct
ures
Com
plex
Fa
cilit
ies
Tran
spor
tatio
nSt
reet
scap
es
Plaz
as
Park
Fea
ture
s
First Floor Elevation (FFE)
bull The elevation of the first finished floor of the structure excluding basements
bull FFE measured from top of lowest floor (riverinenon-coastal high hazard areas) or bottom of lowest horizontal structural member (coastal high hazard areas)
Y Y Y Y
Building Replacement Value (BRV)
bull The unit cost to rebuild a structure of the same quality of construction
bull Not the same as market value
Y Y Y Y
Building Size
bull The total floor area of the building in square feet
bull Total Building Value = BRV x Building Sizebull Typical BRVs for NYC range between $100 to
$325SF for residential buildings and $120 to $450SF for commercialpublic buildings
Y Y Y Y
Structure Description
bull The type of building number of stories and foundation type (full basement partial basement no basement)
bull Collect more detailed foundation data for coastal flood zones
Y Y Y Y
Building Use bull Details related to residential housing commercial business and public use
Y Y Y Y Y
Building Type bull The primary use of building ndash residential commercial public and others
Y Y Y Y Y
Depth Damage Function (DDF)
bull Curves used to estimate structure damage contents damage and displacement of residential buildings based on flood depth
bull DDFs selection based on Structure Description Building Type Building Use
bull Structure DDFs based on percentage of Total Building Value
bull Contents DDFs based on percentage of Total Contents Value
bull Displacement DDFs based on number of displacement days x Displacement Cost
Y Y Y Y Y
Contents Value
bull The cost to replace structure contents (furnishings equipment)
bull Residential building Contents Values typically 50 BRV (FEMA DDFs) or 100 BRV (USACE DDFs)
bull Non-residential building Contents Values between 18 to over 100 depending on building use (USACE DDFs)
bull Total Contents Value = BRV x Building Size
Y Y Y Y Y
Table 16 provides general guidance on how to quantitatively calculate benefits from efforts to address from climate stressors See Section IIIE for more information
NYC Mayorrsquos Office of Recovery and Resiliency Climate Resiliency Design Guidelines
46APPENDIX 4 - PROJECT BENEFITS CATEGORIES
Table 16 ndash Guidance on quantitative calculations for (1) sea level rise with coastal storm surge and (2) increased precipitation measures
Data Input General Guidance ndash Basic Description
Applicable Benefit Category
Applicable Typical Facility Typology
Dire
ct B
enefi
ts
Indi
rect
Ben
efits
Oth
er P
oten
tial
Ben
efits
Bui
ldin
g St
ruct
ures
Com
plex
Fa
cilit
ies
Tran
spor
tatio
nSt
reet
scap
es
Plaz
as
Park
Fea
ture
s
Number of Residents (Residential)
bull Total number of occupants in a residential building
bull Typically estimated based on number of residential units x average number of individuals per household (based on current US Census data or use 25 individuals per household as a default)
Y Y Y Y Y
Displacement Cost (Residential)
bull The unit cost to lodge and feed displaced residents while flood damage is repaired
bull Average unit displacement cost of $415residential unitday recommended based on current FY2018 GSA Per Diem rates for New York City
Y Y Y Y Y
Value of Service (Non-Residential and Public)
bull The unit cost of service disruption and rental of temporary facilities while flood damage is repaired
bull Disruption costs for non-residential buildings typically range from $095 to $136SFmonth and rental costs range from $020 to $136SFmonth depending on building use
bull Value of service for public buildings ($day) is typically based on the annual operating budget for the City agency using the building prorated based on building size or population served by the building then divided by 365 daysyear
Y Y Y Y
Value of Service (Critical Facilities)
bull The unit cost of critical facilities (police fire emergency medical services) lost or delayed while flood damage is repaired
Y Y Y
Value of Service Duration
bull The duration of service disruption and rental of temporary facilities for non-residential buildings and critical facilities while flood damage is repaired
bull For non-residential buildingso Value of Service Durations vary from
4 months to over 30 months based on building use and the depth of flooding
o Total Value of Service Loss = (Disruption Cost x Building Area) = (Rental Cost x Building Area x Value of Service Duration)
bull For public buildings and critical facilitieso Value of Service Durations vary from 0
days to 720 months based on building use and the depth of flooding from FEMA FIA or USACE DDFs
o Total Value of Service Loss = (Value of Service) x (Service Loss Duration)
Y Y Y
NYC Mayorrsquos Office of Recovery and Resiliency Climate Resiliency Design Guidelines
47APPENDIX 4 - PROJECT BENEFITS CATEGORIES
Table 16 ndash Guidance on quantitative calculations for (1) sea level rise with coastal storm surge and (2) increased precipitation measures
Data Input General Guidance ndash Basic Description
Applicable Benefit Category
Applicable Typical Facility Typology
Dire
ct B
enefi
ts
Indi
rect
Ben
efits
Oth
er P
oten
tial
Ben
efits
Bui
ldin
g St
ruct
ures
Com
plex
Fa
cilit
ies
Tran
spor
tatio
nSt
reet
scap
es
Plaz
as
Park
Fea
ture
s
Engineering Estimates for Damages
bull Engineered estimate models of physical damages and service losses at the project site based on the Guidelines event recurrence interval(s) and flood depth(s)
Y Y Y Y Y Y
Historic Damages and Service Losses
bull Historic physical damages and service losses at the project site documented from previous flood events
bull Do not use routine maintenancebull The historic damage event recurrence interval
(RIs) andor flood depths must be determined updated for inflation to the present value and adjusted to match the Guidelines event RIsflood depths
Y Y Y Y Y Y
Facility Replacement Value
bull The unit cost to rebuild the facility
Impacted Area bull The geographic area impacted by the facility in the event of failure in acres
Y Y Y Y
Facility Capacity
bull The design capacity of the facilitybull For example - facility capacity expressed in
millions of gallons per day (MGD) for water and wastewater facilities or megawatts (MW) for electrical facilities
Y Y Y Y
Service Population
bull The number of impacted residents served by the facility
bull Typically estimated based on number of impacted residential customers x average number of individuals per household (based on current US Census data or use 25 individuals per household as a default)
bull Facilities serving mostly non-residentialpublic buildings andor critical facilities should focus on service losses rather than service population
Y Y Y
NYC Mayorrsquos Office of Recovery and Resiliency Climate Resiliency Design Guidelines
48APPENDIX 4 - PROJECT BENEFITS CATEGORIES
Table 16 ndash Guidance on quantitative calculations for (1) sea level rise with coastal storm surge and (2) increased precipitation measures
Data Input General Guidance ndash Basic Description
Applicable Benefit Category
Applicable Typical Facility Typology
Dire
ct B
enefi
ts
Indi
rect
Ben
efits
Oth
er P
oten
tial
Ben
efits
Bui
ldin
g St
ruct
ures
Com
plex
Fa
cilit
ies
Tran
spor
tatio
nSt
reet
scap
es
Plaz
as
Park
Fea
ture
s
Value of Service
bull Unit value of service provided by the facilitybull Example of FEMA standard values for complete
loss of utility service $105personday for potable water$49personday for wastewater$148personday for electrical
bull Consider updating FEMA standard per capita values to reflect current The New York City utility rates
Y Y
Roadway Elevations bull Roadway Elevations
Y Y
Roadway Replacement Value
bull Roadway Replacement ValueY Y
Inundation Area Map
bull Inundation Area Map developed by FEMA or through modeling by project design team
Y Y Y
Building Inventory of Inundation Area
bull The number and type of buildings within the streetscape and neighborhood inundated by the Guidelinersquos flood events
Y Y Y
Average Daily Traffic (ADT)
bull The average number of one-way traffic trips per day along the roadway(s) within the streetscapeneighborhood inundated by the Guidelinersquos flood events
Y Y
Additional Travel Time
bull The additional travel time needed to detour around a flooded roadway expressed in minutes
bull In the unlikely event there is no detour available use a 12-hour travel time per one-way trap but provide a detailed area street map as supporting documentation
Y Y
Value of Traffic Delay
bull The value of service associated with lost time in traffic
bull For example - FEMA standard average value of $3344vehiclehour of delay
bull Consider updating FEMA and GSA standard values to reflect current New York City area labor rates and fuel costs
Y Y
NYC Mayorrsquos Office of Recovery and Resiliency Climate Resiliency Design Guidelines
49APPENDIX 4 - PROJECT BENEFITS CATEGORIES
Table 17 ndash Guidance on quantitative unit benefit calculations for extreme heat hazard measures
Measure General Guidance ndash Unit Benefit Information and Data Requirements
Applicable Benefit Category
Applicable Typical Facility Typology
Dire
ct B
enefi
ts
Indi
rect
Ben
efits
Oth
er P
oten
tial
Ben
efits
Bui
ldin
g St
ruct
ures
Com
plex
Fa
cilit
ies
Tran
spor
tatio
nSt
reet
scap
es
Plaz
as
Park
Fea
ture
s
Green Roof
bull Unit benefit range over PUL = $470SF to $373SF of green roof area ($719SF standard value)
bull Assumed PUL = 40 yearsbull Apply standard value unit benefit to green
roof area to estimate measure benefitbull Higher range values more applicable
to residential and commercial building streetscape projects
Y Y Y Y Y Y
Bioswale Rain Garden Meadow Mix
bull Unit benefit range over PUL = $396SF to $211SF of area ($730SF standard value)
bull Assumed PUL = 30 yearsbull Apply standard value unit benefit to bioswale
rain gardenmeadow mix area to estimate total measure benefit
Y Y Y Y Y Y
Cool Roof
bull Unit benefit range over PUL = $117 to $3151SF of material area ($144SF standard value)
bull Assumed PUL = 20 yearsbull Apply standard value unit benefit to cool roof
area to estimate total measure benefitbull Higher range values more applicable to
residential building streetscape projects
Y Y Y Y Y
Light-Colored PaversLight-Colored Materials
bull Unit benefit range over PUL = $0774 to $204SF of material area ($0866SF standard value)
bull Assumed PUL = 30 yearsbull Apply standard value unit benefit to material
area to estimate total measure benefit
Y Y Y Y
Table 17 provides general guidance on how to quantitatively calculate benefits from efforts to address climate stressors See Section IIIE for more information
NYC Mayorrsquos Office of Recovery and Resiliency Climate Resiliency Design Guidelines
50APPENDIX 4 - PROJECT BENEFITS CATEGORIES
Table 17 ndash Guidance on quantitative unit benefit calculations for extreme heat hazard measures
Measure General Guidance ndash Unit Benefit Information and Data Requirements
Applicable Benefit Category
Applicable Typical Facility Typology
Dire
ct B
enefi
ts
Indi
rect
Ben
efits
Oth
er P
oten
tial
Ben
efits
Bui
ldin
g St
ruct
ures
Com
plex
Fa
cilit
ies
Tran
spor
tatio
nSt
reet
scap
es
Plaz
as
Park
Fea
ture
s
Tree Planting
bull Unit benefit range over PUL = $1005 to $77154Tree ($1855Tree standard value)
bull Assumed PUL = 30 yearsbull Apply standard value unit benefit to number of
trees to estimate total measure benefitbull Higher range values more applicable
to residential and commercial building streetscape projects
Y Y Y Y Y Y
Planter Box Tree
bull Unit benefit range over PUL = $212 to 16304Tree ($392Tree standard value)
bull Assumed PUL = 15 yearsbull Apply standard value unit benefit to number of
trees to estimate total measure benefitbull Higher range values more applicable
to residential and commercial building streetscape projects
Y Y Y Y Y
Shade Canopy
bull Unit benefit range over PUL = $0363 to $396SF ($0458SF standard value)
bull Assumed PUL = 15 yearsbull Apply standard value unit benefit to area of
shade canopy estimate total measure benefitbull Higher range values more applicable
to residential and commercial building streetscape projects
Y Y Y Y
Permeable Grass Pavers
bull Unit benefit range over PUL = $0258SF to $0521SF of pavers ($0363SF standard value)
bull Assumed PUL = 30 yearsbull Apply standard value unit benefit to paver
area to estimate total measure benefit
Y Y Y Y Y
For the purposes of the BCA refer to the following facility typologies bull ldquoBuilding Structuresrdquo include critical small building sites such as EMS or FDNY stations and non-critical small building sites such as
libraries or comfort stationsbull ldquoComplex Facilitiesrdquo include critical infrastructure such as wastewater treatment sites pump stations water filtration plants and similar
large or complex facilitiesbull ldquoTransportationStreetscapePlazasrdquo include roadway reconstruction streetscape improvements street raising plazas and other
transportation-related infrastructurebull ldquoPark Featuresrdquo include parks and similar public recreational facility with natural landscape features
NYC Mayorrsquos Office of Recovery and Resiliency Climate Resiliency Design Guidelines
51APPENDIX 5 - EXAMPLE PLANNING DECISION TREE
This decision tree provides a summarized example approach for how to implement these Guidelines Projects with a total cost greater than $50 million are recommended to conduct a full qualitative and quantitative climate change risk assessment and BCA while projects below $50 million are recommended to conduct a qualitative risk assessment and BCA
Define Project
1) Operational goals and criticality level2) Useful life3) Location in the current flood plain future floodplain and or zone
of tidal inundation and the project arearsquos score on the heat vulnerability index
Evaluate Project Risks According to Probability and Magnitude of Consequence
bull Extreme Heat bull Precipitationbull Sea Level Risebull Coastal Surge
High Level Identification and Assessment of Risk Mitigation Alternatives and Co-benefits
(qualitative)
Detailed Identification and Assessment of Risk Mitigation Alternatives and Co-benefits (qualitative and quantitative)
High Level Estimate of Costs and Benefits of Design Alternatives
(qualitative)
Detailed Estimate of Costs and Benefits of Design Alternatives
(qualitative and quantitative)
Decision Point Which climate change risks require mitigation
Decision Point Evaluate risk mitigation benefits and costs to
determine final resilient design alternative or if no action is required
Decision Point Is the total project cost above $50 million
Below $50 million Above $50 million
APPENDIX 5 - EXAMPLE PLANNING DECISION TREE
NYC Mayorrsquos Office of Recovery and Resiliency Climate Resiliency Design Guidelines
52
Project Title
Design Strategies Checklist (not exhaustive)
Extreme Heat Comments Extreme Precipitation Comments Sea Level Rise amp Storm Surge Comments
Select Site in Low Heat Vulnerability Index area Select High Elevation Site Select High Elevation Site
Minimize East-West Building Orientation Green Roof Raise Building Floor Elevation
Passive Solar Cooling and Ventilation Systems
Protect Below Grade Areas from Flooding Waterproof Building Envelope
Cool Roof (SRI appropriate) On-site Stormwater Management (gray) Elevate Critical Building Functions
Green Roof (extensive) Reduce Impervious Areas Elevate Critical Equipment
Vegetative Structures Permeable Pavement Perimeter Floodwall100 Levee (passive or active)
Enhanced HVAC System including space layout optimization and system scalability
Increase Green Spaces and Planted Areas DryWet Floodproofing
More Efficient Building Envelope Other Utility Redundancy Design101
Parking Lot Shading Resilient Materials amp Landscape Treatments
Light Colored Pavements (appropriate SRI) Design for Storm Surge Outflow
Increase Planted Areas Install Backwater Flow Prevention
Permeable Surfaces Design for Scour
Open-grid Pavement Raise Road Elevation
Other Other
This appendix provides a template for identifying possible design strategies to address climate change risks as described throughout the Guidelines
APPENDIX 6 - DESIGN STRATEGIES CHECKLIST
100 Permanent perimeter flood walls are not permitted to meet floodproofing requirements in buildings with substantial improvements andor damages 101 Utility redundancy design should be pursued for critical systems not all building systems
APPENDIX 6 - DESIGN STRATEGIES CHECKLIST
NYC Mayorrsquos Office of Recovery and Resiliency Climate Resiliency Design Guidelines
53APPENDIX 7 - CLIMATE CHANGE RISK ASSESSMENT RESOURCES
These Guidelines provide data on climate change hazards and recommend how that data can inform resilient design A risk assessment is a tool to help project managers and designers evaluate risk levels as well as select and prioritize resilient design strategies A high level risk assessment is recommended for all City capital projects with a total cost of under $50 million Projects above $50 million are recommended to conduct an in-depth assessment
Risk assessments use quantified estimates of the probability and magnitude of consequence of an event occurring to prioritize responses ldquoProbabilityrdquo is an assessment of the likelihood of a hazard occurring while ldquomagnituderdquo describes the hazardrsquos potential impact Risk assessment tools such as the examples listed below can be used to define and score these categories Projects that score higher across both probability and magnitude can be prioritized for investment and risk mitigation action Projects that score lower across both criteria may require no action beyond meeting code The results are typically charted on a risk matrix and an example is provided on the next page
The climate change risk management frameworks below offer templates for how to integrate climate change projections into a risk assessment process Refer to these resources for examples and further information
bull Vulnerability Assessment and Adaptation Framework is prepared by the Federal Highway Administration (FHWA) While developed for transportation planning this risk assessment framework has broad applicability for evaluating asset vulnerability to climate change Available at httpswwwfhwadotgovenvironmentsustainabilityresilienceadaptation_framework
bull US Climate Resilience Toolkit The US Global Change Research Program offers a step by step risk assessment
framework including tools and case studies at httpstoolkitclimategovsteps (see example on next page)
bull Coast Adapt Guidance on undertaking a risk assessment High level assessment httpscoastadaptcomausitesdefaultfilesfactsheetsT3M4_2_2nd_pass_risk_assessmentpdfDetailed assessment httpscoastadaptcomausitesdefaultfilesfactsheetsT3M4_3_3rd_pass_risk_assessmentpdf
bull Climate adaptation Risk uncertainty and decision-makingDownload the report here httpswwwukciporgukpublicationsRisk
The City plans to develop a NYC-specific process for integrating climate change data into existing risk management processes by April 2019
APPENDIX 7 - CLIMATE CHANGE RISK ASSESSMENT RESOURCES
NYC Mayorrsquos Office of Recovery and Resiliency Climate Resiliency Design Guidelines
54APPENDIX 7 - CLIMATE CHANGE RISK ASSESSMENT RESOURCES
The Risk Characterization Matrix below is an example from the US Climate Resilience Toolkit This tool can be used to assess the probability and magnitude of impact for identified risks The risk of coincident climate stressorsrisks (such as storm surge plus increased precipitation) can also be assessed as applicable
Figure 14 - Example of a climate change risk matrix (adapted from US Climate Resilience Toolkit)
Project teams can determine the magnitude of the impact (along the horizontal scale of 1 through 3 with 3 being the most severe) and the probabilitylikelihood of occurrence for each specific risk (along the vertical scale with 3 being the most likely) A score is typically assigned for each risk (Probabil-ity x Magnitude) and then charted on the matrix Based on the estimated probability and magnitude of consequence above the risks are ranked and prioritized for mitigation Factors to bear in mind include
bull Not all facility typologies have the same level of functional and operational importance during events or tolerance for disruption
bull Not all climate stressors and risks have the same level of impact on each project sitebull Not all identified risks can or should be mitigated fully
NYC Mayorrsquos Office of Recovery and Resiliency Climate Resiliency Design Guidelines
55WORKS CITED
A Stronger More Resilient New York PlaNYC Report of the NYC Special Initiative for Rebuilding and Resiliency The City of New York 2013
ldquoAccount for Climate Riskrdquo International Finance Corporation accessed March 27 2017 httpwwwifcorgwpswcmconnectTopics_Ext_ContentIFC_External_Corporate_SiteClimate+Business
PrioritiesAccount+for+Climate+Risk
American Society of Heating Refrigeration and Air-Conditioning Engineers (ASHRAE) Handbook -Fundamentals 2017
ldquoBaseline Standard Economic Value Methodology Reportrdquo Federal Emergency Management Agency July 2016
Benefit Cost Analysis Toolkit Software Version 530 Federal Emergency Management Agency (build date December 2016)
Criteria for Detention Facility Design New York City Department of Environmental Protection November 2012
Community Resilience Planning Guide for Buildings and Infrastructure Systems Vol 1 NIST Special Publication 1190 US Department of Commerce 2016
Cool and Green Roofing Manual NYC Department of Design and Construction 2007 httpwwwnycgovhtmlddcdownloadspdfcool_green_roof_manpdf
Building Resiliency Task Force US Urban Green Building Council New York 2013 httpurbangreencouncilforcecomBuildingResiliency
Design and Planning for Flood Resiliency Guidelines for NYC Parks New York City Department of Parks and Recreation 2017
httpswwwnycgovparksorgplanning-and-buildingplanningresiliency-plansflood-resiliency
Flooded Bus Barns and Buckled Rails Federal Transit Administration Office of Budget and Policy 2011 httpswwwhsdlorgabstractampdid=685187
Floodproofing Non-Residential Buildings FEMA P936 FEMA 2013 httpswwwfemagovmedia-library-data9a50c534fc5895799321dcdd4b6083e7P-936_8-20-13_508rpdf
ldquoGlossaryrdquo International Infrastructure Management Manual National Asset Management Support Group New Zealand 2011 httpwwwipweaorg
ldquoGreen Roof Metrics Draft Reportrdquo New York City Department of Parks and Recreation 2017
ldquoGuide to Rain Event Preparednessrdquo NYC Department of Environmental Protection httpwwwnycgovhtmldeppdfbrochuresflood-preparedness-flyerpdf
ldquoGuidelines and Discount Rates for Benefit-Cost Analysis of Federal Programsrdquo Appendix C Circular A-94 US Office of Management and Budget (OMB) 2017
ldquoGuidelines for the Design and Construction of Stormwater Management Systemsrdquo New York City Department of Environmental Protection July 2012
Horton R et al New York City Panel on Climate Change 2015 Report Ann NY Acad Sci ISSN 0077-892 New York 2015
Madrigano J et al ldquoA case-only study of vulnerability to heat wavendashrelated mortality in New York City (2000ndash2011)rdquo Environmental Health Perspectives 123672ndash678 2013
WORKS CITED
NYC Mayorrsquos Office of Recovery and Resiliency Climate Resiliency Design Guidelines
56WORKS CITED
enspMcGregor et al Two Degrees The Built Environment and Our Changing Climate Routledge Press 2013
NYC Green Codes Task Force US Green Building Council New York 2010 httpurbangreencouncilorgGreenCodes
NYCrsquos Risk Landscape A Guide to Hazard Mitigation NYC Emergency Management 2014
One New York The Plan for a Strong and Just City The City of New York 2015 httpwwwnycgovhtmlonenyc downloadspdfpublicationsOneNYCpdf
Ready to Respond Strategies for Multifamily Building Resilience Enterprise Green Communities 2015 httpswwwenterprisecommunityorgresources
Rosenzweig C et al Climate Change Adaptation in New York City Building a Risk Management Response New York City Panel on Climate Change 2010
httponlinelibrarywileycomdoi101111nyas20101196issue-1 issuetoc
ldquoSustainable Infrastructure Management Program Learning Environmentrdquo Water Environment Research Foundation accessed March 24 2017 httpsimplewerforg
Urban Waterfront Adaptive Strategies NYC Department of City Planning 2013 httpwww1nycgovsiteplanningplanssustainable-communitiesclimate-resiliencepagetab=1
Wastewater Resiliency Plan Climate Risk Assessment and Adaptation Study New York City Department of Environmental Protection October 2013

NYC Mayorrsquos Office of Recovery and Resiliency Climate Resiliency Design Guidelines
35
APPENDICES
NYC Mayorrsquos Office of Recovery and Resiliency Climate Resiliency Design Guidelines
36APPENDIX 1 ndash KEY TERMS
100-year flood (1 annual chance flood)
A flood that has a 1 probability of occurring in any given year The 100-year floodplain is the extent of the area of a flood that has a 1 chance of occurring or being exceeded in any given year
500-year flood (02 annual chance flood)
A flood that has a 02 probability of occurring in any given year The 500-year floodplain is the extent of the area of a flood that has a 02 chance of occurring or being exceeded in any given year
AdaptationAdjustment in natural or human systems to a new or changing environment that seeks to maximize beneficial opportunities or moderate negative effects Successful adaptations contribute to resiliency
Base flood elevation (BFE)The elevation of surface water resulting from a flood that has a 1 annual chance of occurring or being exceeded in any given year The BFE is shown on the Flood Insurance Rate Map (FIRM)69
BluebeltReference to the Department of Environmental Protectionrsquos (DEP) Bluebelt program to preserve natural drainage corridors including streams ponds and other wetland areas Preservation of these wetland systems allows them to perform their functions of conveying storing and filtering storm water
Climate
The average weather (or more rigorously a statistical description of the average in terms of the mean and variability) over a period of time usually 30 years These quantities are most often surface variables such as temperature precipitation and wind Climate in a wider sense is the state including a statistical description of the climate system70
Climate change
Changes in average weather conditions that persist over multiple decades or longer Climate change encompasses both increases and decreases in temperature as well as shifts in precipitation changing risk of certain types of severe weather events and changes to other variables of the climate system
Climate change riskThe chance that investments (such as in capital projects) can be affected by the physical impacts of climate change71 Risks are evaluated as a product of the probability of occurrence and the magnitude of damages or impacts including socioeconomic factors that would result if they did occur (consequences)
Climate change risk assessment
This assessment involves a detailed project-specific analysis that includes a vulnerability and risk assessment often followed by cost-benefit analysis to assess and select investments in climate change risk mitigation Risk is assessed as a function of the magnitude and probability of a given climate change hazard Examples resources are included in Appendix 7
Climate vulnerabilityThe degree to which systems and populations are affected by adverse impacts It is a function of the character magnitude and rate of climate change and variation to which a system is exposed its sensitivity and its adaptive capacity72
Cloudburst An extreme amount of rain in a short period of time often over a small geographic area73
Cooling Degree Day (CDD) A form of degree-day used to estimate the energy requirements for air conditioning or refrigeration when the daily mean temperature is above 65degF
68 All terms are from the US Global Change Research Program (USGCRP) glossary unless otherwise noted The USGCRP glossary is available at httpwwwglobalchangegovclimate-changeglossary
69 ldquoDefinitionsrdquo FEMA last modified March 1 2017 httpswwwfemagovnational-flood-insurance-programdefinitions70 UKCIP Glossary httpwwwukciporgukglossary71 ldquoAccount for Climate Riskrdquo International Finance Corporation 72 UKCIP Glossary httpwwwukciporgukglossary73 New York City Environmental Protection ldquoCloudburst Resiliency Planning Studyrdquo 2017 Available at httpwwwnycgovhtmldeppdfclimatenyc-cloudburst-studypdf
APPENDIX 1 - KEY TERMS68
NYC Mayorrsquos Office of Recovery and Resiliency Climate Resiliency Design Guidelines
37APPENDIX 1 ndash KEY TERMS
Design life The life expectancy of an asset or product as determined during design74 As opposed to useful life (see below)
Dry Bulb temperature The ambient air temperature measured by a thermometer
Extreme eventUnexpected unusual or unpredictable weather or flooding compared to historical or future projected distribution Extreme events include for example heat waves cold waves heavy rains periods of drought and flooding and severe storms
Facilities For the purposes of this document ldquofacilitiesrdquo refers to all types of buildings housing infrastructure structures and landscape features designed by or for the City of New York
Flexible adaptation pathwayResilience-building strategies that can evolve or be adapted over time as climate change risk assessments evaluations of adaptation strategies and monitoring continue75
Flood Insurance Rate Maps (FIRM)
Official flood map of a community on which FEMA has delineated the 1 annual chance floodplain and the base flood elevations (BFEs) applicable to the community76 The FIRM also includes the 02 floodplain annual chance floodplain and differentiates between special flood hazard areas (V A Coast A zones) and floodways The official FIRM is from the year 2007 while the 2015 PFIRM is currently required by NYC Building Code to calculate design flood elevations NYC DOB references the more restrictive of the two maps in both base flood elevation and flood hazard area (ie V versus A zone) Refer to Appendix 3 for more information
FreeboardAn additional amount of height above the base flood elevation used as a factor of safety (eg two feet above the base flood) in determining the level at which a facilitys lowest floor must be elevated or floodproofed to be in accordance with state or community floodplain management regulations77
Future time slices
Future periods defined by the NPCC for when climate change projections are available In this document the following decadal projections are associated with specific time spans2020s projection = present to 20392050s projection = 2040 to 20592080s projection = 2070 to 20992100s projection = end of century and beyond
Green infrastructureAn array of practices that use or mimic natural systems to manage urban stormwater runoff Water is either directed to engineered systems for infiltration or detained for longer periods before it enters the sewer system
Heat Vulnerability Index (HVI)Summarizes relative risk of adverse health effects from heat due to social and environmental factors Used to identify neighborhoods at higher risk during and after extreme heat events
Heat wave A period of three consecutive days where temperatures rise above 90degF or two consecutive days over 95 degrees78
New York City Panel on Climate Change (NPCC)
The body of leading climate and social scientists charged with making climate change projections for the metropolitan region79
74 Sustainable Infrastructure Management Program Learning Environment httpsimplewerforg 75 Rosenzweig C et al Climate Change Adaptation in New York City Building a Risk Management Response76 ldquoDefinitionsrdquo FEMA77 Ibid78 Horton R et al New York City Panel on Climate Change 2015 Report Chapter 1 Climate Observations and Projections Ann NY
Acad Sci ISSN 0077-8923 (New York 2015) 2579 For more information on the NPCC visit www1nycgovsiteorrchallengesnyc-panel-on-climate-changepage
NYC Mayorrsquos Office of Recovery and Resiliency Climate Resiliency Design Guidelines
38APPENDIX 1 ndash KEY TERMS
Open-grid pavement system
Pavements that consist of loose substrates supported by a grid of a more structurally sound grid or webbing Unbounded loose substrates in these systems transfer and store less heat than bound and compacted pavements and aid permeability Pavement is 50 pervious and contains vegetation in the open cells designed to allow percolation or infiltration of storm water through the surface into the soil below80
Preliminary Flood Insurance Rate Map (PFIRM)
Preliminary flood map developed by FEMA in 2015 for New York City that provides projected risks for flood hazards81 Refer to Appendix 3 for more information
Project useful life (PUL)
The period over which an asset or component is expected to be available for use by an entity This depends on regular and adequate maintenance This period of time typically exceeds the design life (see above) The combined effect of operational requirements and useful life is practical in assessing an investment in improving resilience82
Rain gardenAlso called ldquobioswalerdquo Planted areas designed to collect and manage stormwater that runs off streets sidewalks commercial and residential rooftops and other sources when it rains
Resiliency The ability to bounce back after change or adversity The capability of preparing for responding to and recovering from difficult conditions83
Sea level rise-adjusted design flood elevation
As defined in these Guidelines the increased height of the base flood elevation due to sea level rise plus freeboard depending on the criticality of the facility The sea level rise adjustment depends on the useful life of the facility
Storm surge An abnormal rise of water generated by a storm over and above predicted astronomical tides84
Substantial improvementAny repair reconstruction rehabilitation addition or improvement of a building or structure the cost which equals or exceeds 50 of the market value of the structure before the improvement or repairs started For more information see Appendix G of the NYC Building Code and 1 RCNY sect3606-0185
Tidal inundation Flooding which occurs at high tides due to climate-related sea level rise land subsidence andor the loss of natural barriers86
Urban Heat Island (UHI) effectThe tendency for higher air temperatures to persist in urban areas as a result of heat absorbed and emitted by buildings and asphalt tending to make cities warmer than the surrounding suburban and rural areas
Weather The state of the atmosphere at a given time with regard to temperature cloudiness precipitation wind and other meteorological conditions87
Wet Bulb temperatureThe temperature indicated when a thermometer bulb is covered with a water-saturated wick over which air is caused to flow at approximately 45 ms (900 ftmin) to reach the equilibrium temperature of water evaporating into the air when the heat of vaporization is supplied by the sensible heat of the air88
80 ldquoGlossaryrdquo US Green Building Council (2017) Available at httpwwwusgbcorgglossaryterm552581 ldquoPreliminary FEMA Map Productsrdquo FEMA Map Service Center Available at httpshazardsfemagovfemaportalprelimdownload82 ldquoGlossaryrdquo International Infrastructure Management Manual (2011) 83 A Stronger More Resilient New York (2013) 184 ldquoStorm Surge Overviewrdquo National Hurricane Center NOAA Available at httpswwwnhcnoaagovsurge85 ldquoFlood Resistant Constructionrdquo Appendix G New York City Building Code (2008) and 1 RCNY sect3606-01 available at httpswww1nycgovassetsbuildingsrules1_RCNY_3606-01pdf86 ldquoOcean Factsrdquo National Ocean Service NOAA Available at httpoceanservicenoaagovfactsnuisance-floodinghtml 87 UKCIP Glossary httpwwwukciporgukglossary88 ldquoASHRAE Terminologyrdquo ASHRAE Available at httpswwwashraeorgtechnical-resourcesauthoring-toolsterminology
NYC Mayorrsquos Office of Recovery and Resiliency Climate Resiliency Design Guidelines
39APPENDIX 2 - CLIMATE CHANGE PROJECTIONS
Climate change projections are provided by the New York City Panel on Climate Change (NPCC) The full NPCC report is available from the New York Academy of Sciences89 Tables 8-10 (below) were reproduced directly from the NPCC report while Table 2 (see Section IIA) was developed using the data underlying the NPCC report to inform the design of HVAC systems under warmer conditions
Table 8 ndash NYC sea level rise projections90
Baseline (2000-2004) 0 in
Low estimate (10th percentile)
Middle range (25th to 75th percentile)
High estimate (90th percentile)
2020s 2 in 4-8 in 10 in
2050s 8 in 11-21 in 30 in
2080s 13 in 18-39 in 58 in
2100 15 in 22-50 in 75 in
Note Projections are based on six-component approach that incorporates both local and global factors The model-based components are from 24 global climate models and two representative concentration pathways Projections are relative to the 2000-2004 base period
Table 9 ndash Mean annual changes91
a Temperature Baseline(1971-2000) 54degF
Low estimate (10th percentile)
Middle range (25th to 75th percentile)
High estimate (90th percentile)
2020s + 15degF +20-29degF +32degF
2050s +31degF +41-57degF +66degF
2080s +38degF +53-88degF +103degF
2100 +42degF +58-104degF +121F
b Precipitation Baseline(1971-2000) 501 in
Low estimate (10th percentile)
Middle range (25th to 75th percentile)
High estimate (90th percentile)
2020s -1 percent +1-8 +10
2050s +1 percent +4-11 +13
2080s +2 percent +5-13 +19
2100 -6 percent -1 to +19 +25
Note Based on 35 global climate models (GCMs) and two RCPs Baseline data cover the 1971ndash2000 base period and are from the NOAA National Climatic Data Center (NCDC) Shown are the low estimate (10th percentile) middle range (25th percentile to 75th percentile) and high estimate (90th percentile) These estimates are based on a ranking (from most to least) of the 70 (35 GCMs times 2 RCPs) projections The 90th percentile is defined as the value that 90 percent of the outcomes (or 63 of the 70 values) are the same or lower than Like all projections the NPCC climate change projections have uncertainty embedded within them Sources of uncertainty include data and modeling constraints the random nature of some parts of the climate system and limited understanding of some physical processes The NPCC characterizes levels of uncertainty using state-of-the-art climate models multiple scenarios of future greenhouse gas concentrations and recent peer-reviewed literature Even so the projections are not true probabilities and the potential for error should be acknowledged
89 The NPCC 2015 report is available at httponlinelibrarywileycomdoi101111nyas20151336issue-1issuetoc90 From New York City Panel on Climate Change 2015 Report Chapter 1 Climate Observations and Projections page 4191 From New York City Panel on Climate Change 2015 Report Chapter 1 Climate Observations and Projections page 30
APPENDIX 2 - CLIMATE CHANGE PROJECTIONS
NYC Mayorrsquos Office of Recovery and Resiliency Climate Resiliency Design Guidelines
40APPENDIX 2 - CLIMATE CHANGE PROJECTIONS
Table 10 ndash Extreme events92
2020s Baseline (1971-2000)
Low estimate(10th percentile)
Middle range(25th to 75th percentile)
High estimate (90th percentile)
Numbers of heat waves per year 2 3 3-4 4
Average heat wave duration (days) 4 5 5 5
Number of days per year with
Maximum temperature at or above 90degF 18 24 26-31 33
Maximum temperature at or above 100degF 04 07 1-2 2
Minimum temperature at or below 32degF 71 50 52-58 60
Rainfall at or above 1 inch 13 13 14-15 16
Rainfall at or above 2 inches 3 3 3-4 5
Rainfall at or above 4 inches 03 02 03ndash04 05
2050s Baseline (1971-2000)
Low estimate(10th percentile)
Middle range(25th to 75th percentile)
High estimate (90th percentile)
Numbers of heat waves per year 2 4 5-7 7
Average heat wave duration (days) 4 5 5-6 6
Number of days per year with
Maximum temperature at or above 90degF 18 32 39-52 57
Maximum temperature at or above 100degF 04 2 3-5 7
Minimum temperature at or below 32degF 71 37 42-48 52
Rainfall at or above 1 inch 13 13 14-16 17
Rainfall at or above 2 inches 3 3 4-4 5
Rainfall at or above 4 inches 03 03 03-04 05
2080s Baseline (1971-2000)
Low estimate(10th percentile)
Middle range(25th to 75th percentile)
High estimate (90th percentile)
Numbers of heat waves per year 2 5 6-9 9
Average heat wave duration (days) 4 5 5-7 8
Number of days per year with
Maximum temperature at or above 90degF 18 38 44-76 87
Maximum temperature at or above 100degF 04 2 4-14 20
Minimum temperature at or below 32degF 71 25 30-42 49
Rainfall at or above 1 inch 13 14 15-17 18
Rainfall at or above 2 inches 3 3 4-5 5
Rainfall at or above 4 inches 03 02 03-05 07
Note Projections for temperature and precipitation are based on 35 GCMs and 2 RCPs Baseline data are for the 1971 to 2000 base period and are from the NOAA National Climatic Data Center (NCDC) Shown are the low estimate (10th percentile) middle range (25th to 75th percentile) and high estimate (90th percentile) 30-year mean values from model-based outcomes Decimal places are shown for values less than one although this does not indicate higher precisioncertainty Heat waves are defined as three or more consecutive days with maximum temperatures at or above 90degF Like all projections the NPCC climate change projections have uncertainty embedded within them Sources of uncertainty include data and modeling constraints the random nature of some parts of the climate system and limited understanding of some physical processes The NPCC characterizes levels of uncertainty using state-of-the-art climate models multiple scenarios of future greenhouse gas concentrations and recent peer-reviewed literature Even so the projections are not true probabilities and the potential for error should be acknowledged
92 From New York City Panel on Climate Change 2015 Report Chapter 1 Climate Observations and Projections page 31
NYC Mayorrsquos Office of Recovery and Resiliency Climate Resiliency Design Guidelines
41APPENDIX 3 - DIFFERENTIATION OF FLOOD MAPS
These Guidelines reference several different kinds of flood maps and sources of design flood elevations These maps are described and differentiated below
Table 11 - Differentiation of flood maps used in NYC
Reference Title Data Source Information Provided Referenced By Link
2007 FIRM FEMA
Based on historical data from before 1983 identifies the current base flood (extent and elevation) as the flood that has a 1 chance of occurring in any given year also known as a 100-year flood The NYC Building Code requires that either the 2007 FIRM or 2015 PFIRM elevation be used whichever is higher
2014 NYC Building Code Appendix G
Climate Resiliency Design Guidelines
httpsmscfemagovportal
2015 PFIRM FEMA
Based on historical data identifies the current base flood (extents and elevation) as the flood that has a 1 chance of occurring in any given year also known as a 100-year flood The NYC Building Code requires that either the 2007 FIRM or 2015 PFIRM elevation be used whichever is higher The 2015 PFIRM is currently being reassessed by FEMA
2014 NYC Building Code Appendix G
Climate Resiliency Design Guidelines
httpshazardsfemagovfemaportalprelimdownload
httpwwwregion2coastalcomview-flood-maps-dataview-preliminary-flood-map-data
NYC Flood Hazard Mapper
NYC Department of City Planning
Maps current and future flood hazards in NYC including the following data layers 2007 FIRM and 2015 PFIRM high tide with sea level rise and PFIRM with sea level rise through 2100
Climate Resiliency Design Guidelines
Waterfront Revitalization Plan
httpwww1nycgovsiteplanningdata-mapsflood-hazard-mapperpage
ldquoTable 4 ndash Determine the sea level rise-adjusted design flood elevation for critical and non-critical facilitiesrdquo
ORR amp NPCC
Provides data to use when adding sea level rise to a given 2015 PFIRM or 2007 FIRM Base Flood Elevation (BFE) to calculate a Design Flood Elevation (DFE) Based on the criticality and expected useful life of a facility
Climate Resiliency Design Guidelines
See Section II on ldquoSea Level Riserdquo above
APPENDIX 3 - DIFFERENTIATION OF FLOOD MAPS
NYC Mayorrsquos Office of Recovery and Resiliency Climate Resiliency Design Guidelines
42APPENDIX 4 - PROJECT BENEFITS CATEGORIES
This appendix provides guidance on how to identify and assess benefits as a supplement to Sections IIID and IIIE
Table 12 lists typical direct benefits for reducing impacts from climate stressors and basic guidance for how to estimate them See Section IIID for more information
Table 13 lists typical indirect benefits for reducing impacts from climate stressors and basic guidance for how to estimate them See Section IIID for more information
Table 12 ndash Direct benefits for (1) sea level rise with coastal storm surge and (2) increased precipitation measures
Direct Benefit Basic Guidance for Estimating Values
Physical Damages (Structure Contents)
bull For flood-damaged buildings use depth damage functions developed by FEMA and USACE for structures and contents
bull Use depth damage functions in conjunction with Building Replacement Values (BRVs) and not market values BRVs typically range between $100 to $325SF for residential buildings and $120 to $450SF for commercial public buildings
bull For more complex structures or facilities use engineering estimates of flood damages or review historic flood damages documented from insurance claims repair records or FEMA Public Assistance claims from recent flood disasters
Residential Displacements
bull For flood-damaged buildings use depth damage functions developed by FEMA and USACE for residential displacements
Reduced Life CycleOperation and Maintenance (OampM) Costs93
bull Applicable only to projects that reduce overall life cycle costs or net annual OampM costs from baseline conditions
bull Input reduced annual OampM costs as a project benefit at a 1-year recurrence intervalbull Reduced overall life cycle costs can be input as a longer project useful life
Table 13 ndash Indirect benefits for (1) sea level rise with coastal storm surge and (2) increased precipitation measures
Indirect Benefit Basic Guidance for Estimating Values
Non-Residential Building Service Losses
bull Estimate service loss values and durations for non-residential buildings public buildings critical facilities and parksnatural features based on FEMA BCA guidance and standard values based on building use
Utility Service Losses94
bull Estimate utility service losses for water wastewater and electrical facilities based on the number of impacted customers FEMA per capita standard values for utility service ($105personday for potable water $49personday for wastewater $148personday for electrical)95
bull Estimate utility service loss durations based on engineering estimates or review historic flood damages losses documented from utility company records
bull This benefit can also apply to measures that increase energy efficiency
RoadBridge Service Losses
bull Estimate roadbridge service losses based on the average daily traffic (ADT) detour time and additional travel distance and FEMA and GSA standard values for road service ($3344vehiclehour of delay $0545mile)96
bull Estimate roadbridge service loss durations or review historic flood damages losses
Emergency Service Losses
bull Applicable only to projects that reduce or eliminate documented emergency service costs from baseline conditions
bull Examples of avoided emergency services costs include NYPD staffing to monitor barricades for flooded roads or NFDY staffing for water rescues of residents from flooded buildings or streets
APPENDIX 4 - PROJECT BENEFITS CATEGORIES
93 Reduced life cycle costs may be applicable to some measures that provide extreme heat benefits such as green roofs that can last longer than a standard roof if properly maintained
94 Reduced utility service costs may be applicable to some measures that provide extreme heat benefits such as cool roofs green roofs and shade trees
95 FEMA per capita standard values taken from FEMA BCA Toolkit Version 530 (Build Date 12222016) and developed in FEMArsquos Baseline Standard Economic Value Methodology Report (July 28 2016) Consider updating FEMA standard per capita values to reflect current New York City utility rates
96 Consider updating FEMA and GSA standard values to reflect current New York City area labor rates and fuel costs
NYC Mayorrsquos Office of Recovery and Resiliency Climate Resiliency Design Guidelines
43APPENDIX 4 - PROJECT BENEFITS CATEGORIES
Table 14 ndash Other potential benefits for (1) sea level rise with coastal storm surge and (2) increased precipitation measures
Other Benefit Basic Guidance for Estimating Values
Avoided Stress and Anxiety
bull Applicable only for projects that directly benefit occupants of residential structuresbull Use FEMA standard value for avoided mental stress and anxiety treatment costs of $2443person to
estimate benefit for all impacted residents97
Avoided Lost Productivity
bull Applicable only for projects that directly benefit occupants of residential structuresbull Use FEMA standard value for avoided lost worker productivity costs of $8736household to estimate
benefit for all impacted workers (conservatively assuming one worker per household)
Environmental Open Space
bull Applicable only for projects that create or acquire open space areas by acquisitionbull Use FEMA standard value for environmental open space based on the type of land acquired ($8308
Acreyear for Green open space $39545Acreyear for Riparian $6010Acreyear for Wetlands $554Acreyear for Forests $1799Year for Marine and estuary)97
CSO Volume Reduction
bull Applicable only for projects that provide Combined Sewer Overflow (CSO) abatement by reducing the volume of rainfall runoff
bull Use CSO abatement cost of $0015gallonsyear applied to increased precipitation hazard runoff volume for 5-year design storm98
Ecosystem Service99
bull Add stormwater management benefits of green infrastructure projects to increased precipitation hazards where avoided damages and service losses are not quantified
bull Unit benefits applicable to increased precipitation hazard includeo Green roofs $0133SFyear (PUL 40 years)o BioswaleRain GardenMeadow Mix $0020SFyear (PUL 30 years)o Permeable Grass Pavers $0020SFyear (PUL 30 years)o Tree Plantings $303Treeyear (PUL 30 years)o Planter Box Trees $101Treeyear (PUL 15 years)
Real Estate99
bull Potential real estate benefits from increased resilience of residential andor commercial propertiesstreetscapesneighborhoods included within the project scope
bull Benefit applied to extreme heat hazard for green infrastructure projects directly impacting residential or commercial properties
Quality of Life Health Benefits99
bull Potential quality of life benefits related to improved public health from the resilience measures included within the project scope
bull Benefit applied to extreme heat hazard for green infrastructure projects directly impacting residential or commercial properties
Table 14 lists other typical benefits for reducing impacts from climate stressors and basic guidance for how to estimate them See Section IIID for more information
97 FEMA standard values for avoided mental stress and anxiety and environmental open space values taken from FEMA BCA Toolkit Version 530 (Build Date 12222016)
98 CSO abatement cost taken from APG1 Report for NYC ldquoTechnical Approaches for Benefit-Cost Analysis of Hazard Mitigation Projects in Urban and Coastal Environmentsrdquo (April 2016)
99 Ecosystem Services Real Estate and Quality of LifeHealth benefits tend to be more applicable to green infrastructure measures that provide extreme heat benefits such as green roofs trees and other plantings
NYC Mayorrsquos Office of Recovery and Resiliency Climate Resiliency Design Guidelines
44APPENDIX 4 - PROJECT BENEFITS CATEGORIES
Table 15 ndash Potential benefits for extreme heat (Urban Heat Island) reduction measures
Category Benefit Basic Guidance for Estimating Values
Direct Benefit
Reduced Life Cycle Cost
bull Applicable only to measures such as green roofs that are expected to last longer than standard roofs
bull Compute total cost savings including annual OampM costs
Indirect Benefit
Energy Savings
bull Applicable to measures that reduce energy costs by providing cooling through increased shading andor evapotranspiration
bull Use New York Power Authority rates of $0148kWh for electricity and $0810Therm for natural gas
Other Potential Benefits
Air Quality bull Applicable to measures that absorb pollutants andor reduce carbon dioxide emissions
Acoustics bull Applicable to measures such as green roof or walls that reduce noise transfer
Quality of LifeHealth bull Potential quality of life benefits and related to improved public health
Real Estate bull Applicable to measures that provide residential real estate benefits from increased resilience of propertiesstreetscapesneighborhoods
Retail Sales Marketing
bull Applicable to measures that provide commercial property benefits from increased aesthetics resulting in increased marketing and sales for streetscapesneighborhoods
Tax Credits Incentives
bull Applicable to resilience or green infrastructure measures such as green roofs that have accompanying Federal State or City tax credits or other incentives
Table 15 lists potential benefits for reducing impacts from heat and basic guidance for how to estimate them See Section IIID for more information
NYC Mayorrsquos Office of Recovery and Resiliency Climate Resiliency Design Guidelines
45APPENDIX 4 - PROJECT BENEFITS CATEGORIES
Table 16 ndash Guidance on quantitative calculations for (1) sea level rise with coastal storm surge and (2) increased precipitation measures
Data Input General Guidance ndash Basic Description
Applicable Benefit Category
Applicable Typical Facility Typology
Dire
ct B
enefi
ts
Indi
rect
Ben
efits
Oth
er P
oten
tial
Ben
efits
Bui
ldin
g St
ruct
ures
Com
plex
Fa
cilit
ies
Tran
spor
tatio
nSt
reet
scap
es
Plaz
as
Park
Fea
ture
s
First Floor Elevation (FFE)
bull The elevation of the first finished floor of the structure excluding basements
bull FFE measured from top of lowest floor (riverinenon-coastal high hazard areas) or bottom of lowest horizontal structural member (coastal high hazard areas)
Y Y Y Y
Building Replacement Value (BRV)
bull The unit cost to rebuild a structure of the same quality of construction
bull Not the same as market value
Y Y Y Y
Building Size
bull The total floor area of the building in square feet
bull Total Building Value = BRV x Building Sizebull Typical BRVs for NYC range between $100 to
$325SF for residential buildings and $120 to $450SF for commercialpublic buildings
Y Y Y Y
Structure Description
bull The type of building number of stories and foundation type (full basement partial basement no basement)
bull Collect more detailed foundation data for coastal flood zones
Y Y Y Y
Building Use bull Details related to residential housing commercial business and public use
Y Y Y Y Y
Building Type bull The primary use of building ndash residential commercial public and others
Y Y Y Y Y
Depth Damage Function (DDF)
bull Curves used to estimate structure damage contents damage and displacement of residential buildings based on flood depth
bull DDFs selection based on Structure Description Building Type Building Use
bull Structure DDFs based on percentage of Total Building Value
bull Contents DDFs based on percentage of Total Contents Value
bull Displacement DDFs based on number of displacement days x Displacement Cost
Y Y Y Y Y
Contents Value
bull The cost to replace structure contents (furnishings equipment)
bull Residential building Contents Values typically 50 BRV (FEMA DDFs) or 100 BRV (USACE DDFs)
bull Non-residential building Contents Values between 18 to over 100 depending on building use (USACE DDFs)
bull Total Contents Value = BRV x Building Size
Y Y Y Y Y
Table 16 provides general guidance on how to quantitatively calculate benefits from efforts to address from climate stressors See Section IIIE for more information
NYC Mayorrsquos Office of Recovery and Resiliency Climate Resiliency Design Guidelines
46APPENDIX 4 - PROJECT BENEFITS CATEGORIES
Table 16 ndash Guidance on quantitative calculations for (1) sea level rise with coastal storm surge and (2) increased precipitation measures
Data Input General Guidance ndash Basic Description
Applicable Benefit Category
Applicable Typical Facility Typology
Dire
ct B
enefi
ts
Indi
rect
Ben
efits
Oth
er P
oten
tial
Ben
efits
Bui
ldin
g St
ruct
ures
Com
plex
Fa
cilit
ies
Tran
spor
tatio
nSt
reet
scap
es
Plaz
as
Park
Fea
ture
s
Number of Residents (Residential)
bull Total number of occupants in a residential building
bull Typically estimated based on number of residential units x average number of individuals per household (based on current US Census data or use 25 individuals per household as a default)
Y Y Y Y Y
Displacement Cost (Residential)
bull The unit cost to lodge and feed displaced residents while flood damage is repaired
bull Average unit displacement cost of $415residential unitday recommended based on current FY2018 GSA Per Diem rates for New York City
Y Y Y Y Y
Value of Service (Non-Residential and Public)
bull The unit cost of service disruption and rental of temporary facilities while flood damage is repaired
bull Disruption costs for non-residential buildings typically range from $095 to $136SFmonth and rental costs range from $020 to $136SFmonth depending on building use
bull Value of service for public buildings ($day) is typically based on the annual operating budget for the City agency using the building prorated based on building size or population served by the building then divided by 365 daysyear
Y Y Y Y
Value of Service (Critical Facilities)
bull The unit cost of critical facilities (police fire emergency medical services) lost or delayed while flood damage is repaired
Y Y Y
Value of Service Duration
bull The duration of service disruption and rental of temporary facilities for non-residential buildings and critical facilities while flood damage is repaired
bull For non-residential buildingso Value of Service Durations vary from
4 months to over 30 months based on building use and the depth of flooding
o Total Value of Service Loss = (Disruption Cost x Building Area) = (Rental Cost x Building Area x Value of Service Duration)
bull For public buildings and critical facilitieso Value of Service Durations vary from 0
days to 720 months based on building use and the depth of flooding from FEMA FIA or USACE DDFs
o Total Value of Service Loss = (Value of Service) x (Service Loss Duration)
Y Y Y
NYC Mayorrsquos Office of Recovery and Resiliency Climate Resiliency Design Guidelines
47APPENDIX 4 - PROJECT BENEFITS CATEGORIES
Table 16 ndash Guidance on quantitative calculations for (1) sea level rise with coastal storm surge and (2) increased precipitation measures
Data Input General Guidance ndash Basic Description
Applicable Benefit Category
Applicable Typical Facility Typology
Dire
ct B
enefi
ts
Indi
rect
Ben
efits
Oth
er P
oten
tial
Ben
efits
Bui
ldin
g St
ruct
ures
Com
plex
Fa
cilit
ies
Tran
spor
tatio
nSt
reet
scap
es
Plaz
as
Park
Fea
ture
s
Engineering Estimates for Damages
bull Engineered estimate models of physical damages and service losses at the project site based on the Guidelines event recurrence interval(s) and flood depth(s)
Y Y Y Y Y Y
Historic Damages and Service Losses
bull Historic physical damages and service losses at the project site documented from previous flood events
bull Do not use routine maintenancebull The historic damage event recurrence interval
(RIs) andor flood depths must be determined updated for inflation to the present value and adjusted to match the Guidelines event RIsflood depths
Y Y Y Y Y Y
Facility Replacement Value
bull The unit cost to rebuild the facility
Impacted Area bull The geographic area impacted by the facility in the event of failure in acres
Y Y Y Y
Facility Capacity
bull The design capacity of the facilitybull For example - facility capacity expressed in
millions of gallons per day (MGD) for water and wastewater facilities or megawatts (MW) for electrical facilities
Y Y Y Y
Service Population
bull The number of impacted residents served by the facility
bull Typically estimated based on number of impacted residential customers x average number of individuals per household (based on current US Census data or use 25 individuals per household as a default)
bull Facilities serving mostly non-residentialpublic buildings andor critical facilities should focus on service losses rather than service population
Y Y Y
NYC Mayorrsquos Office of Recovery and Resiliency Climate Resiliency Design Guidelines
48APPENDIX 4 - PROJECT BENEFITS CATEGORIES
Table 16 ndash Guidance on quantitative calculations for (1) sea level rise with coastal storm surge and (2) increased precipitation measures
Data Input General Guidance ndash Basic Description
Applicable Benefit Category
Applicable Typical Facility Typology
Dire
ct B
enefi
ts
Indi
rect
Ben
efits
Oth
er P
oten
tial
Ben
efits
Bui
ldin
g St
ruct
ures
Com
plex
Fa
cilit
ies
Tran
spor
tatio
nSt
reet
scap
es
Plaz
as
Park
Fea
ture
s
Value of Service
bull Unit value of service provided by the facilitybull Example of FEMA standard values for complete
loss of utility service $105personday for potable water$49personday for wastewater$148personday for electrical
bull Consider updating FEMA standard per capita values to reflect current The New York City utility rates
Y Y
Roadway Elevations bull Roadway Elevations
Y Y
Roadway Replacement Value
bull Roadway Replacement ValueY Y
Inundation Area Map
bull Inundation Area Map developed by FEMA or through modeling by project design team
Y Y Y
Building Inventory of Inundation Area
bull The number and type of buildings within the streetscape and neighborhood inundated by the Guidelinersquos flood events
Y Y Y
Average Daily Traffic (ADT)
bull The average number of one-way traffic trips per day along the roadway(s) within the streetscapeneighborhood inundated by the Guidelinersquos flood events
Y Y
Additional Travel Time
bull The additional travel time needed to detour around a flooded roadway expressed in minutes
bull In the unlikely event there is no detour available use a 12-hour travel time per one-way trap but provide a detailed area street map as supporting documentation
Y Y
Value of Traffic Delay
bull The value of service associated with lost time in traffic
bull For example - FEMA standard average value of $3344vehiclehour of delay
bull Consider updating FEMA and GSA standard values to reflect current New York City area labor rates and fuel costs
Y Y
NYC Mayorrsquos Office of Recovery and Resiliency Climate Resiliency Design Guidelines
49APPENDIX 4 - PROJECT BENEFITS CATEGORIES
Table 17 ndash Guidance on quantitative unit benefit calculations for extreme heat hazard measures
Measure General Guidance ndash Unit Benefit Information and Data Requirements
Applicable Benefit Category
Applicable Typical Facility Typology
Dire
ct B
enefi
ts
Indi
rect
Ben
efits
Oth
er P
oten
tial
Ben
efits
Bui
ldin
g St
ruct
ures
Com
plex
Fa
cilit
ies
Tran
spor
tatio
nSt
reet
scap
es
Plaz
as
Park
Fea
ture
s
Green Roof
bull Unit benefit range over PUL = $470SF to $373SF of green roof area ($719SF standard value)
bull Assumed PUL = 40 yearsbull Apply standard value unit benefit to green
roof area to estimate measure benefitbull Higher range values more applicable
to residential and commercial building streetscape projects
Y Y Y Y Y Y
Bioswale Rain Garden Meadow Mix
bull Unit benefit range over PUL = $396SF to $211SF of area ($730SF standard value)
bull Assumed PUL = 30 yearsbull Apply standard value unit benefit to bioswale
rain gardenmeadow mix area to estimate total measure benefit
Y Y Y Y Y Y
Cool Roof
bull Unit benefit range over PUL = $117 to $3151SF of material area ($144SF standard value)
bull Assumed PUL = 20 yearsbull Apply standard value unit benefit to cool roof
area to estimate total measure benefitbull Higher range values more applicable to
residential building streetscape projects
Y Y Y Y Y
Light-Colored PaversLight-Colored Materials
bull Unit benefit range over PUL = $0774 to $204SF of material area ($0866SF standard value)
bull Assumed PUL = 30 yearsbull Apply standard value unit benefit to material
area to estimate total measure benefit
Y Y Y Y
Table 17 provides general guidance on how to quantitatively calculate benefits from efforts to address climate stressors See Section IIIE for more information
NYC Mayorrsquos Office of Recovery and Resiliency Climate Resiliency Design Guidelines
50APPENDIX 4 - PROJECT BENEFITS CATEGORIES
Table 17 ndash Guidance on quantitative unit benefit calculations for extreme heat hazard measures
Measure General Guidance ndash Unit Benefit Information and Data Requirements
Applicable Benefit Category
Applicable Typical Facility Typology
Dire
ct B
enefi
ts
Indi
rect
Ben
efits
Oth
er P
oten
tial
Ben
efits
Bui
ldin
g St
ruct
ures
Com
plex
Fa
cilit
ies
Tran
spor
tatio
nSt
reet
scap
es
Plaz
as
Park
Fea
ture
s
Tree Planting
bull Unit benefit range over PUL = $1005 to $77154Tree ($1855Tree standard value)
bull Assumed PUL = 30 yearsbull Apply standard value unit benefit to number of
trees to estimate total measure benefitbull Higher range values more applicable
to residential and commercial building streetscape projects
Y Y Y Y Y Y
Planter Box Tree
bull Unit benefit range over PUL = $212 to 16304Tree ($392Tree standard value)
bull Assumed PUL = 15 yearsbull Apply standard value unit benefit to number of
trees to estimate total measure benefitbull Higher range values more applicable
to residential and commercial building streetscape projects
Y Y Y Y Y
Shade Canopy
bull Unit benefit range over PUL = $0363 to $396SF ($0458SF standard value)
bull Assumed PUL = 15 yearsbull Apply standard value unit benefit to area of
shade canopy estimate total measure benefitbull Higher range values more applicable
to residential and commercial building streetscape projects
Y Y Y Y
Permeable Grass Pavers
bull Unit benefit range over PUL = $0258SF to $0521SF of pavers ($0363SF standard value)
bull Assumed PUL = 30 yearsbull Apply standard value unit benefit to paver
area to estimate total measure benefit
Y Y Y Y Y
For the purposes of the BCA refer to the following facility typologies bull ldquoBuilding Structuresrdquo include critical small building sites such as EMS or FDNY stations and non-critical small building sites such as
libraries or comfort stationsbull ldquoComplex Facilitiesrdquo include critical infrastructure such as wastewater treatment sites pump stations water filtration plants and similar
large or complex facilitiesbull ldquoTransportationStreetscapePlazasrdquo include roadway reconstruction streetscape improvements street raising plazas and other
transportation-related infrastructurebull ldquoPark Featuresrdquo include parks and similar public recreational facility with natural landscape features
NYC Mayorrsquos Office of Recovery and Resiliency Climate Resiliency Design Guidelines
51APPENDIX 5 - EXAMPLE PLANNING DECISION TREE
This decision tree provides a summarized example approach for how to implement these Guidelines Projects with a total cost greater than $50 million are recommended to conduct a full qualitative and quantitative climate change risk assessment and BCA while projects below $50 million are recommended to conduct a qualitative risk assessment and BCA
Define Project
1) Operational goals and criticality level2) Useful life3) Location in the current flood plain future floodplain and or zone
of tidal inundation and the project arearsquos score on the heat vulnerability index
Evaluate Project Risks According to Probability and Magnitude of Consequence
bull Extreme Heat bull Precipitationbull Sea Level Risebull Coastal Surge
High Level Identification and Assessment of Risk Mitigation Alternatives and Co-benefits
(qualitative)
Detailed Identification and Assessment of Risk Mitigation Alternatives and Co-benefits (qualitative and quantitative)
High Level Estimate of Costs and Benefits of Design Alternatives
(qualitative)
Detailed Estimate of Costs and Benefits of Design Alternatives
(qualitative and quantitative)
Decision Point Which climate change risks require mitigation
Decision Point Evaluate risk mitigation benefits and costs to
determine final resilient design alternative or if no action is required
Decision Point Is the total project cost above $50 million
Below $50 million Above $50 million
APPENDIX 5 - EXAMPLE PLANNING DECISION TREE
NYC Mayorrsquos Office of Recovery and Resiliency Climate Resiliency Design Guidelines
52
Project Title
Design Strategies Checklist (not exhaustive)
Extreme Heat Comments Extreme Precipitation Comments Sea Level Rise amp Storm Surge Comments
Select Site in Low Heat Vulnerability Index area Select High Elevation Site Select High Elevation Site
Minimize East-West Building Orientation Green Roof Raise Building Floor Elevation
Passive Solar Cooling and Ventilation Systems
Protect Below Grade Areas from Flooding Waterproof Building Envelope
Cool Roof (SRI appropriate) On-site Stormwater Management (gray) Elevate Critical Building Functions
Green Roof (extensive) Reduce Impervious Areas Elevate Critical Equipment
Vegetative Structures Permeable Pavement Perimeter Floodwall100 Levee (passive or active)
Enhanced HVAC System including space layout optimization and system scalability
Increase Green Spaces and Planted Areas DryWet Floodproofing
More Efficient Building Envelope Other Utility Redundancy Design101
Parking Lot Shading Resilient Materials amp Landscape Treatments
Light Colored Pavements (appropriate SRI) Design for Storm Surge Outflow
Increase Planted Areas Install Backwater Flow Prevention
Permeable Surfaces Design for Scour
Open-grid Pavement Raise Road Elevation
Other Other
This appendix provides a template for identifying possible design strategies to address climate change risks as described throughout the Guidelines
APPENDIX 6 - DESIGN STRATEGIES CHECKLIST
100 Permanent perimeter flood walls are not permitted to meet floodproofing requirements in buildings with substantial improvements andor damages 101 Utility redundancy design should be pursued for critical systems not all building systems
APPENDIX 6 - DESIGN STRATEGIES CHECKLIST
NYC Mayorrsquos Office of Recovery and Resiliency Climate Resiliency Design Guidelines
53APPENDIX 7 - CLIMATE CHANGE RISK ASSESSMENT RESOURCES
These Guidelines provide data on climate change hazards and recommend how that data can inform resilient design A risk assessment is a tool to help project managers and designers evaluate risk levels as well as select and prioritize resilient design strategies A high level risk assessment is recommended for all City capital projects with a total cost of under $50 million Projects above $50 million are recommended to conduct an in-depth assessment
Risk assessments use quantified estimates of the probability and magnitude of consequence of an event occurring to prioritize responses ldquoProbabilityrdquo is an assessment of the likelihood of a hazard occurring while ldquomagnituderdquo describes the hazardrsquos potential impact Risk assessment tools such as the examples listed below can be used to define and score these categories Projects that score higher across both probability and magnitude can be prioritized for investment and risk mitigation action Projects that score lower across both criteria may require no action beyond meeting code The results are typically charted on a risk matrix and an example is provided on the next page
The climate change risk management frameworks below offer templates for how to integrate climate change projections into a risk assessment process Refer to these resources for examples and further information
bull Vulnerability Assessment and Adaptation Framework is prepared by the Federal Highway Administration (FHWA) While developed for transportation planning this risk assessment framework has broad applicability for evaluating asset vulnerability to climate change Available at httpswwwfhwadotgovenvironmentsustainabilityresilienceadaptation_framework
bull US Climate Resilience Toolkit The US Global Change Research Program offers a step by step risk assessment
framework including tools and case studies at httpstoolkitclimategovsteps (see example on next page)
bull Coast Adapt Guidance on undertaking a risk assessment High level assessment httpscoastadaptcomausitesdefaultfilesfactsheetsT3M4_2_2nd_pass_risk_assessmentpdfDetailed assessment httpscoastadaptcomausitesdefaultfilesfactsheetsT3M4_3_3rd_pass_risk_assessmentpdf
bull Climate adaptation Risk uncertainty and decision-makingDownload the report here httpswwwukciporgukpublicationsRisk
The City plans to develop a NYC-specific process for integrating climate change data into existing risk management processes by April 2019
APPENDIX 7 - CLIMATE CHANGE RISK ASSESSMENT RESOURCES
NYC Mayorrsquos Office of Recovery and Resiliency Climate Resiliency Design Guidelines
54APPENDIX 7 - CLIMATE CHANGE RISK ASSESSMENT RESOURCES
The Risk Characterization Matrix below is an example from the US Climate Resilience Toolkit This tool can be used to assess the probability and magnitude of impact for identified risks The risk of coincident climate stressorsrisks (such as storm surge plus increased precipitation) can also be assessed as applicable
Figure 14 - Example of a climate change risk matrix (adapted from US Climate Resilience Toolkit)
Project teams can determine the magnitude of the impact (along the horizontal scale of 1 through 3 with 3 being the most severe) and the probabilitylikelihood of occurrence for each specific risk (along the vertical scale with 3 being the most likely) A score is typically assigned for each risk (Probabil-ity x Magnitude) and then charted on the matrix Based on the estimated probability and magnitude of consequence above the risks are ranked and prioritized for mitigation Factors to bear in mind include
bull Not all facility typologies have the same level of functional and operational importance during events or tolerance for disruption
bull Not all climate stressors and risks have the same level of impact on each project sitebull Not all identified risks can or should be mitigated fully
NYC Mayorrsquos Office of Recovery and Resiliency Climate Resiliency Design Guidelines
55WORKS CITED
A Stronger More Resilient New York PlaNYC Report of the NYC Special Initiative for Rebuilding and Resiliency The City of New York 2013
ldquoAccount for Climate Riskrdquo International Finance Corporation accessed March 27 2017 httpwwwifcorgwpswcmconnectTopics_Ext_ContentIFC_External_Corporate_SiteClimate+Business
PrioritiesAccount+for+Climate+Risk
American Society of Heating Refrigeration and Air-Conditioning Engineers (ASHRAE) Handbook -Fundamentals 2017
ldquoBaseline Standard Economic Value Methodology Reportrdquo Federal Emergency Management Agency July 2016
Benefit Cost Analysis Toolkit Software Version 530 Federal Emergency Management Agency (build date December 2016)
Criteria for Detention Facility Design New York City Department of Environmental Protection November 2012
Community Resilience Planning Guide for Buildings and Infrastructure Systems Vol 1 NIST Special Publication 1190 US Department of Commerce 2016
Cool and Green Roofing Manual NYC Department of Design and Construction 2007 httpwwwnycgovhtmlddcdownloadspdfcool_green_roof_manpdf
Building Resiliency Task Force US Urban Green Building Council New York 2013 httpurbangreencouncilforcecomBuildingResiliency
Design and Planning for Flood Resiliency Guidelines for NYC Parks New York City Department of Parks and Recreation 2017
httpswwwnycgovparksorgplanning-and-buildingplanningresiliency-plansflood-resiliency
Flooded Bus Barns and Buckled Rails Federal Transit Administration Office of Budget and Policy 2011 httpswwwhsdlorgabstractampdid=685187
Floodproofing Non-Residential Buildings FEMA P936 FEMA 2013 httpswwwfemagovmedia-library-data9a50c534fc5895799321dcdd4b6083e7P-936_8-20-13_508rpdf
ldquoGlossaryrdquo International Infrastructure Management Manual National Asset Management Support Group New Zealand 2011 httpwwwipweaorg
ldquoGreen Roof Metrics Draft Reportrdquo New York City Department of Parks and Recreation 2017
ldquoGuide to Rain Event Preparednessrdquo NYC Department of Environmental Protection httpwwwnycgovhtmldeppdfbrochuresflood-preparedness-flyerpdf
ldquoGuidelines and Discount Rates for Benefit-Cost Analysis of Federal Programsrdquo Appendix C Circular A-94 US Office of Management and Budget (OMB) 2017
ldquoGuidelines for the Design and Construction of Stormwater Management Systemsrdquo New York City Department of Environmental Protection July 2012
Horton R et al New York City Panel on Climate Change 2015 Report Ann NY Acad Sci ISSN 0077-892 New York 2015
Madrigano J et al ldquoA case-only study of vulnerability to heat wavendashrelated mortality in New York City (2000ndash2011)rdquo Environmental Health Perspectives 123672ndash678 2013
WORKS CITED
NYC Mayorrsquos Office of Recovery and Resiliency Climate Resiliency Design Guidelines
56WORKS CITED
enspMcGregor et al Two Degrees The Built Environment and Our Changing Climate Routledge Press 2013
NYC Green Codes Task Force US Green Building Council New York 2010 httpurbangreencouncilorgGreenCodes
NYCrsquos Risk Landscape A Guide to Hazard Mitigation NYC Emergency Management 2014
One New York The Plan for a Strong and Just City The City of New York 2015 httpwwwnycgovhtmlonenyc downloadspdfpublicationsOneNYCpdf
Ready to Respond Strategies for Multifamily Building Resilience Enterprise Green Communities 2015 httpswwwenterprisecommunityorgresources
Rosenzweig C et al Climate Change Adaptation in New York City Building a Risk Management Response New York City Panel on Climate Change 2010
httponlinelibrarywileycomdoi101111nyas20101196issue-1 issuetoc
ldquoSustainable Infrastructure Management Program Learning Environmentrdquo Water Environment Research Foundation accessed March 24 2017 httpsimplewerforg
Urban Waterfront Adaptive Strategies NYC Department of City Planning 2013 httpwww1nycgovsiteplanningplanssustainable-communitiesclimate-resiliencepagetab=1
Wastewater Resiliency Plan Climate Risk Assessment and Adaptation Study New York City Department of Environmental Protection October 2013
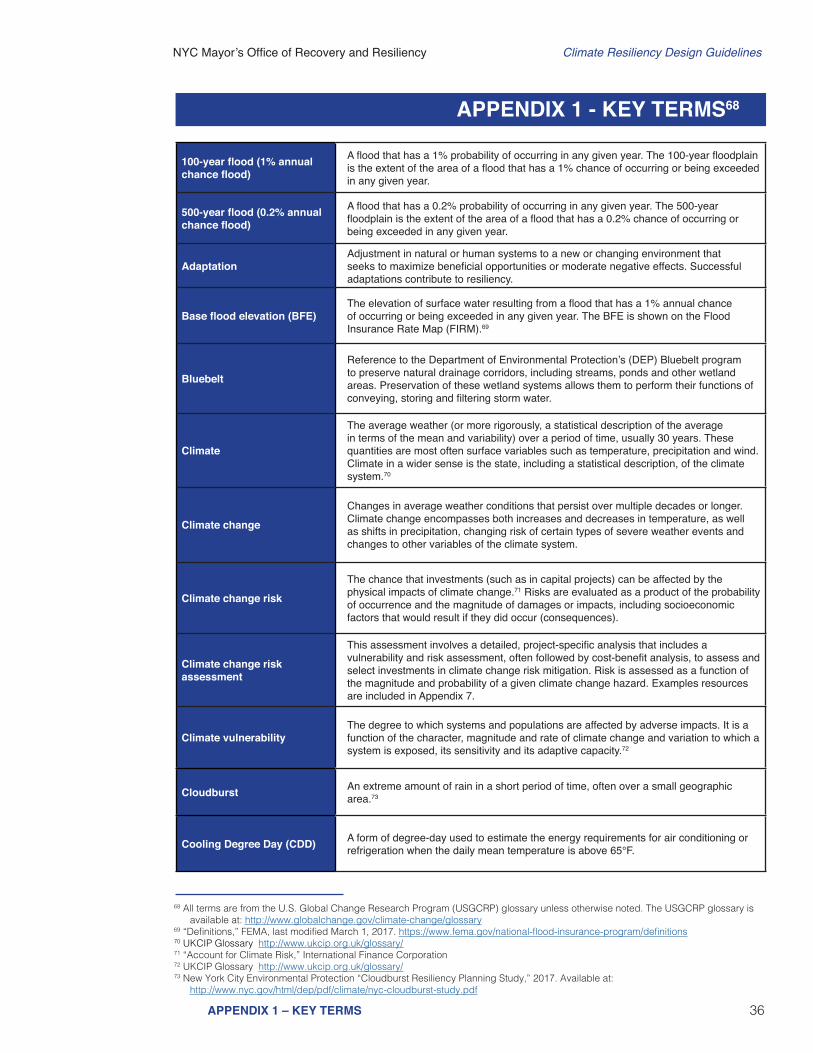
NYC Mayorrsquos Office of Recovery and Resiliency Climate Resiliency Design Guidelines
36APPENDIX 1 ndash KEY TERMS
100-year flood (1 annual chance flood)
A flood that has a 1 probability of occurring in any given year The 100-year floodplain is the extent of the area of a flood that has a 1 chance of occurring or being exceeded in any given year
500-year flood (02 annual chance flood)
A flood that has a 02 probability of occurring in any given year The 500-year floodplain is the extent of the area of a flood that has a 02 chance of occurring or being exceeded in any given year
AdaptationAdjustment in natural or human systems to a new or changing environment that seeks to maximize beneficial opportunities or moderate negative effects Successful adaptations contribute to resiliency
Base flood elevation (BFE)The elevation of surface water resulting from a flood that has a 1 annual chance of occurring or being exceeded in any given year The BFE is shown on the Flood Insurance Rate Map (FIRM)69
BluebeltReference to the Department of Environmental Protectionrsquos (DEP) Bluebelt program to preserve natural drainage corridors including streams ponds and other wetland areas Preservation of these wetland systems allows them to perform their functions of conveying storing and filtering storm water
Climate
The average weather (or more rigorously a statistical description of the average in terms of the mean and variability) over a period of time usually 30 years These quantities are most often surface variables such as temperature precipitation and wind Climate in a wider sense is the state including a statistical description of the climate system70
Climate change
Changes in average weather conditions that persist over multiple decades or longer Climate change encompasses both increases and decreases in temperature as well as shifts in precipitation changing risk of certain types of severe weather events and changes to other variables of the climate system
Climate change riskThe chance that investments (such as in capital projects) can be affected by the physical impacts of climate change71 Risks are evaluated as a product of the probability of occurrence and the magnitude of damages or impacts including socioeconomic factors that would result if they did occur (consequences)
Climate change risk assessment
This assessment involves a detailed project-specific analysis that includes a vulnerability and risk assessment often followed by cost-benefit analysis to assess and select investments in climate change risk mitigation Risk is assessed as a function of the magnitude and probability of a given climate change hazard Examples resources are included in Appendix 7
Climate vulnerabilityThe degree to which systems and populations are affected by adverse impacts It is a function of the character magnitude and rate of climate change and variation to which a system is exposed its sensitivity and its adaptive capacity72
Cloudburst An extreme amount of rain in a short period of time often over a small geographic area73
Cooling Degree Day (CDD) A form of degree-day used to estimate the energy requirements for air conditioning or refrigeration when the daily mean temperature is above 65degF
68 All terms are from the US Global Change Research Program (USGCRP) glossary unless otherwise noted The USGCRP glossary is available at httpwwwglobalchangegovclimate-changeglossary
69 ldquoDefinitionsrdquo FEMA last modified March 1 2017 httpswwwfemagovnational-flood-insurance-programdefinitions70 UKCIP Glossary httpwwwukciporgukglossary71 ldquoAccount for Climate Riskrdquo International Finance Corporation 72 UKCIP Glossary httpwwwukciporgukglossary73 New York City Environmental Protection ldquoCloudburst Resiliency Planning Studyrdquo 2017 Available at httpwwwnycgovhtmldeppdfclimatenyc-cloudburst-studypdf
APPENDIX 1 - KEY TERMS68
NYC Mayorrsquos Office of Recovery and Resiliency Climate Resiliency Design Guidelines
37APPENDIX 1 ndash KEY TERMS
Design life The life expectancy of an asset or product as determined during design74 As opposed to useful life (see below)
Dry Bulb temperature The ambient air temperature measured by a thermometer
Extreme eventUnexpected unusual or unpredictable weather or flooding compared to historical or future projected distribution Extreme events include for example heat waves cold waves heavy rains periods of drought and flooding and severe storms
Facilities For the purposes of this document ldquofacilitiesrdquo refers to all types of buildings housing infrastructure structures and landscape features designed by or for the City of New York
Flexible adaptation pathwayResilience-building strategies that can evolve or be adapted over time as climate change risk assessments evaluations of adaptation strategies and monitoring continue75
Flood Insurance Rate Maps (FIRM)
Official flood map of a community on which FEMA has delineated the 1 annual chance floodplain and the base flood elevations (BFEs) applicable to the community76 The FIRM also includes the 02 floodplain annual chance floodplain and differentiates between special flood hazard areas (V A Coast A zones) and floodways The official FIRM is from the year 2007 while the 2015 PFIRM is currently required by NYC Building Code to calculate design flood elevations NYC DOB references the more restrictive of the two maps in both base flood elevation and flood hazard area (ie V versus A zone) Refer to Appendix 3 for more information
FreeboardAn additional amount of height above the base flood elevation used as a factor of safety (eg two feet above the base flood) in determining the level at which a facilitys lowest floor must be elevated or floodproofed to be in accordance with state or community floodplain management regulations77
Future time slices
Future periods defined by the NPCC for when climate change projections are available In this document the following decadal projections are associated with specific time spans2020s projection = present to 20392050s projection = 2040 to 20592080s projection = 2070 to 20992100s projection = end of century and beyond
Green infrastructureAn array of practices that use or mimic natural systems to manage urban stormwater runoff Water is either directed to engineered systems for infiltration or detained for longer periods before it enters the sewer system
Heat Vulnerability Index (HVI)Summarizes relative risk of adverse health effects from heat due to social and environmental factors Used to identify neighborhoods at higher risk during and after extreme heat events
Heat wave A period of three consecutive days where temperatures rise above 90degF or two consecutive days over 95 degrees78
New York City Panel on Climate Change (NPCC)
The body of leading climate and social scientists charged with making climate change projections for the metropolitan region79
74 Sustainable Infrastructure Management Program Learning Environment httpsimplewerforg 75 Rosenzweig C et al Climate Change Adaptation in New York City Building a Risk Management Response76 ldquoDefinitionsrdquo FEMA77 Ibid78 Horton R et al New York City Panel on Climate Change 2015 Report Chapter 1 Climate Observations and Projections Ann NY
Acad Sci ISSN 0077-8923 (New York 2015) 2579 For more information on the NPCC visit www1nycgovsiteorrchallengesnyc-panel-on-climate-changepage
NYC Mayorrsquos Office of Recovery and Resiliency Climate Resiliency Design Guidelines
38APPENDIX 1 ndash KEY TERMS
Open-grid pavement system
Pavements that consist of loose substrates supported by a grid of a more structurally sound grid or webbing Unbounded loose substrates in these systems transfer and store less heat than bound and compacted pavements and aid permeability Pavement is 50 pervious and contains vegetation in the open cells designed to allow percolation or infiltration of storm water through the surface into the soil below80
Preliminary Flood Insurance Rate Map (PFIRM)
Preliminary flood map developed by FEMA in 2015 for New York City that provides projected risks for flood hazards81 Refer to Appendix 3 for more information
Project useful life (PUL)
The period over which an asset or component is expected to be available for use by an entity This depends on regular and adequate maintenance This period of time typically exceeds the design life (see above) The combined effect of operational requirements and useful life is practical in assessing an investment in improving resilience82
Rain gardenAlso called ldquobioswalerdquo Planted areas designed to collect and manage stormwater that runs off streets sidewalks commercial and residential rooftops and other sources when it rains
Resiliency The ability to bounce back after change or adversity The capability of preparing for responding to and recovering from difficult conditions83
Sea level rise-adjusted design flood elevation
As defined in these Guidelines the increased height of the base flood elevation due to sea level rise plus freeboard depending on the criticality of the facility The sea level rise adjustment depends on the useful life of the facility
Storm surge An abnormal rise of water generated by a storm over and above predicted astronomical tides84
Substantial improvementAny repair reconstruction rehabilitation addition or improvement of a building or structure the cost which equals or exceeds 50 of the market value of the structure before the improvement or repairs started For more information see Appendix G of the NYC Building Code and 1 RCNY sect3606-0185
Tidal inundation Flooding which occurs at high tides due to climate-related sea level rise land subsidence andor the loss of natural barriers86
Urban Heat Island (UHI) effectThe tendency for higher air temperatures to persist in urban areas as a result of heat absorbed and emitted by buildings and asphalt tending to make cities warmer than the surrounding suburban and rural areas
Weather The state of the atmosphere at a given time with regard to temperature cloudiness precipitation wind and other meteorological conditions87
Wet Bulb temperatureThe temperature indicated when a thermometer bulb is covered with a water-saturated wick over which air is caused to flow at approximately 45 ms (900 ftmin) to reach the equilibrium temperature of water evaporating into the air when the heat of vaporization is supplied by the sensible heat of the air88
80 ldquoGlossaryrdquo US Green Building Council (2017) Available at httpwwwusgbcorgglossaryterm552581 ldquoPreliminary FEMA Map Productsrdquo FEMA Map Service Center Available at httpshazardsfemagovfemaportalprelimdownload82 ldquoGlossaryrdquo International Infrastructure Management Manual (2011) 83 A Stronger More Resilient New York (2013) 184 ldquoStorm Surge Overviewrdquo National Hurricane Center NOAA Available at httpswwwnhcnoaagovsurge85 ldquoFlood Resistant Constructionrdquo Appendix G New York City Building Code (2008) and 1 RCNY sect3606-01 available at httpswww1nycgovassetsbuildingsrules1_RCNY_3606-01pdf86 ldquoOcean Factsrdquo National Ocean Service NOAA Available at httpoceanservicenoaagovfactsnuisance-floodinghtml 87 UKCIP Glossary httpwwwukciporgukglossary88 ldquoASHRAE Terminologyrdquo ASHRAE Available at httpswwwashraeorgtechnical-resourcesauthoring-toolsterminology
NYC Mayorrsquos Office of Recovery and Resiliency Climate Resiliency Design Guidelines
39APPENDIX 2 - CLIMATE CHANGE PROJECTIONS
Climate change projections are provided by the New York City Panel on Climate Change (NPCC) The full NPCC report is available from the New York Academy of Sciences89 Tables 8-10 (below) were reproduced directly from the NPCC report while Table 2 (see Section IIA) was developed using the data underlying the NPCC report to inform the design of HVAC systems under warmer conditions
Table 8 ndash NYC sea level rise projections90
Baseline (2000-2004) 0 in
Low estimate (10th percentile)
Middle range (25th to 75th percentile)
High estimate (90th percentile)
2020s 2 in 4-8 in 10 in
2050s 8 in 11-21 in 30 in
2080s 13 in 18-39 in 58 in
2100 15 in 22-50 in 75 in
Note Projections are based on six-component approach that incorporates both local and global factors The model-based components are from 24 global climate models and two representative concentration pathways Projections are relative to the 2000-2004 base period
Table 9 ndash Mean annual changes91
a Temperature Baseline(1971-2000) 54degF
Low estimate (10th percentile)
Middle range (25th to 75th percentile)
High estimate (90th percentile)
2020s + 15degF +20-29degF +32degF
2050s +31degF +41-57degF +66degF
2080s +38degF +53-88degF +103degF
2100 +42degF +58-104degF +121F
b Precipitation Baseline(1971-2000) 501 in
Low estimate (10th percentile)
Middle range (25th to 75th percentile)
High estimate (90th percentile)
2020s -1 percent +1-8 +10
2050s +1 percent +4-11 +13
2080s +2 percent +5-13 +19
2100 -6 percent -1 to +19 +25
Note Based on 35 global climate models (GCMs) and two RCPs Baseline data cover the 1971ndash2000 base period and are from the NOAA National Climatic Data Center (NCDC) Shown are the low estimate (10th percentile) middle range (25th percentile to 75th percentile) and high estimate (90th percentile) These estimates are based on a ranking (from most to least) of the 70 (35 GCMs times 2 RCPs) projections The 90th percentile is defined as the value that 90 percent of the outcomes (or 63 of the 70 values) are the same or lower than Like all projections the NPCC climate change projections have uncertainty embedded within them Sources of uncertainty include data and modeling constraints the random nature of some parts of the climate system and limited understanding of some physical processes The NPCC characterizes levels of uncertainty using state-of-the-art climate models multiple scenarios of future greenhouse gas concentrations and recent peer-reviewed literature Even so the projections are not true probabilities and the potential for error should be acknowledged
89 The NPCC 2015 report is available at httponlinelibrarywileycomdoi101111nyas20151336issue-1issuetoc90 From New York City Panel on Climate Change 2015 Report Chapter 1 Climate Observations and Projections page 4191 From New York City Panel on Climate Change 2015 Report Chapter 1 Climate Observations and Projections page 30
APPENDIX 2 - CLIMATE CHANGE PROJECTIONS
NYC Mayorrsquos Office of Recovery and Resiliency Climate Resiliency Design Guidelines
40APPENDIX 2 - CLIMATE CHANGE PROJECTIONS
Table 10 ndash Extreme events92
2020s Baseline (1971-2000)
Low estimate(10th percentile)
Middle range(25th to 75th percentile)
High estimate (90th percentile)
Numbers of heat waves per year 2 3 3-4 4
Average heat wave duration (days) 4 5 5 5
Number of days per year with
Maximum temperature at or above 90degF 18 24 26-31 33
Maximum temperature at or above 100degF 04 07 1-2 2
Minimum temperature at or below 32degF 71 50 52-58 60
Rainfall at or above 1 inch 13 13 14-15 16
Rainfall at or above 2 inches 3 3 3-4 5
Rainfall at or above 4 inches 03 02 03ndash04 05
2050s Baseline (1971-2000)
Low estimate(10th percentile)
Middle range(25th to 75th percentile)
High estimate (90th percentile)
Numbers of heat waves per year 2 4 5-7 7
Average heat wave duration (days) 4 5 5-6 6
Number of days per year with
Maximum temperature at or above 90degF 18 32 39-52 57
Maximum temperature at or above 100degF 04 2 3-5 7
Minimum temperature at or below 32degF 71 37 42-48 52
Rainfall at or above 1 inch 13 13 14-16 17
Rainfall at or above 2 inches 3 3 4-4 5
Rainfall at or above 4 inches 03 03 03-04 05
2080s Baseline (1971-2000)
Low estimate(10th percentile)
Middle range(25th to 75th percentile)
High estimate (90th percentile)
Numbers of heat waves per year 2 5 6-9 9
Average heat wave duration (days) 4 5 5-7 8
Number of days per year with
Maximum temperature at or above 90degF 18 38 44-76 87
Maximum temperature at or above 100degF 04 2 4-14 20
Minimum temperature at or below 32degF 71 25 30-42 49
Rainfall at or above 1 inch 13 14 15-17 18
Rainfall at or above 2 inches 3 3 4-5 5
Rainfall at or above 4 inches 03 02 03-05 07
Note Projections for temperature and precipitation are based on 35 GCMs and 2 RCPs Baseline data are for the 1971 to 2000 base period and are from the NOAA National Climatic Data Center (NCDC) Shown are the low estimate (10th percentile) middle range (25th to 75th percentile) and high estimate (90th percentile) 30-year mean values from model-based outcomes Decimal places are shown for values less than one although this does not indicate higher precisioncertainty Heat waves are defined as three or more consecutive days with maximum temperatures at or above 90degF Like all projections the NPCC climate change projections have uncertainty embedded within them Sources of uncertainty include data and modeling constraints the random nature of some parts of the climate system and limited understanding of some physical processes The NPCC characterizes levels of uncertainty using state-of-the-art climate models multiple scenarios of future greenhouse gas concentrations and recent peer-reviewed literature Even so the projections are not true probabilities and the potential for error should be acknowledged
92 From New York City Panel on Climate Change 2015 Report Chapter 1 Climate Observations and Projections page 31
NYC Mayorrsquos Office of Recovery and Resiliency Climate Resiliency Design Guidelines
41APPENDIX 3 - DIFFERENTIATION OF FLOOD MAPS
These Guidelines reference several different kinds of flood maps and sources of design flood elevations These maps are described and differentiated below
Table 11 - Differentiation of flood maps used in NYC
Reference Title Data Source Information Provided Referenced By Link
2007 FIRM FEMA
Based on historical data from before 1983 identifies the current base flood (extent and elevation) as the flood that has a 1 chance of occurring in any given year also known as a 100-year flood The NYC Building Code requires that either the 2007 FIRM or 2015 PFIRM elevation be used whichever is higher
2014 NYC Building Code Appendix G
Climate Resiliency Design Guidelines
httpsmscfemagovportal
2015 PFIRM FEMA
Based on historical data identifies the current base flood (extents and elevation) as the flood that has a 1 chance of occurring in any given year also known as a 100-year flood The NYC Building Code requires that either the 2007 FIRM or 2015 PFIRM elevation be used whichever is higher The 2015 PFIRM is currently being reassessed by FEMA
2014 NYC Building Code Appendix G
Climate Resiliency Design Guidelines
httpshazardsfemagovfemaportalprelimdownload
httpwwwregion2coastalcomview-flood-maps-dataview-preliminary-flood-map-data
NYC Flood Hazard Mapper
NYC Department of City Planning
Maps current and future flood hazards in NYC including the following data layers 2007 FIRM and 2015 PFIRM high tide with sea level rise and PFIRM with sea level rise through 2100
Climate Resiliency Design Guidelines
Waterfront Revitalization Plan
httpwww1nycgovsiteplanningdata-mapsflood-hazard-mapperpage
ldquoTable 4 ndash Determine the sea level rise-adjusted design flood elevation for critical and non-critical facilitiesrdquo
ORR amp NPCC
Provides data to use when adding sea level rise to a given 2015 PFIRM or 2007 FIRM Base Flood Elevation (BFE) to calculate a Design Flood Elevation (DFE) Based on the criticality and expected useful life of a facility
Climate Resiliency Design Guidelines
See Section II on ldquoSea Level Riserdquo above
APPENDIX 3 - DIFFERENTIATION OF FLOOD MAPS
NYC Mayorrsquos Office of Recovery and Resiliency Climate Resiliency Design Guidelines
42APPENDIX 4 - PROJECT BENEFITS CATEGORIES
This appendix provides guidance on how to identify and assess benefits as a supplement to Sections IIID and IIIE
Table 12 lists typical direct benefits for reducing impacts from climate stressors and basic guidance for how to estimate them See Section IIID for more information
Table 13 lists typical indirect benefits for reducing impacts from climate stressors and basic guidance for how to estimate them See Section IIID for more information
Table 12 ndash Direct benefits for (1) sea level rise with coastal storm surge and (2) increased precipitation measures
Direct Benefit Basic Guidance for Estimating Values
Physical Damages (Structure Contents)
bull For flood-damaged buildings use depth damage functions developed by FEMA and USACE for structures and contents
bull Use depth damage functions in conjunction with Building Replacement Values (BRVs) and not market values BRVs typically range between $100 to $325SF for residential buildings and $120 to $450SF for commercial public buildings
bull For more complex structures or facilities use engineering estimates of flood damages or review historic flood damages documented from insurance claims repair records or FEMA Public Assistance claims from recent flood disasters
Residential Displacements
bull For flood-damaged buildings use depth damage functions developed by FEMA and USACE for residential displacements
Reduced Life CycleOperation and Maintenance (OampM) Costs93
bull Applicable only to projects that reduce overall life cycle costs or net annual OampM costs from baseline conditions
bull Input reduced annual OampM costs as a project benefit at a 1-year recurrence intervalbull Reduced overall life cycle costs can be input as a longer project useful life
Table 13 ndash Indirect benefits for (1) sea level rise with coastal storm surge and (2) increased precipitation measures
Indirect Benefit Basic Guidance for Estimating Values
Non-Residential Building Service Losses
bull Estimate service loss values and durations for non-residential buildings public buildings critical facilities and parksnatural features based on FEMA BCA guidance and standard values based on building use
Utility Service Losses94
bull Estimate utility service losses for water wastewater and electrical facilities based on the number of impacted customers FEMA per capita standard values for utility service ($105personday for potable water $49personday for wastewater $148personday for electrical)95
bull Estimate utility service loss durations based on engineering estimates or review historic flood damages losses documented from utility company records
bull This benefit can also apply to measures that increase energy efficiency
RoadBridge Service Losses
bull Estimate roadbridge service losses based on the average daily traffic (ADT) detour time and additional travel distance and FEMA and GSA standard values for road service ($3344vehiclehour of delay $0545mile)96
bull Estimate roadbridge service loss durations or review historic flood damages losses
Emergency Service Losses
bull Applicable only to projects that reduce or eliminate documented emergency service costs from baseline conditions
bull Examples of avoided emergency services costs include NYPD staffing to monitor barricades for flooded roads or NFDY staffing for water rescues of residents from flooded buildings or streets
APPENDIX 4 - PROJECT BENEFITS CATEGORIES
93 Reduced life cycle costs may be applicable to some measures that provide extreme heat benefits such as green roofs that can last longer than a standard roof if properly maintained
94 Reduced utility service costs may be applicable to some measures that provide extreme heat benefits such as cool roofs green roofs and shade trees
95 FEMA per capita standard values taken from FEMA BCA Toolkit Version 530 (Build Date 12222016) and developed in FEMArsquos Baseline Standard Economic Value Methodology Report (July 28 2016) Consider updating FEMA standard per capita values to reflect current New York City utility rates
96 Consider updating FEMA and GSA standard values to reflect current New York City area labor rates and fuel costs
NYC Mayorrsquos Office of Recovery and Resiliency Climate Resiliency Design Guidelines
43APPENDIX 4 - PROJECT BENEFITS CATEGORIES
Table 14 ndash Other potential benefits for (1) sea level rise with coastal storm surge and (2) increased precipitation measures
Other Benefit Basic Guidance for Estimating Values
Avoided Stress and Anxiety
bull Applicable only for projects that directly benefit occupants of residential structuresbull Use FEMA standard value for avoided mental stress and anxiety treatment costs of $2443person to
estimate benefit for all impacted residents97
Avoided Lost Productivity
bull Applicable only for projects that directly benefit occupants of residential structuresbull Use FEMA standard value for avoided lost worker productivity costs of $8736household to estimate
benefit for all impacted workers (conservatively assuming one worker per household)
Environmental Open Space
bull Applicable only for projects that create or acquire open space areas by acquisitionbull Use FEMA standard value for environmental open space based on the type of land acquired ($8308
Acreyear for Green open space $39545Acreyear for Riparian $6010Acreyear for Wetlands $554Acreyear for Forests $1799Year for Marine and estuary)97
CSO Volume Reduction
bull Applicable only for projects that provide Combined Sewer Overflow (CSO) abatement by reducing the volume of rainfall runoff
bull Use CSO abatement cost of $0015gallonsyear applied to increased precipitation hazard runoff volume for 5-year design storm98
Ecosystem Service99
bull Add stormwater management benefits of green infrastructure projects to increased precipitation hazards where avoided damages and service losses are not quantified
bull Unit benefits applicable to increased precipitation hazard includeo Green roofs $0133SFyear (PUL 40 years)o BioswaleRain GardenMeadow Mix $0020SFyear (PUL 30 years)o Permeable Grass Pavers $0020SFyear (PUL 30 years)o Tree Plantings $303Treeyear (PUL 30 years)o Planter Box Trees $101Treeyear (PUL 15 years)
Real Estate99
bull Potential real estate benefits from increased resilience of residential andor commercial propertiesstreetscapesneighborhoods included within the project scope
bull Benefit applied to extreme heat hazard for green infrastructure projects directly impacting residential or commercial properties
Quality of Life Health Benefits99
bull Potential quality of life benefits related to improved public health from the resilience measures included within the project scope
bull Benefit applied to extreme heat hazard for green infrastructure projects directly impacting residential or commercial properties
Table 14 lists other typical benefits for reducing impacts from climate stressors and basic guidance for how to estimate them See Section IIID for more information
97 FEMA standard values for avoided mental stress and anxiety and environmental open space values taken from FEMA BCA Toolkit Version 530 (Build Date 12222016)
98 CSO abatement cost taken from APG1 Report for NYC ldquoTechnical Approaches for Benefit-Cost Analysis of Hazard Mitigation Projects in Urban and Coastal Environmentsrdquo (April 2016)
99 Ecosystem Services Real Estate and Quality of LifeHealth benefits tend to be more applicable to green infrastructure measures that provide extreme heat benefits such as green roofs trees and other plantings
NYC Mayorrsquos Office of Recovery and Resiliency Climate Resiliency Design Guidelines
44APPENDIX 4 - PROJECT BENEFITS CATEGORIES
Table 15 ndash Potential benefits for extreme heat (Urban Heat Island) reduction measures
Category Benefit Basic Guidance for Estimating Values
Direct Benefit
Reduced Life Cycle Cost
bull Applicable only to measures such as green roofs that are expected to last longer than standard roofs
bull Compute total cost savings including annual OampM costs
Indirect Benefit
Energy Savings
bull Applicable to measures that reduce energy costs by providing cooling through increased shading andor evapotranspiration
bull Use New York Power Authority rates of $0148kWh for electricity and $0810Therm for natural gas
Other Potential Benefits
Air Quality bull Applicable to measures that absorb pollutants andor reduce carbon dioxide emissions
Acoustics bull Applicable to measures such as green roof or walls that reduce noise transfer
Quality of LifeHealth bull Potential quality of life benefits and related to improved public health
Real Estate bull Applicable to measures that provide residential real estate benefits from increased resilience of propertiesstreetscapesneighborhoods
Retail Sales Marketing
bull Applicable to measures that provide commercial property benefits from increased aesthetics resulting in increased marketing and sales for streetscapesneighborhoods
Tax Credits Incentives
bull Applicable to resilience or green infrastructure measures such as green roofs that have accompanying Federal State or City tax credits or other incentives
Table 15 lists potential benefits for reducing impacts from heat and basic guidance for how to estimate them See Section IIID for more information
NYC Mayorrsquos Office of Recovery and Resiliency Climate Resiliency Design Guidelines
45APPENDIX 4 - PROJECT BENEFITS CATEGORIES
Table 16 ndash Guidance on quantitative calculations for (1) sea level rise with coastal storm surge and (2) increased precipitation measures
Data Input General Guidance ndash Basic Description
Applicable Benefit Category
Applicable Typical Facility Typology
Dire
ct B
enefi
ts
Indi
rect
Ben
efits
Oth
er P
oten
tial
Ben
efits
Bui
ldin
g St
ruct
ures
Com
plex
Fa
cilit
ies
Tran
spor
tatio
nSt
reet
scap
es
Plaz
as
Park
Fea
ture
s
First Floor Elevation (FFE)
bull The elevation of the first finished floor of the structure excluding basements
bull FFE measured from top of lowest floor (riverinenon-coastal high hazard areas) or bottom of lowest horizontal structural member (coastal high hazard areas)
Y Y Y Y
Building Replacement Value (BRV)
bull The unit cost to rebuild a structure of the same quality of construction
bull Not the same as market value
Y Y Y Y
Building Size
bull The total floor area of the building in square feet
bull Total Building Value = BRV x Building Sizebull Typical BRVs for NYC range between $100 to
$325SF for residential buildings and $120 to $450SF for commercialpublic buildings
Y Y Y Y
Structure Description
bull The type of building number of stories and foundation type (full basement partial basement no basement)
bull Collect more detailed foundation data for coastal flood zones
Y Y Y Y
Building Use bull Details related to residential housing commercial business and public use
Y Y Y Y Y
Building Type bull The primary use of building ndash residential commercial public and others
Y Y Y Y Y
Depth Damage Function (DDF)
bull Curves used to estimate structure damage contents damage and displacement of residential buildings based on flood depth
bull DDFs selection based on Structure Description Building Type Building Use
bull Structure DDFs based on percentage of Total Building Value
bull Contents DDFs based on percentage of Total Contents Value
bull Displacement DDFs based on number of displacement days x Displacement Cost
Y Y Y Y Y
Contents Value
bull The cost to replace structure contents (furnishings equipment)
bull Residential building Contents Values typically 50 BRV (FEMA DDFs) or 100 BRV (USACE DDFs)
bull Non-residential building Contents Values between 18 to over 100 depending on building use (USACE DDFs)
bull Total Contents Value = BRV x Building Size
Y Y Y Y Y
Table 16 provides general guidance on how to quantitatively calculate benefits from efforts to address from climate stressors See Section IIIE for more information
NYC Mayorrsquos Office of Recovery and Resiliency Climate Resiliency Design Guidelines
46APPENDIX 4 - PROJECT BENEFITS CATEGORIES
Table 16 ndash Guidance on quantitative calculations for (1) sea level rise with coastal storm surge and (2) increased precipitation measures
Data Input General Guidance ndash Basic Description
Applicable Benefit Category
Applicable Typical Facility Typology
Dire
ct B
enefi
ts
Indi
rect
Ben
efits
Oth
er P
oten
tial
Ben
efits
Bui
ldin
g St
ruct
ures
Com
plex
Fa
cilit
ies
Tran
spor
tatio
nSt
reet
scap
es
Plaz
as
Park
Fea
ture
s
Number of Residents (Residential)
bull Total number of occupants in a residential building
bull Typically estimated based on number of residential units x average number of individuals per household (based on current US Census data or use 25 individuals per household as a default)
Y Y Y Y Y
Displacement Cost (Residential)
bull The unit cost to lodge and feed displaced residents while flood damage is repaired
bull Average unit displacement cost of $415residential unitday recommended based on current FY2018 GSA Per Diem rates for New York City
Y Y Y Y Y
Value of Service (Non-Residential and Public)
bull The unit cost of service disruption and rental of temporary facilities while flood damage is repaired
bull Disruption costs for non-residential buildings typically range from $095 to $136SFmonth and rental costs range from $020 to $136SFmonth depending on building use
bull Value of service for public buildings ($day) is typically based on the annual operating budget for the City agency using the building prorated based on building size or population served by the building then divided by 365 daysyear
Y Y Y Y
Value of Service (Critical Facilities)
bull The unit cost of critical facilities (police fire emergency medical services) lost or delayed while flood damage is repaired
Y Y Y
Value of Service Duration
bull The duration of service disruption and rental of temporary facilities for non-residential buildings and critical facilities while flood damage is repaired
bull For non-residential buildingso Value of Service Durations vary from
4 months to over 30 months based on building use and the depth of flooding
o Total Value of Service Loss = (Disruption Cost x Building Area) = (Rental Cost x Building Area x Value of Service Duration)
bull For public buildings and critical facilitieso Value of Service Durations vary from 0
days to 720 months based on building use and the depth of flooding from FEMA FIA or USACE DDFs
o Total Value of Service Loss = (Value of Service) x (Service Loss Duration)
Y Y Y
NYC Mayorrsquos Office of Recovery and Resiliency Climate Resiliency Design Guidelines
47APPENDIX 4 - PROJECT BENEFITS CATEGORIES
Table 16 ndash Guidance on quantitative calculations for (1) sea level rise with coastal storm surge and (2) increased precipitation measures
Data Input General Guidance ndash Basic Description
Applicable Benefit Category
Applicable Typical Facility Typology
Dire
ct B
enefi
ts
Indi
rect
Ben
efits
Oth
er P
oten
tial
Ben
efits
Bui
ldin
g St
ruct
ures
Com
plex
Fa
cilit
ies
Tran
spor
tatio
nSt
reet
scap
es
Plaz
as
Park
Fea
ture
s
Engineering Estimates for Damages
bull Engineered estimate models of physical damages and service losses at the project site based on the Guidelines event recurrence interval(s) and flood depth(s)
Y Y Y Y Y Y
Historic Damages and Service Losses
bull Historic physical damages and service losses at the project site documented from previous flood events
bull Do not use routine maintenancebull The historic damage event recurrence interval
(RIs) andor flood depths must be determined updated for inflation to the present value and adjusted to match the Guidelines event RIsflood depths
Y Y Y Y Y Y
Facility Replacement Value
bull The unit cost to rebuild the facility
Impacted Area bull The geographic area impacted by the facility in the event of failure in acres
Y Y Y Y
Facility Capacity
bull The design capacity of the facilitybull For example - facility capacity expressed in
millions of gallons per day (MGD) for water and wastewater facilities or megawatts (MW) for electrical facilities
Y Y Y Y
Service Population
bull The number of impacted residents served by the facility
bull Typically estimated based on number of impacted residential customers x average number of individuals per household (based on current US Census data or use 25 individuals per household as a default)
bull Facilities serving mostly non-residentialpublic buildings andor critical facilities should focus on service losses rather than service population
Y Y Y
NYC Mayorrsquos Office of Recovery and Resiliency Climate Resiliency Design Guidelines
48APPENDIX 4 - PROJECT BENEFITS CATEGORIES
Table 16 ndash Guidance on quantitative calculations for (1) sea level rise with coastal storm surge and (2) increased precipitation measures
Data Input General Guidance ndash Basic Description
Applicable Benefit Category
Applicable Typical Facility Typology
Dire
ct B
enefi
ts
Indi
rect
Ben
efits
Oth
er P
oten
tial
Ben
efits
Bui
ldin
g St
ruct
ures
Com
plex
Fa
cilit
ies
Tran
spor
tatio
nSt
reet
scap
es
Plaz
as
Park
Fea
ture
s
Value of Service
bull Unit value of service provided by the facilitybull Example of FEMA standard values for complete
loss of utility service $105personday for potable water$49personday for wastewater$148personday for electrical
bull Consider updating FEMA standard per capita values to reflect current The New York City utility rates
Y Y
Roadway Elevations bull Roadway Elevations
Y Y
Roadway Replacement Value
bull Roadway Replacement ValueY Y
Inundation Area Map
bull Inundation Area Map developed by FEMA or through modeling by project design team
Y Y Y
Building Inventory of Inundation Area
bull The number and type of buildings within the streetscape and neighborhood inundated by the Guidelinersquos flood events
Y Y Y
Average Daily Traffic (ADT)
bull The average number of one-way traffic trips per day along the roadway(s) within the streetscapeneighborhood inundated by the Guidelinersquos flood events
Y Y
Additional Travel Time
bull The additional travel time needed to detour around a flooded roadway expressed in minutes
bull In the unlikely event there is no detour available use a 12-hour travel time per one-way trap but provide a detailed area street map as supporting documentation
Y Y
Value of Traffic Delay
bull The value of service associated with lost time in traffic
bull For example - FEMA standard average value of $3344vehiclehour of delay
bull Consider updating FEMA and GSA standard values to reflect current New York City area labor rates and fuel costs
Y Y
NYC Mayorrsquos Office of Recovery and Resiliency Climate Resiliency Design Guidelines
49APPENDIX 4 - PROJECT BENEFITS CATEGORIES
Table 17 ndash Guidance on quantitative unit benefit calculations for extreme heat hazard measures
Measure General Guidance ndash Unit Benefit Information and Data Requirements
Applicable Benefit Category
Applicable Typical Facility Typology
Dire
ct B
enefi
ts
Indi
rect
Ben
efits
Oth
er P
oten
tial
Ben
efits
Bui
ldin
g St
ruct
ures
Com
plex
Fa
cilit
ies
Tran
spor
tatio
nSt
reet
scap
es
Plaz
as
Park
Fea
ture
s
Green Roof
bull Unit benefit range over PUL = $470SF to $373SF of green roof area ($719SF standard value)
bull Assumed PUL = 40 yearsbull Apply standard value unit benefit to green
roof area to estimate measure benefitbull Higher range values more applicable
to residential and commercial building streetscape projects
Y Y Y Y Y Y
Bioswale Rain Garden Meadow Mix
bull Unit benefit range over PUL = $396SF to $211SF of area ($730SF standard value)
bull Assumed PUL = 30 yearsbull Apply standard value unit benefit to bioswale
rain gardenmeadow mix area to estimate total measure benefit
Y Y Y Y Y Y
Cool Roof
bull Unit benefit range over PUL = $117 to $3151SF of material area ($144SF standard value)
bull Assumed PUL = 20 yearsbull Apply standard value unit benefit to cool roof
area to estimate total measure benefitbull Higher range values more applicable to
residential building streetscape projects
Y Y Y Y Y
Light-Colored PaversLight-Colored Materials
bull Unit benefit range over PUL = $0774 to $204SF of material area ($0866SF standard value)
bull Assumed PUL = 30 yearsbull Apply standard value unit benefit to material
area to estimate total measure benefit
Y Y Y Y
Table 17 provides general guidance on how to quantitatively calculate benefits from efforts to address climate stressors See Section IIIE for more information
NYC Mayorrsquos Office of Recovery and Resiliency Climate Resiliency Design Guidelines
50APPENDIX 4 - PROJECT BENEFITS CATEGORIES
Table 17 ndash Guidance on quantitative unit benefit calculations for extreme heat hazard measures
Measure General Guidance ndash Unit Benefit Information and Data Requirements
Applicable Benefit Category
Applicable Typical Facility Typology
Dire
ct B
enefi
ts
Indi
rect
Ben
efits
Oth
er P
oten
tial
Ben
efits
Bui
ldin
g St
ruct
ures
Com
plex
Fa
cilit
ies
Tran
spor
tatio
nSt
reet
scap
es
Plaz
as
Park
Fea
ture
s
Tree Planting
bull Unit benefit range over PUL = $1005 to $77154Tree ($1855Tree standard value)
bull Assumed PUL = 30 yearsbull Apply standard value unit benefit to number of
trees to estimate total measure benefitbull Higher range values more applicable
to residential and commercial building streetscape projects
Y Y Y Y Y Y
Planter Box Tree
bull Unit benefit range over PUL = $212 to 16304Tree ($392Tree standard value)
bull Assumed PUL = 15 yearsbull Apply standard value unit benefit to number of
trees to estimate total measure benefitbull Higher range values more applicable
to residential and commercial building streetscape projects
Y Y Y Y Y
Shade Canopy
bull Unit benefit range over PUL = $0363 to $396SF ($0458SF standard value)
bull Assumed PUL = 15 yearsbull Apply standard value unit benefit to area of
shade canopy estimate total measure benefitbull Higher range values more applicable
to residential and commercial building streetscape projects
Y Y Y Y
Permeable Grass Pavers
bull Unit benefit range over PUL = $0258SF to $0521SF of pavers ($0363SF standard value)
bull Assumed PUL = 30 yearsbull Apply standard value unit benefit to paver
area to estimate total measure benefit
Y Y Y Y Y
For the purposes of the BCA refer to the following facility typologies bull ldquoBuilding Structuresrdquo include critical small building sites such as EMS or FDNY stations and non-critical small building sites such as
libraries or comfort stationsbull ldquoComplex Facilitiesrdquo include critical infrastructure such as wastewater treatment sites pump stations water filtration plants and similar
large or complex facilitiesbull ldquoTransportationStreetscapePlazasrdquo include roadway reconstruction streetscape improvements street raising plazas and other
transportation-related infrastructurebull ldquoPark Featuresrdquo include parks and similar public recreational facility with natural landscape features
NYC Mayorrsquos Office of Recovery and Resiliency Climate Resiliency Design Guidelines
51APPENDIX 5 - EXAMPLE PLANNING DECISION TREE
This decision tree provides a summarized example approach for how to implement these Guidelines Projects with a total cost greater than $50 million are recommended to conduct a full qualitative and quantitative climate change risk assessment and BCA while projects below $50 million are recommended to conduct a qualitative risk assessment and BCA
Define Project
1) Operational goals and criticality level2) Useful life3) Location in the current flood plain future floodplain and or zone
of tidal inundation and the project arearsquos score on the heat vulnerability index
Evaluate Project Risks According to Probability and Magnitude of Consequence
bull Extreme Heat bull Precipitationbull Sea Level Risebull Coastal Surge
High Level Identification and Assessment of Risk Mitigation Alternatives and Co-benefits
(qualitative)
Detailed Identification and Assessment of Risk Mitigation Alternatives and Co-benefits (qualitative and quantitative)
High Level Estimate of Costs and Benefits of Design Alternatives
(qualitative)
Detailed Estimate of Costs and Benefits of Design Alternatives
(qualitative and quantitative)
Decision Point Which climate change risks require mitigation
Decision Point Evaluate risk mitigation benefits and costs to
determine final resilient design alternative or if no action is required
Decision Point Is the total project cost above $50 million
Below $50 million Above $50 million
APPENDIX 5 - EXAMPLE PLANNING DECISION TREE
NYC Mayorrsquos Office of Recovery and Resiliency Climate Resiliency Design Guidelines
52
Project Title
Design Strategies Checklist (not exhaustive)
Extreme Heat Comments Extreme Precipitation Comments Sea Level Rise amp Storm Surge Comments
Select Site in Low Heat Vulnerability Index area Select High Elevation Site Select High Elevation Site
Minimize East-West Building Orientation Green Roof Raise Building Floor Elevation
Passive Solar Cooling and Ventilation Systems
Protect Below Grade Areas from Flooding Waterproof Building Envelope
Cool Roof (SRI appropriate) On-site Stormwater Management (gray) Elevate Critical Building Functions
Green Roof (extensive) Reduce Impervious Areas Elevate Critical Equipment
Vegetative Structures Permeable Pavement Perimeter Floodwall100 Levee (passive or active)
Enhanced HVAC System including space layout optimization and system scalability
Increase Green Spaces and Planted Areas DryWet Floodproofing
More Efficient Building Envelope Other Utility Redundancy Design101
Parking Lot Shading Resilient Materials amp Landscape Treatments
Light Colored Pavements (appropriate SRI) Design for Storm Surge Outflow
Increase Planted Areas Install Backwater Flow Prevention
Permeable Surfaces Design for Scour
Open-grid Pavement Raise Road Elevation
Other Other
This appendix provides a template for identifying possible design strategies to address climate change risks as described throughout the Guidelines
APPENDIX 6 - DESIGN STRATEGIES CHECKLIST
100 Permanent perimeter flood walls are not permitted to meet floodproofing requirements in buildings with substantial improvements andor damages 101 Utility redundancy design should be pursued for critical systems not all building systems
APPENDIX 6 - DESIGN STRATEGIES CHECKLIST
NYC Mayorrsquos Office of Recovery and Resiliency Climate Resiliency Design Guidelines
53APPENDIX 7 - CLIMATE CHANGE RISK ASSESSMENT RESOURCES
These Guidelines provide data on climate change hazards and recommend how that data can inform resilient design A risk assessment is a tool to help project managers and designers evaluate risk levels as well as select and prioritize resilient design strategies A high level risk assessment is recommended for all City capital projects with a total cost of under $50 million Projects above $50 million are recommended to conduct an in-depth assessment
Risk assessments use quantified estimates of the probability and magnitude of consequence of an event occurring to prioritize responses ldquoProbabilityrdquo is an assessment of the likelihood of a hazard occurring while ldquomagnituderdquo describes the hazardrsquos potential impact Risk assessment tools such as the examples listed below can be used to define and score these categories Projects that score higher across both probability and magnitude can be prioritized for investment and risk mitigation action Projects that score lower across both criteria may require no action beyond meeting code The results are typically charted on a risk matrix and an example is provided on the next page
The climate change risk management frameworks below offer templates for how to integrate climate change projections into a risk assessment process Refer to these resources for examples and further information
bull Vulnerability Assessment and Adaptation Framework is prepared by the Federal Highway Administration (FHWA) While developed for transportation planning this risk assessment framework has broad applicability for evaluating asset vulnerability to climate change Available at httpswwwfhwadotgovenvironmentsustainabilityresilienceadaptation_framework
bull US Climate Resilience Toolkit The US Global Change Research Program offers a step by step risk assessment
framework including tools and case studies at httpstoolkitclimategovsteps (see example on next page)
bull Coast Adapt Guidance on undertaking a risk assessment High level assessment httpscoastadaptcomausitesdefaultfilesfactsheetsT3M4_2_2nd_pass_risk_assessmentpdfDetailed assessment httpscoastadaptcomausitesdefaultfilesfactsheetsT3M4_3_3rd_pass_risk_assessmentpdf
bull Climate adaptation Risk uncertainty and decision-makingDownload the report here httpswwwukciporgukpublicationsRisk
The City plans to develop a NYC-specific process for integrating climate change data into existing risk management processes by April 2019
APPENDIX 7 - CLIMATE CHANGE RISK ASSESSMENT RESOURCES
NYC Mayorrsquos Office of Recovery and Resiliency Climate Resiliency Design Guidelines
54APPENDIX 7 - CLIMATE CHANGE RISK ASSESSMENT RESOURCES
The Risk Characterization Matrix below is an example from the US Climate Resilience Toolkit This tool can be used to assess the probability and magnitude of impact for identified risks The risk of coincident climate stressorsrisks (such as storm surge plus increased precipitation) can also be assessed as applicable
Figure 14 - Example of a climate change risk matrix (adapted from US Climate Resilience Toolkit)
Project teams can determine the magnitude of the impact (along the horizontal scale of 1 through 3 with 3 being the most severe) and the probabilitylikelihood of occurrence for each specific risk (along the vertical scale with 3 being the most likely) A score is typically assigned for each risk (Probabil-ity x Magnitude) and then charted on the matrix Based on the estimated probability and magnitude of consequence above the risks are ranked and prioritized for mitigation Factors to bear in mind include
bull Not all facility typologies have the same level of functional and operational importance during events or tolerance for disruption
bull Not all climate stressors and risks have the same level of impact on each project sitebull Not all identified risks can or should be mitigated fully
NYC Mayorrsquos Office of Recovery and Resiliency Climate Resiliency Design Guidelines
55WORKS CITED
A Stronger More Resilient New York PlaNYC Report of the NYC Special Initiative for Rebuilding and Resiliency The City of New York 2013
ldquoAccount for Climate Riskrdquo International Finance Corporation accessed March 27 2017 httpwwwifcorgwpswcmconnectTopics_Ext_ContentIFC_External_Corporate_SiteClimate+Business
PrioritiesAccount+for+Climate+Risk
American Society of Heating Refrigeration and Air-Conditioning Engineers (ASHRAE) Handbook -Fundamentals 2017
ldquoBaseline Standard Economic Value Methodology Reportrdquo Federal Emergency Management Agency July 2016
Benefit Cost Analysis Toolkit Software Version 530 Federal Emergency Management Agency (build date December 2016)
Criteria for Detention Facility Design New York City Department of Environmental Protection November 2012
Community Resilience Planning Guide for Buildings and Infrastructure Systems Vol 1 NIST Special Publication 1190 US Department of Commerce 2016
Cool and Green Roofing Manual NYC Department of Design and Construction 2007 httpwwwnycgovhtmlddcdownloadspdfcool_green_roof_manpdf
Building Resiliency Task Force US Urban Green Building Council New York 2013 httpurbangreencouncilforcecomBuildingResiliency
Design and Planning for Flood Resiliency Guidelines for NYC Parks New York City Department of Parks and Recreation 2017
httpswwwnycgovparksorgplanning-and-buildingplanningresiliency-plansflood-resiliency
Flooded Bus Barns and Buckled Rails Federal Transit Administration Office of Budget and Policy 2011 httpswwwhsdlorgabstractampdid=685187
Floodproofing Non-Residential Buildings FEMA P936 FEMA 2013 httpswwwfemagovmedia-library-data9a50c534fc5895799321dcdd4b6083e7P-936_8-20-13_508rpdf
ldquoGlossaryrdquo International Infrastructure Management Manual National Asset Management Support Group New Zealand 2011 httpwwwipweaorg
ldquoGreen Roof Metrics Draft Reportrdquo New York City Department of Parks and Recreation 2017
ldquoGuide to Rain Event Preparednessrdquo NYC Department of Environmental Protection httpwwwnycgovhtmldeppdfbrochuresflood-preparedness-flyerpdf
ldquoGuidelines and Discount Rates for Benefit-Cost Analysis of Federal Programsrdquo Appendix C Circular A-94 US Office of Management and Budget (OMB) 2017
ldquoGuidelines for the Design and Construction of Stormwater Management Systemsrdquo New York City Department of Environmental Protection July 2012
Horton R et al New York City Panel on Climate Change 2015 Report Ann NY Acad Sci ISSN 0077-892 New York 2015
Madrigano J et al ldquoA case-only study of vulnerability to heat wavendashrelated mortality in New York City (2000ndash2011)rdquo Environmental Health Perspectives 123672ndash678 2013
WORKS CITED
NYC Mayorrsquos Office of Recovery and Resiliency Climate Resiliency Design Guidelines
56WORKS CITED
enspMcGregor et al Two Degrees The Built Environment and Our Changing Climate Routledge Press 2013
NYC Green Codes Task Force US Green Building Council New York 2010 httpurbangreencouncilorgGreenCodes
NYCrsquos Risk Landscape A Guide to Hazard Mitigation NYC Emergency Management 2014
One New York The Plan for a Strong and Just City The City of New York 2015 httpwwwnycgovhtmlonenyc downloadspdfpublicationsOneNYCpdf
Ready to Respond Strategies for Multifamily Building Resilience Enterprise Green Communities 2015 httpswwwenterprisecommunityorgresources
Rosenzweig C et al Climate Change Adaptation in New York City Building a Risk Management Response New York City Panel on Climate Change 2010
httponlinelibrarywileycomdoi101111nyas20101196issue-1 issuetoc
ldquoSustainable Infrastructure Management Program Learning Environmentrdquo Water Environment Research Foundation accessed March 24 2017 httpsimplewerforg
Urban Waterfront Adaptive Strategies NYC Department of City Planning 2013 httpwww1nycgovsiteplanningplanssustainable-communitiesclimate-resiliencepagetab=1
Wastewater Resiliency Plan Climate Risk Assessment and Adaptation Study New York City Department of Environmental Protection October 2013
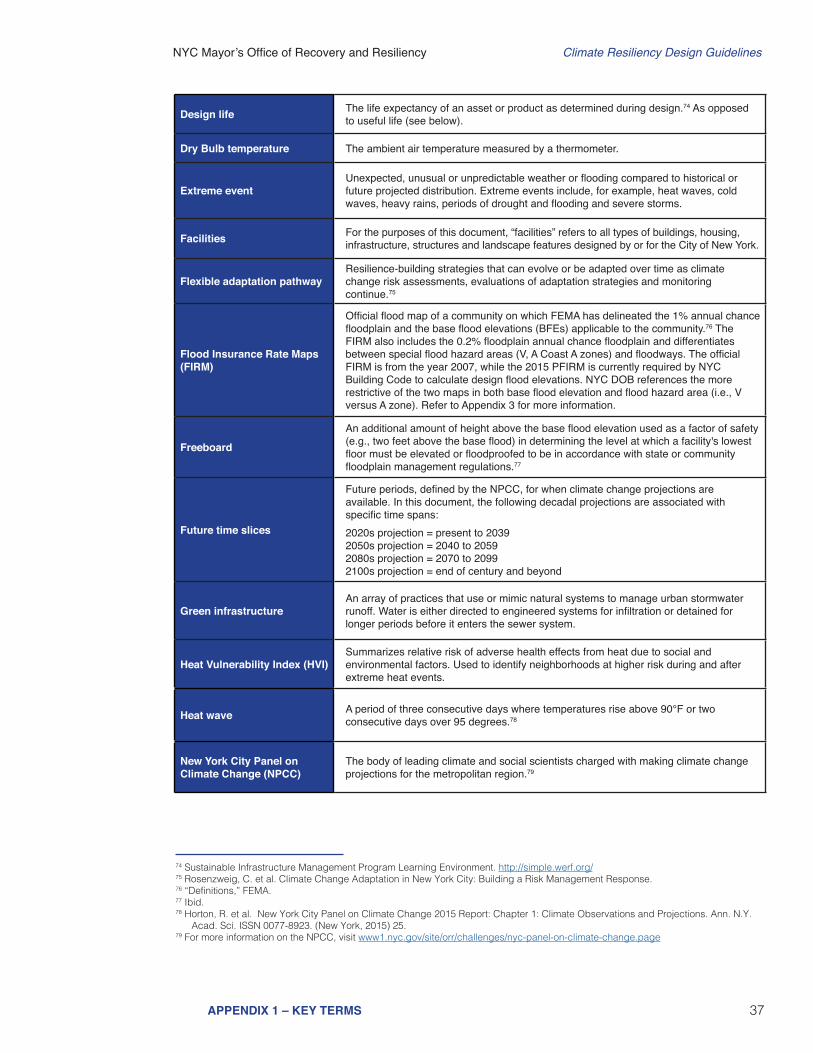
NYC Mayorrsquos Office of Recovery and Resiliency Climate Resiliency Design Guidelines
38APPENDIX 1 ndash KEY TERMS
Open-grid pavement system
Pavements that consist of loose substrates supported by a grid of a more structurally sound grid or webbing Unbounded loose substrates in these systems transfer and store less heat than bound and compacted pavements and aid permeability Pavement is 50 pervious and contains vegetation in the open cells designed to allow percolation or infiltration of storm water through the surface into the soil below80
Preliminary Flood Insurance Rate Map (PFIRM)
Preliminary flood map developed by FEMA in 2015 for New York City that provides projected risks for flood hazards81 Refer to Appendix 3 for more information
Project useful life (PUL)
The period over which an asset or component is expected to be available for use by an entity This depends on regular and adequate maintenance This period of time typically exceeds the design life (see above) The combined effect of operational requirements and useful life is practical in assessing an investment in improving resilience82
Rain gardenAlso called ldquobioswalerdquo Planted areas designed to collect and manage stormwater that runs off streets sidewalks commercial and residential rooftops and other sources when it rains
Resiliency The ability to bounce back after change or adversity The capability of preparing for responding to and recovering from difficult conditions83
Sea level rise-adjusted design flood elevation
As defined in these Guidelines the increased height of the base flood elevation due to sea level rise plus freeboard depending on the criticality of the facility The sea level rise adjustment depends on the useful life of the facility
Storm surge An abnormal rise of water generated by a storm over and above predicted astronomical tides84
Substantial improvementAny repair reconstruction rehabilitation addition or improvement of a building or structure the cost which equals or exceeds 50 of the market value of the structure before the improvement or repairs started For more information see Appendix G of the NYC Building Code and 1 RCNY sect3606-0185
Tidal inundation Flooding which occurs at high tides due to climate-related sea level rise land subsidence andor the loss of natural barriers86
Urban Heat Island (UHI) effectThe tendency for higher air temperatures to persist in urban areas as a result of heat absorbed and emitted by buildings and asphalt tending to make cities warmer than the surrounding suburban and rural areas
Weather The state of the atmosphere at a given time with regard to temperature cloudiness precipitation wind and other meteorological conditions87
Wet Bulb temperatureThe temperature indicated when a thermometer bulb is covered with a water-saturated wick over which air is caused to flow at approximately 45 ms (900 ftmin) to reach the equilibrium temperature of water evaporating into the air when the heat of vaporization is supplied by the sensible heat of the air88
80 ldquoGlossaryrdquo US Green Building Council (2017) Available at httpwwwusgbcorgglossaryterm552581 ldquoPreliminary FEMA Map Productsrdquo FEMA Map Service Center Available at httpshazardsfemagovfemaportalprelimdownload82 ldquoGlossaryrdquo International Infrastructure Management Manual (2011) 83 A Stronger More Resilient New York (2013) 184 ldquoStorm Surge Overviewrdquo National Hurricane Center NOAA Available at httpswwwnhcnoaagovsurge85 ldquoFlood Resistant Constructionrdquo Appendix G New York City Building Code (2008) and 1 RCNY sect3606-01 available at httpswww1nycgovassetsbuildingsrules1_RCNY_3606-01pdf86 ldquoOcean Factsrdquo National Ocean Service NOAA Available at httpoceanservicenoaagovfactsnuisance-floodinghtml 87 UKCIP Glossary httpwwwukciporgukglossary88 ldquoASHRAE Terminologyrdquo ASHRAE Available at httpswwwashraeorgtechnical-resourcesauthoring-toolsterminology
NYC Mayorrsquos Office of Recovery and Resiliency Climate Resiliency Design Guidelines
39APPENDIX 2 - CLIMATE CHANGE PROJECTIONS
Climate change projections are provided by the New York City Panel on Climate Change (NPCC) The full NPCC report is available from the New York Academy of Sciences89 Tables 8-10 (below) were reproduced directly from the NPCC report while Table 2 (see Section IIA) was developed using the data underlying the NPCC report to inform the design of HVAC systems under warmer conditions
Table 8 ndash NYC sea level rise projections90
Baseline (2000-2004) 0 in
Low estimate (10th percentile)
Middle range (25th to 75th percentile)
High estimate (90th percentile)
2020s 2 in 4-8 in 10 in
2050s 8 in 11-21 in 30 in
2080s 13 in 18-39 in 58 in
2100 15 in 22-50 in 75 in
Note Projections are based on six-component approach that incorporates both local and global factors The model-based components are from 24 global climate models and two representative concentration pathways Projections are relative to the 2000-2004 base period
Table 9 ndash Mean annual changes91
a Temperature Baseline(1971-2000) 54degF
Low estimate (10th percentile)
Middle range (25th to 75th percentile)
High estimate (90th percentile)
2020s + 15degF +20-29degF +32degF
2050s +31degF +41-57degF +66degF
2080s +38degF +53-88degF +103degF
2100 +42degF +58-104degF +121F
b Precipitation Baseline(1971-2000) 501 in
Low estimate (10th percentile)
Middle range (25th to 75th percentile)
High estimate (90th percentile)
2020s -1 percent +1-8 +10
2050s +1 percent +4-11 +13
2080s +2 percent +5-13 +19
2100 -6 percent -1 to +19 +25
Note Based on 35 global climate models (GCMs) and two RCPs Baseline data cover the 1971ndash2000 base period and are from the NOAA National Climatic Data Center (NCDC) Shown are the low estimate (10th percentile) middle range (25th percentile to 75th percentile) and high estimate (90th percentile) These estimates are based on a ranking (from most to least) of the 70 (35 GCMs times 2 RCPs) projections The 90th percentile is defined as the value that 90 percent of the outcomes (or 63 of the 70 values) are the same or lower than Like all projections the NPCC climate change projections have uncertainty embedded within them Sources of uncertainty include data and modeling constraints the random nature of some parts of the climate system and limited understanding of some physical processes The NPCC characterizes levels of uncertainty using state-of-the-art climate models multiple scenarios of future greenhouse gas concentrations and recent peer-reviewed literature Even so the projections are not true probabilities and the potential for error should be acknowledged
89 The NPCC 2015 report is available at httponlinelibrarywileycomdoi101111nyas20151336issue-1issuetoc90 From New York City Panel on Climate Change 2015 Report Chapter 1 Climate Observations and Projections page 4191 From New York City Panel on Climate Change 2015 Report Chapter 1 Climate Observations and Projections page 30
APPENDIX 2 - CLIMATE CHANGE PROJECTIONS
NYC Mayorrsquos Office of Recovery and Resiliency Climate Resiliency Design Guidelines
40APPENDIX 2 - CLIMATE CHANGE PROJECTIONS
Table 10 ndash Extreme events92
2020s Baseline (1971-2000)
Low estimate(10th percentile)
Middle range(25th to 75th percentile)
High estimate (90th percentile)
Numbers of heat waves per year 2 3 3-4 4
Average heat wave duration (days) 4 5 5 5
Number of days per year with
Maximum temperature at or above 90degF 18 24 26-31 33
Maximum temperature at or above 100degF 04 07 1-2 2
Minimum temperature at or below 32degF 71 50 52-58 60
Rainfall at or above 1 inch 13 13 14-15 16
Rainfall at or above 2 inches 3 3 3-4 5
Rainfall at or above 4 inches 03 02 03ndash04 05
2050s Baseline (1971-2000)
Low estimate(10th percentile)
Middle range(25th to 75th percentile)
High estimate (90th percentile)
Numbers of heat waves per year 2 4 5-7 7
Average heat wave duration (days) 4 5 5-6 6
Number of days per year with
Maximum temperature at or above 90degF 18 32 39-52 57
Maximum temperature at or above 100degF 04 2 3-5 7
Minimum temperature at or below 32degF 71 37 42-48 52
Rainfall at or above 1 inch 13 13 14-16 17
Rainfall at or above 2 inches 3 3 4-4 5
Rainfall at or above 4 inches 03 03 03-04 05
2080s Baseline (1971-2000)
Low estimate(10th percentile)
Middle range(25th to 75th percentile)
High estimate (90th percentile)
Numbers of heat waves per year 2 5 6-9 9
Average heat wave duration (days) 4 5 5-7 8
Number of days per year with
Maximum temperature at or above 90degF 18 38 44-76 87
Maximum temperature at or above 100degF 04 2 4-14 20
Minimum temperature at or below 32degF 71 25 30-42 49
Rainfall at or above 1 inch 13 14 15-17 18
Rainfall at or above 2 inches 3 3 4-5 5
Rainfall at or above 4 inches 03 02 03-05 07
Note Projections for temperature and precipitation are based on 35 GCMs and 2 RCPs Baseline data are for the 1971 to 2000 base period and are from the NOAA National Climatic Data Center (NCDC) Shown are the low estimate (10th percentile) middle range (25th to 75th percentile) and high estimate (90th percentile) 30-year mean values from model-based outcomes Decimal places are shown for values less than one although this does not indicate higher precisioncertainty Heat waves are defined as three or more consecutive days with maximum temperatures at or above 90degF Like all projections the NPCC climate change projections have uncertainty embedded within them Sources of uncertainty include data and modeling constraints the random nature of some parts of the climate system and limited understanding of some physical processes The NPCC characterizes levels of uncertainty using state-of-the-art climate models multiple scenarios of future greenhouse gas concentrations and recent peer-reviewed literature Even so the projections are not true probabilities and the potential for error should be acknowledged
92 From New York City Panel on Climate Change 2015 Report Chapter 1 Climate Observations and Projections page 31
NYC Mayorrsquos Office of Recovery and Resiliency Climate Resiliency Design Guidelines
41APPENDIX 3 - DIFFERENTIATION OF FLOOD MAPS
These Guidelines reference several different kinds of flood maps and sources of design flood elevations These maps are described and differentiated below
Table 11 - Differentiation of flood maps used in NYC
Reference Title Data Source Information Provided Referenced By Link
2007 FIRM FEMA
Based on historical data from before 1983 identifies the current base flood (extent and elevation) as the flood that has a 1 chance of occurring in any given year also known as a 100-year flood The NYC Building Code requires that either the 2007 FIRM or 2015 PFIRM elevation be used whichever is higher
2014 NYC Building Code Appendix G
Climate Resiliency Design Guidelines
httpsmscfemagovportal
2015 PFIRM FEMA
Based on historical data identifies the current base flood (extents and elevation) as the flood that has a 1 chance of occurring in any given year also known as a 100-year flood The NYC Building Code requires that either the 2007 FIRM or 2015 PFIRM elevation be used whichever is higher The 2015 PFIRM is currently being reassessed by FEMA
2014 NYC Building Code Appendix G
Climate Resiliency Design Guidelines
httpshazardsfemagovfemaportalprelimdownload
httpwwwregion2coastalcomview-flood-maps-dataview-preliminary-flood-map-data
NYC Flood Hazard Mapper
NYC Department of City Planning
Maps current and future flood hazards in NYC including the following data layers 2007 FIRM and 2015 PFIRM high tide with sea level rise and PFIRM with sea level rise through 2100
Climate Resiliency Design Guidelines
Waterfront Revitalization Plan
httpwww1nycgovsiteplanningdata-mapsflood-hazard-mapperpage
ldquoTable 4 ndash Determine the sea level rise-adjusted design flood elevation for critical and non-critical facilitiesrdquo
ORR amp NPCC
Provides data to use when adding sea level rise to a given 2015 PFIRM or 2007 FIRM Base Flood Elevation (BFE) to calculate a Design Flood Elevation (DFE) Based on the criticality and expected useful life of a facility
Climate Resiliency Design Guidelines
See Section II on ldquoSea Level Riserdquo above
APPENDIX 3 - DIFFERENTIATION OF FLOOD MAPS
NYC Mayorrsquos Office of Recovery and Resiliency Climate Resiliency Design Guidelines
42APPENDIX 4 - PROJECT BENEFITS CATEGORIES
This appendix provides guidance on how to identify and assess benefits as a supplement to Sections IIID and IIIE
Table 12 lists typical direct benefits for reducing impacts from climate stressors and basic guidance for how to estimate them See Section IIID for more information
Table 13 lists typical indirect benefits for reducing impacts from climate stressors and basic guidance for how to estimate them See Section IIID for more information
Table 12 ndash Direct benefits for (1) sea level rise with coastal storm surge and (2) increased precipitation measures
Direct Benefit Basic Guidance for Estimating Values
Physical Damages (Structure Contents)
bull For flood-damaged buildings use depth damage functions developed by FEMA and USACE for structures and contents
bull Use depth damage functions in conjunction with Building Replacement Values (BRVs) and not market values BRVs typically range between $100 to $325SF for residential buildings and $120 to $450SF for commercial public buildings
bull For more complex structures or facilities use engineering estimates of flood damages or review historic flood damages documented from insurance claims repair records or FEMA Public Assistance claims from recent flood disasters
Residential Displacements
bull For flood-damaged buildings use depth damage functions developed by FEMA and USACE for residential displacements
Reduced Life CycleOperation and Maintenance (OampM) Costs93
bull Applicable only to projects that reduce overall life cycle costs or net annual OampM costs from baseline conditions
bull Input reduced annual OampM costs as a project benefit at a 1-year recurrence intervalbull Reduced overall life cycle costs can be input as a longer project useful life
Table 13 ndash Indirect benefits for (1) sea level rise with coastal storm surge and (2) increased precipitation measures
Indirect Benefit Basic Guidance for Estimating Values
Non-Residential Building Service Losses
bull Estimate service loss values and durations for non-residential buildings public buildings critical facilities and parksnatural features based on FEMA BCA guidance and standard values based on building use
Utility Service Losses94
bull Estimate utility service losses for water wastewater and electrical facilities based on the number of impacted customers FEMA per capita standard values for utility service ($105personday for potable water $49personday for wastewater $148personday for electrical)95
bull Estimate utility service loss durations based on engineering estimates or review historic flood damages losses documented from utility company records
bull This benefit can also apply to measures that increase energy efficiency
RoadBridge Service Losses
bull Estimate roadbridge service losses based on the average daily traffic (ADT) detour time and additional travel distance and FEMA and GSA standard values for road service ($3344vehiclehour of delay $0545mile)96
bull Estimate roadbridge service loss durations or review historic flood damages losses
Emergency Service Losses
bull Applicable only to projects that reduce or eliminate documented emergency service costs from baseline conditions
bull Examples of avoided emergency services costs include NYPD staffing to monitor barricades for flooded roads or NFDY staffing for water rescues of residents from flooded buildings or streets
APPENDIX 4 - PROJECT BENEFITS CATEGORIES
93 Reduced life cycle costs may be applicable to some measures that provide extreme heat benefits such as green roofs that can last longer than a standard roof if properly maintained
94 Reduced utility service costs may be applicable to some measures that provide extreme heat benefits such as cool roofs green roofs and shade trees
95 FEMA per capita standard values taken from FEMA BCA Toolkit Version 530 (Build Date 12222016) and developed in FEMArsquos Baseline Standard Economic Value Methodology Report (July 28 2016) Consider updating FEMA standard per capita values to reflect current New York City utility rates
96 Consider updating FEMA and GSA standard values to reflect current New York City area labor rates and fuel costs
NYC Mayorrsquos Office of Recovery and Resiliency Climate Resiliency Design Guidelines
43APPENDIX 4 - PROJECT BENEFITS CATEGORIES
Table 14 ndash Other potential benefits for (1) sea level rise with coastal storm surge and (2) increased precipitation measures
Other Benefit Basic Guidance for Estimating Values
Avoided Stress and Anxiety
bull Applicable only for projects that directly benefit occupants of residential structuresbull Use FEMA standard value for avoided mental stress and anxiety treatment costs of $2443person to
estimate benefit for all impacted residents97
Avoided Lost Productivity
bull Applicable only for projects that directly benefit occupants of residential structuresbull Use FEMA standard value for avoided lost worker productivity costs of $8736household to estimate
benefit for all impacted workers (conservatively assuming one worker per household)
Environmental Open Space
bull Applicable only for projects that create or acquire open space areas by acquisitionbull Use FEMA standard value for environmental open space based on the type of land acquired ($8308
Acreyear for Green open space $39545Acreyear for Riparian $6010Acreyear for Wetlands $554Acreyear for Forests $1799Year for Marine and estuary)97
CSO Volume Reduction
bull Applicable only for projects that provide Combined Sewer Overflow (CSO) abatement by reducing the volume of rainfall runoff
bull Use CSO abatement cost of $0015gallonsyear applied to increased precipitation hazard runoff volume for 5-year design storm98
Ecosystem Service99
bull Add stormwater management benefits of green infrastructure projects to increased precipitation hazards where avoided damages and service losses are not quantified
bull Unit benefits applicable to increased precipitation hazard includeo Green roofs $0133SFyear (PUL 40 years)o BioswaleRain GardenMeadow Mix $0020SFyear (PUL 30 years)o Permeable Grass Pavers $0020SFyear (PUL 30 years)o Tree Plantings $303Treeyear (PUL 30 years)o Planter Box Trees $101Treeyear (PUL 15 years)
Real Estate99
bull Potential real estate benefits from increased resilience of residential andor commercial propertiesstreetscapesneighborhoods included within the project scope
bull Benefit applied to extreme heat hazard for green infrastructure projects directly impacting residential or commercial properties
Quality of Life Health Benefits99
bull Potential quality of life benefits related to improved public health from the resilience measures included within the project scope
bull Benefit applied to extreme heat hazard for green infrastructure projects directly impacting residential or commercial properties
Table 14 lists other typical benefits for reducing impacts from climate stressors and basic guidance for how to estimate them See Section IIID for more information
97 FEMA standard values for avoided mental stress and anxiety and environmental open space values taken from FEMA BCA Toolkit Version 530 (Build Date 12222016)
98 CSO abatement cost taken from APG1 Report for NYC ldquoTechnical Approaches for Benefit-Cost Analysis of Hazard Mitigation Projects in Urban and Coastal Environmentsrdquo (April 2016)
99 Ecosystem Services Real Estate and Quality of LifeHealth benefits tend to be more applicable to green infrastructure measures that provide extreme heat benefits such as green roofs trees and other plantings
NYC Mayorrsquos Office of Recovery and Resiliency Climate Resiliency Design Guidelines
44APPENDIX 4 - PROJECT BENEFITS CATEGORIES
Table 15 ndash Potential benefits for extreme heat (Urban Heat Island) reduction measures
Category Benefit Basic Guidance for Estimating Values
Direct Benefit
Reduced Life Cycle Cost
bull Applicable only to measures such as green roofs that are expected to last longer than standard roofs
bull Compute total cost savings including annual OampM costs
Indirect Benefit
Energy Savings
bull Applicable to measures that reduce energy costs by providing cooling through increased shading andor evapotranspiration
bull Use New York Power Authority rates of $0148kWh for electricity and $0810Therm for natural gas
Other Potential Benefits
Air Quality bull Applicable to measures that absorb pollutants andor reduce carbon dioxide emissions
Acoustics bull Applicable to measures such as green roof or walls that reduce noise transfer
Quality of LifeHealth bull Potential quality of life benefits and related to improved public health
Real Estate bull Applicable to measures that provide residential real estate benefits from increased resilience of propertiesstreetscapesneighborhoods
Retail Sales Marketing
bull Applicable to measures that provide commercial property benefits from increased aesthetics resulting in increased marketing and sales for streetscapesneighborhoods
Tax Credits Incentives
bull Applicable to resilience or green infrastructure measures such as green roofs that have accompanying Federal State or City tax credits or other incentives
Table 15 lists potential benefits for reducing impacts from heat and basic guidance for how to estimate them See Section IIID for more information
NYC Mayorrsquos Office of Recovery and Resiliency Climate Resiliency Design Guidelines
45APPENDIX 4 - PROJECT BENEFITS CATEGORIES
Table 16 ndash Guidance on quantitative calculations for (1) sea level rise with coastal storm surge and (2) increased precipitation measures
Data Input General Guidance ndash Basic Description
Applicable Benefit Category
Applicable Typical Facility Typology
Dire
ct B
enefi
ts
Indi
rect
Ben
efits
Oth
er P
oten
tial
Ben
efits
Bui
ldin
g St
ruct
ures
Com
plex
Fa
cilit
ies
Tran
spor
tatio
nSt
reet
scap
es
Plaz
as
Park
Fea
ture
s
First Floor Elevation (FFE)
bull The elevation of the first finished floor of the structure excluding basements
bull FFE measured from top of lowest floor (riverinenon-coastal high hazard areas) or bottom of lowest horizontal structural member (coastal high hazard areas)
Y Y Y Y
Building Replacement Value (BRV)
bull The unit cost to rebuild a structure of the same quality of construction
bull Not the same as market value
Y Y Y Y
Building Size
bull The total floor area of the building in square feet
bull Total Building Value = BRV x Building Sizebull Typical BRVs for NYC range between $100 to
$325SF for residential buildings and $120 to $450SF for commercialpublic buildings
Y Y Y Y
Structure Description
bull The type of building number of stories and foundation type (full basement partial basement no basement)
bull Collect more detailed foundation data for coastal flood zones
Y Y Y Y
Building Use bull Details related to residential housing commercial business and public use
Y Y Y Y Y
Building Type bull The primary use of building ndash residential commercial public and others
Y Y Y Y Y
Depth Damage Function (DDF)
bull Curves used to estimate structure damage contents damage and displacement of residential buildings based on flood depth
bull DDFs selection based on Structure Description Building Type Building Use
bull Structure DDFs based on percentage of Total Building Value
bull Contents DDFs based on percentage of Total Contents Value
bull Displacement DDFs based on number of displacement days x Displacement Cost
Y Y Y Y Y
Contents Value
bull The cost to replace structure contents (furnishings equipment)
bull Residential building Contents Values typically 50 BRV (FEMA DDFs) or 100 BRV (USACE DDFs)
bull Non-residential building Contents Values between 18 to over 100 depending on building use (USACE DDFs)
bull Total Contents Value = BRV x Building Size
Y Y Y Y Y
Table 16 provides general guidance on how to quantitatively calculate benefits from efforts to address from climate stressors See Section IIIE for more information
NYC Mayorrsquos Office of Recovery and Resiliency Climate Resiliency Design Guidelines
46APPENDIX 4 - PROJECT BENEFITS CATEGORIES
Table 16 ndash Guidance on quantitative calculations for (1) sea level rise with coastal storm surge and (2) increased precipitation measures
Data Input General Guidance ndash Basic Description
Applicable Benefit Category
Applicable Typical Facility Typology
Dire
ct B
enefi
ts
Indi
rect
Ben
efits
Oth
er P
oten
tial
Ben
efits
Bui
ldin
g St
ruct
ures
Com
plex
Fa
cilit
ies
Tran
spor
tatio
nSt
reet
scap
es
Plaz
as
Park
Fea
ture
s
Number of Residents (Residential)
bull Total number of occupants in a residential building
bull Typically estimated based on number of residential units x average number of individuals per household (based on current US Census data or use 25 individuals per household as a default)
Y Y Y Y Y
Displacement Cost (Residential)
bull The unit cost to lodge and feed displaced residents while flood damage is repaired
bull Average unit displacement cost of $415residential unitday recommended based on current FY2018 GSA Per Diem rates for New York City
Y Y Y Y Y
Value of Service (Non-Residential and Public)
bull The unit cost of service disruption and rental of temporary facilities while flood damage is repaired
bull Disruption costs for non-residential buildings typically range from $095 to $136SFmonth and rental costs range from $020 to $136SFmonth depending on building use
bull Value of service for public buildings ($day) is typically based on the annual operating budget for the City agency using the building prorated based on building size or population served by the building then divided by 365 daysyear
Y Y Y Y
Value of Service (Critical Facilities)
bull The unit cost of critical facilities (police fire emergency medical services) lost or delayed while flood damage is repaired
Y Y Y
Value of Service Duration
bull The duration of service disruption and rental of temporary facilities for non-residential buildings and critical facilities while flood damage is repaired
bull For non-residential buildingso Value of Service Durations vary from
4 months to over 30 months based on building use and the depth of flooding
o Total Value of Service Loss = (Disruption Cost x Building Area) = (Rental Cost x Building Area x Value of Service Duration)
bull For public buildings and critical facilitieso Value of Service Durations vary from 0
days to 720 months based on building use and the depth of flooding from FEMA FIA or USACE DDFs
o Total Value of Service Loss = (Value of Service) x (Service Loss Duration)
Y Y Y
NYC Mayorrsquos Office of Recovery and Resiliency Climate Resiliency Design Guidelines
47APPENDIX 4 - PROJECT BENEFITS CATEGORIES
Table 16 ndash Guidance on quantitative calculations for (1) sea level rise with coastal storm surge and (2) increased precipitation measures
Data Input General Guidance ndash Basic Description
Applicable Benefit Category
Applicable Typical Facility Typology
Dire
ct B
enefi
ts
Indi
rect
Ben
efits
Oth
er P
oten
tial
Ben
efits
Bui
ldin
g St
ruct
ures
Com
plex
Fa
cilit
ies
Tran
spor
tatio
nSt
reet
scap
es
Plaz
as
Park
Fea
ture
s
Engineering Estimates for Damages
bull Engineered estimate models of physical damages and service losses at the project site based on the Guidelines event recurrence interval(s) and flood depth(s)
Y Y Y Y Y Y
Historic Damages and Service Losses
bull Historic physical damages and service losses at the project site documented from previous flood events
bull Do not use routine maintenancebull The historic damage event recurrence interval
(RIs) andor flood depths must be determined updated for inflation to the present value and adjusted to match the Guidelines event RIsflood depths
Y Y Y Y Y Y
Facility Replacement Value
bull The unit cost to rebuild the facility
Impacted Area bull The geographic area impacted by the facility in the event of failure in acres
Y Y Y Y
Facility Capacity
bull The design capacity of the facilitybull For example - facility capacity expressed in
millions of gallons per day (MGD) for water and wastewater facilities or megawatts (MW) for electrical facilities
Y Y Y Y
Service Population
bull The number of impacted residents served by the facility
bull Typically estimated based on number of impacted residential customers x average number of individuals per household (based on current US Census data or use 25 individuals per household as a default)
bull Facilities serving mostly non-residentialpublic buildings andor critical facilities should focus on service losses rather than service population
Y Y Y
NYC Mayorrsquos Office of Recovery and Resiliency Climate Resiliency Design Guidelines
48APPENDIX 4 - PROJECT BENEFITS CATEGORIES
Table 16 ndash Guidance on quantitative calculations for (1) sea level rise with coastal storm surge and (2) increased precipitation measures
Data Input General Guidance ndash Basic Description
Applicable Benefit Category
Applicable Typical Facility Typology
Dire
ct B
enefi
ts
Indi
rect
Ben
efits
Oth
er P
oten
tial
Ben
efits
Bui
ldin
g St
ruct
ures
Com
plex
Fa
cilit
ies
Tran
spor
tatio
nSt
reet
scap
es
Plaz
as
Park
Fea
ture
s
Value of Service
bull Unit value of service provided by the facilitybull Example of FEMA standard values for complete
loss of utility service $105personday for potable water$49personday for wastewater$148personday for electrical
bull Consider updating FEMA standard per capita values to reflect current The New York City utility rates
Y Y
Roadway Elevations bull Roadway Elevations
Y Y
Roadway Replacement Value
bull Roadway Replacement ValueY Y
Inundation Area Map
bull Inundation Area Map developed by FEMA or through modeling by project design team
Y Y Y
Building Inventory of Inundation Area
bull The number and type of buildings within the streetscape and neighborhood inundated by the Guidelinersquos flood events
Y Y Y
Average Daily Traffic (ADT)
bull The average number of one-way traffic trips per day along the roadway(s) within the streetscapeneighborhood inundated by the Guidelinersquos flood events
Y Y
Additional Travel Time
bull The additional travel time needed to detour around a flooded roadway expressed in minutes
bull In the unlikely event there is no detour available use a 12-hour travel time per one-way trap but provide a detailed area street map as supporting documentation
Y Y
Value of Traffic Delay
bull The value of service associated with lost time in traffic
bull For example - FEMA standard average value of $3344vehiclehour of delay
bull Consider updating FEMA and GSA standard values to reflect current New York City area labor rates and fuel costs
Y Y
NYC Mayorrsquos Office of Recovery and Resiliency Climate Resiliency Design Guidelines
49APPENDIX 4 - PROJECT BENEFITS CATEGORIES
Table 17 ndash Guidance on quantitative unit benefit calculations for extreme heat hazard measures
Measure General Guidance ndash Unit Benefit Information and Data Requirements
Applicable Benefit Category
Applicable Typical Facility Typology
Dire
ct B
enefi
ts
Indi
rect
Ben
efits
Oth
er P
oten
tial
Ben
efits
Bui
ldin
g St
ruct
ures
Com
plex
Fa
cilit
ies
Tran
spor
tatio
nSt
reet
scap
es
Plaz
as
Park
Fea
ture
s
Green Roof
bull Unit benefit range over PUL = $470SF to $373SF of green roof area ($719SF standard value)
bull Assumed PUL = 40 yearsbull Apply standard value unit benefit to green
roof area to estimate measure benefitbull Higher range values more applicable
to residential and commercial building streetscape projects
Y Y Y Y Y Y
Bioswale Rain Garden Meadow Mix
bull Unit benefit range over PUL = $396SF to $211SF of area ($730SF standard value)
bull Assumed PUL = 30 yearsbull Apply standard value unit benefit to bioswale
rain gardenmeadow mix area to estimate total measure benefit
Y Y Y Y Y Y
Cool Roof
bull Unit benefit range over PUL = $117 to $3151SF of material area ($144SF standard value)
bull Assumed PUL = 20 yearsbull Apply standard value unit benefit to cool roof
area to estimate total measure benefitbull Higher range values more applicable to
residential building streetscape projects
Y Y Y Y Y
Light-Colored PaversLight-Colored Materials
bull Unit benefit range over PUL = $0774 to $204SF of material area ($0866SF standard value)
bull Assumed PUL = 30 yearsbull Apply standard value unit benefit to material
area to estimate total measure benefit
Y Y Y Y
Table 17 provides general guidance on how to quantitatively calculate benefits from efforts to address climate stressors See Section IIIE for more information
NYC Mayorrsquos Office of Recovery and Resiliency Climate Resiliency Design Guidelines
50APPENDIX 4 - PROJECT BENEFITS CATEGORIES
Table 17 ndash Guidance on quantitative unit benefit calculations for extreme heat hazard measures
Measure General Guidance ndash Unit Benefit Information and Data Requirements
Applicable Benefit Category
Applicable Typical Facility Typology
Dire
ct B
enefi
ts
Indi
rect
Ben
efits
Oth
er P
oten
tial
Ben
efits
Bui
ldin
g St
ruct
ures
Com
plex
Fa
cilit
ies
Tran
spor
tatio
nSt
reet
scap
es
Plaz
as
Park
Fea
ture
s
Tree Planting
bull Unit benefit range over PUL = $1005 to $77154Tree ($1855Tree standard value)
bull Assumed PUL = 30 yearsbull Apply standard value unit benefit to number of
trees to estimate total measure benefitbull Higher range values more applicable
to residential and commercial building streetscape projects
Y Y Y Y Y Y
Planter Box Tree
bull Unit benefit range over PUL = $212 to 16304Tree ($392Tree standard value)
bull Assumed PUL = 15 yearsbull Apply standard value unit benefit to number of
trees to estimate total measure benefitbull Higher range values more applicable
to residential and commercial building streetscape projects
Y Y Y Y Y
Shade Canopy
bull Unit benefit range over PUL = $0363 to $396SF ($0458SF standard value)
bull Assumed PUL = 15 yearsbull Apply standard value unit benefit to area of
shade canopy estimate total measure benefitbull Higher range values more applicable
to residential and commercial building streetscape projects
Y Y Y Y
Permeable Grass Pavers
bull Unit benefit range over PUL = $0258SF to $0521SF of pavers ($0363SF standard value)
bull Assumed PUL = 30 yearsbull Apply standard value unit benefit to paver
area to estimate total measure benefit
Y Y Y Y Y
For the purposes of the BCA refer to the following facility typologies bull ldquoBuilding Structuresrdquo include critical small building sites such as EMS or FDNY stations and non-critical small building sites such as
libraries or comfort stationsbull ldquoComplex Facilitiesrdquo include critical infrastructure such as wastewater treatment sites pump stations water filtration plants and similar
large or complex facilitiesbull ldquoTransportationStreetscapePlazasrdquo include roadway reconstruction streetscape improvements street raising plazas and other
transportation-related infrastructurebull ldquoPark Featuresrdquo include parks and similar public recreational facility with natural landscape features
NYC Mayorrsquos Office of Recovery and Resiliency Climate Resiliency Design Guidelines
51APPENDIX 5 - EXAMPLE PLANNING DECISION TREE
This decision tree provides a summarized example approach for how to implement these Guidelines Projects with a total cost greater than $50 million are recommended to conduct a full qualitative and quantitative climate change risk assessment and BCA while projects below $50 million are recommended to conduct a qualitative risk assessment and BCA
Define Project
1) Operational goals and criticality level2) Useful life3) Location in the current flood plain future floodplain and or zone
of tidal inundation and the project arearsquos score on the heat vulnerability index
Evaluate Project Risks According to Probability and Magnitude of Consequence
bull Extreme Heat bull Precipitationbull Sea Level Risebull Coastal Surge
High Level Identification and Assessment of Risk Mitigation Alternatives and Co-benefits
(qualitative)
Detailed Identification and Assessment of Risk Mitigation Alternatives and Co-benefits (qualitative and quantitative)
High Level Estimate of Costs and Benefits of Design Alternatives
(qualitative)
Detailed Estimate of Costs and Benefits of Design Alternatives
(qualitative and quantitative)
Decision Point Which climate change risks require mitigation
Decision Point Evaluate risk mitigation benefits and costs to
determine final resilient design alternative or if no action is required
Decision Point Is the total project cost above $50 million
Below $50 million Above $50 million
APPENDIX 5 - EXAMPLE PLANNING DECISION TREE
NYC Mayorrsquos Office of Recovery and Resiliency Climate Resiliency Design Guidelines
52
Project Title
Design Strategies Checklist (not exhaustive)
Extreme Heat Comments Extreme Precipitation Comments Sea Level Rise amp Storm Surge Comments
Select Site in Low Heat Vulnerability Index area Select High Elevation Site Select High Elevation Site
Minimize East-West Building Orientation Green Roof Raise Building Floor Elevation
Passive Solar Cooling and Ventilation Systems
Protect Below Grade Areas from Flooding Waterproof Building Envelope
Cool Roof (SRI appropriate) On-site Stormwater Management (gray) Elevate Critical Building Functions
Green Roof (extensive) Reduce Impervious Areas Elevate Critical Equipment
Vegetative Structures Permeable Pavement Perimeter Floodwall100 Levee (passive or active)
Enhanced HVAC System including space layout optimization and system scalability
Increase Green Spaces and Planted Areas DryWet Floodproofing
More Efficient Building Envelope Other Utility Redundancy Design101
Parking Lot Shading Resilient Materials amp Landscape Treatments
Light Colored Pavements (appropriate SRI) Design for Storm Surge Outflow
Increase Planted Areas Install Backwater Flow Prevention
Permeable Surfaces Design for Scour
Open-grid Pavement Raise Road Elevation
Other Other
This appendix provides a template for identifying possible design strategies to address climate change risks as described throughout the Guidelines
APPENDIX 6 - DESIGN STRATEGIES CHECKLIST
100 Permanent perimeter flood walls are not permitted to meet floodproofing requirements in buildings with substantial improvements andor damages 101 Utility redundancy design should be pursued for critical systems not all building systems
APPENDIX 6 - DESIGN STRATEGIES CHECKLIST
NYC Mayorrsquos Office of Recovery and Resiliency Climate Resiliency Design Guidelines
53APPENDIX 7 - CLIMATE CHANGE RISK ASSESSMENT RESOURCES
These Guidelines provide data on climate change hazards and recommend how that data can inform resilient design A risk assessment is a tool to help project managers and designers evaluate risk levels as well as select and prioritize resilient design strategies A high level risk assessment is recommended for all City capital projects with a total cost of under $50 million Projects above $50 million are recommended to conduct an in-depth assessment
Risk assessments use quantified estimates of the probability and magnitude of consequence of an event occurring to prioritize responses ldquoProbabilityrdquo is an assessment of the likelihood of a hazard occurring while ldquomagnituderdquo describes the hazardrsquos potential impact Risk assessment tools such as the examples listed below can be used to define and score these categories Projects that score higher across both probability and magnitude can be prioritized for investment and risk mitigation action Projects that score lower across both criteria may require no action beyond meeting code The results are typically charted on a risk matrix and an example is provided on the next page
The climate change risk management frameworks below offer templates for how to integrate climate change projections into a risk assessment process Refer to these resources for examples and further information
bull Vulnerability Assessment and Adaptation Framework is prepared by the Federal Highway Administration (FHWA) While developed for transportation planning this risk assessment framework has broad applicability for evaluating asset vulnerability to climate change Available at httpswwwfhwadotgovenvironmentsustainabilityresilienceadaptation_framework
bull US Climate Resilience Toolkit The US Global Change Research Program offers a step by step risk assessment
framework including tools and case studies at httpstoolkitclimategovsteps (see example on next page)
bull Coast Adapt Guidance on undertaking a risk assessment High level assessment httpscoastadaptcomausitesdefaultfilesfactsheetsT3M4_2_2nd_pass_risk_assessmentpdfDetailed assessment httpscoastadaptcomausitesdefaultfilesfactsheetsT3M4_3_3rd_pass_risk_assessmentpdf
bull Climate adaptation Risk uncertainty and decision-makingDownload the report here httpswwwukciporgukpublicationsRisk
The City plans to develop a NYC-specific process for integrating climate change data into existing risk management processes by April 2019
APPENDIX 7 - CLIMATE CHANGE RISK ASSESSMENT RESOURCES
NYC Mayorrsquos Office of Recovery and Resiliency Climate Resiliency Design Guidelines
54APPENDIX 7 - CLIMATE CHANGE RISK ASSESSMENT RESOURCES
The Risk Characterization Matrix below is an example from the US Climate Resilience Toolkit This tool can be used to assess the probability and magnitude of impact for identified risks The risk of coincident climate stressorsrisks (such as storm surge plus increased precipitation) can also be assessed as applicable
Figure 14 - Example of a climate change risk matrix (adapted from US Climate Resilience Toolkit)
Project teams can determine the magnitude of the impact (along the horizontal scale of 1 through 3 with 3 being the most severe) and the probabilitylikelihood of occurrence for each specific risk (along the vertical scale with 3 being the most likely) A score is typically assigned for each risk (Probabil-ity x Magnitude) and then charted on the matrix Based on the estimated probability and magnitude of consequence above the risks are ranked and prioritized for mitigation Factors to bear in mind include
bull Not all facility typologies have the same level of functional and operational importance during events or tolerance for disruption
bull Not all climate stressors and risks have the same level of impact on each project sitebull Not all identified risks can or should be mitigated fully
NYC Mayorrsquos Office of Recovery and Resiliency Climate Resiliency Design Guidelines
55WORKS CITED
A Stronger More Resilient New York PlaNYC Report of the NYC Special Initiative for Rebuilding and Resiliency The City of New York 2013
ldquoAccount for Climate Riskrdquo International Finance Corporation accessed March 27 2017 httpwwwifcorgwpswcmconnectTopics_Ext_ContentIFC_External_Corporate_SiteClimate+Business
PrioritiesAccount+for+Climate+Risk
American Society of Heating Refrigeration and Air-Conditioning Engineers (ASHRAE) Handbook -Fundamentals 2017
ldquoBaseline Standard Economic Value Methodology Reportrdquo Federal Emergency Management Agency July 2016
Benefit Cost Analysis Toolkit Software Version 530 Federal Emergency Management Agency (build date December 2016)
Criteria for Detention Facility Design New York City Department of Environmental Protection November 2012
Community Resilience Planning Guide for Buildings and Infrastructure Systems Vol 1 NIST Special Publication 1190 US Department of Commerce 2016
Cool and Green Roofing Manual NYC Department of Design and Construction 2007 httpwwwnycgovhtmlddcdownloadspdfcool_green_roof_manpdf
Building Resiliency Task Force US Urban Green Building Council New York 2013 httpurbangreencouncilforcecomBuildingResiliency
Design and Planning for Flood Resiliency Guidelines for NYC Parks New York City Department of Parks and Recreation 2017
httpswwwnycgovparksorgplanning-and-buildingplanningresiliency-plansflood-resiliency
Flooded Bus Barns and Buckled Rails Federal Transit Administration Office of Budget and Policy 2011 httpswwwhsdlorgabstractampdid=685187
Floodproofing Non-Residential Buildings FEMA P936 FEMA 2013 httpswwwfemagovmedia-library-data9a50c534fc5895799321dcdd4b6083e7P-936_8-20-13_508rpdf
ldquoGlossaryrdquo International Infrastructure Management Manual National Asset Management Support Group New Zealand 2011 httpwwwipweaorg
ldquoGreen Roof Metrics Draft Reportrdquo New York City Department of Parks and Recreation 2017
ldquoGuide to Rain Event Preparednessrdquo NYC Department of Environmental Protection httpwwwnycgovhtmldeppdfbrochuresflood-preparedness-flyerpdf
ldquoGuidelines and Discount Rates for Benefit-Cost Analysis of Federal Programsrdquo Appendix C Circular A-94 US Office of Management and Budget (OMB) 2017
ldquoGuidelines for the Design and Construction of Stormwater Management Systemsrdquo New York City Department of Environmental Protection July 2012
Horton R et al New York City Panel on Climate Change 2015 Report Ann NY Acad Sci ISSN 0077-892 New York 2015
Madrigano J et al ldquoA case-only study of vulnerability to heat wavendashrelated mortality in New York City (2000ndash2011)rdquo Environmental Health Perspectives 123672ndash678 2013
WORKS CITED
NYC Mayorrsquos Office of Recovery and Resiliency Climate Resiliency Design Guidelines
56WORKS CITED
enspMcGregor et al Two Degrees The Built Environment and Our Changing Climate Routledge Press 2013
NYC Green Codes Task Force US Green Building Council New York 2010 httpurbangreencouncilorgGreenCodes
NYCrsquos Risk Landscape A Guide to Hazard Mitigation NYC Emergency Management 2014
One New York The Plan for a Strong and Just City The City of New York 2015 httpwwwnycgovhtmlonenyc downloadspdfpublicationsOneNYCpdf
Ready to Respond Strategies for Multifamily Building Resilience Enterprise Green Communities 2015 httpswwwenterprisecommunityorgresources
Rosenzweig C et al Climate Change Adaptation in New York City Building a Risk Management Response New York City Panel on Climate Change 2010
httponlinelibrarywileycomdoi101111nyas20101196issue-1 issuetoc
ldquoSustainable Infrastructure Management Program Learning Environmentrdquo Water Environment Research Foundation accessed March 24 2017 httpsimplewerforg
Urban Waterfront Adaptive Strategies NYC Department of City Planning 2013 httpwww1nycgovsiteplanningplanssustainable-communitiesclimate-resiliencepagetab=1
Wastewater Resiliency Plan Climate Risk Assessment and Adaptation Study New York City Department of Environmental Protection October 2013
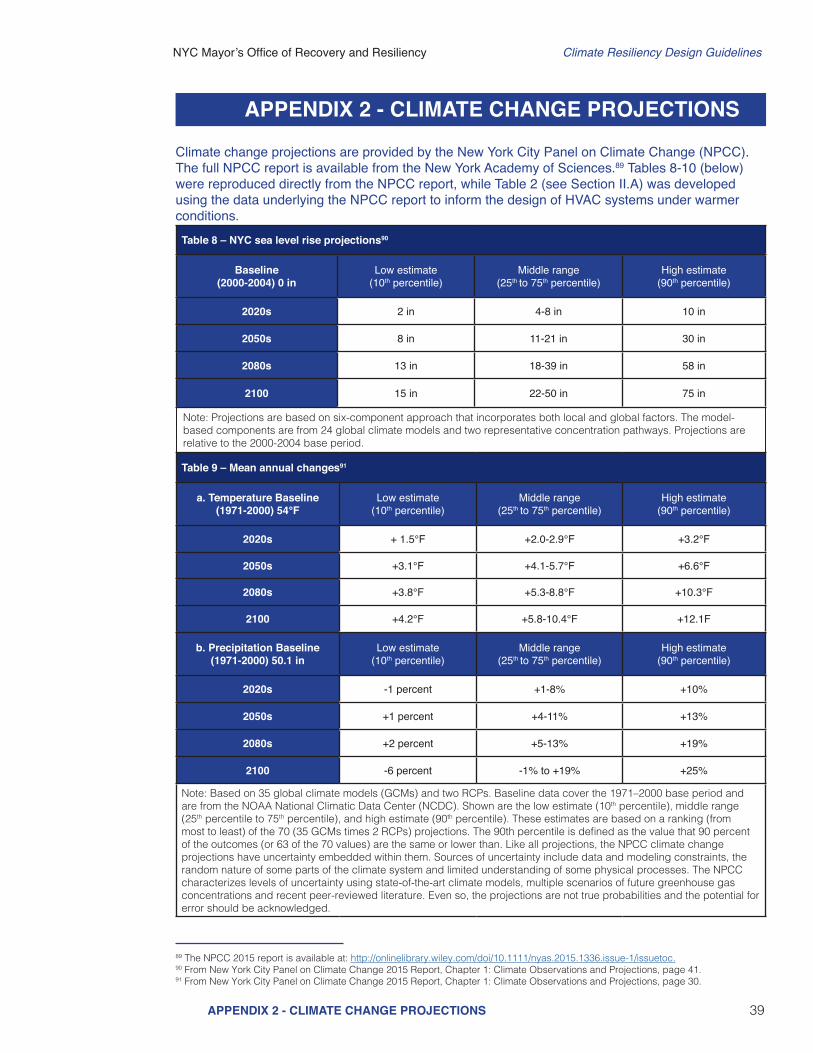
NYC Mayorrsquos Office of Recovery and Resiliency Climate Resiliency Design Guidelines
39APPENDIX 2 - CLIMATE CHANGE PROJECTIONS
Climate change projections are provided by the New York City Panel on Climate Change (NPCC) The full NPCC report is available from the New York Academy of Sciences89 Tables 8-10 (below) were reproduced directly from the NPCC report while Table 2 (see Section IIA) was developed using the data underlying the NPCC report to inform the design of HVAC systems under warmer conditions
Table 8 ndash NYC sea level rise projections90
Baseline (2000-2004) 0 in
Low estimate (10th percentile)
Middle range (25th to 75th percentile)
High estimate (90th percentile)
2020s 2 in 4-8 in 10 in
2050s 8 in 11-21 in 30 in
2080s 13 in 18-39 in 58 in
2100 15 in 22-50 in 75 in
Note Projections are based on six-component approach that incorporates both local and global factors The model-based components are from 24 global climate models and two representative concentration pathways Projections are relative to the 2000-2004 base period
Table 9 ndash Mean annual changes91
a Temperature Baseline(1971-2000) 54degF
Low estimate (10th percentile)
Middle range (25th to 75th percentile)
High estimate (90th percentile)
2020s + 15degF +20-29degF +32degF
2050s +31degF +41-57degF +66degF
2080s +38degF +53-88degF +103degF
2100 +42degF +58-104degF +121F
b Precipitation Baseline(1971-2000) 501 in
Low estimate (10th percentile)
Middle range (25th to 75th percentile)
High estimate (90th percentile)
2020s -1 percent +1-8 +10
2050s +1 percent +4-11 +13
2080s +2 percent +5-13 +19
2100 -6 percent -1 to +19 +25
Note Based on 35 global climate models (GCMs) and two RCPs Baseline data cover the 1971ndash2000 base period and are from the NOAA National Climatic Data Center (NCDC) Shown are the low estimate (10th percentile) middle range (25th percentile to 75th percentile) and high estimate (90th percentile) These estimates are based on a ranking (from most to least) of the 70 (35 GCMs times 2 RCPs) projections The 90th percentile is defined as the value that 90 percent of the outcomes (or 63 of the 70 values) are the same or lower than Like all projections the NPCC climate change projections have uncertainty embedded within them Sources of uncertainty include data and modeling constraints the random nature of some parts of the climate system and limited understanding of some physical processes The NPCC characterizes levels of uncertainty using state-of-the-art climate models multiple scenarios of future greenhouse gas concentrations and recent peer-reviewed literature Even so the projections are not true probabilities and the potential for error should be acknowledged
89 The NPCC 2015 report is available at httponlinelibrarywileycomdoi101111nyas20151336issue-1issuetoc90 From New York City Panel on Climate Change 2015 Report Chapter 1 Climate Observations and Projections page 4191 From New York City Panel on Climate Change 2015 Report Chapter 1 Climate Observations and Projections page 30
APPENDIX 2 - CLIMATE CHANGE PROJECTIONS
NYC Mayorrsquos Office of Recovery and Resiliency Climate Resiliency Design Guidelines
40APPENDIX 2 - CLIMATE CHANGE PROJECTIONS
Table 10 ndash Extreme events92
2020s Baseline (1971-2000)
Low estimate(10th percentile)
Middle range(25th to 75th percentile)
High estimate (90th percentile)
Numbers of heat waves per year 2 3 3-4 4
Average heat wave duration (days) 4 5 5 5
Number of days per year with
Maximum temperature at or above 90degF 18 24 26-31 33
Maximum temperature at or above 100degF 04 07 1-2 2
Minimum temperature at or below 32degF 71 50 52-58 60
Rainfall at or above 1 inch 13 13 14-15 16
Rainfall at or above 2 inches 3 3 3-4 5
Rainfall at or above 4 inches 03 02 03ndash04 05
2050s Baseline (1971-2000)
Low estimate(10th percentile)
Middle range(25th to 75th percentile)
High estimate (90th percentile)
Numbers of heat waves per year 2 4 5-7 7
Average heat wave duration (days) 4 5 5-6 6
Number of days per year with
Maximum temperature at or above 90degF 18 32 39-52 57
Maximum temperature at or above 100degF 04 2 3-5 7
Minimum temperature at or below 32degF 71 37 42-48 52
Rainfall at or above 1 inch 13 13 14-16 17
Rainfall at or above 2 inches 3 3 4-4 5
Rainfall at or above 4 inches 03 03 03-04 05
2080s Baseline (1971-2000)
Low estimate(10th percentile)
Middle range(25th to 75th percentile)
High estimate (90th percentile)
Numbers of heat waves per year 2 5 6-9 9
Average heat wave duration (days) 4 5 5-7 8
Number of days per year with
Maximum temperature at or above 90degF 18 38 44-76 87
Maximum temperature at or above 100degF 04 2 4-14 20
Minimum temperature at or below 32degF 71 25 30-42 49
Rainfall at or above 1 inch 13 14 15-17 18
Rainfall at or above 2 inches 3 3 4-5 5
Rainfall at or above 4 inches 03 02 03-05 07
Note Projections for temperature and precipitation are based on 35 GCMs and 2 RCPs Baseline data are for the 1971 to 2000 base period and are from the NOAA National Climatic Data Center (NCDC) Shown are the low estimate (10th percentile) middle range (25th to 75th percentile) and high estimate (90th percentile) 30-year mean values from model-based outcomes Decimal places are shown for values less than one although this does not indicate higher precisioncertainty Heat waves are defined as three or more consecutive days with maximum temperatures at or above 90degF Like all projections the NPCC climate change projections have uncertainty embedded within them Sources of uncertainty include data and modeling constraints the random nature of some parts of the climate system and limited understanding of some physical processes The NPCC characterizes levels of uncertainty using state-of-the-art climate models multiple scenarios of future greenhouse gas concentrations and recent peer-reviewed literature Even so the projections are not true probabilities and the potential for error should be acknowledged
92 From New York City Panel on Climate Change 2015 Report Chapter 1 Climate Observations and Projections page 31
NYC Mayorrsquos Office of Recovery and Resiliency Climate Resiliency Design Guidelines
41APPENDIX 3 - DIFFERENTIATION OF FLOOD MAPS
These Guidelines reference several different kinds of flood maps and sources of design flood elevations These maps are described and differentiated below
Table 11 - Differentiation of flood maps used in NYC
Reference Title Data Source Information Provided Referenced By Link
2007 FIRM FEMA
Based on historical data from before 1983 identifies the current base flood (extent and elevation) as the flood that has a 1 chance of occurring in any given year also known as a 100-year flood The NYC Building Code requires that either the 2007 FIRM or 2015 PFIRM elevation be used whichever is higher
2014 NYC Building Code Appendix G
Climate Resiliency Design Guidelines
httpsmscfemagovportal
2015 PFIRM FEMA
Based on historical data identifies the current base flood (extents and elevation) as the flood that has a 1 chance of occurring in any given year also known as a 100-year flood The NYC Building Code requires that either the 2007 FIRM or 2015 PFIRM elevation be used whichever is higher The 2015 PFIRM is currently being reassessed by FEMA
2014 NYC Building Code Appendix G
Climate Resiliency Design Guidelines
httpshazardsfemagovfemaportalprelimdownload
httpwwwregion2coastalcomview-flood-maps-dataview-preliminary-flood-map-data
NYC Flood Hazard Mapper
NYC Department of City Planning
Maps current and future flood hazards in NYC including the following data layers 2007 FIRM and 2015 PFIRM high tide with sea level rise and PFIRM with sea level rise through 2100
Climate Resiliency Design Guidelines
Waterfront Revitalization Plan
httpwww1nycgovsiteplanningdata-mapsflood-hazard-mapperpage
ldquoTable 4 ndash Determine the sea level rise-adjusted design flood elevation for critical and non-critical facilitiesrdquo
ORR amp NPCC
Provides data to use when adding sea level rise to a given 2015 PFIRM or 2007 FIRM Base Flood Elevation (BFE) to calculate a Design Flood Elevation (DFE) Based on the criticality and expected useful life of a facility
Climate Resiliency Design Guidelines
See Section II on ldquoSea Level Riserdquo above
APPENDIX 3 - DIFFERENTIATION OF FLOOD MAPS
NYC Mayorrsquos Office of Recovery and Resiliency Climate Resiliency Design Guidelines
42APPENDIX 4 - PROJECT BENEFITS CATEGORIES
This appendix provides guidance on how to identify and assess benefits as a supplement to Sections IIID and IIIE
Table 12 lists typical direct benefits for reducing impacts from climate stressors and basic guidance for how to estimate them See Section IIID for more information
Table 13 lists typical indirect benefits for reducing impacts from climate stressors and basic guidance for how to estimate them See Section IIID for more information
Table 12 ndash Direct benefits for (1) sea level rise with coastal storm surge and (2) increased precipitation measures
Direct Benefit Basic Guidance for Estimating Values
Physical Damages (Structure Contents)
bull For flood-damaged buildings use depth damage functions developed by FEMA and USACE for structures and contents
bull Use depth damage functions in conjunction with Building Replacement Values (BRVs) and not market values BRVs typically range between $100 to $325SF for residential buildings and $120 to $450SF for commercial public buildings
bull For more complex structures or facilities use engineering estimates of flood damages or review historic flood damages documented from insurance claims repair records or FEMA Public Assistance claims from recent flood disasters
Residential Displacements
bull For flood-damaged buildings use depth damage functions developed by FEMA and USACE for residential displacements
Reduced Life CycleOperation and Maintenance (OampM) Costs93
bull Applicable only to projects that reduce overall life cycle costs or net annual OampM costs from baseline conditions
bull Input reduced annual OampM costs as a project benefit at a 1-year recurrence intervalbull Reduced overall life cycle costs can be input as a longer project useful life
Table 13 ndash Indirect benefits for (1) sea level rise with coastal storm surge and (2) increased precipitation measures
Indirect Benefit Basic Guidance for Estimating Values
Non-Residential Building Service Losses
bull Estimate service loss values and durations for non-residential buildings public buildings critical facilities and parksnatural features based on FEMA BCA guidance and standard values based on building use
Utility Service Losses94
bull Estimate utility service losses for water wastewater and electrical facilities based on the number of impacted customers FEMA per capita standard values for utility service ($105personday for potable water $49personday for wastewater $148personday for electrical)95
bull Estimate utility service loss durations based on engineering estimates or review historic flood damages losses documented from utility company records
bull This benefit can also apply to measures that increase energy efficiency
RoadBridge Service Losses
bull Estimate roadbridge service losses based on the average daily traffic (ADT) detour time and additional travel distance and FEMA and GSA standard values for road service ($3344vehiclehour of delay $0545mile)96
bull Estimate roadbridge service loss durations or review historic flood damages losses
Emergency Service Losses
bull Applicable only to projects that reduce or eliminate documented emergency service costs from baseline conditions
bull Examples of avoided emergency services costs include NYPD staffing to monitor barricades for flooded roads or NFDY staffing for water rescues of residents from flooded buildings or streets
APPENDIX 4 - PROJECT BENEFITS CATEGORIES
93 Reduced life cycle costs may be applicable to some measures that provide extreme heat benefits such as green roofs that can last longer than a standard roof if properly maintained
94 Reduced utility service costs may be applicable to some measures that provide extreme heat benefits such as cool roofs green roofs and shade trees
95 FEMA per capita standard values taken from FEMA BCA Toolkit Version 530 (Build Date 12222016) and developed in FEMArsquos Baseline Standard Economic Value Methodology Report (July 28 2016) Consider updating FEMA standard per capita values to reflect current New York City utility rates
96 Consider updating FEMA and GSA standard values to reflect current New York City area labor rates and fuel costs
NYC Mayorrsquos Office of Recovery and Resiliency Climate Resiliency Design Guidelines
43APPENDIX 4 - PROJECT BENEFITS CATEGORIES
Table 14 ndash Other potential benefits for (1) sea level rise with coastal storm surge and (2) increased precipitation measures
Other Benefit Basic Guidance for Estimating Values
Avoided Stress and Anxiety
bull Applicable only for projects that directly benefit occupants of residential structuresbull Use FEMA standard value for avoided mental stress and anxiety treatment costs of $2443person to
estimate benefit for all impacted residents97
Avoided Lost Productivity
bull Applicable only for projects that directly benefit occupants of residential structuresbull Use FEMA standard value for avoided lost worker productivity costs of $8736household to estimate
benefit for all impacted workers (conservatively assuming one worker per household)
Environmental Open Space
bull Applicable only for projects that create or acquire open space areas by acquisitionbull Use FEMA standard value for environmental open space based on the type of land acquired ($8308
Acreyear for Green open space $39545Acreyear for Riparian $6010Acreyear for Wetlands $554Acreyear for Forests $1799Year for Marine and estuary)97
CSO Volume Reduction
bull Applicable only for projects that provide Combined Sewer Overflow (CSO) abatement by reducing the volume of rainfall runoff
bull Use CSO abatement cost of $0015gallonsyear applied to increased precipitation hazard runoff volume for 5-year design storm98
Ecosystem Service99
bull Add stormwater management benefits of green infrastructure projects to increased precipitation hazards where avoided damages and service losses are not quantified
bull Unit benefits applicable to increased precipitation hazard includeo Green roofs $0133SFyear (PUL 40 years)o BioswaleRain GardenMeadow Mix $0020SFyear (PUL 30 years)o Permeable Grass Pavers $0020SFyear (PUL 30 years)o Tree Plantings $303Treeyear (PUL 30 years)o Planter Box Trees $101Treeyear (PUL 15 years)
Real Estate99
bull Potential real estate benefits from increased resilience of residential andor commercial propertiesstreetscapesneighborhoods included within the project scope
bull Benefit applied to extreme heat hazard for green infrastructure projects directly impacting residential or commercial properties
Quality of Life Health Benefits99
bull Potential quality of life benefits related to improved public health from the resilience measures included within the project scope
bull Benefit applied to extreme heat hazard for green infrastructure projects directly impacting residential or commercial properties
Table 14 lists other typical benefits for reducing impacts from climate stressors and basic guidance for how to estimate them See Section IIID for more information
97 FEMA standard values for avoided mental stress and anxiety and environmental open space values taken from FEMA BCA Toolkit Version 530 (Build Date 12222016)
98 CSO abatement cost taken from APG1 Report for NYC ldquoTechnical Approaches for Benefit-Cost Analysis of Hazard Mitigation Projects in Urban and Coastal Environmentsrdquo (April 2016)
99 Ecosystem Services Real Estate and Quality of LifeHealth benefits tend to be more applicable to green infrastructure measures that provide extreme heat benefits such as green roofs trees and other plantings
NYC Mayorrsquos Office of Recovery and Resiliency Climate Resiliency Design Guidelines
44APPENDIX 4 - PROJECT BENEFITS CATEGORIES
Table 15 ndash Potential benefits for extreme heat (Urban Heat Island) reduction measures
Category Benefit Basic Guidance for Estimating Values
Direct Benefit
Reduced Life Cycle Cost
bull Applicable only to measures such as green roofs that are expected to last longer than standard roofs
bull Compute total cost savings including annual OampM costs
Indirect Benefit
Energy Savings
bull Applicable to measures that reduce energy costs by providing cooling through increased shading andor evapotranspiration
bull Use New York Power Authority rates of $0148kWh for electricity and $0810Therm for natural gas
Other Potential Benefits
Air Quality bull Applicable to measures that absorb pollutants andor reduce carbon dioxide emissions
Acoustics bull Applicable to measures such as green roof or walls that reduce noise transfer
Quality of LifeHealth bull Potential quality of life benefits and related to improved public health
Real Estate bull Applicable to measures that provide residential real estate benefits from increased resilience of propertiesstreetscapesneighborhoods
Retail Sales Marketing
bull Applicable to measures that provide commercial property benefits from increased aesthetics resulting in increased marketing and sales for streetscapesneighborhoods
Tax Credits Incentives
bull Applicable to resilience or green infrastructure measures such as green roofs that have accompanying Federal State or City tax credits or other incentives
Table 15 lists potential benefits for reducing impacts from heat and basic guidance for how to estimate them See Section IIID for more information
NYC Mayorrsquos Office of Recovery and Resiliency Climate Resiliency Design Guidelines
45APPENDIX 4 - PROJECT BENEFITS CATEGORIES
Table 16 ndash Guidance on quantitative calculations for (1) sea level rise with coastal storm surge and (2) increased precipitation measures
Data Input General Guidance ndash Basic Description
Applicable Benefit Category
Applicable Typical Facility Typology
Dire
ct B
enefi
ts
Indi
rect
Ben
efits
Oth
er P
oten
tial
Ben
efits
Bui
ldin
g St
ruct
ures
Com
plex
Fa
cilit
ies
Tran
spor
tatio
nSt
reet
scap
es
Plaz
as
Park
Fea
ture
s
First Floor Elevation (FFE)
bull The elevation of the first finished floor of the structure excluding basements
bull FFE measured from top of lowest floor (riverinenon-coastal high hazard areas) or bottom of lowest horizontal structural member (coastal high hazard areas)
Y Y Y Y
Building Replacement Value (BRV)
bull The unit cost to rebuild a structure of the same quality of construction
bull Not the same as market value
Y Y Y Y
Building Size
bull The total floor area of the building in square feet
bull Total Building Value = BRV x Building Sizebull Typical BRVs for NYC range between $100 to
$325SF for residential buildings and $120 to $450SF for commercialpublic buildings
Y Y Y Y
Structure Description
bull The type of building number of stories and foundation type (full basement partial basement no basement)
bull Collect more detailed foundation data for coastal flood zones
Y Y Y Y
Building Use bull Details related to residential housing commercial business and public use
Y Y Y Y Y
Building Type bull The primary use of building ndash residential commercial public and others
Y Y Y Y Y
Depth Damage Function (DDF)
bull Curves used to estimate structure damage contents damage and displacement of residential buildings based on flood depth
bull DDFs selection based on Structure Description Building Type Building Use
bull Structure DDFs based on percentage of Total Building Value
bull Contents DDFs based on percentage of Total Contents Value
bull Displacement DDFs based on number of displacement days x Displacement Cost
Y Y Y Y Y
Contents Value
bull The cost to replace structure contents (furnishings equipment)
bull Residential building Contents Values typically 50 BRV (FEMA DDFs) or 100 BRV (USACE DDFs)
bull Non-residential building Contents Values between 18 to over 100 depending on building use (USACE DDFs)
bull Total Contents Value = BRV x Building Size
Y Y Y Y Y
Table 16 provides general guidance on how to quantitatively calculate benefits from efforts to address from climate stressors See Section IIIE for more information
NYC Mayorrsquos Office of Recovery and Resiliency Climate Resiliency Design Guidelines
46APPENDIX 4 - PROJECT BENEFITS CATEGORIES
Table 16 ndash Guidance on quantitative calculations for (1) sea level rise with coastal storm surge and (2) increased precipitation measures
Data Input General Guidance ndash Basic Description
Applicable Benefit Category
Applicable Typical Facility Typology
Dire
ct B
enefi
ts
Indi
rect
Ben
efits
Oth
er P
oten
tial
Ben
efits
Bui
ldin
g St
ruct
ures
Com
plex
Fa
cilit
ies
Tran
spor
tatio
nSt
reet
scap
es
Plaz
as
Park
Fea
ture
s
Number of Residents (Residential)
bull Total number of occupants in a residential building
bull Typically estimated based on number of residential units x average number of individuals per household (based on current US Census data or use 25 individuals per household as a default)
Y Y Y Y Y
Displacement Cost (Residential)
bull The unit cost to lodge and feed displaced residents while flood damage is repaired
bull Average unit displacement cost of $415residential unitday recommended based on current FY2018 GSA Per Diem rates for New York City
Y Y Y Y Y
Value of Service (Non-Residential and Public)
bull The unit cost of service disruption and rental of temporary facilities while flood damage is repaired
bull Disruption costs for non-residential buildings typically range from $095 to $136SFmonth and rental costs range from $020 to $136SFmonth depending on building use
bull Value of service for public buildings ($day) is typically based on the annual operating budget for the City agency using the building prorated based on building size or population served by the building then divided by 365 daysyear
Y Y Y Y
Value of Service (Critical Facilities)
bull The unit cost of critical facilities (police fire emergency medical services) lost or delayed while flood damage is repaired
Y Y Y
Value of Service Duration
bull The duration of service disruption and rental of temporary facilities for non-residential buildings and critical facilities while flood damage is repaired
bull For non-residential buildingso Value of Service Durations vary from
4 months to over 30 months based on building use and the depth of flooding
o Total Value of Service Loss = (Disruption Cost x Building Area) = (Rental Cost x Building Area x Value of Service Duration)
bull For public buildings and critical facilitieso Value of Service Durations vary from 0
days to 720 months based on building use and the depth of flooding from FEMA FIA or USACE DDFs
o Total Value of Service Loss = (Value of Service) x (Service Loss Duration)
Y Y Y
NYC Mayorrsquos Office of Recovery and Resiliency Climate Resiliency Design Guidelines
47APPENDIX 4 - PROJECT BENEFITS CATEGORIES
Table 16 ndash Guidance on quantitative calculations for (1) sea level rise with coastal storm surge and (2) increased precipitation measures
Data Input General Guidance ndash Basic Description
Applicable Benefit Category
Applicable Typical Facility Typology
Dire
ct B
enefi
ts
Indi
rect
Ben
efits
Oth
er P
oten
tial
Ben
efits
Bui
ldin
g St
ruct
ures
Com
plex
Fa
cilit
ies
Tran
spor
tatio
nSt
reet
scap
es
Plaz
as
Park
Fea
ture
s
Engineering Estimates for Damages
bull Engineered estimate models of physical damages and service losses at the project site based on the Guidelines event recurrence interval(s) and flood depth(s)
Y Y Y Y Y Y
Historic Damages and Service Losses
bull Historic physical damages and service losses at the project site documented from previous flood events
bull Do not use routine maintenancebull The historic damage event recurrence interval
(RIs) andor flood depths must be determined updated for inflation to the present value and adjusted to match the Guidelines event RIsflood depths
Y Y Y Y Y Y
Facility Replacement Value
bull The unit cost to rebuild the facility
Impacted Area bull The geographic area impacted by the facility in the event of failure in acres
Y Y Y Y
Facility Capacity
bull The design capacity of the facilitybull For example - facility capacity expressed in
millions of gallons per day (MGD) for water and wastewater facilities or megawatts (MW) for electrical facilities
Y Y Y Y
Service Population
bull The number of impacted residents served by the facility
bull Typically estimated based on number of impacted residential customers x average number of individuals per household (based on current US Census data or use 25 individuals per household as a default)
bull Facilities serving mostly non-residentialpublic buildings andor critical facilities should focus on service losses rather than service population
Y Y Y
NYC Mayorrsquos Office of Recovery and Resiliency Climate Resiliency Design Guidelines
48APPENDIX 4 - PROJECT BENEFITS CATEGORIES
Table 16 ndash Guidance on quantitative calculations for (1) sea level rise with coastal storm surge and (2) increased precipitation measures
Data Input General Guidance ndash Basic Description
Applicable Benefit Category
Applicable Typical Facility Typology
Dire
ct B
enefi
ts
Indi
rect
Ben
efits
Oth
er P
oten
tial
Ben
efits
Bui
ldin
g St
ruct
ures
Com
plex
Fa
cilit
ies
Tran
spor
tatio
nSt
reet
scap
es
Plaz
as
Park
Fea
ture
s
Value of Service
bull Unit value of service provided by the facilitybull Example of FEMA standard values for complete
loss of utility service $105personday for potable water$49personday for wastewater$148personday for electrical
bull Consider updating FEMA standard per capita values to reflect current The New York City utility rates
Y Y
Roadway Elevations bull Roadway Elevations
Y Y
Roadway Replacement Value
bull Roadway Replacement ValueY Y
Inundation Area Map
bull Inundation Area Map developed by FEMA or through modeling by project design team
Y Y Y
Building Inventory of Inundation Area
bull The number and type of buildings within the streetscape and neighborhood inundated by the Guidelinersquos flood events
Y Y Y
Average Daily Traffic (ADT)
bull The average number of one-way traffic trips per day along the roadway(s) within the streetscapeneighborhood inundated by the Guidelinersquos flood events
Y Y
Additional Travel Time
bull The additional travel time needed to detour around a flooded roadway expressed in minutes
bull In the unlikely event there is no detour available use a 12-hour travel time per one-way trap but provide a detailed area street map as supporting documentation
Y Y
Value of Traffic Delay
bull The value of service associated with lost time in traffic
bull For example - FEMA standard average value of $3344vehiclehour of delay
bull Consider updating FEMA and GSA standard values to reflect current New York City area labor rates and fuel costs
Y Y
NYC Mayorrsquos Office of Recovery and Resiliency Climate Resiliency Design Guidelines
49APPENDIX 4 - PROJECT BENEFITS CATEGORIES
Table 17 ndash Guidance on quantitative unit benefit calculations for extreme heat hazard measures
Measure General Guidance ndash Unit Benefit Information and Data Requirements
Applicable Benefit Category
Applicable Typical Facility Typology
Dire
ct B
enefi
ts
Indi
rect
Ben
efits
Oth
er P
oten
tial
Ben
efits
Bui
ldin
g St
ruct
ures
Com
plex
Fa
cilit
ies
Tran
spor
tatio
nSt
reet
scap
es
Plaz
as
Park
Fea
ture
s
Green Roof
bull Unit benefit range over PUL = $470SF to $373SF of green roof area ($719SF standard value)
bull Assumed PUL = 40 yearsbull Apply standard value unit benefit to green
roof area to estimate measure benefitbull Higher range values more applicable
to residential and commercial building streetscape projects
Y Y Y Y Y Y
Bioswale Rain Garden Meadow Mix
bull Unit benefit range over PUL = $396SF to $211SF of area ($730SF standard value)
bull Assumed PUL = 30 yearsbull Apply standard value unit benefit to bioswale
rain gardenmeadow mix area to estimate total measure benefit
Y Y Y Y Y Y
Cool Roof
bull Unit benefit range over PUL = $117 to $3151SF of material area ($144SF standard value)
bull Assumed PUL = 20 yearsbull Apply standard value unit benefit to cool roof
area to estimate total measure benefitbull Higher range values more applicable to
residential building streetscape projects
Y Y Y Y Y
Light-Colored PaversLight-Colored Materials
bull Unit benefit range over PUL = $0774 to $204SF of material area ($0866SF standard value)
bull Assumed PUL = 30 yearsbull Apply standard value unit benefit to material
area to estimate total measure benefit
Y Y Y Y
Table 17 provides general guidance on how to quantitatively calculate benefits from efforts to address climate stressors See Section IIIE for more information
NYC Mayorrsquos Office of Recovery and Resiliency Climate Resiliency Design Guidelines
50APPENDIX 4 - PROJECT BENEFITS CATEGORIES
Table 17 ndash Guidance on quantitative unit benefit calculations for extreme heat hazard measures
Measure General Guidance ndash Unit Benefit Information and Data Requirements
Applicable Benefit Category
Applicable Typical Facility Typology
Dire
ct B
enefi
ts
Indi
rect
Ben
efits
Oth
er P
oten
tial
Ben
efits
Bui
ldin
g St
ruct
ures
Com
plex
Fa
cilit
ies
Tran
spor
tatio
nSt
reet
scap
es
Plaz
as
Park
Fea
ture
s
Tree Planting
bull Unit benefit range over PUL = $1005 to $77154Tree ($1855Tree standard value)
bull Assumed PUL = 30 yearsbull Apply standard value unit benefit to number of
trees to estimate total measure benefitbull Higher range values more applicable
to residential and commercial building streetscape projects
Y Y Y Y Y Y
Planter Box Tree
bull Unit benefit range over PUL = $212 to 16304Tree ($392Tree standard value)
bull Assumed PUL = 15 yearsbull Apply standard value unit benefit to number of
trees to estimate total measure benefitbull Higher range values more applicable
to residential and commercial building streetscape projects
Y Y Y Y Y
Shade Canopy
bull Unit benefit range over PUL = $0363 to $396SF ($0458SF standard value)
bull Assumed PUL = 15 yearsbull Apply standard value unit benefit to area of
shade canopy estimate total measure benefitbull Higher range values more applicable
to residential and commercial building streetscape projects
Y Y Y Y
Permeable Grass Pavers
bull Unit benefit range over PUL = $0258SF to $0521SF of pavers ($0363SF standard value)
bull Assumed PUL = 30 yearsbull Apply standard value unit benefit to paver
area to estimate total measure benefit
Y Y Y Y Y
For the purposes of the BCA refer to the following facility typologies bull ldquoBuilding Structuresrdquo include critical small building sites such as EMS or FDNY stations and non-critical small building sites such as
libraries or comfort stationsbull ldquoComplex Facilitiesrdquo include critical infrastructure such as wastewater treatment sites pump stations water filtration plants and similar
large or complex facilitiesbull ldquoTransportationStreetscapePlazasrdquo include roadway reconstruction streetscape improvements street raising plazas and other
transportation-related infrastructurebull ldquoPark Featuresrdquo include parks and similar public recreational facility with natural landscape features
NYC Mayorrsquos Office of Recovery and Resiliency Climate Resiliency Design Guidelines
51APPENDIX 5 - EXAMPLE PLANNING DECISION TREE
This decision tree provides a summarized example approach for how to implement these Guidelines Projects with a total cost greater than $50 million are recommended to conduct a full qualitative and quantitative climate change risk assessment and BCA while projects below $50 million are recommended to conduct a qualitative risk assessment and BCA
Define Project
1) Operational goals and criticality level2) Useful life3) Location in the current flood plain future floodplain and or zone
of tidal inundation and the project arearsquos score on the heat vulnerability index
Evaluate Project Risks According to Probability and Magnitude of Consequence
bull Extreme Heat bull Precipitationbull Sea Level Risebull Coastal Surge
High Level Identification and Assessment of Risk Mitigation Alternatives and Co-benefits
(qualitative)
Detailed Identification and Assessment of Risk Mitigation Alternatives and Co-benefits (qualitative and quantitative)
High Level Estimate of Costs and Benefits of Design Alternatives
(qualitative)
Detailed Estimate of Costs and Benefits of Design Alternatives
(qualitative and quantitative)
Decision Point Which climate change risks require mitigation
Decision Point Evaluate risk mitigation benefits and costs to
determine final resilient design alternative or if no action is required
Decision Point Is the total project cost above $50 million
Below $50 million Above $50 million
APPENDIX 5 - EXAMPLE PLANNING DECISION TREE
NYC Mayorrsquos Office of Recovery and Resiliency Climate Resiliency Design Guidelines
52
Project Title
Design Strategies Checklist (not exhaustive)
Extreme Heat Comments Extreme Precipitation Comments Sea Level Rise amp Storm Surge Comments
Select Site in Low Heat Vulnerability Index area Select High Elevation Site Select High Elevation Site
Minimize East-West Building Orientation Green Roof Raise Building Floor Elevation
Passive Solar Cooling and Ventilation Systems
Protect Below Grade Areas from Flooding Waterproof Building Envelope
Cool Roof (SRI appropriate) On-site Stormwater Management (gray) Elevate Critical Building Functions
Green Roof (extensive) Reduce Impervious Areas Elevate Critical Equipment
Vegetative Structures Permeable Pavement Perimeter Floodwall100 Levee (passive or active)
Enhanced HVAC System including space layout optimization and system scalability
Increase Green Spaces and Planted Areas DryWet Floodproofing
More Efficient Building Envelope Other Utility Redundancy Design101
Parking Lot Shading Resilient Materials amp Landscape Treatments
Light Colored Pavements (appropriate SRI) Design for Storm Surge Outflow
Increase Planted Areas Install Backwater Flow Prevention
Permeable Surfaces Design for Scour
Open-grid Pavement Raise Road Elevation
Other Other
This appendix provides a template for identifying possible design strategies to address climate change risks as described throughout the Guidelines
APPENDIX 6 - DESIGN STRATEGIES CHECKLIST
100 Permanent perimeter flood walls are not permitted to meet floodproofing requirements in buildings with substantial improvements andor damages 101 Utility redundancy design should be pursued for critical systems not all building systems
APPENDIX 6 - DESIGN STRATEGIES CHECKLIST
NYC Mayorrsquos Office of Recovery and Resiliency Climate Resiliency Design Guidelines
53APPENDIX 7 - CLIMATE CHANGE RISK ASSESSMENT RESOURCES
These Guidelines provide data on climate change hazards and recommend how that data can inform resilient design A risk assessment is a tool to help project managers and designers evaluate risk levels as well as select and prioritize resilient design strategies A high level risk assessment is recommended for all City capital projects with a total cost of under $50 million Projects above $50 million are recommended to conduct an in-depth assessment
Risk assessments use quantified estimates of the probability and magnitude of consequence of an event occurring to prioritize responses ldquoProbabilityrdquo is an assessment of the likelihood of a hazard occurring while ldquomagnituderdquo describes the hazardrsquos potential impact Risk assessment tools such as the examples listed below can be used to define and score these categories Projects that score higher across both probability and magnitude can be prioritized for investment and risk mitigation action Projects that score lower across both criteria may require no action beyond meeting code The results are typically charted on a risk matrix and an example is provided on the next page
The climate change risk management frameworks below offer templates for how to integrate climate change projections into a risk assessment process Refer to these resources for examples and further information
bull Vulnerability Assessment and Adaptation Framework is prepared by the Federal Highway Administration (FHWA) While developed for transportation planning this risk assessment framework has broad applicability for evaluating asset vulnerability to climate change Available at httpswwwfhwadotgovenvironmentsustainabilityresilienceadaptation_framework
bull US Climate Resilience Toolkit The US Global Change Research Program offers a step by step risk assessment
framework including tools and case studies at httpstoolkitclimategovsteps (see example on next page)
bull Coast Adapt Guidance on undertaking a risk assessment High level assessment httpscoastadaptcomausitesdefaultfilesfactsheetsT3M4_2_2nd_pass_risk_assessmentpdfDetailed assessment httpscoastadaptcomausitesdefaultfilesfactsheetsT3M4_3_3rd_pass_risk_assessmentpdf
bull Climate adaptation Risk uncertainty and decision-makingDownload the report here httpswwwukciporgukpublicationsRisk
The City plans to develop a NYC-specific process for integrating climate change data into existing risk management processes by April 2019
APPENDIX 7 - CLIMATE CHANGE RISK ASSESSMENT RESOURCES
NYC Mayorrsquos Office of Recovery and Resiliency Climate Resiliency Design Guidelines
54APPENDIX 7 - CLIMATE CHANGE RISK ASSESSMENT RESOURCES
The Risk Characterization Matrix below is an example from the US Climate Resilience Toolkit This tool can be used to assess the probability and magnitude of impact for identified risks The risk of coincident climate stressorsrisks (such as storm surge plus increased precipitation) can also be assessed as applicable
Figure 14 - Example of a climate change risk matrix (adapted from US Climate Resilience Toolkit)
Project teams can determine the magnitude of the impact (along the horizontal scale of 1 through 3 with 3 being the most severe) and the probabilitylikelihood of occurrence for each specific risk (along the vertical scale with 3 being the most likely) A score is typically assigned for each risk (Probabil-ity x Magnitude) and then charted on the matrix Based on the estimated probability and magnitude of consequence above the risks are ranked and prioritized for mitigation Factors to bear in mind include
bull Not all facility typologies have the same level of functional and operational importance during events or tolerance for disruption
bull Not all climate stressors and risks have the same level of impact on each project sitebull Not all identified risks can or should be mitigated fully
NYC Mayorrsquos Office of Recovery and Resiliency Climate Resiliency Design Guidelines
55WORKS CITED
A Stronger More Resilient New York PlaNYC Report of the NYC Special Initiative for Rebuilding and Resiliency The City of New York 2013
ldquoAccount for Climate Riskrdquo International Finance Corporation accessed March 27 2017 httpwwwifcorgwpswcmconnectTopics_Ext_ContentIFC_External_Corporate_SiteClimate+Business
PrioritiesAccount+for+Climate+Risk
American Society of Heating Refrigeration and Air-Conditioning Engineers (ASHRAE) Handbook -Fundamentals 2017
ldquoBaseline Standard Economic Value Methodology Reportrdquo Federal Emergency Management Agency July 2016
Benefit Cost Analysis Toolkit Software Version 530 Federal Emergency Management Agency (build date December 2016)
Criteria for Detention Facility Design New York City Department of Environmental Protection November 2012
Community Resilience Planning Guide for Buildings and Infrastructure Systems Vol 1 NIST Special Publication 1190 US Department of Commerce 2016
Cool and Green Roofing Manual NYC Department of Design and Construction 2007 httpwwwnycgovhtmlddcdownloadspdfcool_green_roof_manpdf
Building Resiliency Task Force US Urban Green Building Council New York 2013 httpurbangreencouncilforcecomBuildingResiliency
Design and Planning for Flood Resiliency Guidelines for NYC Parks New York City Department of Parks and Recreation 2017
httpswwwnycgovparksorgplanning-and-buildingplanningresiliency-plansflood-resiliency
Flooded Bus Barns and Buckled Rails Federal Transit Administration Office of Budget and Policy 2011 httpswwwhsdlorgabstractampdid=685187
Floodproofing Non-Residential Buildings FEMA P936 FEMA 2013 httpswwwfemagovmedia-library-data9a50c534fc5895799321dcdd4b6083e7P-936_8-20-13_508rpdf
ldquoGlossaryrdquo International Infrastructure Management Manual National Asset Management Support Group New Zealand 2011 httpwwwipweaorg
ldquoGreen Roof Metrics Draft Reportrdquo New York City Department of Parks and Recreation 2017
ldquoGuide to Rain Event Preparednessrdquo NYC Department of Environmental Protection httpwwwnycgovhtmldeppdfbrochuresflood-preparedness-flyerpdf
ldquoGuidelines and Discount Rates for Benefit-Cost Analysis of Federal Programsrdquo Appendix C Circular A-94 US Office of Management and Budget (OMB) 2017
ldquoGuidelines for the Design and Construction of Stormwater Management Systemsrdquo New York City Department of Environmental Protection July 2012
Horton R et al New York City Panel on Climate Change 2015 Report Ann NY Acad Sci ISSN 0077-892 New York 2015
Madrigano J et al ldquoA case-only study of vulnerability to heat wavendashrelated mortality in New York City (2000ndash2011)rdquo Environmental Health Perspectives 123672ndash678 2013
WORKS CITED
NYC Mayorrsquos Office of Recovery and Resiliency Climate Resiliency Design Guidelines
56WORKS CITED
enspMcGregor et al Two Degrees The Built Environment and Our Changing Climate Routledge Press 2013
NYC Green Codes Task Force US Green Building Council New York 2010 httpurbangreencouncilorgGreenCodes
NYCrsquos Risk Landscape A Guide to Hazard Mitigation NYC Emergency Management 2014
One New York The Plan for a Strong and Just City The City of New York 2015 httpwwwnycgovhtmlonenyc downloadspdfpublicationsOneNYCpdf
Ready to Respond Strategies for Multifamily Building Resilience Enterprise Green Communities 2015 httpswwwenterprisecommunityorgresources
Rosenzweig C et al Climate Change Adaptation in New York City Building a Risk Management Response New York City Panel on Climate Change 2010
httponlinelibrarywileycomdoi101111nyas20101196issue-1 issuetoc
ldquoSustainable Infrastructure Management Program Learning Environmentrdquo Water Environment Research Foundation accessed March 24 2017 httpsimplewerforg
Urban Waterfront Adaptive Strategies NYC Department of City Planning 2013 httpwww1nycgovsiteplanningplanssustainable-communitiesclimate-resiliencepagetab=1
Wastewater Resiliency Plan Climate Risk Assessment and Adaptation Study New York City Department of Environmental Protection October 2013
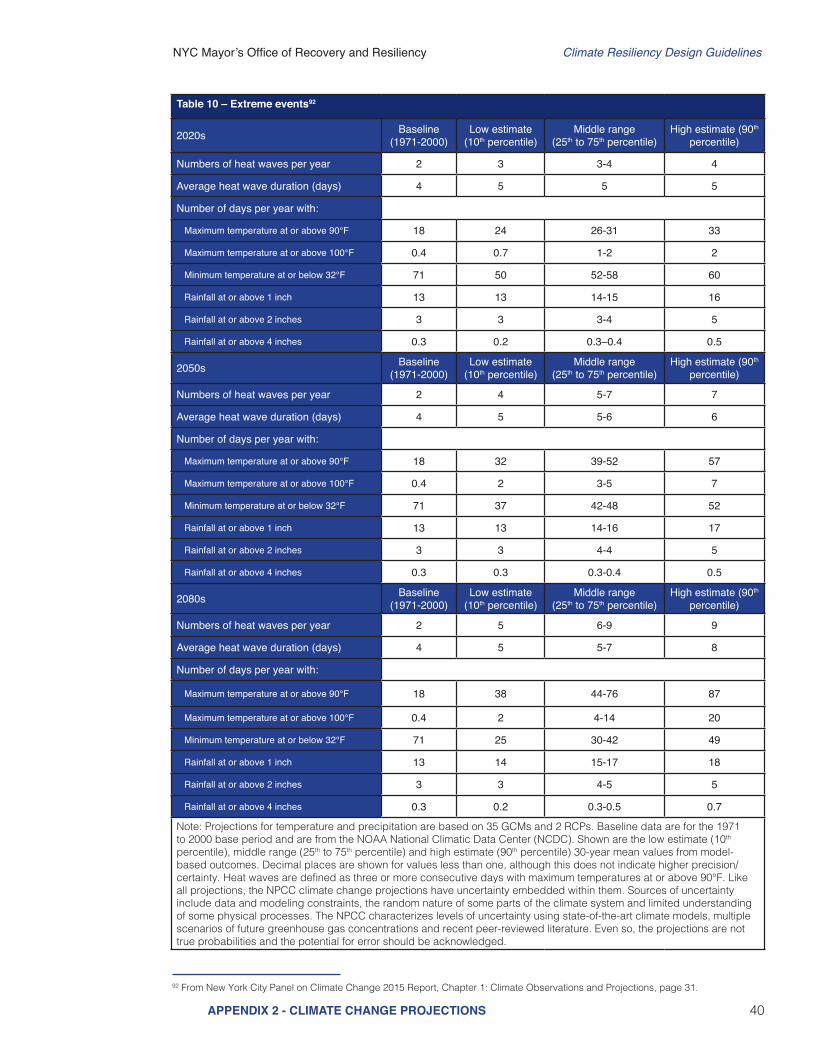
NYC Mayorrsquos Office of Recovery and Resiliency Climate Resiliency Design Guidelines
40APPENDIX 2 - CLIMATE CHANGE PROJECTIONS
Table 10 ndash Extreme events92
2020s Baseline (1971-2000)
Low estimate(10th percentile)
Middle range(25th to 75th percentile)
High estimate (90th percentile)
Numbers of heat waves per year 2 3 3-4 4
Average heat wave duration (days) 4 5 5 5
Number of days per year with
Maximum temperature at or above 90degF 18 24 26-31 33
Maximum temperature at or above 100degF 04 07 1-2 2
Minimum temperature at or below 32degF 71 50 52-58 60
Rainfall at or above 1 inch 13 13 14-15 16
Rainfall at or above 2 inches 3 3 3-4 5
Rainfall at or above 4 inches 03 02 03ndash04 05
2050s Baseline (1971-2000)
Low estimate(10th percentile)
Middle range(25th to 75th percentile)
High estimate (90th percentile)
Numbers of heat waves per year 2 4 5-7 7
Average heat wave duration (days) 4 5 5-6 6
Number of days per year with
Maximum temperature at or above 90degF 18 32 39-52 57
Maximum temperature at or above 100degF 04 2 3-5 7
Minimum temperature at or below 32degF 71 37 42-48 52
Rainfall at or above 1 inch 13 13 14-16 17
Rainfall at or above 2 inches 3 3 4-4 5
Rainfall at or above 4 inches 03 03 03-04 05
2080s Baseline (1971-2000)
Low estimate(10th percentile)
Middle range(25th to 75th percentile)
High estimate (90th percentile)
Numbers of heat waves per year 2 5 6-9 9
Average heat wave duration (days) 4 5 5-7 8
Number of days per year with
Maximum temperature at or above 90degF 18 38 44-76 87
Maximum temperature at or above 100degF 04 2 4-14 20
Minimum temperature at or below 32degF 71 25 30-42 49
Rainfall at or above 1 inch 13 14 15-17 18
Rainfall at or above 2 inches 3 3 4-5 5
Rainfall at or above 4 inches 03 02 03-05 07
Note Projections for temperature and precipitation are based on 35 GCMs and 2 RCPs Baseline data are for the 1971 to 2000 base period and are from the NOAA National Climatic Data Center (NCDC) Shown are the low estimate (10th percentile) middle range (25th to 75th percentile) and high estimate (90th percentile) 30-year mean values from model-based outcomes Decimal places are shown for values less than one although this does not indicate higher precisioncertainty Heat waves are defined as three or more consecutive days with maximum temperatures at or above 90degF Like all projections the NPCC climate change projections have uncertainty embedded within them Sources of uncertainty include data and modeling constraints the random nature of some parts of the climate system and limited understanding of some physical processes The NPCC characterizes levels of uncertainty using state-of-the-art climate models multiple scenarios of future greenhouse gas concentrations and recent peer-reviewed literature Even so the projections are not true probabilities and the potential for error should be acknowledged
92 From New York City Panel on Climate Change 2015 Report Chapter 1 Climate Observations and Projections page 31
NYC Mayorrsquos Office of Recovery and Resiliency Climate Resiliency Design Guidelines
41APPENDIX 3 - DIFFERENTIATION OF FLOOD MAPS
These Guidelines reference several different kinds of flood maps and sources of design flood elevations These maps are described and differentiated below
Table 11 - Differentiation of flood maps used in NYC
Reference Title Data Source Information Provided Referenced By Link
2007 FIRM FEMA
Based on historical data from before 1983 identifies the current base flood (extent and elevation) as the flood that has a 1 chance of occurring in any given year also known as a 100-year flood The NYC Building Code requires that either the 2007 FIRM or 2015 PFIRM elevation be used whichever is higher
2014 NYC Building Code Appendix G
Climate Resiliency Design Guidelines
httpsmscfemagovportal
2015 PFIRM FEMA
Based on historical data identifies the current base flood (extents and elevation) as the flood that has a 1 chance of occurring in any given year also known as a 100-year flood The NYC Building Code requires that either the 2007 FIRM or 2015 PFIRM elevation be used whichever is higher The 2015 PFIRM is currently being reassessed by FEMA
2014 NYC Building Code Appendix G
Climate Resiliency Design Guidelines
httpshazardsfemagovfemaportalprelimdownload
httpwwwregion2coastalcomview-flood-maps-dataview-preliminary-flood-map-data
NYC Flood Hazard Mapper
NYC Department of City Planning
Maps current and future flood hazards in NYC including the following data layers 2007 FIRM and 2015 PFIRM high tide with sea level rise and PFIRM with sea level rise through 2100
Climate Resiliency Design Guidelines
Waterfront Revitalization Plan
httpwww1nycgovsiteplanningdata-mapsflood-hazard-mapperpage
ldquoTable 4 ndash Determine the sea level rise-adjusted design flood elevation for critical and non-critical facilitiesrdquo
ORR amp NPCC
Provides data to use when adding sea level rise to a given 2015 PFIRM or 2007 FIRM Base Flood Elevation (BFE) to calculate a Design Flood Elevation (DFE) Based on the criticality and expected useful life of a facility
Climate Resiliency Design Guidelines
See Section II on ldquoSea Level Riserdquo above
APPENDIX 3 - DIFFERENTIATION OF FLOOD MAPS
NYC Mayorrsquos Office of Recovery and Resiliency Climate Resiliency Design Guidelines
42APPENDIX 4 - PROJECT BENEFITS CATEGORIES
This appendix provides guidance on how to identify and assess benefits as a supplement to Sections IIID and IIIE
Table 12 lists typical direct benefits for reducing impacts from climate stressors and basic guidance for how to estimate them See Section IIID for more information
Table 13 lists typical indirect benefits for reducing impacts from climate stressors and basic guidance for how to estimate them See Section IIID for more information
Table 12 ndash Direct benefits for (1) sea level rise with coastal storm surge and (2) increased precipitation measures
Direct Benefit Basic Guidance for Estimating Values
Physical Damages (Structure Contents)
bull For flood-damaged buildings use depth damage functions developed by FEMA and USACE for structures and contents
bull Use depth damage functions in conjunction with Building Replacement Values (BRVs) and not market values BRVs typically range between $100 to $325SF for residential buildings and $120 to $450SF for commercial public buildings
bull For more complex structures or facilities use engineering estimates of flood damages or review historic flood damages documented from insurance claims repair records or FEMA Public Assistance claims from recent flood disasters
Residential Displacements
bull For flood-damaged buildings use depth damage functions developed by FEMA and USACE for residential displacements
Reduced Life CycleOperation and Maintenance (OampM) Costs93
bull Applicable only to projects that reduce overall life cycle costs or net annual OampM costs from baseline conditions
bull Input reduced annual OampM costs as a project benefit at a 1-year recurrence intervalbull Reduced overall life cycle costs can be input as a longer project useful life
Table 13 ndash Indirect benefits for (1) sea level rise with coastal storm surge and (2) increased precipitation measures
Indirect Benefit Basic Guidance for Estimating Values
Non-Residential Building Service Losses
bull Estimate service loss values and durations for non-residential buildings public buildings critical facilities and parksnatural features based on FEMA BCA guidance and standard values based on building use
Utility Service Losses94
bull Estimate utility service losses for water wastewater and electrical facilities based on the number of impacted customers FEMA per capita standard values for utility service ($105personday for potable water $49personday for wastewater $148personday for electrical)95
bull Estimate utility service loss durations based on engineering estimates or review historic flood damages losses documented from utility company records
bull This benefit can also apply to measures that increase energy efficiency
RoadBridge Service Losses
bull Estimate roadbridge service losses based on the average daily traffic (ADT) detour time and additional travel distance and FEMA and GSA standard values for road service ($3344vehiclehour of delay $0545mile)96
bull Estimate roadbridge service loss durations or review historic flood damages losses
Emergency Service Losses
bull Applicable only to projects that reduce or eliminate documented emergency service costs from baseline conditions
bull Examples of avoided emergency services costs include NYPD staffing to monitor barricades for flooded roads or NFDY staffing for water rescues of residents from flooded buildings or streets
APPENDIX 4 - PROJECT BENEFITS CATEGORIES
93 Reduced life cycle costs may be applicable to some measures that provide extreme heat benefits such as green roofs that can last longer than a standard roof if properly maintained
94 Reduced utility service costs may be applicable to some measures that provide extreme heat benefits such as cool roofs green roofs and shade trees
95 FEMA per capita standard values taken from FEMA BCA Toolkit Version 530 (Build Date 12222016) and developed in FEMArsquos Baseline Standard Economic Value Methodology Report (July 28 2016) Consider updating FEMA standard per capita values to reflect current New York City utility rates
96 Consider updating FEMA and GSA standard values to reflect current New York City area labor rates and fuel costs
NYC Mayorrsquos Office of Recovery and Resiliency Climate Resiliency Design Guidelines
43APPENDIX 4 - PROJECT BENEFITS CATEGORIES
Table 14 ndash Other potential benefits for (1) sea level rise with coastal storm surge and (2) increased precipitation measures
Other Benefit Basic Guidance for Estimating Values
Avoided Stress and Anxiety
bull Applicable only for projects that directly benefit occupants of residential structuresbull Use FEMA standard value for avoided mental stress and anxiety treatment costs of $2443person to
estimate benefit for all impacted residents97
Avoided Lost Productivity
bull Applicable only for projects that directly benefit occupants of residential structuresbull Use FEMA standard value for avoided lost worker productivity costs of $8736household to estimate
benefit for all impacted workers (conservatively assuming one worker per household)
Environmental Open Space
bull Applicable only for projects that create or acquire open space areas by acquisitionbull Use FEMA standard value for environmental open space based on the type of land acquired ($8308
Acreyear for Green open space $39545Acreyear for Riparian $6010Acreyear for Wetlands $554Acreyear for Forests $1799Year for Marine and estuary)97
CSO Volume Reduction
bull Applicable only for projects that provide Combined Sewer Overflow (CSO) abatement by reducing the volume of rainfall runoff
bull Use CSO abatement cost of $0015gallonsyear applied to increased precipitation hazard runoff volume for 5-year design storm98
Ecosystem Service99
bull Add stormwater management benefits of green infrastructure projects to increased precipitation hazards where avoided damages and service losses are not quantified
bull Unit benefits applicable to increased precipitation hazard includeo Green roofs $0133SFyear (PUL 40 years)o BioswaleRain GardenMeadow Mix $0020SFyear (PUL 30 years)o Permeable Grass Pavers $0020SFyear (PUL 30 years)o Tree Plantings $303Treeyear (PUL 30 years)o Planter Box Trees $101Treeyear (PUL 15 years)
Real Estate99
bull Potential real estate benefits from increased resilience of residential andor commercial propertiesstreetscapesneighborhoods included within the project scope
bull Benefit applied to extreme heat hazard for green infrastructure projects directly impacting residential or commercial properties
Quality of Life Health Benefits99
bull Potential quality of life benefits related to improved public health from the resilience measures included within the project scope
bull Benefit applied to extreme heat hazard for green infrastructure projects directly impacting residential or commercial properties
Table 14 lists other typical benefits for reducing impacts from climate stressors and basic guidance for how to estimate them See Section IIID for more information
97 FEMA standard values for avoided mental stress and anxiety and environmental open space values taken from FEMA BCA Toolkit Version 530 (Build Date 12222016)
98 CSO abatement cost taken from APG1 Report for NYC ldquoTechnical Approaches for Benefit-Cost Analysis of Hazard Mitigation Projects in Urban and Coastal Environmentsrdquo (April 2016)
99 Ecosystem Services Real Estate and Quality of LifeHealth benefits tend to be more applicable to green infrastructure measures that provide extreme heat benefits such as green roofs trees and other plantings
NYC Mayorrsquos Office of Recovery and Resiliency Climate Resiliency Design Guidelines
44APPENDIX 4 - PROJECT BENEFITS CATEGORIES
Table 15 ndash Potential benefits for extreme heat (Urban Heat Island) reduction measures
Category Benefit Basic Guidance for Estimating Values
Direct Benefit
Reduced Life Cycle Cost
bull Applicable only to measures such as green roofs that are expected to last longer than standard roofs
bull Compute total cost savings including annual OampM costs
Indirect Benefit
Energy Savings
bull Applicable to measures that reduce energy costs by providing cooling through increased shading andor evapotranspiration
bull Use New York Power Authority rates of $0148kWh for electricity and $0810Therm for natural gas
Other Potential Benefits
Air Quality bull Applicable to measures that absorb pollutants andor reduce carbon dioxide emissions
Acoustics bull Applicable to measures such as green roof or walls that reduce noise transfer
Quality of LifeHealth bull Potential quality of life benefits and related to improved public health
Real Estate bull Applicable to measures that provide residential real estate benefits from increased resilience of propertiesstreetscapesneighborhoods
Retail Sales Marketing
bull Applicable to measures that provide commercial property benefits from increased aesthetics resulting in increased marketing and sales for streetscapesneighborhoods
Tax Credits Incentives
bull Applicable to resilience or green infrastructure measures such as green roofs that have accompanying Federal State or City tax credits or other incentives
Table 15 lists potential benefits for reducing impacts from heat and basic guidance for how to estimate them See Section IIID for more information
NYC Mayorrsquos Office of Recovery and Resiliency Climate Resiliency Design Guidelines
45APPENDIX 4 - PROJECT BENEFITS CATEGORIES
Table 16 ndash Guidance on quantitative calculations for (1) sea level rise with coastal storm surge and (2) increased precipitation measures
Data Input General Guidance ndash Basic Description
Applicable Benefit Category
Applicable Typical Facility Typology
Dire
ct B
enefi
ts
Indi
rect
Ben
efits
Oth
er P
oten
tial
Ben
efits
Bui
ldin
g St
ruct
ures
Com
plex
Fa
cilit
ies
Tran
spor
tatio
nSt
reet
scap
es
Plaz
as
Park
Fea
ture
s
First Floor Elevation (FFE)
bull The elevation of the first finished floor of the structure excluding basements
bull FFE measured from top of lowest floor (riverinenon-coastal high hazard areas) or bottom of lowest horizontal structural member (coastal high hazard areas)
Y Y Y Y
Building Replacement Value (BRV)
bull The unit cost to rebuild a structure of the same quality of construction
bull Not the same as market value
Y Y Y Y
Building Size
bull The total floor area of the building in square feet
bull Total Building Value = BRV x Building Sizebull Typical BRVs for NYC range between $100 to
$325SF for residential buildings and $120 to $450SF for commercialpublic buildings
Y Y Y Y
Structure Description
bull The type of building number of stories and foundation type (full basement partial basement no basement)
bull Collect more detailed foundation data for coastal flood zones
Y Y Y Y
Building Use bull Details related to residential housing commercial business and public use
Y Y Y Y Y
Building Type bull The primary use of building ndash residential commercial public and others
Y Y Y Y Y
Depth Damage Function (DDF)
bull Curves used to estimate structure damage contents damage and displacement of residential buildings based on flood depth
bull DDFs selection based on Structure Description Building Type Building Use
bull Structure DDFs based on percentage of Total Building Value
bull Contents DDFs based on percentage of Total Contents Value
bull Displacement DDFs based on number of displacement days x Displacement Cost
Y Y Y Y Y
Contents Value
bull The cost to replace structure contents (furnishings equipment)
bull Residential building Contents Values typically 50 BRV (FEMA DDFs) or 100 BRV (USACE DDFs)
bull Non-residential building Contents Values between 18 to over 100 depending on building use (USACE DDFs)
bull Total Contents Value = BRV x Building Size
Y Y Y Y Y
Table 16 provides general guidance on how to quantitatively calculate benefits from efforts to address from climate stressors See Section IIIE for more information
NYC Mayorrsquos Office of Recovery and Resiliency Climate Resiliency Design Guidelines
46APPENDIX 4 - PROJECT BENEFITS CATEGORIES
Table 16 ndash Guidance on quantitative calculations for (1) sea level rise with coastal storm surge and (2) increased precipitation measures
Data Input General Guidance ndash Basic Description
Applicable Benefit Category
Applicable Typical Facility Typology
Dire
ct B
enefi
ts
Indi
rect
Ben
efits
Oth
er P
oten
tial
Ben
efits
Bui
ldin
g St
ruct
ures
Com
plex
Fa
cilit
ies
Tran
spor
tatio
nSt
reet
scap
es
Plaz
as
Park
Fea
ture
s
Number of Residents (Residential)
bull Total number of occupants in a residential building
bull Typically estimated based on number of residential units x average number of individuals per household (based on current US Census data or use 25 individuals per household as a default)
Y Y Y Y Y
Displacement Cost (Residential)
bull The unit cost to lodge and feed displaced residents while flood damage is repaired
bull Average unit displacement cost of $415residential unitday recommended based on current FY2018 GSA Per Diem rates for New York City
Y Y Y Y Y
Value of Service (Non-Residential and Public)
bull The unit cost of service disruption and rental of temporary facilities while flood damage is repaired
bull Disruption costs for non-residential buildings typically range from $095 to $136SFmonth and rental costs range from $020 to $136SFmonth depending on building use
bull Value of service for public buildings ($day) is typically based on the annual operating budget for the City agency using the building prorated based on building size or population served by the building then divided by 365 daysyear
Y Y Y Y
Value of Service (Critical Facilities)
bull The unit cost of critical facilities (police fire emergency medical services) lost or delayed while flood damage is repaired
Y Y Y
Value of Service Duration
bull The duration of service disruption and rental of temporary facilities for non-residential buildings and critical facilities while flood damage is repaired
bull For non-residential buildingso Value of Service Durations vary from
4 months to over 30 months based on building use and the depth of flooding
o Total Value of Service Loss = (Disruption Cost x Building Area) = (Rental Cost x Building Area x Value of Service Duration)
bull For public buildings and critical facilitieso Value of Service Durations vary from 0
days to 720 months based on building use and the depth of flooding from FEMA FIA or USACE DDFs
o Total Value of Service Loss = (Value of Service) x (Service Loss Duration)
Y Y Y
NYC Mayorrsquos Office of Recovery and Resiliency Climate Resiliency Design Guidelines
47APPENDIX 4 - PROJECT BENEFITS CATEGORIES
Table 16 ndash Guidance on quantitative calculations for (1) sea level rise with coastal storm surge and (2) increased precipitation measures
Data Input General Guidance ndash Basic Description
Applicable Benefit Category
Applicable Typical Facility Typology
Dire
ct B
enefi
ts
Indi
rect
Ben
efits
Oth
er P
oten
tial
Ben
efits
Bui
ldin
g St
ruct
ures
Com
plex
Fa
cilit
ies
Tran
spor
tatio
nSt
reet
scap
es
Plaz
as
Park
Fea
ture
s
Engineering Estimates for Damages
bull Engineered estimate models of physical damages and service losses at the project site based on the Guidelines event recurrence interval(s) and flood depth(s)
Y Y Y Y Y Y
Historic Damages and Service Losses
bull Historic physical damages and service losses at the project site documented from previous flood events
bull Do not use routine maintenancebull The historic damage event recurrence interval
(RIs) andor flood depths must be determined updated for inflation to the present value and adjusted to match the Guidelines event RIsflood depths
Y Y Y Y Y Y
Facility Replacement Value
bull The unit cost to rebuild the facility
Impacted Area bull The geographic area impacted by the facility in the event of failure in acres
Y Y Y Y
Facility Capacity
bull The design capacity of the facilitybull For example - facility capacity expressed in
millions of gallons per day (MGD) for water and wastewater facilities or megawatts (MW) for electrical facilities
Y Y Y Y
Service Population
bull The number of impacted residents served by the facility
bull Typically estimated based on number of impacted residential customers x average number of individuals per household (based on current US Census data or use 25 individuals per household as a default)
bull Facilities serving mostly non-residentialpublic buildings andor critical facilities should focus on service losses rather than service population
Y Y Y
NYC Mayorrsquos Office of Recovery and Resiliency Climate Resiliency Design Guidelines
48APPENDIX 4 - PROJECT BENEFITS CATEGORIES
Table 16 ndash Guidance on quantitative calculations for (1) sea level rise with coastal storm surge and (2) increased precipitation measures
Data Input General Guidance ndash Basic Description
Applicable Benefit Category
Applicable Typical Facility Typology
Dire
ct B
enefi
ts
Indi
rect
Ben
efits
Oth
er P
oten
tial
Ben
efits
Bui
ldin
g St
ruct
ures
Com
plex
Fa
cilit
ies
Tran
spor
tatio
nSt
reet
scap
es
Plaz
as
Park
Fea
ture
s
Value of Service
bull Unit value of service provided by the facilitybull Example of FEMA standard values for complete
loss of utility service $105personday for potable water$49personday for wastewater$148personday for electrical
bull Consider updating FEMA standard per capita values to reflect current The New York City utility rates
Y Y
Roadway Elevations bull Roadway Elevations
Y Y
Roadway Replacement Value
bull Roadway Replacement ValueY Y
Inundation Area Map
bull Inundation Area Map developed by FEMA or through modeling by project design team
Y Y Y
Building Inventory of Inundation Area
bull The number and type of buildings within the streetscape and neighborhood inundated by the Guidelinersquos flood events
Y Y Y
Average Daily Traffic (ADT)
bull The average number of one-way traffic trips per day along the roadway(s) within the streetscapeneighborhood inundated by the Guidelinersquos flood events
Y Y
Additional Travel Time
bull The additional travel time needed to detour around a flooded roadway expressed in minutes
bull In the unlikely event there is no detour available use a 12-hour travel time per one-way trap but provide a detailed area street map as supporting documentation
Y Y
Value of Traffic Delay
bull The value of service associated with lost time in traffic
bull For example - FEMA standard average value of $3344vehiclehour of delay
bull Consider updating FEMA and GSA standard values to reflect current New York City area labor rates and fuel costs
Y Y
NYC Mayorrsquos Office of Recovery and Resiliency Climate Resiliency Design Guidelines
49APPENDIX 4 - PROJECT BENEFITS CATEGORIES
Table 17 ndash Guidance on quantitative unit benefit calculations for extreme heat hazard measures
Measure General Guidance ndash Unit Benefit Information and Data Requirements
Applicable Benefit Category
Applicable Typical Facility Typology
Dire
ct B
enefi
ts
Indi
rect
Ben
efits
Oth
er P
oten
tial
Ben
efits
Bui
ldin
g St
ruct
ures
Com
plex
Fa
cilit
ies
Tran
spor
tatio
nSt
reet
scap
es
Plaz
as
Park
Fea
ture
s
Green Roof
bull Unit benefit range over PUL = $470SF to $373SF of green roof area ($719SF standard value)
bull Assumed PUL = 40 yearsbull Apply standard value unit benefit to green
roof area to estimate measure benefitbull Higher range values more applicable
to residential and commercial building streetscape projects
Y Y Y Y Y Y
Bioswale Rain Garden Meadow Mix
bull Unit benefit range over PUL = $396SF to $211SF of area ($730SF standard value)
bull Assumed PUL = 30 yearsbull Apply standard value unit benefit to bioswale
rain gardenmeadow mix area to estimate total measure benefit
Y Y Y Y Y Y
Cool Roof
bull Unit benefit range over PUL = $117 to $3151SF of material area ($144SF standard value)
bull Assumed PUL = 20 yearsbull Apply standard value unit benefit to cool roof
area to estimate total measure benefitbull Higher range values more applicable to
residential building streetscape projects
Y Y Y Y Y
Light-Colored PaversLight-Colored Materials
bull Unit benefit range over PUL = $0774 to $204SF of material area ($0866SF standard value)
bull Assumed PUL = 30 yearsbull Apply standard value unit benefit to material
area to estimate total measure benefit
Y Y Y Y
Table 17 provides general guidance on how to quantitatively calculate benefits from efforts to address climate stressors See Section IIIE for more information
NYC Mayorrsquos Office of Recovery and Resiliency Climate Resiliency Design Guidelines
50APPENDIX 4 - PROJECT BENEFITS CATEGORIES
Table 17 ndash Guidance on quantitative unit benefit calculations for extreme heat hazard measures
Measure General Guidance ndash Unit Benefit Information and Data Requirements
Applicable Benefit Category
Applicable Typical Facility Typology
Dire
ct B
enefi
ts
Indi
rect
Ben
efits
Oth
er P
oten
tial
Ben
efits
Bui
ldin
g St
ruct
ures
Com
plex
Fa
cilit
ies
Tran
spor
tatio
nSt
reet
scap
es
Plaz
as
Park
Fea
ture
s
Tree Planting
bull Unit benefit range over PUL = $1005 to $77154Tree ($1855Tree standard value)
bull Assumed PUL = 30 yearsbull Apply standard value unit benefit to number of
trees to estimate total measure benefitbull Higher range values more applicable
to residential and commercial building streetscape projects
Y Y Y Y Y Y
Planter Box Tree
bull Unit benefit range over PUL = $212 to 16304Tree ($392Tree standard value)
bull Assumed PUL = 15 yearsbull Apply standard value unit benefit to number of
trees to estimate total measure benefitbull Higher range values more applicable
to residential and commercial building streetscape projects
Y Y Y Y Y
Shade Canopy
bull Unit benefit range over PUL = $0363 to $396SF ($0458SF standard value)
bull Assumed PUL = 15 yearsbull Apply standard value unit benefit to area of
shade canopy estimate total measure benefitbull Higher range values more applicable
to residential and commercial building streetscape projects
Y Y Y Y
Permeable Grass Pavers
bull Unit benefit range over PUL = $0258SF to $0521SF of pavers ($0363SF standard value)
bull Assumed PUL = 30 yearsbull Apply standard value unit benefit to paver
area to estimate total measure benefit
Y Y Y Y Y
For the purposes of the BCA refer to the following facility typologies bull ldquoBuilding Structuresrdquo include critical small building sites such as EMS or FDNY stations and non-critical small building sites such as
libraries or comfort stationsbull ldquoComplex Facilitiesrdquo include critical infrastructure such as wastewater treatment sites pump stations water filtration plants and similar
large or complex facilitiesbull ldquoTransportationStreetscapePlazasrdquo include roadway reconstruction streetscape improvements street raising plazas and other
transportation-related infrastructurebull ldquoPark Featuresrdquo include parks and similar public recreational facility with natural landscape features
NYC Mayorrsquos Office of Recovery and Resiliency Climate Resiliency Design Guidelines
51APPENDIX 5 - EXAMPLE PLANNING DECISION TREE
This decision tree provides a summarized example approach for how to implement these Guidelines Projects with a total cost greater than $50 million are recommended to conduct a full qualitative and quantitative climate change risk assessment and BCA while projects below $50 million are recommended to conduct a qualitative risk assessment and BCA
Define Project
1) Operational goals and criticality level2) Useful life3) Location in the current flood plain future floodplain and or zone
of tidal inundation and the project arearsquos score on the heat vulnerability index
Evaluate Project Risks According to Probability and Magnitude of Consequence
bull Extreme Heat bull Precipitationbull Sea Level Risebull Coastal Surge
High Level Identification and Assessment of Risk Mitigation Alternatives and Co-benefits
(qualitative)
Detailed Identification and Assessment of Risk Mitigation Alternatives and Co-benefits (qualitative and quantitative)
High Level Estimate of Costs and Benefits of Design Alternatives
(qualitative)
Detailed Estimate of Costs and Benefits of Design Alternatives
(qualitative and quantitative)
Decision Point Which climate change risks require mitigation
Decision Point Evaluate risk mitigation benefits and costs to
determine final resilient design alternative or if no action is required
Decision Point Is the total project cost above $50 million
Below $50 million Above $50 million
APPENDIX 5 - EXAMPLE PLANNING DECISION TREE
NYC Mayorrsquos Office of Recovery and Resiliency Climate Resiliency Design Guidelines
52
Project Title
Design Strategies Checklist (not exhaustive)
Extreme Heat Comments Extreme Precipitation Comments Sea Level Rise amp Storm Surge Comments
Select Site in Low Heat Vulnerability Index area Select High Elevation Site Select High Elevation Site
Minimize East-West Building Orientation Green Roof Raise Building Floor Elevation
Passive Solar Cooling and Ventilation Systems
Protect Below Grade Areas from Flooding Waterproof Building Envelope
Cool Roof (SRI appropriate) On-site Stormwater Management (gray) Elevate Critical Building Functions
Green Roof (extensive) Reduce Impervious Areas Elevate Critical Equipment
Vegetative Structures Permeable Pavement Perimeter Floodwall100 Levee (passive or active)
Enhanced HVAC System including space layout optimization and system scalability
Increase Green Spaces and Planted Areas DryWet Floodproofing
More Efficient Building Envelope Other Utility Redundancy Design101
Parking Lot Shading Resilient Materials amp Landscape Treatments
Light Colored Pavements (appropriate SRI) Design for Storm Surge Outflow
Increase Planted Areas Install Backwater Flow Prevention
Permeable Surfaces Design for Scour
Open-grid Pavement Raise Road Elevation
Other Other
This appendix provides a template for identifying possible design strategies to address climate change risks as described throughout the Guidelines
APPENDIX 6 - DESIGN STRATEGIES CHECKLIST
100 Permanent perimeter flood walls are not permitted to meet floodproofing requirements in buildings with substantial improvements andor damages 101 Utility redundancy design should be pursued for critical systems not all building systems
APPENDIX 6 - DESIGN STRATEGIES CHECKLIST
NYC Mayorrsquos Office of Recovery and Resiliency Climate Resiliency Design Guidelines
53APPENDIX 7 - CLIMATE CHANGE RISK ASSESSMENT RESOURCES
These Guidelines provide data on climate change hazards and recommend how that data can inform resilient design A risk assessment is a tool to help project managers and designers evaluate risk levels as well as select and prioritize resilient design strategies A high level risk assessment is recommended for all City capital projects with a total cost of under $50 million Projects above $50 million are recommended to conduct an in-depth assessment
Risk assessments use quantified estimates of the probability and magnitude of consequence of an event occurring to prioritize responses ldquoProbabilityrdquo is an assessment of the likelihood of a hazard occurring while ldquomagnituderdquo describes the hazardrsquos potential impact Risk assessment tools such as the examples listed below can be used to define and score these categories Projects that score higher across both probability and magnitude can be prioritized for investment and risk mitigation action Projects that score lower across both criteria may require no action beyond meeting code The results are typically charted on a risk matrix and an example is provided on the next page
The climate change risk management frameworks below offer templates for how to integrate climate change projections into a risk assessment process Refer to these resources for examples and further information
bull Vulnerability Assessment and Adaptation Framework is prepared by the Federal Highway Administration (FHWA) While developed for transportation planning this risk assessment framework has broad applicability for evaluating asset vulnerability to climate change Available at httpswwwfhwadotgovenvironmentsustainabilityresilienceadaptation_framework
bull US Climate Resilience Toolkit The US Global Change Research Program offers a step by step risk assessment
framework including tools and case studies at httpstoolkitclimategovsteps (see example on next page)
bull Coast Adapt Guidance on undertaking a risk assessment High level assessment httpscoastadaptcomausitesdefaultfilesfactsheetsT3M4_2_2nd_pass_risk_assessmentpdfDetailed assessment httpscoastadaptcomausitesdefaultfilesfactsheetsT3M4_3_3rd_pass_risk_assessmentpdf
bull Climate adaptation Risk uncertainty and decision-makingDownload the report here httpswwwukciporgukpublicationsRisk
The City plans to develop a NYC-specific process for integrating climate change data into existing risk management processes by April 2019
APPENDIX 7 - CLIMATE CHANGE RISK ASSESSMENT RESOURCES
NYC Mayorrsquos Office of Recovery and Resiliency Climate Resiliency Design Guidelines
54APPENDIX 7 - CLIMATE CHANGE RISK ASSESSMENT RESOURCES
The Risk Characterization Matrix below is an example from the US Climate Resilience Toolkit This tool can be used to assess the probability and magnitude of impact for identified risks The risk of coincident climate stressorsrisks (such as storm surge plus increased precipitation) can also be assessed as applicable
Figure 14 - Example of a climate change risk matrix (adapted from US Climate Resilience Toolkit)
Project teams can determine the magnitude of the impact (along the horizontal scale of 1 through 3 with 3 being the most severe) and the probabilitylikelihood of occurrence for each specific risk (along the vertical scale with 3 being the most likely) A score is typically assigned for each risk (Probabil-ity x Magnitude) and then charted on the matrix Based on the estimated probability and magnitude of consequence above the risks are ranked and prioritized for mitigation Factors to bear in mind include
bull Not all facility typologies have the same level of functional and operational importance during events or tolerance for disruption
bull Not all climate stressors and risks have the same level of impact on each project sitebull Not all identified risks can or should be mitigated fully
NYC Mayorrsquos Office of Recovery and Resiliency Climate Resiliency Design Guidelines
55WORKS CITED
A Stronger More Resilient New York PlaNYC Report of the NYC Special Initiative for Rebuilding and Resiliency The City of New York 2013
ldquoAccount for Climate Riskrdquo International Finance Corporation accessed March 27 2017 httpwwwifcorgwpswcmconnectTopics_Ext_ContentIFC_External_Corporate_SiteClimate+Business
PrioritiesAccount+for+Climate+Risk
American Society of Heating Refrigeration and Air-Conditioning Engineers (ASHRAE) Handbook -Fundamentals 2017
ldquoBaseline Standard Economic Value Methodology Reportrdquo Federal Emergency Management Agency July 2016
Benefit Cost Analysis Toolkit Software Version 530 Federal Emergency Management Agency (build date December 2016)
Criteria for Detention Facility Design New York City Department of Environmental Protection November 2012
Community Resilience Planning Guide for Buildings and Infrastructure Systems Vol 1 NIST Special Publication 1190 US Department of Commerce 2016
Cool and Green Roofing Manual NYC Department of Design and Construction 2007 httpwwwnycgovhtmlddcdownloadspdfcool_green_roof_manpdf
Building Resiliency Task Force US Urban Green Building Council New York 2013 httpurbangreencouncilforcecomBuildingResiliency
Design and Planning for Flood Resiliency Guidelines for NYC Parks New York City Department of Parks and Recreation 2017
httpswwwnycgovparksorgplanning-and-buildingplanningresiliency-plansflood-resiliency
Flooded Bus Barns and Buckled Rails Federal Transit Administration Office of Budget and Policy 2011 httpswwwhsdlorgabstractampdid=685187
Floodproofing Non-Residential Buildings FEMA P936 FEMA 2013 httpswwwfemagovmedia-library-data9a50c534fc5895799321dcdd4b6083e7P-936_8-20-13_508rpdf
ldquoGlossaryrdquo International Infrastructure Management Manual National Asset Management Support Group New Zealand 2011 httpwwwipweaorg
ldquoGreen Roof Metrics Draft Reportrdquo New York City Department of Parks and Recreation 2017
ldquoGuide to Rain Event Preparednessrdquo NYC Department of Environmental Protection httpwwwnycgovhtmldeppdfbrochuresflood-preparedness-flyerpdf
ldquoGuidelines and Discount Rates for Benefit-Cost Analysis of Federal Programsrdquo Appendix C Circular A-94 US Office of Management and Budget (OMB) 2017
ldquoGuidelines for the Design and Construction of Stormwater Management Systemsrdquo New York City Department of Environmental Protection July 2012
Horton R et al New York City Panel on Climate Change 2015 Report Ann NY Acad Sci ISSN 0077-892 New York 2015
Madrigano J et al ldquoA case-only study of vulnerability to heat wavendashrelated mortality in New York City (2000ndash2011)rdquo Environmental Health Perspectives 123672ndash678 2013
WORKS CITED
NYC Mayorrsquos Office of Recovery and Resiliency Climate Resiliency Design Guidelines
56WORKS CITED
enspMcGregor et al Two Degrees The Built Environment and Our Changing Climate Routledge Press 2013
NYC Green Codes Task Force US Green Building Council New York 2010 httpurbangreencouncilorgGreenCodes
NYCrsquos Risk Landscape A Guide to Hazard Mitigation NYC Emergency Management 2014
One New York The Plan for a Strong and Just City The City of New York 2015 httpwwwnycgovhtmlonenyc downloadspdfpublicationsOneNYCpdf
Ready to Respond Strategies for Multifamily Building Resilience Enterprise Green Communities 2015 httpswwwenterprisecommunityorgresources
Rosenzweig C et al Climate Change Adaptation in New York City Building a Risk Management Response New York City Panel on Climate Change 2010
httponlinelibrarywileycomdoi101111nyas20101196issue-1 issuetoc
ldquoSustainable Infrastructure Management Program Learning Environmentrdquo Water Environment Research Foundation accessed March 24 2017 httpsimplewerforg
Urban Waterfront Adaptive Strategies NYC Department of City Planning 2013 httpwww1nycgovsiteplanningplanssustainable-communitiesclimate-resiliencepagetab=1
Wastewater Resiliency Plan Climate Risk Assessment and Adaptation Study New York City Department of Environmental Protection October 2013
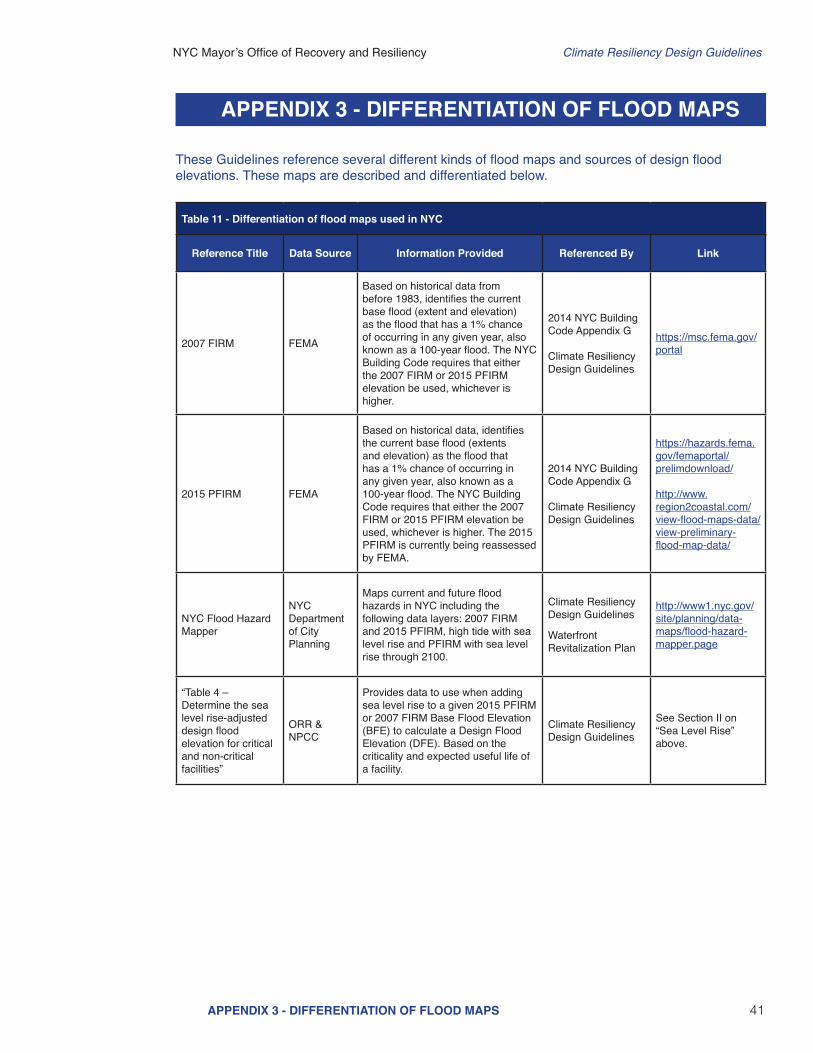
NYC Mayorrsquos Office of Recovery and Resiliency Climate Resiliency Design Guidelines
41APPENDIX 3 - DIFFERENTIATION OF FLOOD MAPS
These Guidelines reference several different kinds of flood maps and sources of design flood elevations These maps are described and differentiated below
Table 11 - Differentiation of flood maps used in NYC
Reference Title Data Source Information Provided Referenced By Link
2007 FIRM FEMA
Based on historical data from before 1983 identifies the current base flood (extent and elevation) as the flood that has a 1 chance of occurring in any given year also known as a 100-year flood The NYC Building Code requires that either the 2007 FIRM or 2015 PFIRM elevation be used whichever is higher
2014 NYC Building Code Appendix G
Climate Resiliency Design Guidelines
httpsmscfemagovportal
2015 PFIRM FEMA
Based on historical data identifies the current base flood (extents and elevation) as the flood that has a 1 chance of occurring in any given year also known as a 100-year flood The NYC Building Code requires that either the 2007 FIRM or 2015 PFIRM elevation be used whichever is higher The 2015 PFIRM is currently being reassessed by FEMA
2014 NYC Building Code Appendix G
Climate Resiliency Design Guidelines
httpshazardsfemagovfemaportalprelimdownload
httpwwwregion2coastalcomview-flood-maps-dataview-preliminary-flood-map-data
NYC Flood Hazard Mapper
NYC Department of City Planning
Maps current and future flood hazards in NYC including the following data layers 2007 FIRM and 2015 PFIRM high tide with sea level rise and PFIRM with sea level rise through 2100
Climate Resiliency Design Guidelines
Waterfront Revitalization Plan
httpwww1nycgovsiteplanningdata-mapsflood-hazard-mapperpage
ldquoTable 4 ndash Determine the sea level rise-adjusted design flood elevation for critical and non-critical facilitiesrdquo
ORR amp NPCC
Provides data to use when adding sea level rise to a given 2015 PFIRM or 2007 FIRM Base Flood Elevation (BFE) to calculate a Design Flood Elevation (DFE) Based on the criticality and expected useful life of a facility
Climate Resiliency Design Guidelines
See Section II on ldquoSea Level Riserdquo above
APPENDIX 3 - DIFFERENTIATION OF FLOOD MAPS
NYC Mayorrsquos Office of Recovery and Resiliency Climate Resiliency Design Guidelines
42APPENDIX 4 - PROJECT BENEFITS CATEGORIES
This appendix provides guidance on how to identify and assess benefits as a supplement to Sections IIID and IIIE
Table 12 lists typical direct benefits for reducing impacts from climate stressors and basic guidance for how to estimate them See Section IIID for more information
Table 13 lists typical indirect benefits for reducing impacts from climate stressors and basic guidance for how to estimate them See Section IIID for more information
Table 12 ndash Direct benefits for (1) sea level rise with coastal storm surge and (2) increased precipitation measures
Direct Benefit Basic Guidance for Estimating Values
Physical Damages (Structure Contents)
bull For flood-damaged buildings use depth damage functions developed by FEMA and USACE for structures and contents
bull Use depth damage functions in conjunction with Building Replacement Values (BRVs) and not market values BRVs typically range between $100 to $325SF for residential buildings and $120 to $450SF for commercial public buildings
bull For more complex structures or facilities use engineering estimates of flood damages or review historic flood damages documented from insurance claims repair records or FEMA Public Assistance claims from recent flood disasters
Residential Displacements
bull For flood-damaged buildings use depth damage functions developed by FEMA and USACE for residential displacements
Reduced Life CycleOperation and Maintenance (OampM) Costs93
bull Applicable only to projects that reduce overall life cycle costs or net annual OampM costs from baseline conditions
bull Input reduced annual OampM costs as a project benefit at a 1-year recurrence intervalbull Reduced overall life cycle costs can be input as a longer project useful life
Table 13 ndash Indirect benefits for (1) sea level rise with coastal storm surge and (2) increased precipitation measures
Indirect Benefit Basic Guidance for Estimating Values
Non-Residential Building Service Losses
bull Estimate service loss values and durations for non-residential buildings public buildings critical facilities and parksnatural features based on FEMA BCA guidance and standard values based on building use
Utility Service Losses94
bull Estimate utility service losses for water wastewater and electrical facilities based on the number of impacted customers FEMA per capita standard values for utility service ($105personday for potable water $49personday for wastewater $148personday for electrical)95
bull Estimate utility service loss durations based on engineering estimates or review historic flood damages losses documented from utility company records
bull This benefit can also apply to measures that increase energy efficiency
RoadBridge Service Losses
bull Estimate roadbridge service losses based on the average daily traffic (ADT) detour time and additional travel distance and FEMA and GSA standard values for road service ($3344vehiclehour of delay $0545mile)96
bull Estimate roadbridge service loss durations or review historic flood damages losses
Emergency Service Losses
bull Applicable only to projects that reduce or eliminate documented emergency service costs from baseline conditions
bull Examples of avoided emergency services costs include NYPD staffing to monitor barricades for flooded roads or NFDY staffing for water rescues of residents from flooded buildings or streets
APPENDIX 4 - PROJECT BENEFITS CATEGORIES
93 Reduced life cycle costs may be applicable to some measures that provide extreme heat benefits such as green roofs that can last longer than a standard roof if properly maintained
94 Reduced utility service costs may be applicable to some measures that provide extreme heat benefits such as cool roofs green roofs and shade trees
95 FEMA per capita standard values taken from FEMA BCA Toolkit Version 530 (Build Date 12222016) and developed in FEMArsquos Baseline Standard Economic Value Methodology Report (July 28 2016) Consider updating FEMA standard per capita values to reflect current New York City utility rates
96 Consider updating FEMA and GSA standard values to reflect current New York City area labor rates and fuel costs
NYC Mayorrsquos Office of Recovery and Resiliency Climate Resiliency Design Guidelines
43APPENDIX 4 - PROJECT BENEFITS CATEGORIES
Table 14 ndash Other potential benefits for (1) sea level rise with coastal storm surge and (2) increased precipitation measures
Other Benefit Basic Guidance for Estimating Values
Avoided Stress and Anxiety
bull Applicable only for projects that directly benefit occupants of residential structuresbull Use FEMA standard value for avoided mental stress and anxiety treatment costs of $2443person to
estimate benefit for all impacted residents97
Avoided Lost Productivity
bull Applicable only for projects that directly benefit occupants of residential structuresbull Use FEMA standard value for avoided lost worker productivity costs of $8736household to estimate
benefit for all impacted workers (conservatively assuming one worker per household)
Environmental Open Space
bull Applicable only for projects that create or acquire open space areas by acquisitionbull Use FEMA standard value for environmental open space based on the type of land acquired ($8308
Acreyear for Green open space $39545Acreyear for Riparian $6010Acreyear for Wetlands $554Acreyear for Forests $1799Year for Marine and estuary)97
CSO Volume Reduction
bull Applicable only for projects that provide Combined Sewer Overflow (CSO) abatement by reducing the volume of rainfall runoff
bull Use CSO abatement cost of $0015gallonsyear applied to increased precipitation hazard runoff volume for 5-year design storm98
Ecosystem Service99
bull Add stormwater management benefits of green infrastructure projects to increased precipitation hazards where avoided damages and service losses are not quantified
bull Unit benefits applicable to increased precipitation hazard includeo Green roofs $0133SFyear (PUL 40 years)o BioswaleRain GardenMeadow Mix $0020SFyear (PUL 30 years)o Permeable Grass Pavers $0020SFyear (PUL 30 years)o Tree Plantings $303Treeyear (PUL 30 years)o Planter Box Trees $101Treeyear (PUL 15 years)
Real Estate99
bull Potential real estate benefits from increased resilience of residential andor commercial propertiesstreetscapesneighborhoods included within the project scope
bull Benefit applied to extreme heat hazard for green infrastructure projects directly impacting residential or commercial properties
Quality of Life Health Benefits99
bull Potential quality of life benefits related to improved public health from the resilience measures included within the project scope
bull Benefit applied to extreme heat hazard for green infrastructure projects directly impacting residential or commercial properties
Table 14 lists other typical benefits for reducing impacts from climate stressors and basic guidance for how to estimate them See Section IIID for more information
97 FEMA standard values for avoided mental stress and anxiety and environmental open space values taken from FEMA BCA Toolkit Version 530 (Build Date 12222016)
98 CSO abatement cost taken from APG1 Report for NYC ldquoTechnical Approaches for Benefit-Cost Analysis of Hazard Mitigation Projects in Urban and Coastal Environmentsrdquo (April 2016)
99 Ecosystem Services Real Estate and Quality of LifeHealth benefits tend to be more applicable to green infrastructure measures that provide extreme heat benefits such as green roofs trees and other plantings
NYC Mayorrsquos Office of Recovery and Resiliency Climate Resiliency Design Guidelines
44APPENDIX 4 - PROJECT BENEFITS CATEGORIES
Table 15 ndash Potential benefits for extreme heat (Urban Heat Island) reduction measures
Category Benefit Basic Guidance for Estimating Values
Direct Benefit
Reduced Life Cycle Cost
bull Applicable only to measures such as green roofs that are expected to last longer than standard roofs
bull Compute total cost savings including annual OampM costs
Indirect Benefit
Energy Savings
bull Applicable to measures that reduce energy costs by providing cooling through increased shading andor evapotranspiration
bull Use New York Power Authority rates of $0148kWh for electricity and $0810Therm for natural gas
Other Potential Benefits
Air Quality bull Applicable to measures that absorb pollutants andor reduce carbon dioxide emissions
Acoustics bull Applicable to measures such as green roof or walls that reduce noise transfer
Quality of LifeHealth bull Potential quality of life benefits and related to improved public health
Real Estate bull Applicable to measures that provide residential real estate benefits from increased resilience of propertiesstreetscapesneighborhoods
Retail Sales Marketing
bull Applicable to measures that provide commercial property benefits from increased aesthetics resulting in increased marketing and sales for streetscapesneighborhoods
Tax Credits Incentives
bull Applicable to resilience or green infrastructure measures such as green roofs that have accompanying Federal State or City tax credits or other incentives
Table 15 lists potential benefits for reducing impacts from heat and basic guidance for how to estimate them See Section IIID for more information
NYC Mayorrsquos Office of Recovery and Resiliency Climate Resiliency Design Guidelines
45APPENDIX 4 - PROJECT BENEFITS CATEGORIES
Table 16 ndash Guidance on quantitative calculations for (1) sea level rise with coastal storm surge and (2) increased precipitation measures
Data Input General Guidance ndash Basic Description
Applicable Benefit Category
Applicable Typical Facility Typology
Dire
ct B
enefi
ts
Indi
rect
Ben
efits
Oth
er P
oten
tial
Ben
efits
Bui
ldin
g St
ruct
ures
Com
plex
Fa
cilit
ies
Tran
spor
tatio
nSt
reet
scap
es
Plaz
as
Park
Fea
ture
s
First Floor Elevation (FFE)
bull The elevation of the first finished floor of the structure excluding basements
bull FFE measured from top of lowest floor (riverinenon-coastal high hazard areas) or bottom of lowest horizontal structural member (coastal high hazard areas)
Y Y Y Y
Building Replacement Value (BRV)
bull The unit cost to rebuild a structure of the same quality of construction
bull Not the same as market value
Y Y Y Y
Building Size
bull The total floor area of the building in square feet
bull Total Building Value = BRV x Building Sizebull Typical BRVs for NYC range between $100 to
$325SF for residential buildings and $120 to $450SF for commercialpublic buildings
Y Y Y Y
Structure Description
bull The type of building number of stories and foundation type (full basement partial basement no basement)
bull Collect more detailed foundation data for coastal flood zones
Y Y Y Y
Building Use bull Details related to residential housing commercial business and public use
Y Y Y Y Y
Building Type bull The primary use of building ndash residential commercial public and others
Y Y Y Y Y
Depth Damage Function (DDF)
bull Curves used to estimate structure damage contents damage and displacement of residential buildings based on flood depth
bull DDFs selection based on Structure Description Building Type Building Use
bull Structure DDFs based on percentage of Total Building Value
bull Contents DDFs based on percentage of Total Contents Value
bull Displacement DDFs based on number of displacement days x Displacement Cost
Y Y Y Y Y
Contents Value
bull The cost to replace structure contents (furnishings equipment)
bull Residential building Contents Values typically 50 BRV (FEMA DDFs) or 100 BRV (USACE DDFs)
bull Non-residential building Contents Values between 18 to over 100 depending on building use (USACE DDFs)
bull Total Contents Value = BRV x Building Size
Y Y Y Y Y
Table 16 provides general guidance on how to quantitatively calculate benefits from efforts to address from climate stressors See Section IIIE for more information
NYC Mayorrsquos Office of Recovery and Resiliency Climate Resiliency Design Guidelines
46APPENDIX 4 - PROJECT BENEFITS CATEGORIES
Table 16 ndash Guidance on quantitative calculations for (1) sea level rise with coastal storm surge and (2) increased precipitation measures
Data Input General Guidance ndash Basic Description
Applicable Benefit Category
Applicable Typical Facility Typology
Dire
ct B
enefi
ts
Indi
rect
Ben
efits
Oth
er P
oten
tial
Ben
efits
Bui
ldin
g St
ruct
ures
Com
plex
Fa
cilit
ies
Tran
spor
tatio
nSt
reet
scap
es
Plaz
as
Park
Fea
ture
s
Number of Residents (Residential)
bull Total number of occupants in a residential building
bull Typically estimated based on number of residential units x average number of individuals per household (based on current US Census data or use 25 individuals per household as a default)
Y Y Y Y Y
Displacement Cost (Residential)
bull The unit cost to lodge and feed displaced residents while flood damage is repaired
bull Average unit displacement cost of $415residential unitday recommended based on current FY2018 GSA Per Diem rates for New York City
Y Y Y Y Y
Value of Service (Non-Residential and Public)
bull The unit cost of service disruption and rental of temporary facilities while flood damage is repaired
bull Disruption costs for non-residential buildings typically range from $095 to $136SFmonth and rental costs range from $020 to $136SFmonth depending on building use
bull Value of service for public buildings ($day) is typically based on the annual operating budget for the City agency using the building prorated based on building size or population served by the building then divided by 365 daysyear
Y Y Y Y
Value of Service (Critical Facilities)
bull The unit cost of critical facilities (police fire emergency medical services) lost or delayed while flood damage is repaired
Y Y Y
Value of Service Duration
bull The duration of service disruption and rental of temporary facilities for non-residential buildings and critical facilities while flood damage is repaired
bull For non-residential buildingso Value of Service Durations vary from
4 months to over 30 months based on building use and the depth of flooding
o Total Value of Service Loss = (Disruption Cost x Building Area) = (Rental Cost x Building Area x Value of Service Duration)
bull For public buildings and critical facilitieso Value of Service Durations vary from 0
days to 720 months based on building use and the depth of flooding from FEMA FIA or USACE DDFs
o Total Value of Service Loss = (Value of Service) x (Service Loss Duration)
Y Y Y
NYC Mayorrsquos Office of Recovery and Resiliency Climate Resiliency Design Guidelines
47APPENDIX 4 - PROJECT BENEFITS CATEGORIES
Table 16 ndash Guidance on quantitative calculations for (1) sea level rise with coastal storm surge and (2) increased precipitation measures
Data Input General Guidance ndash Basic Description
Applicable Benefit Category
Applicable Typical Facility Typology
Dire
ct B
enefi
ts
Indi
rect
Ben
efits
Oth
er P
oten
tial
Ben
efits
Bui
ldin
g St
ruct
ures
Com
plex
Fa
cilit
ies
Tran
spor
tatio
nSt
reet
scap
es
Plaz
as
Park
Fea
ture
s
Engineering Estimates for Damages
bull Engineered estimate models of physical damages and service losses at the project site based on the Guidelines event recurrence interval(s) and flood depth(s)
Y Y Y Y Y Y
Historic Damages and Service Losses
bull Historic physical damages and service losses at the project site documented from previous flood events
bull Do not use routine maintenancebull The historic damage event recurrence interval
(RIs) andor flood depths must be determined updated for inflation to the present value and adjusted to match the Guidelines event RIsflood depths
Y Y Y Y Y Y
Facility Replacement Value
bull The unit cost to rebuild the facility
Impacted Area bull The geographic area impacted by the facility in the event of failure in acres
Y Y Y Y
Facility Capacity
bull The design capacity of the facilitybull For example - facility capacity expressed in
millions of gallons per day (MGD) for water and wastewater facilities or megawatts (MW) for electrical facilities
Y Y Y Y
Service Population
bull The number of impacted residents served by the facility
bull Typically estimated based on number of impacted residential customers x average number of individuals per household (based on current US Census data or use 25 individuals per household as a default)
bull Facilities serving mostly non-residentialpublic buildings andor critical facilities should focus on service losses rather than service population
Y Y Y
NYC Mayorrsquos Office of Recovery and Resiliency Climate Resiliency Design Guidelines
48APPENDIX 4 - PROJECT BENEFITS CATEGORIES
Table 16 ndash Guidance on quantitative calculations for (1) sea level rise with coastal storm surge and (2) increased precipitation measures
Data Input General Guidance ndash Basic Description
Applicable Benefit Category
Applicable Typical Facility Typology
Dire
ct B
enefi
ts
Indi
rect
Ben
efits
Oth
er P
oten
tial
Ben
efits
Bui
ldin
g St
ruct
ures
Com
plex
Fa
cilit
ies
Tran
spor
tatio
nSt
reet
scap
es
Plaz
as
Park
Fea
ture
s
Value of Service
bull Unit value of service provided by the facilitybull Example of FEMA standard values for complete
loss of utility service $105personday for potable water$49personday for wastewater$148personday for electrical
bull Consider updating FEMA standard per capita values to reflect current The New York City utility rates
Y Y
Roadway Elevations bull Roadway Elevations
Y Y
Roadway Replacement Value
bull Roadway Replacement ValueY Y
Inundation Area Map
bull Inundation Area Map developed by FEMA or through modeling by project design team
Y Y Y
Building Inventory of Inundation Area
bull The number and type of buildings within the streetscape and neighborhood inundated by the Guidelinersquos flood events
Y Y Y
Average Daily Traffic (ADT)
bull The average number of one-way traffic trips per day along the roadway(s) within the streetscapeneighborhood inundated by the Guidelinersquos flood events
Y Y
Additional Travel Time
bull The additional travel time needed to detour around a flooded roadway expressed in minutes
bull In the unlikely event there is no detour available use a 12-hour travel time per one-way trap but provide a detailed area street map as supporting documentation
Y Y
Value of Traffic Delay
bull The value of service associated with lost time in traffic
bull For example - FEMA standard average value of $3344vehiclehour of delay
bull Consider updating FEMA and GSA standard values to reflect current New York City area labor rates and fuel costs
Y Y
NYC Mayorrsquos Office of Recovery and Resiliency Climate Resiliency Design Guidelines
49APPENDIX 4 - PROJECT BENEFITS CATEGORIES
Table 17 ndash Guidance on quantitative unit benefit calculations for extreme heat hazard measures
Measure General Guidance ndash Unit Benefit Information and Data Requirements
Applicable Benefit Category
Applicable Typical Facility Typology
Dire
ct B
enefi
ts
Indi
rect
Ben
efits
Oth
er P
oten
tial
Ben
efits
Bui
ldin
g St
ruct
ures
Com
plex
Fa
cilit
ies
Tran
spor
tatio
nSt
reet
scap
es
Plaz
as
Park
Fea
ture
s
Green Roof
bull Unit benefit range over PUL = $470SF to $373SF of green roof area ($719SF standard value)
bull Assumed PUL = 40 yearsbull Apply standard value unit benefit to green
roof area to estimate measure benefitbull Higher range values more applicable
to residential and commercial building streetscape projects
Y Y Y Y Y Y
Bioswale Rain Garden Meadow Mix
bull Unit benefit range over PUL = $396SF to $211SF of area ($730SF standard value)
bull Assumed PUL = 30 yearsbull Apply standard value unit benefit to bioswale
rain gardenmeadow mix area to estimate total measure benefit
Y Y Y Y Y Y
Cool Roof
bull Unit benefit range over PUL = $117 to $3151SF of material area ($144SF standard value)
bull Assumed PUL = 20 yearsbull Apply standard value unit benefit to cool roof
area to estimate total measure benefitbull Higher range values more applicable to
residential building streetscape projects
Y Y Y Y Y
Light-Colored PaversLight-Colored Materials
bull Unit benefit range over PUL = $0774 to $204SF of material area ($0866SF standard value)
bull Assumed PUL = 30 yearsbull Apply standard value unit benefit to material
area to estimate total measure benefit
Y Y Y Y
Table 17 provides general guidance on how to quantitatively calculate benefits from efforts to address climate stressors See Section IIIE for more information
NYC Mayorrsquos Office of Recovery and Resiliency Climate Resiliency Design Guidelines
50APPENDIX 4 - PROJECT BENEFITS CATEGORIES
Table 17 ndash Guidance on quantitative unit benefit calculations for extreme heat hazard measures
Measure General Guidance ndash Unit Benefit Information and Data Requirements
Applicable Benefit Category
Applicable Typical Facility Typology
Dire
ct B
enefi
ts
Indi
rect
Ben
efits
Oth
er P
oten
tial
Ben
efits
Bui
ldin
g St
ruct
ures
Com
plex
Fa
cilit
ies
Tran
spor
tatio
nSt
reet
scap
es
Plaz
as
Park
Fea
ture
s
Tree Planting
bull Unit benefit range over PUL = $1005 to $77154Tree ($1855Tree standard value)
bull Assumed PUL = 30 yearsbull Apply standard value unit benefit to number of
trees to estimate total measure benefitbull Higher range values more applicable
to residential and commercial building streetscape projects
Y Y Y Y Y Y
Planter Box Tree
bull Unit benefit range over PUL = $212 to 16304Tree ($392Tree standard value)
bull Assumed PUL = 15 yearsbull Apply standard value unit benefit to number of
trees to estimate total measure benefitbull Higher range values more applicable
to residential and commercial building streetscape projects
Y Y Y Y Y
Shade Canopy
bull Unit benefit range over PUL = $0363 to $396SF ($0458SF standard value)
bull Assumed PUL = 15 yearsbull Apply standard value unit benefit to area of
shade canopy estimate total measure benefitbull Higher range values more applicable
to residential and commercial building streetscape projects
Y Y Y Y
Permeable Grass Pavers
bull Unit benefit range over PUL = $0258SF to $0521SF of pavers ($0363SF standard value)
bull Assumed PUL = 30 yearsbull Apply standard value unit benefit to paver
area to estimate total measure benefit
Y Y Y Y Y
For the purposes of the BCA refer to the following facility typologies bull ldquoBuilding Structuresrdquo include critical small building sites such as EMS or FDNY stations and non-critical small building sites such as
libraries or comfort stationsbull ldquoComplex Facilitiesrdquo include critical infrastructure such as wastewater treatment sites pump stations water filtration plants and similar
large or complex facilitiesbull ldquoTransportationStreetscapePlazasrdquo include roadway reconstruction streetscape improvements street raising plazas and other
transportation-related infrastructurebull ldquoPark Featuresrdquo include parks and similar public recreational facility with natural landscape features
NYC Mayorrsquos Office of Recovery and Resiliency Climate Resiliency Design Guidelines
51APPENDIX 5 - EXAMPLE PLANNING DECISION TREE
This decision tree provides a summarized example approach for how to implement these Guidelines Projects with a total cost greater than $50 million are recommended to conduct a full qualitative and quantitative climate change risk assessment and BCA while projects below $50 million are recommended to conduct a qualitative risk assessment and BCA
Define Project
1) Operational goals and criticality level2) Useful life3) Location in the current flood plain future floodplain and or zone
of tidal inundation and the project arearsquos score on the heat vulnerability index
Evaluate Project Risks According to Probability and Magnitude of Consequence
bull Extreme Heat bull Precipitationbull Sea Level Risebull Coastal Surge
High Level Identification and Assessment of Risk Mitigation Alternatives and Co-benefits
(qualitative)
Detailed Identification and Assessment of Risk Mitigation Alternatives and Co-benefits (qualitative and quantitative)
High Level Estimate of Costs and Benefits of Design Alternatives
(qualitative)
Detailed Estimate of Costs and Benefits of Design Alternatives
(qualitative and quantitative)
Decision Point Which climate change risks require mitigation
Decision Point Evaluate risk mitigation benefits and costs to
determine final resilient design alternative or if no action is required
Decision Point Is the total project cost above $50 million
Below $50 million Above $50 million
APPENDIX 5 - EXAMPLE PLANNING DECISION TREE
NYC Mayorrsquos Office of Recovery and Resiliency Climate Resiliency Design Guidelines
52
Project Title
Design Strategies Checklist (not exhaustive)
Extreme Heat Comments Extreme Precipitation Comments Sea Level Rise amp Storm Surge Comments
Select Site in Low Heat Vulnerability Index area Select High Elevation Site Select High Elevation Site
Minimize East-West Building Orientation Green Roof Raise Building Floor Elevation
Passive Solar Cooling and Ventilation Systems
Protect Below Grade Areas from Flooding Waterproof Building Envelope
Cool Roof (SRI appropriate) On-site Stormwater Management (gray) Elevate Critical Building Functions
Green Roof (extensive) Reduce Impervious Areas Elevate Critical Equipment
Vegetative Structures Permeable Pavement Perimeter Floodwall100 Levee (passive or active)
Enhanced HVAC System including space layout optimization and system scalability
Increase Green Spaces and Planted Areas DryWet Floodproofing
More Efficient Building Envelope Other Utility Redundancy Design101
Parking Lot Shading Resilient Materials amp Landscape Treatments
Light Colored Pavements (appropriate SRI) Design for Storm Surge Outflow
Increase Planted Areas Install Backwater Flow Prevention
Permeable Surfaces Design for Scour
Open-grid Pavement Raise Road Elevation
Other Other
This appendix provides a template for identifying possible design strategies to address climate change risks as described throughout the Guidelines
APPENDIX 6 - DESIGN STRATEGIES CHECKLIST
100 Permanent perimeter flood walls are not permitted to meet floodproofing requirements in buildings with substantial improvements andor damages 101 Utility redundancy design should be pursued for critical systems not all building systems
APPENDIX 6 - DESIGN STRATEGIES CHECKLIST
NYC Mayorrsquos Office of Recovery and Resiliency Climate Resiliency Design Guidelines
53APPENDIX 7 - CLIMATE CHANGE RISK ASSESSMENT RESOURCES
These Guidelines provide data on climate change hazards and recommend how that data can inform resilient design A risk assessment is a tool to help project managers and designers evaluate risk levels as well as select and prioritize resilient design strategies A high level risk assessment is recommended for all City capital projects with a total cost of under $50 million Projects above $50 million are recommended to conduct an in-depth assessment
Risk assessments use quantified estimates of the probability and magnitude of consequence of an event occurring to prioritize responses ldquoProbabilityrdquo is an assessment of the likelihood of a hazard occurring while ldquomagnituderdquo describes the hazardrsquos potential impact Risk assessment tools such as the examples listed below can be used to define and score these categories Projects that score higher across both probability and magnitude can be prioritized for investment and risk mitigation action Projects that score lower across both criteria may require no action beyond meeting code The results are typically charted on a risk matrix and an example is provided on the next page
The climate change risk management frameworks below offer templates for how to integrate climate change projections into a risk assessment process Refer to these resources for examples and further information
bull Vulnerability Assessment and Adaptation Framework is prepared by the Federal Highway Administration (FHWA) While developed for transportation planning this risk assessment framework has broad applicability for evaluating asset vulnerability to climate change Available at httpswwwfhwadotgovenvironmentsustainabilityresilienceadaptation_framework
bull US Climate Resilience Toolkit The US Global Change Research Program offers a step by step risk assessment
framework including tools and case studies at httpstoolkitclimategovsteps (see example on next page)
bull Coast Adapt Guidance on undertaking a risk assessment High level assessment httpscoastadaptcomausitesdefaultfilesfactsheetsT3M4_2_2nd_pass_risk_assessmentpdfDetailed assessment httpscoastadaptcomausitesdefaultfilesfactsheetsT3M4_3_3rd_pass_risk_assessmentpdf
bull Climate adaptation Risk uncertainty and decision-makingDownload the report here httpswwwukciporgukpublicationsRisk
The City plans to develop a NYC-specific process for integrating climate change data into existing risk management processes by April 2019
APPENDIX 7 - CLIMATE CHANGE RISK ASSESSMENT RESOURCES
NYC Mayorrsquos Office of Recovery and Resiliency Climate Resiliency Design Guidelines
54APPENDIX 7 - CLIMATE CHANGE RISK ASSESSMENT RESOURCES
The Risk Characterization Matrix below is an example from the US Climate Resilience Toolkit This tool can be used to assess the probability and magnitude of impact for identified risks The risk of coincident climate stressorsrisks (such as storm surge plus increased precipitation) can also be assessed as applicable
Figure 14 - Example of a climate change risk matrix (adapted from US Climate Resilience Toolkit)
Project teams can determine the magnitude of the impact (along the horizontal scale of 1 through 3 with 3 being the most severe) and the probabilitylikelihood of occurrence for each specific risk (along the vertical scale with 3 being the most likely) A score is typically assigned for each risk (Probabil-ity x Magnitude) and then charted on the matrix Based on the estimated probability and magnitude of consequence above the risks are ranked and prioritized for mitigation Factors to bear in mind include
bull Not all facility typologies have the same level of functional and operational importance during events or tolerance for disruption
bull Not all climate stressors and risks have the same level of impact on each project sitebull Not all identified risks can or should be mitigated fully
NYC Mayorrsquos Office of Recovery and Resiliency Climate Resiliency Design Guidelines
55WORKS CITED
A Stronger More Resilient New York PlaNYC Report of the NYC Special Initiative for Rebuilding and Resiliency The City of New York 2013
ldquoAccount for Climate Riskrdquo International Finance Corporation accessed March 27 2017 httpwwwifcorgwpswcmconnectTopics_Ext_ContentIFC_External_Corporate_SiteClimate+Business
PrioritiesAccount+for+Climate+Risk
American Society of Heating Refrigeration and Air-Conditioning Engineers (ASHRAE) Handbook -Fundamentals 2017
ldquoBaseline Standard Economic Value Methodology Reportrdquo Federal Emergency Management Agency July 2016
Benefit Cost Analysis Toolkit Software Version 530 Federal Emergency Management Agency (build date December 2016)
Criteria for Detention Facility Design New York City Department of Environmental Protection November 2012
Community Resilience Planning Guide for Buildings and Infrastructure Systems Vol 1 NIST Special Publication 1190 US Department of Commerce 2016
Cool and Green Roofing Manual NYC Department of Design and Construction 2007 httpwwwnycgovhtmlddcdownloadspdfcool_green_roof_manpdf
Building Resiliency Task Force US Urban Green Building Council New York 2013 httpurbangreencouncilforcecomBuildingResiliency
Design and Planning for Flood Resiliency Guidelines for NYC Parks New York City Department of Parks and Recreation 2017
httpswwwnycgovparksorgplanning-and-buildingplanningresiliency-plansflood-resiliency
Flooded Bus Barns and Buckled Rails Federal Transit Administration Office of Budget and Policy 2011 httpswwwhsdlorgabstractampdid=685187
Floodproofing Non-Residential Buildings FEMA P936 FEMA 2013 httpswwwfemagovmedia-library-data9a50c534fc5895799321dcdd4b6083e7P-936_8-20-13_508rpdf
ldquoGlossaryrdquo International Infrastructure Management Manual National Asset Management Support Group New Zealand 2011 httpwwwipweaorg
ldquoGreen Roof Metrics Draft Reportrdquo New York City Department of Parks and Recreation 2017
ldquoGuide to Rain Event Preparednessrdquo NYC Department of Environmental Protection httpwwwnycgovhtmldeppdfbrochuresflood-preparedness-flyerpdf
ldquoGuidelines and Discount Rates for Benefit-Cost Analysis of Federal Programsrdquo Appendix C Circular A-94 US Office of Management and Budget (OMB) 2017
ldquoGuidelines for the Design and Construction of Stormwater Management Systemsrdquo New York City Department of Environmental Protection July 2012
Horton R et al New York City Panel on Climate Change 2015 Report Ann NY Acad Sci ISSN 0077-892 New York 2015
Madrigano J et al ldquoA case-only study of vulnerability to heat wavendashrelated mortality in New York City (2000ndash2011)rdquo Environmental Health Perspectives 123672ndash678 2013
WORKS CITED
NYC Mayorrsquos Office of Recovery and Resiliency Climate Resiliency Design Guidelines
56WORKS CITED
enspMcGregor et al Two Degrees The Built Environment and Our Changing Climate Routledge Press 2013
NYC Green Codes Task Force US Green Building Council New York 2010 httpurbangreencouncilorgGreenCodes
NYCrsquos Risk Landscape A Guide to Hazard Mitigation NYC Emergency Management 2014
One New York The Plan for a Strong and Just City The City of New York 2015 httpwwwnycgovhtmlonenyc downloadspdfpublicationsOneNYCpdf
Ready to Respond Strategies for Multifamily Building Resilience Enterprise Green Communities 2015 httpswwwenterprisecommunityorgresources
Rosenzweig C et al Climate Change Adaptation in New York City Building a Risk Management Response New York City Panel on Climate Change 2010
httponlinelibrarywileycomdoi101111nyas20101196issue-1 issuetoc
ldquoSustainable Infrastructure Management Program Learning Environmentrdquo Water Environment Research Foundation accessed March 24 2017 httpsimplewerforg
Urban Waterfront Adaptive Strategies NYC Department of City Planning 2013 httpwww1nycgovsiteplanningplanssustainable-communitiesclimate-resiliencepagetab=1
Wastewater Resiliency Plan Climate Risk Assessment and Adaptation Study New York City Department of Environmental Protection October 2013
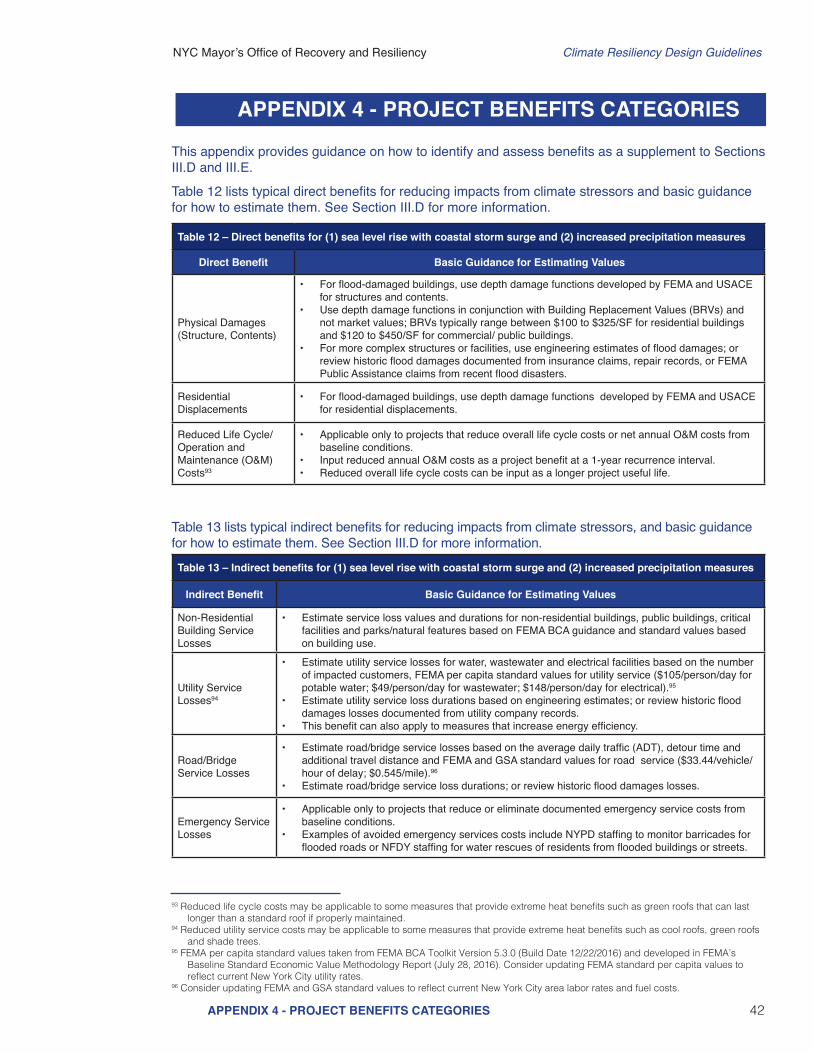
NYC Mayorrsquos Office of Recovery and Resiliency Climate Resiliency Design Guidelines
42APPENDIX 4 - PROJECT BENEFITS CATEGORIES
This appendix provides guidance on how to identify and assess benefits as a supplement to Sections IIID and IIIE
Table 12 lists typical direct benefits for reducing impacts from climate stressors and basic guidance for how to estimate them See Section IIID for more information
Table 13 lists typical indirect benefits for reducing impacts from climate stressors and basic guidance for how to estimate them See Section IIID for more information
Table 12 ndash Direct benefits for (1) sea level rise with coastal storm surge and (2) increased precipitation measures
Direct Benefit Basic Guidance for Estimating Values
Physical Damages (Structure Contents)
bull For flood-damaged buildings use depth damage functions developed by FEMA and USACE for structures and contents
bull Use depth damage functions in conjunction with Building Replacement Values (BRVs) and not market values BRVs typically range between $100 to $325SF for residential buildings and $120 to $450SF for commercial public buildings
bull For more complex structures or facilities use engineering estimates of flood damages or review historic flood damages documented from insurance claims repair records or FEMA Public Assistance claims from recent flood disasters
Residential Displacements
bull For flood-damaged buildings use depth damage functions developed by FEMA and USACE for residential displacements
Reduced Life CycleOperation and Maintenance (OampM) Costs93
bull Applicable only to projects that reduce overall life cycle costs or net annual OampM costs from baseline conditions
bull Input reduced annual OampM costs as a project benefit at a 1-year recurrence intervalbull Reduced overall life cycle costs can be input as a longer project useful life
Table 13 ndash Indirect benefits for (1) sea level rise with coastal storm surge and (2) increased precipitation measures
Indirect Benefit Basic Guidance for Estimating Values
Non-Residential Building Service Losses
bull Estimate service loss values and durations for non-residential buildings public buildings critical facilities and parksnatural features based on FEMA BCA guidance and standard values based on building use
Utility Service Losses94
bull Estimate utility service losses for water wastewater and electrical facilities based on the number of impacted customers FEMA per capita standard values for utility service ($105personday for potable water $49personday for wastewater $148personday for electrical)95
bull Estimate utility service loss durations based on engineering estimates or review historic flood damages losses documented from utility company records
bull This benefit can also apply to measures that increase energy efficiency
RoadBridge Service Losses
bull Estimate roadbridge service losses based on the average daily traffic (ADT) detour time and additional travel distance and FEMA and GSA standard values for road service ($3344vehiclehour of delay $0545mile)96
bull Estimate roadbridge service loss durations or review historic flood damages losses
Emergency Service Losses
bull Applicable only to projects that reduce or eliminate documented emergency service costs from baseline conditions
bull Examples of avoided emergency services costs include NYPD staffing to monitor barricades for flooded roads or NFDY staffing for water rescues of residents from flooded buildings or streets
APPENDIX 4 - PROJECT BENEFITS CATEGORIES
93 Reduced life cycle costs may be applicable to some measures that provide extreme heat benefits such as green roofs that can last longer than a standard roof if properly maintained
94 Reduced utility service costs may be applicable to some measures that provide extreme heat benefits such as cool roofs green roofs and shade trees
95 FEMA per capita standard values taken from FEMA BCA Toolkit Version 530 (Build Date 12222016) and developed in FEMArsquos Baseline Standard Economic Value Methodology Report (July 28 2016) Consider updating FEMA standard per capita values to reflect current New York City utility rates
96 Consider updating FEMA and GSA standard values to reflect current New York City area labor rates and fuel costs
NYC Mayorrsquos Office of Recovery and Resiliency Climate Resiliency Design Guidelines
43APPENDIX 4 - PROJECT BENEFITS CATEGORIES
Table 14 ndash Other potential benefits for (1) sea level rise with coastal storm surge and (2) increased precipitation measures
Other Benefit Basic Guidance for Estimating Values
Avoided Stress and Anxiety
bull Applicable only for projects that directly benefit occupants of residential structuresbull Use FEMA standard value for avoided mental stress and anxiety treatment costs of $2443person to
estimate benefit for all impacted residents97
Avoided Lost Productivity
bull Applicable only for projects that directly benefit occupants of residential structuresbull Use FEMA standard value for avoided lost worker productivity costs of $8736household to estimate
benefit for all impacted workers (conservatively assuming one worker per household)
Environmental Open Space
bull Applicable only for projects that create or acquire open space areas by acquisitionbull Use FEMA standard value for environmental open space based on the type of land acquired ($8308
Acreyear for Green open space $39545Acreyear for Riparian $6010Acreyear for Wetlands $554Acreyear for Forests $1799Year for Marine and estuary)97
CSO Volume Reduction
bull Applicable only for projects that provide Combined Sewer Overflow (CSO) abatement by reducing the volume of rainfall runoff
bull Use CSO abatement cost of $0015gallonsyear applied to increased precipitation hazard runoff volume for 5-year design storm98
Ecosystem Service99
bull Add stormwater management benefits of green infrastructure projects to increased precipitation hazards where avoided damages and service losses are not quantified
bull Unit benefits applicable to increased precipitation hazard includeo Green roofs $0133SFyear (PUL 40 years)o BioswaleRain GardenMeadow Mix $0020SFyear (PUL 30 years)o Permeable Grass Pavers $0020SFyear (PUL 30 years)o Tree Plantings $303Treeyear (PUL 30 years)o Planter Box Trees $101Treeyear (PUL 15 years)
Real Estate99
bull Potential real estate benefits from increased resilience of residential andor commercial propertiesstreetscapesneighborhoods included within the project scope
bull Benefit applied to extreme heat hazard for green infrastructure projects directly impacting residential or commercial properties
Quality of Life Health Benefits99
bull Potential quality of life benefits related to improved public health from the resilience measures included within the project scope
bull Benefit applied to extreme heat hazard for green infrastructure projects directly impacting residential or commercial properties
Table 14 lists other typical benefits for reducing impacts from climate stressors and basic guidance for how to estimate them See Section IIID for more information
97 FEMA standard values for avoided mental stress and anxiety and environmental open space values taken from FEMA BCA Toolkit Version 530 (Build Date 12222016)
98 CSO abatement cost taken from APG1 Report for NYC ldquoTechnical Approaches for Benefit-Cost Analysis of Hazard Mitigation Projects in Urban and Coastal Environmentsrdquo (April 2016)
99 Ecosystem Services Real Estate and Quality of LifeHealth benefits tend to be more applicable to green infrastructure measures that provide extreme heat benefits such as green roofs trees and other plantings
NYC Mayorrsquos Office of Recovery and Resiliency Climate Resiliency Design Guidelines
44APPENDIX 4 - PROJECT BENEFITS CATEGORIES
Table 15 ndash Potential benefits for extreme heat (Urban Heat Island) reduction measures
Category Benefit Basic Guidance for Estimating Values
Direct Benefit
Reduced Life Cycle Cost
bull Applicable only to measures such as green roofs that are expected to last longer than standard roofs
bull Compute total cost savings including annual OampM costs
Indirect Benefit
Energy Savings
bull Applicable to measures that reduce energy costs by providing cooling through increased shading andor evapotranspiration
bull Use New York Power Authority rates of $0148kWh for electricity and $0810Therm for natural gas
Other Potential Benefits
Air Quality bull Applicable to measures that absorb pollutants andor reduce carbon dioxide emissions
Acoustics bull Applicable to measures such as green roof or walls that reduce noise transfer
Quality of LifeHealth bull Potential quality of life benefits and related to improved public health
Real Estate bull Applicable to measures that provide residential real estate benefits from increased resilience of propertiesstreetscapesneighborhoods
Retail Sales Marketing
bull Applicable to measures that provide commercial property benefits from increased aesthetics resulting in increased marketing and sales for streetscapesneighborhoods
Tax Credits Incentives
bull Applicable to resilience or green infrastructure measures such as green roofs that have accompanying Federal State or City tax credits or other incentives
Table 15 lists potential benefits for reducing impacts from heat and basic guidance for how to estimate them See Section IIID for more information
NYC Mayorrsquos Office of Recovery and Resiliency Climate Resiliency Design Guidelines
45APPENDIX 4 - PROJECT BENEFITS CATEGORIES
Table 16 ndash Guidance on quantitative calculations for (1) sea level rise with coastal storm surge and (2) increased precipitation measures
Data Input General Guidance ndash Basic Description
Applicable Benefit Category
Applicable Typical Facility Typology
Dire
ct B
enefi
ts
Indi
rect
Ben
efits
Oth
er P
oten
tial
Ben
efits
Bui
ldin
g St
ruct
ures
Com
plex
Fa
cilit
ies
Tran
spor
tatio
nSt
reet
scap
es
Plaz
as
Park
Fea
ture
s
First Floor Elevation (FFE)
bull The elevation of the first finished floor of the structure excluding basements
bull FFE measured from top of lowest floor (riverinenon-coastal high hazard areas) or bottom of lowest horizontal structural member (coastal high hazard areas)
Y Y Y Y
Building Replacement Value (BRV)
bull The unit cost to rebuild a structure of the same quality of construction
bull Not the same as market value
Y Y Y Y
Building Size
bull The total floor area of the building in square feet
bull Total Building Value = BRV x Building Sizebull Typical BRVs for NYC range between $100 to
$325SF for residential buildings and $120 to $450SF for commercialpublic buildings
Y Y Y Y
Structure Description
bull The type of building number of stories and foundation type (full basement partial basement no basement)
bull Collect more detailed foundation data for coastal flood zones
Y Y Y Y
Building Use bull Details related to residential housing commercial business and public use
Y Y Y Y Y
Building Type bull The primary use of building ndash residential commercial public and others
Y Y Y Y Y
Depth Damage Function (DDF)
bull Curves used to estimate structure damage contents damage and displacement of residential buildings based on flood depth
bull DDFs selection based on Structure Description Building Type Building Use
bull Structure DDFs based on percentage of Total Building Value
bull Contents DDFs based on percentage of Total Contents Value
bull Displacement DDFs based on number of displacement days x Displacement Cost
Y Y Y Y Y
Contents Value
bull The cost to replace structure contents (furnishings equipment)
bull Residential building Contents Values typically 50 BRV (FEMA DDFs) or 100 BRV (USACE DDFs)
bull Non-residential building Contents Values between 18 to over 100 depending on building use (USACE DDFs)
bull Total Contents Value = BRV x Building Size
Y Y Y Y Y
Table 16 provides general guidance on how to quantitatively calculate benefits from efforts to address from climate stressors See Section IIIE for more information
NYC Mayorrsquos Office of Recovery and Resiliency Climate Resiliency Design Guidelines
46APPENDIX 4 - PROJECT BENEFITS CATEGORIES
Table 16 ndash Guidance on quantitative calculations for (1) sea level rise with coastal storm surge and (2) increased precipitation measures
Data Input General Guidance ndash Basic Description
Applicable Benefit Category
Applicable Typical Facility Typology
Dire
ct B
enefi
ts
Indi
rect
Ben
efits
Oth
er P
oten
tial
Ben
efits
Bui
ldin
g St
ruct
ures
Com
plex
Fa
cilit
ies
Tran
spor
tatio
nSt
reet
scap
es
Plaz
as
Park
Fea
ture
s
Number of Residents (Residential)
bull Total number of occupants in a residential building
bull Typically estimated based on number of residential units x average number of individuals per household (based on current US Census data or use 25 individuals per household as a default)
Y Y Y Y Y
Displacement Cost (Residential)
bull The unit cost to lodge and feed displaced residents while flood damage is repaired
bull Average unit displacement cost of $415residential unitday recommended based on current FY2018 GSA Per Diem rates for New York City
Y Y Y Y Y
Value of Service (Non-Residential and Public)
bull The unit cost of service disruption and rental of temporary facilities while flood damage is repaired
bull Disruption costs for non-residential buildings typically range from $095 to $136SFmonth and rental costs range from $020 to $136SFmonth depending on building use
bull Value of service for public buildings ($day) is typically based on the annual operating budget for the City agency using the building prorated based on building size or population served by the building then divided by 365 daysyear
Y Y Y Y
Value of Service (Critical Facilities)
bull The unit cost of critical facilities (police fire emergency medical services) lost or delayed while flood damage is repaired
Y Y Y
Value of Service Duration
bull The duration of service disruption and rental of temporary facilities for non-residential buildings and critical facilities while flood damage is repaired
bull For non-residential buildingso Value of Service Durations vary from
4 months to over 30 months based on building use and the depth of flooding
o Total Value of Service Loss = (Disruption Cost x Building Area) = (Rental Cost x Building Area x Value of Service Duration)
bull For public buildings and critical facilitieso Value of Service Durations vary from 0
days to 720 months based on building use and the depth of flooding from FEMA FIA or USACE DDFs
o Total Value of Service Loss = (Value of Service) x (Service Loss Duration)
Y Y Y
NYC Mayorrsquos Office of Recovery and Resiliency Climate Resiliency Design Guidelines
47APPENDIX 4 - PROJECT BENEFITS CATEGORIES
Table 16 ndash Guidance on quantitative calculations for (1) sea level rise with coastal storm surge and (2) increased precipitation measures
Data Input General Guidance ndash Basic Description
Applicable Benefit Category
Applicable Typical Facility Typology
Dire
ct B
enefi
ts
Indi
rect
Ben
efits
Oth
er P
oten
tial
Ben
efits
Bui
ldin
g St
ruct
ures
Com
plex
Fa
cilit
ies
Tran
spor
tatio
nSt
reet
scap
es
Plaz
as
Park
Fea
ture
s
Engineering Estimates for Damages
bull Engineered estimate models of physical damages and service losses at the project site based on the Guidelines event recurrence interval(s) and flood depth(s)
Y Y Y Y Y Y
Historic Damages and Service Losses
bull Historic physical damages and service losses at the project site documented from previous flood events
bull Do not use routine maintenancebull The historic damage event recurrence interval
(RIs) andor flood depths must be determined updated for inflation to the present value and adjusted to match the Guidelines event RIsflood depths
Y Y Y Y Y Y
Facility Replacement Value
bull The unit cost to rebuild the facility
Impacted Area bull The geographic area impacted by the facility in the event of failure in acres
Y Y Y Y
Facility Capacity
bull The design capacity of the facilitybull For example - facility capacity expressed in
millions of gallons per day (MGD) for water and wastewater facilities or megawatts (MW) for electrical facilities
Y Y Y Y
Service Population
bull The number of impacted residents served by the facility
bull Typically estimated based on number of impacted residential customers x average number of individuals per household (based on current US Census data or use 25 individuals per household as a default)
bull Facilities serving mostly non-residentialpublic buildings andor critical facilities should focus on service losses rather than service population
Y Y Y
NYC Mayorrsquos Office of Recovery and Resiliency Climate Resiliency Design Guidelines
48APPENDIX 4 - PROJECT BENEFITS CATEGORIES
Table 16 ndash Guidance on quantitative calculations for (1) sea level rise with coastal storm surge and (2) increased precipitation measures
Data Input General Guidance ndash Basic Description
Applicable Benefit Category
Applicable Typical Facility Typology
Dire
ct B
enefi
ts
Indi
rect
Ben
efits
Oth
er P
oten
tial
Ben
efits
Bui
ldin
g St
ruct
ures
Com
plex
Fa
cilit
ies
Tran
spor
tatio
nSt
reet
scap
es
Plaz
as
Park
Fea
ture
s
Value of Service
bull Unit value of service provided by the facilitybull Example of FEMA standard values for complete
loss of utility service $105personday for potable water$49personday for wastewater$148personday for electrical
bull Consider updating FEMA standard per capita values to reflect current The New York City utility rates
Y Y
Roadway Elevations bull Roadway Elevations
Y Y
Roadway Replacement Value
bull Roadway Replacement ValueY Y
Inundation Area Map
bull Inundation Area Map developed by FEMA or through modeling by project design team
Y Y Y
Building Inventory of Inundation Area
bull The number and type of buildings within the streetscape and neighborhood inundated by the Guidelinersquos flood events
Y Y Y
Average Daily Traffic (ADT)
bull The average number of one-way traffic trips per day along the roadway(s) within the streetscapeneighborhood inundated by the Guidelinersquos flood events
Y Y
Additional Travel Time
bull The additional travel time needed to detour around a flooded roadway expressed in minutes
bull In the unlikely event there is no detour available use a 12-hour travel time per one-way trap but provide a detailed area street map as supporting documentation
Y Y
Value of Traffic Delay
bull The value of service associated with lost time in traffic
bull For example - FEMA standard average value of $3344vehiclehour of delay
bull Consider updating FEMA and GSA standard values to reflect current New York City area labor rates and fuel costs
Y Y
NYC Mayorrsquos Office of Recovery and Resiliency Climate Resiliency Design Guidelines
49APPENDIX 4 - PROJECT BENEFITS CATEGORIES
Table 17 ndash Guidance on quantitative unit benefit calculations for extreme heat hazard measures
Measure General Guidance ndash Unit Benefit Information and Data Requirements
Applicable Benefit Category
Applicable Typical Facility Typology
Dire
ct B
enefi
ts
Indi
rect
Ben
efits
Oth
er P
oten
tial
Ben
efits
Bui
ldin
g St
ruct
ures
Com
plex
Fa
cilit
ies
Tran
spor
tatio
nSt
reet
scap
es
Plaz
as
Park
Fea
ture
s
Green Roof
bull Unit benefit range over PUL = $470SF to $373SF of green roof area ($719SF standard value)
bull Assumed PUL = 40 yearsbull Apply standard value unit benefit to green
roof area to estimate measure benefitbull Higher range values more applicable
to residential and commercial building streetscape projects
Y Y Y Y Y Y
Bioswale Rain Garden Meadow Mix
bull Unit benefit range over PUL = $396SF to $211SF of area ($730SF standard value)
bull Assumed PUL = 30 yearsbull Apply standard value unit benefit to bioswale
rain gardenmeadow mix area to estimate total measure benefit
Y Y Y Y Y Y
Cool Roof
bull Unit benefit range over PUL = $117 to $3151SF of material area ($144SF standard value)
bull Assumed PUL = 20 yearsbull Apply standard value unit benefit to cool roof
area to estimate total measure benefitbull Higher range values more applicable to
residential building streetscape projects
Y Y Y Y Y
Light-Colored PaversLight-Colored Materials
bull Unit benefit range over PUL = $0774 to $204SF of material area ($0866SF standard value)
bull Assumed PUL = 30 yearsbull Apply standard value unit benefit to material
area to estimate total measure benefit
Y Y Y Y
Table 17 provides general guidance on how to quantitatively calculate benefits from efforts to address climate stressors See Section IIIE for more information
NYC Mayorrsquos Office of Recovery and Resiliency Climate Resiliency Design Guidelines
50APPENDIX 4 - PROJECT BENEFITS CATEGORIES
Table 17 ndash Guidance on quantitative unit benefit calculations for extreme heat hazard measures
Measure General Guidance ndash Unit Benefit Information and Data Requirements
Applicable Benefit Category
Applicable Typical Facility Typology
Dire
ct B
enefi
ts
Indi
rect
Ben
efits
Oth
er P
oten
tial
Ben
efits
Bui
ldin
g St
ruct
ures
Com
plex
Fa
cilit
ies
Tran
spor
tatio
nSt
reet
scap
es
Plaz
as
Park
Fea
ture
s
Tree Planting
bull Unit benefit range over PUL = $1005 to $77154Tree ($1855Tree standard value)
bull Assumed PUL = 30 yearsbull Apply standard value unit benefit to number of
trees to estimate total measure benefitbull Higher range values more applicable
to residential and commercial building streetscape projects
Y Y Y Y Y Y
Planter Box Tree
bull Unit benefit range over PUL = $212 to 16304Tree ($392Tree standard value)
bull Assumed PUL = 15 yearsbull Apply standard value unit benefit to number of
trees to estimate total measure benefitbull Higher range values more applicable
to residential and commercial building streetscape projects
Y Y Y Y Y
Shade Canopy
bull Unit benefit range over PUL = $0363 to $396SF ($0458SF standard value)
bull Assumed PUL = 15 yearsbull Apply standard value unit benefit to area of
shade canopy estimate total measure benefitbull Higher range values more applicable
to residential and commercial building streetscape projects
Y Y Y Y
Permeable Grass Pavers
bull Unit benefit range over PUL = $0258SF to $0521SF of pavers ($0363SF standard value)
bull Assumed PUL = 30 yearsbull Apply standard value unit benefit to paver
area to estimate total measure benefit
Y Y Y Y Y
For the purposes of the BCA refer to the following facility typologies bull ldquoBuilding Structuresrdquo include critical small building sites such as EMS or FDNY stations and non-critical small building sites such as
libraries or comfort stationsbull ldquoComplex Facilitiesrdquo include critical infrastructure such as wastewater treatment sites pump stations water filtration plants and similar
large or complex facilitiesbull ldquoTransportationStreetscapePlazasrdquo include roadway reconstruction streetscape improvements street raising plazas and other
transportation-related infrastructurebull ldquoPark Featuresrdquo include parks and similar public recreational facility with natural landscape features
NYC Mayorrsquos Office of Recovery and Resiliency Climate Resiliency Design Guidelines
51APPENDIX 5 - EXAMPLE PLANNING DECISION TREE
This decision tree provides a summarized example approach for how to implement these Guidelines Projects with a total cost greater than $50 million are recommended to conduct a full qualitative and quantitative climate change risk assessment and BCA while projects below $50 million are recommended to conduct a qualitative risk assessment and BCA
Define Project
1) Operational goals and criticality level2) Useful life3) Location in the current flood plain future floodplain and or zone
of tidal inundation and the project arearsquos score on the heat vulnerability index
Evaluate Project Risks According to Probability and Magnitude of Consequence
bull Extreme Heat bull Precipitationbull Sea Level Risebull Coastal Surge
High Level Identification and Assessment of Risk Mitigation Alternatives and Co-benefits
(qualitative)
Detailed Identification and Assessment of Risk Mitigation Alternatives and Co-benefits (qualitative and quantitative)
High Level Estimate of Costs and Benefits of Design Alternatives
(qualitative)
Detailed Estimate of Costs and Benefits of Design Alternatives
(qualitative and quantitative)
Decision Point Which climate change risks require mitigation
Decision Point Evaluate risk mitigation benefits and costs to
determine final resilient design alternative or if no action is required
Decision Point Is the total project cost above $50 million
Below $50 million Above $50 million
APPENDIX 5 - EXAMPLE PLANNING DECISION TREE
NYC Mayorrsquos Office of Recovery and Resiliency Climate Resiliency Design Guidelines
52
Project Title
Design Strategies Checklist (not exhaustive)
Extreme Heat Comments Extreme Precipitation Comments Sea Level Rise amp Storm Surge Comments
Select Site in Low Heat Vulnerability Index area Select High Elevation Site Select High Elevation Site
Minimize East-West Building Orientation Green Roof Raise Building Floor Elevation
Passive Solar Cooling and Ventilation Systems
Protect Below Grade Areas from Flooding Waterproof Building Envelope
Cool Roof (SRI appropriate) On-site Stormwater Management (gray) Elevate Critical Building Functions
Green Roof (extensive) Reduce Impervious Areas Elevate Critical Equipment
Vegetative Structures Permeable Pavement Perimeter Floodwall100 Levee (passive or active)
Enhanced HVAC System including space layout optimization and system scalability
Increase Green Spaces and Planted Areas DryWet Floodproofing
More Efficient Building Envelope Other Utility Redundancy Design101
Parking Lot Shading Resilient Materials amp Landscape Treatments
Light Colored Pavements (appropriate SRI) Design for Storm Surge Outflow
Increase Planted Areas Install Backwater Flow Prevention
Permeable Surfaces Design for Scour
Open-grid Pavement Raise Road Elevation
Other Other
This appendix provides a template for identifying possible design strategies to address climate change risks as described throughout the Guidelines
APPENDIX 6 - DESIGN STRATEGIES CHECKLIST
100 Permanent perimeter flood walls are not permitted to meet floodproofing requirements in buildings with substantial improvements andor damages 101 Utility redundancy design should be pursued for critical systems not all building systems
APPENDIX 6 - DESIGN STRATEGIES CHECKLIST
NYC Mayorrsquos Office of Recovery and Resiliency Climate Resiliency Design Guidelines
53APPENDIX 7 - CLIMATE CHANGE RISK ASSESSMENT RESOURCES
These Guidelines provide data on climate change hazards and recommend how that data can inform resilient design A risk assessment is a tool to help project managers and designers evaluate risk levels as well as select and prioritize resilient design strategies A high level risk assessment is recommended for all City capital projects with a total cost of under $50 million Projects above $50 million are recommended to conduct an in-depth assessment
Risk assessments use quantified estimates of the probability and magnitude of consequence of an event occurring to prioritize responses ldquoProbabilityrdquo is an assessment of the likelihood of a hazard occurring while ldquomagnituderdquo describes the hazardrsquos potential impact Risk assessment tools such as the examples listed below can be used to define and score these categories Projects that score higher across both probability and magnitude can be prioritized for investment and risk mitigation action Projects that score lower across both criteria may require no action beyond meeting code The results are typically charted on a risk matrix and an example is provided on the next page
The climate change risk management frameworks below offer templates for how to integrate climate change projections into a risk assessment process Refer to these resources for examples and further information
bull Vulnerability Assessment and Adaptation Framework is prepared by the Federal Highway Administration (FHWA) While developed for transportation planning this risk assessment framework has broad applicability for evaluating asset vulnerability to climate change Available at httpswwwfhwadotgovenvironmentsustainabilityresilienceadaptation_framework
bull US Climate Resilience Toolkit The US Global Change Research Program offers a step by step risk assessment
framework including tools and case studies at httpstoolkitclimategovsteps (see example on next page)
bull Coast Adapt Guidance on undertaking a risk assessment High level assessment httpscoastadaptcomausitesdefaultfilesfactsheetsT3M4_2_2nd_pass_risk_assessmentpdfDetailed assessment httpscoastadaptcomausitesdefaultfilesfactsheetsT3M4_3_3rd_pass_risk_assessmentpdf
bull Climate adaptation Risk uncertainty and decision-makingDownload the report here httpswwwukciporgukpublicationsRisk
The City plans to develop a NYC-specific process for integrating climate change data into existing risk management processes by April 2019
APPENDIX 7 - CLIMATE CHANGE RISK ASSESSMENT RESOURCES
NYC Mayorrsquos Office of Recovery and Resiliency Climate Resiliency Design Guidelines
54APPENDIX 7 - CLIMATE CHANGE RISK ASSESSMENT RESOURCES
The Risk Characterization Matrix below is an example from the US Climate Resilience Toolkit This tool can be used to assess the probability and magnitude of impact for identified risks The risk of coincident climate stressorsrisks (such as storm surge plus increased precipitation) can also be assessed as applicable
Figure 14 - Example of a climate change risk matrix (adapted from US Climate Resilience Toolkit)
Project teams can determine the magnitude of the impact (along the horizontal scale of 1 through 3 with 3 being the most severe) and the probabilitylikelihood of occurrence for each specific risk (along the vertical scale with 3 being the most likely) A score is typically assigned for each risk (Probabil-ity x Magnitude) and then charted on the matrix Based on the estimated probability and magnitude of consequence above the risks are ranked and prioritized for mitigation Factors to bear in mind include
bull Not all facility typologies have the same level of functional and operational importance during events or tolerance for disruption
bull Not all climate stressors and risks have the same level of impact on each project sitebull Not all identified risks can or should be mitigated fully
NYC Mayorrsquos Office of Recovery and Resiliency Climate Resiliency Design Guidelines
55WORKS CITED
A Stronger More Resilient New York PlaNYC Report of the NYC Special Initiative for Rebuilding and Resiliency The City of New York 2013
ldquoAccount for Climate Riskrdquo International Finance Corporation accessed March 27 2017 httpwwwifcorgwpswcmconnectTopics_Ext_ContentIFC_External_Corporate_SiteClimate+Business
PrioritiesAccount+for+Climate+Risk
American Society of Heating Refrigeration and Air-Conditioning Engineers (ASHRAE) Handbook -Fundamentals 2017
ldquoBaseline Standard Economic Value Methodology Reportrdquo Federal Emergency Management Agency July 2016
Benefit Cost Analysis Toolkit Software Version 530 Federal Emergency Management Agency (build date December 2016)
Criteria for Detention Facility Design New York City Department of Environmental Protection November 2012
Community Resilience Planning Guide for Buildings and Infrastructure Systems Vol 1 NIST Special Publication 1190 US Department of Commerce 2016
Cool and Green Roofing Manual NYC Department of Design and Construction 2007 httpwwwnycgovhtmlddcdownloadspdfcool_green_roof_manpdf
Building Resiliency Task Force US Urban Green Building Council New York 2013 httpurbangreencouncilforcecomBuildingResiliency
Design and Planning for Flood Resiliency Guidelines for NYC Parks New York City Department of Parks and Recreation 2017
httpswwwnycgovparksorgplanning-and-buildingplanningresiliency-plansflood-resiliency
Flooded Bus Barns and Buckled Rails Federal Transit Administration Office of Budget and Policy 2011 httpswwwhsdlorgabstractampdid=685187
Floodproofing Non-Residential Buildings FEMA P936 FEMA 2013 httpswwwfemagovmedia-library-data9a50c534fc5895799321dcdd4b6083e7P-936_8-20-13_508rpdf
ldquoGlossaryrdquo International Infrastructure Management Manual National Asset Management Support Group New Zealand 2011 httpwwwipweaorg
ldquoGreen Roof Metrics Draft Reportrdquo New York City Department of Parks and Recreation 2017
ldquoGuide to Rain Event Preparednessrdquo NYC Department of Environmental Protection httpwwwnycgovhtmldeppdfbrochuresflood-preparedness-flyerpdf
ldquoGuidelines and Discount Rates for Benefit-Cost Analysis of Federal Programsrdquo Appendix C Circular A-94 US Office of Management and Budget (OMB) 2017
ldquoGuidelines for the Design and Construction of Stormwater Management Systemsrdquo New York City Department of Environmental Protection July 2012
Horton R et al New York City Panel on Climate Change 2015 Report Ann NY Acad Sci ISSN 0077-892 New York 2015
Madrigano J et al ldquoA case-only study of vulnerability to heat wavendashrelated mortality in New York City (2000ndash2011)rdquo Environmental Health Perspectives 123672ndash678 2013
WORKS CITED
NYC Mayorrsquos Office of Recovery and Resiliency Climate Resiliency Design Guidelines
56WORKS CITED
enspMcGregor et al Two Degrees The Built Environment and Our Changing Climate Routledge Press 2013
NYC Green Codes Task Force US Green Building Council New York 2010 httpurbangreencouncilorgGreenCodes
NYCrsquos Risk Landscape A Guide to Hazard Mitigation NYC Emergency Management 2014
One New York The Plan for a Strong and Just City The City of New York 2015 httpwwwnycgovhtmlonenyc downloadspdfpublicationsOneNYCpdf
Ready to Respond Strategies for Multifamily Building Resilience Enterprise Green Communities 2015 httpswwwenterprisecommunityorgresources
Rosenzweig C et al Climate Change Adaptation in New York City Building a Risk Management Response New York City Panel on Climate Change 2010
httponlinelibrarywileycomdoi101111nyas20101196issue-1 issuetoc
ldquoSustainable Infrastructure Management Program Learning Environmentrdquo Water Environment Research Foundation accessed March 24 2017 httpsimplewerforg
Urban Waterfront Adaptive Strategies NYC Department of City Planning 2013 httpwww1nycgovsiteplanningplanssustainable-communitiesclimate-resiliencepagetab=1
Wastewater Resiliency Plan Climate Risk Assessment and Adaptation Study New York City Department of Environmental Protection October 2013
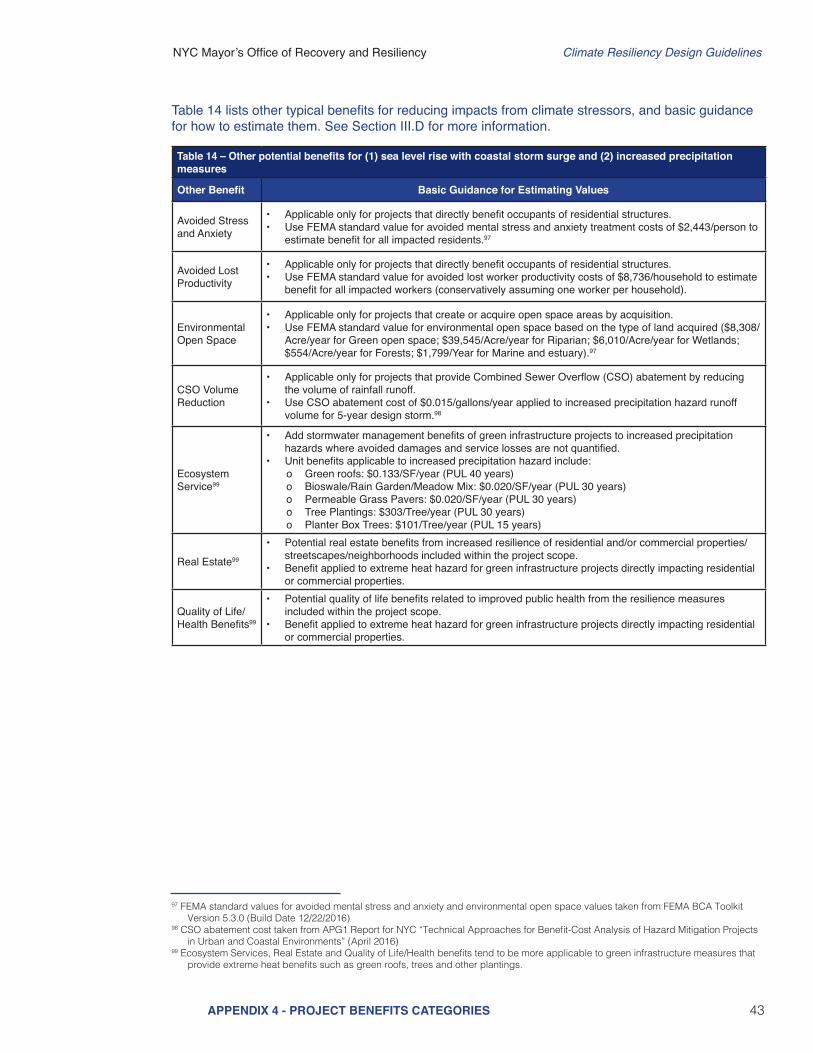
NYC Mayorrsquos Office of Recovery and Resiliency Climate Resiliency Design Guidelines
43APPENDIX 4 - PROJECT BENEFITS CATEGORIES
Table 14 ndash Other potential benefits for (1) sea level rise with coastal storm surge and (2) increased precipitation measures
Other Benefit Basic Guidance for Estimating Values
Avoided Stress and Anxiety
bull Applicable only for projects that directly benefit occupants of residential structuresbull Use FEMA standard value for avoided mental stress and anxiety treatment costs of $2443person to
estimate benefit for all impacted residents97
Avoided Lost Productivity
bull Applicable only for projects that directly benefit occupants of residential structuresbull Use FEMA standard value for avoided lost worker productivity costs of $8736household to estimate
benefit for all impacted workers (conservatively assuming one worker per household)
Environmental Open Space
bull Applicable only for projects that create or acquire open space areas by acquisitionbull Use FEMA standard value for environmental open space based on the type of land acquired ($8308
Acreyear for Green open space $39545Acreyear for Riparian $6010Acreyear for Wetlands $554Acreyear for Forests $1799Year for Marine and estuary)97
CSO Volume Reduction
bull Applicable only for projects that provide Combined Sewer Overflow (CSO) abatement by reducing the volume of rainfall runoff
bull Use CSO abatement cost of $0015gallonsyear applied to increased precipitation hazard runoff volume for 5-year design storm98
Ecosystem Service99
bull Add stormwater management benefits of green infrastructure projects to increased precipitation hazards where avoided damages and service losses are not quantified
bull Unit benefits applicable to increased precipitation hazard includeo Green roofs $0133SFyear (PUL 40 years)o BioswaleRain GardenMeadow Mix $0020SFyear (PUL 30 years)o Permeable Grass Pavers $0020SFyear (PUL 30 years)o Tree Plantings $303Treeyear (PUL 30 years)o Planter Box Trees $101Treeyear (PUL 15 years)
Real Estate99
bull Potential real estate benefits from increased resilience of residential andor commercial propertiesstreetscapesneighborhoods included within the project scope
bull Benefit applied to extreme heat hazard for green infrastructure projects directly impacting residential or commercial properties
Quality of Life Health Benefits99
bull Potential quality of life benefits related to improved public health from the resilience measures included within the project scope
bull Benefit applied to extreme heat hazard for green infrastructure projects directly impacting residential or commercial properties
Table 14 lists other typical benefits for reducing impacts from climate stressors and basic guidance for how to estimate them See Section IIID for more information
97 FEMA standard values for avoided mental stress and anxiety and environmental open space values taken from FEMA BCA Toolkit Version 530 (Build Date 12222016)
98 CSO abatement cost taken from APG1 Report for NYC ldquoTechnical Approaches for Benefit-Cost Analysis of Hazard Mitigation Projects in Urban and Coastal Environmentsrdquo (April 2016)
99 Ecosystem Services Real Estate and Quality of LifeHealth benefits tend to be more applicable to green infrastructure measures that provide extreme heat benefits such as green roofs trees and other plantings
NYC Mayorrsquos Office of Recovery and Resiliency Climate Resiliency Design Guidelines
44APPENDIX 4 - PROJECT BENEFITS CATEGORIES
Table 15 ndash Potential benefits for extreme heat (Urban Heat Island) reduction measures
Category Benefit Basic Guidance for Estimating Values
Direct Benefit
Reduced Life Cycle Cost
bull Applicable only to measures such as green roofs that are expected to last longer than standard roofs
bull Compute total cost savings including annual OampM costs
Indirect Benefit
Energy Savings
bull Applicable to measures that reduce energy costs by providing cooling through increased shading andor evapotranspiration
bull Use New York Power Authority rates of $0148kWh for electricity and $0810Therm for natural gas
Other Potential Benefits
Air Quality bull Applicable to measures that absorb pollutants andor reduce carbon dioxide emissions
Acoustics bull Applicable to measures such as green roof or walls that reduce noise transfer
Quality of LifeHealth bull Potential quality of life benefits and related to improved public health
Real Estate bull Applicable to measures that provide residential real estate benefits from increased resilience of propertiesstreetscapesneighborhoods
Retail Sales Marketing
bull Applicable to measures that provide commercial property benefits from increased aesthetics resulting in increased marketing and sales for streetscapesneighborhoods
Tax Credits Incentives
bull Applicable to resilience or green infrastructure measures such as green roofs that have accompanying Federal State or City tax credits or other incentives
Table 15 lists potential benefits for reducing impacts from heat and basic guidance for how to estimate them See Section IIID for more information
NYC Mayorrsquos Office of Recovery and Resiliency Climate Resiliency Design Guidelines
45APPENDIX 4 - PROJECT BENEFITS CATEGORIES
Table 16 ndash Guidance on quantitative calculations for (1) sea level rise with coastal storm surge and (2) increased precipitation measures
Data Input General Guidance ndash Basic Description
Applicable Benefit Category
Applicable Typical Facility Typology
Dire
ct B
enefi
ts
Indi
rect
Ben
efits
Oth
er P
oten
tial
Ben
efits
Bui
ldin
g St
ruct
ures
Com
plex
Fa
cilit
ies
Tran
spor
tatio
nSt
reet
scap
es
Plaz
as
Park
Fea
ture
s
First Floor Elevation (FFE)
bull The elevation of the first finished floor of the structure excluding basements
bull FFE measured from top of lowest floor (riverinenon-coastal high hazard areas) or bottom of lowest horizontal structural member (coastal high hazard areas)
Y Y Y Y
Building Replacement Value (BRV)
bull The unit cost to rebuild a structure of the same quality of construction
bull Not the same as market value
Y Y Y Y
Building Size
bull The total floor area of the building in square feet
bull Total Building Value = BRV x Building Sizebull Typical BRVs for NYC range between $100 to
$325SF for residential buildings and $120 to $450SF for commercialpublic buildings
Y Y Y Y
Structure Description
bull The type of building number of stories and foundation type (full basement partial basement no basement)
bull Collect more detailed foundation data for coastal flood zones
Y Y Y Y
Building Use bull Details related to residential housing commercial business and public use
Y Y Y Y Y
Building Type bull The primary use of building ndash residential commercial public and others
Y Y Y Y Y
Depth Damage Function (DDF)
bull Curves used to estimate structure damage contents damage and displacement of residential buildings based on flood depth
bull DDFs selection based on Structure Description Building Type Building Use
bull Structure DDFs based on percentage of Total Building Value
bull Contents DDFs based on percentage of Total Contents Value
bull Displacement DDFs based on number of displacement days x Displacement Cost
Y Y Y Y Y
Contents Value
bull The cost to replace structure contents (furnishings equipment)
bull Residential building Contents Values typically 50 BRV (FEMA DDFs) or 100 BRV (USACE DDFs)
bull Non-residential building Contents Values between 18 to over 100 depending on building use (USACE DDFs)
bull Total Contents Value = BRV x Building Size
Y Y Y Y Y
Table 16 provides general guidance on how to quantitatively calculate benefits from efforts to address from climate stressors See Section IIIE for more information
NYC Mayorrsquos Office of Recovery and Resiliency Climate Resiliency Design Guidelines
46APPENDIX 4 - PROJECT BENEFITS CATEGORIES
Table 16 ndash Guidance on quantitative calculations for (1) sea level rise with coastal storm surge and (2) increased precipitation measures
Data Input General Guidance ndash Basic Description
Applicable Benefit Category
Applicable Typical Facility Typology
Dire
ct B
enefi
ts
Indi
rect
Ben
efits
Oth
er P
oten
tial
Ben
efits
Bui
ldin
g St
ruct
ures
Com
plex
Fa
cilit
ies
Tran
spor
tatio
nSt
reet
scap
es
Plaz
as
Park
Fea
ture
s
Number of Residents (Residential)
bull Total number of occupants in a residential building
bull Typically estimated based on number of residential units x average number of individuals per household (based on current US Census data or use 25 individuals per household as a default)
Y Y Y Y Y
Displacement Cost (Residential)
bull The unit cost to lodge and feed displaced residents while flood damage is repaired
bull Average unit displacement cost of $415residential unitday recommended based on current FY2018 GSA Per Diem rates for New York City
Y Y Y Y Y
Value of Service (Non-Residential and Public)
bull The unit cost of service disruption and rental of temporary facilities while flood damage is repaired
bull Disruption costs for non-residential buildings typically range from $095 to $136SFmonth and rental costs range from $020 to $136SFmonth depending on building use
bull Value of service for public buildings ($day) is typically based on the annual operating budget for the City agency using the building prorated based on building size or population served by the building then divided by 365 daysyear
Y Y Y Y
Value of Service (Critical Facilities)
bull The unit cost of critical facilities (police fire emergency medical services) lost or delayed while flood damage is repaired
Y Y Y
Value of Service Duration
bull The duration of service disruption and rental of temporary facilities for non-residential buildings and critical facilities while flood damage is repaired
bull For non-residential buildingso Value of Service Durations vary from
4 months to over 30 months based on building use and the depth of flooding
o Total Value of Service Loss = (Disruption Cost x Building Area) = (Rental Cost x Building Area x Value of Service Duration)
bull For public buildings and critical facilitieso Value of Service Durations vary from 0
days to 720 months based on building use and the depth of flooding from FEMA FIA or USACE DDFs
o Total Value of Service Loss = (Value of Service) x (Service Loss Duration)
Y Y Y
NYC Mayorrsquos Office of Recovery and Resiliency Climate Resiliency Design Guidelines
47APPENDIX 4 - PROJECT BENEFITS CATEGORIES
Table 16 ndash Guidance on quantitative calculations for (1) sea level rise with coastal storm surge and (2) increased precipitation measures
Data Input General Guidance ndash Basic Description
Applicable Benefit Category
Applicable Typical Facility Typology
Dire
ct B
enefi
ts
Indi
rect
Ben
efits
Oth
er P
oten
tial
Ben
efits
Bui
ldin
g St
ruct
ures
Com
plex
Fa
cilit
ies
Tran
spor
tatio
nSt
reet
scap
es
Plaz
as
Park
Fea
ture
s
Engineering Estimates for Damages
bull Engineered estimate models of physical damages and service losses at the project site based on the Guidelines event recurrence interval(s) and flood depth(s)
Y Y Y Y Y Y
Historic Damages and Service Losses
bull Historic physical damages and service losses at the project site documented from previous flood events
bull Do not use routine maintenancebull The historic damage event recurrence interval
(RIs) andor flood depths must be determined updated for inflation to the present value and adjusted to match the Guidelines event RIsflood depths
Y Y Y Y Y Y
Facility Replacement Value
bull The unit cost to rebuild the facility
Impacted Area bull The geographic area impacted by the facility in the event of failure in acres
Y Y Y Y
Facility Capacity
bull The design capacity of the facilitybull For example - facility capacity expressed in
millions of gallons per day (MGD) for water and wastewater facilities or megawatts (MW) for electrical facilities
Y Y Y Y
Service Population
bull The number of impacted residents served by the facility
bull Typically estimated based on number of impacted residential customers x average number of individuals per household (based on current US Census data or use 25 individuals per household as a default)
bull Facilities serving mostly non-residentialpublic buildings andor critical facilities should focus on service losses rather than service population
Y Y Y
NYC Mayorrsquos Office of Recovery and Resiliency Climate Resiliency Design Guidelines
48APPENDIX 4 - PROJECT BENEFITS CATEGORIES
Table 16 ndash Guidance on quantitative calculations for (1) sea level rise with coastal storm surge and (2) increased precipitation measures
Data Input General Guidance ndash Basic Description
Applicable Benefit Category
Applicable Typical Facility Typology
Dire
ct B
enefi
ts
Indi
rect
Ben
efits
Oth
er P
oten
tial
Ben
efits
Bui
ldin
g St
ruct
ures
Com
plex
Fa
cilit
ies
Tran
spor
tatio
nSt
reet
scap
es
Plaz
as
Park
Fea
ture
s
Value of Service
bull Unit value of service provided by the facilitybull Example of FEMA standard values for complete
loss of utility service $105personday for potable water$49personday for wastewater$148personday for electrical
bull Consider updating FEMA standard per capita values to reflect current The New York City utility rates
Y Y
Roadway Elevations bull Roadway Elevations
Y Y
Roadway Replacement Value
bull Roadway Replacement ValueY Y
Inundation Area Map
bull Inundation Area Map developed by FEMA or through modeling by project design team
Y Y Y
Building Inventory of Inundation Area
bull The number and type of buildings within the streetscape and neighborhood inundated by the Guidelinersquos flood events
Y Y Y
Average Daily Traffic (ADT)
bull The average number of one-way traffic trips per day along the roadway(s) within the streetscapeneighborhood inundated by the Guidelinersquos flood events
Y Y
Additional Travel Time
bull The additional travel time needed to detour around a flooded roadway expressed in minutes
bull In the unlikely event there is no detour available use a 12-hour travel time per one-way trap but provide a detailed area street map as supporting documentation
Y Y
Value of Traffic Delay
bull The value of service associated with lost time in traffic
bull For example - FEMA standard average value of $3344vehiclehour of delay
bull Consider updating FEMA and GSA standard values to reflect current New York City area labor rates and fuel costs
Y Y
NYC Mayorrsquos Office of Recovery and Resiliency Climate Resiliency Design Guidelines
49APPENDIX 4 - PROJECT BENEFITS CATEGORIES
Table 17 ndash Guidance on quantitative unit benefit calculations for extreme heat hazard measures
Measure General Guidance ndash Unit Benefit Information and Data Requirements
Applicable Benefit Category
Applicable Typical Facility Typology
Dire
ct B
enefi
ts
Indi
rect
Ben
efits
Oth
er P
oten
tial
Ben
efits
Bui
ldin
g St
ruct
ures
Com
plex
Fa
cilit
ies
Tran
spor
tatio
nSt
reet
scap
es
Plaz
as
Park
Fea
ture
s
Green Roof
bull Unit benefit range over PUL = $470SF to $373SF of green roof area ($719SF standard value)
bull Assumed PUL = 40 yearsbull Apply standard value unit benefit to green
roof area to estimate measure benefitbull Higher range values more applicable
to residential and commercial building streetscape projects
Y Y Y Y Y Y
Bioswale Rain Garden Meadow Mix
bull Unit benefit range over PUL = $396SF to $211SF of area ($730SF standard value)
bull Assumed PUL = 30 yearsbull Apply standard value unit benefit to bioswale
rain gardenmeadow mix area to estimate total measure benefit
Y Y Y Y Y Y
Cool Roof
bull Unit benefit range over PUL = $117 to $3151SF of material area ($144SF standard value)
bull Assumed PUL = 20 yearsbull Apply standard value unit benefit to cool roof
area to estimate total measure benefitbull Higher range values more applicable to
residential building streetscape projects
Y Y Y Y Y
Light-Colored PaversLight-Colored Materials
bull Unit benefit range over PUL = $0774 to $204SF of material area ($0866SF standard value)
bull Assumed PUL = 30 yearsbull Apply standard value unit benefit to material
area to estimate total measure benefit
Y Y Y Y
Table 17 provides general guidance on how to quantitatively calculate benefits from efforts to address climate stressors See Section IIIE for more information
NYC Mayorrsquos Office of Recovery and Resiliency Climate Resiliency Design Guidelines
50APPENDIX 4 - PROJECT BENEFITS CATEGORIES
Table 17 ndash Guidance on quantitative unit benefit calculations for extreme heat hazard measures
Measure General Guidance ndash Unit Benefit Information and Data Requirements
Applicable Benefit Category
Applicable Typical Facility Typology
Dire
ct B
enefi
ts
Indi
rect
Ben
efits
Oth
er P
oten
tial
Ben
efits
Bui
ldin
g St
ruct
ures
Com
plex
Fa
cilit
ies
Tran
spor
tatio
nSt
reet
scap
es
Plaz
as
Park
Fea
ture
s
Tree Planting
bull Unit benefit range over PUL = $1005 to $77154Tree ($1855Tree standard value)
bull Assumed PUL = 30 yearsbull Apply standard value unit benefit to number of
trees to estimate total measure benefitbull Higher range values more applicable
to residential and commercial building streetscape projects
Y Y Y Y Y Y
Planter Box Tree
bull Unit benefit range over PUL = $212 to 16304Tree ($392Tree standard value)
bull Assumed PUL = 15 yearsbull Apply standard value unit benefit to number of
trees to estimate total measure benefitbull Higher range values more applicable
to residential and commercial building streetscape projects
Y Y Y Y Y
Shade Canopy
bull Unit benefit range over PUL = $0363 to $396SF ($0458SF standard value)
bull Assumed PUL = 15 yearsbull Apply standard value unit benefit to area of
shade canopy estimate total measure benefitbull Higher range values more applicable
to residential and commercial building streetscape projects
Y Y Y Y
Permeable Grass Pavers
bull Unit benefit range over PUL = $0258SF to $0521SF of pavers ($0363SF standard value)
bull Assumed PUL = 30 yearsbull Apply standard value unit benefit to paver
area to estimate total measure benefit
Y Y Y Y Y
For the purposes of the BCA refer to the following facility typologies bull ldquoBuilding Structuresrdquo include critical small building sites such as EMS or FDNY stations and non-critical small building sites such as
libraries or comfort stationsbull ldquoComplex Facilitiesrdquo include critical infrastructure such as wastewater treatment sites pump stations water filtration plants and similar
large or complex facilitiesbull ldquoTransportationStreetscapePlazasrdquo include roadway reconstruction streetscape improvements street raising plazas and other
transportation-related infrastructurebull ldquoPark Featuresrdquo include parks and similar public recreational facility with natural landscape features
NYC Mayorrsquos Office of Recovery and Resiliency Climate Resiliency Design Guidelines
51APPENDIX 5 - EXAMPLE PLANNING DECISION TREE
This decision tree provides a summarized example approach for how to implement these Guidelines Projects with a total cost greater than $50 million are recommended to conduct a full qualitative and quantitative climate change risk assessment and BCA while projects below $50 million are recommended to conduct a qualitative risk assessment and BCA
Define Project
1) Operational goals and criticality level2) Useful life3) Location in the current flood plain future floodplain and or zone
of tidal inundation and the project arearsquos score on the heat vulnerability index
Evaluate Project Risks According to Probability and Magnitude of Consequence
bull Extreme Heat bull Precipitationbull Sea Level Risebull Coastal Surge
High Level Identification and Assessment of Risk Mitigation Alternatives and Co-benefits
(qualitative)
Detailed Identification and Assessment of Risk Mitigation Alternatives and Co-benefits (qualitative and quantitative)
High Level Estimate of Costs and Benefits of Design Alternatives
(qualitative)
Detailed Estimate of Costs and Benefits of Design Alternatives
(qualitative and quantitative)
Decision Point Which climate change risks require mitigation
Decision Point Evaluate risk mitigation benefits and costs to
determine final resilient design alternative or if no action is required
Decision Point Is the total project cost above $50 million
Below $50 million Above $50 million
APPENDIX 5 - EXAMPLE PLANNING DECISION TREE
NYC Mayorrsquos Office of Recovery and Resiliency Climate Resiliency Design Guidelines
52
Project Title
Design Strategies Checklist (not exhaustive)
Extreme Heat Comments Extreme Precipitation Comments Sea Level Rise amp Storm Surge Comments
Select Site in Low Heat Vulnerability Index area Select High Elevation Site Select High Elevation Site
Minimize East-West Building Orientation Green Roof Raise Building Floor Elevation
Passive Solar Cooling and Ventilation Systems
Protect Below Grade Areas from Flooding Waterproof Building Envelope
Cool Roof (SRI appropriate) On-site Stormwater Management (gray) Elevate Critical Building Functions
Green Roof (extensive) Reduce Impervious Areas Elevate Critical Equipment
Vegetative Structures Permeable Pavement Perimeter Floodwall100 Levee (passive or active)
Enhanced HVAC System including space layout optimization and system scalability
Increase Green Spaces and Planted Areas DryWet Floodproofing
More Efficient Building Envelope Other Utility Redundancy Design101
Parking Lot Shading Resilient Materials amp Landscape Treatments
Light Colored Pavements (appropriate SRI) Design for Storm Surge Outflow
Increase Planted Areas Install Backwater Flow Prevention
Permeable Surfaces Design for Scour
Open-grid Pavement Raise Road Elevation
Other Other
This appendix provides a template for identifying possible design strategies to address climate change risks as described throughout the Guidelines
APPENDIX 6 - DESIGN STRATEGIES CHECKLIST
100 Permanent perimeter flood walls are not permitted to meet floodproofing requirements in buildings with substantial improvements andor damages 101 Utility redundancy design should be pursued for critical systems not all building systems
APPENDIX 6 - DESIGN STRATEGIES CHECKLIST
NYC Mayorrsquos Office of Recovery and Resiliency Climate Resiliency Design Guidelines
53APPENDIX 7 - CLIMATE CHANGE RISK ASSESSMENT RESOURCES
These Guidelines provide data on climate change hazards and recommend how that data can inform resilient design A risk assessment is a tool to help project managers and designers evaluate risk levels as well as select and prioritize resilient design strategies A high level risk assessment is recommended for all City capital projects with a total cost of under $50 million Projects above $50 million are recommended to conduct an in-depth assessment
Risk assessments use quantified estimates of the probability and magnitude of consequence of an event occurring to prioritize responses ldquoProbabilityrdquo is an assessment of the likelihood of a hazard occurring while ldquomagnituderdquo describes the hazardrsquos potential impact Risk assessment tools such as the examples listed below can be used to define and score these categories Projects that score higher across both probability and magnitude can be prioritized for investment and risk mitigation action Projects that score lower across both criteria may require no action beyond meeting code The results are typically charted on a risk matrix and an example is provided on the next page
The climate change risk management frameworks below offer templates for how to integrate climate change projections into a risk assessment process Refer to these resources for examples and further information
bull Vulnerability Assessment and Adaptation Framework is prepared by the Federal Highway Administration (FHWA) While developed for transportation planning this risk assessment framework has broad applicability for evaluating asset vulnerability to climate change Available at httpswwwfhwadotgovenvironmentsustainabilityresilienceadaptation_framework
bull US Climate Resilience Toolkit The US Global Change Research Program offers a step by step risk assessment
framework including tools and case studies at httpstoolkitclimategovsteps (see example on next page)
bull Coast Adapt Guidance on undertaking a risk assessment High level assessment httpscoastadaptcomausitesdefaultfilesfactsheetsT3M4_2_2nd_pass_risk_assessmentpdfDetailed assessment httpscoastadaptcomausitesdefaultfilesfactsheetsT3M4_3_3rd_pass_risk_assessmentpdf
bull Climate adaptation Risk uncertainty and decision-makingDownload the report here httpswwwukciporgukpublicationsRisk
The City plans to develop a NYC-specific process for integrating climate change data into existing risk management processes by April 2019
APPENDIX 7 - CLIMATE CHANGE RISK ASSESSMENT RESOURCES
NYC Mayorrsquos Office of Recovery and Resiliency Climate Resiliency Design Guidelines
54APPENDIX 7 - CLIMATE CHANGE RISK ASSESSMENT RESOURCES
The Risk Characterization Matrix below is an example from the US Climate Resilience Toolkit This tool can be used to assess the probability and magnitude of impact for identified risks The risk of coincident climate stressorsrisks (such as storm surge plus increased precipitation) can also be assessed as applicable
Figure 14 - Example of a climate change risk matrix (adapted from US Climate Resilience Toolkit)
Project teams can determine the magnitude of the impact (along the horizontal scale of 1 through 3 with 3 being the most severe) and the probabilitylikelihood of occurrence for each specific risk (along the vertical scale with 3 being the most likely) A score is typically assigned for each risk (Probabil-ity x Magnitude) and then charted on the matrix Based on the estimated probability and magnitude of consequence above the risks are ranked and prioritized for mitigation Factors to bear in mind include
bull Not all facility typologies have the same level of functional and operational importance during events or tolerance for disruption
bull Not all climate stressors and risks have the same level of impact on each project sitebull Not all identified risks can or should be mitigated fully
NYC Mayorrsquos Office of Recovery and Resiliency Climate Resiliency Design Guidelines
55WORKS CITED
A Stronger More Resilient New York PlaNYC Report of the NYC Special Initiative for Rebuilding and Resiliency The City of New York 2013
ldquoAccount for Climate Riskrdquo International Finance Corporation accessed March 27 2017 httpwwwifcorgwpswcmconnectTopics_Ext_ContentIFC_External_Corporate_SiteClimate+Business
PrioritiesAccount+for+Climate+Risk
American Society of Heating Refrigeration and Air-Conditioning Engineers (ASHRAE) Handbook -Fundamentals 2017
ldquoBaseline Standard Economic Value Methodology Reportrdquo Federal Emergency Management Agency July 2016
Benefit Cost Analysis Toolkit Software Version 530 Federal Emergency Management Agency (build date December 2016)
Criteria for Detention Facility Design New York City Department of Environmental Protection November 2012
Community Resilience Planning Guide for Buildings and Infrastructure Systems Vol 1 NIST Special Publication 1190 US Department of Commerce 2016
Cool and Green Roofing Manual NYC Department of Design and Construction 2007 httpwwwnycgovhtmlddcdownloadspdfcool_green_roof_manpdf
Building Resiliency Task Force US Urban Green Building Council New York 2013 httpurbangreencouncilforcecomBuildingResiliency
Design and Planning for Flood Resiliency Guidelines for NYC Parks New York City Department of Parks and Recreation 2017
httpswwwnycgovparksorgplanning-and-buildingplanningresiliency-plansflood-resiliency
Flooded Bus Barns and Buckled Rails Federal Transit Administration Office of Budget and Policy 2011 httpswwwhsdlorgabstractampdid=685187
Floodproofing Non-Residential Buildings FEMA P936 FEMA 2013 httpswwwfemagovmedia-library-data9a50c534fc5895799321dcdd4b6083e7P-936_8-20-13_508rpdf
ldquoGlossaryrdquo International Infrastructure Management Manual National Asset Management Support Group New Zealand 2011 httpwwwipweaorg
ldquoGreen Roof Metrics Draft Reportrdquo New York City Department of Parks and Recreation 2017
ldquoGuide to Rain Event Preparednessrdquo NYC Department of Environmental Protection httpwwwnycgovhtmldeppdfbrochuresflood-preparedness-flyerpdf
ldquoGuidelines and Discount Rates for Benefit-Cost Analysis of Federal Programsrdquo Appendix C Circular A-94 US Office of Management and Budget (OMB) 2017
ldquoGuidelines for the Design and Construction of Stormwater Management Systemsrdquo New York City Department of Environmental Protection July 2012
Horton R et al New York City Panel on Climate Change 2015 Report Ann NY Acad Sci ISSN 0077-892 New York 2015
Madrigano J et al ldquoA case-only study of vulnerability to heat wavendashrelated mortality in New York City (2000ndash2011)rdquo Environmental Health Perspectives 123672ndash678 2013
WORKS CITED
NYC Mayorrsquos Office of Recovery and Resiliency Climate Resiliency Design Guidelines
56WORKS CITED
enspMcGregor et al Two Degrees The Built Environment and Our Changing Climate Routledge Press 2013
NYC Green Codes Task Force US Green Building Council New York 2010 httpurbangreencouncilorgGreenCodes
NYCrsquos Risk Landscape A Guide to Hazard Mitigation NYC Emergency Management 2014
One New York The Plan for a Strong and Just City The City of New York 2015 httpwwwnycgovhtmlonenyc downloadspdfpublicationsOneNYCpdf
Ready to Respond Strategies for Multifamily Building Resilience Enterprise Green Communities 2015 httpswwwenterprisecommunityorgresources
Rosenzweig C et al Climate Change Adaptation in New York City Building a Risk Management Response New York City Panel on Climate Change 2010
httponlinelibrarywileycomdoi101111nyas20101196issue-1 issuetoc
ldquoSustainable Infrastructure Management Program Learning Environmentrdquo Water Environment Research Foundation accessed March 24 2017 httpsimplewerforg
Urban Waterfront Adaptive Strategies NYC Department of City Planning 2013 httpwww1nycgovsiteplanningplanssustainable-communitiesclimate-resiliencepagetab=1
Wastewater Resiliency Plan Climate Risk Assessment and Adaptation Study New York City Department of Environmental Protection October 2013
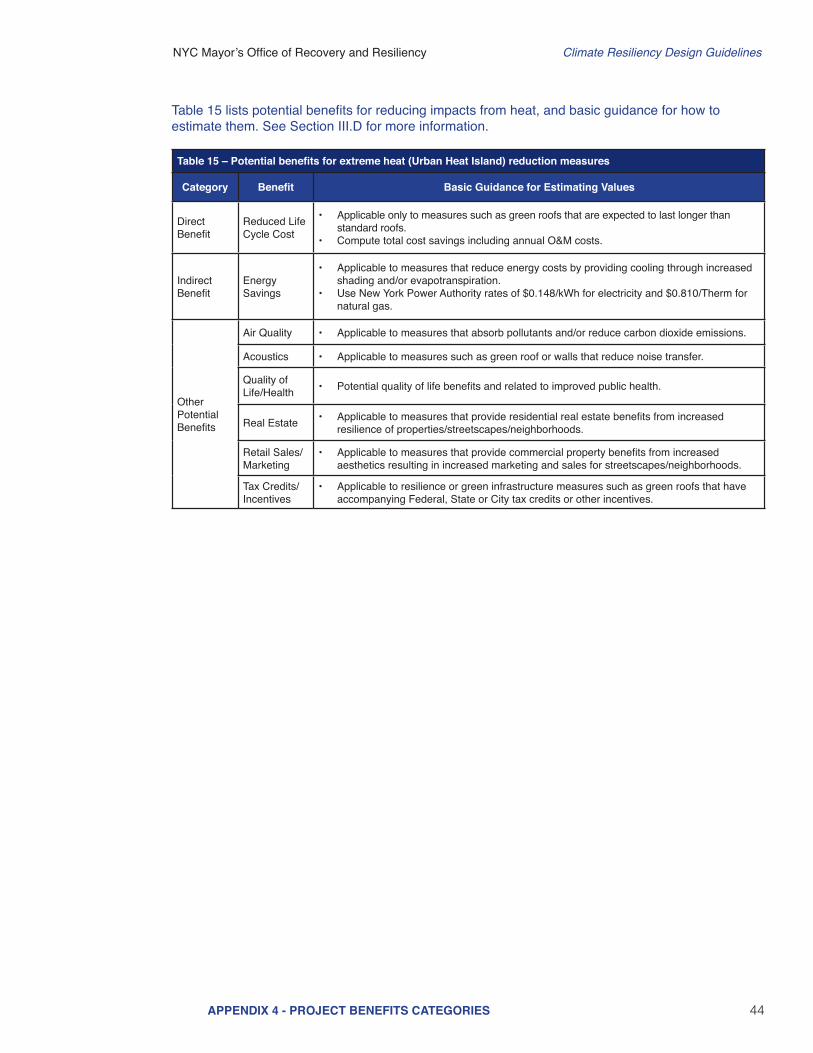
NYC Mayorrsquos Office of Recovery and Resiliency Climate Resiliency Design Guidelines
44APPENDIX 4 - PROJECT BENEFITS CATEGORIES
Table 15 ndash Potential benefits for extreme heat (Urban Heat Island) reduction measures
Category Benefit Basic Guidance for Estimating Values
Direct Benefit
Reduced Life Cycle Cost
bull Applicable only to measures such as green roofs that are expected to last longer than standard roofs
bull Compute total cost savings including annual OampM costs
Indirect Benefit
Energy Savings
bull Applicable to measures that reduce energy costs by providing cooling through increased shading andor evapotranspiration
bull Use New York Power Authority rates of $0148kWh for electricity and $0810Therm for natural gas
Other Potential Benefits
Air Quality bull Applicable to measures that absorb pollutants andor reduce carbon dioxide emissions
Acoustics bull Applicable to measures such as green roof or walls that reduce noise transfer
Quality of LifeHealth bull Potential quality of life benefits and related to improved public health
Real Estate bull Applicable to measures that provide residential real estate benefits from increased resilience of propertiesstreetscapesneighborhoods
Retail Sales Marketing
bull Applicable to measures that provide commercial property benefits from increased aesthetics resulting in increased marketing and sales for streetscapesneighborhoods
Tax Credits Incentives
bull Applicable to resilience or green infrastructure measures such as green roofs that have accompanying Federal State or City tax credits or other incentives
Table 15 lists potential benefits for reducing impacts from heat and basic guidance for how to estimate them See Section IIID for more information
NYC Mayorrsquos Office of Recovery and Resiliency Climate Resiliency Design Guidelines
45APPENDIX 4 - PROJECT BENEFITS CATEGORIES
Table 16 ndash Guidance on quantitative calculations for (1) sea level rise with coastal storm surge and (2) increased precipitation measures
Data Input General Guidance ndash Basic Description
Applicable Benefit Category
Applicable Typical Facility Typology
Dire
ct B
enefi
ts
Indi
rect
Ben
efits
Oth
er P
oten
tial
Ben
efits
Bui
ldin
g St
ruct
ures
Com
plex
Fa
cilit
ies
Tran
spor
tatio
nSt
reet
scap
es
Plaz
as
Park
Fea
ture
s
First Floor Elevation (FFE)
bull The elevation of the first finished floor of the structure excluding basements
bull FFE measured from top of lowest floor (riverinenon-coastal high hazard areas) or bottom of lowest horizontal structural member (coastal high hazard areas)
Y Y Y Y
Building Replacement Value (BRV)
bull The unit cost to rebuild a structure of the same quality of construction
bull Not the same as market value
Y Y Y Y
Building Size
bull The total floor area of the building in square feet
bull Total Building Value = BRV x Building Sizebull Typical BRVs for NYC range between $100 to
$325SF for residential buildings and $120 to $450SF for commercialpublic buildings
Y Y Y Y
Structure Description
bull The type of building number of stories and foundation type (full basement partial basement no basement)
bull Collect more detailed foundation data for coastal flood zones
Y Y Y Y
Building Use bull Details related to residential housing commercial business and public use
Y Y Y Y Y
Building Type bull The primary use of building ndash residential commercial public and others
Y Y Y Y Y
Depth Damage Function (DDF)
bull Curves used to estimate structure damage contents damage and displacement of residential buildings based on flood depth
bull DDFs selection based on Structure Description Building Type Building Use
bull Structure DDFs based on percentage of Total Building Value
bull Contents DDFs based on percentage of Total Contents Value
bull Displacement DDFs based on number of displacement days x Displacement Cost
Y Y Y Y Y
Contents Value
bull The cost to replace structure contents (furnishings equipment)
bull Residential building Contents Values typically 50 BRV (FEMA DDFs) or 100 BRV (USACE DDFs)
bull Non-residential building Contents Values between 18 to over 100 depending on building use (USACE DDFs)
bull Total Contents Value = BRV x Building Size
Y Y Y Y Y
Table 16 provides general guidance on how to quantitatively calculate benefits from efforts to address from climate stressors See Section IIIE for more information
NYC Mayorrsquos Office of Recovery and Resiliency Climate Resiliency Design Guidelines
46APPENDIX 4 - PROJECT BENEFITS CATEGORIES
Table 16 ndash Guidance on quantitative calculations for (1) sea level rise with coastal storm surge and (2) increased precipitation measures
Data Input General Guidance ndash Basic Description
Applicable Benefit Category
Applicable Typical Facility Typology
Dire
ct B
enefi
ts
Indi
rect
Ben
efits
Oth
er P
oten
tial
Ben
efits
Bui
ldin
g St
ruct
ures
Com
plex
Fa
cilit
ies
Tran
spor
tatio
nSt
reet
scap
es
Plaz
as
Park
Fea
ture
s
Number of Residents (Residential)
bull Total number of occupants in a residential building
bull Typically estimated based on number of residential units x average number of individuals per household (based on current US Census data or use 25 individuals per household as a default)
Y Y Y Y Y
Displacement Cost (Residential)
bull The unit cost to lodge and feed displaced residents while flood damage is repaired
bull Average unit displacement cost of $415residential unitday recommended based on current FY2018 GSA Per Diem rates for New York City
Y Y Y Y Y
Value of Service (Non-Residential and Public)
bull The unit cost of service disruption and rental of temporary facilities while flood damage is repaired
bull Disruption costs for non-residential buildings typically range from $095 to $136SFmonth and rental costs range from $020 to $136SFmonth depending on building use
bull Value of service for public buildings ($day) is typically based on the annual operating budget for the City agency using the building prorated based on building size or population served by the building then divided by 365 daysyear
Y Y Y Y
Value of Service (Critical Facilities)
bull The unit cost of critical facilities (police fire emergency medical services) lost or delayed while flood damage is repaired
Y Y Y
Value of Service Duration
bull The duration of service disruption and rental of temporary facilities for non-residential buildings and critical facilities while flood damage is repaired
bull For non-residential buildingso Value of Service Durations vary from
4 months to over 30 months based on building use and the depth of flooding
o Total Value of Service Loss = (Disruption Cost x Building Area) = (Rental Cost x Building Area x Value of Service Duration)
bull For public buildings and critical facilitieso Value of Service Durations vary from 0
days to 720 months based on building use and the depth of flooding from FEMA FIA or USACE DDFs
o Total Value of Service Loss = (Value of Service) x (Service Loss Duration)
Y Y Y
NYC Mayorrsquos Office of Recovery and Resiliency Climate Resiliency Design Guidelines
47APPENDIX 4 - PROJECT BENEFITS CATEGORIES
Table 16 ndash Guidance on quantitative calculations for (1) sea level rise with coastal storm surge and (2) increased precipitation measures
Data Input General Guidance ndash Basic Description
Applicable Benefit Category
Applicable Typical Facility Typology
Dire
ct B
enefi
ts
Indi
rect
Ben
efits
Oth
er P
oten
tial
Ben
efits
Bui
ldin
g St
ruct
ures
Com
plex
Fa
cilit
ies
Tran
spor
tatio
nSt
reet
scap
es
Plaz
as
Park
Fea
ture
s
Engineering Estimates for Damages
bull Engineered estimate models of physical damages and service losses at the project site based on the Guidelines event recurrence interval(s) and flood depth(s)
Y Y Y Y Y Y
Historic Damages and Service Losses
bull Historic physical damages and service losses at the project site documented from previous flood events
bull Do not use routine maintenancebull The historic damage event recurrence interval
(RIs) andor flood depths must be determined updated for inflation to the present value and adjusted to match the Guidelines event RIsflood depths
Y Y Y Y Y Y
Facility Replacement Value
bull The unit cost to rebuild the facility
Impacted Area bull The geographic area impacted by the facility in the event of failure in acres
Y Y Y Y
Facility Capacity
bull The design capacity of the facilitybull For example - facility capacity expressed in
millions of gallons per day (MGD) for water and wastewater facilities or megawatts (MW) for electrical facilities
Y Y Y Y
Service Population
bull The number of impacted residents served by the facility
bull Typically estimated based on number of impacted residential customers x average number of individuals per household (based on current US Census data or use 25 individuals per household as a default)
bull Facilities serving mostly non-residentialpublic buildings andor critical facilities should focus on service losses rather than service population
Y Y Y
NYC Mayorrsquos Office of Recovery and Resiliency Climate Resiliency Design Guidelines
48APPENDIX 4 - PROJECT BENEFITS CATEGORIES
Table 16 ndash Guidance on quantitative calculations for (1) sea level rise with coastal storm surge and (2) increased precipitation measures
Data Input General Guidance ndash Basic Description
Applicable Benefit Category
Applicable Typical Facility Typology
Dire
ct B
enefi
ts
Indi
rect
Ben
efits
Oth
er P
oten
tial
Ben
efits
Bui
ldin
g St
ruct
ures
Com
plex
Fa
cilit
ies
Tran
spor
tatio
nSt
reet
scap
es
Plaz
as
Park
Fea
ture
s
Value of Service
bull Unit value of service provided by the facilitybull Example of FEMA standard values for complete
loss of utility service $105personday for potable water$49personday for wastewater$148personday for electrical
bull Consider updating FEMA standard per capita values to reflect current The New York City utility rates
Y Y
Roadway Elevations bull Roadway Elevations
Y Y
Roadway Replacement Value
bull Roadway Replacement ValueY Y
Inundation Area Map
bull Inundation Area Map developed by FEMA or through modeling by project design team
Y Y Y
Building Inventory of Inundation Area
bull The number and type of buildings within the streetscape and neighborhood inundated by the Guidelinersquos flood events
Y Y Y
Average Daily Traffic (ADT)
bull The average number of one-way traffic trips per day along the roadway(s) within the streetscapeneighborhood inundated by the Guidelinersquos flood events
Y Y
Additional Travel Time
bull The additional travel time needed to detour around a flooded roadway expressed in minutes
bull In the unlikely event there is no detour available use a 12-hour travel time per one-way trap but provide a detailed area street map as supporting documentation
Y Y
Value of Traffic Delay
bull The value of service associated with lost time in traffic
bull For example - FEMA standard average value of $3344vehiclehour of delay
bull Consider updating FEMA and GSA standard values to reflect current New York City area labor rates and fuel costs
Y Y
NYC Mayorrsquos Office of Recovery and Resiliency Climate Resiliency Design Guidelines
49APPENDIX 4 - PROJECT BENEFITS CATEGORIES
Table 17 ndash Guidance on quantitative unit benefit calculations for extreme heat hazard measures
Measure General Guidance ndash Unit Benefit Information and Data Requirements
Applicable Benefit Category
Applicable Typical Facility Typology
Dire
ct B
enefi
ts
Indi
rect
Ben
efits
Oth
er P
oten
tial
Ben
efits
Bui
ldin
g St
ruct
ures
Com
plex
Fa
cilit
ies
Tran
spor
tatio
nSt
reet
scap
es
Plaz
as
Park
Fea
ture
s
Green Roof
bull Unit benefit range over PUL = $470SF to $373SF of green roof area ($719SF standard value)
bull Assumed PUL = 40 yearsbull Apply standard value unit benefit to green
roof area to estimate measure benefitbull Higher range values more applicable
to residential and commercial building streetscape projects
Y Y Y Y Y Y
Bioswale Rain Garden Meadow Mix
bull Unit benefit range over PUL = $396SF to $211SF of area ($730SF standard value)
bull Assumed PUL = 30 yearsbull Apply standard value unit benefit to bioswale
rain gardenmeadow mix area to estimate total measure benefit
Y Y Y Y Y Y
Cool Roof
bull Unit benefit range over PUL = $117 to $3151SF of material area ($144SF standard value)
bull Assumed PUL = 20 yearsbull Apply standard value unit benefit to cool roof
area to estimate total measure benefitbull Higher range values more applicable to
residential building streetscape projects
Y Y Y Y Y
Light-Colored PaversLight-Colored Materials
bull Unit benefit range over PUL = $0774 to $204SF of material area ($0866SF standard value)
bull Assumed PUL = 30 yearsbull Apply standard value unit benefit to material
area to estimate total measure benefit
Y Y Y Y
Table 17 provides general guidance on how to quantitatively calculate benefits from efforts to address climate stressors See Section IIIE for more information
NYC Mayorrsquos Office of Recovery and Resiliency Climate Resiliency Design Guidelines
50APPENDIX 4 - PROJECT BENEFITS CATEGORIES
Table 17 ndash Guidance on quantitative unit benefit calculations for extreme heat hazard measures
Measure General Guidance ndash Unit Benefit Information and Data Requirements
Applicable Benefit Category
Applicable Typical Facility Typology
Dire
ct B
enefi
ts
Indi
rect
Ben
efits
Oth
er P
oten
tial
Ben
efits
Bui
ldin
g St
ruct
ures
Com
plex
Fa
cilit
ies
Tran
spor
tatio
nSt
reet
scap
es
Plaz
as
Park
Fea
ture
s
Tree Planting
bull Unit benefit range over PUL = $1005 to $77154Tree ($1855Tree standard value)
bull Assumed PUL = 30 yearsbull Apply standard value unit benefit to number of
trees to estimate total measure benefitbull Higher range values more applicable
to residential and commercial building streetscape projects
Y Y Y Y Y Y
Planter Box Tree
bull Unit benefit range over PUL = $212 to 16304Tree ($392Tree standard value)
bull Assumed PUL = 15 yearsbull Apply standard value unit benefit to number of
trees to estimate total measure benefitbull Higher range values more applicable
to residential and commercial building streetscape projects
Y Y Y Y Y
Shade Canopy
bull Unit benefit range over PUL = $0363 to $396SF ($0458SF standard value)
bull Assumed PUL = 15 yearsbull Apply standard value unit benefit to area of
shade canopy estimate total measure benefitbull Higher range values more applicable
to residential and commercial building streetscape projects
Y Y Y Y
Permeable Grass Pavers
bull Unit benefit range over PUL = $0258SF to $0521SF of pavers ($0363SF standard value)
bull Assumed PUL = 30 yearsbull Apply standard value unit benefit to paver
area to estimate total measure benefit
Y Y Y Y Y
For the purposes of the BCA refer to the following facility typologies bull ldquoBuilding Structuresrdquo include critical small building sites such as EMS or FDNY stations and non-critical small building sites such as
libraries or comfort stationsbull ldquoComplex Facilitiesrdquo include critical infrastructure such as wastewater treatment sites pump stations water filtration plants and similar
large or complex facilitiesbull ldquoTransportationStreetscapePlazasrdquo include roadway reconstruction streetscape improvements street raising plazas and other
transportation-related infrastructurebull ldquoPark Featuresrdquo include parks and similar public recreational facility with natural landscape features
NYC Mayorrsquos Office of Recovery and Resiliency Climate Resiliency Design Guidelines
51APPENDIX 5 - EXAMPLE PLANNING DECISION TREE
This decision tree provides a summarized example approach for how to implement these Guidelines Projects with a total cost greater than $50 million are recommended to conduct a full qualitative and quantitative climate change risk assessment and BCA while projects below $50 million are recommended to conduct a qualitative risk assessment and BCA
Define Project
1) Operational goals and criticality level2) Useful life3) Location in the current flood plain future floodplain and or zone
of tidal inundation and the project arearsquos score on the heat vulnerability index
Evaluate Project Risks According to Probability and Magnitude of Consequence
bull Extreme Heat bull Precipitationbull Sea Level Risebull Coastal Surge
High Level Identification and Assessment of Risk Mitigation Alternatives and Co-benefits
(qualitative)
Detailed Identification and Assessment of Risk Mitigation Alternatives and Co-benefits (qualitative and quantitative)
High Level Estimate of Costs and Benefits of Design Alternatives
(qualitative)
Detailed Estimate of Costs and Benefits of Design Alternatives
(qualitative and quantitative)
Decision Point Which climate change risks require mitigation
Decision Point Evaluate risk mitigation benefits and costs to
determine final resilient design alternative or if no action is required
Decision Point Is the total project cost above $50 million
Below $50 million Above $50 million
APPENDIX 5 - EXAMPLE PLANNING DECISION TREE
NYC Mayorrsquos Office of Recovery and Resiliency Climate Resiliency Design Guidelines
52
Project Title
Design Strategies Checklist (not exhaustive)
Extreme Heat Comments Extreme Precipitation Comments Sea Level Rise amp Storm Surge Comments
Select Site in Low Heat Vulnerability Index area Select High Elevation Site Select High Elevation Site
Minimize East-West Building Orientation Green Roof Raise Building Floor Elevation
Passive Solar Cooling and Ventilation Systems
Protect Below Grade Areas from Flooding Waterproof Building Envelope
Cool Roof (SRI appropriate) On-site Stormwater Management (gray) Elevate Critical Building Functions
Green Roof (extensive) Reduce Impervious Areas Elevate Critical Equipment
Vegetative Structures Permeable Pavement Perimeter Floodwall100 Levee (passive or active)
Enhanced HVAC System including space layout optimization and system scalability
Increase Green Spaces and Planted Areas DryWet Floodproofing
More Efficient Building Envelope Other Utility Redundancy Design101
Parking Lot Shading Resilient Materials amp Landscape Treatments
Light Colored Pavements (appropriate SRI) Design for Storm Surge Outflow
Increase Planted Areas Install Backwater Flow Prevention
Permeable Surfaces Design for Scour
Open-grid Pavement Raise Road Elevation
Other Other
This appendix provides a template for identifying possible design strategies to address climate change risks as described throughout the Guidelines
APPENDIX 6 - DESIGN STRATEGIES CHECKLIST
100 Permanent perimeter flood walls are not permitted to meet floodproofing requirements in buildings with substantial improvements andor damages 101 Utility redundancy design should be pursued for critical systems not all building systems
APPENDIX 6 - DESIGN STRATEGIES CHECKLIST
NYC Mayorrsquos Office of Recovery and Resiliency Climate Resiliency Design Guidelines
53APPENDIX 7 - CLIMATE CHANGE RISK ASSESSMENT RESOURCES
These Guidelines provide data on climate change hazards and recommend how that data can inform resilient design A risk assessment is a tool to help project managers and designers evaluate risk levels as well as select and prioritize resilient design strategies A high level risk assessment is recommended for all City capital projects with a total cost of under $50 million Projects above $50 million are recommended to conduct an in-depth assessment
Risk assessments use quantified estimates of the probability and magnitude of consequence of an event occurring to prioritize responses ldquoProbabilityrdquo is an assessment of the likelihood of a hazard occurring while ldquomagnituderdquo describes the hazardrsquos potential impact Risk assessment tools such as the examples listed below can be used to define and score these categories Projects that score higher across both probability and magnitude can be prioritized for investment and risk mitigation action Projects that score lower across both criteria may require no action beyond meeting code The results are typically charted on a risk matrix and an example is provided on the next page
The climate change risk management frameworks below offer templates for how to integrate climate change projections into a risk assessment process Refer to these resources for examples and further information
bull Vulnerability Assessment and Adaptation Framework is prepared by the Federal Highway Administration (FHWA) While developed for transportation planning this risk assessment framework has broad applicability for evaluating asset vulnerability to climate change Available at httpswwwfhwadotgovenvironmentsustainabilityresilienceadaptation_framework
bull US Climate Resilience Toolkit The US Global Change Research Program offers a step by step risk assessment
framework including tools and case studies at httpstoolkitclimategovsteps (see example on next page)
bull Coast Adapt Guidance on undertaking a risk assessment High level assessment httpscoastadaptcomausitesdefaultfilesfactsheetsT3M4_2_2nd_pass_risk_assessmentpdfDetailed assessment httpscoastadaptcomausitesdefaultfilesfactsheetsT3M4_3_3rd_pass_risk_assessmentpdf
bull Climate adaptation Risk uncertainty and decision-makingDownload the report here httpswwwukciporgukpublicationsRisk
The City plans to develop a NYC-specific process for integrating climate change data into existing risk management processes by April 2019
APPENDIX 7 - CLIMATE CHANGE RISK ASSESSMENT RESOURCES
NYC Mayorrsquos Office of Recovery and Resiliency Climate Resiliency Design Guidelines
54APPENDIX 7 - CLIMATE CHANGE RISK ASSESSMENT RESOURCES
The Risk Characterization Matrix below is an example from the US Climate Resilience Toolkit This tool can be used to assess the probability and magnitude of impact for identified risks The risk of coincident climate stressorsrisks (such as storm surge plus increased precipitation) can also be assessed as applicable
Figure 14 - Example of a climate change risk matrix (adapted from US Climate Resilience Toolkit)
Project teams can determine the magnitude of the impact (along the horizontal scale of 1 through 3 with 3 being the most severe) and the probabilitylikelihood of occurrence for each specific risk (along the vertical scale with 3 being the most likely) A score is typically assigned for each risk (Probabil-ity x Magnitude) and then charted on the matrix Based on the estimated probability and magnitude of consequence above the risks are ranked and prioritized for mitigation Factors to bear in mind include
bull Not all facility typologies have the same level of functional and operational importance during events or tolerance for disruption
bull Not all climate stressors and risks have the same level of impact on each project sitebull Not all identified risks can or should be mitigated fully
NYC Mayorrsquos Office of Recovery and Resiliency Climate Resiliency Design Guidelines
55WORKS CITED
A Stronger More Resilient New York PlaNYC Report of the NYC Special Initiative for Rebuilding and Resiliency The City of New York 2013
ldquoAccount for Climate Riskrdquo International Finance Corporation accessed March 27 2017 httpwwwifcorgwpswcmconnectTopics_Ext_ContentIFC_External_Corporate_SiteClimate+Business
PrioritiesAccount+for+Climate+Risk
American Society of Heating Refrigeration and Air-Conditioning Engineers (ASHRAE) Handbook -Fundamentals 2017
ldquoBaseline Standard Economic Value Methodology Reportrdquo Federal Emergency Management Agency July 2016
Benefit Cost Analysis Toolkit Software Version 530 Federal Emergency Management Agency (build date December 2016)
Criteria for Detention Facility Design New York City Department of Environmental Protection November 2012
Community Resilience Planning Guide for Buildings and Infrastructure Systems Vol 1 NIST Special Publication 1190 US Department of Commerce 2016
Cool and Green Roofing Manual NYC Department of Design and Construction 2007 httpwwwnycgovhtmlddcdownloadspdfcool_green_roof_manpdf
Building Resiliency Task Force US Urban Green Building Council New York 2013 httpurbangreencouncilforcecomBuildingResiliency
Design and Planning for Flood Resiliency Guidelines for NYC Parks New York City Department of Parks and Recreation 2017
httpswwwnycgovparksorgplanning-and-buildingplanningresiliency-plansflood-resiliency
Flooded Bus Barns and Buckled Rails Federal Transit Administration Office of Budget and Policy 2011 httpswwwhsdlorgabstractampdid=685187
Floodproofing Non-Residential Buildings FEMA P936 FEMA 2013 httpswwwfemagovmedia-library-data9a50c534fc5895799321dcdd4b6083e7P-936_8-20-13_508rpdf
ldquoGlossaryrdquo International Infrastructure Management Manual National Asset Management Support Group New Zealand 2011 httpwwwipweaorg
ldquoGreen Roof Metrics Draft Reportrdquo New York City Department of Parks and Recreation 2017
ldquoGuide to Rain Event Preparednessrdquo NYC Department of Environmental Protection httpwwwnycgovhtmldeppdfbrochuresflood-preparedness-flyerpdf
ldquoGuidelines and Discount Rates for Benefit-Cost Analysis of Federal Programsrdquo Appendix C Circular A-94 US Office of Management and Budget (OMB) 2017
ldquoGuidelines for the Design and Construction of Stormwater Management Systemsrdquo New York City Department of Environmental Protection July 2012
Horton R et al New York City Panel on Climate Change 2015 Report Ann NY Acad Sci ISSN 0077-892 New York 2015
Madrigano J et al ldquoA case-only study of vulnerability to heat wavendashrelated mortality in New York City (2000ndash2011)rdquo Environmental Health Perspectives 123672ndash678 2013
WORKS CITED
NYC Mayorrsquos Office of Recovery and Resiliency Climate Resiliency Design Guidelines
56WORKS CITED
enspMcGregor et al Two Degrees The Built Environment and Our Changing Climate Routledge Press 2013
NYC Green Codes Task Force US Green Building Council New York 2010 httpurbangreencouncilorgGreenCodes
NYCrsquos Risk Landscape A Guide to Hazard Mitigation NYC Emergency Management 2014
One New York The Plan for a Strong and Just City The City of New York 2015 httpwwwnycgovhtmlonenyc downloadspdfpublicationsOneNYCpdf
Ready to Respond Strategies for Multifamily Building Resilience Enterprise Green Communities 2015 httpswwwenterprisecommunityorgresources
Rosenzweig C et al Climate Change Adaptation in New York City Building a Risk Management Response New York City Panel on Climate Change 2010
httponlinelibrarywileycomdoi101111nyas20101196issue-1 issuetoc
ldquoSustainable Infrastructure Management Program Learning Environmentrdquo Water Environment Research Foundation accessed March 24 2017 httpsimplewerforg
Urban Waterfront Adaptive Strategies NYC Department of City Planning 2013 httpwww1nycgovsiteplanningplanssustainable-communitiesclimate-resiliencepagetab=1
Wastewater Resiliency Plan Climate Risk Assessment and Adaptation Study New York City Department of Environmental Protection October 2013
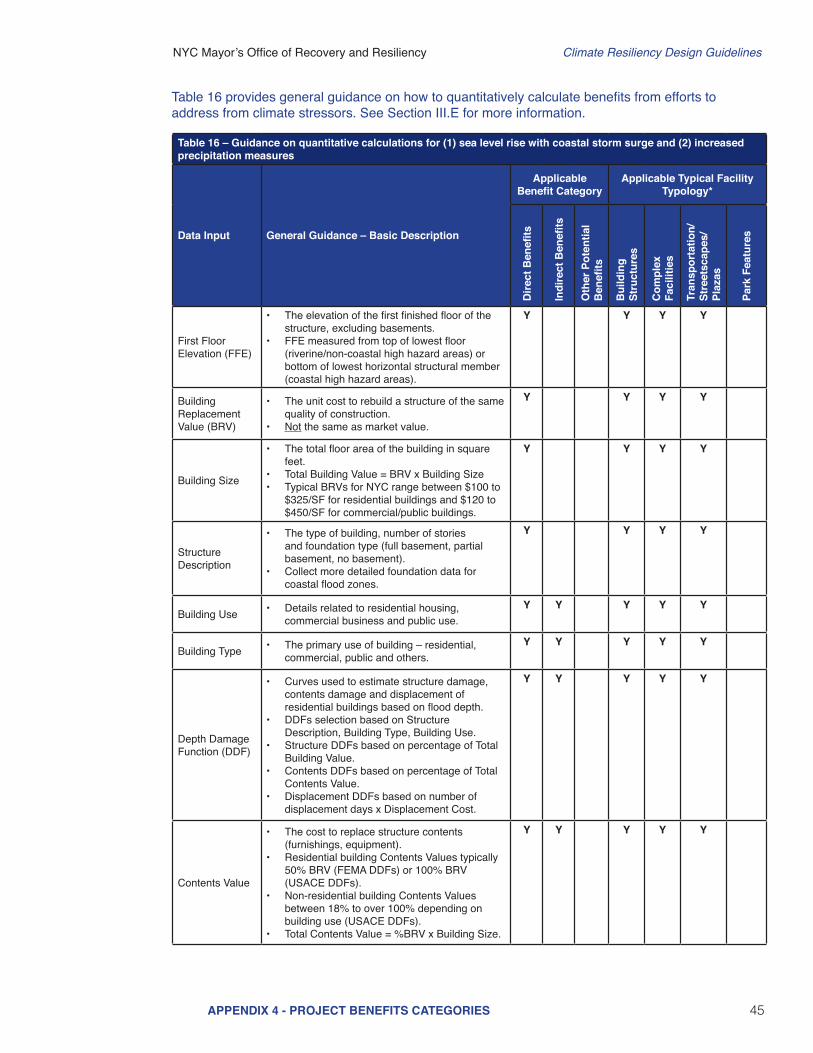
NYC Mayorrsquos Office of Recovery and Resiliency Climate Resiliency Design Guidelines
45APPENDIX 4 - PROJECT BENEFITS CATEGORIES
Table 16 ndash Guidance on quantitative calculations for (1) sea level rise with coastal storm surge and (2) increased precipitation measures
Data Input General Guidance ndash Basic Description
Applicable Benefit Category
Applicable Typical Facility Typology
Dire
ct B
enefi
ts
Indi
rect
Ben
efits
Oth
er P
oten
tial
Ben
efits
Bui
ldin
g St
ruct
ures
Com
plex
Fa
cilit
ies
Tran
spor
tatio
nSt
reet
scap
es
Plaz
as
Park
Fea
ture
s
First Floor Elevation (FFE)
bull The elevation of the first finished floor of the structure excluding basements
bull FFE measured from top of lowest floor (riverinenon-coastal high hazard areas) or bottom of lowest horizontal structural member (coastal high hazard areas)
Y Y Y Y
Building Replacement Value (BRV)
bull The unit cost to rebuild a structure of the same quality of construction
bull Not the same as market value
Y Y Y Y
Building Size
bull The total floor area of the building in square feet
bull Total Building Value = BRV x Building Sizebull Typical BRVs for NYC range between $100 to
$325SF for residential buildings and $120 to $450SF for commercialpublic buildings
Y Y Y Y
Structure Description
bull The type of building number of stories and foundation type (full basement partial basement no basement)
bull Collect more detailed foundation data for coastal flood zones
Y Y Y Y
Building Use bull Details related to residential housing commercial business and public use
Y Y Y Y Y
Building Type bull The primary use of building ndash residential commercial public and others
Y Y Y Y Y
Depth Damage Function (DDF)
bull Curves used to estimate structure damage contents damage and displacement of residential buildings based on flood depth
bull DDFs selection based on Structure Description Building Type Building Use
bull Structure DDFs based on percentage of Total Building Value
bull Contents DDFs based on percentage of Total Contents Value
bull Displacement DDFs based on number of displacement days x Displacement Cost
Y Y Y Y Y
Contents Value
bull The cost to replace structure contents (furnishings equipment)
bull Residential building Contents Values typically 50 BRV (FEMA DDFs) or 100 BRV (USACE DDFs)
bull Non-residential building Contents Values between 18 to over 100 depending on building use (USACE DDFs)
bull Total Contents Value = BRV x Building Size
Y Y Y Y Y
Table 16 provides general guidance on how to quantitatively calculate benefits from efforts to address from climate stressors See Section IIIE for more information
NYC Mayorrsquos Office of Recovery and Resiliency Climate Resiliency Design Guidelines
46APPENDIX 4 - PROJECT BENEFITS CATEGORIES
Table 16 ndash Guidance on quantitative calculations for (1) sea level rise with coastal storm surge and (2) increased precipitation measures
Data Input General Guidance ndash Basic Description
Applicable Benefit Category
Applicable Typical Facility Typology
Dire
ct B
enefi
ts
Indi
rect
Ben
efits
Oth
er P
oten
tial
Ben
efits
Bui
ldin
g St
ruct
ures
Com
plex
Fa
cilit
ies
Tran
spor
tatio
nSt
reet
scap
es
Plaz
as
Park
Fea
ture
s
Number of Residents (Residential)
bull Total number of occupants in a residential building
bull Typically estimated based on number of residential units x average number of individuals per household (based on current US Census data or use 25 individuals per household as a default)
Y Y Y Y Y
Displacement Cost (Residential)
bull The unit cost to lodge and feed displaced residents while flood damage is repaired
bull Average unit displacement cost of $415residential unitday recommended based on current FY2018 GSA Per Diem rates for New York City
Y Y Y Y Y
Value of Service (Non-Residential and Public)
bull The unit cost of service disruption and rental of temporary facilities while flood damage is repaired
bull Disruption costs for non-residential buildings typically range from $095 to $136SFmonth and rental costs range from $020 to $136SFmonth depending on building use
bull Value of service for public buildings ($day) is typically based on the annual operating budget for the City agency using the building prorated based on building size or population served by the building then divided by 365 daysyear
Y Y Y Y
Value of Service (Critical Facilities)
bull The unit cost of critical facilities (police fire emergency medical services) lost or delayed while flood damage is repaired
Y Y Y
Value of Service Duration
bull The duration of service disruption and rental of temporary facilities for non-residential buildings and critical facilities while flood damage is repaired
bull For non-residential buildingso Value of Service Durations vary from
4 months to over 30 months based on building use and the depth of flooding
o Total Value of Service Loss = (Disruption Cost x Building Area) = (Rental Cost x Building Area x Value of Service Duration)
bull For public buildings and critical facilitieso Value of Service Durations vary from 0
days to 720 months based on building use and the depth of flooding from FEMA FIA or USACE DDFs
o Total Value of Service Loss = (Value of Service) x (Service Loss Duration)
Y Y Y
NYC Mayorrsquos Office of Recovery and Resiliency Climate Resiliency Design Guidelines
47APPENDIX 4 - PROJECT BENEFITS CATEGORIES
Table 16 ndash Guidance on quantitative calculations for (1) sea level rise with coastal storm surge and (2) increased precipitation measures
Data Input General Guidance ndash Basic Description
Applicable Benefit Category
Applicable Typical Facility Typology
Dire
ct B
enefi
ts
Indi
rect
Ben
efits
Oth
er P
oten
tial
Ben
efits
Bui
ldin
g St
ruct
ures
Com
plex
Fa
cilit
ies
Tran
spor
tatio
nSt
reet
scap
es
Plaz
as
Park
Fea
ture
s
Engineering Estimates for Damages
bull Engineered estimate models of physical damages and service losses at the project site based on the Guidelines event recurrence interval(s) and flood depth(s)
Y Y Y Y Y Y
Historic Damages and Service Losses
bull Historic physical damages and service losses at the project site documented from previous flood events
bull Do not use routine maintenancebull The historic damage event recurrence interval
(RIs) andor flood depths must be determined updated for inflation to the present value and adjusted to match the Guidelines event RIsflood depths
Y Y Y Y Y Y
Facility Replacement Value
bull The unit cost to rebuild the facility
Impacted Area bull The geographic area impacted by the facility in the event of failure in acres
Y Y Y Y
Facility Capacity
bull The design capacity of the facilitybull For example - facility capacity expressed in
millions of gallons per day (MGD) for water and wastewater facilities or megawatts (MW) for electrical facilities
Y Y Y Y
Service Population
bull The number of impacted residents served by the facility
bull Typically estimated based on number of impacted residential customers x average number of individuals per household (based on current US Census data or use 25 individuals per household as a default)
bull Facilities serving mostly non-residentialpublic buildings andor critical facilities should focus on service losses rather than service population
Y Y Y
NYC Mayorrsquos Office of Recovery and Resiliency Climate Resiliency Design Guidelines
48APPENDIX 4 - PROJECT BENEFITS CATEGORIES
Table 16 ndash Guidance on quantitative calculations for (1) sea level rise with coastal storm surge and (2) increased precipitation measures
Data Input General Guidance ndash Basic Description
Applicable Benefit Category
Applicable Typical Facility Typology
Dire
ct B
enefi
ts
Indi
rect
Ben
efits
Oth
er P
oten
tial
Ben
efits
Bui
ldin
g St
ruct
ures
Com
plex
Fa
cilit
ies
Tran
spor
tatio
nSt
reet
scap
es
Plaz
as
Park
Fea
ture
s
Value of Service
bull Unit value of service provided by the facilitybull Example of FEMA standard values for complete
loss of utility service $105personday for potable water$49personday for wastewater$148personday for electrical
bull Consider updating FEMA standard per capita values to reflect current The New York City utility rates
Y Y
Roadway Elevations bull Roadway Elevations
Y Y
Roadway Replacement Value
bull Roadway Replacement ValueY Y
Inundation Area Map
bull Inundation Area Map developed by FEMA or through modeling by project design team
Y Y Y
Building Inventory of Inundation Area
bull The number and type of buildings within the streetscape and neighborhood inundated by the Guidelinersquos flood events
Y Y Y
Average Daily Traffic (ADT)
bull The average number of one-way traffic trips per day along the roadway(s) within the streetscapeneighborhood inundated by the Guidelinersquos flood events
Y Y
Additional Travel Time
bull The additional travel time needed to detour around a flooded roadway expressed in minutes
bull In the unlikely event there is no detour available use a 12-hour travel time per one-way trap but provide a detailed area street map as supporting documentation
Y Y
Value of Traffic Delay
bull The value of service associated with lost time in traffic
bull For example - FEMA standard average value of $3344vehiclehour of delay
bull Consider updating FEMA and GSA standard values to reflect current New York City area labor rates and fuel costs
Y Y
NYC Mayorrsquos Office of Recovery and Resiliency Climate Resiliency Design Guidelines
49APPENDIX 4 - PROJECT BENEFITS CATEGORIES
Table 17 ndash Guidance on quantitative unit benefit calculations for extreme heat hazard measures
Measure General Guidance ndash Unit Benefit Information and Data Requirements
Applicable Benefit Category
Applicable Typical Facility Typology
Dire
ct B
enefi
ts
Indi
rect
Ben
efits
Oth
er P
oten
tial
Ben
efits
Bui
ldin
g St
ruct
ures
Com
plex
Fa
cilit
ies
Tran
spor
tatio
nSt
reet
scap
es
Plaz
as
Park
Fea
ture
s
Green Roof
bull Unit benefit range over PUL = $470SF to $373SF of green roof area ($719SF standard value)
bull Assumed PUL = 40 yearsbull Apply standard value unit benefit to green
roof area to estimate measure benefitbull Higher range values more applicable
to residential and commercial building streetscape projects
Y Y Y Y Y Y
Bioswale Rain Garden Meadow Mix
bull Unit benefit range over PUL = $396SF to $211SF of area ($730SF standard value)
bull Assumed PUL = 30 yearsbull Apply standard value unit benefit to bioswale
rain gardenmeadow mix area to estimate total measure benefit
Y Y Y Y Y Y
Cool Roof
bull Unit benefit range over PUL = $117 to $3151SF of material area ($144SF standard value)
bull Assumed PUL = 20 yearsbull Apply standard value unit benefit to cool roof
area to estimate total measure benefitbull Higher range values more applicable to
residential building streetscape projects
Y Y Y Y Y
Light-Colored PaversLight-Colored Materials
bull Unit benefit range over PUL = $0774 to $204SF of material area ($0866SF standard value)
bull Assumed PUL = 30 yearsbull Apply standard value unit benefit to material
area to estimate total measure benefit
Y Y Y Y
Table 17 provides general guidance on how to quantitatively calculate benefits from efforts to address climate stressors See Section IIIE for more information
NYC Mayorrsquos Office of Recovery and Resiliency Climate Resiliency Design Guidelines
50APPENDIX 4 - PROJECT BENEFITS CATEGORIES
Table 17 ndash Guidance on quantitative unit benefit calculations for extreme heat hazard measures
Measure General Guidance ndash Unit Benefit Information and Data Requirements
Applicable Benefit Category
Applicable Typical Facility Typology
Dire
ct B
enefi
ts
Indi
rect
Ben
efits
Oth
er P
oten
tial
Ben
efits
Bui
ldin
g St
ruct
ures
Com
plex
Fa
cilit
ies
Tran
spor
tatio
nSt
reet
scap
es
Plaz
as
Park
Fea
ture
s
Tree Planting
bull Unit benefit range over PUL = $1005 to $77154Tree ($1855Tree standard value)
bull Assumed PUL = 30 yearsbull Apply standard value unit benefit to number of
trees to estimate total measure benefitbull Higher range values more applicable
to residential and commercial building streetscape projects
Y Y Y Y Y Y
Planter Box Tree
bull Unit benefit range over PUL = $212 to 16304Tree ($392Tree standard value)
bull Assumed PUL = 15 yearsbull Apply standard value unit benefit to number of
trees to estimate total measure benefitbull Higher range values more applicable
to residential and commercial building streetscape projects
Y Y Y Y Y
Shade Canopy
bull Unit benefit range over PUL = $0363 to $396SF ($0458SF standard value)
bull Assumed PUL = 15 yearsbull Apply standard value unit benefit to area of
shade canopy estimate total measure benefitbull Higher range values more applicable
to residential and commercial building streetscape projects
Y Y Y Y
Permeable Grass Pavers
bull Unit benefit range over PUL = $0258SF to $0521SF of pavers ($0363SF standard value)
bull Assumed PUL = 30 yearsbull Apply standard value unit benefit to paver
area to estimate total measure benefit
Y Y Y Y Y
For the purposes of the BCA refer to the following facility typologies bull ldquoBuilding Structuresrdquo include critical small building sites such as EMS or FDNY stations and non-critical small building sites such as
libraries or comfort stationsbull ldquoComplex Facilitiesrdquo include critical infrastructure such as wastewater treatment sites pump stations water filtration plants and similar
large or complex facilitiesbull ldquoTransportationStreetscapePlazasrdquo include roadway reconstruction streetscape improvements street raising plazas and other
transportation-related infrastructurebull ldquoPark Featuresrdquo include parks and similar public recreational facility with natural landscape features
NYC Mayorrsquos Office of Recovery and Resiliency Climate Resiliency Design Guidelines
51APPENDIX 5 - EXAMPLE PLANNING DECISION TREE
This decision tree provides a summarized example approach for how to implement these Guidelines Projects with a total cost greater than $50 million are recommended to conduct a full qualitative and quantitative climate change risk assessment and BCA while projects below $50 million are recommended to conduct a qualitative risk assessment and BCA
Define Project
1) Operational goals and criticality level2) Useful life3) Location in the current flood plain future floodplain and or zone
of tidal inundation and the project arearsquos score on the heat vulnerability index
Evaluate Project Risks According to Probability and Magnitude of Consequence
bull Extreme Heat bull Precipitationbull Sea Level Risebull Coastal Surge
High Level Identification and Assessment of Risk Mitigation Alternatives and Co-benefits
(qualitative)
Detailed Identification and Assessment of Risk Mitigation Alternatives and Co-benefits (qualitative and quantitative)
High Level Estimate of Costs and Benefits of Design Alternatives
(qualitative)
Detailed Estimate of Costs and Benefits of Design Alternatives
(qualitative and quantitative)
Decision Point Which climate change risks require mitigation
Decision Point Evaluate risk mitigation benefits and costs to
determine final resilient design alternative or if no action is required
Decision Point Is the total project cost above $50 million
Below $50 million Above $50 million
APPENDIX 5 - EXAMPLE PLANNING DECISION TREE
NYC Mayorrsquos Office of Recovery and Resiliency Climate Resiliency Design Guidelines
52
Project Title
Design Strategies Checklist (not exhaustive)
Extreme Heat Comments Extreme Precipitation Comments Sea Level Rise amp Storm Surge Comments
Select Site in Low Heat Vulnerability Index area Select High Elevation Site Select High Elevation Site
Minimize East-West Building Orientation Green Roof Raise Building Floor Elevation
Passive Solar Cooling and Ventilation Systems
Protect Below Grade Areas from Flooding Waterproof Building Envelope
Cool Roof (SRI appropriate) On-site Stormwater Management (gray) Elevate Critical Building Functions
Green Roof (extensive) Reduce Impervious Areas Elevate Critical Equipment
Vegetative Structures Permeable Pavement Perimeter Floodwall100 Levee (passive or active)
Enhanced HVAC System including space layout optimization and system scalability
Increase Green Spaces and Planted Areas DryWet Floodproofing
More Efficient Building Envelope Other Utility Redundancy Design101
Parking Lot Shading Resilient Materials amp Landscape Treatments
Light Colored Pavements (appropriate SRI) Design for Storm Surge Outflow
Increase Planted Areas Install Backwater Flow Prevention
Permeable Surfaces Design for Scour
Open-grid Pavement Raise Road Elevation
Other Other
This appendix provides a template for identifying possible design strategies to address climate change risks as described throughout the Guidelines
APPENDIX 6 - DESIGN STRATEGIES CHECKLIST
100 Permanent perimeter flood walls are not permitted to meet floodproofing requirements in buildings with substantial improvements andor damages 101 Utility redundancy design should be pursued for critical systems not all building systems
APPENDIX 6 - DESIGN STRATEGIES CHECKLIST
NYC Mayorrsquos Office of Recovery and Resiliency Climate Resiliency Design Guidelines
53APPENDIX 7 - CLIMATE CHANGE RISK ASSESSMENT RESOURCES
These Guidelines provide data on climate change hazards and recommend how that data can inform resilient design A risk assessment is a tool to help project managers and designers evaluate risk levels as well as select and prioritize resilient design strategies A high level risk assessment is recommended for all City capital projects with a total cost of under $50 million Projects above $50 million are recommended to conduct an in-depth assessment
Risk assessments use quantified estimates of the probability and magnitude of consequence of an event occurring to prioritize responses ldquoProbabilityrdquo is an assessment of the likelihood of a hazard occurring while ldquomagnituderdquo describes the hazardrsquos potential impact Risk assessment tools such as the examples listed below can be used to define and score these categories Projects that score higher across both probability and magnitude can be prioritized for investment and risk mitigation action Projects that score lower across both criteria may require no action beyond meeting code The results are typically charted on a risk matrix and an example is provided on the next page
The climate change risk management frameworks below offer templates for how to integrate climate change projections into a risk assessment process Refer to these resources for examples and further information
bull Vulnerability Assessment and Adaptation Framework is prepared by the Federal Highway Administration (FHWA) While developed for transportation planning this risk assessment framework has broad applicability for evaluating asset vulnerability to climate change Available at httpswwwfhwadotgovenvironmentsustainabilityresilienceadaptation_framework
bull US Climate Resilience Toolkit The US Global Change Research Program offers a step by step risk assessment
framework including tools and case studies at httpstoolkitclimategovsteps (see example on next page)
bull Coast Adapt Guidance on undertaking a risk assessment High level assessment httpscoastadaptcomausitesdefaultfilesfactsheetsT3M4_2_2nd_pass_risk_assessmentpdfDetailed assessment httpscoastadaptcomausitesdefaultfilesfactsheetsT3M4_3_3rd_pass_risk_assessmentpdf
bull Climate adaptation Risk uncertainty and decision-makingDownload the report here httpswwwukciporgukpublicationsRisk
The City plans to develop a NYC-specific process for integrating climate change data into existing risk management processes by April 2019
APPENDIX 7 - CLIMATE CHANGE RISK ASSESSMENT RESOURCES
NYC Mayorrsquos Office of Recovery and Resiliency Climate Resiliency Design Guidelines
54APPENDIX 7 - CLIMATE CHANGE RISK ASSESSMENT RESOURCES
The Risk Characterization Matrix below is an example from the US Climate Resilience Toolkit This tool can be used to assess the probability and magnitude of impact for identified risks The risk of coincident climate stressorsrisks (such as storm surge plus increased precipitation) can also be assessed as applicable
Figure 14 - Example of a climate change risk matrix (adapted from US Climate Resilience Toolkit)
Project teams can determine the magnitude of the impact (along the horizontal scale of 1 through 3 with 3 being the most severe) and the probabilitylikelihood of occurrence for each specific risk (along the vertical scale with 3 being the most likely) A score is typically assigned for each risk (Probabil-ity x Magnitude) and then charted on the matrix Based on the estimated probability and magnitude of consequence above the risks are ranked and prioritized for mitigation Factors to bear in mind include
bull Not all facility typologies have the same level of functional and operational importance during events or tolerance for disruption
bull Not all climate stressors and risks have the same level of impact on each project sitebull Not all identified risks can or should be mitigated fully
NYC Mayorrsquos Office of Recovery and Resiliency Climate Resiliency Design Guidelines
55WORKS CITED
A Stronger More Resilient New York PlaNYC Report of the NYC Special Initiative for Rebuilding and Resiliency The City of New York 2013
ldquoAccount for Climate Riskrdquo International Finance Corporation accessed March 27 2017 httpwwwifcorgwpswcmconnectTopics_Ext_ContentIFC_External_Corporate_SiteClimate+Business
PrioritiesAccount+for+Climate+Risk
American Society of Heating Refrigeration and Air-Conditioning Engineers (ASHRAE) Handbook -Fundamentals 2017
ldquoBaseline Standard Economic Value Methodology Reportrdquo Federal Emergency Management Agency July 2016
Benefit Cost Analysis Toolkit Software Version 530 Federal Emergency Management Agency (build date December 2016)
Criteria for Detention Facility Design New York City Department of Environmental Protection November 2012
Community Resilience Planning Guide for Buildings and Infrastructure Systems Vol 1 NIST Special Publication 1190 US Department of Commerce 2016
Cool and Green Roofing Manual NYC Department of Design and Construction 2007 httpwwwnycgovhtmlddcdownloadspdfcool_green_roof_manpdf
Building Resiliency Task Force US Urban Green Building Council New York 2013 httpurbangreencouncilforcecomBuildingResiliency
Design and Planning for Flood Resiliency Guidelines for NYC Parks New York City Department of Parks and Recreation 2017
httpswwwnycgovparksorgplanning-and-buildingplanningresiliency-plansflood-resiliency
Flooded Bus Barns and Buckled Rails Federal Transit Administration Office of Budget and Policy 2011 httpswwwhsdlorgabstractampdid=685187
Floodproofing Non-Residential Buildings FEMA P936 FEMA 2013 httpswwwfemagovmedia-library-data9a50c534fc5895799321dcdd4b6083e7P-936_8-20-13_508rpdf
ldquoGlossaryrdquo International Infrastructure Management Manual National Asset Management Support Group New Zealand 2011 httpwwwipweaorg
ldquoGreen Roof Metrics Draft Reportrdquo New York City Department of Parks and Recreation 2017
ldquoGuide to Rain Event Preparednessrdquo NYC Department of Environmental Protection httpwwwnycgovhtmldeppdfbrochuresflood-preparedness-flyerpdf
ldquoGuidelines and Discount Rates for Benefit-Cost Analysis of Federal Programsrdquo Appendix C Circular A-94 US Office of Management and Budget (OMB) 2017
ldquoGuidelines for the Design and Construction of Stormwater Management Systemsrdquo New York City Department of Environmental Protection July 2012
Horton R et al New York City Panel on Climate Change 2015 Report Ann NY Acad Sci ISSN 0077-892 New York 2015
Madrigano J et al ldquoA case-only study of vulnerability to heat wavendashrelated mortality in New York City (2000ndash2011)rdquo Environmental Health Perspectives 123672ndash678 2013
WORKS CITED
NYC Mayorrsquos Office of Recovery and Resiliency Climate Resiliency Design Guidelines
56WORKS CITED
enspMcGregor et al Two Degrees The Built Environment and Our Changing Climate Routledge Press 2013
NYC Green Codes Task Force US Green Building Council New York 2010 httpurbangreencouncilorgGreenCodes
NYCrsquos Risk Landscape A Guide to Hazard Mitigation NYC Emergency Management 2014
One New York The Plan for a Strong and Just City The City of New York 2015 httpwwwnycgovhtmlonenyc downloadspdfpublicationsOneNYCpdf
Ready to Respond Strategies for Multifamily Building Resilience Enterprise Green Communities 2015 httpswwwenterprisecommunityorgresources
Rosenzweig C et al Climate Change Adaptation in New York City Building a Risk Management Response New York City Panel on Climate Change 2010
httponlinelibrarywileycomdoi101111nyas20101196issue-1 issuetoc
ldquoSustainable Infrastructure Management Program Learning Environmentrdquo Water Environment Research Foundation accessed March 24 2017 httpsimplewerforg
Urban Waterfront Adaptive Strategies NYC Department of City Planning 2013 httpwww1nycgovsiteplanningplanssustainable-communitiesclimate-resiliencepagetab=1
Wastewater Resiliency Plan Climate Risk Assessment and Adaptation Study New York City Department of Environmental Protection October 2013
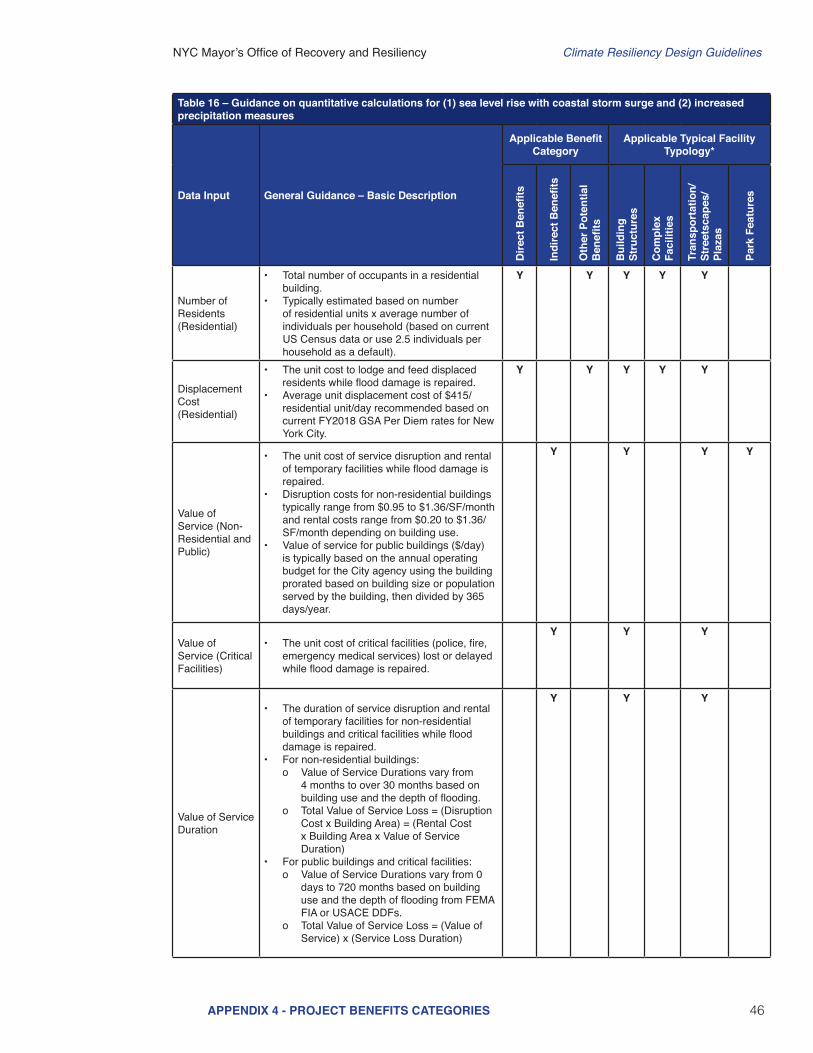
NYC Mayorrsquos Office of Recovery and Resiliency Climate Resiliency Design Guidelines
46APPENDIX 4 - PROJECT BENEFITS CATEGORIES
Table 16 ndash Guidance on quantitative calculations for (1) sea level rise with coastal storm surge and (2) increased precipitation measures
Data Input General Guidance ndash Basic Description
Applicable Benefit Category
Applicable Typical Facility Typology
Dire
ct B
enefi
ts
Indi
rect
Ben
efits
Oth
er P
oten
tial
Ben
efits
Bui
ldin
g St
ruct
ures
Com
plex
Fa
cilit
ies
Tran
spor
tatio
nSt
reet
scap
es
Plaz
as
Park
Fea
ture
s
Number of Residents (Residential)
bull Total number of occupants in a residential building
bull Typically estimated based on number of residential units x average number of individuals per household (based on current US Census data or use 25 individuals per household as a default)
Y Y Y Y Y
Displacement Cost (Residential)
bull The unit cost to lodge and feed displaced residents while flood damage is repaired
bull Average unit displacement cost of $415residential unitday recommended based on current FY2018 GSA Per Diem rates for New York City
Y Y Y Y Y
Value of Service (Non-Residential and Public)
bull The unit cost of service disruption and rental of temporary facilities while flood damage is repaired
bull Disruption costs for non-residential buildings typically range from $095 to $136SFmonth and rental costs range from $020 to $136SFmonth depending on building use
bull Value of service for public buildings ($day) is typically based on the annual operating budget for the City agency using the building prorated based on building size or population served by the building then divided by 365 daysyear
Y Y Y Y
Value of Service (Critical Facilities)
bull The unit cost of critical facilities (police fire emergency medical services) lost or delayed while flood damage is repaired
Y Y Y
Value of Service Duration
bull The duration of service disruption and rental of temporary facilities for non-residential buildings and critical facilities while flood damage is repaired
bull For non-residential buildingso Value of Service Durations vary from
4 months to over 30 months based on building use and the depth of flooding
o Total Value of Service Loss = (Disruption Cost x Building Area) = (Rental Cost x Building Area x Value of Service Duration)
bull For public buildings and critical facilitieso Value of Service Durations vary from 0
days to 720 months based on building use and the depth of flooding from FEMA FIA or USACE DDFs
o Total Value of Service Loss = (Value of Service) x (Service Loss Duration)
Y Y Y
NYC Mayorrsquos Office of Recovery and Resiliency Climate Resiliency Design Guidelines
47APPENDIX 4 - PROJECT BENEFITS CATEGORIES
Table 16 ndash Guidance on quantitative calculations for (1) sea level rise with coastal storm surge and (2) increased precipitation measures
Data Input General Guidance ndash Basic Description
Applicable Benefit Category
Applicable Typical Facility Typology
Dire
ct B
enefi
ts
Indi
rect
Ben
efits
Oth
er P
oten
tial
Ben
efits
Bui
ldin
g St
ruct
ures
Com
plex
Fa
cilit
ies
Tran
spor
tatio
nSt
reet
scap
es
Plaz
as
Park
Fea
ture
s
Engineering Estimates for Damages
bull Engineered estimate models of physical damages and service losses at the project site based on the Guidelines event recurrence interval(s) and flood depth(s)
Y Y Y Y Y Y
Historic Damages and Service Losses
bull Historic physical damages and service losses at the project site documented from previous flood events
bull Do not use routine maintenancebull The historic damage event recurrence interval
(RIs) andor flood depths must be determined updated for inflation to the present value and adjusted to match the Guidelines event RIsflood depths
Y Y Y Y Y Y
Facility Replacement Value
bull The unit cost to rebuild the facility
Impacted Area bull The geographic area impacted by the facility in the event of failure in acres
Y Y Y Y
Facility Capacity
bull The design capacity of the facilitybull For example - facility capacity expressed in
millions of gallons per day (MGD) for water and wastewater facilities or megawatts (MW) for electrical facilities
Y Y Y Y
Service Population
bull The number of impacted residents served by the facility
bull Typically estimated based on number of impacted residential customers x average number of individuals per household (based on current US Census data or use 25 individuals per household as a default)
bull Facilities serving mostly non-residentialpublic buildings andor critical facilities should focus on service losses rather than service population
Y Y Y
NYC Mayorrsquos Office of Recovery and Resiliency Climate Resiliency Design Guidelines
48APPENDIX 4 - PROJECT BENEFITS CATEGORIES
Table 16 ndash Guidance on quantitative calculations for (1) sea level rise with coastal storm surge and (2) increased precipitation measures
Data Input General Guidance ndash Basic Description
Applicable Benefit Category
Applicable Typical Facility Typology
Dire
ct B
enefi
ts
Indi
rect
Ben
efits
Oth
er P
oten
tial
Ben
efits
Bui
ldin
g St
ruct
ures
Com
plex
Fa
cilit
ies
Tran
spor
tatio
nSt
reet
scap
es
Plaz
as
Park
Fea
ture
s
Value of Service
bull Unit value of service provided by the facilitybull Example of FEMA standard values for complete
loss of utility service $105personday for potable water$49personday for wastewater$148personday for electrical
bull Consider updating FEMA standard per capita values to reflect current The New York City utility rates
Y Y
Roadway Elevations bull Roadway Elevations
Y Y
Roadway Replacement Value
bull Roadway Replacement ValueY Y
Inundation Area Map
bull Inundation Area Map developed by FEMA or through modeling by project design team
Y Y Y
Building Inventory of Inundation Area
bull The number and type of buildings within the streetscape and neighborhood inundated by the Guidelinersquos flood events
Y Y Y
Average Daily Traffic (ADT)
bull The average number of one-way traffic trips per day along the roadway(s) within the streetscapeneighborhood inundated by the Guidelinersquos flood events
Y Y
Additional Travel Time
bull The additional travel time needed to detour around a flooded roadway expressed in minutes
bull In the unlikely event there is no detour available use a 12-hour travel time per one-way trap but provide a detailed area street map as supporting documentation
Y Y
Value of Traffic Delay
bull The value of service associated with lost time in traffic
bull For example - FEMA standard average value of $3344vehiclehour of delay
bull Consider updating FEMA and GSA standard values to reflect current New York City area labor rates and fuel costs
Y Y
NYC Mayorrsquos Office of Recovery and Resiliency Climate Resiliency Design Guidelines
49APPENDIX 4 - PROJECT BENEFITS CATEGORIES
Table 17 ndash Guidance on quantitative unit benefit calculations for extreme heat hazard measures
Measure General Guidance ndash Unit Benefit Information and Data Requirements
Applicable Benefit Category
Applicable Typical Facility Typology
Dire
ct B
enefi
ts
Indi
rect
Ben
efits
Oth
er P
oten
tial
Ben
efits
Bui
ldin
g St
ruct
ures
Com
plex
Fa
cilit
ies
Tran
spor
tatio
nSt
reet
scap
es
Plaz
as
Park
Fea
ture
s
Green Roof
bull Unit benefit range over PUL = $470SF to $373SF of green roof area ($719SF standard value)
bull Assumed PUL = 40 yearsbull Apply standard value unit benefit to green
roof area to estimate measure benefitbull Higher range values more applicable
to residential and commercial building streetscape projects
Y Y Y Y Y Y
Bioswale Rain Garden Meadow Mix
bull Unit benefit range over PUL = $396SF to $211SF of area ($730SF standard value)
bull Assumed PUL = 30 yearsbull Apply standard value unit benefit to bioswale
rain gardenmeadow mix area to estimate total measure benefit
Y Y Y Y Y Y
Cool Roof
bull Unit benefit range over PUL = $117 to $3151SF of material area ($144SF standard value)
bull Assumed PUL = 20 yearsbull Apply standard value unit benefit to cool roof
area to estimate total measure benefitbull Higher range values more applicable to
residential building streetscape projects
Y Y Y Y Y
Light-Colored PaversLight-Colored Materials
bull Unit benefit range over PUL = $0774 to $204SF of material area ($0866SF standard value)
bull Assumed PUL = 30 yearsbull Apply standard value unit benefit to material
area to estimate total measure benefit
Y Y Y Y
Table 17 provides general guidance on how to quantitatively calculate benefits from efforts to address climate stressors See Section IIIE for more information
NYC Mayorrsquos Office of Recovery and Resiliency Climate Resiliency Design Guidelines
50APPENDIX 4 - PROJECT BENEFITS CATEGORIES
Table 17 ndash Guidance on quantitative unit benefit calculations for extreme heat hazard measures
Measure General Guidance ndash Unit Benefit Information and Data Requirements
Applicable Benefit Category
Applicable Typical Facility Typology
Dire
ct B
enefi
ts
Indi
rect
Ben
efits
Oth
er P
oten
tial
Ben
efits
Bui
ldin
g St
ruct
ures
Com
plex
Fa
cilit
ies
Tran
spor
tatio
nSt
reet
scap
es
Plaz
as
Park
Fea
ture
s
Tree Planting
bull Unit benefit range over PUL = $1005 to $77154Tree ($1855Tree standard value)
bull Assumed PUL = 30 yearsbull Apply standard value unit benefit to number of
trees to estimate total measure benefitbull Higher range values more applicable
to residential and commercial building streetscape projects
Y Y Y Y Y Y
Planter Box Tree
bull Unit benefit range over PUL = $212 to 16304Tree ($392Tree standard value)
bull Assumed PUL = 15 yearsbull Apply standard value unit benefit to number of
trees to estimate total measure benefitbull Higher range values more applicable
to residential and commercial building streetscape projects
Y Y Y Y Y
Shade Canopy
bull Unit benefit range over PUL = $0363 to $396SF ($0458SF standard value)
bull Assumed PUL = 15 yearsbull Apply standard value unit benefit to area of
shade canopy estimate total measure benefitbull Higher range values more applicable
to residential and commercial building streetscape projects
Y Y Y Y
Permeable Grass Pavers
bull Unit benefit range over PUL = $0258SF to $0521SF of pavers ($0363SF standard value)
bull Assumed PUL = 30 yearsbull Apply standard value unit benefit to paver
area to estimate total measure benefit
Y Y Y Y Y
For the purposes of the BCA refer to the following facility typologies bull ldquoBuilding Structuresrdquo include critical small building sites such as EMS or FDNY stations and non-critical small building sites such as
libraries or comfort stationsbull ldquoComplex Facilitiesrdquo include critical infrastructure such as wastewater treatment sites pump stations water filtration plants and similar
large or complex facilitiesbull ldquoTransportationStreetscapePlazasrdquo include roadway reconstruction streetscape improvements street raising plazas and other
transportation-related infrastructurebull ldquoPark Featuresrdquo include parks and similar public recreational facility with natural landscape features
NYC Mayorrsquos Office of Recovery and Resiliency Climate Resiliency Design Guidelines
51APPENDIX 5 - EXAMPLE PLANNING DECISION TREE
This decision tree provides a summarized example approach for how to implement these Guidelines Projects with a total cost greater than $50 million are recommended to conduct a full qualitative and quantitative climate change risk assessment and BCA while projects below $50 million are recommended to conduct a qualitative risk assessment and BCA
Define Project
1) Operational goals and criticality level2) Useful life3) Location in the current flood plain future floodplain and or zone
of tidal inundation and the project arearsquos score on the heat vulnerability index
Evaluate Project Risks According to Probability and Magnitude of Consequence
bull Extreme Heat bull Precipitationbull Sea Level Risebull Coastal Surge
High Level Identification and Assessment of Risk Mitigation Alternatives and Co-benefits
(qualitative)
Detailed Identification and Assessment of Risk Mitigation Alternatives and Co-benefits (qualitative and quantitative)
High Level Estimate of Costs and Benefits of Design Alternatives
(qualitative)
Detailed Estimate of Costs and Benefits of Design Alternatives
(qualitative and quantitative)
Decision Point Which climate change risks require mitigation
Decision Point Evaluate risk mitigation benefits and costs to
determine final resilient design alternative or if no action is required
Decision Point Is the total project cost above $50 million
Below $50 million Above $50 million
APPENDIX 5 - EXAMPLE PLANNING DECISION TREE
NYC Mayorrsquos Office of Recovery and Resiliency Climate Resiliency Design Guidelines
52
Project Title
Design Strategies Checklist (not exhaustive)
Extreme Heat Comments Extreme Precipitation Comments Sea Level Rise amp Storm Surge Comments
Select Site in Low Heat Vulnerability Index area Select High Elevation Site Select High Elevation Site
Minimize East-West Building Orientation Green Roof Raise Building Floor Elevation
Passive Solar Cooling and Ventilation Systems
Protect Below Grade Areas from Flooding Waterproof Building Envelope
Cool Roof (SRI appropriate) On-site Stormwater Management (gray) Elevate Critical Building Functions
Green Roof (extensive) Reduce Impervious Areas Elevate Critical Equipment
Vegetative Structures Permeable Pavement Perimeter Floodwall100 Levee (passive or active)
Enhanced HVAC System including space layout optimization and system scalability
Increase Green Spaces and Planted Areas DryWet Floodproofing
More Efficient Building Envelope Other Utility Redundancy Design101
Parking Lot Shading Resilient Materials amp Landscape Treatments
Light Colored Pavements (appropriate SRI) Design for Storm Surge Outflow
Increase Planted Areas Install Backwater Flow Prevention
Permeable Surfaces Design for Scour
Open-grid Pavement Raise Road Elevation
Other Other
This appendix provides a template for identifying possible design strategies to address climate change risks as described throughout the Guidelines
APPENDIX 6 - DESIGN STRATEGIES CHECKLIST
100 Permanent perimeter flood walls are not permitted to meet floodproofing requirements in buildings with substantial improvements andor damages 101 Utility redundancy design should be pursued for critical systems not all building systems
APPENDIX 6 - DESIGN STRATEGIES CHECKLIST
NYC Mayorrsquos Office of Recovery and Resiliency Climate Resiliency Design Guidelines
53APPENDIX 7 - CLIMATE CHANGE RISK ASSESSMENT RESOURCES
These Guidelines provide data on climate change hazards and recommend how that data can inform resilient design A risk assessment is a tool to help project managers and designers evaluate risk levels as well as select and prioritize resilient design strategies A high level risk assessment is recommended for all City capital projects with a total cost of under $50 million Projects above $50 million are recommended to conduct an in-depth assessment
Risk assessments use quantified estimates of the probability and magnitude of consequence of an event occurring to prioritize responses ldquoProbabilityrdquo is an assessment of the likelihood of a hazard occurring while ldquomagnituderdquo describes the hazardrsquos potential impact Risk assessment tools such as the examples listed below can be used to define and score these categories Projects that score higher across both probability and magnitude can be prioritized for investment and risk mitigation action Projects that score lower across both criteria may require no action beyond meeting code The results are typically charted on a risk matrix and an example is provided on the next page
The climate change risk management frameworks below offer templates for how to integrate climate change projections into a risk assessment process Refer to these resources for examples and further information
bull Vulnerability Assessment and Adaptation Framework is prepared by the Federal Highway Administration (FHWA) While developed for transportation planning this risk assessment framework has broad applicability for evaluating asset vulnerability to climate change Available at httpswwwfhwadotgovenvironmentsustainabilityresilienceadaptation_framework
bull US Climate Resilience Toolkit The US Global Change Research Program offers a step by step risk assessment
framework including tools and case studies at httpstoolkitclimategovsteps (see example on next page)
bull Coast Adapt Guidance on undertaking a risk assessment High level assessment httpscoastadaptcomausitesdefaultfilesfactsheetsT3M4_2_2nd_pass_risk_assessmentpdfDetailed assessment httpscoastadaptcomausitesdefaultfilesfactsheetsT3M4_3_3rd_pass_risk_assessmentpdf
bull Climate adaptation Risk uncertainty and decision-makingDownload the report here httpswwwukciporgukpublicationsRisk
The City plans to develop a NYC-specific process for integrating climate change data into existing risk management processes by April 2019
APPENDIX 7 - CLIMATE CHANGE RISK ASSESSMENT RESOURCES
NYC Mayorrsquos Office of Recovery and Resiliency Climate Resiliency Design Guidelines
54APPENDIX 7 - CLIMATE CHANGE RISK ASSESSMENT RESOURCES
The Risk Characterization Matrix below is an example from the US Climate Resilience Toolkit This tool can be used to assess the probability and magnitude of impact for identified risks The risk of coincident climate stressorsrisks (such as storm surge plus increased precipitation) can also be assessed as applicable
Figure 14 - Example of a climate change risk matrix (adapted from US Climate Resilience Toolkit)
Project teams can determine the magnitude of the impact (along the horizontal scale of 1 through 3 with 3 being the most severe) and the probabilitylikelihood of occurrence for each specific risk (along the vertical scale with 3 being the most likely) A score is typically assigned for each risk (Probabil-ity x Magnitude) and then charted on the matrix Based on the estimated probability and magnitude of consequence above the risks are ranked and prioritized for mitigation Factors to bear in mind include
bull Not all facility typologies have the same level of functional and operational importance during events or tolerance for disruption
bull Not all climate stressors and risks have the same level of impact on each project sitebull Not all identified risks can or should be mitigated fully
NYC Mayorrsquos Office of Recovery and Resiliency Climate Resiliency Design Guidelines
55WORKS CITED
A Stronger More Resilient New York PlaNYC Report of the NYC Special Initiative for Rebuilding and Resiliency The City of New York 2013
ldquoAccount for Climate Riskrdquo International Finance Corporation accessed March 27 2017 httpwwwifcorgwpswcmconnectTopics_Ext_ContentIFC_External_Corporate_SiteClimate+Business
PrioritiesAccount+for+Climate+Risk
American Society of Heating Refrigeration and Air-Conditioning Engineers (ASHRAE) Handbook -Fundamentals 2017
ldquoBaseline Standard Economic Value Methodology Reportrdquo Federal Emergency Management Agency July 2016
Benefit Cost Analysis Toolkit Software Version 530 Federal Emergency Management Agency (build date December 2016)
Criteria for Detention Facility Design New York City Department of Environmental Protection November 2012
Community Resilience Planning Guide for Buildings and Infrastructure Systems Vol 1 NIST Special Publication 1190 US Department of Commerce 2016
Cool and Green Roofing Manual NYC Department of Design and Construction 2007 httpwwwnycgovhtmlddcdownloadspdfcool_green_roof_manpdf
Building Resiliency Task Force US Urban Green Building Council New York 2013 httpurbangreencouncilforcecomBuildingResiliency
Design and Planning for Flood Resiliency Guidelines for NYC Parks New York City Department of Parks and Recreation 2017
httpswwwnycgovparksorgplanning-and-buildingplanningresiliency-plansflood-resiliency
Flooded Bus Barns and Buckled Rails Federal Transit Administration Office of Budget and Policy 2011 httpswwwhsdlorgabstractampdid=685187
Floodproofing Non-Residential Buildings FEMA P936 FEMA 2013 httpswwwfemagovmedia-library-data9a50c534fc5895799321dcdd4b6083e7P-936_8-20-13_508rpdf
ldquoGlossaryrdquo International Infrastructure Management Manual National Asset Management Support Group New Zealand 2011 httpwwwipweaorg
ldquoGreen Roof Metrics Draft Reportrdquo New York City Department of Parks and Recreation 2017
ldquoGuide to Rain Event Preparednessrdquo NYC Department of Environmental Protection httpwwwnycgovhtmldeppdfbrochuresflood-preparedness-flyerpdf
ldquoGuidelines and Discount Rates for Benefit-Cost Analysis of Federal Programsrdquo Appendix C Circular A-94 US Office of Management and Budget (OMB) 2017
ldquoGuidelines for the Design and Construction of Stormwater Management Systemsrdquo New York City Department of Environmental Protection July 2012
Horton R et al New York City Panel on Climate Change 2015 Report Ann NY Acad Sci ISSN 0077-892 New York 2015
Madrigano J et al ldquoA case-only study of vulnerability to heat wavendashrelated mortality in New York City (2000ndash2011)rdquo Environmental Health Perspectives 123672ndash678 2013
WORKS CITED
NYC Mayorrsquos Office of Recovery and Resiliency Climate Resiliency Design Guidelines
56WORKS CITED
enspMcGregor et al Two Degrees The Built Environment and Our Changing Climate Routledge Press 2013
NYC Green Codes Task Force US Green Building Council New York 2010 httpurbangreencouncilorgGreenCodes
NYCrsquos Risk Landscape A Guide to Hazard Mitigation NYC Emergency Management 2014
One New York The Plan for a Strong and Just City The City of New York 2015 httpwwwnycgovhtmlonenyc downloadspdfpublicationsOneNYCpdf
Ready to Respond Strategies for Multifamily Building Resilience Enterprise Green Communities 2015 httpswwwenterprisecommunityorgresources
Rosenzweig C et al Climate Change Adaptation in New York City Building a Risk Management Response New York City Panel on Climate Change 2010
httponlinelibrarywileycomdoi101111nyas20101196issue-1 issuetoc
ldquoSustainable Infrastructure Management Program Learning Environmentrdquo Water Environment Research Foundation accessed March 24 2017 httpsimplewerforg
Urban Waterfront Adaptive Strategies NYC Department of City Planning 2013 httpwww1nycgovsiteplanningplanssustainable-communitiesclimate-resiliencepagetab=1
Wastewater Resiliency Plan Climate Risk Assessment and Adaptation Study New York City Department of Environmental Protection October 2013
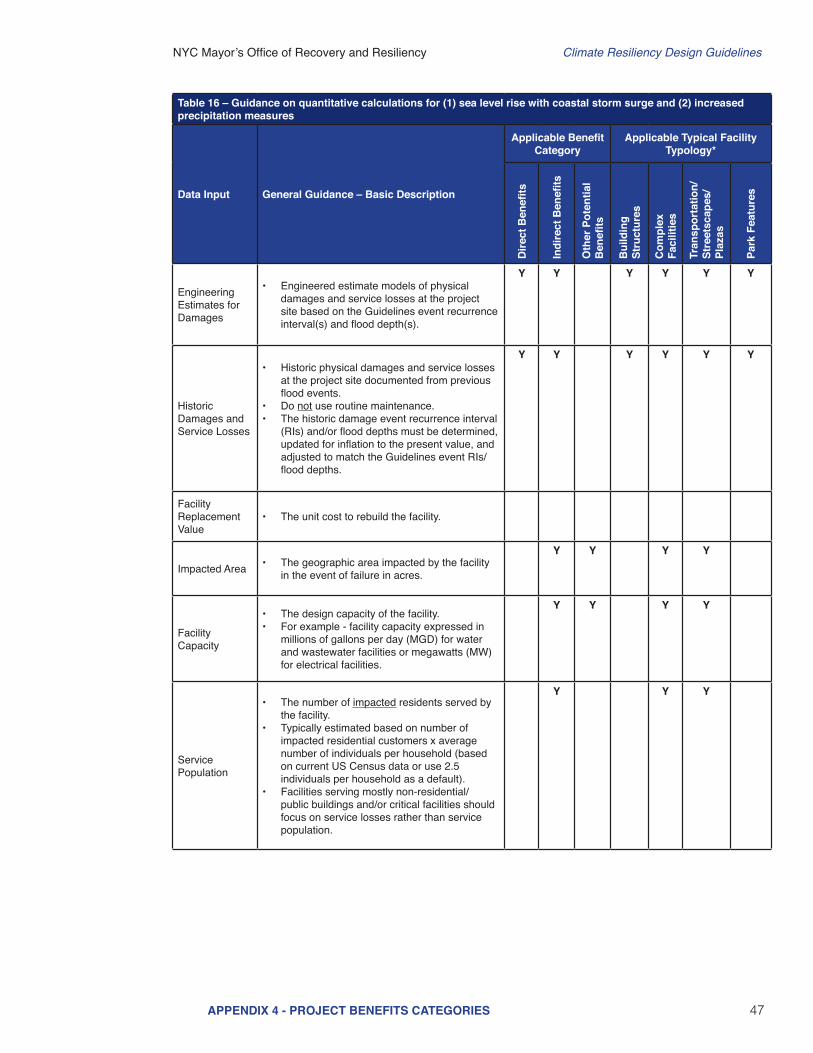
NYC Mayorrsquos Office of Recovery and Resiliency Climate Resiliency Design Guidelines
47APPENDIX 4 - PROJECT BENEFITS CATEGORIES
Table 16 ndash Guidance on quantitative calculations for (1) sea level rise with coastal storm surge and (2) increased precipitation measures
Data Input General Guidance ndash Basic Description
Applicable Benefit Category
Applicable Typical Facility Typology
Dire
ct B
enefi
ts
Indi
rect
Ben
efits
Oth
er P
oten
tial
Ben
efits
Bui
ldin
g St
ruct
ures
Com
plex
Fa
cilit
ies
Tran
spor
tatio
nSt
reet
scap
es
Plaz
as
Park
Fea
ture
s
Engineering Estimates for Damages
bull Engineered estimate models of physical damages and service losses at the project site based on the Guidelines event recurrence interval(s) and flood depth(s)
Y Y Y Y Y Y
Historic Damages and Service Losses
bull Historic physical damages and service losses at the project site documented from previous flood events
bull Do not use routine maintenancebull The historic damage event recurrence interval
(RIs) andor flood depths must be determined updated for inflation to the present value and adjusted to match the Guidelines event RIsflood depths
Y Y Y Y Y Y
Facility Replacement Value
bull The unit cost to rebuild the facility
Impacted Area bull The geographic area impacted by the facility in the event of failure in acres
Y Y Y Y
Facility Capacity
bull The design capacity of the facilitybull For example - facility capacity expressed in
millions of gallons per day (MGD) for water and wastewater facilities or megawatts (MW) for electrical facilities
Y Y Y Y
Service Population
bull The number of impacted residents served by the facility
bull Typically estimated based on number of impacted residential customers x average number of individuals per household (based on current US Census data or use 25 individuals per household as a default)
bull Facilities serving mostly non-residentialpublic buildings andor critical facilities should focus on service losses rather than service population
Y Y Y
NYC Mayorrsquos Office of Recovery and Resiliency Climate Resiliency Design Guidelines
48APPENDIX 4 - PROJECT BENEFITS CATEGORIES
Table 16 ndash Guidance on quantitative calculations for (1) sea level rise with coastal storm surge and (2) increased precipitation measures
Data Input General Guidance ndash Basic Description
Applicable Benefit Category
Applicable Typical Facility Typology
Dire
ct B
enefi
ts
Indi
rect
Ben
efits
Oth
er P
oten
tial
Ben
efits
Bui
ldin
g St
ruct
ures
Com
plex
Fa
cilit
ies
Tran
spor
tatio
nSt
reet
scap
es
Plaz
as
Park
Fea
ture
s
Value of Service
bull Unit value of service provided by the facilitybull Example of FEMA standard values for complete
loss of utility service $105personday for potable water$49personday for wastewater$148personday for electrical
bull Consider updating FEMA standard per capita values to reflect current The New York City utility rates
Y Y
Roadway Elevations bull Roadway Elevations
Y Y
Roadway Replacement Value
bull Roadway Replacement ValueY Y
Inundation Area Map
bull Inundation Area Map developed by FEMA or through modeling by project design team
Y Y Y
Building Inventory of Inundation Area
bull The number and type of buildings within the streetscape and neighborhood inundated by the Guidelinersquos flood events
Y Y Y
Average Daily Traffic (ADT)
bull The average number of one-way traffic trips per day along the roadway(s) within the streetscapeneighborhood inundated by the Guidelinersquos flood events
Y Y
Additional Travel Time
bull The additional travel time needed to detour around a flooded roadway expressed in minutes
bull In the unlikely event there is no detour available use a 12-hour travel time per one-way trap but provide a detailed area street map as supporting documentation
Y Y
Value of Traffic Delay
bull The value of service associated with lost time in traffic
bull For example - FEMA standard average value of $3344vehiclehour of delay
bull Consider updating FEMA and GSA standard values to reflect current New York City area labor rates and fuel costs
Y Y
NYC Mayorrsquos Office of Recovery and Resiliency Climate Resiliency Design Guidelines
49APPENDIX 4 - PROJECT BENEFITS CATEGORIES
Table 17 ndash Guidance on quantitative unit benefit calculations for extreme heat hazard measures
Measure General Guidance ndash Unit Benefit Information and Data Requirements
Applicable Benefit Category
Applicable Typical Facility Typology
Dire
ct B
enefi
ts
Indi
rect
Ben
efits
Oth
er P
oten
tial
Ben
efits
Bui
ldin
g St
ruct
ures
Com
plex
Fa
cilit
ies
Tran
spor
tatio
nSt
reet
scap
es
Plaz
as
Park
Fea
ture
s
Green Roof
bull Unit benefit range over PUL = $470SF to $373SF of green roof area ($719SF standard value)
bull Assumed PUL = 40 yearsbull Apply standard value unit benefit to green
roof area to estimate measure benefitbull Higher range values more applicable
to residential and commercial building streetscape projects
Y Y Y Y Y Y
Bioswale Rain Garden Meadow Mix
bull Unit benefit range over PUL = $396SF to $211SF of area ($730SF standard value)
bull Assumed PUL = 30 yearsbull Apply standard value unit benefit to bioswale
rain gardenmeadow mix area to estimate total measure benefit
Y Y Y Y Y Y
Cool Roof
bull Unit benefit range over PUL = $117 to $3151SF of material area ($144SF standard value)
bull Assumed PUL = 20 yearsbull Apply standard value unit benefit to cool roof
area to estimate total measure benefitbull Higher range values more applicable to
residential building streetscape projects
Y Y Y Y Y
Light-Colored PaversLight-Colored Materials
bull Unit benefit range over PUL = $0774 to $204SF of material area ($0866SF standard value)
bull Assumed PUL = 30 yearsbull Apply standard value unit benefit to material
area to estimate total measure benefit
Y Y Y Y
Table 17 provides general guidance on how to quantitatively calculate benefits from efforts to address climate stressors See Section IIIE for more information
NYC Mayorrsquos Office of Recovery and Resiliency Climate Resiliency Design Guidelines
50APPENDIX 4 - PROJECT BENEFITS CATEGORIES
Table 17 ndash Guidance on quantitative unit benefit calculations for extreme heat hazard measures
Measure General Guidance ndash Unit Benefit Information and Data Requirements
Applicable Benefit Category
Applicable Typical Facility Typology
Dire
ct B
enefi
ts
Indi
rect
Ben
efits
Oth
er P
oten
tial
Ben
efits
Bui
ldin
g St
ruct
ures
Com
plex
Fa
cilit
ies
Tran
spor
tatio
nSt
reet
scap
es
Plaz
as
Park
Fea
ture
s
Tree Planting
bull Unit benefit range over PUL = $1005 to $77154Tree ($1855Tree standard value)
bull Assumed PUL = 30 yearsbull Apply standard value unit benefit to number of
trees to estimate total measure benefitbull Higher range values more applicable
to residential and commercial building streetscape projects
Y Y Y Y Y Y
Planter Box Tree
bull Unit benefit range over PUL = $212 to 16304Tree ($392Tree standard value)
bull Assumed PUL = 15 yearsbull Apply standard value unit benefit to number of
trees to estimate total measure benefitbull Higher range values more applicable
to residential and commercial building streetscape projects
Y Y Y Y Y
Shade Canopy
bull Unit benefit range over PUL = $0363 to $396SF ($0458SF standard value)
bull Assumed PUL = 15 yearsbull Apply standard value unit benefit to area of
shade canopy estimate total measure benefitbull Higher range values more applicable
to residential and commercial building streetscape projects
Y Y Y Y
Permeable Grass Pavers
bull Unit benefit range over PUL = $0258SF to $0521SF of pavers ($0363SF standard value)
bull Assumed PUL = 30 yearsbull Apply standard value unit benefit to paver
area to estimate total measure benefit
Y Y Y Y Y
For the purposes of the BCA refer to the following facility typologies bull ldquoBuilding Structuresrdquo include critical small building sites such as EMS or FDNY stations and non-critical small building sites such as
libraries or comfort stationsbull ldquoComplex Facilitiesrdquo include critical infrastructure such as wastewater treatment sites pump stations water filtration plants and similar
large or complex facilitiesbull ldquoTransportationStreetscapePlazasrdquo include roadway reconstruction streetscape improvements street raising plazas and other
transportation-related infrastructurebull ldquoPark Featuresrdquo include parks and similar public recreational facility with natural landscape features
NYC Mayorrsquos Office of Recovery and Resiliency Climate Resiliency Design Guidelines
51APPENDIX 5 - EXAMPLE PLANNING DECISION TREE
This decision tree provides a summarized example approach for how to implement these Guidelines Projects with a total cost greater than $50 million are recommended to conduct a full qualitative and quantitative climate change risk assessment and BCA while projects below $50 million are recommended to conduct a qualitative risk assessment and BCA
Define Project
1) Operational goals and criticality level2) Useful life3) Location in the current flood plain future floodplain and or zone
of tidal inundation and the project arearsquos score on the heat vulnerability index
Evaluate Project Risks According to Probability and Magnitude of Consequence
bull Extreme Heat bull Precipitationbull Sea Level Risebull Coastal Surge
High Level Identification and Assessment of Risk Mitigation Alternatives and Co-benefits
(qualitative)
Detailed Identification and Assessment of Risk Mitigation Alternatives and Co-benefits (qualitative and quantitative)
High Level Estimate of Costs and Benefits of Design Alternatives
(qualitative)
Detailed Estimate of Costs and Benefits of Design Alternatives
(qualitative and quantitative)
Decision Point Which climate change risks require mitigation
Decision Point Evaluate risk mitigation benefits and costs to
determine final resilient design alternative or if no action is required
Decision Point Is the total project cost above $50 million
Below $50 million Above $50 million
APPENDIX 5 - EXAMPLE PLANNING DECISION TREE
NYC Mayorrsquos Office of Recovery and Resiliency Climate Resiliency Design Guidelines
52
Project Title
Design Strategies Checklist (not exhaustive)
Extreme Heat Comments Extreme Precipitation Comments Sea Level Rise amp Storm Surge Comments
Select Site in Low Heat Vulnerability Index area Select High Elevation Site Select High Elevation Site
Minimize East-West Building Orientation Green Roof Raise Building Floor Elevation
Passive Solar Cooling and Ventilation Systems
Protect Below Grade Areas from Flooding Waterproof Building Envelope
Cool Roof (SRI appropriate) On-site Stormwater Management (gray) Elevate Critical Building Functions
Green Roof (extensive) Reduce Impervious Areas Elevate Critical Equipment
Vegetative Structures Permeable Pavement Perimeter Floodwall100 Levee (passive or active)
Enhanced HVAC System including space layout optimization and system scalability
Increase Green Spaces and Planted Areas DryWet Floodproofing
More Efficient Building Envelope Other Utility Redundancy Design101
Parking Lot Shading Resilient Materials amp Landscape Treatments
Light Colored Pavements (appropriate SRI) Design for Storm Surge Outflow
Increase Planted Areas Install Backwater Flow Prevention
Permeable Surfaces Design for Scour
Open-grid Pavement Raise Road Elevation
Other Other
This appendix provides a template for identifying possible design strategies to address climate change risks as described throughout the Guidelines
APPENDIX 6 - DESIGN STRATEGIES CHECKLIST
100 Permanent perimeter flood walls are not permitted to meet floodproofing requirements in buildings with substantial improvements andor damages 101 Utility redundancy design should be pursued for critical systems not all building systems
APPENDIX 6 - DESIGN STRATEGIES CHECKLIST
NYC Mayorrsquos Office of Recovery and Resiliency Climate Resiliency Design Guidelines
53APPENDIX 7 - CLIMATE CHANGE RISK ASSESSMENT RESOURCES
These Guidelines provide data on climate change hazards and recommend how that data can inform resilient design A risk assessment is a tool to help project managers and designers evaluate risk levels as well as select and prioritize resilient design strategies A high level risk assessment is recommended for all City capital projects with a total cost of under $50 million Projects above $50 million are recommended to conduct an in-depth assessment
Risk assessments use quantified estimates of the probability and magnitude of consequence of an event occurring to prioritize responses ldquoProbabilityrdquo is an assessment of the likelihood of a hazard occurring while ldquomagnituderdquo describes the hazardrsquos potential impact Risk assessment tools such as the examples listed below can be used to define and score these categories Projects that score higher across both probability and magnitude can be prioritized for investment and risk mitigation action Projects that score lower across both criteria may require no action beyond meeting code The results are typically charted on a risk matrix and an example is provided on the next page
The climate change risk management frameworks below offer templates for how to integrate climate change projections into a risk assessment process Refer to these resources for examples and further information
bull Vulnerability Assessment and Adaptation Framework is prepared by the Federal Highway Administration (FHWA) While developed for transportation planning this risk assessment framework has broad applicability for evaluating asset vulnerability to climate change Available at httpswwwfhwadotgovenvironmentsustainabilityresilienceadaptation_framework
bull US Climate Resilience Toolkit The US Global Change Research Program offers a step by step risk assessment
framework including tools and case studies at httpstoolkitclimategovsteps (see example on next page)
bull Coast Adapt Guidance on undertaking a risk assessment High level assessment httpscoastadaptcomausitesdefaultfilesfactsheetsT3M4_2_2nd_pass_risk_assessmentpdfDetailed assessment httpscoastadaptcomausitesdefaultfilesfactsheetsT3M4_3_3rd_pass_risk_assessmentpdf
bull Climate adaptation Risk uncertainty and decision-makingDownload the report here httpswwwukciporgukpublicationsRisk
The City plans to develop a NYC-specific process for integrating climate change data into existing risk management processes by April 2019
APPENDIX 7 - CLIMATE CHANGE RISK ASSESSMENT RESOURCES
NYC Mayorrsquos Office of Recovery and Resiliency Climate Resiliency Design Guidelines
54APPENDIX 7 - CLIMATE CHANGE RISK ASSESSMENT RESOURCES
The Risk Characterization Matrix below is an example from the US Climate Resilience Toolkit This tool can be used to assess the probability and magnitude of impact for identified risks The risk of coincident climate stressorsrisks (such as storm surge plus increased precipitation) can also be assessed as applicable
Figure 14 - Example of a climate change risk matrix (adapted from US Climate Resilience Toolkit)
Project teams can determine the magnitude of the impact (along the horizontal scale of 1 through 3 with 3 being the most severe) and the probabilitylikelihood of occurrence for each specific risk (along the vertical scale with 3 being the most likely) A score is typically assigned for each risk (Probabil-ity x Magnitude) and then charted on the matrix Based on the estimated probability and magnitude of consequence above the risks are ranked and prioritized for mitigation Factors to bear in mind include
bull Not all facility typologies have the same level of functional and operational importance during events or tolerance for disruption
bull Not all climate stressors and risks have the same level of impact on each project sitebull Not all identified risks can or should be mitigated fully
NYC Mayorrsquos Office of Recovery and Resiliency Climate Resiliency Design Guidelines
55WORKS CITED
A Stronger More Resilient New York PlaNYC Report of the NYC Special Initiative for Rebuilding and Resiliency The City of New York 2013
ldquoAccount for Climate Riskrdquo International Finance Corporation accessed March 27 2017 httpwwwifcorgwpswcmconnectTopics_Ext_ContentIFC_External_Corporate_SiteClimate+Business
PrioritiesAccount+for+Climate+Risk
American Society of Heating Refrigeration and Air-Conditioning Engineers (ASHRAE) Handbook -Fundamentals 2017
ldquoBaseline Standard Economic Value Methodology Reportrdquo Federal Emergency Management Agency July 2016
Benefit Cost Analysis Toolkit Software Version 530 Federal Emergency Management Agency (build date December 2016)
Criteria for Detention Facility Design New York City Department of Environmental Protection November 2012
Community Resilience Planning Guide for Buildings and Infrastructure Systems Vol 1 NIST Special Publication 1190 US Department of Commerce 2016
Cool and Green Roofing Manual NYC Department of Design and Construction 2007 httpwwwnycgovhtmlddcdownloadspdfcool_green_roof_manpdf
Building Resiliency Task Force US Urban Green Building Council New York 2013 httpurbangreencouncilforcecomBuildingResiliency
Design and Planning for Flood Resiliency Guidelines for NYC Parks New York City Department of Parks and Recreation 2017
httpswwwnycgovparksorgplanning-and-buildingplanningresiliency-plansflood-resiliency
Flooded Bus Barns and Buckled Rails Federal Transit Administration Office of Budget and Policy 2011 httpswwwhsdlorgabstractampdid=685187
Floodproofing Non-Residential Buildings FEMA P936 FEMA 2013 httpswwwfemagovmedia-library-data9a50c534fc5895799321dcdd4b6083e7P-936_8-20-13_508rpdf
ldquoGlossaryrdquo International Infrastructure Management Manual National Asset Management Support Group New Zealand 2011 httpwwwipweaorg
ldquoGreen Roof Metrics Draft Reportrdquo New York City Department of Parks and Recreation 2017
ldquoGuide to Rain Event Preparednessrdquo NYC Department of Environmental Protection httpwwwnycgovhtmldeppdfbrochuresflood-preparedness-flyerpdf
ldquoGuidelines and Discount Rates for Benefit-Cost Analysis of Federal Programsrdquo Appendix C Circular A-94 US Office of Management and Budget (OMB) 2017
ldquoGuidelines for the Design and Construction of Stormwater Management Systemsrdquo New York City Department of Environmental Protection July 2012
Horton R et al New York City Panel on Climate Change 2015 Report Ann NY Acad Sci ISSN 0077-892 New York 2015
Madrigano J et al ldquoA case-only study of vulnerability to heat wavendashrelated mortality in New York City (2000ndash2011)rdquo Environmental Health Perspectives 123672ndash678 2013
WORKS CITED
NYC Mayorrsquos Office of Recovery and Resiliency Climate Resiliency Design Guidelines
56WORKS CITED
enspMcGregor et al Two Degrees The Built Environment and Our Changing Climate Routledge Press 2013
NYC Green Codes Task Force US Green Building Council New York 2010 httpurbangreencouncilorgGreenCodes
NYCrsquos Risk Landscape A Guide to Hazard Mitigation NYC Emergency Management 2014
One New York The Plan for a Strong and Just City The City of New York 2015 httpwwwnycgovhtmlonenyc downloadspdfpublicationsOneNYCpdf
Ready to Respond Strategies for Multifamily Building Resilience Enterprise Green Communities 2015 httpswwwenterprisecommunityorgresources
Rosenzweig C et al Climate Change Adaptation in New York City Building a Risk Management Response New York City Panel on Climate Change 2010
httponlinelibrarywileycomdoi101111nyas20101196issue-1 issuetoc
ldquoSustainable Infrastructure Management Program Learning Environmentrdquo Water Environment Research Foundation accessed March 24 2017 httpsimplewerforg
Urban Waterfront Adaptive Strategies NYC Department of City Planning 2013 httpwww1nycgovsiteplanningplanssustainable-communitiesclimate-resiliencepagetab=1
Wastewater Resiliency Plan Climate Risk Assessment and Adaptation Study New York City Department of Environmental Protection October 2013
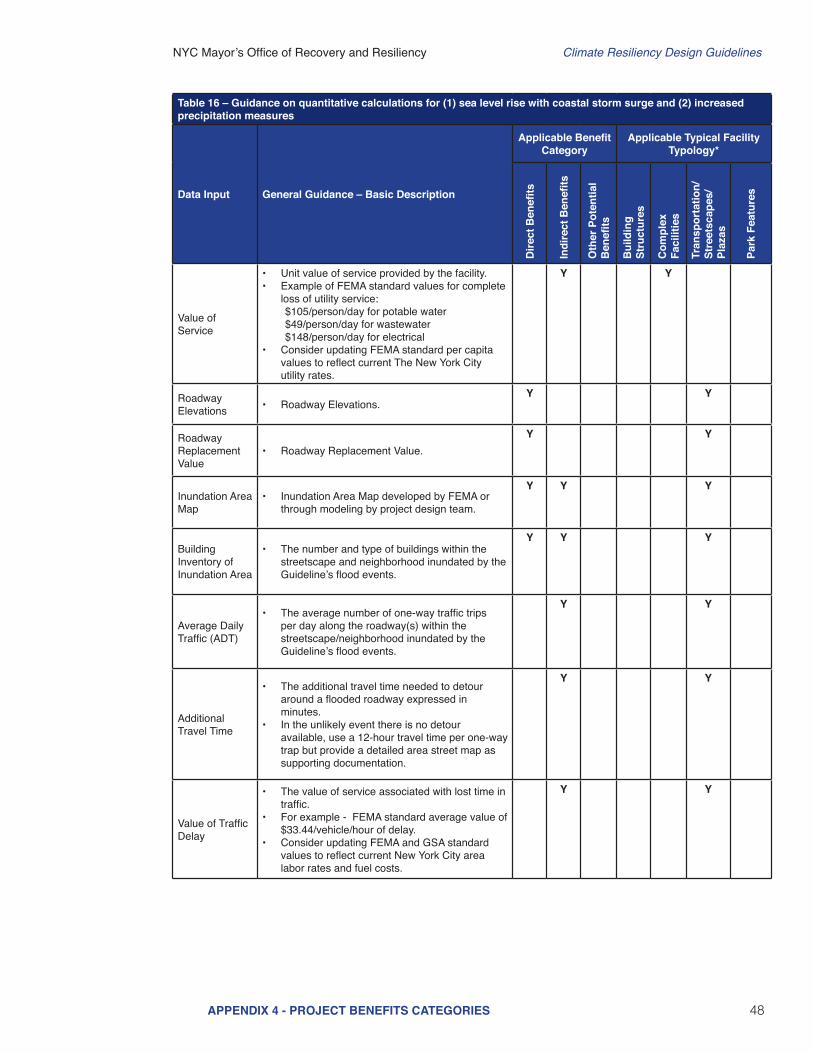
NYC Mayorrsquos Office of Recovery and Resiliency Climate Resiliency Design Guidelines
48APPENDIX 4 - PROJECT BENEFITS CATEGORIES
Table 16 ndash Guidance on quantitative calculations for (1) sea level rise with coastal storm surge and (2) increased precipitation measures
Data Input General Guidance ndash Basic Description
Applicable Benefit Category
Applicable Typical Facility Typology
Dire
ct B
enefi
ts
Indi
rect
Ben
efits
Oth
er P
oten
tial
Ben
efits
Bui
ldin
g St
ruct
ures
Com
plex
Fa
cilit
ies
Tran
spor
tatio
nSt
reet
scap
es
Plaz
as
Park
Fea
ture
s
Value of Service
bull Unit value of service provided by the facilitybull Example of FEMA standard values for complete
loss of utility service $105personday for potable water$49personday for wastewater$148personday for electrical
bull Consider updating FEMA standard per capita values to reflect current The New York City utility rates
Y Y
Roadway Elevations bull Roadway Elevations
Y Y
Roadway Replacement Value
bull Roadway Replacement ValueY Y
Inundation Area Map
bull Inundation Area Map developed by FEMA or through modeling by project design team
Y Y Y
Building Inventory of Inundation Area
bull The number and type of buildings within the streetscape and neighborhood inundated by the Guidelinersquos flood events
Y Y Y
Average Daily Traffic (ADT)
bull The average number of one-way traffic trips per day along the roadway(s) within the streetscapeneighborhood inundated by the Guidelinersquos flood events
Y Y
Additional Travel Time
bull The additional travel time needed to detour around a flooded roadway expressed in minutes
bull In the unlikely event there is no detour available use a 12-hour travel time per one-way trap but provide a detailed area street map as supporting documentation
Y Y
Value of Traffic Delay
bull The value of service associated with lost time in traffic
bull For example - FEMA standard average value of $3344vehiclehour of delay
bull Consider updating FEMA and GSA standard values to reflect current New York City area labor rates and fuel costs
Y Y
NYC Mayorrsquos Office of Recovery and Resiliency Climate Resiliency Design Guidelines
49APPENDIX 4 - PROJECT BENEFITS CATEGORIES
Table 17 ndash Guidance on quantitative unit benefit calculations for extreme heat hazard measures
Measure General Guidance ndash Unit Benefit Information and Data Requirements
Applicable Benefit Category
Applicable Typical Facility Typology
Dire
ct B
enefi
ts
Indi
rect
Ben
efits
Oth
er P
oten
tial
Ben
efits
Bui
ldin
g St
ruct
ures
Com
plex
Fa
cilit
ies
Tran
spor
tatio
nSt
reet
scap
es
Plaz
as
Park
Fea
ture
s
Green Roof
bull Unit benefit range over PUL = $470SF to $373SF of green roof area ($719SF standard value)
bull Assumed PUL = 40 yearsbull Apply standard value unit benefit to green
roof area to estimate measure benefitbull Higher range values more applicable
to residential and commercial building streetscape projects
Y Y Y Y Y Y
Bioswale Rain Garden Meadow Mix
bull Unit benefit range over PUL = $396SF to $211SF of area ($730SF standard value)
bull Assumed PUL = 30 yearsbull Apply standard value unit benefit to bioswale
rain gardenmeadow mix area to estimate total measure benefit
Y Y Y Y Y Y
Cool Roof
bull Unit benefit range over PUL = $117 to $3151SF of material area ($144SF standard value)
bull Assumed PUL = 20 yearsbull Apply standard value unit benefit to cool roof
area to estimate total measure benefitbull Higher range values more applicable to
residential building streetscape projects
Y Y Y Y Y
Light-Colored PaversLight-Colored Materials
bull Unit benefit range over PUL = $0774 to $204SF of material area ($0866SF standard value)
bull Assumed PUL = 30 yearsbull Apply standard value unit benefit to material
area to estimate total measure benefit
Y Y Y Y
Table 17 provides general guidance on how to quantitatively calculate benefits from efforts to address climate stressors See Section IIIE for more information
NYC Mayorrsquos Office of Recovery and Resiliency Climate Resiliency Design Guidelines
50APPENDIX 4 - PROJECT BENEFITS CATEGORIES
Table 17 ndash Guidance on quantitative unit benefit calculations for extreme heat hazard measures
Measure General Guidance ndash Unit Benefit Information and Data Requirements
Applicable Benefit Category
Applicable Typical Facility Typology
Dire
ct B
enefi
ts
Indi
rect
Ben
efits
Oth
er P
oten
tial
Ben
efits
Bui
ldin
g St
ruct
ures
Com
plex
Fa
cilit
ies
Tran
spor
tatio
nSt
reet
scap
es
Plaz
as
Park
Fea
ture
s
Tree Planting
bull Unit benefit range over PUL = $1005 to $77154Tree ($1855Tree standard value)
bull Assumed PUL = 30 yearsbull Apply standard value unit benefit to number of
trees to estimate total measure benefitbull Higher range values more applicable
to residential and commercial building streetscape projects
Y Y Y Y Y Y
Planter Box Tree
bull Unit benefit range over PUL = $212 to 16304Tree ($392Tree standard value)
bull Assumed PUL = 15 yearsbull Apply standard value unit benefit to number of
trees to estimate total measure benefitbull Higher range values more applicable
to residential and commercial building streetscape projects
Y Y Y Y Y
Shade Canopy
bull Unit benefit range over PUL = $0363 to $396SF ($0458SF standard value)
bull Assumed PUL = 15 yearsbull Apply standard value unit benefit to area of
shade canopy estimate total measure benefitbull Higher range values more applicable
to residential and commercial building streetscape projects
Y Y Y Y
Permeable Grass Pavers
bull Unit benefit range over PUL = $0258SF to $0521SF of pavers ($0363SF standard value)
bull Assumed PUL = 30 yearsbull Apply standard value unit benefit to paver
area to estimate total measure benefit
Y Y Y Y Y
For the purposes of the BCA refer to the following facility typologies bull ldquoBuilding Structuresrdquo include critical small building sites such as EMS or FDNY stations and non-critical small building sites such as
libraries or comfort stationsbull ldquoComplex Facilitiesrdquo include critical infrastructure such as wastewater treatment sites pump stations water filtration plants and similar
large or complex facilitiesbull ldquoTransportationStreetscapePlazasrdquo include roadway reconstruction streetscape improvements street raising plazas and other
transportation-related infrastructurebull ldquoPark Featuresrdquo include parks and similar public recreational facility with natural landscape features
NYC Mayorrsquos Office of Recovery and Resiliency Climate Resiliency Design Guidelines
51APPENDIX 5 - EXAMPLE PLANNING DECISION TREE
This decision tree provides a summarized example approach for how to implement these Guidelines Projects with a total cost greater than $50 million are recommended to conduct a full qualitative and quantitative climate change risk assessment and BCA while projects below $50 million are recommended to conduct a qualitative risk assessment and BCA
Define Project
1) Operational goals and criticality level2) Useful life3) Location in the current flood plain future floodplain and or zone
of tidal inundation and the project arearsquos score on the heat vulnerability index
Evaluate Project Risks According to Probability and Magnitude of Consequence
bull Extreme Heat bull Precipitationbull Sea Level Risebull Coastal Surge
High Level Identification and Assessment of Risk Mitigation Alternatives and Co-benefits
(qualitative)
Detailed Identification and Assessment of Risk Mitigation Alternatives and Co-benefits (qualitative and quantitative)
High Level Estimate of Costs and Benefits of Design Alternatives
(qualitative)
Detailed Estimate of Costs and Benefits of Design Alternatives
(qualitative and quantitative)
Decision Point Which climate change risks require mitigation
Decision Point Evaluate risk mitigation benefits and costs to
determine final resilient design alternative or if no action is required
Decision Point Is the total project cost above $50 million
Below $50 million Above $50 million
APPENDIX 5 - EXAMPLE PLANNING DECISION TREE
NYC Mayorrsquos Office of Recovery and Resiliency Climate Resiliency Design Guidelines
52
Project Title
Design Strategies Checklist (not exhaustive)
Extreme Heat Comments Extreme Precipitation Comments Sea Level Rise amp Storm Surge Comments
Select Site in Low Heat Vulnerability Index area Select High Elevation Site Select High Elevation Site
Minimize East-West Building Orientation Green Roof Raise Building Floor Elevation
Passive Solar Cooling and Ventilation Systems
Protect Below Grade Areas from Flooding Waterproof Building Envelope
Cool Roof (SRI appropriate) On-site Stormwater Management (gray) Elevate Critical Building Functions
Green Roof (extensive) Reduce Impervious Areas Elevate Critical Equipment
Vegetative Structures Permeable Pavement Perimeter Floodwall100 Levee (passive or active)
Enhanced HVAC System including space layout optimization and system scalability
Increase Green Spaces and Planted Areas DryWet Floodproofing
More Efficient Building Envelope Other Utility Redundancy Design101
Parking Lot Shading Resilient Materials amp Landscape Treatments
Light Colored Pavements (appropriate SRI) Design for Storm Surge Outflow
Increase Planted Areas Install Backwater Flow Prevention
Permeable Surfaces Design for Scour
Open-grid Pavement Raise Road Elevation
Other Other
This appendix provides a template for identifying possible design strategies to address climate change risks as described throughout the Guidelines
APPENDIX 6 - DESIGN STRATEGIES CHECKLIST
100 Permanent perimeter flood walls are not permitted to meet floodproofing requirements in buildings with substantial improvements andor damages 101 Utility redundancy design should be pursued for critical systems not all building systems
APPENDIX 6 - DESIGN STRATEGIES CHECKLIST
NYC Mayorrsquos Office of Recovery and Resiliency Climate Resiliency Design Guidelines
53APPENDIX 7 - CLIMATE CHANGE RISK ASSESSMENT RESOURCES
These Guidelines provide data on climate change hazards and recommend how that data can inform resilient design A risk assessment is a tool to help project managers and designers evaluate risk levels as well as select and prioritize resilient design strategies A high level risk assessment is recommended for all City capital projects with a total cost of under $50 million Projects above $50 million are recommended to conduct an in-depth assessment
Risk assessments use quantified estimates of the probability and magnitude of consequence of an event occurring to prioritize responses ldquoProbabilityrdquo is an assessment of the likelihood of a hazard occurring while ldquomagnituderdquo describes the hazardrsquos potential impact Risk assessment tools such as the examples listed below can be used to define and score these categories Projects that score higher across both probability and magnitude can be prioritized for investment and risk mitigation action Projects that score lower across both criteria may require no action beyond meeting code The results are typically charted on a risk matrix and an example is provided on the next page
The climate change risk management frameworks below offer templates for how to integrate climate change projections into a risk assessment process Refer to these resources for examples and further information
bull Vulnerability Assessment and Adaptation Framework is prepared by the Federal Highway Administration (FHWA) While developed for transportation planning this risk assessment framework has broad applicability for evaluating asset vulnerability to climate change Available at httpswwwfhwadotgovenvironmentsustainabilityresilienceadaptation_framework
bull US Climate Resilience Toolkit The US Global Change Research Program offers a step by step risk assessment
framework including tools and case studies at httpstoolkitclimategovsteps (see example on next page)
bull Coast Adapt Guidance on undertaking a risk assessment High level assessment httpscoastadaptcomausitesdefaultfilesfactsheetsT3M4_2_2nd_pass_risk_assessmentpdfDetailed assessment httpscoastadaptcomausitesdefaultfilesfactsheetsT3M4_3_3rd_pass_risk_assessmentpdf
bull Climate adaptation Risk uncertainty and decision-makingDownload the report here httpswwwukciporgukpublicationsRisk
The City plans to develop a NYC-specific process for integrating climate change data into existing risk management processes by April 2019
APPENDIX 7 - CLIMATE CHANGE RISK ASSESSMENT RESOURCES
NYC Mayorrsquos Office of Recovery and Resiliency Climate Resiliency Design Guidelines
54APPENDIX 7 - CLIMATE CHANGE RISK ASSESSMENT RESOURCES
The Risk Characterization Matrix below is an example from the US Climate Resilience Toolkit This tool can be used to assess the probability and magnitude of impact for identified risks The risk of coincident climate stressorsrisks (such as storm surge plus increased precipitation) can also be assessed as applicable
Figure 14 - Example of a climate change risk matrix (adapted from US Climate Resilience Toolkit)
Project teams can determine the magnitude of the impact (along the horizontal scale of 1 through 3 with 3 being the most severe) and the probabilitylikelihood of occurrence for each specific risk (along the vertical scale with 3 being the most likely) A score is typically assigned for each risk (Probabil-ity x Magnitude) and then charted on the matrix Based on the estimated probability and magnitude of consequence above the risks are ranked and prioritized for mitigation Factors to bear in mind include
bull Not all facility typologies have the same level of functional and operational importance during events or tolerance for disruption
bull Not all climate stressors and risks have the same level of impact on each project sitebull Not all identified risks can or should be mitigated fully
NYC Mayorrsquos Office of Recovery and Resiliency Climate Resiliency Design Guidelines
55WORKS CITED
A Stronger More Resilient New York PlaNYC Report of the NYC Special Initiative for Rebuilding and Resiliency The City of New York 2013
ldquoAccount for Climate Riskrdquo International Finance Corporation accessed March 27 2017 httpwwwifcorgwpswcmconnectTopics_Ext_ContentIFC_External_Corporate_SiteClimate+Business
PrioritiesAccount+for+Climate+Risk
American Society of Heating Refrigeration and Air-Conditioning Engineers (ASHRAE) Handbook -Fundamentals 2017
ldquoBaseline Standard Economic Value Methodology Reportrdquo Federal Emergency Management Agency July 2016
Benefit Cost Analysis Toolkit Software Version 530 Federal Emergency Management Agency (build date December 2016)
Criteria for Detention Facility Design New York City Department of Environmental Protection November 2012
Community Resilience Planning Guide for Buildings and Infrastructure Systems Vol 1 NIST Special Publication 1190 US Department of Commerce 2016
Cool and Green Roofing Manual NYC Department of Design and Construction 2007 httpwwwnycgovhtmlddcdownloadspdfcool_green_roof_manpdf
Building Resiliency Task Force US Urban Green Building Council New York 2013 httpurbangreencouncilforcecomBuildingResiliency
Design and Planning for Flood Resiliency Guidelines for NYC Parks New York City Department of Parks and Recreation 2017
httpswwwnycgovparksorgplanning-and-buildingplanningresiliency-plansflood-resiliency
Flooded Bus Barns and Buckled Rails Federal Transit Administration Office of Budget and Policy 2011 httpswwwhsdlorgabstractampdid=685187
Floodproofing Non-Residential Buildings FEMA P936 FEMA 2013 httpswwwfemagovmedia-library-data9a50c534fc5895799321dcdd4b6083e7P-936_8-20-13_508rpdf
ldquoGlossaryrdquo International Infrastructure Management Manual National Asset Management Support Group New Zealand 2011 httpwwwipweaorg
ldquoGreen Roof Metrics Draft Reportrdquo New York City Department of Parks and Recreation 2017
ldquoGuide to Rain Event Preparednessrdquo NYC Department of Environmental Protection httpwwwnycgovhtmldeppdfbrochuresflood-preparedness-flyerpdf
ldquoGuidelines and Discount Rates for Benefit-Cost Analysis of Federal Programsrdquo Appendix C Circular A-94 US Office of Management and Budget (OMB) 2017
ldquoGuidelines for the Design and Construction of Stormwater Management Systemsrdquo New York City Department of Environmental Protection July 2012
Horton R et al New York City Panel on Climate Change 2015 Report Ann NY Acad Sci ISSN 0077-892 New York 2015
Madrigano J et al ldquoA case-only study of vulnerability to heat wavendashrelated mortality in New York City (2000ndash2011)rdquo Environmental Health Perspectives 123672ndash678 2013
WORKS CITED
NYC Mayorrsquos Office of Recovery and Resiliency Climate Resiliency Design Guidelines
56WORKS CITED
enspMcGregor et al Two Degrees The Built Environment and Our Changing Climate Routledge Press 2013
NYC Green Codes Task Force US Green Building Council New York 2010 httpurbangreencouncilorgGreenCodes
NYCrsquos Risk Landscape A Guide to Hazard Mitigation NYC Emergency Management 2014
One New York The Plan for a Strong and Just City The City of New York 2015 httpwwwnycgovhtmlonenyc downloadspdfpublicationsOneNYCpdf
Ready to Respond Strategies for Multifamily Building Resilience Enterprise Green Communities 2015 httpswwwenterprisecommunityorgresources
Rosenzweig C et al Climate Change Adaptation in New York City Building a Risk Management Response New York City Panel on Climate Change 2010
httponlinelibrarywileycomdoi101111nyas20101196issue-1 issuetoc
ldquoSustainable Infrastructure Management Program Learning Environmentrdquo Water Environment Research Foundation accessed March 24 2017 httpsimplewerforg
Urban Waterfront Adaptive Strategies NYC Department of City Planning 2013 httpwww1nycgovsiteplanningplanssustainable-communitiesclimate-resiliencepagetab=1
Wastewater Resiliency Plan Climate Risk Assessment and Adaptation Study New York City Department of Environmental Protection October 2013
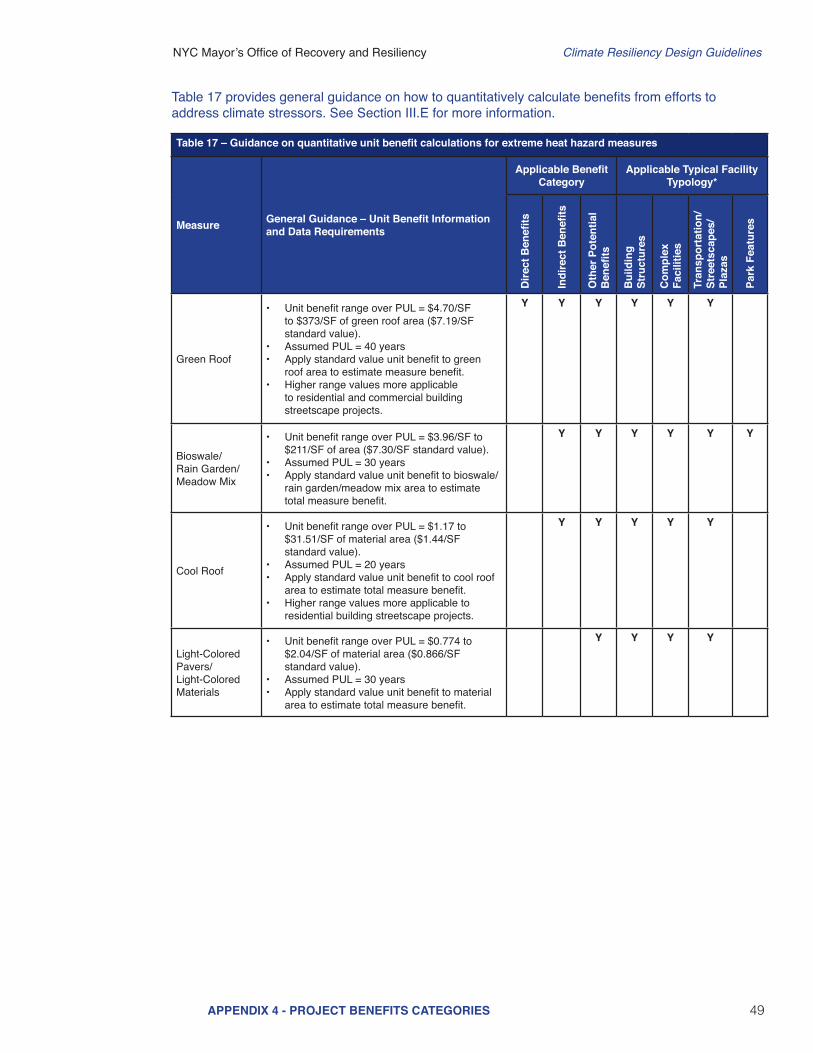
NYC Mayorrsquos Office of Recovery and Resiliency Climate Resiliency Design Guidelines
49APPENDIX 4 - PROJECT BENEFITS CATEGORIES
Table 17 ndash Guidance on quantitative unit benefit calculations for extreme heat hazard measures
Measure General Guidance ndash Unit Benefit Information and Data Requirements
Applicable Benefit Category
Applicable Typical Facility Typology
Dire
ct B
enefi
ts
Indi
rect
Ben
efits
Oth
er P
oten
tial
Ben
efits
Bui
ldin
g St
ruct
ures
Com
plex
Fa
cilit
ies
Tran
spor
tatio
nSt
reet
scap
es
Plaz
as
Park
Fea
ture
s
Green Roof
bull Unit benefit range over PUL = $470SF to $373SF of green roof area ($719SF standard value)
bull Assumed PUL = 40 yearsbull Apply standard value unit benefit to green
roof area to estimate measure benefitbull Higher range values more applicable
to residential and commercial building streetscape projects
Y Y Y Y Y Y
Bioswale Rain Garden Meadow Mix
bull Unit benefit range over PUL = $396SF to $211SF of area ($730SF standard value)
bull Assumed PUL = 30 yearsbull Apply standard value unit benefit to bioswale
rain gardenmeadow mix area to estimate total measure benefit
Y Y Y Y Y Y
Cool Roof
bull Unit benefit range over PUL = $117 to $3151SF of material area ($144SF standard value)
bull Assumed PUL = 20 yearsbull Apply standard value unit benefit to cool roof
area to estimate total measure benefitbull Higher range values more applicable to
residential building streetscape projects
Y Y Y Y Y
Light-Colored PaversLight-Colored Materials
bull Unit benefit range over PUL = $0774 to $204SF of material area ($0866SF standard value)
bull Assumed PUL = 30 yearsbull Apply standard value unit benefit to material
area to estimate total measure benefit
Y Y Y Y
Table 17 provides general guidance on how to quantitatively calculate benefits from efforts to address climate stressors See Section IIIE for more information
NYC Mayorrsquos Office of Recovery and Resiliency Climate Resiliency Design Guidelines
50APPENDIX 4 - PROJECT BENEFITS CATEGORIES
Table 17 ndash Guidance on quantitative unit benefit calculations for extreme heat hazard measures
Measure General Guidance ndash Unit Benefit Information and Data Requirements
Applicable Benefit Category
Applicable Typical Facility Typology
Dire
ct B
enefi
ts
Indi
rect
Ben
efits
Oth
er P
oten
tial
Ben
efits
Bui
ldin
g St
ruct
ures
Com
plex
Fa
cilit
ies
Tran
spor
tatio
nSt
reet
scap
es
Plaz
as
Park
Fea
ture
s
Tree Planting
bull Unit benefit range over PUL = $1005 to $77154Tree ($1855Tree standard value)
bull Assumed PUL = 30 yearsbull Apply standard value unit benefit to number of
trees to estimate total measure benefitbull Higher range values more applicable
to residential and commercial building streetscape projects
Y Y Y Y Y Y
Planter Box Tree
bull Unit benefit range over PUL = $212 to 16304Tree ($392Tree standard value)
bull Assumed PUL = 15 yearsbull Apply standard value unit benefit to number of
trees to estimate total measure benefitbull Higher range values more applicable
to residential and commercial building streetscape projects
Y Y Y Y Y
Shade Canopy
bull Unit benefit range over PUL = $0363 to $396SF ($0458SF standard value)
bull Assumed PUL = 15 yearsbull Apply standard value unit benefit to area of
shade canopy estimate total measure benefitbull Higher range values more applicable
to residential and commercial building streetscape projects
Y Y Y Y
Permeable Grass Pavers
bull Unit benefit range over PUL = $0258SF to $0521SF of pavers ($0363SF standard value)
bull Assumed PUL = 30 yearsbull Apply standard value unit benefit to paver
area to estimate total measure benefit
Y Y Y Y Y
For the purposes of the BCA refer to the following facility typologies bull ldquoBuilding Structuresrdquo include critical small building sites such as EMS or FDNY stations and non-critical small building sites such as
libraries or comfort stationsbull ldquoComplex Facilitiesrdquo include critical infrastructure such as wastewater treatment sites pump stations water filtration plants and similar
large or complex facilitiesbull ldquoTransportationStreetscapePlazasrdquo include roadway reconstruction streetscape improvements street raising plazas and other
transportation-related infrastructurebull ldquoPark Featuresrdquo include parks and similar public recreational facility with natural landscape features
NYC Mayorrsquos Office of Recovery and Resiliency Climate Resiliency Design Guidelines
51APPENDIX 5 - EXAMPLE PLANNING DECISION TREE
This decision tree provides a summarized example approach for how to implement these Guidelines Projects with a total cost greater than $50 million are recommended to conduct a full qualitative and quantitative climate change risk assessment and BCA while projects below $50 million are recommended to conduct a qualitative risk assessment and BCA
Define Project
1) Operational goals and criticality level2) Useful life3) Location in the current flood plain future floodplain and or zone
of tidal inundation and the project arearsquos score on the heat vulnerability index
Evaluate Project Risks According to Probability and Magnitude of Consequence
bull Extreme Heat bull Precipitationbull Sea Level Risebull Coastal Surge
High Level Identification and Assessment of Risk Mitigation Alternatives and Co-benefits
(qualitative)
Detailed Identification and Assessment of Risk Mitigation Alternatives and Co-benefits (qualitative and quantitative)
High Level Estimate of Costs and Benefits of Design Alternatives
(qualitative)
Detailed Estimate of Costs and Benefits of Design Alternatives
(qualitative and quantitative)
Decision Point Which climate change risks require mitigation
Decision Point Evaluate risk mitigation benefits and costs to
determine final resilient design alternative or if no action is required
Decision Point Is the total project cost above $50 million
Below $50 million Above $50 million
APPENDIX 5 - EXAMPLE PLANNING DECISION TREE
NYC Mayorrsquos Office of Recovery and Resiliency Climate Resiliency Design Guidelines
52
Project Title
Design Strategies Checklist (not exhaustive)
Extreme Heat Comments Extreme Precipitation Comments Sea Level Rise amp Storm Surge Comments
Select Site in Low Heat Vulnerability Index area Select High Elevation Site Select High Elevation Site
Minimize East-West Building Orientation Green Roof Raise Building Floor Elevation
Passive Solar Cooling and Ventilation Systems
Protect Below Grade Areas from Flooding Waterproof Building Envelope
Cool Roof (SRI appropriate) On-site Stormwater Management (gray) Elevate Critical Building Functions
Green Roof (extensive) Reduce Impervious Areas Elevate Critical Equipment
Vegetative Structures Permeable Pavement Perimeter Floodwall100 Levee (passive or active)
Enhanced HVAC System including space layout optimization and system scalability
Increase Green Spaces and Planted Areas DryWet Floodproofing
More Efficient Building Envelope Other Utility Redundancy Design101
Parking Lot Shading Resilient Materials amp Landscape Treatments
Light Colored Pavements (appropriate SRI) Design for Storm Surge Outflow
Increase Planted Areas Install Backwater Flow Prevention
Permeable Surfaces Design for Scour
Open-grid Pavement Raise Road Elevation
Other Other
This appendix provides a template for identifying possible design strategies to address climate change risks as described throughout the Guidelines
APPENDIX 6 - DESIGN STRATEGIES CHECKLIST
100 Permanent perimeter flood walls are not permitted to meet floodproofing requirements in buildings with substantial improvements andor damages 101 Utility redundancy design should be pursued for critical systems not all building systems
APPENDIX 6 - DESIGN STRATEGIES CHECKLIST
NYC Mayorrsquos Office of Recovery and Resiliency Climate Resiliency Design Guidelines
53APPENDIX 7 - CLIMATE CHANGE RISK ASSESSMENT RESOURCES
These Guidelines provide data on climate change hazards and recommend how that data can inform resilient design A risk assessment is a tool to help project managers and designers evaluate risk levels as well as select and prioritize resilient design strategies A high level risk assessment is recommended for all City capital projects with a total cost of under $50 million Projects above $50 million are recommended to conduct an in-depth assessment
Risk assessments use quantified estimates of the probability and magnitude of consequence of an event occurring to prioritize responses ldquoProbabilityrdquo is an assessment of the likelihood of a hazard occurring while ldquomagnituderdquo describes the hazardrsquos potential impact Risk assessment tools such as the examples listed below can be used to define and score these categories Projects that score higher across both probability and magnitude can be prioritized for investment and risk mitigation action Projects that score lower across both criteria may require no action beyond meeting code The results are typically charted on a risk matrix and an example is provided on the next page
The climate change risk management frameworks below offer templates for how to integrate climate change projections into a risk assessment process Refer to these resources for examples and further information
bull Vulnerability Assessment and Adaptation Framework is prepared by the Federal Highway Administration (FHWA) While developed for transportation planning this risk assessment framework has broad applicability for evaluating asset vulnerability to climate change Available at httpswwwfhwadotgovenvironmentsustainabilityresilienceadaptation_framework
bull US Climate Resilience Toolkit The US Global Change Research Program offers a step by step risk assessment
framework including tools and case studies at httpstoolkitclimategovsteps (see example on next page)
bull Coast Adapt Guidance on undertaking a risk assessment High level assessment httpscoastadaptcomausitesdefaultfilesfactsheetsT3M4_2_2nd_pass_risk_assessmentpdfDetailed assessment httpscoastadaptcomausitesdefaultfilesfactsheetsT3M4_3_3rd_pass_risk_assessmentpdf
bull Climate adaptation Risk uncertainty and decision-makingDownload the report here httpswwwukciporgukpublicationsRisk
The City plans to develop a NYC-specific process for integrating climate change data into existing risk management processes by April 2019
APPENDIX 7 - CLIMATE CHANGE RISK ASSESSMENT RESOURCES
NYC Mayorrsquos Office of Recovery and Resiliency Climate Resiliency Design Guidelines
54APPENDIX 7 - CLIMATE CHANGE RISK ASSESSMENT RESOURCES
The Risk Characterization Matrix below is an example from the US Climate Resilience Toolkit This tool can be used to assess the probability and magnitude of impact for identified risks The risk of coincident climate stressorsrisks (such as storm surge plus increased precipitation) can also be assessed as applicable
Figure 14 - Example of a climate change risk matrix (adapted from US Climate Resilience Toolkit)
Project teams can determine the magnitude of the impact (along the horizontal scale of 1 through 3 with 3 being the most severe) and the probabilitylikelihood of occurrence for each specific risk (along the vertical scale with 3 being the most likely) A score is typically assigned for each risk (Probabil-ity x Magnitude) and then charted on the matrix Based on the estimated probability and magnitude of consequence above the risks are ranked and prioritized for mitigation Factors to bear in mind include
bull Not all facility typologies have the same level of functional and operational importance during events or tolerance for disruption
bull Not all climate stressors and risks have the same level of impact on each project sitebull Not all identified risks can or should be mitigated fully
NYC Mayorrsquos Office of Recovery and Resiliency Climate Resiliency Design Guidelines
55WORKS CITED
A Stronger More Resilient New York PlaNYC Report of the NYC Special Initiative for Rebuilding and Resiliency The City of New York 2013
ldquoAccount for Climate Riskrdquo International Finance Corporation accessed March 27 2017 httpwwwifcorgwpswcmconnectTopics_Ext_ContentIFC_External_Corporate_SiteClimate+Business
PrioritiesAccount+for+Climate+Risk
American Society of Heating Refrigeration and Air-Conditioning Engineers (ASHRAE) Handbook -Fundamentals 2017
ldquoBaseline Standard Economic Value Methodology Reportrdquo Federal Emergency Management Agency July 2016
Benefit Cost Analysis Toolkit Software Version 530 Federal Emergency Management Agency (build date December 2016)
Criteria for Detention Facility Design New York City Department of Environmental Protection November 2012
Community Resilience Planning Guide for Buildings and Infrastructure Systems Vol 1 NIST Special Publication 1190 US Department of Commerce 2016
Cool and Green Roofing Manual NYC Department of Design and Construction 2007 httpwwwnycgovhtmlddcdownloadspdfcool_green_roof_manpdf
Building Resiliency Task Force US Urban Green Building Council New York 2013 httpurbangreencouncilforcecomBuildingResiliency
Design and Planning for Flood Resiliency Guidelines for NYC Parks New York City Department of Parks and Recreation 2017
httpswwwnycgovparksorgplanning-and-buildingplanningresiliency-plansflood-resiliency
Flooded Bus Barns and Buckled Rails Federal Transit Administration Office of Budget and Policy 2011 httpswwwhsdlorgabstractampdid=685187
Floodproofing Non-Residential Buildings FEMA P936 FEMA 2013 httpswwwfemagovmedia-library-data9a50c534fc5895799321dcdd4b6083e7P-936_8-20-13_508rpdf
ldquoGlossaryrdquo International Infrastructure Management Manual National Asset Management Support Group New Zealand 2011 httpwwwipweaorg
ldquoGreen Roof Metrics Draft Reportrdquo New York City Department of Parks and Recreation 2017
ldquoGuide to Rain Event Preparednessrdquo NYC Department of Environmental Protection httpwwwnycgovhtmldeppdfbrochuresflood-preparedness-flyerpdf
ldquoGuidelines and Discount Rates for Benefit-Cost Analysis of Federal Programsrdquo Appendix C Circular A-94 US Office of Management and Budget (OMB) 2017
ldquoGuidelines for the Design and Construction of Stormwater Management Systemsrdquo New York City Department of Environmental Protection July 2012
Horton R et al New York City Panel on Climate Change 2015 Report Ann NY Acad Sci ISSN 0077-892 New York 2015
Madrigano J et al ldquoA case-only study of vulnerability to heat wavendashrelated mortality in New York City (2000ndash2011)rdquo Environmental Health Perspectives 123672ndash678 2013
WORKS CITED
NYC Mayorrsquos Office of Recovery and Resiliency Climate Resiliency Design Guidelines
56WORKS CITED
enspMcGregor et al Two Degrees The Built Environment and Our Changing Climate Routledge Press 2013
NYC Green Codes Task Force US Green Building Council New York 2010 httpurbangreencouncilorgGreenCodes
NYCrsquos Risk Landscape A Guide to Hazard Mitigation NYC Emergency Management 2014
One New York The Plan for a Strong and Just City The City of New York 2015 httpwwwnycgovhtmlonenyc downloadspdfpublicationsOneNYCpdf
Ready to Respond Strategies for Multifamily Building Resilience Enterprise Green Communities 2015 httpswwwenterprisecommunityorgresources
Rosenzweig C et al Climate Change Adaptation in New York City Building a Risk Management Response New York City Panel on Climate Change 2010
httponlinelibrarywileycomdoi101111nyas20101196issue-1 issuetoc
ldquoSustainable Infrastructure Management Program Learning Environmentrdquo Water Environment Research Foundation accessed March 24 2017 httpsimplewerforg
Urban Waterfront Adaptive Strategies NYC Department of City Planning 2013 httpwww1nycgovsiteplanningplanssustainable-communitiesclimate-resiliencepagetab=1
Wastewater Resiliency Plan Climate Risk Assessment and Adaptation Study New York City Department of Environmental Protection October 2013
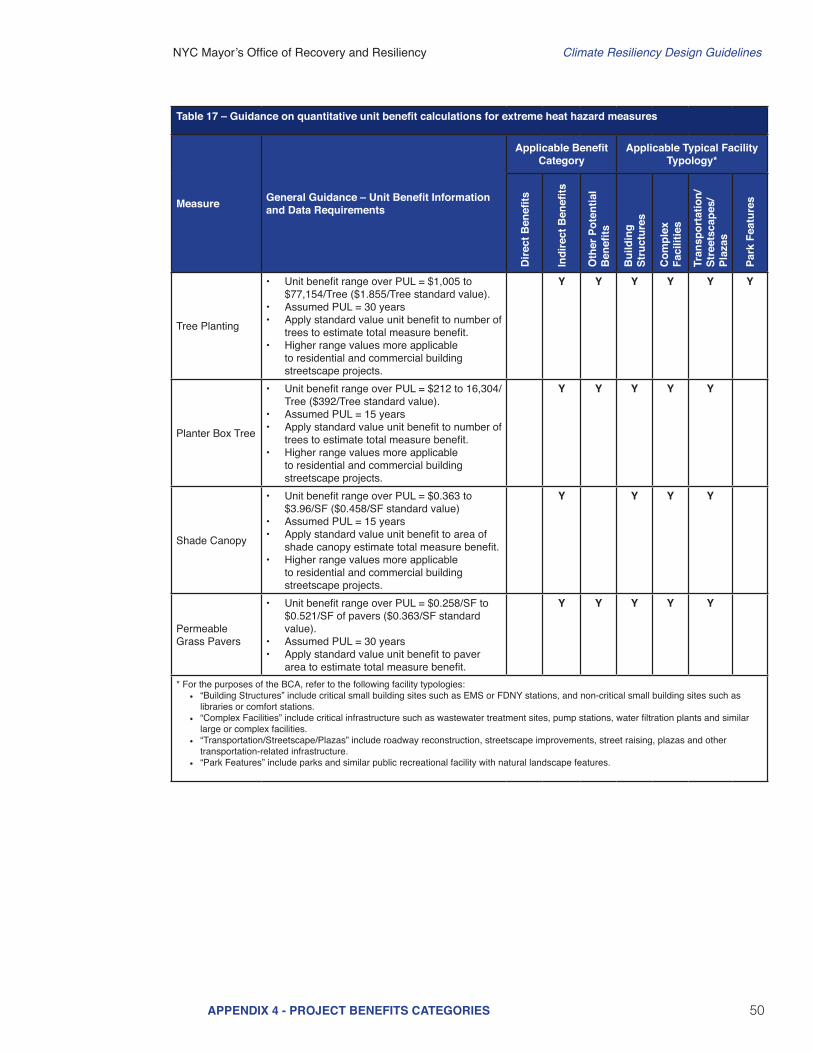
NYC Mayorrsquos Office of Recovery and Resiliency Climate Resiliency Design Guidelines
50APPENDIX 4 - PROJECT BENEFITS CATEGORIES
Table 17 ndash Guidance on quantitative unit benefit calculations for extreme heat hazard measures
Measure General Guidance ndash Unit Benefit Information and Data Requirements
Applicable Benefit Category
Applicable Typical Facility Typology
Dire
ct B
enefi
ts
Indi
rect
Ben
efits
Oth
er P
oten
tial
Ben
efits
Bui
ldin
g St
ruct
ures
Com
plex
Fa
cilit
ies
Tran
spor
tatio
nSt
reet
scap
es
Plaz
as
Park
Fea
ture
s
Tree Planting
bull Unit benefit range over PUL = $1005 to $77154Tree ($1855Tree standard value)
bull Assumed PUL = 30 yearsbull Apply standard value unit benefit to number of
trees to estimate total measure benefitbull Higher range values more applicable
to residential and commercial building streetscape projects
Y Y Y Y Y Y
Planter Box Tree
bull Unit benefit range over PUL = $212 to 16304Tree ($392Tree standard value)
bull Assumed PUL = 15 yearsbull Apply standard value unit benefit to number of
trees to estimate total measure benefitbull Higher range values more applicable
to residential and commercial building streetscape projects
Y Y Y Y Y
Shade Canopy
bull Unit benefit range over PUL = $0363 to $396SF ($0458SF standard value)
bull Assumed PUL = 15 yearsbull Apply standard value unit benefit to area of
shade canopy estimate total measure benefitbull Higher range values more applicable
to residential and commercial building streetscape projects
Y Y Y Y
Permeable Grass Pavers
bull Unit benefit range over PUL = $0258SF to $0521SF of pavers ($0363SF standard value)
bull Assumed PUL = 30 yearsbull Apply standard value unit benefit to paver
area to estimate total measure benefit
Y Y Y Y Y
For the purposes of the BCA refer to the following facility typologies bull ldquoBuilding Structuresrdquo include critical small building sites such as EMS or FDNY stations and non-critical small building sites such as
libraries or comfort stationsbull ldquoComplex Facilitiesrdquo include critical infrastructure such as wastewater treatment sites pump stations water filtration plants and similar
large or complex facilitiesbull ldquoTransportationStreetscapePlazasrdquo include roadway reconstruction streetscape improvements street raising plazas and other
transportation-related infrastructurebull ldquoPark Featuresrdquo include parks and similar public recreational facility with natural landscape features
NYC Mayorrsquos Office of Recovery and Resiliency Climate Resiliency Design Guidelines
51APPENDIX 5 - EXAMPLE PLANNING DECISION TREE
This decision tree provides a summarized example approach for how to implement these Guidelines Projects with a total cost greater than $50 million are recommended to conduct a full qualitative and quantitative climate change risk assessment and BCA while projects below $50 million are recommended to conduct a qualitative risk assessment and BCA
Define Project
1) Operational goals and criticality level2) Useful life3) Location in the current flood plain future floodplain and or zone
of tidal inundation and the project arearsquos score on the heat vulnerability index
Evaluate Project Risks According to Probability and Magnitude of Consequence
bull Extreme Heat bull Precipitationbull Sea Level Risebull Coastal Surge
High Level Identification and Assessment of Risk Mitigation Alternatives and Co-benefits
(qualitative)
Detailed Identification and Assessment of Risk Mitigation Alternatives and Co-benefits (qualitative and quantitative)
High Level Estimate of Costs and Benefits of Design Alternatives
(qualitative)
Detailed Estimate of Costs and Benefits of Design Alternatives
(qualitative and quantitative)
Decision Point Which climate change risks require mitigation
Decision Point Evaluate risk mitigation benefits and costs to
determine final resilient design alternative or if no action is required
Decision Point Is the total project cost above $50 million
Below $50 million Above $50 million
APPENDIX 5 - EXAMPLE PLANNING DECISION TREE
NYC Mayorrsquos Office of Recovery and Resiliency Climate Resiliency Design Guidelines
52
Project Title
Design Strategies Checklist (not exhaustive)
Extreme Heat Comments Extreme Precipitation Comments Sea Level Rise amp Storm Surge Comments
Select Site in Low Heat Vulnerability Index area Select High Elevation Site Select High Elevation Site
Minimize East-West Building Orientation Green Roof Raise Building Floor Elevation
Passive Solar Cooling and Ventilation Systems
Protect Below Grade Areas from Flooding Waterproof Building Envelope
Cool Roof (SRI appropriate) On-site Stormwater Management (gray) Elevate Critical Building Functions
Green Roof (extensive) Reduce Impervious Areas Elevate Critical Equipment
Vegetative Structures Permeable Pavement Perimeter Floodwall100 Levee (passive or active)
Enhanced HVAC System including space layout optimization and system scalability
Increase Green Spaces and Planted Areas DryWet Floodproofing
More Efficient Building Envelope Other Utility Redundancy Design101
Parking Lot Shading Resilient Materials amp Landscape Treatments
Light Colored Pavements (appropriate SRI) Design for Storm Surge Outflow
Increase Planted Areas Install Backwater Flow Prevention
Permeable Surfaces Design for Scour
Open-grid Pavement Raise Road Elevation
Other Other
This appendix provides a template for identifying possible design strategies to address climate change risks as described throughout the Guidelines
APPENDIX 6 - DESIGN STRATEGIES CHECKLIST
100 Permanent perimeter flood walls are not permitted to meet floodproofing requirements in buildings with substantial improvements andor damages 101 Utility redundancy design should be pursued for critical systems not all building systems
APPENDIX 6 - DESIGN STRATEGIES CHECKLIST
NYC Mayorrsquos Office of Recovery and Resiliency Climate Resiliency Design Guidelines
53APPENDIX 7 - CLIMATE CHANGE RISK ASSESSMENT RESOURCES
These Guidelines provide data on climate change hazards and recommend how that data can inform resilient design A risk assessment is a tool to help project managers and designers evaluate risk levels as well as select and prioritize resilient design strategies A high level risk assessment is recommended for all City capital projects with a total cost of under $50 million Projects above $50 million are recommended to conduct an in-depth assessment
Risk assessments use quantified estimates of the probability and magnitude of consequence of an event occurring to prioritize responses ldquoProbabilityrdquo is an assessment of the likelihood of a hazard occurring while ldquomagnituderdquo describes the hazardrsquos potential impact Risk assessment tools such as the examples listed below can be used to define and score these categories Projects that score higher across both probability and magnitude can be prioritized for investment and risk mitigation action Projects that score lower across both criteria may require no action beyond meeting code The results are typically charted on a risk matrix and an example is provided on the next page
The climate change risk management frameworks below offer templates for how to integrate climate change projections into a risk assessment process Refer to these resources for examples and further information
bull Vulnerability Assessment and Adaptation Framework is prepared by the Federal Highway Administration (FHWA) While developed for transportation planning this risk assessment framework has broad applicability for evaluating asset vulnerability to climate change Available at httpswwwfhwadotgovenvironmentsustainabilityresilienceadaptation_framework
bull US Climate Resilience Toolkit The US Global Change Research Program offers a step by step risk assessment
framework including tools and case studies at httpstoolkitclimategovsteps (see example on next page)
bull Coast Adapt Guidance on undertaking a risk assessment High level assessment httpscoastadaptcomausitesdefaultfilesfactsheetsT3M4_2_2nd_pass_risk_assessmentpdfDetailed assessment httpscoastadaptcomausitesdefaultfilesfactsheetsT3M4_3_3rd_pass_risk_assessmentpdf
bull Climate adaptation Risk uncertainty and decision-makingDownload the report here httpswwwukciporgukpublicationsRisk
The City plans to develop a NYC-specific process for integrating climate change data into existing risk management processes by April 2019
APPENDIX 7 - CLIMATE CHANGE RISK ASSESSMENT RESOURCES
NYC Mayorrsquos Office of Recovery and Resiliency Climate Resiliency Design Guidelines
54APPENDIX 7 - CLIMATE CHANGE RISK ASSESSMENT RESOURCES
The Risk Characterization Matrix below is an example from the US Climate Resilience Toolkit This tool can be used to assess the probability and magnitude of impact for identified risks The risk of coincident climate stressorsrisks (such as storm surge plus increased precipitation) can also be assessed as applicable
Figure 14 - Example of a climate change risk matrix (adapted from US Climate Resilience Toolkit)
Project teams can determine the magnitude of the impact (along the horizontal scale of 1 through 3 with 3 being the most severe) and the probabilitylikelihood of occurrence for each specific risk (along the vertical scale with 3 being the most likely) A score is typically assigned for each risk (Probabil-ity x Magnitude) and then charted on the matrix Based on the estimated probability and magnitude of consequence above the risks are ranked and prioritized for mitigation Factors to bear in mind include
bull Not all facility typologies have the same level of functional and operational importance during events or tolerance for disruption
bull Not all climate stressors and risks have the same level of impact on each project sitebull Not all identified risks can or should be mitigated fully
NYC Mayorrsquos Office of Recovery and Resiliency Climate Resiliency Design Guidelines
55WORKS CITED
A Stronger More Resilient New York PlaNYC Report of the NYC Special Initiative for Rebuilding and Resiliency The City of New York 2013
ldquoAccount for Climate Riskrdquo International Finance Corporation accessed March 27 2017 httpwwwifcorgwpswcmconnectTopics_Ext_ContentIFC_External_Corporate_SiteClimate+Business
PrioritiesAccount+for+Climate+Risk
American Society of Heating Refrigeration and Air-Conditioning Engineers (ASHRAE) Handbook -Fundamentals 2017
ldquoBaseline Standard Economic Value Methodology Reportrdquo Federal Emergency Management Agency July 2016
Benefit Cost Analysis Toolkit Software Version 530 Federal Emergency Management Agency (build date December 2016)
Criteria for Detention Facility Design New York City Department of Environmental Protection November 2012
Community Resilience Planning Guide for Buildings and Infrastructure Systems Vol 1 NIST Special Publication 1190 US Department of Commerce 2016
Cool and Green Roofing Manual NYC Department of Design and Construction 2007 httpwwwnycgovhtmlddcdownloadspdfcool_green_roof_manpdf
Building Resiliency Task Force US Urban Green Building Council New York 2013 httpurbangreencouncilforcecomBuildingResiliency
Design and Planning for Flood Resiliency Guidelines for NYC Parks New York City Department of Parks and Recreation 2017
httpswwwnycgovparksorgplanning-and-buildingplanningresiliency-plansflood-resiliency
Flooded Bus Barns and Buckled Rails Federal Transit Administration Office of Budget and Policy 2011 httpswwwhsdlorgabstractampdid=685187
Floodproofing Non-Residential Buildings FEMA P936 FEMA 2013 httpswwwfemagovmedia-library-data9a50c534fc5895799321dcdd4b6083e7P-936_8-20-13_508rpdf
ldquoGlossaryrdquo International Infrastructure Management Manual National Asset Management Support Group New Zealand 2011 httpwwwipweaorg
ldquoGreen Roof Metrics Draft Reportrdquo New York City Department of Parks and Recreation 2017
ldquoGuide to Rain Event Preparednessrdquo NYC Department of Environmental Protection httpwwwnycgovhtmldeppdfbrochuresflood-preparedness-flyerpdf
ldquoGuidelines and Discount Rates for Benefit-Cost Analysis of Federal Programsrdquo Appendix C Circular A-94 US Office of Management and Budget (OMB) 2017
ldquoGuidelines for the Design and Construction of Stormwater Management Systemsrdquo New York City Department of Environmental Protection July 2012
Horton R et al New York City Panel on Climate Change 2015 Report Ann NY Acad Sci ISSN 0077-892 New York 2015
Madrigano J et al ldquoA case-only study of vulnerability to heat wavendashrelated mortality in New York City (2000ndash2011)rdquo Environmental Health Perspectives 123672ndash678 2013
WORKS CITED
NYC Mayorrsquos Office of Recovery and Resiliency Climate Resiliency Design Guidelines
56WORKS CITED
enspMcGregor et al Two Degrees The Built Environment and Our Changing Climate Routledge Press 2013
NYC Green Codes Task Force US Green Building Council New York 2010 httpurbangreencouncilorgGreenCodes
NYCrsquos Risk Landscape A Guide to Hazard Mitigation NYC Emergency Management 2014
One New York The Plan for a Strong and Just City The City of New York 2015 httpwwwnycgovhtmlonenyc downloadspdfpublicationsOneNYCpdf
Ready to Respond Strategies for Multifamily Building Resilience Enterprise Green Communities 2015 httpswwwenterprisecommunityorgresources
Rosenzweig C et al Climate Change Adaptation in New York City Building a Risk Management Response New York City Panel on Climate Change 2010
httponlinelibrarywileycomdoi101111nyas20101196issue-1 issuetoc
ldquoSustainable Infrastructure Management Program Learning Environmentrdquo Water Environment Research Foundation accessed March 24 2017 httpsimplewerforg
Urban Waterfront Adaptive Strategies NYC Department of City Planning 2013 httpwww1nycgovsiteplanningplanssustainable-communitiesclimate-resiliencepagetab=1
Wastewater Resiliency Plan Climate Risk Assessment and Adaptation Study New York City Department of Environmental Protection October 2013
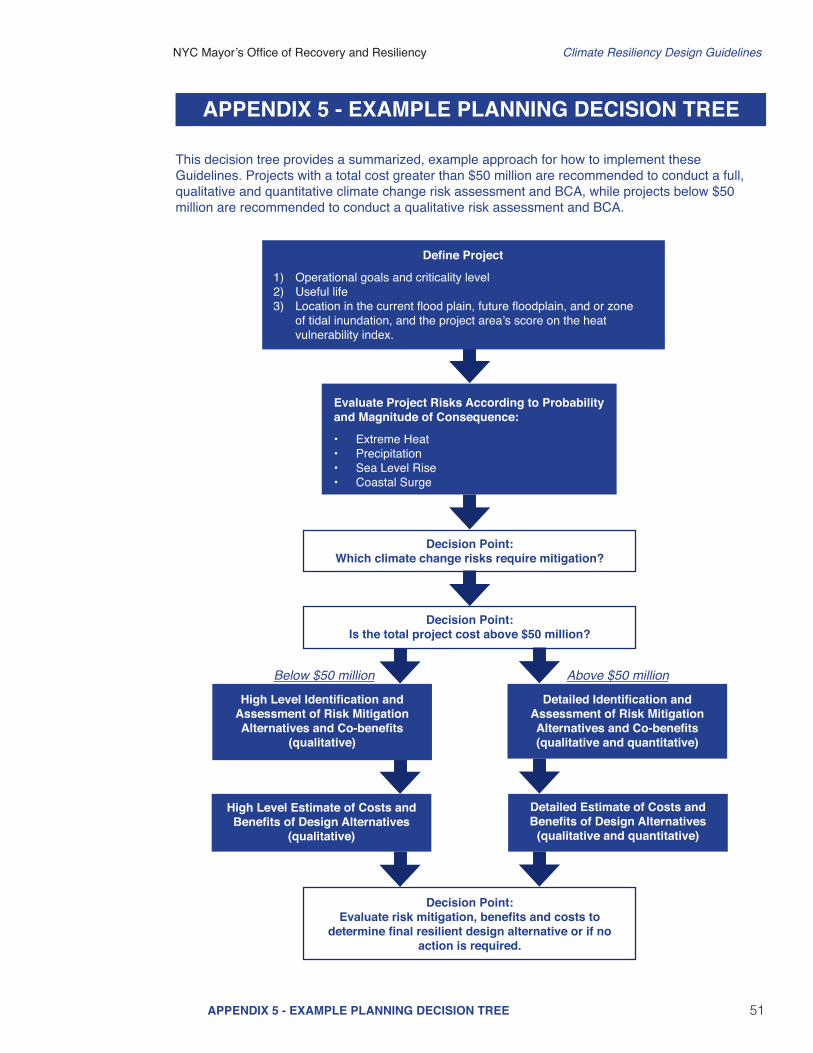
NYC Mayorrsquos Office of Recovery and Resiliency Climate Resiliency Design Guidelines
51APPENDIX 5 - EXAMPLE PLANNING DECISION TREE
This decision tree provides a summarized example approach for how to implement these Guidelines Projects with a total cost greater than $50 million are recommended to conduct a full qualitative and quantitative climate change risk assessment and BCA while projects below $50 million are recommended to conduct a qualitative risk assessment and BCA
Define Project
1) Operational goals and criticality level2) Useful life3) Location in the current flood plain future floodplain and or zone
of tidal inundation and the project arearsquos score on the heat vulnerability index
Evaluate Project Risks According to Probability and Magnitude of Consequence
bull Extreme Heat bull Precipitationbull Sea Level Risebull Coastal Surge
High Level Identification and Assessment of Risk Mitigation Alternatives and Co-benefits
(qualitative)
Detailed Identification and Assessment of Risk Mitigation Alternatives and Co-benefits (qualitative and quantitative)
High Level Estimate of Costs and Benefits of Design Alternatives
(qualitative)
Detailed Estimate of Costs and Benefits of Design Alternatives
(qualitative and quantitative)
Decision Point Which climate change risks require mitigation
Decision Point Evaluate risk mitigation benefits and costs to
determine final resilient design alternative or if no action is required
Decision Point Is the total project cost above $50 million
Below $50 million Above $50 million
APPENDIX 5 - EXAMPLE PLANNING DECISION TREE
NYC Mayorrsquos Office of Recovery and Resiliency Climate Resiliency Design Guidelines
52
Project Title
Design Strategies Checklist (not exhaustive)
Extreme Heat Comments Extreme Precipitation Comments Sea Level Rise amp Storm Surge Comments
Select Site in Low Heat Vulnerability Index area Select High Elevation Site Select High Elevation Site
Minimize East-West Building Orientation Green Roof Raise Building Floor Elevation
Passive Solar Cooling and Ventilation Systems
Protect Below Grade Areas from Flooding Waterproof Building Envelope
Cool Roof (SRI appropriate) On-site Stormwater Management (gray) Elevate Critical Building Functions
Green Roof (extensive) Reduce Impervious Areas Elevate Critical Equipment
Vegetative Structures Permeable Pavement Perimeter Floodwall100 Levee (passive or active)
Enhanced HVAC System including space layout optimization and system scalability
Increase Green Spaces and Planted Areas DryWet Floodproofing
More Efficient Building Envelope Other Utility Redundancy Design101
Parking Lot Shading Resilient Materials amp Landscape Treatments
Light Colored Pavements (appropriate SRI) Design for Storm Surge Outflow
Increase Planted Areas Install Backwater Flow Prevention
Permeable Surfaces Design for Scour
Open-grid Pavement Raise Road Elevation
Other Other
This appendix provides a template for identifying possible design strategies to address climate change risks as described throughout the Guidelines
APPENDIX 6 - DESIGN STRATEGIES CHECKLIST
100 Permanent perimeter flood walls are not permitted to meet floodproofing requirements in buildings with substantial improvements andor damages 101 Utility redundancy design should be pursued for critical systems not all building systems
APPENDIX 6 - DESIGN STRATEGIES CHECKLIST
NYC Mayorrsquos Office of Recovery and Resiliency Climate Resiliency Design Guidelines
53APPENDIX 7 - CLIMATE CHANGE RISK ASSESSMENT RESOURCES
These Guidelines provide data on climate change hazards and recommend how that data can inform resilient design A risk assessment is a tool to help project managers and designers evaluate risk levels as well as select and prioritize resilient design strategies A high level risk assessment is recommended for all City capital projects with a total cost of under $50 million Projects above $50 million are recommended to conduct an in-depth assessment
Risk assessments use quantified estimates of the probability and magnitude of consequence of an event occurring to prioritize responses ldquoProbabilityrdquo is an assessment of the likelihood of a hazard occurring while ldquomagnituderdquo describes the hazardrsquos potential impact Risk assessment tools such as the examples listed below can be used to define and score these categories Projects that score higher across both probability and magnitude can be prioritized for investment and risk mitigation action Projects that score lower across both criteria may require no action beyond meeting code The results are typically charted on a risk matrix and an example is provided on the next page
The climate change risk management frameworks below offer templates for how to integrate climate change projections into a risk assessment process Refer to these resources for examples and further information
bull Vulnerability Assessment and Adaptation Framework is prepared by the Federal Highway Administration (FHWA) While developed for transportation planning this risk assessment framework has broad applicability for evaluating asset vulnerability to climate change Available at httpswwwfhwadotgovenvironmentsustainabilityresilienceadaptation_framework
bull US Climate Resilience Toolkit The US Global Change Research Program offers a step by step risk assessment
framework including tools and case studies at httpstoolkitclimategovsteps (see example on next page)
bull Coast Adapt Guidance on undertaking a risk assessment High level assessment httpscoastadaptcomausitesdefaultfilesfactsheetsT3M4_2_2nd_pass_risk_assessmentpdfDetailed assessment httpscoastadaptcomausitesdefaultfilesfactsheetsT3M4_3_3rd_pass_risk_assessmentpdf
bull Climate adaptation Risk uncertainty and decision-makingDownload the report here httpswwwukciporgukpublicationsRisk
The City plans to develop a NYC-specific process for integrating climate change data into existing risk management processes by April 2019
APPENDIX 7 - CLIMATE CHANGE RISK ASSESSMENT RESOURCES
NYC Mayorrsquos Office of Recovery and Resiliency Climate Resiliency Design Guidelines
54APPENDIX 7 - CLIMATE CHANGE RISK ASSESSMENT RESOURCES
The Risk Characterization Matrix below is an example from the US Climate Resilience Toolkit This tool can be used to assess the probability and magnitude of impact for identified risks The risk of coincident climate stressorsrisks (such as storm surge plus increased precipitation) can also be assessed as applicable
Figure 14 - Example of a climate change risk matrix (adapted from US Climate Resilience Toolkit)
Project teams can determine the magnitude of the impact (along the horizontal scale of 1 through 3 with 3 being the most severe) and the probabilitylikelihood of occurrence for each specific risk (along the vertical scale with 3 being the most likely) A score is typically assigned for each risk (Probabil-ity x Magnitude) and then charted on the matrix Based on the estimated probability and magnitude of consequence above the risks are ranked and prioritized for mitigation Factors to bear in mind include
bull Not all facility typologies have the same level of functional and operational importance during events or tolerance for disruption
bull Not all climate stressors and risks have the same level of impact on each project sitebull Not all identified risks can or should be mitigated fully
NYC Mayorrsquos Office of Recovery and Resiliency Climate Resiliency Design Guidelines
55WORKS CITED
A Stronger More Resilient New York PlaNYC Report of the NYC Special Initiative for Rebuilding and Resiliency The City of New York 2013
ldquoAccount for Climate Riskrdquo International Finance Corporation accessed March 27 2017 httpwwwifcorgwpswcmconnectTopics_Ext_ContentIFC_External_Corporate_SiteClimate+Business
PrioritiesAccount+for+Climate+Risk
American Society of Heating Refrigeration and Air-Conditioning Engineers (ASHRAE) Handbook -Fundamentals 2017
ldquoBaseline Standard Economic Value Methodology Reportrdquo Federal Emergency Management Agency July 2016
Benefit Cost Analysis Toolkit Software Version 530 Federal Emergency Management Agency (build date December 2016)
Criteria for Detention Facility Design New York City Department of Environmental Protection November 2012
Community Resilience Planning Guide for Buildings and Infrastructure Systems Vol 1 NIST Special Publication 1190 US Department of Commerce 2016
Cool and Green Roofing Manual NYC Department of Design and Construction 2007 httpwwwnycgovhtmlddcdownloadspdfcool_green_roof_manpdf
Building Resiliency Task Force US Urban Green Building Council New York 2013 httpurbangreencouncilforcecomBuildingResiliency
Design and Planning for Flood Resiliency Guidelines for NYC Parks New York City Department of Parks and Recreation 2017
httpswwwnycgovparksorgplanning-and-buildingplanningresiliency-plansflood-resiliency
Flooded Bus Barns and Buckled Rails Federal Transit Administration Office of Budget and Policy 2011 httpswwwhsdlorgabstractampdid=685187
Floodproofing Non-Residential Buildings FEMA P936 FEMA 2013 httpswwwfemagovmedia-library-data9a50c534fc5895799321dcdd4b6083e7P-936_8-20-13_508rpdf
ldquoGlossaryrdquo International Infrastructure Management Manual National Asset Management Support Group New Zealand 2011 httpwwwipweaorg
ldquoGreen Roof Metrics Draft Reportrdquo New York City Department of Parks and Recreation 2017
ldquoGuide to Rain Event Preparednessrdquo NYC Department of Environmental Protection httpwwwnycgovhtmldeppdfbrochuresflood-preparedness-flyerpdf
ldquoGuidelines and Discount Rates for Benefit-Cost Analysis of Federal Programsrdquo Appendix C Circular A-94 US Office of Management and Budget (OMB) 2017
ldquoGuidelines for the Design and Construction of Stormwater Management Systemsrdquo New York City Department of Environmental Protection July 2012
Horton R et al New York City Panel on Climate Change 2015 Report Ann NY Acad Sci ISSN 0077-892 New York 2015
Madrigano J et al ldquoA case-only study of vulnerability to heat wavendashrelated mortality in New York City (2000ndash2011)rdquo Environmental Health Perspectives 123672ndash678 2013
WORKS CITED
NYC Mayorrsquos Office of Recovery and Resiliency Climate Resiliency Design Guidelines
56WORKS CITED
enspMcGregor et al Two Degrees The Built Environment and Our Changing Climate Routledge Press 2013
NYC Green Codes Task Force US Green Building Council New York 2010 httpurbangreencouncilorgGreenCodes
NYCrsquos Risk Landscape A Guide to Hazard Mitigation NYC Emergency Management 2014
One New York The Plan for a Strong and Just City The City of New York 2015 httpwwwnycgovhtmlonenyc downloadspdfpublicationsOneNYCpdf
Ready to Respond Strategies for Multifamily Building Resilience Enterprise Green Communities 2015 httpswwwenterprisecommunityorgresources
Rosenzweig C et al Climate Change Adaptation in New York City Building a Risk Management Response New York City Panel on Climate Change 2010
httponlinelibrarywileycomdoi101111nyas20101196issue-1 issuetoc
ldquoSustainable Infrastructure Management Program Learning Environmentrdquo Water Environment Research Foundation accessed March 24 2017 httpsimplewerforg
Urban Waterfront Adaptive Strategies NYC Department of City Planning 2013 httpwww1nycgovsiteplanningplanssustainable-communitiesclimate-resiliencepagetab=1
Wastewater Resiliency Plan Climate Risk Assessment and Adaptation Study New York City Department of Environmental Protection October 2013
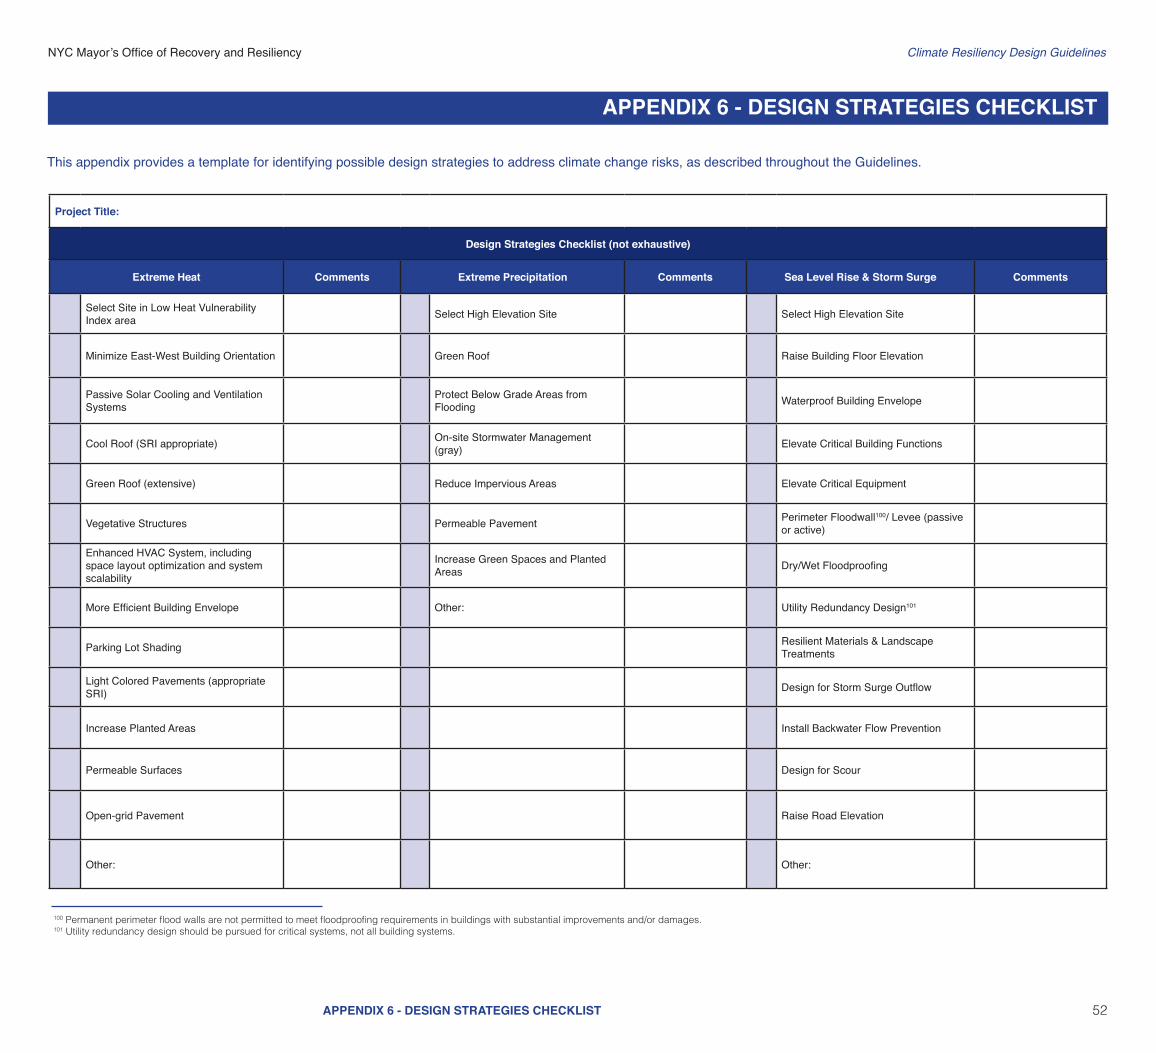
NYC Mayorrsquos Office of Recovery and Resiliency Climate Resiliency Design Guidelines
52
Project Title
Design Strategies Checklist (not exhaustive)
Extreme Heat Comments Extreme Precipitation Comments Sea Level Rise amp Storm Surge Comments
Select Site in Low Heat Vulnerability Index area Select High Elevation Site Select High Elevation Site
Minimize East-West Building Orientation Green Roof Raise Building Floor Elevation
Passive Solar Cooling and Ventilation Systems
Protect Below Grade Areas from Flooding Waterproof Building Envelope
Cool Roof (SRI appropriate) On-site Stormwater Management (gray) Elevate Critical Building Functions
Green Roof (extensive) Reduce Impervious Areas Elevate Critical Equipment
Vegetative Structures Permeable Pavement Perimeter Floodwall100 Levee (passive or active)
Enhanced HVAC System including space layout optimization and system scalability
Increase Green Spaces and Planted Areas DryWet Floodproofing
More Efficient Building Envelope Other Utility Redundancy Design101
Parking Lot Shading Resilient Materials amp Landscape Treatments
Light Colored Pavements (appropriate SRI) Design for Storm Surge Outflow
Increase Planted Areas Install Backwater Flow Prevention
Permeable Surfaces Design for Scour
Open-grid Pavement Raise Road Elevation
Other Other
This appendix provides a template for identifying possible design strategies to address climate change risks as described throughout the Guidelines
APPENDIX 6 - DESIGN STRATEGIES CHECKLIST
100 Permanent perimeter flood walls are not permitted to meet floodproofing requirements in buildings with substantial improvements andor damages 101 Utility redundancy design should be pursued for critical systems not all building systems
APPENDIX 6 - DESIGN STRATEGIES CHECKLIST
NYC Mayorrsquos Office of Recovery and Resiliency Climate Resiliency Design Guidelines
53APPENDIX 7 - CLIMATE CHANGE RISK ASSESSMENT RESOURCES
These Guidelines provide data on climate change hazards and recommend how that data can inform resilient design A risk assessment is a tool to help project managers and designers evaluate risk levels as well as select and prioritize resilient design strategies A high level risk assessment is recommended for all City capital projects with a total cost of under $50 million Projects above $50 million are recommended to conduct an in-depth assessment
Risk assessments use quantified estimates of the probability and magnitude of consequence of an event occurring to prioritize responses ldquoProbabilityrdquo is an assessment of the likelihood of a hazard occurring while ldquomagnituderdquo describes the hazardrsquos potential impact Risk assessment tools such as the examples listed below can be used to define and score these categories Projects that score higher across both probability and magnitude can be prioritized for investment and risk mitigation action Projects that score lower across both criteria may require no action beyond meeting code The results are typically charted on a risk matrix and an example is provided on the next page
The climate change risk management frameworks below offer templates for how to integrate climate change projections into a risk assessment process Refer to these resources for examples and further information
bull Vulnerability Assessment and Adaptation Framework is prepared by the Federal Highway Administration (FHWA) While developed for transportation planning this risk assessment framework has broad applicability for evaluating asset vulnerability to climate change Available at httpswwwfhwadotgovenvironmentsustainabilityresilienceadaptation_framework
bull US Climate Resilience Toolkit The US Global Change Research Program offers a step by step risk assessment
framework including tools and case studies at httpstoolkitclimategovsteps (see example on next page)
bull Coast Adapt Guidance on undertaking a risk assessment High level assessment httpscoastadaptcomausitesdefaultfilesfactsheetsT3M4_2_2nd_pass_risk_assessmentpdfDetailed assessment httpscoastadaptcomausitesdefaultfilesfactsheetsT3M4_3_3rd_pass_risk_assessmentpdf
bull Climate adaptation Risk uncertainty and decision-makingDownload the report here httpswwwukciporgukpublicationsRisk
The City plans to develop a NYC-specific process for integrating climate change data into existing risk management processes by April 2019
APPENDIX 7 - CLIMATE CHANGE RISK ASSESSMENT RESOURCES
NYC Mayorrsquos Office of Recovery and Resiliency Climate Resiliency Design Guidelines
54APPENDIX 7 - CLIMATE CHANGE RISK ASSESSMENT RESOURCES
The Risk Characterization Matrix below is an example from the US Climate Resilience Toolkit This tool can be used to assess the probability and magnitude of impact for identified risks The risk of coincident climate stressorsrisks (such as storm surge plus increased precipitation) can also be assessed as applicable
Figure 14 - Example of a climate change risk matrix (adapted from US Climate Resilience Toolkit)
Project teams can determine the magnitude of the impact (along the horizontal scale of 1 through 3 with 3 being the most severe) and the probabilitylikelihood of occurrence for each specific risk (along the vertical scale with 3 being the most likely) A score is typically assigned for each risk (Probabil-ity x Magnitude) and then charted on the matrix Based on the estimated probability and magnitude of consequence above the risks are ranked and prioritized for mitigation Factors to bear in mind include
bull Not all facility typologies have the same level of functional and operational importance during events or tolerance for disruption
bull Not all climate stressors and risks have the same level of impact on each project sitebull Not all identified risks can or should be mitigated fully
NYC Mayorrsquos Office of Recovery and Resiliency Climate Resiliency Design Guidelines
55WORKS CITED
A Stronger More Resilient New York PlaNYC Report of the NYC Special Initiative for Rebuilding and Resiliency The City of New York 2013
ldquoAccount for Climate Riskrdquo International Finance Corporation accessed March 27 2017 httpwwwifcorgwpswcmconnectTopics_Ext_ContentIFC_External_Corporate_SiteClimate+Business
PrioritiesAccount+for+Climate+Risk
American Society of Heating Refrigeration and Air-Conditioning Engineers (ASHRAE) Handbook -Fundamentals 2017
ldquoBaseline Standard Economic Value Methodology Reportrdquo Federal Emergency Management Agency July 2016
Benefit Cost Analysis Toolkit Software Version 530 Federal Emergency Management Agency (build date December 2016)
Criteria for Detention Facility Design New York City Department of Environmental Protection November 2012
Community Resilience Planning Guide for Buildings and Infrastructure Systems Vol 1 NIST Special Publication 1190 US Department of Commerce 2016
Cool and Green Roofing Manual NYC Department of Design and Construction 2007 httpwwwnycgovhtmlddcdownloadspdfcool_green_roof_manpdf
Building Resiliency Task Force US Urban Green Building Council New York 2013 httpurbangreencouncilforcecomBuildingResiliency
Design and Planning for Flood Resiliency Guidelines for NYC Parks New York City Department of Parks and Recreation 2017
httpswwwnycgovparksorgplanning-and-buildingplanningresiliency-plansflood-resiliency
Flooded Bus Barns and Buckled Rails Federal Transit Administration Office of Budget and Policy 2011 httpswwwhsdlorgabstractampdid=685187
Floodproofing Non-Residential Buildings FEMA P936 FEMA 2013 httpswwwfemagovmedia-library-data9a50c534fc5895799321dcdd4b6083e7P-936_8-20-13_508rpdf
ldquoGlossaryrdquo International Infrastructure Management Manual National Asset Management Support Group New Zealand 2011 httpwwwipweaorg
ldquoGreen Roof Metrics Draft Reportrdquo New York City Department of Parks and Recreation 2017
ldquoGuide to Rain Event Preparednessrdquo NYC Department of Environmental Protection httpwwwnycgovhtmldeppdfbrochuresflood-preparedness-flyerpdf
ldquoGuidelines and Discount Rates for Benefit-Cost Analysis of Federal Programsrdquo Appendix C Circular A-94 US Office of Management and Budget (OMB) 2017
ldquoGuidelines for the Design and Construction of Stormwater Management Systemsrdquo New York City Department of Environmental Protection July 2012
Horton R et al New York City Panel on Climate Change 2015 Report Ann NY Acad Sci ISSN 0077-892 New York 2015
Madrigano J et al ldquoA case-only study of vulnerability to heat wavendashrelated mortality in New York City (2000ndash2011)rdquo Environmental Health Perspectives 123672ndash678 2013
WORKS CITED
NYC Mayorrsquos Office of Recovery and Resiliency Climate Resiliency Design Guidelines
56WORKS CITED
enspMcGregor et al Two Degrees The Built Environment and Our Changing Climate Routledge Press 2013
NYC Green Codes Task Force US Green Building Council New York 2010 httpurbangreencouncilorgGreenCodes
NYCrsquos Risk Landscape A Guide to Hazard Mitigation NYC Emergency Management 2014
One New York The Plan for a Strong and Just City The City of New York 2015 httpwwwnycgovhtmlonenyc downloadspdfpublicationsOneNYCpdf
Ready to Respond Strategies for Multifamily Building Resilience Enterprise Green Communities 2015 httpswwwenterprisecommunityorgresources
Rosenzweig C et al Climate Change Adaptation in New York City Building a Risk Management Response New York City Panel on Climate Change 2010
httponlinelibrarywileycomdoi101111nyas20101196issue-1 issuetoc
ldquoSustainable Infrastructure Management Program Learning Environmentrdquo Water Environment Research Foundation accessed March 24 2017 httpsimplewerforg
Urban Waterfront Adaptive Strategies NYC Department of City Planning 2013 httpwww1nycgovsiteplanningplanssustainable-communitiesclimate-resiliencepagetab=1
Wastewater Resiliency Plan Climate Risk Assessment and Adaptation Study New York City Department of Environmental Protection October 2013
NYC Mayorrsquos Office of Recovery and Resiliency Climate Resiliency Design Guidelines
53APPENDIX 7 - CLIMATE CHANGE RISK ASSESSMENT RESOURCES
These Guidelines provide data on climate change hazards and recommend how that data can inform resilient design A risk assessment is a tool to help project managers and designers evaluate risk levels as well as select and prioritize resilient design strategies A high level risk assessment is recommended for all City capital projects with a total cost of under $50 million Projects above $50 million are recommended to conduct an in-depth assessment
Risk assessments use quantified estimates of the probability and magnitude of consequence of an event occurring to prioritize responses ldquoProbabilityrdquo is an assessment of the likelihood of a hazard occurring while ldquomagnituderdquo describes the hazardrsquos potential impact Risk assessment tools such as the examples listed below can be used to define and score these categories Projects that score higher across both probability and magnitude can be prioritized for investment and risk mitigation action Projects that score lower across both criteria may require no action beyond meeting code The results are typically charted on a risk matrix and an example is provided on the next page
The climate change risk management frameworks below offer templates for how to integrate climate change projections into a risk assessment process Refer to these resources for examples and further information
bull Vulnerability Assessment and Adaptation Framework is prepared by the Federal Highway Administration (FHWA) While developed for transportation planning this risk assessment framework has broad applicability for evaluating asset vulnerability to climate change Available at httpswwwfhwadotgovenvironmentsustainabilityresilienceadaptation_framework
bull US Climate Resilience Toolkit The US Global Change Research Program offers a step by step risk assessment
framework including tools and case studies at httpstoolkitclimategovsteps (see example on next page)
bull Coast Adapt Guidance on undertaking a risk assessment High level assessment httpscoastadaptcomausitesdefaultfilesfactsheetsT3M4_2_2nd_pass_risk_assessmentpdfDetailed assessment httpscoastadaptcomausitesdefaultfilesfactsheetsT3M4_3_3rd_pass_risk_assessmentpdf
bull Climate adaptation Risk uncertainty and decision-makingDownload the report here httpswwwukciporgukpublicationsRisk
The City plans to develop a NYC-specific process for integrating climate change data into existing risk management processes by April 2019
APPENDIX 7 - CLIMATE CHANGE RISK ASSESSMENT RESOURCES
NYC Mayorrsquos Office of Recovery and Resiliency Climate Resiliency Design Guidelines
54APPENDIX 7 - CLIMATE CHANGE RISK ASSESSMENT RESOURCES
The Risk Characterization Matrix below is an example from the US Climate Resilience Toolkit This tool can be used to assess the probability and magnitude of impact for identified risks The risk of coincident climate stressorsrisks (such as storm surge plus increased precipitation) can also be assessed as applicable
Figure 14 - Example of a climate change risk matrix (adapted from US Climate Resilience Toolkit)
Project teams can determine the magnitude of the impact (along the horizontal scale of 1 through 3 with 3 being the most severe) and the probabilitylikelihood of occurrence for each specific risk (along the vertical scale with 3 being the most likely) A score is typically assigned for each risk (Probabil-ity x Magnitude) and then charted on the matrix Based on the estimated probability and magnitude of consequence above the risks are ranked and prioritized for mitigation Factors to bear in mind include
bull Not all facility typologies have the same level of functional and operational importance during events or tolerance for disruption
bull Not all climate stressors and risks have the same level of impact on each project sitebull Not all identified risks can or should be mitigated fully
NYC Mayorrsquos Office of Recovery and Resiliency Climate Resiliency Design Guidelines
55WORKS CITED
A Stronger More Resilient New York PlaNYC Report of the NYC Special Initiative for Rebuilding and Resiliency The City of New York 2013
ldquoAccount for Climate Riskrdquo International Finance Corporation accessed March 27 2017 httpwwwifcorgwpswcmconnectTopics_Ext_ContentIFC_External_Corporate_SiteClimate+Business
PrioritiesAccount+for+Climate+Risk
American Society of Heating Refrigeration and Air-Conditioning Engineers (ASHRAE) Handbook -Fundamentals 2017
ldquoBaseline Standard Economic Value Methodology Reportrdquo Federal Emergency Management Agency July 2016
Benefit Cost Analysis Toolkit Software Version 530 Federal Emergency Management Agency (build date December 2016)
Criteria for Detention Facility Design New York City Department of Environmental Protection November 2012
Community Resilience Planning Guide for Buildings and Infrastructure Systems Vol 1 NIST Special Publication 1190 US Department of Commerce 2016
Cool and Green Roofing Manual NYC Department of Design and Construction 2007 httpwwwnycgovhtmlddcdownloadspdfcool_green_roof_manpdf
Building Resiliency Task Force US Urban Green Building Council New York 2013 httpurbangreencouncilforcecomBuildingResiliency
Design and Planning for Flood Resiliency Guidelines for NYC Parks New York City Department of Parks and Recreation 2017
httpswwwnycgovparksorgplanning-and-buildingplanningresiliency-plansflood-resiliency
Flooded Bus Barns and Buckled Rails Federal Transit Administration Office of Budget and Policy 2011 httpswwwhsdlorgabstractampdid=685187
Floodproofing Non-Residential Buildings FEMA P936 FEMA 2013 httpswwwfemagovmedia-library-data9a50c534fc5895799321dcdd4b6083e7P-936_8-20-13_508rpdf
ldquoGlossaryrdquo International Infrastructure Management Manual National Asset Management Support Group New Zealand 2011 httpwwwipweaorg
ldquoGreen Roof Metrics Draft Reportrdquo New York City Department of Parks and Recreation 2017
ldquoGuide to Rain Event Preparednessrdquo NYC Department of Environmental Protection httpwwwnycgovhtmldeppdfbrochuresflood-preparedness-flyerpdf
ldquoGuidelines and Discount Rates for Benefit-Cost Analysis of Federal Programsrdquo Appendix C Circular A-94 US Office of Management and Budget (OMB) 2017
ldquoGuidelines for the Design and Construction of Stormwater Management Systemsrdquo New York City Department of Environmental Protection July 2012
Horton R et al New York City Panel on Climate Change 2015 Report Ann NY Acad Sci ISSN 0077-892 New York 2015
Madrigano J et al ldquoA case-only study of vulnerability to heat wavendashrelated mortality in New York City (2000ndash2011)rdquo Environmental Health Perspectives 123672ndash678 2013
WORKS CITED
NYC Mayorrsquos Office of Recovery and Resiliency Climate Resiliency Design Guidelines
56WORKS CITED
enspMcGregor et al Two Degrees The Built Environment and Our Changing Climate Routledge Press 2013
NYC Green Codes Task Force US Green Building Council New York 2010 httpurbangreencouncilorgGreenCodes
NYCrsquos Risk Landscape A Guide to Hazard Mitigation NYC Emergency Management 2014
One New York The Plan for a Strong and Just City The City of New York 2015 httpwwwnycgovhtmlonenyc downloadspdfpublicationsOneNYCpdf
Ready to Respond Strategies for Multifamily Building Resilience Enterprise Green Communities 2015 httpswwwenterprisecommunityorgresources
Rosenzweig C et al Climate Change Adaptation in New York City Building a Risk Management Response New York City Panel on Climate Change 2010
httponlinelibrarywileycomdoi101111nyas20101196issue-1 issuetoc
ldquoSustainable Infrastructure Management Program Learning Environmentrdquo Water Environment Research Foundation accessed March 24 2017 httpsimplewerforg
Urban Waterfront Adaptive Strategies NYC Department of City Planning 2013 httpwww1nycgovsiteplanningplanssustainable-communitiesclimate-resiliencepagetab=1
Wastewater Resiliency Plan Climate Risk Assessment and Adaptation Study New York City Department of Environmental Protection October 2013
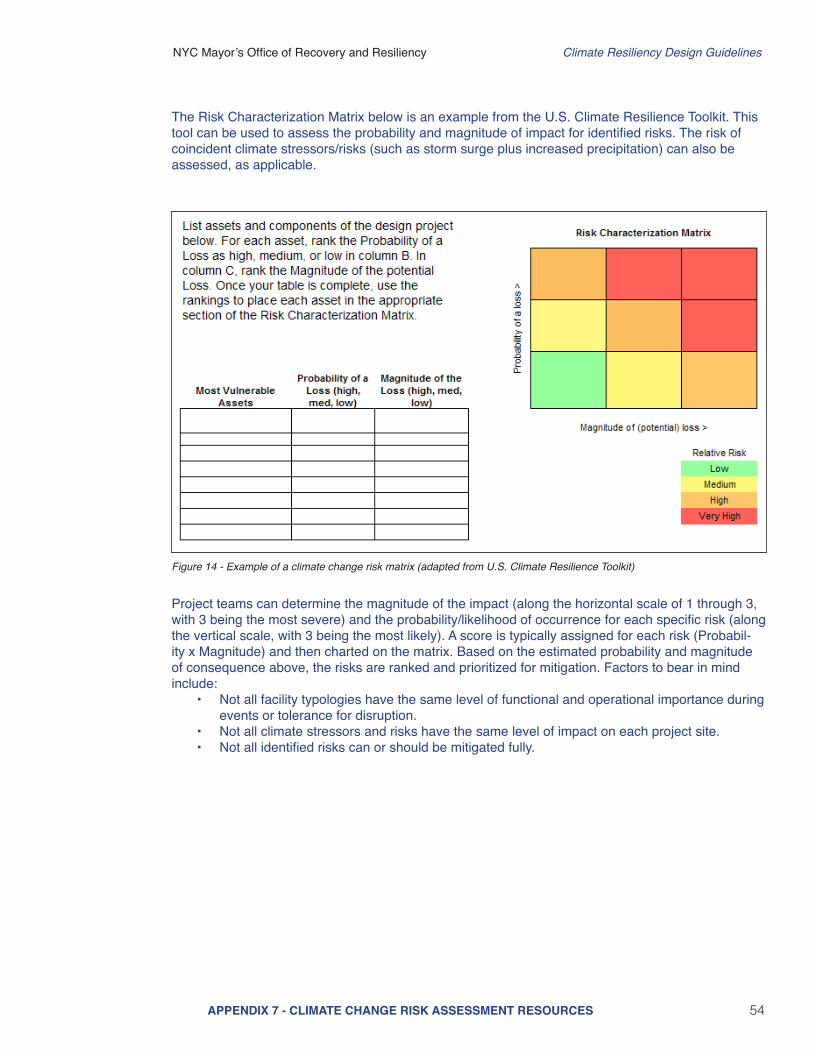
NYC Mayorrsquos Office of Recovery and Resiliency Climate Resiliency Design Guidelines
54APPENDIX 7 - CLIMATE CHANGE RISK ASSESSMENT RESOURCES
The Risk Characterization Matrix below is an example from the US Climate Resilience Toolkit This tool can be used to assess the probability and magnitude of impact for identified risks The risk of coincident climate stressorsrisks (such as storm surge plus increased precipitation) can also be assessed as applicable
Figure 14 - Example of a climate change risk matrix (adapted from US Climate Resilience Toolkit)
Project teams can determine the magnitude of the impact (along the horizontal scale of 1 through 3 with 3 being the most severe) and the probabilitylikelihood of occurrence for each specific risk (along the vertical scale with 3 being the most likely) A score is typically assigned for each risk (Probabil-ity x Magnitude) and then charted on the matrix Based on the estimated probability and magnitude of consequence above the risks are ranked and prioritized for mitigation Factors to bear in mind include
bull Not all facility typologies have the same level of functional and operational importance during events or tolerance for disruption
bull Not all climate stressors and risks have the same level of impact on each project sitebull Not all identified risks can or should be mitigated fully
NYC Mayorrsquos Office of Recovery and Resiliency Climate Resiliency Design Guidelines
55WORKS CITED
A Stronger More Resilient New York PlaNYC Report of the NYC Special Initiative for Rebuilding and Resiliency The City of New York 2013
ldquoAccount for Climate Riskrdquo International Finance Corporation accessed March 27 2017 httpwwwifcorgwpswcmconnectTopics_Ext_ContentIFC_External_Corporate_SiteClimate+Business
PrioritiesAccount+for+Climate+Risk
American Society of Heating Refrigeration and Air-Conditioning Engineers (ASHRAE) Handbook -Fundamentals 2017
ldquoBaseline Standard Economic Value Methodology Reportrdquo Federal Emergency Management Agency July 2016
Benefit Cost Analysis Toolkit Software Version 530 Federal Emergency Management Agency (build date December 2016)
Criteria for Detention Facility Design New York City Department of Environmental Protection November 2012
Community Resilience Planning Guide for Buildings and Infrastructure Systems Vol 1 NIST Special Publication 1190 US Department of Commerce 2016
Cool and Green Roofing Manual NYC Department of Design and Construction 2007 httpwwwnycgovhtmlddcdownloadspdfcool_green_roof_manpdf
Building Resiliency Task Force US Urban Green Building Council New York 2013 httpurbangreencouncilforcecomBuildingResiliency
Design and Planning for Flood Resiliency Guidelines for NYC Parks New York City Department of Parks and Recreation 2017
httpswwwnycgovparksorgplanning-and-buildingplanningresiliency-plansflood-resiliency
Flooded Bus Barns and Buckled Rails Federal Transit Administration Office of Budget and Policy 2011 httpswwwhsdlorgabstractampdid=685187
Floodproofing Non-Residential Buildings FEMA P936 FEMA 2013 httpswwwfemagovmedia-library-data9a50c534fc5895799321dcdd4b6083e7P-936_8-20-13_508rpdf
ldquoGlossaryrdquo International Infrastructure Management Manual National Asset Management Support Group New Zealand 2011 httpwwwipweaorg
ldquoGreen Roof Metrics Draft Reportrdquo New York City Department of Parks and Recreation 2017
ldquoGuide to Rain Event Preparednessrdquo NYC Department of Environmental Protection httpwwwnycgovhtmldeppdfbrochuresflood-preparedness-flyerpdf
ldquoGuidelines and Discount Rates for Benefit-Cost Analysis of Federal Programsrdquo Appendix C Circular A-94 US Office of Management and Budget (OMB) 2017
ldquoGuidelines for the Design and Construction of Stormwater Management Systemsrdquo New York City Department of Environmental Protection July 2012
Horton R et al New York City Panel on Climate Change 2015 Report Ann NY Acad Sci ISSN 0077-892 New York 2015
Madrigano J et al ldquoA case-only study of vulnerability to heat wavendashrelated mortality in New York City (2000ndash2011)rdquo Environmental Health Perspectives 123672ndash678 2013
WORKS CITED
NYC Mayorrsquos Office of Recovery and Resiliency Climate Resiliency Design Guidelines
56WORKS CITED
enspMcGregor et al Two Degrees The Built Environment and Our Changing Climate Routledge Press 2013
NYC Green Codes Task Force US Green Building Council New York 2010 httpurbangreencouncilorgGreenCodes
NYCrsquos Risk Landscape A Guide to Hazard Mitigation NYC Emergency Management 2014
One New York The Plan for a Strong and Just City The City of New York 2015 httpwwwnycgovhtmlonenyc downloadspdfpublicationsOneNYCpdf
Ready to Respond Strategies for Multifamily Building Resilience Enterprise Green Communities 2015 httpswwwenterprisecommunityorgresources
Rosenzweig C et al Climate Change Adaptation in New York City Building a Risk Management Response New York City Panel on Climate Change 2010
httponlinelibrarywileycomdoi101111nyas20101196issue-1 issuetoc
ldquoSustainable Infrastructure Management Program Learning Environmentrdquo Water Environment Research Foundation accessed March 24 2017 httpsimplewerforg
Urban Waterfront Adaptive Strategies NYC Department of City Planning 2013 httpwww1nycgovsiteplanningplanssustainable-communitiesclimate-resiliencepagetab=1
Wastewater Resiliency Plan Climate Risk Assessment and Adaptation Study New York City Department of Environmental Protection October 2013
NYC Mayorrsquos Office of Recovery and Resiliency Climate Resiliency Design Guidelines
56WORKS CITED
enspMcGregor et al Two Degrees The Built Environment and Our Changing Climate Routledge Press 2013
NYC Green Codes Task Force US Green Building Council New York 2010 httpurbangreencouncilorgGreenCodes
NYCrsquos Risk Landscape A Guide to Hazard Mitigation NYC Emergency Management 2014
One New York The Plan for a Strong and Just City The City of New York 2015 httpwwwnycgovhtmlonenyc downloadspdfpublicationsOneNYCpdf
Ready to Respond Strategies for Multifamily Building Resilience Enterprise Green Communities 2015 httpswwwenterprisecommunityorgresources
Rosenzweig C et al Climate Change Adaptation in New York City Building a Risk Management Response New York City Panel on Climate Change 2010
httponlinelibrarywileycomdoi101111nyas20101196issue-1 issuetoc
ldquoSustainable Infrastructure Management Program Learning Environmentrdquo Water Environment Research Foundation accessed March 24 2017 httpsimplewerforg
Urban Waterfront Adaptive Strategies NYC Department of City Planning 2013 httpwww1nycgovsiteplanningplanssustainable-communitiesclimate-resiliencepagetab=1
Wastewater Resiliency Plan Climate Risk Assessment and Adaptation Study New York City Department of Environmental Protection October 2013