Embed Size (px)
Citation preview

Aprila Bank ASA | Company Presentation | November 2020

2
Table of contentsOverview
Overview01
02 Strategy
03 Financials
04 Appendix
3
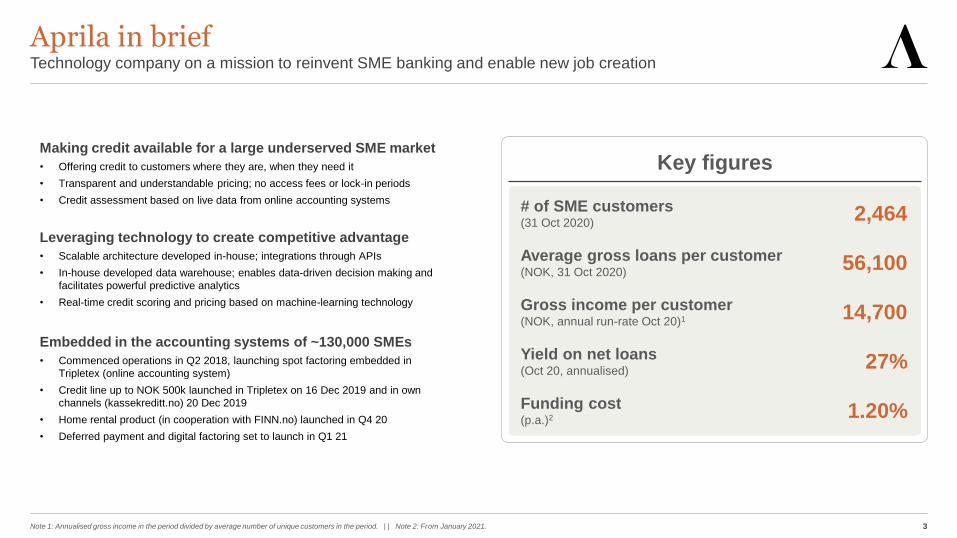
Aprila in brief
Note 1: Annualised gross income in the period divided by average number of unique customers in the period. | | Note 2: From January 2021.
Technology company on a mission to reinvent SME banking and enable new job creation
Making credit available for a large underserved SME market
• Offering credit to customers where they are, when they need it
• Transparent and understandable pricing; no access fees or lock-in periods
• Credit assessment based on live data from online accounting systems
Leveraging technology to create competitive advantage
• Scalable architecture developed in-house; integrations through APIs
• In-house developed data warehouse; enables data-driven decision making and
facilitates powerful predictive analytics
• Real-time credit scoring and pricing based on machine-learning technology
Embedded in the accounting systems of ~130,000 SMEs
• Commenced operations in Q2 2018, launching spot factoring embedded in
Tripletex (online accounting system)
• Credit line up to NOK 500k launched in Tripletex on 16 Dec 2019 and in own
channels (kassekreditt.no) 20 Dec 2019
• Home rental product (in cooperation with FINN.no) launched in Q4 20
• Deferred payment and digital factoring set to launch in Q1 21
Key figures
# of SME customers(31 Oct 2020)
2,464
Yield on net loans (Oct 20, annualised)
27%
Funding cost(p.a.)2 1.20%
Average gross loans per customer(NOK, 31 Oct 2020)
56,100
Gross income per customer(NOK, annual run-rate Oct 20)1 14,700

4
The Problem
Sources: 1) EIF European Small Business Finance Outlook December 2019. 2) EIF European Small Business Finance Outlook June 2018. 3) IMF DataMapper.
SMEs are the backbone of the European economy, but lack of financing results in stagnant growth
SMEs share of the European economy1
Employment Value creation
Share of European SMEs with bank loans2 Acc. GDP growth since the financial crisis (%)3
SMEs constitute 67% of
employment and 56% of the
value creation in Europe…
…but lack access to
funding…
…which contributes to a
stagnant growth in the
European economy
67%
33%
56%
44%
29%
22%
15%
Medium Small Micro
95.5
58.0
34.6
22.2
14.6
Asia
Africa
Oceania
America
Europe
5
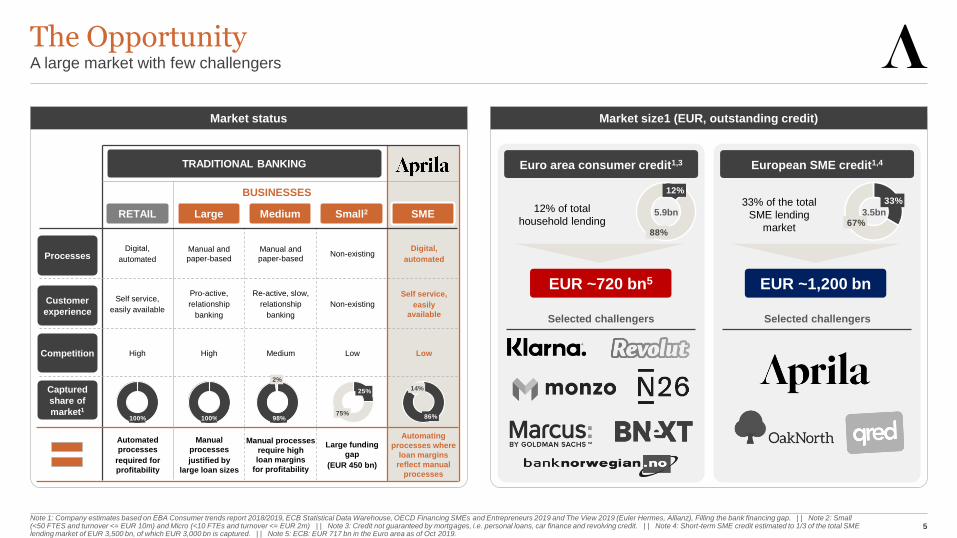
The Opportunity
Note 1: Company estimates based on EBA Consumer trends report 2018/2019, ECB Statistical Data Warehouse, OECD Financing SMEs and Entrepreneurs 2019 and The View 2019 (Euler Hermes, Allianz), Filling the bank financing gap. | | Note 2: Small (<50 FTES and turnover <= EUR 10m) and Micro (<10 FTEs and turnover <= EUR 2m) | | Note 3: Credit not guaranteed by mortgages, i.e. personal loans, car finance and revolving credit. | | Note 4: Short-term SME credit estimated to 1/3 of the total SME lending market of EUR 3,500 bn, of which EUR 3,000 bn is captured. | | Note 5: ECB: EUR 717 bn in the Euro area as of Oct 2019.
A large market with few challengers
TRADITIONAL BANKING
Processes
Customer
experience
Competition
RETAIL Large Medium SME
Digital,
automated
Self service,
easily available
High
Automated
processes
required for
profitability
Manual and
paper-based
Pro-active,
relationship
banking
High
Manual
processes
justified by
large loan sizes
Manual and
paper-based
Re-active, slow,
relationship
banking
Medium
Manual processes
require high
loan margins
for profitability
Non-existing
Non-existing
Low
Large funding
gap
(EUR 450 bn)
Euro area consumer credit1,3
EUR ~720 bn5
Selected challengers
Digital,
automated
Self service,
easily
available
Low
Automating
processes where
loan margins
reflect manual
processes
Small2
BUSINESSES
Captured
share of
market1
EUR ~1,200 bn
33% of the total
SME lending
market
3.5bn5.9bn12% of total
household lending
Market status Market size1 (EUR, outstanding credit)
Selected challengers
European SME credit1,4
100% 100% 98%
2%
25%
75%86%
14%
33%
67%
12%
88%
6
Products
Note 1: Based on 30 days to payment. | | Note 2: NO: “Næringskausjon”
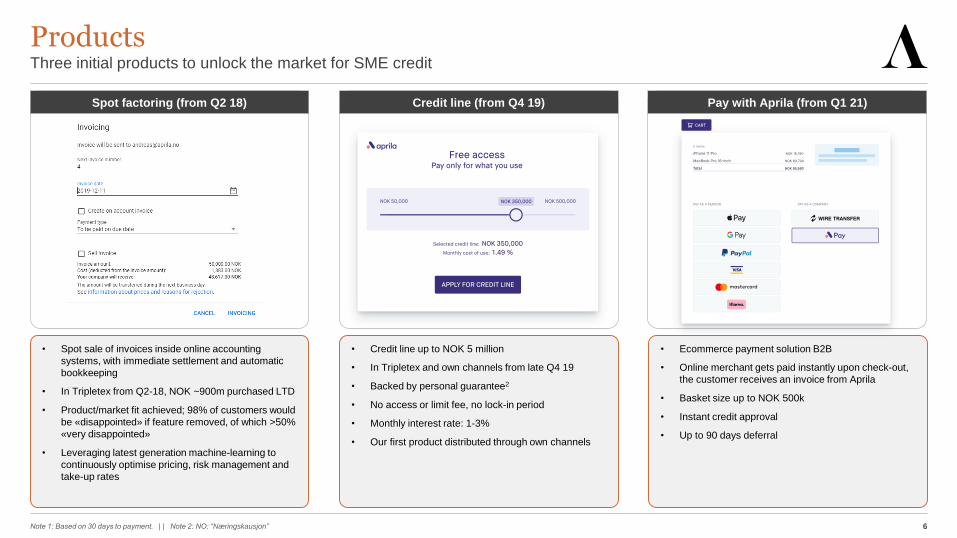
Three initial products to unlock the market for SME credit
• Spot sale of invoices inside online accounting
systems, with immediate settlement and automatic
bookkeeping
• In Tripletex from Q2-18, NOK ~900m purchased LTD
• Product/market fit achieved; 98% of customers would
be «disappointed» if feature removed, of which >50%
«very disappointed»
• Leveraging latest generation machine-learning to
continuously optimise pricing, risk management and
take-up rates
• Credit line up to NOK 5 million
• In Tripletex and own channels from late Q4 19
• Backed by personal guarantee2
• No access or limit fee, no lock-in period
• Monthly interest rate: 1-3%
• Our first product distributed through own channels
• Ecommerce payment solution B2B
• Online merchant gets paid instantly upon check-out,
the customer receives an invoice from Aprila
• Basket size up to NOK 500k
• Instant credit approval
• Up to 90 days deferral
Spot factoring (from Q2 18) Credit line (from Q4 19) Pay with Aprila (from Q1 21)

7
Timeline
Note 1: Five ERP systems, FINN.no, Axactor, business loan aggregators and own channels. | | Note 2: ERP / online accounting systems, online classifieds (FINN.no) etc..
Five products and nine channels from primo 20211
Q4-19: + ~15,000
Streamline Scale up Expand
2018 20202019 2021 →
Distribution
Digital platforms2
Aggregators
Own channels
Products
Spot factoring
Credit line
Pay With Aprila
FundingEquity
Deposits (~1.2% p.a.)
Q2-18:
~40,000
Customer
exposure
through
platforms
Q1-20:
+ ~40,000
Q2-20:
+ ~40,000
Setup
Home rental
Digital factoring

8
Table of contentsOverview
Overview01
02 Strategy
03 Financials
04 Appendix

9
Strategy
Note 1: Source: Itera - Smart Banking Survey of Norwegian SMEs, winter 2020
Deliver frictionless banking services to SMEs embedded in the interfaces they already use
Provide credit where
SMEs want it, and
when they need it
Use real time
accounting and
transaction data
Automate pricing
and decision making
Eliminate friction
and manual labour
Distribute through
partners to minimise
cost and risk
• Customers give their consent to share accounting and transaction data from
their respective systems in order to access Aprila credit and payment services
• Aprila receives real time customer accounting data and transaction history from
the partner systems that have integrated with Aprila’s APIs
• More than 50 different machine learning and expert models running in
production, analysing accounting and transaction data to calculate prices (risk
adjusted interest rates) and make credit decisions automatically to enable
seamless and real-time customer experience and usage
• End-to-end automation of Aprila side processes to reduce cost to serve and
provide instant customer self-servicing
• Financial costs are automatically booked in the customer’s accounting system
• Keep Aprila organisation size, cost and risk at a minimum through partners; re-
use and leverage other companies’ technology, data, customer interfaces and
distribution channels
• Typical Aprila partners are accounting systems, ERP systems (accounting,
invoicing, transactions), payment infrastructure companies, e-commerce
platforms, POS solutions, accounting offices and traditional banks
«If you could access all your banking services in one interface,
which interface would you prefer?»
SMEs don’t want to go to a bank, or use their apps1
Problem Solution
Traditional banks are not able to serve SMEs
• Traditional banks have limited and outdated insights into the
financial status of SME customers → high risk aversion, low
lending approval rates
• Manual onboarding and case handling → poor customer
experience and slow response times
• Low ticket size of SME loans, and high cost to serve →
unprofitable for banks to lend money to SMEs
• Offer banking and payment services through APIs inside the applications the
SMEs are already using, e.g. invoicing systems, accounting systems, ERP
systems, POS solutions, e-commerce solutions
• Provide credit and payment opportunities in the time of need, e.g. at point of
sale or when funds are insufficient to pay large bills
64%
22%
5%
In the accounting system
Online bank / banking app / branches
Other
10
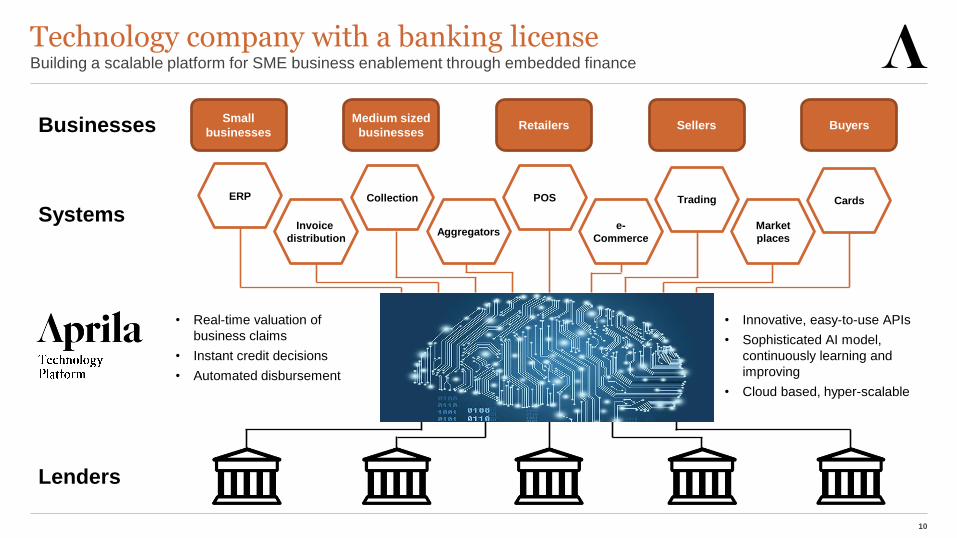
Technology company with a banking licenseBuilding a scalable platform for SME business enablement through embedded finance
ERP
Small
businesses
Medium sized
businessesRetailers Sellers Buyers
AggregatorsInvoice
distribution
e-
Commerce
POS Trading
Market
places
CardsCollection
• Innovative, easy-to-use APIs
• Sophisticated AI model,
continuously learning and
improving
• Cloud based, hyper-scalable
• Real-time valuation of
business claims
• Instant credit decisions
• Automated disbursement
Businesses
Systems
Lenders
11
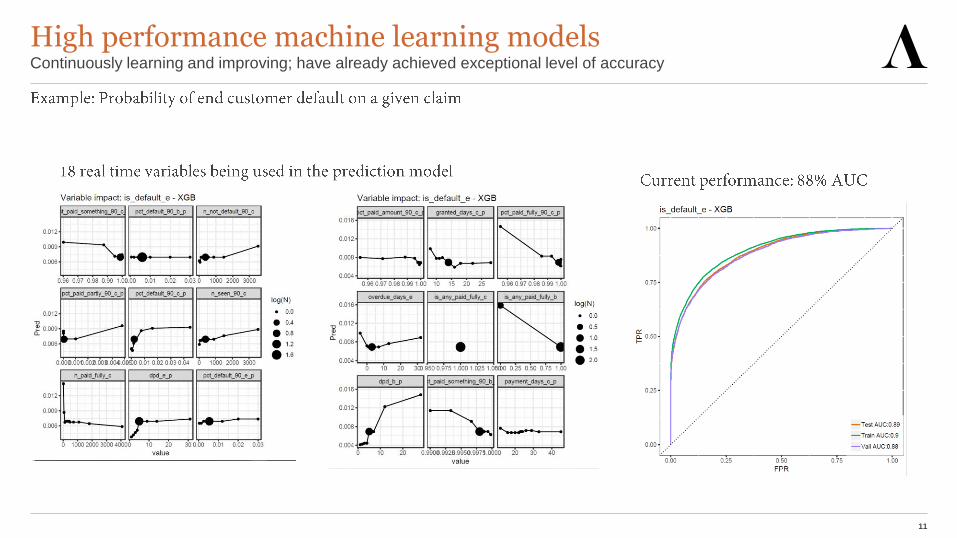
High performance machine learning modelsContinuously learning and improving; have already achieved exceptional level of accuracy
12
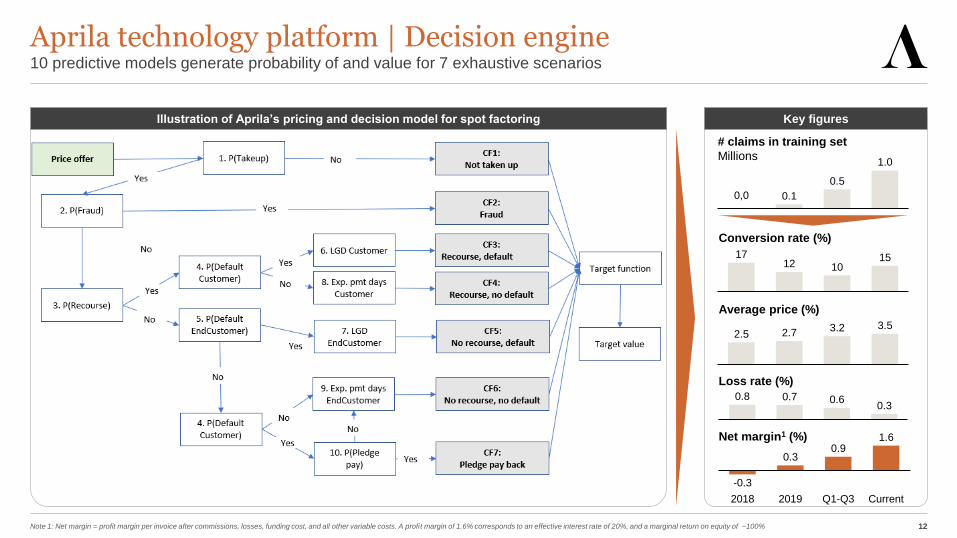
Aprila technology platform | Decision engine
Note 1: Net margin = profit margin per invoice after commissions, losses, funding cost, and all other variable costs. A profit margin of 1.6% corresponds to an effective interest rate of 20%, and a marginal return on equity of ~100%
10 predictive models generate probability of and value for 7 exhaustive scenarios
1712 10
15
2.5 2.7 3.2 3.5
-0.3
0.30.9
1.6
20192018 Q1-Q3 Current
# claims in training set
Millions
Conversion rate (%)
Average price (%)
0.8 0.7 0.60.3
Loss rate (%)
Net margin1 (%)
0.1
0.5
1.0
0,0
Illustration of Aprila’s pricing and decision model for spot factoring Key figures
13
Growth plan
Note 1: Estimated interest and fee income from short term SME lending in 2019.
Note 2: Aprila’s total income from own balance sheet in % of the interest and fee income in the respective market. Assumed annual market growth: Norway 4%, Nordics: 3%, Europe 2% . | | Note 3: Total income.
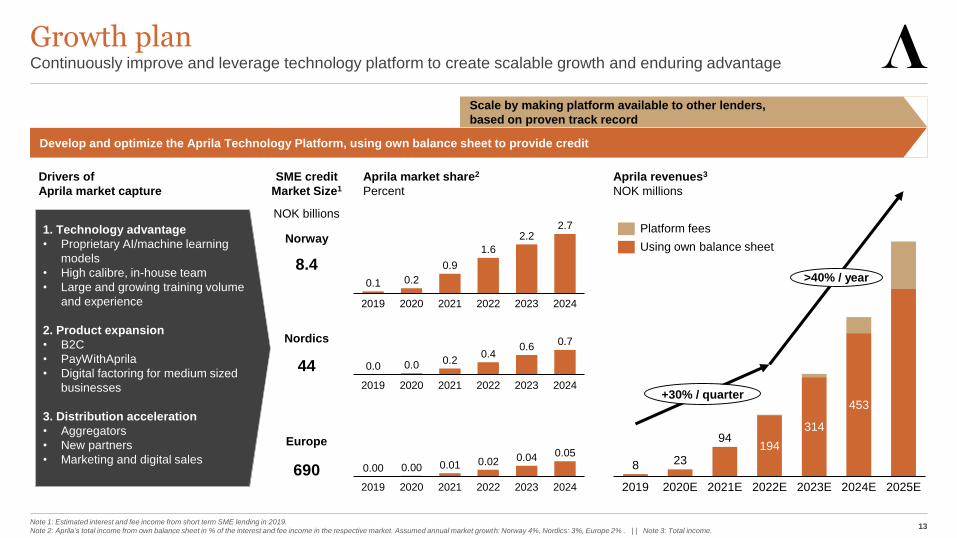
Continuously improve and leverage technology platform to create scalable growth and enduring advantage
8 23
94194
314
453
2024E2019 2021E2020E 2022E 2023E 2025E
+30% / quarter
>40% / year
Platform fees
Using own balance sheet
Aprila revenues3
NOK millions
0.1 0.2
0.9
1.6
2.22.7
20202019 20232021 2022 2024
SME credit
Market Size1
Norway
Nordics
Europe
8.4
44
690
NOK billions
Aprila market share2
Percent
0.0 0.0 0.20.4
0.60.7
20202019 20232021 20242022
0.00 0.00 0.01 0.02 0.04 0.05
2021 20242019 2020 2022 2023
Drivers of
Aprila market capture
1. Technology advantage
• Proprietary AI/machine learning
models
• High calibre, in-house team
• Large and growing training volume
and experience
2. Product expansion
• B2C
• PayWithAprila
• Digital factoring for medium sized
businesses
3. Distribution acceleration
• Aggregators
• New partners
• Marketing and digital sales
Develop and optimize the Aprila Technology Platform, using own balance sheet to provide credit
Scale by making platform available to other lenders,
based on proven track record

14
Geographic presence and scalingDigital maturity will be a key selection criterion
Short-termNorway
• Highly digital home market
• Online accounting systems
have integrated Aprila Bank
financing inside their
systems, making this the
first fully digital integration
of bank financing within
ERP
Mid-termThe Nordics
• The Nordic countries are
world-leaders with respect
to digitalisation and have
well-functioning financial
markets; a great starting
point for future expansion
• Aprila expects to enter new
markets through distribution
agreements with ERP
providers
Long-termContinental Europe
• Entry to Continental Europe
through existing and new
partners with established
local presence
• Aprila’s banking license can
be passported across the
EU/EEA
2021Q2 2018 2023
Commenced
operations in
Norway
Expand to the first
Nordic country outside of
Norway
Expand to the first
European country
outside of the Nordics
International expansion plan
15
Table of contentsOverview
Overview01
02 Strategy
03 Financials
04 Appendix

16
1.0 1.1 1.2 1.11.3
1.5
1.0 1.0
1.6 1.7 1.8
2.4
3.0
15.9
18.9 19.0
15.0
17.7 16.0
9.3 8.2
11.7 10.5 10.2
13.7 14.7
2019-10 2019-11 2019-12 2020-01 2020-02 2020-03 2020-04 2020-05 2020-06 2020-07 2020-08 2020-09 2020-10
Gross income from lending (NOK million)
Gross period income per avg no. of onboarded customers (NOK thousand, annualised)
Gross income run-rate
# of unique customers EOP
718
Gross income (NOK million) and gross income per customer (NOK thousand) Key comments
• Drop in income per customer in April and May,
as Aprila significantly reduced interest rates to
help businesses suffering from the Corona-
shutdown, and manually tightened credit
algorithms as the algorithms had not been
trained on pandemic data
• Positive development in income per customer
from June as interest rates were restored back
to normal, and algorithms were gradually
loosened
- Relatively low numbers from July and
August are due to large share of
businesses in vacation mode
732 802 871 990 1,207 1,311 1,454 1,812 1,977 2,065 2,274 2,464
30%monthly
NOK 3.0m in October

17
Financial outlook
Note 1: ~40,000 Tripletex customers. | | Note 2: ~130,000 customers. | | Note 3: Of which ~2,500 customers via ERP (130 000 customers in Tripletex, Xledger, Uni Economy, Visma eAccounting and Fiken) and ~1000 customers in other channels. | | Note 4: Per average
number of customers. YE 2019 = run-rate Q4 19. 31 Oct 20 = run-rate Oct 20. YE 2020 = estimated run-rate Dec 20.
Annual run-rate of NOK 50m in gross income at year-end and break-even in Q2 21
8022% of customer exposure1
3,000~2% of customer exposure3
17,748 ~17,000
14.2 ~50
# of customersEnd of period
YE 2019 YE 2020E
Gross income
per customerAnnual run-rate4
(NOK)
Annual gross
incomeRun-rate (NOKm)
• New partners
• New products
• In-house marketing and sales
• Increased approval rate
• Increased credit line limits
• Purchasing B2C invoices
Drivers
Break-even expected in Q2 21
2,4641.9% of customer exposure2
14,700
36.2
31 Oct 20

18
Table of contentsOverview
Overview01
02 Strategy
03 Financials
04 Appendix

19
Management teamSolid background from finance, banking and technology
Per Christian Goller | 54 | Chief Growth Officer
• Former Head of Corporate Finance at Fondsfinans, co-founder of
Berg Goller & Co (sold to Icebank in 2008), Head of Bus. Dev. at
Opera Software and Marketing Manager at TINE, numerous
board positions
• BSc from Uni. of Manchester and MBA from the Norwegian
School of Economics (NHH)
Lene Gridseth | 31 | Chief Operating Officer
• Previous experience as Investment Banking Associate at Beringer
Finance, primarily focusing on M&A within Technology & IT
services
• MSc In Financial Economics from the Norwegian School of
Economics (NHH)
Kjetil S. Barli | 38 | Chief Financial Officer
• Former Head of Financial Institutions Group at Fondsfinans /
Beringer Finance (2013-17), Associate Corporate Finance at
Fondsfinans (2010-12) and Management Consultant at PA
Consulting Group (2009-10)
• MSc in Industrial Economics from the Norwegian University of
Science and Technology (NTNU)
Martine Haakanes | 32 | Chief Risk Officer
• Former Regulatory risk manager in Danske Bank C&I, Credit
Process Analyst in Nordea and Senior Associate in PwC focusing
on regulation and risk management primarily in the financial
sector
• BSc in Business Management and MSc in Business
Management and Finance from Bond University
Israr Khan | 34 | Chief Product & Technology Officer
• Former Digital Director in marked.no, Senior Vice President
Digitalisation in DNB and Head of Experience Design and
Manager at Capgemini, Consultant in Microsoft
• Computer Engineering and Informatics from Oslo and Akershus
University College of Applied Sciences, Organisational theory and
leadership from Høyskolen i Hedmark
Halvor S. Lande | 47 | Chief Executive Officer
• Former EVP Digitalisation and Business Development in DNB
(2016-19), Associate Principal (2013-16) and Engagement
Manager (2008-13) at McKinsey. Co-founder and CEO of RiskLab
(1999-2008)
• MSc in Mathematics from the University of Oslo, Computer
Engineering from NTNU (NTH)

20
Board of DirectorsCompetent and experienced board
Remi C. Dramstad | 34 | Board Member
• Partner at Advokatfirmaet Selmer DA
• In charge of Selmer’s start-up and fintech initiative
• Master of Laws from University of Oslo and LL.M. Corporations from New York University
Ingrid Tjønneland | 60 | Board Member
• 27 years of banking experience of which 25 years with DNB, where she has held executive positions within AML, Risk Management, Compliance, IT & Operations,
Business Controlling, Private Banking, Credit and Custody services, Strategy and Concept Development and Investment Advisory
• Has held several board positions within DNB throughout her professional career
• Law Degree from the University of Oslo
Arild Spandow | 50 | Chairman
• Founder and CEO of Amesto Group AS, a company delivering ERP, CRM and HRM software, payroll and accounting, translation and staffing services
• Currently serving as Chairman of the Board at Amesto Solutions Invest
• BSc (Hons) in Business Administration from University of Bath
Bente Loe | 51 | Board Member
• Partner in Alliance Venture.
• Chair of the board of the Norwegian Venture & Private Equity Association and has previously been a board member in Data response, NRC Group, Software Innovation,
and Bank Norwegian
• BSBA and MBA in International Finance from University of Denver
Trond Kristian Andreassen | 56 | Board Member
• Former CEO of Aktiv Kapital in Norway for six years, built up and led Gothia Financial Group (now Arvato) for nine years, and was CEO of Avida Finans AB for one year
where he also sat on the board for two years
• Business Degree from BI Norwegian Business School
Astrid Lehre | 57 | Board Member
• Has previously been Head of Audit in DNB for five years, Auditor director of EDB Business Partner for six years and Head of Group Internal Audit in EVRY for seven years
• Business major from BI Norwegian Business School and an Authorized Public Accountant from Norwegian School of Economics (NHH)

21
Highlights Q3 2020
Note 1: Gross income from lending divided by average net loans in the period. | | Note 2: Invoices with a nominal amount of NOK 0 - 500k. | | Note 3: Gross income / invoiced amount.
Summary
Q3 20 68% gross income growth QoQ and 155% YoY
• Aprila’s gross income from lending grew by 68% in the third quarter to an all-time high of NOK 5.9 million
• Gross loans surged 59%, from NOK 76 million at the end of Q2 to NOK 121 million at the end of Q3
• Purchased amount reached an all-time high of NOK 115 million, a 43% gain from Q2
Launched next generation decision engine for spot factoring
• Aprila launched a new decision engine for spot factoring on 5 September 2020
• Following the launch, approval and take-up rates surged, lifting conversion rate with ~50% to a new level of ~15%2
• The past weeks, Aprila’s share of its spot factoring customers’ revenue (‘invoice cut’3) has increased from a
historical 0.28% to a new run-rate level of 0.45% (+61%)
Secured growth in 2021 and onwards through new agreements
• Late September, Aprila signed a distribution agreement with Visma.net Webfaktura; Visma Business’ online
invoicing solution. Launch is expected during Q4 2020
• Mid October, Aprila signed a distribution agreement with Fair Group AS for distribution of deferred B2B payment
embedded in Fair’s invoice distribution platform; a platform that distributes 20 million invoices annually in Norway
• Late October, Aprila signed a partnership agreement with Axactor to offer digital factoring to medium sized
businesses with invoice volumes of NOK 20 million to NOK 5 billion; an important step towards servicing larger
customers and capturing a significantly larger share of the NOK 260 bn Norwegian factoring market
LTM
1
NOKm Q2 20 Q3 20
Purchased amount 80 115
Gross loans 76 120
Gross income from lending 3.5 5.9
Total income 2.4 4.0
Pre-tax operating profit -12.1 -11.6
Yield on avg. net loans 21% 25%
NOKm Q3 19 Q3 20
Purchased amount 307 405
Gross loans 32 120
Gross income from lending 9.4 16.6
Total income 7.2 11.4
Pre-tax operating profit -32.3 -48.0
Yield on avg. net loans 28% 23%
LTM ending

22
Loan losses and provisions
Note 1: Stage 1: All exposures <= 30 DPD, Stage 2: Exposures 31 – 90 DPD, and exposures <= 30 DPD with negative risk class migration since initial recognition, Stage 3: Exposures >90 DPD and other non-performing exposures | | Note 2: Coverage ratio
= LLP in % of gross defaulted loans. | | Note 3: Sum of loan loss provisions and realised losses in the period.
Loan impairments and losses of NOK 1.0m in Q3
LLPs by stage1
Gross defaulted loans and coverage ratio2
Loans by DPD (>30)
Loan losses3
NOK million
NOK million
• LLPs of NOK 2.4m / 2.0% of gross loans at EOP
(3.2% in Q2 20)
• DPD >30: 1.9% of gross loans
- The improvement is primarily a result of the
change in the product mix, from 100% spot
factoring in Q3 19 to 39% in Q3 20
- DPD > 30 for spot factoring has however also
improved in Q3 (from 8.4% 30 Jun to 4.0% 30
Sep); a natural consequence of the growth in gross
lending
• Gross defaulted loans were NOK 0.5m
- Coverage ratio2 of 470%
- The elevation in this ratio is caused by the new
product mix; credit line accounts for a relatively
large portion of the LLPs, but only NOK 125k was
default at EOP Q3 20
• Total loan losses of NOK 1.0m in Q2 of which NOK
0.02m in LLPs and NOK 0.93m in net realised losses
%
NOK million
• As of 30 Sep 2020, Aprila had purchased 31,152 invoices
LTD with a total nominal value of NOK 803m
• Total recognised spot factoring losses LTD amounted to
NOK 5.0m (0.62% of purchased amount) and relates to 88
claims (0.28% of all purchased invoices)
Key comments
0.1 0.1 0.1 0.1 0.10.3
0.60.9
0.2 0.0 0.1 0.1 0.10.4
0.7
1.1
0.8
1.9
0.8 0.61.1
0.7
1.0
0.4
0.0 0.1
1.1
1.9
0.90.8
1.31.4
2.4 2.4
Q2 18 Q3 18 Q4 18 Q1 19 Q2 19 Q3 19 Q4 19 Q1 20 Q2 20 Q3 20
Stage 1
Stage 2
Stage 3
0.0%1.4%
13.5%12.3%
7.7%8.6%
6.2%5.3%
3.0%1.9%
Q2 18 Q3 18 Q4 18 Q1 19 Q2 19 Q3 19 Q4 19 Q1 20 Q2 20 Q3 20
31-60
61-90
>90
0.9
2.5
1.2
0.9
1.5
0.9
1.5
0.5123%78% 74% 85% 82%
153%160%
470%
Q2 18 Q3 18 Q4 18 Q1 19 Q2 19 Q3 19 Q4 19 Q1 20 Q2 20 Q3 20
Gross defaulted loans Coverage ratio
0.0 0.1
1.00.9
0.7
0.3
0.91.2 1.1
1.0
Q2 18 Q3 18 Q4 18 Q1 19 Q2 19 Q3 19 Q4 19 Q1 20 Q2 20 Q3 20
23
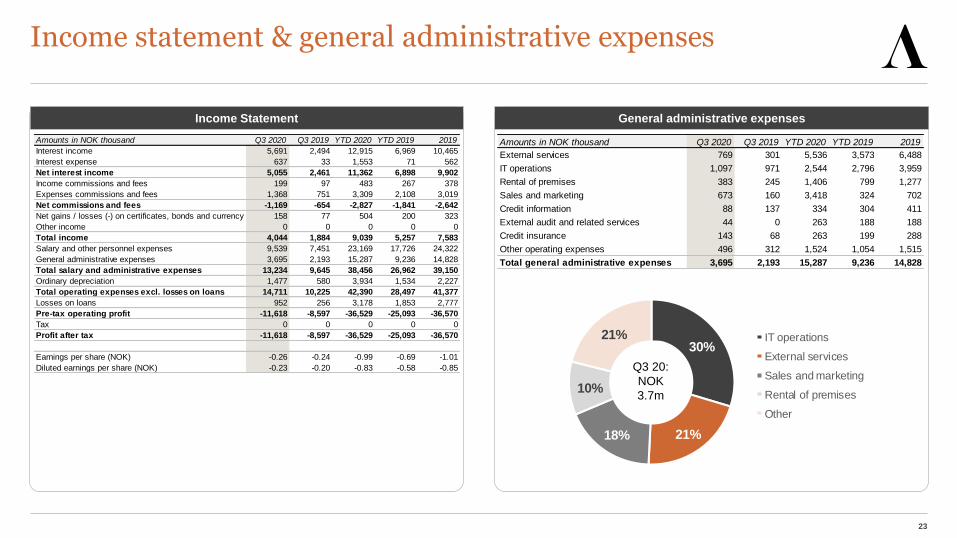
30%
21%18%
10%
21% IT operations
External services
Sales and marketing
Rental of premises
Other
Income statement & general administrative expenses
Income Statement General administrative expenses
Q3 20:
NOK
3.7m
Amounts in NOK thousand Q3 2020 Q3 2019 YTD 2020 YTD 2019 2019
Interest income 5,691 2,494 12,915 6,969 10,465
Interest expense 637 33 1,553 71 562
Net interest income 5,055 2,461 11,362 6,898 9,902
Income commissions and fees 199 97 483 267 378
Expenses commissions and fees 1,368 751 3,309 2,108 3,019
Net commissions and fees -1,169 -654 -2,827 -1,841 -2,642
Net gains / losses (-) on certificates, bonds and currency 158 77 504 200 323
Other income 0 0 0 0 0
Total income 4,044 1,884 9,039 5,257 7,583
Salary and other personnel expenses 9,539 7,451 23,169 17,726 24,322
General administrative expenses 3,695 2,193 15,287 9,236 14,828
Total salary and administrative expenses 13,234 9,645 38,456 26,962 39,150
Ordinary depreciation 1,477 580 3,934 1,534 2,227
Total operating expenses excl. losses on loans 14,711 10,225 42,390 28,497 41,377
Losses on loans 952 256 3,178 1,853 2,777
Pre-tax operating profit -11,618 -8,597 -36,529 -25,093 -36,570
Tax 0 0 0 0 0
Profit after tax -11,618 -8,597 -36,529 -25,093 -36,570
Earnings per share (NOK) -0.26 -0.24 -0.99 -0.69 -1.01
Diluted earnings per share (NOK) -0.23 -0.20 -0.83 -0.58 -0.85
Amounts in NOK thousand Q3 2020 Q3 2019 YTD 2020 YTD 2019 2019
External services 769 301 5,536 3,573 6,488
IT operations 1,097 971 2,544 2,796 3,959
Rental of premises 383 245 1,406 799 1,277
Sales and marketing 673 160 3,418 324 702
Credit information 88 137 334 304 411
External audit and related services 44 0 263 188 188
Credit insurance 143 68 263 199 288
Other operating expenses 496 312 1,524 1,054 1,515
Total general administrative expenses 3,695 2,193 15,287 9,236 14,828

24
Balance sheet & regulatory capital
Balance Sheet Regulatory capital
Amounts in NOK thousand 30.09.2020 31.12.2019 30.09.2019
Loans and deposits with credit institutions 48,643 60,593 69,992
Net loans to customers 117,657 40,885 31,173
Certificates and bonds 56,033 45,470 30,313
Other intangible assets 19,576 12,700 6,823
Deferred tax assets 0 0 0
Fixed assets 4,590 5,868 2,504
Other receivables 9,456 4,522 2,482
Total assets 255,956 170,038 143,287
Deposits from and debt to customers 113,297 62,194 32,234
Other debt 14,818 15,642 7,900
Total liabilities 128,115 77,836 40,134
Share capital 44,590 36,220 36,220
Share premium 190,309 127,036 127,036
Unregistered Share capital 0 37 0
Other paid-in equity 2,241 1,680 1,191
Retained earnings -109,300 -72,771 -61,293
Total equity 127,840 92,202 103,153
Total equity and liabilities 255,956 170,038 143,287
Amounts in NOK thousand 30.09.2020 31.12.2019 30.09.2019
Share capital 44,590 36,220 36,220
Share premium 190,309 127,036 127,036
Other equity -107,059 -71,054 -60,103
Total equity 127,840 92,202 103,153
Other intangible assets -19,576 -12,700 -6,823
AVA adjustment -56 -45 -30
Deferred tax assets 0 0 0
Common equity tier 1 (CET 1) 108,208 79,456 96,300
Tier 1 capital 108,208 79,456 96,300
Total capital 108,208 79,456 96,300
Risk-weighted assets
Loans and deposits with credit institutions 9,729 12,119 13,998
Loans to customers 82,255 32,219 28,453
Certificates and bonds 2,527 1,502 0
Other assets 14,046 10,390 4,986
Credit risk 108,557 56,230 47,438
Operational risk 9,669 9,669 5,119
Risk-weighted assets 118,226 65,899 52,557
Common equity tier 1 ratio (%) 91.5% 120.6% 183.2%
Tier 1 ratio (%) 91.5% 120.6% 183.2%
Total capital ratio (%) 91.5% 120.6% 183.2%
Leverage ratio (%) 44.2% 50.0% 70.6%
LCR 1039% 2162% 347%
25
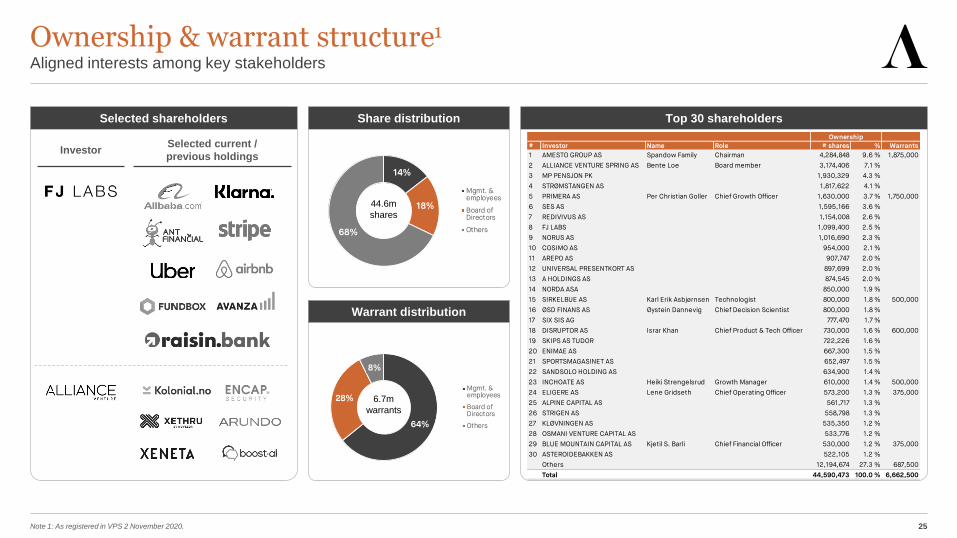
14%
18%
68%
Mgmt. &employees
Board ofDirectors
Others
64%
28%
8%
Mgmt. &employees
Board ofDirectors
Others
Ownership & warrant structure1
Note 1: As registered in VPS 2 November 2020.
Aligned interests among key stakeholders
Top 30 shareholders
44.6m
shares
6.7m
warrants
Selected shareholders
InvestorSelected current /
previous holdings
Share distribution
Warrant distribution
# Investor Name Role # shares % Warrants
1 AMESTO GROUP AS Spandow Family Chairman 4,284,848 9.6 % 1,875,000
2 ALLIANCE VENTURE SPRING AS Bente Loe Board member 3,174,406 7.1 %
3 MP PENSJON PK 1,930,329 4.3 %
4 STRØMSTANGEN AS 1,817,622 4.1 %
5 PRIMERA AS Per Christian Goller Chief Growth Officer 1,630,000 3.7 % 1,750,000
6 SES AS 1,595,166 3.6 %
7 REDIVIVUS AS 1,154,008 2.6 %
8 FJ LABS 1,099,400 2.5 %
9 NORUS AS 1,016,690 2.3 %
10 COSIMO AS 954,000 2.1 %
11 AREPO AS 907,747 2.0 %
12 UNIVERSAL PRESENTKORT AS 897,699 2.0 %
13 A HOLDINGS AS 874,545 2.0 %
14 NORDA ASA 850,000 1.9 %
15 SIRKELBUE AS Karl Erik Asbjørnsen Technologist 800,000 1.8 % 500,000
16 ØSD FINANS AS Øystein Dannevig Chief Decision Scientist 800,000 1.8 %
17 SIX SIS AG 777,470 1.7 %
18 DISRUPTOR AS Israr Khan Chief Product & Tech Officer 730,000 1.6 % 600,000
19 SKIPS AS TUDOR 722,226 1.6 %
20 ENIMAE AS 667,300 1.5 %
21 SPORTSMAGASINET AS 652,497 1.5 %
22 SANDSOLO HOLDING AS 634,900 1.4 %
23 INCHOATE AS Heiki Strengelsrud Growth Manager 610,000 1.4 % 500,000
24 ELIGERE AS Lene Gridseth Chief Operating Officer 573,200 1.3 % 375,000
25 ALPINE CAPITAL AS 561,717 1.3 %
26 STRIGEN AS 558,798 1.3 %
27 KLØVNINGEN AS 535,350 1.2 %
28 OSMANI VENTURE CAPITAL AS 533,776 1.2 %
29 BLUE MOUNTAIN CAPITAL AS Kjetil S. Barli Chief Financial Officer 530,000 1.2 % 375,000
30 ASTEROIDEBAKKEN AS 522,105 1.2 %
Others 12,194,674 27.3 % 687,500
Total 44,590,473 100.0 % 6,662,500
Ownership