Embed Size (px)
Citation preview
ANNUAL REPORT | 2011BN Bank ASA

Highlights of 2011 ..................................................................................................................................................................3
History .....................................................................................................................................................................................4
Financial Ratios .......................................................................................................................................................................5
Vision .......................................................................................................................................................................................6
BN Bank is back on the ball! ..................................................................................................................................................7
The Board of Directors ............................................................................................................................................................8
Executive Management ..........................................................................................................................................................9
Business description ............................................................................................................................................................ 10
Report of the Directors ........................................................................................................................................................ 17
Income Statement ............................................................................................................................................................... 29
Balance Sheet at 31 December ........................................................................................................................................... 30
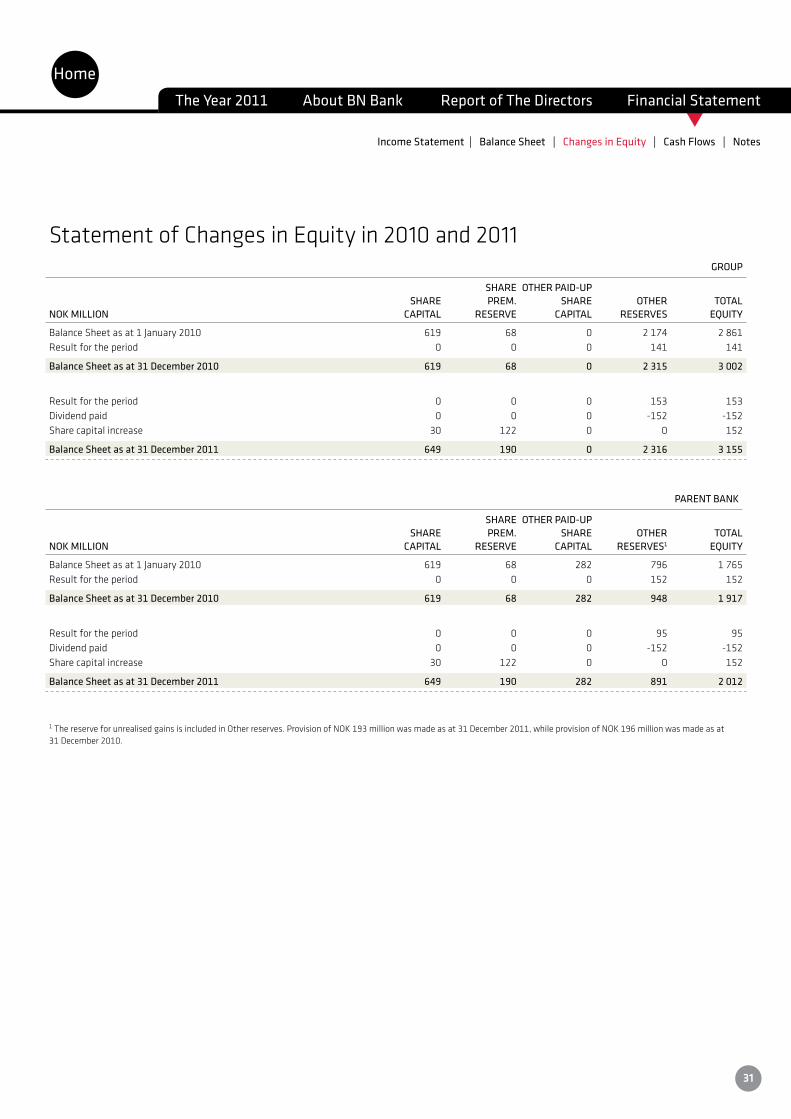
Statement of Changes in Equity in 2010 and 2011 ........................................................................................................... 31
Statement of Cash Flows .................................................................................................................................................... 32
Notes ..................................................................................................................................................................................... 33Note 1. Accounting policies etc. ........................................................................................................................................................................34note 2. Interest and similar income ..................................................................................................................................................................43Note 3. Interest expense and similar charges ...................................................................................................................................................43Note 4. Change in value of financial instruments carried at fair value, gains and losses .................................................................................44Note 5. Other operating income ........................................................................................................................................................................45Note 6. Salaries and general administrative expenses .....................................................................................................................................45Note 7. Related party disclosures .....................................................................................................................................................................46Note 8. Loans to employees and elected officers .............................................................................................................................................50Note 9. Pension costs and commitments .........................................................................................................................................................51Note 10. Intangible assets and tangible fixed assets .......................................................................................................................................55Note 11. Other operating expense ....................................................................................................................................................................57Note 12. Impairment losses and write-downs on loans carried at amortised cost ........................................................................................... 57Note 13. tax ......................................................................................................................................................................................................60Note 14. Cash and balances due from credit institutions .................................................................................................................................62Note 15. Loans and advances ...........................................................................................................................................................................62Note 16. Repossessed properties .....................................................................................................................................................................63Note 17. Financial derivatives ..........................................................................................................................................................................63Note 18. Short-term securities investments ....................................................................................................................................................63Note 19. Subordinated loans ............................................................................................................................................................................64Note 20. Ownership interests in group companies ...........................................................................................................................................64Note 21. Prepayments and accrued income ......................................................................................................................................................66Note 22. Liabilities to credit institutions ..........................................................................................................................................................66Note 23. Customer deposits and accounts payable to customers ....................................................................................................................66Note 24. Debt securities in issue .......................................................................................................................................................................67Note 25. Accrued expenses and deferred income .............................................................................................................................................68Note 26. Subordinated loan capital ..................................................................................................................................................................69Note 27. Shareholder structure and share capital.............................................................................................................................................70Note 28. Capital adequacy ................................................................................................................................................................................70Note 29. Financial instruments by category .....................................................................................................................................................73Note 30. Fair value of financial instruments.....................................................................................................................................................75Note 31. Risk in financial instruments - qualitative description ...................................................................................................................... 81Note 32. Risk in financial instruments - quantitative description - Group .......................................................................................................86Note 33. Risk in financial instruments - quantitative description - Parent Bank .............................................................................................93Note 34. Secured debt and guarantees as at 31 December ............................................................................................................................101Note 35. Proposed, not adopted dividend ......................................................................................................................................................101Note 36. Events after the reporting period .....................................................................................................................................................102Note 37. Transfer of loans to SpareBank 1 Næringskreditt and SpareBank 1 Boligkreditt .............................................................................103Note 38. Disclosures concerning operating segments ....................................................................................................................................104Note 39. Income statement for the four last quarters ....................................................................................................................................106Note 40. Elected Officers and Group Executive Management ........................................................................................................................107
Declaration by the Board of Directors and Managing Director ........................................................................................ 110
Auditor´s Report ................................................................................................................................................................ 111
Control Committee`s report for 2011 ............................................................................................................................... 113
Articles of association of BN Bank ASA ............................................................................................................................ 114
Innhold
HomeThe Year 2011 About BN Bank Report of The Directors Financial Statement
2

t
Highlights of 2011
• ProfitaftertaxfortheBNBankGrouptotalledNOK154million(2010:NOK141million)
• Returnonequityaftertaxwas5.0percent(2010:4.8percent)
• 13 per cent growth in commercial property lending and 9 per cent growth in residential mortgage lending in the last 12 months
• BNBank’s former head office in Trondheim (Munkegata 21)was sold for a net profit of NOK36million.
• Tier1capitalratiowas11.0percent(2010:10.8percent)
• GunnarHovlandtookuptheappointmentofManagingDirector.
-7.2 %
Gross lending 2008 - 2011 (NOKbn)
+8.9 %
+8.0 %
38.8
42.3
45.7
2009
41.8
2008 2010 2011
-579
136 141 154
2008
2009 2010 2011
Profit after tax 2008 - 2011 (NOKm)
HomeThe Year 2011 About BN Bank Report of The Directors Financial Statement
3

t
BN Bank ASA is an independent bank, which has its head office in Trondheim and a branch for commercial property in Oslo. In total, we have just over 100 employees. We serve customers across the country via our internet banking and telephone services.
BN Bank is owned by the SpareBank 1 banks and offers a broad spectrum of banking services to businesses and private individuals.
Within the private banking market, BN Bank is known as one of the best in Norway within savings products and we are also amongst the best as regards mortgage conditions. Within the business market, the bank possesses specialist expertise within commercial property.
1961:In1961,thecreditinstitutionASNæringskredittwasfoundedinTrondheimbybanksandinsurancecompanies.Thecompany’sobjectwas to contribute to the financing of commercial activity by mediating and providing secured loans.
1986:Asaresultofthecompany’sstronggrowth,aregionalofficewas established in Oslo in 1983. In 1986, the business was expanded to cover mortgages and the name of the company was therefore changed toBolig-ogNæringskredittAS.
1989:In1989,thecompanywasfloatedonOsloStockExchange.
1992:In1992,thecreditinstitutionwasconvertedtoabankandre-namedBolig-ogNæringsbankenASA(BNbank).Theprincipalaimofbe-coming a bank was the opportunity to offer favourable savings products. Thisreducedthecompany’sdependenceonthesecuritiesmarketasasource of financing.
1998:In1998,thecreditinstitutionBolig-ogNæringskredittASA(BNkreditt)wasestablishedasawhollyownedsubsidiaryofBNbank.
BNkreditttookoverBNbank’slendingtothebusinessmarketandhou-singcooperatives(jointdebt).TheaimoftheestablishmentwastostrengthentheGroup’scompetitivepositionwithinthebusinessmarketand reduce the guarantee fund charge.
2000:In2000and2001,therangeofproductsandservicesofferedwas expanded. The aim of this expansion was to provide a better basis for growth and profitability by becoming a more complete provider of financial products and services within selected customer segments.
2004:InDecember2004,Íslandsbankiputforwardanoffertopur-chaseallsharesinBNbank.OnceÍslandsbankihadobtainedtheconsentof the shareholders and the necessary permits, BNbank became part oftheÍslandsbankiGroupfrom1April2005.ThelistingonOsloStockExchangewasthendeleted.In2006,ÍslandsbankiwasrenamedGlitnir.
2007:In2007,thecreditinstitutionBNBoligkredittASwasestablis-hedasawhollyownedsubsidiaryofBNbank.Thecompany’sstrategyistoissuecoveredbondsbasedonthebank’swell-securedmortgagesandtogivetheGroupaccesstothisfinancinginstrument.
BN Boligkreditt does not issue its own loans, but acquires mortgages from BNbank.
2008:In2008,BNbankmergedwithGlitnirBankAS(formerlyKre-dittbankeniÅlesund)andtookthenameGlitnirBankASA.InDecember2008, a consortium of SpareBank 1 banks obtained a licence to purchase GlitnirBankASAaftertheIcelandicparentbankhadbeenplacedunderpublicadministrationtwomonthspreviously.GlitnirBankASAwasrena-med BNbank ASA at the same time.
2009:InJune2009,SpareBank1NæringskredittASwasfoundedandis licensed by the Financial Supervisory Authority of Norway to operate as a credit institution. The aim of the credit institution is to secure the banks within the alliance stable and long-term financing of commercial property at competitive prices.
SpareBank1Næringskredittacquiresloanssecuredincommercialpro-perty and issues covered bonds. BN Bank can transfer loans to the insti-tution, but has no assets.
In October 2009, BNbank ASA was renamed BN Bank ASA and presented the new name with a new profile.
2010:During2010,thebank’sstrategythroughto2016wasfurtherdeveloped and refined. Within the private market, BN Bank aims to be a leading direct bank which complements the owner banks, whilst within the business market the bank will continue to operate as a specialist wit-hin the financing of commercial property.
In November 2010, the bank relocated its head office from Munkegata 21 in Trondheim to the new Sparebank block in Søndre gate.
2011:Theoldheadoffice,Munkegata21inTrondheim,wassoldinQ3.GunnarHovlandwasappointedasnewCEO,followingLisbethK.Nærø.
History
HomeThe Year 2011 About BN Bank Report of The Directors Financial Statement
History | Financial Ratios | Vision | BN Bank is back on the ball | The Board of Directors | Executive Management | Business description
4
t
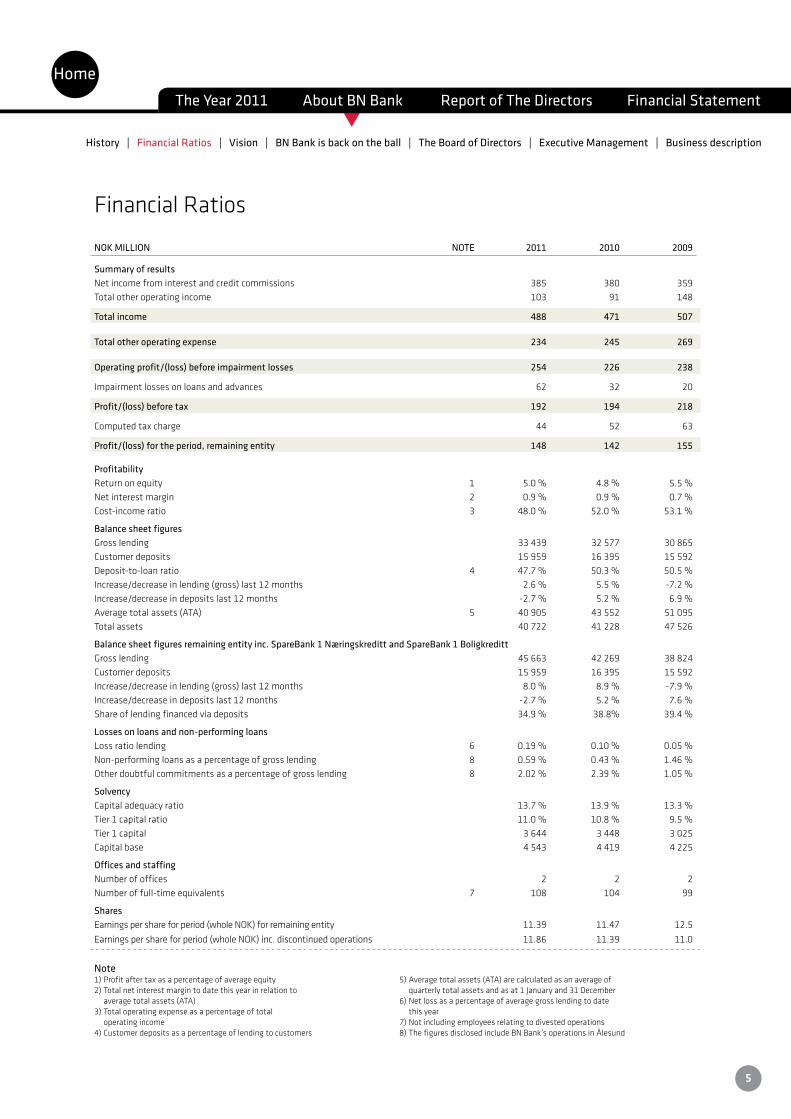
NOK MILLION NOTE 2011 2010 2009
Summary of resultsNet income from interest and credit commissions 385 380 359Total other operating income 103 91 148
Total income 488 471 507
Total other operating expense 234 245 269
Operating profit/(loss) before impairment losses 254 226 238
Impairment losses on loans and advances 62 32 20
Profit/(loss) before tax 192 194 218
Computed tax charge 44 52 63
Profit/(loss) for the period, remaining entity 148 142 155
ProfitabilityReturn on equity 1 5.0 % 4.8 % 5.5 %Net interest margin 2 0.9 % 0.9 % 0.7 %Cost-income ratio 3 48.0 % 52.0 % 53.1 %
Balance sheet figuresGrosslending 33 439 32 577 30865Customerdeposits 15 959 16 395 15592Deposit-to-loan ratio 4 47.7 % 50.3 % 50.5 %Increase/decreaseinlending(gross)last12months 2.6% 5.5% -7.2%Increase/decrease in deposits last 12 months -2.7 % 5.2 % 6.9 %Averagetotalassets(ATA) 5 40 905 43 552 51095Totalassets 40 722 41 228 47526
Balance sheet figures remaining entity inc. SpareBank 1 Næringskreditt and SpareBank 1 Boligkreditt Grosslending 45 663 42 269 38824Customerdeposits 15 959 16 395 15592Increase/decreaseinlending(gross)last12months 8.0% 8.9% -7.9%Increase/decrease in deposits last 12 months -2.7 % 5.2 % 7.6 %Share of lending financed via deposits 34.9 % 38.8% 39.4 %
Losses on loans and non-performing loansLoss ratio lending 6 0.19 % 0.10 % 0.05 %Non-performing loans as a percentage of gross lending 8 0.59 % 0.43 % 1.46 %Other doubtful commitments as a percentage of gross lending 8 2.02 % 2.39 % 1.05 %
SolvencyCapital adequacy ratio 13.7 % 13.9 % 13.3 %Tier 1 capital ratio 11.0 % 10.8 % 9.5 %Tier1capital 3 644 3 448 3025Capitalbase 4 543 4 419 4225
Offices and staffingNumber of offices 2 2 2Number of full-time equivalents 7 108 104 99
SharesEarningspershareforperiod(wholeNOK)forremainingentity 11.39 11.47 12.5Earningspershareforperiod(wholeNOK)inc.discontinuedoperations 11.86 11.39 11.0
Note 1)Profitaftertaxasapercentageofaverageequity2)Totalnetinterestmargintodatethisyearinrelationto averagetotalassets(ATA)3)Totaloperatingexpenseasapercentageoftotal operating income4)Customerdepositsasapercentageoflendingtocustomers
5)Averagetotalassets(ATA)arecalculatedasanaverageof quarterlytotalassetsandasat1Januaryand31December6)Netlossasapercentageofaveragegrosslendingtodate this year7)Notincludingemployeesrelatingtodivestedoperations8)ThefiguresdisclosedincludeBNBank’soperationsinÅlesund
Financial Ratios
HomeThe Year 2011 About BN Bank Report of The Directors Financial Statement
History | Financial Ratios | Vision | BN Bank is back on the ball | The Board of Directors | Executive Management | Business description
5

t
VisionA vision must bring the company together, describe the basis for its existence and give all stakeholders around the company a common understanding of direction.
BNBank’svisionistomakebankingsimpleandpredictable.Thisvisionistheresultofalongprocesstowhichallthebank’semployeescontributed.Thevisionformsabasisformakingthebankuniqueandthepreferredchoicewithinthe market.
Many consumers believe that dealing with banks is not easy. Services and products seem complicated and the balance of power between the institution and customer is considered to be distorted in favour of the bank. BN Bank will be the bank which makes the complicated comprehensible to the man or woman in the street. Our products and services will be simple to establish and use. The bank will be transparent, clear and predictable.
Our customer will find that they make their own choices and have control over their own personal finances and that the bank acts and responds as expected.
ValuesThevisiongivesthebank’semployeesandotherstakeholdergroupsacommondirection,whilethebank’svaluesdescribewhatwilltakeusinthisdirection.Thebank’svaluesdescribethekeycharacteristicsofthewayinwhichwework in order to fulfil the vision.
BN Bank’s values are Committed, Effective and Open.
BN Bank employees shall contribute and feel a sense of ownership towards the work of the bank. They must “lean forward” in relation to shared tasks and think holistically. Employees shall seek out challenges, take responsibility and be able to change quickly. BN Bank employees shall be positive and stand together as one team.
BNBankemployeesshallsharetheloadtogetherandworksmartacrossdepartments.Theyshallutilisethebank’stools and carry out their duties correctly first time. They must be cost-focussed and endeavour to do things simply. Employees shall show initiative, be solution-focussed and have a high capacity to deliver. The organisation shall conti-nually seek out opportunities for improvement, both internally and for the customer.
Thecompany’scultureshallbecharacterisedbytrust,honesty,mutualrespectandopenness-bothwithinthecom-panyandoutwardlytowardsthecompany’scustomers.Thecommunicationwillbeopenandactive,evenwhenmis-takes have been made. BN Bank employees speak to and not about, and seek out the appropriate arena for different discussions.
StrategyIn December 2010, the board of directors of BN Bank adopted a new strategy for the bank. This new strategic plan is the result of a protracted process, during which the board and senior management worked together to define BN Bank’sinitiativeareasinthefutureandtheroleofthebankwithintheSpareBank1alliance.Thenewstrategicplanextends through to the end of 2016.
BN Bank aims to be a focussed niche bank which complements the owner banks and the SpareBank 1 alliance within the respective initiative areas.
Through specialist expertise within commercial property financing, BN Bank shall strengthen its position as a lead-ing player within the financing of commercial property with low risk in the primary markets of Eastern Norway and Trøndelag.
Within the private market, BN Bank shall be a leading direct bank with an emphasis on self-service, simple products and competitive conditions. During the period covered by the strategy, the bank shall expand its product spectrum in order to meet demand for banking services within the primary target groups.
BN Bank shall be cost-effective, have low risk and be simple and predictable for its customers. The bank shall have a clear profile for PM and BM out in the market.
An offensive growth strategy has been adopted within both the private market and the market for loans for commercial property. This growth will take place without the provision of additional capital from the shareholders. The positive margin development, the developments within the various financing sources and the effective use of capital are vital parameters for the opportunities to realise the growth and the strategy.
HomeThe Year 2011 About BN Bank Report of The Directors Financial Statement
History | Financial Ratios | Vision | BN Bank is back on the ball | The Board of Directors | Executive Management | Business description
6
t
BN Bank is back on the ball! BN Bank celebrated its 50th anniversary as an independent bank in 2011. When Icelandic owners took over the bank in 2004, thethendirectorofNorway’sFinancialSupervisoryAuthoritydescribedBNBankasthe«filletsteakintheNorwegianbank-ing industry». We were known as a small, simple, efficient market player backed by a solid knowledge of our trade. After yearsofshiftingownershipandmanagement,ourprincipalstrategyfor2012–2016is«backtobasics».Ourcustomerswillonce more find us to be an unpretentious and efficient bank, delivering simple, predictable and profitable banking services for their benefit. Our bond investors and owners will be able to rely on predictable returns from BN Bank because we will deliver on the back of a good, sound credit policy with low risk attached.
In the Corporate Market, our strategy is allied to that of our competent, simple, quick, solution-oriented and long-term partner in commercial property lending. Our experienced staff have excellent relations with long-term property owners, facilitators and transaction developers – and are often asked for advice by key players early on in the development process. Asignofqualityindeed!Alreadyin2011,ourstrategyhasbornefruit:wepassedanall-timehighinlendinginNovemberand have many exciting projects on the go in 2012.
In the Retail Market, our focus is on competent bank customers who want to manage their own accounts – and who have no need for customer advisors and in-branch services. BN Bank will be focused on good, simple, self-service solutions on digital surfaces. 2011 was a year of heavy investment to help realise this strategy, and we will shortly be launching new mobile banking, new tablet banking and new online banking services as well as new websites. We look forward to the day when a growing number of retail customers will discover that BN Bank delivers above all expectations!
To create the efficiency that BN Bank has been known for, cost leadership will be another important fundament of our strategy in the time ahead. We will therefore be implementing continual improvements in all our processes, with the aim ofoncemorebeingoneofNorway’smostefficientbanks.
Since our owners adopted a new strategy for BN Bank in 2010, a huge amount of hard work has been done to improve and streamline the Bank, both so as to give our customers a simpler banking experience and to ensure that our staff have a simple, efficient working day. And so BN Bank is back on the ball – and looking forward to another 50 years of serving the best interests of our customers, our owners, our investors and our staff.
GunnarHovlandManaging Director
HomeThe Year 2011 About BN Bank Report of The Directors Financial Statement
History | Financial Ratios | Vision | BN Bank is back on the ball | The Board of Directors | Executive Management | Business description
7

t
Members at 31 December 2011
Finn Haugan, Chair Managing Director, SpareBank 1 SMN. First elected in 2009; term of office expires in 2013.
Tore Medhus, Deputy chair Executive Vice-President Corporate Market, SpareBank 1 SR-Bank. First elected in 2009; term of office expires in 2013.
Stig- Arne Engen Executive Vice-President Retail Market, SpareBank 1 Nord-Norge. First elected in 2009; term of office expires in 2012.
Harald Gaupen Bank Administrative Manager, SpareBank 1 Buskerud-Vestfold. First elected in 2009; term of office expires in 2012.
Helene Jebsen Anker Self-employed consultant. First elected in 2009; term of office expires in 2012.
Ella Skjørestad GroupHeadofMarketing,Sparebank1SR-Bank.Firstelectedin2011;termofofficeexpiresin2012.
Kristin Undheim Partner in Indianer AS. First elected in 2009; term of office expires in 2012.
Anita Finserås Bretun Customer Service Officer, BN Bank. Employee representative. First elected in 2011; term of office expires in 2013.
Deputy members
Hans Olav Karde Managing Director, SpareBank 1 Nord-Norge
Tor Dahle Managing Director, SR-Investering.
Eli Ystad GroupCEO,SpareBank1SMN.
Tove Hassel Secretary, BN Bank ASA, deputy for employee representative. First elected in 2009; term of office expires in 2013.
The Board of Directors
HomeThe Year 2011 About BN Bank Report of The Directors Financial Statement
History | Financial Ratios | Vision | BN Bank is back on the ball | The Board of Directors | Executive Management | Business description
8

t
GunnarHovland| Managing Director
GunnarHovland(born1965)isManagingDirectorofBNBankASA.HovlandholdsthedegreeCandAgricfromtheAgriculturalUniversityofNorway(nowtheUniversityofLifeSciences)andhasanMBAinEconomicsandManagementfromtheNorwegianSchoolofEconomics.GunnarHovland comes to BN Bank ASA from the combined post of Managing Director of the energy companyTrondheimKraftandDeputyManagingDirectoroftheenergycompanyFjordkraft.Hovland has also held management posts with the dairy co-operative Tine BA and has broad directorship experience from a range of industries.
Svend Lund | Deputy managing Director
SvendLund(born1970)isDeputyManagingDirectorofBNBankASA.Hisareasofresponsibi-lity also include Corporate Market and Operations. He was previously employed by Fokus Bank. Lund received his education in Accountancy and Auditing at Trondheim Business School and in Strategy and Management at BI Norwegian Business School.
Trond Søraas | Finance and Treasury Director/CFO
TrondSøraas(born1968)isFinanceandTreasuryDirector/CFOofBNBankASA.HecomesfromthepostofFinancialManageratKLPBankenASandKLPKommunekredittAS.SøraasholdsthedegreeofSiviløkonom(Master’sdegreeinEconomicsandBusinessAdministration)fromthe Norwegian School of Economics and is also an authorised financial analyst from the same institution.
Rune Rasmussen | Director Risk Management
RuneRasmussenholds aMaster’s degree in Statistics from theNorwegianUniversity ofScience and Technology in Trondheim and has also studied a variety of other subjects at BI Trondheim Business School. He was previously employed by the bank DnB NOR and as a guest lecturer(universitylecturer)atBITrondheimBusinessSchool.
Executive Management
HomeThe Year 2011 About BN Bank Report of The Directors Financial Statement
History | Financial Ratios | Vision | BN Bank is back on the ball | The Board of Directors | Executive Management | Business description
9

t
Business description
ThevisionoftheBNBankGroupistomakebankingsimpleandpredictable.Webelievethatsimplicityandpredictabilitywill secure the long-term profitability of BN Bank and make it an attractive employer. The overarching objective for BN Bankistoachieveoptimumreturnsonequitywithinthebusiness’sparameters.
BNBank’sstrategyistobeafocusednichebankandtoprovidecomplementaryservicestothoseoftheownerbankswithin their strategic areas. In the corporate market the Bank shall be a leading specialist bank for financing commercial properties and in the retail market a leading direct bank with the focus on deposits and residential mortgage loans. In addition to these areas, the Bank will also eventually offer a variety of SpareBank 1 products. BN Bank shall have a low risk profile, and be cost-effective, simple and predictable.
BNBank’sactivityisnationwideinNorwayandconcentratedinthetwocorebusinessareasofretailbankingandcor-poratebanking.BNBankhasitsheadofficeinTrondheimandabranchofficeinOslo.TheBNBankGroupisstructuredasfollows:
BN Bank ASA
BNkreditt AS BN Boligkreditt AS
Managing DirectorGunnar Hovland
Director Corporate marketSvend Lund
Finance and Treasury Director/CFOTrond Søraas
Director Risk ManagementRune Rasmussen
Director Retail marketGunnar Hovland
HomeThe Year 2011 About BN Bank Report of The Directors Financial Statement
History | Financial Ratios | Vision | BN Bank is back on the ball | The Board of Directors | Executive Management | Business description
10
t
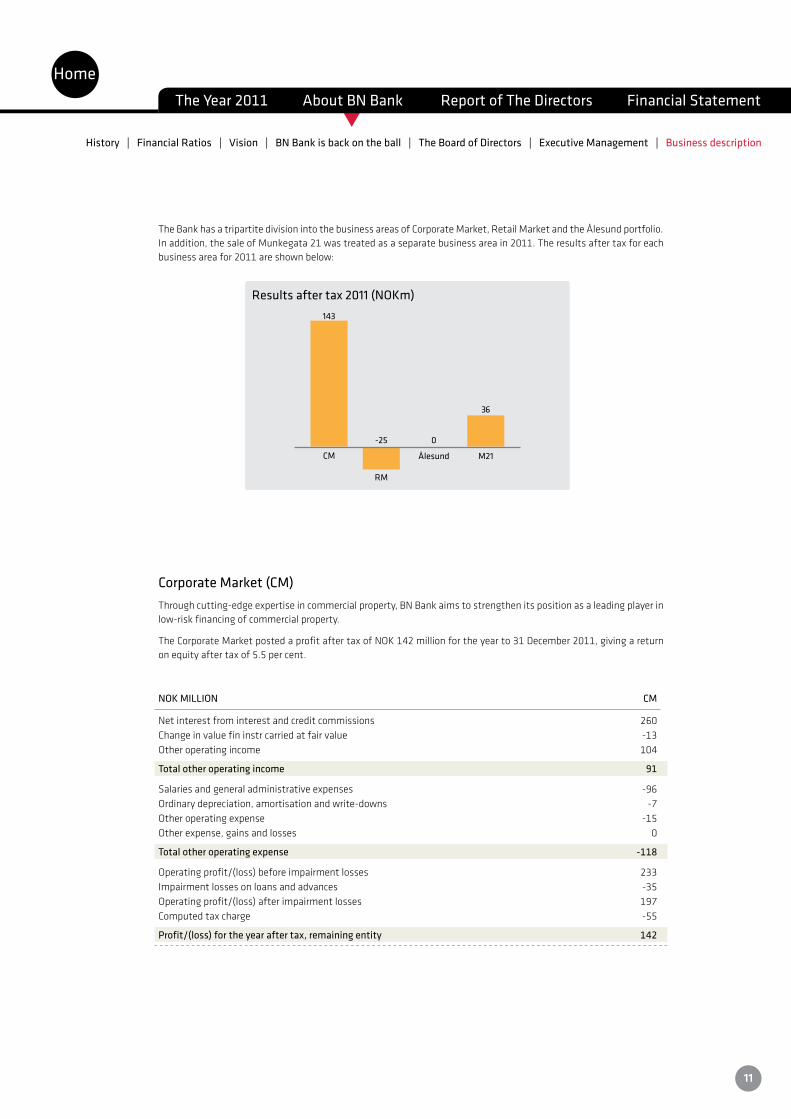
The Bank has a tripartite division into the business areas of Corporate Market, Retail Market and the Ålesund portfolio. In addition, the sale of Munkegata 21 was treated as a separate business area in 2011. The results after tax for each businessareafor2011areshownbelow:
143
-25 0
36
CM
RM
Ålesund M21
Results after tax 2011 (NOKm)
Corporate Market (CM)Through cutting-edge expertise in commercial property, BN Bank aims to strengthen its position as a leading player in low-risk financing of commercial property.
TheCorporateMarketpostedaprofitaftertaxofNOK142millionfortheyearto31December2011,givingareturnon equity after tax of 5.5 per cent.
NOK MILLION CM
Net interest from interest and credit commissions 260Change in value fin instr carried at fair value -13Other operating income 104
Total other operating income 91
Salaries and general administrative expenses -96Ordinary depreciation, amortisation and write-downs -7Other operating expense -15Other expense, gains and losses 0
Total other operating expense -118
Operatingprofit/(loss)beforeimpairmentlosses 233Impairment losses on loans and advances -35Operatingprofit/(loss)afterimpairmentlosses 197Computed tax charge -55
Profit/(loss) for the year after tax, remaining entity 142
HomeThe Year 2011 About BN Bank Report of The Directors Financial Statement
History | Financial Ratios | Vision | BN Bank is back on the ball | The Board of Directors | Executive Management | Business description
11
t
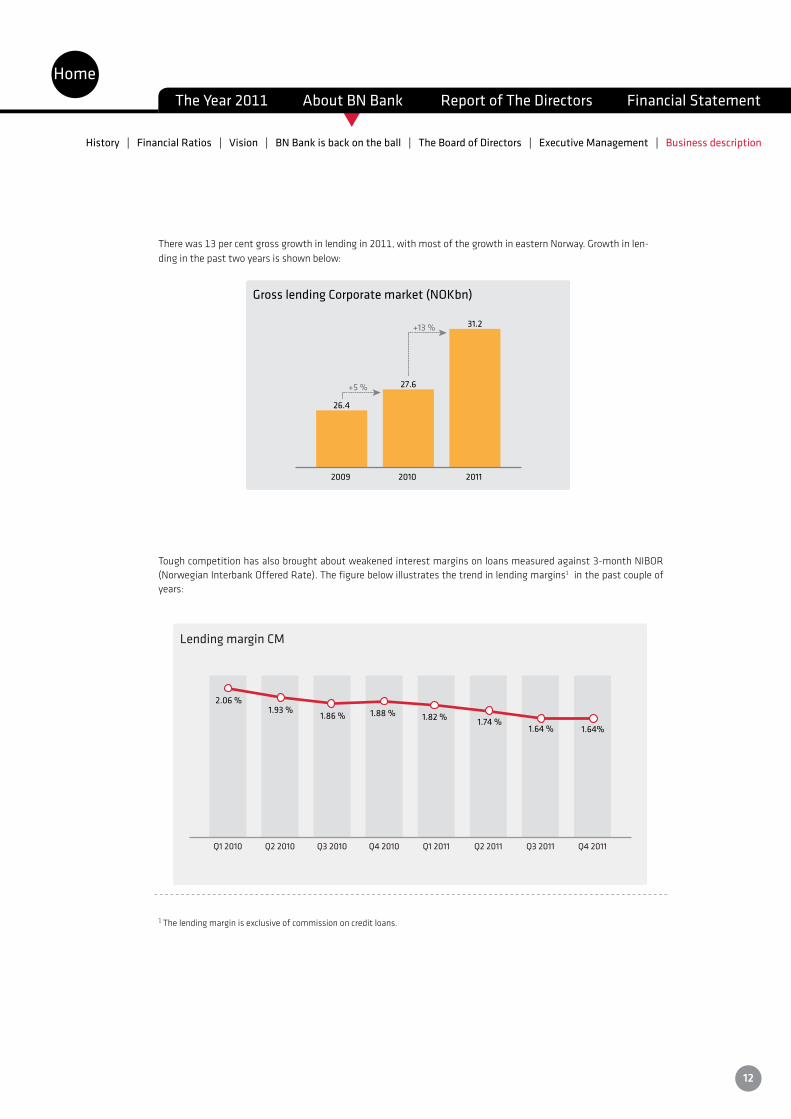
Therewas13percentgrossgrowthinlendingin2011,withmostofthegrowthineasternNorway.Growthinlen-dinginthepasttwoyearsisshownbelow:
26.4
31.2
27.6+5 %
Gross lending Corporate market (NOKbn)
+13 %
2009 2011 2010
Tough competition has also brought about weakened interest margins on loans measured against 3-month NIBOR (NorwegianInterbankOfferedRate).Thefigurebelowillustratesthetrendinlendingmargins1 in the past couple of years:
Q1 2010 Q2 2010 Q3 2010 Q4 2010 Q1 2011 Q2 2011 Q3 2011
2.06 %1.93 %
1.86 % 1.88 % 1.82 % 1.74 %1.64 % 1.64%
Q4 2011
Lending margin CM
1 The lending margin is exclusive of commission on credit loans.
HomeThe Year 2011 About BN Bank Report of The Directors Financial Statement
History | Financial Ratios | Vision | BN Bank is back on the ball | The Board of Directors | Executive Management | Business description
12
t
FortheBNBankGroup,thefigurefornon-performingloansasapercentageofgrosslendingincreasedby0.22per-centagepointsfrom2010andisnow0.55percentofgrosslending.IncludingtheloanportfolioinSpareBank1Næ-ringskreditt, non-performing loans as a percentage of gross lending as at 31 December 2011 was 0.40 per cent, which is 0.16 percentage points up from 31 December 2010. BN Bank is highly focused on the quality of the portfolio and on monitoring and following up doubtful loans and commitments.
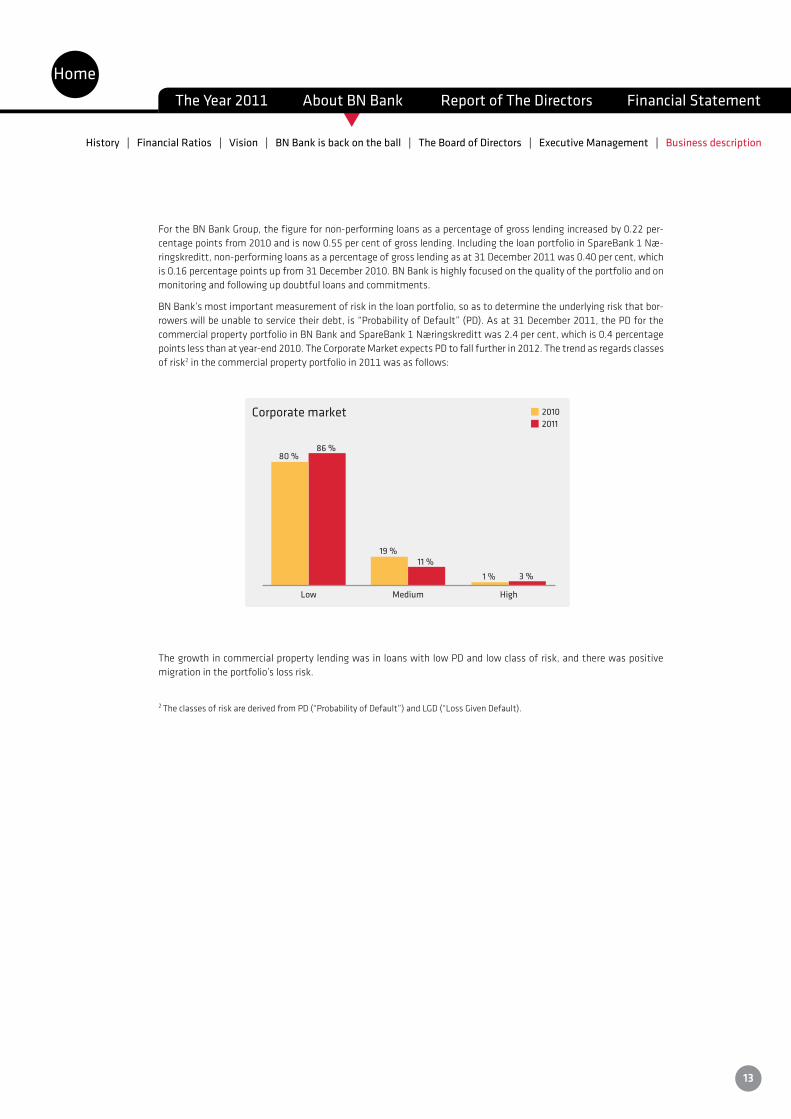
BNBank’smostimportantmeasurementofriskintheloanportfolio,soastodeterminetheunderlyingriskthatbor-rowerswillbeunabletoservicetheirdebt,is“ProbabilityofDefault”(PD).Asat31December2011,thePDforthecommercialpropertyportfolioinBNBankandSpareBank1Næringskredittwas2.4percent,whichis0.4percentagepoints less than at year-end 2010. The Corporate Market expects PD to fall further in 2012. The trend as regards classes of risk2inthecommercialpropertyportfolioin2011wasasfollows:
80 % 86 %
Low
1 % 3 %
High
2010
19 % 11 %
Medium
Corporate market2011
The growth in commercial property lending was in loans with low PD and low class of risk, and there was positive migrationintheportfolio’slossrisk.
2 TheclassesofriskarederivedfromPD(“ProbabilityofDefault”)andLGD(“LossGivenDefault).
HomeThe Year 2011 About BN Bank Report of The Directors Financial Statement
History | Financial Ratios | Vision | BN Bank is back on the ball | The Board of Directors | Executive Management | Business description
13
t
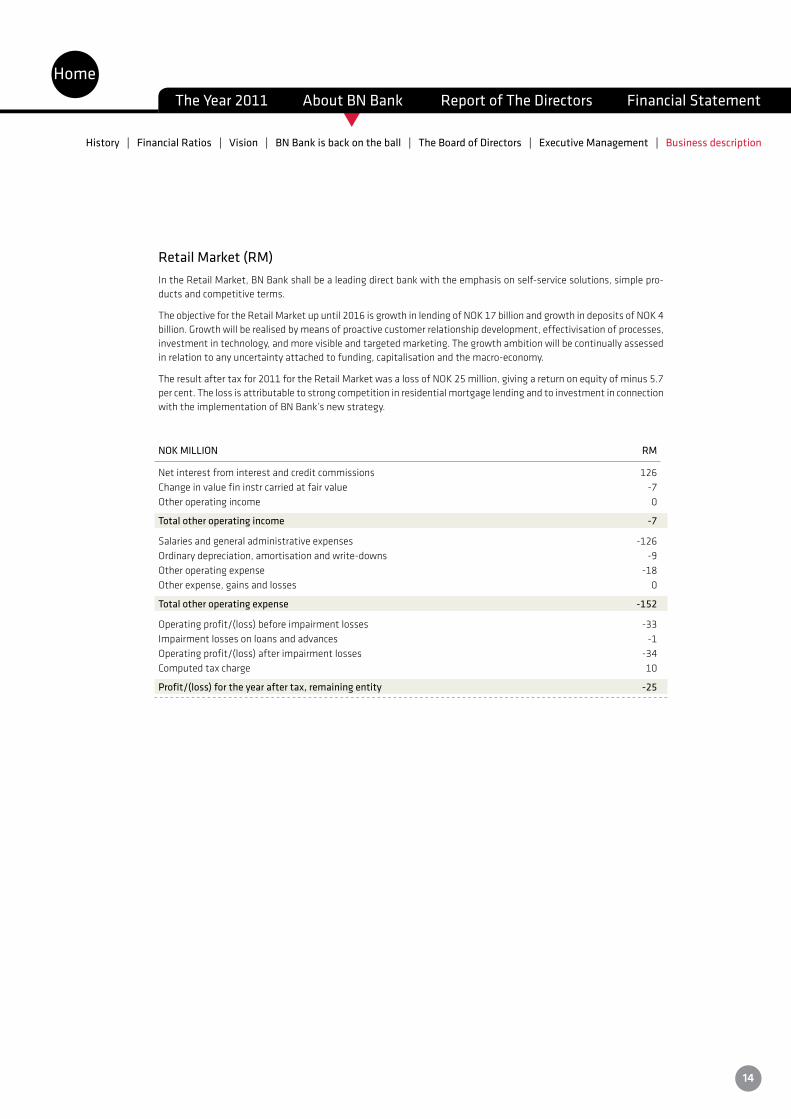
Retail Market (RM)In the Retail Market, BN Bank shall be a leading direct bank with the emphasis on self-service solutions, simple pro-ducts and competitive terms.
TheobjectivefortheRetailMarketupuntil2016isgrowthinlendingofNOK17billionandgrowthindepositsofNOK4billion.Growthwillberealisedbymeansofproactivecustomerrelationshipdevelopment,effectivisationofprocesses,investment in technology, and more visible and targeted marketing. The growth ambition will be continually assessed in relation to any uncertainty attached to funding, capitalisation and the macro-economy.
Theresultaftertaxfor2011fortheRetailMarketwasalossofNOK25million,givingareturnonequityofminus5.7per cent. The loss is attributable to strong competition in residential mortgage lending and to investment in connection withtheimplementationofBNBank’snewstrategy.
NOK MILLION RM
Net interest from interest and credit commissions 126Change in value fin instr carried at fair value -7Other operating income 0
Total other operating income -7
Salaries and general administrative expenses -126Ordinary depreciation, amortisation and write-downs -9Other operating expense -18Other expense, gains and losses 0
Total other operating expense -152
Operatingprofit/(loss)beforeimpairmentlosses -33Impairment losses on loans and advances -1Operatingprofit/(loss)afterimpairmentlosses -34Computed tax charge 10
Profit/(loss) for the year after tax, remaining entity -25
HomeThe Year 2011 About BN Bank Report of The Directors Financial Statement
History | Financial Ratios | Vision | BN Bank is back on the ball | The Board of Directors | Executive Management | Business description
14
t
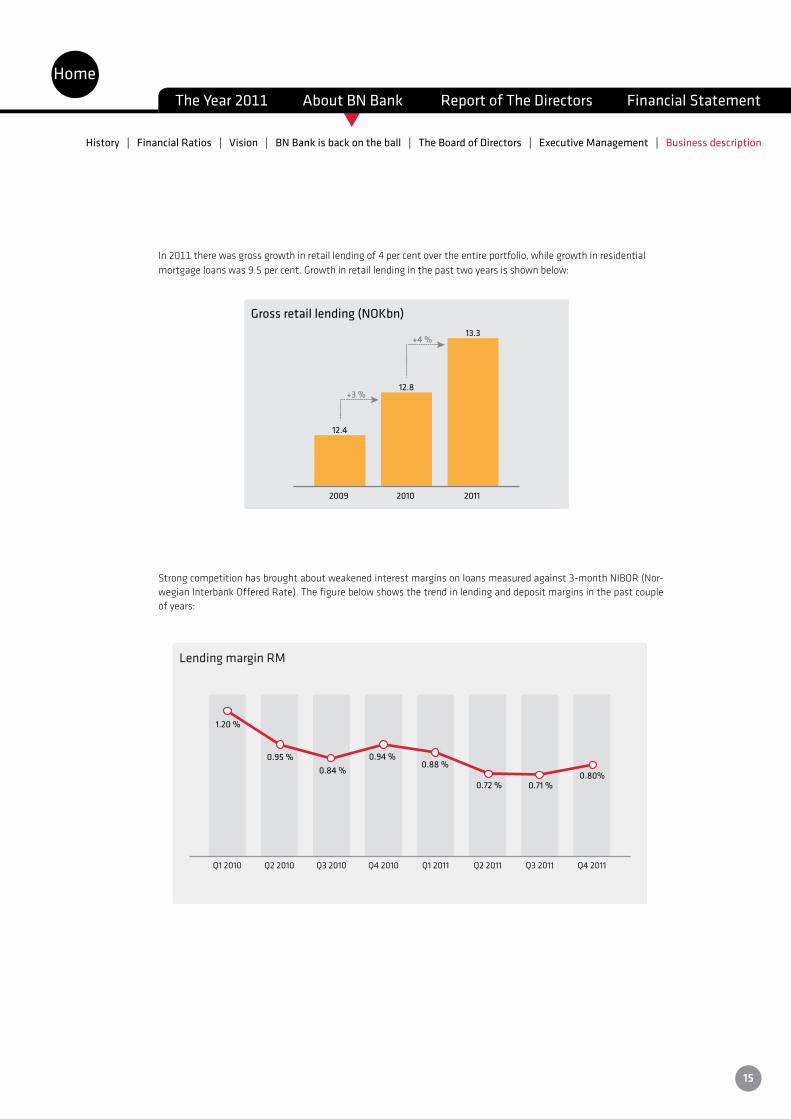
In 2011 there was gross growth in retail lending of 4 per cent over the entire portfolio, while growth in residential mortgageloanswas9.5percent.Growthinretaillendinginthepasttwoyearsisshownbelow:
12.4
13.3
12.8+3 %
Gross retail lending (NOKbn)
+4 %
2009 2011 2010
Strongcompetitionhasbroughtaboutweakenedinterestmarginsonloansmeasuredagainst3-monthNIBOR(Nor-wegianInterbankOfferedRate).Thefigurebelowshowsthetrendinlendinganddepositmarginsinthepastcoupleofyears:
Q1 2010 Q2 2010 Q3 2010 Q4 2010 Q1 2011 Q2 2011 Q3 2011
1.20 %
0.95 %0.84 %
0.94 %0.88 %
0.72 % 0.71 %0.80%
Q4 2011
Lending margin RM
HomeThe Year 2011 About BN Bank Report of The Directors Financial Statement
History | Financial Ratios | Vision | BN Bank is back on the ball | The Board of Directors | Executive Management | Business description
15
t
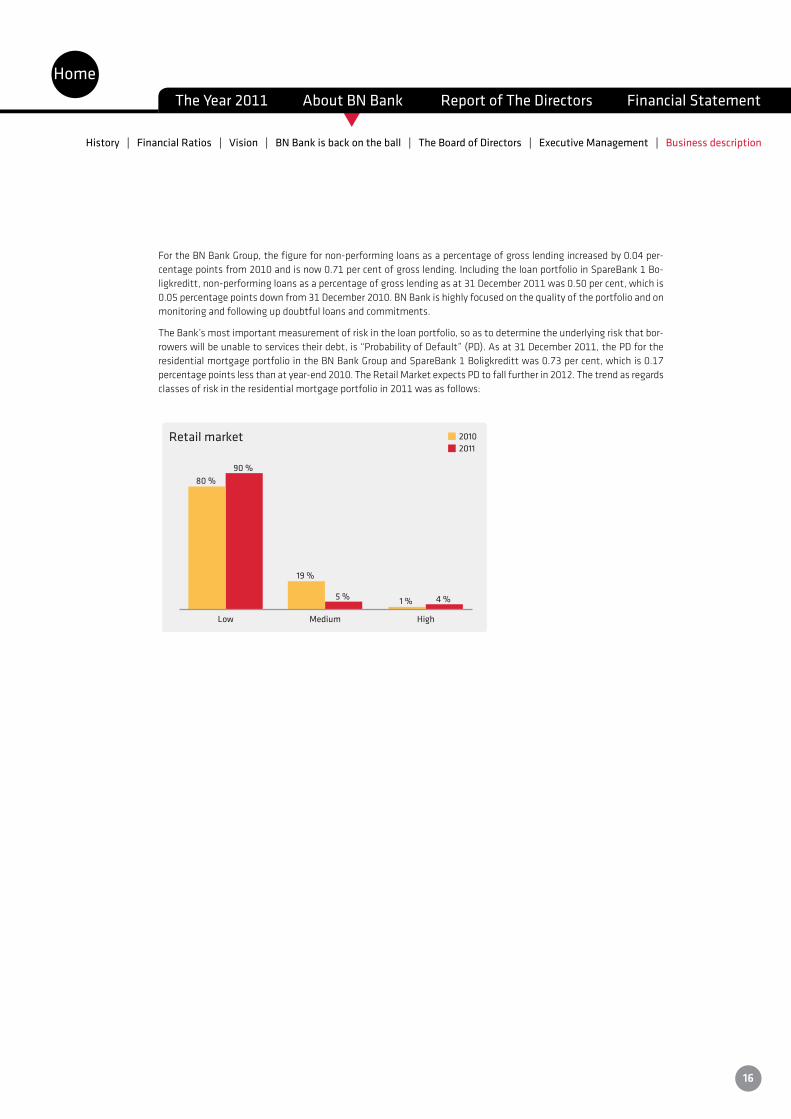
FortheBNBankGroup,thefigurefornon-performingloansasapercentageofgrosslendingincreasedby0.04per-centage points from 2010 and is now 0.71 per cent of gross lending. Including the loan portfolio in SpareBank 1 Bo-ligkreditt, non-performing loans as a percentage of gross lending as at 31 December 2011 was 0.50 per cent, which is 0.05 percentage points down from 31 December 2010. BN Bank is highly focused on the quality of the portfolio and on monitoring and following up doubtful loans and commitments.
TheBank’smostimportantmeasurementofriskintheloanportfolio,soastodeterminetheunderlyingriskthatbor-rowerswillbeunabletoservicestheirdebt,is“ProbabilityofDefault”(PD).Asat31December2011,thePDfortheresidentialmortgageportfoliointheBNBankGroupandSpareBank1Boligkredittwas0.73percent,whichis0.17percentage points less than at year-end 2010. The Retail Market expects PD to fall further in 2012. The trend as regards classesofriskintheresidentialmortgageportfolioin2011wasasfollows:
80 % 90 %
Low
1 % 4 %
High
2010
19 %
5 %
Medium
Retail market2011
HomeThe Year 2011 About BN Bank Report of The Directors Financial Statement
History | Financial Ratios | Vision | BN Bank is back on the ball | The Board of Directors | Executive Management | Business description
16
t
Summary of 2011 BNBankASA(BNBank/theBank)reportedaconsolidatedprofitfor2011ofNOK154million.Thisisequivalenttoa5percentreturnonequityaftertax.GrowthwithintheBNBankGroup’scoreareaswasgood,with13percentgrowthinlending for commercial properties and 9 per cent growth in lending for residential properties. The position is good as re-gardsBNBank’ssolvencyandfunding.Asat31December2011,BNBankhada“core”tier1capitalratioof9.5percent.
As a result of higher borrowing costs for BN Bank and an increasingly competitive situation, especially in residential mortgage loans, lending margins declined in 2011. Margins on deposits did, however, improve. Adjusted for the sale oftheBank’sformerheadoffices,thelevelofcostswashigherin2011thanin2010.BNBankplanstoreduceitscostlevels in 2012.
Consolidatedprofitaftertaxfor2011wasNOK154millionfortheBNBankGroup,asagainstNOK141millionfor2010. Compared with 2010, the Bank has had lower other operating expenses, reduced losses and higher total income in 2011.
Non-performing loans as a percentage of gross lending have increased by 0.16 percentage points compared with 2010 and the figure is now 0.59 per cent of gross lending1. The increase is mainly attributable to non-performing loans on commercial properties. The Bank will continue to focus closely on the quality of the loan portfolio and on monitoring and following up doubtful loan commitments.
BNBank’sfundingsituationisgood.In2011theBankissuedordinaryseniorbondsandcertificatesintheNorwegianbondmarketforatotalofalmostNOK10billion.
TheBank’scapitaladequacyratioandtier1capitalratiowere,respectively,13.7and11.0percentasat31December2011, compared with 13.9 and 10.8 per cent respectively at the start of 2011. The corresponding figures for the “core” tier 1 capital ratio were 9.5 and 9.4 per cent respectively.
BNBank’stotalassetsstoodatNOK40.7billionasat31December2011,whichisNOK0.5billiondownonthepast12months. The decrease is largely attributable to the transfer to SpareBank 1 SMN in the past year of assets classified asheldforsale.Grosslending2totalledNOK45.7billionasat31December2011,whichisNOK3.4billion(8percent)uponthepastyear.Oftheincreaseingrosslending,corporatelendingaccountedforNOK3.6billionandretaillendingforNOK0.5billion,whileseller’scredittoSparebank1SMNaccountedforadecreaseofNOK0.7billion.Depositsasat31December2011totalledNOK16.0billion.
Operations, objectives and strategy BNBank’svisionistomakebankingsimpleandpredictable.BNBank’sbusinessconceptis:
With good products and competent staff, BN Bank shall make banking services simple and predictable, in order to secure long-term profitability and make the Bank an attractive employer.
TheBank’scorevaluesarecommitment,efficiencyandopenness.
BN Bank has put in place a future-oriented strategy based on the two-fold objective of being a direct bank serving the retail market and a specialist bank for commercial real estate serving the corporate market. In these areas, BN Bank aims to pursue a complementary activity to the operations of the owner banks. In the retail market, the Bank shall be a leading direct bank focused on competitive terms and self-service solutions. In the corporate market, the Bank shall bealeadingbankforfinancingcommercialrealestate,withthemainfocusonEasternNorwayandTrøndelag(CentralNorway).BNBankshallhavealowriskprofileandbeknownforsimplicity,predictabilityandcost-effectiveness.
BN Bank prepares a new funding strategy every year. Deposits, senior bonds issued in the Norwegian bond market andcoveredbondsfromtheSpareBank1consortium’screditinstitutionswillbetheBank’smostimportantsourcesof funding.
BNBank’sactivityisnationwideinNorwayandconcentratedinthetwocorebusinessareasofretailbankingandcorpo-rate banking. BN Bank has its head office in Trondheim and a branch office in Oslo. In 2011, the Bank sold its old head office and has now relocated to premises better adapted to its operations in the new SpareBank 1 block in Trondheim.
1 Including the Ålesund portfolio2GrosslendingisthesumtotalofcorporateandretaillendinginBNBank,SpareBank1Næringskreditt,SpareBank1Boligkredittandloans to SpareBank 1 SMN.
Report of the Directors
HomeThe Year 2011 About BN Bank Report of The Directors Financial Statement
17
t
Financial developmentsBN Bank presents its consolidated and separate financial statements in compliance with International Financial Repor-tingStandards(IFRS).SeeNote1formoreinformation.
Profit performance for 2011 The results of the operations in Ålesund that were sold to Sparebank 1 SMN, but not transferred, are separated out in thefinancialstatementsin“Resultofoperationsunderdivestment”,sothat“Profit/(loss)forperiod,remainingentity”reflectstheresultsoftheremainingentity(continuingoperations)withincommercialrealestate,theretailmarketandthe portfolio transferred to Sparebank 1 SMN, but where the loss guarantee lies with BN Bank. All activity in Ålesund is referred to as the “Ålesund portfolio”.
ProfitaftertaxfortheremainingentitywasNOK148millionin2011,comparedwithNOK142millionin2010.Con-solidatedprofitaftertaxfortheBNBankGroupwasNOK154millionfor2011,asagainstNOK141millionin2010,giving a return on equity of 5.0 per cent in 2011. The increase in post-tax profit including discontinued operations is attributabletothesaleoftheBank’sformerheadoffice,areductioninlosses,andanincreaseintotalincomein2011compared with 2010.
Withrespectto“operationsunderdivestment”,attheendof2011therestillremainedloansforNOK101milliontobetransferredfromtheoriginalÅlesundportfolioofNOK4.8billion.Theseremainingcustomerloanaccountsareexpected to be converted during the first quarter of 2012. At the same point in time, the guarantee portfolio is valued atNOK3.1billion.Theguaranteeportfoliohasremainedvirtuallyunchangedinthepastyear.
TheresultoftheoperationsinÅlesundfor2011wasNOK0million,ascomparedtoalossofNOK14millionfor2010.
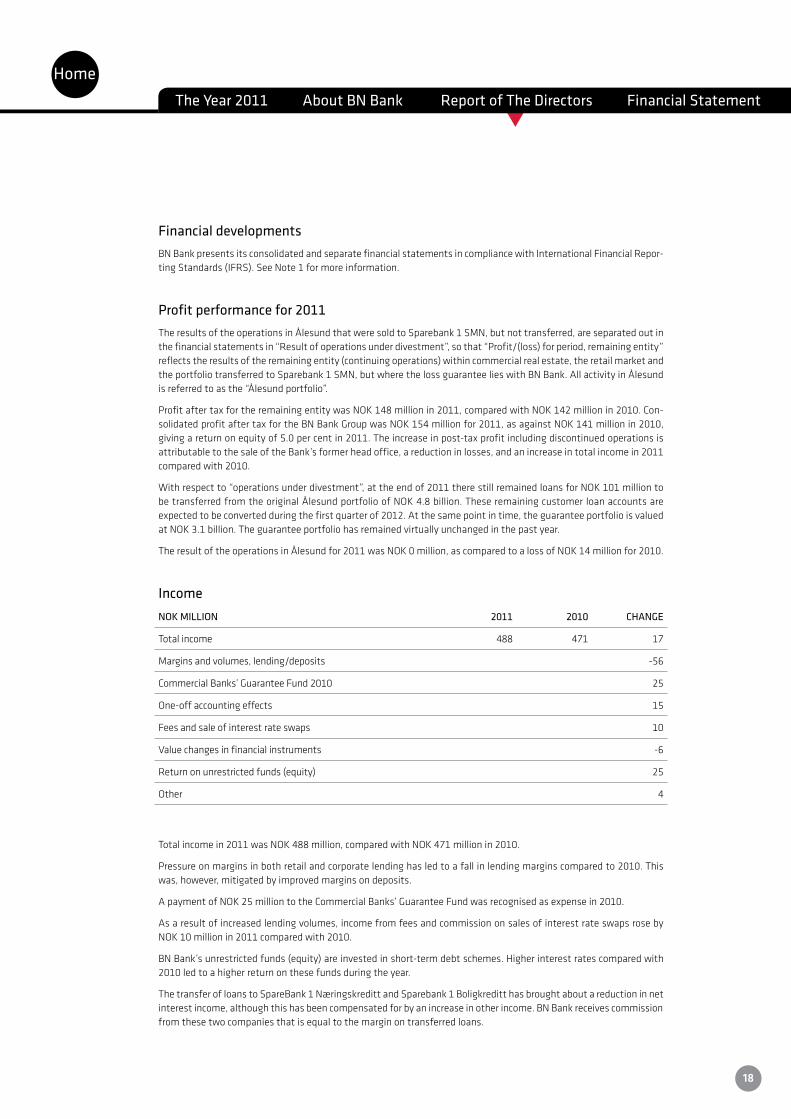
IncomeNOK MILLION 2011 2010 CHANGE
Total income 488 471 17
Margins and volumes, lending/deposits -56
CommercialBanks’GuaranteeFund2010 25
One-off accounting effects 15
Fees and sale of interest rate swaps 10
Value changes in financial instruments -6
Returnonunrestrictedfunds(equity) 25
Other 4
Totalincomein2011wasNOK488million,comparedwithNOK471millionin2010.
Pressure on margins in both retail and corporate lending has led to a fall in lending margins compared to 2010. This was, however, mitigated by improved margins on deposits.
ApaymentofNOK25milliontotheCommercialBanks’GuaranteeFundwasrecognisedasexpensein2010.
As a result of increased lending volumes, income from fees and commission on sales of interest rate swaps rose by NOK10millionin2011comparedwith2010.
BNBank’sunrestrictedfunds(equity)areinvestedinshort-termdebtschemes.Higherinterestratescomparedwith2010 led to a higher return on these funds during the year.
ThetransferofloanstoSpareBank1NæringskredittandSparebank1Boligkreditthasbroughtaboutareductioninnetinterest income, although this has been compensated for by an increase in other income. BN Bank receives commission from these two companies that is equal to the margin on transferred loans.
HomeThe Year 2011 About BN Bank Report of The Directors Financial Statement
18
t
BNBank’sderivatives,somebondborrowingsandtheentireliquidityportfolioarecarriedatfairvalue.TheBank’sin-terest rate risk and exchange rate risk are both low, and fluctuations in interest rates and exchange rates should have a limited net profit-and-loss effect. During periods when interest rate spreads between different instruments develop differently, profit-and-loss effects may arise. The market situation and the substantial fluctuations in interest rates and exchange rates have previously caused increased fluctuations in the value of financial instruments and greater volatility in changes in value. To reduce the volatility, since 2010 the Bank has used hedge accounting on new fixed-rate borrowings.In2011,valuechangeshadanegativeeffectonoperatingincomebyNOK20million,whichisanegativechangeofNOK6millioncomparedwith2010.Formoreinformationconcerningthesevaluechanges,seeNote4.
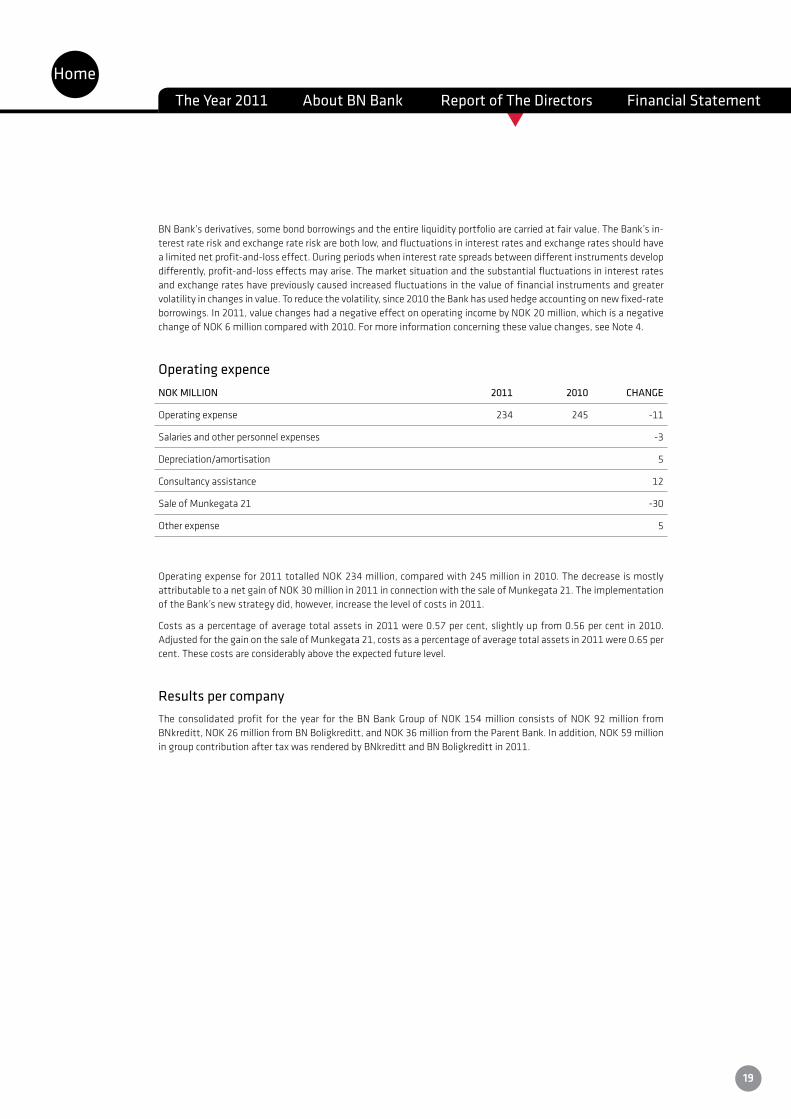
Operating expence NOK MILLION 2011 2010 CHANGE
Operating expense 234 245 -11
Salaries and other personnel expenses -3
Depreciation/amortisation 5
Consultancy assistance 12
Sale of Munkegata 21 -30
Other expense 5
Operatingexpensefor2011totalledNOK234million,comparedwith245millionin2010.Thedecreaseismostly attributabletoanetgainofNOK30millionin2011inconnectionwiththesaleofMunkegata21.TheimplementationoftheBank’snewstrategydid,however,increasethelevelofcostsin2011.
Costs as a percentage of average total assets in 2011 were 0.57 per cent, slightly up from 0.56 per cent in 2010. Adjusted for the gain on the sale of Munkegata 21, costs as a percentage of average total assets in 2011 were 0.65 per cent. These costs are considerably above the expected future level.
Results per companyTheconsolidatedprofit for theyear for theBNBankGroupofNOK154million consistsofNOK92million from BNkreditt,NOK26millionfromBNBoligkreditt,andNOK36millionfromtheParentBank.Inaddition,NOK59millionin group contribution after tax was rendered by BNkreditt and BN Boligkreditt in 2011.
HomeThe Year 2011 About BN Bank Report of The Directors Financial Statement
19
t
Write-downs on loansWithdeductionsforindividualwrite-downs,non-performinganddoubtfulloanstotalledNOK766millionattheendofthefourthquarterof2011,whichisdownbyNOK98millionon31December2010.Thisincludesnon-performinganddoubtful loans in the Ålesund portfolio. Non-performing loans were 0.59 per cent of gross lending as at 31 December 2011(includingtheÅlesundportfolio),comparedwith0.43percentasat31December2010.Theincreaseisattributa-ble to a higher rate of non-performing commercial property loans. The Bank will continue to focus closely on the quality of the portfolio and on monitoring and following up doubtful loan commitments. See Note 12 for more information about non-performing and doubtful loans.
Fortheremainingentity(continuingoperations),impairmentlossesonloansandadvancestotalledNOK62millionin2011,comparedwithNOK32millionin2010.Impairmentlossesin2011comprisedNOK35millionincorporatelending(0.11percentofgrosslendingoncommercialrealestate3),NOK1millioninretaillending(0.01percentofgrossretaillending4),andNOK26millionintheportfoliosoldtoSpareBankISMN5(0.91percentofgrosslendingintheÅlesundportfolio).ImpairmentlossesonloansandadvancesintheÅlesundportfoliototalledNOK26millionin2011,comparedwithNOK38millionin2010.ForBNBankasawhole,impairmentlossesonloansandadvancestotalledNOK62million,whichisNOK8millionlessthanin2010.
LoanlossprovisionsfortheremainingentitywereNOK179millionasat31December2011.Ofthissum,collectivewrite-downstotalledNOK85million,whichis0.25percentofgrosslending.Individualwrite-downstotalledNOK94millionasat31December2011.LoanlossprovisionsfortheÅlesundportfolioasat31December2011totalledNOK50million,ofwhichNOK20millionwerecollectivewrite-downsandNOK30millionindividualwrite-downs.
Recommended allocation of profit for the year TheBoardofDirectorsrecommendsthattheParentBank’sprofitfortheperiodofNOK95millionbeallocatedasdividends. The Board recommends an issue of shares for an equivalent amount.
Thecompany’sunrestrictedequityaftertherecommendedallocationfortheperiodisNOK603million.
Balance Sheet BNBank’stotalassetswereNOK40.7billionasat31December2011,whichisNOK0.5billiondownonthepast12months. The decrease is primarily owing to assets classified as held for sale being transferred in the past year to SpareBank 1 SMN.
During2011,loansforNOK1.6billionweretransferredtoSpareBank1BoligkredittandloansforNOK1.0billiontoSpareBank1Næringskreditt.
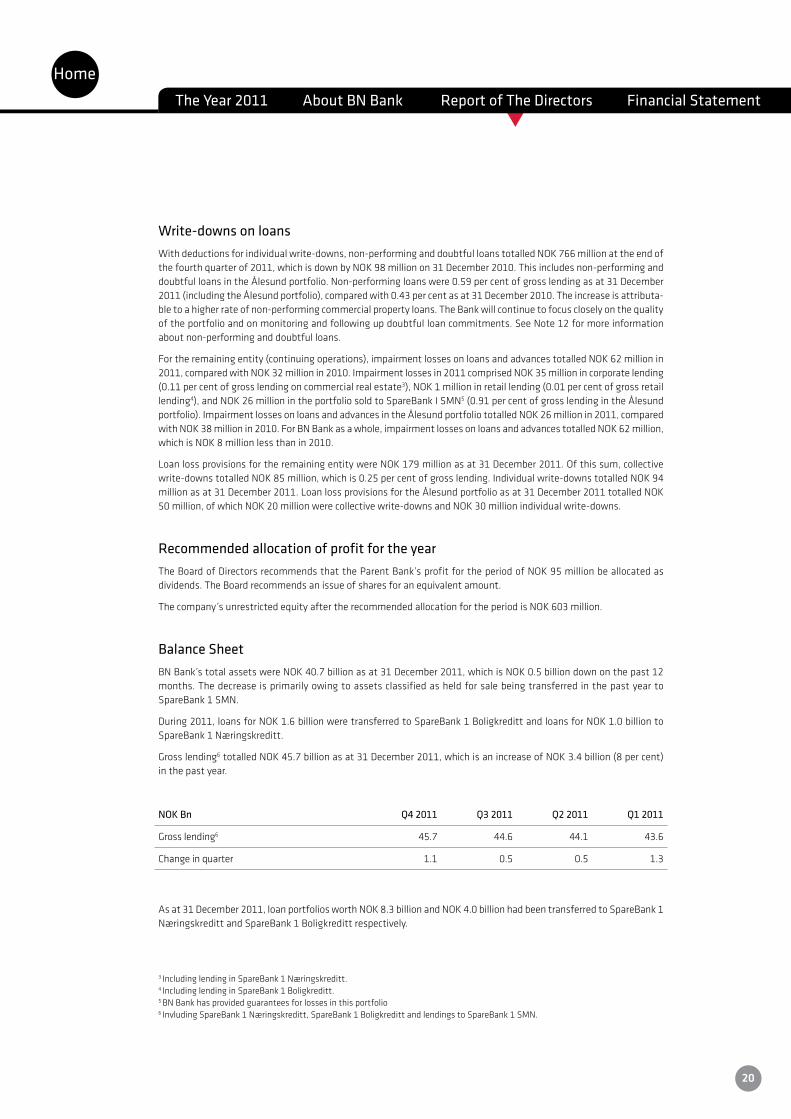
Grosslending6totalledNOK45.7billionasat31December2011,whichisanincreaseofNOK3.4billion(8percent)in the past year.
NOK Bn Q4 2011 Q3 2011 Q2 2011 Q1 2011
Grosslending6 45.7 44.6 44.1 43.6
Change in quarter 1.1 0.5 0.5 1.3
Asat31December2011,loanportfoliosworthNOK8.3billionandNOK4.0billionhadbeentransferredtoSpareBank1 NæringskredittandSpareBank1Boligkredittrespectively.
3 IncludinglendinginSpareBank1Næringskreditt.4 Including lending in SpareBank 1 Boligkreditt.5 BN Bank has provided guarantees for losses in this portfolio6 InvludingSpareBank1Næringskreditt,SpareBank1BoligkredittandlendingstoSpareBank1SMN.
HomeThe Year 2011 About BN Bank Report of The Directors Financial Statement
20
t
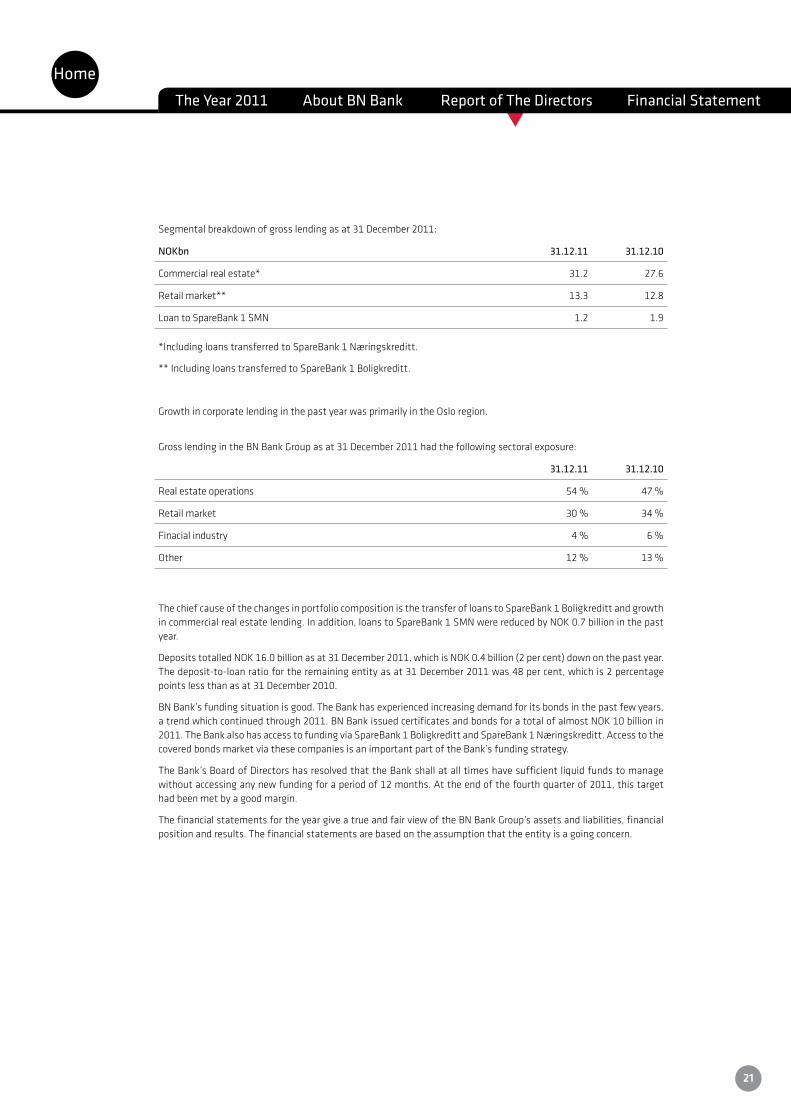
Segmentalbreakdownofgrosslendingasat31December2011:
NOKbn 31.12.11 31.12.10
Commercial real estate* 31.2 27.6
Retail market** 13.3 12.8
Loan to SpareBank 1 SMN 1.2 1.9
*IncludingloanstransferredtoSpareBank1Næringskreditt.
** Including loans transferred to SpareBank 1 Boligkreditt.
GrowthincorporatelendinginthepastyearwasprimarilyintheOsloregion.
GrosslendingintheBNBankGroupasat31December2011hadthefollowingsectoralexposure:
31.12.11 31.12.10
Real estate operations 54 % 47 %
Retail market 30 % 34 %
Finacial industry 4 % 6 %
Other 12 % 13 %
The chief cause of the changes in portfolio composition is the transfer of loans to SpareBank 1 Boligkreditt and growth incommercialrealestatelending.Inaddition,loanstoSpareBank1SMNwerereducedbyNOK0.7billioninthepastyear.
DepositstotalledNOK16.0billionasat31December2011,whichisNOK0.4billion(2percent)downonthepastyear.The deposit-to-loan ratio for the remaining entity as at 31 December 2011 was 48 per cent, which is 2 percentage points less than as at 31 December 2010.
BNBank’sfundingsituationisgood.TheBankhasexperiencedincreasingdemandforitsbondsinthepastfewyears,atrendwhichcontinuedthrough2011.BNBankissuedcertificatesandbondsforatotalofalmostNOK10billionin2011.TheBankalsohasaccesstofundingviaSpareBank1BoligkredittandSpareBank1Næringskreditt.AccesstothecoveredbondsmarketviathesecompaniesisanimportantpartoftheBank’sfundingstrategy.
TheBank’sBoardofDirectorshasresolvedthattheBankshallatalltimeshavesufficientliquidfundstomanagewithout accessing any new funding for a period of 12 months. At the end of the fourth quarter of 2011, this target had been met by a good margin.
ThefinancialstatementsfortheyeargiveatrueandfairviewoftheBNBankGroup’sassetsandliabilities,financialposition and results. The financial statements are based on the assumption that the entity is a going concern.
HomeThe Year 2011 About BN Bank Report of The Directors Financial Statement
21
t
Subsidiaries TheBNBankGroupcomprisesthebankBNBankandthecreditinstitutionsBolig-ogNæringskredittAS(BNkreditt)andBNBoligkredittAS(BNBoligkreditt).InadditiontothesearetherealestatecompaniesMunkegata21ASandCollection Eiendom AS, which were both established in 2010.
BN Bank, BNkreditt and BN Boligkreditt present their separate financial statements in accordance with International FinancialReportingStandards(IFRS).TheothercompaniespresenttheirfinancialstatementsinaccordancewithNorwegianGenerallyAcceptedAccountingPrinciples(NGAAP).SeeNote1formoreinformation.
Bolig- og Næringskreditt AS
BNkreditt provides low-risk mortgage loans on commercial real estate, and at the end of the fourth quarter 2011 had agrossloanportfoliototallingNOK17.2billion,comparedwithNOK15.3billionasat31December2010.Asat31December2011,NOK8.0billioninloanshadbeentransferredtoSpareBank1Næringskreditt.
ThecompanypostedaprofitaftertaxofNOK92millionfor2011,comparedwithNOK53millionfor2010.Theincreaseis owing to positive changes in the value of financial instruments.
ImpairmentlossesonloansandadvancestotalledNOK44millionfor2011,comparedwithNOK53millionfor2010.Individualwrite-downstotalledNOK60millionasat31December2011.Collectivewrite-downswereNOK42millionas of the fourth quarter 2011, which is 0.24 per cent of gross lending.
At31December2011,BNkreditthadoutstandingbonddebttotallingNOK4.5billion,comparedwithNOK6.3billionas at 31 December 2010.
BN Bank has provided a guarantee that BNkreditt will have a capital adequacy ratio or junior financing of minimum 20 percent.BNkreditt’scapitaladequacyratioandtier1capitalratiowere,respectively,17.7percentand15.1percentasat31December2011.BNBankhascededprecedenceforNOK407millionasat31December2011.
BN Boligkreditt AS
BNBoligkredittisBNBank’screditinstitutionforissuanceofcoveredbonds,andattheendofthefourthquarter2011thecompanyhadaresidentialmortgageportfoliototallingNOK2.0billion,whichisNOK0.8billiondownon31December2010.During2010and2011loansweresoldforNOK4.0billiontoBNBankforsellingontoSpareBank1Boligkreditt.
ThecompanypostedaprofitaftertaxofNOK26millionfor2011,comparedwithNOK19millionfor2010.Therisein profit is attributable to a decrease in other operating expense and positive changes in the value of financial instru-ments.
Thecompany’scapitaladequacyratioandtier1capitalratiowere,respectively,39.4percentand31.5percentasat31 December 2011.
BN Bank has entered into an agreement with SpareBank 1 Boligkreditt AS and will primarily use this company for financing home loans in the future.
Munkegata 21 AS and Collection Eiendom AS
Munkegata21wasestablishedin2010forthepurposeofowningandlettingtheBank’sformerheadofficepropertyin Trondheim. The shares in Munkegata 21 were sold during the third quarter of 2011. The sale gave rise to a gain after taxofNOK36millioninBNBank’sconsolidatedfinancialstatements.
Collection Eiendom was established in 2010 for the purpose of owning and managing real estate. Collection Eiendom posted a zero result after tax as at 31 December 2011.
HomeThe Year 2011 About BN Bank Report of The Directors Financial Statement
22

t
Fourth quarter 2011 Theremainingentity(continuingoperations)postedaprofitaftertaxofNOK32millionforthefourthquarterof2011,comparedwithNOK55millionforthethirdquarter.ProfitaftertaxwasNOK26million,comparedwithNOK55millionfor third-quarter 2011, giving a 3.3 per cent return on equity after tax for fourth-quarter 2011. The most important reason for the decrease in profit from the third quarter is the gain on the sale of Munkegata 21. The fourth-quarter resultaftertaxfortheÅlesundportfoliowasalossofNOK3million.TheÅlesundportfolioalsoreportedalossofNOK3 million in the third quarter 2011.
TotalincomeforthefourthquarterwasNOK132million,comparedwithNOK111millionforthethirdquarter.Themost important reason for the increase in operating income was one-off accounting effects on net interest margin and increasedfees,totallingNOK14millioninall.
BNBank’slendinganddepositmarginsdecreasedbyNOK2millionduringthefourthquarterof2011comparedwiththird-quarter 2011.
OperatingexpensewasNOK71millioninthefourthquarter,comparedwithNOK28millioninthird-quarter2011.Themost important reason for the decrease in other operating expense is that Munkegata 21 was sold during the third quarteratagainofNOK37million.
TheremainingentityhadimpairmentlossesonloansandadvancesofNOK18millioninfourth-quarter2011,comparedwithNOK16millioninthird-quarter2011.Impairmentlossesinthefourthquarterof2010comprisedNOK11millionincorporatelending(commercialrealestate),NOK2millioninretaillending,andNOK9millioninthatpartoftheÅlesundportfolio that has been taken over by SpareBank 1 SMN and guaranteed by BN Bank.
ImpairmentlossesonloansintheÅlesundportfoliointhefourthquarterof2011totalledNOK17million.
GrosslendingincreasedbyNOK1.1billion(2percent)inthefourthquarterof2011,mostlyincorporatelendingintheOslo region. As a result of competitive interest rates, the Bank has also seen growth in the retail mortgage market in the last quarter, although growth in retail lending was pulled down in the fourth quarter by a decrease in financing of capital-protected savings products.
DepositswereupinthefourthquarterbyNOK619million,ofwhichNOK405millionwasfromretailcustomersandNOK214millionfrombusinesscustomers.
Risk managementPartofBNBank’sstrategyistomaintainalowriskprofileinallitsactivities.
The Bank has adopted guidelines for controlling and managing all the relevant types of risk. These include risk tole-rance, limits, choice of risk monitoring method, and reporting requirements. The principles established for risk mana-gementapplyfortheentireGroup.TheBoardreceivesregularstatusreportsonallrelevantrisks.
The Bank has no exposure to the stock market.
Newcapitaladequacyrulesforbanks(BaselII)cameintoforcewitheffectfrom2007.Financialinstitutionswithlowcredit risk and good risk management systems may be subject to a lower capital base requirement under the new rules.BNBankaimstoapplytheadvancedInternalRatings-Based(IRB)methodtothemajorityofitsloanportfolio.There is an ongoing project within the Bank to apply during 2012 to the Financial Supervisory Authority of Norway for authorisation as an Advanced IRB Bank.
An assessment of the most important risks is provided below.
HomeThe Year 2011 About BN Bank Report of The Directors Financial Statement
23
t
Credit riskCredit risk in the loan portfolio is a product of two factors, both of which must be present if a loss is to arise. One fac-tor is the possibility that the borrower will be unable to repay the loan. The other is that the value of the underlying asset will be insufficient to cover the amount owed to BN Bank in the event of default and subsequent realisation of the asset.
BNBank’screditstrategycontainstargetsandparametersfor:
• Portfolioquality:measuredasdefaultprobability,expectedlossandactualdefaultwithineachcreditportfolio
• Portfolioconcentration:number,sizeandqualityoflargecommitments,andconcentrationinareatypes
• Portfoliogrowth
• Yield
Commercial real estate
Creditworthinessassessmentsforcommercialrealestateborrowersplaceemphasisgenerallyontheborrower’sfinan-cial position, financial results/cash flow, ability and willingness to pay, amount of equity, and collateral.
For the most part, BN Bank finances fully developed commercial properties, i.e. properties let to one or more tenants. BNBank’sfirstlineofdefenceagainstimpairmentlossesisthereforethefinancialperformanceofabroadlycompo-sed portfolio of tenants. The general economic trend in Norway will therefore have an impact on the trend in non-performing loans.
The risk of an increase in non-performing loans and impairment losses on commercial real estate loans is deemed moderate.
The retail market
Owing to low interest rates, the financial position of Norwegian households in general is considered good, despite increased risk having arisen from the downturn in the Norwegian economy.
Mostoftheloansgiventoretailborrowersaresecuredbyamortgageonresidentialproperty.TheBank’screditpolicyrequires the property to be centrally located.
House prices rose in 2011. The trend in 2012 will probably flatten out, with the risk of significant price falls believed to be slight as interest rates are expected to remain low and the supply of new properties is small. Historically, house prices are high in relation to consumer prices and rents, but more moderate viewed in the light of developments in households’disposableincome.70percentoftheresidentialmortgageloanportfolioissecuredbymortgageswithupto a 60 per cent loan-to-value ratio viewed in relation to EAD7.
The risk of non-performing loans and impairment losses on loans among retail borrowers is considered low.
The rest of the corporate market (the Ålesund portfolio)
Initsrevisedstrategy,BNBankhasdecidedthattheBank’screditexposureinthecorporatemarketshouldbetobor-rowerswithcommercialrealestateloans.However,followingthemergerwiththeformerKredittBanken/GlitnirBank,the Bank still has a credit portfolio with exposure to other types of businesses, primarily offshore service vessels, marine transport, seafood and industry.
In 2009, the Bank entered into an agreement with SpareBank1 SMN whereby the latter would take over this credit portfolio. Since then, BN Bank has provided guarantees for the credit risk attached to the portfolio. In February 2012 large parts of the portfolio were, however, finally taken over by SpareBank 1 SMN. See “Events after the reporting period” for more information.
7 EADisBNBank’sexpectedexposuretotheborrowerinNorwegiankroneratahypotheticaldefaultdatewithinoneyear.
HomeThe Year 2011 About BN Bank Report of The Directors Financial Statement
24
t
Risk classification
BN Bank employs a risk classification system for its loan commitments. The risk classification models used by the Bank classify the loans in relation to the probability of default and the estimated loss which may arise from default. Different models are used, depending on what is considered the most significant risk factors relating to the loan. The models employ different quantitative methods, such as simulation and logistical regression. In the case of commercial real estate loans, quantitative methods are used in combination with qualitative analyses.
The risk classification system and the analysis of risk in the loan portfolio, as well as the new capital adequacy rules, are described in more detail in Notes 28, 31, 32 and 33.
The portfolio divided into classes of risk, and other relevant information from the system, is reported regularly to the Board.
Expected losses
TheBank’sriskclassificationsystemestimatesexpectedimpairmentlossesinthevariousportfolios.Expectedimpair-ment losses on loans express an expectation of the size of the annual average expected loss over an economic cycle.
At year-end 2011, the ratio of expected impairment losses in the entire loan portfolio was 0.23 per cent, of which 0.08 per cent was in retail lending, 0.18 per cent in commercial real estate, and 0.54 per cent in the Ålesund portfolio.
Impairment losses on loans in 2011 were 0.19 per cent of gross lending. Impairment losses as a percentage of managed grosslendingwere0.01percentinretaillending,0.11percentincommercialrealestatelending,andNOK0.91percent in the Ålesund portfolio.
Historically, losses on loans have been considerably lower than the estimates of expected losses, with the exception of 2008whenasingleloancommitmentnotcoveredbythecurrentcreditstrategygaverisetoalossofNOK205million.Impairment losses within the traditional mortgage lending operations have been low.
The level of losses over time in BN Bank is closely linked to macroeconomic trends. The trend in the real economy and property prices will therefore influence the extent of losses in the time ahead.
The Bank will continue to focus closely on the quality of the loan portfolio and on monitoring and following up doubtful loan commitments.
Liquidity risk BN Bank has a slightly lower deposit-to-loan ratio than the average among Norwegian banks. The reason for this is that BN Bank has a shorter history as a bank authorised to accept deposits than as a credit institution. It means that BN Bank is, relatively speaking, more dependent on the money and securities markets as a source of finance than most other Norwegian banks.
The Board has adopted general guidelines for controlling liquidity risk, including setting requirements for measuring, monitoring and reviewing risk. The Bank has a 12-month survival target period in relation to liquidity. In addition, the Board has adopted a contingency plan for use in any liquidity emergency, and has also set limits for net funding requi-rementswithingiventimehorizonsandlimits/parametersforotherliquidityindicators.TheGroup’sliquiditypositionis reported monthly to the Board. Stress tests are also carried out to monitor the liquidity position.
IntheBoard’sopinion,BNBank’sliquiditypositioniscurrentlysatisfactory.
HomeThe Year 2011 About BN Bank Report of The Directors Financial Statement
25

t
Interest rate risk and foreign exchange riskBNBank’sexposuretotheinterestrateandforeignexchangemarketsislimited.TheBank’sborrowingsshallhavethesamefixedinterestratesastheGroup’sloanportfolio.Anydifferentialsinfixedrateperiodsbetweenborrowingandlending are equalised with the use of hedging instruments. In the same way, foreign exchange risk as a result of the Group’scurrencyborrowingandlendingisreducedwithhedginginstruments.
TheBank’sunrestrictedfunds(equity)haveashortinvestmenthorizon,andsothereturnonthesefundswillvarywithshort-term interest rates.
TheBoardhasadoptedguidelinesandsetlimitsfortheBank’sinterestrateandforeignexchangeexposure.Theseexposures are reported monthly to the Board.
Market riskThemostimportantfactorsthatcanbeaffectedbychangesinthemarketsituationortheauthorities’regulatorydecisions are volume and margins in the deposits/funding and lending businesses, impairment losses and operating expense.
Operational risk BN Bank seeks to keep operational risk low through the use of standardised products and services, the maintenance of a small, flexible organisation with clear division of responsibilities, and good working procedures and management and control systems.
The Board receives an annual review of operational risks within the Bank, and is also regularly updated on any signifi-cant operational disruption or deviation.
Board activities The Board of Directors of BN Bank held 17 board meetings in 2011. The Board has appointed an audit committee and a remuneration committee, which act as preparatory and advisory executive committees for the Board.
ForanoverviewofthemembersoftheBoardofDirectorsandtheGroupExecutiveManagement,seeNote40tothefinancial statements.
On1December2011,theBoardappointedGunnarHovlandasthenewManagingDirectorofBNBank.
AsaconsequenceofthefactthatBNBankASAhasbondslistedontheOsloStockExchange’smainlist,theBoardhasprepared a statement of policy on corporate governance which satisfies the requirements demanded of bond issuers. ThestatementispostedonBNBank’swebsiteatwww.bnbank.no.
HomeThe Year 2011 About BN Bank Report of The Directors Financial Statement
26
t
Working environment and organisationTheBoardofDirectorswishestothankalltheGroup’semployeesfortheirhardworkin2011.
BNBankemployed108staff(108full-timeequivalents(FTEs))asat31December2011,whichisanincreaseoffourFTEs since the last year-end.
The Bank did not achieve the performance targets that were set for the bonus scheme for 2011, and so there will be no performance-related pay this year.
In 2011, BN Bank drew up a policy for salary and other benefits payable to the Managing Director and other senior executives in accordance with the Norwegian Public Limited Liability Companies Act, section 6-16a. Note 7 reflects thecontentoftheBank’spolicy.
The working relationship between management and employees is good. The Bank has a working environment and liai-soncommittee,whichconsistsofrepresentativesfromthegroupexecutivemanagementandthesalariedemployees’association.
SicknessabsenceintheBNBankGroupwas3.80percentin2011,comparedwith4.80percentintherestoftheNorwegianfinanceindustry(thelast-mentionedfigureappliestothefirstthreequartersof2011).Sicknessabsencein 2010 was 2.83 per cent. There were no significant injuries or accidents in 2011.
BNBank’spolicyistobeanequalopportunitiesemployerwithgenderequalitybetweenwomenandmen.Ofthecompany’s108employees,51arewomenand57men.TheBankaimstoachieveabalancebetweenthenumbersofmale and female staff at all levels of the organisation, but there are still relatively few women in management posi-tions within the Bank. There were no women in the group executive management team as at 31 December 2011. Out of atotalof12departmentalmanagers,fivearewomen(42percentfemaleparticipation).Atyear-end2011,BNBank’sBoard of Directors consisted of four women and four men, including one female employee representative. The target of 40 per cent shareholder-elected female representation on the Board has thus been fulfilled.
The Bank endeavours to ensure equal opportunities for all staff, irrespective of functional ability, and to prevent discri-mination on grounds of impaired functional ability.
BNBank’sheadofficeisenvironmentallycertificatedundertheMiljøfyrtårn(Eco-Lighthouse)nationalcertificationpro-gramme. This includes certification in the areas of working environment, procurement/materials use, energy, transport, waste, emissions and discharges, and aesthetics.
BNBank’sactivitiesimpactontheexternalenvironmentchieflyintheformofofficeoperationsandbusinesstravel.In November 2010, the Bank moved its Trondheim head office to a tenancy in a new commercial building with a low energy profile. The Bank has provided facilities for staff to use video-conferencing and other electronic communication asanalternativetobusinesstravel,inordertokeeptheBank’scarbonfootprintdown.TheBankisalsofocusedonpre-separation of waste at source and on reducing the amount of waste at source.
Events after the reporting periodTheIcelandicbankGlitnirbankihf,nowGlitnirhf,suedBNBankin2011forunlawfuloff-setofaboutNOK240million.AttheendofJanuary2011,OsloDistrictCourtgavejudgmentwherebyBNBankwasorderedtopayGlitnirNOK213millionplusinterest.BNBankhadpreviouslychargedtheoff-setamountagainstincome,sothattheCourt’sdecisionhas no accounting effect for the Bank. BN Bank will consider an appeal following close analysis of the judgment.
As part of the programme of adaptations to its new business strategy, BN Bank entered into an agreement with Spa-reBank1SMNon1February2012forthelattertoassumethefinalcreditriskforloansequivalenttoNOK2.4billionoftheremainingÅlesundportfolioofNOK3.1billion.Inaddition,thepartiesagreedaceilingof60percentforthecreditriskattachedtotheremainingportfolioofNOK0.7billion.Asaresultoftheagreement,BNBank’sexposuretothisportfolioisconsiderablyreducedandnowaccountsoverallforlessthan1percentoftheBank’slending.
HomeThe Year 2011 About BN Bank Report of The Directors Financial Statement
27

t
Trondheim, 28 February 2012
The Board of Directors of BN Bank ASA
Finn Haugan (Chair)
ToreMedhus StigArneEngen HaraldGaupen HeleneJebsenAnker (DeputyChair)
KristinUndheim AnitaFinseråsBretun EllaSkjørestad GunnarHovland (EmployeeRepresentative) (ManagingDirector)
Outlook A good position in selected markets, a satisfactory funding situation and strong capitalisation all give BN Bank a sound basis for continuing to streamline its business as a cost-effective direct bank in the retail market and as a competitive niche player in commercial real estate.
The situation with regard to the global economy is uncertain and may affect the price the Bank will need to pay for its funding. Continuing turbulence in the financial markets may thus impact on growth and earnings in the time ahead. Against this background, lower growth and higher borrowing costs must be expected in 2012 than in 2011. BN Bank plans to implement a scheme in 2012 designed to cut costs compared to 2011, and expects to see cost levels fall in the weeks and months ahead. The Bank will focus particularly on consultancy costs, marketing and administrative costs.
Theoverallqualityoftheloanportfolioisconsideredgood.BNBank’scommercialrealestateportfolioiswelldiversified,with a variety of types of tenant and lease object. The economic downturn, increased vacancy rates and higher interest rates may impact negatively on the ability of borrowers to service their debts.
As a consequence of major regulatory changes, including the Basel III regulations, the banking industry is faced with strict requirements as regards capitalisation, funding and liquidity. With its sound levels of capitalisation and a satis-factory funding situation, BN Bank is well positioned to satisfy the new requirements.
HomeThe Year 2011 About BN Bank Report of The Directors Financial Statement
28
t
GROUP PARENT BANK
NOK MILLION NOTE 2011 2010 2011 2010
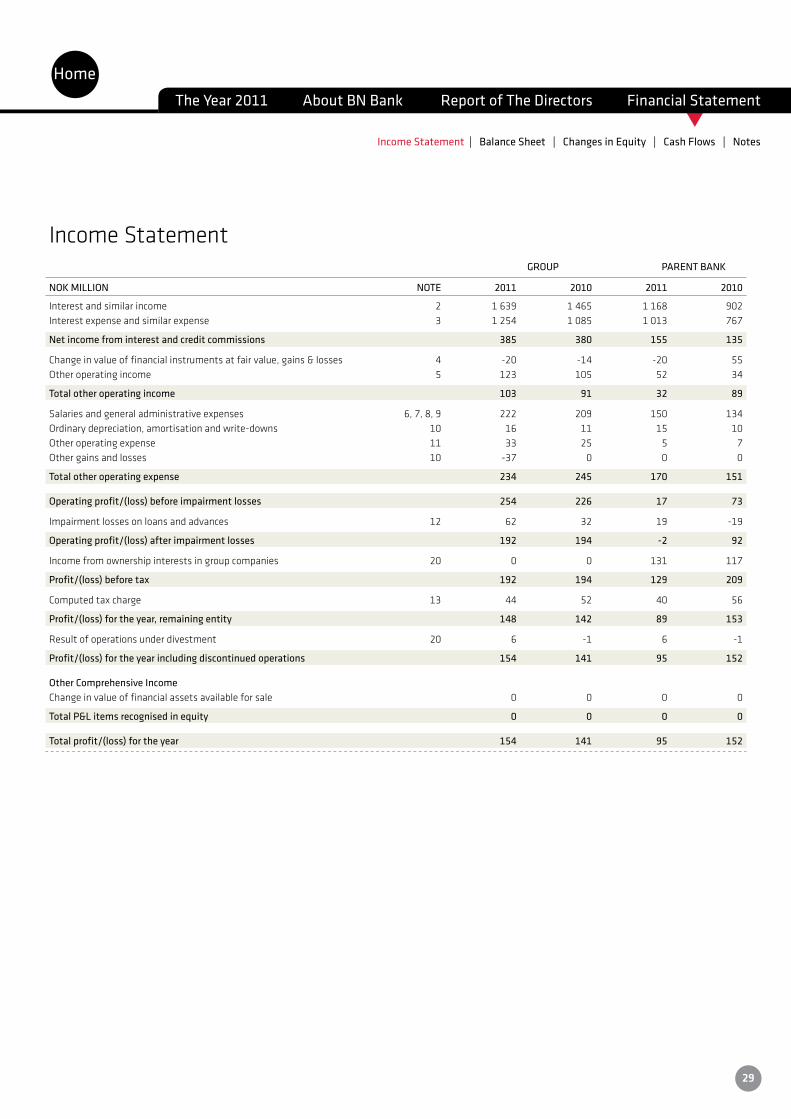
Interestandsimilarincome 2 1 639 1 465 1 168 902Interestexpenseandsimilarexpense 3 1 254 1 085 1 013 767
Net income from interest and credit commissions 385 380 155 135
Change in value of financial instruments at fair value, gains & losses 4 -20 -14 -20 55Other operating income 5 123 105 52 34
Total other operating income 103 91 32 89
Salaries and general administrative expenses 6, 7, 8, 9 222 209 150 134Ordinary depreciation, amortisation and write-downs 10 16 11 15 10Other operating expense 11 33 25 5 7Other gains and losses 10 -37 0 0 0
Total other operating expense 234 245 170 151
Operating profit/(loss) before impairment losses 254 226 17 73
Impairment losses on loans and advances 12 62 32 19 -19
Operating profit/(loss) after impairment losses 192 194 -2 92
Income from ownership interests in group companies 20 0 0 131 117
Profit/(loss) before tax 192 194 129 209
Computed tax charge 13 44 52 40 56
Profit/(loss) for the year, remaining entity 148 142 89 153
Result of operations under divestment 20 6 -1 6 -1
Profit/(loss) for the year including discontinued operations 154 141 95 152
Other Comprehensive IncomeChange in value of financial assets available for sale 0 0 0 0
Total P&L items recognised in equity 0 0 0 0
Total profit/(loss) for the year 154 141 95 152
Income Statement
HomeThe Year 2011 About BN Bank Report of The Directors Financial Statement
Income Statement | Balance Sheet | Changes in Equity | Cash Flows | Notes
29
t
Trondheim, 28 February 2012
The Board of Directors of BN Bank ASA
Finn Haugan (Chair)
ToreMedhus StigArneEngen HaraldGaupen HeleneJebsenAnker (DeputyChair)
KristinUndheim AnitaFinseråsBretun EllaSkjørestad GunnarHovland (EmployeeRepresentative) (ManagingDirector)
Balance Sheet at 31 December GROUP PARENT BANK
NOK MILLION NOTE 2011 2010 2011 2010
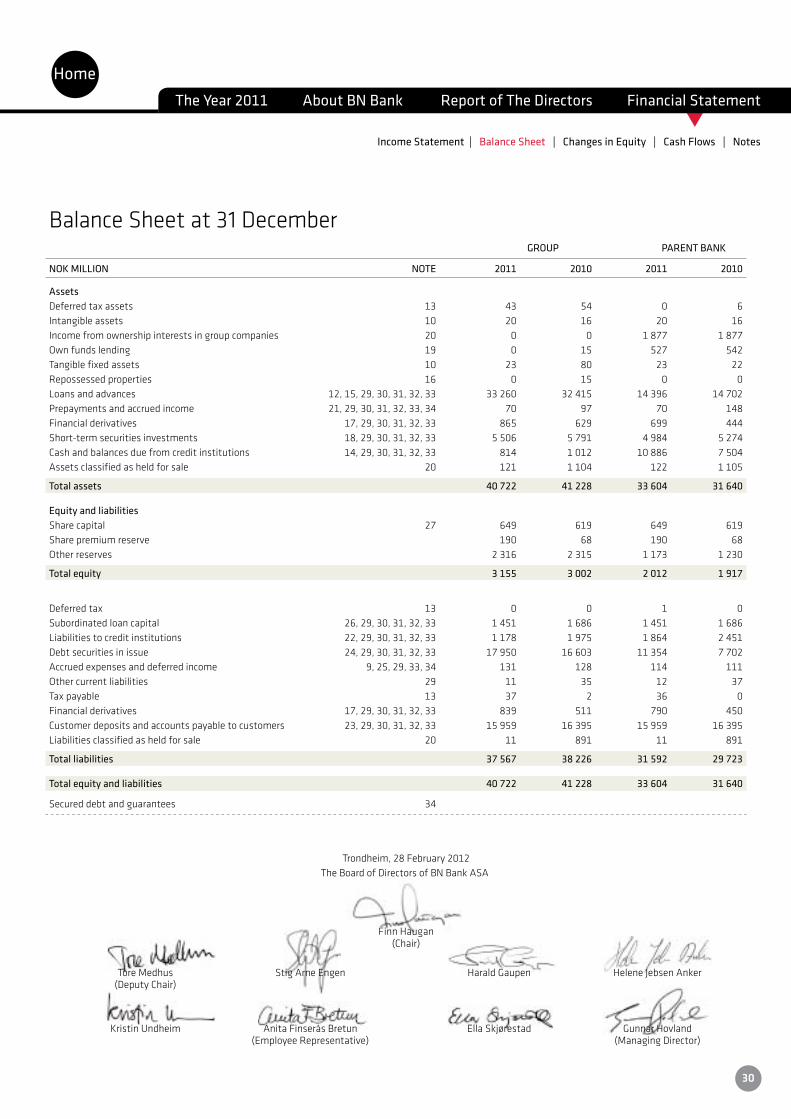
AssetsDeferred tax assets 13 43 54 0 6Intangible assets 10 20 16 20 16Incomefromownershipinterestsingroupcompanies 20 0 0 1 877 1 877Own funds lending 19 0 15 527 542Tangible fixed assets 10 23 80 23 22Repossessed properties 16 0 15 0 0Loansandadvances 12,15,29,30,31,32,33 33 260 32 415 14 396 14 702Prepayments and accrued income 21, 29, 30, 31, 32, 33, 34 70 97 70 148Financial derivatives 17, 29, 30, 31, 32, 33 865 629 699 444Short-termsecuritiesinvestments 18,29,30,31,32,33 5 506 5 791 4 984 5 274Cashandbalancesduefromcreditinstitutions 14,29,30,31,32,33 814 1 012 10 886 7 504Assetsclassifiedasheldforsale 20 121 1 104 122 1 105
Total assets 40 722 41 228 33 604 31 640
Equity and liabilities Share capital 27 649 619 649 619Share premium reserve 190 68 190 68Otherreserves 2 316 2 315 1 173 1 230
Total equity 3 155 3 002 2 012 1 917
Deferred tax 13 0 0 1 0Subordinatedloancapital 26,29,30,31,32,33 1 451 1 686 1 451 1 686Liabilitiestocreditinstitutions 22,29,30,31,32,33 1 178 1 975 1 864 2 451Debtsecuritiesinissue 24,29,30,31,32,33 17 950 16 603 11 354 7 702Accrued expenses and deferred income 9, 25, 29, 33, 34 131 128 114 111Other current liabilities 29 11 35 12 37Tax payable 13 37 2 36 0Financial derivatives 17, 29, 30, 31, 32, 33 839 511 790 450Customerdepositsandaccountspayabletocustomers 23,29,30,31,32,33 15 959 16 395 15 959 16 395Liabilities classified as held for sale 20 11 891 11 891
Total liabilities 37 567 38 226 31 592 29 723
Total equity and liabilities 40 722 41 228 33 604 31 640
Secured debt and guarantees 34
HomeThe Year 2011 About BN Bank Report of The Directors Financial Statement
Income Statement | Balance Sheet | Changes in Equity | Cash Flows | Notes
30
t
GROUP
SHARE OTHER PAID-UP SHARE PREM. SHARE OTHER TOTALNOK MILLION CAPITAL RESERVE CAPITAL RESERVES EQUITY
BalanceSheetasat1January2010 619 68 0 2 174 2 861Result for the period 0 0 0 141 141
Balance Sheet as at 31 December 2010 619 68 0 2 315 3 002
Result for the period 0 0 0 153 153Dividend paid 0 0 0 -152 -152Share capital increase 30 122 0 0 152
Balance Sheet as at 31 December 2011 649 190 0 2 316 3 155
PARENT BANK
SHARE OTHER PAID-UP SHARE PREM. SHARE OTHER TOTALNOK MILLION CAPITAL RESERVE CAPITAL RESERVES1 EQUITY
BalanceSheetasat1January2010 619 68 282 796 1 765Result for the period 0 0 0 152 152
Balance Sheet as at 31 December 2010 619 68 282 948 1 917
Result for the period 0 0 0 95 95Dividend paid 0 0 0 -152 -152Share capital increase 30 122 0 0 152
Balance Sheet as at 31 December 2011 649 190 282 891 2 012
1ThereserveforunrealisedgainsisincludedinOtherreserves.ProvisionofNOK193millionwasmadeasat31December2011,whileprovisionofNOK196millionwasmadeasat 31 December 2010.
Statement of Changes in Equity in 2010 and 2011
HomeThe Year 2011 About BN Bank Report of The Directors Financial Statement
Income Statement | Balance Sheet | Changes in Equity | Cash Flows | Notes
31
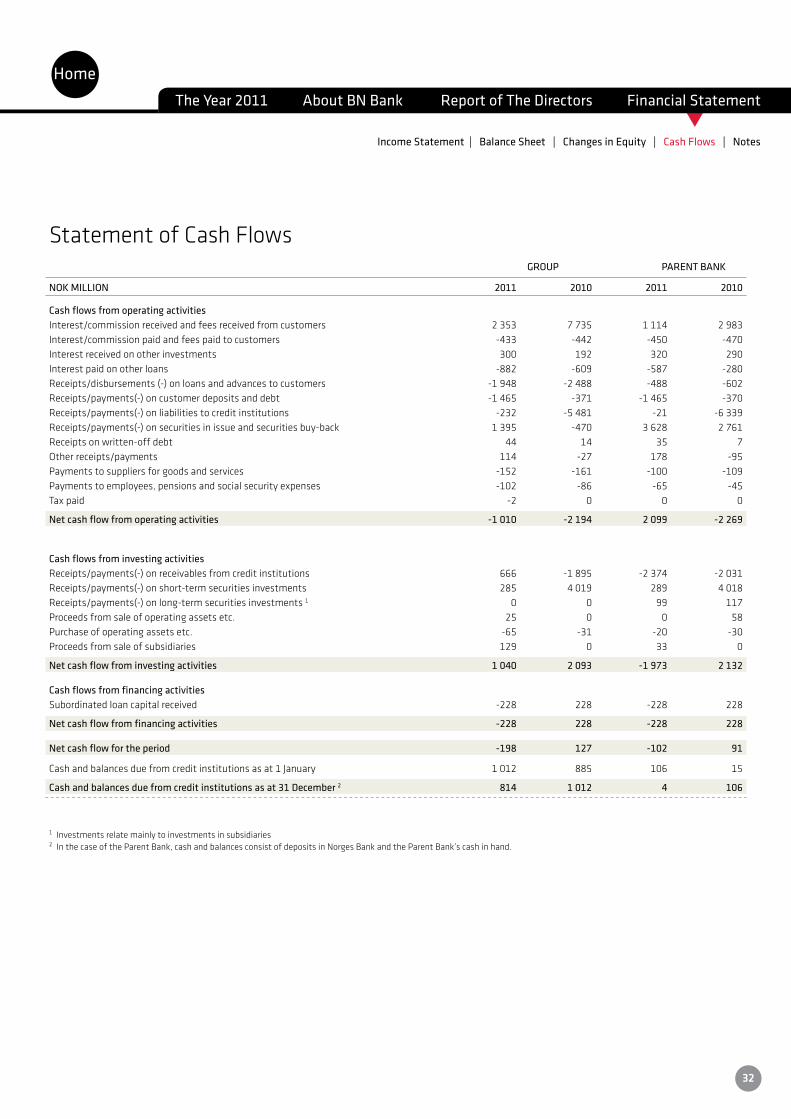
t
Statement of Cash Flows GROUP PARENT BANK
NOK MILLION 2011 2010 2011 2010
Cash flows from operating activitiesInterest/commissionreceivedandfeesreceivedfromcustomers 2 353 7 735 1 114 2 983Interest/commission paid and fees paid to customers -433 -442 -450 -470Interest received on other investments 300 192 320 290Interest paid on other loans -882 -609 -587 -280Receipts/disbursements(-)onloansandadvancestocustomers -1 948 -2 488 -488 -602Receipts/payments(-)oncustomerdepositsanddebt -1 465 -371 -1 465 -370Receipts/payments(-)onliabilitiestocreditinstitutions -232 -5 481 -21 -6 339Receipts/payments(-)onsecuritiesinissueandsecuritiesbuy-back 1 395 -470 3 628 2 761Receipts on written-off debt 44 14 35 7Other receipts/payments 114 -27 178 -95Payments to suppliers for goods and services -152 -161 -100 -109Payments to employees, pensions and social security expenses -102 -86 -65 -45Tax paid -2 0 0 0
Net cash flow from operating activities -1 010 -2 194 2 099 -2 269
Cash flows from investing activitiesReceipts/payments(-)onreceivablesfromcreditinstitutions 666 -1 895 -2 374 -2 031Receipts/payments(-)onshort-termsecuritiesinvestments 285 4 019 289 4 018Receipts/payments(-)onlong-termsecuritiesinvestments1 0 0 99 117Proceeds from sale of operating assets etc. 25 0 0 58Purchase of operating assets etc. -65 -31 -20 -30Proceeds from sale of subsidiaries 129 0 33 0
Net cash flow from investing activities 1 040 2 093 -1 973 2 132
Cash flows from financing activitiesSubordinated loan capital received -228 228 -228 228
Net cash flow from financing activities -228 228 -228 228
Net cash flow for the period -198 127 -102 91
Cashandbalancesduefromcreditinstitutionsasat1January 1 012 885 106 15
Cash and balances due from credit institutions as at 31 December 2 814 1 012 4 106
1 Investments relate mainly to investments in subsidiaries2InthecaseoftheParentBank,cashandbalancesconsistofdepositsinNorgesBankandtheParentBank’scashinhand.
HomeThe Year 2011 About BN Bank Report of The Directors Financial Statement
Income Statement | Balance Sheet | Changes in Equity | Cash Flows | Notes
32
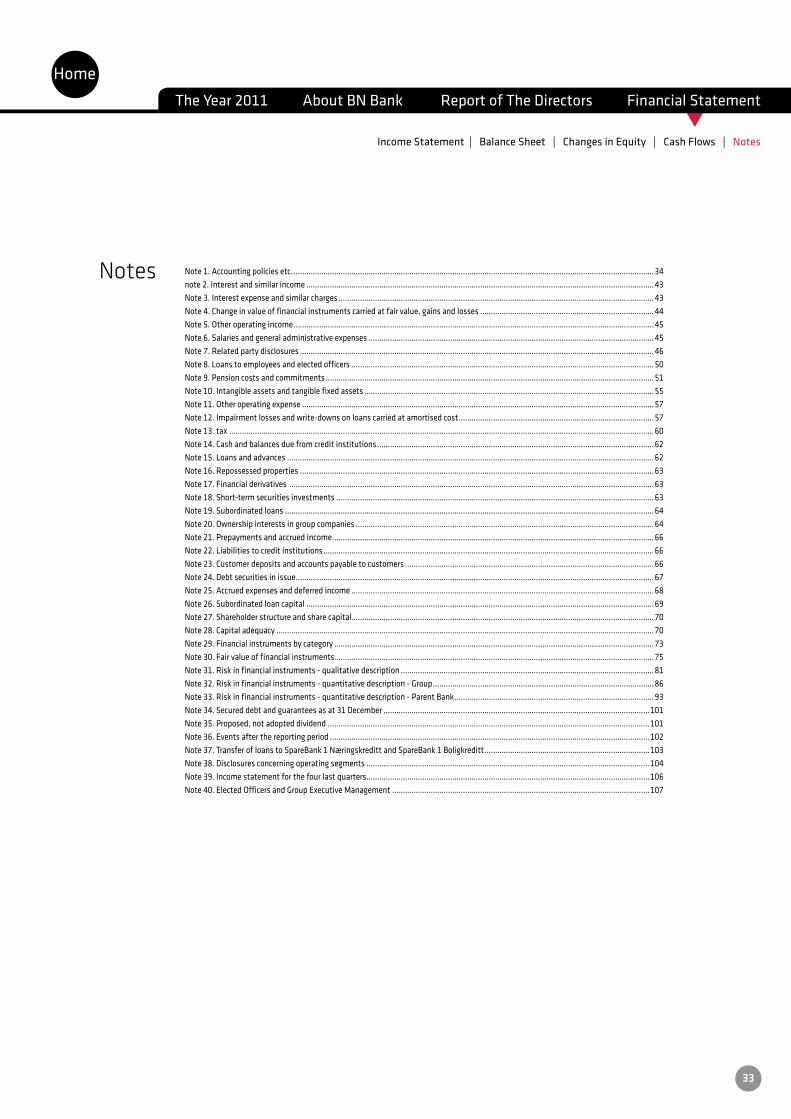
t
Notes
HomeThe Year 2011 About BN Bank Report of The Directors Financial Statement
Note 1. Accounting policies etc. ........................................................................................................................................................................34note 2. Interest and similar income ..................................................................................................................................................................43Note 3. Interest expense and similar charges ...................................................................................................................................................43Note 4. Change in value of financial instruments carried at fair value, gains and losses .................................................................................44Note 5. Other operating income ........................................................................................................................................................................45Note 6. Salaries and general administrative expenses .....................................................................................................................................45Note 7. Related party disclosures .....................................................................................................................................................................46Note 8. Loans to employees and elected officers .............................................................................................................................................50Note 9. Pension costs and commitments .........................................................................................................................................................51Note 10. Intangible assets and tangible fixed assets .......................................................................................................................................55Note 11. Other operating expense ....................................................................................................................................................................57Note 12. Impairment losses and write-downs on loans carried at amortised cost ........................................................................................... 57Note 13. tax ......................................................................................................................................................................................................60Note 14. Cash and balances due from credit institutions .................................................................................................................................62Note 15. Loans and advances ...........................................................................................................................................................................62Note 16. Repossessed properties .....................................................................................................................................................................63Note 17. Financial derivatives ..........................................................................................................................................................................63Note 18. Short-term securities investments ....................................................................................................................................................63Note 19. Subordinated loans ............................................................................................................................................................................64Note 20. Ownership interests in group companies ...........................................................................................................................................64Note 21. Prepayments and accrued income ......................................................................................................................................................66Note 22. Liabilities to credit institutions ..........................................................................................................................................................66Note 23. Customer deposits and accounts payable to customers ....................................................................................................................66Note 24. Debt securities in issue .......................................................................................................................................................................67Note 25. Accrued expenses and deferred income .............................................................................................................................................68Note 26. Subordinated loan capital ..................................................................................................................................................................69Note 27. Shareholder structure and share capital.............................................................................................................................................70Note 28. Capital adequacy ................................................................................................................................................................................70Note 29. Financial instruments by category .....................................................................................................................................................73Note 30. Fair value of financial instruments.....................................................................................................................................................75Note 31. Risk in financial instruments - qualitative description ...................................................................................................................... 81Note 32. Risk in financial instruments - quantitative description - Group .......................................................................................................86Note 33. Risk in financial instruments - quantitative description - Parent Bank .............................................................................................93Note 34. Secured debt and guarantees as at 31 December ............................................................................................................................101Note 35. Proposed, not adopted dividend ......................................................................................................................................................101Note 36. Events after the reporting period .....................................................................................................................................................102Note 37. Transfer of loans to SpareBank 1 Næringskreditt and SpareBank 1 Boligkreditt .............................................................................103Note 38. Disclosures concerning operating segments ....................................................................................................................................104Note 39. Income statement for the four last quarters ....................................................................................................................................106Note 40. Elected Officers and Group Executive Management ........................................................................................................................107
Income Statement | Balance Sheet | Changes in Equity | Cash Flows | Notes
33
t
NOTE 1. ACCOUNTING POLICIES ETC.
Information about the companyBNBankASA(BNBank)isapubliclimitedcompany,establishedanddomiciledinNorway,andwithitsregisteredofficein Trondheim. BN Bank also has branch offices in Oslo.
BN Bank and SpareBank 1 SMN entered into an agreement in September 2009 for SpareBank 1 SMN to take over BN Bank’sdivisioninÅlesund.Underthetermsoftheagreement,SpareBank1SMNtookoverall36employeesofBNBankinÅlesundaswellasallitscustomeraccounts,whichat30SeptembercomprisedNOK4.8billioninlendingandNOK1.5billionindeposits.
The loans and deposits in Ålesund are being transferred gradually to SpareBank 1 SMN. BN Bank will finance the loan portfolio and guarantee the credit risk. The guarantee and financing will be reduced gradually. If the guarantee has not been discontinued after three years, it may be renewed for a further two years at the most.
WithintheframeworkofBNBank’sarticlesofassociationandsubjecttothelegislationthatisinforceatanytime,theBank may carry on all business and perform all services that it is customary or natural for banks to perform.
Basis for preparation of the financial statementsBNBankASApresentstheconsolidatedfinancialstatementsfortheGroupandtheseparatefinancialstatementsfortheParentBankfor2010incompliancewithInternationalFinancialReportingStandards(IFRS),asapprovedbytheEU.
New and amended standards applied in the BN Bank Group with effect in 2011There are no new or amended IFRSs or IFRIC interpretations of relevance for the accounts which came into effect in 2011whichareconsideredtohaveorareexpectedtohaveanymaterialeffectontheGroup.
Standards and amendments to, and interpretations of, existing standards that are not yet effective and where the Group has not chosen early applicationThe following standards and amendments to, and interpretations of, existing standards have been published, and ap-plicationwillbeobligatoryfortheGroupintheirconsolidatedandseparatefinancialstatementsfortheannualperiodbeginningon1January2012orlater,butwithouttheGrouphavingchosenearlyapplication:
IAS19“EmployeeBenefits”wasamendedinJune2011.Asaresultoftheamendments,allestimatevariancesarecarriedin‘othercomprehensiveincome’astheyarise(nocorridor),thereisimmediaterecognitionthroughprofitorlossof the costs of all past benefits earned, and interest expense and expected return on pension assets is replaced with a netamountofinterestwhichiscalculatedusingthediscountedrateonthenetpensionobligation(asset).TheGrouphas not yet finished analysing the consequences of the amendments in IAS 19.
IFRS 9 “Financial Instruments” regulates the classification and measurement of, and accounting for, financial assets and financial liabilities. IFRS 9 was published in November 2009 and October 2010, and replaces the parts of IAS 39 that deal with the classification and measurement of, and accounting for, financial instruments. According to IFRS 9,financialassetsshallbedividedintotwocategoriesaccordingtothemethodofmeasurement:thosemeasuredatfair value and those measured at amortised cost. Classification is made at the time the asset is initially recognised. Theclassificationwilldependonthecompany’sbusinessmodelforhandlingitsfinancial instrumentsandonthecharacteristics of the contractual cash flows arising from the instrument. For financial liabilities, the requirements are essentially the same as under IAS 39. The main change, in those cases where fair value measurement has been chosen forfinancialliabilities,isthatthatamountofachangeinthefairvaluethatisattributabletochangesinthecompany’sowncreditriskoftheliabilityispresentedthrough‘othercomprehensiveincome’ratherthanthroughprofitorloss,unlessthiswouldcreateanaccountingmismatchinprofitorloss.TheGroupisplanningtoadoptIFRS9whenthestandard takes effect and is approved by the EU. The standard will become effective for annual periods commencing onorafter1January2015.
HomeThe Year 2011 About BN Bank Report of The Directors Financial Statement
Income Statement | Balance Sheet | Changes in Equity | Cash Flows | Notes
34
t
IFRS 10 “Consolidated Financial Statements” is based on the current principles of using the concept of control as the decisivecriterionfordeterminingwhetheracompanyshouldbeincludedintheparentcompany’sconsolidatedfinancialstatements. The standard provides comprehensive guidance for assessing whether control is present in those cases wherethisisdifficulttodetermine.TheGrouphasnotconsideredallthepossibleconsequencesthatfollowfromIFRS10.TheGroupplanstoapplythestandardforannualperiodscommencingonorafter1January2013.
IFRS 12 “Disclosures of Interest in Other Entities” contains the disclosure requirements for interests in subsidiaries, jointarrangements,associates,SpecialPurposeEntities(SPEs)andotheroff-balancesheetactivities.TheGrouphasnotconsideredthefulleffectofIFRS12.TheGroupplanstoapplythestandardforannualperiodscommencingonorafter1January2013.
IFRS 13 “Fair Value Measurement” defines what is meant by fair value when the term is used in IFRS, provides a uni-form description of how fair value should be determined under IFRS, and defines which additional disclosures should be provided when fair value is used. The standard does not broaden the scope of fair value accounting but provides guidance concerning the method of application where the use of fair value is obligatory or permitted in other IFRSs. TheGroupusedfairvalueasameasurementcriterionforcertainassetsandliabilities.TheGrouphasnotconsideredthefulleffectofIFRS13.TheGroupplansthe(early)applicationofIFRS13forannualperiodscommencingonorafter1January2012.
AmendmenttoIAS1“OtherComprehensiveIncome”:Inthepresentationofitemswithin‘othercomprehensivein-come’,adistinctionmustbemadebetweentheitemsthatwilllaterbereversedinprofitorlossandthosethatwillnotbereversedinprofitorloss.Theamendmentismandatoryasat1July2012.
There are otherwise no other IFRSs or IFRIC interpretations that have not become effective that are expected to have a material effect on the financial statements.
Comparative figuresAll amounts stated in the income statement, balance sheet, statement of cash flows and disclosures are given with oneyear’scomparativefigures.Comparativefiguresarepreparedonthebasisofthesameprinciplesasfiguresforthemost recent period.
Discretionary measurements, estimates and assumptionsInapplyingtheaccountingpoliciesfortheGroup,theCompany’smanagementhaveinsomeareasexerciseddiscretionand based the accounting on estimates and assumptions regarding future events. There will naturally be an inherent uncertainty associated with accounting items based on discretionary estimates and assumptions regarding future events. In exercising discretion and determining assumptions concerning future events, the management will have regard for the available information at the end of the reporting period, historical experience with similar valuations, and market and third-party assessments of the matters in question. However, although the management use their best discretion and build on the best available estimates, in some cases the actual outcome may differ significantly from what the accounting was based on. Measurements, estimates and assumptions that represent a significant risk of material change in the capitalised value of assets and liabilities during the next financial year, are discussed below.
Fair value of financial instrumentsThe fair value of financial instruments is based partly on assumptions that are not observable in the market. This ap-plies particularly to setting a relevant premium for credit risk when determining the fair value of fixed-rate securities in the form of borrowing, lending and securities issued by others. In such cases, the management have based their mea-surements on the information available in the market, combined with their best discretionary estimates. Information of this kind will include credit evaluations made by other credit institutions.
HomeThe Year 2011 About BN Bank Report of The Directors Financial Statement
Income Statement | Balance Sheet | Changes in Equity | Cash Flows | Notes
35
t
Write-downs on loansWrite-downs for impairment losses are made when there is objective evidence that a loan or group of loans is impaired. The write-down is calculated as the difference between the capitalised balance sheet value and the net present value of estimated future cash flows discounted by the effective interest rate.
ImpairmentlossesonloansandadvancesarebasedonareviewoftheBank’sloanandguaranteeportfolioaccordingto the regulations for valuing loans provided by the Financial Supervisory Authority of Norway.
The Bank specifically determines all impairment losses on loans and guarantees at the end of every quarter. Non-performing loans and doubtful commitments are followed up with continuous assessments.
Fixed assets held-for-sale and discontinued operationsAssetsthattheBank’sBoardhavedecidedwillbesoldaretreatedunderIFRS5,whenthecriteriafordoingthisarefulfilled.
The business in Ålesund has been organisationally subordinate to SpareBank 1 SMN since the fourth quarter of 2009, and is treated under IFRS 5. The subsidiary Collection Eiendom AS has been established to take over shares in com-panies that have defaulted on their loans and commitments with us. The intention is to sell on the shares within one year, which will be treated under IFRS 5.
PensionsThe present value of recognised pension commitments depends on the determination of financial and actuarial as-sumptions. Changes in such assumptions will give rise to changes in recognised amounts for pension commitments and the pension cost.
Expected return is determined on the basis of historical return experience and how the pension assets in question are invested with a view to risk and the type of securities involved. The discount rate is determined on the basis of the interest rate on long-term Norwegian government bonds at the end of the reporting period. Other important assump-tions for the pension commitments are annual wage growth, annual adjustment of pensions, and expected adjustment oftheNorwegiannationalinsurancebasicamount(G).Forsuchassumptionsandforreturnanddiscountratethemanagement will have regard for the guidance and recommendations available at the end of the reporting period. In the case of demographic assumptions, estimates and discretion will be based on experience material available from the actuaries.
Period of use for tangible fixed assets and intangible assets with a limited useful lifeEstimates are made of the expected residual value, useful life and related depreciation rates for tangible fixed assets and of amortisation rates for intangible assets with a limited useful life. The expected useful life and residual value are measured at least once a year.
HomeThe Year 2011 About BN Bank Report of The Directors Financial Statement
Income Statement | Balance Sheet | Changes in Equity | Cash Flows | Notes
36

t
Accounting policiesConsolidation
TheconsolidatedfinancialstatementscomprisetheParentBankBNBankASA(BNBank),andthewhollyownedsub-sidiariesBolig-ogNæringskredittASA(BNkreditt),BNBoligkredittASandCollectionEiendomAS.
Subsidiariesareallentities(includingSpecialPurposeEntities)inwhichtheGrouphasthepowertocontroltheentity’sfinancialandoperatingstrategy,normallybyacquiringownershipofmorethanhalfoftheentity’svotingsharecapi-tal. In determining whether control exists, the effect is included of potential voting rights which can be exercised or converted at the end of the reporting period. Subsidiaries are consolidated from the date control is transferred to the Groupandareexcludedfromconsolidationwhencontrolends.
The acquisition method for business combinations has been considerably changed since 2010. For example, all con-sideration upon the purchase of a business shall be recognised at fair value at the date of acquisition. Contingent consideration is normally classified as debt and the subsequent changes in value are carried in profit or loss. For each acquisition,theGroupmaychoosewhetheranynon-controllinginterestsintheacquiredcompanyshallbemeasuredatfair value or only at a share of the net assets excluding goodwill. All transaction costs shall be carried in profit or loss.
Subsidiaries which it has been decided to sell in the near future are classified as held-for-sale under IFRS 5.
Uniform accounting policies have been applied for all companies included in the consolidated financial statements.
The consolidated financial statements are required to show the assets and liabilities, financial position and results for thecompaniesintheGroup,asthoughtheywereasingleeconomicentity.Allinter-companyaccounts,shareowners-hip, significant transactions and gains/losses arising on the transfer of existing assets, between the companies in the Group,havethereforebeeneliminated.
Subsidiaries
SubsidiariesareaccountedforatcostintheParentBank’sseparatefinancialstatements.Dividendisrecognisedasincome when the dividend is finally adopted.
Recognition of income and expenditure
Interest earned from variable-rate loans, including loans with a rolling fixed-rate period, is taken to income over the termoftheloanusingtheloan’seffectiveinterestrate.Incomefromfeesandcommissionsisincludedinthecalcu-lationofeffectiveinterest.Interest(nominal)earnedfromfixed-rateloansisrecognisedasinterestincomeasitisearned, and changes in the fair value of expected future cash flows are carried in the income statement through the line for changes in the value of financial instruments carried at fair value.
Interest(nominal)fromfinancialinstrumentsmeasuredatfairvalueistakentoincomeorcarriedtoexpenseasitisearned as income or accrued as expense.
Fees, commissions etc., which are not included in the effective interest rate calculation for borrowings or loans, are recognised in the income statement as they are earned as income or accrued as expense.
HomeThe Year 2011 About BN Bank Report of The Directors Financial Statement
Income Statement | Balance Sheet | Changes in Equity | Cash Flows | Notes
37
t
Financial instruments – Classification etc.
On initial recognition on the balance sheet, financial instruments will be assigned to a class of financial instruments described in IAS 39. The various classes defined in IAS 39 are Financial instruments at fair value with value changes carried through profit or loss, Loans and receivables at amortised cost, Liabilities at amortised cost, Held-to-maturity investments at amortised cost and Available-for-sale financial assets with value changes carried in other comprehensive income. The two last-mentioned classes are normally not relevant for BN Bank.
Within the class Financial instruments at fair value with value changes carried through profit or loss, assigning the asset to a class may be obligatory, or the assignment can be voluntary if other specific criteria are fulfilled. In BN Bank, all derivatives are obliged to be measured at fair value with value changes carried through profit or loss. In addition, all fixed-rate securities in the bank portfolio will be selected for measurement at fair value through profit or loss, inclu-dingtheBank’sownissuedsecuritiesandfixed-rateborrowingandlending.Inthiscontext,allsecuritiesthathavea fixed rate of interest over the entire term will be reckoned as fixed-rate securities. Securities that have a fixed rate on a rolling basis will not be reckoned as fixed-rate securities. Fixed-rate securities are selected for measurement at fair value through profit or loss in order to avoid what would otherwise be accounting asymmetry through the related interest rate hedging instruments being recognised at fair value. In that fair value recognition avoids the most material parts of this accounting asymmetry, the criteria for recognising the instruments at fair value are regarded as fulfilled.
All financial instruments in the investment portfolio that are not derivatives will be selected for measurement at fair value through profit or loss. Selection is done on the basis of these securities being followed up and managed on the basis of fair value. There is a documented investment strategy for the investment portfolio. The investment portfolio istheBank’sliquidityreserveandshallbeinvestedininterest-bearingsecuritieswithlowriskandgoodliquidity.Afteraccounthasbeentakenofthesecurities’liquidityandinvestmentportfoliorisk,theobjectiveisforthesecuritiestomakeoptimumcontributiontotheBank’snetinterestincome.Theresultsoftheinvestmentportfolioarereportedmonthly to the management.
Financial instruments, other than those measured at fair value with value changes carried through profit or loss or available-for-sale at fair value with value changes carried in equity, are accounted for at amortised cost using the ef-fective interest rate method.
Allfinancialinstrumentsarerecognisedinitiallyonthetradingdateoftheinstrument(andnotthesettlementdate).
Financial instruments measured using fair value hedge accounting
In2010theGroupbeganusingfairvaluehedgesonnewissuedsecuritiesandrelatedhedgeinstruments.TheGroupmeasures and documents the effectiveness of the hedge, both at initial classification and on a continuous basis. With a fair value hedge the hedge instrument is accounted for at fair value and the hedge object accounted for at fair value for the hedged risk, and changes in these values from the opening balance are recognised in profit or loss.
If the hedge relationship is ended or it cannot be verified that the hedge is sufficiently effective, the value change relating to the hedge object is amortised over the remaining term.
Currency
Income and expenditure in foreign currencies is translated into Norwegian kroner according to the rate of exchange at the time of the transaction.
Balance sheet items in foreign currencies are mainly hedged by corresponding items on the opposite side of the balance sheet or by hedge transactions. Forward-exchange contracts are used only as hedges and are entered into in order to hedgeidentifieditems.AssetsandliabilitiesinforeigncurrenciesaretranslatedintoNorwegiankroneratthebanks’middle rates for currencies at the end of the reporting period. Forward-exchange contracts are measured at fair value with changes in value carried through profit or loss.
HomeThe Year 2011 About BN Bank Report of The Directors Financial Statement
Income Statement | Balance Sheet | Changes in Equity | Cash Flows | Notes
38

t
Loans, impairment losses and provisions for impairment losses measured at amortised cost
TheGroupcapitalisesloansonthebalancesheetatcostatthedateofestablishment.Costincludestheprincipalofthe loan, as well as fees and any direct costs.
In subsequent periods, loans are measured at amortised cost, and interest income is recognised as income according to theeffectiveinterestratemethod.Theeffectiveinterestrateistheratebywhichtheloan’scashflowsarediscountedover the expected term of the loan at the amortised cost of the loan at the date of establishment. The effective inte-rest rate method also means that interest on written-down loans is recognised as income. For such loans, the internal rate of interest at the date of establishment is adjusted for changes in interest rate up until the date of write-down. Interest is recognised as income based on the written-down value of the loan.
Write-downs for impairment losses are made when there is objective evidence that a loan or a group of loans has become impaired. The write-down is calculated as the difference between the balance sheet value and the net present value of estimated future cash flows discounted by the effective interest rate.
In the income statement, the item “Impairment losses on loans and advances” consists of write-offs, changes in write-downs on loans and provisions for guarantees, as well as recoveries on previous write-offs.
Non-performing loans
Non-performing loans are defined as loans where the borrower defaults on the loan agreement for reasons not due to normal delays or other chance circumstance affecting the borrower. Loans that are not serviced 90 days after the due date are in all events considered as non-performing loans. Doubtful commitments where bankruptcy or debt settlement proceedings have been instituted, debt recovery has been instituted through the courts, distress has been levied,thedebtor’sassetshavebeenattached,orwherethereareothercircumstancessuchasafailureofliquidityor solvency or breach of other clause of the loan agreement with the Bank, are also defined as non-performing loans. Renegotiated loans are treated as doubtful loans as they are loans that could otherwise become non-performing loans.
Write-offs
Write-offs are impairment losses on loans which are considered final and which are booked as being written off. These includelosseswheretheGrouphaslostitsclaimagainstthedebtorasaresultofbankruptcyorinsolvency,affirmedvoluntary arrangement, unsuccessful execution proceedings, final and enforceable judgment, or debt relief. This also applies in those cases where the Bank has in some other way stopped enforcement of payment or waived its claim for payment of some of the loan or the entire loan.
Loans and impairment losses measured at fair value
Fixed-rate loans are capitalised on the balance sheet at fair value with changes in value carried through profit or loss. With measurement at fair value, losses are expressed through changes in the credit risk premium in the discount rate, and through adjustments of expected cash flows on which the discount is based. The objective evidence of a decline in value or impairment, which forms the basis for writing down the loan to amortised cost, is the same type of event which forms the basis for changed assessments of credit risk and expected cash flows at fair value estimations in the case of loans measured at fair value. Impairment losses connected with loans measured at fair value are presented as part of the fair value change in loans.
HomeThe Year 2011 About BN Bank Report of The Directors Financial Statement
Income Statement | Balance Sheet | Changes in Equity | Cash Flows | Notes
39

t
Repossessed properties
Properties which are repossessed through mortgage foreclosure as a result of non-performing loans, and where the Groupdoesnotintendtokeepthepropertyforlong-termownershiporuse,arepresentedonaseparatelineonthebalance sheet. Repossessed properties are valued at the date of repossession at the lower of cost or estimated market value. In subsequent accounts the properties are valued at the lower of this purchase cost or estimated market value attheendofthereportingperiod.Asat1January2011theGrouphaschangedtheaccountingpolicyforclassifyingongoing value changes and gains/losses on the sale of repossessed properties. These are now carried under impairment losses on loans if there is a close connection between the repossessed property and the original loan. When a plan is adopted for disposing of repossessed properties, the properties are presented as held for sale, on a separate line in the balance sheet.
Financial derivatives
Financial derivatives are obliged to be measured at fair value with changes in value carried through profit or loss. Where BN Bank is concerned, such financial instruments are equity options, equity-linked options, forward exchange contracts, futurerateagreements(FRAs),interestrateswaps,andcombinedinterestrate-andcurrencyswaps.
Bonds and certificates – In general
Bonds and certificates issued by others consist of the investment portfolio and holdings acquired as a hedge against interest rate risk on the funding side. In the case of own bonds and certificates, a distinction is drawn between acqui-sition for refinancing purposes and the purchase/sale of own bonds in connection with the market promotion included in the investment portfolio.
Bonds and certificates – Classification
Bonds and certificates issued by others are classified mainly as short-term investment securities. Bond loans where the decision to acquire the bonds is taken on the basis of ordinary lending criteria are classified as loans. The accounting treatment of bond loans is thus analogous with that of ordinary loans. Own bonds and certificates are deducted from the bond debt and certificate debt respectively.
Bonds and certificates – Measurement of investment portfolio
Bonds and certificates included in the investment portfolio are classified voluntarily at fair value with changes in value carried through profit or loss.
Bonds and certificates – Estimation of gains/losses
When estimating gains/losses on the sale of bonds and certificates, the opening value is set as the weighted average purchase cost of the entire holding of the bonds/certificates in question.
Financial guarantees
Financial guarantees are measured at fair value with changes in value carried through profit or loss. Upon establish-ment of a contract, the commission for the entire contract period is measured. The guarantee is taken to income in correlation with earnings, and presented under the line “Other operating income, gains and losses”.
Off-setting and net reporting
Financial assets and financial liabilities are off-set and reported net on the balance sheet when there is a legally enfor-ceable right of set-off and the intention is either to settle the asset and liability on a net basis or to realise the asset and settle the liability simultaneously.
HomeThe Year 2011 About BN Bank Report of The Directors Financial Statement
Income Statement | Balance Sheet | Changes in Equity | Cash Flows | Notes
40
t
Financial instruments measured at fair value
Financial instruments which are sold in an active market are valued at observed market prices. Financial instruments which are not sold in an active market are assessed using a valuation technique. Valuation techniques are based on recent transactions between independent parties, reference to instruments with approximately the same content, or discounted cash flows. As far as possible, valuations are based on externally observable parameter values. All loans, borrowings and deposits which are measured at fair value are valued on the basis of discounted cash flows.
Where the measurement of financial instruments at fair value is performed using a valuation technique, the valuation can potentially give rise to a gain or a loss on day one if the fair value according to the valuation model differs from the transaction price. Such gains and losses cannot be recognised in the accounts on day one. When measuring loans at fair value, BN Bank will calculate a customer-specific margin on each customer commitment, and this margin will be included in all subsequent valuations, so that what might otherwise have given risen to a day-one gain or a day-one loss will be amortised over the entire term of the loan. In the case of borrowings and securities in the investment portfolio, the result of the valuation is checked against the transaction price, and where there are not immaterial dif-ferences a specific supplement will be calculated in the discount rate per contract that is added to the discount rate in all subsequent valuations, so that the day-one gain or day-one loss is amortised over the entire term of the security.
Financial instruments – Classification of accrued interest
Accrued interest is shown throughout together with the value of the related financial instruments, both for borrowings, loans, derivatives and interest-bearing securities issued by others. In the case of borrowings and loans, this classifica-tion applies irrespective of whether the instrument is measured at amortised cost or fair value.
Tangible fixed assets
Tangible fixed assets are carried on the balance sheet at original cost less accumulated depreciation and write-downs. Ordinary depreciation is calculated on a straight-line basis over the expected useful life of the operating asset. If the fair value of an operating asset is substantially less than book value, and this is owing to circumstances that cannot be considered temporary, the operating asset is written down to fair value.
Intangible assets
Purchasedcomputersystemsandsoftwarearecarriedonthebalancesheetatoriginalcost(includingthecostsofmakingthesoftwareoperative)andareamortisedonastraight-linebasisovertheexpectedusefullifeoftheasset.
Development or maintenance expenses are taken to expense as they accrue.
Pension costs and liabilities
TheGrouphasdifferentpensionschemes.Thesepensionschemesarefundedthroughpaymentstoinsurancecompa-nies as determined by periodic actuarial calculations.
TheGrouphasbothdefinedcontributionschemesanddefinedbenefitschemes.AdefinedcontributionschemeisapensionschemewheretheGrouppaysfixedcontributionsintoaseparatelegalentity(afund).TheGrouphasnolegalorotherconstructiveobligationtopayfurthercontributionsiftheentity(fund)doesnotholdsufficientassetstopayall employee benefits related to employee service in the current and prior periods. Pension schemes that are not defined contribution schemes are defined benefit schemes. Typically, a defined benefit scheme is a scheme which defines an agreed pension benefit that an employee will receive upon retirement. The amount of the benefit will normally depend on one or more factors, such as age, the number of years of service, and pay.
In line with IAS 19, liabilities relating to group pension schemes with life insurance companies and unsecured liabilities are both included in the financial statements. The net pension cost for the year consists of the present value of the year’spensioncontributionsandinterestexpenseonthepensionliability,lesstheanticipatedyieldonthepensionas-sets and adjusted for the distributional effects of changes in pension plans, estimates and variance. The net pension cost is included in the item “Salaries and general administrative expenses”.
HomeThe Year 2011 About BN Bank Report of The Directors Financial Statement
Income Statement | Balance Sheet | Changes in Equity | Cash Flows | Notes
41
t
Estimate variances are accounted for over the average remaining pension contribution period as long as the variance exceeds the higher of 10 per cent of the pension assets or 10 per cent of the pension liability.
Intheeventofchangestothecostofthepensionscheme,effectsrelatingtopreviousperiods’pensioncontributionsare taken to expense in the period in which the change arises, while the unpaid contributions are accrued over the remaining period of service.
Wheredefinedcontributionschemesareinoperation,theGrouppayscontributionstoprivatelymanagedpensioninsuranceplansonacontractualbasis.TheGrouphasnofurtherpaymentobligationsafterthesecontributionshavebeen paid. The contributions are accounted for as wages and salaries concurrently with the obligation to pay contri-butions. Prepaid contributions are carried as an asset to the extent that the contribution can be refunded or reduce future contributions.
Tax
Taxisaccruedasanexpenseirrespectiveofthedateitispaid.Thetaxchargethusreflectstheyear’staxandfuturetaxpayableasaresultoftheyear’sactivity.Taxwhichitisestimatedwillbeassessedontheyear’sprofitisincludedin the tax charge for the year and designated as tax payable.
Deferred tax is calculated on the basis of differences between reported accounting and taxable profits that will be off-set in the future. Tax-adding and tax-deducting temporary differences within the same interval of time are measured against one another. Any net deferred tax asset is stated as an asset on the balance sheet when it is probable that the tax-deducting temporary differences will be realised.
Presentation of dividend
The proposed distribution of dividend is presented as equity until a final resolution to distribute the dividend has been passed. Distributed dividend is then presented as provision for dividend until the dividend has been paid.
Provisions, contingent assets and contingent liabilities
Aprovision is recognisedonly if it isapresentobligation(legalorconstructive)resultingfromapastevent, it isprobable that an outflow of resources from the enterprise embodying economic benefits would be required to settle the obligation, and a reliable estimate can be made of the amount of the obligation. Provisions are recognised in the amount that expresses the best estimate of the expenditure required to settle the present obligation at the end of the reporting period. Where the effect is material, account is taken of the time value of money when calculating the amount of provision.
There is no recognition of contingent assets or contingent liabilities.
Cash
The line for cash includes cash in hand and deposits with and balances due from credit institutions and central banks.
The cash flow statement is presented using the direct method, which provides information about important classes of receipts and payments.
Segment reporting
OperatingsegmentsarereportedinthesamewayaswithinternalreportingtotheBank’schiefoperatingdecisionmaker.TheBank’schiefoperatingdecisionmaker,whoisresponsibleforallocatingresourcesforandassessingperfor-manceintheoperatingsegments,hasbeenidentifiedastheGroupExecutiveManagement.
HomeThe Year 2011 About BN Bank Report of The Directors Financial Statement
Income Statement | Balance Sheet | Changes in Equity | Cash Flows | Notes
42
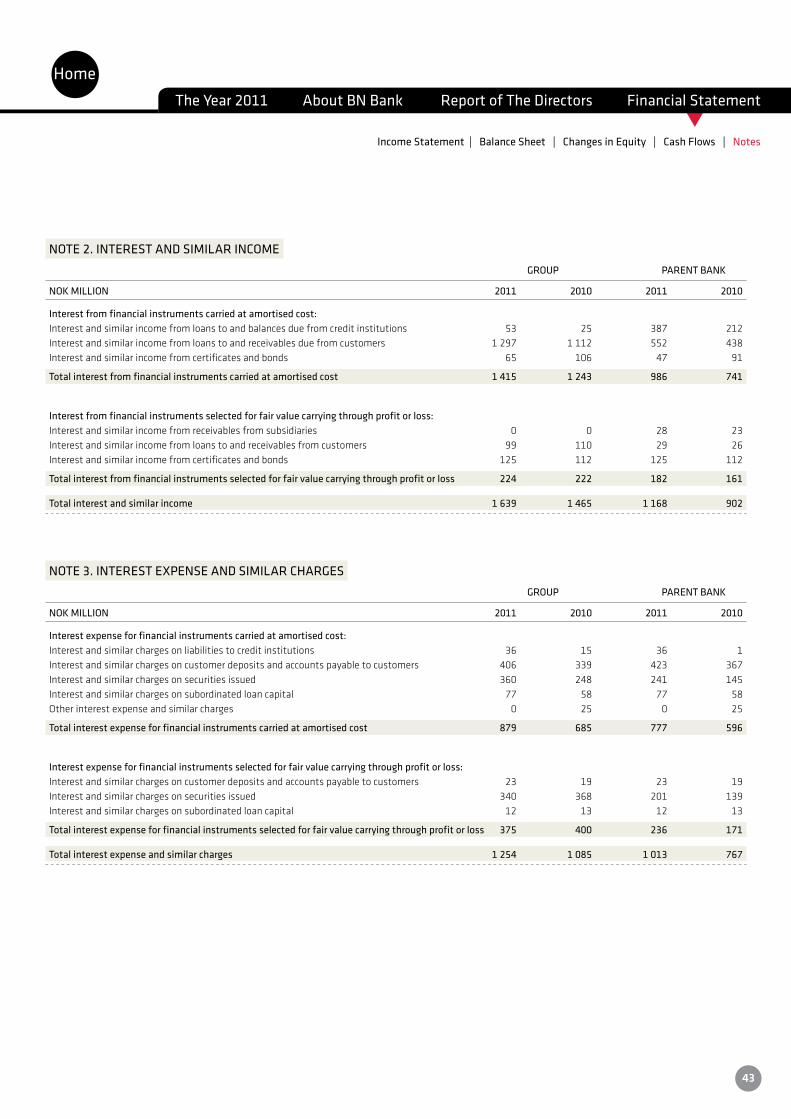
t
NOTE 2. INTEREST AND SIMILAR INCOME GROUP PARENT BANK
NOK MILLION 2011 2010 2011 2010
Interest from financial instruments carried at amortised cost:Interest and similar income from loans to and balances due from credit institutions 53 25 387 212Interestandsimilarincomefromloanstoandreceivablesduefromcustomers 1 297 1 112 552 438Interest and similar income from certificates and bonds 65 106 47 91
Total interest from financial instruments carried at amortised cost 1 415 1 243 986 741
Interest from financial instruments selected for fair value carrying through profit or loss:Interest and similar income from receivables from subsidiaries 0 0 28 23Interest and similar income from loans to and receivables from customers 99 110 29 26Interest and similar income from certificates and bonds 125 112 125 112
Total interest from financial instruments selected for fair value carrying through profit or loss 224 222 182 161
Total interest and similar income 1 639 1 465 1 168 902
NOTE 3. INTEREST EXPENSE AND SIMILAR CHARGES GROUP PARENT BANK
NOK MILLION 2011 2010 2011 2010
Interest expense for financial instruments carried at amortised cost:Interest and similar charges on liabilities to credit institutions 36 15 36 1Interest and similar charges on customer deposits and accounts payable to customers 406 339 423 367Interest and similar charges on securities issued 360 248 241 145Interest and similar charges on subordinated loan capital 77 58 77 58Other interest expense and similar charges 0 25 0 25
Total interest expense for financial instruments carried at amortised cost 879 685 777 596
Interest expense for financial instruments selected for fair value carrying through profit or loss:Interest and similar charges on customer deposits and accounts payable to customers 23 19 23 19Interest and similar charges on securities issued 340 368 201 139Interest and similar charges on subordinated loan capital 12 13 12 13
Total interest expense for financial instruments selected for fair value carrying through profit or loss 375 400 236 171
Total interest expense and similar charges 1 254 1 085 1 013 767
HomeThe Year 2011 About BN Bank Report of The Directors Financial Statement
Income Statement | Balance Sheet | Changes in Equity | Cash Flows | Notes
43
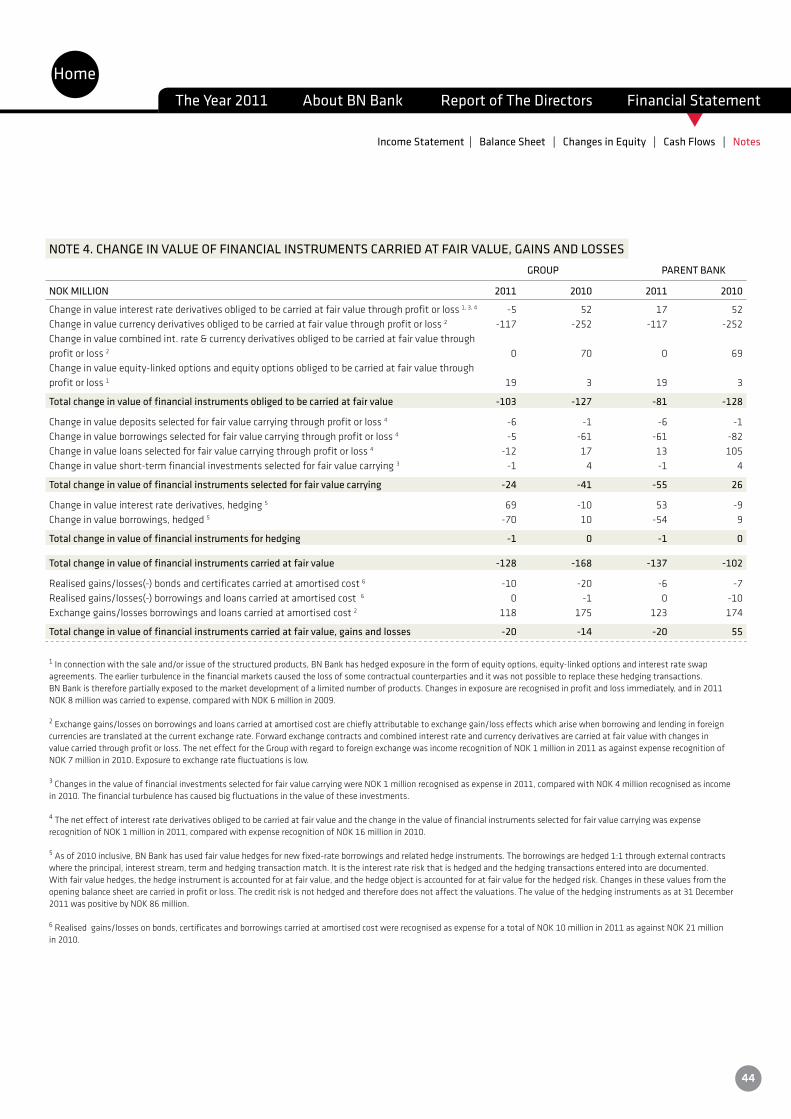
t
NOTE 4. CHANGE IN VALUE OF FINANCIAL INSTRUMENTS CARRIED AT FAIR VALUE, GAINS AND LOSSES GROUP PARENT BANK
NOK MILLION 2011 2010 2011 2010
Change in value interest rate derivatives obliged to be carried at fair value through profit or loss 1, 3, 4 -5 52 17 52Change in value currency derivatives obliged to be carried at fair value through profit or loss 2 -117 -252 -117 -252Change in value combined int. rate & currency derivatives obliged to be carried at fair value through profit or loss 2 0 70 0 69Change in value equity-linked options and equity options obliged to be carried at fair value through profit or loss 1 19 3 19 3
Total change in value of financial instruments obliged to be carried at fair value -103 -127 -81 -128
Change in value deposits selected for fair value carrying through profit or loss 4 -6 -1 -6 -1Change in value borrowings selected for fair value carrying through profit or loss 4 -5 -61 -61 -82Change in value loans selected for fair value carrying through profit or loss 4 -12 17 13 105Change in value short-term financial investments selected for fair value carrying 3 -1 4 -1 4
Total change in value of financial instruments selected for fair value carrying -24 -41 -55 26
Change in value interest rate derivatives, hedging 5 69 -10 53 -9Change in value borrowings, hedged 5 -70 10 -54 9
Total change in value of financial instruments for hedging -1 0 -1 0
Total change in value of financial instruments carried at fair value -128 -168 -137 -102
Realisedgains/losses(-)bondsandcertificatescarriedatamortisedcost6 -10 -20 -6 -7Realisedgains/losses(-)borrowingsandloanscarriedatamortisedcost6 0 -1 0 -10Exchange gains/losses borrowings and loans carried at amortised cost 2 118 175 123 174
Total change in value of financial instruments carried at fair value, gains and losses -20 -14 -20 55
1 In connection with the sale and/or issue of the structured products, BN Bank has hedged exposure in the form of equity options, equity-linked options and interest rate swap agreements. The earlier turbulence in the financial markets caused the loss of some contractual counterparties and it was not possible to replace these hedging transactions. BN Bank is therefore partially exposed to the market development of a limited number of products. Changes in exposure are recognised in profit and loss immediately, and in 2011 NOK8millionwascarriedtoexpense,comparedwithNOK6millionin2009. 2 Exchange gains/losses on borrowings and loans carried at amortised cost are chiefly attributable to exchange gain/loss effects which arise when borrowing and lending in foreign currencies are translated at the current exchange rate. Forward exchange contracts and combined interest rate and currency derivatives are carried at fair value with changes in valuecarriedthroughprofitorloss.TheneteffectfortheGroupwithregardtoforeignexchangewasincomerecognitionofNOK1millionin2011asagainstexpenserecognitionofNOK7millionin2010.Exposuretoexchangeratefluctuationsislow. 3ChangesinthevalueoffinancialinvestmentsselectedforfairvaluecarryingwereNOK1millionrecognisedasexpensein2011,comparedwithNOK4millionrecognisedasincome in 2010. The financial turbulence has caused big fluctuations in the value of these investments.
4 The net effect of interest rate derivatives obliged to be carried at fair value and the change in the value of financial instruments selected for fair value carrying was expense recognitionofNOK1millionin2011,comparedwithexpenserecognitionofNOK16millionin2010.
5Asof2010inclusive,BNBankhasusedfairvaluehedgesfornewfixed-rateborrowingsandrelatedhedgeinstruments.Theborrowingsarehedged1:1throughexternalcontractswhere the principal, interest stream, term and hedging transaction match. It is the interest rate risk that is hedged and the hedging transactions entered into are documented. With fair value hedges, the hedge instrument is accounted for at fair value, and the hedge object is accounted for at fair value for the hedged risk. Changes in these values from the opening balance sheet are carried in profit or loss. The credit risk is not hedged and therefore does not affect the valuations. The value of the hedging instruments as at 31 December 2011waspositivebyNOK86million.
6Realisedgains/lossesonbonds,certificatesandborrowingscarriedatamortisedcostwererecognisedasexpenseforatotalofNOK10millionin2011asagainstNOK21million in 2010.
HomeThe Year 2011 About BN Bank Report of The Directors Financial Statement
Income Statement | Balance Sheet | Changes in Equity | Cash Flows | Notes
44
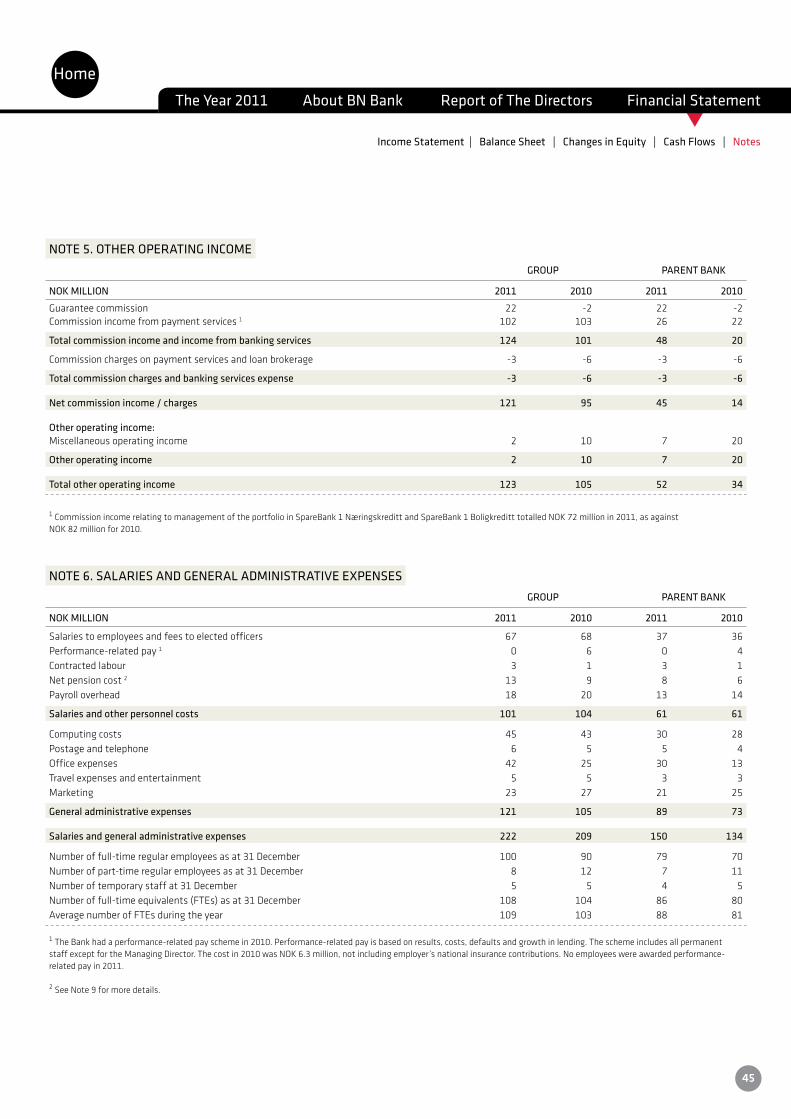
t
NOTE 5. OTHER OPERATING INCOME GROUP PARENT BANK
NOK MILLION 2011 2010 2011 2010
Guaranteecommission 22 -2 22 -2Commission income from payment services 1 102 103 26 22
Total commission income and income from banking services 124 101 48 20
Commission charges on payment services and loan brokerage -3 -6 -3 -6
Total commission charges and banking services expense -3 -6 -3 -6
Net commission income / charges 121 95 45 14
Other operating income:Miscellaneous operating income 2 10 7 20
Other operating income 2 10 7 20
Total other operating income 123 105 52 34
1CommissionincomerelatingtomanagementoftheportfolioinSpareBank1NæringskredittandSpareBank1BoligkreditttotalledNOK72millionin2011,asagainst NOK82millionfor2010.
NOTE 6. SALARIES AND GENERAL ADMINISTRATIVE EXPENSES GROUP PARENT BANK
NOK MILLION 2011 2010 2011 2010
Salaries to employees and fees to elected officers 67 68 37 36Performance-related pay 1 0 6 0 4Contracted labour 3 1 3 1Net pension cost 2 13 9 8 6Payroll overhead 18 20 13 14
Salaries and other personnel costs 101 104 61 61
Computing costs 45 43 30 28Postage and telephone 6 5 5 4Office expenses 42 25 30 13Travel expenses and entertainment 5 5 3 3Marketing 23 27 21 25
General administrative expenses 121 105 89 73
Salaries and general administrative expenses 222 209 150 134
Number of full-time regular employees as at 31 December 100 90 79 70Number of part-time regular employees as at 31 December 8 12 7 11Number of temporary staff at 31 December 5 5 4 5Numberoffull-timeequivalents(FTEs)asat31December 108 104 86 80Average number of FTEs during the year 109 103 88 81
1 The Bank had a performance-related pay scheme in 2010. Performance-related pay is based on results, costs, defaults and growth in lending. The scheme includes all permanent staffexceptfortheManagingDirector.Thecostin2010wasNOK6.3million,notincludingemployer’snationalinsurancecontributions.Noemployeeswereawardedperformance-related pay in 2011.
2 See Note 9 for more details.
HomeThe Year 2011 About BN Bank Report of The Directors Financial Statement
Income Statement | Balance Sheet | Changes in Equity | Cash Flows | Notes
45
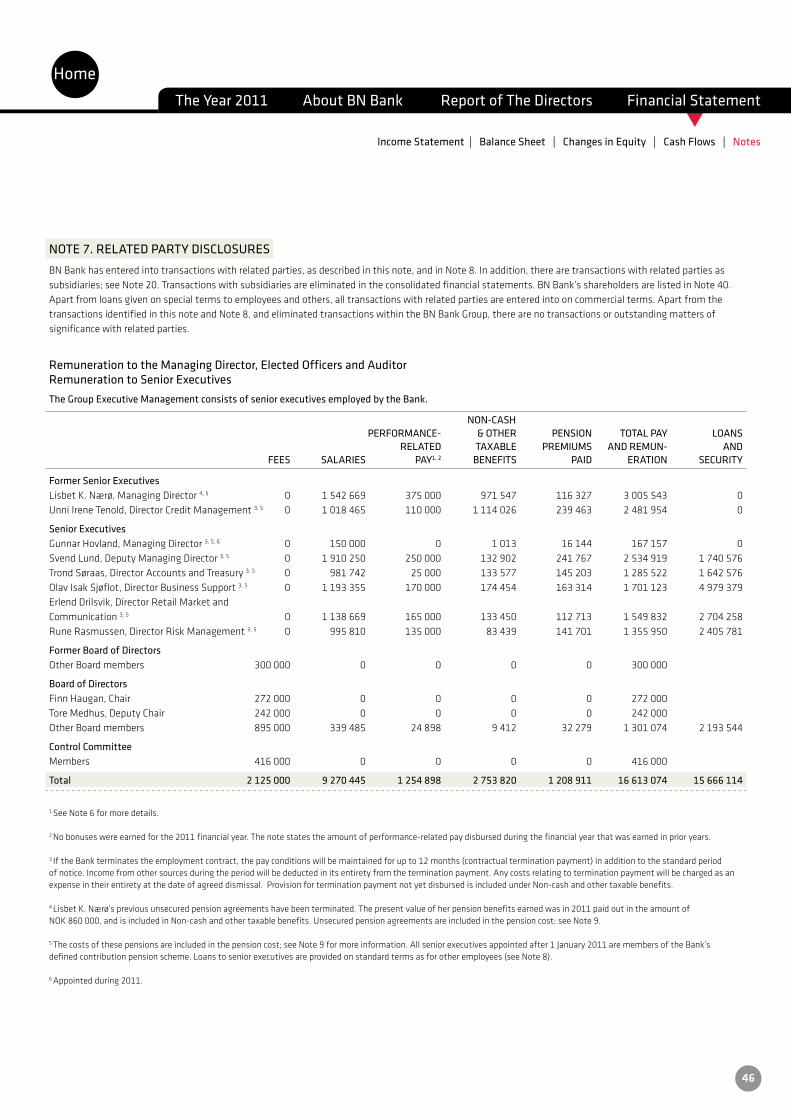
t
NOTE 7. RELATED PARTY DISCLOSURESBN Bank has entered into transactions with related parties, as described in this note, and in Note 8. In addition, there are transactions with related parties as subsidiaries;seeNote20.Transactionswithsubsidiariesareeliminatedintheconsolidatedfinancialstatements.BNBank’sshareholdersarelistedinNote40.Apart from loans given on special terms to employees and others, all transactions with related parties are entered into on commercial terms. Apart from the transactionsidentifiedinthisnoteandNote8,andeliminatedtransactionswithintheBNBankGroup,therearenotransactionsoroutstandingmattersof significance with related parties.
Remuneration to the Managing Director, Elected Officers and AuditorRemuneration to Senior ExecutivesThe Group Executive Management consists of senior executives employed by the Bank.
NON-CASH PERFORMANCE- & OTHER PENSION TOTAL PAY LOANS RELATED TAXABLE PREMIUMS AND REMUN- AND FEES SALARIES PAY1, 2 BENEFITS PAID ERATION SECURITY
Former Senior ExecutivesLisbetK.Nærø,ManagingDirector4, 5 0 1 542 669 375 000 971 547 116 327 3 005 543 0Unni Irene Tenold, Director Credit Management 3, 5 0 1 018 465 110 000 1 114 026 239 463 2 481 954 0
Senior ExecutivesGunnarHovland,ManagingDirector3, 5, 6 0 150 000 0 1 013 16 144 167 157 0Svend Lund, Deputy Managing Director 3, 5 0 1 910 250 250 000 132 902 241 767 2 534 919 1 740 576Trond Søraas, Director Accounts and Treasury 3, 5 0 981 742 25 000 133 577 145 203 1 285 522 1 642 576Olav Isak Sjøflot, Director Business Support 3, 5 0 1 193 355 170 000 174 454 163 314 1 701 123 4 979 379Erlend Drilsvik, Director Retail Market and Communication 3, 5 0 1 138 669 165 000 133 450 112 713 1 549 832 2 704 258Rune Rasmussen, Director Risk Management 3, 5 0 995 810 135 000 83 439 141 701 1 355 950 2 405 781
Former Board of DirectorsOtherBoardmembers 300 000 0 0 0 0 300 000
Board of DirectorsFinnHaugan,Chair 272 000 0 0 0 0 272 000ToreMedhus,DeputyChair 242 000 0 0 0 0 242 000OtherBoardmembers 895 000 339 485 24 898 9 412 32 279 1 301 074 2 193 544
Control CommitteeMembers 416 000 0 0 0 0 416 000
Total 2 125 000 9 270 445 1 254 898 2 753 820 1 208 911 16 613 074 15 666 114
1 See Note 6 for more details.
2 No bonuses were earned for the 2011 financial year. The note states the amount of performance-related pay disbursed during the financial year that was earned in prior years.
3 IftheBankterminatestheemploymentcontract,thepayconditionswillbemaintainedforupto12months(contractualterminationpayment)inadditiontothestandardperiod of notice. Income from other sources during the period will be deducted in its entirety from the termination payment. Any costs relating to termination payment will be charged as an expense in their entirety at the date of agreed dismissal. Provision for termination payment not yet disbursed is included under Non-cash and other taxable benefits.
4 LisbetK.Nærø’spreviousunsecuredpensionagreementshavebeenterminated.Thepresentvalueofherpensionbenefitsearnedwasin2011paidoutintheamountof NOK860000,andisincludedinNon-cashandothertaxablebenefits.Unsecuredpensionagreementsareincludedinthepensioncost;seeNote9.
5 Thecostsofthesepensionsareincludedinthepensioncost;seeNote9formoreinformation.Allseniorexecutivesappointedafter1January2011aremembersoftheBank’s definedcontributionpensionscheme.Loanstoseniorexecutivesareprovidedonstandardtermsasforotheremployees(seeNote8).
6 Appointed during 2011.
HomeThe Year 2011 About BN Bank Report of The Directors Financial Statement
Income Statement | Balance Sheet | Changes in Equity | Cash Flows | Notes
46
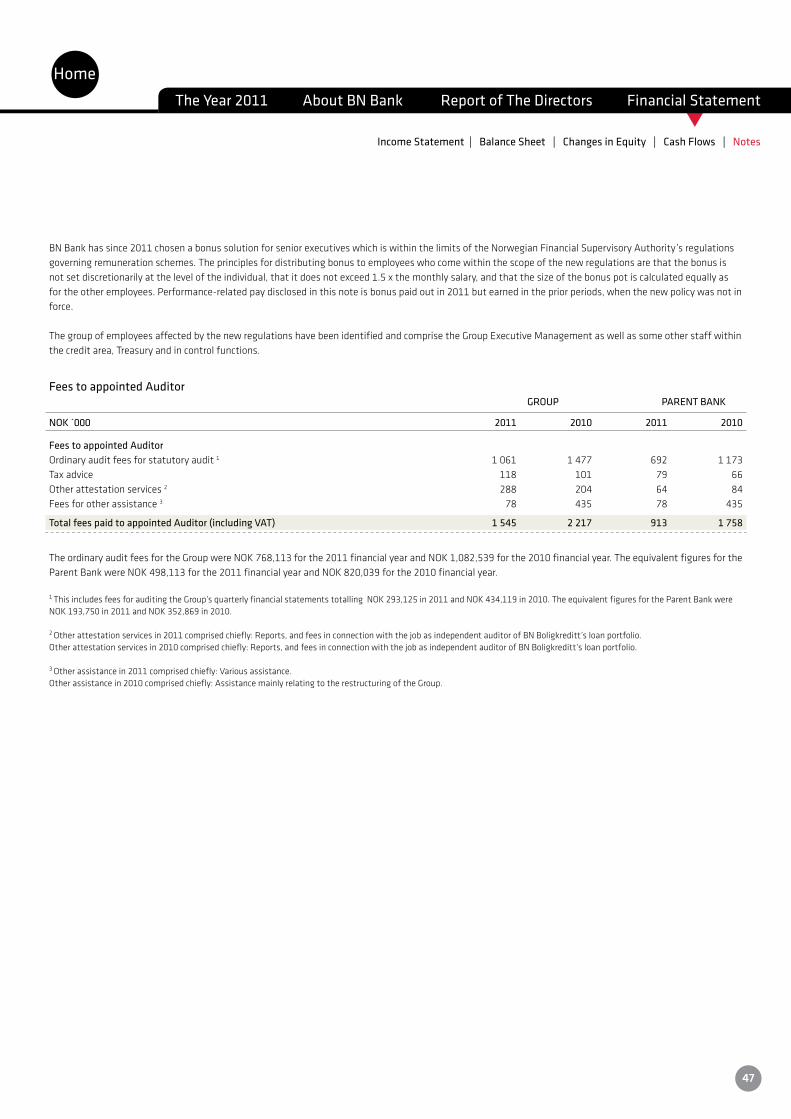
t
BNBankhassince2011chosenabonussolutionforseniorexecutiveswhichiswithinthelimitsoftheNorwegianFinancialSupervisoryAuthority’sregulationsgoverning remuneration schemes. The principles for distributing bonus to employees who come within the scope of the new regulations are that the bonus is not set discretionarily at the level of the individual, that it does not exceed 1.5 x the monthly salary, and that the size of the bonus pot is calculated equally as for the other employees. Performance-related pay disclosed in this note is bonus paid out in 2011 but earned in the prior periods, when the new policy was not in force.
ThegroupofemployeesaffectedbythenewregulationshavebeenidentifiedandcomprisetheGroupExecutiveManagementaswellassomeotherstaffwithinthe credit area, Treasury and in control functions.
Fees to appointed Auditor GROUP PARENT BANK
NOK ´000 2011 2010 2011 2010
Fees to appointed AuditorOrdinary audit fees for statutory audit 1 1 061 1 477 692 1 173Tax advice 118 101 79 66 Other attestation services 2 288 204 64 84 Fees for other assistance 3 78 435 78 435
Total fees paid to appointed Auditor (including VAT) 1 545 2 217 913 1 758
TheordinaryauditfeesfortheGroupwereNOK768,113forthe2011financialyearandNOK1,082,539forthe2010financialyear.TheequivalentfiguresfortheParentBankwereNOK498,113forthe2011financialyearandNOK820,039forthe2010financialyear.
1 ThisincludesfeesforauditingtheGroup’squarterlyfinancialstatementstotallingNOK293,125in2011andNOK434,119in2010.TheequivalentfiguresfortheParentBankwereNOK193,750in2011andNOK352,869in2010.
2 Otherattestationservicesin2011comprisedchiefly:Reports,andfeesinconnectionwiththejobasindependentauditorofBNBoligkreditt’sloanportfolio. Otherattestationservicesin2010comprisedchiefly:Reports,andfeesinconnectionwiththejobasindependentauditorofBNBoligkreditt’sloanportfolio.
3 Otherassistancein2011comprisedchiefly:Variousassistance. Otherassistancein2010comprisedchiefly:AssistancemainlyrelatingtotherestructuringoftheGroup.
HomeThe Year 2011 About BN Bank Report of The Directors Financial Statement
Income Statement | Balance Sheet | Changes in Equity | Cash Flows | Notes
47
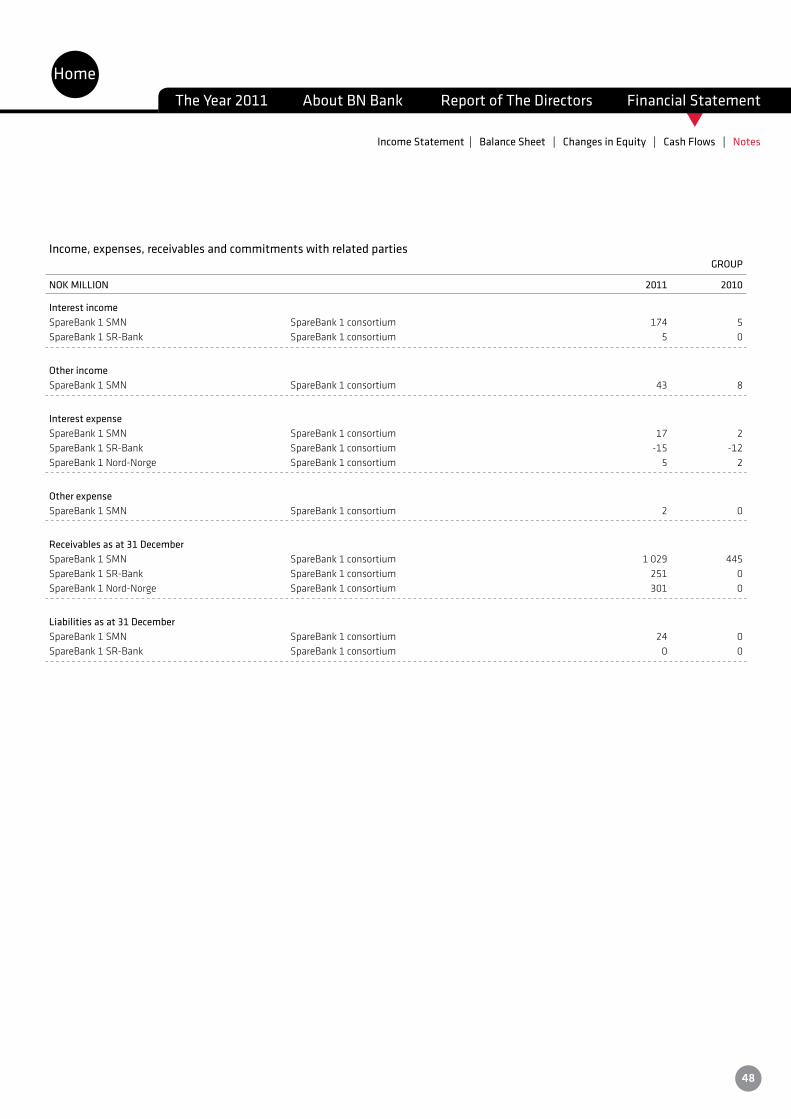
t
Income, expenses, receivables and commitments with related parties GROUP
NOK MILLION 2011 2010
Interest incomeSpareBank 1 SMN SpareBank 1 consortium 174 5SpareBank 1 SR-Bank SpareBank 1 consortium 5 0
Other incomeSpareBank 1 SMN SpareBank 1 consortium 43 8
Interest expenseSpareBank 1 SMN SpareBank 1 consortium 17 2SpareBank 1 SR-Bank SpareBank 1 consortium -15 -12SpareBank 1 Nord-Norge SpareBank 1 consortium 5 2
Other expenseSpareBank 1 SMN SpareBank 1 consortium 2 0
Receivables as at 31 DecemberSpareBank1SMN SpareBank1consortium 1 029 445SpareBank 1 SR-Bank SpareBank 1 consortium 251 0SpareBank 1 Nord-Norge SpareBank 1 consortium 301 0
Liabilities as at 31 DecemberSpareBank 1 SMN SpareBank 1 consortium 24 0SpareBank 1 SR-Bank SpareBank 1 consortium 0 0
HomeThe Year 2011 About BN Bank Report of The Directors Financial Statement
Income Statement | Balance Sheet | Changes in Equity | Cash Flows | Notes
48
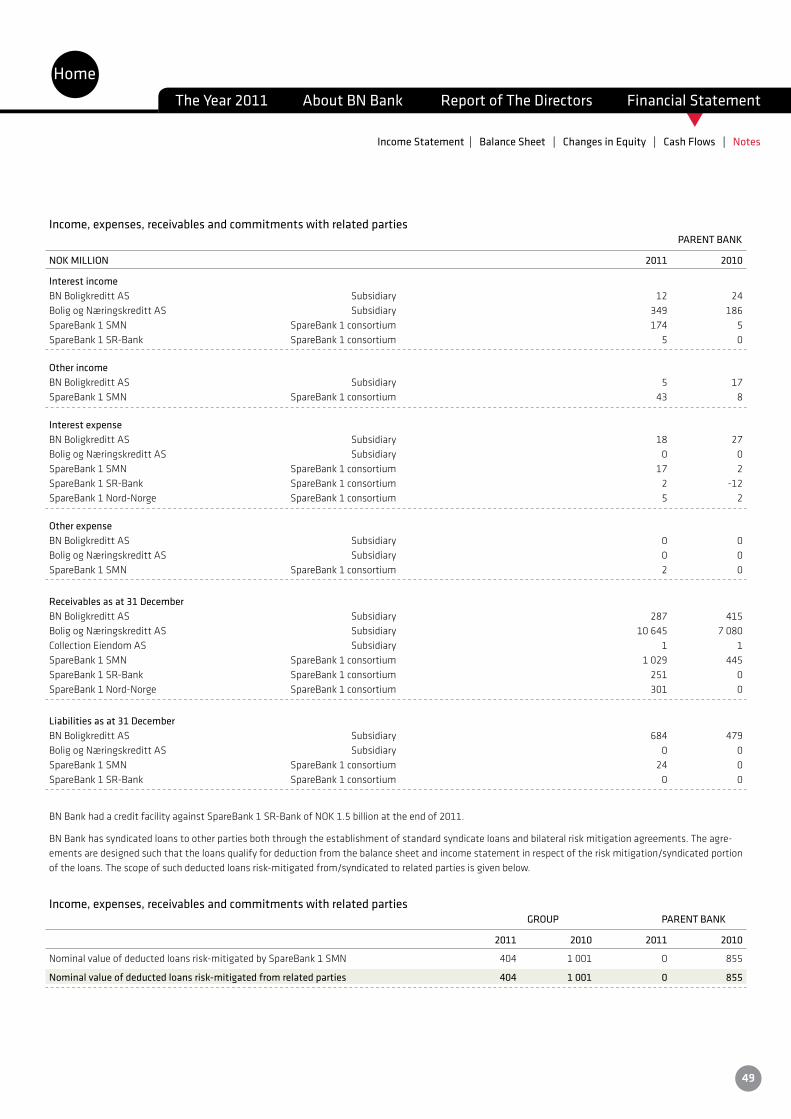
t
Income, expenses, receivables and commitments with related parties PARENT BANK
NOK MILLION 2011 2010
Interest incomeBN Boligkreditt AS Subsidiary 12 24BoligogNæringskredittAS Subsidiary 349 186SpareBank 1 SMN SpareBank 1 consortium 174 5SpareBank 1 SR-Bank SpareBank 1 consortium 5 0
Other incomeBN Boligkreditt AS Subsidiary 5 17SpareBank 1 SMN SpareBank 1 consortium 43 8
Interest expenseBN Boligkreditt AS Subsidiary 18 27 BoligogNæringskredittAS Subsidiary 0 0SpareBank 1 SMN SpareBank 1 consortium 17 2 SpareBank 1 SR-Bank SpareBank 1 consortium 2 -12 SpareBank 1 Nord-Norge SpareBank 1 consortium 5 2
Other expenseBN Boligkreditt AS Subsidiary 0 0BoligogNæringskredittAS Subsidiary 0 0SpareBank 1 SMN SpareBank 1 consortium 2 0
Receivables as at 31 DecemberBN Boligkreditt AS Subsidiary 287 415BoligogNæringskredittAS Subsidiary 10 645 7 080Collection Eiendom AS Subsidiary 1 1SpareBank1SMN SpareBank1consortium 1 029 445SpareBank 1 SR-Bank SpareBank 1 consortium 251 0SpareBank 1 Nord-Norge SpareBank 1 consortium 301 0
Liabilities as at 31 DecemberBN Boligkreditt AS Subsidiary 684 479BoligogNæringskredittAS Subsidiary 0 0SpareBank 1 SMN SpareBank 1 consortium 24 0SpareBank 1 SR-Bank SpareBank 1 consortium 0 0
BNBankhadacreditfacilityagainstSpareBank1SR-BankofNOK1.5billionattheendof2011.
BN Bank has syndicated loans to other parties both through the establishment of standard syndicate loans and bilateral risk mitigation agreements. The agre-ements are designed such that the loans qualify for deduction from the balance sheet and income statement in respect of the risk mitigation/syndicated portion of the loans. The scope of such deducted loans risk-mitigated from/syndicated to related parties is given below.
Income, expenses, receivables and commitments with related parties GROUP PARENT BANK
2011 2010 2011 2010
Nominalvalueofdeductedloansrisk-mitigatedbySpareBank1SMN 404 1 001 0 855
Nominal value of deducted loans risk-mitigated from related parties 404 1 001 0 855
HomeThe Year 2011 About BN Bank Report of The Directors Financial Statement
Income Statement | Balance Sheet | Changes in Equity | Cash Flows | Notes
49
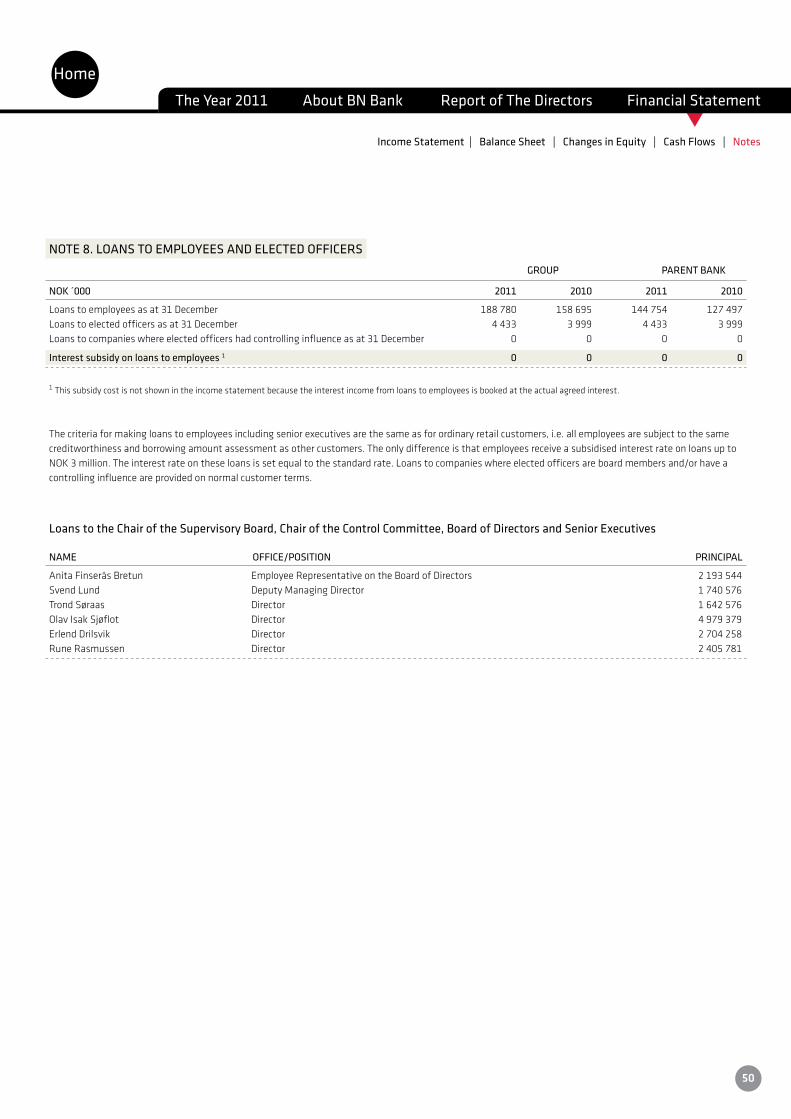
t
NOTE 8. LOANS TO EMPLOYEES AND ELECTED OFFICERS GROUP PARENT BANK
NOK ´000 2011 2010 2011 2010
Loanstoemployeesasat31December 188 780 158 695 144 754 127 497Loanstoelectedofficersasat31December 4 433 3 999 4 433 3 999Loans to companies where elected officers had controlling influence as at 31 December 0 0 0 0
Interest subsidy on loans to employees 1 0 0 0 0
1 This subsidy cost is not shown in the income statement because the interest income from loans to employees is booked at the actual agreed interest.
The criteria for making loans to employees including senior executives are the same as for ordinary retail customers, i.e. all employees are subject to the same creditworthiness and borrowing amount assessment as other customers. The only difference is that employees receive a subsidised interest rate on loans up to NOK3million.Theinterestrateontheseloansissetequaltothestandardrate.Loanstocompanieswhereelectedofficersareboardmembersand/orhaveacontrolling influence are provided on normal customer terms.
Loans to the Chair of the Supervisory Board, Chair of the Control Committee, Board of Directors and Senior Executives
NAME OFFICE/POSITION PRINCIPAL
AnitaFinseråsBretun EmployeeRepresentativeontheBoardofDirectors 2 193 544SvendLund DeputyManagingDirector 1 740 576TrondSøraas Director 1 642 576OlavIsakSjøflot Director 4 979 379ErlendDrilsvik Director 2 704 258RuneRasmussen Director 2 405 781
HomeThe Year 2011 About BN Bank Report of The Directors Financial Statement
Income Statement | Balance Sheet | Changes in Equity | Cash Flows | Notes
50

t
NOTE 9. PENSION COSTS AND COMMITMENTS
TheGrouphasagrouppensionschemewhichsecuresmoststaffapensionof70%ofordinarypayatretirementdate.Thepensionschemesareinvestedinaunittrustschemethroughalifeassurancecompany.From1January2011thedefinedbenefitpensionschemeisclosedtonewmembers.Asof2011,BNBankis offering a defined contribution pension scheme. The premiums for the defined contribution scheme are recognised as expense on an ongoing basis as they ac-crue. The cost of the defined contribution scheme is included in the actuarially calculated pension cost below. The pension schemes satisfy the requirements for Norwegianmandatoryoccupationalpensionschemes(OTP). TheformerunsecuredStateearnings-relatedearlyretirementpensionscheme(AFP)wasdissolvedin2010andrecognisedasincomeintheamountofNOK6.5million in 2010. The premiums for the new AFP scheme are recognised as expense on an ongoing basis as they accrue. Spouse’spensionandsalaryinexcessof12Gwereremovedfromthegroupschemein2007.Pensionsforsalaryinexcessof12Garecoveredthroughaseparatedefined contribution pension scheme from 2007 inclusive. FormerDirectorGunnarJervenhadacontractualretirementageof60.HeenteredintoanewagreementwithBNBankin2010tobecomeapartytothatretire-mentagreementatage57onthesameconditions.Theeffectofthechangewaschargedasexpensein2010intheamountofNOK5.5million.Hispensionis70%percentofnormalsalaryatretirementdate,andwillbeadjustedannuallyinaccordancewithincreasesinthenationalinsuranceschemebasicamount(G).Pensionfromage67issecuredthroughtheGroup’sgrouppensionschemesupto12G,whilepensionover12GandpensionbeforethisdateisunsecuredandcoveredthroughtheGroup’soperationalexpenditure. When measuring the accrued pension commitments, the estimated commitment on the accounts closing day is applied. The future pension benefits are based onthenumberofcontributoryyearsandfinalsalaryatretirementdate.TheGorupsgrouppensionschemesrelatingtothedefinedbenefitschemesarenetpension schemes, while the unsecured pension commitments are gross pension schemes. The estimated commitment is adjusted annually in accordance with a statement from the life assurance company of the accrued pension commitment. When valuing pension assets, the estimated value on the accounts closing day is applied. This estimated value is adjusted each year in accordance with a state-ment from the life assurance company of the transfer value of the pension assets. The accumulated effect of changes in the underlying financial and actuarial ratios, as a result of which the value of the pension assets and pension commit-ments has changed, is allocated to profit or loss systematically over the average remaining contributory period. Actuarialcalculationsaremadeeachyearbyanapprovedactuary,basedoninformationprovidedbytheGroup. TheGroup’slegalobligationisnotaffectedbytheaccountingtreatment.
HomeThe Year 2011 About BN Bank Report of The Directors Financial Statement
Income Statement | Balance Sheet | Changes in Equity | Cash Flows | Notes
51
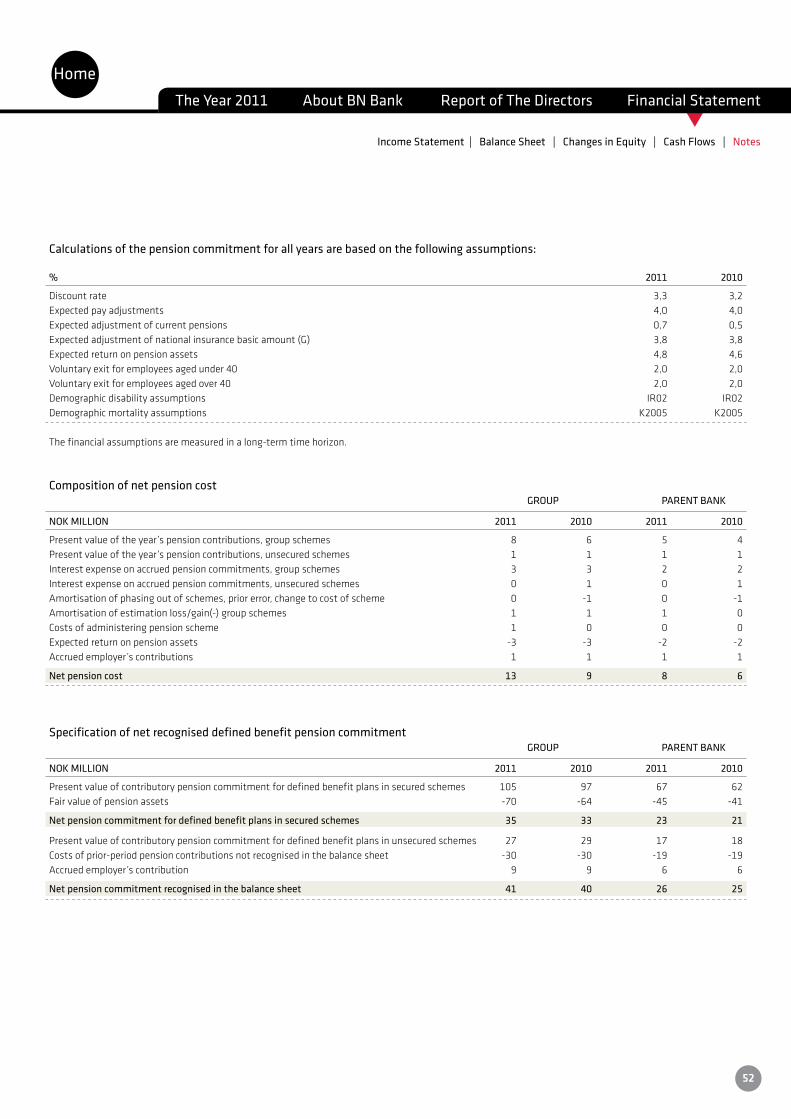
t
Calculations of the pension commitment for all years are based on the following assumptions:
% 2011 2010
Discount rate 3,3 3,2Expected pay adjustments 4,0 4,0Expected adjustment of current pensions 0,7 0,5Expectedadjustmentofnationalinsurancebasicamount(G) 3,8 3,8Expected return on pension assets 4,8 4,6Voluntary exit for employees aged under 40 2,0 2,0Voluntary exit for employees aged over 40 2,0 2,0Demographic disability assumptions IR02 IR02Demographicmortalityassumptions K2005 K2005
The financial assumptions are measured in a long-term time horizon.
Composition of net pension cost GROUP PARENT BANK
NOK MILLION 2011 2010 2011 2010
Presentvalueoftheyear’spensioncontributions,groupschemes 8 6 5 4Presentvalueoftheyear’spensioncontributions,unsecuredschemes 1 1 1 1Interest expense on accrued pension commitments, group schemes 3 3 2 2Interest expense on accrued pension commitments, unsecured schemes 0 1 0 1Amortisation of phasing out of schemes, prior error, change to cost of scheme 0 -1 0 -1Amortisationofestimationloss/gain(-)groupschemes 1 1 1 0Costs of administering pension scheme 1 0 0 0Expected return on pension assets -3 -3 -2 -2Accruedemployer’scontributions 1 1 1 1
Net pension cost 13 9 8 6
Specification of net recognised defined benefit pension commitment GROUP PARENT BANK
NOK MILLION 2011 2010 2011 2010
Present value of contributory pension commitment for defined benefit plans in secured schemes 105 97 67 62Fair value of pension assets -70 -64 -45 -41
Net pension commitment for defined benefit plans in secured schemes 35 33 23 21
Present value of contributory pension commitment for defined benefit plans in unsecured schemes 27 29 17 18Costs of prior-period pension contributions not recognised in the balance sheet -30 -30 -19 -19Accruedemployer’scontribution 9 9 6 6
Net pension commitment recognised in the balance sheet 41 40 26 25
HomeThe Year 2011 About BN Bank Report of The Directors Financial Statement
Income Statement | Balance Sheet | Changes in Equity | Cash Flows | Notes
52
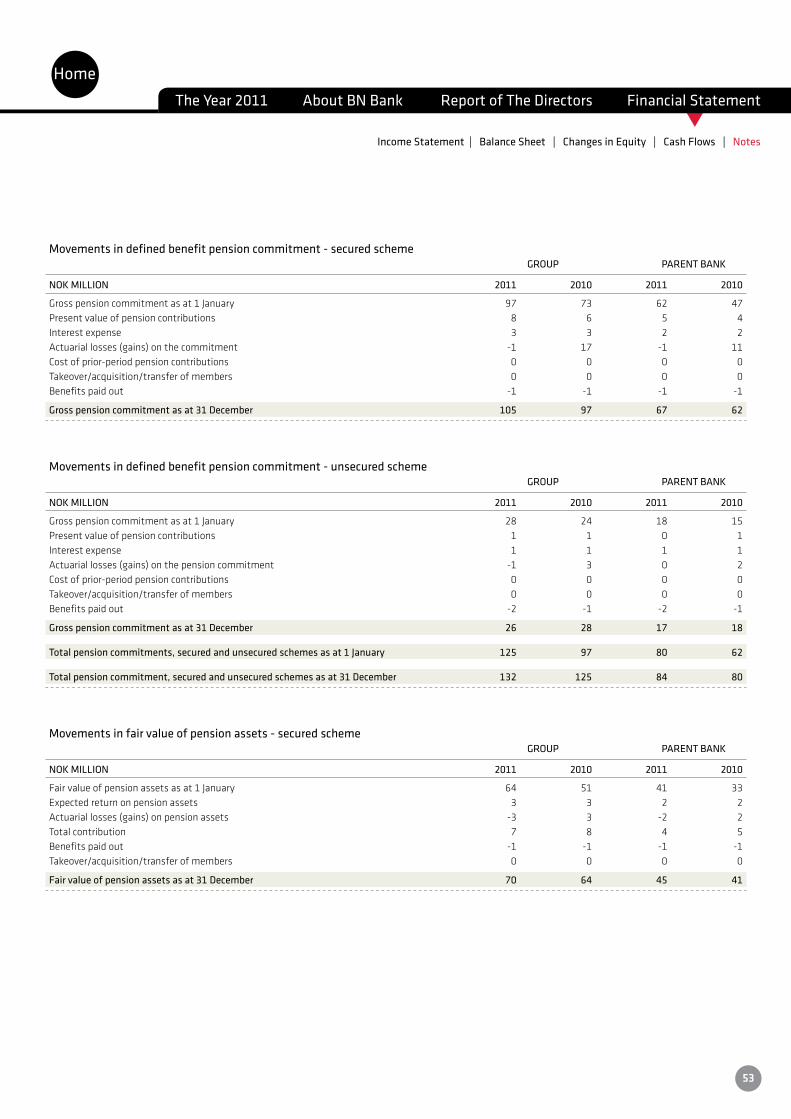
t
Movements in defined benefit pension commitment - secured scheme GROUP PARENT BANK
NOK MILLION 2011 2010 2011 2010
Grosspensioncommitmentasat1January 97 73 62 47Present value of pension contributions 8 6 5 4Interest expense 3 3 2 2Actuariallosses(gains)onthecommitment -1 17 -1 11Cost of prior-period pension contributions 0 0 0 0Takeover/acquisition/transfer of members 0 0 0 0Benefits paid out -1 -1 -1 -1
Gross pension commitment as at 31 December 105 97 67 62
Movements in defined benefit pension commitment - unsecured scheme GROUP PARENT BANK
NOK MILLION 2011 2010 2011 2010
Grosspensioncommitmentasat1January 28 24 18 15Present value of pension contributions 1 1 0 1Interest expense 1 1 1 1Actuariallosses(gains)onthepensioncommitment -1 3 0 2Cost of prior-period pension contributions 0 0 0 0Takeover/acquisition/transfer of members 0 0 0 0Benefits paid out -2 -1 -2 -1
Gross pension commitment as at 31 December 26 28 17 18
Total pension commitments, secured and unsecured schemes as at 1 January 125 97 80 62
Total pension commitment, secured and unsecured schemes as at 31 December 132 125 84 80
Movements in fair value of pension assets - secured scheme GROUP PARENT BANK
NOK MILLION 2011 2010 2011 2010
Fairvalueofpensionassetsasat1January 64 51 41 33Expected return on pension assets 3 3 2 2Actuariallosses(gains)onpensionassets -3 3 -2 2Total contribution 7 8 4 5Benefits paid out -1 -1 -1 -1Takeover/acquisition/transfer of members 0 0 0 0
Fair value of pension assets as at 31 December 70 64 45 41
HomeThe Year 2011 About BN Bank Report of The Directors Financial Statement
Income Statement | Balance Sheet | Changes in Equity | Cash Flows | Notes
53

t
Pension scheme members GROUP PARENT BANK
NOK MILLION 2011 2010 2011 2010
Economically active members 118 103 76 66Pensioners and disabled members 16 17 10 11
Total number of pension scheme members 134 120 86 77
Investment of pension assets as at 31 December GROUP
2011 2010 NOK MILLION AMOUNT % AMOUNT %
Equity instruments 7 10.4 10 15.6Debt instruments 49 70.3 40 62.3Real estate 13 18.1 10 16.1Other investments 1 1.2 4 6.0
Total pension assets 70 100 64 100
Pension assets are not invested in own financial instruments or other assets in the company. The pension assets are managed by the insurance company.
Expectedpaymentofpremiumtodefinedbenefitpensionschemesin2012isNOK8millionfortheGroup,andNOK5millionfortheParentCompany.
GROUP
NOK MILLION 2011 2010 2009 2008 2007 2006
Present value of pension contributions 132 125 97 112 114 93Fair value of pension assets 70 64 51 63 61 60
Deficit/(surplus) -62 -61 -45 -49 -53 -33
Experience-based adjustments to pension commitments -2 20 -29 -18 13 -13Experience-based adjustments to pension assets -3 3 -20 -14 -2 -1
PARENT BANK
NOK MILLION 2011 2010 2009 2008 2007 2006
Present value of pension contributions 84 80 62 71 75 59Fair value of pension assets 45 41 33 40 42 39
Deficit/(surplus) -39 -39 -29 -31 -33 -20
Experience-based adjustments to pension commitments -1 12 -19 -12 7 -8Experience-based adjustments to pension assets -2 2 -13 -9 -2 -1
HomeThe Year 2011 About BN Bank Report of The Directors Financial Statement
Income Statement | Balance Sheet | Changes in Equity | Cash Flows | Notes
54
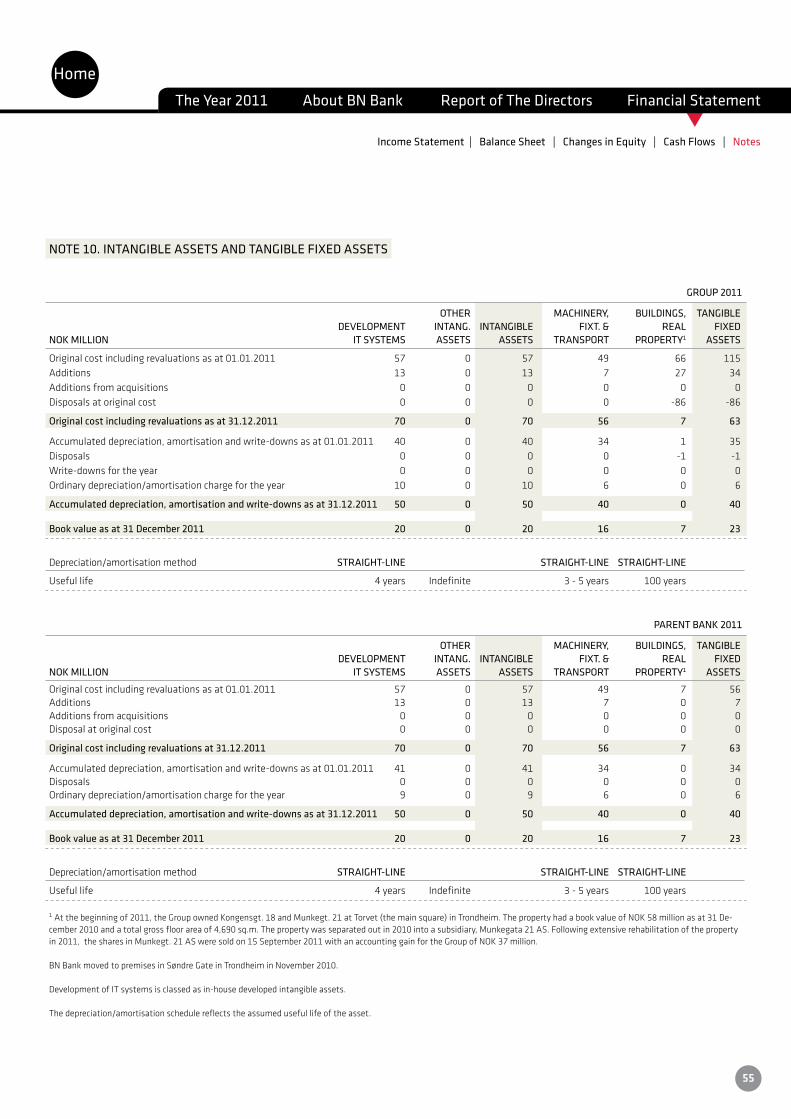
t
NOTE 10. INTANGIBLE ASSETS AND TANGIBLE FIXED ASSETS
GROUP 2011
OTHER MACHINERY, BUILDINGS, TANGIBLE DEVELOPMENT INTANG. INTANGIBLE FIXT. & REAL FIXEDNOK MILLION IT SYSTEMS ASSETS ASSETS TRANSPORT PROPERTY1 ASSETS
Original cost including revaluations as at 01.01.2011 57 0 57 49 66 115Additions 13 0 13 7 27 34Additions from acquisitions 0 0 0 0 0 0Disposals at original cost 0 0 0 0 -86 -86
Original cost including revaluations as at 31.12.2011 70 0 70 56 7 63
Accumulated depreciation, amortisation and write-downs as at 01.01.2011 40 0 40 34 1 35Disposals 0 0 0 0 -1 -1Write-downs for the year 0 0 0 0 0 0Ordinary depreciation/amortisation charge for the year 10 0 10 6 0 6
Accumulated depreciation, amortisation and write-downs as at 31.12.2011 50 0 50 40 0 40
Book value as at 31 December 2011 20 0 20 16 7 23
Depreciation/amortisation method STRAIGHT-LINE STRAIGHT-LINE STRAIGHT-LINE
Useful life 4 years Indefinite 3 - 5 years 100 years
PARENT BANK 2011
OTHER MACHINERY, BUILDINGS, TANGIBLE DEVELOPMENT INTANG. INTANGIBLE FIXT. & REAL FIXEDNOK MILLION IT SYSTEMS ASSETS ASSETS TRANSPORT PROPERTY1 ASSETS
Original cost including revaluations as at 01.01.2011 57 0 57 49 7 56Additions 13 0 13 7 0 7Additions from acquisitions 0 0 0 0 0 0Disposal at original cost 0 0 0 0 0 0
Original cost including revaluations at 31.12.2011 70 0 70 56 7 63
Accumulated depreciation, amortisation and write-downs as at 01.01.2011 41 0 41 34 0 34Disposals 0 0 0 0 0 0Ordinary depreciation/amortisation charge for the year 9 0 9 6 0 6
Accumulated depreciation, amortisation and write-downs as at 31.12.2011 50 0 50 40 0 40
Book value as at 31 December 2011 20 0 20 16 7 23
Depreciation/amortisation method STRAIGHT-LINE STRAIGHT-LINE STRAIGHT-LINE
Useful life 4 years Indefinite 3 - 5 years 100 years
1Atthebeginningof2011,theGroupownedKongensgt.18andMunkegt.21atTorvet(themainsquare)inTrondheim.ThepropertyhadabookvalueofNOK58millionasat31De-cember 2010 and a total gross floor area of 4,690 sq.m. The property was separated out in 2010 into a subsidiary, Munkegata 21 AS. Following extensive rehabilitation of the property in2011,thesharesinMunkegt.21ASweresoldon15September2011withanaccountinggainfortheGroupofNOK37million.
BNBankmovedtopremisesinSøndreGateinTrondheiminNovember2010.
Development of IT systems is classed as in-house developed intangible assets.
The depreciation/amortisation schedule reflects the assumed useful life of the asset.
HomeThe Year 2011 About BN Bank Report of The Directors Financial Statement
Income Statement | Balance Sheet | Changes in Equity | Cash Flows | Notes
55
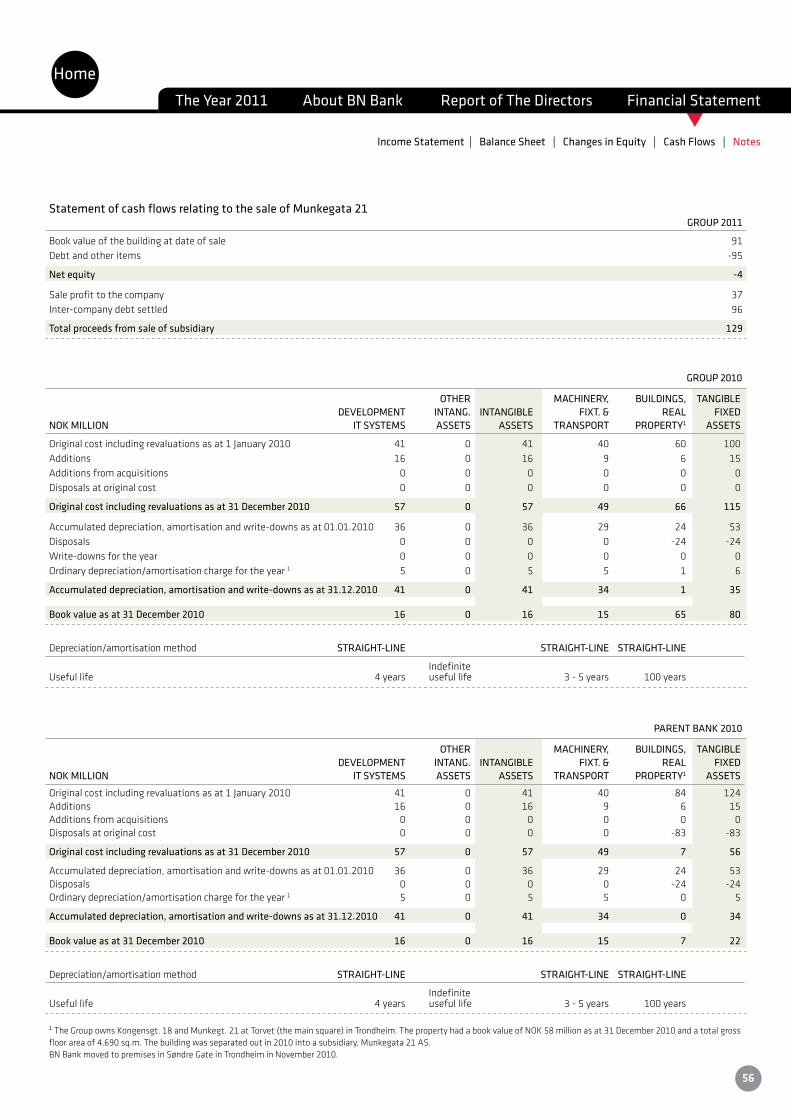
t
Statement of cash flows relating to the sale of Munkegata 21 GROUP 2011
Book value of the building at date of sale 91Debt and other items -95
Net equity -4
Sale profit to the company 37Inter-company debt settled 96
Total proceeds from sale of subsidiary 129
GROUP 2010
OTHER MACHINERY, BUILDINGS, TANGIBLE DEVELOPMENT INTANG. INTANGIBLE FIXT. & REAL FIXEDNOK MILLION IT SYSTEMS ASSETS ASSETS TRANSPORT PROPERTY1 ASSETS
Originalcostincludingrevaluationsasat1January2010 41 0 41 40 60 100Additions 16 0 16 9 6 15Additions from acquisitions 0 0 0 0 0 0Disposals at original cost 0 0 0 0 0 0
Original cost including revaluations as at 31 December 2010 57 0 57 49 66 115
Accumulated depreciation, amortisation and write-downs as at 01.01.2010 36 0 36 29 24 53Disposals 0 0 0 0 -24 -24Write-downs for the year 0 0 0 0 0 0Ordinary depreciation/amortisation charge for the year 1 5 0 5 5 1 6
Accumulated depreciation, amortisation and write-downs as at 31.12.2010 41 0 41 34 1 35
Book value as at 31 December 2010 16 0 16 15 65 80
Depreciation/amortisation method STRAIGHT-LINE STRAIGHT-LINE STRAIGHT-LINE
Indefinite Useful life 4 years useful life 3 - 5 years 100 years
PARENT BANK 2010
OTHER MACHINERY, BUILDINGS, TANGIBLE DEVELOPMENT INTANG. INTANGIBLE FIXT. & REAL FIXEDNOK MILLION IT SYSTEMS ASSETS ASSETS TRANSPORT PROPERTY1 ASSETS
Originalcostincludingrevaluationsasat1January2010 41 0 41 40 84 124Additions 16 0 16 9 6 15Additions from acquisitions 0 0 0 0 0 0Disposals at original cost 0 0 0 0 -83 -83
Original cost including revaluations as at 31 December 2010 57 0 57 49 7 56
Accumulated depreciation, amortisation and write-downs as at 01.01.2010 36 0 36 29 24 53Disposals 0 0 0 0 -24 -24Ordinary depreciation/amortisation charge for the year 1 5 0 5 5 0 5
Accumulated depreciation, amortisation and write-downs as at 31.12.2010 41 0 41 34 0 34
Book value as at 31 December 2010 16 0 16 15 7 22
Depreciation/amortisation method STRAIGHT-LINE STRAIGHT-LINE STRAIGHT-LINE
Indefinite Useful life 4 years useful life 3 - 5 years 100 years
1TheGroupownsKongensgt.18andMunkegt.21atTorvet(themainsquare)inTrondheim.ThepropertyhadabookvalueofNOK58millionasat31December2010andatotalgrossfloor area of 4,690 sq.m. The building was separated out in 2010 into a subsidiary, Munkegata 21 AS.BNBankmovedtopremisesinSøndreGateinTrondheiminNovember2010.
HomeThe Year 2011 About BN Bank Report of The Directors Financial Statement
Income Statement | Balance Sheet | Changes in Equity | Cash Flows | Notes
56
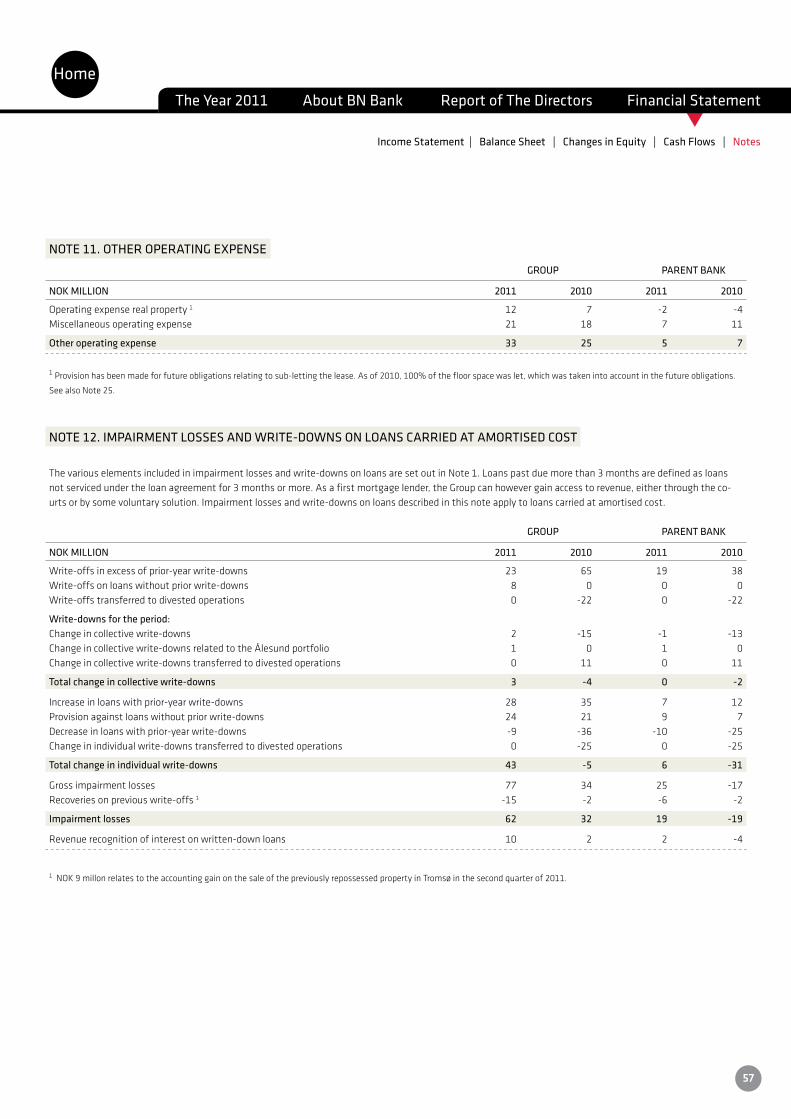
t
NOTE 11. OTHER OPERATING EXPENSE GROUP PARENT BANK
NOK MILLION 2011 2010 2011 2010
Operating expense real property 1 12 7 -2 -4Miscellaneous operating expense 21 18 7 11
Other operating expense 33 25 5 7
1 Provision has been made for future obligations relating to sub-letting the lease. As of 2010, 100% of the floor space was let, which was taken into account in the future obligations.
See also Note 25.
NOTE 12. IMPAIRMENT LOSSES AND WRITE-DOWNS ON LOANS CARRIED AT AMORTISED COST
The various elements included in impairment losses and write-downs on loans are set out in Note 1. Loans past due more than 3 months are defined as loans notservicedundertheloanagreementfor3monthsormore.Asafirstmortgagelender,theGroupcanhowevergainaccesstorevenue,eitherthroughtheco-urts or by some voluntary solution. Impairment losses and write-downs on loans described in this note apply to loans carried at amortised cost.
GROUP PARENT BANK
NOK MILLION 2011 2010 2011 2010
Write-offs in excess of prior-year write-downs 23 65 19 38Write-offs on loans without prior write-downs 8 0 0 0Write-offs transferred to divested operations 0 -22 0 -22
Write-downs for the period:Change in collective write-downs 2 -15 -1 -13Change in collective write-downs related to the Ålesund portfolio 1 0 1 0Change in collective write-downs transferred to divested operations 0 11 0 11
Total change in collective write-downs 3 -4 0 -2
Increase in loans with prior-year write-downs 28 35 7 12Provision against loans without prior write-downs 24 21 9 7Decrease in loans with prior-year write-downs -9 -36 -10 -25Change in individual write-downs transferred to divested operations 0 -25 0 -25
Total change in individual write-downs 43 -5 6 -31
Grossimpairmentlosses 77 34 25 -17Recoveries on previous write-offs 1 -15 -2 -6 -2
Impairment losses 62 32 19 -19
Revenue recognition of interest on written-down loans 10 2 2 -4
1NOK9millonrelatestotheaccountinggainonthesaleofthepreviouslyrepossessedpropertyinTromsøinthesecondquarterof2011.
HomeThe Year 2011 About BN Bank Report of The Directors Financial Statement
Income Statement | Balance Sheet | Changes in Equity | Cash Flows | Notes
57
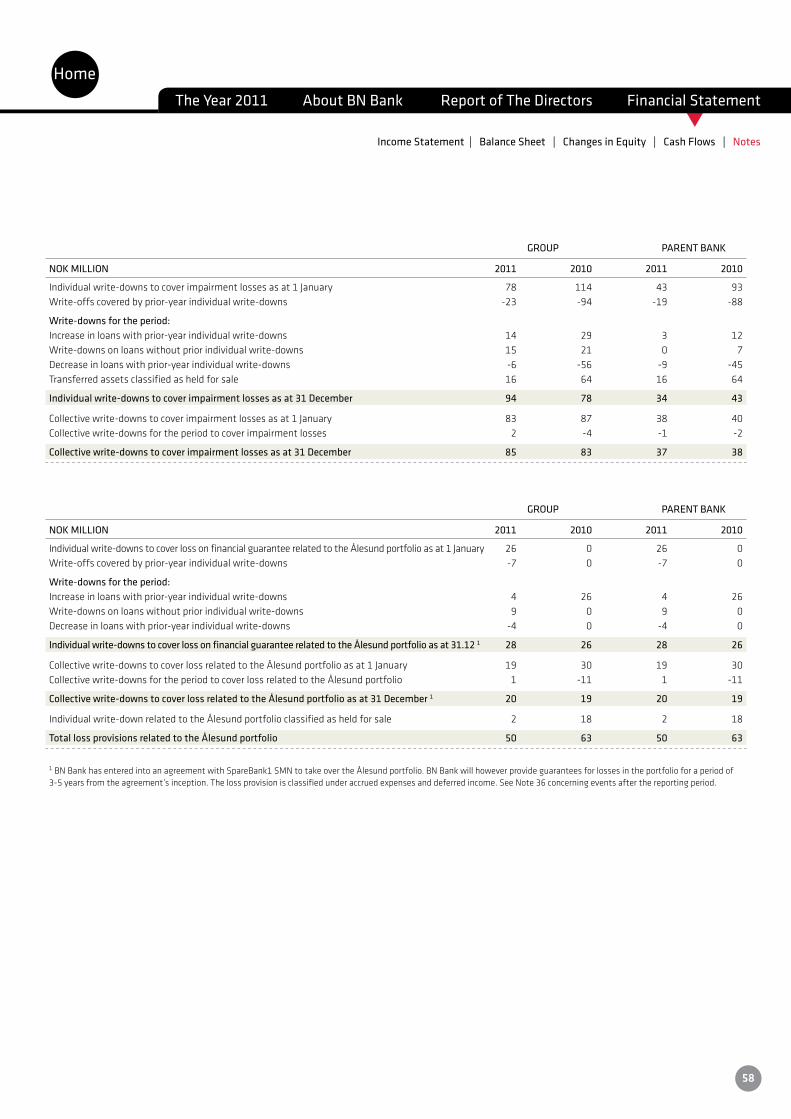
t
GROUP PARENT BANK
NOK MILLION 2011 2010 2011 2010
Individualwrite-downstocoverimpairmentlossesasat1January 78 114 43 93Write-offs covered by prior-year individual write-downs -23 -94 -19 -88
Write-downs for the period:Increase in loans with prior-year individual write-downs 14 29 3 12Write-downs on loans without prior individual write-downs 15 21 0 7Decrease in loans with prior-year individual write-downs -6 -56 -9 -45Transferred assets classified as held for sale 16 64 16 64
Individual write-downs to cover impairment losses as at 31 December 94 78 34 43
Collectivewrite-downstocoverimpairmentlossesasat1January 83 87 38 40Collective write-downs for the period to cover impairment losses 2 -4 -1 -2
Collective write-downs to cover impairment losses as at 31 December 85 83 37 38
GROUP PARENT BANK
NOK MILLION 2011 2010 2011 2010
Individualwrite-downstocoverlossonfinancialguaranteerelatedtotheÅlesundportfolioasat1January 26 0 26 0Write-offs covered by prior-year individual write-downs -7 0 -7 0
Write-downs for the period:Increase in loans with prior-year individual write-downs 4 26 4 26Write-downs on loans without prior individual write-downs 9 0 9 0Decrease in loans with prior-year individual write-downs -4 0 -4 0
Individual write-downs to cover loss on financial guarantee related to the Ålesund portfolio as at 31.12 1 28 26 28 26
Collectivewrite-downstocoverlossrelatedtotheÅlesundportfolioasat1January 19 30 19 30Collective write-downs for the period to cover loss related to the Ålesund portfolio 1 -11 1 -11
Collective write-downs to cover loss related to the Ålesund portfolio as at 31 December 1 20 19 20 19
Individual write-down related to the Ålesund portfolio classified as held for sale 2 18 2 18
Total loss provisions related to the Ålesund portfolio 50 63 50 63
1 BN Bank has entered into an agreement with SpareBank1 SMN to take over the Ålesund portfolio. BN Bank will however provide guarantees for losses in the portfolio for a period of 3-5yearsfromtheagreement’sinception.Thelossprovisionisclassifiedunderaccruedexpensesanddeferredincome.SeeNote36concerningeventsafterthereportingperiod.
HomeThe Year 2011 About BN Bank Report of The Directors Financial Statement
Income Statement | Balance Sheet | Changes in Equity | Cash Flows | Notes
58
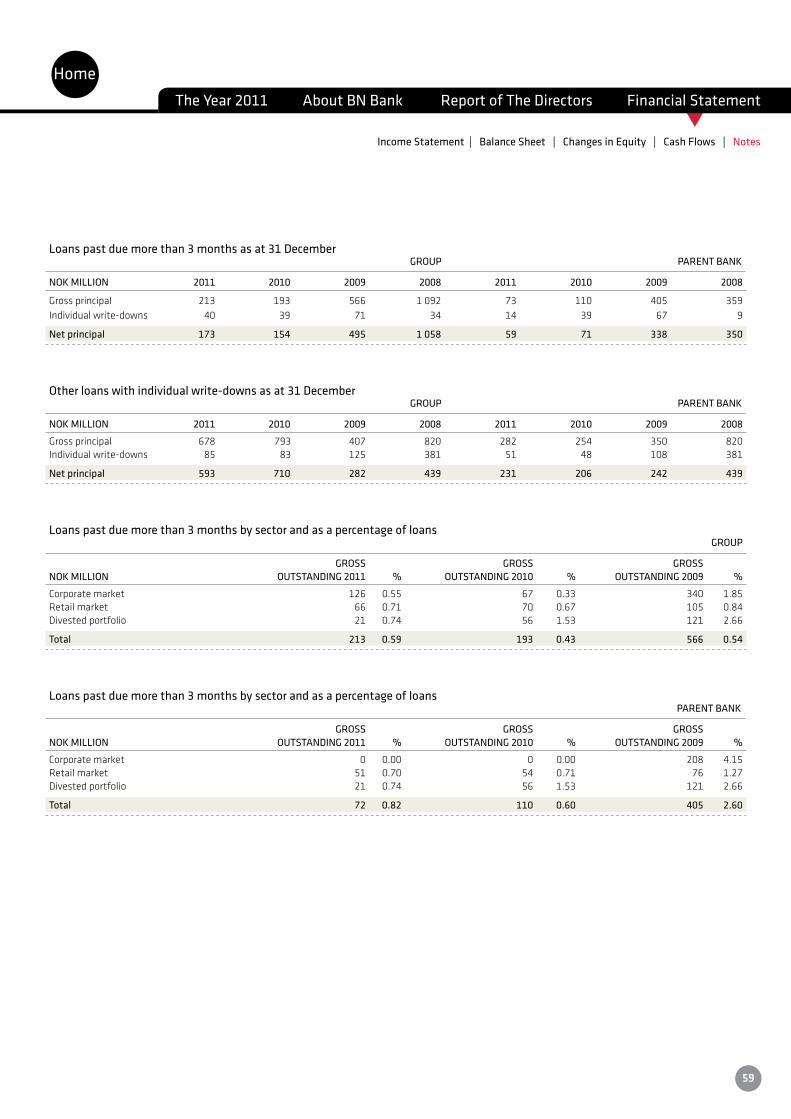
t
Loans past due more than 3 months as at 31 December GROUP PARENT BANK
NOK MILLION 2011 2010 2009 2008 2011 2010 2009 2008
Grossprincipal 213 193 566 1 092 73 110 405 359Individual write-downs 40 39 71 34 14 39 67 9
Net principal 173 154 495 1 058 59 71 338 350
Other loans with individual write-downs as at 31 December GROUP PARENT BANK
NOK MILLION 2011 2010 2009 2008 2011 2010 2009 2008
Grossprincipal 678 793 407 820 282 254 350 820Individual write-downs 85 83 125 381 51 48 108 381
Net principal 593 710 282 439 231 206 242 439
Loans past due more than 3 months by sector and as a percentage of loans GROUP
GROSS GROSS GROSSNOK MILLION OUTSTANDING 2011 % OUTSTANDING 2010 % OUTSTANDING 2009 %
Corporate market 126 0.55 67 0.33 340 1.85Retail market 66 0.71 70 0.67 105 0.84Divested portfolio 21 0.74 56 1.53 121 2.66
Total 213 0.59 193 0.43 566 0.54
Loans past due more than 3 months by sector and as a percentage of loans PARENT BANK
GROSS GROSS GROSSNOK MILLION OUTSTANDING 2011 % OUTSTANDING 2010 % OUTSTANDING 2009 %
Corporate market 0 0.00 0 0.00 208 4.15Retail market 51 0.70 54 0.71 76 1.27Divested portfolio 21 0.74 56 1.53 121 2.66
Total 72 0.82 110 0.60 405 2.60
HomeThe Year 2011 About BN Bank Report of The Directors Financial Statement
Income Statement | Balance Sheet | Changes in Equity | Cash Flows | Notes
59

t
NOTE 13. TAX
Computation of tax payable GROUP PARENT BANK
NOK MILLION 2011 2010 2011 2010
Profit/(loss)beforetax 201 191 138 207
Permanent P&L differences:Income from ownership interests in associates 0 0 0 0Income from ownership interests in group companies 0 0 45 0Non-deductible expenses 2 5 2 5Non-taxable income -33 -1 -33 -1
Changes in temporary P&L differences relating to:Current assets/short-term liabilities -159 95 -120 210Fixed assets/long-term liabilities 123 -283 113 -291
Other items recognised in equity
Taxable income 134 7 145 130
Taxpayable(28%) 37 2 41 3628%ofthepreviousyear’sgroupcontribution,recognisedthisyear 0 0 -40 -7628%oftheyear’sgroupcontribution 0 0 36 40
Tax payable on the balance sheet 37 2 36 0
The Parent Bank has a loss carry-forward and therefore no tax payable in 2010. The subsidiaries render group contribution chiefly equivalent to the taxable pro-fit.ThesubsidiaryBNBoligkreditthastaxpayabletotallingNOK2millionin2010.
The Parent Bank has a taxable profit in 2011 after the subsidiaries have rendered group contribution with tax effect. The Parent Bank has tax payable totalling NOK36millionin2011.
ThesubsidiaryBNkreditthastaxpayableofNOK1millionin2011.
GROUP PARENT BANK
NOK MILLION 2011 2010 2011 2010
Tax payable 37 2 41 36Excess/insufficient tax provision last year 0 -3 0 -3Change in deferred tax 10 53 2 23Tax charge relating to divested operations -3 0 -3 0
Tax charge 44 52 40 56
HomeThe Year 2011 About BN Bank Report of The Directors Financial Statement
Income Statement | Balance Sheet | Changes in Equity | Cash Flows | Notes
60
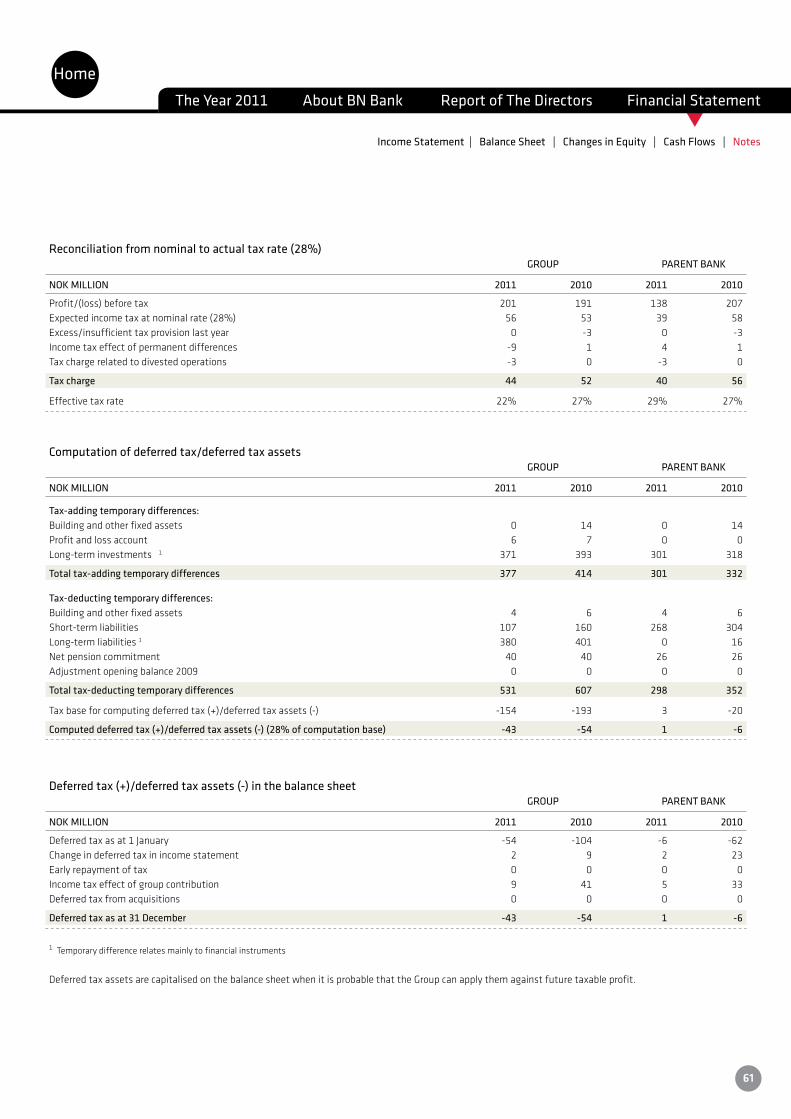
t
Reconciliation from nominal to actual tax rate (28%) GROUP PARENT BANK
NOK MILLION 2011 2010 2011 2010
Profit/(loss)beforetax 201 191 138 207Expectedincometaxatnominalrate(28%) 56 53 39 58Excess/insufficient tax provision last year 0 -3 0 -3Income tax effect of permanent differences -9 1 4 1Tax charge related to divested operations -3 0 -3 0
Tax charge 44 52 40 56
Effective tax rate 22% 27% 29% 27%
Computation of deferred tax/deferred tax assets GROUP PARENT BANK
NOK MILLION 2011 2010 2011 2010
Tax-adding temporary differences:Building and other fixed assets 0 14 0 14Profit and loss account 6 7 0 0Long-term investments 1 371 393 301 318
Total tax-adding temporary differences 377 414 301 332
Tax-deducting temporary differences:Building and other fixed assets 4 6 4 6 Short-term liabilities 107 160 268 304 Long-term liabilities 1 380 401 0 16 Net pension commitment 40 40 26 26 Adjustment opening balance 2009 0 0 0 0
Total tax-deducting temporary differences 531 607 298 352
Taxbaseforcomputingdeferredtax(+)/deferredtaxassets(-) -154 -193 3 -20
Computed deferred tax (+)/deferred tax assets (-) (28% of computation base) -43 -54 1 -6
Deferred tax (+)/deferred tax assets (-) in the balance sheet GROUP PARENT BANK
NOK MILLION 2011 2010 2011 2010
Deferredtaxasat1January -54 -104 -6 -62Change in deferred tax in income statement 2 9 2 23Early repayment of tax 0 0 0 0Income tax effect of group contribution 9 41 5 33Deferred tax from acquisitions 0 0 0 0
Deferred tax as at 31 December -43 -54 1 -6
1 Temporary difference relates mainly to financial instruments
DeferredtaxassetsarecapitalisedonthebalancesheetwhenitisprobablethattheGroupcanapplythemagainstfuturetaxableprofit.
HomeThe Year 2011 About BN Bank Report of The Directors Financial Statement
Income Statement | Balance Sheet | Changes in Equity | Cash Flows | Notes
61
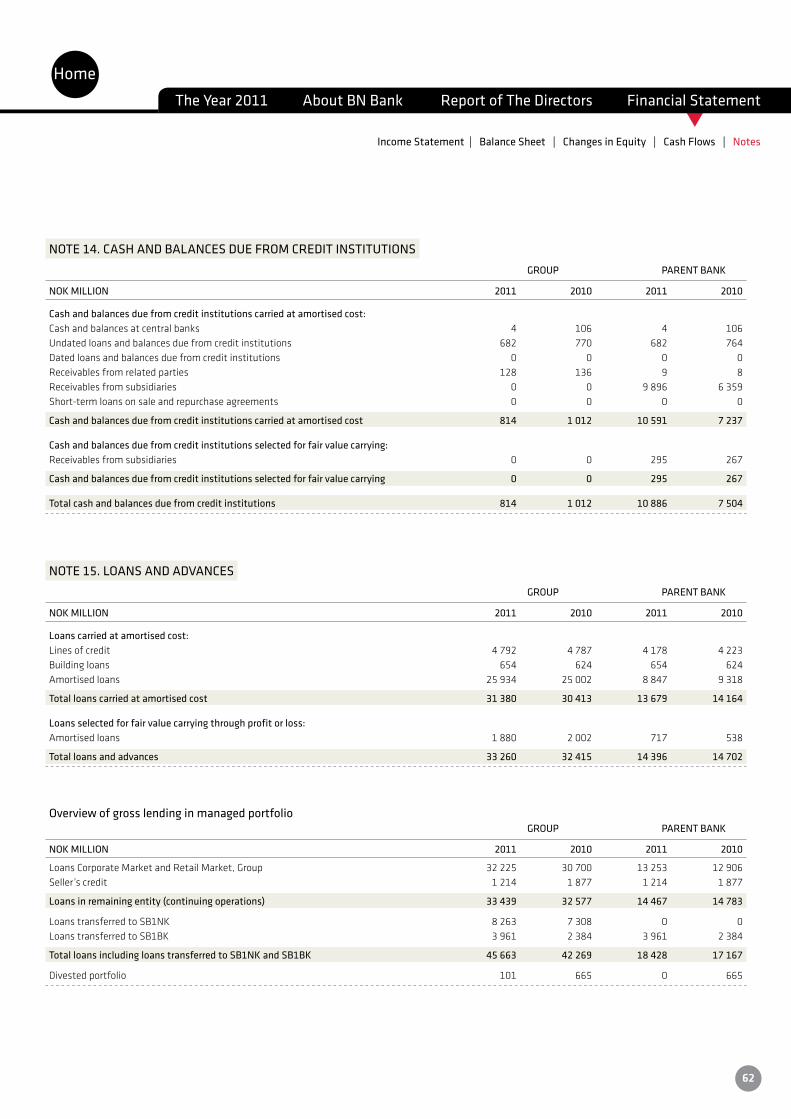
t
NOTE 14. CASH AND BALANCES DUE FROM CREDIT INSTITUTIONS GROUP PARENT BANK
NOK MILLION 2011 2010 2011 2010
Cash and balances due from credit institutions carried at amortised cost:Cash and balances at central banks 4 106 4 106Undated loans and balances due from credit institutions 682 770 682 764Dated loans and balances due from credit institutions 0 0 0 0Receivables from related parties 128 136 9 8Receivablesfromsubsidiaries 0 0 9 896 6 359Short-term loans on sale and repurchase agreements 0 0 0 0
Cash and balances due from credit institutions carried at amortised cost 814 1 012 10 591 7 237
Cash and balances due from credit institutions selected for fair value carrying:Receivables from subsidiaries 0 0 295 267
Cash and balances due from credit institutions selected for fair value carrying 0 0 295 267
Total cash and balances due from credit institutions 814 1 012 10 886 7 504
NOTE 15. LOANS AND ADVANCES GROUP PARENT BANK
NOK MILLION 2011 2010 2011 2010
Loans carried at amortised cost:Linesofcredit 4 792 4 787 4 178 4 223Building loans 654 624 654 624Amortisedloans 25 934 25 002 8 847 9 318
Total loans carried at amortised cost 31 380 30 413 13 679 14 164
Loans selected for fair value carrying through profit or loss:Amortisedloans 1 880 2 002 717 538
Total loans and advances 33 260 32 415 14 396 14 702
Overview of gross lending in managed portfolio GROUP PARENT BANK
NOK MILLION 2011 2010 2011 2010
LoansCorporateMarketandRetailMarket,Group 32 225 30 700 13 253 12 906Seller’scredit 1 214 1 877 1 214 1 877
Loans in remaining entity (continuing operations) 33 439 32 577 14 467 14 783
LoanstransferredtoSB1NK 8 263 7 308 0 0LoanstransferredtoSB1BK 3 961 2 384 3 961 2 384
Total loans including loans transferred to SB1NK and SB1BK 45 663 42 269 18 428 17 167
Divested portfolio 101 665 0 665
HomeThe Year 2011 About BN Bank Report of The Directors Financial Statement
Income Statement | Balance Sheet | Changes in Equity | Cash Flows | Notes
62
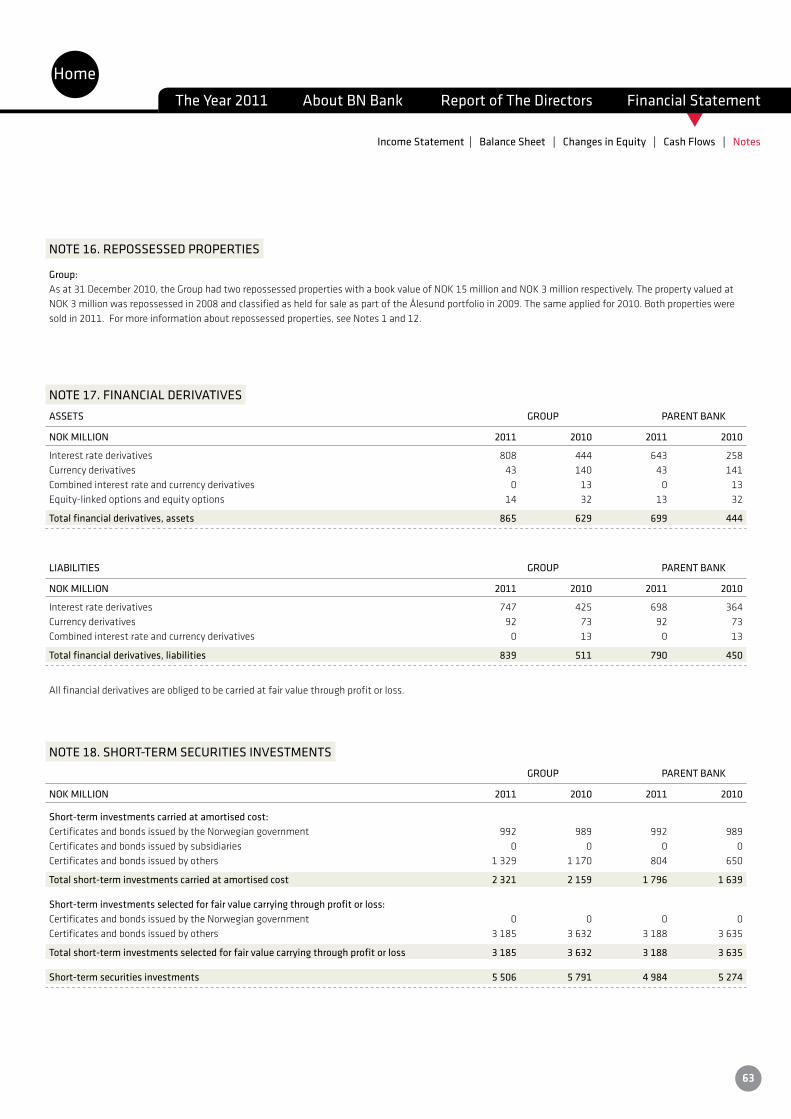
t
NOTE 16. REPOSSESSED PROPERTIES
Group:Asat31December2010,theGrouphadtworepossessedpropertieswithabookvalueofNOK15millionandNOK3millionrespectively.ThepropertyvaluedatNOK3millionwasrepossessedin2008andclassifiedasheldforsaleaspartoftheÅlesundportfolioin2009.Thesameappliedfor2010.Bothpropertiesweresold in 2011. For more information about repossessed properties, see Notes 1 and 12.
NOTE 17. FINANCIAL DERIVATIVES ASSETS GROUP PARENT BANK
NOK MILLION 2011 2010 2011 2010
Interest rate derivatives 808 444 643 258Currency derivatives 43 140 43 141Combined interest rate and currency derivatives 0 13 0 13Equity-linked options and equity options 14 32 13 32
Total financial derivatives, assets 865 629 699 444
LIABILITIES GROUP PARENT BANK
NOK MILLION 2011 2010 2011 2010
Interest rate derivatives 747 425 698 364Currency derivatives 92 73 92 73Combined interest rate and currency derivatives 0 13 0 13
Total financial derivatives, liabilities 839 511 790 450
All financial derivatives are obliged to be carried at fair value through profit or loss.
NOTE 18. SHORT-TERM SECURITIES INVESTMENTS GROUP PARENT BANK
NOK MILLION 2011 2010 2011 2010
Short-term investments carried at amortised cost:Certificates and bonds issued by the Norwegian government 992 989 992 989Certificates and bonds issued by subsidiaries 0 0 0 0Certificatesandbondsissuedbyothers 1 329 1 170 804 650
Total short-term investments carried at amortised cost 2 321 2 159 1 796 1 639
Short-term investments selected for fair value carrying through profit or loss:Certificates and bonds issued by the Norwegian government 0 0 0 0Certificatesandbondsissuedbyothers 3 185 3 632 3 188 3 635
Total short-term investments selected for fair value carrying through profit or loss 3 185 3 632 3 188 3 635
Short-term securities investments 5 506 5 791 4 984 5 274
HomeThe Year 2011 About BN Bank Report of The Directors Financial Statement
Income Statement | Balance Sheet | Changes in Equity | Cash Flows | Notes
63

t
NOTE 19. SUBORDINATED LOANS GROUP PARENT BANK
NOK MILLION 2011 2010 2011 2010
Subordinated loans carried at amortised cost:Subordinated loans made to others 0 15 0 15Subordinated loans made to subsidiaries 0 0 527 527
Total subordinated loans carried at amortised cost 0 15 527 542
NOTE 20. OWNERSHIP INTERESTS IN GROUP COMPANIESGROUP COMPANIES
SUBSIDIARY´S BOOK VALUE CAPITAL- BOOK VALUE RESULT RESULT SHARE SHARE- AS AT INCREASE WRITE- AS AT FOR YEAR FOR YEARNOK MILLION CAPITAL HOLDING1 1.1.2011 M.M DOWN 31.12.11 2011 2010
Bolig-ogNæringskredittAS,Trondheim 600 100% 1 600 0 0 1 600 92 53BN Boligkreditt AS, Trondheim 101 100% 277 0 0 277 26 19Collection Eiendom AS, Trondheim 0 100% 0 0 0 0 0 0
Shares in subsidiaries 1 877 0 0 1 877
1 The shareholding is equal to the voting share.
TheParentBankhasreceivedgroupcontributionfromitssubsidiariesin2011foratotalofNOK144million,andhasrenderedgroupcontributiontosubsidiariesforNOK45million.ThesharesinthecompanyMunkegata21ASweresoldinthethirdquarterof2011,witharesultantaccountinggainofNOK32million.
The operations in Ålesund, which deal chiefly in lending to the corporate market, were organisationally subordinate to SpareBank 1 SMN from the fourth quarter of 2009. The separation from BN Bank started in the fourth quarter of 2009 and is expected to be completed by the end of the first quarter of 2012. As of the third quarter of 2009, the operations have been measured and reported as discontinued operations under IFRS 5.
Specification of results of divested operations
GROUP/PARENT BANK
NOK MILLION 2011 2010
Net income from interest and credit commissions 4 35Total other operating income 1 5Total other operating expense -3 5Impairment losses on loans and advances -1 36Income from ownership interests in group companies 0 0
Pre-tax result of operations under divestment 9 -1
Computed tax charge 3 0
Result after tax of operations under divestment 6 -1
Statement of cash flows relating to divested operations
HomeThe Year 2011 About BN Bank Report of The Directors Financial Statement
Income Statement | Balance Sheet | Changes in Equity | Cash Flows | Notes
64
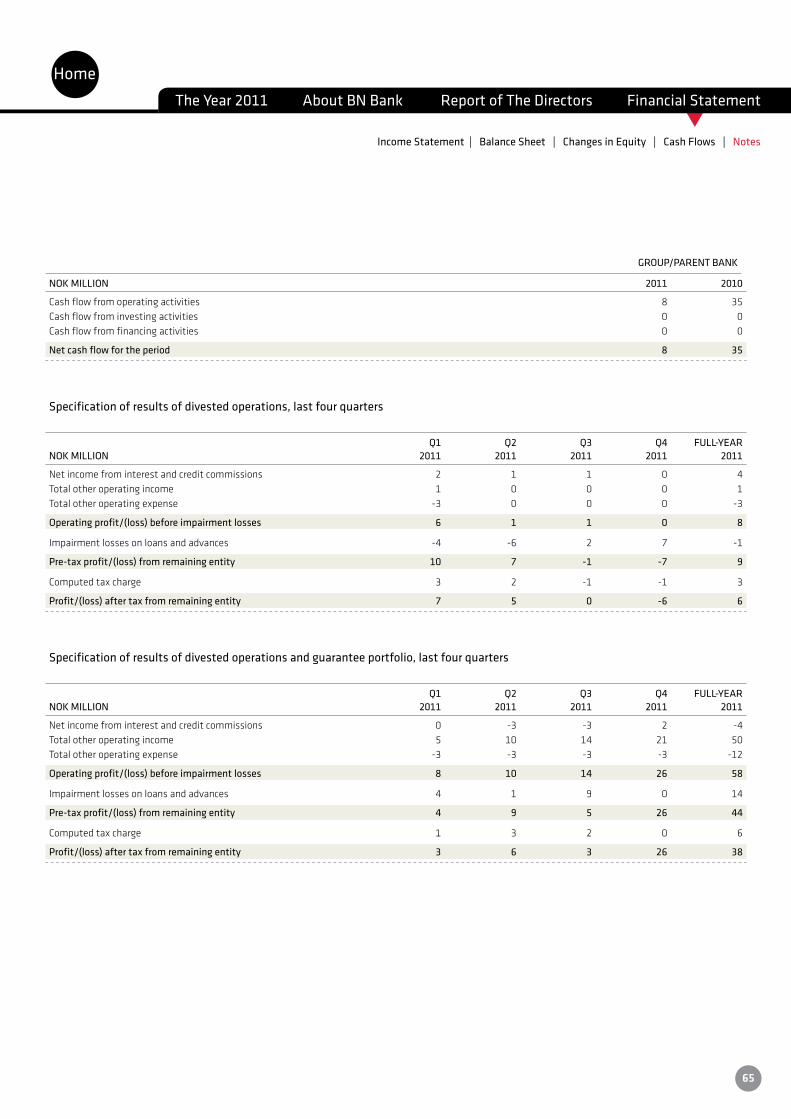
t
GROUP/PARENT BANK
NOK MILLION 2011 2010
Cash flow from operating activities 8 35Cash flow from investing activities 0 0Cash flow from financing activities 0 0
Net cash flow for the period 8 35
Specification of results of divested operations, last four quarters
Q1 Q2 Q3 Q4 FULL-YEARNOK MILLION 2011 2011 2011 2011 2011
Net income from interest and credit commissions 2 1 1 0 4Total other operating income 1 0 0 0 1Total other operating expense -3 0 0 0 -3
Operating profit/(loss) before impairment losses 6 1 1 0 8
Impairment losses on loans and advances -4 -6 2 7 -1
Pre-tax profit/(loss) from remaining entity 10 7 -1 -7 9
Computed tax charge 3 2 -1 -1 3
Profit/(loss) after tax from remaining entity 7 5 0 -6 6
Specification of results of divested operations and guarantee portfolio, last four quarters
Q1 Q2 Q3 Q4 FULL-YEARNOK MILLION 2011 2011 2011 2011 2011
Net income from interest and credit commissions 0 -3 -3 2 -4Total other operating income 5 10 14 21 50Total other operating expense -3 -3 -3 -3 -12
Operating profit/(loss) before impairment losses 8 10 14 26 58
Impairment losses on loans and advances 4 1 9 0 14
Pre-tax profit/(loss) from remaining entity 4 9 5 26 44
Computed tax charge 1 3 2 0 6
Profit/(loss) after tax from remaining entity 3 6 3 26 38
HomeThe Year 2011 About BN Bank Report of The Directors Financial Statement
Income Statement | Balance Sheet | Changes in Equity | Cash Flows | Notes
65
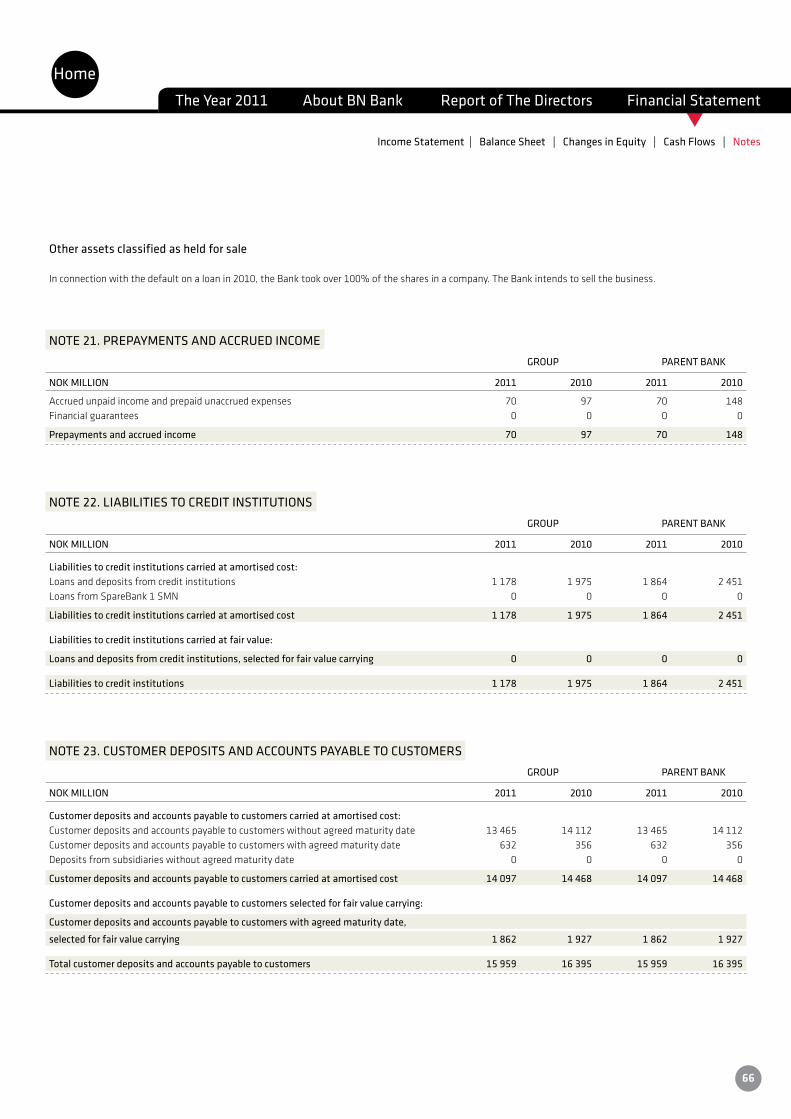
t
Other assets classified as held for sale
In connection with the default on a loan in 2010, the Bank took over 100% of the shares in a company. The Bank intends to sell the business.
NOTE 21. PREPAYMENTS AND ACCRUED INCOME GROUP PARENT BANK
NOK MILLION 2011 2010 2011 2010
Accrued unpaid income and prepaid unaccrued expenses 70 97 70 148Financial guarantees 0 0 0 0
Prepayments and accrued income 70 97 70 148
NOTE 22. LIABILITIES TO CREDIT INSTITUTIONS GROUP PARENT BANK
NOK MILLION 2011 2010 2011 2010
Liabilities to credit institutions carried at amortised cost:Loansanddepositsfromcreditinstitutions 1 178 1 975 1 864 2 451Loans from SpareBank 1 SMN 0 0 0 0
Liabilities to credit institutions carried at amortised cost 1 178 1 975 1 864 2 451
Liabilities to credit institutions carried at fair value:
Loans and deposits from credit institutions, selected for fair value carrying 0 0 0 0
Liabilities to credit institutions 1 178 1 975 1 864 2 451
NOTE 23. CUSTOMER DEPOSITS AND ACCOUNTS PAYABLE TO CUSTOMERS GROUP PARENT BANK
NOK MILLION 2011 2010 2011 2010
Customer deposits and accounts payable to customers carried at amortised cost:Customerdepositsandaccountspayabletocustomerswithoutagreedmaturitydate 13 465 14 112 13 465 14 112Customer deposits and accounts payable to customers with agreed maturity date 632 356 632 356Deposits from subsidiaries without agreed maturity date 0 0 0 0
Customer deposits and accounts payable to customers carried at amortised cost 14 097 14 468 14 097 14 468
Customer deposits and accounts payable to customers selected for fair value carrying:
Customer deposits and accounts payable to customers with agreed maturity date,
selected for fair value carrying 1 862 1 927 1 862 1 927
Total customer deposits and accounts payable to customers 15 959 16 395 15 959 16 395
HomeThe Year 2011 About BN Bank Report of The Directors Financial Statement
Income Statement | Balance Sheet | Changes in Equity | Cash Flows | Notes
66
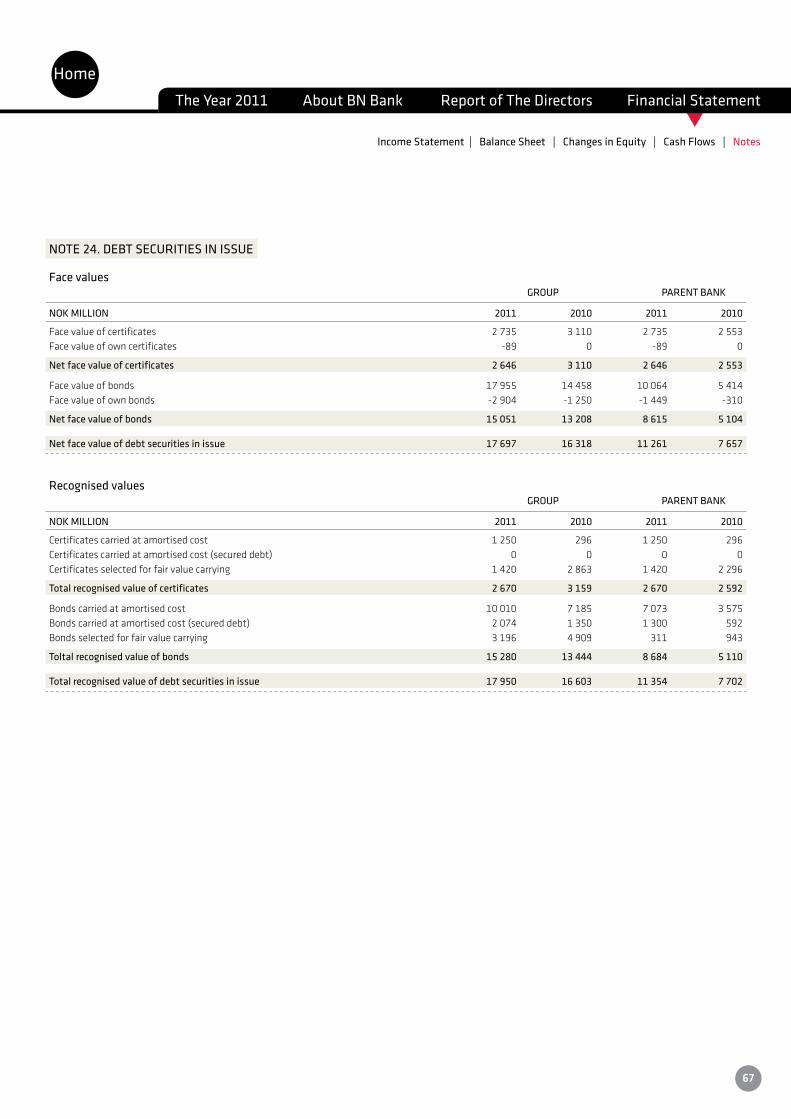
t
NOTE 24. DEBT SECURITIES IN ISSUE
Face values GROUP PARENT BANK
NOK MILLION 2011 2010 2011 2010
Facevalueofcertificates 2735 3 110 2 735 2 553Face value of own certificates -89 0 -89 0
Net face value of certificates 2 646 3 110 2 646 2 553
Facevalueofbonds 17 955 14 458 10 064 5 414Facevalueofownbonds -2 904 -1 250 -1 449 -310
Net face value of bonds 15 051 13 208 8 615 5 104
Net face value of debt securities in issue 17 697 16 318 11 261 7 657
Recognised values GROUP PARENT BANK
NOK MILLION 2011 2010 2011 2010
Certificatescarriedatamortisedcost 1 250 296 1 250 296Certificatescarriedatamortisedcost(secureddebt) 0 0 0 0Certificatesselectedforfairvaluecarrying 1 420 2 863 1 420 2 296
Total recognised value of certificates 2 670 3 159 2 670 2 592
Bondscarriedatamortisedcost 10 010 7 185 7 073 3 575Bondscarriedatamortisedcost(secureddebt) 2 074 1 350 1 300 592Bondsselectedforfairvaluecarrying 3 196 4 909 311 943
Toltal recognised value of bonds 15 280 13 444 8 684 5 110
Total recognised value of debt securities in issue 17 950 16 603 11 354 7 702
HomeThe Year 2011 About BN Bank Report of The Directors Financial Statement
Income Statement | Balance Sheet | Changes in Equity | Cash Flows | Notes
67
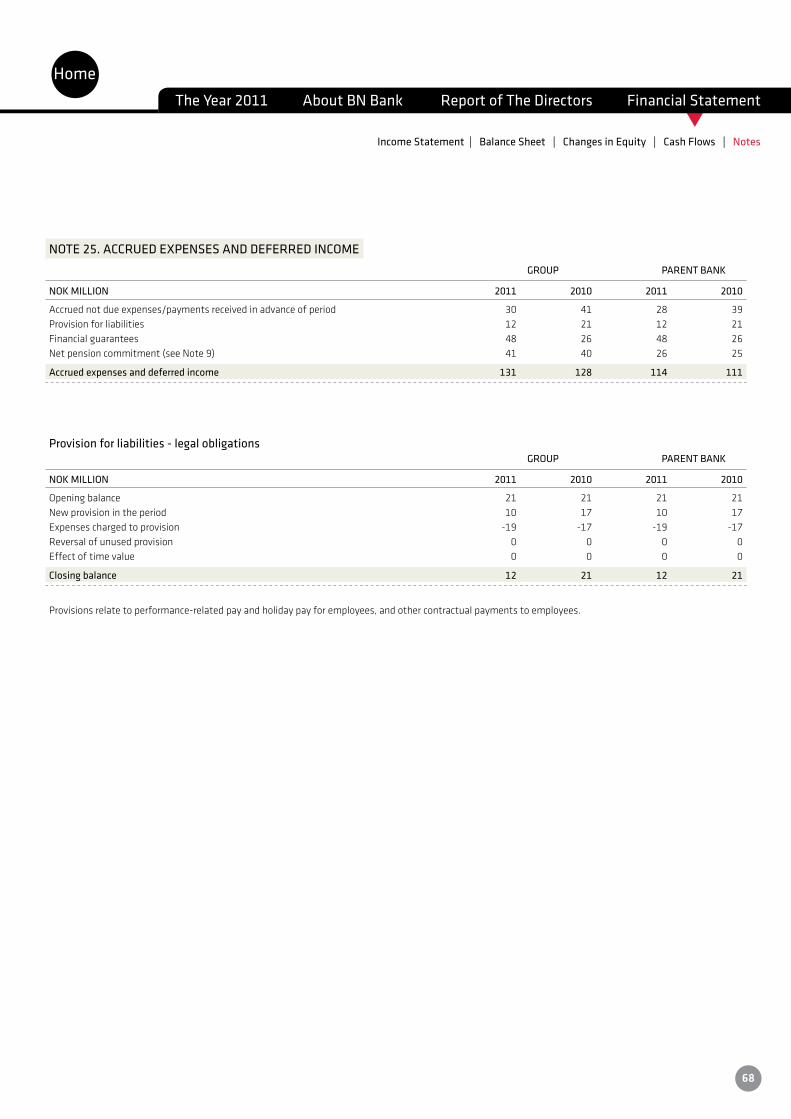
t
NOTE 25. ACCRUED EXPENSES AND DEFERRED INCOME GROUP PARENT BANK
NOK MILLION 2011 2010 2011 2010
Accrued not due expenses/payments received in advance of period 30 41 28 39Provision for liabilities 12 21 12 21Financial guarantees 48 26 48 26Netpensioncommitment(seeNote9) 41 40 26 25
Accrued expenses and deferred income 131 128 114 111
Provision for liabilities - legal obligations GROUP PARENT BANK
NOK MILLION 2011 2010 2011 2010
Opening balance 21 21 21 21New provision in the period 10 17 10 17Expenses charged to provision -19 -17 -19 -17Reversal of unused provision 0 0 0 0Effect of time value 0 0 0 0
Closing balance 12 21 12 21
Provisions relate to performance-related pay and holiday pay for employees, and other contractual payments to employees.
HomeThe Year 2011 About BN Bank Report of The Directors Financial Statement
Income Statement | Balance Sheet | Changes in Equity | Cash Flows | Notes
68

t
NOTE 26. SUBORDINATED LOAN CAPITAL
Subordinated loans carried at amortised cost: 2011 2010 GROUP AND PARENT BANK
RECOGNISED NOMINAL RECOGNISED NOMINALISIN-NUMBER VALUE 31.12.11
4 (NOKm) VALUE 31.12.10
4 (NOKm) CURRENCY MATURITY
1030287.0 2 0 0 199 199 NOK 16.03.161023144.2 3 84 85 84 85 NOK Perpetual1041777.7 1 298 300 297 300 NOK 22.02.181059357.7 3 397 400 400 400 NOK Perpetual1056663.1 1 498 500 498 500 NOK 16.04.20
Subordinated loans carried at amortised cost 1 277 1 285 1 478 1 484
Subordinated loans selected for fair value carrying through profit or loss: 2011 2010 GROUP AND PARENT BANK
RECOGNISED NOMINAL RECOGNISED NOMINALISIN-NUMBER VALUE 31.12.11
4 (NOKm) VALUE 31.12.10
4 (NOKm) CURRENCY MATURITY
1030292.0 2 0 0 30 30 NOK 16.03.161023143.4 3 161 165 185 165 NOK Perpetual
Subordinated loans selected for fair value carrying 161 165 215 195
Subordinated loan capital 1 438 1 450 1 692 1 679
1 Theinterestrateisadjustedeverythreemonths.Theinterestrateonloans1041777.7and1056663.1issetat3-monthNIBOR(NorwegianInterbankOfferedRate)plus2.40and2.75 percentage points respectively in arrears for the first 5 years, and thereafter at 3-month NIBOR plus 3.15 and 3.50 percentage points respectively in arrears for the last 5 years. The loans can be fully or partially redeemed after 5 years, subject to the consent of the Financial Supervisory Authority of Norway. The interest rate on loans 1041777.7 and 1056663.1 as at 31 December 2011 were, respectively, 5.61% and 5.83%. All three loans are included in their entirety in the capital base; see Note 28.
2 The loan was redeemed after 5 years, i.e. in 2011.
3 The Bank had three issues of perpetual subordinated loan capital securities as at 31 December 2011. The interest rate on loan 1023143.4 is fixed at 7.14% until 25 August 2014, thereafter at 3-month NIBOR plus 3.00 percentage points in arrears. The interest rate on loan 1023144.2 is fixed at 3-month NIBOR plus 2.00 percentage points for the first 10 years, and thereafter at 3-month NIBOR plus 3.00 percentage points. At 31 December 2011 the interest rate was 4.93%. The interest rate on loan 1059357.7 is fixed at 3-month NIBOR plus 3.90 percentage points for the first 10 years, and thereafter at 3-month NIBOR plus 4.90 percentage points. At 31 December 2011 the interest rate was 6.81%.The loans may be fully orpartiallyredeemedafter10years,subjecttotheconsentoftheFinancialSupervisoryAuthorityofNorway.AlltheloansareincludedintheirentiretyintheBank’stier1capital;seeNote 28.
4 Figures are stated net of accrued interest.
HomeThe Year 2011 About BN Bank Report of The Directors Financial Statement
Income Statement | Balance Sheet | Changes in Equity | Cash Flows | Notes
69
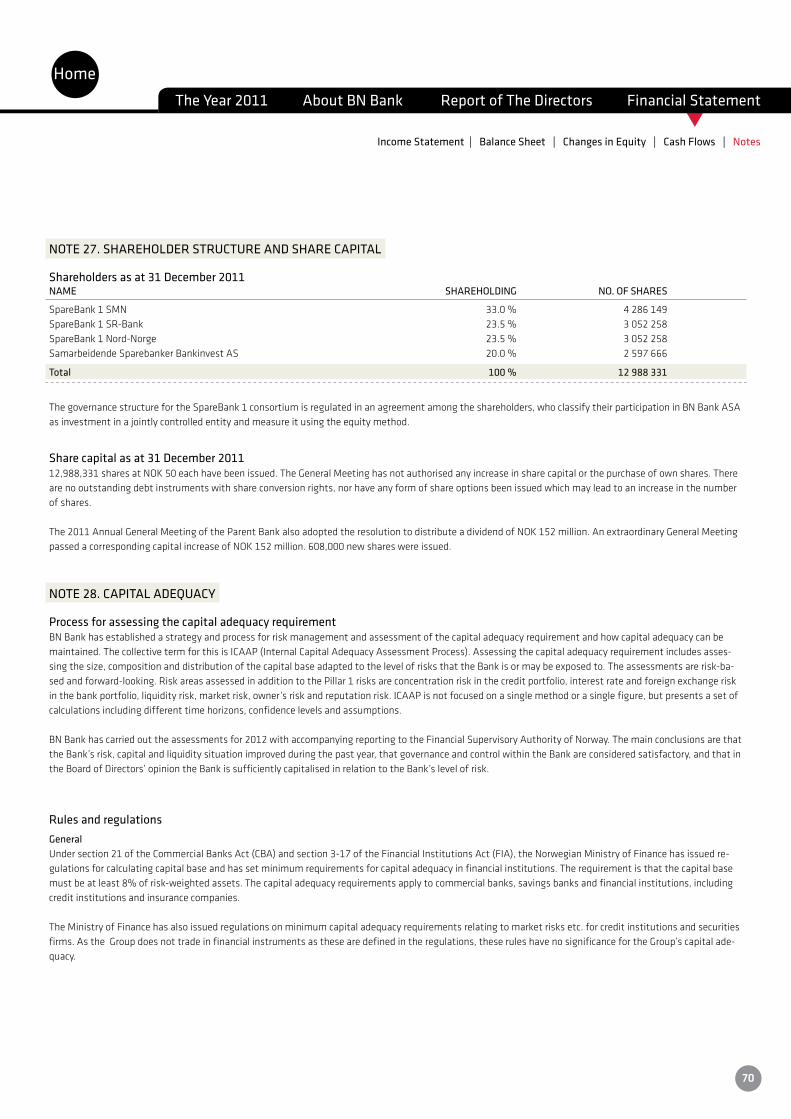
t
NOTE 27. SHAREHOLDER STRUCTURE AND SHARE CAPITAL
Shareholders as at 31 December 2011NAME SHAREHOLDING NO. OF SHARES
SpareBank1SMN 33.0% 4 286 149SpareBank1SR-Bank 23.5% 3 052 258SpareBank1Nord-Norge 23.5% 3 052 258SamarbeidendeSparebankerBankinvestAS 20.0% 2 597 666
Total 100 % 12 988 331
The governance structure for the SpareBank 1 consortium is regulated in an agreement among the shareholders, who classify their participation in BN Bank ASA as investment in a jointly controlled entity and measure it using the equity method.
Share capital as at 31 December 201112,988,331sharesatNOK50eachhavebeenissued.TheGeneralMeetinghasnotauthorisedanyincreaseinsharecapitalorthepurchaseofownshares.Thereare no outstanding debt instruments with share conversion rights, nor have any form of share options been issued which may lead to an increase in the number of shares.
The2011AnnualGeneralMeetingoftheParentBankalsoadoptedtheresolutiontodistributeadividendofNOK152million.AnextraordinaryGeneralMeetingpassedacorrespondingcapitalincreaseofNOK152million.608,000newshareswereissued.
NOTE 28. CAPITAL ADEQUACY
Process for assessing the capital adequacy requirementBN Bank has established a strategy and process for risk management and assessment of the capital adequacy requirement and how capital adequacy can be maintained.ThecollectivetermforthisisICAAP(InternalCapitalAdequacyAssessmentProcess).Assessingthecapitaladequacyrequirementincludesasses-sing the size, composition and distribution of the capital base adapted to the level of risks that the Bank is or may be exposed to. The assessments are risk-ba-sed and forward-looking. Risk areas assessed in addition to the Pillar 1 risks are concentration risk in the credit portfolio, interest rate and foreign exchange risk inthebankportfolio,liquidityrisk,marketrisk,owner’sriskandreputationrisk.ICAAPisnotfocusedonasinglemethodorasinglefigure,butpresentsasetofcalculations including different time horizons, confidence levels and assumptions. BN Bank has carried out the assessments for 2012 with accompanying reporting to the Financial Supervisory Authority of Norway. The main conclusions are that theBank’srisk,capitalandliquiditysituationimprovedduringthepastyear,thatgovernanceandcontrolwithintheBankareconsideredsatisfactory,andthatintheBoardofDirectors’opiniontheBankissufficientlycapitalisedinrelationtotheBank’slevelofrisk.
Rules and regulationsGeneralUndersection21oftheCommercialBanksAct(CBA)andsection3-17oftheFinancialInstitutionsAct(FIA),theNorwegianMinistryofFinancehasissuedre-gulations for calculating capital base and has set minimum requirements for capital adequacy in financial institutions. The requirement is that the capital base must be at least 8% of risk-weighted assets. The capital adequacy requirements apply to commercial banks, savings banks and financial institutions, including credit institutions and insurance companies.
The Ministry of Finance has also issued regulations on minimum capital adequacy requirements relating to market risks etc. for credit institutions and securities firms.AstheGroupdoesnottradeinfinancialinstrumentsasthesearedefinedintheregulations,theseruleshavenosignificancefortheGroup’scapitalade-quacy.
HomeThe Year 2011 About BN Bank Report of The Directors Financial Statement
Income Statement | Balance Sheet | Changes in Equity | Cash Flows | Notes
70
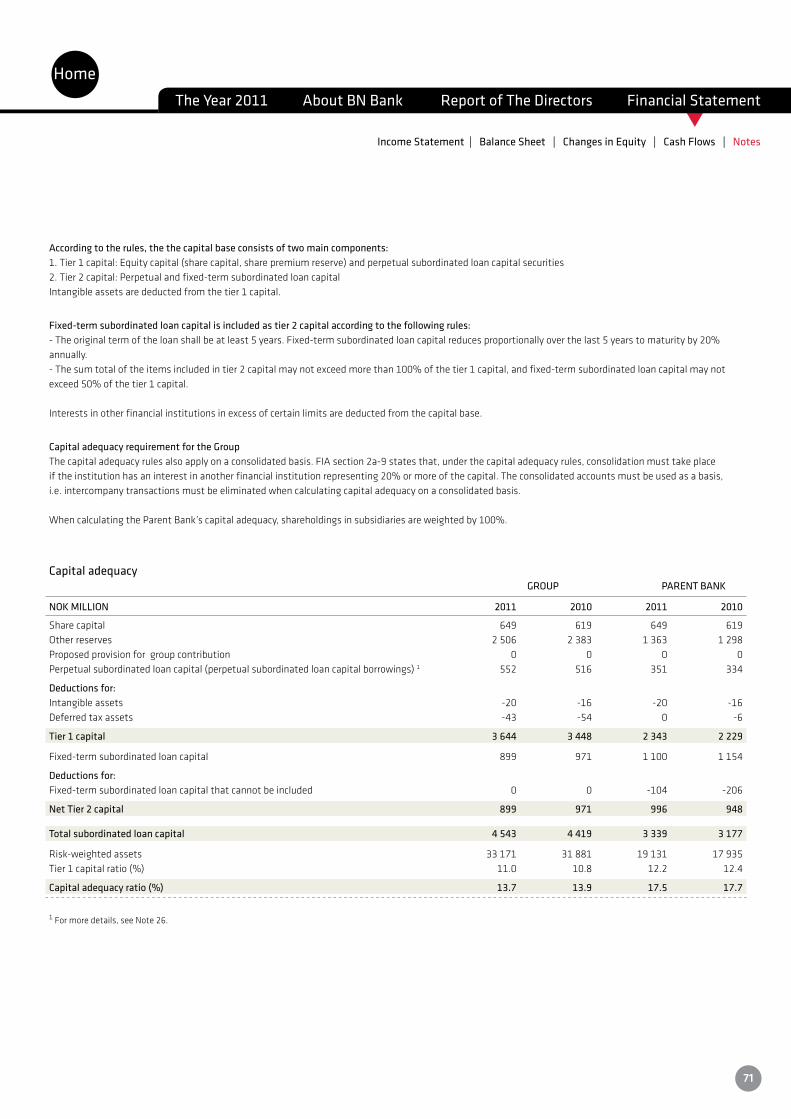
t
According to the rules, the the capital base consists of two main components: 1.Tier1capital:Equitycapital(sharecapital,sharepremiumreserve)andperpetualsubordinatedloancapitalsecurities2.Tier2capital:Perpetualandfixed-termsubordinatedloancapitalIntangible assets are deducted from the tier 1 capital.
Fixed-term subordinated loan capital is included as tier 2 capital according to the following rules: - The original term of the loan shall be at least 5 years. Fixed-term subordinated loan capital reduces proportionally over the last 5 years to maturity by 20% annually. - The sum total of the items included in tier 2 capital may not exceed more than 100% of the tier 1 capital, and fixed-term subordinated loan capital may not exceed 50% of the tier 1 capital. Interests in other financial institutions in excess of certain limits are deducted from the capital base.
Capital adequacy requirement for the Group The capital adequacy rules also apply on a consolidated basis. FIA section 2a-9 states that, under the capital adequacy rules, consolidation must take place if the institution has an interest in another financial institution representing 20% or more of the capital. The consolidated accounts must be used as a basis, i.e. intercompany transactions must be eliminated when calculating capital adequacy on a consolidated basis.
WhencalculatingtheParentBank’scapitaladequacy,shareholdingsinsubsidiariesareweightedby100%.
Capital adequacy GROUP PARENT BANK
NOK MILLION 2011 2010 2011 2010
Share capital 649 619 649 619Otherreserves 2 506 2 383 1 363 1 298Proposed provision for group contribution 0 0 0 0Perpetualsubordinatedloancapital(perpetualsubordinatedloancapitalborrowings)1 552 516 351 334
Deductions for:Intangible assets -20 -16 -20 -16Deferred tax assets -43 -54 0 -6
Tier 1 capital 3 644 3 448 2 343 2 229
Fixed-termsubordinatedloancapital 899 971 1 100 1 154
Deductions for:Fixed-term subordinated loan capital that cannot be included 0 0 -104 -206
Net Tier 2 capital 899 971 996 948
Total subordinated loan capital 4 543 4 419 3 339 3 177
Risk-weightedassets 33 171 31 881 19 131 17 935Tier1capitalratio(%) 11.0 10.8 12.2 12.4
Capital adequacy ratio (%) 13.7 13.9 17.5 17.7
1 For more details, see Note 26.
HomeThe Year 2011 About BN Bank Report of The Directors Financial Statement
Income Statement | Balance Sheet | Changes in Equity | Cash Flows | Notes
71
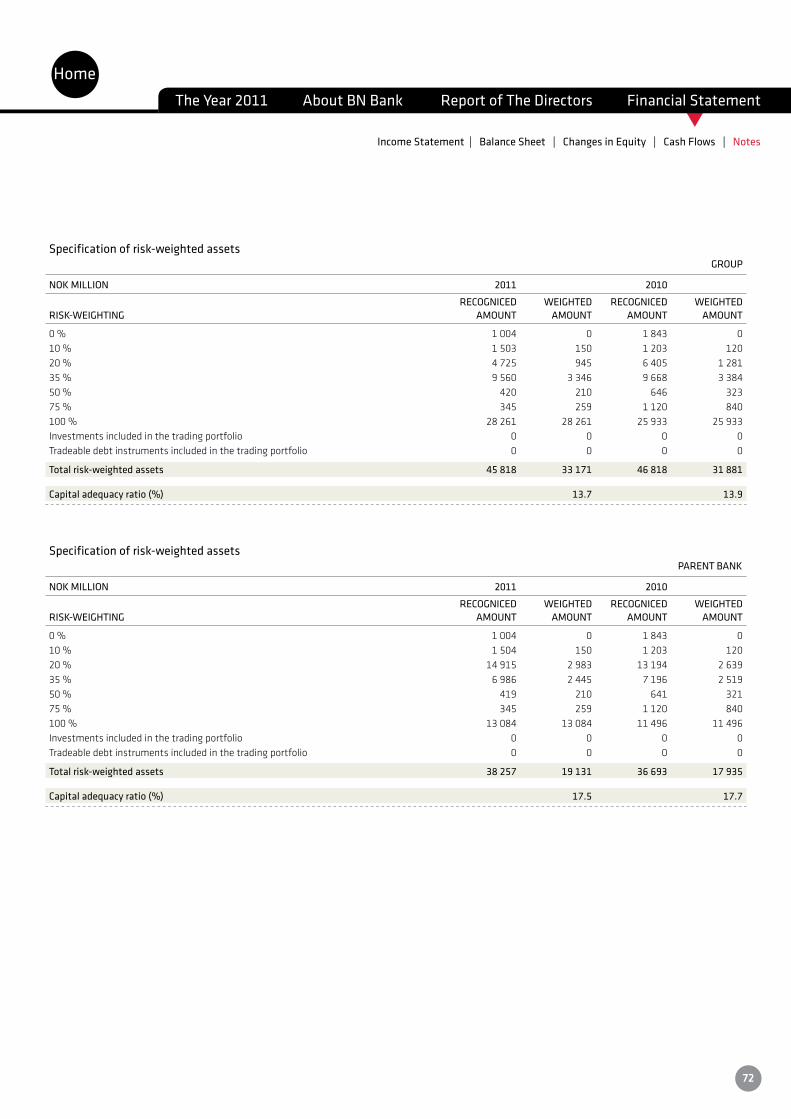
t
Specification of risk-weighted assets GROUP
NOK MILLION 2011 2010
RECOGNICED WEIGHTED RECOGNICED WEIGHTEDRISK-WEIGHTING AMOUNT AMOUNT AMOUNT AMOUNT
0% 1 004 0 1 843 010% 1 503 150 1 203 12020% 4 725 945 6 405 1 28135% 9 560 3 346 9 668 3 38450 % 420 210 646 323 75% 345 259 1 120 840100% 28 261 28 261 25 933 25 933Investments included in the trading portfolio 0 0 0 0 Tradeable debt instruments included in the trading portfolio 0 0 0 0
Total risk-weighted assets 45 818 33 171 46 818 31 881
Capital adequacy ratio (%) 13.7 13.9
Specification of risk-weighted assets PARENT BANK
NOK MILLION 2011 2010
RECOGNICED WEIGHTED RECOGNICED WEIGHTEDRISK-WEIGHTING AMOUNT AMOUNT AMOUNT AMOUNT
0% 1 004 0 1 843 010% 1 504 150 1 203 12020% 14 915 2 983 13 194 2 63935% 6 986 2 445 7 196 2 51950 % 419 210 641 321 75% 345 259 1 120 840100% 13 084 13 084 11 496 11 496Investments included in the trading portfolio 0 0 0 0 Tradeable debt instruments included in the trading portfolio 0 0 0 0
Total risk-weighted assets 38 257 19 131 36 693 17 935
Capital adequacy ratio (%) 17.5 17.7
HomeThe Year 2011 About BN Bank Report of The Directors Financial Statement
Income Statement | Balance Sheet | Changes in Equity | Cash Flows | Notes
72
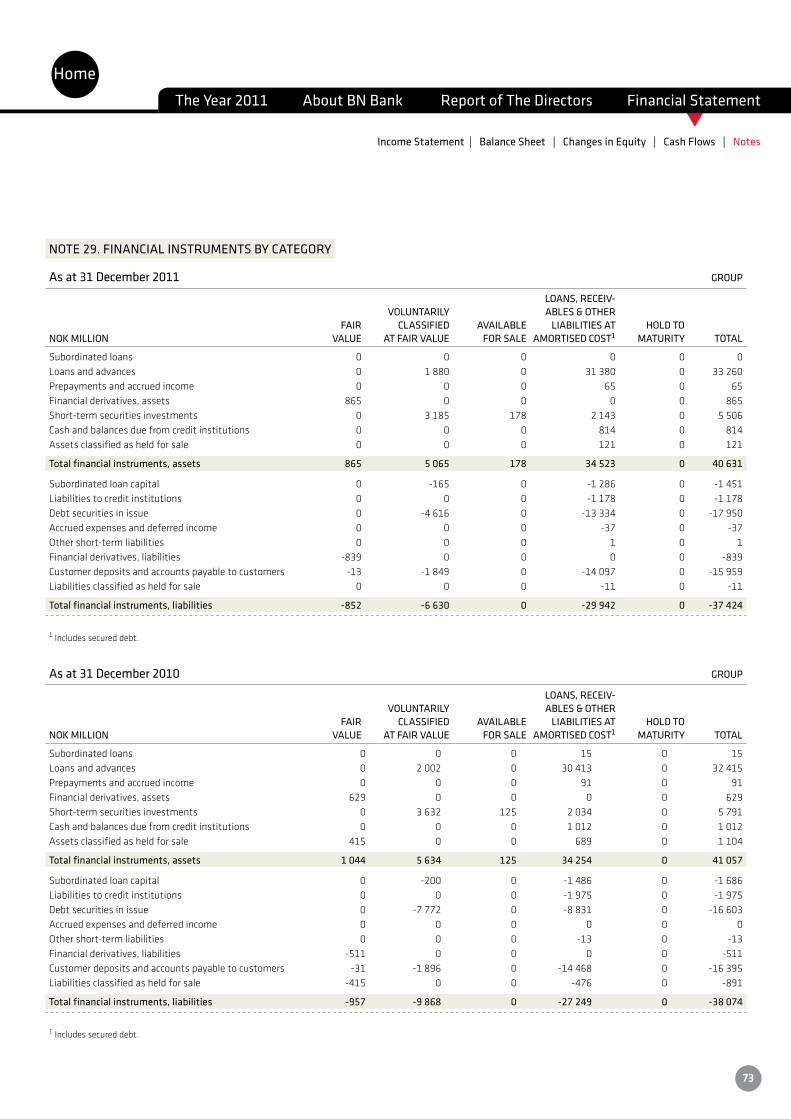
t
NOTE 29. FINANCIAL INSTRUMENTS BY CATEGORY
As at 31 December 2011 GROUP
LOANS, RECEIV- VOLUNTARILY ABLES & OTHER FAIR CLASSIFIED AVAILABLE LIABILITIES AT HOLD TONOK MILLION VALUE AT FAIR VALUE FOR SALE AMORTISED COST1 MATURITY TOTAL
Subordinated loans 0 0 0 0 0 0Loansandadvances 0 1 880 0 31 380 0 33 260Prepayments and accrued income 0 0 0 65 0 65Financial derivatives, assets 865 0 0 0 0 865Short-termsecuritiesinvestments 0 3 185 178 2 143 0 5 506Cash and balances due from credit institutions 0 0 0 814 0 814Assets classified as held for sale 0 0 0 121 0 121
Total financial instruments, assets 865 5 065 178 34 523 0 40 631
Subordinatedloancapital 0 -165 0 -1 286 0 -1 451Liabilitiestocreditinstitutions 0 0 0 -1 178 0 -1 178Debtsecuritiesinissue 0 -4 616 0 -13 334 0 -17 950Accrued expenses and deferred income 0 0 0 -37 0 -37Other short-term liabilities 0 0 0 1 0 1Financial derivatives, liabilities -839 0 0 0 0 -839Customerdepositsandaccountspayabletocustomers -13 -1 849 0 -14 097 0 -15 959Liabilities classified as held for sale 0 0 0 -11 0 -11
Total financial instruments, liabilities -852 -6 630 0 -29 942 0 -37 424
1 Includes secured debt.
As at 31 December 2010 GROUP
LOANS, RECEIV- VOLUNTARILY ABLES & OTHER FAIR CLASSIFIED AVAILABLE LIABILITIES AT HOLD TONOK MILLION VALUE AT FAIR VALUE FOR SALE AMORTISED COST1 MATURITY TOTAL
Subordinated loans 0 0 0 15 0 15Loansandadvances 0 2 002 0 30 413 0 32 415Prepayments and accrued income 0 0 0 91 0 91Financial derivatives, assets 629 0 0 0 0 629Short-termsecuritiesinvestments 0 3 632 125 2 034 0 5 791Cashandbalancesduefromcreditinstitutions 0 0 0 1 012 0 1 012Assetsclassifiedasheldforsale 415 0 0 689 0 1 104
Total financial instruments, assets 1 044 5 634 125 34 254 0 41 057
Subordinatedloancapital 0 -200 0 -1 486 0 -1 686Liabilitiestocreditinstitutions 0 0 0 -1 975 0 -1 975Debtsecuritiesinissue 0 -7 772 0 -8 831 0 -16 603Accrued expenses and deferred income 0 0 0 0 0 0Other short-term liabilities 0 0 0 -13 0 -13Financial derivatives, liabilities -511 0 0 0 0 -511Customerdepositsandaccountspayabletocustomers -31 -1 896 0 -14 468 0 -16 395Liabilities classified as held for sale -415 0 0 -476 0 -891
Total financial instruments, liabilities -957 -9 868 0 -27 249 0 -38 074
1 Includes secured debt.
HomeThe Year 2011 About BN Bank Report of The Directors Financial Statement
Income Statement | Balance Sheet | Changes in Equity | Cash Flows | Notes
73
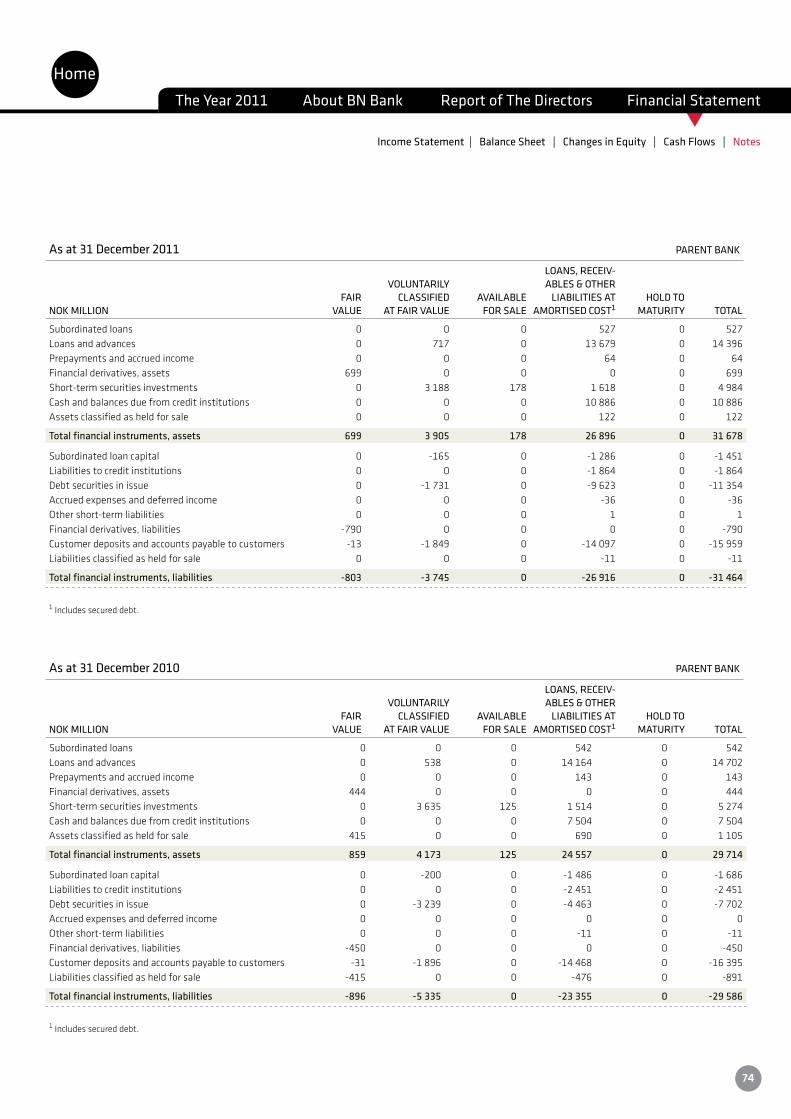
t
As at 31 December 2011 PARENT BANK
LOANS, RECEIV- VOLUNTARILY ABLES & OTHER FAIR CLASSIFIED AVAILABLE LIABILITIES AT HOLD TONOK MILLION VALUE AT FAIR VALUE FOR SALE AMORTISED COST1 MATURITY TOTAL
Subordinated loans 0 0 0 527 0 527Loansandadvances 0 717 0 13 679 0 14 396Prepayments and accrued income 0 0 0 64 0 64Financial derivatives, assets 699 0 0 0 0 699Short-termsecuritiesinvestments 0 3 188 178 1 618 0 4 984Cashandbalancesduefromcreditinstitutions 0 0 0 10 886 0 10 886Assets classified as held for sale 0 0 0 122 0 122
Total financial instruments, assets 699 3 905 178 26 896 0 31 678
Subordinatedloancapital 0 -165 0 -1 286 0 -1 451Liabilitiestocreditinstitutions 0 0 0 -1 864 0 -1 864Debtsecuritiesinissue 0 -1 731 0 -9 623 0 -11 354Accrued expenses and deferred income 0 0 0 -36 0 -36Other short-term liabilities 0 0 0 1 0 1Financial derivatives, liabilities -790 0 0 0 0 -790Customerdepositsandaccountspayabletocustomers -13 -1 849 0 -14 097 0 -15 959Liabilities classified as held for sale 0 0 0 -11 0 -11
Total financial instruments, liabilities -803 -3 745 0 -26 916 0 -31 464
1 Includes secured debt.
As at 31 December 2010 PARENT BANK
LOANS, RECEIV- VOLUNTARILY ABLES & OTHER FAIR CLASSIFIED AVAILABLE LIABILITIES AT HOLD TONOK MILLION VALUE AT FAIR VALUE FOR SALE AMORTISED COST1 MATURITY TOTAL
Subordinated loans 0 0 0 542 0 542Loansandadvances 0 538 0 14 164 0 14 702Prepayments and accrued income 0 0 0 143 0 143Financial derivatives, assets 444 0 0 0 0 444Short-termsecuritiesinvestments 0 3 635 125 1 514 0 5 274Cashandbalancesduefromcreditinstitutions 0 0 0 7 504 0 7 504Assetsclassifiedasheldforsale 415 0 0 690 0 1 105
Total financial instruments, assets 859 4 173 125 24 557 0 29 714
Subordinatedloancapital 0 -200 0 -1 486 0 -1 686Liabilitiestocreditinstitutions 0 0 0 -2 451 0 -2 451Debtsecuritiesinissue 0 -3 239 0 -4 463 0 -7 702Accrued expenses and deferred income 0 0 0 0 0 0Other short-term liabilities 0 0 0 -11 0 -11Financial derivatives, liabilities -450 0 0 0 0 -450Customerdepositsandaccountspayabletocustomers -31 -1 896 0 -14 468 0 -16 395Liabilities classified as held for sale -415 0 0 -476 0 -891
Total financial instruments, liabilities -896 -5 335 0 -23 355 0 -29 586
1 Includes secured debt.
HomeThe Year 2011 About BN Bank Report of The Directors Financial Statement
Income Statement | Balance Sheet | Changes in Equity | Cash Flows | Notes
74
t
NOTE 30. FAIR VALUE OF FINANCIAL INSTRUMENTS
METHODS OF DETERMINING FAIR VALUE
Interest swap agreements, currency swap agreeements and forward exchange contractsThe measurement of interest swap agreements at fair value is performed using a valuation technique where future cash flows are discounted to present values. The calculationofexpectedcashflowsandthediscountingofthesecashflowsisperformedusingobservedmarketinterestratesforthevariouscurrencies(interest-rateswapcurve)andobservedexchangerates(fromwhichforwardexchangeratesarederived).
Interest swap agreements with credit spreadThe measurement of interest swap agreements with credit spread at fair value is performed using a valuation technique where future cash flows are discounted to present values. The calculation of expected cash flows and the discounting of these cash flows is performed using observed market interest rates for the various currencies(interest-rateswapcurve)withpremiumfortheoriginalcreditspreadontheinterestswapagreement.
Certificates and bondsCertificates are measured at quoted prices where such are available and the securities are liquid. In the case of other securities, measurement is performed using a valuation technique and discounting of expected future cash flows. The risk-free interest rate is read from the market through the interest rate on loans betweenespeciallycreditworthybanks(interest-rateswapcurve).Thepremiumforcreditriskisdeterminedonthebasisofmarketplayers’assessmentsofthecreditworthiness of the issuer.
Loans and advancesFor loans measured at fair value, the valuation is performed using a valuation technique where expected future cash flows are discounted to present values. The risk-freeinterestrateisreadfromthemarketthroughtheinterestrateonloansbetweenespeciallycreditworthybanks(interest-rateswapcurve).Thepremiumfor credit risk and margins is determined on the basis of the original premium for credit risk and margin, but with subsequent adjustment of these premiums in correlationwithchangesinthemarketpricingofrisk,theborrowers’creditratingsandmarginchangesinthemarket.
Borrowings selected for fair value carryingWhere borrowing/funding is measured at fair value, quoted borrowings will be measured at quoted prices where such are available and the securities are liquid. In the case of other securities, measurement is performed using a valuation technique and discounting of expected future cash flows. The risk-free interest rate is readfromthemarketthroughtheinterestrateonloansbetweenespeciallycreditworthybanks(interest-rateswapcurve).Thepremiumforcreditriskisdeterminedonthebasisofmarketplayers’ongoingassessmentsoftheBank’screditworthiness.
Hedged borrowing/fundingBorrowings included in fair value hedges are measured using a valuation technique and discounting of expected future cash flows. The risk-free interest rate is readfromthemarketthroughtheinterestrateonloansbetweenespeciallycreditworthybanks(interest-rateswapcurve).Wehavediscountedbytheinterest-rate swap curve with premium for the original credit spread on the borrowing to eliminate the effects of the credit risk. It is the interest rate risk that is hedged.
DepositsFor deposits measured at fair value, the valuation is performed using a valuation technique where expected future cash flows are discounted to present values. The risk-freeinterestrateisreadfromthemarketthroughtheinterestrateonloansbetweenespeciallycreditworthybanks(interest-rateswapcurve).Thepremiumforcreditriskisdeterminedonthebasisofothermarketplayers’ongoingassessmentsoftheBank’screditworthiness.Thepremiumformarginsisdeterminedonthe basis of the original margin, but with subsequent adjustment of margin in correlation with margin changes in the market.
OptionsThe measurement of equity options and equity-linked options at fair value is performed by obtaining market prices from the facilitators of the structured financial products.
Division into measurement levels
Financialinstrumentsmeasuredatfairvalueattheendofthereportingperiodaredividedintothefollowinglevelsoffairvaluemeasurement:
-Level1:Quotedpriceinanactivemarketforanidenticalassetorliability.
-Level2:Measurementisperformedusingavaluationtechniqueanddiscountingofexpectedfuturecashflows.Therisk-freeinterestrateisreadfromthemarketthroughtheinterestrateofloansbetweenespeciallycreditworthybanks(interest-rateswapcurve).Thepremiumforcreditriskisdeterminedonthebasisofothermarketplayers’ongoingassessmentsoftheBank’screditworthiness.
-Level3:Measurementbasedonfactorsnottakenfromobservablemarketsnorwhichhaveobservableassumptionsasinputtothevaluation.
HomeThe Year 2011 About BN Bank Report of The Directors Financial Statement
Income Statement | Balance Sheet | Changes in Equity | Cash Flows | Notes
75
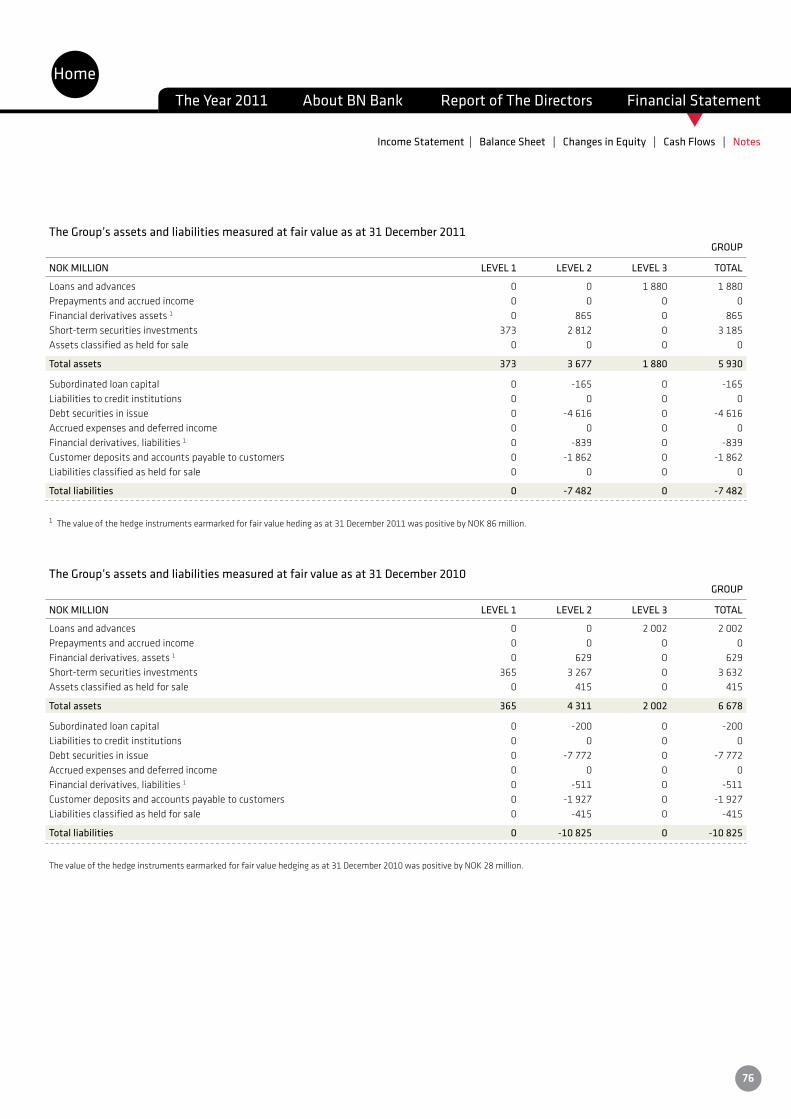
t
The Group’s assets and liabilities measured at fair value as at 31 December 2011 GROUP
NOK MILLION LEVEL 1 LEVEL 2 LEVEL 3 TOTAL
Loansandadvances 0 0 1 880 1 880Prepayments and accrued income 0 0 0 0Financial derivatives assets 1 0 865 0 865Short-termsecuritiesinvestments 373 2 812 0 3 185Assets classified as held for sale 0 0 0 0
Total assets 373 3 677 1 880 5 930
Subordinated loan capital 0 -165 0 -165Liabilities to credit institutions 0 0 0 0Debtsecuritiesinissue 0 -4 616 0 -4 616Accrued expenses and deferred income 0 0 0 0Financial derivatives, liabilities 1 0 -839 0 -839Customerdepositsandaccountspayabletocustomers 0 -1 862 0 -1 862Liabilities classified as held for sale 0 0 0 0
Total liabilities 0 -7 482 0 -7 482
1Thevalueofthehedgeinstrumentsearmarkedforfairvaluehedingasat31December2011waspositivebyNOK86million.
The Group’s assets and liabilities measured at fair value as at 31 December 2010 GROUP
NOK MILLION LEVEL 1 LEVEL 2 LEVEL 3 TOTAL
Loansandadvances 0 0 2 002 2 002Prepayments and accrued income 0 0 0 0Financial derivatives, assets 1 0 629 0 629Short-termsecuritiesinvestments 365 3 267 0 3 632Assets classified as held for sale 0 415 0 415
Total assets 365 4 311 2 002 6 678
Subordinated loan capital 0 -200 0 -200Liabilities to credit institutions 0 0 0 0Debtsecuritiesinissue 0 -7 772 0 -7 772Accrued expenses and deferred income 0 0 0 0Financial derivatives, liabilities 1 0 -511 0 -511Customerdepositsandaccountspayabletocustomers 0 -1 927 0 -1 927Liabilities classified as held for sale 0 -415 0 -415
Total liabilities 0 -10 825 0 -10 825
Thevalueofthehedgeinstrumentsearmarkedforfairvaluehedgingasat31December2010waspositivebyNOK28million.
HomeThe Year 2011 About BN Bank Report of The Directors Financial Statement
Income Statement | Balance Sheet | Changes in Equity | Cash Flows | Notes
76
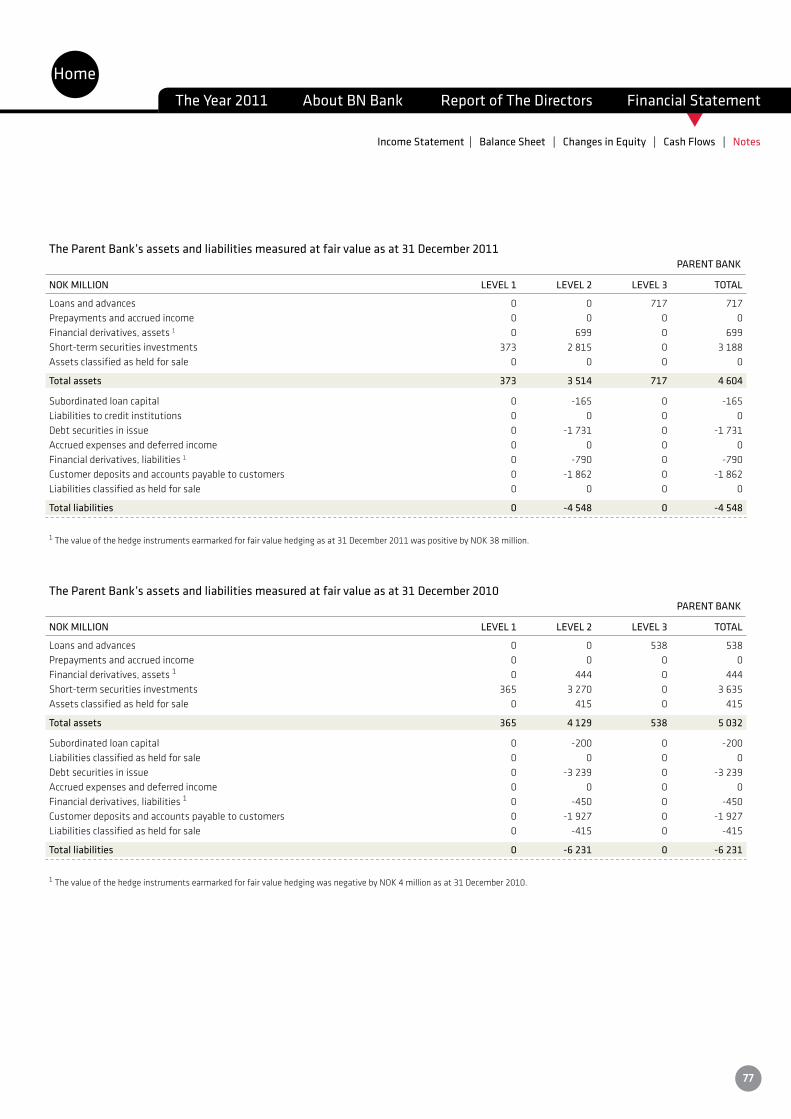
t
The Parent Bank’s assets and liabilities measured at fair value as at 31 December 2011 PARENT BANK
NOK MILLION LEVEL 1 LEVEL 2 LEVEL 3 TOTAL
Loans and advances 0 0 717 717Prepayments and accrued income 0 0 0 0Financial derivatives, assets 1 0 699 0 699Short-termsecuritiesinvestments 373 2 815 0 3 188Assets classified as held for sale 0 0 0 0
Total assets 373 3 514 717 4 604
Subordinated loan capital 0 -165 0 -165Liabilities to credit institutions 0 0 0 0Debtsecuritiesinissue 0 -1 731 0 -1 731Accrued expenses and deferred income 0 0 0 0Financial derivatives, liabilities 1 0 -790 0 -790Customerdepositsandaccountspayabletocustomers 0 -1 862 0 -1 862Liabilities classified as held for sale 0 0 0 0
Total liabilities 0 -4 548 0 -4 548
1Thevalueofthehedgeinstrumentsearmarkedforfairvaluehedgingasat31December2011waspositivebyNOK38million.
The Parent Bank’s assets and liabilities measured at fair value as at 31 December 2010 PARENT BANK
NOK MILLION LEVEL 1 LEVEL 2 LEVEL 3 TOTAL
Loans and advances 0 0 538 538Prepayments and accrued income 0 0 0 0Financial derivatives, assets 1 0 444 0 444Short-termsecuritiesinvestments 365 3 270 0 3 635Assets classified as held for sale 0 415 0 415
Total assets 365 4 129 538 5 032
Subordinated loan capital 0 -200 0 -200Liabilities classified as held for sale 0 0 0 0Debtsecuritiesinissue 0 -3 239 0 -3 239Accrued expenses and deferred income 0 0 0 0Financial derivatives, liabilities 1 0 -450 0 -450Customerdepositsandaccountspayabletocustomers 0 -1 927 0 -1 927Liabilities classified as held for sale 0 -415 0 -415
Total liabilities 0 -6 231 0 -6 231
1ThevalueofthehedgeinstrumentsearmarkedforfairvaluehedgingwasnegativebyNOK4millionasat31December2010.
HomeThe Year 2011 About BN Bank Report of The Directors Financial Statement
Income Statement | Balance Sheet | Changes in Equity | Cash Flows | Notes
77
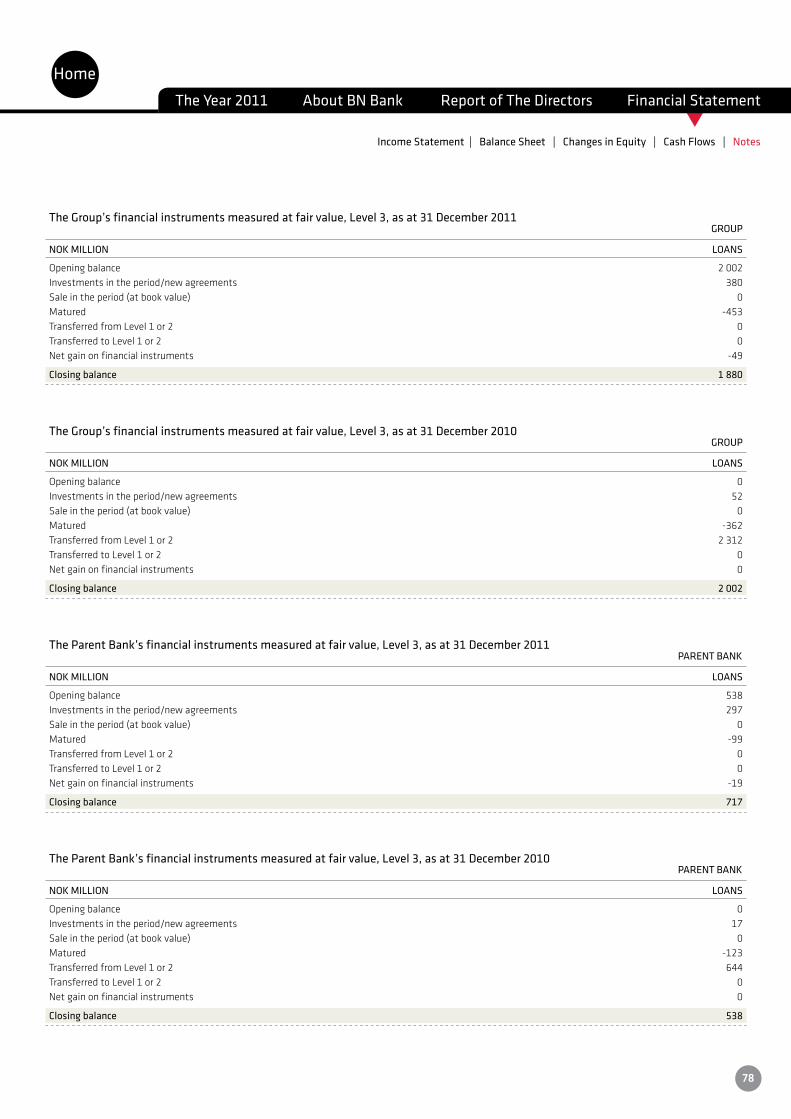
t
The Group’s financial instruments measured at fair value, Level 3, as at 31 December 2011 GROUP
NOK MILLION LOANS
Openingbalance 2 002Investments in the period/new agreements 380Saleintheperiod(atbookvalue) 0Matured -453Transferred from Level 1 or 2 0Transferred to Level 1 or 2 0Net gain on financial instruments -49
Closing balance 1 880
The Group’s financial instruments measured at fair value, Level 3, as at 31 December 2010 GROUP
NOK MILLION LOANS
Opening balance 0Investments in the period/new agreements 52Saleintheperiod(atbookvalue) 0Matured -362TransferredfromLevel1or2 2 312Transferred to Level 1 or 2 0Net gain on financial instruments 0
Closing balance 2 002
The Parent Bank’s financial instruments measured at fair value, Level 3, as at 31 December 2011 PARENT BANK
NOK MILLION LOANS
Opening balance 538Investments in the period/new agreements 297Saleintheperiod(atbookvalue) 0Matured -99Transferred from Level 1 or 2 0Transferred to Level 1 or 2 0Net gain on financial instruments -19
Closing balance 717
The Parent Bank’s financial instruments measured at fair value, Level 3, as at 31 December 2010 PARENT BANK
NOK MILLION LOANS
Opening balance 0Investments in the period/new agreements 17Saleintheperiod(atbookvalue) 0Matured -123Transferred from Level 1 or 2 644Transferred to Level 1 or 2 0Net gain on financial instruments 0
Closing balance 538
HomeThe Year 2011 About BN Bank Report of The Directors Financial Statement
Income Statement | Balance Sheet | Changes in Equity | Cash Flows | Notes
78
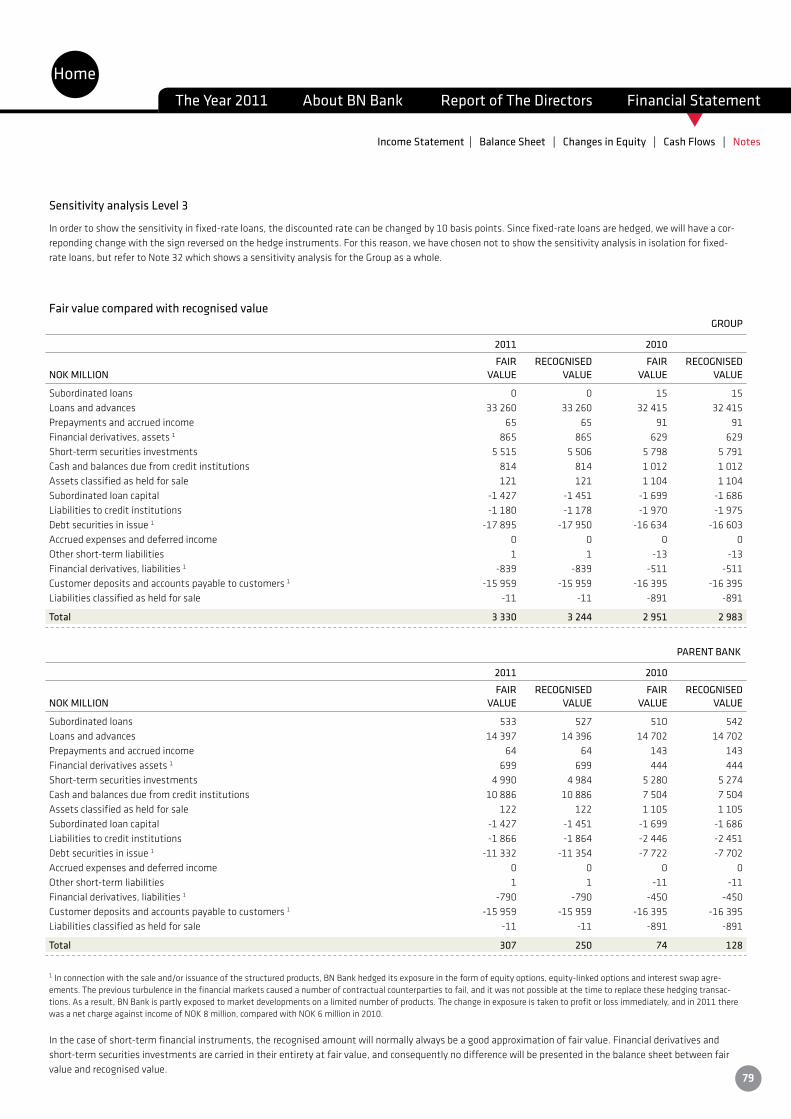
t
Sensitivity analysis Level 3
In order to show the sensitivity in fixed-rate loans, the discounted rate can be changed by 10 basis points. Since fixed-rate loans are hedged, we will have a cor-reponding change with the sign reversed on the hedge instruments. For this reason, we have chosen not to show the sensitivity analysis in isolation for fixed-rateloans,butrefertoNote32whichshowsasensitivityanalysisfortheGroupasawhole.
Fair value compared with recognised value GROUP
2011 2010
FAIR RECOGNISED FAIR RECOGNISEDNOK MILLION VALUE VALUE VALUE VALUE
Subordinated loans 0 0 15 15Loansandadvances 33 260 33 260 32 415 32 415Prepayments and accrued income 65 65 91 91Financial derivatives, assets 1 865 865 629 629Short-termsecuritiesinvestments 5 515 5 506 5 798 5 791Cashandbalancesduefromcreditinstitutions 814 814 1 012 1 012Assetsclassifiedasheldforsale 121 121 1 104 1 104Subordinatedloancapital -1 427 -1 451 -1 699 -1 686Liabilitiestocreditinstitutions -1 180 -1 178 -1 970 -1 975Debt securities in issue 1 -17 895 -17 950 -16 634 -16 603Accrued expenses and deferred income 0 0 0 0Other short-term liabilities 1 1 -13 -13Financial derivatives, liabilities 1 -839 -839 -511 -511Customer deposits and accounts payable to customers 1 -15 959 -15 959 -16 395 -16 395Liabilities classified as held for sale -11 -11 -891 -891
Total 3 330 3 244 2 951 2 983
PARENT BANK
2011 2010
FAIR RECOGNISED FAIR RECOGNISEDNOK MILLION VALUE VALUE VALUE VALUE
Subordinated loans 533 527 510 542Loansandadvances 14 397 14 396 14 702 14 702Prepayments and accrued income 64 64 143 143Financial derivatives assets 1 699 699 444 444Short-termsecuritiesinvestments 4 990 4 984 5 280 5 274Cashandbalancesduefromcreditinstitutions 10 886 10 886 7 504 7 504Assetsclassifiedasheldforsale 122 122 1 105 1 105Subordinatedloancapital -1 427 -1 451 -1 699 -1 686Liabilitiestocreditinstitutions -1 866 -1 864 -2 446 -2 451Debt securities in issue 1 -11 332 -11 354 -7 722 -7 702Accrued expenses and deferred income 0 0 0 0Other short-term liabilities 1 1 -11 -11Financial derivatives, liabilities 1 -790 -790 -450 -450Customer deposits and accounts payable to customers 1 -15 959 -15 959 -16 395 -16 395Liabilities classified as held for sale -11 -11 -891 -891
Total 307 250 74 128
1 In connection with the sale and/or issuance of the structured products, BN Bank hedged its exposure in the form of equity options, equity-linked options and interest swap agre-ements. The previous turbulence in the financial markets caused a number of contractual counterparties to fail, and it was not possible at the time to replace these hedging transac-tions. As a result, BN Bank is partly exposed to market developments on a limited number of products. The change in exposure is taken to profit or loss immediately, and in 2011 there wasanetchargeagainstincomeofNOK8million,comparedwithNOK6millionin2010.
In the case of short-term financial instruments, the recognised amount will normally always be a good approximation of fair value. Financial derivatives and short-term securities investments are carried in their entirety at fair value, and consequently no difference will be presented in the balance sheet between fair value and recognised value.
HomeThe Year 2011 About BN Bank Report of The Directors Financial Statement
Income Statement | Balance Sheet | Changes in Equity | Cash Flows | Notes
79
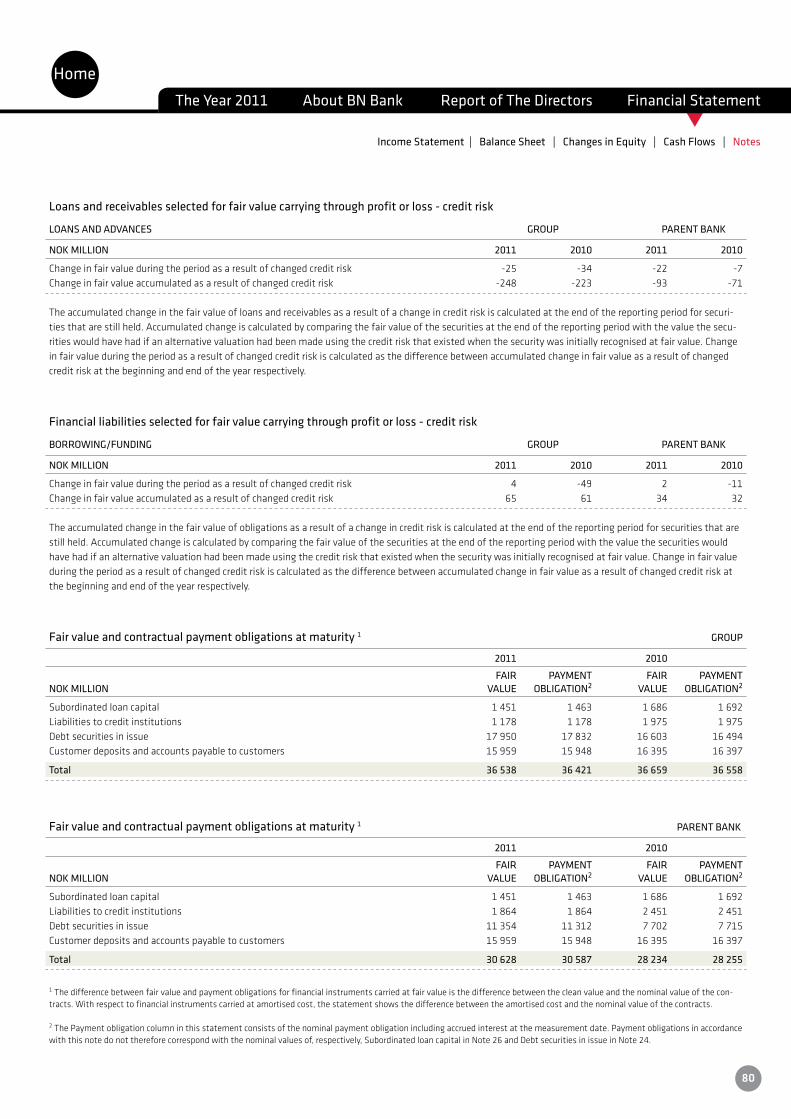
t
Loans and receivables selected for fair value carrying through profit or loss - credit risk
LOANS AND ADVANCES GROUP PARENT BANK
NOK MILLION 2011 2010 2011 2010
Change in fair value during the period as a result of changed credit risk -25 -34 -22 -7Change in fair value accumulated as a result of changed credit risk -248 -223 -93 -71
The accumulated change in the fair value of loans and receivables as a result of a change in credit risk is calculated at the end of the reporting period for securi-ties that are still held. Accumulated change is calculated by comparing the fair value of the securities at the end of the reporting period with the value the secu-rities would have had if an alternative valuation had been made using the credit risk that existed when the security was initially recognised at fair value. Change in fair value during the period as a result of changed credit risk is calculated as the difference between accumulated change in fair value as a result of changed credit risk at the beginning and end of the year respectively.
Financial liabilities selected for fair value carrying through profit or loss - credit risk
BORROWING/FUNDING GROUP PARENT BANK
NOK MILLION 2011 2010 2011 2010
Change in fair value during the period as a result of changed credit risk 4 -49 2 -11Change in fair value accumulated as a result of changed credit risk 65 61 34 32
The accumulated change in the fair value of obligations as a result of a change in credit risk is calculated at the end of the reporting period for securities that are still held. Accumulated change is calculated by comparing the fair value of the securities at the end of the reporting period with the value the securities would have had if an alternative valuation had been made using the credit risk that existed when the security was initially recognised at fair value. Change in fair value during the period as a result of changed credit risk is calculated as the difference between accumulated change in fair value as a result of changed credit risk at the beginning and end of the year respectively.
Fair value and contractual payment obligations at maturity 1 GROUP
2011 2010
FAIR PAYMENT FAIR PAYMENTNOK MILLION VALUE OBLIGATION2 VALUE OBLIGATION2
Subordinatedloancapital 1 451 1 463 1 686 1 692Liabilitiestocreditinstitutions 1 178 1 178 1 975 1 975Debtsecuritiesinissue 17 950 17 832 16 603 16 494Customerdepositsandaccountspayabletocustomers 15 959 15 948 16 395 16 397
Total 36 538 36 421 36 659 36 558
Fair value and contractual payment obligations at maturity 1 PARENT BANK
2011 2010
FAIR PAYMENT FAIR PAYMENTNOK MILLION VALUE OBLIGATION2 VALUE OBLIGATION2
Subordinatedloancapital 1 451 1 463 1 686 1 692Liabilitiestocreditinstitutions 1 864 1 864 2 451 2 451Debtsecuritiesinissue 11 354 11 312 7 702 7 715Customerdepositsandaccountspayabletocustomers 15 959 15 948 16 395 16 397
Total 30 628 30 587 28 234 28 255
1 The difference between fair value and payment obligations for financial instruments carried at fair value is the difference between the clean value and the nominal value of the con-tracts. With respect to financial instruments carried at amortised cost, the statement shows the difference between the amortised cost and the nominal value of the contracts. 2 The Payment obligation column in this statement consists of the nominal payment obligation including accrued interest at the measurement date. Payment obligations in accordance with this note do not therefore correspond with the nominal values of, respectively, Subordinated loan capital in Note 26 and Debt securities in issue in Note 24.
HomeThe Year 2011 About BN Bank Report of The Directors Financial Statement
Income Statement | Balance Sheet | Changes in Equity | Cash Flows | Notes
80
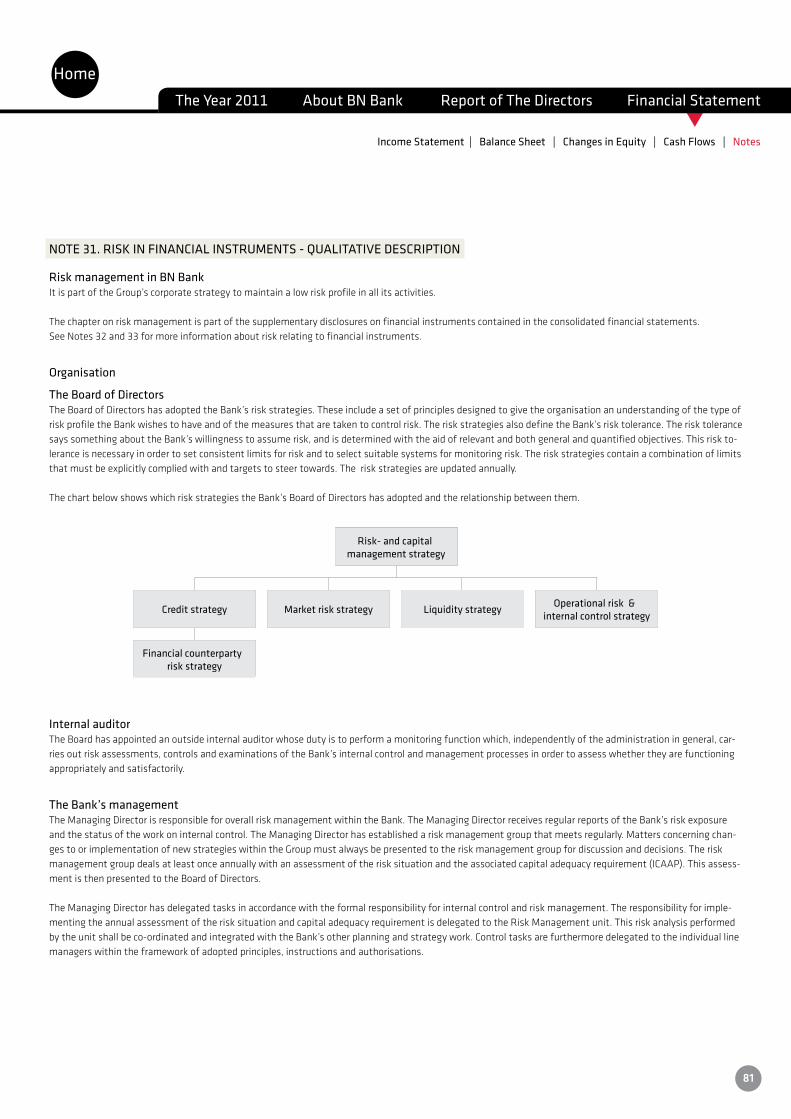
t
NOTE 31. RISK IN FINANCIAL INSTRUMENTS - QUALITATIVE DESCRIPTION
Risk management in BN BankItispartoftheGroup’scorporatestrategytomaintainalowriskprofileinallitsactivities.
The chapter on risk management is part of the supplementary disclosures on financial instruments contained in the consolidated financial statements. See Notes 32 and 33 for more information about risk relating to financial instruments.
Organisation
The Board of DirectorsTheBoardofDirectorshasadoptedtheBank’sriskstrategies.TheseincludeasetofprinciplesdesignedtogivetheorganisationanunderstandingofthetypeofriskprofiletheBankwishestohaveandofthemeasuresthataretakentocontrolrisk.TheriskstrategiesalsodefinetheBank’srisktolerance.TherisktolerancesayssomethingabouttheBank’swillingnesstoassumerisk,andisdeterminedwiththeaidofrelevantandbothgeneralandquantifiedobjectives.Thisriskto-lerance is necessary in order to set consistent limits for risk and to select suitable systems for monitoring risk. The risk strategies contain a combination of limits that must be explicitly complied with and targets to steer towards. The risk strategies are updated annually.
ThechartbelowshowswhichriskstrategiestheBank’sBoardofDirectorshasadoptedandtherelationshipbetweenthem.
Operational risk & internal control strategy
Risk- and capital management strategy
Financial counterparty risk strategy
Liquidity strategyMarket risk strategyCredit strategy
Internal auditorThe Board has appointed an outside internal auditor whose duty is to perform a monitoring function which, independently of the administration in general, car-riesoutriskassessments,controlsandexaminationsoftheBank’sinternalcontrolandmanagementprocessesinordertoassesswhethertheyarefunctioningappropriately and satisfactorily.
The Bank’s managementTheManagingDirectorisresponsibleforoverallriskmanagementwithintheBank.TheManagingDirectorreceivesregularreportsoftheBank’sriskexposureand the status of the work on internal control. The Managing Director has established a risk management group that meets regularly. Matters concerning chan-gestoorimplementationofnewstrategieswithintheGroupmustalwaysbepresentedtotheriskmanagementgroupfordiscussionanddecisions.Theriskmanagementgroupdealsatleastonceannuallywithanassessmentoftherisksituationandtheassociatedcapitaladequacyrequirement(ICAAP).Thisassess-ment is then presented to the Board of Directors. The Managing Director has delegated tasks in accordance with the formal responsibility for internal control and risk management. The responsibility for imple-menting the annual assessment of the risk situation and capital adequacy requirement is delegated to the Risk Management unit. This risk analysis performed bytheunitshallbeco-ordinatedandintegratedwiththeBank’sotherplanningandstrategywork.Controltasksarefurthermoredelegatedtotheindividuallinemanagers within the framework of adopted principles, instructions and authorisations.
HomeThe Year 2011 About BN Bank Report of The Directors Financial Statement
Income Statement | Balance Sheet | Changes in Equity | Cash Flows | Notes
81

t
AdministrationTheBankhasitsownRiskManagementunit,whichcoverstheentireGroupandwhichdoesnotcarryoutactivitiesthatthecontrolfunctionisintendedtomoni-tor. This unit is charged with identifying, measuring and assessing all risks.
The risk management processThe Bank has in place satisfactory and appropriate strategies and processes for risk management and assessing capital adequacy and how this can be maintai-ned.ThecollectivetermforthisisICAAP(InternalCapitalAdequacyAssessmentProcess).Inordertostructuretheframework,BNBank’sICAAPisdividedintofivestages:
I) Identification of riskAn analysis has been made of the risks the Bank is exposed to. There is a suitable system of risk monitoring for all risks. There is also a process for identifying changes to existing risks and any exposure to new risks. The latter applies especially in connection with changes in any existing, or establishment of, new pro-ducts or business areas.
II) Quantification of risk and equity InordertoanalysetheBank’srisk-bearingcapacity,allrisksarequantifiedandaggregated.
III) Assessment of capital adequacy requirementThe calculations are based on the requirement that the Bank is obliged to satisfy the regulatory requirements for capital base with a given probability. Calcu-lationsarealsomadeforotherconfidencelevelsandtimehorizons.ThelevelofcapitalisfurthermoreadaptedtotheBank’sbusinessplansandgrowthambi-tions, developments in framework conditions, capital planning and contingency planning. Calculations are also made of economic capital for different confidence levels and time horizons.
IV) Setting limits (ex ante control)All significants risks have a limit.
V) Risk monitoring and ex post controlProcedures have been established for dealing with breaches of limit. In cases where risk is not quantifiable, the object of the risk monitoring is to check process-related requirements or qualitative requirements. Reporting of risk monitoring follows a fixed frequency and provides a full picture of the situation. In cases where risk exposure arises quickly or unexpectedly, ad hoc reports are to be prepared. Ex post control means that if the risk monitoring uncovers real exposure thatisgreaterthanthedesiredlevelofexposure,measuresshallbetaken.Relevantmeasuresincluderiskmitigation,achangeoflimits(reallocationofriskcapital)orincreasedequity.Expostcontrolcanbeviewedasthelaststageoftheriskmanagementprocessandatthesametimethestartingpointforanewprocess.
HomeThe Year 2011 About BN Bank Report of The Directors Financial Statement
Income Statement | Balance Sheet | Changes in Equity | Cash Flows | Notes
82
t
Risk categoriesFor risk management purposes, BN Bank distinguishes between the following categories of risk:
Credit riskCreditriskisdefinedastheriskoflossthatarisesiftheGroup’scounterpartiesorcustomersfailtomeettheirpaymentobligationstoBNBank.Creditriskcon-cerns all receivables from counterparties/customers, mainly loans and advances, but also liability in accordance with other issued credits, guarantees, securities, credit granted but not drawn on, and the counterparty risk that arises through derivatives and forward exchange contracts. Settlement risk, which arises in connection with payment services as a result of the fact that not all transactions take place in real time, also give rise to counterparty risk. In the loan portfolio, credit risk is a product of two events, both of which must occur if a loss is to arise. One risk is the possibility that the borrower will be unable or unwilling to pay. The other is that the value of the underlying mortgaged asset will be insufficient to cover the amount owed to BN Bank in the event of default and subsequent realisation of the asset. Loans to business and retail customers are risk-classified before a decision is made to grant credit. The classification is updated at least once annually for businesses and quarterly for retail customers. CreditriskisasignificantriskfortheBank,andthedesiredexposureislow.Monitoringofcreditriskisbasedonaninternalriskclassificationsystem(InternalRatings-BasedorIRBsystem).BNBankusescreditratingmodelstoanalysecreditriskwithincommercialrealestate,otherbusinessactivityandtheretailmar-ket.ThesemodelsassigntoeverydebtoraPD(ProbabilityofDefault)classandanLGD(LossGivenDefault)class.ThePDclassificationindicatestheprobabilitythataloanwillbedefaultedon,whiletheLGDclassificationgivesanestimateofthelossrate(inrelationtothesizeoftheexposure)giventhattheloanisde-faultedon.TheproductofthePDandLGDthatareassignedtoanindividualloangivestheexpectedlossontheloanasapercentageofthesizeofexposure.
The credit rating models differ from one another as regards what are considered the most significant risk factors relating to the loan. In the case of property companies, the focus is on the level and uncertainty of the cash flows generated from the properties that are being risk-classified for finance relative to the probability of default. For other types of enterprise, there is a greater focus on previous results/cash flow, the market situation, the management, etc. For clas-sification in relation to impairment losses arising from default, the focus is on value and the uncertainty of the value of the properties that serve as security for theloan.Forretailborrowers,thefocusisonthedebtor’sincomeandpropertyinadditiontovariousbehaviourvariables.InthecaseofLGDcalculations,here,too, the key element is the security offered for the loan and the value of the mortgaged asset in relation to the size of the loan. The management are provided with regular credit risk reports based on the risk classification system. A key element in this connection is the trend in loans divi-dedintodifferentclassesofriskandmigrationbetweentheclasses.InNotes32and33anassessmentisprovidedoftheBank’screditriskattheendof2010and 2011 respectively.
Liquidity riskLiquidityriskisdefinedastheriskthattheBankwillbeunabletofinancegrowthinlendingandtodischargeitscommitmentsastheyfalldue(refinancingrisk).LiquidityriskalsoincludestheriskthatfinancialmarketsthattheBankwishestousedonotfunction(marketliquidity).LiquidityriskisasignificantriskfortheBank. The desired exposure shall be moderate and in line with the average in the market. Liquidity risk monitoring is done by controlling exposure in relation to set limits and by control of qualitative requirements. The management receive regular reports of liquidity risk in relation to limits and targets. See Notes 32 and 33forananalysisoftheGroup’sliquidityriskattheendof2010and2011respectively.
Market riskMarketriskisdefinedastheriskoflossowingtochangesinexternalconditionssuchasthemarketsituationortheauthorities’regulatorydecisions.Marketriskisdefinedasasignificantrisk.Thedesiredexposureshallbemoderate.TheGroupmonitorsmarketriskbymeansofqualitativeandquantitativeanalysesofvariousfactors.Themostimportantfactorsthatcanbeimpactedbychangesinthemarketsituationortheauthorities’regulatorydecisionsarevolumeandmargins in the lending and deposit/funding businesses, impairment losses on loans, and operating expense.
Interest rate riskInterestrateriskisdefinedasthetotalearnings-relatedrisktowhichtheBankisexposedifthefixed-interestperiodsfortheBank’scommitmentsandreceiva-blesbothonandoffthebalancesheetdonotmatch.Interestrateriskisdefinedasariskwithsomesignificance.Thedesiredexposureshallbelow.TheBank’sequity shall in principle be exposed to short-term interest rates. This shall be achieved by commitments and receivables with a fixed interest rate of more than one year virtually neutralising one another. Interest rate risk is monitored by controlling exposure in relation to set limits for interest sensitivity. Interest sensiti-vity analysis has been chosen as the basis for setting limits because of the ability of this key indicator to quantify interest rate risk. The other important tool for managing risk is the gap analysis, which compares fixed interest periods on the assets and liabilities side for each period and includes both on- and off-balance sheet items. The management receive regular reports of these connections. An analysis of interest rate risk at the end of 2010 and 2011 respectively is provided in Notes 32 and 33.
HomeThe Year 2011 About BN Bank Report of The Directors Financial Statement
Income Statement | Balance Sheet | Changes in Equity | Cash Flows | Notes
83

t
Foreign exchange riskForeign exchange risk is defined as the total earnings-related risk to which the Bank is exposed when foreign exchange rates change. Foreign exchange risk is de-fined as a non-significant risk for the Bank. The desired exposure shall be low. Foreign exchange risk is monitored by controlling exposure in relation to set limits. Reportsaredrawnupshowingthenetpositionineachcurrency.Thisanalysiscontainsallcurrencyitemson-andoff-balancesheet(interestandprincipals),aswell as agreements entered into with foreign exchange risk that are not yet entered in the books. The management receive regular reports of this analysis. An analysis of foreign exchange risk at the end of 2010 and 2011 respectively is provided in Notes 32 and 33.
Operational riskOperationalriskisdefinedastherisktowhichtheGroupisexposedintheeventofinadequacyorfailureofinternalprocedures,people,systemsorexternalevents. Operational risk includes fraud risk. Fraud risk consists of several types of undesired events, including money-laundering, corruption, criminal deception, internalfraud(embezzlement,misappropriationoffunds,theftandthelike).Thelast-mentionedactionsfallunderthetermeconomiccrime.Operationalriskis defined as a risk with some significance for the Bank. The desired exposure shall be moderate. Operational risk is monitored by means of regular qualitative analyses.
Ownership riskOwnership risk is the risk that BN Bank will suffer a negative result from shareholdings in strategically owned companies, or that the Bank will need to inject fresh equity capital into strategically owned companies, whether this is due to strong growth or to keep the company operating as a result of deficit.SpareBank1BoligkredittASandSpareBank1NæringskredittASareincludedinthecalculationofownershiprisk.Capitalrequirementsrelatingtorealestatecompanies which have been taken over because of default are dealt with under risk of impaired value of real property. Where other companies are concerned, there is considered to be limited risk and so risk-adjusted capital has not been calculated for these.
Reputation riskReputation risk is the risk of loss as a result of damage to business reputation. This includes loss of revenue and access to capital because of a loss of trustworthiness and reputation in the market, i.e. in relation to customers, counterparties, primary capital certificate holders and authorities.Thebankingbusinessisdependentontrust,bothinthemarketandinrelationtoregulatoryauthorities.EventsthathaveanegativeimpactontheBank’srepu-tation can damage liquidity and commercial opportunities.
Compliance riskComplianceriskistheriskthattheGroupwillincurpublicsanctions,fines,financiallossorlossofreputationasaresultoffailuretocomplywithlawsandregu-lations.
Strategic riskStrategic risk is the risk of loss or failure of revenue because of poor strategic business decisions, including those relating to growth ambitions, entry into new markets, and/or acquisitions.
HomeThe Year 2011 About BN Bank Report of The Directors Financial Statement
Income Statement | Balance Sheet | Changes in Equity | Cash Flows | Notes
84

t
Concentrations of risk
Concentrations of financial risk arise when financial instruments with the same characteristics are affected uniformly by changes in economic or other factors. Identifying these concentrations of risk includes making discretionary assessments. The Bank encounters different types of risk concentration. If individual borrowers or groups of associated debtors make up a considerable share of the loan port-folio, this will represent a form of concentration risk since the portfolio will then contain company-specific or unsystematic risk. This type of risk concentration is called debtor concentration. Frequently, the risk associated with financing commercial property is in actual fact the exposure to the tenants in the buildings. If a large proportion of the build-ings in our loan portfolio are leased to large individual tenants or if a large proportion of the tenants are connected with a particular trade or business, this also implies a type of concentration risk. We call this tenant concentration. Another type of risk concentration is as a result of high exposure to certain sectors or geographical areas. Some sectors and geographical areas may have dif-ferent economic cycles, and any failure to spread the exposure over different sectors means that we may miss out on diversification opportunities. This type of concentration risk is known as sector concentration or geographical concentration. Extra risk as a result of debtor concentration is present, as the Bank sees it, but does not represent a significant risk for the Bank. This is because, when one takes into account the quality of the collateral, exposure is actually low. Similar reasoning can be applied in relation to tenant concentration. BN Bank has a concentrated loan portfolio as a result of its strategy of specialising in financing real estate in Norway, and this sector makes up about 58% of the totalcreditportfolio.SectorconcentrationisthereforethemostimportantkindofconcentrationinBNBank’sportfolio.Consequently,aconsiderableshareofthe portfolio will be exposed to risk factors that affect property companies specifically. These risk factors are primarily vacancy, rental prices and interest rates. The last-mentioned is a general macrovariable, but property companies are more heavily exposed to interest rates than many other industries owing to the high proportion of loans and because property is an asset with a long life.
On the level of individual loans, there will be big variations in relation to the sensitivity of the loan to these factors and therefore in how the loan contributes to theportfolio’sconcentrationrisk.Thiswilldependonleaseconditions,thelocationoftheproperty,thetypeofbuilding,andsoon.Thedebtor’sfinancialsitua-tionwillalsobeveryimportant.Thiswillvaryagreatdealwithdifferencesintheamountborrowedandthedebtor’sabilitytoservicethedebt. BN Bank has limited possibilities for reducing the portfolio risk by diversifying into other geographical areas and sectors. From a risk analysis and risk manage-ment perspective, it is therefore important to be consistently aware of this element of the portfolio risk. The IRB system permits the Bank to do this.
Hedging instruments
The Group employs the following hedging instruments:•Interestrateswaps–contractstoexchangeinterest-rateconditionsforafixednominalsumoverafixednumberofperiods
•FRAs–forwardrateagreements–contractstoexchangeanagreedinterestrateforafuturefixedrateforaspecificnominalsumforaspecificperiod.
•Equity-linkedoptionsandshare-andinterestrateswaps–inthiscontextcontractstoreceivetheyieldononeormoreshares,shareindexesorfundsatafixedfuturedateagainstpaymentofapremiumwhenthecontractismade(equity-linkedoptions),oragainstpaymentofavariablecurrentinterestrateoverthetermoftheoption(share-andinterest-rateswaps).Thecontractsaremadeatthesametimeasborrowingintheformofequity-linkedbondsorequity-linkedterm deposits. The contracts are designed so as to give BN Bank no net exposure in equity instruments.
•Forwardexchangecontracts–contractsforthepurchaseorsaleofforeigncurrencywithsettlementataspecificfuturedate.
The object of using interest-rate, currency and equity instruments is to hedge future interest rates or to counteract the effect of exchange rate fluctuations.
HomeThe Year 2011 About BN Bank Report of The Directors Financial Statement
Income Statement | Balance Sheet | Changes in Equity | Cash Flows | Notes
85
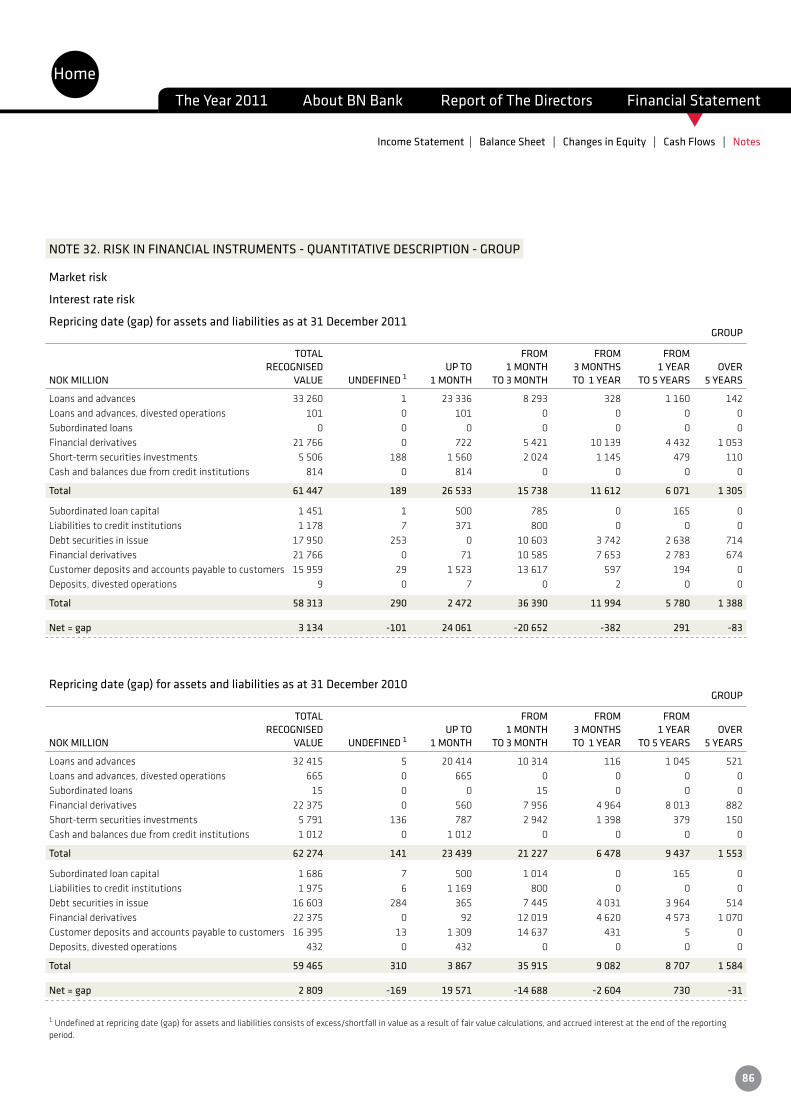
t
NOTE 32. RISK IN FINANCIAL INSTRUMENTS - QUANTITATIVE DESCRIPTION - GROUP
Market risk
Interest rate risk
Repricing date (gap) for assets and liabilities as at 31 December 2011 GROUP
TOTAL FROM FROM FROM RECOGNISED UP TO 1 MONTH 3 MONTHS 1 YEAR OVERNOK MILLION VALUE UNDEFINED 1 1 MONTH TO 3 MONTH TO 1 YEAR TO 5 YEARS 5 YEARS
Loansandadvances 33 260 1 23 336 8 293 328 1 160 142Loans and advances, divested operations 101 0 101 0 0 0 0Subordinated loans 0 0 0 0 0 0 0Financialderivatives 21 766 0 722 5 421 10 139 4 432 1 053Short-termsecuritiesinvestments 5 506 188 1 560 2 024 1 145 479 110Cash and balances due from credit institutions 814 0 814 0 0 0 0
Total 61 447 189 26 533 15 738 11 612 6 071 1 305
Subordinatedloancapital 1 451 1 500 785 0 165 0Liabilitiestocreditinstitutions 1 178 7 371 800 0 0 0Debtsecuritiesinissue 17 950 253 0 10 603 3 742 2 638 714Financialderivatives 21 766 0 71 10 585 7 653 2 783 674Customerdepositsandaccountspayabletocustomers 15 959 29 1 523 13 617 597 194 0Deposits, divested operations 9 0 7 0 2 0 0
Total 58 313 290 2 472 36 390 11 994 5 780 1 388
Net = gap 3 134 -101 24 061 -20 652 -382 291 -83
Repricing date (gap) for assets and liabilities as at 31 December 2010 GROUP
TOTAL FROM FROM FROM RECOGNISED UP TO 1 MONTH 3 MONTHS 1 YEAR OVERNOK MILLION VALUE UNDEFINED 1 1 MONTH TO 3 MONTH TO 1 YEAR TO 5 YEARS 5 YEARS
Loansandadvances 32 415 5 20 414 10 314 116 1 045 521Loans and advances, divested operations 665 0 665 0 0 0 0Subordinated loans 15 0 0 15 0 0 0Financialderivatives 22 375 0 560 7 956 4 964 8 013 882Short-termsecuritiesinvestments 5 791 136 787 2 942 1 398 379 150Cashandbalancesduefromcreditinstitutions 1 012 0 1 012 0 0 0 0
Total 62 274 141 23 439 21 227 6 478 9 437 1 553
Subordinatedloancapital 1 686 7 500 1 014 0 165 0Liabilitiestocreditinstitutions 1 975 6 1 169 800 0 0 0Debtsecuritiesinissue 16 603 284 365 7 445 4 031 3 964 514Financialderivatives 22 375 0 92 12 019 4 620 4 573 1 070Customerdepositsandaccountspayabletocustomers 16 395 13 1 309 14 637 431 5 0Deposits, divested operations 432 0 432 0 0 0 0
Total 59 465 310 3 867 35 915 9 082 8 707 1 584
Net = gap 2 809 -169 19 571 -14 688 -2 604 730 -31
1Undefinedatrepricingdate(gap)forassetsandliabilitiesconsistsofexcess/shortfallinvalueasaresultoffairvaluecalculations,andaccruedinterestattheendofthereportingperiod.
HomeThe Year 2011 About BN Bank Report of The Directors Financial Statement
Income Statement | Balance Sheet | Changes in Equity | Cash Flows | Notes
86
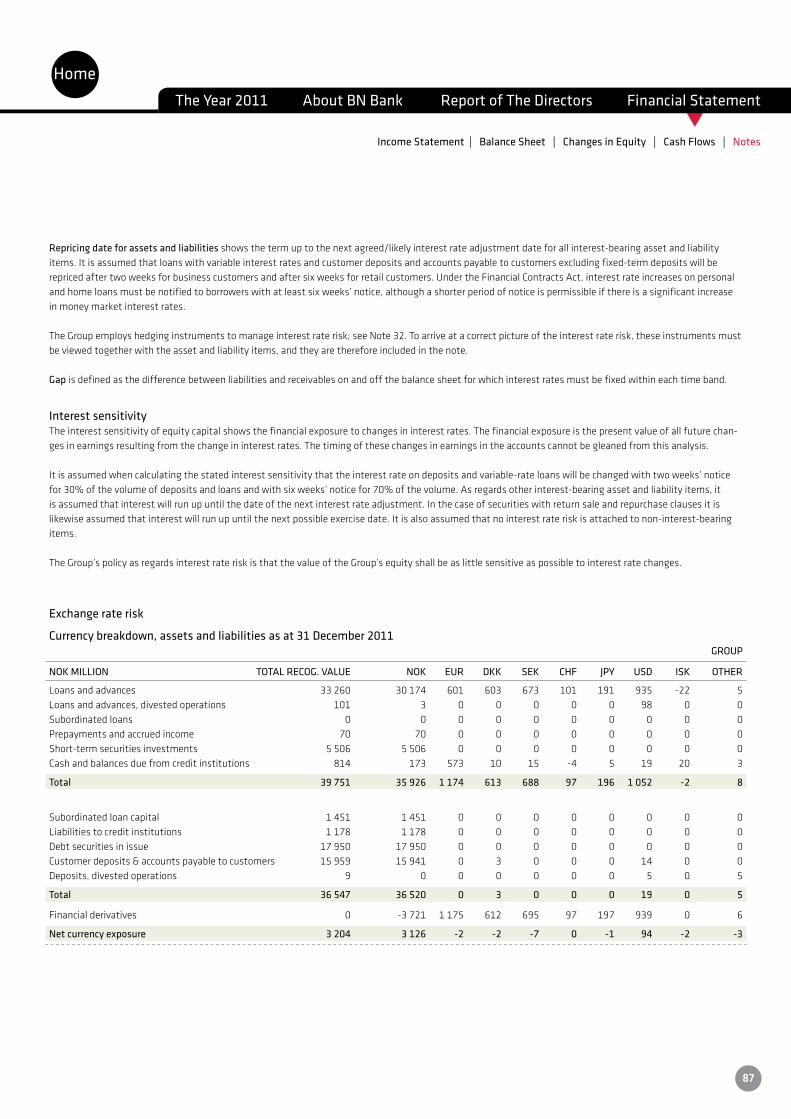
t
Repricing date for assets and liabilities shows the term up to the next agreed/likely interest rate adjustment date for all interest-bearing asset and liability items. It is assumed that loans with variable interest rates and customer deposits and accounts payable to customers excluding fixed-term deposits will be repriced after two weeks for business customers and after six weeks for retail customers. Under the Financial Contracts Act, interest rate increases on personal andhomeloansmustbenotifiedtoborrowerswithatleastsixweeks’notice,althoughashorterperiodofnoticeispermissibleifthereisasignificantincreasein money market interest rates.
TheGroupemployshedginginstrumentstomanageinterestraterisk;seeNote32.Toarriveatacorrectpictureoftheinterestraterisk,theseinstrumentsmustbe viewed together with the asset and liability items, and they are therefore included in the note.
Gap is defined as the difference between liabilities and receivables on and off the balance sheet for which interest rates must be fixed within each time band.
Interest sensitivityThe interest sensitivity of equity capital shows the financial exposure to changes in interest rates. The financial exposure is the present value of all future chan-ges in earnings resulting from the change in interest rates. The timing of these changes in earnings in the accounts cannot be gleaned from this analysis.
Itisassumedwhencalculatingthestatedinterestsensitivitythattheinterestrateondepositsandvariable-rateloanswillbechangedwithtwoweeks’noticefor30%ofthevolumeofdepositsandloansandwithsixweeks’noticefor70%ofthevolume.Asregardsotherinterest-bearingassetandliabilityitems,itis assumed that interest will run up until the date of the next interest rate adjustment. In the case of securities with return sale and repurchase clauses it is likewise assumed that interest will run up until the next possible exercise date. It is also assumed that no interest rate risk is attached to non-interest-bearing items.
TheGroup’spolicyasregardsinterestrateriskisthatthevalueoftheGroup’sequityshallbeaslittlesensitiveaspossibletointerestratechanges.
Exchange rate risk
Currency breakdown, assets and liabilities as at 31 December 2011 GROUP
NOK MILLION TOTAL RECOG. VALUE NOK EUR DKK SEK CHF JPY USD ISK OTHER
Loansandadvances 33 260 30 174 601 603 673 101 191 935 -22 5Loans and advances, divested operations 101 3 0 0 0 0 0 98 0 0Subordinated loans 0 0 0 0 0 0 0 0 0 0Prepayments and accrued income 70 70 0 0 0 0 0 0 0 0Short-termsecuritiesinvestments 5 506 5 506 0 0 0 0 0 0 0 0Cash and balances due from credit institutions 814 173 573 10 15 -4 5 19 20 3
Total 39 751 35 926 1 174 613 688 97 196 1 052 -2 8
Subordinatedloancapital 1 451 1 451 0 0 0 0 0 0 0 0Liabilitiestocreditinstitutions 1 178 1 178 0 0 0 0 0 0 0 0Debtsecuritiesinissue 17 950 17 950 0 0 0 0 0 0 0 0Customerdeposits&accountspayabletocustomers 15 959 15 941 0 3 0 0 0 14 0 0Deposits, divested operations 9 0 0 0 0 0 0 5 0 5
Total 36 547 36 520 0 3 0 0 0 19 0 5
Financialderivatives 0 -3 721 1 175 612 695 97 197 939 0 6
Net currency exposure 3 204 3 126 -2 -2 -7 0 -1 94 -2 -3
HomeThe Year 2011 About BN Bank Report of The Directors Financial Statement
Income Statement | Balance Sheet | Changes in Equity | Cash Flows | Notes
87
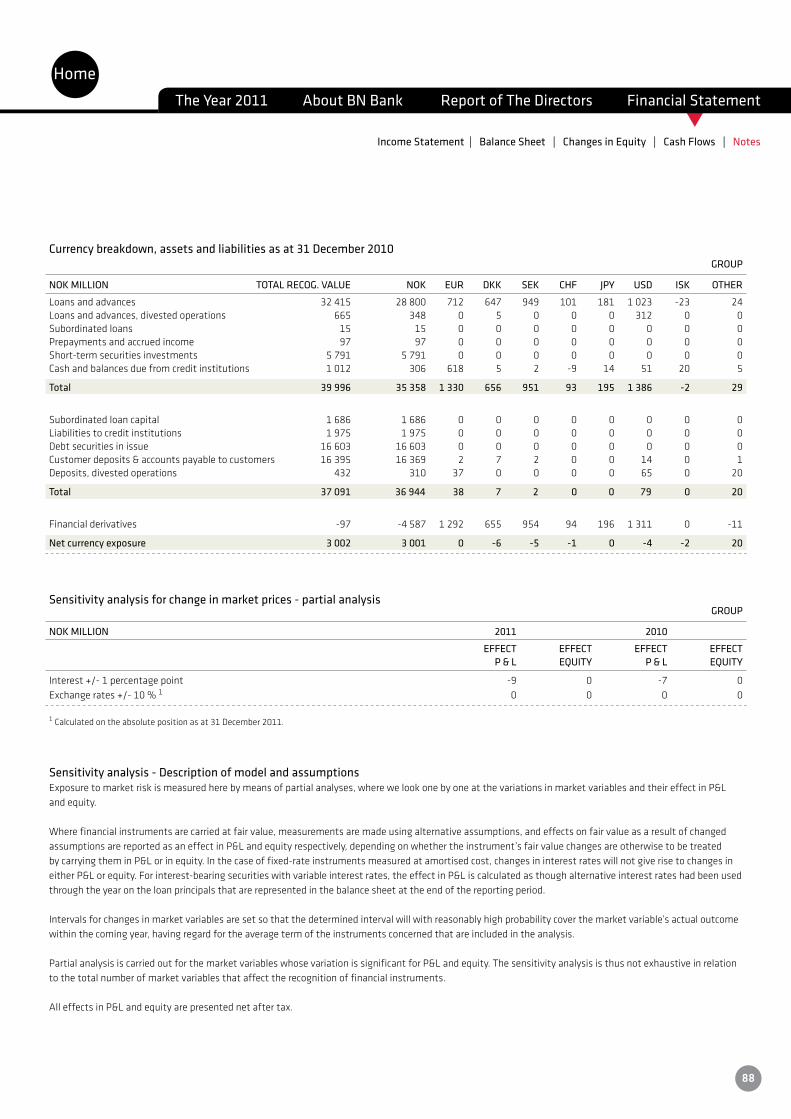
t
Currency breakdown, assets and liabilities as at 31 December 2010 GROUP
NOK MILLION TOTAL RECOG. VALUE NOK EUR DKK SEK CHF JPY USD ISK OTHER
Loansandadvances 32 415 28 800 712 647 949 101 181 1 023 -23 24Loans and advances, divested operations 665 348 0 5 0 0 0 312 0 0Subordinated loans 15 15 0 0 0 0 0 0 0 0Prepayments and accrued income 97 97 0 0 0 0 0 0 0 0Short-termsecuritiesinvestments 5 791 5 791 0 0 0 0 0 0 0 0Cashandbalancesduefromcreditinstitutions 1 012 306 618 5 2 -9 14 51 20 5
Total 39 996 35 358 1 330 656 951 93 195 1 386 -2 29
Subordinatedloancapital 1 686 1 686 0 0 0 0 0 0 0 0Liabilitiestocreditinstitutions 1 975 1 975 0 0 0 0 0 0 0 0Debtsecuritiesinissue 16 603 16 603 0 0 0 0 0 0 0 0Customerdeposits&accountspayabletocustomers 16 395 16 369 2 7 2 0 0 14 0 1Deposits, divested operations 432 310 37 0 0 0 0 65 0 20
Total 37 091 36 944 38 7 2 0 0 79 0 20
Financialderivatives -97 -4 587 1 292 655 954 94 196 1 311 0 -11
Net currency exposure 3 002 3 001 0 -6 -5 -1 0 -4 -2 20
Sensitivity analysis for change in market prices - partial analysis GROUP
NOK MILLION 2011 2010
EFFECT EFFECT EFFECT EFFECT P & L EQUITY P & L EQUITY
Interest+/-1percentagepoint -9 0 -7 0Exchangerates+/-10%1 0 0 0 0
1 Calculated on the absolute position as at 31 December 2011.
Sensitivity analysis - Description of model and assumptionsExposure to market risk is measured here by means of partial analyses, where we look one by one at the variations in market variables and their effect in P&L and equity.
Where financial instruments are carried at fair value, measurements are made using alternative assumptions, and effects on fair value as a result of changed assumptionsarereportedasaneffectinP&Landequityrespectively,dependingonwhethertheinstrument’sfairvaluechangesareotherwisetobetreatedby carrying them in P&L or in equity. In the case of fixed-rate instruments measured at amortised cost, changes in interest rates will not give rise to changes in either P&L or equity. For interest-bearing securities with variable interest rates, the effect in P&L is calculated as though alternative interest rates had been used through the year on the loan principals that are represented in the balance sheet at the end of the reporting period.
Intervalsforchangesinmarketvariablesaresetsothatthedeterminedintervalwillwithreasonablyhighprobabilitycoverthemarketvariable’sactualoutcomewithin the coming year, having regard for the average term of the instruments concerned that are included in the analysis.
Partial analysis is carried out for the market variables whose variation is significant for P&L and equity. The sensitivity analysis is thus not exhaustive in relation to the total number of market variables that affect the recognition of financial instruments.
All effects in P&L and equity are presented net after tax.
HomeThe Year 2011 About BN Bank Report of The Directors Financial Statement
Income Statement | Balance Sheet | Changes in Equity | Cash Flows | Notes
88
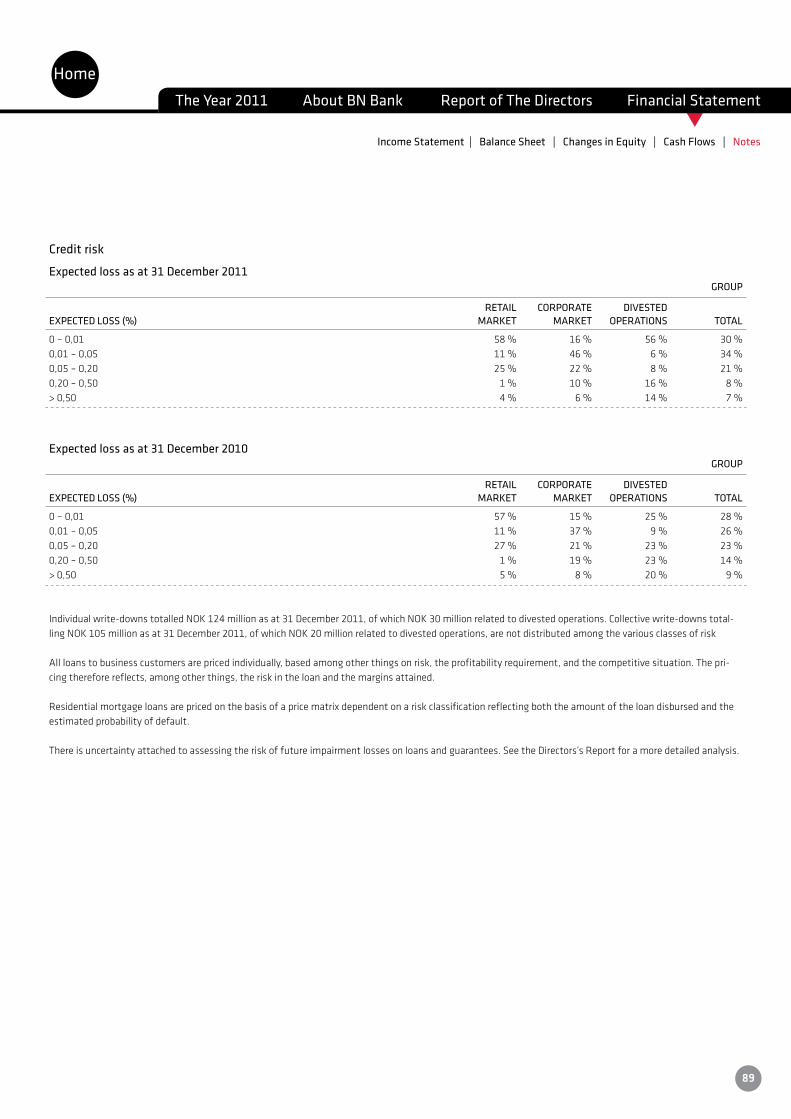
t
Credit risk
Expected loss as at 31 December 2011 GROUP
RETAIL CORPORATE DIVESTEDEXPECTED LOSS (%) MARKET MARKET OPERATIONS TOTAL
0 – 0,01 58 % 16 % 56 % 30 %0,01 – 0,05 11 % 46 % 6 % 34 %0,05 – 0,20 25 % 22 % 8 % 21 %0,20 – 0,50 1 % 10 % 16 % 8 %> 0,50 4 % 6 % 14 % 7 %
Expected loss as at 31 December 2010 GROUP
RETAIL CORPORATE DIVESTEDEXPECTED LOSS (%) MARKET MARKET OPERATIONS TOTAL
0 – 0,01 57 % 15 % 25 % 28 %0,01 – 0,05 11 % 37 % 9 % 26 %0,05 – 0,20 27 % 21 % 23 % 23 %0,20 – 0,50 1 % 19 % 23 % 14 %> 0,50 5 % 8 % 20 % 9 %
Individualwrite-downstotalledNOK124millionasat31December2011,ofwhichNOK30millionrelatedtodivestedoperations.Collectivewrite-downstotal-lingNOK105millionasat31December2011,ofwhichNOK20millionrelatedtodivestedoperations,arenotdistributedamongthevariousclassesofrisk
All loans to business customers are priced individually, based among other things on risk, the profitability requirement, and the competitive situation. The pri-cing therefore reflects, among other things, the risk in the loan and the margins attained.
Residential mortgage loans are priced on the basis of a price matrix dependent on a risk classification reflecting both the amount of the loan disbursed and the estimated probability of default.
Thereisuncertaintyattachedtoassessingtheriskoffutureimpairmentlossesonloansandguarantees.SeetheDirectors’sReportforamoredetailedanalysis.
HomeThe Year 2011 About BN Bank Report of The Directors Financial Statement
Income Statement | Balance Sheet | Changes in Equity | Cash Flows | Notes
89
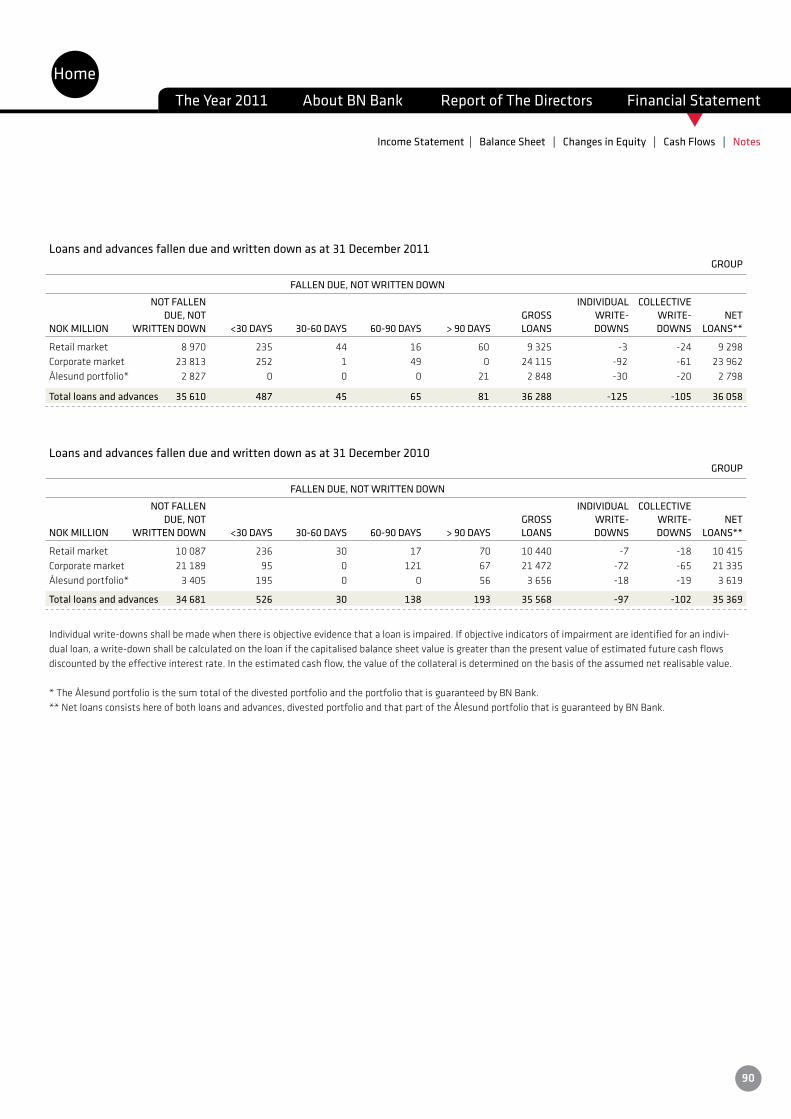
t
Loans and advances fallen due and written down as at 31 December 2011 GROUP
FALLEN DUE, NOT WRITTEN DOWN
NOT FALLEN INDIVIDUAL COLLECTIVE DUE, NOT GROSS WRITE- WRITE- NETNOK MILLION WRITTEN DOWN <30 DAYS 30-60 DAYS 60-90 DAYS > 90 DAYS LOANS DOWNS DOWNS LOANS**
Retailmarket 8970 235 44 16 60 9325 -3 -24 9 298Corporatemarket 23 813 252 1 49 0 24 115 -92 -61 23 962Ålesundportfolio* 2 827 0 0 0 21 2 848 -30 -20 2 798
Total loans and advances 35 610 487 45 65 81 36 288 -125 -105 36 058
Loans and advances fallen due and written down as at 31 December 2010 GROUP
FALLEN DUE, NOT WRITTEN DOWN
NOT FALLEN INDIVIDUAL COLLECTIVE DUE, NOT GROSS WRITE- WRITE- NETNOK MILLION WRITTEN DOWN <30 DAYS 30-60 DAYS 60-90 DAYS > 90 DAYS LOANS DOWNS DOWNS LOANS**
Retailmarket 10 087 236 30 17 70 10440 -7 -18 10415Corporatemarket 21 189 95 0 121 67 21472 -72 -65 21335Ålesundportfolio* 3 405 195 0 0 56 3656 -18 -19 3619
Total loans and advances 34 681 526 30 138 193 35 568 -97 -102 35 369
Individual write-downs shall be made when there is objective evidence that a loan is impaired. If objective indicators of impairment are identified for an indivi-dual loan, a write-down shall be calculated on the loan if the capitalised balance sheet value is greater than the present value of estimated future cash flows discounted by the effective interest rate. In the estimated cash flow, the value of the collateral is determined on the basis of the assumed net realisable value.
* The Ålesund portfolio is the sum total of the divested portfolio and the portfolio that is guaranteed by BN Bank.** Net loans consists here of both loans and advances, divested portfolio and that part of the Ålesund portfolio that is guaranteed by BN Bank.
HomeThe Year 2011 About BN Bank Report of The Directors Financial Statement
Income Statement | Balance Sheet | Changes in Equity | Cash Flows | Notes
90
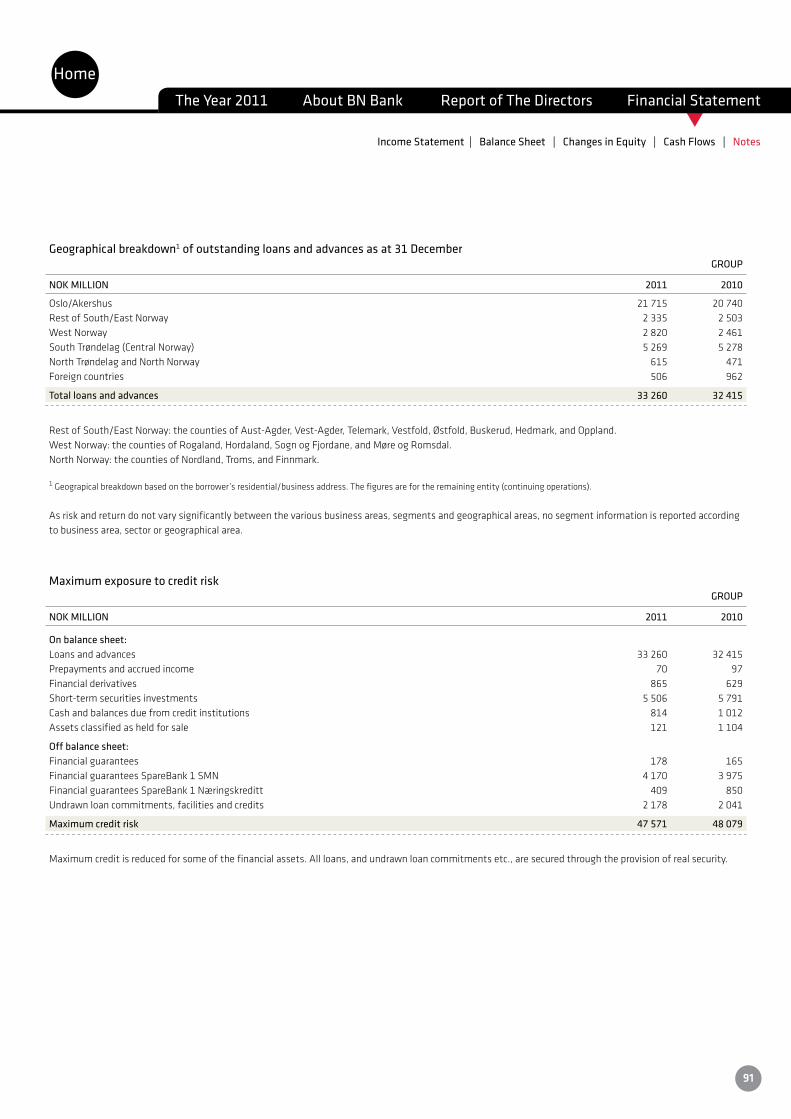
t
Geographical breakdown1 of outstanding loans and advances as at 31 December GROUP
NOK MILLION 2011 2010
Oslo/Akershus 21 715 20 740RestofSouth/EastNorway 2 335 2 503WestNorway 2 820 2 461SouthTrøndelag(CentralNorway) 5 269 5 278North Trøndelag and North Norway 615 471Foreign countries 506 962
Total loans and advances 33 260 32 415
RestofSouth/EastNorway:thecountiesofAust-Agder,Vest-Agder,Telemark,Vestfold,Østfold,Buskerud,Hedmark,andOppland.WestNorway:thecountiesofRogaland,Hordaland,SognogFjordane,andMøreogRomsdal.NorthNorway:thecountiesofNordland,Troms,andFinnmark.
1Geograpicalbreakdownbasedontheborrower’sresidential/businessaddress.Thefiguresarefortheremainingentity(continuingoperations).
As risk and return do not vary significantly between the various business areas, segments and geographical areas, no segment information is reported according to business area, sector or geographical area.
Maximum exposure to credit risk GROUP
NOK MILLION 2011 2010
On balance sheet:Loansandadvances 33 260 32 415Prepayments and accrued income 70 97Financial derivatives 865 629Short-termsecuritiesinvestments 5 506 5 791Cash and balances due from credit institutions 814 1 012Assetsclassifiedasheldforsale 121 1 104
Off balance sheet:Financial guarantees 178 165FinancialguaranteesSpareBank1SMN 4 170 3975FinancialguaranteesSpareBank1Næringskreditt 409 850Undrawnloancommitments,facilitiesandcredits 2 178 2 041
Maximum credit risk 47 571 48 079
Maximum credit is reduced for some of the financial assets. All loans, and undrawn loan commitments etc., are secured through the provision of real security.
HomeThe Year 2011 About BN Bank Report of The Directors Financial Statement
Income Statement | Balance Sheet | Changes in Equity | Cash Flows | Notes
91
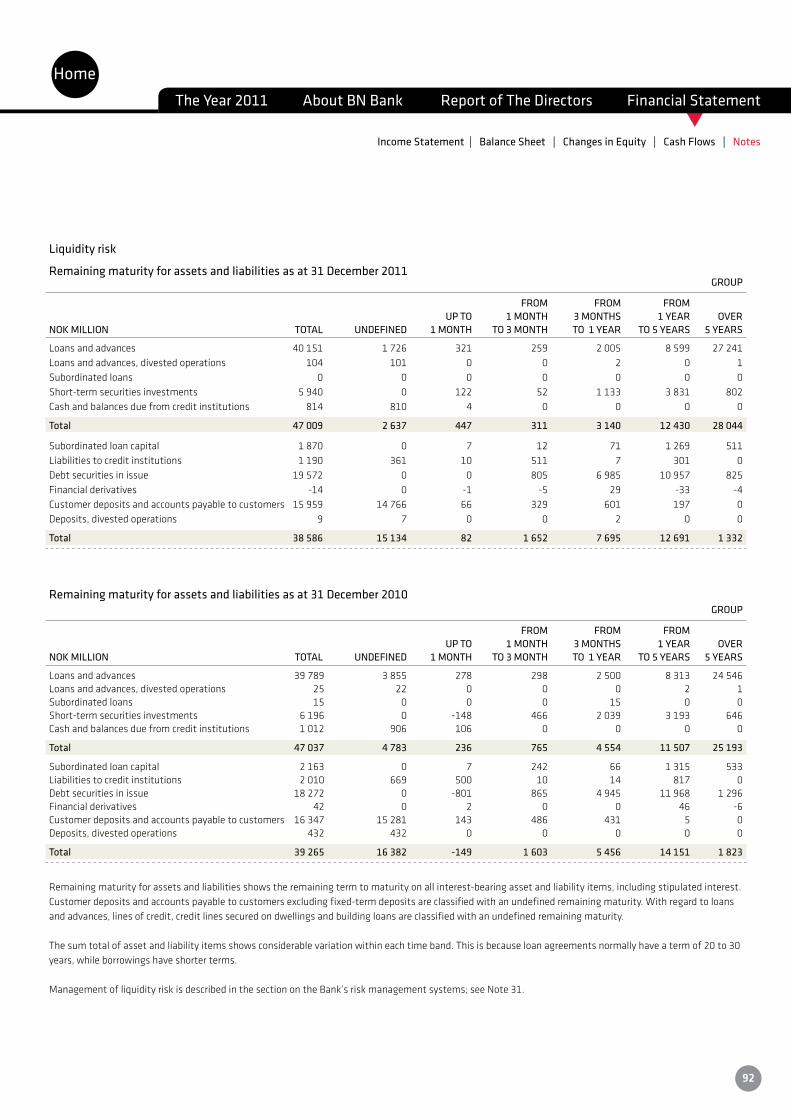
t
Liquidity risk
Remaining maturity for assets and liabilities as at 31 December 2011 GROUP
FROM FROM FROM UP TO 1 MONTH 3 MONTHS 1 YEAR OVERNOK MILLION TOTAL UNDEFINED 1 MONTH TO 3 MONTH TO 1 YEAR TO 5 YEARS 5 YEARS
Loansandadvances 40 151 1 726 321 259 2 005 8 599 27 241Loans and advances, divested operations 104 101 0 0 2 0 1Subordinated loans 0 0 0 0 0 0 0Short-termsecuritiesinvestments 5 940 0 122 52 1 133 3 831 802Cash and balances due from credit institutions 814 810 4 0 0 0 0
Total 47 009 2 637 447 311 3 140 12 430 28 044
Subordinatedloancapital 1 870 0 7 12 71 1 269 511Liabilitiestocreditinstitutions 1 190 361 10 511 7 301 0Debtsecuritiesinissue 19 572 0 0 805 6 985 10 957 825Financial derivatives -14 0 -1 -5 29 -33 -4Customerdepositsandaccountspayabletocustomers 15 959 14 766 66 329 601 197 0Deposits, divested operations 9 7 0 0 2 0 0
Total 38 586 15 134 82 1 652 7 695 12 691 1 332
Remaining maturity for assets and liabilities as at 31 December 2010 GROUP
FROM FROM FROM UP TO 1 MONTH 3 MONTHS 1 YEAR OVERNOK MILLION TOTAL UNDEFINED 1 MONTH TO 3 MONTH TO 1 YEAR TO 5 YEARS 5 YEARS
Loansandadvances 39 789 3 855 278 298 2 500 8 313 24 546Loans and advances, divested operations 25 22 0 0 0 2 1Subordinated loans 15 0 0 0 15 0 0Short-termsecuritiesinvestments 6 196 0 -148 466 2 039 3 193 646Cashandbalancesduefromcreditinstitutions 1 012 906 106 0 0 0 0
Total 47 037 4 783 236 765 4 554 11 507 25 193
Subordinatedloancapital 2 163 0 7 242 66 1 315 533Liabilitiestocreditinstitutions 2 010 669 500 10 14 817 0Debtsecuritiesinissue 18 272 0 -801 865 4 945 11 968 1 296Financial derivatives 42 0 2 0 0 46 -6Customerdepositsandaccountspayabletocustomers 16 347 15 281 143 486 431 5 0Deposits, divested operations 432 432 0 0 0 0 0
Total 39 265 16 382 -149 1 603 5 456 14 151 1 823
Remaining maturity for assets and liabilities shows the remaining term to maturity on all interest-bearing asset and liability items, including stipulated interest. Customer deposits and accounts payable to customers excluding fixed-term deposits are classified with an undefined remaining maturity. With regard to loans and advances, lines of credit, credit lines secured on dwellings and building loans are classified with an undefined remaining maturity.
The sum total of asset and liability items shows considerable variation within each time band. This is because loan agreements normally have a term of 20 to 30 years, while borrowings have shorter terms.
ManagementofliquidityriskisdescribedinthesectionontheBank’sriskmanagementsystems;seeNote31.
HomeThe Year 2011 About BN Bank Report of The Directors Financial Statement
Income Statement | Balance Sheet | Changes in Equity | Cash Flows | Notes
92
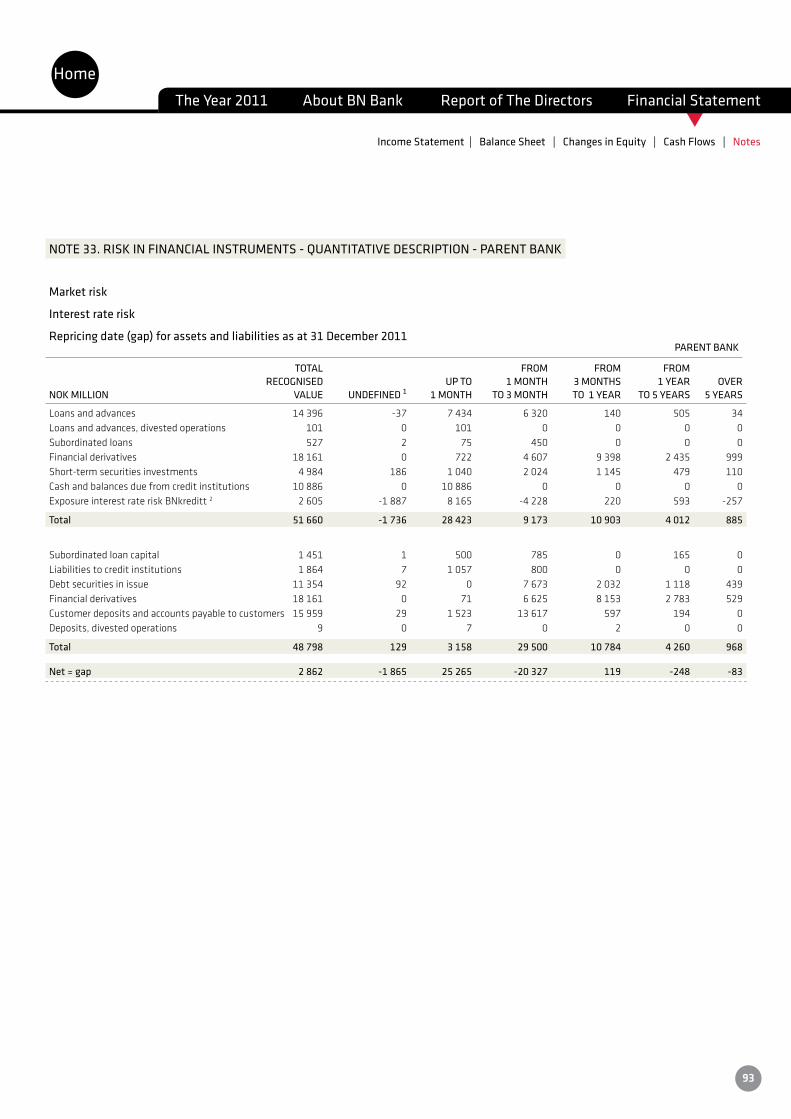
t
NOTE 33. RISK IN FINANCIAL INSTRUMENTS - QUANTITATIVE DESCRIPTION - PARENT BANK
Market risk
Interest rate risk
Repricing date (gap) for assets and liabilities as at 31 December 2011 PARENT BANK
TOTAL FROM FROM FROM RECOGNISED UP TO 1 MONTH 3 MONTHS 1 YEAR OVERNOK MILLION VALUE UNDEFINED 1 1 MONTH TO 3 MONTH TO 1 YEAR TO 5 YEARS 5 YEARS
Loansandadvances 14 396 -37 7 434 6 320 140 505 34Loans and advances, divested operations 101 0 101 0 0 0 0Subordinated loans 527 2 75 450 0 0 0Financialderivatives 18 161 0 722 4 607 9 398 2 435 999Short-termsecuritiesinvestments 4 984 186 1 040 2 024 1 145 479 110Cashandbalancesduefromcreditinstitutions 10 886 0 10 886 0 0 0 0Exposure interest rate risk BNkreditt 2 2 605 -1 887 8 165 -4 228 220 593 -257
Total 51 660 -1 736 28 423 9 173 10 903 4 012 885
Subordinatedloancapital 1 451 1 500 785 0 165 0Liabilitiestocreditinstitutions 1 864 7 1 057 800 0 0 0Debtsecuritiesinissue 11 354 92 0 7 673 2 032 1 118 439Financialderivatives 18 161 0 71 6 625 8 153 2 783 529Customerdepositsandaccountspayabletocustomers 15 959 29 1 523 13 617 597 194 0Deposits, divested operations 9 0 7 0 2 0 0
Total 48 798 129 3 158 29 500 10 784 4 260 968
Net = gap 2 862 -1 865 25 265 -20 327 119 -248 -83
HomeThe Year 2011 About BN Bank Report of The Directors Financial Statement
Income Statement | Balance Sheet | Changes in Equity | Cash Flows | Notes
93

t
Repricing date (gap) for assets and liabilities as at 31 December 2010 PARENT BANK
TOTAL FROM FROM FROM RECOGNISED UP TO 1 MONTH 3 MONTHS 1 YEAR OVERNOK MILLION VALUE UNDEFINED 1 1 MONTH TO 3 MONTH TO 1 YEAR TO 5 YEARS 5 YEARS
Loansandadvances 14 702 -37 6 631 7 580 56 378 94Loans and advances, divested operations 665 0 665 0 0 0 0Subordinated loans 542 2 0 465 75 0 0Financialderivatives 17 120 0 560 7 098 4 432 4 232 799Short-termsecuritiesinvestments 5 274 138 787 2 422 1 398 379 150Cashandbalancesduefromcreditinstitutions 7 504 0 7 504 0 0 0 0Exposure interest rate risk BNkreditt 2 2 556 -1 538 8 505 -3 873 -1 221 593 90
Total 48 363 -1 435 24 652 13 691 4 740 5 582 1 133
Subordinatedloancapital 1 686 7 500 1 014 0 165 0Liabilitiestocreditinstitutions 2 451 6 1 645 800 0 0 0Debtsecuritiesinissue 7 702 44 180 4 222 2 409 608 239Financialderivatives 17 120 0 92 7 600 4 430 4 073 925Customerdepositsandaccountspayabletocustomers 16 395 13 1 309 14 637 431 5 0Deposits, divested operations 432 0 432 0 0 0 0
Total 45 786 71 4 158 28 272 7 269 4 852 1 164
Net = gap 2 577 -1 506 20 494 -14 581 -2 530 730 -30
1Undefinedatrepricingdate(gap)forassetsandliabilitiesconsistsofexcess/shortfallasaresultoffairvaluecalculations,andaccruedinterestattheendofthereportingperiod.
2 Interest rate risk is identified and managed at group level. There is an internal agreement between BN Bank and BNkreditt that adjusts any gap between the companies.
Repricing date for assets and liabilities shows the term up to the next agreed/likely interest rate adjustment date for all interest-bearing asset and liability items. It is assumed that loans with variable interest rates and customer deposits and accounts payable to customers excluding fixed-term deposits will be repriced after two weeks for business customers and six weeks for retail customers. Under the Financial Contracts Act, interest rate increases on loans to retail customersmustbenotifiedtoborrowerswithatleastsixweeks’notice,althoughashorterperiodofnoticeispermissibleifthereisasignificantincreaseinmoney market interest rates.
TheGroupemployshedginginstrumentstomanageinterestraterisk;seeNote31.Toarriveatacorrectpictureoftheinterestraterisk,theseinstrumentsmustbe viewed together with the asset and liability items, and they are therefore included in the note.
Gap isdefined as the difference between liabilities and receivables on and off the balance sheet for which interest rates must be fixed within each time band.
HomeThe Year 2011 About BN Bank Report of The Directors Financial Statement
Income Statement | Balance Sheet | Changes in Equity | Cash Flows | Notes
94
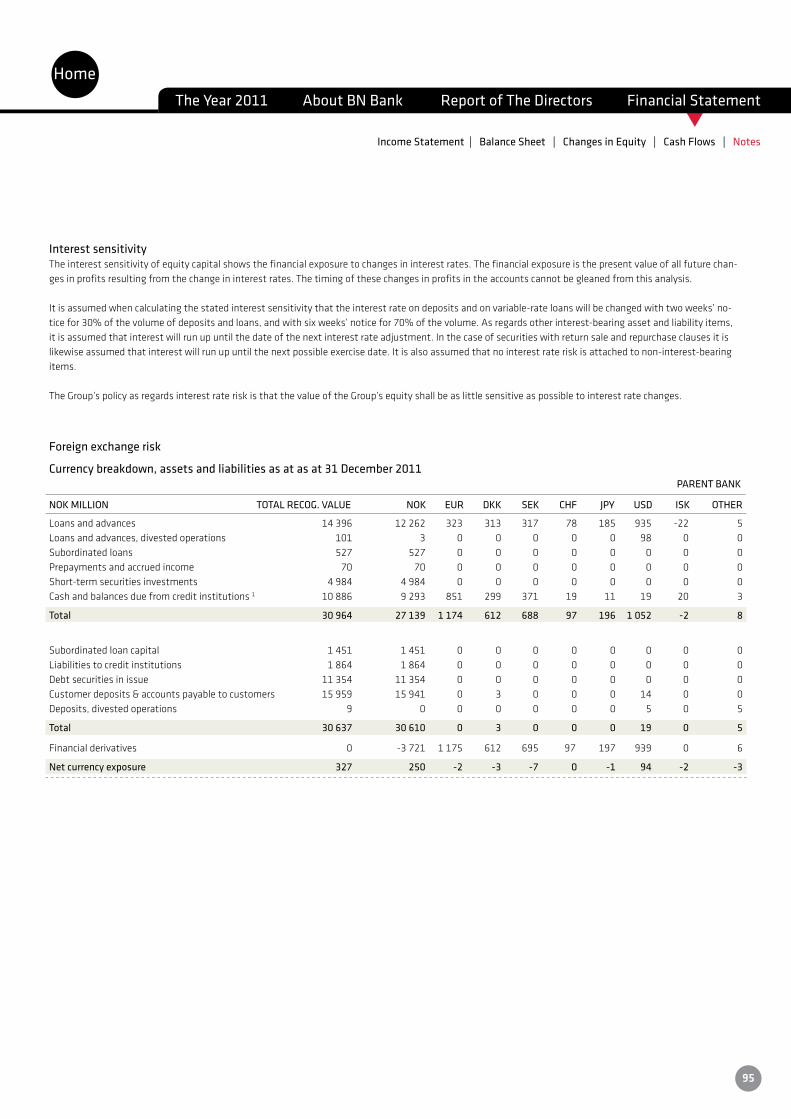
t
Interest sensitivityThe interest sensitivity of equity capital shows the financial exposure to changes in interest rates. The financial exposure is the present value of all future chan-ges in profits resulting from the change in interest rates. The timing of these changes in profits in the accounts cannot be gleaned from this analysis.
Itisassumedwhencalculatingthestatedinterestsensitivitythattheinterestrateondepositsandonvariable-rateloanswillbechangedwithtwoweeks’no-ticefor30%ofthevolumeofdepositsandloans,andwithsixweeks’noticefor70%ofthevolume.Asregardsotherinterest-bearingassetandliabilityitems,it is assumed that interest will run up until the date of the next interest rate adjustment. In the case of securities with return sale and repurchase clauses it is likewise assumed that interest will run up until the next possible exercise date. It is also assumed that no interest rate risk is attached to non-interest-bearing items. TheGroup’spolicyasregardsinterestrateriskisthatthevalueoftheGroup’sequityshallbeaslittlesensitiveaspossibletointerestratechanges.
Foreign exchange risk
Currency breakdown, assets and liabilities as at as at 31 December 2011 PARENT BANK
NOK MILLION TOTAL RECOG. VALUE NOK EUR DKK SEK CHF JPY USD ISK OTHER
Loansandadvances 14 396 12 262 323 313 317 78 185 935 -22 5Loans and advances, divested operations 101 3 0 0 0 0 0 98 0 0Subordinated loans 527 527 0 0 0 0 0 0 0 0Prepayments and accrued income 70 70 0 0 0 0 0 0 0 0Short-termsecuritiesinvestments 4 984 4 984 0 0 0 0 0 0 0 0Cash and balances due from credit institutions 1 10 886 9 293 851 299 371 19 11 19 20 3
Total 30 964 27 139 1 174 612 688 97 196 1 052 -2 8
Subordinatedloancapital 1 451 1 451 0 0 0 0 0 0 0 0Liabilitiestocreditinstitutions 1 864 1 864 0 0 0 0 0 0 0 0Debtsecuritiesinissue 11 354 11 354 0 0 0 0 0 0 0 0Customerdeposits&accountspayabletocustomers 15 959 15 941 0 3 0 0 0 14 0 0Deposits, divested operations 9 0 0 0 0 0 0 5 0 5
Total 30 637 30 610 0 3 0 0 0 19 0 5
Financialderivatives 0 -3 721 1 175 612 695 97 197 939 0 6
Net currency exposure 327 250 -2 -3 -7 0 -1 94 -2 -3
HomeThe Year 2011 About BN Bank Report of The Directors Financial Statement
Income Statement | Balance Sheet | Changes in Equity | Cash Flows | Notes
95

t
Currency breakdown, assets and liabilities as at 31 December 2010 PARENT BANK
NOK MILLION TOTAL RECOG. VALUE NOK EUR DKK SEK CHF JPY USD ISK OTHER
Loansandadvances 14 702 12 351 426 322 326 77 175 1 023 -23 24Loans and advances, divested operations 665 348 0 5 0 0 0 312 0 0Subordinated loans 542 542 0 0 0 0 0 0 0 0Prepayments and accrued income 148 148 0 0 0 0 0 0 0 0Short-termsecuritiesinvestments 5 274 5 274 0 0 0 0 0 0 0 0Cash and balances due from credit institutions 1 7 504 5 534 904 330 625 15 20 51 20 5
Total 28 835 24 198 1 330 656 951 93 195 1 386 -2 29
Subordinatedloancapital 1 686 1 686 0 0 0 0 0 0 0 0Liabilitiestocreditinstitutions 2 451 2 451 0 0 0 0 0 0 0 0Debtsecuritiesinissue 7 702 7 702 0 0 0 0 0 0 0 0Customerdeposits&accountspayabletocustomers 16 395 16 369 2 7 2 0 0 14 0 1Deposits, divested operations 432 310 37 0 0 0 0 65 0 20
Total 28 666 28 519 38 7 2 0 0 79 0 20
Financialderivatives -97 -4 587 1 292 655 954 94 196 1 311 0 -11
Net currency exposure 267 265 0 -6 -5 -1 0 -4 -2 20
1 Foreign exchange risk is identified and managed at group level. There is an internal agreement between BN Bank and BNkreditt that adjusts any gap between the companies.
Sensitivity analysis for change in market prices - partial analysis PARENT BANK
NOK MILLION 2011 2010
EFFECT EFFECT EFFECT EFFECT P & L EQUITY P & L EQUITY
Interest+/-1percentagepoint -9 0 -7 0Exchangetates+/-10%1 0 0 0 0
1 Calculated on the absolute position as at 31 December 2011.
Sensitivity analysis - Description of model and assumptions Exposure to market risk is measured here by means of partial analyses, where we look one by one at the variations in market variables and their effect in P&L and equity.
Where financial instruments are carried at fair value, measurements are made using alternative assumptions, and effects on fair value as a result of changed assumptionsarereportedasaneffectinP&Landequityrespectively,dependingonwhethertheinstrument’sfairvaluechangesareotherwisetobetreatedby carrying them in P&L or in equity. In the case of fixed-rate instruments measured at amortised cost, changes in interest rates will not give rise to changes in either P&L or equity. For interest-bearing securities with variable interest rates, the effect in P&L is calculated as though alternative interest rates had been used through the year on the loan principals that are represented in the balance sheet at the end of the reporting period.
Intervalsforchangesinmarketvariablesaresetsothatthedeterminedintervalwillwithreasonablyhighprobabilitycoverthemarketvariable’sactualoutcomewithin the coming year, having regard for the average term of the instruments concerned that are included in the analysis.
Partial analysis is carried out for the market variables whose variation is significant for P&L and equity. The sensitivity analysis is thus not exhaustive in relation to the total number of market variables that affect the recognition of financial instruments.
All effects in P&L and equity are presented net after tax.
HomeThe Year 2011 About BN Bank Report of The Directors Financial Statement
Income Statement | Balance Sheet | Changes in Equity | Cash Flows | Notes
96
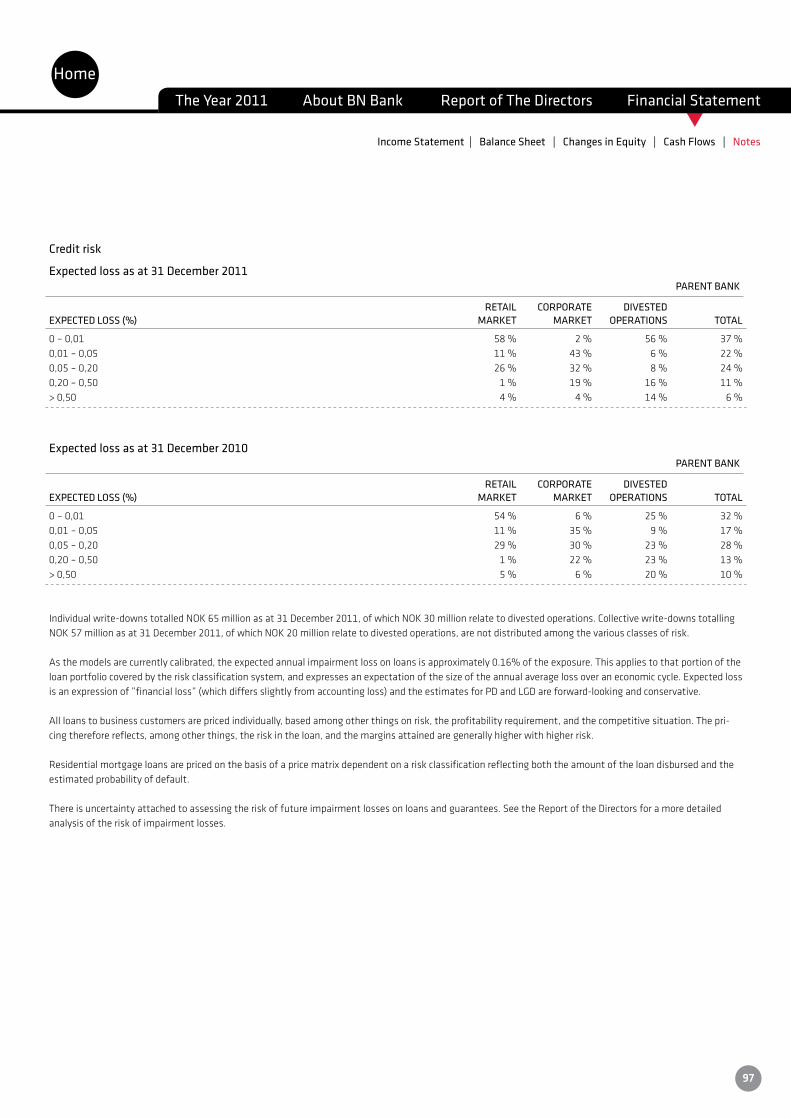
t
Credit risk
Expected loss as at 31 December 2011 PARENT BANK
RETAIL CORPORATE DIVESTEDEXPECTED LOSS (%) MARKET MARKET OPERATIONS TOTAL
0 – 0,01 58 % 2 % 56 % 37 %0,01 – 0,05 11 % 43 % 6 % 22 %0,05 – 0,20 26 % 32 % 8 % 24 %0,20 – 0,50 1 % 19 % 16 % 11 %> 0,50 4 % 4 % 14 % 6 %
Expected loss as at 31 December 2010 PARENT BANK
RETAIL CORPORATE DIVESTEDEXPECTED LOSS (%) MARKET MARKET OPERATIONS TOTAL
0 – 0,01 54 % 6 % 25 % 32 %0,01 – 0,05 11 % 35 % 9 % 17 %0,05 – 0,20 29 % 30 % 23 % 28 %0,20 – 0,50 1 % 22 % 23 % 13 %> 0,50 5 % 6 % 20 % 10 %
Individualwrite-downstotalledNOK65millionasat31December2011,ofwhichNOK30millionrelatetodivestedoperations.Collectivewrite-downstotallingNOK57millionasat31December2011,ofwhichNOK20millionrelatetodivestedoperations,arenotdistributedamongthevariousclassesofrisk.
As the models are currently calibrated, the expected annual impairment loss on loans is approximately 0.16% of the exposure. This applies to that portion of the loan portfolio covered by the risk classification system, and expresses an expectation of the size of the annual average loss over an economic cycle. Expected loss isanexpressionof”financialloss”(whichdiffersslightlyfromaccountingloss)andtheestimatesforPDandLGDareforward-lookingandconservative.
All loans to business customers are priced individually, based among other things on risk, the profitability requirement, and the competitive situation. The pri-cing therefore reflects, among other things, the risk in the loan, and the margins attained are generally higher with higher risk.
Residential mortgage loans are priced on the basis of a price matrix dependent on a risk classification reflecting both the amount of the loan disbursed and the estimated probability of default.
There is uncertainty attached to assessing the risk of future impairment losses on loans and guarantees. See the Report of the Directors for a more detailed analysis of the risk of impairment losses.
HomeThe Year 2011 About BN Bank Report of The Directors Financial Statement
Income Statement | Balance Sheet | Changes in Equity | Cash Flows | Notes
97
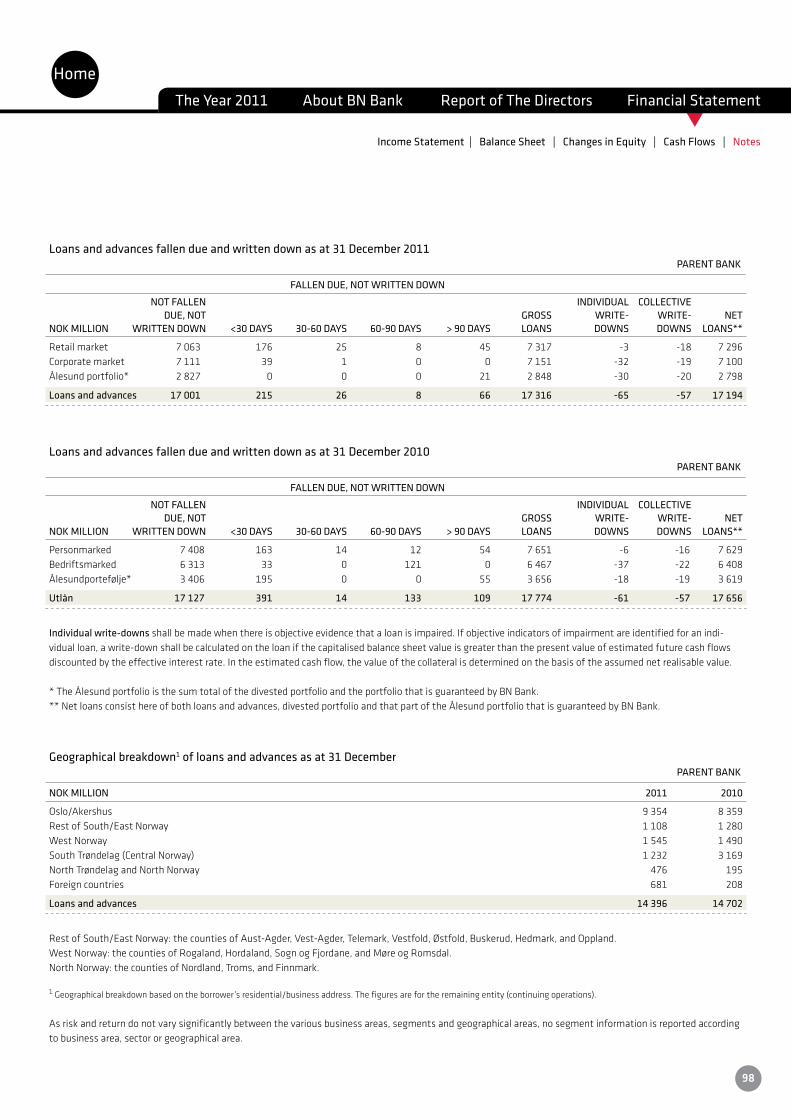
t
Loans and advances fallen due and written down as at 31 December 2011 PARENT BANK
FALLEN DUE, NOT WRITTEN DOWN
NOT FALLEN INDIVIDUAL COLLECTIVE DUE, NOT GROSS WRITE- WRITE- NETNOK MILLION WRITTEN DOWN <30 DAYS 30-60 DAYS 60-90 DAYS > 90 DAYS LOANS DOWNS DOWNS LOANS**
Retailmarket 7 063 176 25 8 45 7 317 -3 -18 7 296Corporatemarket 7 111 39 1 0 0 7 151 -32 -19 7 100Ålesundportfolio* 2 827 0 0 0 21 2 848 -30 -20 2 798
Loans and advances 17 001 215 26 8 66 17 316 -65 -57 17 194
Loans and advances fallen due and written down as at 31 December 2010 PARENT BANK
FALLEN DUE, NOT WRITTEN DOWN
NOT FALLEN INDIVIDUAL COLLECTIVE DUE, NOT GROSS WRITE- WRITE- NETNOK MILLION WRITTEN DOWN <30 DAYS 30-60 DAYS 60-90 DAYS > 90 DAYS LOANS DOWNS DOWNS LOANS**
Personmarked 7 408 163 14 12 54 7 651 -6 -16 7 629Bedriftsmarked 6 313 33 0 121 0 6 467 -37 -22 6 408Ålesundportefølje* 3 406 195 0 0 55 3 656 -18 -19 3 619
Utlån 17 127 391 14 133 109 17 774 -61 -57 17 656
Individual write-downs shall be made when there is objective evidence that a loan is impaired. If objective indicators of impairment are identified for an indi-vidual loan, a write-down shall be calculated on the loan if the capitalised balance sheet value is greater than the present value of estimated future cash flows discounted by the effective interest rate. In the estimated cash flow, the value of the collateral is determined on the basis of the assumed net realisable value.
* The Ålesund portfolio is the sum total of the divested portfolio and the portfolio that is guaranteed by BN Bank.** Net loans consist here of both loans and advances, divested portfolio and that part of the Ålesund portfolio that is guaranteed by BN Bank.
Geographical breakdown1 of loans and advances as at 31 December PARENT BANK
NOK MILLION 2011 2010
Oslo/Akershus 9 354 8 359RestofSouth/EastNorway 1 108 1 280WestNorway 1 545 1 490SouthTrøndelag(CentralNorway) 1 232 3 169North Trøndelag and North Norway 476 195Foreign countries 681 208
Loans and advances 14 396 14 702
RestofSouth/EastNorway:thecountiesofAust-Agder,Vest-Agder,Telemark,Vestfold,Østfold,Buskerud,Hedmark,andOppland.WestNorway:thecountiesofRogaland,Hordaland,SognogFjordane,andMøreogRomsdal.NorthNorway:thecountiesofNordland,Troms,andFinnmark.
1Geographicalbreakdownbasedontheborrower’sresidential/businessaddress.Thefiguresarefortheremainingentity(continuingoperations).
As risk and return do not vary significantly between the various business areas, segments and geographical areas, no segment information is reported according to business area, sector or geographical area.
HomeThe Year 2011 About BN Bank Report of The Directors Financial Statement
Income Statement | Balance Sheet | Changes in Equity | Cash Flows | Notes
98
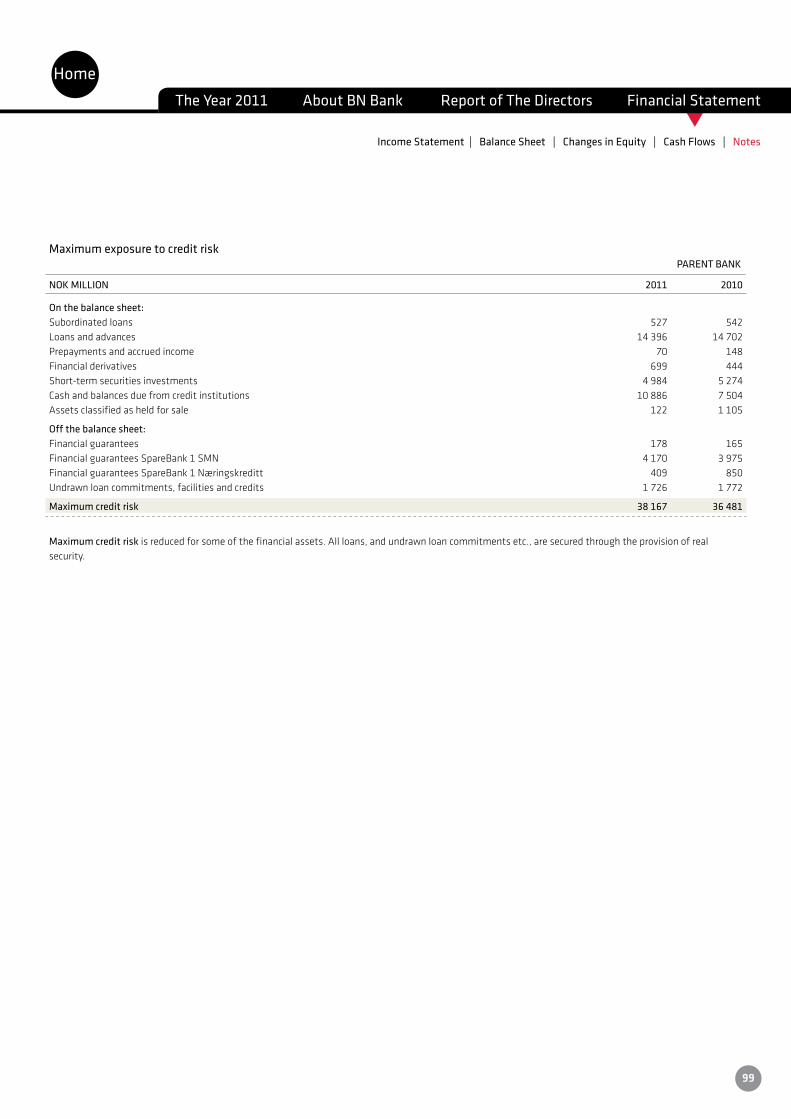
t
Maximum exposure to credit risk PARENT BANK
NOK MILLION 2011 2010
On the balance sheet:Subordinated loans 527 542Loansandadvances 14 396 14 702Prepayments and accrued income 70 148Financial derivatives 699 444Short-termsecuritiesinvestments 4 984 5 274Cashandbalancesduefromcreditinstitutions 10 886 7 504Assetsclassifiedasheldforsale 122 1 105
Off the balance sheet: Financial guarantees 178 165FinancialguaranteesSpareBank1SMN 4 170 3 975FinancialguaranteesSpareBank1Næringskreditt 409 850Undrawnloancommitments,facilitiesandcredits 1 726 1 772
Maximum credit risk 38 167 36 481
Maximum credit risk is reduced for some of the financial assets. All loans, and undrawn loan commitments etc., are secured through the provision of real security.
HomeThe Year 2011 About BN Bank Report of The Directors Financial Statement
Income Statement | Balance Sheet | Changes in Equity | Cash Flows | Notes
99
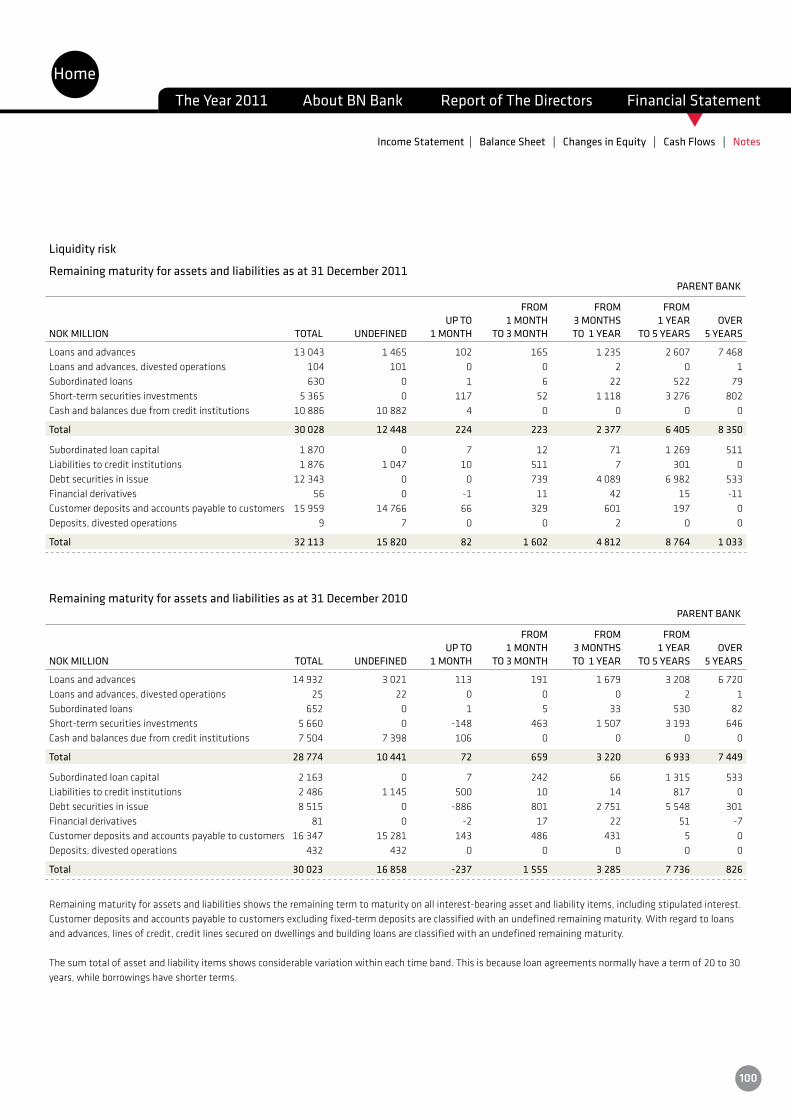
t
Liquidity risk
Remaining maturity for assets and liabilities as at 31 December 2011 PARENT BANK
FROM FROM FROM UP TO 1 MONTH 3 MONTHS 1 YEAR OVERNOK MILLION TOTAL UNDEFINED 1 MONTH TO 3 MONTH TO 1 YEAR TO 5 YEARS 5 YEARS
Loansandadvances 13 043 1 465 102 165 1 235 2 607 7 468Loans and advances, divested operations 104 101 0 0 2 0 1Subordinated loans 630 0 1 6 22 522 79Short-term securities investments 5 365 0 117 52 1 118 3 276 802Cashandbalancesduefromcreditinstitutions 10 886 10 882 4 0 0 0 0
Total 30 028 12 448 224 223 2 377 6 405 8 350
Subordinatedloancapital 1 870 0 7 12 71 1 269 511Liabilitiestocreditinstitutions 1 876 1 047 10 511 7 301 0Debtsecuritiesinissue 12 343 0 0 739 4 089 6 982 533Financial derivatives 56 0 -1 11 42 15 -11Customerdepositsandaccountspayabletocustomers 15 959 14 766 66 329 601 197 0Deposits, divested operations 9 7 0 0 2 0 0
Total 32 113 15 820 82 1 602 4 812 8 764 1 033
Remaining maturity for assets and liabilities as at 31 December 2010 PARENT BANK
FROM FROM FROM UP TO 1 MONTH 3 MONTHS 1 YEAR OVERNOK MILLION TOTAL UNDEFINED 1 MONTH TO 3 MONTH TO 1 YEAR TO 5 YEARS 5 YEARS
Loansandadvances 14 932 3 021 113 191 1 679 3 208 6 720Loans and advances, divested operations 25 22 0 0 0 2 1Subordinated loans 652 0 1 5 33 530 82Short-termsecuritiesinvestments 5 660 0 -148 463 1 507 3 193 646Cashandbalancesduefromcreditinstitutions 7 504 7 398 106 0 0 0 0
Total 28 774 10 441 72 659 3 220 6 933 7 449
Subordinatedloancapital 2 163 0 7 242 66 1 315 533Liabilitiestocreditinstitutions 2 486 1 145 500 10 14 817 0Debtsecuritiesinissue 8 515 0 -886 801 2 751 5 548 301Financial derivatives 81 0 -2 17 22 51 -7Customerdepositsandaccountspayabletocustomers 16 347 15 281 143 486 431 5 0Deposits, divested operations 432 432 0 0 0 0 0
Total 30 023 16 858 -237 1 555 3 285 7 736 826
Remaining maturity for assets and liabilities shows the remaining term to maturity on all interest-bearing asset and liability items, including stipulated interest. Customer deposits and accounts payable to customers excluding fixed-term deposits are classified with an undefined remaining maturity. With regard to loans and advances, lines of credit, credit lines secured on dwellings and building loans are classified with an undefined remaining maturity.
The sum total of asset and liability items shows considerable variation within each time band. This is because loan agreements normally have a term of 20 to 30 years, while borrowings have shorter terms.
HomeThe Year 2011 About BN Bank Report of The Directors Financial Statement
Income Statement | Balance Sheet | Changes in Equity | Cash Flows | Notes
100
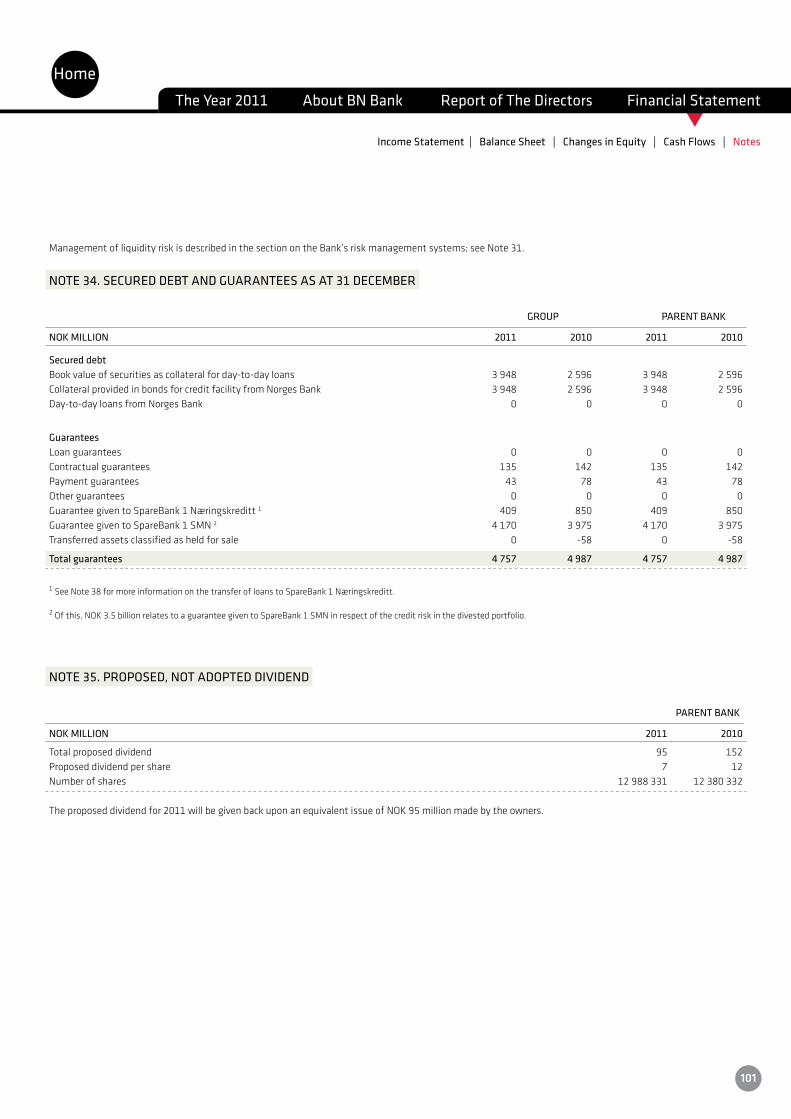
t
ManagementofliquidityriskisdescribedinthesectionontheBank’sriskmanagementsystems;seeNote31.
NOTE 34. SECURED DEBT AND GUARANTEES AS AT 31 DECEMBER
GROUP PARENT BANK
NOK MILLION 2011 2010 2011 2010
Secured debtBookvalueofsecuritiesascollateralforday-to-dayloans 3 948 2 596 3 948 2 596CollateralprovidedinbondsforcreditfacilityfromNorgesBank 3 948 2 596 3 948 2 596Day-to-day loans from Norges Bank 0 0 0 0
GuaranteesLoan guarantees 0 0 0 0Contractual guarantees 135 142 135 142Payment guarantees 43 78 43 78Other guarantees 0 0 0 0GuaranteegiventoSpareBank1Næringskreditt1 409 850 409 850GuaranteegiventoSpareBank1SMN2 4 170 3 975 4 170 3 975Transferred assets classified as held for sale 0 -58 0 -58
Total guarantees 4 757 4 987 4 757 4 987
1SeeNote38formoreinformationonthetransferofloanstoSpareBank1Næringskreditt.
2Ofthis,NOK3.5billionrelatestoaguaranteegiventoSpareBank1SMNinrespectofthecreditriskinthedivestedportfolio.
NOTE 35. PROPOSED, NOT ADOPTED DIVIDEND
PARENT BANK
NOK MILLION 2011 2010
Total proposed dividend 95 152Proposed dividend per share 7 12Numberofshares 12 988331 12 380 332
Theproposeddividendfor2011willbegivenbackuponanequivalentissueofNOK95millionmadebytheowners.
HomeThe Year 2011 About BN Bank Report of The Directors Financial Statement
Income Statement | Balance Sheet | Changes in Equity | Cash Flows | Notes
101

t
NOTE 36. EVENTS AFTER THE REPORTING PERIOD
Contingent liabilities
Sale of structured productsBN Bank was sued in a group action over structured savings products in 2008. The Supreme Court ruled in February 2010 that group litigation is not appropriate for assessing this type of product. The group action against BN Bank has thus been brought to a conclusion.
ThreecustomersthensuedtheBankindividuallyintheDistrictCourt,buttheCourt’sdecisionof8July2011wentagainstthem.ThedecisionwasappealedtotheBorgartingCourtofAppeal,andtheappealwillbeheardinMarch2013.Thetotalloancommitmentinvolvedasat31December2011wasNOK4million. BN Bank has also provided loans to finance Artemis structured products. BN Bank is now being sued by seven customers, three of whom are limited companies, withthetotalloanfinancingontheseproductsamountingtoNOK126million.Theamountsindisputeareinterestpayments. In connection with the sale and/or issue of the structured products, BN Bank has hedged exposure in the form of equity options, equity-linked options and inte-rest rate swap agreements. The turbulence in the financial markets in 2008 caused the loss of some contractual counterparties, and it has not been possible to replace all these hedging transactions. The liquidator of one of the contractual counterparties filed a counter-claim in 2011, which BN Bank disputes. The out-comeisunclear,andlitigationisunderway.ThetotalclaimamountstoNOK12million.
Bankruptcy dividend/offset against Glitnir banki hf, IcelandBNBankhasfiledaclaimforNOK225millionagainsttheassetsinliquidationofGlitnirbankihf,Iceland.Thebankruptcydividendisstillunclarifiedand,oftheNOK225millionclaim,NOK205millionwaswrittendowninBNBank’saccountsin2008.
BNBankhasoffsettheclaim,butGlitnir’swinding-upboardhascontesteditandissuingBNBankfortheoffset.Thewinding-upboardisalsoclaimingNOK12million in interest.
Thecourtcasewasongoinginfourth-quarter2011andjudgmentwaspronouncedattheendofJanuary2012.Itiscurrentlyuncertainastowhetherthejudg-ment will be appealed. The present judgment will not have any significant accounting effect for the Bank.
Events after the reporting periodBNBankputupaguaranteeinrespectofthedivestedÅlesundportfoliotoSpareBank1SMNforaboutNOK3.1billion.NOK2.4billionofthisguaranteehasnowbeensettledtowardsSpareBank1SMNwitheffectfrom1February2012.FortheremainingportfolioofNOK0.7billion,BNBankisguaranteeing60%ofthe credit risk.
The portfolio takeover will have no accounting effect for BN Bank in 2012. The parties have also agreed to work towards a full takeover or termination of the remaining portfolio within the agreement period of three years.
Contingent outcomes, events after the reporting periodApart from the matters mentioned in the note above, there are no assets or liabilities to which contingent outcomes are attached and where those outcomes couldhaveasignificantimpactontheGroup’sfinancialpositionandresults.Therewerenosignificanteventsafterthereportingperiod.
HomeThe Year 2011 About BN Bank Report of The Directors Financial Statement
Income Statement | Balance Sheet | Changes in Equity | Cash Flows | Notes
102
t
NOTE 37. TRANSFER OF LOANS TO SPAREBANK 1 NÆRINGSKREDITT AND SPAREBANK 1 BOLIGKREDITT
Transfer of loans to SpareBank 1 NæringskredittSpareBank1NæringskredittASwasestablishedin2009andgrantedalicencebytheFinancialSupervisoryAuthorityofNorwaytooperateasacreditinstitu-tion.Thecompany’sbondshaveanAa3ratingfromMoody’s.ThecompanyisownedbythesavingsbanksthatformtheSpareBank1consortiumandisco-locatedwithSpareBank1BoligkredittASinStavanger.ThesamebanksownSpareBank1NæringskredittasownBNBank.Thepurposeofthecompanyistosecureforthebankswithintheconsortiumasourceofstable,long-termfinancingofcommercialrealestateatcompetitiverates.SpareBank1Næringskredittprocures loans with mortgages on commercial properties and issues covered bonds within the regulations governing such bonds established in 2007. As part of theconsortium,BNBankmaytransferloanstothecompanyand,aspartoftheBank’sfundingstrategy,loanshavebeentransferredfromBNkreditt.AttheendofDecember2011,thebookvalueoftransferredloanswasNOK8.3billion.BNBankisresponsibleformanagingthetransferredloansandBNkredittreceivesacommission based on the net return on the loans transferred by the Bank and the costs to the company.
In order to attend to the interests of existing bond holders, in connection with the transfer BN Bank guaranteed that BNkreditt will have a capital adequacy ratio of at least 20 per cent at all times. Should the capital adequacy ratio fall below 20%, the Parent Bank will cede precedence with respect to its accounts receivable withBNkredittand/orprovideaguarantee.Asat31December2011,BNkreditt’scapitaladequacyratiowas17.7%.TheamounttheParentBankiscedingpre-cedenceforwasNOK407millionasat31December2011. BNBankhasputupguaranteesforthetransferredloancommitmentstotheextenttheyexceed25percentofSpareBank1Næringskreditt’scapitalbase.Asat31December2011,theseguaranteestotalledNOK409million.
Transfer of loans to SpareBank 1 BoligkredittSpareBank1BoligkredittisownedbythesavingsbanksthatformtheSpareBank1consortiumandisco-locatedwithSpareBank1NæringskredittASinSta-vanger. The purpose of the company is to secure for the banks within the consortium a source of stable, long-term financing of residential mortgage loans at competitiverates.Thecompany’sbond’shavearatingofAaaandAAAfromMoody’sandfromFitchrespectively.SpareBank1Boligkredittprocuresloanswithmortgages on residential properties and issues covered bonds within the regulations governing such bonds established in 2007. As part of the consortium, BN Bankmaytransferloanstothecompanyand,aspartoftheBank’sfundingstrategy,loansweretransferredfromBNBoligkredittin2010and2011.AttheendofDecember2011,thebookvalueoftransferredloanswasNOK4billion.BNBankisresponsibleformanagingthetransferredloansandreceivesacommissionbased on the net return on the loans transferred by the Bank and the costs to the company.
HomeThe Year 2011 About BN Bank Report of The Directors Financial Statement
Income Statement | Balance Sheet | Changes in Equity | Cash Flows | Notes
103
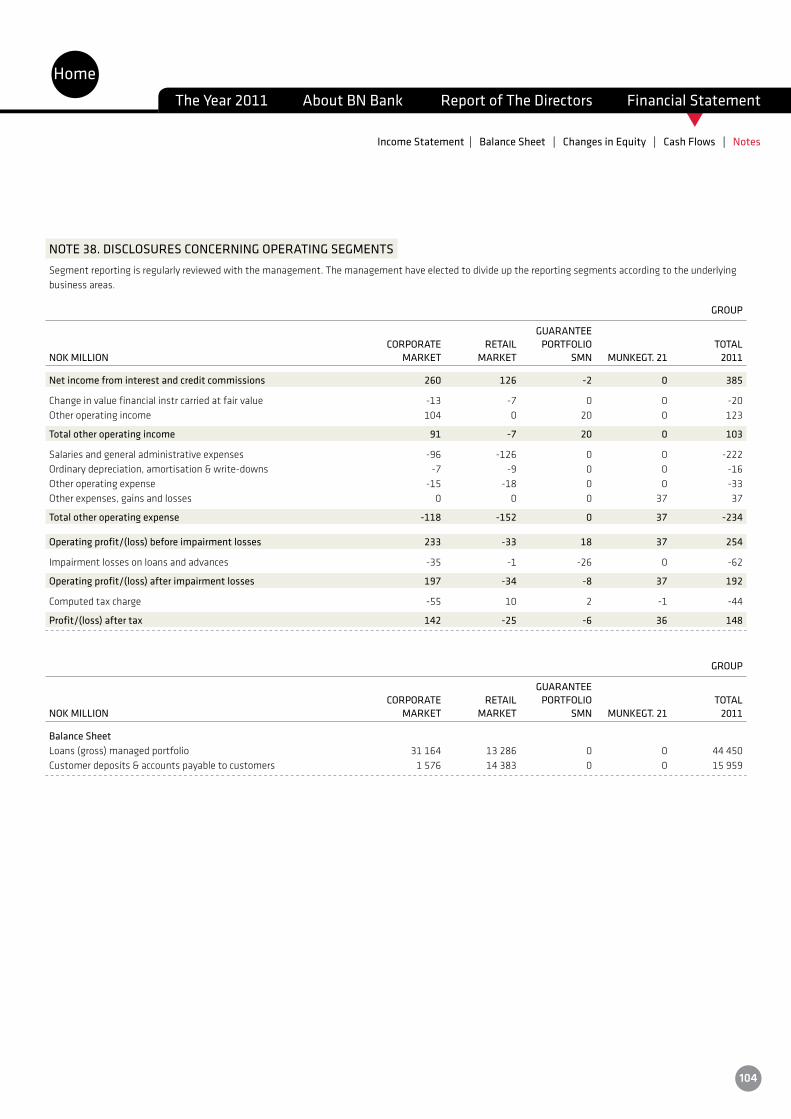
t
NOTE 38. DISCLOSURES CONCERNING OPERATING SEGMENTSSegment reporting is regularly reviewed with the management. The management have elected to divide up the reporting segments according to the underlying business areas.
GROUP
GUARANTEE CORPORATE RETAIL PORTFOLIO TOTALNOK MILLION MARKET MARKET SMN MUNKEGT. 21 2011
Net income from interest and credit commissions 260 126 -2 0 385
Change in value financial instr carried at fair value -13 -7 0 0 -20Other operating income 104 0 20 0 123
Total other operating income 91 -7 20 0 103
Salaries and general administrative expenses -96 -126 0 0 -222Ordinary depreciation, amortisation & write-downs -7 -9 0 0 -16Other operating expense -15 -18 0 0 -33Other expenses, gains and losses 0 0 0 37 37
Total other operating expense -118 -152 0 37 -234
Operating profit/(loss) before impairment losses 233 -33 18 37 254
Impairment losses on loans and advances -35 -1 -26 0 -62
Operating profit/(loss) after impairment losses 197 -34 -8 37 192
Computed tax charge -55 10 2 -1 -44
Profit/(loss) after tax 142 -25 -6 36 148
GROUP
GUARANTEE CORPORATE RETAIL PORTFOLIO TOTALNOK MILLION MARKET MARKET SMN MUNKEGT. 21 2011
Balance Sheet Loans(gross)managedportfolio 31 164 13 286 0 0 44 450Customerdeposits&accountspayabletocustomers 1 576 14 383 0 0 15 959
HomeThe Year 2011 About BN Bank Report of The Directors Financial Statement
Income Statement | Balance Sheet | Changes in Equity | Cash Flows | Notes
104
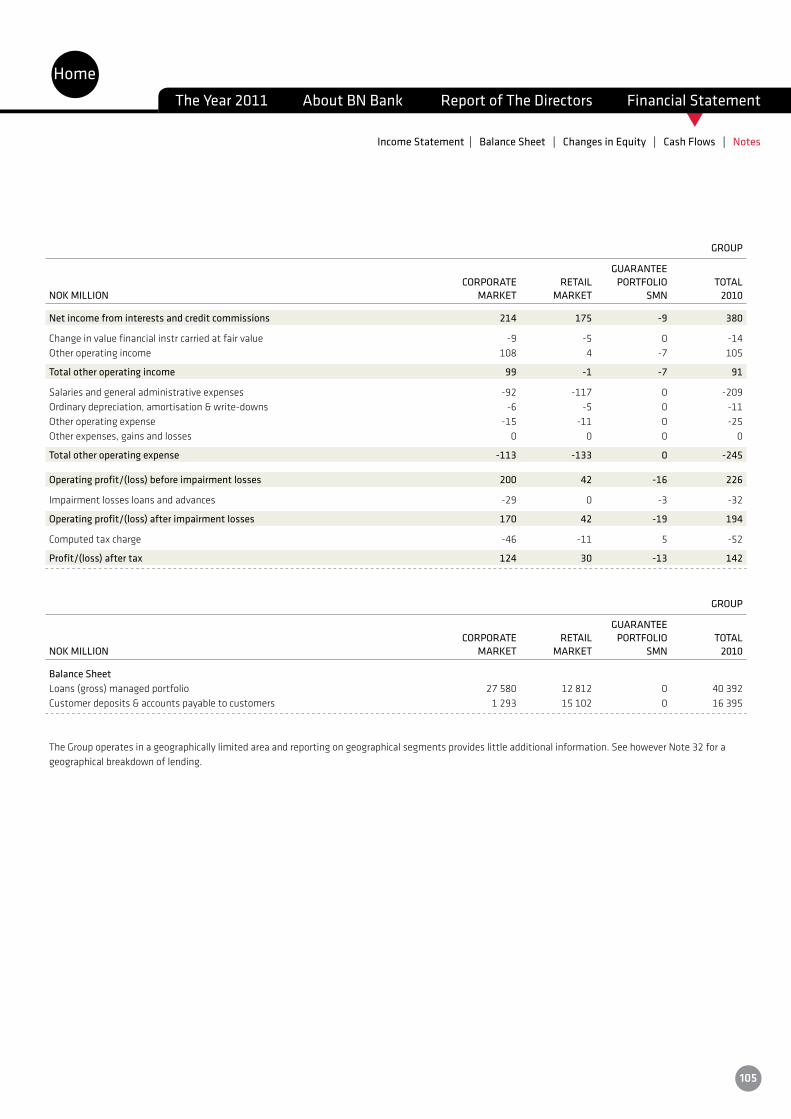
t
GROUP
GUARANTEE CORPORATE RETAIL PORTFOLIO TOTALNOK MILLION MARKET MARKET SMN 2010
Net income from interests and credit commissions 214 175 -9 380
Change in value financial instr carried at fair value -9 -5 0 -14Other operating income 108 4 -7 105
Total other operating income 99 -1 -7 91
Salaries and general administrative expenses -92 -117 0 -209Ordinary depreciation, amortisation & write-downs -6 -5 0 -11Other operating expense -15 -11 0 -25Other expenses, gains and losses 0 0 0 0
Total other operating expense -113 -133 0 -245
Operating profit/(loss) before impairment losses 200 42 -16 226
Impairment losses loans and advances -29 0 -3 -32
Operating profit/(loss) after impairment losses 170 42 -19 194
Computed tax charge -46 -11 5 -52
Profit/(loss) after tax 124 30 -13 142
GROUP
GUARANTEE CORPORATE RETAIL PORTFOLIO TOTALNOK MILLION MARKET MARKET SMN 2010
Balance Sheet Loans(gross)managedportfolio 27580 12812 0 40 392Customerdeposits&accountspayabletocustomers 1293 15102 0 16 395
TheGroupoperatesinageographicallylimitedareaandreportingongeographicalsegmentsprovideslittleadditionalinformation.SeehoweverNote32forageographical breakdown of lending.
HomeThe Year 2011 About BN Bank Report of The Directors Financial Statement
Income Statement | Balance Sheet | Changes in Equity | Cash Flows | Notes
105
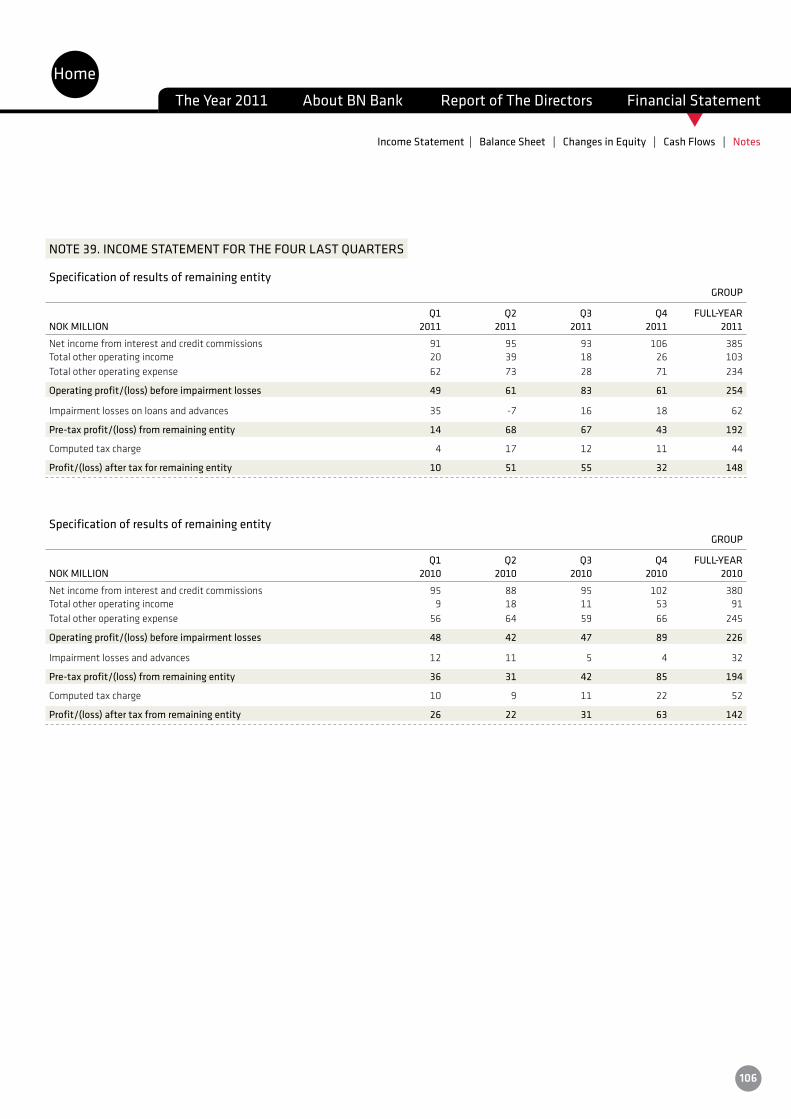
t
NOTE 39. INCOME STATEMENT FOR THE FOUR LAST QUARTERS
Specification of results of remaining entity GROUP
Q1 Q2 Q3 Q4 FULL-YEARNOK MILLION 2011 2011 2011 2011 2011
Net income from interest and credit commissions 91 95 93 106 385Total other operating income 20 39 18 26 103Total other operating expense 62 73 28 71 234
Operating profit/(loss) before impairment losses 49 61 83 61 254
Impairment losses on loans and advances 35 -7 16 18 62
Pre-tax profit/(loss) from remaining entity 14 68 67 43 192
Computed tax charge 4 17 12 11 44
Profit/(loss) after tax for remaining entity 10 51 55 32 148
Specification of results of remaining entity GROUP
Q1 Q2 Q3 Q4 FULL-YEARNOK MILLION 2010 2010 2010 2010 2010
Net income from interest and credit commissions 95 88 95 102 380Total other operating income 9 18 11 53 91Total other operating expense 56 64 59 66 245
Operating profit/(loss) before impairment losses 48 42 47 89 226
Impairment losses and advances 12 11 5 4 32
Pre-tax profit/(loss) from remaining entity 36 31 42 85 194
Computed tax charge 10 9 11 22 52
Profit/(loss) after tax from remaining entity 26 22 31 63 142
HomeThe Year 2011 About BN Bank Report of The Directors Financial Statement
Income Statement | Balance Sheet | Changes in Equity | Cash Flows | Notes
106

t
NOTE 40. ELECTED OFFICERS AND GROUP EXECUTIVE MANAGEMENT
TheshareholdersexercisethehighestauthorityintheBNBankGroupthroughtheGeneralMeeting.Ofthe15membersoftheSupervisoryBoard,11areelectedbytheshareholders,whilefourareelectedbyandfromamongtheemployeesoftheBNBankGroup.TheGeneralMeetingalsoelectstheControlCommittee.The Supervisory Board appoints the external auditor and the Board of Directors. BN Bank, BNkreditt and BN Boligkreditt have had an identical Supervisory Board and Control Committee since 13 March 2009. All the companies have the same auditor.
Supervisory BoardMEMBERS OCCUPATION/RESIDENCE
Elected by and from among the shareholders
Members at 31 December 2011Tore Haarberg SpareBank 1 SMNGroTveit SpareBank1SR-BankStig Horsberg Eriksen SpareBank 1 SR-BankElisabeth Utheim SpareBank 1 Nord-NorgeBjørn Reidar Engaas Nøtterøy SparebankOdd Einar Folland SpareBank 1 NordvestUnni Pedersen SpareBank 1 Nord-NorgeTruls Lindberg SpareBank 1 Nord-NorgeKjerstiHønstad SpareBank1SMNVegard Helland SpareBank 1 SMNArne Nypan SpareBank 1 SMN
Deputy members:Anne Beth Høivik SpareBank 1 SR-BankRolf Einar Hermansen SamSparMerete Hauge SpareBank 1 Nord-NorgeIngeGrøntvedt SpareBank1SMNEvy Heia SpareBank 1 SMNAtleHåvarsteinNilsen SpareBank1SR-Bank
Elected by and from among the employeesOve Rinnan BN Bank, TrondheimHaraldKierulf BNBank,TrondheimBeritGranan BNBank,OsloEllen-MeretheGarnes BNBank,Trondheim
Deputy membersLise Faksnes BN Bank, Trondheim JørnAleksandersen BNBank,Oslo
None of the members of the Supervisory Board owns shares in BN Bank.
HomeThe Year 2011 About BN Bank Report of The Directors Financial Statement
Income Statement | Balance Sheet | Changes in Equity | Cash Flows | Notes
107
Control CommitteeMEMBERS OCCUPATION/RESIDENCE
Former members in 2011DagNafstad CourtofAppealJudge,HålogalandCourtofAppeal,Tromsø
Members at 31 December 2011 KnutRo Lawyerandpartner,RoSommersadvokatfirma,OsloRolfRøkke HeadofTrondheimMunicipalTreasurer’sOffice,TrondheimOddBroshaug TaxAuthority,HåvikRigmor Abel HR Director and Environmental Director, Norwegian Seafood Export Council, Tromsø
Attending deputy memberIvarListerud RyggeVålerSpareBank
Election CommitteeMEMBERS OCCUPATION/RESIDENCE
Members at 31 December 2011KjellFordal ExecutiveVice-PresidentFinance,SpareBank1SMNHansOlavKarde ManagingDirector,SpareBank1SNNTore Haarberg Executive Vice-President Retail Market and Deputy Managing Director, SpareBank 1 SMNGroTveit ChiefFinancialOfficer,SpareBank1SR-BankTom Skundberg 1 Assistant Director Corporate Market, BN Bank ASA
1 OneelectioncommitteeiselectedbytheSupervisoryBoardandonebytheAnnualGeneralMeeting.Thecommitteesareidenticalwiththeexceptionoftheemployeerepresentative,who only sits on the committee elected by the Supervisory Board.
None of the members of the Control Committee or Election Committees owns shares in BN Bank.
External Auditor NUMBER OF SHARES
PricewaterhouseCoopersAS,inthepersonofRuneKennethS.Lædre,StateAuthorisedPublicAccountant 0
HomeThe Year 2011 About BN Bank Report of The Directors Financial Statement
Income Statement | Balance Sheet | Changes in Equity | Cash Flows | Notes
108
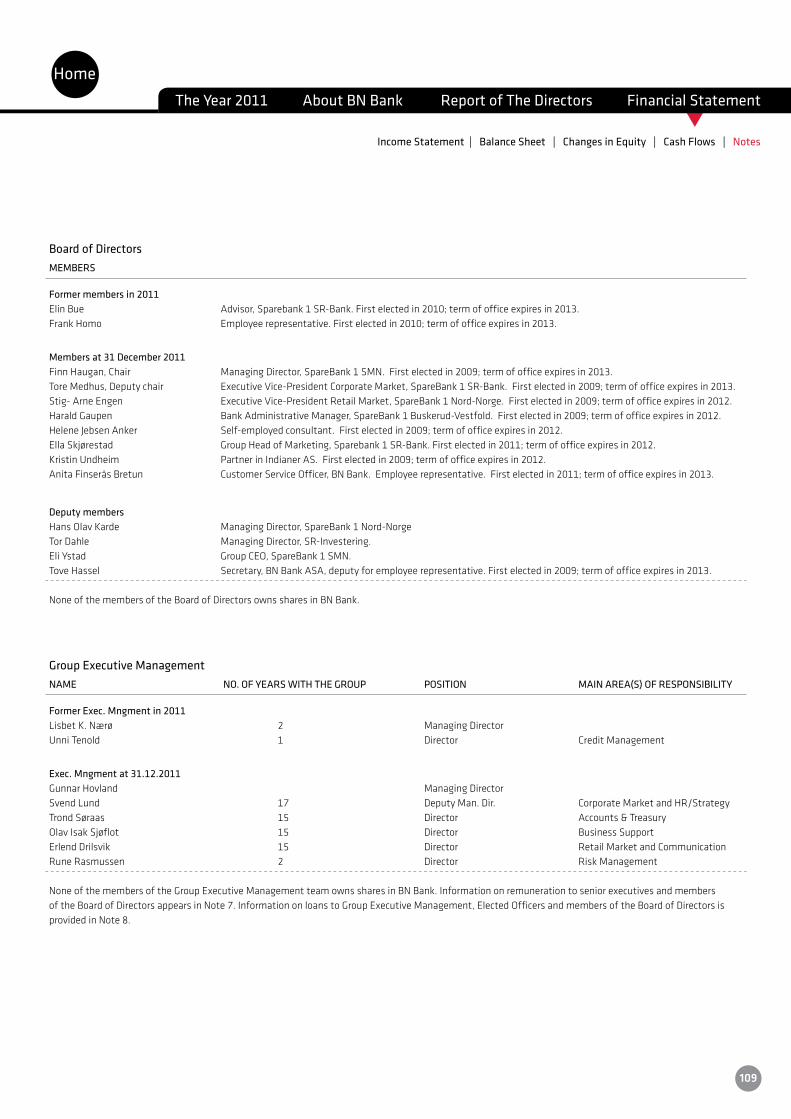
t
Board of DirectorsMEMBERS
Former members in 2011 Elin Bue Advisor, Sparebank 1 SR-Bank. First elected in 2010; term of office expires in 2013.Frank Homo Employee representative. First elected in 2010; term of office expires in 2013.
Members at 31 December 2011Finn Haugan, Chair Managing Director, SpareBank 1 SMN. First elected in 2009; term of office expires in 2013.Tore Medhus, Deputy chair Executive Vice-President Corporate Market, SpareBank 1 SR-Bank. First elected in 2009; term of office expires in 2013.Stig- Arne Engen Executive Vice-President Retail Market, SpareBank 1 Nord-Norge. First elected in 2009; term of office expires in 2012.HaraldGaupen BankAdministrativeManager,SpareBank1Buskerud-Vestfold.Firstelectedin2009;termofofficeexpiresin2012.HeleneJebsenAnker Self-employedconsultant.Firstelectedin2009;termofofficeexpiresin2012.EllaSkjørestad GroupHeadofMarketing,Sparebank1SR-Bank.Firstelectedin2011;termofofficeexpiresin2012.KristinUndheim PartnerinIndianerAS.Firstelectedin2009;termofofficeexpiresin2012.AnitaFinseråsBretun CustomerServiceOfficer,BNBank.Employeerepresentative.Firstelectedin2011;termofofficeexpiresin2013.
Deputy membersHansOlavKarde ManagingDirector,SpareBank1Nord-NorgeTor Dahle Managing Director, SR-Investering. EliYstad GroupCEO,SpareBank1SMN.Tove Hassel Secretary, BN Bank ASA, deputy for employee representative. First elected in 2009; term of office expires in 2013.
None of the members of the Board of Directors owns shares in BN Bank.
Group Executive Management NAME NO. OF YEARS WITH THE GROUP POSITION MAIN AREA(S) OF RESPONSIBILITY
Former Exec. Mngment in 2011LisbetK.Nærø 2 ManagingDirectorUnni Tenold 1 Director Credit Management
Exec. Mngment at 31.12.2011GunnarHovland ManagingDirectorSvend Lund 17 Deputy Man. Dir. Corporate Market and HR/Strategy Trond Søraas 15 Director Accounts & TreasuryOlav Isak Sjøflot 15 Director Business SupportErlend Drilsvik 15 Director Retail Market and CommunicationRune Rasmussen 2 Director Risk Management
NoneofthemembersoftheGroupExecutiveManagementteamownssharesinBNBank.Informationonremunerationtoseniorexecutivesandmembers oftheBoardofDirectorsappearsinNote7.InformationonloanstoGroupExecutiveManagement,ElectedOfficersandmembersoftheBoardofDirectorsis provided in Note 8.
HomeThe Year 2011 About BN Bank Report of The Directors Financial Statement
Income Statement | Balance Sheet | Changes in Equity | Cash Flows | Notes
109

t
Trondheim, 28 February 2012
The Board of Directors of BN Bank ASA
Finn Haugan (Chair)
ToreMedhus StigArneEngen HaraldGaupen HeleneJebsenAnker (DeputyChair)
KristinUndheim AnitaFinseråsBretun EllaSkjørestad GunnarHovland (EmployeeRepresentative) (ManagingDirector)
Declaration by the Board of Directors and Managing DirectorWeconfirmthattheCompany’sfinancialstatementsandtheGroup’sconsolidatedfinancialstatementsfor2011have,tothebestofourbelief,beenpreparedincompliancewithInternationalFinancialReportingStandards(IFRS)asapprovedbytheEU,andthatthedisclosuresintheseparatefinancialstatementsandconsolidatedfinancialstatementsgiveatrueandfairpictureoftheCompany’sandtheGroup’sassets,liabilities,financialpositionandresultsasawhole.
The Annual Report and Report of the Directors provide, to the best of our belief, a true and fair overview of the development, results andpositionoftheCompanyandoftheGroup,andanoutlineofthemostsignificantriskanduncertaintyfactorsfacingtheCompanyandtheGroupinthenextfinancialperiod.
HomeThe Year 2011 About BN Bank Report of The Directors Financial Statement
Declaration | Auditors Report | Control Committee´s Report | Articles of association
110
t
PricewaterhouseCoopers AS, Brattørkaia 17 B, NO-7492 Trondheim T: 02316, www.pwc.no Org.no.: 987 009 713 MVA, Medlem av Den norske Revisorforening
To the Supervisory Board and the Annual Shareholders' Meeting of BN Bank ASA
Independent auditor’s report
Report on the Financial Statements
We have audited the accompanying financial statements of BN Bank ASA, which comprise the financial statements of the parent company and the financial statements of the group. The financial statements of the parent company and the financial statements for of group comprise the balance sheet as at 31 December 2011, income statement, changes in equity and cash flow for the year then ended, and a summary of significant accounting policies and other explanatory information.
The Board of Directors and the Managing Director’s Responsibility for the Financial Statements
The Board of Directors and the Managing Director are responsible for the preparation and fair presentation of these financial statements in accordance with International Financial Reporting Standards as adopted by EU, and for such internal control as the Board of Directors and the Managing Director determine is necessary to enable the preparation of financial statements that are free from material misstatement, whether due to fraud or error.
Auditor’s Responsibility
Our responsibility is to express an opinion on these financial statements based on our audit. We conducted our audit in accordance with laws, regulations, and auditing standards and practices generally accepted in Norway, including International Standards on Auditing. Those standards require that we comply with ethical requirements and plan and perform the audit to obtain reasonable assurance about whether the financial statements are free from material misstatement.
An audit involves performing procedures to obtain audit evidence about the amounts and disclosures in the financial statements. The procedures selected depend on the auditor’s judgment, including the assessment of the risks of material misstatement of the financial statements, whether due to fraud or error. In making those risk assessments, the auditor considers internal control relevant to the entity’s preparation and fair presentation of the financial statements in order to design audit procedures that are appropriate in the circumstances, but not for the purpose of expressing an opinion on the effectiveness of the entity’s internal control. An audit also includes evaluating the appropriateness of accounting policies used and the reasonableness of accounting estimates made by management, as well as evaluating the overall presentation of the financial statements.
We believe that the audit evidence we have obtained is sufficient and appropriate to provide a basis for our audit opinion.
Opinion
In our opinion, the financial statements are prepared in accordance with the law and regulations and present fairly, in all material respects, the financial position for the parent company and the group BN Bank ASA as at 31 December 2011, and its financial performance and its cash flows for the year then ended in accordance with International Financial Reporting Standards as adopted by EU.
Auditor s Report
HomeThe Year 2011 About BN Bank Report of The Directors Financial Statement
Declaration | Auditors Report | Control Committee´s Report | Articles of association
111

t
Independent auditor's report - 2011 - BN Bank ASA, page 2
(2)
Report on Other Legal and Regulatory Requirements
Opinion on the Board of Directors’ report and statement of corporate governance principles and practices
Based on our audit of the financial statements as described above, it is our opinion that the information presented in the Board of Directors report and statement of corporate governance principles and practices concerning the financial statements and the going concern assumption, and the proposal for the allocation of the profit is consistent with the financial statements and complies with the law and regulations.
Opinion on Registration and Documentation
Based on our audit of the financial statements as described above, and control procedures we have considered necessary in accordance with the International Standard on Assurance Engagements ISAE 3000 “Assurance Engagements Other than Audits or Reviews of Historical Financial Information”, it is our opinion that management has fulfilled its duty to produce a proper and clearly set out registration and documentation of the company’s accounting information in accordance with the law and bookkeeping standards and practices generally accepted in Norway.
Trondheim, 28 February 2012 PricewaterhouseCoopers AS Rune Kenneth S. Lædre State Authorised Public Accountant (Norway) Note: This translation from Norwegian has been prepared for information purposes only.
HomeThe Year 2011 About BN Bank Report of The Directors Financial Statement
Declaration | Auditors Report | Control Committee´s Report | Articles of association
112
t
Control Committee s report for 2011The Control Committee of BN Bank ASA held six meetings during the course of the year, of which two in Trondheim and four in Oslo. The Com-mittee examined the minute book of the Board of Directors at each meeting.
TheDeputyManagingDirector/ActingManagingDirectororChiefFinancialOfficerhasattendedallthecommittee’smeetings.TheChairmanoftheboardhasparticipatedinonemeeting.OtherrepresentativesoftheGroup`smanagementhavebeenpresentinconnectionwiththediscussion of any business where the Committee deemed it desirable.
The Committee has at all times been presented with the material requested and has also received satisfactory answers and infor¬mation in relation to the matters discussed.
In the opinion of the Committee, there is a good working relationship between the Committee and the external and internal auditors.
The Committee has performed its control function in accordance with current legislation, the Articles of Association, given instructions and its own work plan. The Committee is of the opinion that the Mortgage company`s operations are conducted in a sound and appropriate manner and in accordance with current laws, regulations, the Articles of Association and the instructions given by the Supervisory Board.
The Committee has examined the Board of Directors´ recommendations with regard to the financial statements, annual report and auditor`s report. The Committee deems the Board`s assessment of the Mortgage company`s financial position to be satisfactory.
The Committee recommends that the financial statements and annual report be approved.
Oslo, 29 February 2012
(Chair) (DeputyChair)
HomeThe Year 2011 About BN Bank Report of The Directors Financial Statement
Declaration | Auditors Report | Control Committee´s Report | Articles of association
113
t
Chap. 1 Company name. Registered office. Objects.§1-1 TheCompany’snameisBNBankASA.TheCompany’sbusinessaddressisinthemunicipalityofTrondheim.BNbankcanwithinthe parameters of the legislation that is in force at any time, carry on all business and provide all services that it is customary or natural for a bank.
Chap. 2 Share capital. Capital base. Shares§2-1 TheBank’ssharecapitalisNOK649416550dividedinto12988331sharesofNOK50each,allfullypaid.
§2-2 TheBank’ssharesshallbe registeredwith theNorwegianCentralSecuritiesDepository.Any transferofsharesshallbenotified immediately to the Depository.
The acquisition of shares by transfer (sale, gift) is subject to the consent of theBank’s Board ofDirectors,which shall not be unreasonably withheld. Written justification can be demanded for any such refusal.
The acquirer of a share may only exercise the rights of a shareholder once the acquisition has been entered in the register of shareholders, or when the acquisition has been notified and approved without any impediment arising under the provisions of the Companies Act, §§ 4-16 to 4-23. This does not however apply to the right to receive a dividend and other distributions and the entitlement new shares in the event of an increase in capital.
Chap. 3 Board of Directors§ 3-1 The Board of Directors shall consist of between five and nine members elected by the Supervisory Board.
At least half theBoardmembersmust reside inNorway, unless theKingmakes exemption in a particular case. The residency requirement does not apply to nationals of a State that is party to the EEA Agreement and who reside in that State.
AtleastoneoftheBoard’selectedmembersshallbeanemployeeoftheBank.Personaldeputiesshallbeelectedfortheseemployee representatives, who shall be entitled to attend and speak at board meetings.
Up to three deputy members may be elected for the other elected Board members.
The Supervisory Board shall elect separately the Chair and Deputy Chair of the Board.
Elected Board members shall hold office for two years. Each year those members who have held office longest shall retire from the Board. On the first occasion approximately half the members shall retire in accordance with lots drawn by the Election Committee.
Deputies shall be elected to serve for two years.
To replace a Board member who retires before his or her term of office expires, a new member shall be elected at the first opportunity to hold office for the remainder of the term.
§ 3-2 The election of Board members shall be organised by an Election Committee consisting of the Chair of the Supervisory Board and four members elected by the Supervisory Board. The Committee shall have members from both groups represented on the Supervisory Board;seeCommercialBanksAct,§11(4)and(5).TheChairoftheSupervisoryBoardshallserveastheChairoftheElectionCommittee. TheBoardmemberstobeelectedfromamongtheBank’semployeesandtheirpersonaldeputiesshallbenominatedonlybythe employee representative on the Election Committee.
The Election Committee shall also organise the election of members of district boards and district councils; see Chapter 5 below.
Articles of association of BN Bank ASA
HomeThe Year 2011 About BN Bank Report of The Directors Financial Statement
Declaration | Auditors Report | Control Committee´s Report | Articles of association
114

t
§ 3-3 Meetings of the Board of Directors shall be convened by the Chair not less than once a month or otherwise as often as the operations of the Bank require, or whenever demanded by a Board member.
The Board forms a quorum when more than half of all members are present or participating in discussing an item of business. However, no resolution may be adopted by the Board unless all the members have as far as possible been given an opportunity to participate in the item of business under discussion. In the absence of a Board member, his or her deputy shall be invited to attend the meeting.
All resolutions require the supporting votes of a majority of those present or those participating in discussion of an item of business, and in the event of a tie the presiding Chair has the casting vote. However, no resolution will be valid unless at least half of all the Board members have voted in favour thereof.
Absent Board members shall acquaint themselves with resolutions adopted in their absence.
§3-4 TheBoardshalladministertheBank’saffairs,includingmakingdecisionsonindividualcreditapplications.TheBoardshallensurethat theBank’soperationsareorganisedsatisfactorilyandthataccountingandcapitalmanagementaresubjecttoadequatecontrols.
TheBoardshallissueinstructionsfortheBank’sdistrictboards;seenotwithstanding§5-1,lastsentence.
§ 3-5 The Board shall appoint and dismiss the employees of the Bank and stipulate their conditions of employment. The Board may delegate this authority in respect of employees other than the Managing Director and his or her deputy.
§ 3-6 The Chair of the Board or the Managing Director singly, or any two elected Board members jointly, may sign for the Bank. The Board may authorise designated employees to sign for the Bank. The Board may moreover grant power of procuration and special powers of attorney.
§3-7 TheManagingDirectorshallberesponsiblefortheday-to-dayconductoftheBank’soperationsinaccordancewithgeneralinstructions issuedbytheSupervisoryBoardandapprovedbytheGeneralMeeting,andtheguidelinesandordersissuedbytheBoard.
Chap. 4 Supervisory Board § 4-1 The Supervisory Board shall consist of 15 members.
The Supervisory Board should represent a variety of interests and include members from different districts and business sectors that are affected by the activities of the Bank.
TheChairoftheSupervisoryBoardandatleasthalfthemembersanddeputymembersmustresideinNorwayunlesstheKingmakes exemption in a particular case. The residency requirement does not apply to nationals of a State that is party to the EEA Agreement and who reside in that State.
No member of the Board of Directors, or observer, or the Managing Director, may be a member of the Supervisory Board.
TheGeneralMeetingshallelect11membersandsixdeputymembers.Themembersanddeputymembersshallbeelectedfromamong theBank’sshareholders.TheelectionshallbeorganisedbyanElectionCommitteeoffourmemberselectedbytheGeneralMeeting.
FourmembersandtwodeputymembersshallbeelectedbyandfromamongtheBank’semployees.TheKingissuesrulesforsuch elections.
The members of the Supervisory Board shall each year elect a Chair and Deputy Chair from among their number.
The members and deputy members of the Supervisory Board are elected for terms of two years.
OfthosemembersfirstelectedtotheSupervisoryBoardbytheGeneralMeeting,halfshallbeselectedbylottoretireafteroneyear. Thereafter each year those who have served longest shall retire. Lots shall be drawn by the Election Committee.
A member of the Supervisory Board is entitled to resign before his or her term of office expires if there are special reasons for so doing. The Supervisory Board and the person or body who elected the member shall be given reasonable notice in advance. A member of the SupervisoryBoardcanberemovedbythepersonorbodywhoelectedthemember.ThisdoesnotapplytomemberselectedbytheBank’s employees; see fifth paragraph above.
To replace a member of the Supervisory Board who resigns before his or her term of office expires, a new member shall be elected at the earliest opportunity to serve for the remainder of the term.
HomeThe Year 2011 About BN Bank Report of The Directors Financial Statement
Declaration | Auditors Report | Control Committee´s Report | Articles of association
115
t
§ 4-2 The Chair shall convene meetings of the Supervisory Board as often as may be necessary and otherwise whenever so required by the Board of Directors, the Control Committee or at least one sixth of the members of the Supervisory Board.
The members of the Board of Directors, the Control Committee and the Auditor shall be called to meetings of the Supervisory Board. Unless otherwise decided by the Supervisory Board in any particular case, the members of the Board of Directors and Control Committee are entitled to attend and to speak at meetings of the Supervisory Board. The Chair of the Board of Directors and the Managing Director are obliged to attend such meetings, unless it is obviously unnecessary for them to do so or they have a valid excuse. In the latter event a deputy shall be appointed.
§4-3 TheremunerationtomembersoftheSupervisoryBoardshallbesetbytheGeneralMeeting.NomemberoftheSupervisoryBoardmay in connection with his or her work for the Board accept remuneration from anyone other than the Bank. This also applies to remuneration which another contracting party or his or her representative has reserved for themselves from the Bank.
Any remuneration which is agreed or received in contravention of the prohibition in the first paragraph above shall fall to the Bank. This also applies to any return on assets or assets given in lieu of remuneration.
The prohibition in the first paragraph shall not hinder a member of the Supervisory Board, who does not take part in the day-to-day management,fromactingasamiddlemaninrelationtothecompanyinreturnforthecustomarymiddlemanremunerationif:
1. the member of the Supervisory Board does not also represent the Bank, and
2. the transaction is part of the middleman activity operated as a business by the Supervisory Board member.
§ 4-4 Members of the Supervisory Board shall not act in any way liable to give certain shareholders or others an unreasonable advantage at the expense of other shareholders or the Bank.
TheSupervisoryBoardshallnotcomplywithanydecisionoftheGeneralMeetingoranyothercorporatebodyifthedecisioniscontrary tothelawortheBank’sArticlesofAssociation.
§ 4-5 The Supervisory Board forms a quorum when more than half of all its members are present. However, the Supervisory Board may not adopt any resolution unless all members have been given an opportunity to participate in considering the item of business under discussion. If a member is absent, his or her deputy shall be invited to attend.
Resolutions of the Supervisory Board shall be adopted by a majority of the attending members and in the event of a tie the presiding Chair has the casting vote. However, no resolution will be valid unless more than one third of all the board members have voted in favour thereof.
§4-6 TheSupervisoryBoardshall:
1. supervise the management and administration of the Bank by the Board of Directors and the Managing Director and ensure that the Bank’sobjectsarepromotedinaccordancewiththelaw,theArticlesofAssociationandtheresolutionsadoptedbytheGeneralMeeting andtheSupervisoryBoard,andadoptguidelinesfortheBank’soperations.Theguidelinesshalltaketheformofgeneralinstructions fortheBank’smanagementandadministration,andshallbepresentedtotheGeneralMeetingforapproval.
2. electtheelectedmembersanddeputymembersoftheBoardofDirectors;seenotwithstanding§3-1(3).
3. elect the members of the Election Committee; see § 3-2.
4. appoint an auditor or auditing firm.
5. receivereportsontheBank’soperationsandexamineextractsfromtheaccountsandreportsfromtheControlCommittee.Each memberisentitledatmeetingsoftheSupervisoryBoardtodemandinformationregardingtheBank’soperationstotheextentheor she deems necessary. The Supervisory Board may institute its own investigation or appoint a committee to do so.
6. examinetheBank’sannualfinancialstatements,annualreportandAuditor’sreport,andmakeareporttotheGeneralMeetingonthe BoardofDirectors’recommendationsregardingtheannualfinancialstatementsandtheappropriationofprofitorcoveringofloss.The BoardofDirectors’recommendationsandtheAuditor’sreportshallbesenttotheSupervisoryBoardmembersnolaterthanoneweek before the matter is to be discussed.
7. adoptresolutionsontheremunerationoftheBank’selectedofficersandAuditorandtheremuneration/salaryoftheManagingDirector.
HomeThe Year 2011 About BN Bank Report of The Directors Financial Statement
Declaration | Auditors Report | Control Committee´s Report | Articles of association
116

t
8. make decisions in respect of district boards and district councils in accordance with § 5-1 and § 5-2.
9. make pronouncements on matters concerning the Bank which are presented to it by the Board of Directors or the Control Committee.
The Supervisory Board may make recommendations to the Board of Directors on any matter.
The Supervisory Board shall not make a decision on any matter which according to § 3-4 above falls under the Board of Directors.
§ 4-7 FollowingproposalsfromtheBoardofDirectors,theSupervisoryBoardshalladoptresolutionsto:
1. establish or close a branch or district office in municipalities in which the Bank does not have its head office or a branch or district office.
2. declare any dividends to be distributed to shareholders and the amount thereof subject to the maximum amount stipulated by the Board. The meeting shall decide at the same time the date from which the declared dividends are payable.
§ 4-8 Minutes shall be kept of Supervisory Board meetings under the responsibility of the presiding Chair. The minutes shall be approved and signed by all the participants at the meeting or by the Chair and two other participants elected at the meeting.
Chap. 5 District boards and district councils§ 5-1 The Supervisory Board may decide that a district office outside the municipality in which the Bank has its head office shall have its own board with between five and seven members.
If the district office has 15 or more employees, one member shall be elected by and from among the employees at that office. The electionshallbebymajorityvote inaccordancewiththeregulationsprovidedbytheKing inrespectoftheelectionofemployee members to the Supervisory Board, to the extent that the regulations are relevant. The other members of the district board shall be elected by the Supervisory Board.
The elected offices are for terms of two years.
TheBank’smainBoardofDirectorsshallissueinstructionsforthedistrictboard.TheinstructionsshallbeapprovedbytheSupervisory BoardandbepresentedtotheGeneralMeeting.
§ 5-2 The Supervisory Board may decide that a branch or district office shall have an advisory district council. The members of the council shall be elected by the Supervisory Board, in the event following nominations from the district board.
A district council may serve as a joint advisory council for a number of branch or district offices.
Chap. 6 Control Committee§ 6-1 The Control Committee consists of between one and six members and between one and two deputy members.
Members of the Control Committee must satisfy the eligibility requirements for election to the Supervisory Board. One member must meetthequalificationsofjudgesundertheCourtsofJusticeActof13August1915,§54(2).
The election of this member is subject to the approval of the Financial Supervisory Authority of Norway. The Authority may grant dispensation from the provisions of the two preceding points. No member or deputy member of the Board of Directors, Auditor or officer of the Bank may be elected a member or deputy member of the Control Committee. Nor may any person be elected thereto who is legally incompetent or who is an associate, subordinate, dependant, spouse or relative by blood or marriage in direct line of ascent or descent or in the first collateral line, of any member or deputy member of the Board of Directors, Auditor or senior officer of the Bank. Nor may any person be elected who has been made bankrupt or initiated debt settlement proceedings or is under private administration. If any circumstance arises which causes a member no longer to be eligible, he or she shall resign from the Control Committee. To replace a resigning member, a new member shall be elected at the earliest opportunity to serve for the remainder of the term.
The elected offices are for terms of two years.
Whereadistrictofficehasitsownboard,theGeneralMeetingmayelectalocalcontrolcommittee,withmembersnominatedbythe Bank’smainControlCommittee,tocarryoutlocalcontrolsunderthesupervisionofthemainControlCommittee.
HomeThe Year 2011 About BN Bank Report of The Directors Financial Statement
Declaration | Auditors Report | Control Committee´s Report | Articles of association
117
t
§ 6-2 The Control Committee shall meet whenever considered necessary in order to ensure sufficient supervision. It shall keep a record of its deliberations, in a form authorised by the Financial Supervisory Authority of Norway, and shall each year submit a report to the SupervisoryBoard,GeneralMeetingandFinancialSupervisoryAuthorityofNorwayonitsactivitiesandtheBank’sposition.
The Supervisory Board shall adopt instructions for the Committee, which shall be approved by the Financial Supervisory Authority of Norway.
Chap. 7 General Meeting§7-1 TheshareholdersactingthroughtheGeneralMeetingexercisethehighestauthorityintheBank,unlessauthorityhasbeenvested exclusively inoneoftheBank’sotherbodiesbyspecialstatutoryprovision.AttheGeneralMeetingeachsharehasonevote;see notwithstanding§7-6(3).Allresolutionsshallbepassedbyasimplemajority,unlessotherwiseprovidedbythelawortheArticlesof Association.
AnordinaryGeneralMeetingshallbeheldattheBank’sheadofficebeforetheendofAprileachyear.
TheChairoftheSupervisoryBoardconvenesGeneralMeetings.
TheBoardofDirectors,membersoftheControlCommitteeandtheAuditorshallbecalledtoGeneralMeetings.Themembersofthe BoardofDirectorsandControlCommitteeareentitledtoattendandtospeakatGeneralMeetings.TheManagingDirectorandtheChair oftheSupervisoryBoardareobligedtoattendGeneralMeetingsunlessitisobviouslyunnecessaryforthemtoattendortheyhavea valid excuse. In the latter event, deputies shall be appointed.
Notice shall be given to the Financial Supervisory Authority of Norway in good time, and not later than the last date for lawful notice totheshareholders,ofthebusinesstobetransactedattheGeneralMeeting.Acopyoftheminutesofthemeetingshallbesentim- mediately to the Financial Supervisory Authority of Norway.
§7-2 Theannualfinancialstatements,annualreport,Auditor’sreportandSupervisoryBoardreport,see§4-6(6),shallbepresentedatthe AnnualGeneralMeetingandbedistributedtothoseshareholderswhohavenothadthedocumentssenttheminadvance.
§7-3 TheChairoftheSupervisoryBoardshallopentheGeneralMeetingandchairtheproceedingsuntilapresidingchairiselected.
§7-4 TheAnnualGeneralMeetingshall:
1. elect a person to chair the meeting from among the shareholders in attendance.
2. elect11membersandsixdeputiestotheSupervisoryBoardfromamongtheBank’sshareholders,andelectmemberstotheControl Committee
3. elect an Election Committee to organise the election of members and deputy members to the Supervisory Board and Control Committee atthenextAnnualGeneralMeeting.
4. adopt the annual financial statements, including the appropriation of profit or covering of loss.
5. transactanyotherbusinesswhichaccordingtolawortheArticlesofAssociationfallsundertheGeneralMeeting.
§7-5 WhentheGeneralMeetinghasbeenconvened,theChairshalldrawupalistoftheattendingshareholdersandproxiesstatingthe numberofsharesandvoteswhicheachofthemrepresents.ThislistshallbeemployeduntilitrequirestobealteredbytheGeneral Meeting.
§ 7-6 Votes shall be cast in writing if all those present at the meeting are unable to agree to another form of voting.
TheChairshallensurethatminutesarekeptoftheGeneralMeeting’sproceedings.Theminutesshallrecordallresolutionspassedby theGeneralMeetingandstatetheoutcomeofvoting.Thelistofattendingshareholdersandproxiesshallbeenteredinorattachedto theminutes.TheminutesshallbesignedbytheChairandatleastoneotherpersonappointedbytheGeneralMeetingfromamongthe participants. The minutes shall be held in safekeeping and made available to the shareholders.
HomeThe Year 2011 About BN Bank Report of The Directors Financial Statement
Declaration | Auditors Report | Control Committee´s Report | Articles of association
118
t
Chap. 8 Auditor§ 8-1 The Auditor shall comply with the instructions and orders that the Supervisory Board shall give, save where they conflict with provisions setbyorpursuanttolaworwiththeBank’sArticlesofAssociationorgenerallyacceptedauditingprinciples.
TheAuditorshallsubmithisorhercommentsandreportsthroughtheControlCommitteetotheSupervisoryBoard.TheAuditor’sreport shall be submitted at least two weeks before the meeting of the Supervisory Board which shall consider the financial statements.
Chap. 9 Conditions relating to deposits§ 9-1 The Board shall set the terms and conditions for receiving and paying deposits in accordance with any rules drawn up by the Financial Supervisory Authority of Norway.
Chap. 10 Annual Financial Statements and Annual Report § 10-1 The financial year shall coincide with the calendar year.
For each financial year the Board shall submit annual financial statements and an annual report.
ThefinancialstatementsandannualreportshallbeplacedatthedisposaloftheAuditoratleastonemonthbeforetheAnnualGeneral Meeting. The Control Committee and Supervisory Board shall examine the audited financial statements and annual report before they arepresentedtotheGeneralMeeting.
TheGeneralMeetingshalladoptthefinancialstatementsnolaterthantheendofApril.
Chap. 11 Retirement age. Term of service § 11-1 The maximum age of retirement for permanent employees is 70 years.
§11-2 AnelectedmemberorChairoftheBank’sBoardofDirectors,SupervisoryBoardorControlCommitteemaynotholdsuchofficefora consecutive period of more than 12 years or for periods which combined exceed 20 years. In computing these periods, only that period forwhichthepersonconcernedhasheldelectedofficeintheBanksince1January1978willbeincluded.Apersonmaynotbeelected/ re-elected to any of these offices if, under the provisions of this paragraph, he or she would not be entitled to serve the full term for which he or she was elected.
Chap. 12 Amendments to these Articles of Association§12-1 AresolutiontoamendtheArticlesshallbepassedbytheGeneralMeeting.Theresolutionrequirestheapprovalofatleasttwo-thirds ofthevotesgivenandthesharecapitalrepresentedattheGeneralMeeting.
AnyproposaltoamendtheArticlesmustbesubmittedtotheChairoftheBoardatleastfourweeksbeforetheGeneralMeetingshall consider the proposal.
Chap. 13 Entry into force §13-1 TheseArticlesofAssociationshallenterintoforcewhentheyreceiveapprovalinaccordancewiththeCommercialBanksAct,§4(3).
HomeThe Year 2011 About BN Bank Report of The Directors Financial Statement
Declaration | Auditors Report | Control Committee´s Report | Articles of association
119

www.bnbank.no