Embed Size (px)
Citation preview
P a g e | 1 of 127
Aquatic Animal Health Subprogram:
Development of improved molecular diagnostic tests for Perkinsus olseni in Australian
molluscs
Nicholas Gudkovs, David Cummins, Brian Jones, Axel Colling, Nagendrakumar B. Singanallur and Mark Crane
June 2016
FRDC Project No 2011/004
P a g e | 1 of 127
© 2016 Fisheries Research and Development Corporation.
All rights reserved.
ISBN 978-1-4863-0691-6 online
Aquatic Animal Health Subprogram: Development of improved molecular diagnostic tests for Perkinsus olseni in Australian molluscs
FRDC Project No 2011/004
2016
Ownership of Intellectual property rights Unless otherwise noted, copyright (and any other intellectual property rights, if any) in this publication is owned by the Fisheries Research and Development Corporation and the CSIRO Australian Animal Health Laboratory
This publication (and any information sourced from it) should be attributed to Nicholas Gudkovs, David Cummins, Brian Jones, Axel Colling, Nagendrakumar B. Singanallur and Mark Crane. 2016. FRDC Aquatic Animal Health Subprogram: Development of improved molecular diagnostic tests for Perkinsus olseni in Australian molluscs
Creative Commons licence All material in this publication is licensed under a Creative Commons Attribution 3.0 Australia Licence, save for content supplied by third parties, logos and the Commonwealth Coat of Arms.
Creative Commons Attribution 3.0 Australia Licence is a standard form licence agreement that allows you to copy, distribute, transmit and adapt this publication provided you attribute the work. A summary of the licence terms is available from creativecommons.org/licenses/by/3.0/au/deed.en. The full licence terms are available from creativecommons.org/licenses/by/3.0/au/legalcode.
Inquiries regarding the licence and any use of this document should be sent to: [email protected]
Disclaimer The authors do not warrant that the information in this document is free from errors or omissions. The authors do not accept any form of liability, be it contractual, tortious, or otherwise, for the contents of this document or for any consequences arising from its use or any reliance placed upon it. The information, opinions and advice contained in this document may not relate, or be relevant, to a readers particular circumstances. Opinions expressed by the authors are the individual opinions expressed by those persons and are not necessarily those of the publisher, research provider or the FRDC.
The Fisheries Research and Development Corporation plans, invests in and manages fisheries research and development throughout Australia. It is a statutory authority within the portfolio of the federal Minister for Agriculture, Fisheries and Forestry, jointly funded by the Australian Government and the fishing industry.
Researcher Contact Details FRDC Contact Details Name: Address: Phone: Fax: Email:
Nicholas Gudkovs and David Cummins 5 Portarlington Road, PO Bag 24 Geelong VIC 3220 03 5227 5000 03 5227 5555 [email protected]
Address: Phone: Fax: Email: Web:
25 Geils Court Deakin ACT 2600 02 6285 0400 02 6285 0499 [email protected] www.frdc.com.au
In submitting this report, the researcher has agreed to FRDC publishing this material in its edited form.
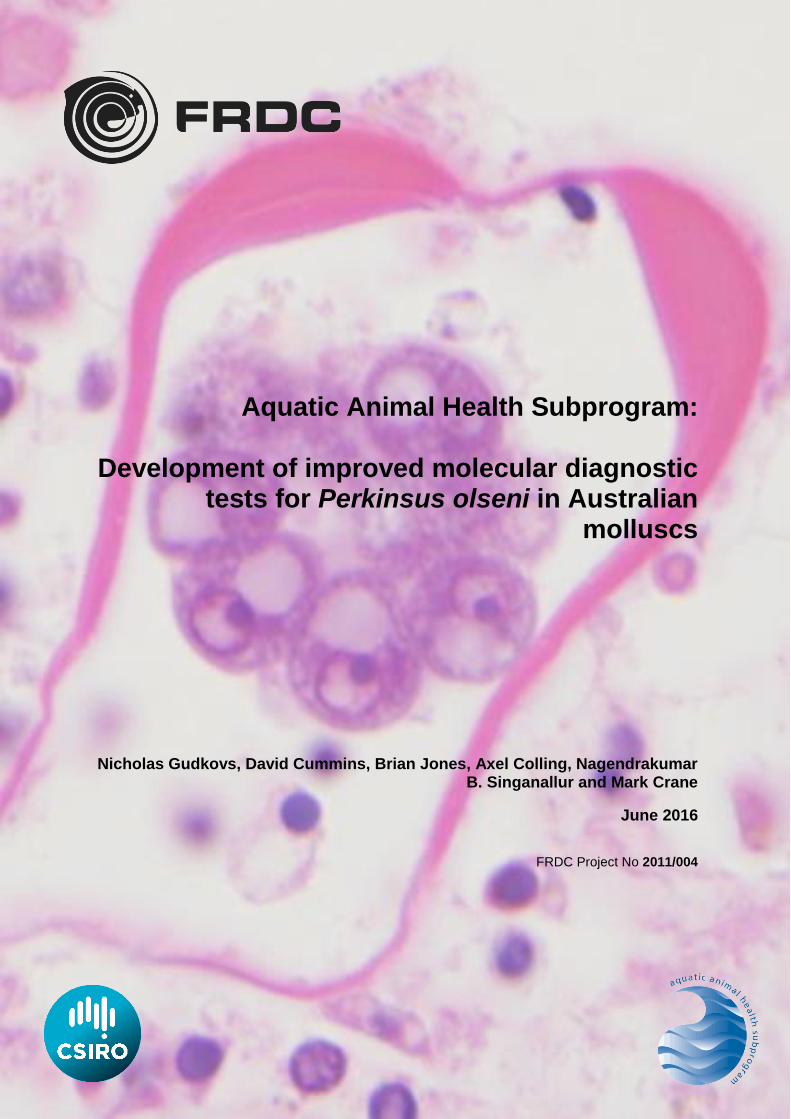
Cover Photo: Perkinsus olseni in the greenlip abalone (Haliotis laevigata) with permission of Professor Ryan Carnegie, OIE Perkinsus Reference Laboratory, Virginia Institute of Marine Science.
P a g e | 1 of 127
Contents
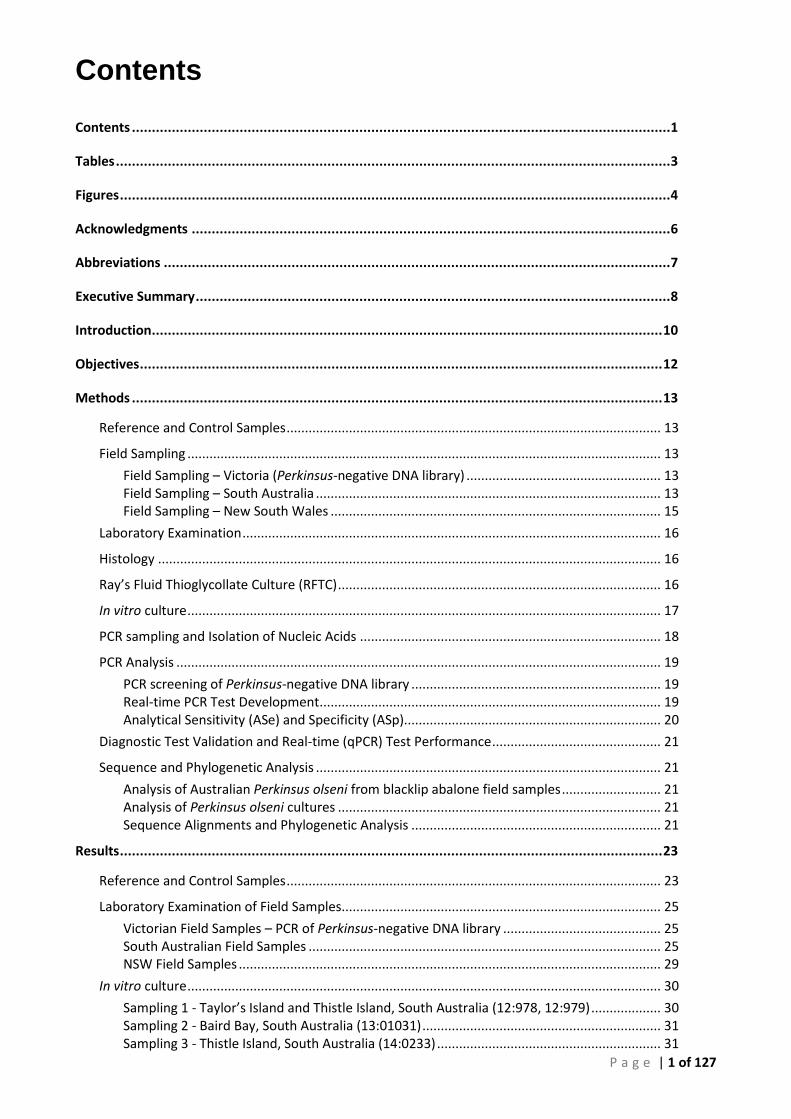
Contents ....................................................................................................................................... 1
Tables ........................................................................................................................................... 3
Figures .......................................................................................................................................... 4
Acknowledgments ........................................................................................................................ 6
Abbreviations ............................................................................................................................... 7
Executive Summary ....................................................................................................................... 8
Introduction ................................................................................................................................ 10
Objectives ................................................................................................................................... 12
Methods ..................................................................................................................................... 13
Reference and Control Samples ...................................................................................................... 13
Field Sampling ................................................................................................................................. 13
Field Sampling – Victoria (Perkinsus-negative DNA library) ..................................................... 13 Field Sampling – South Australia .............................................................................................. 13 Field Sampling – New South Wales .......................................................................................... 15
Laboratory Examination .................................................................................................................. 16
Histology ......................................................................................................................................... 16
Ray’s Fluid Thioglycollate Culture (RFTC) ........................................................................................ 16
In vitro culture ................................................................................................................................. 17
PCR sampling and Isolation of Nucleic Acids .................................................................................. 18
PCR Analysis .................................................................................................................................... 19
PCR screening of Perkinsus-negative DNA library .................................................................... 19 Real-time PCR Test Development ............................................................................................. 19 Analytical Sensitivity (ASe) and Specificity (ASp)...................................................................... 20
Diagnostic Test Validation and Real-time (qPCR) Test Performance .............................................. 21
Sequence and Phylogenetic Analysis .............................................................................................. 21
Analysis of Australian Perkinsus olseni from blacklip abalone field samples ........................... 21 Analysis of Perkinsus olseni cultures ........................................................................................ 21 Sequence Alignments and Phylogenetic Analysis .................................................................... 21
Results ........................................................................................................................................ 23
Reference and Control Samples ...................................................................................................... 23
Laboratory Examination of Field Samples....................................................................................... 25
Victorian Field Samples – PCR of Perkinsus-negative DNA library ........................................... 25 South Australian Field Samples ................................................................................................ 25 NSW Field Samples ................................................................................................................... 29
In vitro culture ................................................................................................................................. 30
Sampling 1 - Taylor’s Island and Thistle Island, South Australia (12:978, 12:979) ................... 30 Sampling 2 - Baird Bay, South Australia (13:01031) ................................................................. 31 Sampling 3 - Thistle Island, South Australia (14:0233) ............................................................. 31
P a g e | 2 of 127
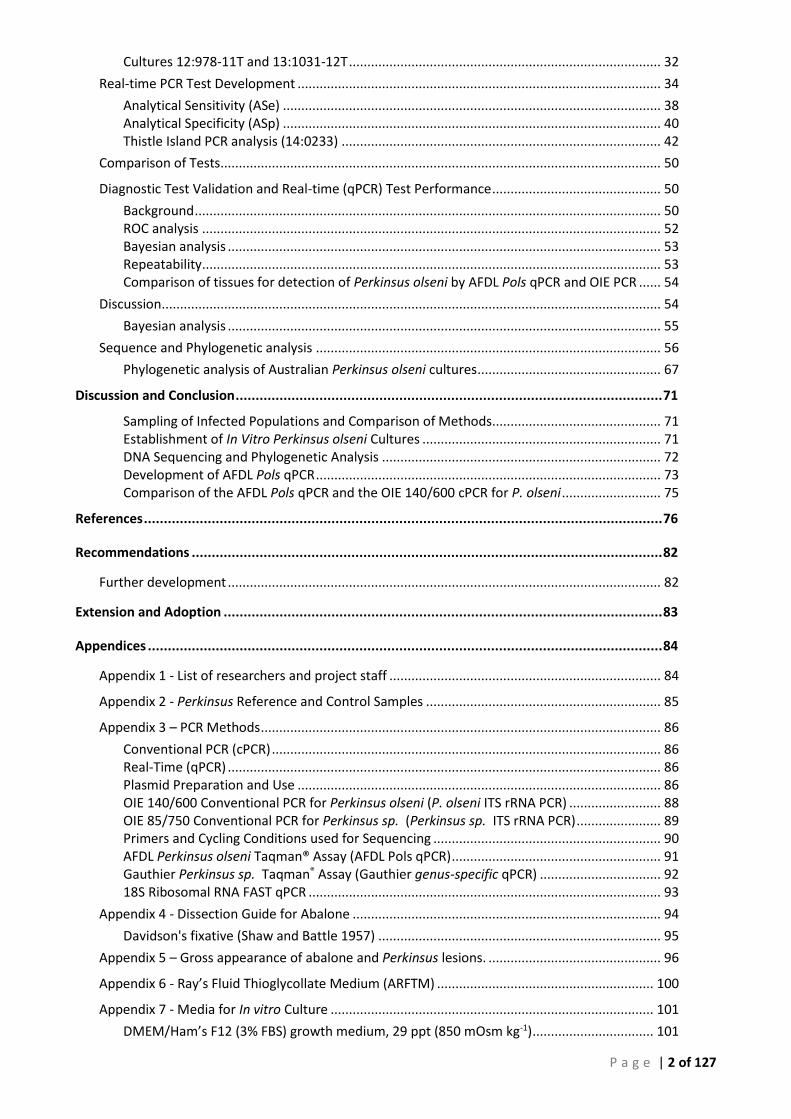
Cultures 12:978-11T and 13:1031-12T ..................................................................................... 32
Real-time PCR Test Development ................................................................................................... 34
Analytical Sensitivity (ASe) ....................................................................................................... 38 Analytical Specificity (ASp) ....................................................................................................... 40 Thistle Island PCR analysis (14:0233) ....................................................................................... 42
Comparison of Tests ........................................................................................................................ 50
Diagnostic Test Validation and Real-time (qPCR) Test Performance .............................................. 50
Background ............................................................................................................................... 50 ROC analysis ............................................................................................................................. 52 Bayesian analysis ...................................................................................................................... 53 Repeatability ............................................................................................................................. 53 Comparison of tissues for detection of Perkinsus olseni by AFDL Pols qPCR and OIE PCR ...... 54
Discussion ........................................................................................................................................ 54
Bayesian analysis ...................................................................................................................... 55
Sequence and Phylogenetic analysis .............................................................................................. 56
Phylogenetic analysis of Australian Perkinsus olseni cultures .................................................. 67
Discussion and Conclusion ........................................................................................................... 71
Sampling of Infected Populations and Comparison of Methods.............................................. 71 Establishment of In Vitro Perkinsus olseni Cultures ................................................................. 71 DNA Sequencing and Phylogenetic Analysis ............................................................................ 72 Development of AFDL Pols qPCR .............................................................................................. 73 Comparison of the AFDL Pols qPCR and the OIE 140/600 cPCR for P. olseni ........................... 75
References .................................................................................................................................. 76
Recommendations ...................................................................................................................... 82
Further development ...................................................................................................................... 82
Extension and Adoption .............................................................................................................. 83
Appendices ................................................................................................................................. 84
Appendix 1 - List of researchers and project staff .......................................................................... 84
Appendix 2 - Perkinsus Reference and Control Samples ................................................................ 85
Appendix 3 – PCR Methods ............................................................................................................. 86
Conventional PCR (cPCR) .......................................................................................................... 86 Real-Time (qPCR) ...................................................................................................................... 86 Plasmid Preparation and Use ................................................................................................... 86 OIE 140/600 Conventional PCR for Perkinsus olseni (P. olseni ITS rRNA PCR) ......................... 88 OIE 85/750 Conventional PCR for Perkinsus sp. (Perkinsus sp. ITS rRNA PCR) ....................... 89 Primers and Cycling Conditions used for Sequencing .............................................................. 90 AFDL Perkinsus olseni Taqman® Assay (AFDL Pols qPCR) ......................................................... 91 Gauthier Perkinsus sp. Taqman® Assay (Gauthier genus-specific qPCR) ................................. 92 18S Ribosomal RNA FAST qPCR ................................................................................................ 93
Appendix 4 - Dissection Guide for Abalone .................................................................................... 94
Davidson's fixative (Shaw and Battle 1957) ............................................................................. 95
Appendix 5 – Gross appearance of abalone and Perkinsus lesions. ............................................... 96
Appendix 6 - Ray’s Fluid Thioglycollate Medium (ARFTM) ........................................................... 100
Appendix 7 - Media for In vitro Culture ........................................................................................ 101
DMEM/Ham’s F12 (3% FBS) growth medium, 29 ppt (850 mOsm kg-1) ................................. 101
P a g e | 3 of 127
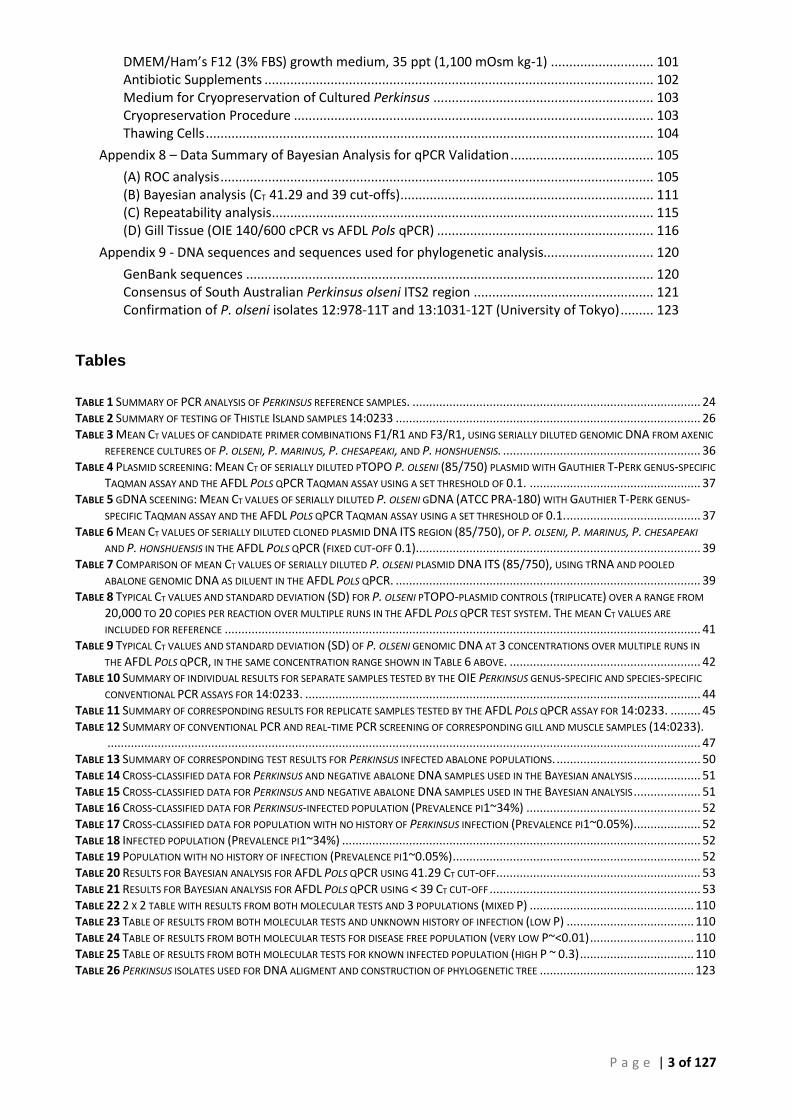
DMEM/Ham’s F12 (3% FBS) growth medium, 35 ppt (1,100 mOsm kg-1) ............................ 101 Antibiotic Supplements .......................................................................................................... 102 Medium for Cryopreservation of Cultured Perkinsus ............................................................ 103 Cryopreservation Procedure .................................................................................................. 103 Thawing Cells .......................................................................................................................... 104
Appendix 8 – Data Summary of Bayesian Analysis for qPCR Validation ....................................... 105
(A) ROC analysis ...................................................................................................................... 105 (B) Bayesian analysis (CT 41.29 and 39 cut-offs) ..................................................................... 111 (C) Repeatability analysis ........................................................................................................ 115 (D) Gill Tissue (OIE 140/600 cPCR vs AFDL Pols qPCR) ........................................................... 116
Appendix 9 - DNA sequences and sequences used for phylogenetic analysis.............................. 120
GenBank sequences ............................................................................................................... 120 Consensus of South Australian Perkinsus olseni ITS2 region ................................................. 121 Confirmation of P. olseni isolates 12:978-11T and 13:1031-12T (University of Tokyo) ......... 123
Tables
TABLE 1 SUMMARY OF PCR ANALYSIS OF PERKINSUS REFERENCE SAMPLES. ...................................................................................... 24 TABLE 2 SUMMARY OF TESTING OF THISTLE ISLAND SAMPLES 14:0233 ........................................................................................... 26 TABLE 3 MEAN CT VALUES OF CANDIDATE PRIMER COMBINATIONS F1/R1 AND F3/R1, USING SERIALLY DILUTED GENOMIC DNA FROM AXENIC
REFERENCE CULTURES OF P. OLSENI, P. MARINUS, P. CHESAPEAKI, AND P. HONSHUENSIS. ........................................................... 36 TABLE 4 PLASMID SCREENING: MEAN CT OF SERIALLY DILUTED PTOPO P. OLSENI (85/750) PLASMID WITH GAUTHIER T-PERK GENUS-SPECIFIC
TAQMAN ASSAY AND THE AFDL POLS QPCR TAQMAN ASSAY USING A SET THRESHOLD OF 0.1. ................................................... 37 TABLE 5 GDNA SCEENING: MEAN CT VALUES OF SERIALLY DILUTED P. OLSENI GDNA (ATCC PRA-180) WITH GAUTHIER T-PERK GENUS-
SPECIFIC TAQMAN ASSAY AND THE AFDL POLS QPCR TAQMAN ASSAY USING A SET THRESHOLD OF 0.1. ........................................ 37 TABLE 6 MEAN CT VALUES OF SERIALLY DILUTED CLONED PLASMID DNA ITS REGION (85/750), OF P. OLSENI, P. MARINUS, P. CHESAPEAKI
AND P. HONSHUENSIS IN THE AFDL POLS QPCR (FIXED CUT-OFF 0.1)..................................................................................... 39 TABLE 7 COMPARISON OF MEAN CT VALUES OF SERIALLY DILUTED P. OLSENI PLASMID DNA ITS (85/750), USING TRNA AND POOLED
ABALONE GENOMIC DNA AS DILUENT IN THE AFDL POLS QPCR. ........................................................................................... 39 TABLE 8 TYPICAL CT VALUES AND STANDARD DEVIATION (SD) FOR P. OLSENI PTOPO-PLASMID CONTROLS (TRIPLICATE) OVER A RANGE FROM
20,000 TO 20 COPIES PER REACTION OVER MULTIPLE RUNS IN THE AFDL POLS QPCR TEST SYSTEM. THE MEAN CT VALUES ARE
INCLUDED FOR REFERENCE .............................................................................................................................................. 41 TABLE 9 TYPICAL CT VALUES AND STANDARD DEVIATION (SD) OF P. OLSENI GENOMIC DNA AT 3 CONCENTRATIONS OVER MULTIPLE RUNS IN
THE AFDL POLS QPCR, IN THE SAME CONCENTRATION RANGE SHOWN IN TABLE 6 ABOVE. ......................................................... 42 TABLE 10 SUMMARY OF INDIVIDUAL RESULTS FOR SEPARATE SAMPLES TESTED BY THE OIE PERKINSUS GENUS-SPECIFIC AND SPECIES-SPECIFIC
CONVENTIONAL PCR ASSAYS FOR 14:0233. ...................................................................................................................... 44 TABLE 11 SUMMARY OF CORRESPONDING RESULTS FOR REPLICATE SAMPLES TESTED BY THE AFDL POLS QPCR ASSAY FOR 14:0233. ......... 45 TABLE 12 SUMMARY OF CONVENTIONAL PCR AND REAL-TIME PCR SCREENING OF CORRESPONDING GILL AND MUSCLE SAMPLES (14:0233).
................................................................................................................................................................................. 47 TABLE 13 SUMMARY OF CORRESPONDING TEST RESULTS FOR PERKINSUS INFECTED ABALONE POPULATIONS. ........................................... 50 TABLE 14 CROSS-CLASSIFIED DATA FOR PERKINSUS AND NEGATIVE ABALONE DNA SAMPLES USED IN THE BAYESIAN ANALYSIS .................... 51 TABLE 15 CROSS-CLASSIFIED DATA FOR PERKINSUS AND NEGATIVE ABALONE DNA SAMPLES USED IN THE BAYESIAN ANALYSIS .................... 51 TABLE 16 CROSS-CLASSIFIED DATA FOR PERKINSUS-INFECTED POPULATION (PREVALENCE PI1~34%) .................................................... 52 TABLE 17 CROSS-CLASSIFIED DATA FOR POPULATION WITH NO HISTORY OF PERKINSUS INFECTION (PREVALENCE PI1~0.05%).................... 52 TABLE 18 INFECTED POPULATION (PREVALENCE PI1~34%) ........................................................................................................... 52 TABLE 19 POPULATION WITH NO HISTORY OF INFECTION (PREVALENCE PI1~0.05%) .......................................................................... 52 TABLE 20 RESULTS FOR BAYESIAN ANALYSIS FOR AFDL POLS QPCR USING 41.29 CT CUT-OFF ............................................................. 53 TABLE 21 RESULTS FOR BAYESIAN ANALYSIS FOR AFDL POLS QPCR USING < 39 CT CUT-OFF ............................................................... 53 TABLE 22 2 X 2 TABLE WITH RESULTS FROM BOTH MOLECULAR TESTS AND 3 POPULATIONS (MIXED P) ................................................. 110 TABLE 23 TABLE OF RESULTS FROM BOTH MOLECULAR TESTS AND UNKNOWN HISTORY OF INFECTION (LOW P) ...................................... 110 TABLE 24 TABLE OF RESULTS FROM BOTH MOLECULAR TESTS FOR DISEASE FREE POPULATION (VERY LOW P~<0.01) ............................... 110 TABLE 25 TABLE OF RESULTS FROM BOTH MOLECULAR TESTS FOR KNOWN INFECTED POPULATION (HIGH P ~ 0.3) .................................. 110 TABLE 26 PERKINSUS ISOLATES USED FOR DNA ALIGMENT AND CONSTRUCTION OF PHYLOGENETIC TREE .............................................. 123
P a g e | 4 of 127
Figures
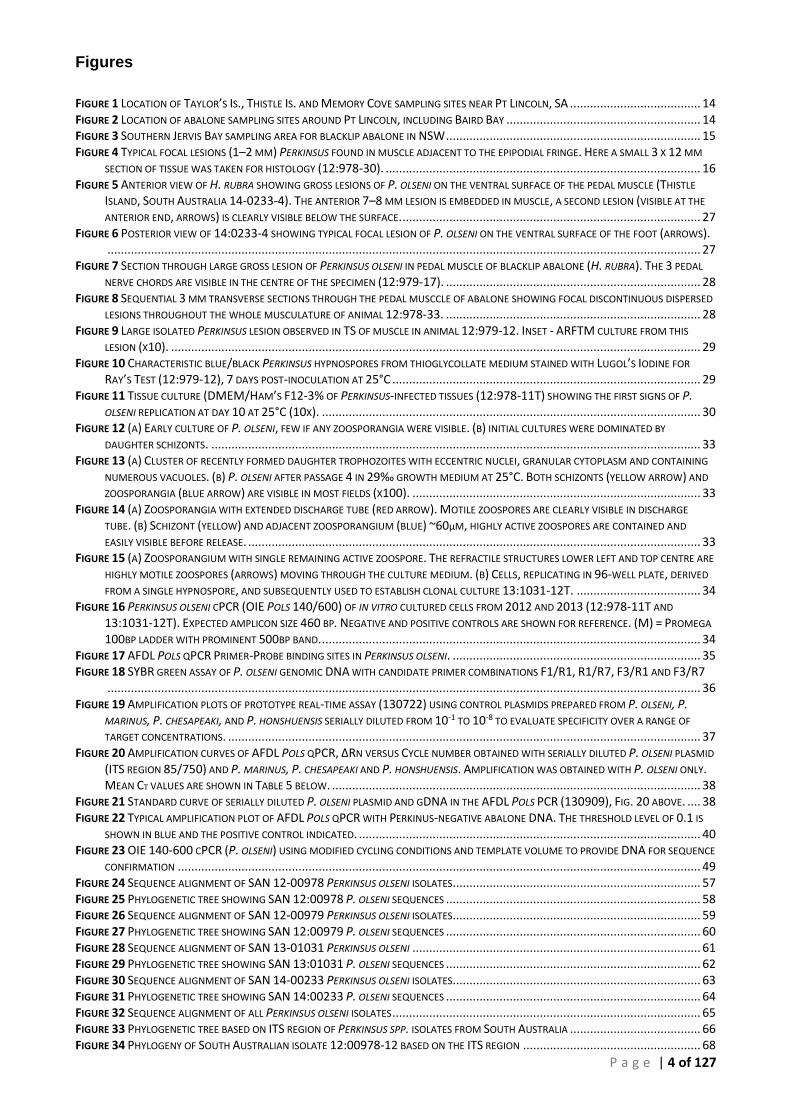
FIGURE 1 LOCATION OF TAYLOR’S IS., THISTLE IS. AND MEMORY COVE SAMPLING SITES NEAR PT LINCOLN, SA ....................................... 14 FIGURE 2 LOCATION OF ABALONE SAMPLING SITES AROUND PT LINCOLN, INCLUDING BAIRD BAY .......................................................... 14 FIGURE 3 SOUTHERN JERVIS BAY SAMPLING AREA FOR BLACKLIP ABALONE IN NSW ............................................................................ 15 FIGURE 4 TYPICAL FOCAL LESIONS (1–2 MM) PERKINSUS FOUND IN MUSCLE ADJACENT TO THE EPIPODIAL FRINGE. HERE A SMALL 3 X 12 MM
SECTION OF TISSUE WAS TAKEN FOR HISTOLOGY (12:978-30). .............................................................................................. 16 FIGURE 5 ANTERIOR VIEW OF H. RUBRA SHOWING GROSS LESIONS OF P. OLSENI ON THE VENTRAL SURFACE OF THE PEDAL MUSCLE (THISTLE
ISLAND, SOUTH AUSTRALIA 14-0233-4). THE ANTERIOR 7–8 MM LESION IS EMBEDDED IN MUSCLE, A SECOND LESION (VISIBLE AT THE
ANTERIOR END, ARROWS) IS CLEARLY VISIBLE BELOW THE SURFACE. ......................................................................................... 27 FIGURE 6 POSTERIOR VIEW OF 14:0233-4 SHOWING TYPICAL FOCAL LESION OF P. OLSENI ON THE VENTRAL SURFACE OF THE FOOT (ARROWS).
................................................................................................................................................................................. 27 FIGURE 7 SECTION THROUGH LARGE GROSS LESION OF PERKINSUS OLSENI IN PEDAL MUSCLE OF BLACKLIP ABALONE (H. RUBRA). THE 3 PEDAL
NERVE CHORDS ARE VISIBLE IN THE CENTRE OF THE SPECIMEN (12:979-17). ............................................................................ 28 FIGURE 8 SEQUENTIAL 3 MM TRANSVERSE SECTIONS THROUGH THE PEDAL MUSCCLE OF ABALONE SHOWING FOCAL DISCONTINUOUS DISPERSED
LESIONS THROUGHOUT THE WHOLE MUSCULATURE OF ANIMAL 12:978-33. ............................................................................ 28 FIGURE 9 LARGE ISOLATED PERKINSUS LESION OBSERVED IN TS OF MUSCLE IN ANIMAL 12:979-12. INSET - ARFTM CULTURE FROM THIS
LESION (X10). .............................................................................................................................................................. 29 FIGURE 10 CHARACTERISTIC BLUE/BLACK PERKINSUS HYPNOSPORES FROM THIOGLYCOLLATE MEDIUM STAINED WITH LUGOL’S IODINE FOR
RAY’S TEST (12:979-12), 7 DAYS POST-INOCULATION AT 25°C ............................................................................................ 29 FIGURE 11 TISSUE CULTURE (DMEM/HAM’S F12-3% OF PERKINSUS-INFECTED TISSUES (12:978-11T) SHOWING THE FIRST SIGNS OF P.
OLSENI REPLICATION AT DAY 10 AT 25°C (10X). ................................................................................................................. 30 FIGURE 12 (A) EARLY CULTURE OF P. OLSENI, FEW IF ANY ZOOSPORANGIA WERE VISIBLE. (B) INITIAL CULTURES WERE DOMINATED BY
DAUGHTER SCHIZONTS. .................................................................................................................................................. 33 FIGURE 13 (A) CLUSTER OF RECENTLY FORMED DAUGHTER TROPHOZOITES WITH ECCENTRIC NUCLEI, GRANULAR CYTOPLASM AND CONTAINING
NUMEROUS VACUOLES. (B) P. OLSENI AFTER PASSAGE 4 IN 29‰ GROWTH MEDIUM AT 25°C. BOTH SCHIZONTS (YELLOW ARROW) AND
ZOOSPORANGIA (BLUE ARROW) ARE VISIBLE IN MOST FIELDS (X100). ...................................................................................... 33 FIGURE 14 (A) ZOOSPORANGIA WITH EXTENDED DISCHARGE TUBE (RED ARROW). MOTILE ZOOSPORES ARE CLEARLY VISIBLE IN DISCHARGE
TUBE. (B) SCHIZONT (YELLOW) AND ADJACENT ZOOSPORANGIUM (BLUE) ~60µM, HIGHLY ACTIVE ZOOSPORES ARE CONTAINED AND
EASILY VISIBLE BEFORE RELEASE. ....................................................................................................................................... 33 FIGURE 15 (A) ZOOSPORANGIUM WITH SINGLE REMAINING ACTIVE ZOOSPORE. THE REFRACTILE STRUCTURES LOWER LEFT AND TOP CENTRE ARE
HIGHLY MOTILE ZOOSPORES (ARROWS) MOVING THROUGH THE CULTURE MEDIUM. (B) CELLS, REPLICATING IN 96-WELL PLATE, DERIVED
FROM A SINGLE HYPNOSPORE, AND SUBSEQUENTLY USED TO ESTABLISH CLONAL CULTURE 13:1031-12T. ..................................... 34 FIGURE 16 PERKINSUS OLSENI CPCR (OIE POLS 140/600) OF IN VITRO CULTURED CELLS FROM 2012 AND 2013 (12:978-11T AND
13:1031-12T). EXPECTED AMPLICON SIZE 460 BP. NEGATIVE AND POSITIVE CONTROLS ARE SHOWN FOR REFERENCE. (M) = PROMEGA
100BP LADDER WITH PROMINENT 500BP BAND. ................................................................................................................. 34 FIGURE 17 AFDL POLS QPCR PRIMER-PROBE BINDING SITES IN PERKINSUS OLSENI. .......................................................................... 35 FIGURE 18 SYBR GREEN ASSAY OF P. OLSENI GENOMIC DNA WITH CANDIDATE PRIMER COMBINATIONS F1/R1, R1/R7, F3/R1 AND F3/R7
................................................................................................................................................................................. 36 FIGURE 19 AMPLIFICATION PLOTS OF PROTOTYPE REAL-TIME ASSAY (130722) USING CONTROL PLASMIDS PREPARED FROM P. OLSENI, P.
MARINUS, P. CHESAPEAKI, AND P. HONSHUENSIS SERIALLY DILUTED FROM 10-1 TO 10-8 TO EVALUATE SPECIFICITY OVER A RANGE OF
TARGET CONCENTRATIONS. ............................................................................................................................................. 37 FIGURE 20 AMPLIFICATION CURVES OF AFDL POLS QPCR, ∆RN VERSUS CYCLE NUMBER OBTAINED WITH SERIALLY DILUTED P. OLSENI PLASMID
(ITS REGION 85/750) AND P. MARINUS, P. CHESAPEAKI AND P. HONSHUENSIS. AMPLIFICATION WAS OBTAINED WITH P. OLSENI ONLY. MEAN CT VALUES ARE SHOWN IN TABLE 5 BELOW. .............................................................................................................. 38
FIGURE 21 STANDARD CURVE OF SERIALLY DILUTED P. OLSENI PLASMID AND GDNA IN THE AFDL POLS PCR (130909), FIG. 20 ABOVE. .... 38 FIGURE 22 TYPICAL AMPLIFICATION PLOT OF AFDL POLS QPCR WITH PERKINUS-NEGATIVE ABALONE DNA. THE THRESHOLD LEVEL OF 0.1 IS
SHOWN IN BLUE AND THE POSITIVE CONTROL INDICATED. ...................................................................................................... 40 FIGURE 23 OIE 140-600 CPCR (P. OLSENI) USING MODIFIED CYCLING CONDITIONS AND TEMPLATE VOLUME TO PROVIDE DNA FOR SEQUENCE
CONFIRMATION ............................................................................................................................................................ 49 FIGURE 24 SEQUENCE ALIGNMENT OF SAN 12-00978 PERKINSUS OLSENI ISOLATES. ......................................................................... 57 FIGURE 25 PHYLOGENETIC TREE SHOWING SAN 12:00978 P. OLSENI SEQUENCES ............................................................................ 58 FIGURE 26 SEQUENCE ALIGNMENT OF SAN 12-00979 PERKINSUS OLSENI ISOLATES. ......................................................................... 59 FIGURE 27 PHYLOGENETIC TREE SHOWING SAN 12:00979 P. OLSENI SEQUENCES ............................................................................ 60 FIGURE 28 SEQUENCE ALIGNMENT OF SAN 13-01031 PERKINSUS OLSENI ...................................................................................... 61 FIGURE 29 PHYLOGENETIC TREE SHOWING SAN 13:01031 P. OLSENI SEQUENCES ............................................................................ 62 FIGURE 30 SEQUENCE ALIGNMENT OF SAN 14-00233 PERKINSUS OLSENI ISOLATES .......................................................................... 63 FIGURE 31 PHYLOGENETIC TREE SHOWING SAN 14:00233 P. OLSENI SEQUENCES ............................................................................ 64 FIGURE 32 SEQUENCE ALIGNMENT OF ALL PERKINSUS OLSENI ISOLATES ............................................................................................ 65 FIGURE 33 PHYLOGENETIC TREE BASED ON ITS REGION OF PERKINSUS SPP. ISOLATES FROM SOUTH AUSTRALIA ....................................... 66 FIGURE 34 PHYLOGENY OF SOUTH AUSTRALIAN ISOLATE 12:00978-12 BASED ON THE ITS REGION ..................................................... 68
P a g e | 5 of 127
FIGURE 35 PHYLOGENY OF SOUTH AUSTRALIAN ISOLATE 12:00978-12 BASED ON THE LSU SEQUENCE ................................................ 69 FIGURE 36 PHYLOGENY OF SOUTH AUSTRALIAN ISOLATE 12:00978-12 BASED ON THE ACTIN GENE ..................................................... 70 FIGURE 37 NORMAL APPEARANCE OF UNINFECTED BLACKLIP ABLAONE (H. RUBRA) REMOVED FROM SHELL FOR DISSECTION. ...................... 96 FIGURE 38 NORNAL ABALONE SEEN IN SEQUENTIAL TS OF THE PEDAL MUSCLE AT 2-3 MM SLICES FOR EXAMINATION FOR PERKINSUS LESIONS.
THE 3 NEURAL GANGLIA CAN BE SEEN AT THE MIDLINE. ......................................................................................................... 96 FIGURE 39 PROMINANT PERKINSUS LESION ON DORSAL SURFACE OF MUSCLE IN ANIMAL 14:0233-11. ................................................. 97 FIGURE 40 LARGE ACTIVE PERKINSUS LESION SMALLER DARK LESIONS DISPERSED THROUGHOUT THE MUSCULATURE. IN THIS CASE, ALTHOUGH
LESIONS ARE WIDESPREAD INTERNALLY, NO LESIONS WERE OBSERVED DURING EXTERNAL EXAMINATION. ........................................ 97 FIGURE 41 LESIONS COMMONLY APPEAR SCATTERED OVER THE SURFACE OF THE PEDAL MUSCLE IN INFECTED ANIAMLS. ENCYSTED NEMATODES
MAY PRODUCE A SIMILAR LESION. THESE LESIONS ARE NOT PATHOGNOMIC FOR PERKINSUS, AND FURTHER LABORATORY EXAMINATION IS
REQUIRED FOR RELIABLE DIAGNOSIS OF SMALLER LESIONS. ..................................................................................................... 98 FIGURE 42 (A)-(C) TS THROUGH PEDAL MUSCLE OF VARIOUS BLACKLIP ABALONE (HALIOTIS RUBRA) INFECTED WITH P. OLSENI. A VAREITY OF
LESIONS IN SEVERELY AFFECTED HARVEST SIZE ANIMALS ARE SHOWN. PRESUMABLY SOME OF THESE INFECTIONS ARE CHRONIC AND
PERSIST FROM YEARS TO YEAR. ......................................................................................................................................... 99 FIGURE 43 ROC CURVE OF AFDL POLS QPCR DATA USED TO GENERATE THE CUT-OFF FOR BAYESIAN ANALYSIS ..................................... 106 FIGURE 44 INTERACTIVE DOT PLOT OF AFDL POLS QPCR DATA FROM THE ROC ANALYSIS SHOWN IN FIGURE 42................................... 106 FIGURE 45 MODIFIED ROC CURVE OF AFDL POLS QPCR DATA SHOWING THE DSE AND DSE FOR ALL CUT-OFF VALUES AT THE 95% CI. .... 107 FIGURE 46 ALIGNMENT AND COMPARISON OF P. OLSENI CONSENSUS SEQUENCE FROM SOUTH AUSTRALIAN ABALONE (H. RUBRA) AND
QUEENSLAND MUD ARKS (ANADARA TRAPEZIA) WITH P. OLSENI SEQUENCE FROM NCBI. .......................................................... 122 FIGURE 47 PHYLOGENETIC TREE OF PERKINSUS ISOLATES, INCLUDING AUS_ITS CONSENSUS. ........................................................... 123 FIGURE 48 ALIGNMENT OF PERKINSUS ISOLATES, INCLUDING AUS_ITS CONSENSUS SEQUENCE GENERATED USING IN VITRO CULTURES 12:978-
11T AND 13:1031-12T .............................................................................................................................................. 124
P a g e | 6 of 127
Acknowledgments
The authors would like to thank the Primary Industries and Regions South Australia - South Australian Research and Development Institute (PIRSA-SARDI) for the use of laboratory and aquarium facilities at the Lincoln Marine Science Centre. We also thank Dr Marty Deveney (PIRSA-SARDI) for his expert advice and generous assistance with the examination of abalone field samples. Dr Ben Stobart and Mr Jay Dent (PIRSA-SARDI) are acknowledged for the difficult and dangerous work of field collection of abalone in the Port Lincoln area.
We also thank Ms. Samara Miller and the Abalone Industry Association of South Australia for their support and assistance with the collection of infected abalone in South Australia.
The help and advice of Mr Duncan Worthington and the assistance of Mr Dick Perese and Mr Ben Perese, for the field collection of abalone from NSW is gratefully acknowledged as is the NSW Department of Primary Industries for allowing the collection of specimens in the Jervis Bay Marine Park Habitat Protection Zone.
We also thank Professor Tomoyoshi Yoshinaga, Department of Aquatic Bioscience, University of Tokyo for independently confirming the sequence of Perkinsus olseni cultures submitted to ATCC and Ms Lynette Williams, and Mr John Hoad (CSIRO Australian Animal Health Laboratory) for their help with the collection and processing of laboratory samples over the course of the project.
The following contributors are also acknowledged for their advice and help, including the provision of laboratory protocols, histological reference material and reference samples for PCR development. We also thank Dr Tomoyoshi Yoshinaga for undertaking independent DNA sequence analysis for confirmation of P. olseni isolates established in this project.
Professor Kimberly S. Reece and Professor Ryan B. Carnegie OIE Perkinsus Reference Centre Department of Aquatic Health Sciences Virginia Institute of Marine Science Gloucester Point, VA USA Dr Chris Dungan Senior Research Scientist Cooperative Oxford Laboratory 904 South Morris Street Oxford, Maryland 21654 USA Professor David Bushek Associate Professor Haskin Shellfish Research Laboratory 6959 Miller Avenue Port Norris, NJ 08349 USA Professor Tomoyoshi Yoshinaga Laboratory of Fish Diseases Graduate School of Agricultural and Life Sciences University of Tokyo Yayoi 1-1-1, Bunkyo-ku, Tokyo 113-8657, Japan
P a g e | 7 of 127
Abbreviations
AAHL Australian Animal Health Laboratory
ARFTM Alternative Ray’s Fluid Thioglycollate Medium
ASe analytical sensitivity of assay
ASp analytical specificity of assay
ATCC American Type Culture Collection
BLAST Basic Local Alignment Search Tool - http://blast.ncbi.nlm.nih.gov/
CSIRO Commonwealth Scientific and Industrial Research Organisation
cPCR conventional PCR
CT real-time PCR threshold cycle
Davidson’s Davidson's fixative (Shaw and Battle, 1957)
DMEM Dulbecco's Modified Eagle Medium
DMEM/Ham’s F12-3% DMEM with Ham’s Nutrient Mixture F12 and 3% foetal bovine serum
DMSO Dimethyl sulfoxide - (CH₃)₂SO
DNA deoxyribonucleic acid
DSe sensitivity of diagnostic test
DSp specificity of diagnostic test
FBS foetal bovine serum
FRDC Fisheries Research and Development Corporation
g gravitational force
gDNA genomic DNA
Ham’s F12 Ham’s Nutrient Mixture F12
ICES Conseil International pour l’Exploration de la Mer
ITS internal transcribed spacer
LSU rRNA large subunit ribosomal RNA
MGB minor groove binding
nt nucleotide
NTS non-transcribed spacer
nt nucleotide
OIE Office International des Epizooties – the World Organisation for Animal Health
PBS phosphate-buffered saline
PCR polymerase chain reaction
qPCR quantitative PCR (real-time PCR)
RNA ribonucleic acid
SASW sterile artificial seawater
SCAAH Sub-committee on Aquatic Animal Health
SSU rRNA small subunit ribosomal RNA
tRNA transfer RNA
TS transverse section
v/v volume per volume
w/v weight per volume
P a g e | 8 of 127
Executive Summary
Background
Perkinsus is the widespread cause of disease and lost production in mollusc fisheries world-wide. Found mostly in temperate waters, two species are listed internationally as notifiable by the OIE and also appear on Australia's National List of Reportable Diseases of Aquatic Animals. Although Perkinsus marinus is exotic to Australia, Perkinsus olseni is enzootic and well-known as the cause of serious infections in various wild abalone populations in south-eastern Australia.
The rapid identification and reliable differentiation of species is a major issue in the diagnosis and management of Perkinsosis in Australia. Traditional methods of Perkinsus diagnosis, such as histology and Ray’s thioglycollate culture, are straightforward and practical, however they lack sensitivity and fail to differentiate specific species. The molecular methods currently recommended by the OIE are based on conventional 1-step PCR which is generally more labour intensive, slower and less sensitive than real-time PCR.
The primary aim of this project was to develop and validate a species-specific real-time PCR (qPCR) assay for Perkinsus olseni.
Aims/Objectives
The aims and objectives of the project were:
1. Undertake a targeted molecular, histological and cultural examination of known Perkinsus-infected wild abalone populations to compare existing methods of detection.
2. Establish representative axenic (single species) cultures of Perkinsus sp. from infected abalone.
3. Use established PCRs and DNA sequencing methods to confirm the presence of P. olseni and determine the genetic diversity, including other Perkinsus sp. from these populations.
4. Develop and validate qPCR methods for the detection and identification of P. olseni in infected abalone.
5. Compare and evaluate the performance of the objective 4 qPCR with existing conventional PCR methods for detection of P. olseni.
Methodology
Scientists from the CSIRO Australian Animal Health Laboratory in Geelong, have undertaken a study of Perkinsus in blacklip abalone to develop a new qPCR system for the diagnosis of P. olseni. The design of primers and probe for the P. olseni Taqman® assay was based on DNA sequence from infected abalone collected from South Australia over the course of the project and sequence data publically available through GenBank.
Single species (axenic) cell cultures of P. olseni from abalone were established using standard methods of propagation. Cell cultures were confirmed by sequencing and phylogenetic analysis of the ITS, LSU and actin genes. DNA sequence was independently confirmed by experts in Japan.
The accumulated test data were used to compare the new qPCR assay with exiting test methods. Validation of the P. olseni qPCR was based on a wide range of samples including mollusc field samples, cloned plasmids and axenic reference cultures of Perkinsus. The analytical sensitivity (ASe) of the test system was determined using serially diluted plasmid DNA and genomic DNA from cultured cells. All calculations of diagnostic sensitivity and specificity were based on testing of naturally infected animals. The diagnostic performance characteristics of the assay were also determined by ROC and Bayesian analysis to obtain estimates of diagnostic sensitivity and specificity.
P a g e | 9 of 127
Results
A species-specific Taqman® based real-time PCR for P. olseni was developed. The analytical specificity (ASp) of the system was 100% with respect to a range of non-target Perkinsus reference samples (n = 42). The system could detect 1 to 2 copies/µl of target DNA in a background of abalone genomic DNA, and plasmid dilutions between 2 and 20 copies per PCR reaction represent the 95% confidence limit of analytical sensitivity as recommended by the OIE. The CT values from the equivalent amount of P. olseni genomic DNA (600 pg to 1 fg) were linear over this range.
ROC analysis provided an estimate of the relative diagnostic sensitivity (DSe) of 94.6% and diagnostic specificity (DSp) of 92.8% at a preliminary cut-off CT of 41.29 for the new AFDL Pols qPCR using the OIE species-specific PCR assay as a reference. When different tissues were used our analysis shows that the DSe obtained with the AFDL Pols qPCR with gill and muscle were similar, 0.88 and 0.92, respectively.
While the primary focus of the project was the development of the qPCR, cell cultures were to be used as the basis of DNA sequencing. Although this strategy was modified, two cryopreserved axenic cultures of P. olseni were established. These are the first in vitro cultures of P. olseni propagated from abalone in Australia. The culture from Thistle Island, South Australia 2012 (12:978-11T) was obtained from a site near Memory Cove, South Australia and was accepted as the holotype culture for P. olseni by the ATCC.
The sequencing and phylogenetic analysis undertaken in this project confirmed the taxonomy and identification of the field samples used for test development and the identity of the in vitro cultures. Analysis of DNA sequence from the ITS region indicated that there had been little change in this region since 1989 and that this region remains a stable and useful target for molecular detection.
Implications for relevant stakeholders
The molecular assay developed in this project provides rapid detection and identification of species and has application for testing individuals from outbreaks or high-throughput surveillance of populations for certification and management of stocks.
The development of a highly sensitive and highly specific diagnostic test has the potential to provide state government authorities, their diagnostic laboratories, and their fisheries managers and regulators with improved diagnostic capability not only for the diagnosis of Perkinsosis (specifically, rapid identification of the causative agent) but also for the detection and identification of sub-clinical infections. The provision of a validated diagnostic test with estimates of diagnostic specificity and sensitivity allows the design of surveillance programs and sampling protocols to be based on reliable scientific data. The test can be implemented in the recently developed abalone farm accreditation program.
Recommendations
It is recommended that details of this test be provided to diagnostic laboratories for immediate implementation in state jurisdictions that have a need for Perkinsus diagnostics. Moreover, the method and validation should be published in a peer-reviewed scientific journal to facilitate wider adoption of the test through inclusion in the OIE Manual of Diagnostic Tests for Aquatic Animals.
Keywords
Australia, mollusc, protozoa, Alveolata, Perkinsozoa, Perkinsea, Perkinsida, Perkinsidae, Perkinsus olseni, Perkinsus atlanticus, Perkinsosis, PCR, real-time PCR, qPCR, cell-culture, in vitro culture, Haliotis rubra, blacklip abalone, PCR validation, ROC analysis, Bayesian analysis, in vitro culture, diagnostic validation.
P a g e | 10 of 127
Introduction
The discovery of Perkinsus arose out of investigations, beginning in 1946, into the cause of massive mortalities and population decline in the native American oyster Crassostrea virginica, in the Gulf of Mexico. At first, the activity of oil companies close to the coast was thought to be responsible, but a small spherical protozoan, first called Dermocystidium marinum was discovered in the diseased oysters (Mackin, Owen and Collier, 1950). We now know this organism as Perkinsus marinus.
Typically, early descriptions of Perkinsus species relied on differences in geographic and host ranges as a basis for species discrimination. Although variations in morphology were observed among Perkinsus, it is difficult to differentiate species based on morphology alone, and in some cases difficult to distinguish Perkinsus from other protists, such as Colpodella, which has similar morphological features (Villalba et al., 2004). Nevertheless morphological analysis was used to support numerous reclassifications, at times placing Perkinsus in: the Ascomycetales, Entomophthorales, Saprolegnales, Haplosporidia, Labyrinthuloides and the Apicomplexa (Mackin, 1951; Sprague, 1954; Mackin and Boswell, 1956; Mackin, 1962; Mackin and Ray, 1966; Perkins, 1976). In 1978 the genus Perkinsus was established, placing P. marinus in the Apicomplexa (Levine, 1978). Unfortunately considerable disagreement on the classification of Perkinsus remained.
The first DNA sequences for Perkinsus were published by Fong et al. (1993) and Goggin and Barker (1993). Their phylogenetic analysis of the small subunit ribosomal RNA (SSU rRNA) gene sequence suggested that Perkinsus species were more closely related to Dinoflagellates than the Apicomplexans. Since then, the development of DNA technology has facilitated further re-evaluation through analyses of multiple DNA loci, such as the ITS and NTS regions, and the SSU rRNA, LSU rRNA and actin genes commonly targeted. As a result, the taxonomic position of species within the genus Perkinsus has now been refined (Burreson et al., 2005; Murrell et al., 2002).
More generally, Zhang et al. (2011) have supported the affiliation of the genus Perkinsus with an independent lineage (Perkinsozoa) positioned between the phyla of Dinoflagellata and Apicomplexa, within the group of taxa referred to as the Alveolates, which includes the ciliates, dinoflagellates and apicomplexans. Based on these analyses, current classification places the genus Perkinsus within the phylum Perkinsozoa in the superphylum Alveolata.
Domain: Eukaryota Kingdom: Chromalveolata Superphylum: Alveolata (Possessing cortical alveoli, cavities) Phylum: Perkinsozoa1 (Genus Perkinsus and protists that do not fit existing Alveolata phyla) Class: Perkinsea Order: Perkinsida Family: Perkinsidae Genus: Perkinsus (Levine 1978)
Seven species of Perkinsus are currently recognized: P. beihaiensis (Moss et al., 2008), P. chesapeaki (syn. P. andrewsi) (McLaughlin et al., 2000), P. honshuensis (Dungan and Reece, 2006), P. marinus (Mackin et al., 1950), P. mediterraneus (Casas et al., 2004), P. olseni (syn. P. atlanticus) (Lester and Davies, 1989) and P. qugwadii (Blackbourn et al., 1998).
1 Norén, F, Moestrup, Ø, Rehnstam-Holm, Ann-Sofi. 1999. Parvilucifera infectans norén et moestrup gen. et sp. nov. (perkinsozoa
phylum nov.): a parasitic flagellate capable of killing toxic microalgae. European Journal of Protistology 35(3): 233–254.
P a g e | 11 of 127
Perkinsus is the widespread cause of disease and lost production in mollusc fisheries world-wide. Found mostly in temperate waters, two species are listed internationally as notifiable by the OIE2 and also appear on Australia's National List of Reportable Diseases of Aquatic Animals3. Although Perkinsus marinus is exotic to Australia, Perkinsus olseni is enzootic and well-known as the cause of serious infections in various wild abalone populations in south-eastern Australia.
Perkinsus proliferates in tissues and may produce brown pustules or abscesses. These may contain a caseous creamy-brown exudate. In chronically infected populations, these abscesses are found in the pedal muscle and mantle of Haliotis rubra and H. laevigata thereby significantly reducing their market value. In outbreaks of P. olseni infection in culture facilities in Australia, 30 to 40% mortalities have occurred among H. laevigata. In each case, introduced blacklip abalone (H. rubra) were found to be responsible for the outbreaks (Goggin and Lester, 1995). Transmission of this parasite occurs directly between individual molluscs. Prezoosporangia from rupturing abscesses or decaying abalone undergo development to zoosporangia in seawater. This occurs within nine days at 20 °C and three days at 28 °C and hundreds of motile, biflagellate zoospores are produced. The zoospores are infective to abalone as well as other molluscs (Goggin et al., 1989). Field studies indicated that infections of P. olseni in wild H. rubra are positively correlated with both water temperature and size of abalone, the parasite being maintained in the environment by H. rubra with negligible contributions from other susceptible abalone species or other molluscs (Lester et al. 2001).
According to the OIE Manual of Diagnostic Tests for Aquatic Animals (OIE, 2015), P. olseni has an extremely wide host range. Known hosts include the clams Anadara trapezia, Austrovenus stutchburyi, Ruditapes decussatus, R. philippinarum, Tridacna maxima, T. crocea, Protothaca jedoensis and Pitar rostrata (Goggin & Lester, 1995; Villalba et al., 2004; Cremonte et al., 2005; Park et al., 2006; Sheppard & Phillips, 2008); oysters Crassostrea gigas, C. ariakensis, and C. sikamea (Villalba et al., 2004); pearl oysters Pinctada margaritifera, P. martensii, and P. fucata (Goggin & Lester, 1995; Sanil et al., 2010); and abalone Haliotis rubra, H. laevigata, H. scalaris, and H. cyclobates (Goggin & Lester, 1995). It is likely that other sympatric bivalve and gastropod hosts exist within the geographic range.
The detection, rapid identification and reliable differentiation of species is a major issue in the diagnosis and management of Perkinsosis in Australia and elsewhere. Histology and, above all, incubation of host tissues in Ray’s fluid thioglycollate medium (ARFTM) have been the classic methods for Perkinsus diagnosis. These traditional methods, are straightforward and practical, however they lack sensitivity and fail to differentiate specific species.
PCR has established itself as a sensitive diagnostic technique for Perkinsus (Villalba et al., 2004), with the ability to detect and differentiate species (Coss et al., 2001: Gauthier et al., 2006; Audemard et al., 2004; Moss et al., 2006; Moss et al., 2008). However, the molecular methods currently recommended by the OIE are based on conventional 1-step PCR which is generally more labour intensive, slower and less sensitive than the real-time PCRs now implemented for many diseases in diagnostic laboratories.
The primary aim of this project was to develop and validate a species-specific real-time PCR (qPCR) assay for Perkinsus olseni. The samples collected for initial screening would also be used to formally validate the new molecular test procedures developed, providing direct confirmation of the accuracy and reliability of both the assays and associated test procedures compared with the existing conventional PCRs. At the same time the proposed sampling would provide an opportunity to establish in vitro cultures of P. olseni from blacklip abalone (Haliotis rubra) for DNA sequencing and phylogenetic analysis. The cultures would also be available for further research, and will be made available through the ATCC. The targeted field sampling of known infected populations would also provide an opportunity to investigate speculation arising from the genetic analysis of Perkinsus samples from blacklip abalone in NSW. These data suggested that a Perkinsus ITS variant detected previously, possibly constitutes a new species (Reece et al., 2010).
2 http://www.oie.int/en/international-standard-setting/aquatic-code/access-online/
3 http://www.agriculture.gov.au/animal/aquatic/reporting/reportable-diseases
P a g e | 12 of 127
Objectives
1. Undertake a targeted molecular, histological and cultural examination of known Perkinsus-infected wild abalone populations to compare existing methods of detection.
2. Establish representative axenic (single species) cultures of Perkinsus sp. from infected abalone.
3. Use established PCRs and DNA sequencing methods to confirm the presence of P. olseni and determine the genetic diversity, including other Perkinsus sp. from these populations.
4. Develop and validate qPCR methods for the detection and identification of P. olseni in infected abalone.
5. Compare and evaluate the performance of the objective 4 qPCR with existing conventional PCR methods for detection of P. olseni.
P a g e | 13 of 127
Methods
Reference and Control Samples
A range of Perkinsus reference samples was obtained as a result of generous donation from a number of laboratories. In particular, the authors thank the OIE Perkinsus Reference Laboratory, Virginia Institute of Marine Science and Dr Chris Dungan, NOAA Cooperative Oxford Laboratory.
Reference materials included formalin-fixed paraffin-embedded tissues for histology, ethanol-fixed tissues from a variety of mollusc species and ethanol-fixed axenic cultures of most Perkinsus species. The axenic cultures provided a source of uncontaminated Perkinsus genomic gDNA. The reference samples accumulated over the course of the project are summarised in Appendix 2.
Field Sampling
It was assumed that larger animals were older and were thus potentially exposed to infection over a longer period of time. Collection by divers was therefore biased towards the selection of larger animals.
Field Sampling – Victoria (Perkinsus-negative DNA library)
In order to establish a baseline for testing and validation of the qPCR test developed here a large Perkinsus-negative DNA library from blacklip abalone (Haliotis rubra) was prepared. Clinically normal wild abalone (n=200) were collected with the assistance of commercial divers from multiple sites from 38° 24 209 S to
142° 28 627 E along the southern Victorian coast in 2012. This area was selected because there are no reports of Perkinsus infection here and these populations are recognised as being free of Perkinsus.
Sampling was conducted in 2012 over a period of weeks from sub-tidal reefs at 5-7 m. A mean water temperature of 13.3°C was reported at this time. Tissue samples of gill and muscle from individual animals were fixed in 90% v/v ethanol and stored at 4°C prior to nucleic acid isolation.
Field Sampling – South Australia
The purpose of sample collection in South Australia was to obtain a range of Perkinsus-infected tissues from naturally infected populations of abalone. These tissues would provide material for qPCR test development, tissue culture propagation of Perkinsus olseni and PCR test validation. With the assistance of divers from South Australian Research and Development Institute, Primary Industries and Regions South Australia (PIRSA-SARDI), sampling was undertaken at 6 locations around the Port Lincoln area from April 2012 to April 2014. As with the Victorian collection, all sampling was confined to the blacklip abalone (Haliotis rubra).
As divers tend to avoid infected reefs, these sampling sites were selected on the basis of historical reports of Perkinsus in blacklip abalone at or nearby these locations. These included the east side of Taylor’s Island 34° 52.606'S, 136° 0.897'E, where 50 animals of mean length 131 mm were taken. This site was the location of an earlier FRDC-funded study, FRDC Project No. 2000/151, which reported a high prevalence of chronic infection in previous years. As Memory Cove was the site from which P. olseni was first described (Lester and Davis, 1981)4 animals were collected (n = 10, mean length 128 mm) from this site 34° 59.279'S 135° 59.150'E in order to obtain representative material as close as possible to that originally described. Disease
4 In the original publication which describes Perkinsus olseni the type locality of host abalone is reported as near Pt. Lincoln, South Australia Latitude 35°56’S, Longitude 135°59’W. This position is between New Zealand and South America. As samples from Memory Cove were also examined, this site was assumed to be the type locality.
P a g e | 14 of 127
had been observed recently by divers at Thistle Island 34° 57.173'S 136° 7.791'E (n = 22, mean length 137 mm), and 3 sites around Baird Bay (near 33° 9.462'S 134° 25.833'E) where 17 animals were taken.
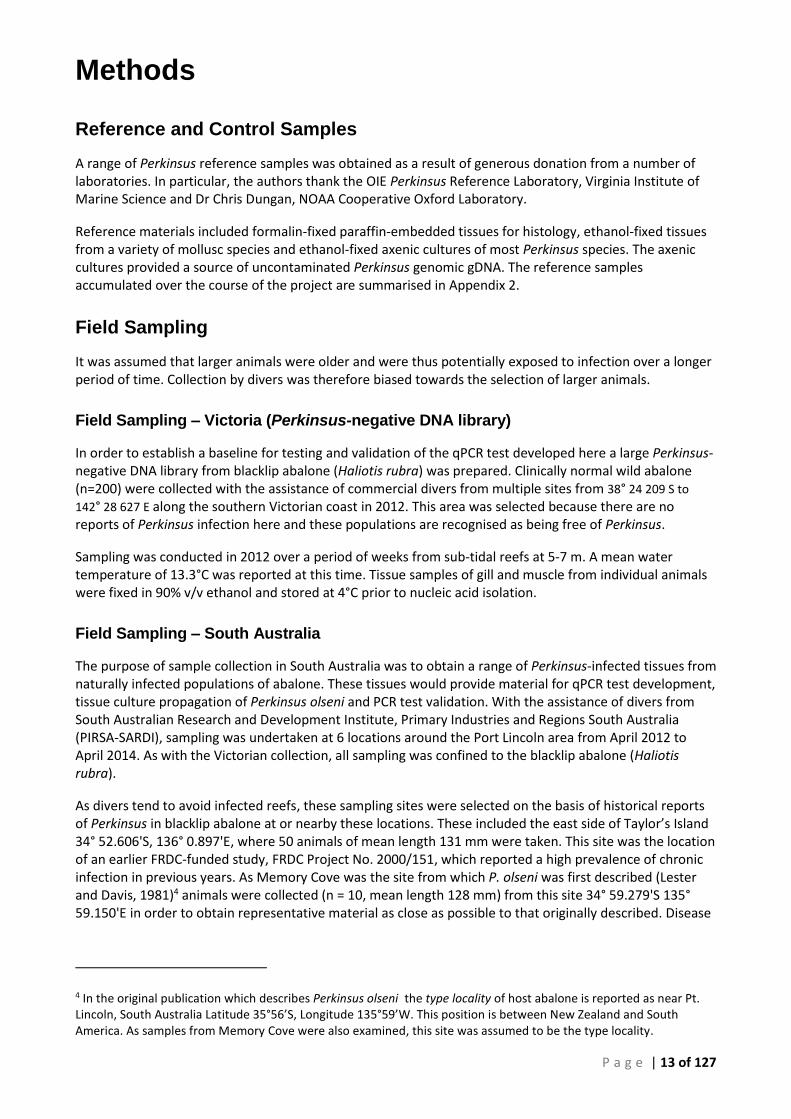
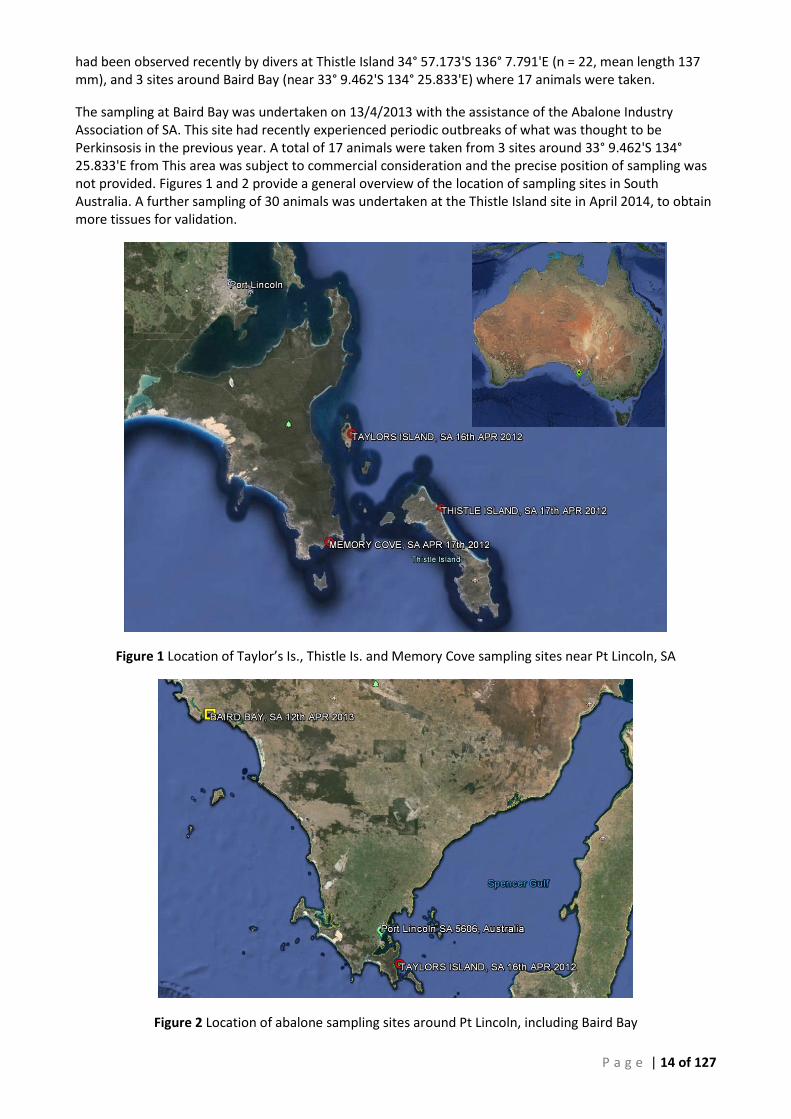
The sampling at Baird Bay was undertaken on 13/4/2013 with the assistance of the Abalone Industry Association of SA. This site had recently experienced periodic outbreaks of what was thought to be Perkinsosis in the previous year. A total of 17 animals were taken from 3 sites around 33° 9.462'S 134° 25.833'E from This area was subject to commercial consideration and the precise position of sampling was not provided. Figures 1 and 2 provide a general overview of the location of sampling sites in South Australia. A further sampling of 30 animals was undertaken at the Thistle Island site in April 2014, to obtain more tissues for validation.
Figure 1 Location of Taylor’s Is., Thistle Is. and Memory Cove sampling sites near Pt Lincoln, SA
Figure 2 Location of abalone sampling sites around Pt Lincoln, including Baird Bay
P a g e | 15 of 127
Field Sampling – New South Wales
The purpose of this sampling was to obtain a wider range of geographically dispersed P. olseni in order to further validate the qPCR, to establish in vitro cultures from this area and to further characterise the genetic diversity of P. olseni in Australia. Of particular interest was the recently reported ITS variant from this area (Reece et al., 2010).
Despite the widespread mortalities attributed to Perkinsus in NSW in the early 2000’s (Liggins et al., 2010), only passive monitoring is undertaken for Perkinsus in NSW. As a result there is little information on the current distribution of Perkinsus along the NSW coast. It is difficult to accept that the mass mortalities and infection previously observed were self-limiting and that Perkinsus has disappeared from the east coast of Australia. The lack of current information from commercial fishers and Fisheries NSW regarding the distribution of Perkinsus was a significant impediment to obtaining useful samples from NSW. As our funding was confined to the sampling of a limited number of specific sites, an area around St Georges Head, just south of Jervis Bay, was selected for targeted sampling and a permit was obtained from the NSW National Parks service. Although no sampling has taken place at this site for some years both P. olseni and the ITS variant (Reece et al. 2010) were both previously reported from this area with reasonable frequency (Liggins and Upston, 2010). Given the apparent spread of disease southwards along the coast, this area and an adjacent area just south at Sussex Inlet were selected for sampling.
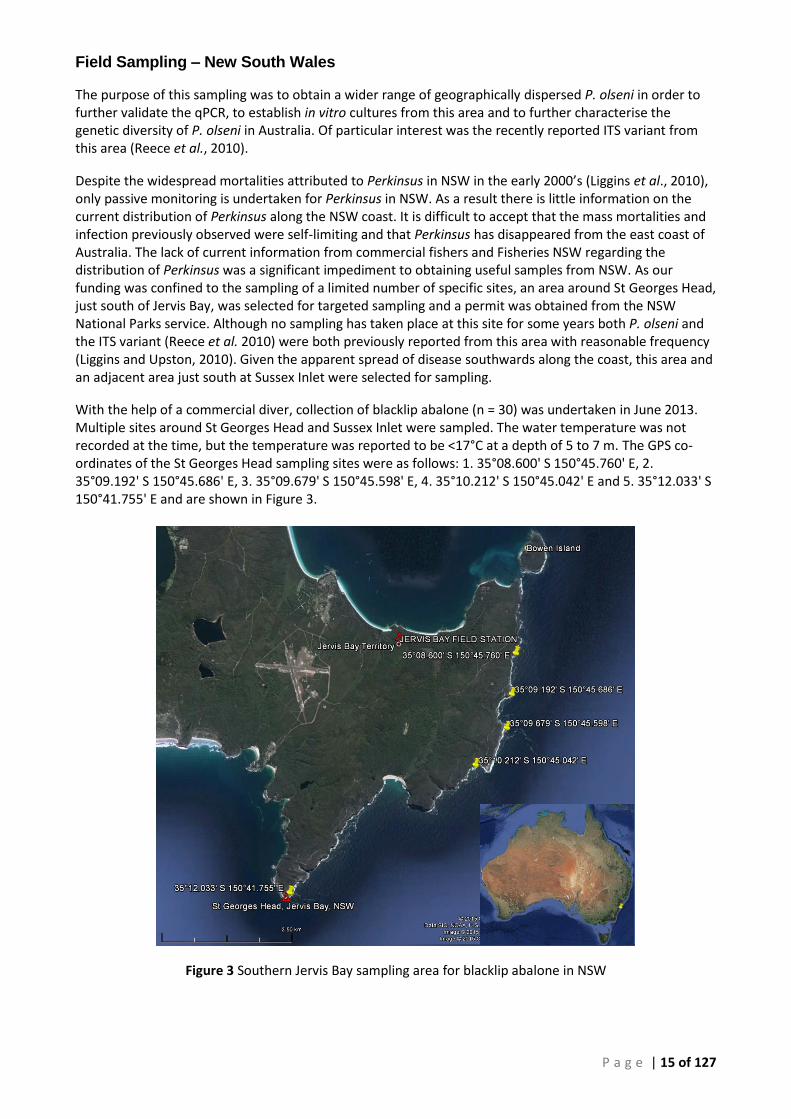
With the help of a commercial diver, collection of blacklip abalone (n = 30) was undertaken in June 2013. Multiple sites around St Georges Head and Sussex Inlet were sampled. The water temperature was not recorded at the time, but the temperature was reported to be <17°C at a depth of 5 to 7 m. The GPS co-ordinates of the St Georges Head sampling sites were as follows: 1. 35°08.600' S 150°45.760' E, 2. 35°09.192' S 150°45.686' E, 3. 35°09.679' S 150°45.598' E, 4. 35°10.212' S 150°45.042' E and 5. 35°12.033' S 150°41.755' E and are shown in Figure 3.
Figure 3 Southern Jervis Bay sampling area for blacklip abalone in NSW
P a g e | 16 of 127
Laboratory Examination
All abalone were subjected to detailed laboratory examination which included, gross examination for lesions or other signs of disease, culture in ARFTM, tissue culture, histology, PCR (OIE-recommended assays) and the genus-specific real-time (qPCR) of Gauthier et al. (2006). Samples were also screened using the new real-time PCR (AFDL Pols qPCR) developed in this project. Together these data were analysed and used to validate the assay.
Histology
All samples for histology were cut directly into pre-labelled histology cassettes and fixed in Davidson’s solution. If samples could not be processed within 48 hours, the fixed tissues were transferred to 70% (v/v) ethanol before embedding. Samples for PCR were taken from adjacent tissues at the same time. The procedure for selecting tissues was standardised to maximise the possible detection of Perkinsus and ensure consistency between populations. The process of dissection and sampling is summarised in Appendix 4.
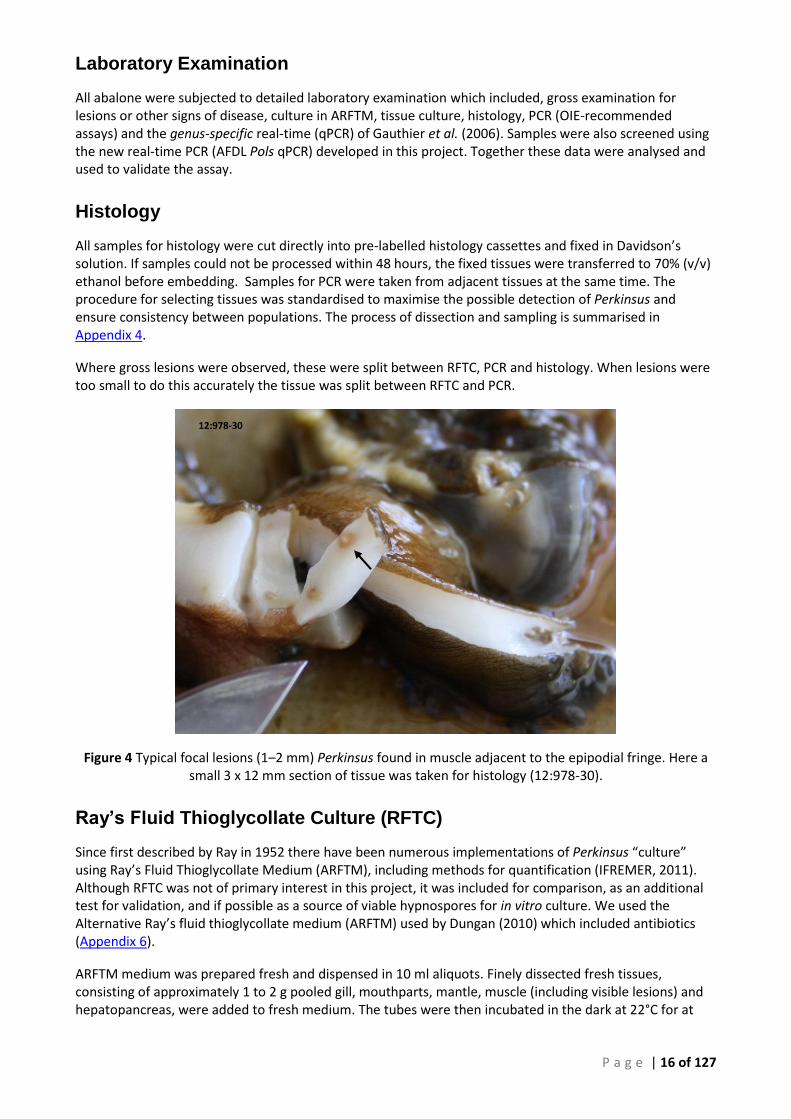
Where gross lesions were observed, these were split between RFTC, PCR and histology. When lesions were too small to do this accurately the tissue was split between RFTC and PCR.
Figure 4 Typical focal lesions (1–2 mm) Perkinsus found in muscle adjacent to the epipodial fringe. Here a small 3 x 12 mm section of tissue was taken for histology (12:978-30).
Ray’s Fluid Thioglycollate Culture (RFTC)
Since first described by Ray in 1952 there have been numerous implementations of Perkinsus “culture” using Ray’s Fluid Thioglycollate Medium (ARFTM), including methods for quantification (IFREMER, 2011). Although RFTC was not of primary interest in this project, it was included for comparison, as an additional test for validation, and if possible as a source of viable hypnospores for in vitro culture. We used the Alternative Ray’s fluid thioglycollate medium (ARFTM) used by Dungan (2010) which included antibiotics (Appendix 6).
ARFTM medium was prepared fresh and dispensed in 10 ml aliquots. Finely dissected fresh tissues, consisting of approximately 1 to 2 g pooled gill, mouthparts, mantle, muscle (including visible lesions) and hepatopancreas, were added to fresh medium. The tubes were then incubated in the dark at 22°C for at
12:978-30
P a g e | 17 of 127
least one week before microscopic examination. After the first samples from South Australia were cultured, hepatopancreas was cultured separately in a second tube.
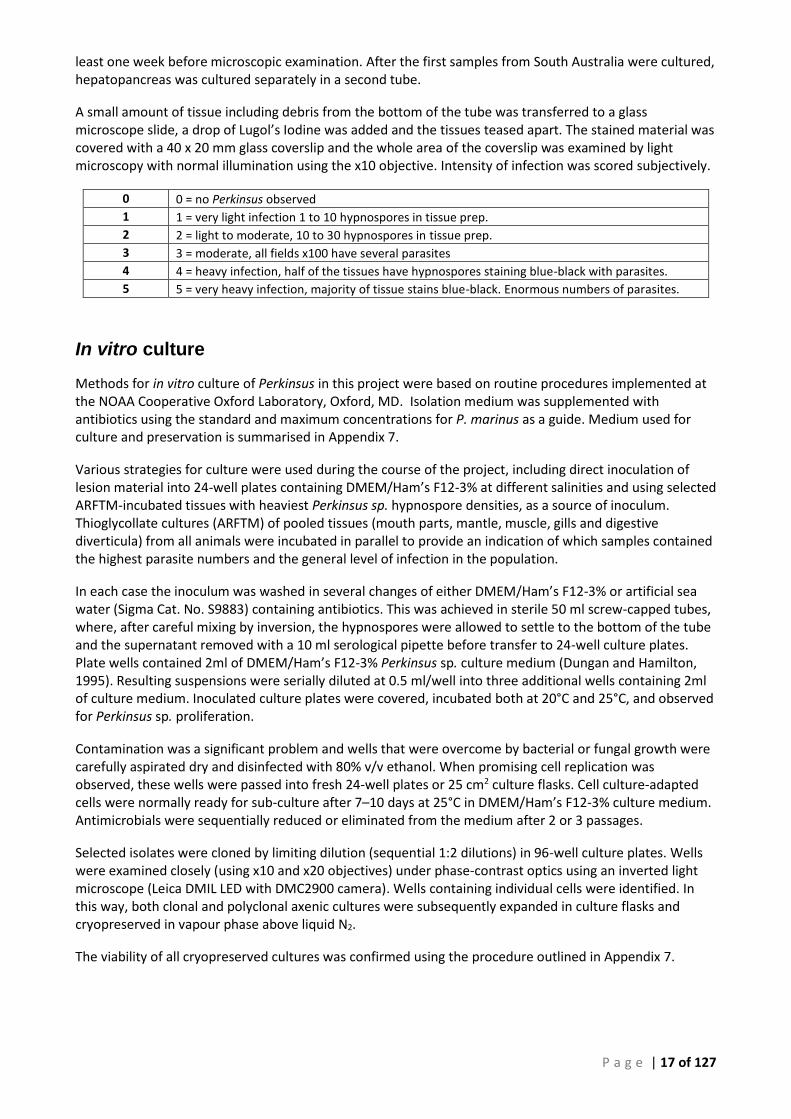
A small amount of tissue including debris from the bottom of the tube was transferred to a glass microscope slide, a drop of Lugol’s Iodine was added and the tissues teased apart. The stained material was covered with a 40 x 20 mm glass coverslip and the whole area of the coverslip was examined by light microscopy with normal illumination using the x10 objective. Intensity of infection was scored subjectively.
0 0 = no Perkinsus observed
1 1 = very light infection 1 to 10 hypnospores in tissue prep.
2 2 = light to moderate, 10 to 30 hypnospores in tissue prep.
3 3 = moderate, all fields x100 have several parasites
4 4 = heavy infection, half of the tissues have hypnospores staining blue-black with parasites.
5 5 = very heavy infection, majority of tissue stains blue-black. Enormous numbers of parasites.
In vitro culture
Methods for in vitro culture of Perkinsus in this project were based on routine procedures implemented at the NOAA Cooperative Oxford Laboratory, Oxford, MD. Isolation medium was supplemented with antibiotics using the standard and maximum concentrations for P. marinus as a guide. Medium used for culture and preservation is summarised in Appendix 7.
Various strategies for culture were used during the course of the project, including direct inoculation of lesion material into 24-well plates containing DMEM/Ham’s F12-3% at different salinities and using selected ARFTM-incubated tissues with heaviest Perkinsus sp. hypnospore densities, as a source of inoculum. Thioglycollate cultures (ARFTM) of pooled tissues (mouth parts, mantle, muscle, gills and digestive diverticula) from all animals were incubated in parallel to provide an indication of which samples contained the highest parasite numbers and the general level of infection in the population.
In each case the inoculum was washed in several changes of either DMEM/Ham’s F12-3% or artificial sea water (Sigma Cat. No. S9883) containing antibiotics. This was achieved in sterile 50 ml screw-capped tubes, where, after careful mixing by inversion, the hypnospores were allowed to settle to the bottom of the tube and the supernatant removed with a 10 ml serological pipette before transfer to 24-well culture plates. Plate wells contained 2ml of DMEM/Ham’s F12-3% Perkinsus sp. culture medium (Dungan and Hamilton, 1995). Resulting suspensions were serially diluted at 0.5 ml/well into three additional wells containing 2ml of culture medium. Inoculated culture plates were covered, incubated both at 20°C and 25°C, and observed for Perkinsus sp. proliferation.
Contamination was a significant problem and wells that were overcome by bacterial or fungal growth were carefully aspirated dry and disinfected with 80% v/v ethanol. When promising cell replication was observed, these wells were passed into fresh 24-well plates or 25 cm2 culture flasks. Cell culture-adapted cells were normally ready for sub-culture after 7–10 days at 25°C in DMEM/Ham’s F12-3% culture medium. Antimicrobials were sequentially reduced or eliminated from the medium after 2 or 3 passages.
Selected isolates were cloned by limiting dilution (sequential 1:2 dilutions) in 96-well culture plates. Wells were examined closely (using x10 and x20 objectives) under phase-contrast optics using an inverted light microscope (Leica DMIL LED with DMC2900 camera). Wells containing individual cells were identified. In this way, both clonal and polyclonal axenic cultures were subsequently expanded in culture flasks and cryopreserved in vapour phase above liquid N2.
The viability of all cryopreserved cultures was confirmed using the procedure outlined in Appendix 7.
P a g e | 18 of 127
PCR sampling and Isolation of Nucleic Acids
In most cases the tissues for PCR were taken at the same time as samples for histology, the tissues being taken from adjacent sites at the same time. Given the necessary constraints associated with tissue dissection, sampling and transport, all tissue samples were fixed in 80-90% (v/v) ethanol and stored at 4-6°C prior to DNA extraction.
As DNA isolation directly affects all downstream applications, it is the most critical step in molecular testing.
As Perkinsus infection appeared as focal lesions with uneven distribution through affected tissues we looked to homogenising larger (2-4 g) and perhaps more representative samples. Various methods of sample homogenisation were trialled. Ethanol-fixed abalone tissues, particularly muscle and mantle are very tough and rubbery and were particularly difficult to homogenise. We found that homogenisation of fixed tissues was generally impractical for processing large numbers of ethanol-fixed samples. Even mechanical processing with substrates such as, 1 mm steel microspheres, silicon shards and ceramic beads, did not produce a homogeneous sample for DNA extraction (data not shown). After homogenizing large pools of tissues many samples were inhibitory in the endogenous 18S control PCR or reacted inconsistently between replicate PCRs.
In order to facilitate the comparison of results between test runs and maintain consistency for the purposes of test validation a standardised extraction procedure was adopted and all sample processing was based on the uniform chemical lysis of samples. In this case we used the QIAGEN DNeasy Tissue kit (Cat. No. 69504).
The MagMAX™ Express 96 system was used to prepare the Perkinsus-negative abalone library as repetition stress was an issue with these samples. The modification was justified on the basis that previous equivalence testing has shown this system was comparable to column-based extraction for herpesvirus in mollusc tissue. The remainder of testing, including that of reference and field samples, relied on the standard Qiagen kit (above) with columns as supplied by the manufacturer.
Nucleic acid extraction of normal abalone (Perkinsus-negative DNA library)
These samples were collected over a period of time at a number of sites along the coast. When sufficient sample numbers for mass processing were accumulated, a standard weight of 20-30 mg tissue, consisting of 15 mg of gill and 15 mg of muscle tissue, from individual animals was dissected into ATL buffer with Proteinase K (180 µl ATL + 20 µl PK), as recommended. Samples were incubated overnight at 56°C or until lysed. Lysed samples were inverted or gently vortexed several times to mix during the course of digestion. Samples were then centrifuged briefly (3 min at 10,000 x g), after which 50 µl of supernatant was used for DNA isolation by MagMAX™ Express 96 system. Total nucleic acid was eluted with paramagnetic beads using 80 µl of MagMAX™ elution buffer for each sample. The nucleic acids (n = 200) were dispensed into duplicate 96-well PCR plates and stored at -20°C until use.
Nucleic acid extraction of reference control samples and field specimens
Control samples and field specimens were comprised of both ethanol-fixed tissues and fixed cells propagated in tissue culture. A standard weight of between 20-30 mg of tissue, or 10 mg of cells, was lysed in Qiagen ATL/PK buffer according to the manufacturer's instructions. DNA isolation was then carried out using Qiagen columns (Qiagen DNeasy Blood and Tissue Kit (250): Cat. No. 69506) with final elution of DNA in 100 µl AE buffer. DNA samples were stored at -20°C when not in use.
Taylor’s Island (12:978), Memory Cove (12:979a)5 and Thistle Island and (12:979b)6
The purpose of sample collection in South Australia was to obtain a range of Perkinsus-infected tissues from naturally infected populations of abalone. A total of 82 blacklip abalone were sampled as a source of
5 12:979a = 12:979-1 to 10 6 12:979b = 12:979-11 to 34

P a g e | 19 of 127
Perkinsus from South Australia. These tissues provided material for DNA sequencing and qPCR test development, tissue culture propagation of Perkinsus olseni and PCR test validation.
Thistle Island (14:0233)
The primary purpose of this sampling was to develop an understanding of the distribution of Perkinsus DNA around lesions in the tissues of affected abalone and to determine how to best target abalone sampling for detection by PCR. In addition to testing visible lesions by PCR, multiple PCR samples from normal tissues immediately adjacent to lesions and samples from apparently normal animals were also screened. Multiple samples from all animals were tested in parallel using both the OIE conventional PCR and the AFDL Pols qPCR.
After the animals were euthanized by cooling on ice and their shells removed, the visceral mass was separated from the underlying muscle. The gills and the external surface of the viscera were closely examined for the presence of gross lesions. The muscle was sliced transversely at 1 to 2 mm intervals along the entire length of each animal and the cut surface examined for lesions. Gross lesions were only observed in muscle. For PCR examination, in addition to visible muscle lesions, one half of the gill was dissected longitudinally and fixed in ethanol. From this, 3 sub-samples were taken (30 mg) at 3 levels along the length of the gill. Normal muscle was also taken from 3 locations in the pedal muscle. If Perkinsus lesions were visible in the muscle, samples of "normal" muscle were taken from the same transverse section containing the lesion, but from an area which appeared normal. In this case separate disposable scalpel blades were used for each sample to eliminate possible cross-contamination from the site of the visible lesion. A small piece of digestive gland (approximately 200-300 mg) was also taken from the lower third of the left side of the visceral mass from all 30 animals. All samples for PCR were fixed in 80% ethanol. At the same time, corresponding samples were fixed in Davidson's fixative for histological examination. All fixed samples for DNA extraction and PCR were further dissected to provide a uniform sample of approximately 30 mg of tissue for digestion.
PCR Analysis
The 18S ribosomal RNA FAST qPCR was essential for confirming the suitability of our test samples for PCR and is summarised in the PCR Methods of Appendix 3. The 18S targeted assay provided confirmation of the successful extraction of nucleic acids from a sample and distinguished samples where PCR was inhibited. The qPCR plate format and the use of Taqman® Fast Universal PCR Master Mix provided rapid turnaround for convenient QC of samples. Subsequent testing with species-specific plasmid or gDNA controls provided confirmation of the performance of each mastermix.
All conventional PCR testing for Perkinsus was based on the OIE-recommended methods according to the standard implementation used at CSIRO-AAHL (Appendix 3). Similarly all real-time assays, including the 18S qPCR, the genus-specific qPCR of Gauthier et al. (2006) and the AFDL qPCR for P. olseni, developed in the course of this project were carried out using standard methods summarised in Appendix 3. The reagents used for mastermix preparation and amplification parameters are summarised.
PCR screening of Perkinsus-negative DNA library
The full library of 200 Victorian samples from the Perkinsus-free zone were screened for P. olseni using the OIE 85/750 cPCR (OIE-recommended 1-step genus-specific conventional PCR), the OIE 140/600 cPCR (OIE-recommended 1-step species-specific conventional PCR for P. olseni), the real-time genus-specific assay of Gauthier et al. (2006), sensitive to 1 fg Perkinsus genomic DNA (gDNA), and a host-directed 18S qPCR to verify the extraction and assess sample inhibition.
Real-time PCR Test Development
Given the focus and considerable accumulating data of DNA sequence in the ITS region of Perkinsus and the use of this region for other molecular assays, including the OIE-recommended PCR tests, we aimed to similarly exploit this region for a specific P. olseni qPCR test.
P a g e | 20 of 127
DNA sequence data were generated from the ITS region using the OIE genus-specific primers 85F-750R, from a range of Perkinsus samples (n = 16) collected as part of this project including from both Taylor's Island and Thistle Island. These South Australian Perkinsus DNA sequences were aligned with a range of P. olseni sequences from GenBank to provide a map of both variable and conserved sites which was used for primer/probe design. Similar consensus sequences for P. marinus, P. chesapeaki, P. honshuensis, P. beihaiensis and P. mediterraneus were also included. Various possible primer and probe combinations for P. olseni were generated using Primer Express 3 (Life Technologies). These were assessed for specificity using the consensus sequences for the non-target Perkinsus species. Two forward and 2 reverse primers specific for P. olseni which passed the performance criteria of Primer Express were selected. Before synthesis, the specificity of the candidate primers was checked using NCBI primer BLAST (Ye et al., 2012) and the GenBank NR database.
The best primer combination was selected by their performance in SYBR assay with serially diluted P. olseni gDNA, followed by Taqman screening of gDNA from ATCC cultures of P. olseni, P. marinus, P. chesapeaki and P. honshuensis.
Analytical Sensitivity (ASe) and Specificity (ASp)
Replicate testing of serially diluted gDNA and plasmid DNA was undertaken to determine analytical specificity (ASp) and sensitivity (ASe). The accumulated test data of field and reference samples were used to estimate diagnostic specificity (DSp) and sensitivity (DSe) by statistical methods, including ROC and Bayesian analysis.
Analytical Sensitivity
Both P. olseni plasmid and gDNA from reference cultures were used to obtain an estimate of the analytical sensitivity (ASe) of the prototype AFDL Pols qPCR system. Plasmid testing was used to determine the specific copy number detected and testing of genomic DNA provided an estimate of the quantity of gDNA that could be detected.
Plasmids (Invitrogen pPCR2.1-TOPO) containing Perkinsus inserts prepared from the OIE 85F-750R cPCR (OIE diagnostic region) amplicon were constructed by standard methods using axenic clonal cultures as a source of genomic DNA. Plasmid stocks of 108 copies/µl were prepared using a standard molar/mass calculation and the Qubit 2.0, (Invitrogen) fluorimeter to provide an initial measurement of the starting concentration. Yeast tRNA carrier (Invitrogen Cat. No. 15401-029) at a concentration of 50 ng/µl in 1 mM TE buffer (pH 7.6) was used as diluent.
For the sake of simplicity, the analytical sensitivity (ASe) was determined experimentally (ASeexp) as suggested by Caraguel et al. (2011). In this case, 5 replicates of each plasmid, diluted in an appropriate non-target matrix, were tested to provide an estimate of ASeexp at 95% confidence, as required by the OIE. Recognising the potential for the dilution medium to influence PCR amplification, the testing was repeated with 3 different diluents; 1 mM TE buffer (pH 7.6), yeast tRNA at 50 ng/µl in 1 mM TE buffer and pooled abalone genomic DNA at 50 ng/µl. The later would serve to simulate detection in a matrix of abalone gDNA at a level found in normal field samples.
Analytical Specificity
All the Perkinsus samples used to assess analytical specificity (ASp) were derived from sources outside Australia and represent a wide range of mollusc host species with a wide geographic (global) distribution. The axenic cultures provided uncontaminated Perkinsus gDNA target, at high concentration without interfering host or other DNA, significantly favouring any cross-reaction that might occur in the candidate assay (AFDL Pols qPCR).
No P. mediterraneus or P. qugwadii samples were obtained and these species were not tested. While the specificity (ASp) using these 2 species could not be validated by testing, the DNA consensus alignments of P. mediterraneus, P. qugwadii and the test primers and probe show significant mismatch (Figure 17). While confirmatory testing was not undertaken, the major differences in sequence observed over the diagnostic
P a g e | 21 of 127
region are sufficient for us to expect that the analytical specificity of our P. olseni assay (AFDL Pols qPCR) would be maintained for these species.
Diagnostic Test Validation and Real-time (qPCR) Test Performance
The design of primers and probe for the P. olseni Taqman® assay was based on Perkinsus DNA sequence generated from South Australian abalone collected at the beginning of this project and further sequence data made publically available by the National (USA) Centre for Biotechnology Information through GenBank.
Validation of the P. olseni qPCR was based on the testing of a wide range of samples including; mollusc field samples, cloned plasmids and axenic reference cultures of Perkinsus. All calculations of test sensitivity and specificity were based on testing of naturally infected animals collected in the field from wild populations. P. mediterraneus and P. qugwadii were not included in testing as few samples of these species are available and none could be sourced for use in this project.
Diagnostic Sensitivity (DSe) and specificity (DSp)
The performance characteristics of the AFDL Pols qPCR for detection of Perkinsus olseni was determined by Latent Class Analysis with Bayesian modelling to obtain estimates of diagnostic sensitivity and specificity. A Cochran statistical model was used to assess repeatability and a comparative statistical analysis of gill and muscle results was undertaken to compare the relative performance of these specimens in the qPCR assay. In order to reduce fragmentation of this analysis, the performance and validation analysis are presented together in the results with discussion. The data summary for statistical analysis is shown in Appendix 8.
Sequence and Phylogenetic Analysis
Analysis of Australian Perkinsus olseni from blacklip abalone field samples
Amplification of the ITS region of Perkinsus was achieved using the two OIE methods. For convenience, sequencing was mostly confined to those samples that were also positive by standard 1-step conventional PCR, however some data from samples subjected to prolonged cycling times (70 cycles) were also included in analysis. The prolonged cycling procedure was useful in confirming some real-time positive samples with high CT values. Its general application was limited in this analysis. Although both the OIE Perkinsus spp. PCR (85-750) and the OIE Perkinsus olseni (140-600) PCR were sequenced, the Perkinsus spp. PCR (85-750) provided the longer DNA product and was used for sequence analysis and subsequent phylogenetic analysis in the majority of cases.
Analysis of Perkinsus olseni cultures
In addition to DNA sequence analysis of Perkinsus field samples, a more detailed analysis was undertaken to better characterise the four P. olseni axenic cultures established in this project. DNA analysis was expanded to include the ITS region, the large sub-unit of the rRNA gene (LSU) and the actin gene. These data were used to confirm the uniformity of both the polyclonal and clonal cultures established, confirm the identity of the cultures and generally provide more data on the genetic composition of Perkinsus in Australia. These data were also used for the submission of isolate 12:00978-12 to the ATCC and to establish it as the holotype culture of P. olseni. Replicating cultures were also sent to Japan where our sequence data were independently confirmed at Tokyo University by Prof Tomoyoshi Yoshinaga.
Sequence Alignments and Phylogenetic Analysis
Sequence analysis and alignments were achieved using Geneious software v7.1.7 (Biomatters) and the phylogenetic trees were constructed using both the Geneious software v7.1.7 (Biomatters) and Mega6. Sequence files were de novo assembled (without extrinsic comparison to existing data) and primer trimmed. Any discrepancies in sequence alignments were acknowledged by the use of ambiguous bases.
P a g e | 22 of 127
Sequence alignments and trimming were conducted using Geneious, while Mega6 was used to build sequence alignments and construct phylogenetic trees. Briefly, neighbour-joining trees were performed using the Tajima-Nei model with 10,000 bootstrap replicates.
The evolutionary history was inferred using the neighbour-Joining method of Saitou and Nei (1987). The optimal tree with sum of branch length is shown for each analysis. The percentage of replicate trees in which the associated taxa clustered together in the bootstrap test (1000 replicates) is shown next to the branches (Felsenstein, 1985). The evolutionary distances being computed using the Tamura-Nei method (Tamura and Nei, 1993) and are in the units of the number of base substitutions per site. The analysis involved 44 nucleotide sequences for the ITS, 30 sequences for the LSU and 41 sequences for the actin gene. Evolutionary analyses were conducted in MEGA6 (Tamura et al., 2013). The 1st+2nd+3rd+non-coding codon positions were included. All sequence positions containing gaps and/or missing data were eliminated. The total number of positions in the final dataset for each analysis is indicated in the figure legends.
P a g e | 23 of 127
Results
Reference and Control Samples
The reference samples for PCR included 5 of the 7 known species of Perkinsus. All samples were received as ethanol-fixed specimens. P. olseni (syn. P. atlanticus), P. marinus, P. chesapeaki (syn. P. andrewsi), and P. honshuensis came as axenic cultures fixed in ethanol. P. beihaiensis was received as fixed tissues from naturally infected clams. A large stock of homogenised ethanol-fixed Crassostrea virginica tissues infected with P. marinus was also established.
The reference samples were screened by PCR using the OIE genus-specific conventional PCR (85/750), the OIE P. olseni species-specific conventional PCR (140/600), the Perkinsus genus-specific Taqman® assay of Gauthier et al. (2006) and the AFDL Pols qPCR assay. The 4 PCR systems have specificity for either Perkinsus spp. (genus-specific) or P. olseni (species-specific). The specificity of each test is listed under each test name summarised in Table 1. The results of this testing was generally straightforward and confirmed the ASp of the AFDL Pols qPCR.
Although not officially recognised, the Gauthier et al. (2006) genus-specific qPCR was found to be an excellent reference test for all samples, particularly when the level of detection of the OIE genus-specific assay was beyond limits, as was the case with some P. beihaiensis tissue samples (red highlight, Table 1). The Gauthier assay was designed to detect all Perkinsus spp. and has very similar analytical sensitivity (ASe) compared to the AFDL Pols qPCR system (Table 3 and 4 below).
All the P. olseni (syn. P. atlanticus) samples were positive by all tests, as expected. This testing was consistent with the specificity expected of the system and furthermore demonstrated the ability of the AFDL Pols qPCR system to detect P. olseni strains of diverse origin including a range of exotic strains from overseas.
The only anomalous results were obtained with P. honshuensis. Our samples of P. honshuensis (highlighted in blue, Table 1) originated from cultures derived from the Manila clam Venerupis philippinarum (Dungan, 2006). In this study, some clams were reported to be co-infected with both P. honshuensis and P. olseni. As the DNA sequence of these species appears to be well-differentiated over the diagnostic region (Figure 17) we attributed the positive P. olseni result with these samples to the co-infection reported by these authors. Subsequent PCR analysis of cultures derived from the same sample (Mie-3g) by Umeda and Yoshinaga (2012) further explain our results and showed that some polyclonal cultures of P. honshuensis, including some obtained from the ATCC, are mixed and contain both P. honshuensis and P. olseni. In this case our sample, Mie-3g-A, gave consistently positive results for both the Perkinsus genus-specific assays and P. olseni assays, whereas sample Mie-3g-B was consistently negative by the AFDL Pols qPCR. The isolated positive result for P. olseni with the OIE P. olseni-specific conventional PCR (140/600) was not replicated and could not be explained in isolation.
In order to unambiguously establish the specificity of the AFDL Pols qPCR with respect to P. honshuensis, we selected for a P. honshuensis plasmid (Invitrogen pPCR2.1-TOPO) with an insert generated by the OIE 85F-750R PCR (diagnostic region) from sample Mie-3g-A.The insert was confirmed by DNA sequencing to be from P. honshuensis. PCR screening of the P. honshuensis plasmid did not show any signal above background in the AFDL Pols qPCR system over the range of 2 x 101 to 2 x 10⁷ copies (Figures 21, 22 and Table 5). Despite the anomalous results obtained in testing the unreliable P. honshuensis gDNA samples by conventional PCR, the clear negative result obtained with the AFDL Pols qPCR with high concentrations of P. honshuensis plasmid convincingly demonstrates the specificity of the new qPCR system with respect to P. honshuensis in the region targeted by the assay.
The test results obtained for P. marinus, P. chesapeaki and P. beihaiensis were clear-cut. The samples derived from culture (P. marinus, P. chesapeaki) had high levels of DNA target and were test-negative by all the P. olseni-specific tests, including the new AFDL Pols qPCR.
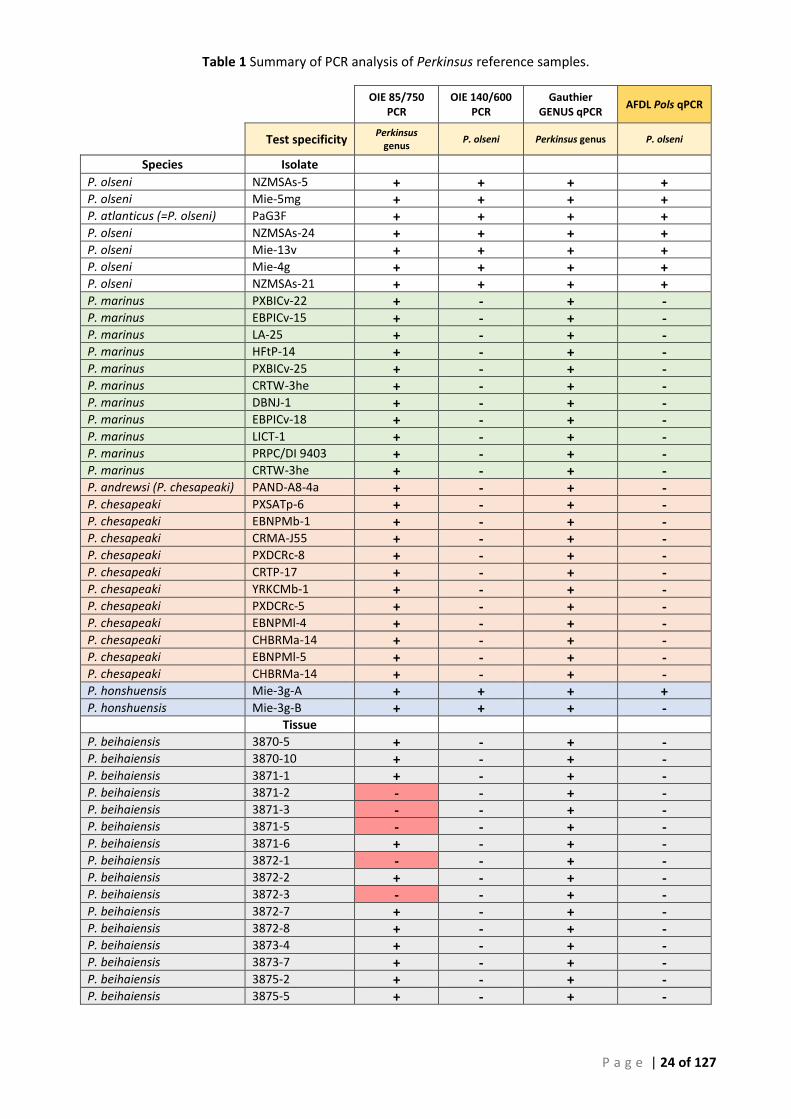
P a g e | 24 of 127
Table 1 Summary of PCR analysis of Perkinsus reference samples.
OIE 85/750
PCR OIE 140/600
PCR Gauthier
GENUS qPCR AFDL Pols qPCR
Test specificity Perkinsus
genus P. olseni Perkinsus genus P. olseni
Species Isolate P. olseni NZMSAs-5 + + + + P. olseni Mie-5mg + + + + P. atlanticus (=P. olseni) PaG3F + + + + P. olseni NZMSAs-24 + + + + P. olseni Mie-13v + + + + P. olseni Mie-4g + + + + P. olseni NZMSAs-21 + + + + P. marinus PXBICv-22 + - + - P. marinus EBPICv-15 + - + - P. marinus LA-25 + - + - P. marinus HFtP-14 + - + - P. marinus PXBICv-25 + - + - P. marinus CRTW-3he + - + - P. marinus DBNJ-1 + - + - P. marinus EBPICv-18 + - + - P. marinus LICT-1 + - + - P. marinus PRPC/DI 9403 + - + - P. marinus CRTW-3he + - + - P. andrewsi (P. chesapeaki) PAND-A8-4a + - + - P. chesapeaki PXSATp-6 + - + - P. chesapeaki EBNPMb-1 + - + - P. chesapeaki CRMA-J55 + - + - P. chesapeaki PXDCRc-8 + - + - P. chesapeaki CRTP-17 + - + - P. chesapeaki YRKCMb-1 + - + - P. chesapeaki PXDCRc-5 + - + - P. chesapeaki EBNPMl-4 + - + - P. chesapeaki CHBRMa-14 + - + - P. chesapeaki EBNPMl-5 + - + - P. chesapeaki CHBRMa-14 + - + - P. honshuensis Mie-3g-A + + + + P. honshuensis Mie-3g-B + + + -
Tissue P. beihaiensis 3870-5 + - + - P. beihaiensis 3870-10 + - + - P. beihaiensis 3871-1 + - + - P. beihaiensis 3871-2 - - + - P. beihaiensis 3871-3 - - + - P. beihaiensis 3871-5 - - + - P. beihaiensis 3871-6 + - + - P. beihaiensis 3872-1 - - + - P. beihaiensis 3872-2 + - + - P. beihaiensis 3872-3 - - + - P. beihaiensis 3872-7 + - + - P. beihaiensis 3872-8 + - + - P. beihaiensis 3873-4 + - + - P. beihaiensis 3873-7 + - + - P. beihaiensis 3875-2 + - + - P. beihaiensis 3875-5 + - + -
P a g e | 25 of 127
The P. beihaiensis reference samples were in the form of naturally infected tissues from the field and, as such, the levels of target DNA was variable and, in some cases, below the threshold of detection of the OIE genus-specific conventional PCR (85/750). All the samples that were positive by the OIE genus-specific conventional assay were negative by both P. olseni-specific assays, including the AFDL Pols qPCR. Although P. beihaiensis samples 3871-2, 3871-3, 3871-5, 3872-1 and 3872-3 were test negative by the OIE genus-specific conventional PCR (85/750), these samples were all positive by the Gauthier genus-specific Taqman® assay. We attributed this to the greater sensitivity (ASe) of the Gauthier Taqman® T-Perk assay over the OIE one-step conventional PCR. Given that the Gauthier genus-specific assay and the AFDL Pols qPCR have very similar analytical sensitivity (shown previously), it would not be unreasonable to expect some amplification after 45 cycles if there was "cross-reaction" with P. beihaiensis in the AFDL Pols qPCR. This was not the case and all the P. beihaiensis field samples were unambiguously negative in the AFDL Pols qPCR, with no signal observed in any sample after 45 cycles. We concluded that the specificity of the AFDL Pols qPCR system with respect to this species was confirmed.
Laboratory Examination of Field Samples
Victorian Field Samples – PCR of Perkinsus-negative DNA library
The full library of 200 Victorian samples from the Perkinsus-free zone was screened for P. olseni with the OIE 85/750 cPCR (genus), the OIE 140/600 cPCR (species), the real-time assay of Gauthier et al. (2006), which is genus-specific for Perkinsus and sensitive to 1 fg Perkinsus gDNA, and the AFDL Pols qPCR.
A few light bands of unexpected size were observed in the conventional OIE PCR tests. In each case these bands were sequenced and shown to be non-specific artefacts of amplification (data not shown). Duplicates of all the Victorian abalone samples were tested twice with each PCR and were test-negative. All samples were confirmed by the 18S host-directed PCR. Given that these samples were derived from geographically removed and commercially exploited abalone populations with no history of Perkinsus, and that all PCR testing was negative for Perkinsus, these samples were accepted as known negative samples for the AFDL Pols qPCR test validation.
South Australian Field Samples
Taylor’s Island (12:978), Memory Cove (12:979a)7 and Thistle Island (12:979b)8
A total of 82 blacklip abalone (mean length 133.1 mm) were examined. Of these, 31 (38%) displayed gross lesions or external signs of disease (Figure 7, 8, 9). At Taylor’s Island, 16 of 50 animals (32%) were found positive by Ray’s Test with 12 of 50 positive by histology (24%). At Memory Cove, only one animal tested positive, while at Thistle Island 11 of 22 (50%) animals were positive in Ray’s medium with 10 histological positives (45%). A total of 27 abalone were positive by culture in Ray’s medium (33%), with 23 of 82 animals examined, positive by histology (28%).
Lesions RFTC Histology
85/750 cPCR
140/600 cPCR
AFDL qPCR
Total Animals
Taylor Island 12-978 20 16 12 17 18 29 50
Memory Cove 12-979-1 0 0 1 0 0 1 10
Thistle Island 12-979-11 11 11 10 10 15 16 22
31 27 23 27 33 46 82
7 12:979a = 12:979-1 to 10 8 12:979b = 12:979-11 to 34
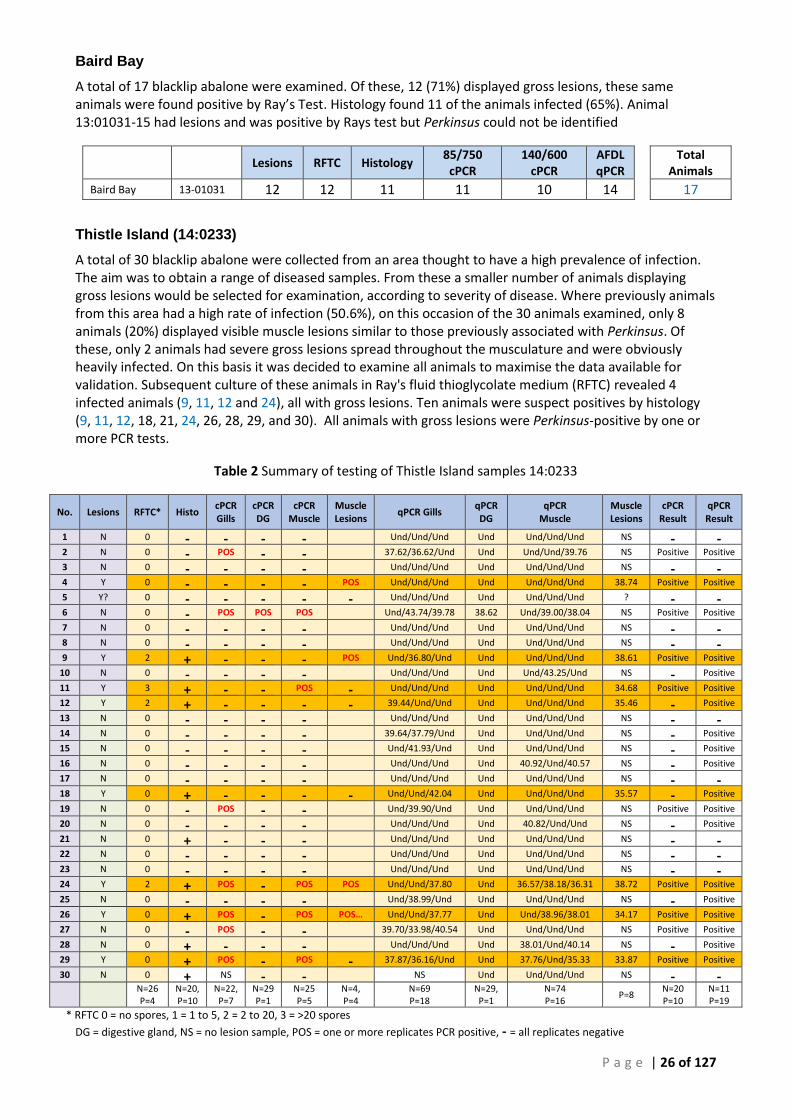
P a g e | 26 of 127
Baird Bay
A total of 17 blacklip abalone were examined. Of these, 12 (71%) displayed gross lesions, these same animals were found positive by Ray’s Test. Histology found 11 of the animals infected (65%). Animal 13:01031-15 had lesions and was positive by Rays test but Perkinsus could not be identified
Lesions RFTC Histology
85/750 cPCR
140/600 cPCR
AFDL qPCR
Total Animals
Baird Bay 13-01031 12 12 11 11 10 14 17
Thistle Island (14:0233)
A total of 30 blacklip abalone were collected from an area thought to have a high prevalence of infection. The aim was to obtain a range of diseased samples. From these a smaller number of animals displaying gross lesions would be selected for examination, according to severity of disease. Where previously animals from this area had a high rate of infection (50.6%), on this occasion of the 30 animals examined, only 8 animals (20%) displayed visible muscle lesions similar to those previously associated with Perkinsus. Of these, only 2 animals had severe gross lesions spread throughout the musculature and were obviously heavily infected. On this basis it was decided to examine all animals to maximise the data available for validation. Subsequent culture of these animals in Ray's fluid thioglycolate medium (RFTC) revealed 4 infected animals (9, 11, 12 and 24), all with gross lesions. Ten animals were suspect positives by histology (9, 11, 12, 18, 21, 24, 26, 28, 29, and 30). All animals with gross lesions were Perkinsus-positive by one or more PCR tests.
Table 2 Summary of testing of Thistle Island samples 14:0233
No. Lesions RFTC* Histo cPCR Gills
cPCR DG
cPCR Muscle
Muscle Lesions
qPCR Gills qPCR DG
qPCR Muscle
Muscle Lesions
cPCR Result
qPCR Result
1 N 0 - - - - Und/Und/Und Und Und/Und/Und NS - - 2 N 0 - POS - - 37.62/36.62/Und Und Und/Und/39.76 NS Positive Positive
3 N 0 - - - - Und/Und/Und Und Und/Und/Und NS - - 4 Y 0 - - - - POS Und/Und/Und Und Und/Und/Und 38.74 Positive Positive
5 Y? 0 - - - - - Und/Und/Und Und Und/Und/Und ? - - 6 N 0 - POS POS POS Und/43.74/39.78 38.62 Und/39.00/38.04 NS Positive Positive
7 N 0 - - - - Und/Und/Und Und Und/Und/Und NS - - 8 N 0 - - - - Und/Und/Und Und Und/Und/Und NS - - 9 Y 2 + - - - POS Und/36.80/Und Und Und/Und/Und 38.61 Positive Positive
10 N 0 - - - - Und/Und/Und Und Und/43.25/Und NS - Positive
11 Y 3 + - - POS - Und/Und/Und Und Und/Und/Und 34.68 Positive Positive
12 Y 2 + - - - - 39.44/Und/Und Und Und/Und/Und 35.46 - Positive
13 N 0 - - - - Und/Und/Und Und Und/Und/Und NS - - 14 N 0 - - - - 39.64/37.79/Und Und Und/Und/Und NS - Positive
15 N 0 - - - - Und/41.93/Und Und Und/Und/Und NS - Positive
16 N 0 - - - - Und/Und/Und Und 40.92/Und/40.57 NS - Positive
17 N 0 - - - - Und/Und/Und Und Und/Und/Und NS - - 18 Y 0 + - - - - Und/Und/42.04 Und Und/Und/Und 35.57 - Positive
19 N 0 - POS - - Und/39.90/Und Und Und/Und/Und NS Positive Positive
20 N 0 - - - - Und/Und/Und Und 40.82/Und/Und NS - Positive
21 N 0 + - - - Und/Und/Und Und Und/Und/Und NS - - 22 N 0 - - - - Und/Und/Und Und Und/Und/Und NS - - 23 N 0 - - - - Und/Und/Und Und Und/Und/Und NS - - 24 Y 2 + POS - POS POS Und/Und/37.80 Und 36.57/38.18/36.31 38.72 Positive Positive
25 N 0 - - - - Und/38.99/Und Und Und/Und/Und NS - Positive
26 Y 0 + POS - POS POS… Und/Und/37.77 Und Und/38.96/38.01 34.17 Positive Positive
27 N 0 - POS - - 39.70/33.98/40.54 Und Und/Und/Und NS Positive Positive
28 N 0 + - - - Und/Und/Und Und 38.01/Und/40.14 NS - Positive
29 Y 0 + POS - POS - 37.87/36.16/Und Und 37.76/Und/35.33 33.87 Positive Positive
30 N 0 + NS - - NS Und Und/Und/Und NS - -
N=26 P=4
N=20, P=10
N=22, P=7
N=29 P=1
N=25 P=5
N=4, P=4
N=69 P=18
N=29, P=1
N=74 P=16
P=8 N=20 P=10
N=11 P=19
* RFTC 0 = no spores, 1 = 1 to 5, 2 = 2 to 20, 3 = >20 spores
DG = digestive gland, NS = no lesion sample, POS = one or more replicates PCR positive, - = all replicates negative
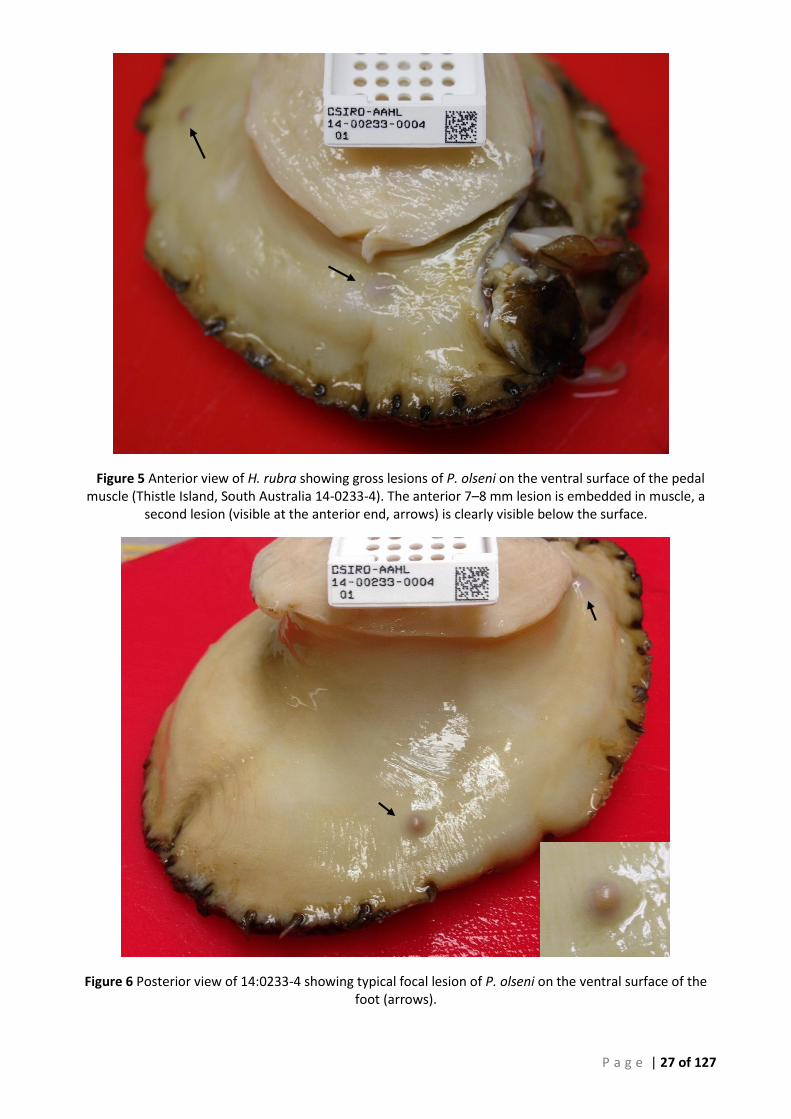
P a g e | 27 of 127
Figure 5 Anterior view of H. rubra showing gross lesions of P. olseni on the ventral surface of the pedal muscle (Thistle Island, South Australia 14-0233-4). The anterior 7–8 mm lesion is embedded in muscle, a
second lesion (visible at the anterior end, arrows) is clearly visible below the surface.
Figure 6 Posterior view of 14:0233-4 showing typical focal lesion of P. olseni on the ventral surface of the foot (arrows).
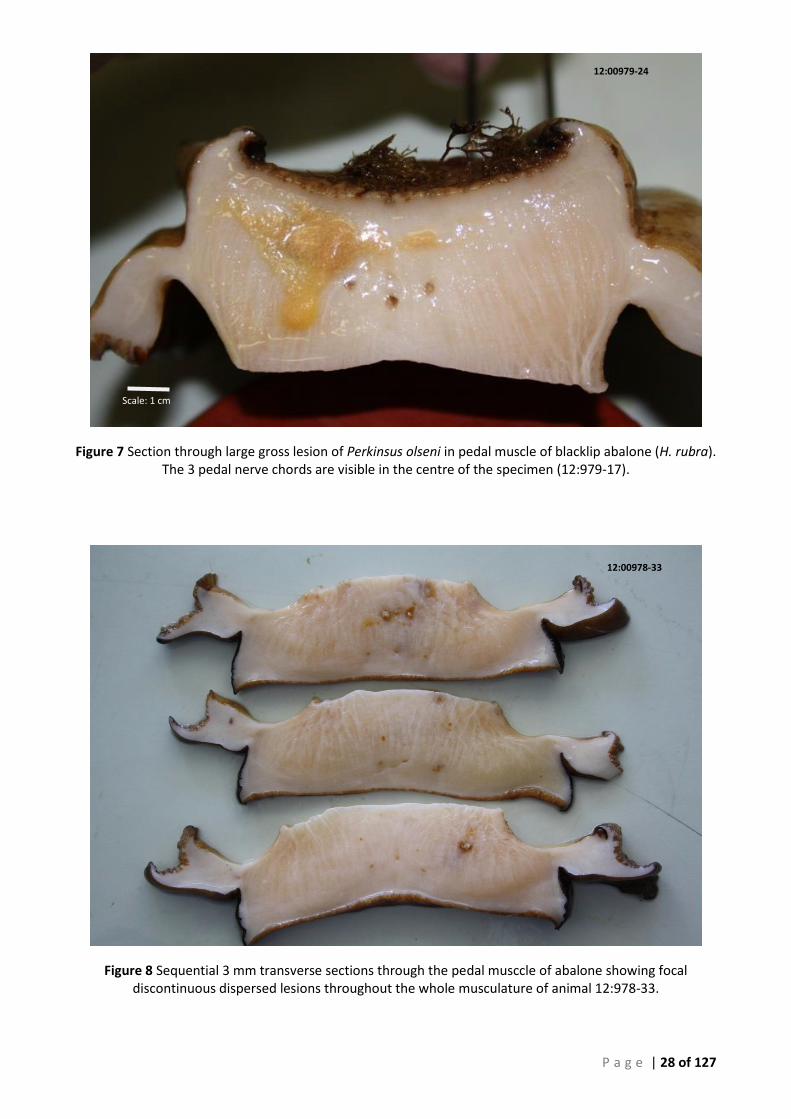
P a g e | 28 of 127
Figure 7 Section through large gross lesion of Perkinsus olseni in pedal muscle of blacklip abalone (H. rubra). The 3 pedal nerve chords are visible in the centre of the specimen (12:979-17).
Figure 8 Sequential 3 mm transverse sections through the pedal musccle of abalone showing focal discontinuous dispersed lesions throughout the whole musculature of animal 12:978-33.
12:00979-24
Scale: 1 cm
12:00978-33
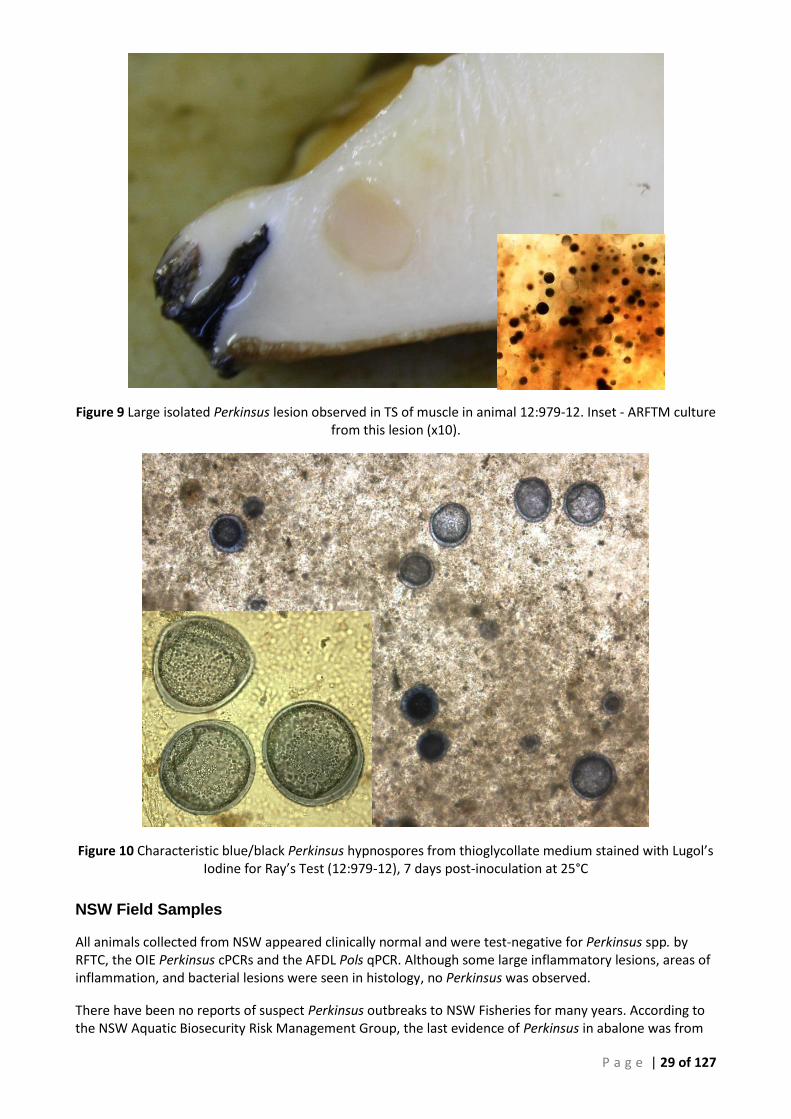
P a g e | 29 of 127
Figure 9 Large isolated Perkinsus lesion observed in TS of muscle in animal 12:979-12. Inset - ARFTM culture from this lesion (x10).
Figure 10 Characteristic blue/black Perkinsus hypnospores from thioglycollate medium stained with Lugol’s Iodine for Ray’s Test (12:979-12), 7 days post-inoculation at 25°C
NSW Field Samples
All animals collected from NSW appeared clinically normal and were test-negative for Perkinsus spp. by RFTC, the OIE Perkinsus cPCRs and the AFDL Pols qPCR. Although some large inflammatory lesions, areas of inflammation, and bacterial lesions were seen in histology, no Perkinsus was observed.
There have been no reports of suspect Perkinsus outbreaks to NSW Fisheries for many years. According to the NSW Aquatic Biosecurity Risk Management Group, the last evidence of Perkinsus in abalone was from
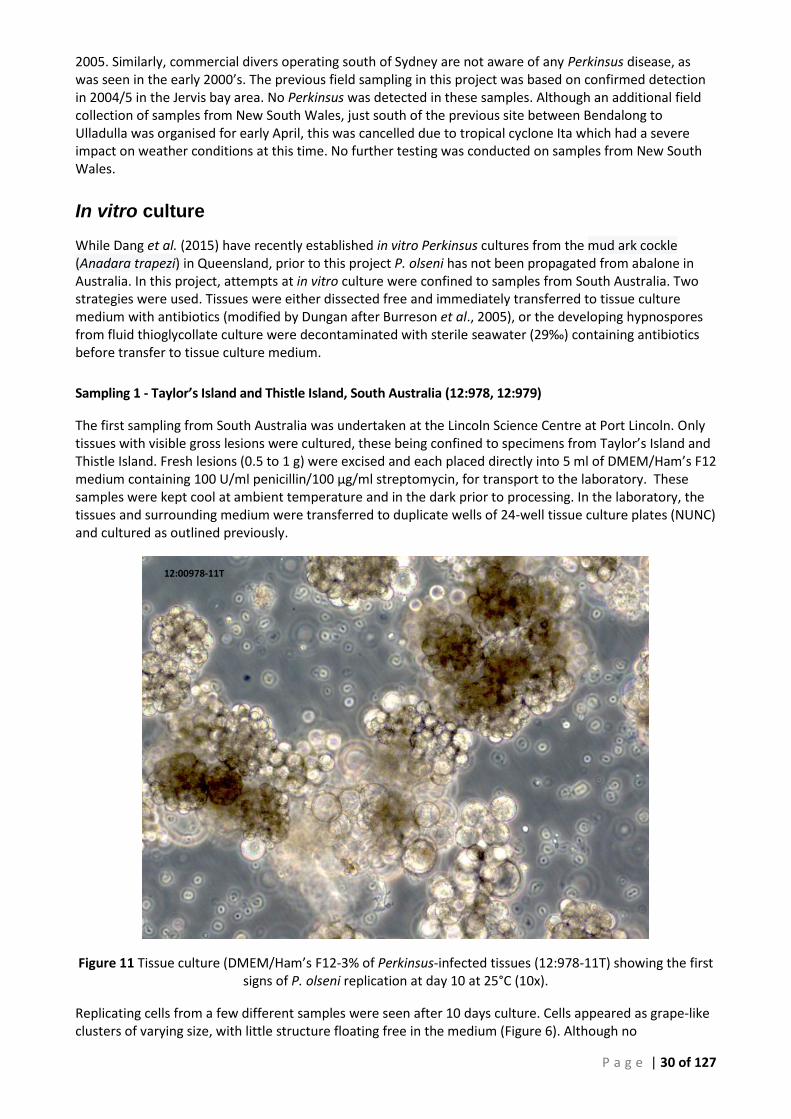
P a g e | 30 of 127
2005. Similarly, commercial divers operating south of Sydney are not aware of any Perkinsus disease, as was seen in the early 2000’s. The previous field sampling in this project was based on confirmed detection in 2004/5 in the Jervis bay area. No Perkinsus was detected in these samples. Although an additional field collection of samples from New South Wales, just south of the previous site between Bendalong to Ulladulla was organised for early April, this was cancelled due to tropical cyclone Ita which had a severe impact on weather conditions at this time. No further testing was conducted on samples from New South Wales.
In vitro culture
While Dang et al. (2015) have recently established in vitro Perkinsus cultures from the mud ark cockle (Anadara trapezi) in Queensland, prior to this project P. olseni has not been propagated from abalone in Australia. In this project, attempts at in vitro culture were confined to samples from South Australia. Two strategies were used. Tissues were either dissected free and immediately transferred to tissue culture medium with antibiotics (modified by Dungan after Burreson et al., 2005), or the developing hypnospores from fluid thioglycollate culture were decontaminated with sterile seawater (29‰) containing antibiotics before transfer to tissue culture medium.
Sampling 1 - Taylor’s Island and Thistle Island, South Australia (12:978, 12:979)
The first sampling from South Australia was undertaken at the Lincoln Science Centre at Port Lincoln. Only tissues with visible gross lesions were cultured, these being confined to specimens from Taylor’s Island and Thistle Island. Fresh lesions (0.5 to 1 g) were excised and each placed directly into 5 ml of DMEM/Ham’s F12 medium containing 100 U/ml penicillin/100 µg/ml streptomycin, for transport to the laboratory. These samples were kept cool at ambient temperature and in the dark prior to processing. In the laboratory, the tissues and surrounding medium were transferred to duplicate wells of 24-well tissue culture plates (NUNC) and cultured as outlined previously.
Figure 11 Tissue culture (DMEM/Ham’s F12-3% of Perkinsus-infected tissues (12:978-11T) showing the first signs of P. olseni replication at day 10 at 25°C (10x).
Replicating cells from a few different samples were seen after 10 days culture. Cells appeared as grape-like clusters of varying size, with little structure floating free in the medium (Figure 6). Although no
12:00978-11T
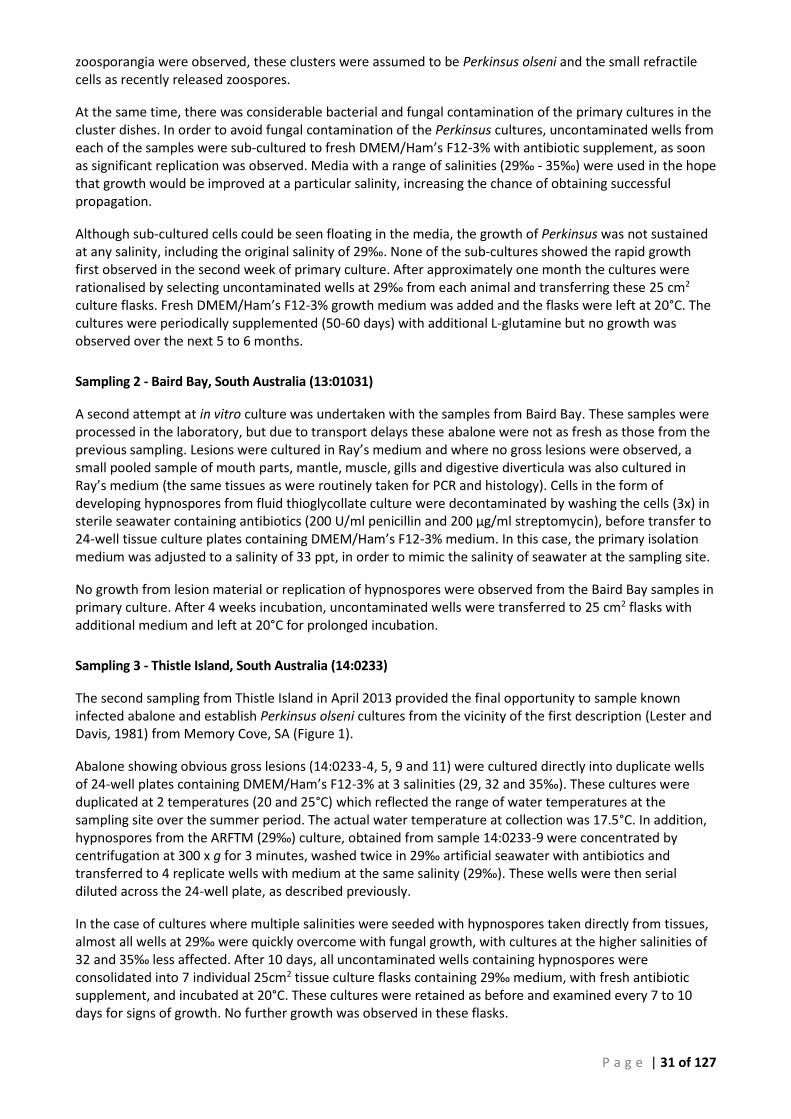
P a g e | 31 of 127
zoosporangia were observed, these clusters were assumed to be Perkinsus olseni and the small refractile cells as recently released zoospores.
At the same time, there was considerable bacterial and fungal contamination of the primary cultures in the cluster dishes. In order to avoid fungal contamination of the Perkinsus cultures, uncontaminated wells from each of the samples were sub-cultured to fresh DMEM/Ham’s F12-3% with antibiotic supplement, as soon as significant replication was observed. Media with a range of salinities (29‰ - 35‰) were used in the hope that growth would be improved at a particular salinity, increasing the chance of obtaining successful propagation.
Although sub-cultured cells could be seen floating in the media, the growth of Perkinsus was not sustained at any salinity, including the original salinity of 29‰. None of the sub-cultures showed the rapid growth first observed in the second week of primary culture. After approximately one month the cultures were rationalised by selecting uncontaminated wells at 29‰ from each animal and transferring these 25 cm2 culture flasks. Fresh DMEM/Ham’s F12-3% growth medium was added and the flasks were left at 20°C. The cultures were periodically supplemented (50-60 days) with additional L-glutamine but no growth was observed over the next 5 to 6 months.
Sampling 2 - Baird Bay, South Australia (13:01031)
A second attempt at in vitro culture was undertaken with the samples from Baird Bay. These samples were processed in the laboratory, but due to transport delays these abalone were not as fresh as those from the previous sampling. Lesions were cultured in Ray’s medium and where no gross lesions were observed, a small pooled sample of mouth parts, mantle, muscle, gills and digestive diverticula was also cultured in Ray’s medium (the same tissues as were routinely taken for PCR and histology). Cells in the form of developing hypnospores from fluid thioglycollate culture were decontaminated by washing the cells (3x) in sterile seawater containing antibiotics (200 U/ml penicillin and 200 µg/ml streptomycin), before transfer to 24-well tissue culture plates containing DMEM/Ham’s F12-3% medium. In this case, the primary isolation medium was adjusted to a salinity of 33 ppt, in order to mimic the salinity of seawater at the sampling site.
No growth from lesion material or replication of hypnospores were observed from the Baird Bay samples in primary culture. After 4 weeks incubation, uncontaminated wells were transferred to 25 cm2 flasks with additional medium and left at 20°C for prolonged incubation.
Sampling 3 - Thistle Island, South Australia (14:0233)
The second sampling from Thistle Island in April 2013 provided the final opportunity to sample known infected abalone and establish Perkinsus olseni cultures from the vicinity of the first description (Lester and Davis, 1981) from Memory Cove, SA (Figure 1).
Abalone showing obvious gross lesions (14:0233-4, 5, 9 and 11) were cultured directly into duplicate wells of 24-well plates containing DMEM/Ham’s F12-3% at 3 salinities (29, 32 and 35‰). These cultures were duplicated at 2 temperatures (20 and 25°C) which reflected the range of water temperatures at the sampling site over the summer period. The actual water temperature at collection was 17.5°C. In addition, hypnospores from the ARFTM (29‰) culture, obtained from sample 14:0233-9 were concentrated by centrifugation at 300 x g for 3 minutes, washed twice in 29‰ artificial seawater with antibiotics and transferred to 4 replicate wells with medium at the same salinity (29‰). These wells were then serial diluted across the 24-well plate, as described previously.
In the case of cultures where multiple salinities were seeded with hypnospores taken directly from tissues, almost all wells at 29‰ were quickly overcome with fungal growth, with cultures at the higher salinities of 32 and 35‰ less affected. After 10 days, all uncontaminated wells containing hypnospores were consolidated into 7 individual 25cm2 tissue culture flasks containing 29‰ medium, with fresh antibiotic supplement, and incubated at 20°C. These cultures were retained as before and examined every 7 to 10 days for signs of growth. No further growth was observed in these flasks.
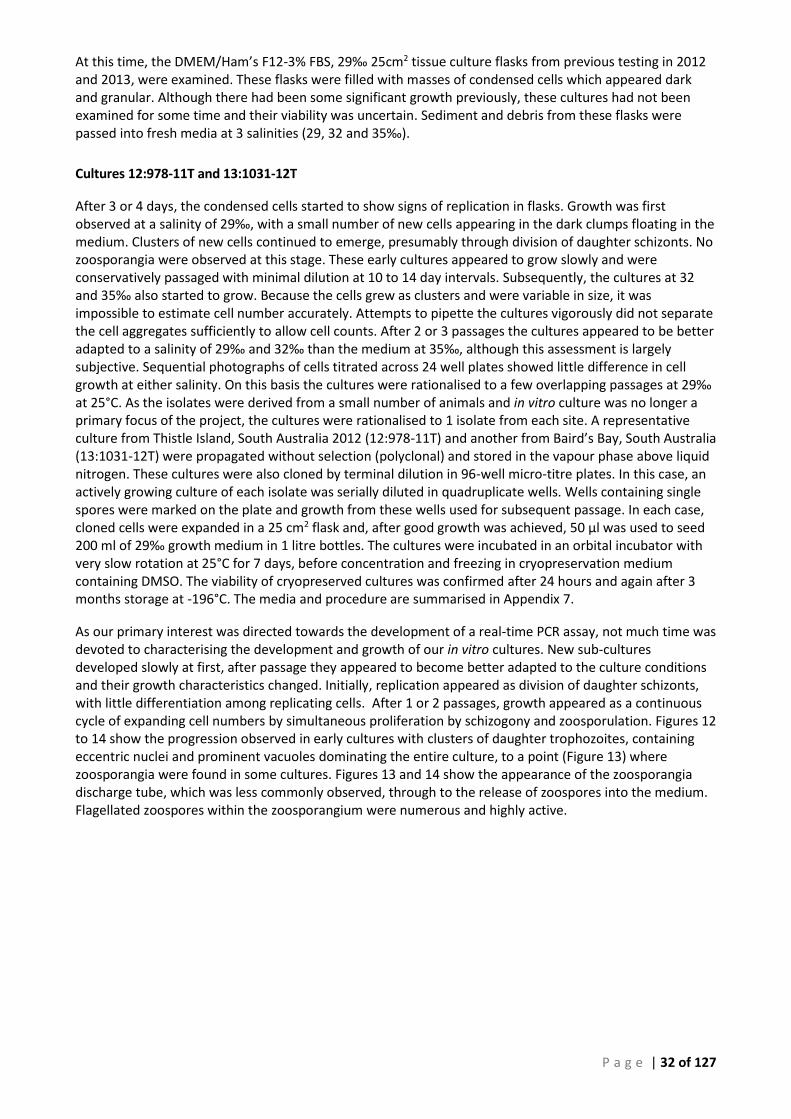
P a g e | 32 of 127
At this time, the DMEM/Ham’s F12-3% FBS, 29‰ 25cm2 tissue culture flasks from previous testing in 2012 and 2013, were examined. These flasks were filled with masses of condensed cells which appeared dark and granular. Although there had been some significant growth previously, these cultures had not been examined for some time and their viability was uncertain. Sediment and debris from these flasks were passed into fresh media at 3 salinities (29, 32 and 35‰).
Cultures 12:978-11T and 13:1031-12T
After 3 or 4 days, the condensed cells started to show signs of replication in flasks. Growth was first observed at a salinity of 29‰, with a small number of new cells appearing in the dark clumps floating in the medium. Clusters of new cells continued to emerge, presumably through division of daughter schizonts. No zoosporangia were observed at this stage. These early cultures appeared to grow slowly and were conservatively passaged with minimal dilution at 10 to 14 day intervals. Subsequently, the cultures at 32 and 35‰ also started to grow. Because the cells grew as clusters and were variable in size, it was impossible to estimate cell number accurately. Attempts to pipette the cultures vigorously did not separate the cell aggregates sufficiently to allow cell counts. After 2 or 3 passages the cultures appeared to be better adapted to a salinity of 29‰ and 32‰ than the medium at 35‰, although this assessment is largely subjective. Sequential photographs of cells titrated across 24 well plates showed little difference in cell growth at either salinity. On this basis the cultures were rationalised to a few overlapping passages at 29‰ at 25°C. As the isolates were derived from a small number of animals and in vitro culture was no longer a primary focus of the project, the cultures were rationalised to 1 isolate from each site. A representative culture from Thistle Island, South Australia 2012 (12:978-11T) and another from Baird’s Bay, South Australia (13:1031-12T) were propagated without selection (polyclonal) and stored in the vapour phase above liquid nitrogen. These cultures were also cloned by terminal dilution in 96-well micro-titre plates. In this case, an actively growing culture of each isolate was serially diluted in quadruplicate wells. Wells containing single spores were marked on the plate and growth from these wells used for subsequent passage. In each case, cloned cells were expanded in a 25 cm2 flask and, after good growth was achieved, 50 µl was used to seed 200 ml of 29‰ growth medium in 1 litre bottles. The cultures were incubated in an orbital incubator with very slow rotation at 25°C for 7 days, before concentration and freezing in cryopreservation medium containing DMSO. The viability of cryopreserved cultures was confirmed after 24 hours and again after 3 months storage at -196°C. The media and procedure are summarised in Appendix 7.
As our primary interest was directed towards the development of a real-time PCR assay, not much time was devoted to characterising the development and growth of our in vitro cultures. New sub-cultures developed slowly at first, after passage they appeared to become better adapted to the culture conditions and their growth characteristics changed. Initially, replication appeared as division of daughter schizonts, with little differentiation among replicating cells. After 1 or 2 passages, growth appeared as a continuous cycle of expanding cell numbers by simultaneous proliferation by schizogony and zoosporulation. Figures 12 to 14 show the progression observed in early cultures with clusters of daughter trophozoites, containing eccentric nuclei and prominent vacuoles dominating the entire culture, to a point (Figure 13) where zoosporangia were found in some cultures. Figures 13 and 14 show the appearance of the zoosporangia discharge tube, which was less commonly observed, through to the release of zoospores into the medium. Flagellated zoospores within the zoosporangium were numerous and highly active.
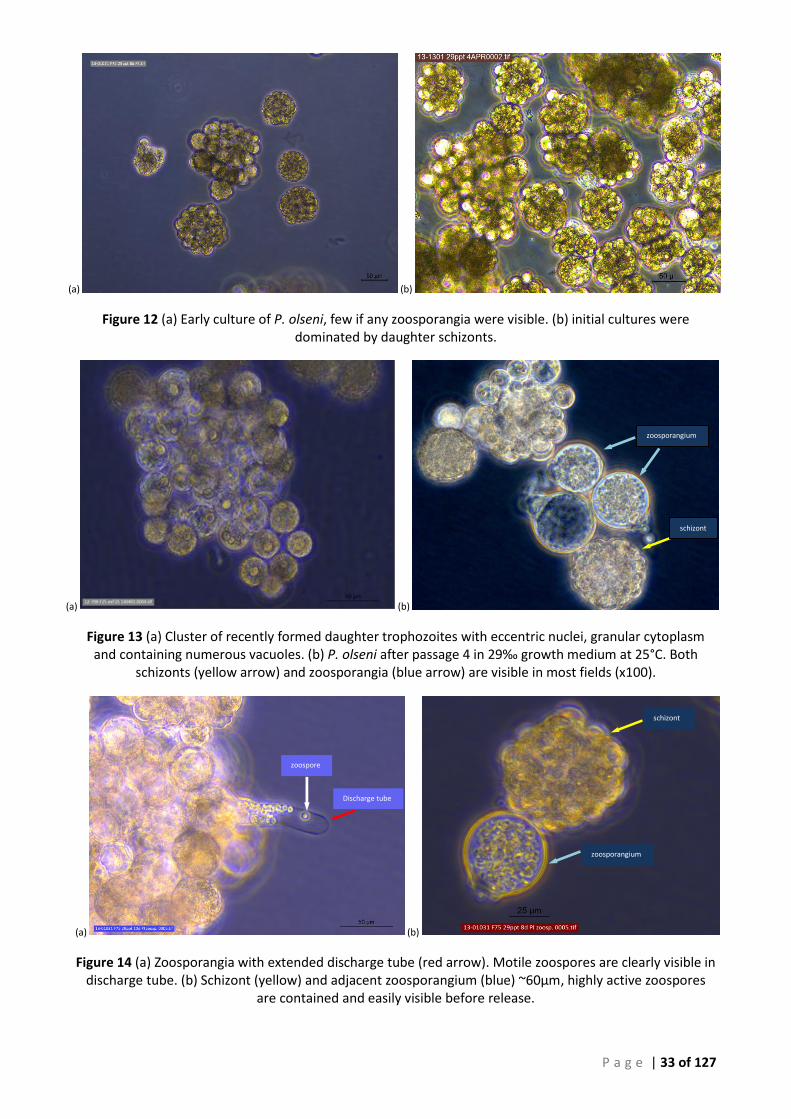
P a g e | 33 of 127
(a) (b)
Figure 12 (a) Early culture of P. olseni, few if any zoosporangia were visible. (b) initial cultures were dominated by daughter schizonts.
(a) (b)
Figure 13 (a) Cluster of recently formed daughter trophozoites with eccentric nuclei, granular cytoplasm and containing numerous vacuoles. (b) P. olseni after passage 4 in 29‰ growth medium at 25°C. Both
schizonts (yellow arrow) and zoosporangia (blue arrow) are visible in most fields (x100).
(a) (b)
Figure 14 (a) Zoosporangia with extended discharge tube (red arrow). Motile zoospores are clearly visible in discharge tube. (b) Schizont (yellow) and adjacent zoosporangium (blue) ~60µm, highly active zoospores
are contained and easily visible before release.
zoosporangium
zoosporangium
schizont
schizont
zoospore
Discharge tube
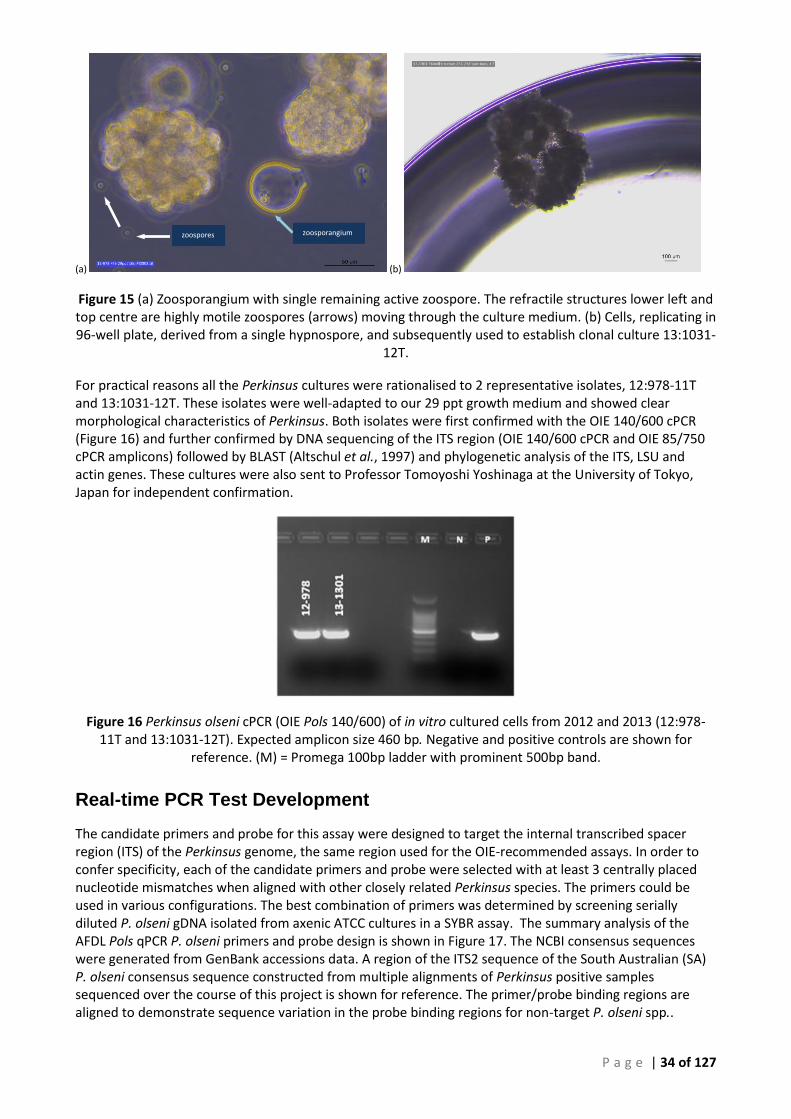
P a g e | 34 of 127
(a) (b)
Figure 15 (a) Zoosporangium with single remaining active zoospore. The refractile structures lower left and top centre are highly motile zoospores (arrows) moving through the culture medium. (b) Cells, replicating in 96-well plate, derived from a single hypnospore, and subsequently used to establish clonal culture 13:1031-
12T.
For practical reasons all the Perkinsus cultures were rationalised to 2 representative isolates, 12:978-11T and 13:1031-12T. These isolates were well-adapted to our 29 ppt growth medium and showed clear morphological characteristics of Perkinsus. Both isolates were first confirmed with the OIE 140/600 cPCR (Figure 16) and further confirmed by DNA sequencing of the ITS region (OIE 140/600 cPCR and OIE 85/750 cPCR amplicons) followed by BLAST (Altschul et al., 1997) and phylogenetic analysis of the ITS, LSU and actin genes. These cultures were also sent to Professor Tomoyoshi Yoshinaga at the University of Tokyo, Japan for independent confirmation.
Figure 16 Perkinsus olseni cPCR (OIE Pols 140/600) of in vitro cultured cells from 2012 and 2013 (12:978-11T and 13:1031-12T). Expected amplicon size 460 bp. Negative and positive controls are shown for
reference. (M) = Promega 100bp ladder with prominent 500bp band.
Real-time PCR Test Development
The candidate primers and probe for this assay were designed to target the internal transcribed spacer region (ITS) of the Perkinsus genome, the same region used for the OIE-recommended assays. In order to confer specificity, each of the candidate primers and probe were selected with at least 3 centrally placed nucleotide mismatches when aligned with other closely related Perkinsus species. The primers could be used in various configurations. The best combination of primers was determined by screening serially diluted P. olseni gDNA isolated from axenic ATCC cultures in a SYBR assay. The summary analysis of the AFDL Pols qPCR P. olseni primers and probe design is shown in Figure 17. The NCBI consensus sequences were generated from GenBank accessions data. A region of the ITS2 sequence of the South Australian (SA) P. olseni consensus sequence constructed from multiple alignments of Perkinsus positive samples sequenced over the course of this project is shown for reference. The primer/probe binding regions are aligned to demonstrate sequence variation in the probe binding regions for non-target P. olseni spp..
zoospores zoosporangium

P a g e | 35 of 127
Figure 17 AFDL Pols qPCR Primer-Probe binding sites in Perkinsus olseni.
(A)
(B)
(C)
(D)
(E)
(F)
(G)
DNA consensus sequences for (A) P. olseni, (B) P. marinus, (C) P. chesapeaki, (D) P. mediterraneus, (E) P. honshuensis, (F) P. beihaiensis and (G) P. qugwadi aligned against the South Australian P. olseni consensus and the AFDL Pols qPCR primer-probe binding sites summarising the sequence variation and design rationale in the target regions with non-P. olseni sp.
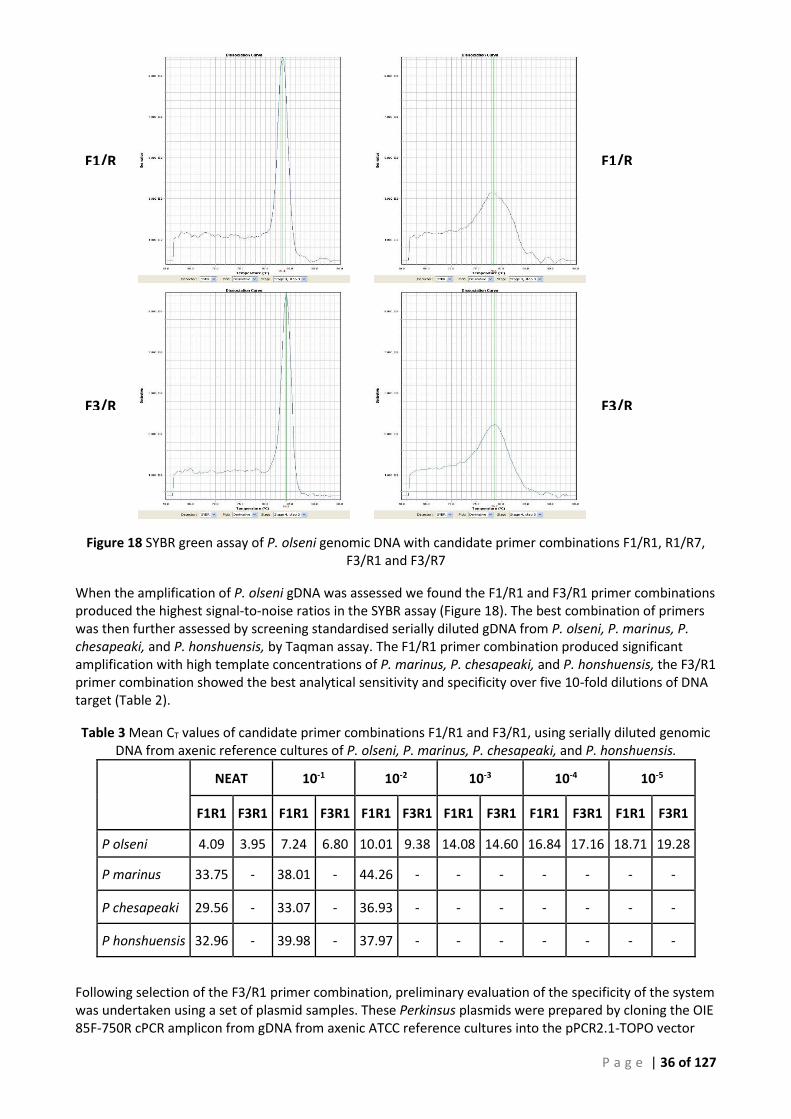
P a g e | 36 of 127
Figure 18 SYBR green assay of P. olseni genomic DNA with candidate primer combinations F1/R1, R1/R7, F3/R1 and F3/R7
When the amplification of P. olseni gDNA was assessed we found the F1/R1 and F3/R1 primer combinations produced the highest signal-to-noise ratios in the SYBR assay (Figure 18). The best combination of primers was then further assessed by screening standardised serially diluted gDNA from P. olseni, P. marinus, P. chesapeaki, and P. honshuensis, by Taqman assay. The F1/R1 primer combination produced significant amplification with high template concentrations of P. marinus, P. chesapeaki, and P. honshuensis, the F3/R1 primer combination showed the best analytical sensitivity and specificity over five 10-fold dilutions of DNA target (Table 2).
Table 3 Mean CT values of candidate primer combinations F1/R1 and F3/R1, using serially diluted genomic DNA from axenic reference cultures of P. olseni, P. marinus, P. chesapeaki, and P. honshuensis.
NEAT 10-1 10-2 10-3 10-4 10-5
F1R1 F3R1 F1R1 F3R1 F1R1 F3R1 F1R1 F3R1 F1R1 F3R1 F1R1 F3R1
P olseni 4.09 3.95 7.24 6.80 10.01 9.38 14.08 14.60 16.84 17.16 18.71 19.28
P marinus 33.75 - 38.01 - 44.26 - - - - - - -
P chesapeaki 29.56 - 33.07 - 36.93 - - - - - - -
P honshuensis 32.96 - 39.98 - 37.97 - - - - - - -
Following selection of the F3/R1 primer combination, preliminary evaluation of the specificity of the system was undertaken using a set of plasmid samples. These Perkinsus plasmids were prepared by cloning the OIE 85F-750R cPCR amplicon from gDNA from axenic ATCC reference cultures into the pPCR2.1-TOPO vector
F1/R
F3/RF3/R
F1/R
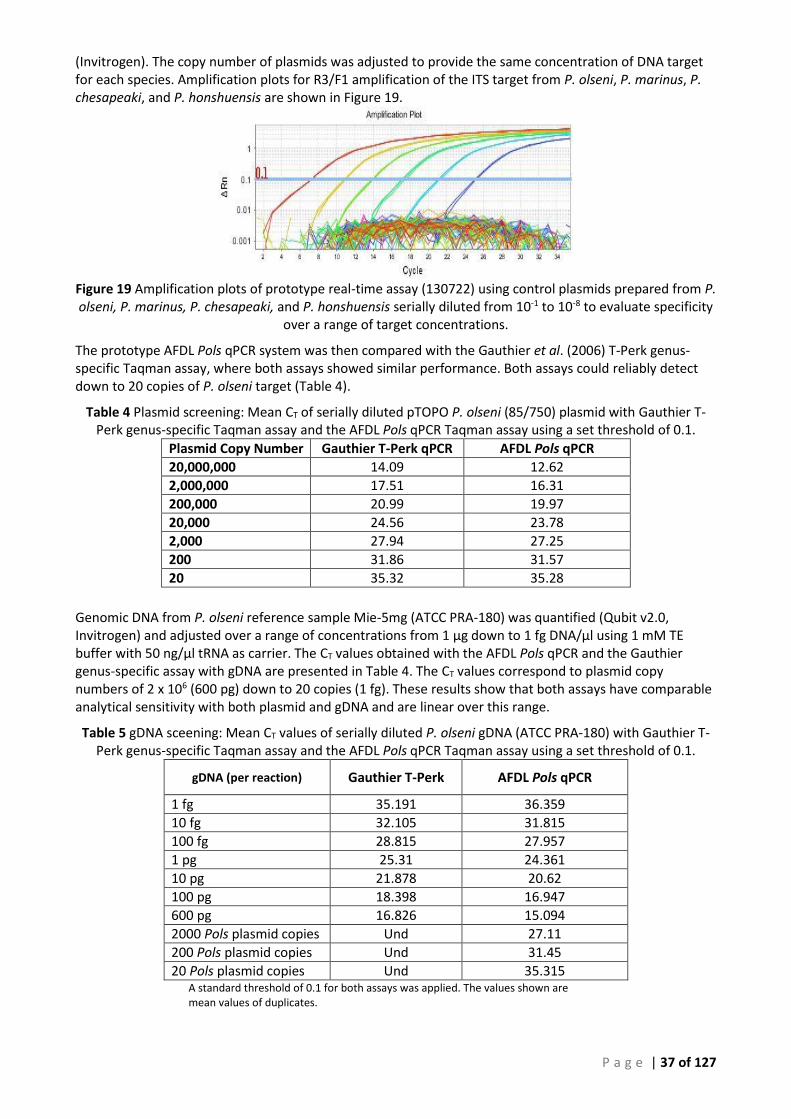
P a g e | 37 of 127
(Invitrogen). The copy number of plasmids was adjusted to provide the same concentration of DNA target for each species. Amplification plots for R3/F1 amplification of the ITS target from P. olseni, P. marinus, P. chesapeaki, and P. honshuensis are shown in Figure 19.
Figure 19 Amplification plots of prototype real-time assay (130722) using control plasmids prepared from P. olseni, P. marinus, P. chesapeaki, and P. honshuensis serially diluted from 10-1 to 10-8 to evaluate specificity
over a range of target concentrations.
The prototype AFDL Pols qPCR system was then compared with the Gauthier et al. (2006) T-Perk genus-specific Taqman assay, where both assays showed similar performance. Both assays could reliably detect down to 20 copies of P. olseni target (Table 4).
Table 4 Plasmid screening: Mean CT of serially diluted pTOPO P. olseni (85/750) plasmid with Gauthier T-Perk genus-specific Taqman assay and the AFDL Pols qPCR Taqman assay using a set threshold of 0.1.
Plasmid Copy Number Gauthier T-Perk qPCR AFDL Pols qPCR
20,000,000 14.09 12.62
2,000,000 17.51 16.31
200,000 20.99 19.97
20,000 24.56 23.78
2,000 27.94 27.25
200 31.86 31.57
20 35.32 35.28
Genomic DNA from P. olseni reference sample Mie-5mg (ATCC PRA-180) was quantified (Qubit v2.0, Invitrogen) and adjusted over a range of concentrations from 1 µg down to 1 fg DNA/µl using 1 mM TE buffer with 50 ng/µl tRNA as carrier. The CT values obtained with the AFDL Pols qPCR and the Gauthier genus-specific assay with gDNA are presented in Table 4. The CT values correspond to plasmid copy numbers of 2 x 10⁶ (600 pg) down to 20 copies (1 fg). These results show that both assays have comparable analytical sensitivity with both plasmid and gDNA and are linear over this range.
Table 5 gDNA sceening: Mean CT values of serially diluted P. olseni gDNA (ATCC PRA-180) with Gauthier T-Perk genus-specific Taqman assay and the AFDL Pols qPCR Taqman assay using a set threshold of 0.1.
gDNA (per reaction) Gauthier T-Perk AFDL Pols qPCR
1 fg 35.191 36.359
10 fg 32.105 31.815
100 fg 28.815 27.957
1 pg 25.31 24.361
10 pg 21.878 20.62
100 pg 18.398 16.947
600 pg 16.826 15.094
2000 Pols plasmid copies Und 27.11
200 Pols plasmid copies Und 31.45
20 Pols plasmid copies Und 35.315 A standard threshold of 0.1 for both assays was applied. The values shown are mean values of duplicates.
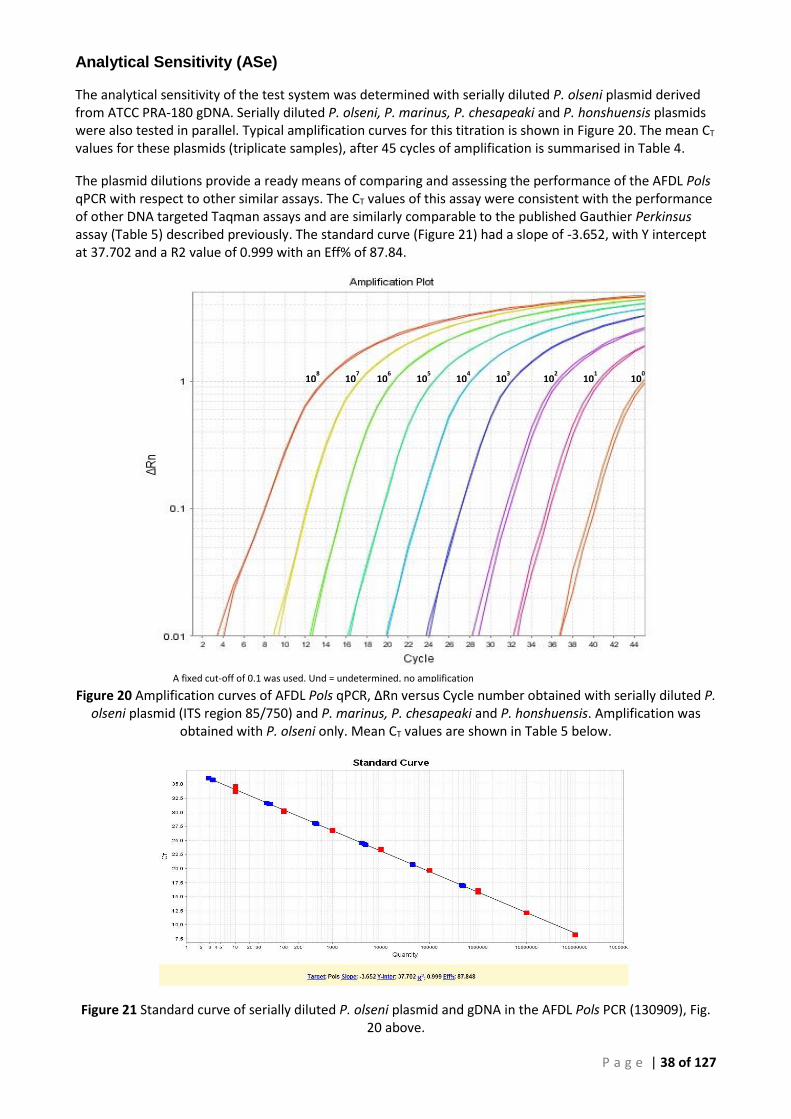
P a g e | 38 of 127
Analytical Sensitivity (ASe)
The analytical sensitivity of the test system was determined with serially diluted P. olseni plasmid derived from ATCC PRA-180 gDNA. Serially diluted P. olseni, P. marinus, P. chesapeaki and P. honshuensis plasmids were also tested in parallel. Typical amplification curves for this titration is shown in Figure 20. The mean CT values for these plasmids (triplicate samples), after 45 cycles of amplification is summarised in Table 4.
The plasmid dilutions provide a ready means of comparing and assessing the performance of the AFDL Pols qPCR with respect to other similar assays. The CT values of this assay were consistent with the performance of other DNA targeted Taqman assays and are similarly comparable to the published Gauthier Perkinsus assay (Table 5) described previously. The standard curve (Figure 21) had a slope of -3.652, with Y intercept at 37.702 and a R2 value of 0.999 with an Eff% of 87.84.
Figure 20 Amplification curves of AFDL Pols qPCR, ∆Rn versus Cycle number obtained with serially diluted P. olseni plasmid (ITS region 85/750) and P. marinus, P. chesapeaki and P. honshuensis. Amplification was
obtained with P. olseni only. Mean CT values are shown in Table 5 below.
Figure 21 Standard curve of serially diluted P. olseni plasmid and gDNA in the AFDL Pols PCR (130909), Fig. 20 above.
108 10
7 106 10
5 104 10
3 102 10
1 100
A fixed cut-off of 0.1 was used. Und = undetermined, no amplification after 45 cycles.
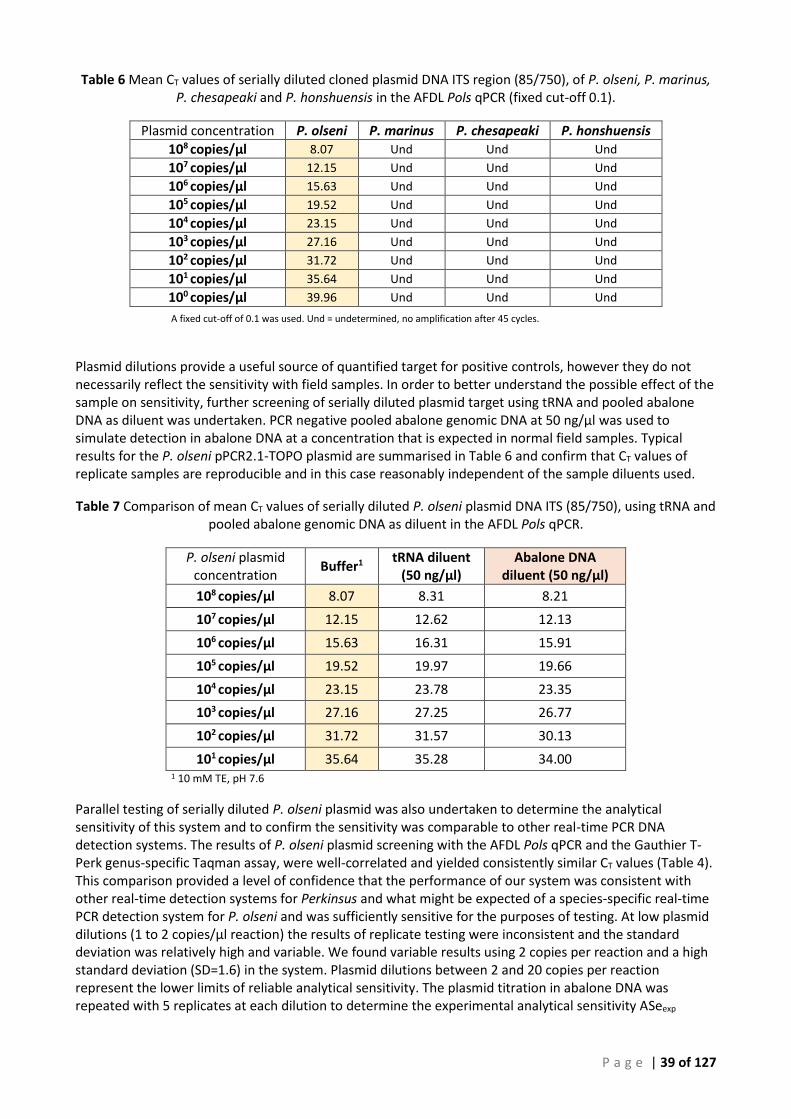
P a g e | 39 of 127
Table 6 Mean CT values of serially diluted cloned plasmid DNA ITS region (85/750), of P. olseni, P. marinus,
P. chesapeaki and P. honshuensis in the AFDL Pols qPCR (fixed cut-off 0.1).
Plasmid concentration P. olseni P. marinus P. chesapeaki P. honshuensis
108 copies/µl 8.07 Und Und Und
107 copies/µl 12.15 Und Und Und
106 copies/µl 15.63 Und Und Und
105 copies/µl 19.52 Und Und Und
104 copies/µl 23.15 Und Und Und
103 copies/µl 27.16 Und Und Und
102 copies/µl 31.72 Und Und Und
101 copies/µl 35.64 Und Und Und
100 copies/µl 39.96 Und Und Und
A fixed cut-off of 0.1 was used. Und = undetermined, no amplification after 45 cycles.
Plasmid dilutions provide a useful source of quantified target for positive controls, however they do not necessarily reflect the sensitivity with field samples. In order to better understand the possible effect of the sample on sensitivity, further screening of serially diluted plasmid target using tRNA and pooled abalone DNA as diluent was undertaken. PCR negative pooled abalone genomic DNA at 50 ng/µl was used to simulate detection in abalone DNA at a concentration that is expected in normal field samples. Typical results for the P. olseni pPCR2.1-TOPO plasmid are summarised in Table 6 and confirm that CT values of replicate samples are reproducible and in this case reasonably independent of the sample diluents used.
Table 7 Comparison of mean CT values of serially diluted P. olseni plasmid DNA ITS (85/750), using tRNA and pooled abalone genomic DNA as diluent in the AFDL Pols qPCR.
1 10 mM TE, pH 7.6
Parallel testing of serially diluted P. olseni plasmid was also undertaken to determine the analytical sensitivity of this system and to confirm the sensitivity was comparable to other real-time PCR DNA detection systems. The results of P. olseni plasmid screening with the AFDL Pols qPCR and the Gauthier T-Perk genus-specific Taqman assay, were well-correlated and yielded consistently similar CT values (Table 4). This comparison provided a level of confidence that the performance of our system was consistent with other real-time detection systems for Perkinsus and what might be expected of a species-specific real-time PCR detection system for P. olseni and was sufficiently sensitive for the purposes of testing. At low plasmid dilutions (1 to 2 copies/µl reaction) the results of replicate testing were inconsistent and the standard deviation was relatively high and variable. We found variable results using 2 copies per reaction and a high standard deviation (SD=1.6) in the system. Plasmid dilutions between 2 and 20 copies per reaction represent the lower limits of reliable analytical sensitivity. The plasmid titration in abalone DNA was repeated with 5 replicates at each dilution to determine the experimental analytical sensitivity ASeexp
P. olseni plasmid concentration
Buffer1 tRNA diluent
(50 ng/µl) Abalone DNA
diluent (50 ng/µl)
108 copies/µl 8.07 8.31 8.21
107 copies/µl 12.15 12.62 12.13
106 copies/µl 15.63 16.31 15.91
105 copies/µl 19.52 19.97 19.66
104 copies/µl 23.15 23.78 23.35
103 copies/µl 27.16 27.25 26.77
102 copies/µl 31.72 31.57 30.13
101 copies/µl 35.64 35.28 34.00
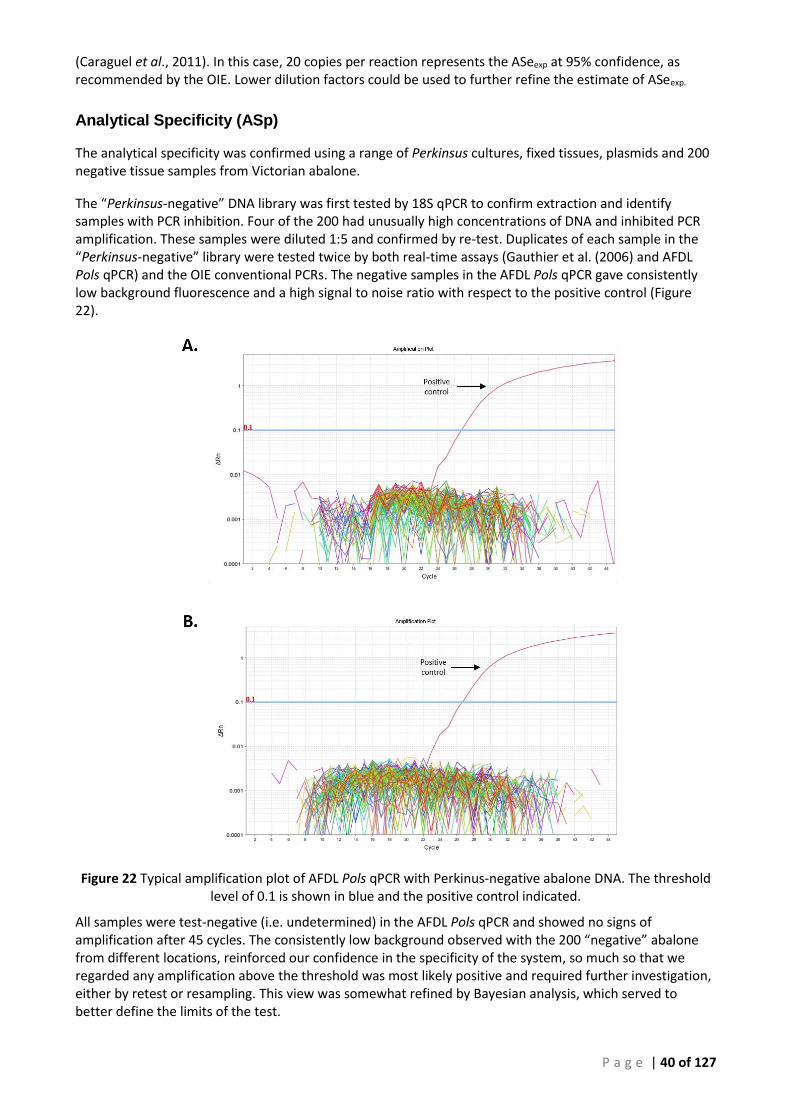
P a g e | 40 of 127
(Caraguel et al., 2011). In this case, 20 copies per reaction represents the ASeexp at 95% confidence, as recommended by the OIE. Lower dilution factors could be used to further refine the estimate of ASeexp.
Analytical Specificity (ASp)
The analytical specificity was confirmed using a range of Perkinsus cultures, fixed tissues, plasmids and 200 negative tissue samples from Victorian abalone.
The “Perkinsus-negative” DNA library was first tested by 18S qPCR to confirm extraction and identify samples with PCR inhibition. Four of the 200 had unusually high concentrations of DNA and inhibited PCR amplification. These samples were diluted 1:5 and confirmed by re-test. Duplicates of each sample in the “Perkinsus-negative” library were tested twice by both real-time assays (Gauthier et al. (2006) and AFDL Pols qPCR) and the OIE conventional PCRs. The negative samples in the AFDL Pols qPCR gave consistently low background fluorescence and a high signal to noise ratio with respect to the positive control (Figure 22).
Figure 22 Typical amplification plot of AFDL Pols qPCR with Perkinus-negative abalone DNA. The threshold level of 0.1 is shown in blue and the positive control indicated.
All samples were test-negative (i.e. undetermined) in the AFDL Pols qPCR and showed no signs of amplification after 45 cycles. The consistently low background observed with the 200 “negative” abalone from different locations, reinforced our confidence in the specificity of the system, so much so that we regarded any amplification above the threshold was most likely positive and required further investigation, either by retest or resampling. This view was somewhat refined by Bayesian analysis, which served to better define the limits of the test.
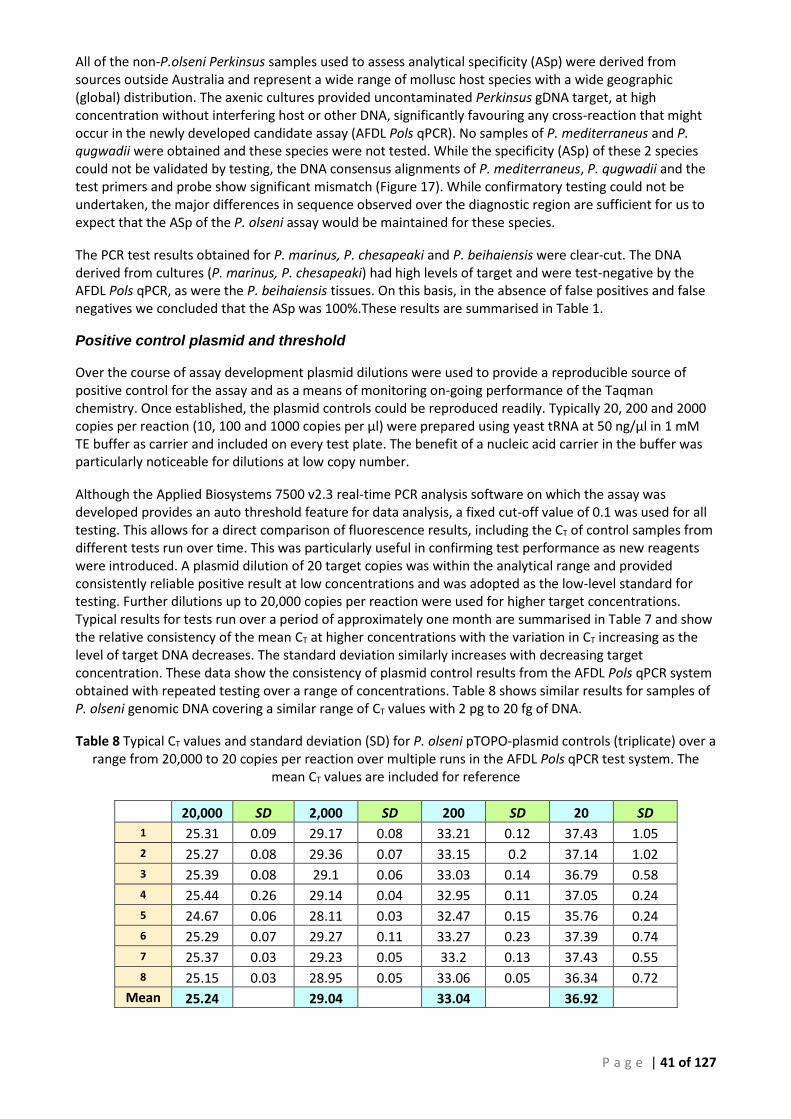
P a g e | 41 of 127
All of the non-P.olseni Perkinsus samples used to assess analytical specificity (ASp) were derived from sources outside Australia and represent a wide range of mollusc host species with a wide geographic (global) distribution. The axenic cultures provided uncontaminated Perkinsus gDNA target, at high concentration without interfering host or other DNA, significantly favouring any cross-reaction that might occur in the newly developed candidate assay (AFDL Pols qPCR). No samples of P. mediterraneus and P. qugwadii were obtained and these species were not tested. While the specificity (ASp) of these 2 species could not be validated by testing, the DNA consensus alignments of P. mediterraneus, P. qugwadii and the test primers and probe show significant mismatch (Figure 17). While confirmatory testing could not be undertaken, the major differences in sequence observed over the diagnostic region are sufficient for us to expect that the ASp of the P. olseni assay would be maintained for these species.
The PCR test results obtained for P. marinus, P. chesapeaki and P. beihaiensis were clear-cut. The DNA derived from cultures (P. marinus, P. chesapeaki) had high levels of target and were test-negative by the AFDL Pols qPCR, as were the P. beihaiensis tissues. On this basis, in the absence of false positives and false negatives we concluded that the ASp was 100%.These results are summarised in Table 1.
Positive control plasmid and threshold
Over the course of assay development plasmid dilutions were used to provide a reproducible source of positive control for the assay and as a means of monitoring on-going performance of the Taqman chemistry. Once established, the plasmid controls could be reproduced readily. Typically 20, 200 and 2000 copies per reaction (10, 100 and 1000 copies per µl) were prepared using yeast tRNA at 50 ng/µl in 1 mM TE buffer as carrier and included on every test plate. The benefit of a nucleic acid carrier in the buffer was particularly noticeable for dilutions at low copy number.
Although the Applied Biosystems 7500 v2.3 real-time PCR analysis software on which the assay was developed provides an auto threshold feature for data analysis, a fixed cut-off value of 0.1 was used for all testing. This allows for a direct comparison of fluorescence results, including the CT of control samples from different tests run over time. This was particularly useful in confirming test performance as new reagents were introduced. A plasmid dilution of 20 target copies was within the analytical range and provided consistently reliable positive result at low concentrations and was adopted as the low-level standard for testing. Further dilutions up to 20,000 copies per reaction were used for higher target concentrations. Typical results for tests run over a period of approximately one month are summarised in Table 7 and show the relative consistency of the mean CT at higher concentrations with the variation in CT increasing as the level of target DNA decreases. The standard deviation similarly increases with decreasing target concentration. These data show the consistency of plasmid control results from the AFDL Pols qPCR system obtained with repeated testing over a range of concentrations. Table 8 shows similar results for samples of P. olseni genomic DNA covering a similar range of CT values with 2 pg to 20 fg of DNA.
Table 8 Typical CT values and standard deviation (SD) for P. olseni pTOPO-plasmid controls (triplicate) over a range from 20,000 to 20 copies per reaction over multiple runs in the AFDL Pols qPCR test system. The
mean CT values are included for reference
20,000 SD 2,000 SD 200 SD 20 SD
1 25.31 0.09 29.17 0.08 33.21 0.12 37.43 1.05
2 25.27 0.08 29.36 0.07 33.15 0.2 37.14 1.02
3 25.39 0.08 29.1 0.06 33.03 0.14 36.79 0.58
4 25.44 0.26 29.14 0.04 32.95 0.11 37.05 0.24
5 24.67 0.06 28.11 0.03 32.47 0.15 35.76 0.24
6 25.29 0.07 29.27 0.11 33.27 0.23 37.39 0.74
7 25.37 0.03 29.23 0.05 33.2 0.13 37.43 0.55
8 25.15 0.03 28.95 0.05 33.06 0.05 36.34 0.72
Mean 25.24 29.04 33.04 36.92
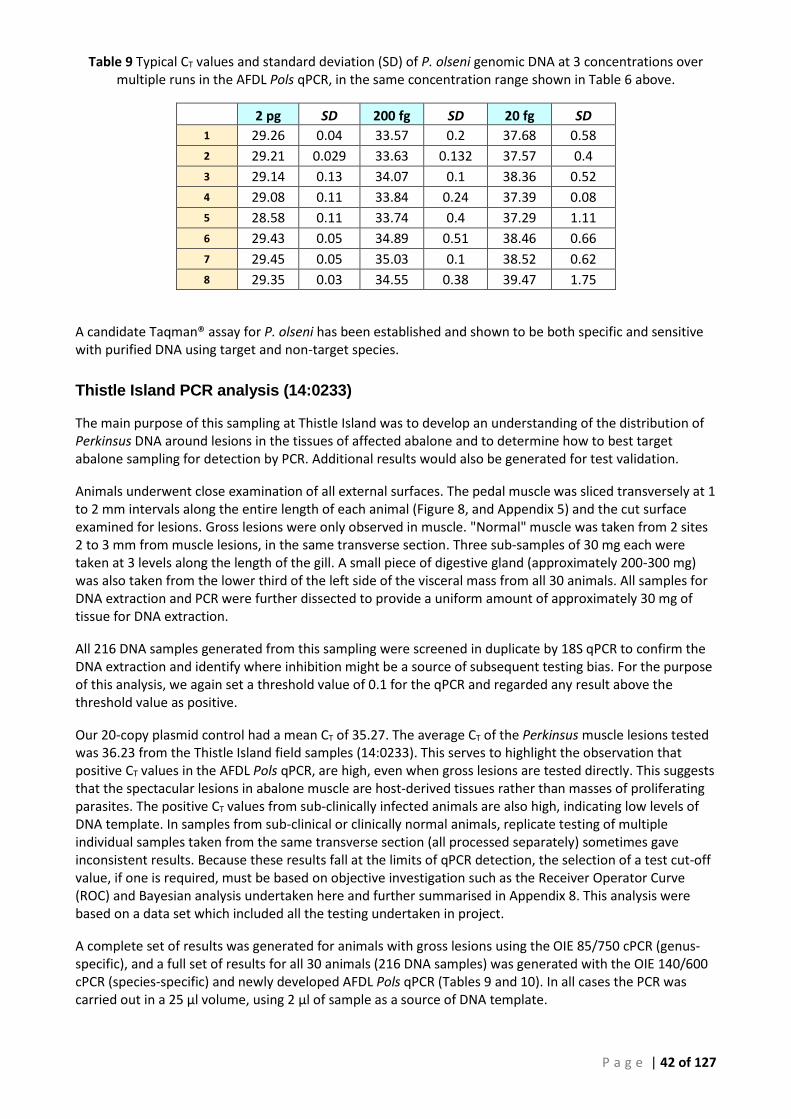
P a g e | 42 of 127
Table 9 Typical CT values and standard deviation (SD) of P. olseni genomic DNA at 3 concentrations over multiple runs in the AFDL Pols qPCR, in the same concentration range shown in Table 6 above.
2 pg SD 200 fg SD 20 fg SD
1 29.26 0.04 33.57 0.2 37.68 0.58
2 29.21 0.029 33.63 0.132 37.57 0.4
3 29.14 0.13 34.07 0.1 38.36 0.52
4 29.08 0.11 33.84 0.24 37.39 0.08
5 28.58 0.11 33.74 0.4 37.29 1.11
6 29.43 0.05 34.89 0.51 38.46 0.66
7 29.45 0.05 35.03 0.1 38.52 0.62
8 29.35 0.03 34.55 0.38 39.47 1.75
A candidate Taqman® assay for P. olseni has been established and shown to be both specific and sensitive with purified DNA using target and non-target species.
Thistle Island PCR analysis (14:0233)
The main purpose of this sampling at Thistle Island was to develop an understanding of the distribution of Perkinsus DNA around lesions in the tissues of affected abalone and to determine how to best target abalone sampling for detection by PCR. Additional results would also be generated for test validation.
Animals underwent close examination of all external surfaces. The pedal muscle was sliced transversely at 1 to 2 mm intervals along the entire length of each animal (Figure 8, and Appendix 5) and the cut surface examined for lesions. Gross lesions were only observed in muscle. "Normal" muscle was taken from 2 sites 2 to 3 mm from muscle lesions, in the same transverse section. Three sub-samples of 30 mg each were taken at 3 levels along the length of the gill. A small piece of digestive gland (approximately 200-300 mg) was also taken from the lower third of the left side of the visceral mass from all 30 animals. All samples for DNA extraction and PCR were further dissected to provide a uniform amount of approximately 30 mg of tissue for DNA extraction.
All 216 DNA samples generated from this sampling were screened in duplicate by 18S qPCR to confirm the DNA extraction and identify where inhibition might be a source of subsequent testing bias. For the purpose of this analysis, we again set a threshold value of 0.1 for the qPCR and regarded any result above the threshold value as positive.
Our 20-copy plasmid control had a mean CT of 35.27. The average CT of the Perkinsus muscle lesions tested was 36.23 from the Thistle Island field samples (14:0233). This serves to highlight the observation that positive CT values in the AFDL Pols qPCR, are high, even when gross lesions are tested directly. This suggests that the spectacular lesions in abalone muscle are host-derived tissues rather than masses of proliferating parasites. The positive CT values from sub-clinically infected animals are also high, indicating low levels of DNA template. In samples from sub-clinical or clinically normal animals, replicate testing of multiple individual samples taken from the same transverse section (all processed separately) sometimes gave inconsistent results. Because these results fall at the limits of qPCR detection, the selection of a test cut-off value, if one is required, must be based on objective investigation such as the Receiver Operator Curve (ROC) and Bayesian analysis undertaken here and further summarised in Appendix 8. This analysis were based on a data set which included all the testing undertaken in project.
A complete set of results was generated for animals with gross lesions using the OIE 85/750 cPCR (genus-specific), and a full set of results for all 30 animals (216 DNA samples) was generated with the OIE 140/600 cPCR (species-specific) and newly developed AFDL Pols qPCR (Tables 9 and 10). In all cases the PCR was carried out in a 25 µl volume, using 2 µl of sample as a source of DNA template.

P a g e | 43 of 127
The real-time CT result in the tables represents an individual sample, and is expressed as the mean of each sample tested in triplicate. Testing was also carried out on samples at a 1:10 dilution (1:10 results not shown) to eliminate possible concentration effects as a source of error. Conventional PCR assays were performed as single tests on the DNA sample. These results provide a direct comparison of the relative performance of each test with a common set of samples derived from a range of tissues from naturally infected animals.
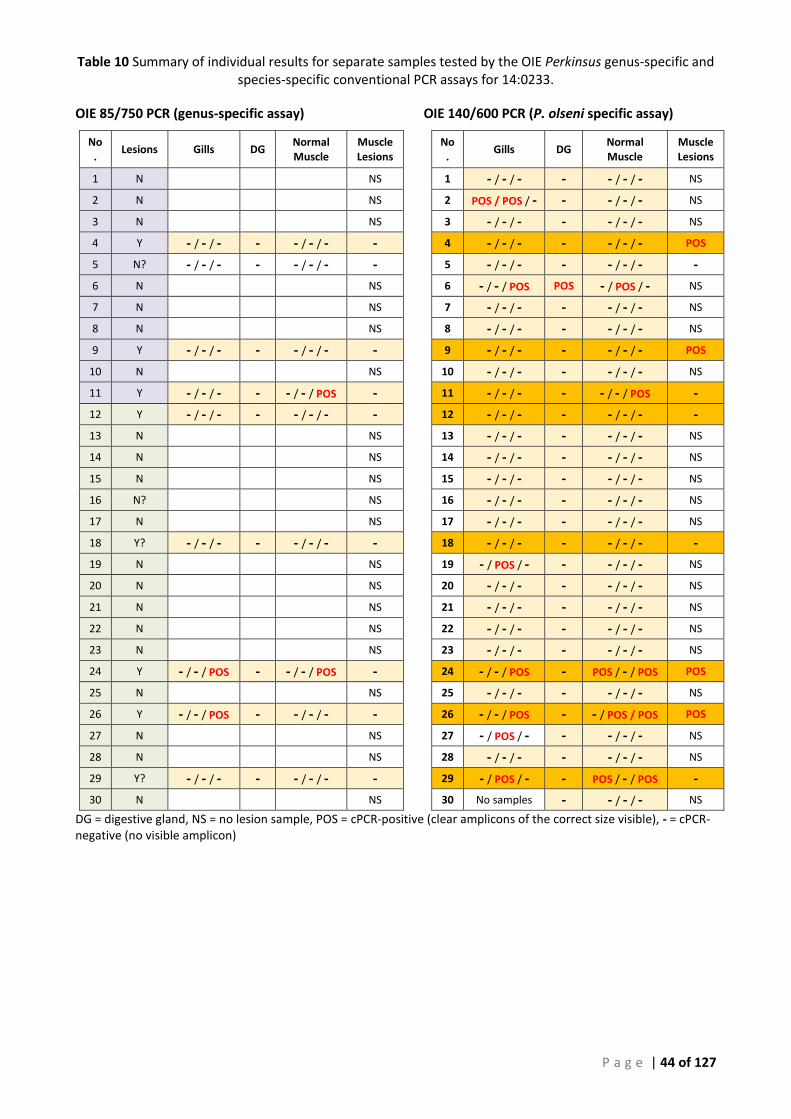
P a g e | 44 of 127
Table 10 Summary of individual results for separate samples tested by the OIE Perkinsus genus-specific and species-specific conventional PCR assays for 14:0233.
OIE 85/750 PCR (genus-specific assay) OIE 140/600 PCR (P. olseni specific assay)
No.
Lesions Gills DG Normal Muscle
Muscle Lesions
No
. Gills DG
Normal Muscle
Muscle Lesions
1 N NS 1 - / - / - - - / - / - NS
2 N NS 2 POS / POS / - - - / - / - NS
3 N NS 3 - / - / - - - / - / - NS
4 Y - / - / - - - / - / - - 4 - / - / - - - / - / - POS
5 N? - / - / - - - / - / - - 5 - / - / - - - / - / - -
6 N NS 6 - / - / POS POS - / POS / - NS
7 N NS 7 - / - / - - - / - / - NS
8 N NS 8 - / - / - - - / - / - NS
9 Y - / - / - - - / - / - - 9 - / - / - - - / - / - POS
10 N NS 10 - / - / - - - / - / - NS
11 Y - / - / - - - / - / POS - 11 - / - / - - - / - / POS -
12 Y - / - / - - - / - / - - 12 - / - / - - - / - / - -
13 N NS 13 - / - / - - - / - / - NS
14 N NS 14 - / - / - - - / - / - NS
15 N NS 15 - / - / - - - / - / - NS
16 N? NS 16 - / - / - - - / - / - NS
17 N NS 17 - / - / - - - / - / - NS
18 Y? - / - / - - - / - / - - 18 - / - / - - - / - / - -
19 N NS 19 - / POS / - - - / - / - NS
20 N NS 20 - / - / - - - / - / - NS
21 N NS 21 - / - / - - - / - / - NS
22 N NS 22 - / - / - - - / - / - NS
23 N NS 23 - / - / - - - / - / - NS
24 Y - / - / POS - - / - / POS - 24 - / - / POS - POS / - / POS POS
25 N NS 25 - / - / - - - / - / - NS
26 Y - / - / POS - - / - / - - 26 - / - / POS - - / POS / POS POS
27 N NS 27 - / POS / - - - / - / - NS
28 N NS 28 - / - / - - - / - / - NS
29 Y? - / - / - - - / - / - - 29 - / POS / - - POS / - / POS -
30 N NS 30 No samples - - / - / - NS
DG = digestive gland, NS = no lesion sample, POS = cPCR-positive (clear amplicons of the correct size visible), - = cPCR-negative (no visible amplicon)
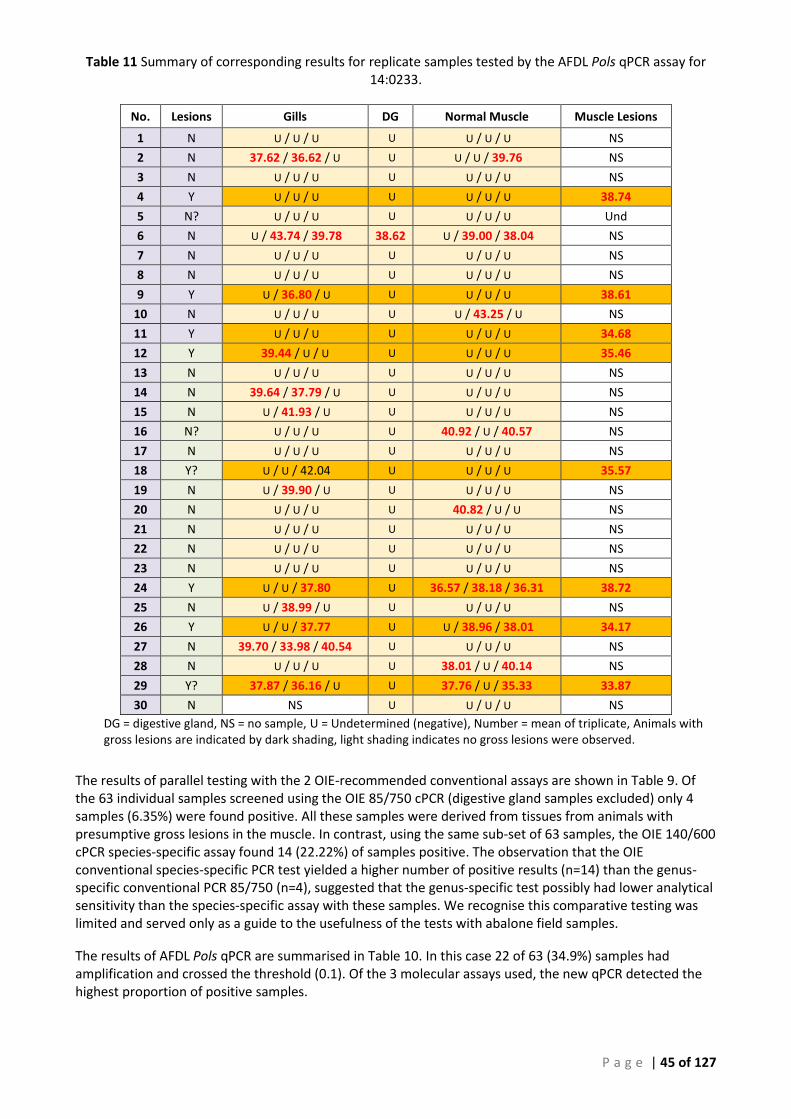
P a g e | 45 of 127
Table 11 Summary of corresponding results for replicate samples tested by the AFDL Pols qPCR assay for 14:0233.
No. Lesions Gills DG Normal Muscle Muscle Lesions
1 N U / U / U U U / U / U NS
2 N 37.62 / 36.62 / U U U / U / 39.76 NS
3 N U / U / U U U / U / U NS
4 Y U / U / U U U / U / U 38.74
5 N? U / U / U U U / U / U Und
6 N U / 43.74 / 39.78 38.62 U / 39.00 / 38.04 NS
7 N U / U / U U U / U / U NS
8 N U / U / U U U / U / U NS
9 Y U / 36.80 / U U U / U / U 38.61
10 N U / U / U U U / 43.25 / U NS
11 Y U / U / U U U / U / U 34.68
12 Y 39.44 / U / U U U / U / U 35.46
13 N U / U / U U U / U / U NS
14 N 39.64 / 37.79 / U U U / U / U NS
15 N U / 41.93 / U U U / U / U NS
16 N? U / U / U U 40.92 / U / 40.57 NS
17 N U / U / U U U / U / U NS
18 Y? U / U / 42.04 U U / U / U 35.57
19 N U / 39.90 / U U U / U / U NS
20 N U / U / U U 40.82 / U / U NS
21 N U / U / U U U / U / U NS
22 N U / U / U U U / U / U NS
23 N U / U / U U U / U / U NS
24 Y U / U / 37.80 U 36.57 / 38.18 / 36.31 38.72
25 N U / 38.99 / U U U / U / U NS
26 Y U / U / 37.77 U U / 38.96 / 38.01 34.17
27 N 39.70 / 33.98 / 40.54 U U / U / U NS
28 N U / U / U U 38.01 / U / 40.14 NS
29 Y? 37.87 / 36.16 / U U 37.76 / U / 35.33 33.87
30 N NS U U / U / U NS
DG = digestive gland, NS = no sample, U = Undetermined (negative), Number = mean of triplicate, Animals with gross lesions are indicated by dark shading, light shading indicates no gross lesions were observed.
The results of parallel testing with the 2 OIE-recommended conventional assays are shown in Table 9. Of the 63 individual samples screened using the OIE 85/750 cPCR (digestive gland samples excluded) only 4 samples (6.35%) were found positive. All these samples were derived from tissues from animals with presumptive gross lesions in the muscle. In contrast, using the same sub-set of 63 samples, the OIE 140/600 cPCR species-specific assay found 14 (22.22%) of samples positive. The observation that the OIE conventional species-specific PCR test yielded a higher number of positive results (n=14) than the genus-specific conventional PCR 85/750 (n=4), suggested that the genus-specific test possibly had lower analytical sensitivity than the species-specific assay with these samples. We recognise this comparative testing was limited and served only as a guide to the usefulness of the tests with abalone field samples.
The results of AFDL Pols qPCR are summarised in Table 10. In this case 22 of 63 (34.9%) samples had amplification and crossed the threshold (0.1). Of the 3 molecular assays used, the new qPCR detected the highest proportion of positive samples.
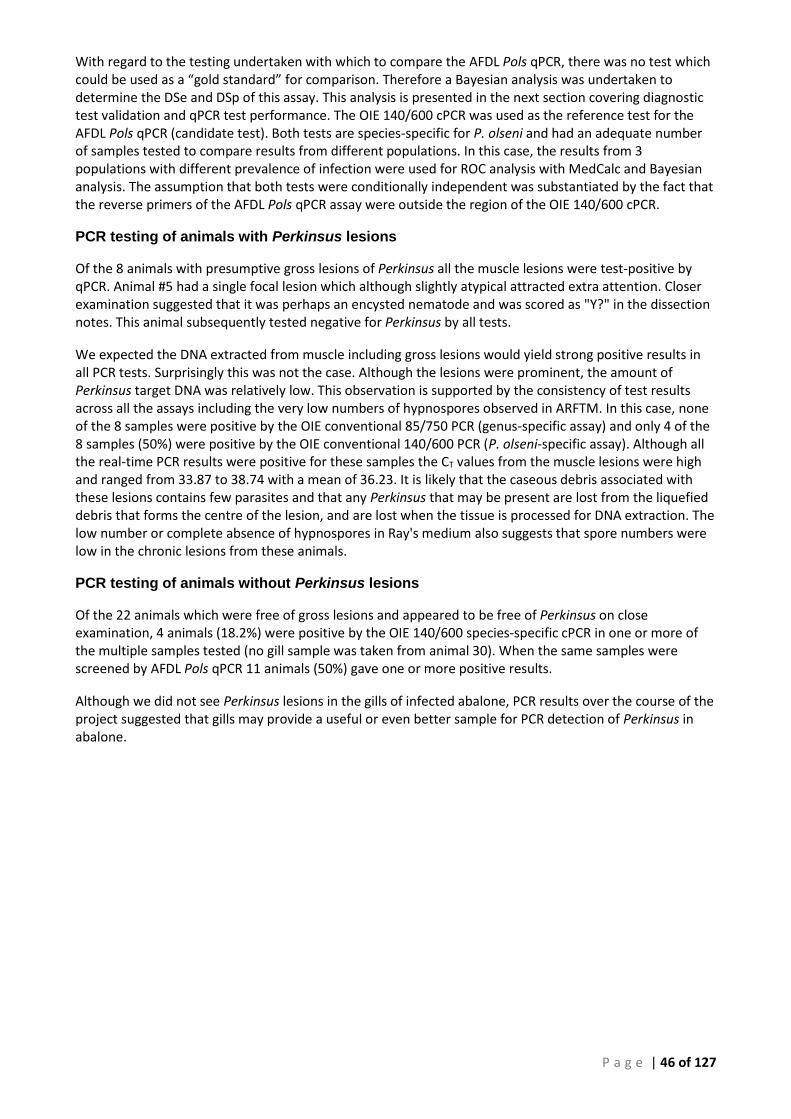
P a g e | 46 of 127
With regard to the testing undertaken with which to compare the AFDL Pols qPCR, there was no test which could be used as a “gold standard” for comparison. Therefore a Bayesian analysis was undertaken to determine the DSe and DSp of this assay. This analysis is presented in the next section covering diagnostic test validation and qPCR test performance. The OIE 140/600 cPCR was used as the reference test for the AFDL Pols qPCR (candidate test). Both tests are species-specific for P. olseni and had an adequate number of samples tested to compare results from different populations. In this case, the results from 3 populations with different prevalence of infection were used for ROC analysis with MedCalc and Bayesian analysis. The assumption that both tests were conditionally independent was substantiated by the fact that the reverse primers of the AFDL Pols qPCR assay were outside the region of the OIE 140/600 cPCR.
PCR testing of animals with Perkinsus lesions
Of the 8 animals with presumptive gross lesions of Perkinsus all the muscle lesions were test-positive by qPCR. Animal #5 had a single focal lesion which although slightly atypical attracted extra attention. Closer examination suggested that it was perhaps an encysted nematode and was scored as "Y?" in the dissection notes. This animal subsequently tested negative for Perkinsus by all tests.
We expected the DNA extracted from muscle including gross lesions would yield strong positive results in all PCR tests. Surprisingly this was not the case. Although the lesions were prominent, the amount of Perkinsus target DNA was relatively low. This observation is supported by the consistency of test results across all the assays including the very low numbers of hypnospores observed in ARFTM. In this case, none of the 8 samples were positive by the OIE conventional 85/750 PCR (genus-specific assay) and only 4 of the 8 samples (50%) were positive by the OIE conventional 140/600 PCR (P. olseni-specific assay). Although all the real-time PCR results were positive for these samples the CT values from the muscle lesions were high and ranged from 33.87 to 38.74 with a mean of 36.23. It is likely that the caseous debris associated with these lesions contains few parasites and that any Perkinsus that may be present are lost from the liquefied debris that forms the centre of the lesion, and are lost when the tissue is processed for DNA extraction. The low number or complete absence of hypnospores in Ray's medium also suggests that spore numbers were low in the chronic lesions from these animals.
PCR testing of animals without Perkinsus lesions
Of the 22 animals which were free of gross lesions and appeared to be free of Perkinsus on close examination, 4 animals (18.2%) were positive by the OIE 140/600 species-specific cPCR in one or more of the multiple samples tested (no gill sample was taken from animal 30). When the same samples were screened by AFDL Pols qPCR 11 animals (50%) gave one or more positive results.
Although we did not see Perkinsus lesions in the gills of infected abalone, PCR results over the course of the project suggested that gills may provide a useful or even better sample for PCR detection of Perkinsus in abalone.
P a g e | 47 of 127
Table 12 Summary of conventional PCR and real-time PCR screening of corresponding gill and muscle samples (14:0233).
OIE 140/600 cPCR qPCR
OIE 140/600
cPCR qPCR
Gills Gills Normal Muscle Normal Muscle
1 - / - / - U / U / U 1 - / - / - U / U / U
2 POS / POS / - 37.62 / 36.62 / U 2 - / - / - U / U / 39.76
3 - / - / - U / U / U 3 - / - / - U / U / U
4 - / - / - U / U / U 4 - / - / - U / U / U
5 - / - / - U / U / U 5 - / - / - U / U / U
6 - / - / POS U / 43.74 / 39.78 6 - / POS / - U / 39.00 / 38.04
7 - / - / - U / U / U 7 - / - / - U / U / U
8 - / - / - U / U / U 8 - / - / - U / U / U
9 - / - / - U / 36.80 / U 9 - / - / - U / U / U
10 - / - / - U / U / U 10 - / - / - U / 43.25 / U
11 - / - / - U / U / U 11 - / - / POS U / U / U
12 - / - / - 39.44 / U / U 12 - / - / - U / U / U
13 - / - / - U / U / U 13 - / - / - U / U / U
14 - / - / - 39.64 / 37.79 / U 14 - / - / - U / U / U
15 - / - / - U / 41.93 / U 15 - / - / - U / U / U
16 - / - / - U / U / U 16 - / - / - 40.92 / U / 40.57
17 - / - / - U / U / U 17 - / - / - U / U / U
18 - / - / - U / U / 42.04 18 - / - / - U / U / U
19 - / POS / - U / 39.90 / U 19 - / - / - U / U / U
20 - / - / - U / U / U 20 - / - / - 40.82 / U / U
21 - / - / - U / U / U 21 - / - / - U / U / U
22 - / - / - U / U / U 22 - / - / - U / U / U
23 - / - / - U / U / U 23 - / - / - U / U / U
24 - / - / POS U / U / 37.80 24 POS / - / POS 36.57 / 38.18 / 36.31
25 - / - / - U / 38.99 / U 25 - / - / - U / U / U
26 - / - / POS U / U / 37.77 26 - / POS / POS U / 38.96 / 38.01
27 - / POS / - 39.70 / 33.98 / 40.54 27 - / - / - U / U / U
28 - / - / - U / U / U 28 - / - / - 38.01 / U / 40.14
29 - / POS / - 37.87 / 36.16 / U 29 POS / - / POS 37.76 / U / 35.33
30 NS NS 30 - / - / - U / U / U
NS = no sample, U = Undetermined (negative) Number = mean of triplicate, Animals with gross lesions are indicated by dark shading, light shading indicates no gross lesions were observed.
PCR testing of Digestive Gland
The column-extracted DNA sample from digestive gland (DG) was found to be inhibitory in the 18S-directed PCR and although the inhibition could be eliminated by dilution, this reduced the amount of DNA target by the same proportion (data not shown). For this reason the digestive gland was not considered a useful sample for PCR detection using the conventional column-based extraction process for DNA isolation.
During preliminary Perkinsus OIE cPCR screening of the animals with gross lesions (4, 9, 11, 12, 18, 24, 26 and 29), a small number of animals without lesions were also tested as background negative controls. Despite the negative 18S pre-screening, the digestive gland from animal 6 was found to be positive with the OIE 140/600 P. olseni-specific cPCR. This PCR result was reproducible and was also confirmed with the AFDL Pols qPCR test (CT 38.62). As a result we tested all the digestive gland DNA samples by both the OIE 140/600 cPCR and the qPCR in this analysis. No other PCR positive samples from digestive gland were detected by either OIE cPCR or the AFDL Pols qPCR. We conclude that the result from DG of animal #6 was atypical and
P a g e | 48 of 127
perhaps the result of finding a concentration of parasites in the small section of digestive gland tested. These data serve to confirm that column-extracted DNA from digestive gland is not a useful sample for Perkinsus PCR detection.
PCR testing of Gills
All the positive conventional PCR results were from gill, with the exception of animal 6 where gill, digestive gland and muscle were all positive by conventional PCR. The results of cPCR testing and qPCR from gill were well-correlated. In every case where the gill sample was cPCR positive the AFDL Pols qPCR result was also positive (Table 11). This was true of both animals with and without gross lesions in the muscle. Of the 63 gill samples from animals without gross lesions 5 samples (7.8%) were cPCR-positive and 12 samples (19.1%) were positive by qPCR. Of the 24 gill samples from animals with gross lesions 3 samples (12.5%) were positive by cPCR and 7 samples (29.2%) were positive by qPCR.
PCR testing of Muscle
Of the 66 muscle samples from 22 animals without gross lesions, only 1 sample (1.5%) was positive by cPCR and 9 samples (13.6%) were positive by qPCR (Table 3, light shading). Of the 24 muscle samples (normal muscle) from animals with gross lesions 7 samples (29.2%) were positive by cPCR, with an equal number of 7 samples (29.2%) also positive by qPCR.
PCR Sampling and Test Summary
As a general observation, based on the testing of multiple samples of each tissue type, including digestive gland, gill and muscle from all the animals, more positive samples could be detected with the AFDL Pols qPCR system than with the existing OIE species-specific cPCR. With a few minor exceptions the results from the OIE recommended assays were in agreement with the qPCR. We attributed any minor differences to the low copy number of Perkinsus target DNA in the samples. In sub-clinically infected abalone, the real-time assay provided a more sensitive method for Perkinsus detection over culture in ARFTM or the existing conventional PCRs.
The qPCR provides a consistently positive result when the edge of the lesion is included in the DNA extraction. Where animals have gross lesions these should be targeted and tested directly. In the case of this sampling at Thistle Island (14:0233), the low levels of parasite meant that both Ray's Test and conventional PCR did not prove reliable, even when affected tissues were included in culture. The normal muscle surrounding lesions is not necessarily a reliable sample for PCR, even with advanced lesions, where parasites might be expected in the surrounding tissue. In this case, multiple samples surrounding lesions were qPCR-negative in 5 of the 8 animals investigated.
PCR of Sub-Clinically Infected Animals
One aim of this collection was to use naturally infected animals with a range of severity of infection to optimise PCR sampling from abalone. The sampling of infected animals with obvious lesions in muscle is straightforward, however large sub-clinically infected animals without lesions are challenging.
Our work suggests that DNA samples from the digestive gland of abalone are inhibitory and not recommended for PCR. Of the gill samples from animals without gross lesions, 7.8% were positive by cPCR and 11.1% were positive by qPCR. With muscle samples from the same animals, 1.5% were positive by cPCR and 13.6% were positive by qPCR. Although no gross lesions have been observed in the gills of abalone, the gills proved to be a useful sample for detection of P. olseni in sub-clinically infected animals. Based on this testing, where no lesions are apparent, multiple samples from different sites including both gills and muscle are recommended to increase the rate of detection.
High CT values
In the course of testing field samples from known infected populations, we found CT values between 40 and 45 in the AFDL Pols qPCR were not uncommon. Typically 1 or 2 replicates gave a high CT value with a limited
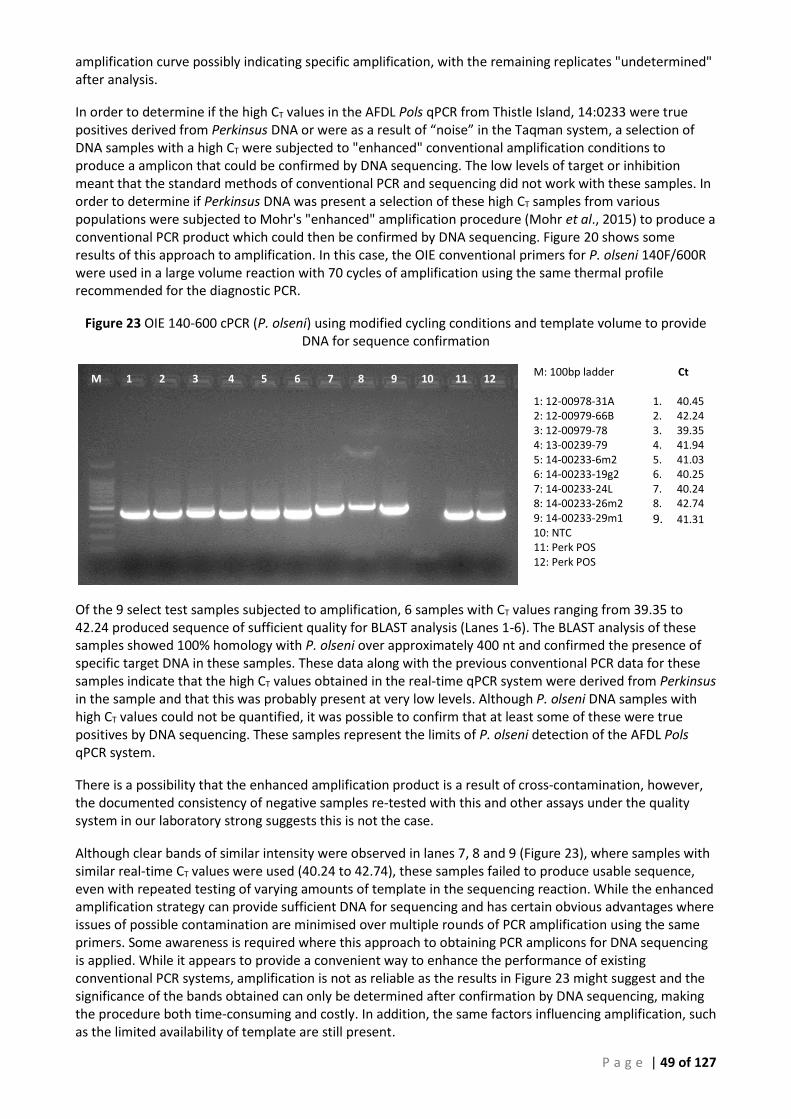
P a g e | 49 of 127
amplification curve possibly indicating specific amplification, with the remaining replicates "undetermined" after analysis.
In order to determine if the high CT values in the AFDL Pols qPCR from Thistle Island, 14:0233 were true positives derived from Perkinsus DNA or were as a result of “noise” in the Taqman system, a selection of DNA samples with a high CT were subjected to "enhanced" conventional amplification conditions to produce a amplicon that could be confirmed by DNA sequencing. The low levels of target or inhibition meant that the standard methods of conventional PCR and sequencing did not work with these samples. In order to determine if Perkinsus DNA was present a selection of these high CT samples from various populations were subjected to Mohr's "enhanced" amplification procedure (Mohr et al., 2015) to produce a conventional PCR product which could then be confirmed by DNA sequencing. Figure 20 shows some results of this approach to amplification. In this case, the OIE conventional primers for P. olseni 140F/600R were used in a large volume reaction with 70 cycles of amplification using the same thermal profile recommended for the diagnostic PCR.
Figure 23 OIE 140-600 cPCR (P. olseni) using modified cycling conditions and template volume to provide DNA for sequence confirmation
M: 100bp ladder 1: 12-00978-31A 2: 12-00979-66B 3: 12-00979-78 4: 13-00239-79 5: 14-00233-6m2 6: 14-00233-19g2 7: 14-00233-24L 8: 14-00233-26m2 9: 14-00233-29m1 10: NTC 11: Perk POS 12: Perk POS
Ct
1. 40.45 2. 42.24 3. 39.35 4. 41.94 5. 41.03 6. 40.25 7. 40.24 8. 42.74
9. 41.31
Of the 9 select test samples subjected to amplification, 6 samples with CT values ranging from 39.35 to 42.24 produced sequence of sufficient quality for BLAST analysis (Lanes 1-6). The BLAST analysis of these samples showed 100% homology with P. olseni over approximately 400 nt and confirmed the presence of specific target DNA in these samples. These data along with the previous conventional PCR data for these samples indicate that the high CT values obtained in the real-time qPCR system were derived from Perkinsus in the sample and that this was probably present at very low levels. Although P. olseni DNA samples with high CT values could not be quantified, it was possible to confirm that at least some of these were true positives by DNA sequencing. These samples represent the limits of P. olseni detection of the AFDL Pols qPCR system.
There is a possibility that the enhanced amplification product is a result of cross-contamination, however, the documented consistency of negative samples re-tested with this and other assays under the quality system in our laboratory strong suggests this is not the case.
Although clear bands of similar intensity were observed in lanes 7, 8 and 9 (Figure 23), where samples with similar real-time CT values were used (40.24 to 42.74), these samples failed to produce usable sequence, even with repeated testing of varying amounts of template in the sequencing reaction. While the enhanced amplification strategy can provide sufficient DNA for sequencing and has certain obvious advantages where issues of possible contamination are minimised over multiple rounds of PCR amplification using the same primers. Some awareness is required where this approach to obtaining PCR amplicons for DNA sequencing is applied. While it appears to provide a convenient way to enhance the performance of existing conventional PCR systems, amplification is not as reliable as the results in Figure 23 might suggest and the significance of the bands obtained can only be determined after confirmation by DNA sequencing, making the procedure both time-consuming and costly. In addition, the same factors influencing amplification, such as the limited availability of template are still present.
M 1 2 3 4 5 6 7 8 9 10 11 12

P a g e | 50 of 127
Comparison of Tests
Methods of Perkinsus diagnosis include Ray’s thioglycollate culture, histology, PCR and DNA sequence analysis. While RFTC and histology are widely used, it is likely that with appropriate validation PCR will take over as the method of choice for rapid detection and the identification of species (Villalba et al., 2004).
In this study of Perkinsus in abalone, individual test results of RFTC, histology and PCR were very difficult to correlate. This is in part due to focal nature of Perkinsus infection in abalone and the distribution of the parasite within the host. Histological lesions were often evident, with no visible parasites. Similarly PCR testing from sequential samples of muscle immediately adjacent to advanced lesions, had variable results. Given that different tissues and different amounts of tissue are used for each test meaningful comparison of individual test results is problematic.
Looking at the summary of total test results from corresponding individuals within infected populations (Table 13) we found that a similar number of infections were found by RFTC (27%, n = 43) and histology (28%, n = 44). The OIE species-specific conventional PCR found 33% were PCR positive and the AFDL Pols qPCR found 50% of the animals tested were PCR positive.
A summary of test results from Perkinsus infected population is given in table 13. Data from these populations and a small number of diagnostic submissions (data not shown) formed the basis of the ROC and Bayesian analysis for diagnostic test validation.
Table 13 Summary of corresponding test results for Perkinsus infected abalone populations.
Lesions RFTC Histology
85/750 cPCR
140/600 cPCR
AFDL qPCR
Total Animals
Taylor Island 12-978 20 16 12 17 18 29 50
Memory Cove 12-979-1 0 0 1 0 0 1 10
Thistle Island 12-979-11 11 11 10 10 15 16 22
Baird Bay 13-1031 12 12 11 11 10 14 17
Sussex Inlet 13-1571 0 0 0 0 0 1 30
Thistle Island 14-233 8 4 10 nr 10 19 30
51 43 44 38 53 80 159
Diagnostic Test Validation and Real-time (qPCR) Test Performance
Background The OIE 140/600 conventional PCR (OIE test) was used as the reference test for the AFDL Pols qPCR (candidate test). Both tests are species-specific for P. olseni and had an adequate number of samples tested to compare results from different populations. In this case, the results from 3 populations with different prevalences of infection were used for ROC analysis using MedCalc (https://www.medcalc.org/) and Bayesian analysis. The assumption that both tests were conditionally independent was substantiated by the fact that reverse primers of the AFDL Pols qPCR were outside the region of the Perkinsus genome covered by the 140/600 cPCR. ROC analysis was performed on a total of 377 samples (56 positive and 321 negative samples by the OIE 140/600 cPCR. Bayesian analysis was performed using the cut-off generated through the ROC analysis (CT 41.29) and an arbitrary lower cut-off (CT 39) was also used to allow analysis for those who cannot accept the validity of high CT values ≥ 40.
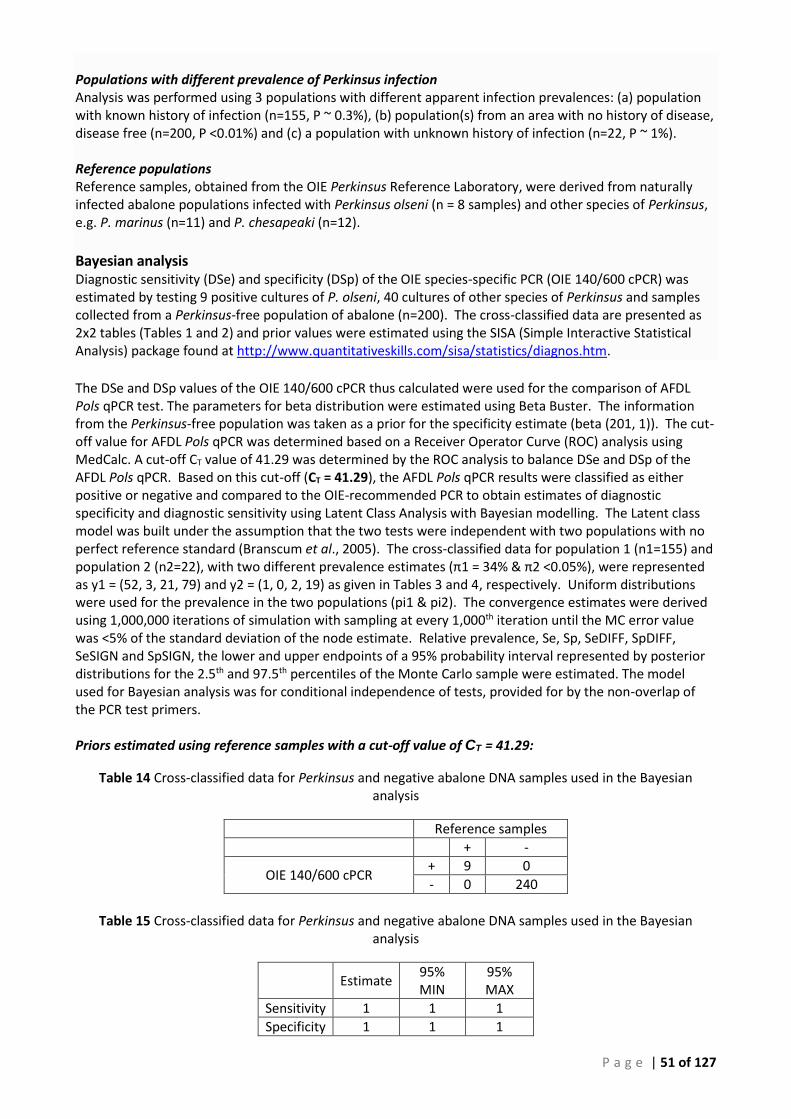
P a g e | 51 of 127
Populations with different prevalence of Perkinsus infection Analysis was performed using 3 populations with different apparent infection prevalences: (a) population with known history of infection (n=155, P ~ 0.3%), (b) population(s) from an area with no history of disease, disease free (n=200, P <0.01%) and (c) a population with unknown history of infection (n=22, P ~ 1%). Reference populations Reference samples, obtained from the OIE Perkinsus Reference Laboratory, were derived from naturally infected abalone populations infected with Perkinsus olseni (n = 8 samples) and other species of Perkinsus, e.g. P. marinus (n=11) and P. chesapeaki (n=12).
Bayesian analysis Diagnostic sensitivity (DSe) and specificity (DSp) of the OIE species-specific PCR (OIE 140/600 cPCR) was estimated by testing 9 positive cultures of P. olseni, 40 cultures of other species of Perkinsus and samples collected from a Perkinsus-free population of abalone (n=200). The cross-classified data are presented as 2x2 tables (Tables 1 and 2) and prior values were estimated using the SISA (Simple Interactive Statistical Analysis) package found at http://www.quantitativeskills.com/sisa/statistics/diagnos.htm. The DSe and DSp values of the OIE 140/600 cPCR thus calculated were used for the comparison of AFDL Pols qPCR test. The parameters for beta distribution were estimated using Beta Buster. The information from the Perkinsus-free population was taken as a prior for the specificity estimate (beta (201, 1)). The cut-off value for AFDL Pols qPCR was determined based on a Receiver Operator Curve (ROC) analysis using MedCalc. A cut-off CT value of 41.29 was determined by the ROC analysis to balance DSe and DSp of the AFDL Pols qPCR. Based on this cut-off (CT = 41.29), the AFDL Pols qPCR results were classified as either positive or negative and compared to the OIE-recommended PCR to obtain estimates of diagnostic specificity and diagnostic sensitivity using Latent Class Analysis with Bayesian modelling. The Latent class model was built under the assumption that the two tests were independent with two populations with no perfect reference standard (Branscum et al., 2005). The cross-classified data for population 1 (n1=155) and population 2 (n2=22), with two different prevalence estimates (π1 = 34% & π2 <0.05%), were represented as y1 = (52, 3, 21, 79) and y2 = (1, 0, 2, 19) as given in Tables 3 and 4, respectively. Uniform distributions were used for the prevalence in the two populations (pi1 & pi2). The convergence estimates were derived using 1,000,000 iterations of simulation with sampling at every 1,000th iteration until the MC error value was <5% of the standard deviation of the node estimate. Relative prevalence, Se, Sp, SeDIFF, SpDIFF, SeSIGN and SpSIGN, the lower and upper endpoints of a 95% probability interval represented by posterior distributions for the 2.5th and 97.5th percentiles of the Monte Carlo sample were estimated. The model used for Bayesian analysis was for conditional independence of tests, provided for by the non-overlap of the PCR test primers. Priors estimated using reference samples with a cut-off value of CT = 41.29:
Table 14 Cross-classified data for Perkinsus and negative abalone DNA samples used in the Bayesian analysis
Reference samples
+ -
OIE 140/600 cPCR + 9 0
- 0 240
Table 15 Cross-classified data for Perkinsus and negative abalone DNA samples used in the Bayesian
analysis
Estimate 95% MIN
95% MAX
Sensitivity 1 1 1
Specificity 1 1 1
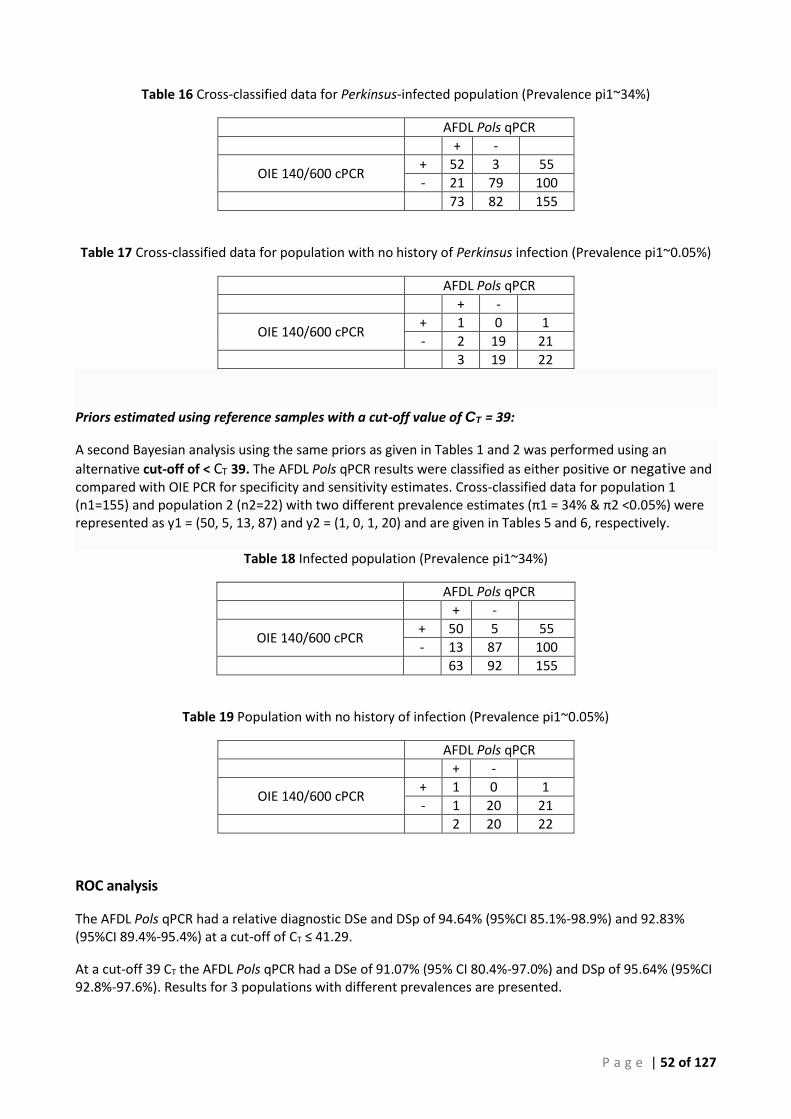
P a g e | 52 of 127
Table 16 Cross-classified data for Perkinsus-infected population (Prevalence pi1~34%)
AFDL Pols qPCR
+ -
OIE 140/600 cPCR + 52 3 55
- 21 79 100
73 82 155
Table 17 Cross-classified data for population with no history of Perkinsus infection (Prevalence pi1~0.05%)
AFDL Pols qPCR
+ -
OIE 140/600 cPCR + 1 0 1
- 2 19 21
3 19 22
Priors estimated using reference samples with a cut-off value of CT = 39:
A second Bayesian analysis using the same priors as given in Tables 1 and 2 was performed using an
alternative cut-off of < CT 39. The AFDL Pols qPCR results were classified as either positive or negative and compared with OIE PCR for specificity and sensitivity estimates. Cross-classified data for population 1 (n1=155) and population 2 (n2=22) with two different prevalence estimates (π1 = 34% & π2 <0.05%) were represented as y1 = (50, 5, 13, 87) and y2 = (1, 0, 1, 20) and are given in Tables 5 and 6, respectively.
Table 18 Infected population (Prevalence pi1~34%)
AFDL Pols qPCR
+ -
OIE 140/600 cPCR + 50 5 55
- 13 87 100
63 92 155
Table 19 Population with no history of infection (Prevalence pi1~0.05%)
AFDL Pols qPCR
+ -
OIE 140/600 cPCR + 1 0 1
- 1 20 21
2 20 22
ROC analysis
The AFDL Pols qPCR had a relative diagnostic DSe and DSp of 94.64% (95%CI 85.1%-98.9%) and 92.83% (95%CI 89.4%-95.4%) at a cut-off of CT ≤ 41.29.
At a cut-off 39 CT the AFDL Pols qPCR had a DSe of 91.07% (95% CI 80.4%-97.0%) and DSp of 95.64% (95%CI 92.8%-97.6%). Results for 3 populations with different prevalences are presented.
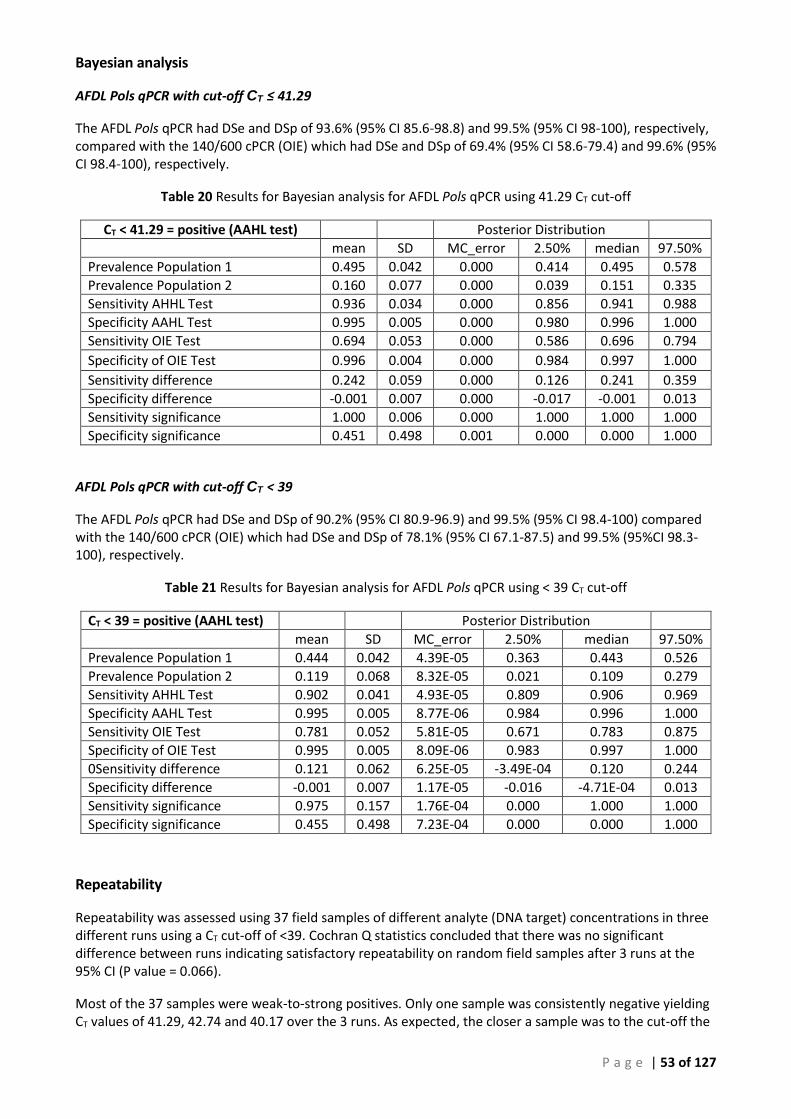
P a g e | 53 of 127
Bayesian analysis
AFDL Pols qPCR with cut-off CT ≤ 41.29
The AFDL Pols qPCR had DSe and DSp of 93.6% (95% CI 85.6-98.8) and 99.5% (95% CI 98-100), respectively, compared with the 140/600 cPCR (OIE) which had DSe and DSp of 69.4% (95% CI 58.6-79.4) and 99.6% (95% CI 98.4-100), respectively.
Table 20 Results for Bayesian analysis for AFDL Pols qPCR using 41.29 CT cut-off
CT < 41.29 = positive (AAHL test) Posterior Distribution
mean SD MC_error 2.50% median 97.50%
Prevalence Population 1 0.495 0.042 0.000 0.414 0.495 0.578
Prevalence Population 2 0.160 0.077 0.000 0.039 0.151 0.335
Sensitivity AHHL Test 0.936 0.034 0.000 0.856 0.941 0.988
Specificity AAHL Test 0.995 0.005 0.000 0.980 0.996 1.000
Sensitivity OIE Test 0.694 0.053 0.000 0.586 0.696 0.794
Specificity of OIE Test 0.996 0.004 0.000 0.984 0.997 1.000
Sensitivity difference 0.242 0.059 0.000 0.126 0.241 0.359
Specificity difference -0.001 0.007 0.000 -0.017 -0.001 0.013
Sensitivity significance 1.000 0.006 0.000 1.000 1.000 1.000
Specificity significance 0.451 0.498 0.001 0.000 0.000 1.000
AFDL Pols qPCR with cut-off CT < 39
The AFDL Pols qPCR had DSe and DSp of 90.2% (95% CI 80.9-96.9) and 99.5% (95% CI 98.4-100) compared with the 140/600 cPCR (OIE) which had DSe and DSp of 78.1% (95% CI 67.1-87.5) and 99.5% (95%CI 98.3-100), respectively.
Table 21 Results for Bayesian analysis for AFDL Pols qPCR using < 39 CT cut-off
CT < 39 = positive (AAHL test) Posterior Distribution
mean SD MC_error 2.50% median 97.50%
Prevalence Population 1 0.444 0.042 4.39E-05 0.363 0.443 0.526
Prevalence Population 2 0.119 0.068 8.32E-05 0.021 0.109 0.279
Sensitivity AHHL Test 0.902 0.041 4.93E-05 0.809 0.906 0.969
Specificity AAHL Test 0.995 0.005 8.77E-06 0.984 0.996 1.000
Sensitivity OIE Test 0.781 0.052 5.81E-05 0.671 0.783 0.875
Specificity of OIE Test 0.995 0.005 8.09E-06 0.983 0.997 1.000
0Sensitivity difference 0.121 0.062 6.25E-05 -3.49E-04 0.120 0.244
Specificity difference -0.001 0.007 1.17E-05 -0.016 -4.71E-04 0.013
Sensitivity significance 0.975 0.157 1.76E-04 0.000 1.000 1.000
Specificity significance 0.455 0.498 7.23E-04 0.000 0.000 1.000
Repeatability
Repeatability was assessed using 37 field samples of different analyte (DNA target) concentrations in three different runs using a CT cut-off of <39. Cochran Q statistics concluded that there was no significant difference between runs indicating satisfactory repeatability on random field samples after 3 runs at the 95% CI (P value = 0.066).
Most of the 37 samples were weak-to-strong positives. Only one sample was consistently negative yielding CT values of 41.29, 42.74 and 40.17 over the 3 runs. As expected, the closer a sample was to the cut-off the
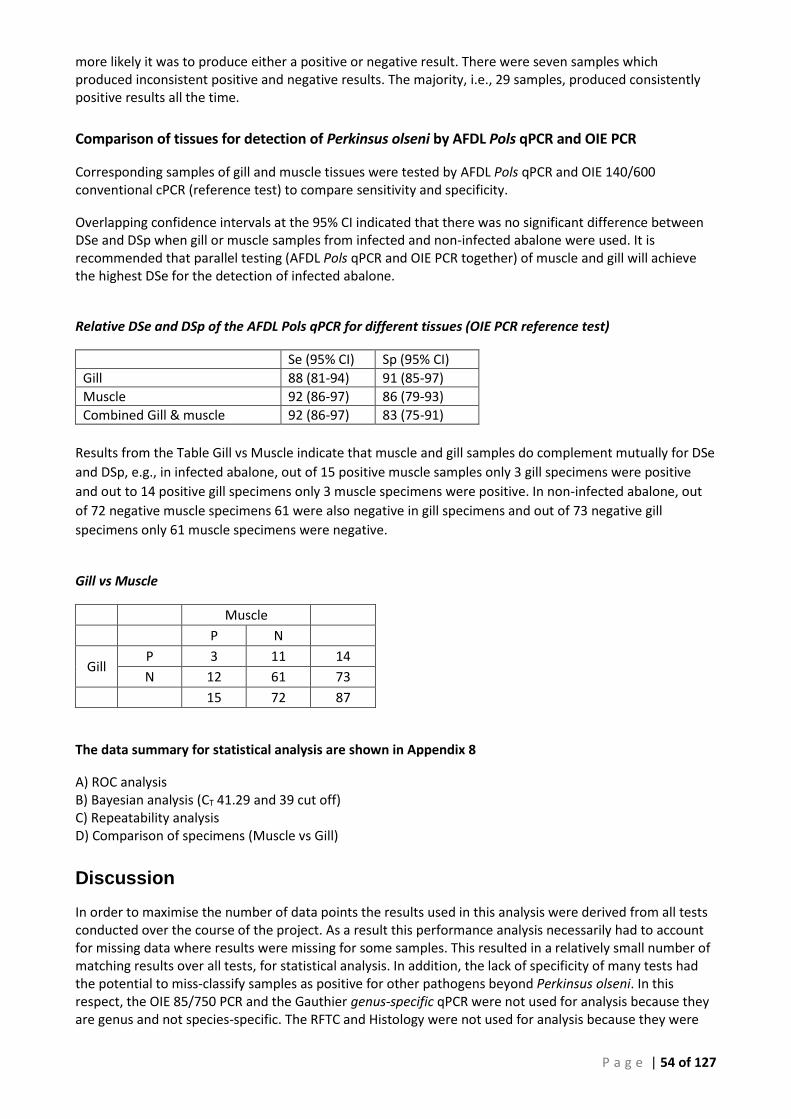
P a g e | 54 of 127
more likely it was to produce either a positive or negative result. There were seven samples which produced inconsistent positive and negative results. The majority, i.e., 29 samples, produced consistently positive results all the time.
Comparison of tissues for detection of Perkinsus olseni by AFDL Pols qPCR and OIE PCR
Corresponding samples of gill and muscle tissues were tested by AFDL Pols qPCR and OIE 140/600 conventional cPCR (reference test) to compare sensitivity and specificity.
Overlapping confidence intervals at the 95% CI indicated that there was no significant difference between DSe and DSp when gill or muscle samples from infected and non-infected abalone were used. It is recommended that parallel testing (AFDL Pols qPCR and OIE PCR together) of muscle and gill will achieve the highest DSe for the detection of infected abalone.
Relative DSe and DSp of the AFDL Pols qPCR for different tissues (OIE PCR reference test)
Se (95% CI) Sp (95% CI)
Gill 88 (81-94) 91 (85-97)
Muscle 92 (86-97) 86 (79-93)
Combined Gill & muscle 92 (86-97) 83 (75-91)
Results from the Table Gill vs Muscle indicate that muscle and gill samples do complement mutually for DSe
and DSp, e.g., in infected abalone, out of 15 positive muscle samples only 3 gill specimens were positive
and out to 14 positive gill specimens only 3 muscle specimens were positive. In non-infected abalone, out
of 72 negative muscle specimens 61 were also negative in gill specimens and out of 73 negative gill
specimens only 61 muscle specimens were negative.
Gill vs Muscle
Muscle
P N
Gill P 3 11 14
N 12 61 73
15 72 87
The data summary for statistical analysis are shown in Appendix 8
A) ROC analysis B) Bayesian analysis (CT 41.29 and 39 cut off) C) Repeatability analysis D) Comparison of specimens (Muscle vs Gill)
Discussion
In order to maximise the number of data points the results used in this analysis were derived from all tests conducted over the course of the project. As a result this performance analysis necessarily had to account for missing data where results were missing for some samples. This resulted in a relatively small number of matching results over all tests, for statistical analysis. In addition, the lack of specificity of many tests had the potential to miss-classify samples as positive for other pathogens beyond Perkinsus olseni. In this respect, the OIE 85/750 PCR and the Gauthier genus-specific qPCR were not used for analysis because they are genus and not species-specific. The RFTC and Histology were not used for analysis because they were
P a g e | 55 of 127
regarded as too non-specific. Sequencing was used for test confirmation but the number of results was limited in terms of the statistical analysis of the PCR assays. Consequently, a sub-set of data consisting of the OIE PCR (reference test) and the AFDL Pols qPCR was the primary source of data for establishing the performance characteristics of the candidate AFDL Pols qPCR test.
ROC analysis
ROC analysis was performed using 56 positive and 321 negative samples for P. olseni as determined by the OIE cPCR reference test. The Area under the Curve was 0.957. A significance level of <0.0001 indicates that the AFDL Pols qPCR is able to distinguish between the infected and non-infected group. ROC analysis was used to estimate the relative DSe (94.6) and DSp (92.8) at a preliminary cut-off of ≤ CT 41.29 for the AFDL Pols qPCR.
Bayesian analysis
Bayesian analysis revealed the OIE cPCR reference test had lower DSe (78.1%) than the candidate test AFDL Pols qPCR (90.2%) with the abalone samples tested in our system. (Table 8, cut-off CT of 39). Under these circumstances ROC analysis may be misleading because the reference test is likely to have missed infected abalone and produced negative results for samples which in reality were true-positive, in that the AFDL Pols qPCR indicated 21 false positive results in Table 3. This in turn had the effect of depressing the DSp of the candidate test. Nevertheless, the AFDL Pols qPCR and OIE cPCR reference tests had 100% agreement of test results in the population of 200 individuals with no history of Perkinsus infection or historic freedom (Table A3). These results substantiate the high DSp estimates close to 100% for both tests as confirmed in the Bayesian analysis. This Bayesian analysis was performed using a fixed threshold of 0.1 and 2 different CT cut-off values. A CT cut-off of ≤41.29 for positive samples was obtained from the ROC analysis of our data. A lower CT cut-off ≤ 39 was arbitrarily chosen to provide estimates of DSe and DSp for those laboratories that consider cut-offs beyond a CT of 40 as unreliable for qPCR. In this case, lowering the cut-off causes a slight drop in DSe and an increased DSp due to the reaction dynamics of real-time PCR. These data clearly show that CT values ≤41.29 in the AFDL Pols qPCR system are positive. CT values ≤39 are unambiguously positive if a CT of >40 is not accepted. In which case the range of >39-42 might be considered inconclusive and samples with a CT > 42-45 are negative. Our experience has been that abalone DNA samples from uninfected populations produce little if any background in the AFDL Pols qPCR system and that CT values between 40 and 45 are often observed in testing infected populations. Depending on the purpose of testing, inconclusive results may require re-test and/or resampling to reliably establish the infection status of a population.
Repeatability
Cochran Q statistics indicated satisfactory repeatability between runs using random samples.
Sample selection in abalone (muscle vs gills)
Disease prevalence, required probability of detection and test sensitivity are the key factors for a sampling frame and the moderate DSe of the AFDL Pols qPCR must be taken into consideration. Parallel testing (OIE PCR and AFDL Pols qPCR together) of muscle and gill specimens is likely to increase DSe of detecting Perkinsus olseni-infected abalone. Using the AFDL Pols qPCR as a screening “population test”, e.g. on 10-15 abalone, at the same time would help to minimize false-negative results in low prevalence scenarios and would also be helpful to minimize false-negative results due to localised infections. Our data show that the DSe obtained with the AFDL Pols qPCR with gill and muscle are similar, 0.88 and 0.92, respectively. The slightly higher sensitivity in muscle
P a g e | 56 of 127
may be due in part to the natural bias of the operator towards sampling visible lesions or areas of tissue with abnormal appearance which may be indicative of infection. Should the highest level of DSe be required the parallel testing of both muscle and gill is recommended.
The relevant validation data for ROC analysis, Bayesian analysis (with CT 41.29 and 39 cut-offs), repeatability and comparison of muscle and gill specimens are shown in Appendix 8.
Sequence and Phylogenetic analysis
Only minor variations in DNA sequence were found in alignments of the ITS region (Figures 24, 26, 28, 30 and 32) in the area adjacent the diagnostic probe. These were mostly confined to single nucleotides at specific locations, nt positions 284 and 321 in the alignments of 12-00978, 12-00979 and 13-01031. The only other variations observed were single nucleotide changes from sample 12:00979-25 (Figure 13). This included an ambiguous nucleotide W (A or T) within the area targeted by the probe which could not be differentiated in the chromatogram as the AT peaks were superimposed. As we consistently applied the most conservative interpretation to all DNA sequencing undertaken, the ambiguity was retained and is reported here for the sake of completeness. The possible sequence mismatch in the probe-binding region of 12:00979-25 did not affect detection of this sample in the real-time assay. No other sequence variations were observed in the areas targeted by the primers.
All the P. olseni sequences from Australian field samples collected over 3 years grouped with the other P. olseni sequences from GenBank in the phylogenetic analysis of individual samples (Figures 25, 27, 29, 31 and 32). The topologies of the trees generated were similar in the analyses with P. marinus, P. honshuensis and P. mediterraneus being most closely related to P. olseni in all the phylogenetic trees generated. These DNA sequence alignments and the phylogenetic trees on which they are based provide evidence of the taxonomic affiliation of the individual samples with respect to other Perkinsus species and show there is little variation in the DNA sequence in the region targeted by the real-time assay and further serve to confirm the identity of Perkinsus olseni and the specificity of the AFDL Pols qPCR system.
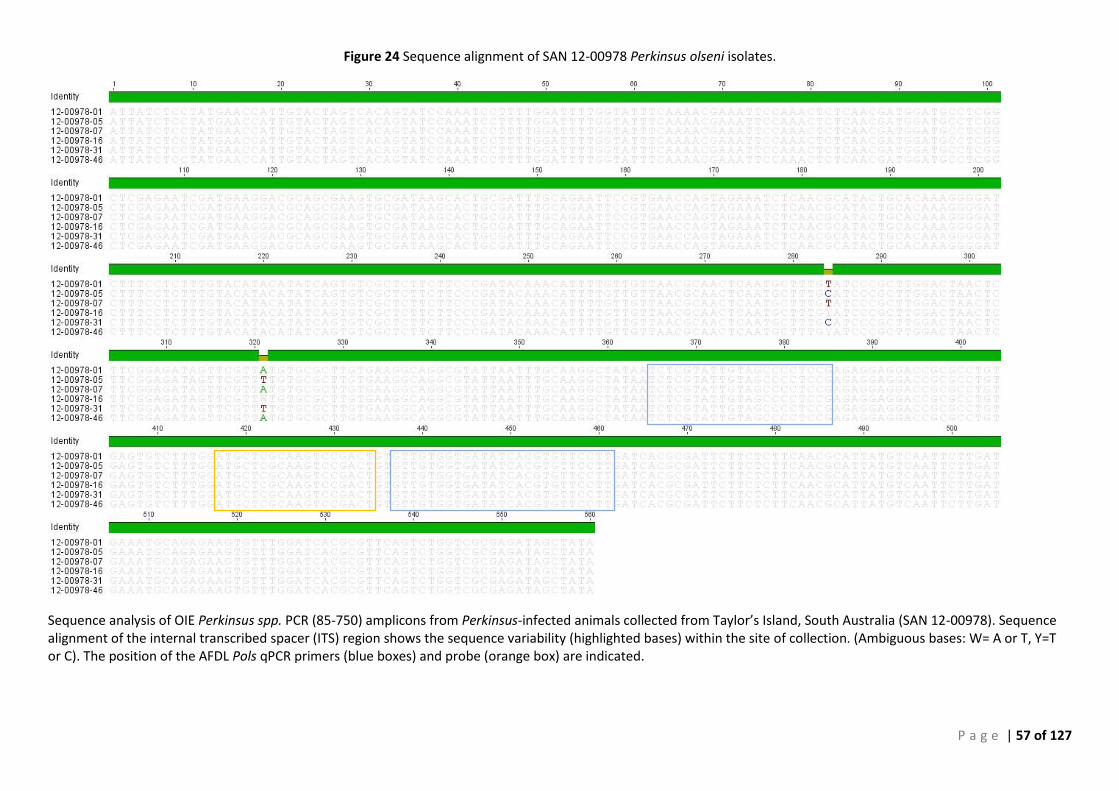
P a g e | 57 of 127
Figure 24 Sequence alignment of SAN 12-00978 Perkinsus olseni isolates.
Sequence analysis of OIE Perkinsus spp. PCR (85-750) amplicons from Perkinsus-infected animals collected from Taylor’s Island, South Australia (SAN 12-00978). Sequence alignment of the internal transcribed spacer (ITS) region shows the sequence variability (highlighted bases) within the site of collection. (Ambiguous bases: W= A or T, Y=T or C). The position of the AFDL Pols qPCR primers (blue boxes) and probe (orange box) are indicated.
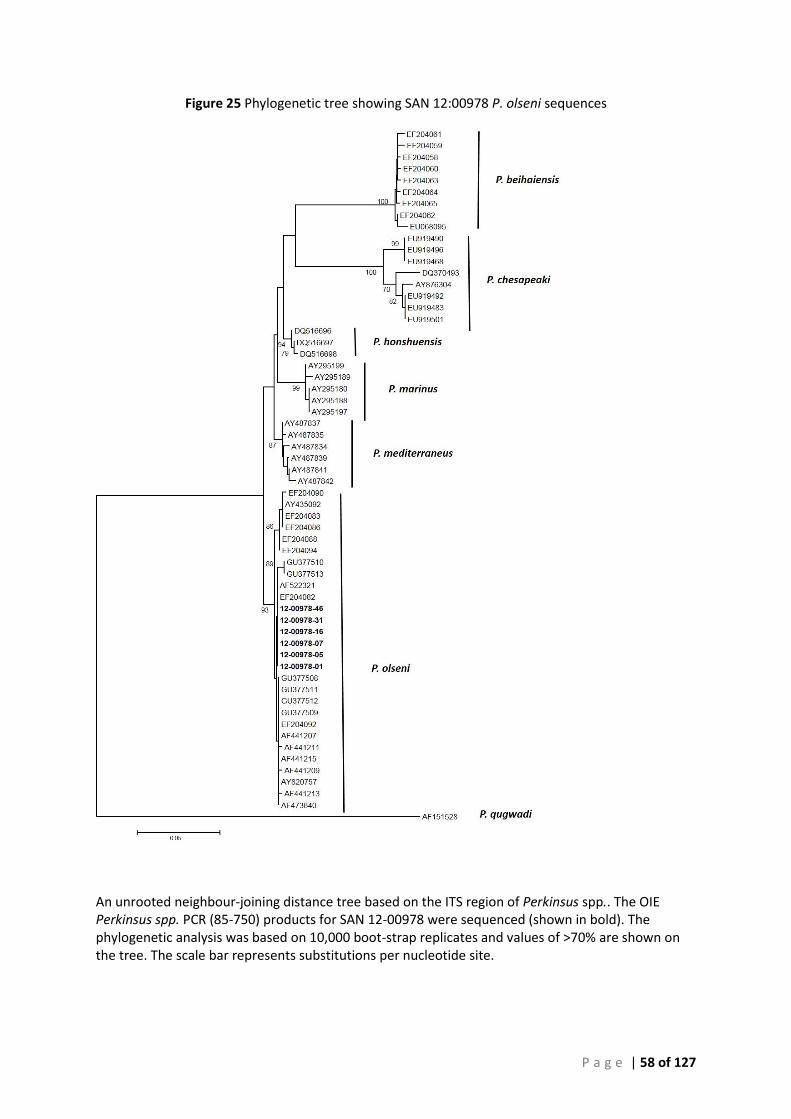
P a g e | 58 of 127
Figure 25 Phylogenetic tree showing SAN 12:00978 P. olseni sequences
An unrooted neighbour-joining distance tree based on the ITS region of Perkinsus spp.. The OIE Perkinsus spp. PCR (85-750) products for SAN 12-00978 were sequenced (shown in bold). The phylogenetic analysis was based on 10,000 boot-strap replicates and values of >70% are shown on the tree. The scale bar represents substitutions per nucleotide site.
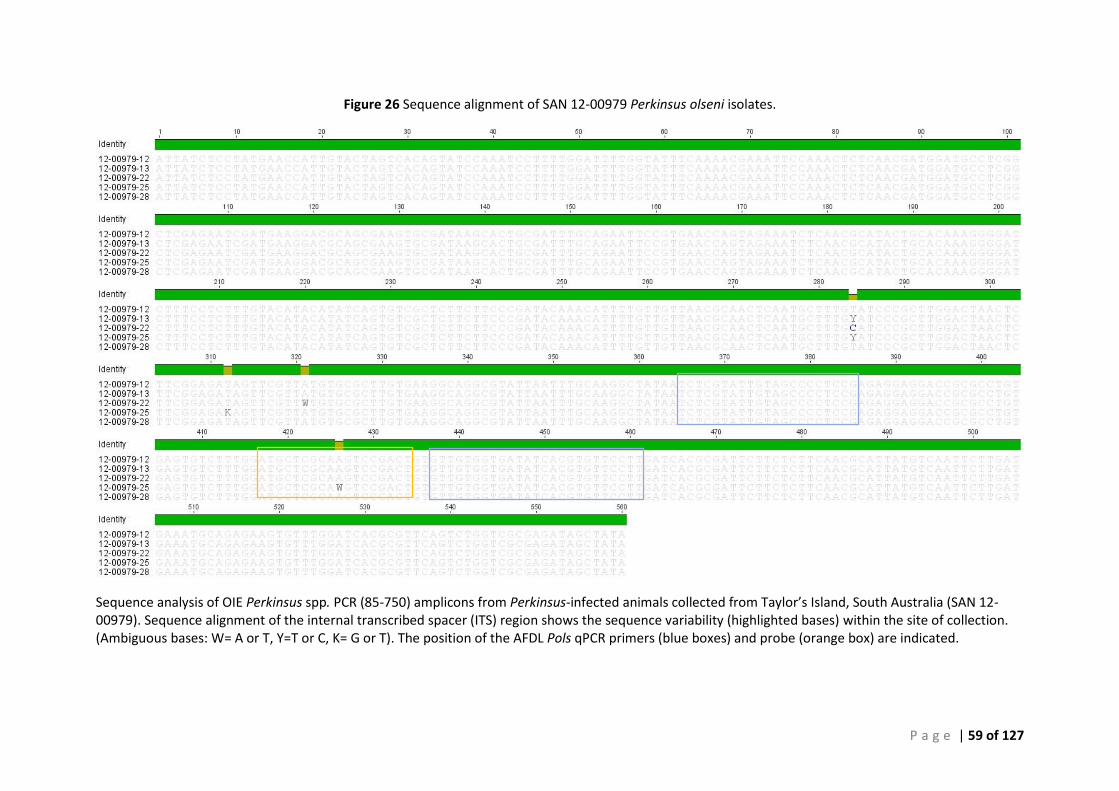
P a g e | 59 of 127
Figure 26 Sequence alignment of SAN 12-00979 Perkinsus olseni isolates.
Sequence analysis of OIE Perkinsus spp. PCR (85-750) amplicons from Perkinsus-infected animals collected from Taylor’s Island, South Australia (SAN 12-00979). Sequence alignment of the internal transcribed spacer (ITS) region shows the sequence variability (highlighted bases) within the site of collection. (Ambiguous bases: W= A or T, Y=T or C, K= G or T). The position of the AFDL Pols qPCR primers (blue boxes) and probe (orange box) are indicated.
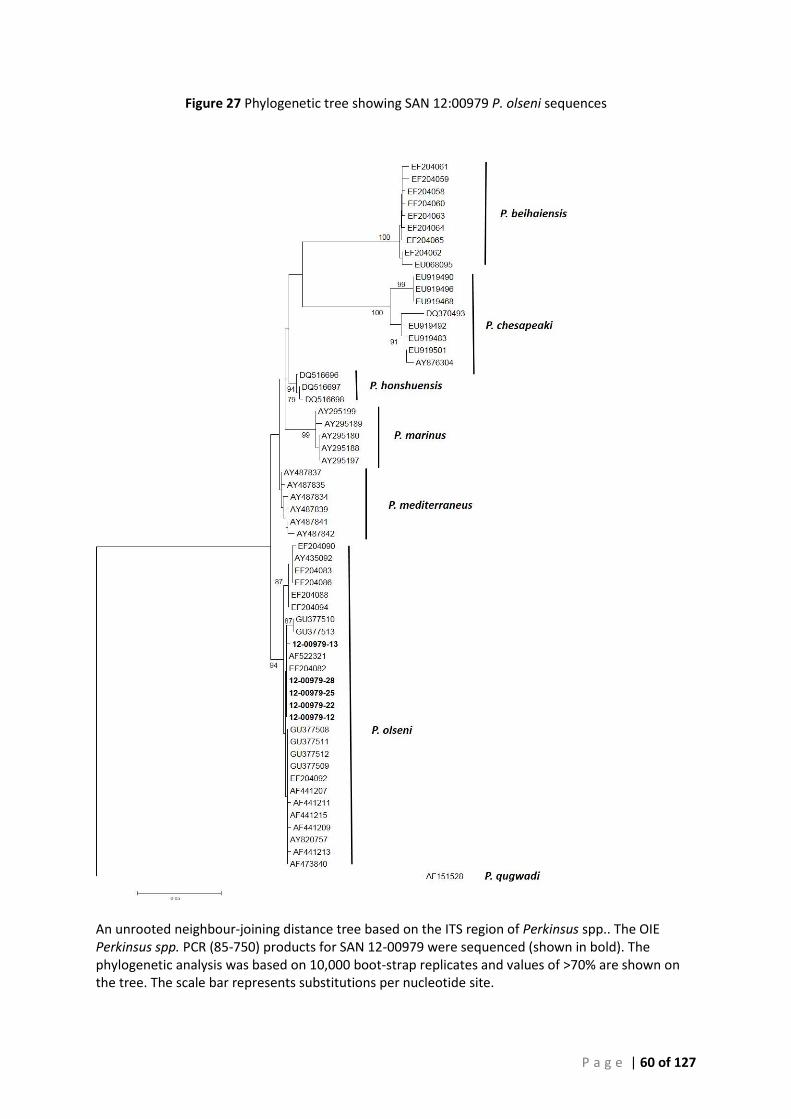
P a g e | 60 of 127
Figure 27 Phylogenetic tree showing SAN 12:00979 P. olseni sequences
An unrooted neighbour-joining distance tree based on the ITS region of Perkinsus spp.. The OIE Perkinsus spp. PCR (85-750) products for SAN 12-00979 were sequenced (shown in bold). The phylogenetic analysis was based on 10,000 boot-strap replicates and values of >70% are shown on the tree. The scale bar represents substitutions per nucleotide site.
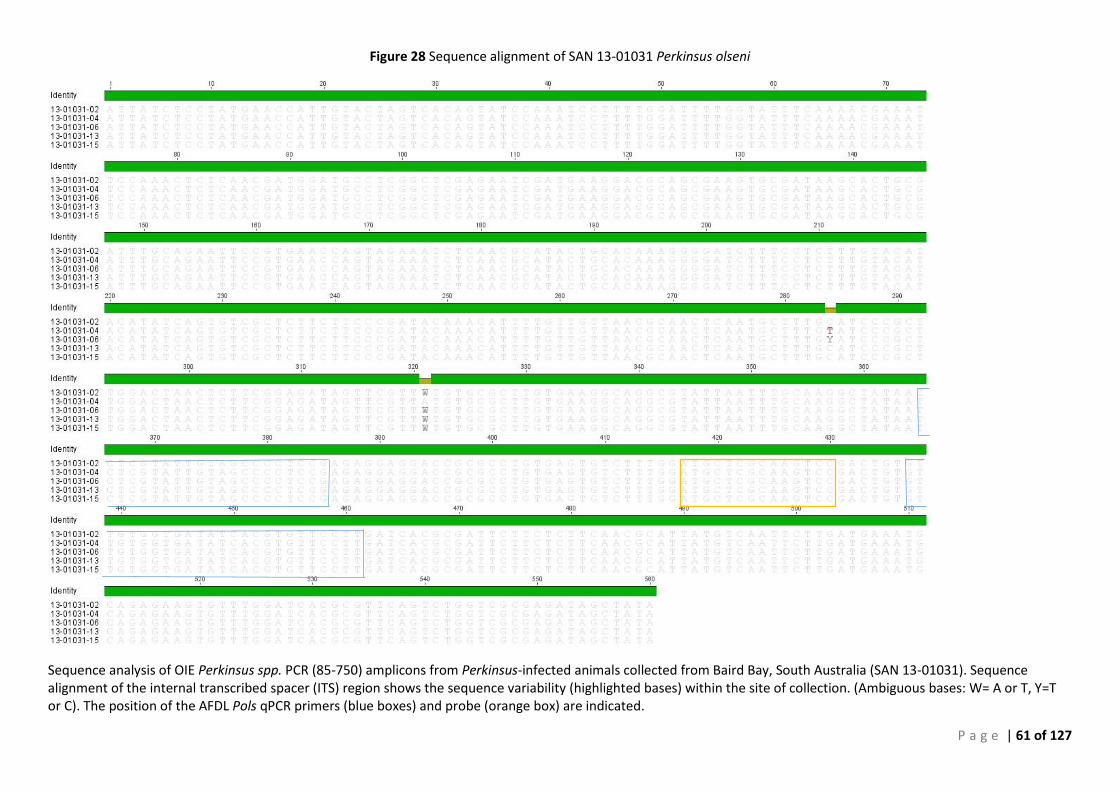
P a g e | 61 of 127
Figure 28 Sequence alignment of SAN 13-01031 Perkinsus olseni
Sequence analysis of OIE Perkinsus spp. PCR (85-750) amplicons from Perkinsus-infected animals collected from Baird Bay, South Australia (SAN 13-01031). Sequence alignment of the internal transcribed spacer (ITS) region shows the sequence variability (highlighted bases) within the site of collection. (Ambiguous bases: W= A or T, Y=T or C). The position of the AFDL Pols qPCR primers (blue boxes) and probe (orange box) are indicated.
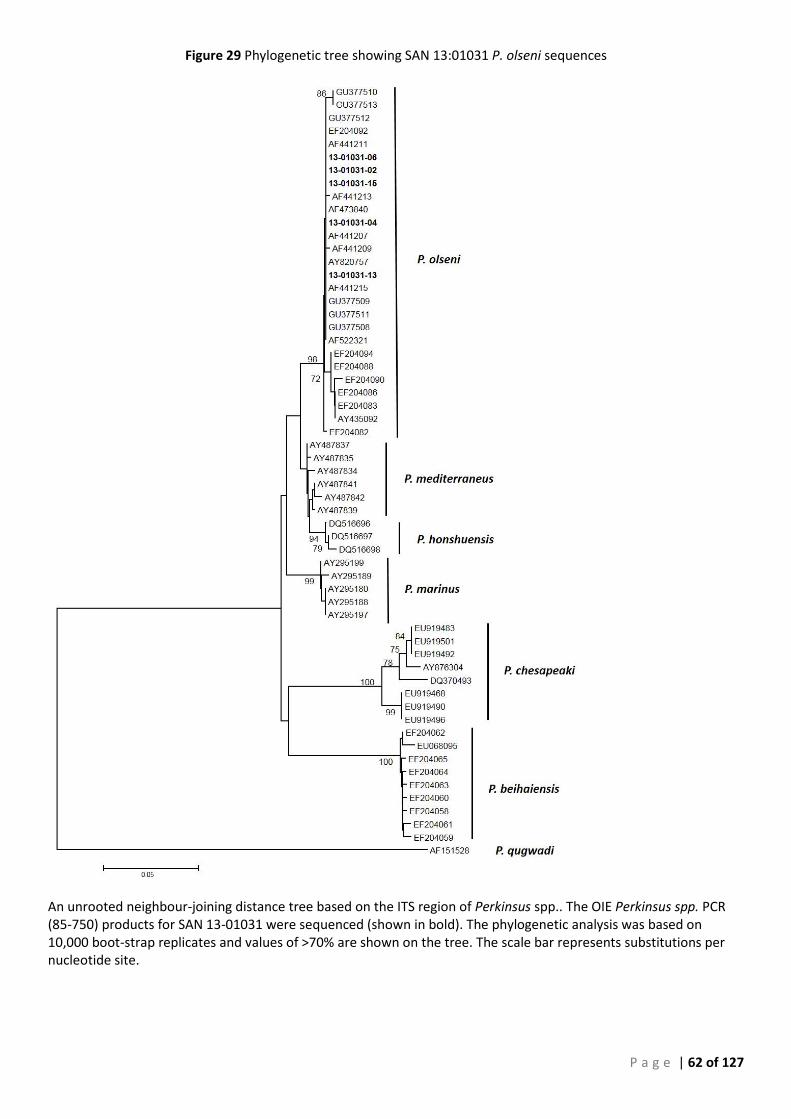
P a g e | 62 of 127
Figure 29 Phylogenetic tree showing SAN 13:01031 P. olseni sequences
An unrooted neighbour-joining distance tree based on the ITS region of Perkinsus spp.. The OIE Perkinsus spp. PCR (85-750) products for SAN 13-01031 were sequenced (shown in bold). The phylogenetic analysis was based on 10,000 boot-strap replicates and values of >70% are shown on the tree. The scale bar represents substitutions per nucleotide site.
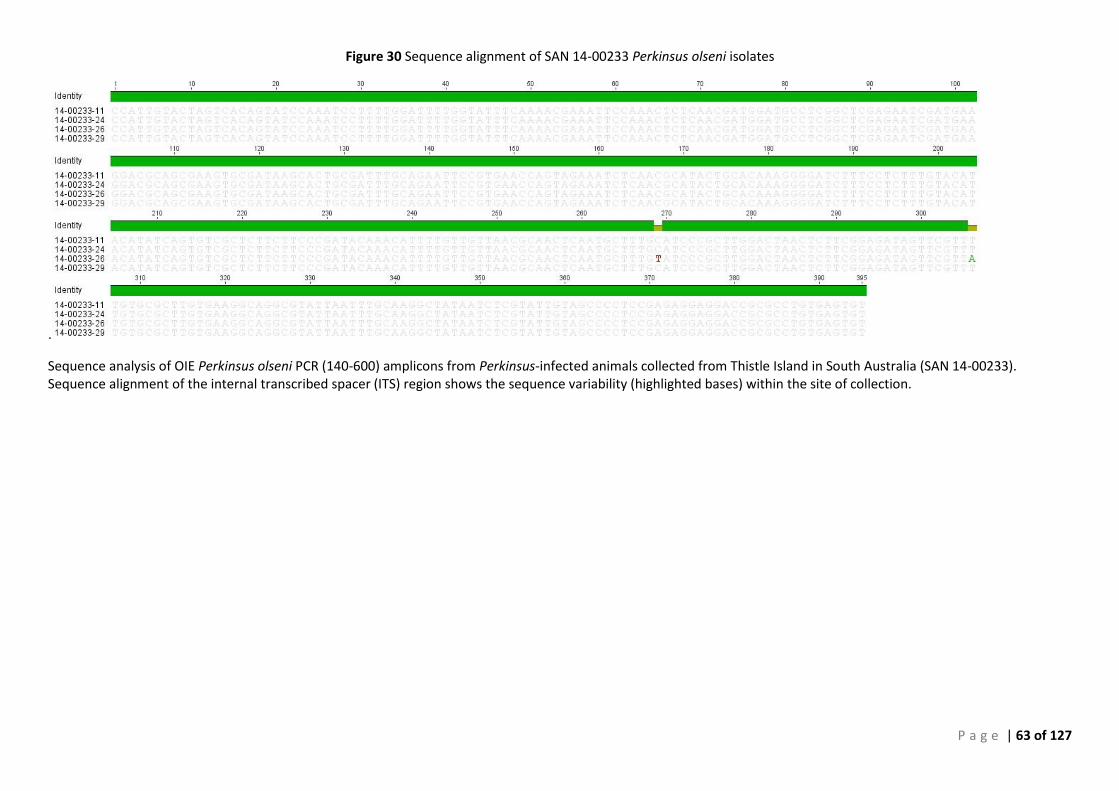
P a g e | 63 of 127
Figure 30 Sequence alignment of SAN 14-00233 Perkinsus olseni isolates
.
Sequence analysis of OIE Perkinsus olseni PCR (140-600) amplicons from Perkinsus-infected animals collected from Thistle Island in South Australia (SAN 14-00233). Sequence alignment of the internal transcribed spacer (ITS) region shows the sequence variability (highlighted bases) within the site of collection.
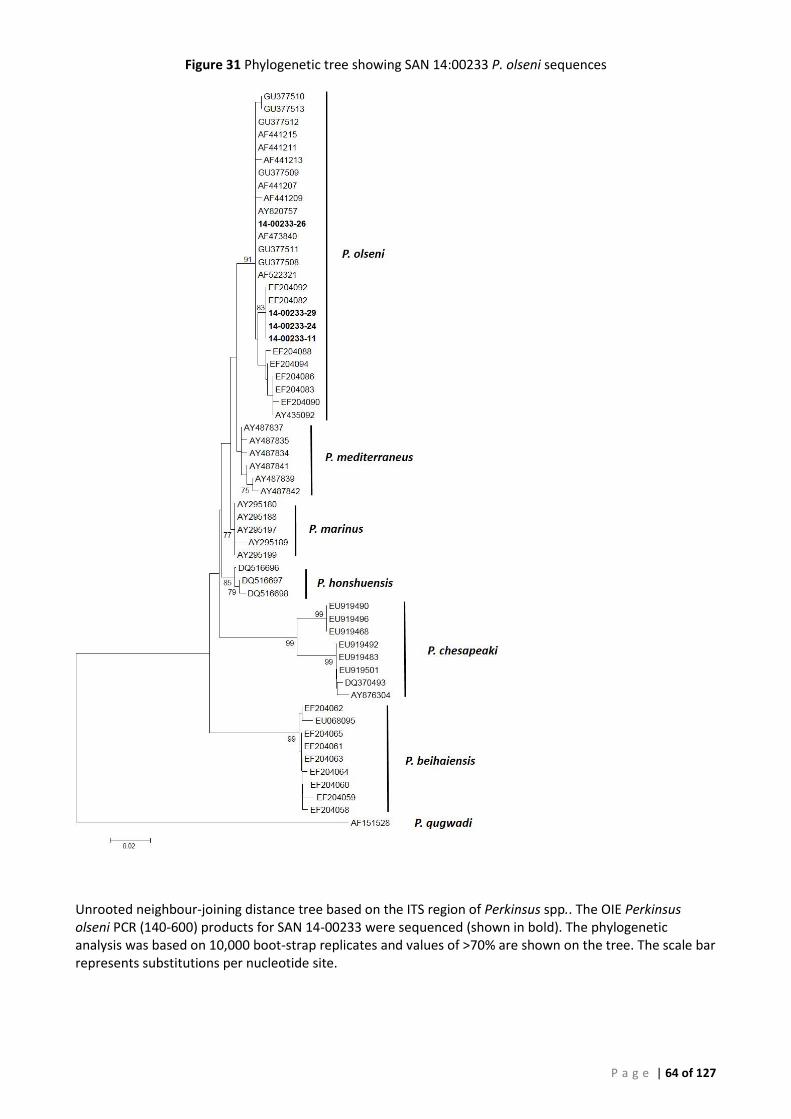
P a g e | 64 of 127
Figure 31 Phylogenetic tree showing SAN 14:00233 P. olseni sequences
Unrooted neighbour-joining distance tree based on the ITS region of Perkinsus spp.. The OIE Perkinsus olseni PCR (140-600) products for SAN 14-00233 were sequenced (shown in bold). The phylogenetic analysis was based on 10,000 boot-strap replicates and values of >70% are shown on the tree. The scale bar represents substitutions per nucleotide site.
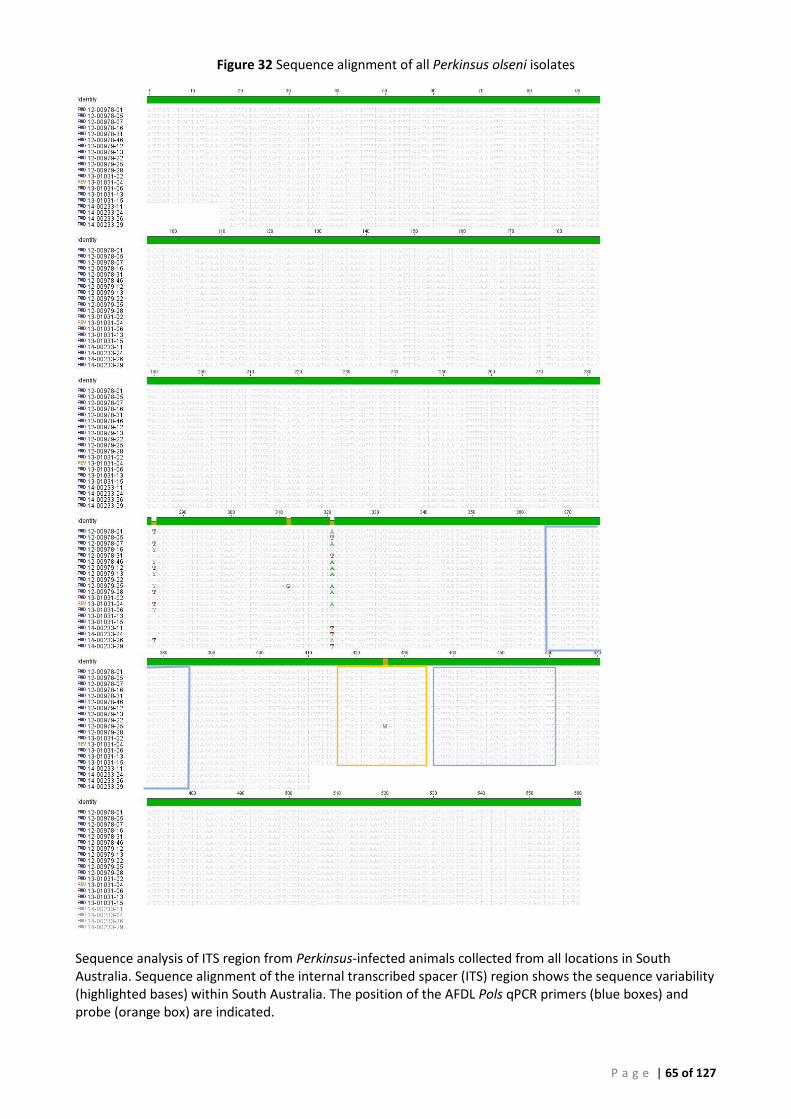
P a g e | 65 of 127
Figure 32 Sequence alignment of all Perkinsus olseni isolates
Sequence analysis of ITS region from Perkinsus-infected animals collected from all locations in South Australia. Sequence alignment of the internal transcribed spacer (ITS) region shows the sequence variability (highlighted bases) within South Australia. The position of the AFDL Pols qPCR primers (blue boxes) and probe (orange box) are indicated.
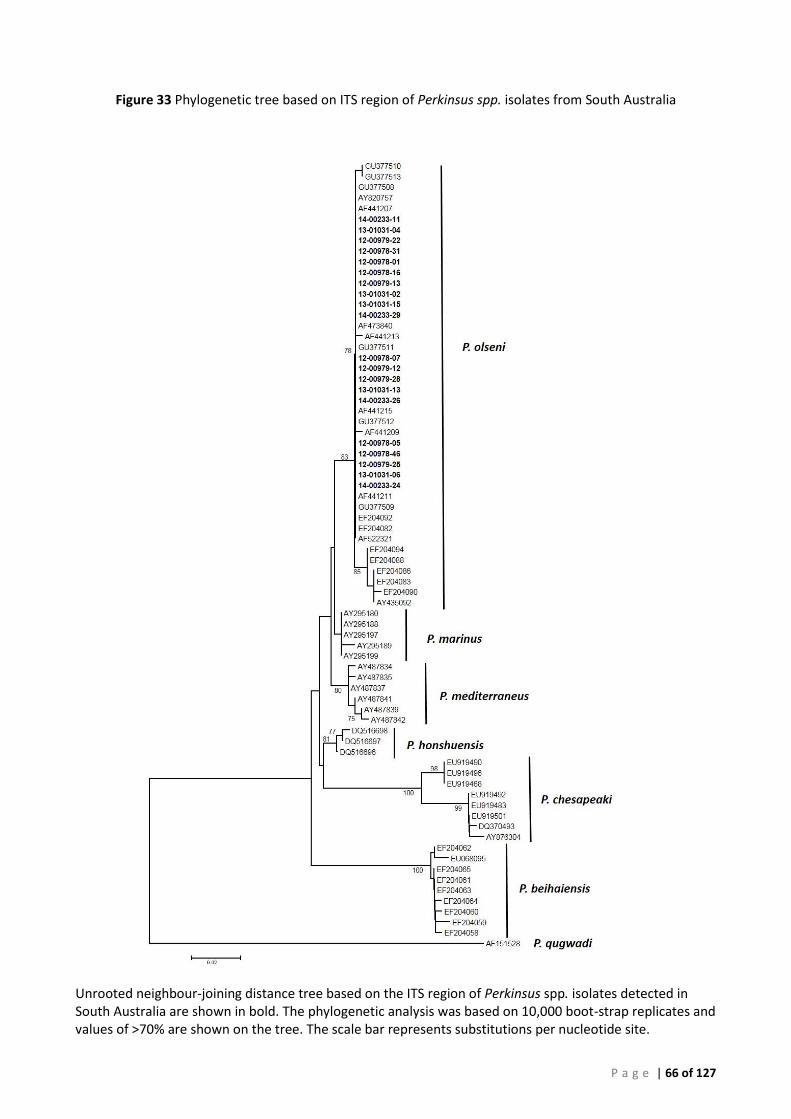
P a g e | 66 of 127
Figure 33 Phylogenetic tree based on ITS region of Perkinsus spp. isolates from South Australia
Unrooted neighbour-joining distance tree based on the ITS region of Perkinsus spp. isolates detected in South Australia are shown in bold. The phylogenetic analysis was based on 10,000 boot-strap replicates and values of >70% are shown on the tree. The scale bar represents substitutions per nucleotide site.
P a g e | 67 of 127
Phylogenetic analysis of Australian Perkinsus olseni cultures
In addition to DNA sequence analysis of abalone field samples from Perkinsus-infected populations sampled, sequencing and phylogenetic analysis of the ITS region, the large sub-unit of the rRNA gene (LSU) and the actin gene was undertaken on the 4 P. olseni axenic cultures established in this project. This analysis was undertaken to confirm the uniformity of both the polyclonal and clonal cultures established and to further characterise and confirm the taxonomy of the cultures and was required for the submission to the ATCC of 12:00978-12 as the type culture of P. olseni.
Phylogenetic analysis
Here we provide a detailed phylogenetic analyses of nucleotide sequences of the internal transcribed spacer (ITS) region of the ribosomal RNA (rRNA) gene complex, of the large subunit (LSU) rRNA gene, and of the actin gene for P. olseni isolate 12:00978-12 from Taylor’s Island, South Australia (34°52'36.36"S, 136° 0'53.82"E). The cultures were established from Perkinsus lesions in pedal muscle collected from H. rubra (blacklip abalone) in April 2012 and 2013. DNA sequence of P. olseni isolate 12:00978-12 is compared with GenBank sequence data representative of each of the 7 known species of Perkinsus. These data are consistent with and representative of the 4 cultures established in this project and are summarised as a phylogenetic tree of each gene loci (Figures 34 to 36). The primers and thermal cycling conditions are modified after Moss et al. (2008) and are summarised in Appendix 2. The GenBank accession numbers for sequences used in the phylogenetic analysis are summarised in Appendix 3.
Sequence analysis of the ITS region and LSU rRNA gene fragments of the rRNA gene complex showed that in all cases the amplified fragment was the targeted DNA and consistently placed this as a member of the genus Perkinsus and the sequences grouped in clades represented by P. olseni. The topologies of the trees generated, based on each of the three loci (Figures 33 to 35) were similar in the analyses with the SA Perkinsus sequence grouping with other P. olseni sequences, and P. marinus, P. honshuensis and P. mediterraneus being most closely related in all the phylogenetic trees generated. These sequence data and phylogenetic analysis provide clear evidence of the taxonomic affiliation of the SA Perkinsus cultures with respect to other Perkinsus species and serves to further confirm the identity of the Perkinsus olseni cultures and the specificity of the AFDL Pols qPCR system.
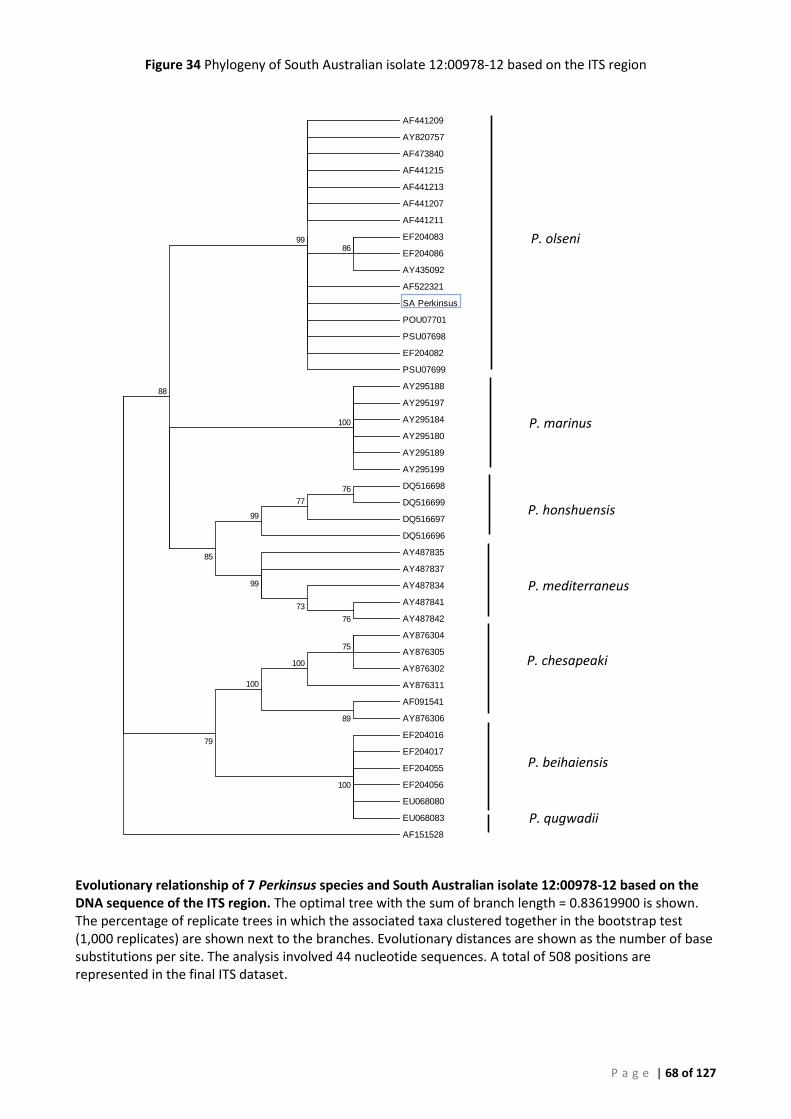
P a g e | 68 of 127
Figure 34 Phylogeny of South Australian isolate 12:00978-12 based on the ITS region
Evolutionary relationship of 7 Perkinsus species and South Australian isolate 12:00978-12 based on the DNA sequence of the ITS region. The optimal tree with the sum of branch length = 0.83619900 is shown. The percentage of replicate trees in which the associated taxa clustered together in the bootstrap test (1,000 replicates) are shown next to the branches. Evolutionary distances are shown as the number of base substitutions per site. The analysis involved 44 nucleotide sequences. A total of 508 positions are represented in the final ITS dataset.
P. honshuensis
P. mediterraneus
P. beihaiensis
P. olseni
P. qugwadii
P. chesapeaki
P. marinus
AF441209
AY820757
AF473840
AF441215
AF441213
AF441207
AF441211
EF204083
EF204086
AY435092
AF522321
SA Perkinsus
POU07701
PSU07698
EF204082
PSU07699
AY295188
AY295197
AY295184
AY295180
AY295189
AY295199
DQ516698
DQ516699
DQ516697
DQ516696
AY487835
AY487837
AY487834
AY487841
AY487842
AY876304
AY876305
AY876302
AY876311
AF091541
AY876306
EF204016
EF204017
EF204055
EF204056
EU068080
EU068083
AF151528
75
100
89
100
100
79
100
76
77
99
76
73
99
85
88
8699

P a g e | 69 of 127
Figure 35 Phylogeny of South Australian isolate 12:00978-12 based on the LSU sequence
Evolutionary relationship of 6 Perkinsus species and South Australian isolate 12:00978-12 based on the DNA sequence of the LSU region. The optimal tree with the sum of branch length = 0.11475750 is shown. The percentage of replicate trees in which the associated taxa clustered together in the bootstrap test (1,000 replicates) are shown next to the branches. Evolutionary distances are shown as the number of base substitutions per site. The analysis involved 30 nucleotide sequences. A total of 927 positions are represented in the final LSU dataset.
EF204098
EF204096
EF204097
EF204095
DQ516682
DQ516681
DQ516680
AY876319
AY876322
AY876328
AY876325
AY876320
AF509333
EF204078
EF204077
SA Perkinsus
AY876332
AY876331
AY876330
AY876348
AY876345
AY876347
AY876346
AY876344
EF526444
EF526441
EF52644
EF526438
EF526440
EF526437
100
99
97
100
100
78
99
81
84
99
P. olseni
P. chesapeaki
P. beihaiensis
P. marinus
P. honshuensis
P. mediterraneus
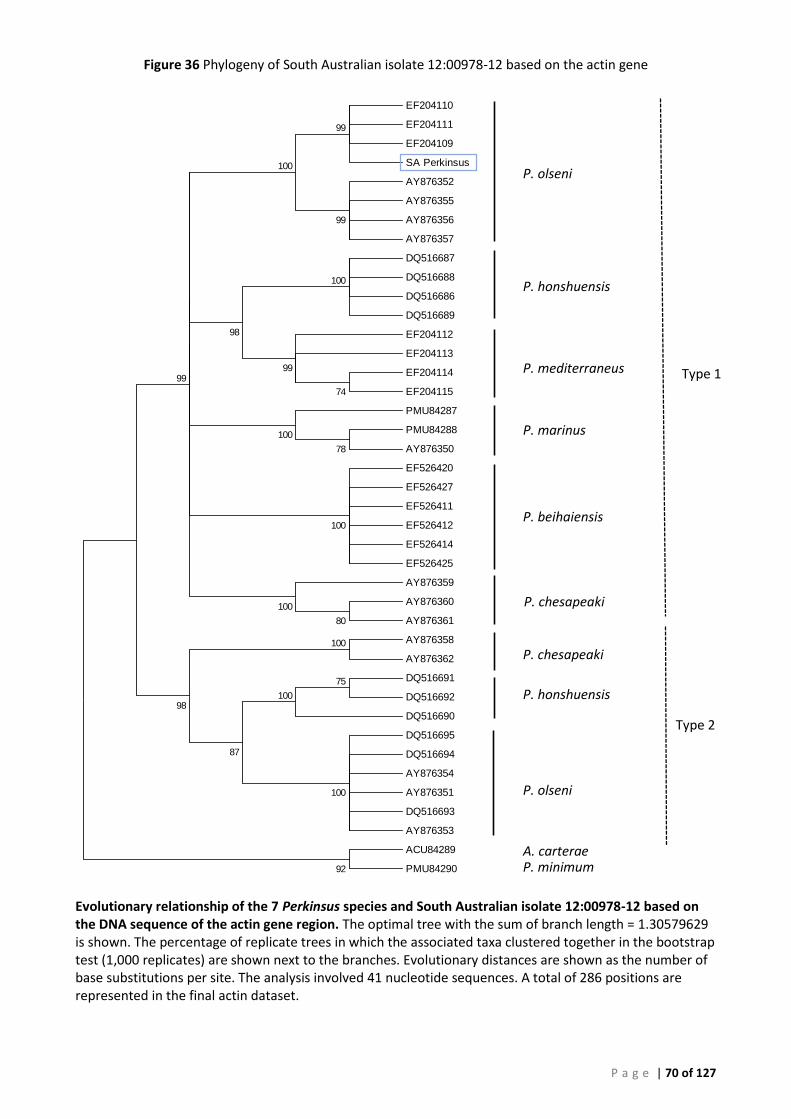
P a g e | 70 of 127
Figure 36 Phylogeny of South Australian isolate 12:00978-12 based on the actin gene
Evolutionary relationship of the 7 Perkinsus species and South Australian isolate 12:00978-12 based on the DNA sequence of the actin gene region. The optimal tree with the sum of branch length = 1.30579629 is shown. The percentage of replicate trees in which the associated taxa clustered together in the bootstrap test (1,000 replicates) are shown next to the branches. Evolutionary distances are shown as the number of base substitutions per site. The analysis involved 41 nucleotide sequences. A total of 286 positions are represented in the final actin dataset.
EF204110
EF204111
EF204109
SA Perkinsus
AY876352
AY876355
AY876356
AY876357
DQ516687
DQ516688
DQ516686
DQ516689
EF204112
EF204113
EF204114
EF204115
PMU84287
PMU84288
AY876350
EF526420
EF526427
EF526411
EF526412
EF526414
EF526425
AY876359
AY876360
AY876361
AY876358
AY876362
DQ516691
DQ516692
DQ516690
DQ516695
DQ516694
AY876354
AY876351
DQ516693
AY876353
ACU84289
PMU84290
75
100
100
100
87
98
92
80
100
100
78
100
100
74
99
98
99
99
100
99
Type 1
P. marinus
P. beihaiensis
P. mediterraneus
P. honshuensis
P. olseni
P. chesapeaki
P. chesapeaki
P. honshuensis
P. olseni
A. carterae P. minimum
Type 2
P a g e | 71 of 127
Discussion and Conclusion
Sampling of Infected Populations and Comparison of Methods
The targeted sampling of known Perkinsus-infected wild abalone populations provided an opportunity to compare existing methods of detection, including RFTC, histology and PCR-based molecular methods. A summary for results from Perkinsus-infected populations is given in table 13. Data from these populations and some diagnostic submissions (data not shown) formed the basis of the ROC and Bayesian analysis for diagnostic test validation.
While histology and RFTC provide a cheap and convenient means of Perkinsus detection neither method can be used for definitive diagnosis of specific species. Novoa et al. (2002) reported the lack of specificity of the RFTC by DNA sequence analysis of hypnospores obtained through incubation of clam gills in RFTM. The results showed that the assay was not specific to members of the genus Perkinsus, and that other organisms including a Perkinsus-like organism (PseudoPerkinsus tapetis, Mesomycetozoa), also enlarged hypnospores when incubated in thioglycollate medium.
The method for Ray’s thioglycollate culture used in this project was based on the ICES standard assay (ICES, 2011). A pool of target tissues were dissected and incubated in ARFTM before examination by microscopy. A further refinement of the procedure was the total body burden assay, individual tissues or the entire animal were incubated in ARFTM then washed with NaOH to dissolve the host tissue. This method is more sensitive and accurate than the standard RFTC (Bushek et al., 1994; Rodríguez and Navas, 1995) but also more expensive and time-consuming than the standard assay. The total body burden assay would be difficult to implement for screening of populations of large abalone. Comparison of the two methods in oysters, shows that the standard method does not consistently detect infections until the parasite burden is ≥ 103 to 104 per gram wet weight of tissue (ICES, 2011). Histology and ARFTM incubation of hemolymph samples are considered less sensitive diagnostic techniques than standard RFTC incubation in the ICES (2011) report. In the course of testing individual tissues we were surprised to find that gill samples were often positive by PCR, despite the absence of lesions. In order to determine the relative value of sampling gill and muscle in abalone we analysed and compared the OIE PCR and AFDL Pols qPCR results. Our data showed that parallel testing (OIE PCR and AFDL Pols qPCR together) of muscle and gill specimens is likely to increase DSe of detecting Perkinsus olseni-infected abalone. Using the AFDL Pols qPCR as a screening “population test”, e.g. on 10-15 abalone, at the same time would help to minimize false-negative results in low prevalence scenarios and would also be helpful to minimize false-negative results due to localised infections. Our data show that the DSe obtained with the AFDL Pols qPCR with gill and muscle are similar, 0.88 and 0.92, respectively. The slightly higher sensitivity in muscle may be due in part to the natural bias of the operator towards sampling visible lesions or areas of tissue with abnormal appearance which may be indicative of infection. Should the highest level of DSe be required the parallel testing of both muscle and gill is recommended.
Establishment of In Vitro Perkinsus olseni Cultures
Replicating in vitro cultures of Perkinsus olseni were successfully established from each of the infected areas examined. This includes a sample from Thistle Island, South Australia which is near the location from which P. olseni was first described.
It is important to clearly distinguish between culture of Perkinsus in Ray’s Thioglycollate Medium (ARFTM) and the in vitro culture undertaken here. Culture in ARFTM does not result in significant replication or increase of parasite numbers but merely allows Perkinsus hypnospores to increase in size making them easier to visualise by light microscopy when stained with dilute Lugol’s Iodine solution (Figure 10). This is the basis of Ray’s test which provides a cheap and convenient means of screening for Perkinsus spp. While it appears that Perkinsus spp. are preferentially selected in the medium and iodine-staining is generally
P a g e | 72 of 127
confined to Perkinsus hypnospores, Ray’s test does not provide definitive identification. In contrast, in vitro tissue culture of Perkinsus provides a way of both amplifying cell numbers and storing the live parasite providing a ready source of Perkinsus for biological study. A stock of P. olseni cells has been established for this purpose and is available from CSIRO-AAHL for distribution to Australian laboratories. A stock of Perkinsus olseni gDNA has also been prepared.
Four representative axenic cultures were cryopreserved successfully. Two isolates from 2012 and 2013 were cloned by terminal dilution and the viability of the cryopreserved stocks was demonstrated by recovery and passage of cells in tissue culture. The identification of all P. olseni cultures was confirmed by DNA sequencing and BLAST (Altschul et al., 1997) and phylogenetic analysis of the ITS intergenic region, the LSU rRNA gene and the actin gene.
A clonal culture from this location was accepted by ATCC as the holotype culture for P. olseni.
DNA Sequencing and Phylogenetic Analysis
The results of DNA sequencing and phylogenetic analysis provided a useful framework for the real-time PCR development. We saw little variation in DNA sequence in the diagnostic region over the course of the study and these data correlated with the other P. olseni sequences from GenBank, demonstrating stability in this area of the Perkinsus genome extending over some decades. Only minor variations in DNA sequence were found in alignments of the ITS region (Figures 23, 25, 27, 29 and 31). These were mostly confined to single nucleotides changes outside the region targeted by the real-time assay.
All the P. olseni sequences from Australian field samples collected over 3 years grouped with the other P. olseni sequences from GenBank in the phylogenetic analysis of individual samples (Figures 24, 26, 28, 30 and 32). The topologies of the trees generated were similar in the analyses with P. marinus, P. honshuensis and P. mediterraneus being most closely related to P. olseni in all the phylogenetic trees generated.
These DNA sequence alignments and the phylogenetic trees on which they are based provide evidence of the taxonomic affiliation of the individual samples with respect to other Perkinsus species and show there is little variation in the DNA sequence in the region targeted by the real-time assay and further serve to confirm the identity of the Perkinsus olseni cultures developed in this project and the specificity of the AFDL Pols qPCR system.
The sequencing and phylogenetic analysis in this project was also intended to confirm the taxonomy and identification of a possible new Perkinsus species found in NSW abalone samples in 2005 and also reported from Vietnamese clams imported into the USA (Liggins & Upston, 2010; Reece et al., 2010).
The Perkinsus-related mortalities which severely depleted stocks of blacklip abalone along approximately 500 km of NSW coastline since the early 1990’s appears to have dropped to the point where disease due to Perkinsus is no longer reported. The reasons for this are not known. Areas of disease were still active and identified in a number of surveys conducted in the early 2000’s where Perkinsus infections were identified by Ray’s Test and confirmed by histology. The last reports of Perkinsus appear to have come from samples collected in 2005, in this case Perkinsus olseni was confirmed by PCR and DNA sequencing. In the course of this testing an “ITS-variant” was detected (Reece et al., 2010), however no further samples appear to have been collected from these areas. From that time to the beginning of this project in 2011, Perkinsosis in NSW abalone appears to have declined and no sampling for surveillance testing for Perkinsus was undertaken.
As a result of the original mortality events in NSW, Liggins and Upston (2010) reported that in some areas abalone stocks may have been depleted to less than 10% of virgin abundance and that the recovery of stocks would be a slow process. It is possible that populations were so severely depleted that infection was self-limiting, however it is equally possible that some unknown environmental factor or a combination of factors is responsible for the disappearance of the disease. Whatever the case may be any explanation for the disappearance of Perkinsus from previously infected areas in NSW abalone is speculative at best. Despite the best advice from NSW authorities, including NSW DPI and NSW Fisheries and professional
P a g e | 73 of 127
abalone divers who are responsible for the regulation of this fishery, no Perkinsus-infected populations could be identified at the time of this project.
As research funding for the collection of field samples in this project was based on targeted sampling of known infected populations, field collection in NSW was limited to the area were the ITS-variant was last detected. Limited sampling was conducted at five sites south of Bowen Island down to the St Georges Head in the Jervis Bay area (Site 1 (35° 8.600'S, 150° 45.760'E), Site 2 (35° 9.192'S, 150° 45.686'E), Site 3 (35° 9.679'S, 150° 45.598'E), Site 4 (35° 10.212'S, 150° 45.042'E), Site 5 (35° 12.033'S, 150° 41.755'E)). No Perkinsus was detected in any samples from this area and no DNA sequence analysis of either P. olseni or the ITS-variant from NSW was possible.
Given our inability to obtain samples of Perkinsus from NSW, requests were made to obtain the original DNA sequence data from the NSW blacklip abalone samples collected in 2005 for comparison. Unfortunately these data are not available.
Perkinsus was recently described from Anadara trapezia (mud arks) in Queensland (Dang et al. 2015). Only limited sequence of the P. olseni detected there was available through NCBI. Our alignments (Figure 45) only include the region of the AFDL Pols qPCR forward primer. However given the level of validation undertaken with other Perkinsus samples derived from multiple hosts and locations, we remain confident that our assay has specificity for P. olseni.
Development of AFDL Pols qPCR
The currently recommended OIE conventional PCRs for both P. marinus and P. olseni target the ITS region of the Perkinsus genome. PCR primers that target the internal transcribed spacer region (ITS) are recommended for PCR detection as more is known about inter- and intra-specific sequence variation of the ITS region than other possible diagnostic regions such as the non-transcribed spacer (NTS) region of the Perkinsus sp. rRNA gene complex (OIE, 2015a). Like the 16S rRNA gene commonly used to identify prokaryotes, this area has sufficient DNA sequence variation to allow differentiation of species while at the same time is sufficiently conserved within species to provide reliable identification.
Multiple sequence alignments were generated and used as the basis for design and then further sequencing of positive field samples was undertaken to determine if there were underlying regions of variability which might undermine the sensitivity and specificity of the real-time assay. DNA sequence data for Perkinsus olseni field samples from various sites around the Port Lincoln area (12-00978, 12-00979, 14-00233) and Baird Bay in South Australia (13-01031) were consistent with GenBank data on P. olseni from other species and geographic areas. A consensus DNA sequence of the ITS region from select samples representing all South Australian sites at which Perkinsus was found was constructed (Appendix 9) and aligned with both the GenBank derived consensus and the primer and probe sequences to further confirm the selection of primer and probe binding sites shown in Figure 17. Within each non-target alignment the primers and probe contain at least 3 centrally placed DNA sequence mismatches when compared to non-target species. These differences confer specificity to the AFDL Pols qPCR assay with respect to the other Perkinsus species and guided the selection of primers and probe on which the system was based.
An MGB probe was favoured for the AFDL Pols qPCR as these probes form an extremely stable duplex with single-stranded DNA target. The higher Tm of the duplex allows the design of shorter probes in hybridization based assays (Kutyavin et al. 2000). This was a particular issue when it came to locating a probe in the limited space available in the DNA alignment of Perkinsus ITS. While the Primer 3® software provided primers and probe that would theoretically work in the Taqman® system, the selection of these was empirically determined.
High CT values in the AFDL Pols qPCR
In the course of testing field samples from known infected populations, we found CT values between 40 and 45 in the AFDL Pols qPCR were not uncommon. Typically 1 or 2 replicates gave a high CT value with a limited amplification curve possibly indicating specific amplification, with the remaining replicates "undetermined"
P a g e | 74 of 127
after analysis. The late amplification observed is not confined to this P. olseni assay and is observed in other real-time assays where a cut-off value might be applied.
These results are problematic as the CT values may fall outside the limit of detection (LOD) suggested by extrapolation of the quantified plasmid titration and often appear inconsistently on repeat testing. Given the consistency observed with the screening of P. olseni plasmid and gDNA diluted in pooled abalone DNA, the reasons for late amplification are not readily explained. We assume it is the result of late amplification of low levels of DNA template in a high background of host DNA or other constituents co-purified in the samples. While our experience, based on the replicate testing and analysis of hundreds of known negative abalone samples, has been that our probe-based system is unambiguously negative after 45 cycles of amplification, the possible heteroscedasticity associated with CT values (Caraguel et al., 2011) may obscure the true nature of these samples. Bustin et al. (2009) observed (citing Burns and Valdivia, 2008) "Cq values >40 are suspect because of the implied low efficiency and generally should not be reported; however, the use of such arbitrary Cq cut-offs is not ideal, because they may be either too low (eliminating valid results) or too high (increasing false-positive results)". This issue is currently under review by SCAAH who may provide some perspective on this.
Within the context of this study, in order to better understand and determine the significance of high CT results in the system, we wanted to establish if these results were indeed true positives derived from Perkinsus DNA or were merely a result of noise in the system derived from non-specific interactions with the Taqman chemistry. The late amplification seen in these samples precluded any chance of reliably assessing other indicators of specific amplification such as a characteristic amplification curve.
If the high CT result could be independently confirmed by sequencing, it is reasonable to accept that the observed CT was derived from amplification of specific target template in the system. In this case the OIE conventional primers were used in a large volume reaction with 70 cycles of amplification using the same temperatures recommended for the diagnostic PCR. Of the 9 samples subjected to amplification, 7 samples produced DNA sequence of sufficient quality for BLAST (Altschul et al., 1997) analysis. This analysis confirmed the presence of Perkinsus and that the high CT values obtained in the AFDL Pols qPCR system were derived from P. olseni DNA in the sample.
On this basis we could not reliably define the absolute limits of analytical sensitivity. Given the large number (n = 200) of known negative abalone samples screened (repeat testing in triplicate), and further samples from populations with unknown disease status which were subsequently shown to be uninfected were unambiguously negative in the test with the absence of any background signal, we regard any positive value as a significant result indicating a presumptive positive result for P. olseni, which depending on the purpose of the assay might require further sampling and testing for confirmation. On this basis a cut-off value for the system was not defined.
Along with field samples from wild populations collected over the course of the project we used a large library of 200 negative samples and some fixed reference tissues to validate the system. Final ROC analysis was performed using 56 positive and 321 negative samples for P. olseni using the OIE 140/600 cPCR as the reference test. The area under the curve was 0.957 with a significance level of <0.0001, indicating that the AFDL Pols qPCR is able to distinguish between the infected and non-infected groups. Bayesian analysis was then used to estimate the relative DSe (94.6) and DSp (92.8) at a preliminary cut-off of ≤ CT 41.29.
Repeatability was assessed using 37 field samples of different analyte (DNA target) concentrations in three different runs using a CT cut-off of <39. Cochran Q statistics concluded that there was no significant difference between runs indicating satisfactory repeatability on random field samples after 3 runs at the 95% CI (P value = 0.066).
Sampling Abalone for PCR
As opposed to most bivalves, blacklip abalone are large animals. This in itself possess a challenge to the application of PCR. Where small samples taken from bivalves may be representative, abalone require close inspection and considered selection of tissues for PCR detection. The current OIE Manual of Diagnostic
P a g e | 75 of 127
Tests for Aquatic Animals (OIE, 2015) recommends gill or mantle tissue for PCR in both bivalves and abalone. Our data show that the DSe obtained with the AFDL Pols qPCR with gill and muscle (sampled from around the epipodial fringe) are similar, 0.88 and 0.92, respectively. The slightly higher sensitivity in muscle may be due in part to the natural bias of the operator towards sampling visible lesions or areas of tissue with abnormal appearance which may be indicative of infection. Should the highest level of DSe be required the parallel testing of both muscle and gill is recommended. It is important to note that these estimates of DSe of the AFDL Pols qPCR with gills and muscle are based on the close examination of animals, including examination of serial slices at 2 to 3 mm intervals through the whole body after the visceral mass is removed. In the absence of lesions we found that multiple samples of gill and muscle increased the rate of detection.
Comparison of the AFDL Pols qPCR and the OIE 140/600 cPCR for P. olseni
Of the 159 animals examined from Perkinsus-infected populations, the OIE species-specific conventional PCR found 33% were PCR-positive and the AFDL Pols qPCR found 50% of the animals were PCR positive.
Bayesian analysis was used to compare the performance of the new AFDL Pols qPCR assay with the current OIE-recommended 140/600 cPCR for P. olseni. The DSe and DSp of the AFDL Pols qPCR was dependant on the cut-off used. Given the unresolved issues surrounding the acceptable end-point for qPCR. We calculated the DSe and DSp of each assay using 2 cut-off values. Bayesian analysis was performed using the cut-off generated through the ROC analysis (CT 41.29) and an arbitrary lower cut-off (CT 39.00) was also used to allow analysis for those laboratories that cannot accept the validity of high CT values (≥ 40).
AFDL Pols qPCR with cut-off CT ≤ 41.29
When a cut-off CT < 39.00 is applied, the AFDL Pols qPCR had DSe and DSp of 93.6% (95% CI 85.6-98.8) and 99.5% (95% CI 98-100), respectively, compared with the 140/600 cPCR (OIE) which had DSe and DSp of 69.4% (95% CI 58.6-79.4) and 99.6% (95% CI 98.4-100), respectively.
AFDL Pols qPCR with cut-off CT < 39.00
Similarly, when a cut-off CT < 39.00 is applied, the AFDL Pols qPCR had a DSe and DSp of 90.2% (95% CI 80.9-96.9) and 99.5% (95% CI 98.4-100) compared with the 140/600 cPCR (OIE) which had DSe and DSp of 78.1% (95% CI 67.1-87.5) and 99.5% (95%CI 98.3-100), respectively.
It is concluded that, no matter which CT cut-off value is used, the AFDL Pols qPCR provides a highly sensitive and specific test for the detection and identification of P. olseni.
P a g e | 76 of 127
References
Abollo E, Casas SM, Ceschia G, Villalba A. 2006. Differential diagnosis of Perkinsus species by polymerase chain reaction-restriction fragment length polymorphism assay. Molecular and Cellular Probes 20:323-370.
Altschul SF, Madden TL, Schäffer AA, Zhang J, Zhang Z, Miller W, Lipman DJ. 1997. Gapped BLAST and PSI-BLAST: a new generation of protein database search programs. Nucleic Acids Research 25:3389-3402.
Audemard C, Reece KS, Burreson EM. 2004. Real-time PCR for the detection and quantification of the protistan parasite Perkinsus marinus in environmental waters. Applied and Environmental Microbiology 70:6611–6618.
Australian Department of Agriculture and Water Resources. 2015. Australia's National List of Reportable Diseases of Aquatic Animals http://www.agriculture.gov.au/animal/aquatic/reporting/reportable-diseases
Blackbourn J, Bower SM, Meyer GR. 1998. Perkinsus qugwadi sp. nov. (incertae sedis), a pathogenic protozoan parasite of Yesso scallops, Patinopecten yessoensis, cultured in British Columbia, Canada. Canadian Journal of Zoology 76:942−953.
Bower S, Burreson E, Reece KS. 2003. Annex 10: Review of molecular techniques used to differentiate the various species/isolates of Perkinsus. Report of the Working Group on Pathology and Diseases of Marine Organisms, Aberdeen, UK, 11-15 March 2003. Mariculture Committee, ICES CM 2003/F: 03, Ref. ACME, pg. 54-60 (online version http://www.ices.dk/products/CMdocs/2003/F/F0303.PDF (pg. 60 of 101)).
Bower, SM. 2000. Infectious diseases of abalone (Haliotis spp.) and risks associated with transplantation. In: Campbell, A. (Editor), Workshop on Rebuilding Abalone Stocks in British Columbia. Canadian Special Publication of Fisheries and Aquatic Sciences 130:111-122.
Bower, SM. 2010. Synopsis of Infectious Diseases and Parasites of Commercially Exploited Shellfish: Perkinsus olseni of Abalone. http://www.dfo-mpo.gc.ca/science/aah-saa/diseases-maladies/perkolab-eng.html.
Branscum AJ, Gardner IA, Wagner BA, McInturff PS, Salman MD. 2005. Effect of diagnostic testing error on intracluster correlation coefficient estimation. Preventive Veterinary Medicine 69:63–75.
Brown GD, Hudson KL, Reece KS. 2004. Multiple polymorphic sites at the ITS and ATAN loci in cultured isolates of Perkinsus marinus. Journal of Eukaryotic Microbiology 51:312-320.
Burns M, Valdivia H. 2008. Modelling the limit of detection in real-time quantitative PCR. European Food Research and Technology 226:1513-1524.
Burreson EM, Reece KS, Dungan CF. 2005. Molecular, morphological, and experimental evidence support the synonymy of Perkinsus chesapeaki and Perkinsus andrewsi. Journal of Eukaryotic Microbiology 52:258-270.
Bushek D, Ford SE, Allen Jr. SK. 1994. Evaluation of methods using Ray’s fluid thioglycollate medium for diagnosis of Perkinsus marinus infection in the eastern oyster, Crassostrea virginica. Annual Review of Fish Diseases 4:201-217.
Bustin SA, Benes V, Garson JA, Hellemans J, Huggett J, Kubista M, Mueller R, Nolan T, Pfaffl MW, Shipley GL, Vandesompele J, Wittwer CT. 2009. The MIQE guidelines: minimum information for publication of quantitative real-time PCR experiments. Clinical Chemistry 55:611-22.
Caraguel CGB, Stryhn H, Gagné N, Dohoo IR, Hammell KL. 2011. Selection of a cutoff value for real-time PCR results to fit diagnostic purpose: analytical and epidemiologic approaches. Journal Veterinary Diagnostic Investigation 23:2–15.
Casas SM, Grau A, Reece KS, Apakupakul K, Azevedo C, Villalba A. 2004. Perkinsus mediterraneus n. sp. a protistan parasite of the European flat oyster Ostrea edulis (L.) from the Coast of Balearic Islands, Mediterranean Sea. Diseases of Aquatic Organisms 58:231-244.
P a g e | 77 of 127
Coss CA, Robledo JAF, Ruiz GM, Vasta GR. 2001. Description of Perkinsus andrewsi n. sp. isolated from the Baltic clam (Macoma balthica) by characterization of the ribosomal RNA locus, and development of a species-specific PCR-based diagnostic assay. Journal of Eukaryotic Microbiology 48:52-61.
Cremonte F, Balseiro P, Figueras A. 2005. Occurrence of Perkinsus olseni (Protozoa: Apicomplexa) and other parasites in the venerid commercial clam Pitar rostrata from Uruguay, southwestern Atlantic coast. Diseases of Aquatic Organisms 64:85–90.
Dang C, Dungan CF, Scott GP, Reece KS. 2015. Perkinsus sp. infections and in vitro isolates from Anadara trapezia (mud arks) of Queensland, Australia. Diseases of Aquatic Organisms 113:51-58.
DeLong ER, DeLong DM, Clarke-Pearson DL. 1988. Comparing the areas under two or more correlated receiver operating characteristic curves: a nonparametric approach. Biometrics 44:837-845
Dungan CF, Reece KS. 2006. In vitro Propagation of Two Perkinsus spp. Parasites from Japanese Manila Clams Venerupis philippinarum and Description of Perkinsus honshuensis n. sp. Journal of Eukaryotic Microbiology 53:316–326.
Dungan CF, Hamilton RM. 1995. Use of a tetrazolium-based cell proliferation assay to measure effects of in vitro conditions on Perkinsus marinus (Apicomplexa) proliferation. Journal of Eukaryotic Microbiology 42:379–388.
Felsenstein J. 1985. Confidence limits on phylogenies: An approach using the bootstrap. Evolution 39:783-791.
Fong D, Rodríguez R, Koo K, Sun J, Sogin ML, Bushek D, Littlewood DTJ, Ford SE. 1993. Small subunit ribosomal RNA gene sequence of the oyster parasite Perkinsus marinus. Molecular Marine Biology and Biotechnology 2:346-350.
Gauthier JD, Miller CR, Wilbur AE. 2006. TaqMan® MGB real-time PCR approach to quantification of Perkinsus marinus and Perkinsus spp. in oysters. Journal of Shellfish Research 25:619–624.
Goggin CL, Barker SC. 1993. Phylogenetic position of the genus Perkinsus (Protista, Apicomplexa) based on small subunit ribosomal RNA. Molecular and Biochemical Parasitology 60:65-70.
Goggin CL, Lester RJG. 1995. Perkinsus, a protistan parasite of abalone in Australia: a review. Marine Fisheries Research 46:639-646.
Goggin CL, Sewell KB, Lester RJ. 1990. Tolerances of Perkinsus spp. (Protozoa, Apicomplexa) to temperature, chlorine and salinity. Journal of Shellfish Research 9:145-148.
Goggin CL, Sewell KB, Lester RJG. 1989. Cross-infection experiments with Australian Perkinsus species. Diseases of Aquatic Organisms 7:55-59.
Goggin CL. 1994. Variation in the two internal transcribed spacers and 5.8S ribosomal RNA from five isolates of the marine parasite Perkinsus (Protista, Apicomplexa). Molecular and Biochemical Parasitology 65:179-182.
Handlinger J, Bastianello S, Callinan R, Carson J, Creeper J, Deveney M, Forsyth WM, Freeman K, Hooper C, Jones B, Lancaster M, Landos M, Loh R, Oyay BS, Phillips P, Pyecroft S, Stephen F. 2006. Abalone Aquaculture Subprogram: A National Survey of Disease of Commercially Exploited Abalone Species to Support Trade and Translocation Issues and the Development of Health Surveillance Programs. FRDC project 2002/201.
Hayward C, Lester R, Barker S, McCallum H, Murrell A, Kleeman S. 2002. Transmission of Perkinsus olseni among wild blacklip abalone in South Australia. (Abstract). Handbook and Abstracts, Fifth Symposium on Diseases in Asian Aquaculture, Queensland, Australia, 24-28 November 2002. Pg. 139.
ICES. 2011. Dermo disease of oysters caused by Perkinsus marinus. Revised and updated by Susan E. Ford. ICES Identification Leaflets for Diseases and Parasites of Fish and Shellfish. International Council for the Exploration of the Sea Leaflet No. 30. 5 pp.
P a g e | 78 of 127
IFREMER. 2011. European Union Reference Laboratory for Molluscs Diseases Standard Operating Procedure Quantification of Perkinsus sp. infection intensity using Ray’s Fluid Thioglycolate Medium (RFTC) Method. Ed.1, p. 4.
Itoh N, Meyer GR, Tabata A, Lowe G, Abbott CL, Johnson SC. 2013. Rediscovery of the Yesso scallop pathogen Perkinsus qugwadi in Canada, and development of PCR tests. Diseases of Aquatic Organisms 104:83-91.
Kutyavin IV, Afonina IA, Mills A, Gorn VV, Lukhtanov EA, Belousov ES, Singer MJ, Walburger DK, Lokhov SG, Gall AA, Dempcy R, Reed MW, Meyer RB, Hedgpeth J. 2000. 3'-Minor groove binder-DNA probes increase sequence specificity at PCR extension temperatures. Nucleic Acids Research 28:655–661.
Lester RJG, Davis GHG. 1981. A new Perkinsus species (Apicomplexa, Perkinsea) from the abalone Haliotis ruber. Journal of Invertebrate Pathology 37:181-187.
Lester RJG, Goggin CL, Sewell KB. 1990. Perkinsus in Australia. P. 189-199. In F.O. Perkins and T.C. Cheng [Ed.]. Pathology in Marine Science. Academic Press Inc., San Diego. CA.
Lester RJG, Hayward CJ. 2005. Control of Perkinsus disease in abalone. Final Report for FRDC Project no. 2000/151, Fisheries Research and Development Corporation, Australian Government, and The University of Queensland - Marine Parasitology, Brisbane. Pg. 50.
Lester RJG, Kleeman SN, Barker SC, McCallum HI. 2001. Epidemiology of Perkinsus olseni, pathogen of abalone. (Abstract). Book of Abstracts, European Association of Fish Pathologists, Tenth International Conference "Diseases of Fish and Shellfish. Trinity College Dublin, Ireland, 9 - 14 September 2001. pg. O-006.
Lester RJG. 1986. Abalone dieback caused by protozoan infection? Australian Fisheries 45:26-27.
Levine ND. 1978. Perkinsus gen. n. and other new taxa in the protozoan phylum Apicomplexa. Journal of Parasitology 64:549.
Liggins GW and Upston J. 2010. Investigating and managing the Perkinsus-related mortality of blacklip abalone in NSW. FRDC project 2004/084 Final Report. ISSN 1837-2112.
Mackin JG and Boswell JL. 1956. The life cycle and relationships of Dermocystidium marinum. Proceedings of the National Shellfish Association 46:112-115.
Mackin JG, Owen HM, Collier A. 1950. Preliminary note on the occurrence of a new protistan parasite, Dermocystidium marinum n. sp. in Crassostrea virginica (Gmelin). Science 111:328-329.
Mackin JG, Ray SM. 1966. The taxonomic relationships of Dermocystidium marinum Mackin, Owen, and Collier. Journal of Invertebrate Pathology 8:544-545.
Mackin JG. 1951. Histopathology of infection of Crassostrea virginica (Gmelin) by Dermocystidium marinum Mackin, Owen and Collier. Bulletin of Marine Science 1:72-87.
Mackin JG. 1962. Oyster disease caused by Dermocystidium marinum and other microorganisms in Louisiana. Publications of the Institute of Marine Science 7:132-229.
McLaughlin SM, Tall BD, Shaheen A, Elsayed EE, Faisal M. 2000. Zoosporulation of a new Perkinsus species isolated from the gills of the softshell clam Mya arenaria. Parasite 7:115–122
Mohr PG, Moody NJG, Williams LW, Hoad JGM, Cummins DM, Davies KR, Crane MStJ. 2015. Molecular confirmation of infectious spleen and kidney necrosis virus (ISKNV) in farmed and imported ornamental fish in Australia. Diseases of Aquatic Organisms 116:103-110.
Moore BR, Kleeman SN, Lester RGJ. 2002. The development of a positive non-infectious control for the detection of Perkinsus using the Ray test. Journal of Shellfish Research 21:871-873.
Mortensen S, Arzul I, Miossec L, Paillard C, Feist S, Stentiford G, Renault T, Saulnier D, Gregory A. 2007. Molluscs and crustaceans, 5.3.18 Perkinsosis due to Perkinsus olseni. In: Raynard, R., T. Wahli, I. Vatsos, S. Mortensen (eds.) Review of disease interactions and pathogen exchange between farmed and
P a g e | 79 of 127
wild finfish and shellfish in Europe. VESO on behalf of DIPNET, Oslo. P. 389-396. (For electronic publication see www.dipnet.info under "Documents", subgroup "Reports and project deliverables").
Moss JA, Burreson EM, Reece KS. 2006. Advanced Perkinsus marinus infections in Crassostrea ariakensis maintained under laboratory conditions. Journal of Shellfish Research 25:65–72.
Moss JA, Burreson EM, Reece KS. 2006. Advanced Perkinsus marinus infections in Crassostrea ariakensis maintained under laboratory conditions. Journal of Shellfish Research 25:65-72.
Moss JA, Xiao J, Dungan CF, Reece SR. 2008. Description of Perkinsus beihaiensis n. sp., a new Perkinsus sp. Parasite in Oysters in Southern China. Journal of Eukaryotic Microbiology 55:117-130
Murrell A, Kleeman SN, Barker SC, Lester RJG. 2002. Synonymy of Perkinsus olseni Lester & Davis, 1981 and Perkinsus atlanticus Azevedo, 1989 and an update on the phylogenetic position of the genus Perkinsus. Bulletin of the European Association of Fish Pathologists 22: 258-265.
Novoa B, Ordás MC, Figueras A. 2002. Hypnospores detected by RFTM in clam (Ruditapes decussatus) tissues belong to two different protozoan organisms, Perkinsus atlanticus and a Perkinsus like organism. Aquaculture 209:11-18.
O'Donoghue PJ, Phillips PH, Shepherd SA. 1991. Perkinsus (Protozoa: Apicomplexa) infections in abalone from South Australian waters. Transactions of the Royal Society of South Australia 115:77-82.
OIE. 2015. Infection with Perkinsus olseni. Chapter 2.4.7. Manual of Diagnostic Tests for Aquatic Animals. http://www.oie.int/index.php?id=2439&L=0&htmfile=chapitre_Perkinsus_olseni.htm.
OIE. 2015a. Infection with Perkinsus marinus. Chapter 2.4.6. Manual of Diagnostic Tests for Aquatic Animals. http://www.oie.int/index.php?id=2439&L=0&htmfile=chapitre_Perkinsus_marinus.htm.
Park KI, Ngo TT, Choi SD, Cho M, Choi KS. 2006. Occurrence of Perkinsus olseni in the Venus clam Protothaca jedoensis in Korean waters. Journal of Invertebrate Parasitology 93:81–87.
Pecher WT, Robledo JA, Vasta GR. 2004. Identification of a second rRNA gene unit in the Perkinsus andrewsi genome. Journal of Eukaryotic Microbiology 51:234-245.
Perkins FO. 1976. Zoospores of the oyster pathogen, Dermocystidium marinum. I. Fine structure of the conoid and other sporozoan–like organelles. Journal of Parasitology 62:959–974.
Ray SM. 1952. A culture technique for the diagnosis of infections by Dermocystidium marinum Mackin, Owen, and Collier in oysters. Science 116:360–361.
Reece KS, Scott GP, Dungan CF, da Silva PM, Adams C, Burreson EM. 2010. Discovery and Characterisation of New Perkinsus species. Proc. 6th International Symposium on Aquatic Animal Health, Sept 5-9, 2010, Tampa Florida, USA.
Rodríguez F, Navas JI. 1995. A comparison of gill and hemolymph assays for the thioglycollate diagnosis of Perkinsus atlanticus (Apicomplexa, Perkinsea) in clams, Ruditapes decussatus (L.) and Ruditapes philippinarum (Adams and Reeve). Aquaculture 132:145-152.
Saitou N, Nei M. 1987. The neighbour-joining method: A new method for reconstructing phylogenetic trees. Molecular Biology and Evolution 4:406-425.
Sanil NK, Vijayan KK, Kripa V, Mohamed KS. 2010. Occurrence of the protozoan parasite, Perkinsus olseni in the wild and farmed pearl oyster, Pinctada fucata (Gould) from the Southeast coast of India. Aquaculture 299:8–14.
Sheppard BJ, Phillips AC. 2008. Perkinsus olseni detected in Vietnamese aquacultured reef clams Tridacna crocea imported to the USA, following a mortality event. Diseases of Aquatic Organisms 79:229–235.
Sprague V. 1954. Protozoa. Fisheries Bulletin of the Fish and Wildlife Service U.S. 89:243-256.
Tamura K, Nei M. 1993. Estimation of the number of nucleotide substitutions in the control region of mitochondrial DNA in humans and chimpanzees. Molecular Biology and Evolution 10:512-526.
Tamura K, Stecher G, Peterson D, Filipski A, Kumar S. 2013. MEGA6: Molecular Evolutionary Genetics Analysis version 6.0. Molecular Biology and Evolution 30:2725-2729.

P a g e | 80 of 127
Umeda K, Yoshinaga T. 2012. Development of real-time PCR assays for discrimination and quantification of two Perkinsus spp. in the Manila clam Ruditapes philippinarum. Diseases of Aquatic Organisms 99:215-225.
Villalba A, Reece KS, Ordás MC, Casas SM, Figueras A. 2004. Perkinsosis in molluscs: a review. Aquatic Living Resources 17:411–432
Ye J, Coulouris G, Zaretskaya I, Cutcutache I Rozen S, Madden TL. 2012. Primer-BLAST: A tool to design target-specific primers for polymerase chain reaction. BMC Bioinformatics. 13:134.
Zhang H, Campbell DA, Sturm NR, Dungan CF, Lin S. 2011. Spliced leader RNAs, mitochondrial gene frameshifts and multi-protein phylogeny expand support for the genus Perkinsus as a unique group of Alveolates. PLoS ONE 6(5): e19933
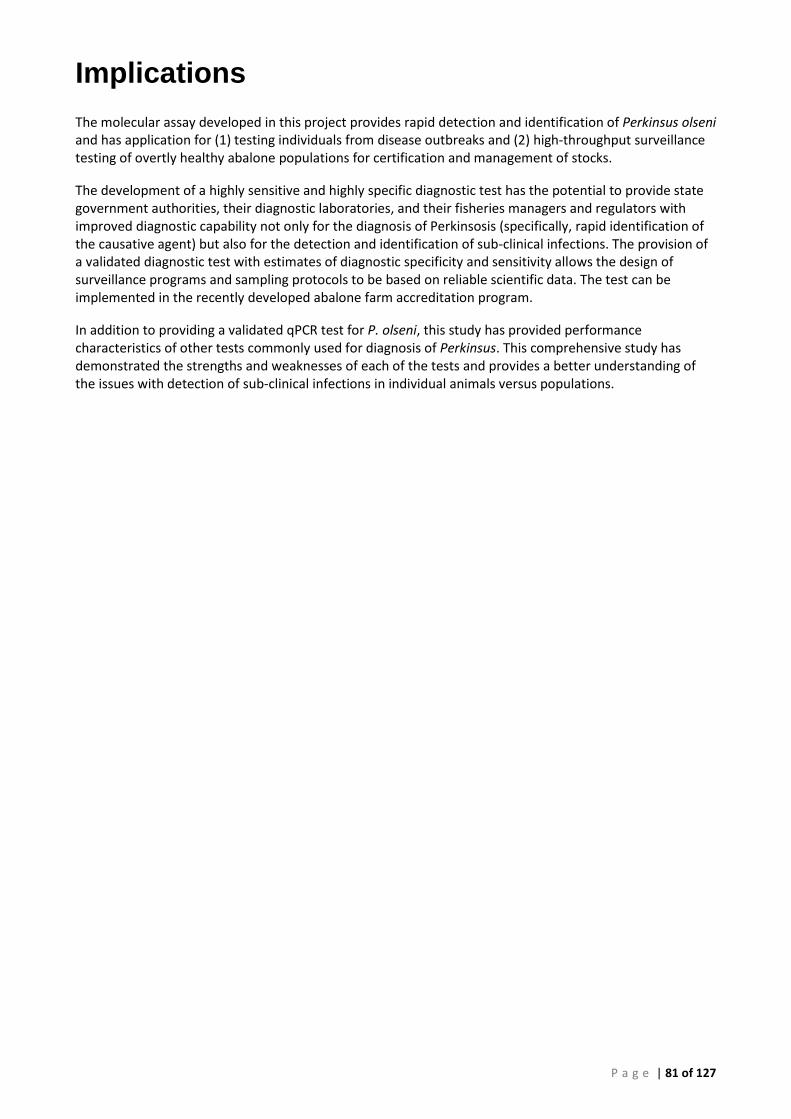
P a g e | 81 of 127
Implications
The molecular assay developed in this project provides rapid detection and identification of Perkinsus olseni and has application for (1) testing individuals from disease outbreaks and (2) high-throughput surveillance testing of overtly healthy abalone populations for certification and management of stocks.
The development of a highly sensitive and highly specific diagnostic test has the potential to provide state government authorities, their diagnostic laboratories, and their fisheries managers and regulators with improved diagnostic capability not only for the diagnosis of Perkinsosis (specifically, rapid identification of the causative agent) but also for the detection and identification of sub-clinical infections. The provision of a validated diagnostic test with estimates of diagnostic specificity and sensitivity allows the design of surveillance programs and sampling protocols to be based on reliable scientific data. The test can be implemented in the recently developed abalone farm accreditation program.
In addition to providing a validated qPCR test for P. olseni, this study has provided performance characteristics of other tests commonly used for diagnosis of Perkinsus. This comprehensive study has demonstrated the strengths and weaknesses of each of the tests and provides a better understanding of the issues with detection of sub-clinical infections in individual animals versus populations.
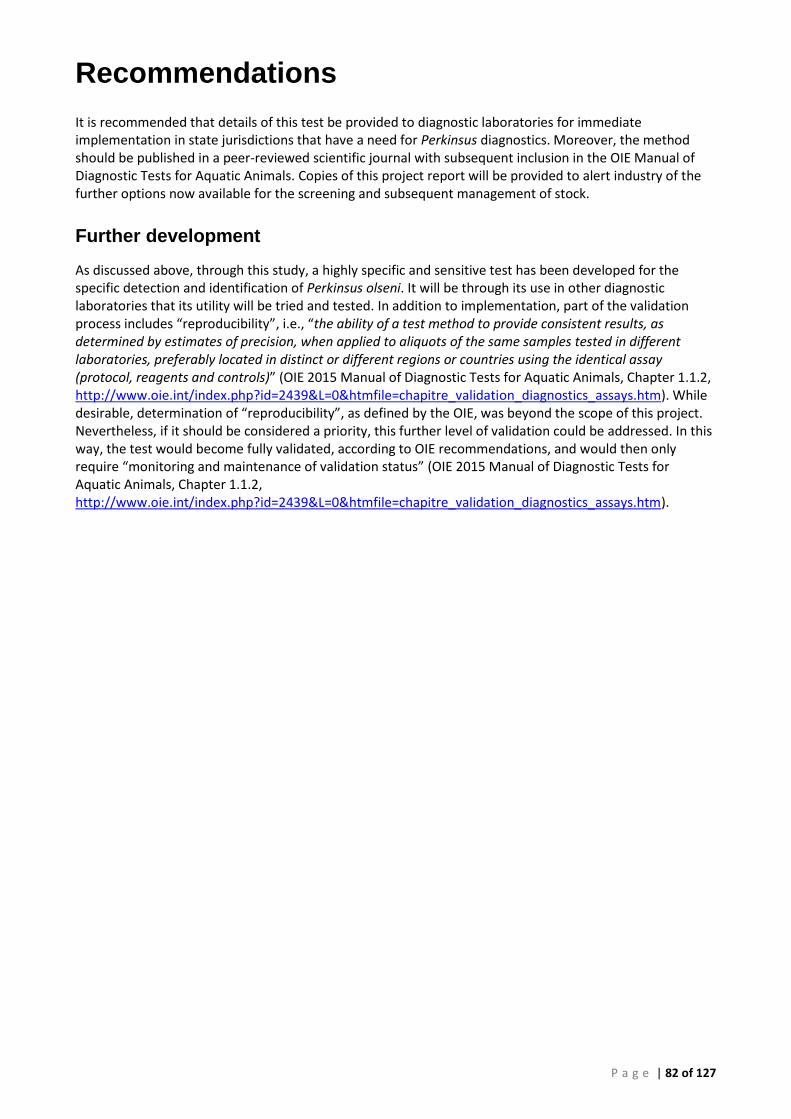
P a g e | 82 of 127
Recommendations
It is recommended that details of this test be provided to diagnostic laboratories for immediate implementation in state jurisdictions that have a need for Perkinsus diagnostics. Moreover, the method should be published in a peer-reviewed scientific journal with subsequent inclusion in the OIE Manual of Diagnostic Tests for Aquatic Animals. Copies of this project report will be provided to alert industry of the further options now available for the screening and subsequent management of stock.
Further development
As discussed above, through this study, a highly specific and sensitive test has been developed for the specific detection and identification of Perkinsus olseni. It will be through its use in other diagnostic laboratories that its utility will be tried and tested. In addition to implementation, part of the validation process includes “reproducibility”, i.e., “the ability of a test method to provide consistent results, as determined by estimates of precision, when applied to aliquots of the same samples tested in different laboratories, preferably located in distinct or different regions or countries using the identical assay (protocol, reagents and controls)” (OIE 2015 Manual of Diagnostic Tests for Aquatic Animals, Chapter 1.1.2, http://www.oie.int/index.php?id=2439&L=0&htmfile=chapitre_validation_diagnostics_assays.htm). While desirable, determination of “reproducibility”, as defined by the OIE, was beyond the scope of this project. Nevertheless, if it should be considered a priority, this further level of validation could be addressed. In this way, the test would become fully validated, according to OIE recommendations, and would then only require “monitoring and maintenance of validation status” (OIE 2015 Manual of Diagnostic Tests for Aquatic Animals, Chapter 1.1.2, http://www.oie.int/index.php?id=2439&L=0&htmfile=chapitre_validation_diagnostics_assays.htm).
P a g e | 83 of 127
Extension and Adoption
Development of the real-time PCR assay was communicated to the wider scientific community internationally and domestically through a series of three conference presentations (below).
David M. Cummins, Brian J. Jones, Mark St. J. Crane and Nicholas Gudkovs (2014) Development of a Taqman® real-time PCR assay for the detection of Perkinsus olseni in Australian abalone. 7th International Symposium on Aquatic Animal Heath, Portland, Oregon USA. 31st August - 5th September 2014
David M. Cummins, Brian J. Jones, Mark St. J. Crane and Nicholas Gudkovs (2014) Development of a Taqman® real-time PCR assay for the detection of Perkinsus olseni in Australian abalone. 10th Annual Meeting of the Australian Association of Veterinary Laboratory Diagnosticians, Adelaide, South Australia. 27th - 28th November
David M. Cummins, Nicholas Moody, Nicholas Gudkovs, Brian Jones, Mike Snow, Mark Crane (2015) A tale of two projects: The development of a Taqman® PCR assay for the detection of Perkinsus olseni & Positive control strategies to reduce the reliance on genomic material. 3rd Australasian Scientific Conference on Aquatic Animal Health, Cairns, Queensland Australia. 6th - 11th July.
The real-time assay developed as the primary focus of this project has been adopted for diagnostic screening by the CSIRO Australian Animal Health Laboratory.
The clonal culture of Perkinsus olseni 12:00978-12T from blacklip abalone at Taylor Island, near Pt Lincoln, South Australia, established during the course of the project, was accepted by the American Type Culture Collection (ATCC) as the type culture for the species. Within Australia, cultures of this isolate may be available from the CSIRO Australian Animal Health Laboratory, Geelong. This isolate will be more widely available to the scientific community through the ATCC.
P a g e | 84 of 127
Appendices
Appendix 1 - List of researchers and project staff
CSIRO Australian Animal Health Laboratory Nicholas Gudkovs David Cummins John Hoad Mark Crane Nette Williams Mark Crane Axel Colling Nagendrakumar Singanallur Ministry for Primary Industries - Manatū Ahu Matua, New Zealand Brian Jones PIRSA - South Australian Research and Development Institute Marty Deveney Ben Stobart Jay Dent
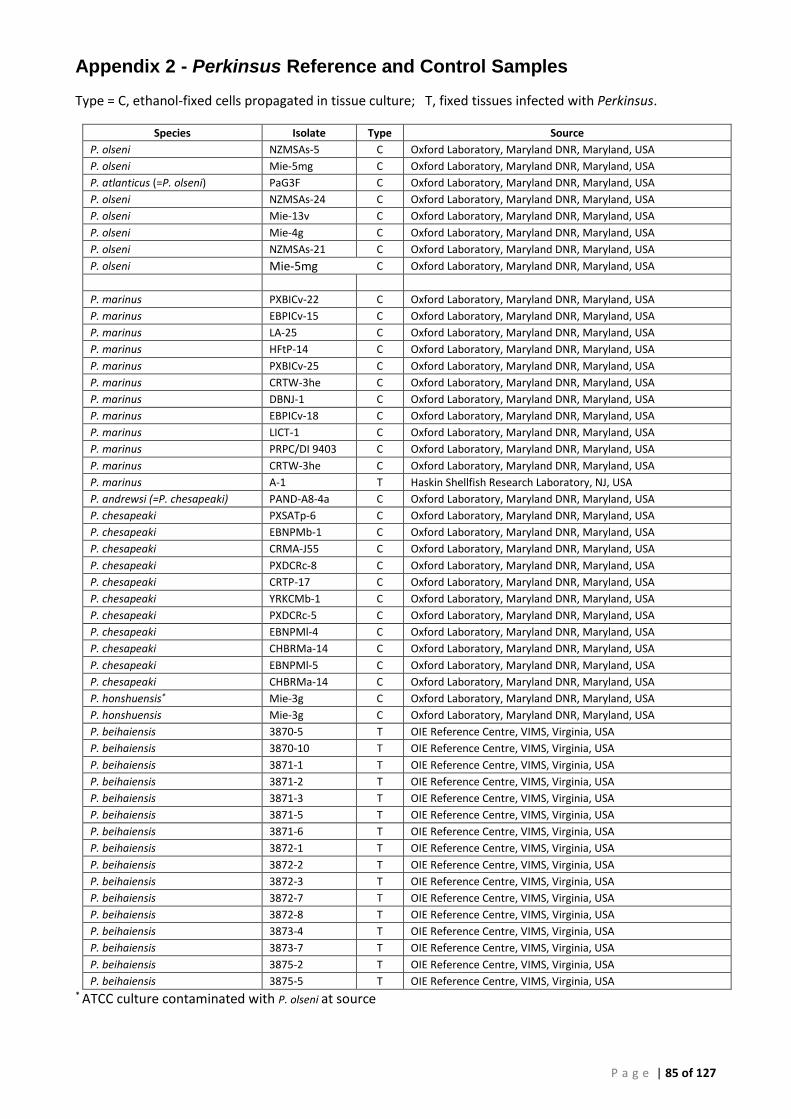
P a g e | 85 of 127
Appendix 2 - Perkinsus Reference and Control Samples
Type = C, ethanol-fixed cells propagated in tissue culture; T, fixed tissues infected with Perkinsus.
Species Isolate Type Source
P. olseni NZMSAs-5 C Oxford Laboratory, Maryland DNR, Maryland, USA
P. olseni Mie-5mg C Oxford Laboratory, Maryland DNR, Maryland, USA
P. atlanticus (=P. olseni) PaG3F C Oxford Laboratory, Maryland DNR, Maryland, USA
P. olseni NZMSAs-24 C Oxford Laboratory, Maryland DNR, Maryland, USA
P. olseni Mie-13v C Oxford Laboratory, Maryland DNR, Maryland, USA
P. olseni Mie-4g C Oxford Laboratory, Maryland DNR, Maryland, USA
P. olseni NZMSAs-21 C Oxford Laboratory, Maryland DNR, Maryland, USA
P. olseni Mie-5mg C Oxford Laboratory, Maryland DNR, Maryland, USA
P. marinus PXBICv-22 C Oxford Laboratory, Maryland DNR, Maryland, USA
P. marinus EBPICv-15 C Oxford Laboratory, Maryland DNR, Maryland, USA
P. marinus LA-25 C Oxford Laboratory, Maryland DNR, Maryland, USA
P. marinus HFtP-14 C Oxford Laboratory, Maryland DNR, Maryland, USA
P. marinus PXBICv-25 C Oxford Laboratory, Maryland DNR, Maryland, USA
P. marinus CRTW-3he C Oxford Laboratory, Maryland DNR, Maryland, USA
P. marinus DBNJ-1 C Oxford Laboratory, Maryland DNR, Maryland, USA
P. marinus EBPICv-18 C Oxford Laboratory, Maryland DNR, Maryland, USA
P. marinus LICT-1 C Oxford Laboratory, Maryland DNR, Maryland, USA
P. marinus PRPC/DI 9403 C Oxford Laboratory, Maryland DNR, Maryland, USA
P. marinus CRTW-3he C Oxford Laboratory, Maryland DNR, Maryland, USA
P. marinus A-1 T Haskin Shellfish Research Laboratory, NJ, USA
P. andrewsi (=P. chesapeaki) PAND-A8-4a C Oxford Laboratory, Maryland DNR, Maryland, USA
P. chesapeaki PXSATp-6 C Oxford Laboratory, Maryland DNR, Maryland, USA
P. chesapeaki EBNPMb-1 C Oxford Laboratory, Maryland DNR, Maryland, USA
P. chesapeaki CRMA-J55 C Oxford Laboratory, Maryland DNR, Maryland, USA
P. chesapeaki PXDCRc-8 C Oxford Laboratory, Maryland DNR, Maryland, USA
P. chesapeaki CRTP-17 C Oxford Laboratory, Maryland DNR, Maryland, USA
P. chesapeaki YRKCMb-1 C Oxford Laboratory, Maryland DNR, Maryland, USA
P. chesapeaki PXDCRc-5 C Oxford Laboratory, Maryland DNR, Maryland, USA
P. chesapeaki EBNPMl-4 C Oxford Laboratory, Maryland DNR, Maryland, USA
P. chesapeaki CHBRMa-14 C Oxford Laboratory, Maryland DNR, Maryland, USA
P. chesapeaki EBNPMl-5 C Oxford Laboratory, Maryland DNR, Maryland, USA
P. chesapeaki CHBRMa-14 C Oxford Laboratory, Maryland DNR, Maryland, USA
P. honshuensis* Mie-3g C Oxford Laboratory, Maryland DNR, Maryland, USA
P. honshuensis Mie-3g C Oxford Laboratory, Maryland DNR, Maryland, USA
P. beihaiensis 3870-5 T OIE Reference Centre, VIMS, Virginia, USA
P. beihaiensis 3870-10 T OIE Reference Centre, VIMS, Virginia, USA
P. beihaiensis 3871-1 T OIE Reference Centre, VIMS, Virginia, USA
P. beihaiensis 3871-2 T OIE Reference Centre, VIMS, Virginia, USA
P. beihaiensis 3871-3 T OIE Reference Centre, VIMS, Virginia, USA
P. beihaiensis 3871-5 T OIE Reference Centre, VIMS, Virginia, USA
P. beihaiensis 3871-6 T OIE Reference Centre, VIMS, Virginia, USA
P. beihaiensis 3872-1 T OIE Reference Centre, VIMS, Virginia, USA
P. beihaiensis 3872-2 T OIE Reference Centre, VIMS, Virginia, USA
P. beihaiensis 3872-3 T OIE Reference Centre, VIMS, Virginia, USA
P. beihaiensis 3872-7 T OIE Reference Centre, VIMS, Virginia, USA
P. beihaiensis 3872-8 T OIE Reference Centre, VIMS, Virginia, USA
P. beihaiensis 3873-4 T OIE Reference Centre, VIMS, Virginia, USA
P. beihaiensis 3873-7 T OIE Reference Centre, VIMS, Virginia, USA
P. beihaiensis 3875-2 T OIE Reference Centre, VIMS, Virginia, USA
P. beihaiensis 3875-5 T OIE Reference Centre, VIMS, Virginia, USA * ATCC culture contaminated with P. olseni at source
P a g e | 86 of 127
Appendix 3 – PCR Methods
Conventional PCR (cPCR)
All conventional PCR amplification (cPCR) was carried out in a standard volume of 25 l where DNA
template was added as a 2 l volume to 23 l of mastermix. Thermal cycling was carried out in 0.2 ml Eppendorf PCR tubes (8-TUBE STRIP PCR CLEAN THIN WALL PK/120 STRIPS Order No. 0030 124.359).
Mastermix was based on HotStarTaq Master Mix (Qiagen, Cat. No. 203445). All primers for cPCR were
synthesised by Geneworks. PCR primers were stored frozen at a working stock concentration of 18M.
Thermal cycling was carried out in the Eppendorf MasterCycler EP using fast ramp rates for all reactions.
Gel electrophoresis was performed in 1.5% (w/v) TAE (Promega) gels at 90V according to standard methods. PCR bands were visualised using SYBR Safe DNA Gel Stain (Invitrogen, Cat. No. 33102) and a Safe Imager™ 2.0 Blue Light Transilluminator with a 100bp DNA Ladder (Promega Cat. No. G2101 and Invitrogen Cat. No. 15628) as standard.
Real-Time (qPCR)
All real-time PCR (qPCR) testing was undertaken in a standard volume of 25 l in Fast Optical 96-well Reaction plates (Applied Biosystems Cat. No. 4346906), sealed with MicroAmp Optical Adhesive film
(Applied Biosystems Cat. No. 4311971). DNA template was added as a 2 l volume.
Master Mix was based on Taqman® Universal PCR Master Mix (Applied Biosystems Cat. No. 4304437)
All primers and probes used for qPCR were synthesised and HPLC purified by Life Technologies. PCR primers
were stored frozen at a working stock concentration of 18M, yielding a final concentration of 0.9M (22.5
pmol per reaction). The MGB Taqman® probe was prepared as a 5M working stock, yielding a final
concentration of 0.25M (6.25 pmol per reaction).
Real-time amplification was performed using Applied Biosystems® 7500 Real-Time PCR Systems.
Plasmid Preparation and Use
Plasmid controls were developed for P. olseni (NZMSAs-5, ATCC PRA-204), P. marinus (LA-25, ATCC 50775), P. honshuensis (Mie-3g, ATCC PRA-176) and P. chesapeaki (CRTP-17, ATCC 50865) using a pPCR2.1-TOPO vector with methods supplied by the manufacturer (TOPO® TA Cloning® Kit with PCR®2.1 TOPO® Invitrogen Cat: K4500-01). Briefly, genomic DNA for each of the Perkinsus isolates were PCR amplified using the OIE 85/750 genus-specific primers. Amplicons were gel purified (QIAgen gel purification kit) and cloned into the pCR®II-TOPO TA vector (Invitrogen). Purified plasmids were isolated and sequenced confirmed.
To establish analytical sensitivity (ASe) plasmid stock solutions were quantified using the Qubit® 2.0
Fluorometer (Invitrogen Cat. No. Q32866), with subsequent plasmid dilutions prepared using 50 ng/l of yeast tRNA carrier (Invitrogen Cat. No. 15401-029) in 10 mM TE buffer diluent. The P. olseni control plasmid was also serially diluted as above in abalone host gDNA at 50 ng/µl.
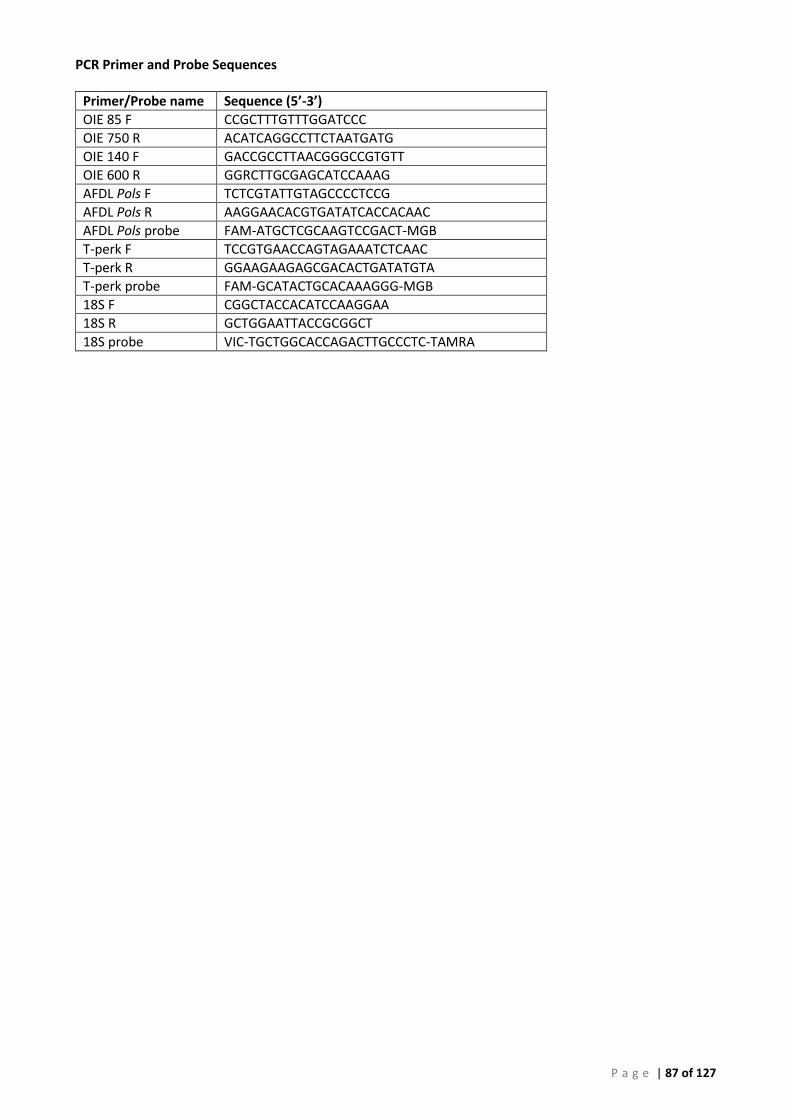
P a g e | 87 of 127
PCR Primer and Probe Sequences
Primer/Probe name Sequence (5’-3’)
OIE 85 F CCGCTTTGTTTGGATCCC
OIE 750 R ACATCAGGCCTTCTAATGATG
OIE 140 F GACCGCCTTAACGGGCCGTGTT
OIE 600 R GGRCTTGCGAGCATCCAAAG
AFDL Pols F TCTCGTATTGTAGCCCCTCCG
AFDL Pols R AAGGAACACGTGATATCACCACAAC
AFDL Pols probe FAM-ATGCTCGCAAGTCCGACT-MGB
T-perk F TCCGTGAACCAGTAGAAATCTCAAC
T-perk R GGAAGAAGAGCGACACTGATATGTA
T-perk probe FAM-GCATACTGCACAAAGGG-MGB
18S F CGGCTACCACATCCAAGGAA
18S R GCTGGAATTACCGCGGCT
18S probe VIC-TGCTGGCACCAGACTTGCCCTC-TAMRA

P a g e | 88 of 127
OIE 140/600 Conventional PCR for Perkinsus olseni (P. olseni ITS rRNA PCR)
Master Mix
Perkinsus olseni ITS rRNA gene PCR – 450 bp amplicon
Reagent Volume for 1 rxn
9.5 l Water
HotStarTaq Master Mix 12.5 l
Primer name: PolsITS 140F (18µM) 0.5 l
Primer Name: PolsITS 600R (18µM) 0.5 l
Total volume 23 l
Thermal Cycling Conditions
Cycles Conditions
1 95C for 5 minutes
40 95C for 60 seconds
64C for 60 seconds 72C for 2 min
1 72C for 5 min
Hold 4C
Primer sequences:
Primer Sequence
PolsITS-140 5’-GAC-CGC-CTT-AAC-GGG-CCG-TGT-T-3’
PolsITS-600 5’-GGR-CTT-GCG-AGC-ATC-CAA-AG-3’
References
OIE, 2014 Manual of Diagnostic Tests for Aquatic Animals. Chapter 2.4.7 Infection with Perkinsus olseni. [http://www.oie.int/index.php?id=2439&L=0&htmfile=chapitre_Perkinsus_olseni.htm]
Audemard C, Reece KS, Burreson EM. 2004. Real-time PCR for the detection and quantification of the protistan parasite Perkinsus marinus in environmental waters. Appl. Environ. Microbiol. 70: 6611–6618.

P a g e | 89 of 127
OIE 85/750 Conventional PCR for Perkinsus sp. (Perkinsus sp. ITS rRNA PCR)
Master Mix
Perkinsus sp. ITS rRNA gene PCR – 703 bp amplicon
Reagent Volume for 1 rxn
Water 9.5 l
HotStarTaq Master Mix 12.5 l
Primer name: PerkITS 85F (18µM) 0.5 l
Primer Name: PerkITS 750R (18µM) 0.5 l
Total volume 23 l
Thermal Cycling Conditions
Cycles Conditions
1 95C for 5 minutes
40 95C for 30 seconds
58C for 30 seconds 72C for 60 seconds
1 72C for 5 minutes
Hold 4C
Primer sequences:
Primer Sequence
PerkITS-85 5’- CCG CTT TGT TTG GAT CCC -3’
PerkITS-750 5’- ACA TCA GGC CTT CTA ATG ATG -3’
References
OIE Manual of Diagnostic Tests for Aquatic Animals, 2014. Chapter 2.4.7 Infection with Perkinsus olseni. [http://www.oie.int/index.php?id=2439&L=0&htmfile=chapitre_Perkinsus_olseni.htm]
Audemard C, Reece KS, Burreson EM. 2004. Real-time PCR for the detection and quantification of the protistan parasite Perkinsus marinus in environmental waters. Appl. Environ. Microbiol. 70: 6611–6618.
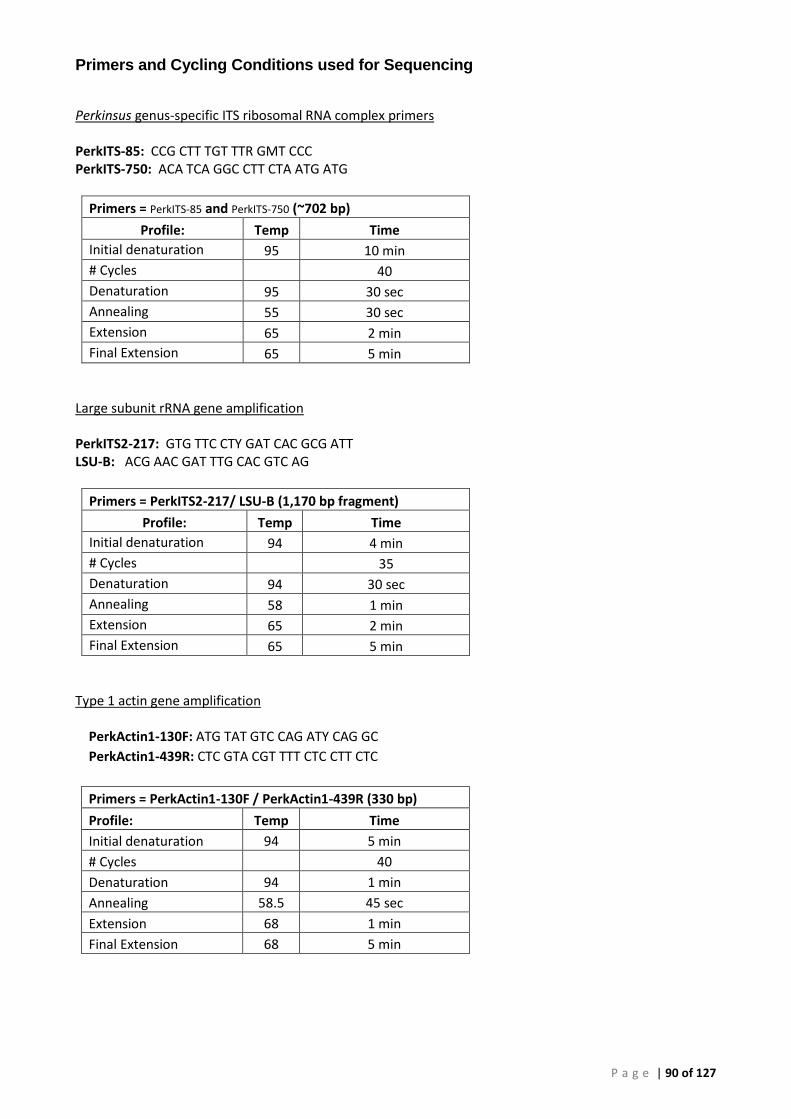
P a g e | 90 of 127
Primers and Cycling Conditions used for Sequencing
Perkinsus genus-specific ITS ribosomal RNA complex primers PerkITS-85: CCG CTT TGT TTR GMT CCC PerkITS-750: ACA TCA GGC CTT CTA ATG ATG
Primers = PerkITS-85 and PerkITS-750 (~702 bp)
Profile: Temp Time
Initial denaturation 95 10 min
# Cycles 40
Denaturation 95 30 sec
Annealing 55 30 sec
Extension 65 2 min
Final Extension 65 5 min
Large subunit rRNA gene amplification PerkITS2-217: GTG TTC CTY GAT CAC GCG ATT LSU-B: ACG AAC GAT TTG CAC GTC AG
Primers = PerkITS2-217/ LSU-B (1,170 bp fragment)
Profile: Temp Time
Initial denaturation 94 4 min
# Cycles 35
Denaturation 94 30 sec
Annealing 58 1 min
Extension 65 2 min
Final Extension 65 5 min
Type 1 actin gene amplification
PerkActin1-130F: ATG TAT GTC CAG ATY CAG GC
PerkActin1-439R: CTC GTA CGT TTT CTC CTT CTC
Primers = PerkActin1-130F / PerkActin1-439R (330 bp)
Profile: Temp Time
Initial denaturation 94 5 min
# Cycles 40
Denaturation 94 1 min
Annealing 58.5 45 sec
Extension 68 1 min
Final Extension 68 5 min
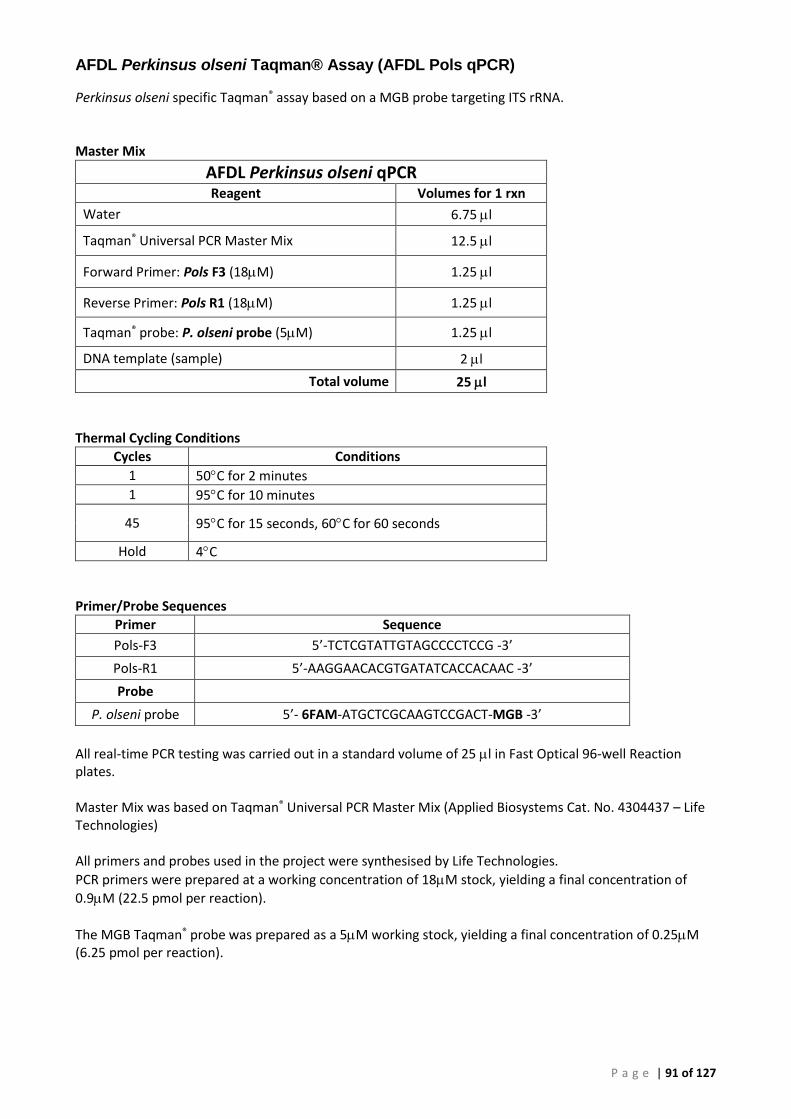
P a g e | 91 of 127
AFDL Perkinsus olseni Taqman® Assay (AFDL Pols qPCR)
Perkinsus olseni specific Taqman® assay based on a MGB probe targeting ITS rRNA. Master Mix
AFDL Perkinsus olseni qPCR Reagent Volumes for 1 rxn
Water 6.75 l
Taqman® Universal PCR Master Mix 12.5 l
Forward Primer: Pols F3 (18M) 1.25 l
Reverse Primer: Pols R1 (18M) 1.25 l
Taqman® probe: P. olseni probe (5M) 1.25 l
DNA template (sample) 2 l
Total volume 25 l
Thermal Cycling Conditions
Cycles Conditions
1 50C for 2 minutes
1 95C for 10 minutes
45 95C for 15 seconds, 60C for 60 seconds
Hold 4C
Primer/Probe Sequences
Primer Sequence
Pols-F3 5’-TCTCGTATTGTAGCCCCTCCG -3’
Pols-R1 5’-AAGGAACACGTGATATCACCACAAC -3’
Probe
P. olseni probe 5’- 6FAM-ATGCTCGCAAGTCCGACT-MGB -3’
All real-time PCR testing was carried out in a standard volume of 25 l in Fast Optical 96-well Reaction plates. Master Mix was based on Taqman® Universal PCR Master Mix (Applied Biosystems Cat. No. 4304437 – Life Technologies) All primers and probes used in the project were synthesised by Life Technologies.
PCR primers were prepared at a working concentration of 18M stock, yielding a final concentration of
0.9M (22.5 pmol per reaction).
The MGB Taqman® probe was prepared as a 5M working stock, yielding a final concentration of 0.25M (6.25 pmol per reaction).
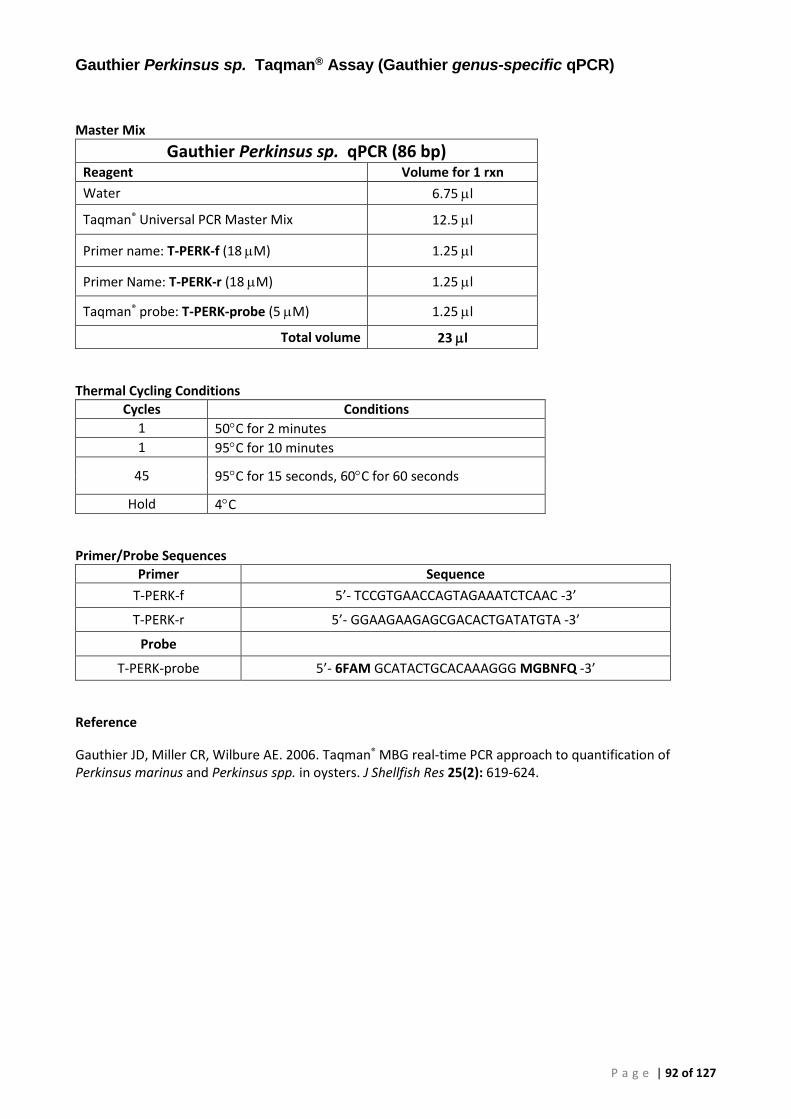
P a g e | 92 of 127
Gauthier Perkinsus sp. Taqman® Assay (Gauthier genus-specific qPCR)
Master Mix
Gauthier Perkinsus sp. qPCR (86 bp) Reagent Volume for 1 rxn
Water 6.75 l
Taqman® Universal PCR Master Mix 12.5 l
Primer name: T-PERK-f (18 M) 1.25 l
Primer Name: T-PERK-r (18 M) 1.25 l
Taqman® probe: T-PERK-probe (5 M) 1.25 l
Total volume 23 l
Thermal Cycling Conditions
Cycles Conditions
1 50C for 2 minutes
1 95C for 10 minutes
45 95C for 15 seconds, 60C for 60 seconds
Hold 4C
Primer/Probe Sequences
Primer Sequence
T-PERK-f 5’- TCCGTGAACCAGTAGAAATCTCAAC -3’
T-PERK-r 5’- GGAAGAAGAGCGACACTGATATGTA -3’
Probe
T-PERK-probe 5’- 6FAM GCATACTGCACAAAGGG MGBNFQ -3’
Reference
Gauthier JD, Miller CR, Wilbure AE. 2006. Taqman® MBG real-time PCR approach to quantification of Perkinsus marinus and Perkinsus spp. in oysters. J Shellfish Res 25(2): 619-624.
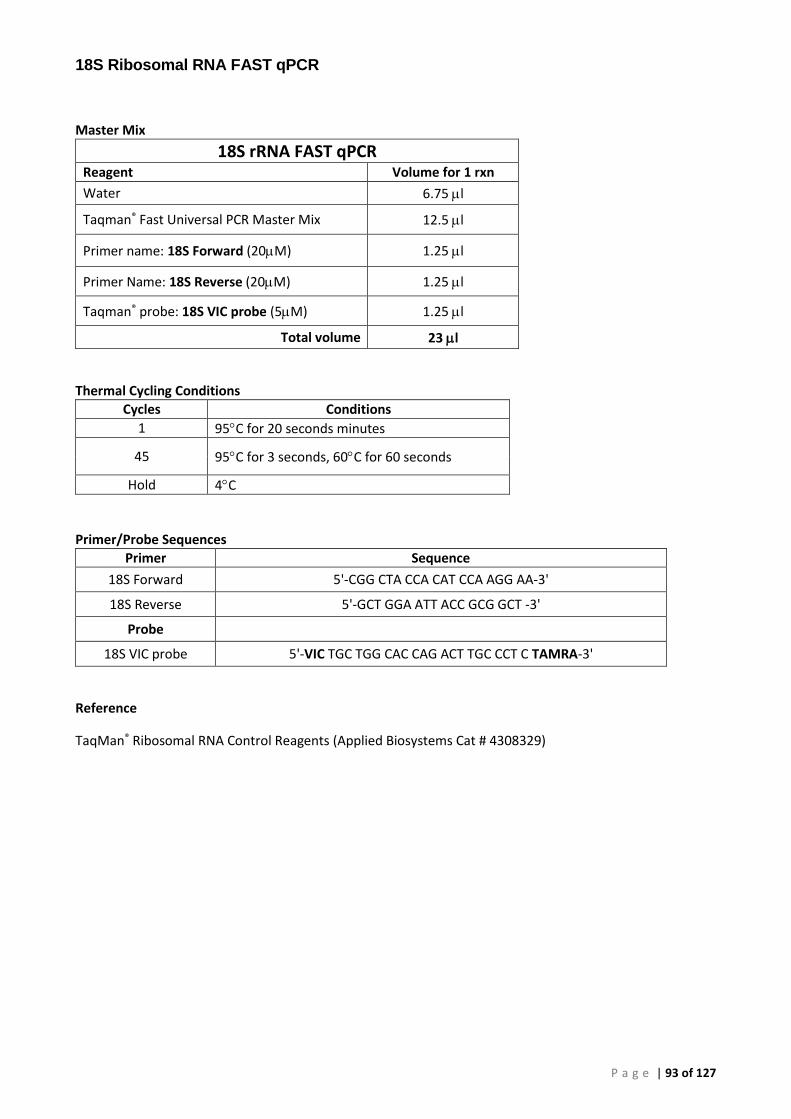
P a g e | 93 of 127
18S Ribosomal RNA FAST qPCR
Master Mix
18S rRNA FAST qPCR Reagent Volume for 1 rxn
Water 6.75 l
Taqman® Fast Universal PCR Master Mix 12.5 l
Primer name: 18S Forward (20M) 1.25 l
Primer Name: 18S Reverse (20M) 1.25 l
Taqman® probe: 18S VIC probe (5M) 1.25 l
Total volume 23 l
Thermal Cycling Conditions
Cycles Conditions
1 95C for 20 seconds minutes
45 95C for 3 seconds, 60C for 60 seconds
Hold 4C
Primer/Probe Sequences
Primer Sequence
18S Forward 5'-CGG CTA CCA CAT CCA AGG AA-3'
18S Reverse 5'-GCT GGA ATT ACC GCG GCT -3'
Probe
18S VIC probe 5'-VIC TGC TGG CAC CAG ACT TGC CCT C TAMRA-3'
Reference
TaqMan® Ribosomal RNA Control Reagents (Applied Biosystems Cat # 4308329)

P a g e | 94 of 127
Appendix 4 - Dissection Guide for Abalone
Mollusc tissues degenerate quickly. Dissected tissues for molecular analysis or histology should be taken quickly and placed directly into fixative. Dense tissues such as the foot muscle, should be thinly sliced (no more than 2mm) to allow proper fixation.
Remove the body mass from the shell by carefully sliding the mantle and epipodial fringe aside and cutting through the adductor muscle close to the contour of the shell. Place body ventral surface down with the anterior end uppermost (normal orientation).
Cut 1: Longitudinal section of head and mouth. Cut a transverse section across the whole body between 1 and 3 cm (depending on the size of the animal) posterior to the level of the mouth. With a longitudinal cut at the mid-line, divide the small anterior section into 2 equal pieces. Cut a 2mm slice from the exposed longitudinal surface for histology. This tissue can be trimmed to fit an embedding cassette, but should include the anterior tissues (buccal cavity, radula and surrounding odontophore muscle).
Cut 2: Transverse section of gills and mantle. The gills are visible on the left side of the body. About half way down the gills, make a transverse cut about 1cm through the gills and adjoining tissue. Cut a 2mm slice from the exposed surface, taking a section of gills and mantle.
Cut 3: Transverse section of digestive gland and stomach. About one third down from the TS of gill, make a transverse cut through the digestive gland and stomach (this may include some gonad). Again, cut a 1cm X 2mm slice from the exposed tissue surface, taking a section of digestive gland and surrounding tissue.
Cut 4: Section of muscle. Take a 2mm slice of muscle from the lateral margin of the foot. In order to inspect the foot, transverse cuts should be made through the entire foot muscle across the dorsal surface to expose encysted parasites or gross lesions in the muscle. The tissues from Cuts 1 and 2 may be arranged in one cassette, with the remaining tissues from Cuts 3 and 4 in a second. Additional cassettes should be used for other gross lesions.
Gross lesions Gross lesions or unusual structures should be excised, sliced thinly and fixed whole or cut into an embedding cassette.
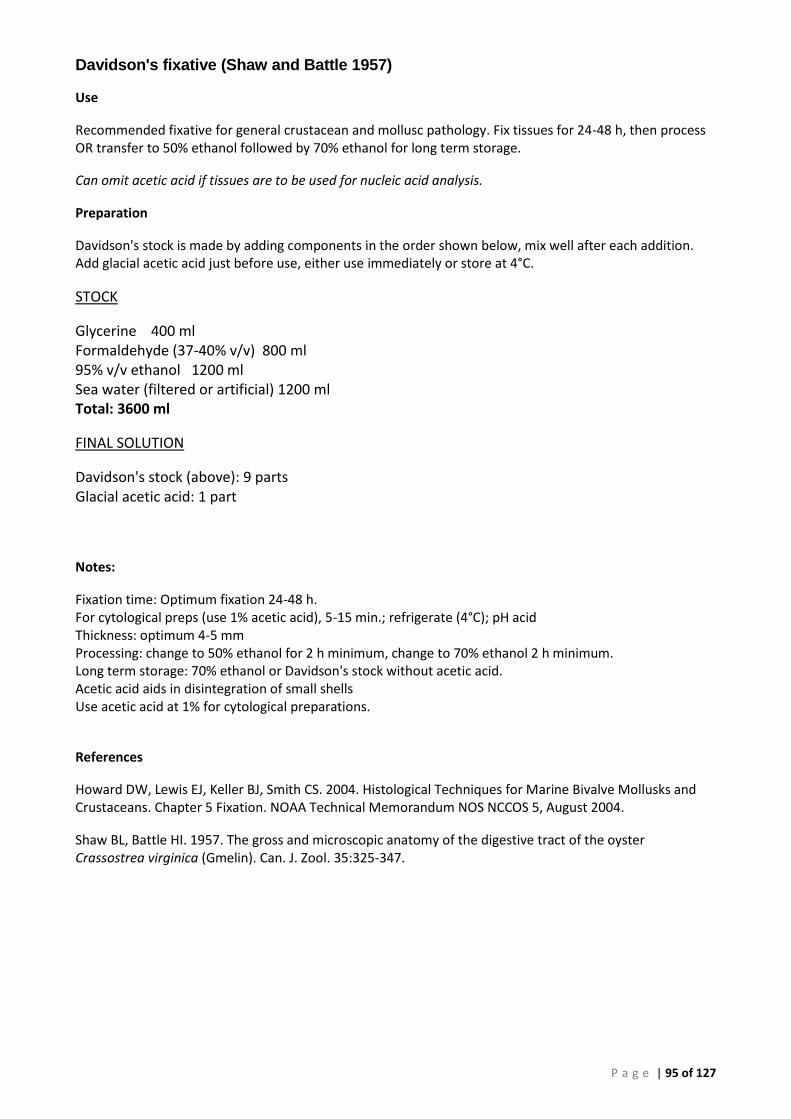
P a g e | 95 of 127
Davidson's fixative (Shaw and Battle 1957)
Use
Recommended fixative for general crustacean and mollusc pathology. Fix tissues for 24-48 h, then process OR transfer to 50% ethanol followed by 70% ethanol for long term storage.
Can omit acetic acid if tissues are to be used for nucleic acid analysis.
Preparation
Davidson's stock is made by adding components in the order shown below, mix well after each addition. Add glacial acetic acid just before use, either use immediately or store at 4°C.
STOCK
Glycerine 400 ml Formaldehyde (37-40% v/v) 800 ml 95% v/v ethanol 1200 ml Sea water (filtered or artificial) 1200 ml Total: 3600 ml
FINAL SOLUTION
Davidson's stock (above): 9 parts Glacial acetic acid: 1 part
Notes:
Fixation time: Optimum fixation 24-48 h. For cytological preps (use 1% acetic acid), 5-15 min.; refrigerate (4°C); pH acid Thickness: optimum 4-5 mm Processing: change to 50% ethanol for 2 h minimum, change to 70% ethanol 2 h minimum. Long term storage: 70% ethanol or Davidson's stock without acetic acid. Acetic acid aids in disintegration of small shells Use acetic acid at 1% for cytological preparations.
References
Howard DW, Lewis EJ, Keller BJ, Smith CS. 2004. Histological Techniques for Marine Bivalve Mollusks and Crustaceans. Chapter 5 Fixation. NOAA Technical Memorandum NOS NCCOS 5, August 2004.
Shaw BL, Battle HI. 1957. The gross and microscopic anatomy of the digestive tract of the oyster Crassostrea virginica (Gmelin). Can. J. Zool. 35:325-347.
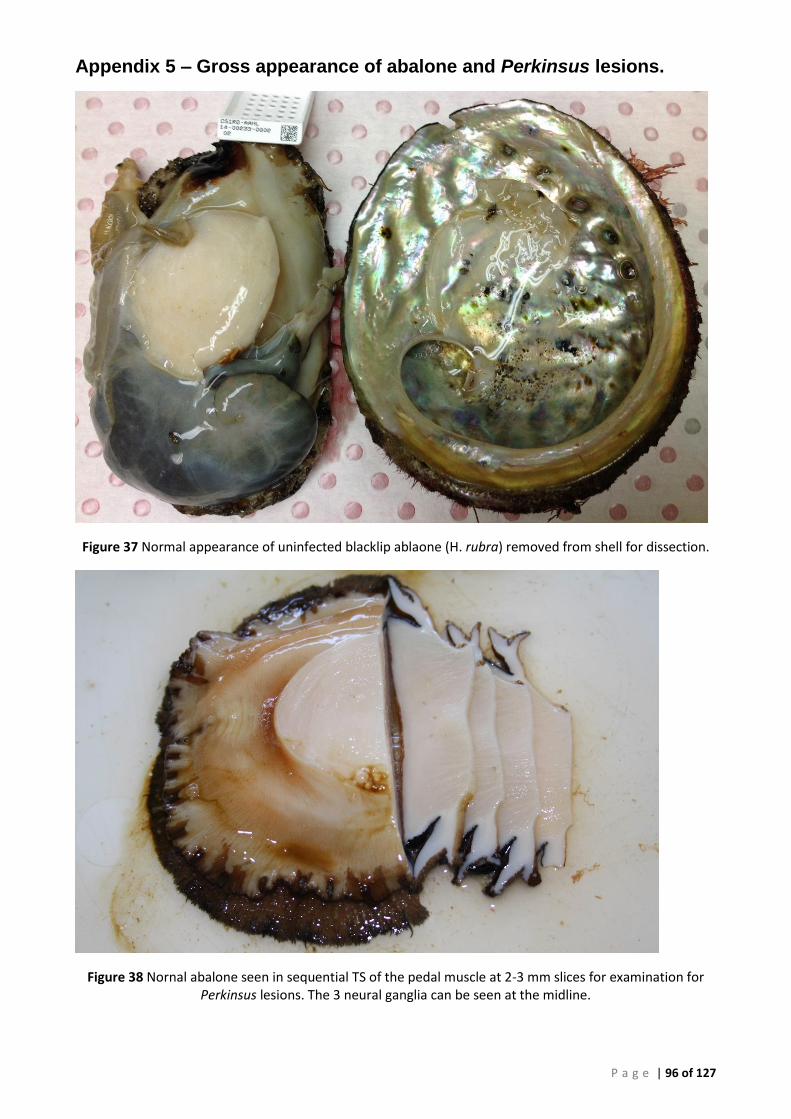
P a g e | 96 of 127
Appendix 5 – Gross appearance of abalone and Perkinsus lesions.
Figure 37 Normal appearance of uninfected blacklip ablaone (H. rubra) removed from shell for dissection.
Figure 38 Nornal abalone seen in sequential TS of the pedal muscle at 2-3 mm slices for examination for Perkinsus lesions. The 3 neural ganglia can be seen at the midline.
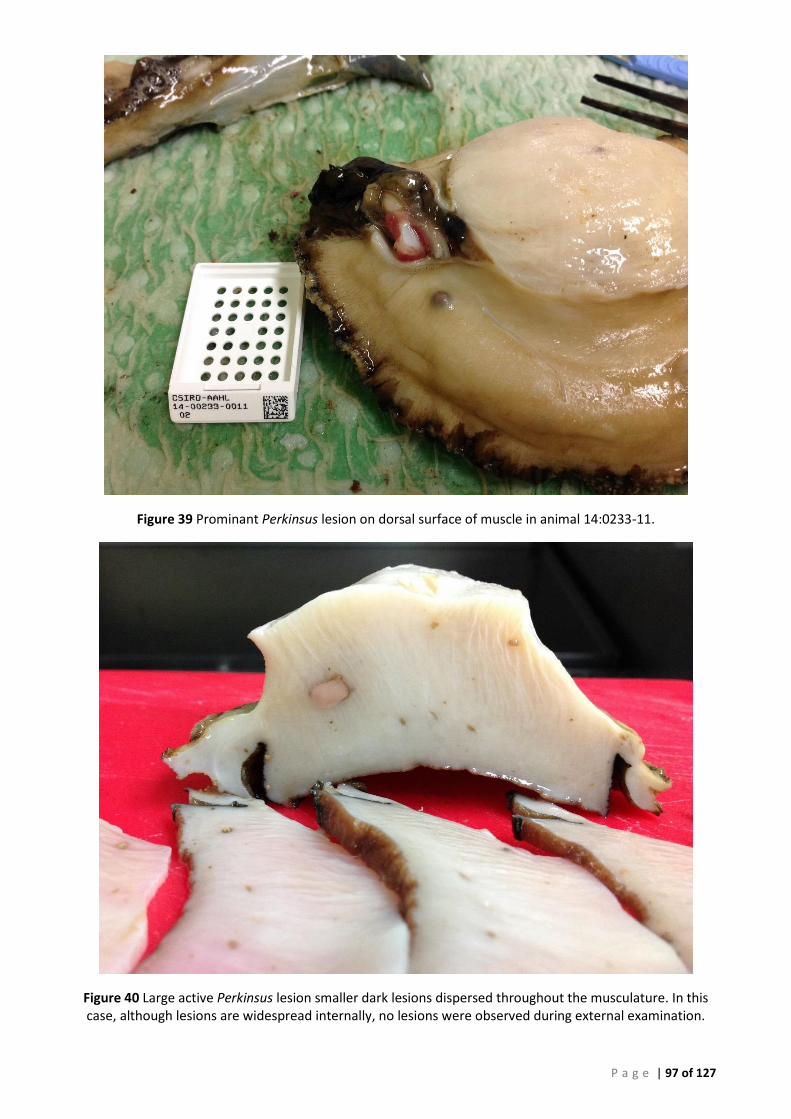
P a g e | 97 of 127
Figure 39 Prominant Perkinsus lesion on dorsal surface of muscle in animal 14:0233-11.
Figure 40 Large active Perkinsus lesion smaller dark lesions dispersed throughout the musculature. In this case, although lesions are widespread internally, no lesions were observed during external examination.
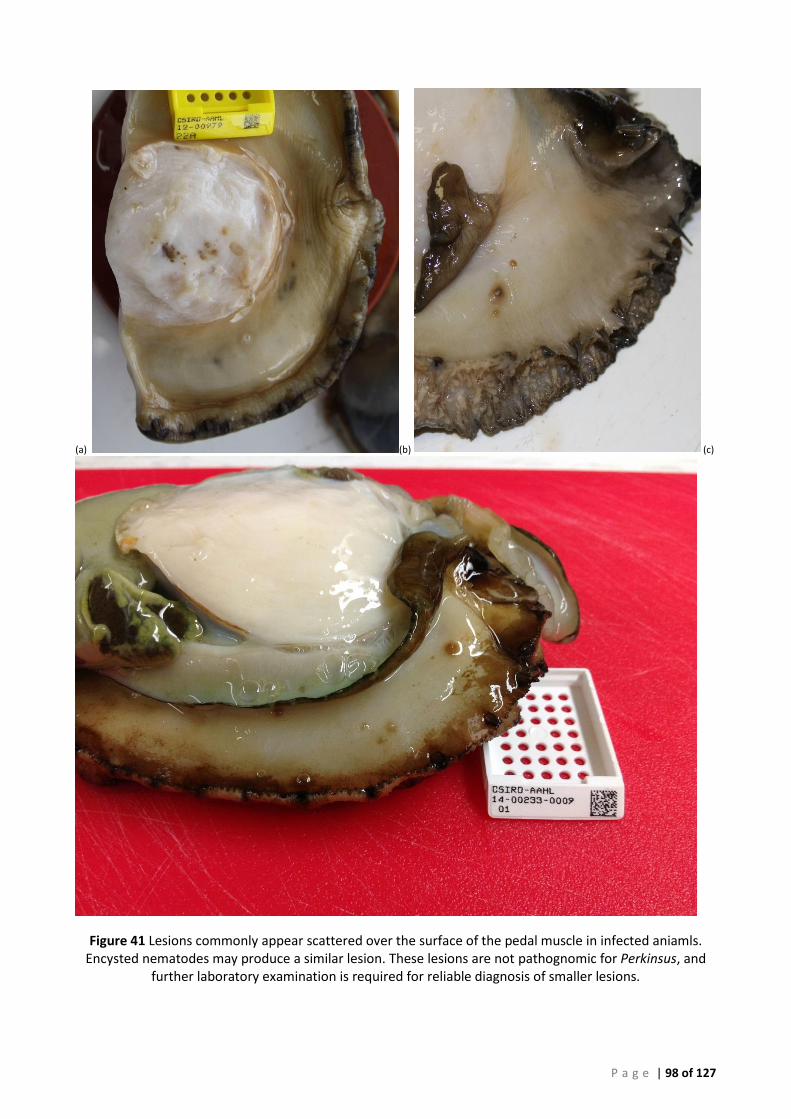
P a g e | 98 of 127
(a) (b) (c)
Figure 41 Lesions commonly appear scattered over the surface of the pedal muscle in infected aniamls. Encysted nematodes may produce a similar lesion. These lesions are not pathognomic for Perkinsus, and
further laboratory examination is required for reliable diagnosis of smaller lesions.
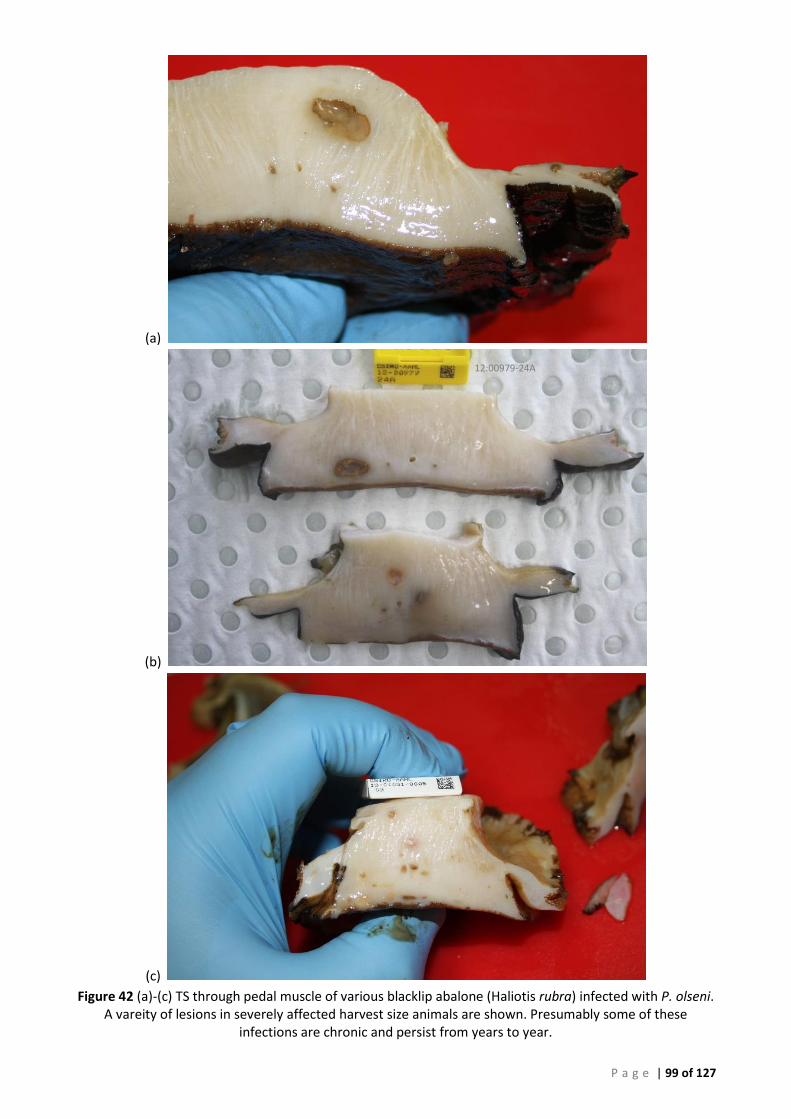
P a g e | 99 of 127
(a)
(b)
(c)
Figure 42 (a)-(c) TS through pedal muscle of various blacklip abalone (Haliotis rubra) infected with P. olseni. A vareity of lesions in severely affected harvest size animals are shown. Presumably some of these
infections are chronic and persist from years to year.
12:00979-24A
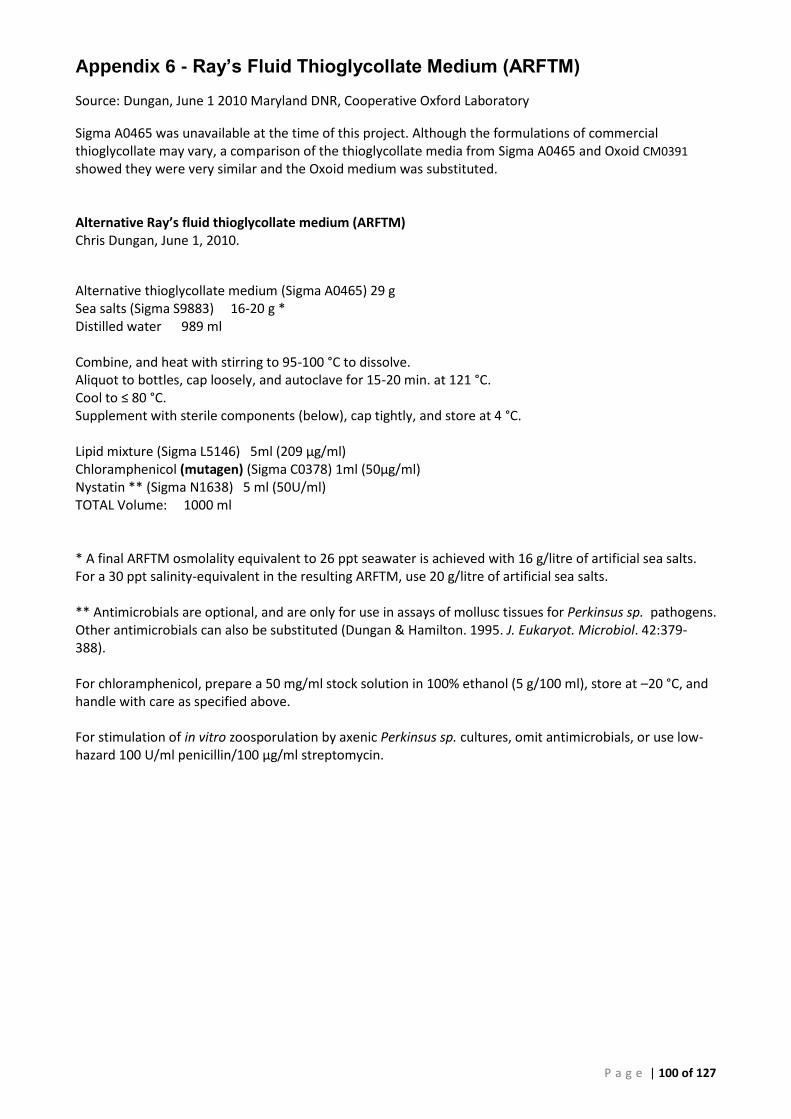
P a g e | 100 of 127
Appendix 6 - Ray’s Fluid Thioglycollate Medium (ARFTM)
Source: Dungan, June 1 2010 Maryland DNR, Cooperative Oxford Laboratory
Sigma A0465 was unavailable at the time of this project. Although the formulations of commercial thioglycollate may vary, a comparison of the thioglycollate media from Sigma A0465 and Oxoid CM0391
showed they were very similar and the Oxoid medium was substituted. Alternative Ray’s fluid thioglycollate medium (ARFTM) Chris Dungan, June 1, 2010.
Alternative thioglycollate medium (Sigma A0465) 29 g Sea salts (Sigma S9883) 16-20 g * Distilled water 989 ml Combine, and heat with stirring to 95-100 °C to dissolve. Aliquot to bottles, cap loosely, and autoclave for 15-20 min. at 121 °C. Cool to ≤ 80 °C. Supplement with sterile components (below), cap tightly, and store at 4 °C. Lipid mixture (Sigma L5146) 5ml (209 µg/ml) Chloramphenicol (mutagen) (Sigma C0378) 1ml (50µg/ml) Nystatin ** (Sigma N1638) 5 ml (50U/ml) TOTAL Volume: 1000 ml * A final ARFTM osmolality equivalent to 26 ppt seawater is achieved with 16 g/litre of artificial sea salts. For a 30 ppt salinity-equivalent in the resulting ARFTM, use 20 g/litre of artificial sea salts. ** Antimicrobials are optional, and are only for use in assays of mollusc tissues for Perkinsus sp. pathogens. Other antimicrobials can also be substituted (Dungan & Hamilton. 1995. J. Eukaryot. Microbiol. 42:379-388). For chloramphenicol, prepare a 50 mg/ml stock solution in 100% ethanol (5 g/100 ml), store at –20 °C, and handle with care as specified above. For stimulation of in vitro zoosporulation by axenic Perkinsus sp. cultures, omit antimicrobials, or use low-hazard 100 U/ml penicillin/100 µg/ml streptomycin.
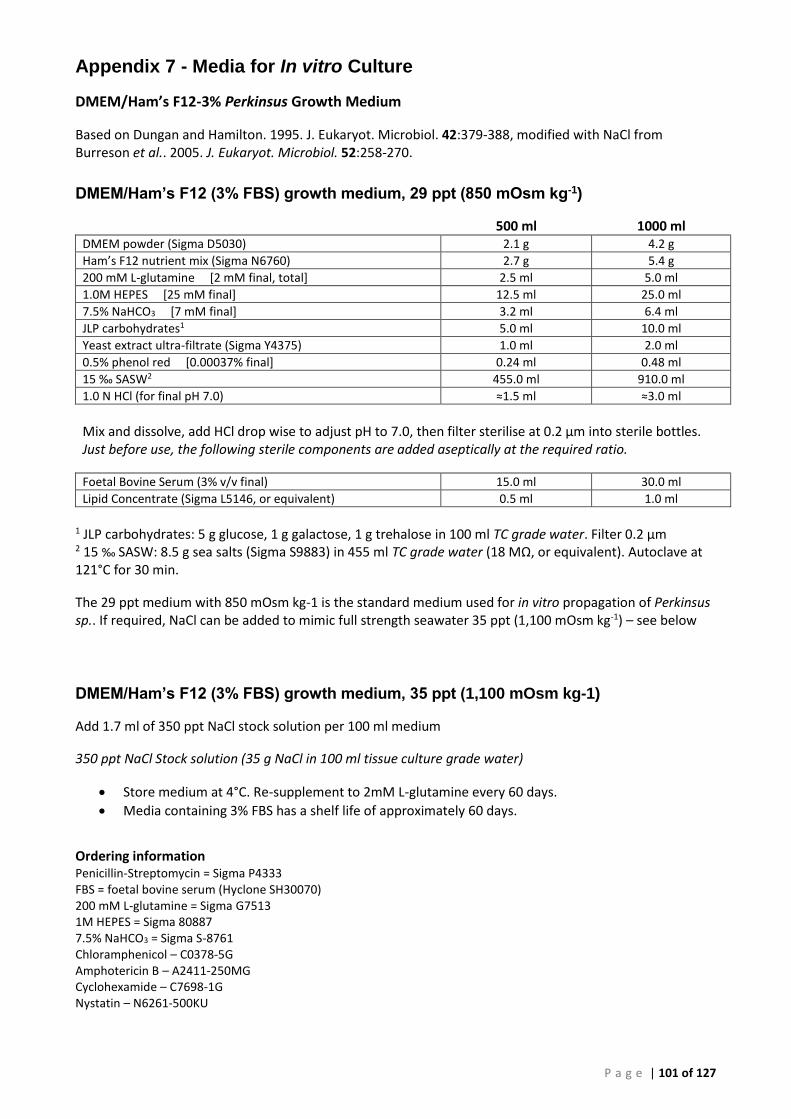
P a g e | 101 of 127
Appendix 7 - Media for In vitro Culture
DMEM/Ham’s F12-3% Perkinsus Growth Medium
Based on Dungan and Hamilton. 1995. J. Eukaryot. Microbiol. 42:379-388, modified with NaCl from Burreson et al.. 2005. J. Eukaryot. Microbiol. 52:258-270.
DMEM/Ham’s F12 (3% FBS) growth medium, 29 ppt (850 mOsm kg-1)
500 ml 1000 ml DMEM powder (Sigma D5030) 2.1 g 4.2 g
Ham’s F12 nutrient mix (Sigma N6760) 2.7 g 5.4 g
200 mM L-glutamine [2 mM final, total] 2.5 ml 5.0 ml
1.0M HEPES [25 mM final] 12.5 ml 25.0 ml
7.5% NaHCO3 [7 mM final] 3.2 ml 6.4 ml
JLP carbohydrates1 5.0 ml 10.0 ml
Yeast extract ultra-filtrate (Sigma Y4375) 1.0 ml 2.0 ml
0.5% phenol red [0.00037% final] 0.24 ml 0.48 ml
15 ‰ SASW2 455.0 ml 910.0 ml
1.0 N HCl (for final pH 7.0) ≈1.5 ml ≈3.0 ml
Mix and dissolve, add HCl drop wise to adjust pH to 7.0, then filter sterilise at 0.2 µm into sterile bottles. Just before use, the following sterile components are added aseptically at the required ratio.
Foetal Bovine Serum (3% v/v final) 15.0 ml 30.0 ml
Lipid Concentrate (Sigma L5146, or equivalent) 0.5 ml 1.0 ml
1 JLP carbohydrates: 5 g glucose, 1 g galactose, 1 g trehalose in 100 ml TC grade water. Filter 0.2 µm 2 15 ‰ SASW: 8.5 g sea salts (Sigma S9883) in 455 ml TC grade water (18 MΩ, or equivalent). Autoclave at 121°C for 30 min.
The 29 ppt medium with 850 mOsm kg-1 is the standard medium used for in vitro propagation of Perkinsus sp.. If required, NaCl can be added to mimic full strength seawater 35 ppt (1,100 mOsm kg-1) – see below
DMEM/Ham’s F12 (3% FBS) growth medium, 35 ppt (1,100 mOsm kg-1)
Add 1.7 ml of 350 ppt NaCl stock solution per 100 ml medium
350 ppt NaCl Stock solution (35 g NaCl in 100 ml tissue culture grade water)
Store medium at 4°C. Re-supplement to 2mM L-glutamine every 60 days.
Media containing 3% FBS has a shelf life of approximately 60 days.
Ordering information Penicillin-Streptomycin = Sigma P4333 FBS = foetal bovine serum (Hyclone SH30070) 200 mM L-glutamine = Sigma G7513 1M HEPES = Sigma 80887 7.5% NaHCO3 = Sigma S-8761 Chloramphenicol – C0378-5G Amphotericin B – A2411-250MG Cyclohexamide – C7698-1G Nystatin – N6261-500KU
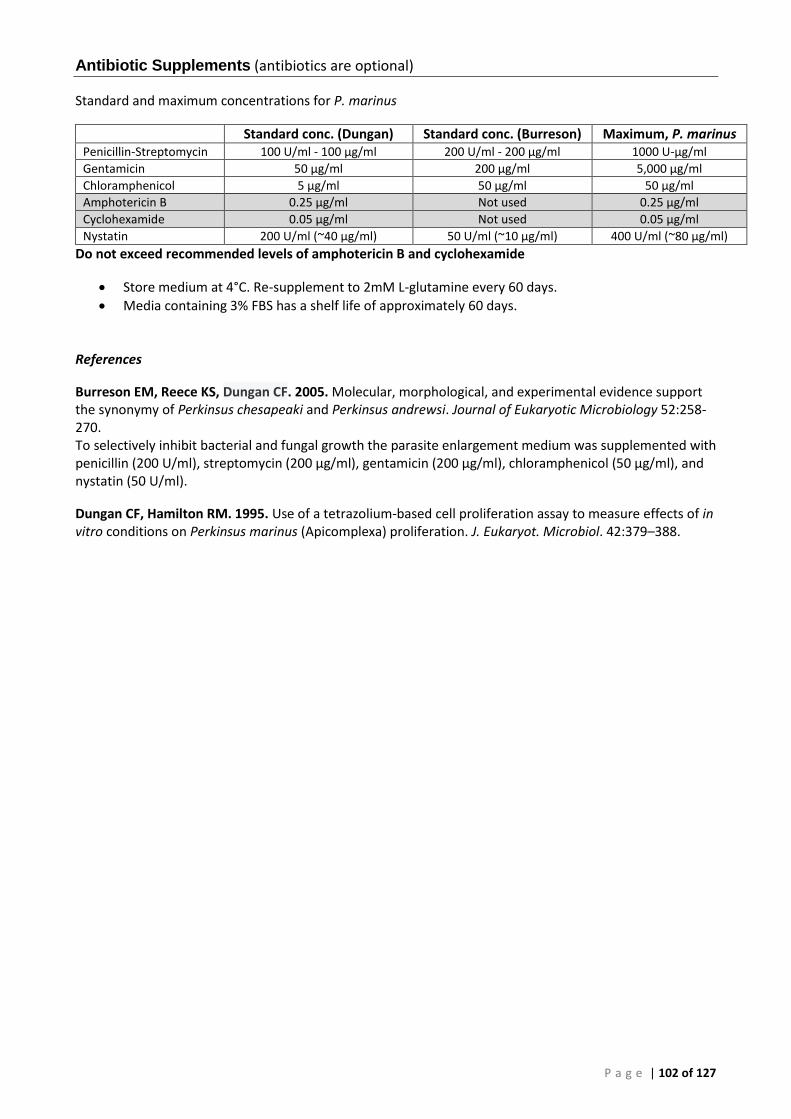
P a g e | 102 of 127
Antibiotic Supplements (antibiotics are optional)
Standard and maximum concentrations for P. marinus
Standard conc. (Dungan) Standard conc. (Burreson) Maximum, P. marinus Penicillin-Streptomycin 100 U/ml - 100 µg/ml 200 U/ml - 200 µg/ml 1000 U-µg/ml
Gentamicin 50 µg/ml 200 µg/ml 5,000 µg/ml
Chloramphenicol 5 µg/ml 50 µg/ml 50 µg/ml
Amphotericin B 0.25 µg/ml Not used 0.25 µg/ml
Cyclohexamide 0.05 µg/ml Not used 0.05 µg/ml
Nystatin 200 U/ml (~40 µg/ml) 50 U/ml (~10 µg/ml) 400 U/ml (~80 µg/ml)
Do not exceed recommended levels of amphotericin B and cyclohexamide
Store medium at 4°C. Re-supplement to 2mM L-glutamine every 60 days.
Media containing 3% FBS has a shelf life of approximately 60 days. References
Burreson EM, Reece KS, Dungan CF. 2005. Molecular, morphological, and experimental evidence support the synonymy of Perkinsus chesapeaki and Perkinsus andrewsi. Journal of Eukaryotic Microbiology 52:258-270. To selectively inhibit bacterial and fungal growth the parasite enlargement medium was supplemented with penicillin (200 U/ml), streptomycin (200 µg/ml), gentamicin (200 µg/ml), chloramphenicol (50 µg/ml), and nystatin (50 U/ml).
Dungan CF, Hamilton RM. 1995. Use of a tetrazolium-based cell proliferation assay to measure effects of in vitro conditions on Perkinsus marinus (Apicomplexa) proliferation. J. Eukaryot. Microbiol. 42:379–388.
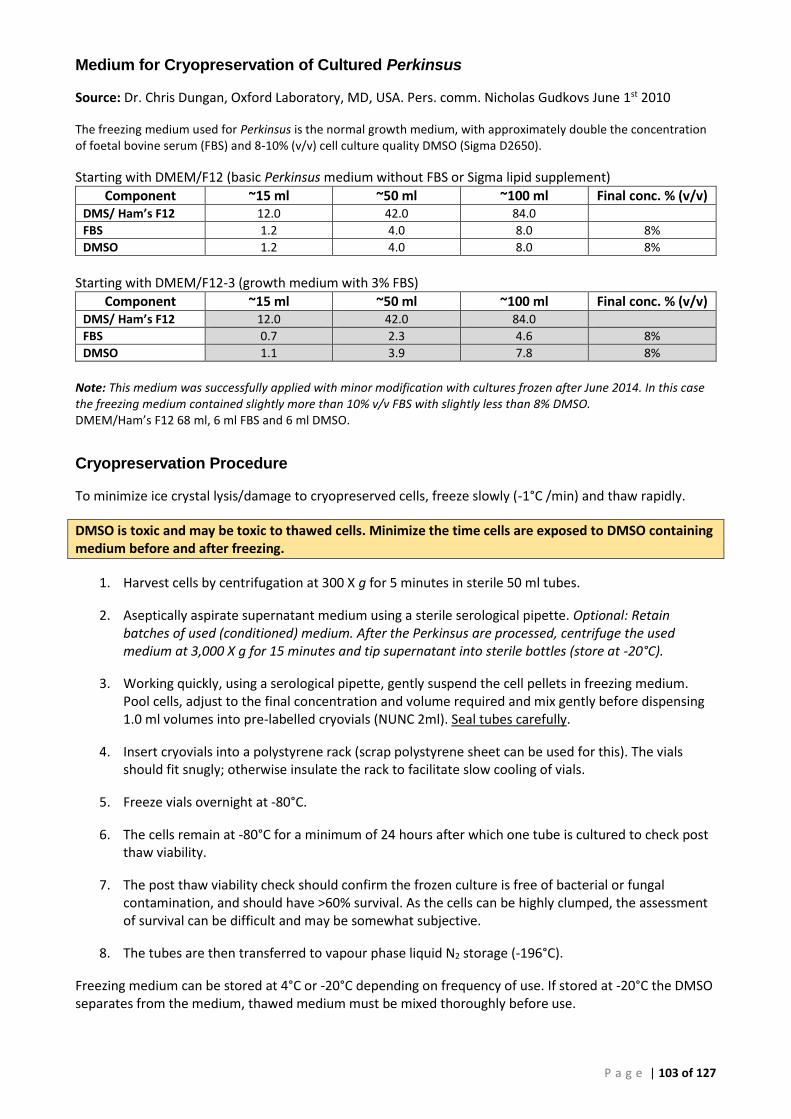
P a g e | 103 of 127
Medium for Cryopreservation of Cultured Perkinsus
Source: Dr. Chris Dungan, Oxford Laboratory, MD, USA. Pers. comm. Nicholas Gudkovs June 1st 2010
The freezing medium used for Perkinsus is the normal growth medium, with approximately double the concentration of foetal bovine serum (FBS) and 8-10% (v/v) cell culture quality DMSO (Sigma D2650).
Starting with DMEM/F12 (basic Perkinsus medium without FBS or Sigma lipid supplement)
Component ~15 ml ~50 ml ~100 ml Final conc. % (v/v) DMS/ Ham’s F12 12.0 42.0 84.0
FBS 1.2 4.0 8.0 8%
DMSO 1.2 4.0 8.0 8%
Starting with DMEM/F12-3 (growth medium with 3% FBS)
Component ~15 ml ~50 ml ~100 ml Final conc. % (v/v) DMS/ Ham’s F12 12.0 42.0 84.0
FBS 0.7 2.3 4.6 8%
DMSO 1.1 3.9 7.8 8%
Note: This medium was successfully applied with minor modification with cultures frozen after June 2014. In this case the freezing medium contained slightly more than 10% v/v FBS with slightly less than 8% DMSO. DMEM/Ham’s F12 68 ml, 6 ml FBS and 6 ml DMSO.
Cryopreservation Procedure
To minimize ice crystal lysis/damage to cryopreserved cells, freeze slowly (-1°C /min) and thaw rapidly.
DMSO is toxic and may be toxic to thawed cells. Minimize the time cells are exposed to DMSO containing medium before and after freezing.
1. Harvest cells by centrifugation at 300 X g for 5 minutes in sterile 50 ml tubes.
2. Aseptically aspirate supernatant medium using a sterile serological pipette. Optional: Retain batches of used (conditioned) medium. After the Perkinsus are processed, centrifuge the used medium at 3,000 X g for 15 minutes and tip supernatant into sterile bottles (store at -20°C).
3. Working quickly, using a serological pipette, gently suspend the cell pellets in freezing medium. Pool cells, adjust to the final concentration and volume required and mix gently before dispensing 1.0 ml volumes into pre-labelled cryovials (NUNC 2ml). Seal tubes carefully.
4. Insert cryovials into a polystyrene rack (scrap polystyrene sheet can be used for this). The vials should fit snugly; otherwise insulate the rack to facilitate slow cooling of vials.
5. Freeze vials overnight at -80°C.
6. The cells remain at -80°C for a minimum of 24 hours after which one tube is cultured to check post thaw viability.
7. The post thaw viability check should confirm the frozen culture is free of bacterial or fungal contamination, and should have >60% survival. As the cells can be highly clumped, the assessment of survival can be difficult and may be somewhat subjective.
8. The tubes are then transferred to vapour phase liquid N2 storage (-196°C).
Freezing medium can be stored at 4°C or -20°C depending on frequency of use. If stored at -20°C the DMSO separates from the medium, thawed medium must be mixed thoroughly before use.
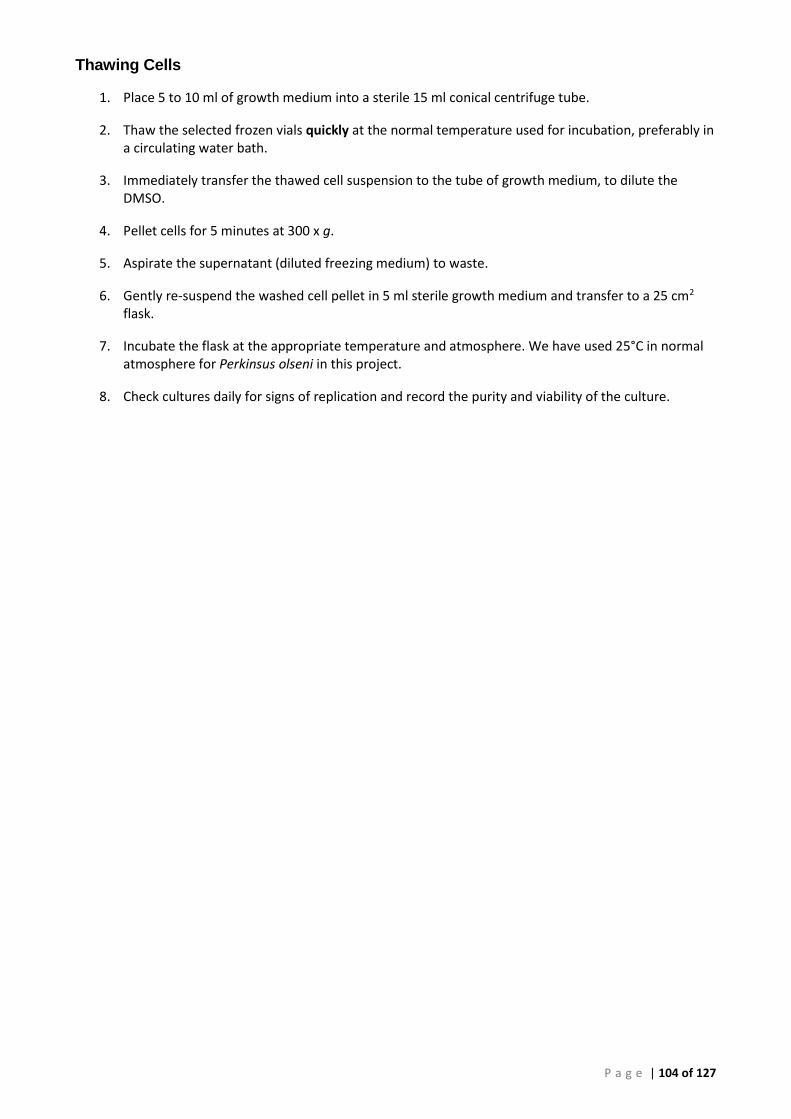
P a g e | 104 of 127
Thawing Cells
1. Place 5 to 10 ml of growth medium into a sterile 15 ml conical centrifuge tube.
2. Thaw the selected frozen vials quickly at the normal temperature used for incubation, preferably in a circulating water bath.
3. Immediately transfer the thawed cell suspension to the tube of growth medium, to dilute the DMSO.
4. Pellet cells for 5 minutes at 300 x g.
5. Aspirate the supernatant (diluted freezing medium) to waste.
6. Gently re-suspend the washed cell pellet in 5 ml sterile growth medium and transfer to a 25 cm2 flask.
7. Incubate the flask at the appropriate temperature and atmosphere. We have used 25°C in normal atmosphere for Perkinsus olseni in this project.
8. Check cultures daily for signs of replication and record the purity and viability of the culture.
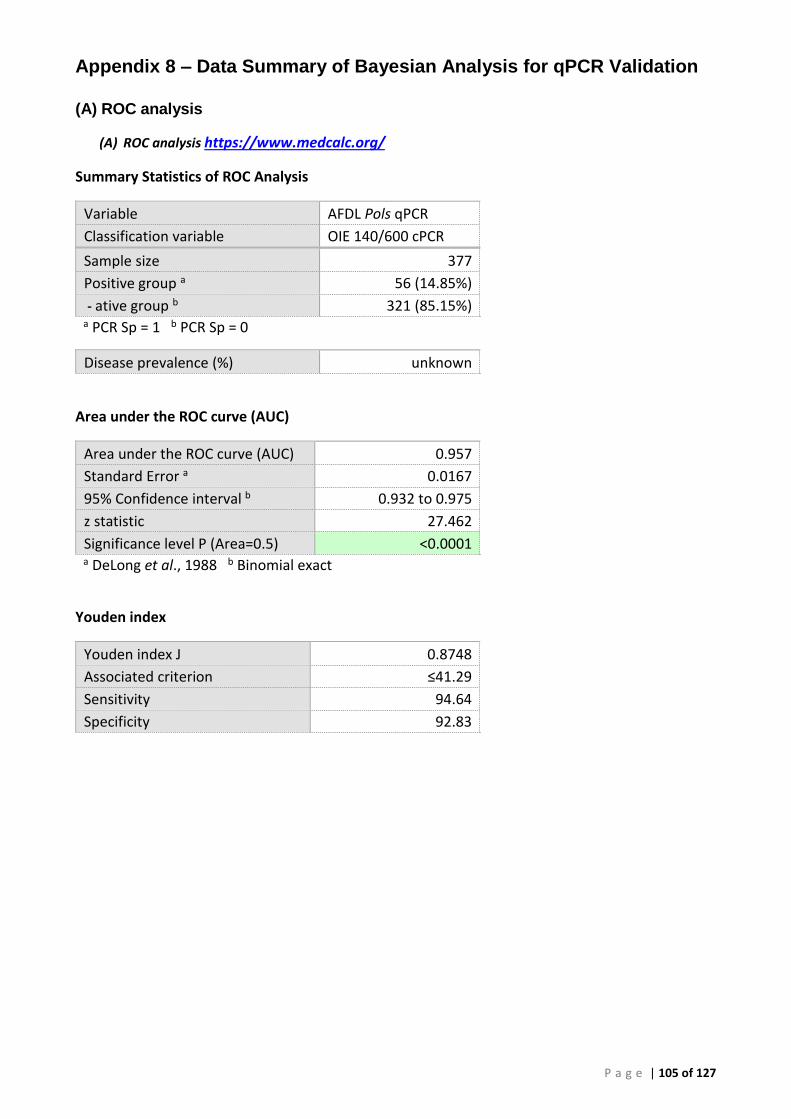
P a g e | 105 of 127
Appendix 8 – Data Summary of Bayesian Analysis for qPCR Validation
(A) ROC analysis
(A) ROC analysis https://www.medcalc.org/
Summary Statistics of ROC Analysis
Variable AFDL Pols qPCR
Classification variable OIE 140/600 cPCR
Sample size 377
Positive group a 56 (14.85%)
- ative group b 321 (85.15%) a PCR Sp = 1 b PCR Sp = 0
Disease prevalence (%) unknown
Area under the ROC curve (AUC)
Area under the ROC curve (AUC) 0.957
Standard Error a 0.0167
95% Confidence interval b 0.932 to 0.975
z statistic 27.462
Significance level P (Area=0.5) <0.0001 a DeLong et al., 1988 b Binomial exact
Youden index
Youden index J 0.8748
Associated criterion ≤41.29
Sensitivity 94.64
Specificity 92.83
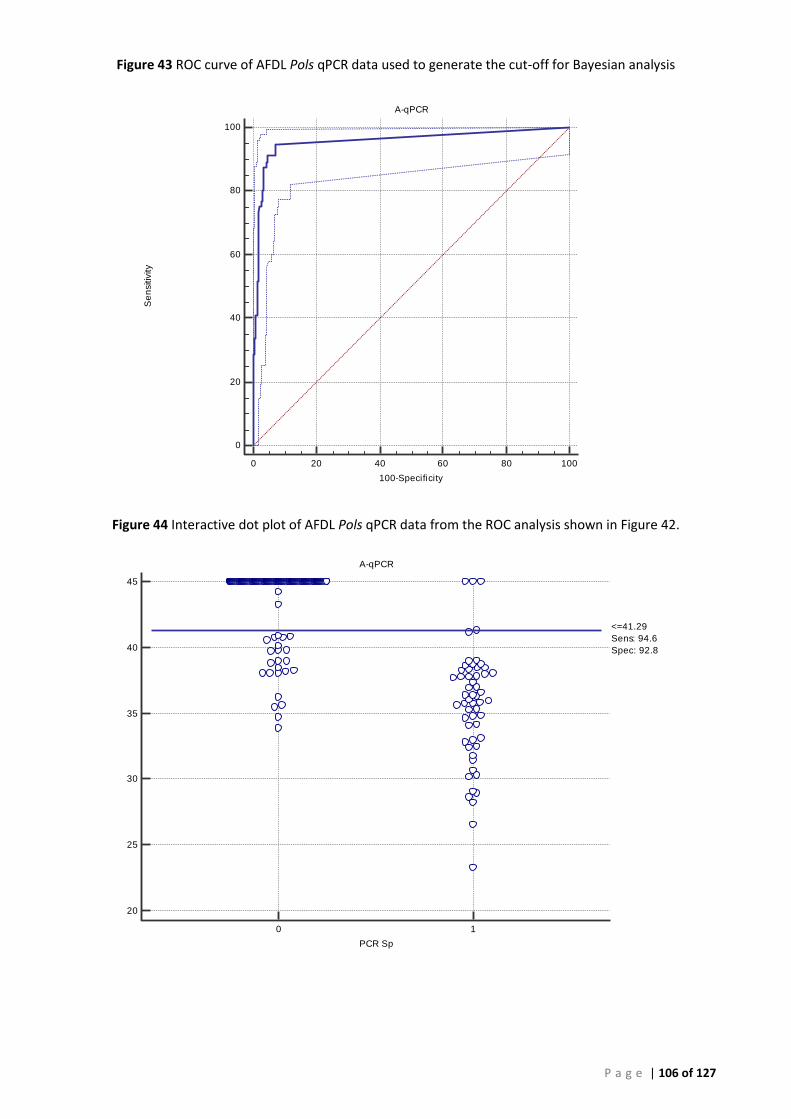
P a g e | 106 of 127
Figure 43 ROC curve of AFDL Pols qPCR data used to generate the cut-off for Bayesian analysis
Figure 44 Interactive dot plot of AFDL Pols qPCR data from the ROC analysis shown in Figure 42.
0
20
40
60
80
100
A-qPCR
0 20 40 60 80 100
100-Specificity
Se
nsitiv
ity
20
25
30
35
40
45
A-qPCR
PCR Sp
0 1
<=41.29
Sens: 94.6
Spec: 92.8
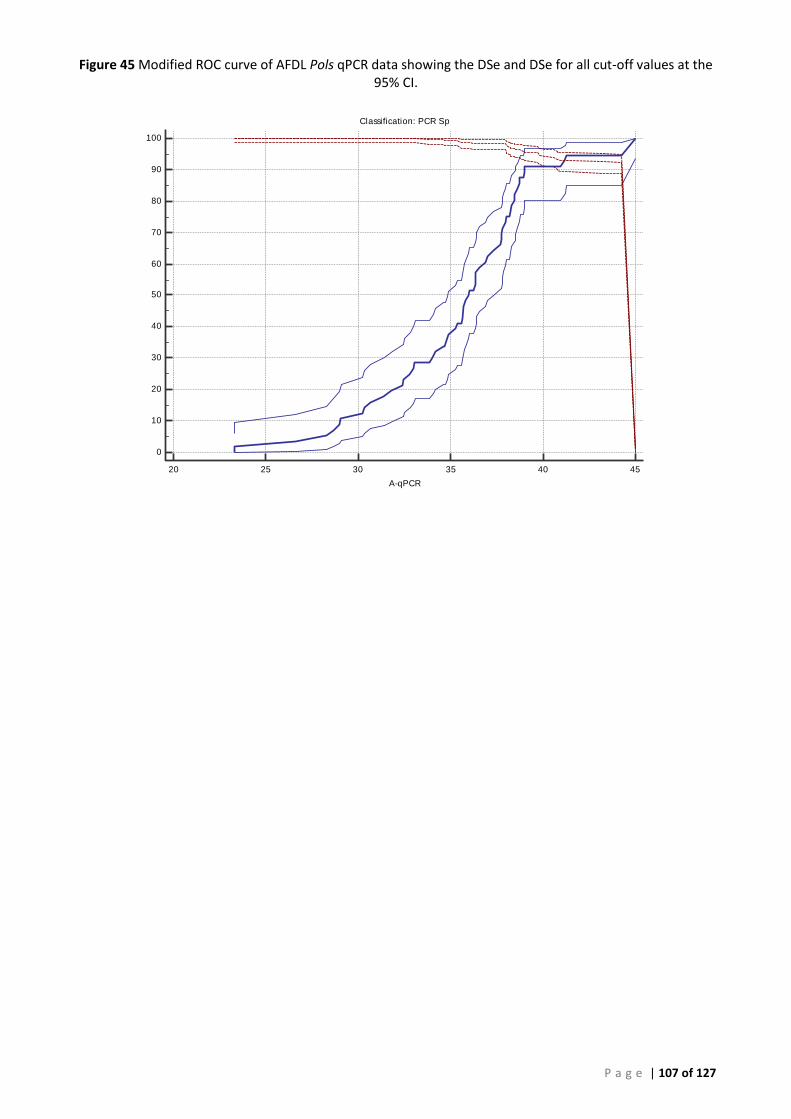
P a g e | 107 of 127
Figure 45 Modified ROC curve of AFDL Pols qPCR data showing the DSe and DSe for all cut-off values at the 95% CI.
0
10
20
30
40
50
60
70
80
90
100
Classification: PCR Sp
20 25 30 35 40 45
A-qPCR
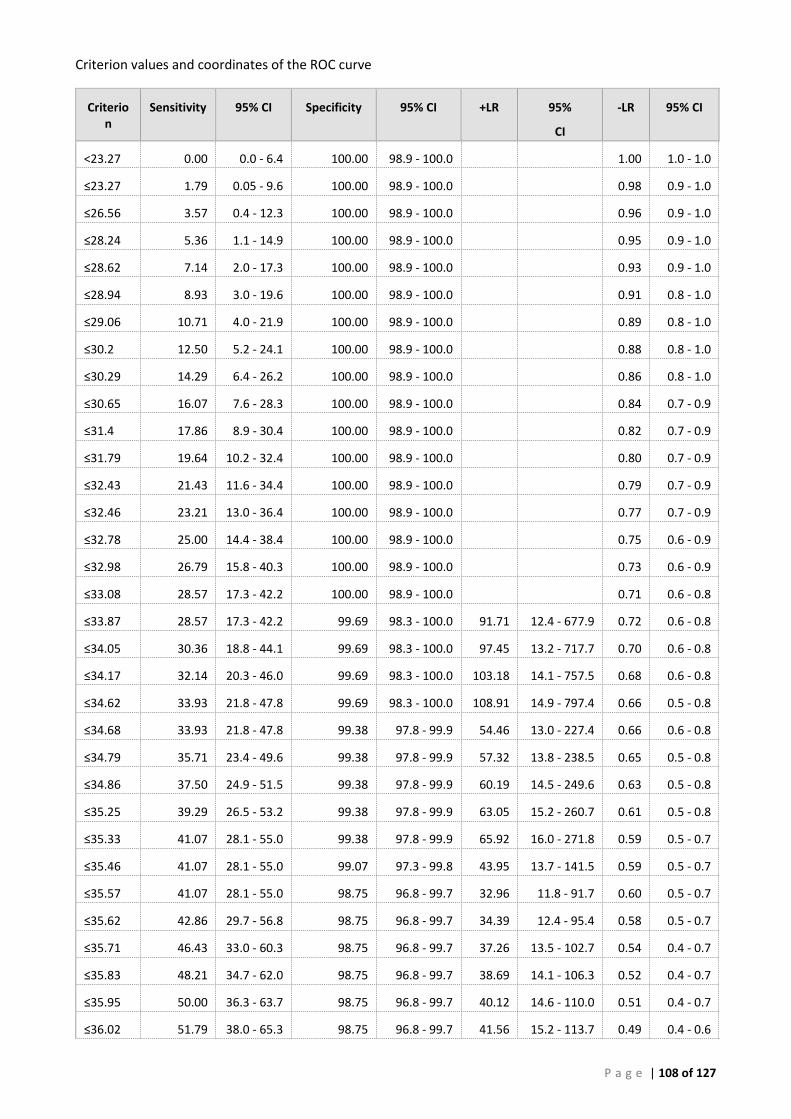
P a g e | 108 of 127
Criterion values and coordinates of the ROC curve
Criterion
Sensitivity 95% CI Specificity 95% CI +LR 95%
CI
-LR 95% CI
<23.27 0.00 0.0 - 6.4 100.00 98.9 - 100.0 1.00 1.0 - 1.0
≤23.27 1.79 0.05 - 9.6 100.00 98.9 - 100.0 0.98 0.9 - 1.0
≤26.56 3.57 0.4 - 12.3 100.00 98.9 - 100.0 0.96 0.9 - 1.0
≤28.24 5.36 1.1 - 14.9 100.00 98.9 - 100.0 0.95 0.9 - 1.0
≤28.62 7.14 2.0 - 17.3 100.00 98.9 - 100.0 0.93 0.9 - 1.0
≤28.94 8.93 3.0 - 19.6 100.00 98.9 - 100.0 0.91 0.8 - 1.0
≤29.06 10.71 4.0 - 21.9 100.00 98.9 - 100.0 0.89 0.8 - 1.0
≤30.2 12.50 5.2 - 24.1 100.00 98.9 - 100.0 0.88 0.8 - 1.0
≤30.29 14.29 6.4 - 26.2 100.00 98.9 - 100.0 0.86 0.8 - 1.0
≤30.65 16.07 7.6 - 28.3 100.00 98.9 - 100.0 0.84 0.7 - 0.9
≤31.4 17.86 8.9 - 30.4 100.00 98.9 - 100.0 0.82 0.7 - 0.9
≤31.79 19.64 10.2 - 32.4 100.00 98.9 - 100.0 0.80 0.7 - 0.9
≤32.43 21.43 11.6 - 34.4 100.00 98.9 - 100.0 0.79 0.7 - 0.9
≤32.46 23.21 13.0 - 36.4 100.00 98.9 - 100.0 0.77 0.7 - 0.9
≤32.78 25.00 14.4 - 38.4 100.00 98.9 - 100.0 0.75 0.6 - 0.9
≤32.98 26.79 15.8 - 40.3 100.00 98.9 - 100.0 0.73 0.6 - 0.9
≤33.08 28.57 17.3 - 42.2 100.00 98.9 - 100.0 0.71 0.6 - 0.8
≤33.87 28.57 17.3 - 42.2 99.69 98.3 - 100.0 91.71 12.4 - 677.9 0.72 0.6 - 0.8
≤34.05 30.36 18.8 - 44.1 99.69 98.3 - 100.0 97.45 13.2 - 717.7 0.70 0.6 - 0.8
≤34.17 32.14 20.3 - 46.0 99.69 98.3 - 100.0 103.18 14.1 - 757.5 0.68 0.6 - 0.8
≤34.62 33.93 21.8 - 47.8 99.69 98.3 - 100.0 108.91 14.9 - 797.4 0.66 0.5 - 0.8
≤34.68 33.93 21.8 - 47.8 99.38 97.8 - 99.9 54.46 13.0 - 227.4 0.66 0.6 - 0.8
≤34.79 35.71 23.4 - 49.6 99.38 97.8 - 99.9 57.32 13.8 - 238.5 0.65 0.5 - 0.8
≤34.86 37.50 24.9 - 51.5 99.38 97.8 - 99.9 60.19 14.5 - 249.6 0.63 0.5 - 0.8
≤35.25 39.29 26.5 - 53.2 99.38 97.8 - 99.9 63.05 15.2 - 260.7 0.61 0.5 - 0.8
≤35.33 41.07 28.1 - 55.0 99.38 97.8 - 99.9 65.92 16.0 - 271.8 0.59 0.5 - 0.7
≤35.46 41.07 28.1 - 55.0 99.07 97.3 - 99.8 43.95 13.7 - 141.5 0.59 0.5 - 0.7
≤35.57 41.07 28.1 - 55.0 98.75 96.8 - 99.7 32.96 11.8 - 91.7 0.60 0.5 - 0.7
≤35.62 42.86 29.7 - 56.8 98.75 96.8 - 99.7 34.39 12.4 - 95.4 0.58 0.5 - 0.7
≤35.71 46.43 33.0 - 60.3 98.75 96.8 - 99.7 37.26 13.5 - 102.7 0.54 0.4 - 0.7
≤35.83 48.21 34.7 - 62.0 98.75 96.8 - 99.7 38.69 14.1 - 106.3 0.52 0.4 - 0.7
≤35.95 50.00 36.3 - 63.7 98.75 96.8 - 99.7 40.12 14.6 - 110.0 0.51 0.4 - 0.7
≤36.02 51.79 38.0 - 65.3 98.75 96.8 - 99.7 41.56 15.2 - 113.7 0.49 0.4 - 0.6
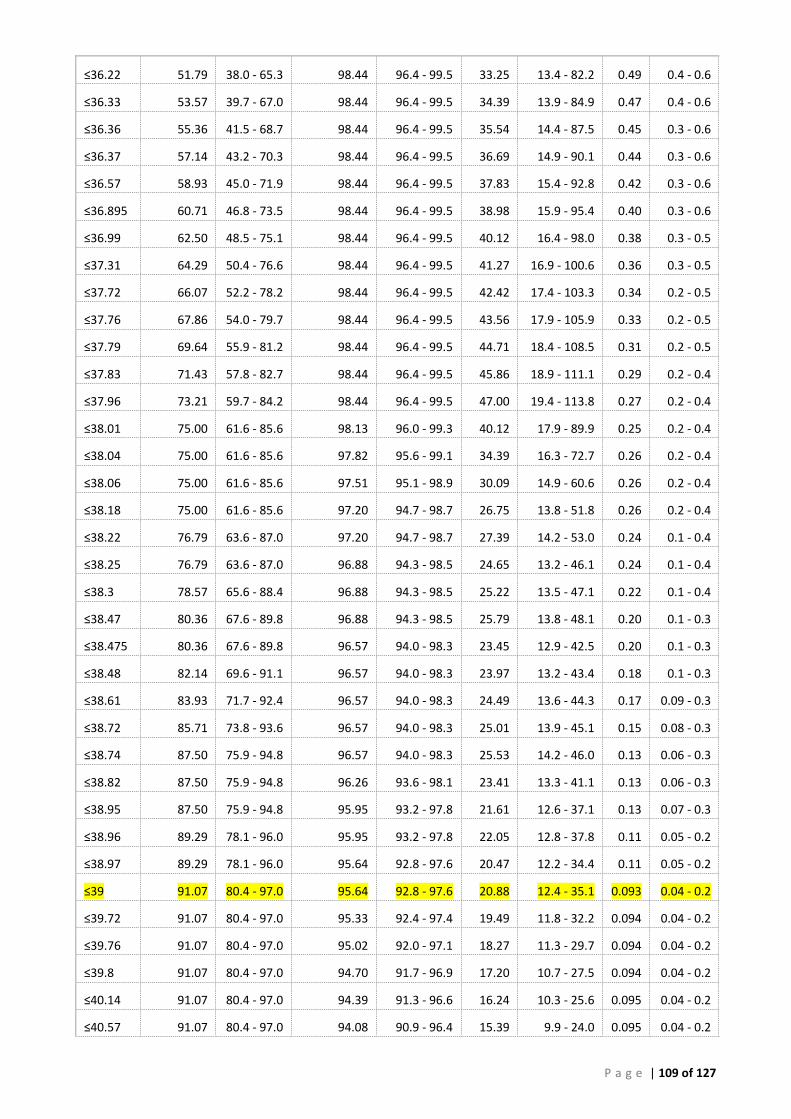
P a g e | 109 of 127
≤36.22 51.79 38.0 - 65.3 98.44 96.4 - 99.5 33.25 13.4 - 82.2 0.49 0.4 - 0.6
≤36.33 53.57 39.7 - 67.0 98.44 96.4 - 99.5 34.39 13.9 - 84.9 0.47 0.4 - 0.6
≤36.36 55.36 41.5 - 68.7 98.44 96.4 - 99.5 35.54 14.4 - 87.5 0.45 0.3 - 0.6
≤36.37 57.14 43.2 - 70.3 98.44 96.4 - 99.5 36.69 14.9 - 90.1 0.44 0.3 - 0.6
≤36.57 58.93 45.0 - 71.9 98.44 96.4 - 99.5 37.83 15.4 - 92.8 0.42 0.3 - 0.6
≤36.895 60.71 46.8 - 73.5 98.44 96.4 - 99.5 38.98 15.9 - 95.4 0.40 0.3 - 0.6
≤36.99 62.50 48.5 - 75.1 98.44 96.4 - 99.5 40.12 16.4 - 98.0 0.38 0.3 - 0.5
≤37.31 64.29 50.4 - 76.6 98.44 96.4 - 99.5 41.27 16.9 - 100.6 0.36 0.3 - 0.5
≤37.72 66.07 52.2 - 78.2 98.44 96.4 - 99.5 42.42 17.4 - 103.3 0.34 0.2 - 0.5
≤37.76 67.86 54.0 - 79.7 98.44 96.4 - 99.5 43.56 17.9 - 105.9 0.33 0.2 - 0.5
≤37.79 69.64 55.9 - 81.2 98.44 96.4 - 99.5 44.71 18.4 - 108.5 0.31 0.2 - 0.5
≤37.83 71.43 57.8 - 82.7 98.44 96.4 - 99.5 45.86 18.9 - 111.1 0.29 0.2 - 0.4
≤37.96 73.21 59.7 - 84.2 98.44 96.4 - 99.5 47.00 19.4 - 113.8 0.27 0.2 - 0.4
≤38.01 75.00 61.6 - 85.6 98.13 96.0 - 99.3 40.12 17.9 - 89.9 0.25 0.2 - 0.4
≤38.04 75.00 61.6 - 85.6 97.82 95.6 - 99.1 34.39 16.3 - 72.7 0.26 0.2 - 0.4
≤38.06 75.00 61.6 - 85.6 97.51 95.1 - 98.9 30.09 14.9 - 60.6 0.26 0.2 - 0.4
≤38.18 75.00 61.6 - 85.6 97.20 94.7 - 98.7 26.75 13.8 - 51.8 0.26 0.2 - 0.4
≤38.22 76.79 63.6 - 87.0 97.20 94.7 - 98.7 27.39 14.2 - 53.0 0.24 0.1 - 0.4
≤38.25 76.79 63.6 - 87.0 96.88 94.3 - 98.5 24.65 13.2 - 46.1 0.24 0.1 - 0.4
≤38.3 78.57 65.6 - 88.4 96.88 94.3 - 98.5 25.22 13.5 - 47.1 0.22 0.1 - 0.4
≤38.47 80.36 67.6 - 89.8 96.88 94.3 - 98.5 25.79 13.8 - 48.1 0.20 0.1 - 0.3
≤38.475 80.36 67.6 - 89.8 96.57 94.0 - 98.3 23.45 12.9 - 42.5 0.20 0.1 - 0.3
≤38.48 82.14 69.6 - 91.1 96.57 94.0 - 98.3 23.97 13.2 - 43.4 0.18 0.1 - 0.3
≤38.61 83.93 71.7 - 92.4 96.57 94.0 - 98.3 24.49 13.6 - 44.3 0.17 0.09 - 0.3
≤38.72 85.71 73.8 - 93.6 96.57 94.0 - 98.3 25.01 13.9 - 45.1 0.15 0.08 - 0.3
≤38.74 87.50 75.9 - 94.8 96.57 94.0 - 98.3 25.53 14.2 - 46.0 0.13 0.06 - 0.3
≤38.82 87.50 75.9 - 94.8 96.26 93.6 - 98.1 23.41 13.3 - 41.1 0.13 0.06 - 0.3
≤38.95 87.50 75.9 - 94.8 95.95 93.2 - 97.8 21.61 12.6 - 37.1 0.13 0.07 - 0.3
≤38.96 89.29 78.1 - 96.0 95.95 93.2 - 97.8 22.05 12.8 - 37.8 0.11 0.05 - 0.2
≤38.97 89.29 78.1 - 96.0 95.64 92.8 - 97.6 20.47 12.2 - 34.4 0.11 0.05 - 0.2
≤39 91.07 80.4 - 97.0 95.64 92.8 - 97.6 20.88 12.4 - 35.1 0.093 0.04 - 0.2
≤39.72 91.07 80.4 - 97.0 95.33 92.4 - 97.4 19.49 11.8 - 32.2 0.094 0.04 - 0.2
≤39.76 91.07 80.4 - 97.0 95.02 92.0 - 97.1 18.27 11.3 - 29.7 0.094 0.04 - 0.2
≤39.8 91.07 80.4 - 97.0 94.70 91.7 - 96.9 17.20 10.7 - 27.5 0.094 0.04 - 0.2
≤40.14 91.07 80.4 - 97.0 94.39 91.3 - 96.6 16.24 10.3 - 25.6 0.095 0.04 - 0.2
≤40.57 91.07 80.4 - 97.0 94.08 90.9 - 96.4 15.39 9.9 - 24.0 0.095 0.04 - 0.2
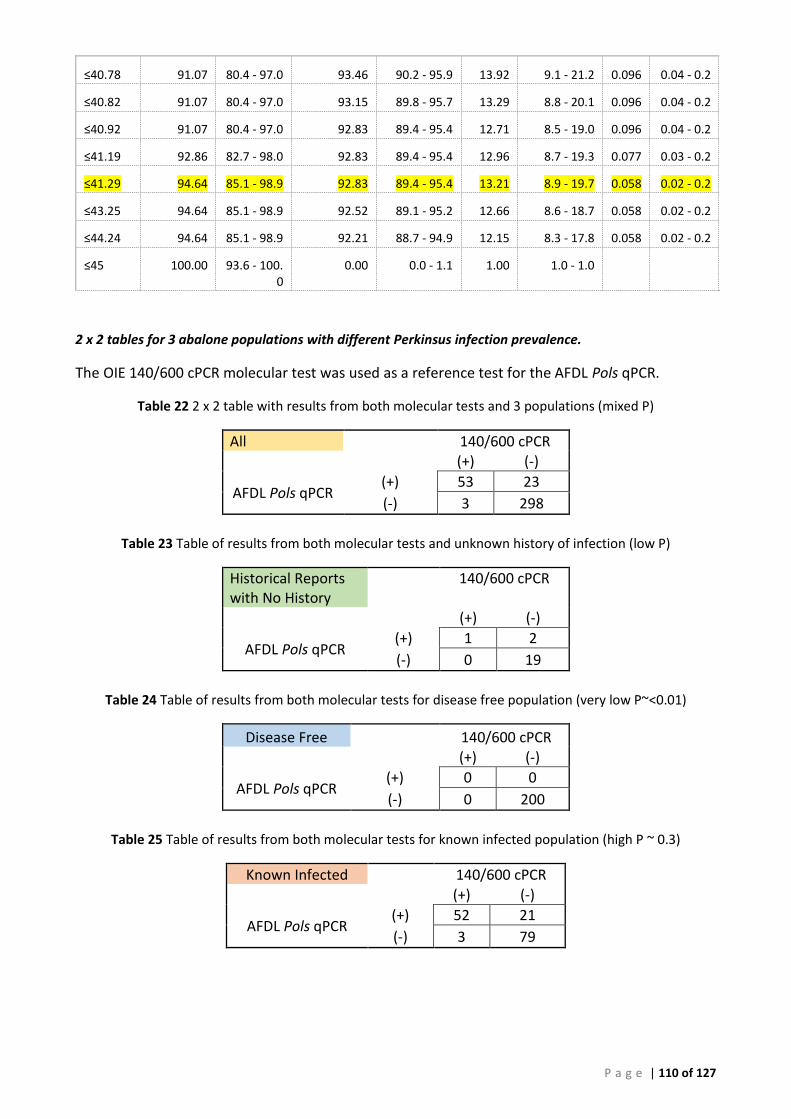
P a g e | 110 of 127
≤40.78 91.07 80.4 - 97.0 93.46 90.2 - 95.9 13.92 9.1 - 21.2 0.096 0.04 - 0.2
≤40.82 91.07 80.4 - 97.0 93.15 89.8 - 95.7 13.29 8.8 - 20.1 0.096 0.04 - 0.2
≤40.92 91.07 80.4 - 97.0 92.83 89.4 - 95.4 12.71 8.5 - 19.0 0.096 0.04 - 0.2
≤41.19 92.86 82.7 - 98.0 92.83 89.4 - 95.4 12.96 8.7 - 19.3 0.077 0.03 - 0.2
≤41.29 94.64 85.1 - 98.9 92.83 89.4 - 95.4 13.21 8.9 - 19.7 0.058 0.02 - 0.2
≤43.25 94.64 85.1 - 98.9 92.52 89.1 - 95.2 12.66 8.6 - 18.7 0.058 0.02 - 0.2
≤44.24 94.64 85.1 - 98.9 92.21 88.7 - 94.9 12.15 8.3 - 17.8 0.058 0.02 - 0.2
≤45 100.00 93.6 - 100.0
0.00 0.0 - 1.1 1.00 1.0 - 1.0
2 x 2 tables for 3 abalone populations with different Perkinsus infection prevalence.
The OIE 140/600 cPCR molecular test was used as a reference test for the AFDL Pols qPCR.
Table 22 2 x 2 table with results from both molecular tests and 3 populations (mixed P)
All 140/600 cPCR (+) (-)
AFDL Pols qPCR (+) 53 23
(-) 3 298
Table 23 Table of results from both molecular tests and unknown history of infection (low P)
Historical Reports with No History
140/600 cPCR
(+) (-)
AFDL Pols qPCR (+) 1 2
(-) 0 19
Table 24 Table of results from both molecular tests for disease free population (very low P~<0.01)
Disease Free 140/600 cPCR (+) (-)
AFDL Pols qPCR (+) 0 0
(-) 0 200
Table 25 Table of results from both molecular tests for known infected population (high P ~ 0.3)
Known Infected 140/600 cPCR (+) (-)
AFDL Pols qPCR (+) 52 21
(-) 3 79
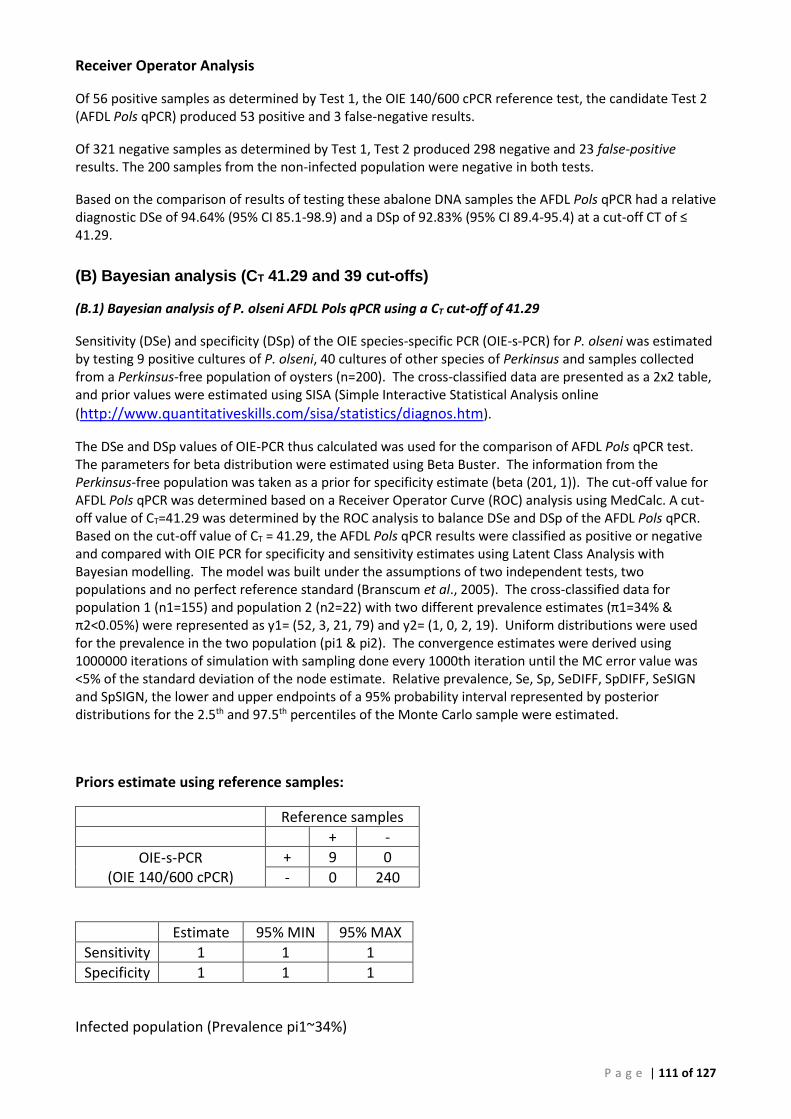
P a g e | 111 of 127
Receiver Operator Analysis
Of 56 positive samples as determined by Test 1, the OIE 140/600 cPCR reference test, the candidate Test 2 (AFDL Pols qPCR) produced 53 positive and 3 false-negative results.
Of 321 negative samples as determined by Test 1, Test 2 produced 298 negative and 23 false-positive results. The 200 samples from the non-infected population were negative in both tests.
Based on the comparison of results of testing these abalone DNA samples the AFDL Pols qPCR had a relative diagnostic DSe of 94.64% (95% CI 85.1-98.9) and a DSp of 92.83% (95% CI 89.4-95.4) at a cut-off CT of ≤ 41.29.
(B) Bayesian analysis (CT 41.29 and 39 cut-offs)
(B.1) Bayesian analysis of P. olseni AFDL Pols qPCR using a CT cut-off of 41.29
Sensitivity (DSe) and specificity (DSp) of the OIE species-specific PCR (OIE-s-PCR) for P. olseni was estimated by testing 9 positive cultures of P. olseni, 40 cultures of other species of Perkinsus and samples collected from a Perkinsus-free population of oysters (n=200). The cross-classified data are presented as a 2x2 table, and prior values were estimated using SISA (Simple Interactive Statistical Analysis online
(http://www.quantitativeskills.com/sisa/statistics/diagnos.htm).
The DSe and DSp values of OIE-PCR thus calculated was used for the comparison of AFDL Pols qPCR test. The parameters for beta distribution were estimated using Beta Buster. The information from the Perkinsus-free population was taken as a prior for specificity estimate (beta (201, 1)). The cut-off value for AFDL Pols qPCR was determined based on a Receiver Operator Curve (ROC) analysis using MedCalc. A cut-off value of CT=41.29 was determined by the ROC analysis to balance DSe and DSp of the AFDL Pols qPCR. Based on the cut-off value of CT = 41.29, the AFDL Pols qPCR results were classified as positive or negative and compared with OIE PCR for specificity and sensitivity estimates using Latent Class Analysis with Bayesian modelling. The model was built under the assumptions of two independent tests, two populations and no perfect reference standard (Branscum et al., 2005). The cross-classified data for population 1 (n1=155) and population 2 (n2=22) with two different prevalence estimates (π1=34% & π2<0.05%) were represented as y1= (52, 3, 21, 79) and y2= (1, 0, 2, 19). Uniform distributions were used for the prevalence in the two population (pi1 & pi2). The convergence estimates were derived using 1000000 iterations of simulation with sampling done every 1000th iteration until the MC error value was <5% of the standard deviation of the node estimate. Relative prevalence, Se, Sp, SeDIFF, SpDIFF, SeSIGN and SpSIGN, the lower and upper endpoints of a 95% probability interval represented by posterior distributions for the 2.5th and 97.5th percentiles of the Monte Carlo sample were estimated.
Priors estimate using reference samples:
Reference samples
+ -
OIE-s-PCR (OIE 140/600 cPCR)
+ 9 0
- 0 240
Estimate 95% MIN 95% MAX
Sensitivity 1 1 1
Specificity 1 1 1
Infected population (Prevalence pi1~34%)

P a g e | 112 of 127
AFDL Pols qPCR
+ -
OIE-s-PCR (OIE 140/600 cPCR)
+ 52 3 55
- 21 79 100
73 82 155
Population with no history of infection (Prevalence pi1~0.05%)
AFDL Pols qPCR
+ -
OIE-s-PCR (OIE 140/600 cPCR)
+ 1 0 1
- 2 19 21
3 19 22
Latent class analysis with Bayesian analysis model with conditional independence of tests model;
{ y1[1:Q, 1:Q] ~ dmulti(p1[1:Q, 1:Q], n1) y2[1:Q, 1:Q] ~ dmulti(p2[1:Q, 1:Q], n2) p1[1,1] <- pi1*SeOIE*SeAAHL + (1-pi1)*(1-SpOIE)*(1-SpAAHL) p1[1,2] <- pi1*SeOIE*(1-SeAAHL) + (1-pi1)*(1-SpOIE)*SpAAHL p1[2,1] <- pi1*(1-SeOIE)*SeAAHL + (1-pi1)*SpOIE*(1-SpAAHL) p1[2,2] <- pi1*(1-SeOIE)*(1-SeAAHL) + (1-pi1)*SpOIE*SpAAHL p2[1,1] <- pi2*SeOIE*SeAAHL + (1-pi2)*(1-SpOIE)*(1-SpAAHL) p2[1,2] <- pi2*SeOIE*(1-SeAAHL) + (1-pi2)*(1-SpOIE)*SpAAHL p2[2,1] <- pi2*(1-SeOIE)*SeAAHL + (1-pi2)*SpOIE*(1-SpAAHL) p2[2,2] <- pi2*(1-SeOIE)*(1-SeAAHL) + (1-pi2)*SpOIE*SpAAHL SeOIE ~ dbeta(1,1) SpOIE ~ dbeta(201,1) # based on data with 0 positive out of 200 TN SeAAHL ~ dbeta(1,1) SpAAHL ~ dbeta(201,1) # based on data with 0 positive out of 200 TN pi1~ dbeta(1,1) pi2 ~ dbeta(1,1) SeDIFF <-SeAAHL-SeOIE SeSIGN<-step(SeDIFF) SpDIFF <-SpAAHL-SpOIE SpSIGN<-step(SpDIFF) } list(n1=155, n2=22, y1=structure(.Data=c(52,3,21,79),.Dim=c(2,2)), y2=structure(.Data=c(1,0,2,19),.Dim=c(2,2)),Q=2) list(pi1=0.34, pi2=0.05, SeOIE=0.80, SpOIE=0.995, SeAAHL=0.90, SpAAHL=0.995)
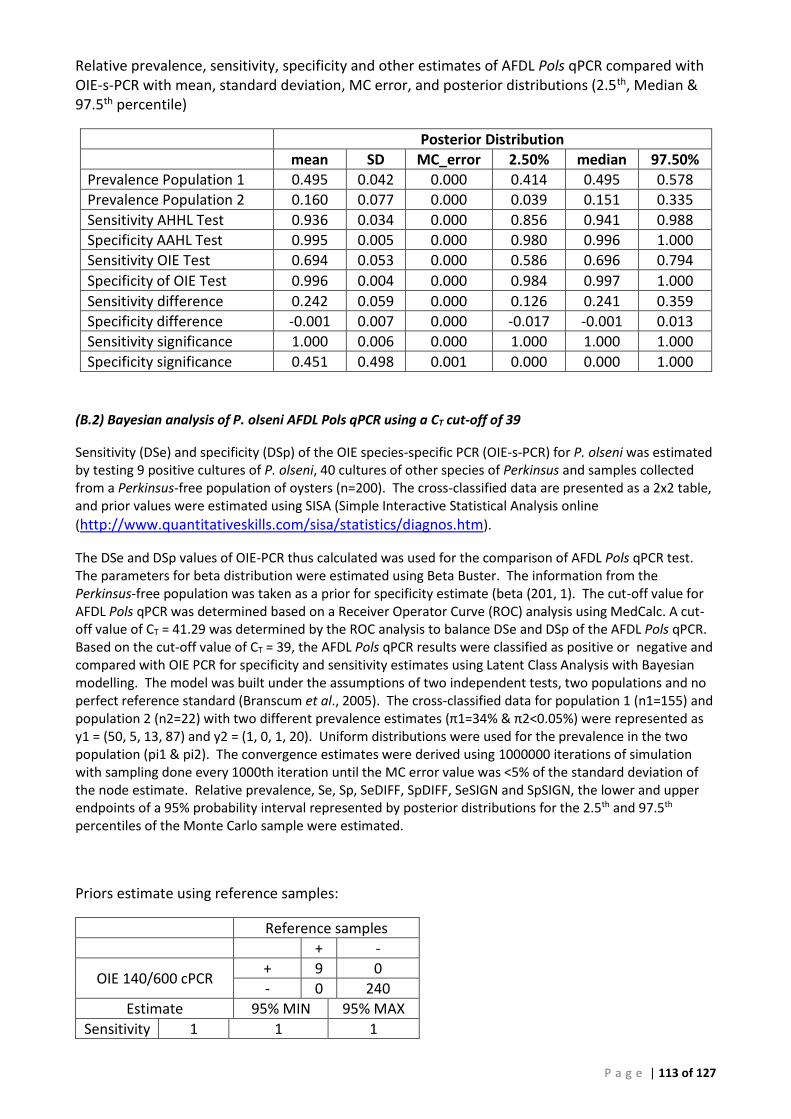
P a g e | 113 of 127
Relative prevalence, sensitivity, specificity and other estimates of AFDL Pols qPCR compared with OIE-s-PCR with mean, standard deviation, MC error, and posterior distributions (2.5th, Median & 97.5th percentile)
Posterior Distribution
mean SD MC_error 2.50% median 97.50%
Prevalence Population 1 0.495 0.042 0.000 0.414 0.495 0.578
Prevalence Population 2 0.160 0.077 0.000 0.039 0.151 0.335
Sensitivity AHHL Test 0.936 0.034 0.000 0.856 0.941 0.988
Specificity AAHL Test 0.995 0.005 0.000 0.980 0.996 1.000
Sensitivity OIE Test 0.694 0.053 0.000 0.586 0.696 0.794
Specificity of OIE Test 0.996 0.004 0.000 0.984 0.997 1.000
Sensitivity difference 0.242 0.059 0.000 0.126 0.241 0.359
Specificity difference -0.001 0.007 0.000 -0.017 -0.001 0.013
Sensitivity significance 1.000 0.006 0.000 1.000 1.000 1.000
Specificity significance 0.451 0.498 0.001 0.000 0.000 1.000
(B.2) Bayesian analysis of P. olseni AFDL Pols qPCR using a CT cut-off of 39
Sensitivity (DSe) and specificity (DSp) of the OIE species-specific PCR (OIE-s-PCR) for P. olseni was estimated by testing 9 positive cultures of P. olseni, 40 cultures of other species of Perkinsus and samples collected from a Perkinsus-free population of oysters (n=200). The cross-classified data are presented as a 2x2 table, and prior values were estimated using SISA (Simple Interactive Statistical Analysis online
(http://www.quantitativeskills.com/sisa/statistics/diagnos.htm).
The DSe and DSp values of OIE-PCR thus calculated was used for the comparison of AFDL Pols qPCR test. The parameters for beta distribution were estimated using Beta Buster. The information from the Perkinsus-free population was taken as a prior for specificity estimate (beta (201, 1). The cut-off value for AFDL Pols qPCR was determined based on a Receiver Operator Curve (ROC) analysis using MedCalc. A cut-off value of CT = 41.29 was determined by the ROC analysis to balance DSe and DSp of the AFDL Pols qPCR. Based on the cut-off value of CT = 39, the AFDL Pols qPCR results were classified as positive or negative and compared with OIE PCR for specificity and sensitivity estimates using Latent Class Analysis with Bayesian modelling. The model was built under the assumptions of two independent tests, two populations and no perfect reference standard (Branscum et al., 2005). The cross-classified data for population 1 (n1=155) and population 2 (n2=22) with two different prevalence estimates (π1=34% & π2<0.05%) were represented as y1 = (50, 5, 13, 87) and y2 = (1, 0, 1, 20). Uniform distributions were used for the prevalence in the two population (pi1 & pi2). The convergence estimates were derived using 1000000 iterations of simulation with sampling done every 1000th iteration until the MC error value was <5% of the standard deviation of the node estimate. Relative prevalence, Se, Sp, SeDIFF, SpDIFF, SeSIGN and SpSIGN, the lower and upper endpoints of a 95% probability interval represented by posterior distributions for the 2.5th and 97.5th percentiles of the Monte Carlo sample were estimated.
Priors estimate using reference samples:
Reference samples
+ -
OIE 140/600 cPCR + 9 0
- 0 240
Estimate 95% MIN 95% MAX
Sensitivity 1 1 1
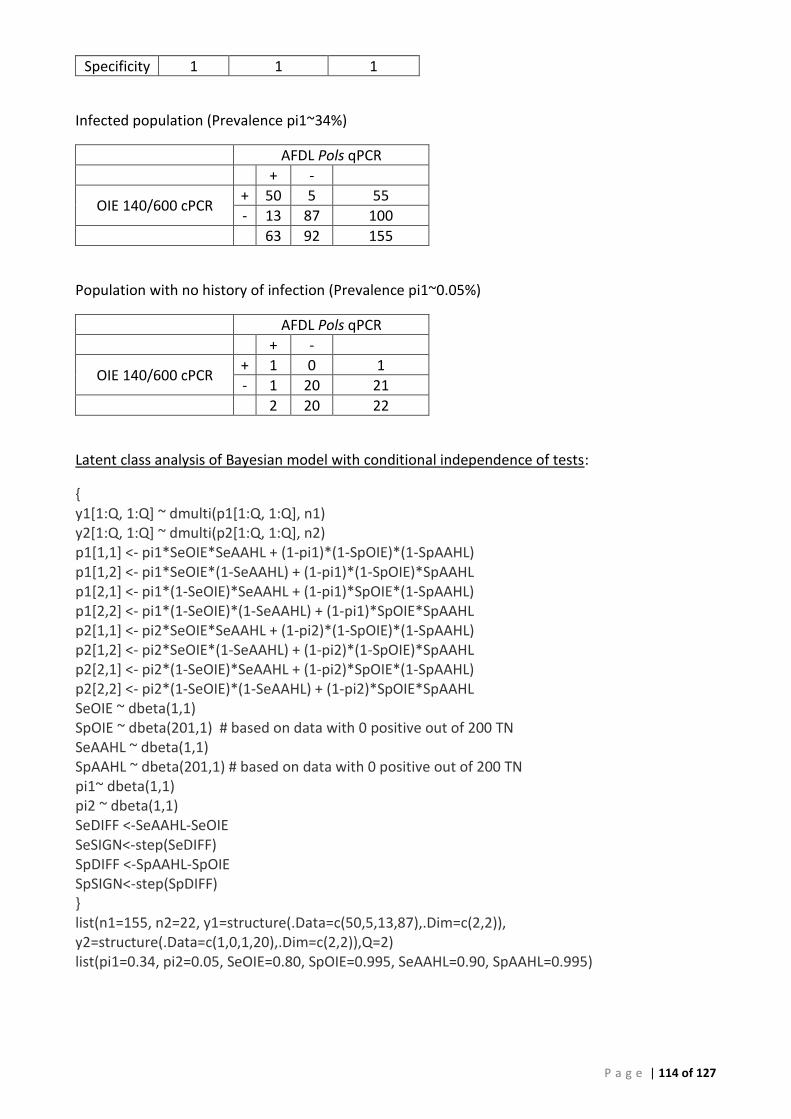
P a g e | 114 of 127
Specificity 1 1 1
Infected population (Prevalence pi1~34%)
AFDL Pols qPCR
+ -
OIE 140/600 cPCR + 50 5 55
- 13 87 100
63 92 155
Population with no history of infection (Prevalence pi1~0.05%)
AFDL Pols qPCR
+ -
OIE 140/600 cPCR + 1 0 1
- 1 20 21
2 20 22
Latent class analysis of Bayesian model with conditional independence of tests:
{ y1[1:Q, 1:Q] ~ dmulti(p1[1:Q, 1:Q], n1) y2[1:Q, 1:Q] ~ dmulti(p2[1:Q, 1:Q], n2) p1[1,1] <- pi1*SeOIE*SeAAHL + (1-pi1)*(1-SpOIE)*(1-SpAAHL) p1[1,2] <- pi1*SeOIE*(1-SeAAHL) + (1-pi1)*(1-SpOIE)*SpAAHL p1[2,1] <- pi1*(1-SeOIE)*SeAAHL + (1-pi1)*SpOIE*(1-SpAAHL) p1[2,2] <- pi1*(1-SeOIE)*(1-SeAAHL) + (1-pi1)*SpOIE*SpAAHL p2[1,1] <- pi2*SeOIE*SeAAHL + (1-pi2)*(1-SpOIE)*(1-SpAAHL) p2[1,2] <- pi2*SeOIE*(1-SeAAHL) + (1-pi2)*(1-SpOIE)*SpAAHL p2[2,1] <- pi2*(1-SeOIE)*SeAAHL + (1-pi2)*SpOIE*(1-SpAAHL) p2[2,2] <- pi2*(1-SeOIE)*(1-SeAAHL) + (1-pi2)*SpOIE*SpAAHL SeOIE ~ dbeta(1,1) SpOIE ~ dbeta(201,1) # based on data with 0 positive out of 200 TN SeAAHL ~ dbeta(1,1) SpAAHL ~ dbeta(201,1) # based on data with 0 positive out of 200 TN pi1~ dbeta(1,1) pi2 ~ dbeta(1,1) SeDIFF <-SeAAHL-SeOIE SeSIGN<-step(SeDIFF) SpDIFF <-SpAAHL-SpOIE SpSIGN<-step(SpDIFF) } list(n1=155, n2=22, y1=structure(.Data=c(50,5,13,87),.Dim=c(2,2)), y2=structure(.Data=c(1,0,1,20),.Dim=c(2,2)),Q=2) list(pi1=0.34, pi2=0.05, SeOIE=0.80, SpOIE=0.995, SeAAHL=0.90, SpAAHL=0.995)
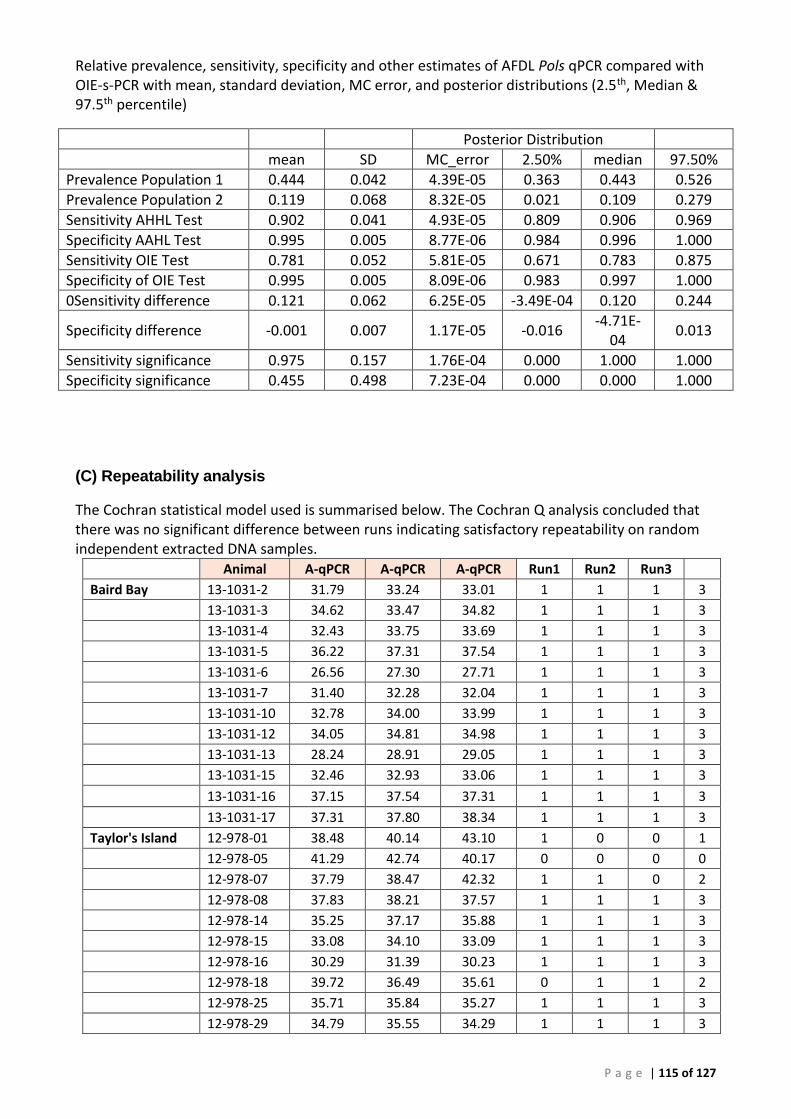
P a g e | 115 of 127
Relative prevalence, sensitivity, specificity and other estimates of AFDL Pols qPCR compared with OIE-s-PCR with mean, standard deviation, MC error, and posterior distributions (2.5th, Median & 97.5th percentile)
Posterior Distribution
mean SD MC_error 2.50% median 97.50%
Prevalence Population 1 0.444 0.042 4.39E-05 0.363 0.443 0.526
Prevalence Population 2 0.119 0.068 8.32E-05 0.021 0.109 0.279
Sensitivity AHHL Test 0.902 0.041 4.93E-05 0.809 0.906 0.969
Specificity AAHL Test 0.995 0.005 8.77E-06 0.984 0.996 1.000
Sensitivity OIE Test 0.781 0.052 5.81E-05 0.671 0.783 0.875
Specificity of OIE Test 0.995 0.005 8.09E-06 0.983 0.997 1.000
0Sensitivity difference 0.121 0.062 6.25E-05 -3.49E-04 0.120 0.244
Specificity difference -0.001 0.007 1.17E-05 -0.016 -4.71E-
04 0.013
Sensitivity significance 0.975 0.157 1.76E-04 0.000 1.000 1.000
Specificity significance 0.455 0.498 7.23E-04 0.000 0.000 1.000
(C) Repeatability analysis
The Cochran statistical model used is summarised below. The Cochran Q analysis concluded that there was no significant difference between runs indicating satisfactory repeatability on random independent extracted DNA samples.
Animal A-qPCR A-qPCR A-qPCR Run1 Run2 Run3
Baird Bay 13-1031-2 31.79 33.24 33.01 1 1 1 3
13-1031-3 34.62 33.47 34.82 1 1 1 3
13-1031-4 32.43 33.75 33.69 1 1 1 3
13-1031-5 36.22 37.31 37.54 1 1 1 3
13-1031-6 26.56 27.30 27.71 1 1 1 3
13-1031-7 31.40 32.28 32.04 1 1 1 3
13-1031-10 32.78 34.00 33.99 1 1 1 3
13-1031-12 34.05 34.81 34.98 1 1 1 3
13-1031-13 28.24 28.91 29.05 1 1 1 3
13-1031-15 32.46 32.93 33.06 1 1 1 3
13-1031-16 37.15 37.54 37.31 1 1 1 3
13-1031-17 37.31 37.80 38.34 1 1 1 3
Taylor's Island 12-978-01 38.48 40.14 43.10 1 0 0 1
12-978-05 41.29 42.74 40.17 0 0 0 0
12-978-07 37.79 38.47 42.32 1 1 0 2
12-978-08 37.83 38.21 37.57 1 1 1 3
12-978-14 35.25 37.17 35.88 1 1 1 3
12-978-15 33.08 34.10 33.09 1 1 1 3
12-978-16 30.29 31.39 30.23 1 1 1 3
12-978-18 39.72 36.49 35.61 0 1 1 2
12-978-25 35.71 35.84 35.27 1 1 1 3
12-978-29 34.79 35.55 34.29 1 1 1 3
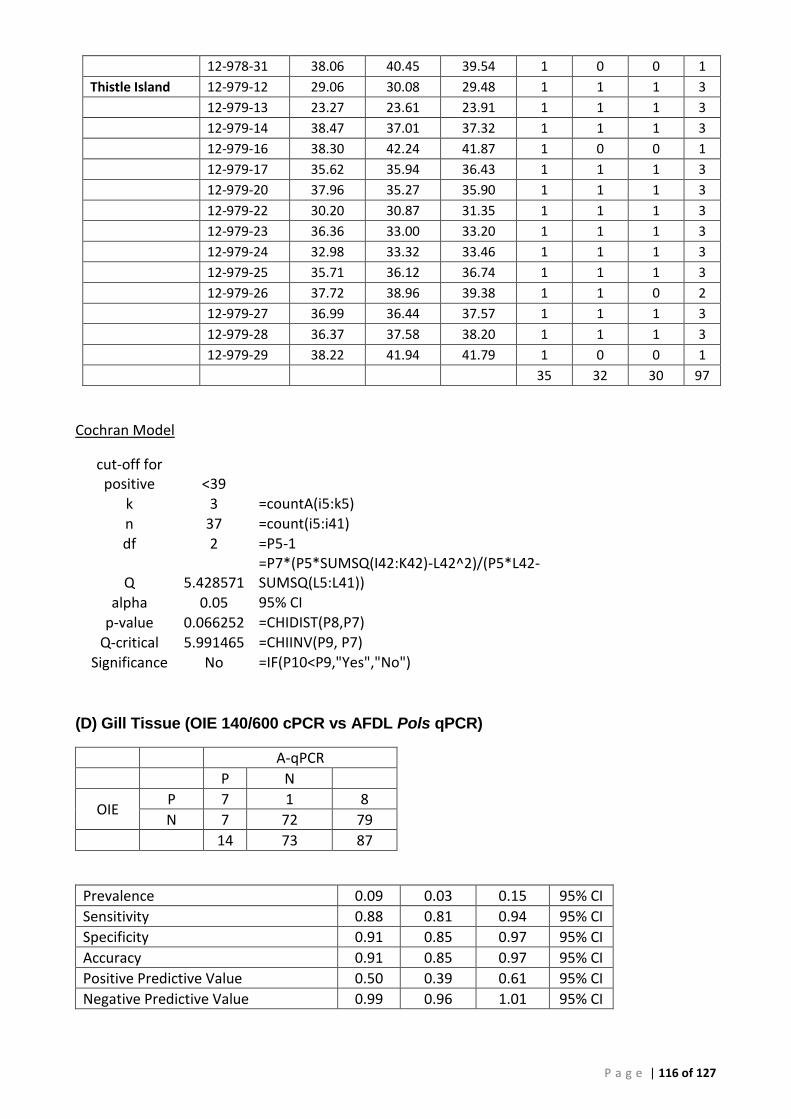
P a g e | 116 of 127
12-978-31 38.06 40.45 39.54 1 0 0 1
Thistle Island 12-979-12 29.06 30.08 29.48 1 1 1 3
12-979-13 23.27 23.61 23.91 1 1 1 3
12-979-14 38.47 37.01 37.32 1 1 1 3
12-979-16 38.30 42.24 41.87 1 0 0 1
12-979-17 35.62 35.94 36.43 1 1 1 3
12-979-20 37.96 35.27 35.90 1 1 1 3
12-979-22 30.20 30.87 31.35 1 1 1 3
12-979-23 36.36 33.00 33.20 1 1 1 3
12-979-24 32.98 33.32 33.46 1 1 1 3
12-979-25 35.71 36.12 36.74 1 1 1 3
12-979-26 37.72 38.96 39.38 1 1 0 2
12-979-27 36.99 36.44 37.57 1 1 1 3
12-979-28 36.37 37.58 38.20 1 1 1 3
12-979-29 38.22 41.94 41.79 1 0 0 1
35 32 30 97
Cochran Model
cut-off for positive <39
k 3 =countA(i5:k5)
n 37 =count(i5:i41)
df 2 =P5-1
Q 5.428571 =P7*(P5*SUMSQ(I42:K42)-L42^2)/(P5*L42-SUMSQ(L5:L41))
alpha 0.05 95% CI
p-value 0.066252 =CHIDIST(P8,P7)
Q-critical 5.991465 =CHIINV(P9, P7)
Significance No =IF(P10<P9,"Yes","No")
(D) Gill Tissue (OIE 140/600 cPCR vs AFDL Pols qPCR)
A-qPCR
P N
OIE P 7 1 8
N 7 72 79
14 73 87
Prevalence 0.09 0.03 0.15 95% CI
Sensitivity 0.88 0.81 0.94 95% CI
Specificity 0.91 0.85 0.97 95% CI
Accuracy 0.91 0.85 0.97 95% CI
Positive Predictive Value 0.50 0.39 0.61 95% CI
Negative Predictive Value 0.99 0.96 1.01 95% CI

P a g e | 117 of 127
Muscle Tissue (OIE 140/600 cPCR vs AFDL Pols qPCR)
A-qPCR
P N
OIE P 11 1
N 12 74
98
Prevalence 0.12 0.06 0.19 95% CI
Sensitivity 0.92 0.86 0.97 95% CI
Specificity 0.86 0.79 0.93 95% CI
Accuracy 0.87 0.80 0.93 95% CI
Positive Predictive Value 0.48 0.38 0.58 95% CI
Negative Predictive Value 0.99 0.96 1.01 95% CI
Gill vs Muscle
Muscle
P N
Gill P 3 11
N 12 61
87
Prevalence 0.16 0.08 0.24 95% CI
Sensitivity 0.21 0.13 0.30 95% CI
Specificity 0.84 0.76 0.91 95% CI
Accuracy 0.74 0.64 0.83 95% CI
Positive Predictive Value 0.20 0.12 0.28 95% CI
Negative Predictive Value 0.85 0.77 0.92 95% CI
Kappa value 0.05 -0.29 0.38 95% CI
Combined Gill & Muscle (OIE 140/600 cPCR vs AFDL Pols qPCR)
AFDL Pols qPCR
P N
OIE P 11 1
N 13 62
87
Prevalence 0.14 0.07 0.21 95% CI
Sensitivity 0.92 0.86 0.97 95% CI
Specificity 0.83 0.75 0.91 95% CI
Accuracy 0.84 0.76 0.92 95% CI
Positive Predictive Value 0.46 0.35 0.56 95% CI
Negative Predictive Value 0.98 0.96 1.01 95% CI
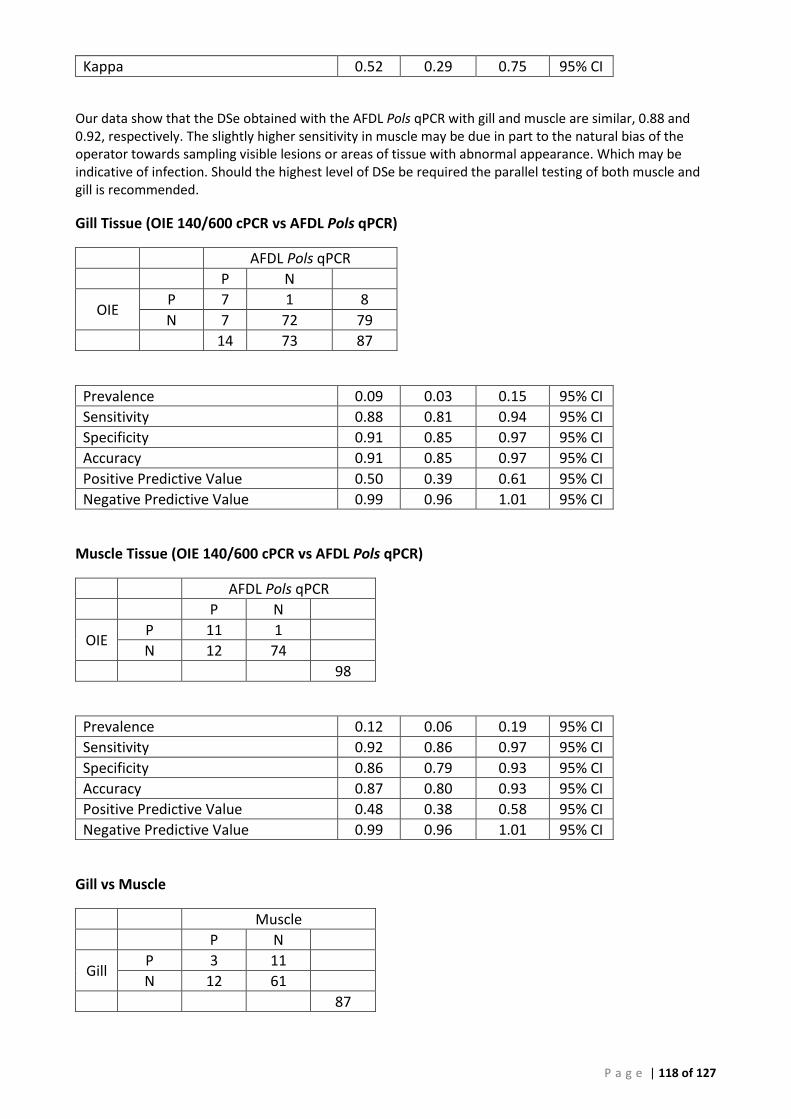
P a g e | 118 of 127
Kappa 0.52 0.29 0.75 95% CI
Our data show that the DSe obtained with the AFDL Pols qPCR with gill and muscle are similar, 0.88 and 0.92, respectively. The slightly higher sensitivity in muscle may be due in part to the natural bias of the operator towards sampling visible lesions or areas of tissue with abnormal appearance. Which may be indicative of infection. Should the highest level of DSe be required the parallel testing of both muscle and gill is recommended.
Gill Tissue (OIE 140/600 cPCR vs AFDL Pols qPCR)
AFDL Pols qPCR
P N
OIE P 7 1 8
N 7 72 79
14 73 87
Prevalence 0.09 0.03 0.15 95% CI
Sensitivity 0.88 0.81 0.94 95% CI
Specificity 0.91 0.85 0.97 95% CI
Accuracy 0.91 0.85 0.97 95% CI
Positive Predictive Value 0.50 0.39 0.61 95% CI
Negative Predictive Value 0.99 0.96 1.01 95% CI
Muscle Tissue (OIE 140/600 cPCR vs AFDL Pols qPCR)
AFDL Pols qPCR
P N
OIE P 11 1
N 12 74
98
Prevalence 0.12 0.06 0.19 95% CI
Sensitivity 0.92 0.86 0.97 95% CI
Specificity 0.86 0.79 0.93 95% CI
Accuracy 0.87 0.80 0.93 95% CI
Positive Predictive Value 0.48 0.38 0.58 95% CI
Negative Predictive Value 0.99 0.96 1.01 95% CI
Gill vs Muscle
Muscle
P N
Gill P 3 11
N 12 61
87
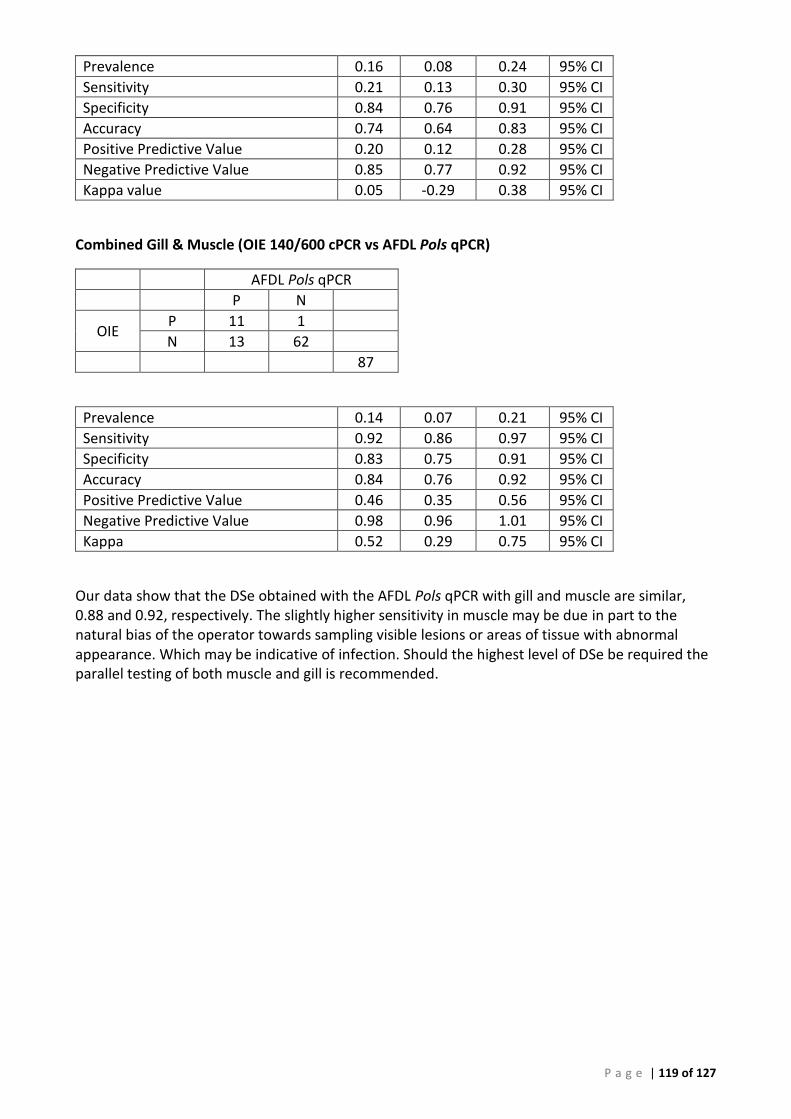
P a g e | 119 of 127
Prevalence 0.16 0.08 0.24 95% CI
Sensitivity 0.21 0.13 0.30 95% CI
Specificity 0.84 0.76 0.91 95% CI
Accuracy 0.74 0.64 0.83 95% CI
Positive Predictive Value 0.20 0.12 0.28 95% CI
Negative Predictive Value 0.85 0.77 0.92 95% CI
Kappa value 0.05 -0.29 0.38 95% CI
Combined Gill & Muscle (OIE 140/600 cPCR vs AFDL Pols qPCR)
AFDL Pols qPCR
P N
OIE P 11 1
N 13 62
87
Prevalence 0.14 0.07 0.21 95% CI
Sensitivity 0.92 0.86 0.97 95% CI
Specificity 0.83 0.75 0.91 95% CI
Accuracy 0.84 0.76 0.92 95% CI
Positive Predictive Value 0.46 0.35 0.56 95% CI
Negative Predictive Value 0.98 0.96 1.01 95% CI
Kappa 0.52 0.29 0.75 95% CI
Our data show that the DSe obtained with the AFDL Pols qPCR with gill and muscle are similar, 0.88 and 0.92, respectively. The slightly higher sensitivity in muscle may be due in part to the natural bias of the operator towards sampling visible lesions or areas of tissue with abnormal appearance. Which may be indicative of infection. Should the highest level of DSe be required the parallel testing of both muscle and gill is recommended.
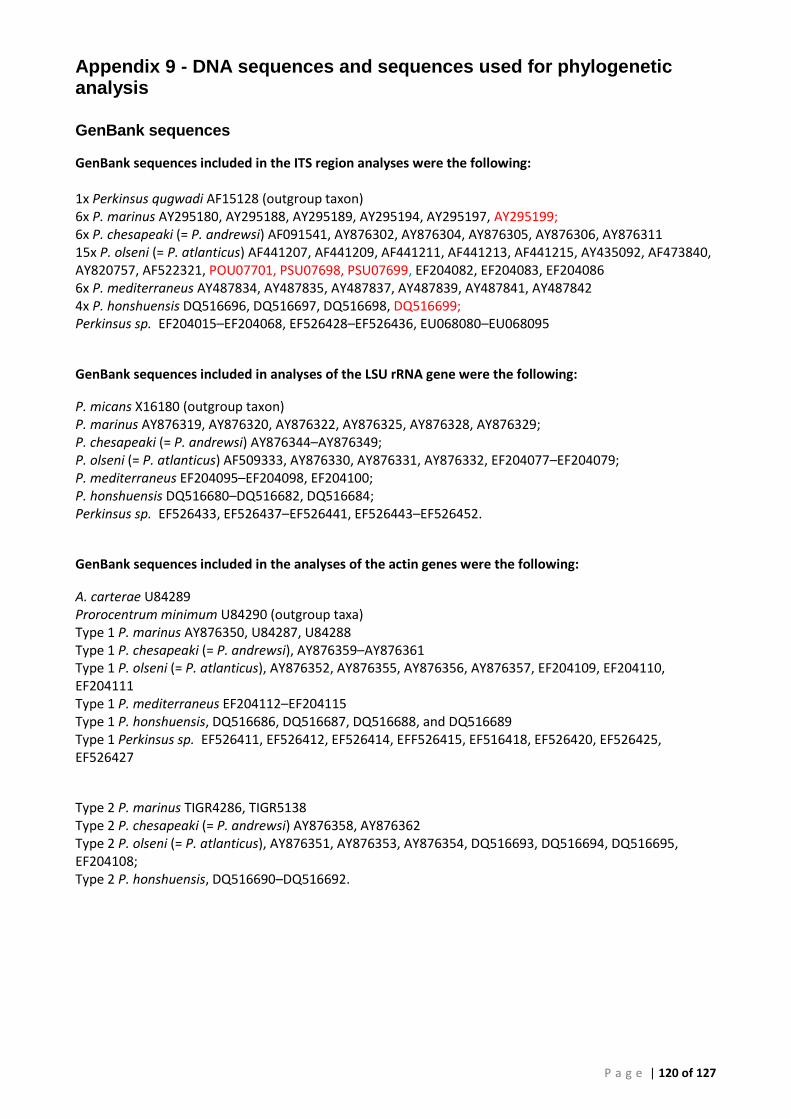
P a g e | 120 of 127
Appendix 9 - DNA sequences and sequences used for phylogenetic analysis
GenBank sequences
GenBank sequences included in the ITS region analyses were the following: 1x Perkinsus qugwadi AF15128 (outgroup taxon) 6x P. marinus AY295180, AY295188, AY295189, AY295194, AY295197, AY295199; 6x P. chesapeaki (= P. andrewsi) AF091541, AY876302, AY876304, AY876305, AY876306, AY876311 15x P. olseni (= P. atlanticus) AF441207, AF441209, AF441211, AF441213, AF441215, AY435092, AF473840, AY820757, AF522321, POU07701, PSU07698, PSU07699, EF204082, EF204083, EF204086 6x P. mediterraneus AY487834, AY487835, AY487837, AY487839, AY487841, AY487842 4x P. honshuensis DQ516696, DQ516697, DQ516698, DQ516699; Perkinsus sp. EF204015–EF204068, EF526428–EF526436, EU068080–EU068095
GenBank sequences included in analyses of the LSU rRNA gene were the following:
P. micans X16180 (outgroup taxon) P. marinus AY876319, AY876320, AY876322, AY876325, AY876328, AY876329; P. chesapeaki (= P. andrewsi) AY876344–AY876349; P. olseni (= P. atlanticus) AF509333, AY876330, AY876331, AY876332, EF204077–EF204079; P. mediterraneus EF204095–EF204098, EF204100; P. honshuensis DQ516680–DQ516682, DQ516684; Perkinsus sp. EF526433, EF526437–EF526441, EF526443–EF526452.
GenBank sequences included in the analyses of the actin genes were the following:
A. carterae U84289 Prorocentrum minimum U84290 (outgroup taxa) Type 1 P. marinus AY876350, U84287, U84288 Type 1 P. chesapeaki (= P. andrewsi), AY876359–AY876361 Type 1 P. olseni (= P. atlanticus), AY876352, AY876355, AY876356, AY876357, EF204109, EF204110, EF204111 Type 1 P. mediterraneus EF204112–EF204115 Type 1 P. honshuensis, DQ516686, DQ516687, DQ516688, and DQ516689 Type 1 Perkinsus sp. EF526411, EF526412, EF526414, EFF526415, EF516418, EF526420, EF526425, EF526427
Type 2 P. marinus TIGR4286, TIGR5138 Type 2 P. chesapeaki (= P. andrewsi) AY876358, AY876362 Type 2 P. olseni (= P. atlanticus), AY876351, AY876353, AY876354, DQ516693, DQ516694, DQ516695, EF204108; Type 2 P. honshuensis, DQ516690–DQ516692.
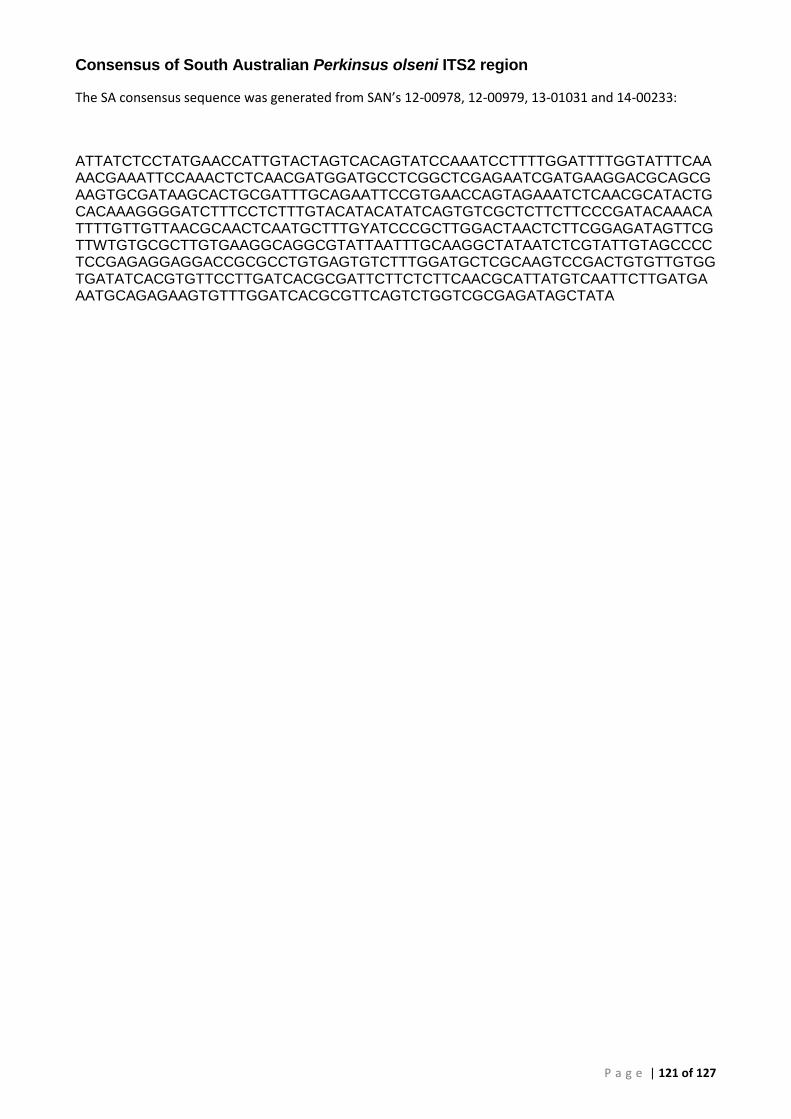
P a g e | 121 of 127
Consensus of South Australian Perkinsus olseni ITS2 region
The SA consensus sequence was generated from SAN’s 12-00978, 12-00979, 13-01031 and 14-00233:
ATTATCTCCTATGAACCATTGTACTAGTCACAGTATCCAAATCCTTTTGGATTTTGGTATTTCAAAACGAAATTCCAAACTCTCAACGATGGATGCCTCGGCTCGAGAATCGATGAAGGACGCAGCGAAGTGCGATAAGCACTGCGATTTGCAGAATTCCGTGAACCAGTAGAAATCTCAACGCATACTGCACAAAGGGGATCTTTCCTCTTTGTACATACATATCAGTGTCGCTCTTCTTCCCGATACAAACATTTTGTTGTTAACGCAACTCAATGCTTTGYATCCCGCTTGGACTAACTCTTCGGAGATAGTTCGTTWTGTGCGCTTGTGAAGGCAGGCGTATTAATTTGCAAGGCTATAATCTCGTATTGTAGCCCCTCCGAGAGGAGGACCGCGCCTGTGAGTGTCTTTGGATGCTCGCAAGTCCGACTGTGTTGTGGTGATATCACGTGTTCCTTGATCACGCGATTCTTCTCTTCAACGCATTATGTCAATTCTTGATGAAATGCAGAGAAGTGTTTGGATCACGCGTTCAGTCTGGTCGCGAGATAGCTATA
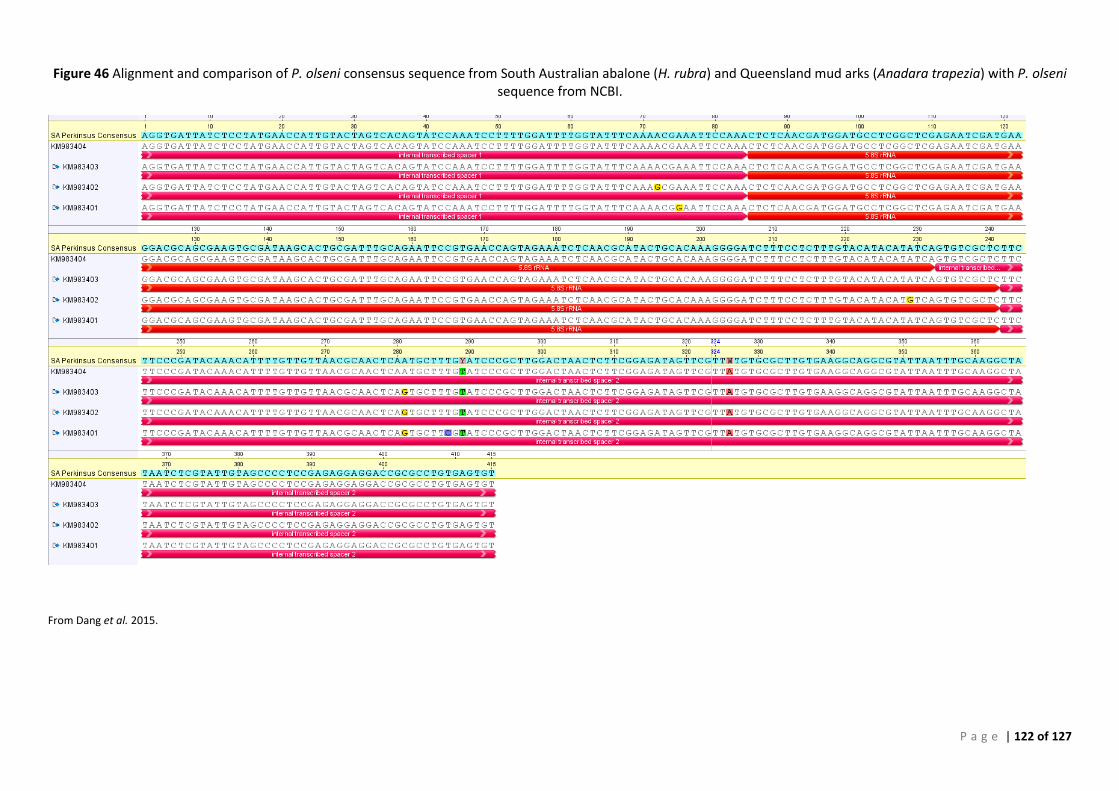
P a g e | 122 of 127
Figure 46 Alignment and comparison of P. olseni consensus sequence from South Australian abalone (H. rubra) and Queensland mud arks (Anadara trapezia) with P. olseni sequence from NCBI.
From Dang et al. 2015.
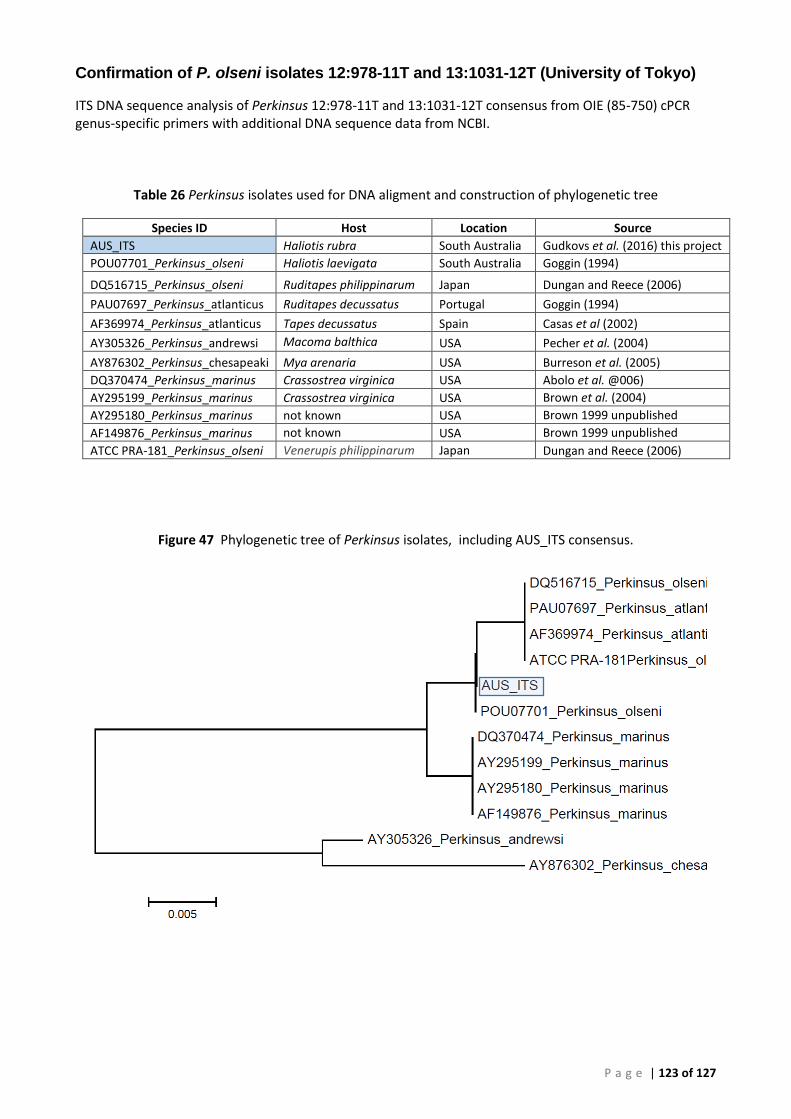
P a g e | 123 of 127
Confirmation of P. olseni isolates 12:978-11T and 13:1031-12T (University of Tokyo)
ITS DNA sequence analysis of Perkinsus 12:978-11T and 13:1031-12T consensus from OIE (85-750) cPCR genus-specific primers with additional DNA sequence data from NCBI.
Table 26 Perkinsus isolates used for DNA aligment and construction of phylogenetic tree
Species ID Host Location Source
AUS_ITS Haliotis rubra South Australia Gudkovs et al. (2016) this project
POU07701_Perkinsus_olseni Haliotis laevigata South Australia Goggin (1994)
DQ516715_Perkinsus_olseni Ruditapes philippinarum Japan Dungan and Reece (2006)
PAU07697_Perkinsus_atlanticus Ruditapes decussatus Portugal Goggin (1994)
AF369974_Perkinsus_atlanticus Tapes decussatus Spain Casas et al (2002)
AY305326_Perkinsus_andrewsi Macoma balthica USA Pecher et al. (2004)
AY876302_Perkinsus_chesapeaki Mya arenaria USA Burreson et al. (2005)
DQ370474_Perkinsus_marinus Crassostrea virginica USA Abolo et al. @006)
AY295199_Perkinsus_marinus Crassostrea virginica USA Brown et al. (2004)
AY295180_Perkinsus_marinus not known USA Brown 1999 unpublished
AF149876_Perkinsus_marinus not known USA Brown 1999 unpublished
ATCC PRA-181_Perkinsus_olseni Venerupis philippinarum Japan Dungan and Reece (2006)
Figure 47 Phylogenetic tree of Perkinsus isolates, including AUS_ITS consensus.
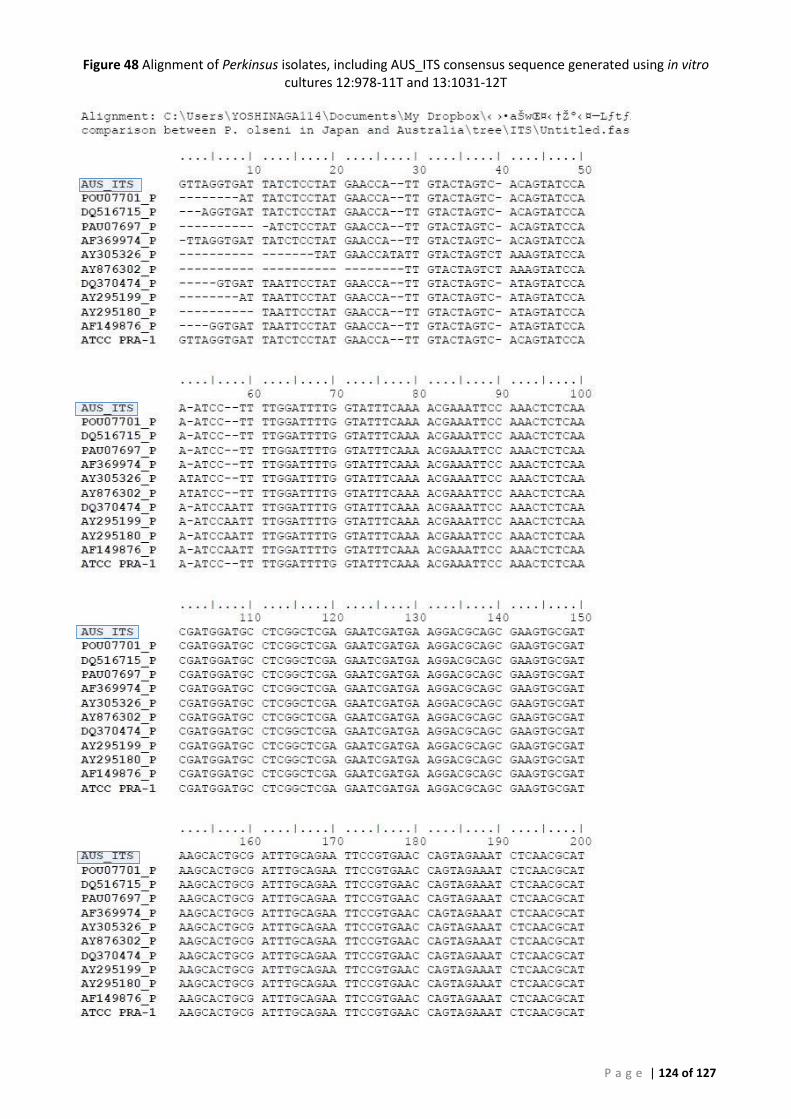
P a g e | 124 of 127
Figure 48 Alignment of Perkinsus isolates, including AUS_ITS consensus sequence generated using in vitro cultures 12:978-11T and 13:1031-12T
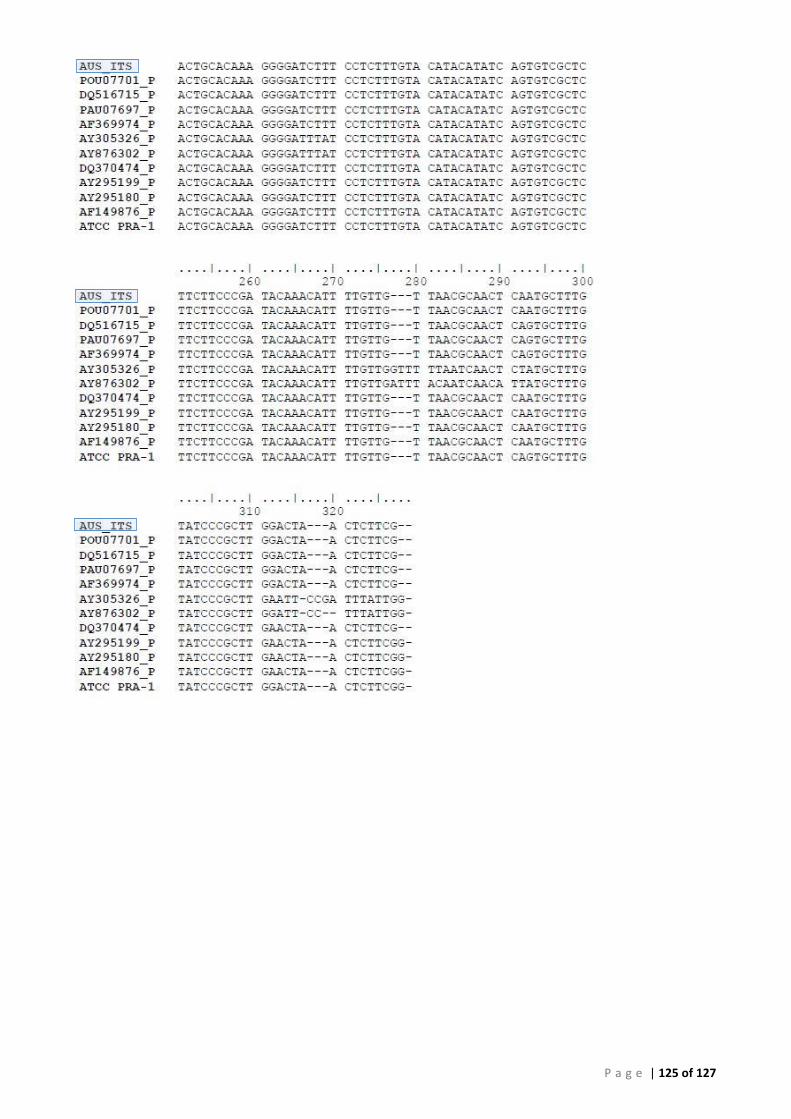
P a g e | 125 of 127