Embed Size (px)
Citation preview
1
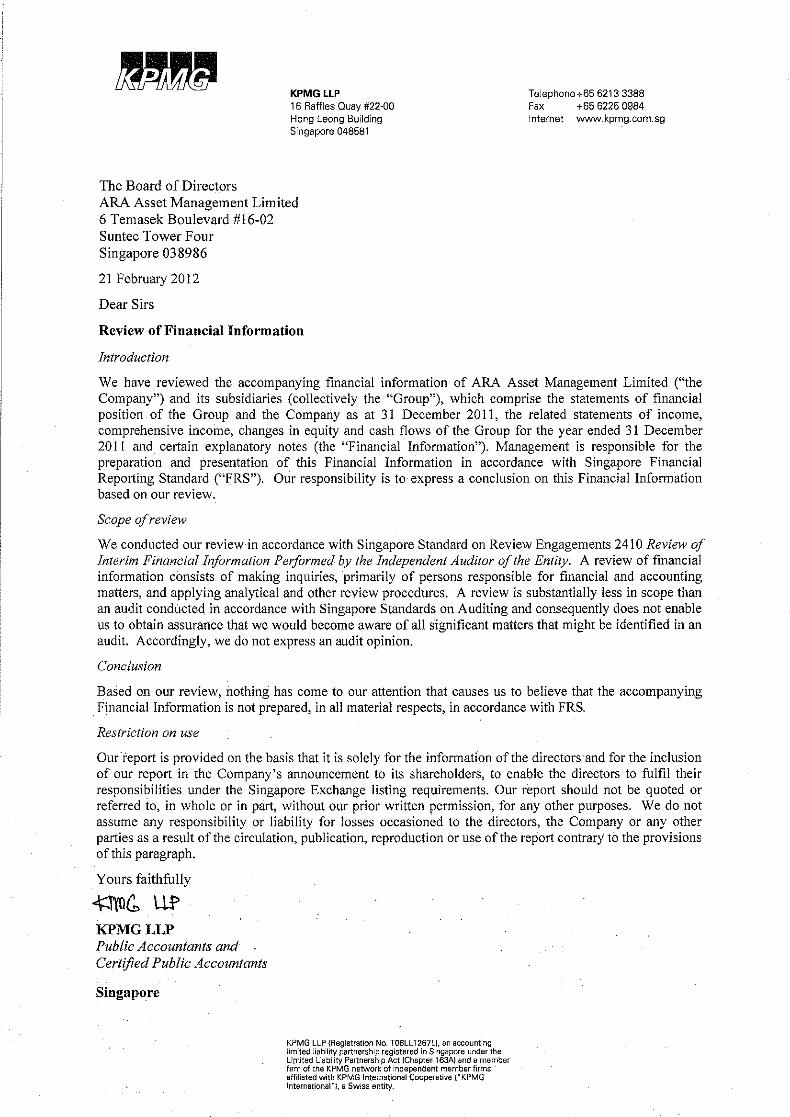
ARA ASSET MANAGEMENT LIMITED FINANCIAL STATEMENTS ANNOUNCEMENT FINANCIAL RESULTS FOR THE YEAR ENDED 31 DECEMBER 2011 The financial information for the year ended 31 December 2011 in the announcement have been extracted from the financial statements for the period from 1 January 2011 to 31 December 2011, which have been reviewed by the auditors in accordance with the Singapore Standard on Review Engagements 2410. ARA Asset Management Limited (“ARA” or the “Group”) is a real estate fund management company listed on the main board of the Singapore Exchange Securities Trading Limited (“SGX-ST”). The ARA Group comprises four primary business segments:
Real estate investment trusts (“REITs”); Private real estate funds; Real estate management services; and Corporate finance advisory services.
ARA currently manages REITs listed in Singapore, Hong Kong and Malaysia with a diversified portfolio spanning the office, retail, industrial/office and logistics sectors; private real estate funds investing in real estate in Asia; and provides real estate management services, including property management services and convention & exhibition services; and corporate finance advisory services.
Asset Management Limited
Financial Statements Announcement For the financial year ended 31 December 2011
2
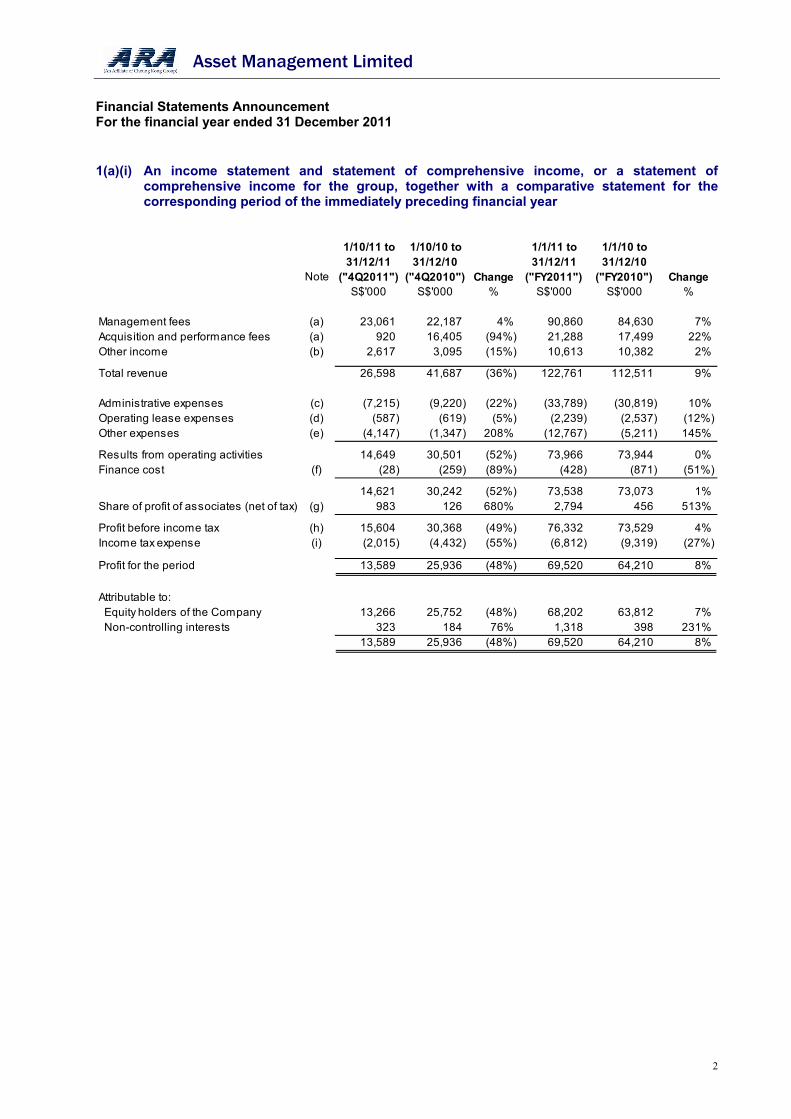
1(a)(i) An income statement and statement of comprehensive income, or a statement of
comprehensive income for the group, together with a comparative statement for the corresponding period of the immediately preceding financial year
1/10/11 to 1/10/10 to 1/1/11 to 1/1/10 to31/12/11 31/12/10 31/12/11 31/12/10
Note ("4Q2011") ("4Q2010") Change ("FY2011") ("FY2010") ChangeS$'000 S$'000 % S$'000 S$'000 %
Management fees (a) 23,061 22,187 4% 90,860 84,630 7% Acquisition and performance fees (a) 920 16,405 (94%) 21,288 17,499 22% Other income (b) 2,617 3,095 (15%) 10,613 10,382 2%
Total revenue 26,598 41,687 (36%) 122,761 112,511 9%
Administrative expenses (c) (7,215) (9,220) (22%) (33,789) (30,819) 10% Operating lease expenses (d) (587) (619) (5%) (2,239) (2,537) (12%)Other expenses (e) (4,147) (1,347) 208% (12,767) (5,211) 145%
Results from operating activities 14,649 30,501 (52%) 73,966 73,944 0% Finance cost (f) (28) (259) (89%) (428) (871) (51%)
14,621 30,242 (52%) 73,538 73,073 1% Share of profit of associates (net of tax) (g) 983 126 680% 2,794 456 513%
Profit before income tax (h) 15,604 30,368 (49%) 76,332 73,529 4% Income tax expense (i) (2,015) (4,432) (55%) (6,812) (9,319) (27%)
Profit for the period 13,589 25,936 (48%) 69,520 64,210 8%
Attributable to: Equity holders of the Company 13,266 25,752 (48%) 68,202 63,812 7% Non-controlling interests 323 184 76% 1,318 398 231%
13,589 25,936 (48%) 69,520 64,210 8%
Asset Management Limited
Financial Statements Announcement For the financial year ended 31 December 2011
3
1(a)(ii) Explanatory notes to the income statement
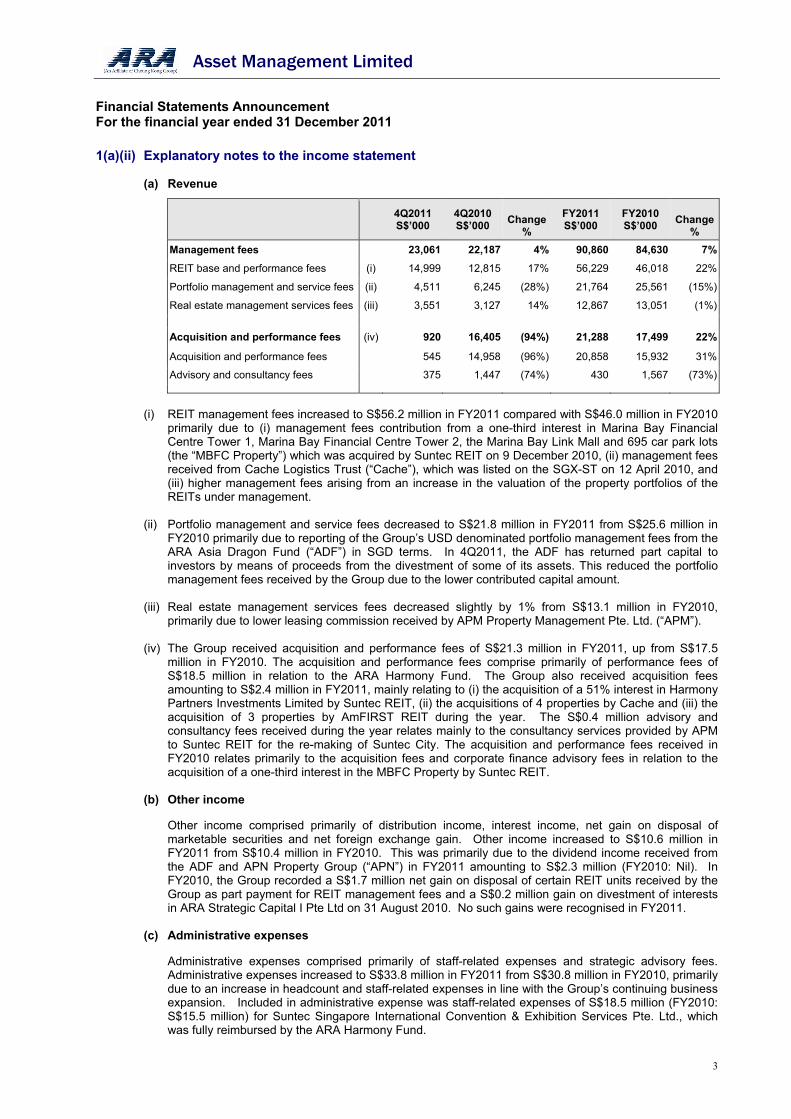
(a) Revenue
4Q2011 S$’000
4Q2010 S$’000
Change
%
FY2011 S$’000
FY2010 S$’000
Change
%
Management fees 23,061 22,187 4% 90,860 84,630 7%
REIT base and performance fees (i) 14,999 12,815 17% 56,229 46,018 22%
Portfolio management and service fees (ii) 4,511 6,245 (28%) 21,764 25,561 (15%)
Real estate management services fees (iii) 3,551 3,127 14% 12,867 13,051 (1%)
Acquisition and performance fees (iv) 920 16,405 (94%) 21,288 17,499 22%
Acquisition and performance fees 545 14,958 (96%) 20,858 15,932 31%
Advisory and consultancy fees 375 1,447 (74%) 430 1,567 (73%)
(i) REIT management fees increased to S$56.2 million in FY2011 compared with S$46.0 million in FY2010
primarily due to (i) management fees contribution from a one-third interest in Marina Bay Financial Centre Tower 1, Marina Bay Financial Centre Tower 2, the Marina Bay Link Mall and 695 car park lots (the “MBFC Property”) which was acquired by Suntec REIT on 9 December 2010, (ii) management fees received from Cache Logistics Trust (“Cache”), which was listed on the SGX-ST on 12 April 2010, and (iii) higher management fees arising from an increase in the valuation of the property portfolios of the REITs under management.
(ii) Portfolio management and service fees decreased to S$21.8 million in FY2011 from S$25.6 million in
FY2010 primarily due to reporting of the Group’s USD denominated portfolio management fees from the ARA Asia Dragon Fund (“ADF”) in SGD terms. In 4Q2011, the ADF has returned part capital to investors by means of proceeds from the divestment of some of its assets. This reduced the portfolio management fees received by the Group due to the lower contributed capital amount.
(iii) Real estate management services fees decreased slightly by 1% from S$13.1 million in FY2010,
primarily due to lower leasing commission received by APM Property Management Pte. Ltd. (“APM”).
(iv) The Group received acquisition and performance fees of S$21.3 million in FY2011, up from S$17.5 million in FY2010. The acquisition and performance fees comprise primarily of performance fees of S$18.5 million in relation to the ARA Harmony Fund. The Group also received acquisition fees amounting to S$2.4 million in FY2011, mainly relating to (i) the acquisition of a 51% interest in Harmony Partners Investments Limited by Suntec REIT, (ii) the acquisitions of 4 properties by Cache and (iii) the acquisition of 3 properties by AmFIRST REIT during the year. The S$0.4 million advisory and consultancy fees received during the year relates mainly to the consultancy services provided by APM to Suntec REIT for the re-making of Suntec City. The acquisition and performance fees received in FY2010 relates primarily to the acquisition fees and corporate finance advisory fees in relation to the acquisition of a one-third interest in the MBFC Property by Suntec REIT.
(b) Other income
Other income comprised primarily of distribution income, interest income, net gain on disposal of marketable securities and net foreign exchange gain. Other income increased to S$10.6 million in FY2011 from S$10.4 million in FY2010. This was primarily due to the dividend income received from the ADF and APN Property Group (“APN”) in FY2011 amounting to S$2.3 million (FY2010: Nil). In FY2010, the Group recorded a S$1.7 million net gain on disposal of certain REIT units received by the Group as part payment for REIT management fees and a S$0.2 million gain on divestment of interests in ARA Strategic Capital I Pte Ltd on 31 August 2010. No such gains were recognised in FY2011.
(c) Administrative expenses
Administrative expenses comprised primarily of staff-related expenses and strategic advisory fees. Administrative expenses increased to S$33.8 million in FY2011 from S$30.8 million in FY2010, primarily due to an increase in headcount and staff-related expenses in line with the Group’s continuing business expansion. Included in administrative expense was staff-related expenses of S$18.5 million (FY2010: S$15.5 million) for Suntec Singapore International Convention & Exhibition Services Pte. Ltd., which was fully reimbursed by the ARA Harmony Fund.
Asset Management Limited
Financial Statements Announcement For the financial year ended 31 December 2011
4
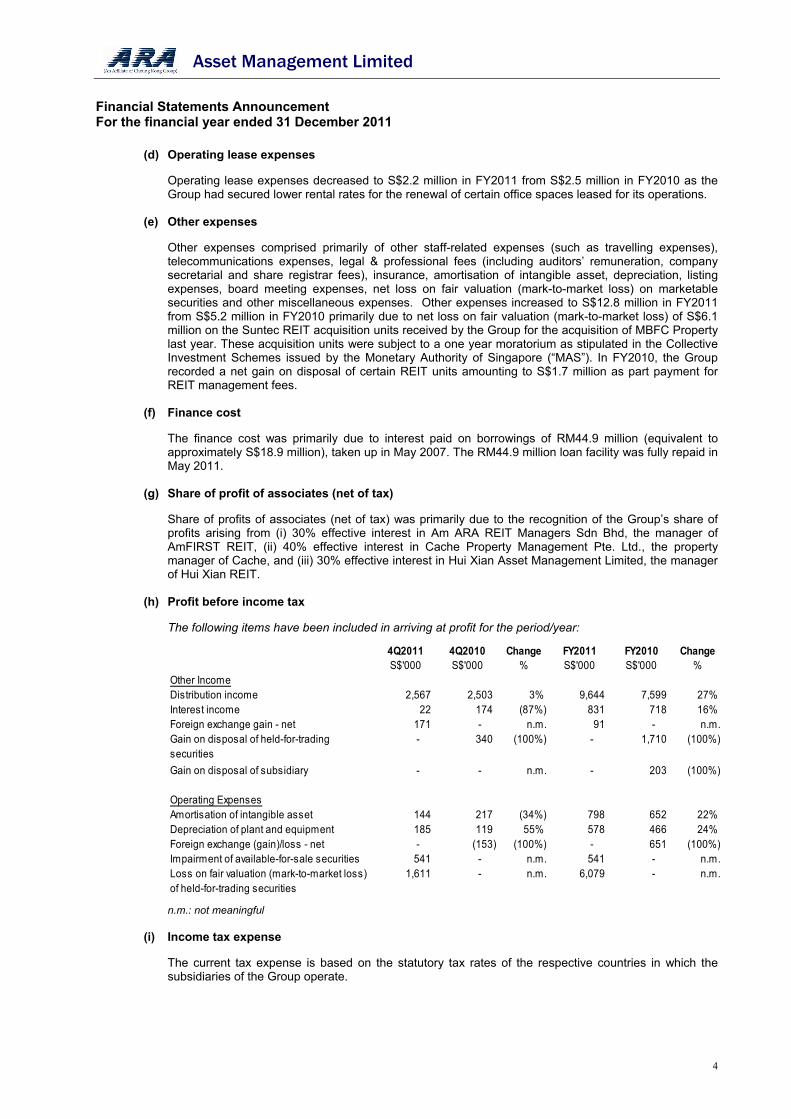
(d) Operating lease expenses
Operating lease expenses decreased to S$2.2 million in FY2011 from S$2.5 million in FY2010 as the Group had secured lower rental rates for the renewal of certain office spaces leased for its operations.
(e) Other expenses
Other expenses comprised primarily of other staff-related expenses (such as travelling expenses), telecommunications expenses, legal & professional fees (including auditors’ remuneration, company secretarial and share registrar fees), insurance, amortisation of intangible asset, depreciation, listing expenses, board meeting expenses, net loss on fair valuation (mark-to-market loss) on marketable securities and other miscellaneous expenses. Other expenses increased to S$12.8 million in FY2011 from S$5.2 million in FY2010 primarily due to net loss on fair valuation (mark-to-market loss) of S$6.1 million on the Suntec REIT acquisition units received by the Group for the acquisition of MBFC Property last year. These acquisition units were subject to a one year moratorium as stipulated in the Collective Investment Schemes issued by the Monetary Authority of Singapore (“MAS”). In FY2010, the Group recorded a net gain on disposal of certain REIT units amounting to S$1.7 million as part payment for REIT management fees.
(f) Finance cost
The finance cost was primarily due to interest paid on borrowings of RM44.9 million (equivalent to approximately S$18.9 million), taken up in May 2007. The RM44.9 million loan facility was fully repaid in May 2011.
(g) Share of profit of associates (net of tax)
Share of profits of associates (net of tax) was primarily due to the recognition of the Group’s share of profits arising from (i) 30% effective interest in Am ARA REIT Managers Sdn Bhd, the manager of AmFIRST REIT, (ii) 40% effective interest in Cache Property Management Pte. Ltd., the property manager of Cache, and (iii) 30% effective interest in Hui Xian Asset Management Limited, the manager of Hui Xian REIT.
(h) Profit before income tax
The following items have been included in arriving at profit for the period/year:
4Q2011 4Q2010 Change FY2011 FY2010 ChangeS$'000 S$'000 % S$'000 S$'000 %
Other IncomeDistribution income 2,567 2,503 3% 9,644 7,599 27% Interest income 22 174 (87%) 831 718 16% Foreign exchange gain - net 171 - n.m. 91 - n.m.Gain on disposal of held-for-trading securities
- 340 (100%) - 1,710 (100%)
Gain on disposal of subsidiary - - n.m. - 203 (100%)
Operating ExpensesAmortisation of intangible asset 144 217 (34%) 798 652 22% Depreciation of plant and equipment 185 119 55% 578 466 24% Foreign exchange (gain)/loss - net - (153) (100%) - 651 (100%)Impairment of available-for-sale securities 541 - n.m. 541 - n.m.Loss on fair valuation (mark-to-market loss) of held-for-trading securities
1,611 - n.m. 6,079 - n.m.
n.m.: not meaningful
(i) Income tax expense
The current tax expense is based on the statutory tax rates of the respective countries in which the subsidiaries of the Group operate.
Asset Management Limited
Financial Statements Announcement For the financial year ended 31 December 2011
5
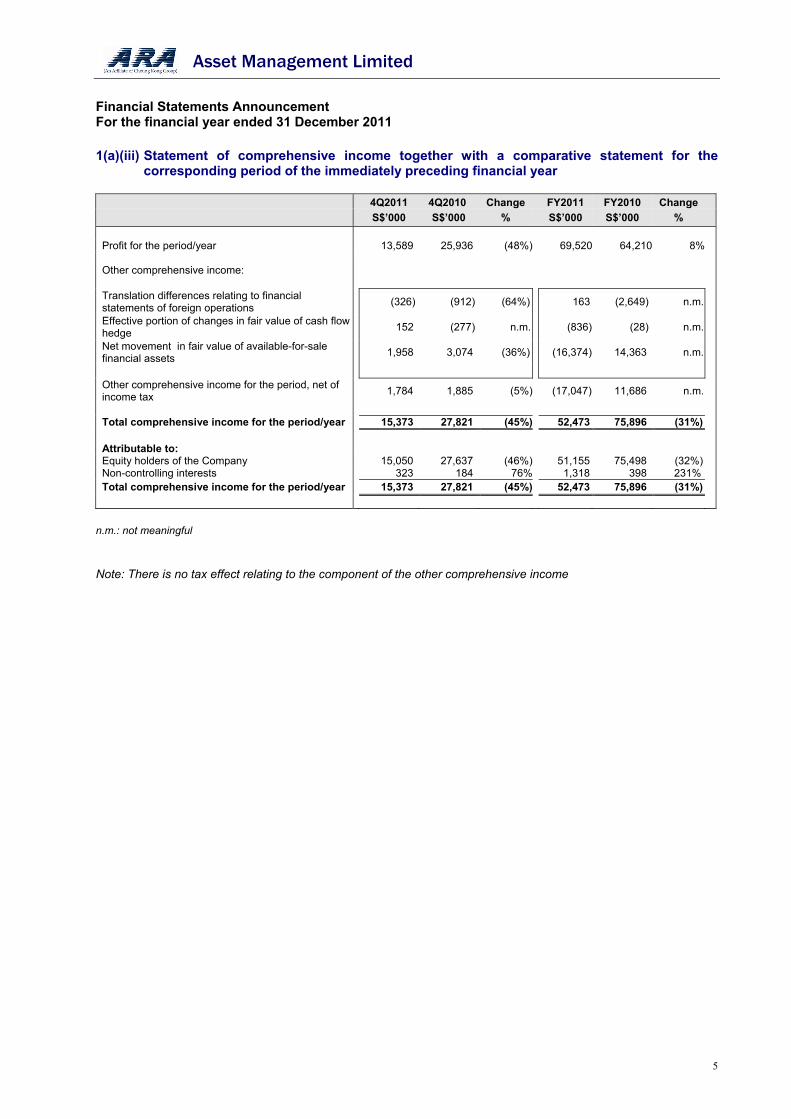
1(a)(iii) Statement of comprehensive income together with a comparative statement for the corresponding period of the immediately preceding financial year
4Q2011 4Q2010 Change FY2011 FY2010 Change
S$’000 S$’000 % S$’000 S$’000 %
Profit for the period/year 13,589 25,936 (48%) 69,520 64,210 8% Other comprehensive income: Translation differences relating to financial statements of foreign operations
(326) (912) (64%) 163 (2,649) n.m.
Effective portion of changes in fair value of cash flow hedge
152 (277) n.m. (836) (28) n.m.
Net movement in fair value of available-for-sale financial assets
1,958 3,074 (36%) (16,374) 14,363 n.m.
Other comprehensive income for the period, net of income tax
1,784 1,885 (5%) (17,047) 11,686 n.m.
Total comprehensive income for the period/year 15,373 27,821 (45%) 52,473 75,896 (31%) Attributable to: Equity holders of the Company 15,050 27,637 (46%) 51,155 75,498 (32%)Non-controlling interests 323 184 76% 1,318 398 231%Total comprehensive income for the period/year 15,373 27,821 (45%) 52,473 75,896 (31%)
n.m.: not meaningful Note: There is no tax effect relating to the component of the other comprehensive income
Asset Management Limited
Financial Statements Announcement For the financial year ended 31 December 2011
6
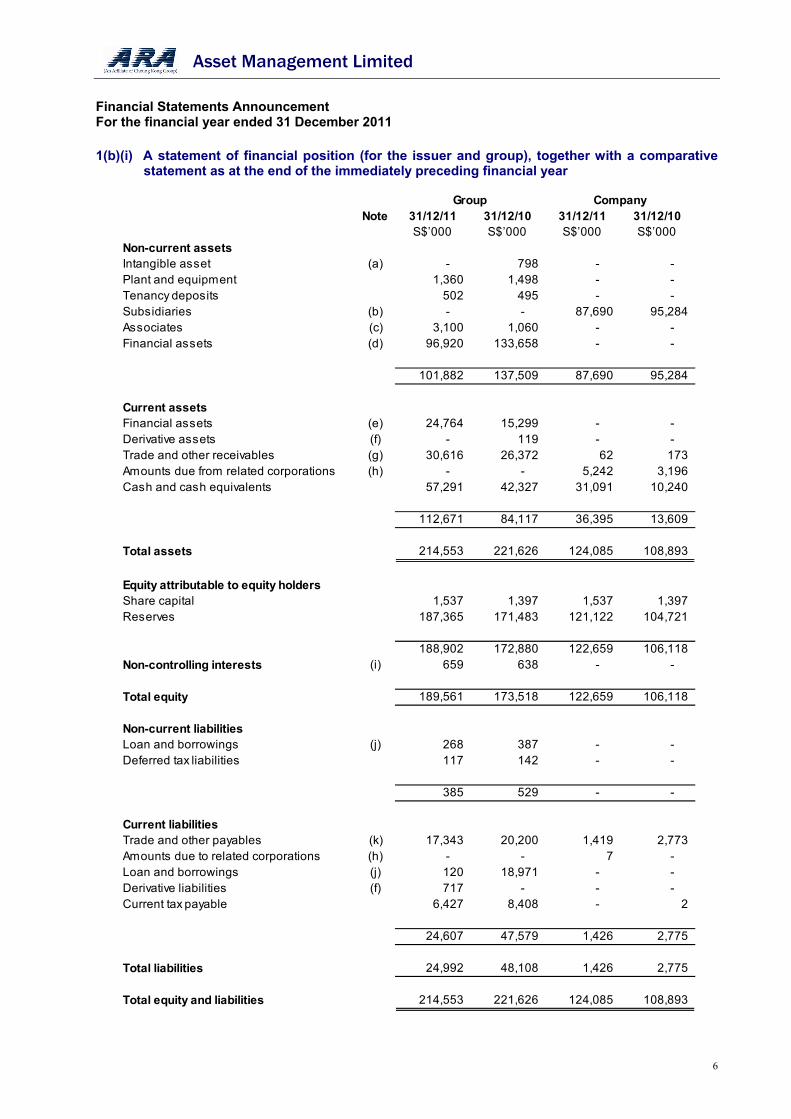
1(b)(i) A statement of financial position (for the issuer and group), together with a comparative statement as at the end of the immediately preceding financial year
Note 31/12/11 31/12/10 31/12/11 31/12/10S$’000 S$’000 S$’000 S$’000
Non-current assetsIntangible asset (a) - 798 - - Plant and equipment 1,360 1,498 - - Tenancy deposits 502 495 - - Subsidiaries (b) - - 87,690 95,284 Associates (c) 3,100 1,060 - - Financial assets (d) 96,920 133,658 - -
101,882 137,509 87,690 95,284
Current assetsFinancial assets (e) 24,764 15,299 - - Derivative assets (f) - 119 - - Trade and other receivables (g) 30,616 26,372 62 173 Amounts due from related corporations (h) - - 5,242 3,196 Cash and cash equivalents 57,291 42,327 31,091 10,240
112,671 84,117 36,395 13,609
Total assets 214,553 221,626 124,085 108,893
Equity attributable to equity holdersShare capital 1,537 1,397 1,537 1,397 Reserves 187,365 171,483 121,122 104,721
188,902 172,880 122,659 106,118 Non-controlling interests (i) 659 638 - -
Total equity 189,561 173,518 122,659 106,118
Non-current liabilitiesLoan and borrowings (j) 268 387 - - Deferred tax liabilities 117 142 - -
385 529 - -
Current liabilitiesTrade and other payables (k) 17,343 20,200 1,419 2,773 Amounts due to related corporations (h) - - 7 - Loan and borrowings (j) 120 18,971 - - Derivative liabilities (f) 717 - - - Current tax payable 6,427 8,408 - 2
24,607 47,579 1,426 2,775
Total liabilities 24,992 48,108 1,426 2,775
Total equity and liabilities 214,553 221,626 124,085 108,893
Group Company
Asset Management Limited
Financial Statements Announcement For the financial year ended 31 December 2011
7
Footnotes:
(a) Intangible asset represents the excess of the cost of the acquisition over the Group’s interest in the net fair value of the identifiable assets, liabilities and contingent liabilities of APM; and is measured at cost less accumulated amortisation and impairment losses. As at 31 December 2011, the intangible asset has been fully amortised.
(b) Interest in subsidiaries comprise equity investments in the Company’s subsidiaries and loans to
subsidiaries where the settlement of the amount is neither planned nor likely to occur in the foreseeable future. In FY2011, the equity investments decreased primarily due to the full settlement of a quasi equity loan of S$8.0 million in relation to the Group’s participation in a mezzanine loan to the ARA Harmony Fund to part finance its acquisition of Suntec Singapore.
(c) Interest in associates relates to the Group’s 40% equity interest in Cache Property Management Pte.
Ltd., and 30% equity interest in Am ARA REIT Holdings Sdn. Bhd., Am ARA REIT Managers Sdn. Bhd., World Deluxe Enterprises Limited, Hui Xian Asset Management Limited and Beijing Hui Xian Enterprise Services Limited.
(d) Non-current financial assets as at 31 December 2011 comprise (i) 34.1 million Suntec REIT units held by the Group as a strategic stake and which have been pledged as security for a credit facility (see 1(b)(ii) – Details of any collateral); (ii) 11.9 million Cache units held by the Group as a strategic stake, (iii) 23.1 million AmFIRST REIT units (31 December 2010: 53.7 million) held by the Group as strategic stake; (iv) seed capital investment in the ARA Asia Dragon Fund (“ADF”); (v) investment in the ARA Asian Asset Income Fund (“AAIF”); and (vi) a 13.9% strategic stake in APN Property Group Limited (“APN”). The mezzanine loan to the ARA Harmony Fund to part finance its acquisition of Suntec Singapore has been fully repaid in FY2011 (31 December 2010: S$8.0 million).
(e) Current financial assets as at 31 December 2011 comprise (i) REIT units received by the Group as part
payment for REIT management fees, (ii) REIT units received by the Group as payment of acquisition fees for the acquisition by Suntec REIT of a one-third interest in the MBFC Property which was completed on 9 December 2010, and (iii) REIT units received by the Group as payment of acquisition fees for the acquisition of Jinshan Chemical Warehouse by Cache, which was completed on 15 June 2011. The REIT units received as payment for acquisition fees are subject to a one-year moratorium as stipulated in the Code on Collective Investment Schemes issued by the Monetary Authority of Singapore.
(f) Derivative assets / liabilities relate to the fair value of foreign currency forward contracts entered into by
the Group to hedge the Group’s foreign currency exposure. (g) Trade and other receivables comprise accrued fees receivable, deposits, prepayments and other
receivables. The increase in trade and other receivables is primarily due to the increase in accrued REIT management fees and receivables from real estate management services fees.
(h) Amounts due from related corporations relate mainly to advances to subsidiaries and amounts paid on
behalf by related corporations. (i) Non-controlling interest relates to the non-controlling shareholders’ proportionate interest in ARA-CWT
Trust Management (Cache) Limited, ARA Managers (Silver) Pte. Ltd. and ARA Fund Management (Silver) Limited. As at 31 December 2011, ARA Fund Management (Silver) Limited and ARA Managers (Silver) Pte Ltd have respectively completed its members’ voluntary winding-up proceedings and made an application to be struck off from the Register of the Accounting and Corporate Regulatory Authority of Singapore.
(j) Loan and borrowings as at 31 December 2011 relate to finance lease liabilities for the purchase of
certain plant and equipment.
(k) Trade and other payables comprise accrued fees payable, net GST output tax payable, provision for staff related benefits to employees and other payables. The decrease in trade and other payables was primarily due to payment of FY2011 bonus before the year end as compared to FY2010 where bonus payment was made after year end.
Asset Management Limited
Financial Statements Announcement For the financial year ended 31 December 2011
8
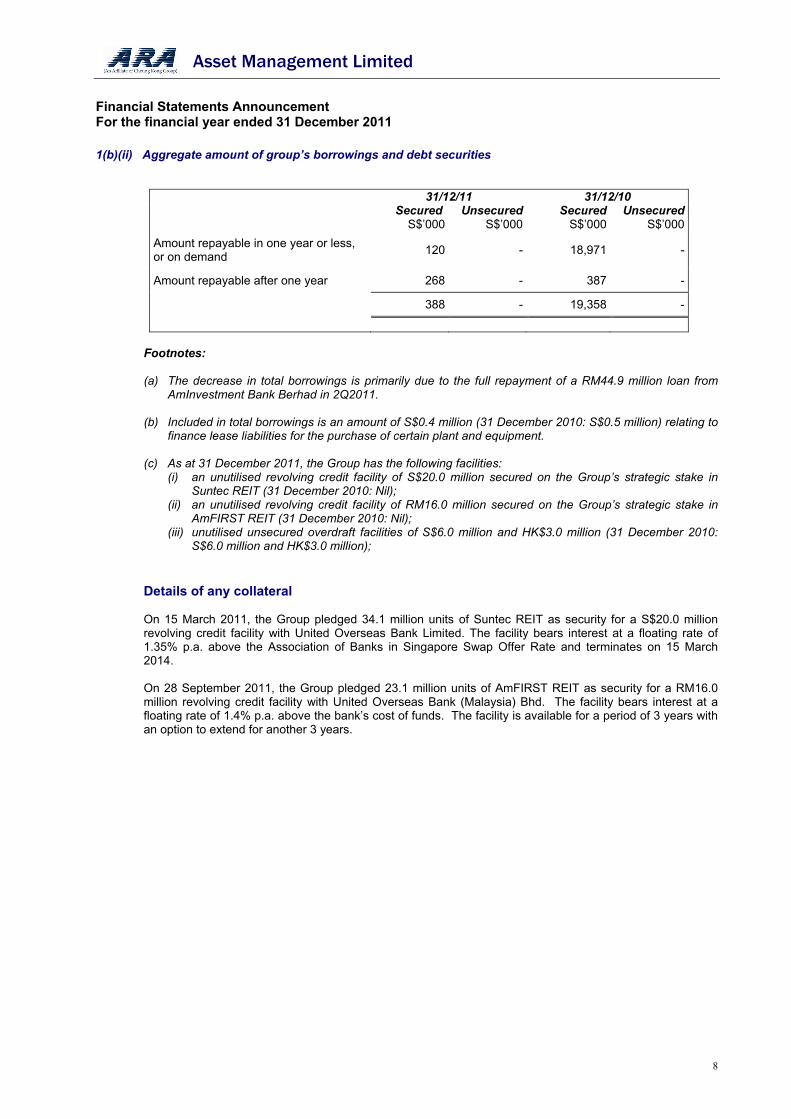
1(b)(ii) Aggregate amount of group’s borrowings and debt securities
31/12/11 31/12/10 Secured Unsecured Secured Unsecured S$’000 S$’000 S$’000 S$’000
Amount repayable in one year or less, or on demand
120 - 18,971 -
Amount repayable after one year 268 - 387 -
388 - 19,358 -
Footnotes:
(a) The decrease in total borrowings is primarily due to the full repayment of a RM44.9 million loan from AmInvestment Bank Berhad in 2Q2011.
(b) Included in total borrowings is an amount of S$0.4 million (31 December 2010: S$0.5 million) relating to finance lease liabilities for the purchase of certain plant and equipment.
(c) As at 31 December 2011, the Group has the following facilities:
(i) an unutilised revolving credit facility of S$20.0 million secured on the Group’s strategic stake in Suntec REIT (31 December 2010: Nil);
(ii) an unutilised revolving credit facility of RM16.0 million secured on the Group’s strategic stake in AmFIRST REIT (31 December 2010: Nil);
(iii) unutilised unsecured overdraft facilities of S$6.0 million and HK$3.0 million (31 December 2010: S$6.0 million and HK$3.0 million);
Details of any collateral
On 15 March 2011, the Group pledged 34.1 million units of Suntec REIT as security for a S$20.0 million revolving credit facility with United Overseas Bank Limited. The facility bears interest at a floating rate of 1.35% p.a. above the Association of Banks in Singapore Swap Offer Rate and terminates on 15 March 2014. On 28 September 2011, the Group pledged 23.1 million units of AmFIRST REIT as security for a RM16.0 million revolving credit facility with United Overseas Bank (Malaysia) Bhd. The facility bears interest at a floating rate of 1.4% p.a. above the bank’s cost of funds. The facility is available for a period of 3 years with an option to extend for another 3 years.
Asset Management Limited
Financial Statements Announcement For the financial year ended 31 December 2011
9
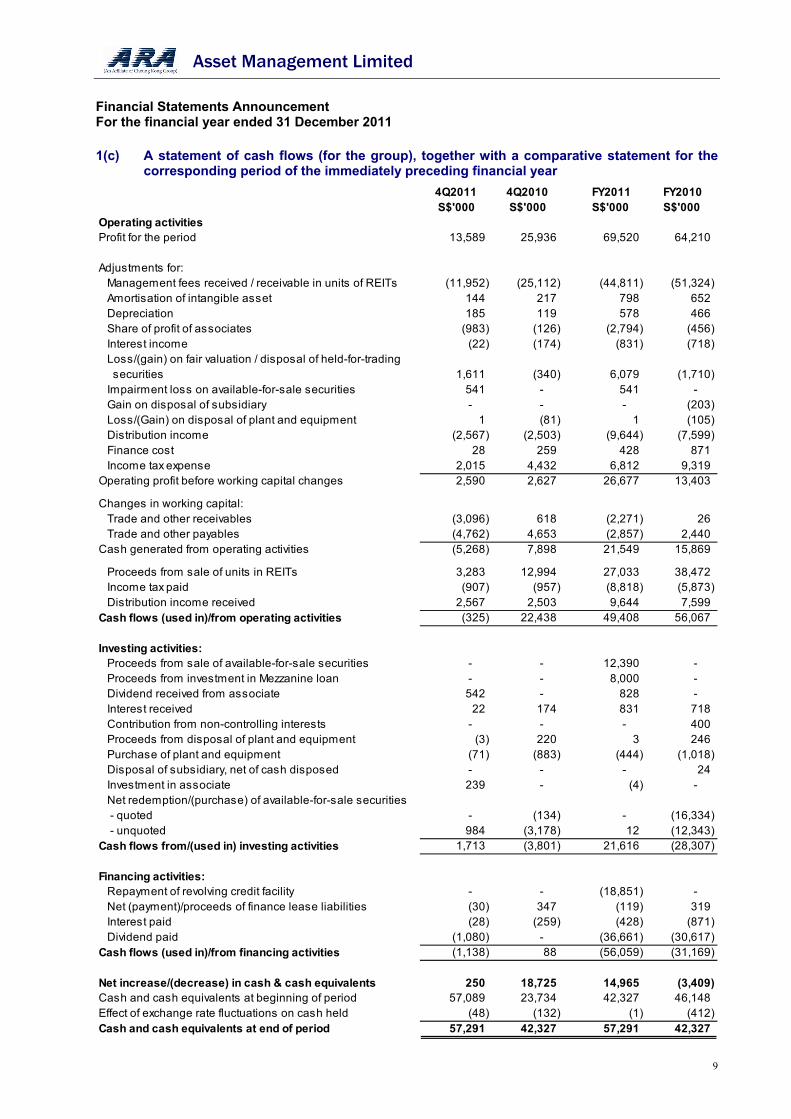
1(c) A statement of cash flows (for the group), together with a comparative statement for the corresponding period of the immediately preceding financial year
4Q2011 4Q2010 FY2011 FY2010 S$'000 S$'000 S$'000 S$'000
Operating activitiesProfit for the period 13,589 25,936 69,520 64,210 Adjustments for:
Management fees received / receivable in units of REITs (11,952) (25,112) (44,811) (51,324) Amortisation of intangible asset 144 217 798 652 Depreciation 185 119 578 466 Share of profit of associates (983) (126) (2,794) (456) Interest income (22) (174) (831) (718) Loss/(gain) on fair valuation / disposal of held-for-trading securities 1,611 (340) 6,079 (1,710) Impairment loss on available-for-sale securities 541 - 541 - Gain on disposal of subsidiary - - - (203) Loss/(Gain) on disposal of plant and equipment 1 (81) 1 (105) Distribution income (2,567) (2,503) (9,644) (7,599) Finance cost 28 259 428 871 Income tax expense 2,015 4,432 6,812 9,319
Operating profit before working capital changes 2,590 2,627 26,677 13,403
Changes in working capital:Trade and other receivables (3,096) 618 (2,271) 26 Trade and other payables (4,762) 4,653 (2,857) 2,440
Cash generated from operating activities (5,268) 7,898 21,549 15,869
Proceeds from sale of units in REITs 3,283 12,994 27,033 38,472 Income tax paid (907) (957) (8,818) (5,873) Distribution income received 2,567 2,503 9,644 7,599
Cash flows (used in)/from operating activities (325) 22,438 49,408 56,067
Investing activities:Proceeds from sale of available-for-sale securities - - 12,390 - Proceeds from investment in Mezzanine loan - - 8,000 - Dividend received from associate 542 - 828 - Interest received 22 174 831 718 Contribution from non-controlling interests - - - 400 Proceeds from disposal of plant and equipment (3) 220 3 246 Purchase of plant and equipment (71) (883) (444) (1,018) Disposal of subsidiary, net of cash disposed - - - 24 Investment in associate 239 - (4) - Net redemption/(purchase) of available-for-sale securities - quoted - (134) - (16,334) - unquoted 984 (3,178) 12 (12,343)
Cash flows from/(used in) investing activities 1,713 (3,801) 21,616 (28,307)
Financing activities:Repayment of revolving credit facility - - (18,851) - Net (payment)/proceeds of finance lease liabilities (30) 347 (119) 319 Interest paid (28) (259) (428) (871) Dividend paid (1,080) - (36,661) (30,617)
Cash flows (used in)/from financing activities (1,138) 88 (56,059) (31,169)
Net increase/(decrease) in cash & cash equivalents 250 18,725 14,965 (3,409) Cash and cash equivalents at beginning of period 57,089 23,734 42,327 46,148 Effect of exchange rate fluctuations on cash held (48) (132) (1) (412) Cash and cash equivalents at end of period 57,291 42,327 57,291 42,327
Asset Management Limited
Financial Statements Announcement For the financial year ended 31 December 2011
10
Footnotes:
(a) As at 31 December 2011, the Group had utilised S$59.9 million of the net IPO proceeds raised of S$75.5 million as follows:- As at
31/12/11 S$’000
31/12/10 S$’000
Seed capital investment in the ADF 24,723 23,100
Strategic stake in REIT 27,200 27,200
Investment in mezzanine loan(1)
8,000 8,000
59,923 58,300
(1) This investment was made in relation to the establishment of the ARA Harmony Fund.
(b) Cash flows from operating activities decreased to S$49.6 million in FY2011 from S$56.1 million in FY2010, primarily due to a decrease in proceeds from the sale of REIT units. The proceeds received from the sale of REIT units in FY2010 included REIT units received as fees in prior financial periods.
(c) Net cash inflow from investing activities was S$21.4 million in FY2011 as compared to a net cash
outflow of S$28.3 million in FY2010. The net cash inflow from investing activities in FY2011 was primarily due to (i) net proceeds received from the partial sale of AmFIRST REIT units in April 2011 and (ii) proceeds received in relation to the Group’s participation in a mezzanine loan to the ARA Harmony Fund to part finance its acquisition of Suntec Singapore. The net cash outflow for investing activities in FY2010 comprised mainly of the acquisition of a strategic stake in Cache during its IPO in April 2010, a strategic investment in APN Property Group and seed capital investment in the ADF pursuant to capital calls from the fund in FY2010.
(d) Net cash outflow for financing activities increased to S$56.1 million in FY2011 from S$31.2 million in FY2010. This was primarily due to (i) the repayment of the RM44.9 million loan (equivalent to S$18.9 million) in 2Q2011 and (ii) higher dividend paid subsequent to the Company’s enlarged share base after the 1-for-10 bonus issue in June 2011.
Asset Management Limited
Financial Statements Announcement For the financial year ended 31 December 2011
11
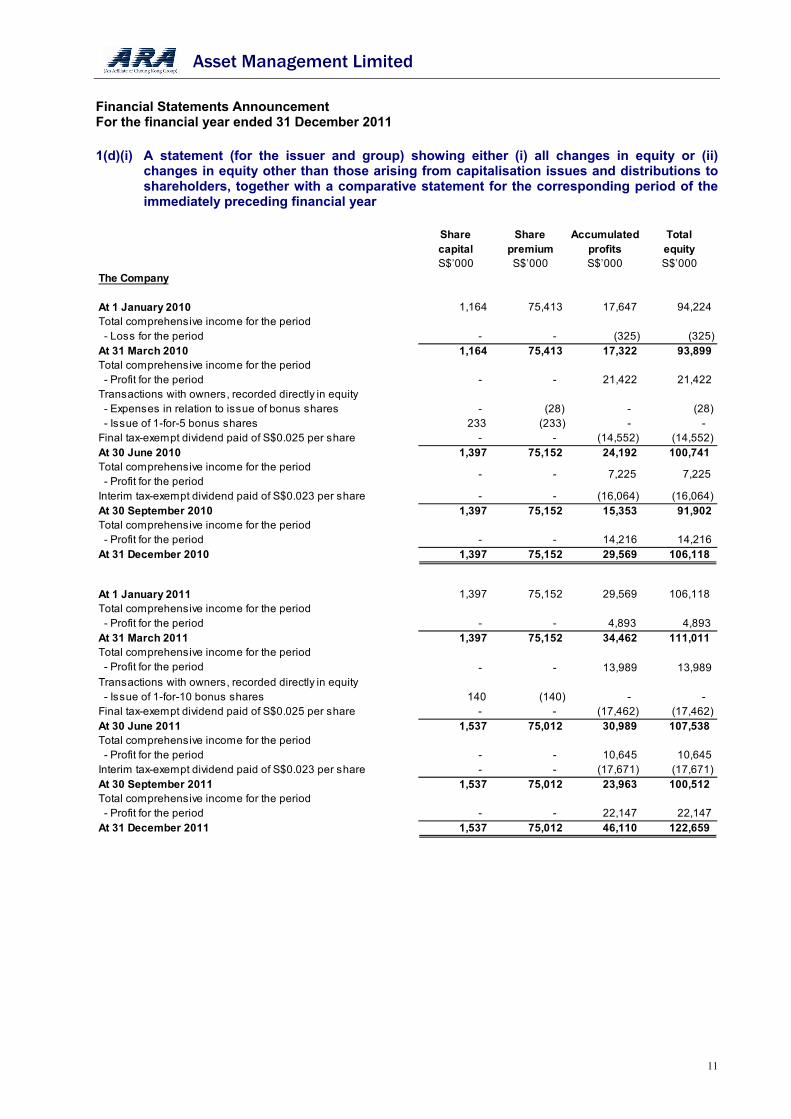
1(d)(i) A statement (for the issuer and group) showing either (i) all changes in equity or (ii) changes in equity other than those arising from capitalisation issues and distributions to shareholders, together with a comparative statement for the corresponding period of the immediately preceding financial year
Share Share Accumulated Totalcapital premium profits equityS$’000 S$’000 S$’000 S$’000
The Company
At 1 January 2010 1,164 75,413 17,647 94,224 Total comprehensive income for the period - Loss for the period - - (325) (325)At 31 March 2010 1,164 75,413 17,322 93,899 Total comprehensive income for the period - Profit for the period - - 21,422 21,422 Transactions with owners, recorded directly in equity - Expenses in relation to issue of bonus shares - (28) - (28) - Issue of 1-for-5 bonus shares 233 (233) - - Final tax-exempt dividend paid of S$0.025 per share - - (14,552) (14,552)At 30 June 2010 1,397 75,152 24,192 100,741 Total comprehensive income for the period - Profit for the period
- - 7,225 7,225
Interim tax-exempt dividend paid of S$0.023 per share - - (16,064) (16,064)At 30 September 2010 1,397 75,152 15,353 91,902 Total comprehensive income for the period - Profit for the period - - 14,216 14,216 At 31 December 2010 1,397 75,152 29,569 106,118
At 1 January 2011 1,397 75,152 29,569 106,118 Total comprehensive income for the period - Profit for the period - - 4,893 4,893 At 31 March 2011 1,397 75,152 34,462 111,011 Total comprehensive income for the period - Profit for the period - - 13,989 13,989 Transactions with owners, recorded directly in equity - Issue of 1-for-10 bonus shares 140 (140) - - Final tax-exempt dividend paid of S$0.025 per share - - (17,462) (17,462)At 30 June 2011 1,537 75,012 30,989 107,538 Total comprehensive income for the period - Profit for the period - - 10,645 10,645 Interim tax-exempt dividend paid of S$0.023 per share - - (17,671) (17,671)At 30 September 2011 1,537 75,012 23,963 100,512 Total comprehensive income for the period - Profit for the period - - 22,147 22,147 At 31 December 2011 1,537 75,012 46,110 122,659
Asset Management Limited
Financial Statements Announcement For the financial year ended 31 December 2011
12
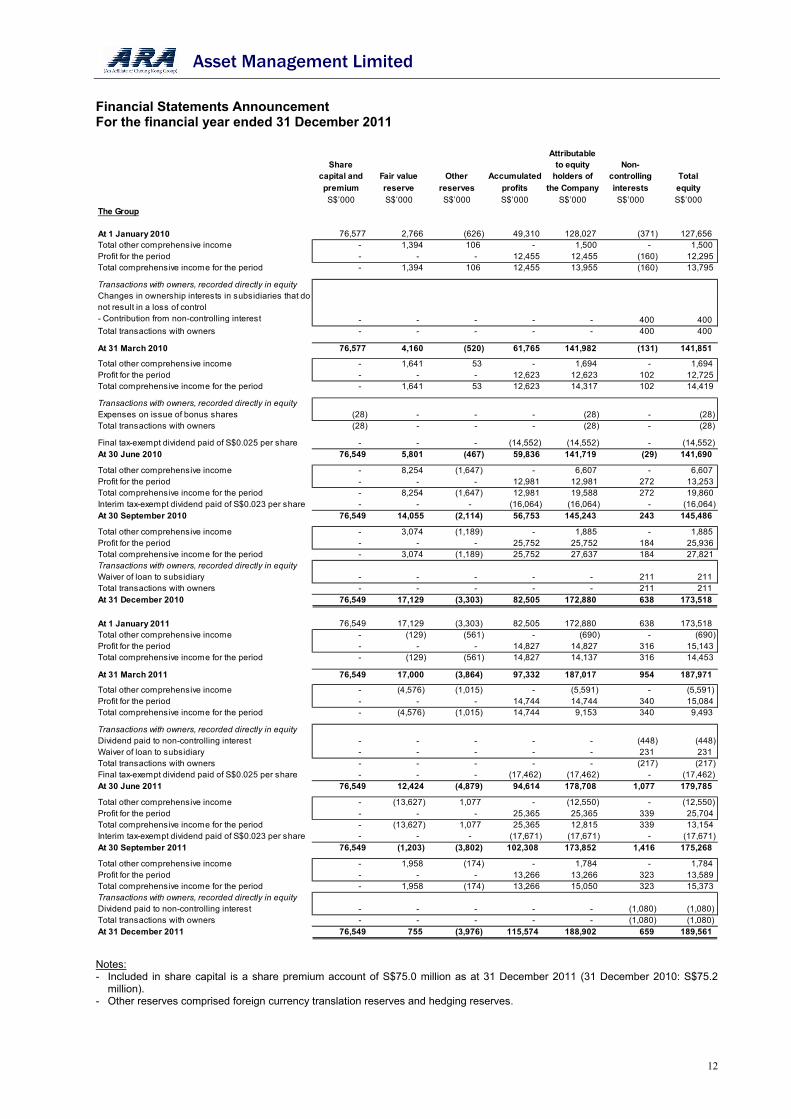
AttributableShare to equity Non-
capital and Fair value Other Accumulated holders of controlling Total
premium reserve reserves profits the Company interests equityS$’000 S$’000 S$’000 S$’000 S$’000 S$’000 S$’000
The Group
At 1 January 2010 76,577 2,766 (626) 49,310 128,027 (371) 127,656 Total other comprehensive income - 1,394 106 - 1,500 - 1,500 Profit for the period - - - 12,455 12,455 (160) 12,295 Total comprehensive income for the period - 1,394 106 12,455 13,955 (160) 13,795
Transactions with owners, recorded directly in equityChanges in ownership interests in subsidiaries that do not result in a loss of control- Contribution from non-controlling interest - - - - - 400 400 Total transactions with owners - - - - - 400 400
At 31 March 2010 76,577 4,160 (520) 61,765 141,982 (131) 141,851
Total other comprehensive income - 1,641 53 - 1,694 - 1,694 Profit for the period - - - 12,623 12,623 102 12,725 Total comprehensive income for the period - 1,641 53 12,623 14,317 102 14,419
Transactions with owners, recorded directly in equityExpenses on issue of bonus shares (28) - - - (28) - (28)Total transactions with owners (28) - - - (28) - (28)
Final tax-exempt dividend paid of S$0.025 per share - - - (14,552) (14,552) - (14,552)At 30 June 2010 76,549 5,801 (467) 59,836 141,719 (29) 141,690
Total other comprehensive income - 8,254 (1,647) - 6,607 - 6,607 Profit for the period - - - 12,981 12,981 272 13,253 Total comprehensive income for the period - 8,254 (1,647) 12,981 19,588 272 19,860 Interim tax-exempt dividend paid of S$0.023 per share - - - (16,064) (16,064) - (16,064) At 30 September 2010 76,549 14,055 (2,114) 56,753 145,243 243 145,486
Total other comprehensive income - 3,074 (1,189) - 1,885 - 1,885 Profit for the period - - - 25,752 25,752 184 25,936 Total comprehensive income for the period - 3,074 (1,189) 25,752 27,637 184 27,821 Transactions with owners, recorded directly in equityWaiver of loan to subsidiary - - - - - 211 211 Total transactions with owners - - - - - 211 211 At 31 December 2010 76,549 17,129 (3,303) 82,505 172,880 638 173,518
At 1 January 2011 76,549 17,129 (3,303) 82,505 172,880 638 173,518 Total other comprehensive income - (129) (561) - (690) - (690)Profit for the period - - - 14,827 14,827 316 15,143 Total comprehensive income for the period - (129) (561) 14,827 14,137 316 14,453
At 31 March 2011 76,549 17,000 (3,864) 97,332 187,017 954 187,971
Total other comprehensive income - (4,576) (1,015) - (5,591) - (5,591)Profit for the period - - - 14,744 14,744 340 15,084 Total comprehensive income for the period - (4,576) (1,015) 14,744 9,153 340 9,493
Transactions with owners, recorded directly in equityDividend paid to non-controlling interest - - - - - (448) (448)Waiver of loan to subsidiary - - - - - 231 231 Total transactions with owners - - - - - (217) (217)Final tax-exempt dividend paid of S$0.025 per share - - - (17,462) (17,462) - (17,462)At 30 June 2011 76,549 12,424 (4,879) 94,614 178,708 1,077 179,785
Total other comprehensive income - (13,627) 1,077 - (12,550) - (12,550)Profit for the period - - - 25,365 25,365 339 25,704 Total comprehensive income for the period - (13,627) 1,077 25,365 12,815 339 13,154 Interim tax-exempt dividend paid of S$0.023 per share - - - (17,671) (17,671) - (17,671) At 30 September 2011 76,549 (1,203) (3,802) 102,308 173,852 1,416 175,268
Total other comprehensive income - 1,958 (174) - 1,784 - 1,784 Profit for the period - - - 13,266 13,266 323 13,589 Total comprehensive income for the period - 1,958 (174) 13,266 15,050 323 15,373 Transactions with owners, recorded directly in equityDividend paid to non-controlling interest - - - - - (1,080) (1,080)Total transactions with owners - - - - - (1,080) (1,080)At 31 December 2011 76,549 755 (3,976) 115,574 188,902 659 189,561
Notes: - Included in share capital is a share premium account of S$75.0 million as at 31 December 2011 (31 December 2010: S$75.2
million). - Other reserves comprised foreign currency translation reserves and hedging reserves.
Asset Management Limited
Financial Statements Announcement For the financial year ended 31 December 2011
13
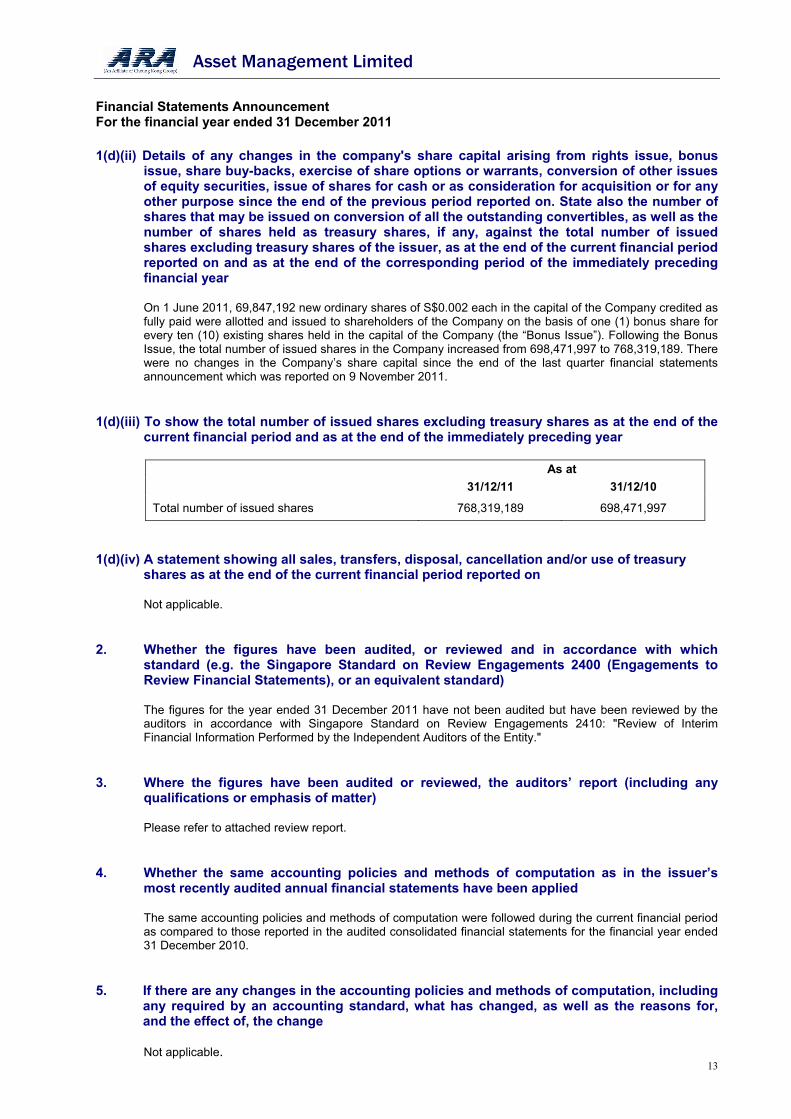
1(d)(ii) Details of any changes in the company's share capital arising from rights issue, bonus issue, share buy-backs, exercise of share options or warrants, conversion of other issues of equity securities, issue of shares for cash or as consideration for acquisition or for any other purpose since the end of the previous period reported on. State also the number of shares that may be issued on conversion of all the outstanding convertibles, as well as the number of shares held as treasury shares, if any, against the total number of issued shares excluding treasury shares of the issuer, as at the end of the current financial period reported on and as at the end of the corresponding period of the immediately preceding financial year
On 1 June 2011, 69,847,192 new ordinary shares of S$0.002 each in the capital of the Company credited as fully paid were allotted and issued to shareholders of the Company on the basis of one (1) bonus share for every ten (10) existing shares held in the capital of the Company (the “Bonus Issue”). Following the Bonus Issue, the total number of issued shares in the Company increased from 698,471,997 to 768,319,189. There were no changes in the Company’s share capital since the end of the last quarter financial statements announcement which was reported on 9 November 2011.
1(d)(iii) To show the total number of issued shares excluding treasury shares as at the end of the
current financial period and as at the end of the immediately preceding year
As at 31/12/11 31/12/10
Total number of issued shares 768,319,189 698,471,997
1(d)(iv) A statement showing all sales, transfers, disposal, cancellation and/or use of treasury
shares as at the end of the current financial period reported on Not applicable. 2. Whether the figures have been audited, or reviewed and in accordance with which
standard (e.g. the Singapore Standard on Review Engagements 2400 (Engagements to Review Financial Statements), or an equivalent standard)
The figures for the year ended 31 December 2011 have not been audited but have been reviewed by the
auditors in accordance with Singapore Standard on Review Engagements 2410: "Review of Interim Financial Information Performed by the Independent Auditors of the Entity."
3. Where the figures have been audited or reviewed, the auditors’ report (including any
qualifications or emphasis of matter) Please refer to attached review report. 4. Whether the same accounting policies and methods of computation as in the issuer’s
most recently audited annual financial statements have been applied
The same accounting policies and methods of computation were followed during the current financial period as compared to those reported in the audited consolidated financial statements for the financial year ended 31 December 2010.
5. If there are any changes in the accounting policies and methods of computation, including
any required by an accounting standard, what has changed, as well as the reasons for, and the effect of, the change
Not applicable.
Asset Management Limited
Financial Statements Announcement For the financial year ended 31 December 2011
14
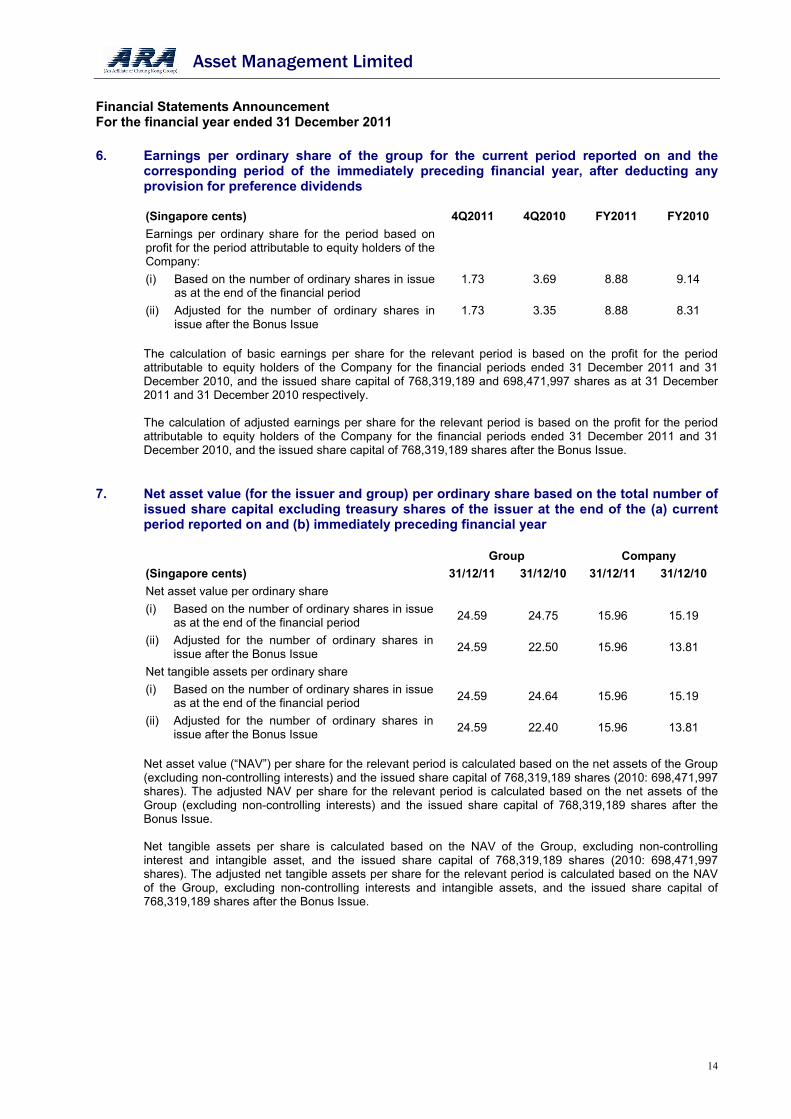
6. Earnings per ordinary share of the group for the current period reported on and the corresponding period of the immediately preceding financial year, after deducting any provision for preference dividends (Singapore cents) 4Q2011 4Q2010
FY2011 FY2010
Earnings per ordinary share for the period based on profit for the period attributable to equity holders of the Company:
(i) Based on the number of ordinary shares in issue as at the end of the financial period
1.73 3.69 8.88 9.14
(ii) Adjusted for the number of ordinary shares in issue after the Bonus Issue
1.73 3.35 8.88 8.31
The calculation of basic earnings per share for the relevant period is based on the profit for the period attributable to equity holders of the Company for the financial periods ended 31 December 2011 and 31 December 2010, and the issued share capital of 768,319,189 and 698,471,997 shares as at 31 December 2011 and 31 December 2010 respectively. The calculation of adjusted earnings per share for the relevant period is based on the profit for the period attributable to equity holders of the Company for the financial periods ended 31 December 2011 and 31 December 2010, and the issued share capital of 768,319,189 shares after the Bonus Issue.
7. Net asset value (for the issuer and group) per ordinary share based on the total number of
issued share capital excluding treasury shares of the issuer at the end of the (a) current period reported on and (b) immediately preceding financial year
Group Company
(Singapore cents) 31/12/11 31/12/10 31/12/11 31/12/10
Net asset value per ordinary share
(i) Based on the number of ordinary shares in issue as at the end of the financial period
24.59 24.75 15.96 15.19
(ii) Adjusted for the number of ordinary shares in issue after the Bonus Issue
24.59 22.50 15.96 13.81
Net tangible assets per ordinary share
(i) Based on the number of ordinary shares in issue as at the end of the financial period
24.59 24.64 15.96 15.19
(ii) Adjusted for the number of ordinary shares in issue after the Bonus Issue
24.59 22.40 15.96 13.81
Net asset value (“NAV”) per share for the relevant period is calculated based on the net assets of the Group (excluding non-controlling interests) and the issued share capital of 768,319,189 shares (2010: 698,471,997 shares). The adjusted NAV per share for the relevant period is calculated based on the net assets of the Group (excluding non-controlling interests) and the issued share capital of 768,319,189 shares after the Bonus Issue. Net tangible assets per share is calculated based on the NAV of the Group, excluding non-controlling interest and intangible asset, and the issued share capital of 768,319,189 shares (2010: 698,471,997 shares). The adjusted net tangible assets per share for the relevant period is calculated based on the NAV of the Group, excluding non-controlling interests and intangible assets, and the issued share capital of 768,319,189 shares after the Bonus Issue.
Asset Management Limited
Financial Statements Announcement For the financial year ended 31 December 2011
15
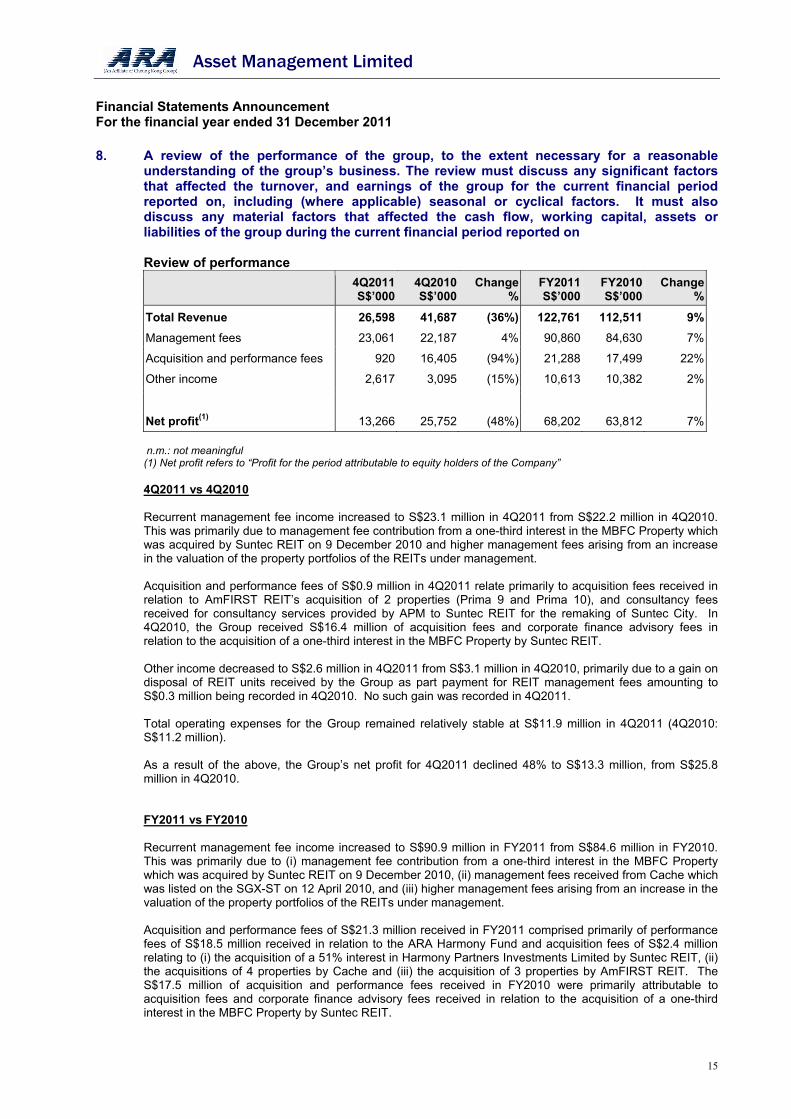
8. A review of the performance of the group, to the extent necessary for a reasonable understanding of the group’s business. The review must discuss any significant factors that affected the turnover, and earnings of the group for the current financial period reported on, including (where applicable) seasonal or cyclical factors. It must also discuss any material factors that affected the cash flow, working capital, assets or liabilities of the group during the current financial period reported on
Review of performance
4Q2011S$’000
4Q2010S$’000
Change%
FY2011 S$’000
FY2010 S$’000
Change%
Total Revenue 26,598 41,687 (36%) 122,761 112,511 9%
Management fees 23,061 22,187 4% 90,860 84,630 7%
Acquisition and performance fees 920 16,405 (94%) 21,288 17,499 22%
Other income 2,617 3,095 (15%) 10,613 10,382 2%
Net profit(1) 13,266 25,752 (48%) 68,202 63,812 7% n.m.: not meaningful (1) Net profit refers to “Profit for the period attributable to equity holders of the Company” 4Q2011 vs 4Q2010 Recurrent management fee income increased to S$23.1 million in 4Q2011 from S$22.2 million in 4Q2010. This was primarily due to management fee contribution from a one-third interest in the MBFC Property which was acquired by Suntec REIT on 9 December 2010 and higher management fees arising from an increase in the valuation of the property portfolios of the REITs under management. Acquisition and performance fees of S$0.9 million in 4Q2011 relate primarily to acquisition fees received in relation to AmFIRST REIT’s acquisition of 2 properties (Prima 9 and Prima 10), and consultancy fees received for consultancy services provided by APM to Suntec REIT for the remaking of Suntec City. In 4Q2010, the Group received S$16.4 million of acquisition fees and corporate finance advisory fees in relation to the acquisition of a one-third interest in the MBFC Property by Suntec REIT. Other income decreased to S$2.6 million in 4Q2011 from S$3.1 million in 4Q2010, primarily due to a gain on disposal of REIT units received by the Group as part payment for REIT management fees amounting to S$0.3 million being recorded in 4Q2010. No such gain was recorded in 4Q2011. Total operating expenses for the Group remained relatively stable at S$11.9 million in 4Q2011 (4Q2010: S$11.2 million). As a result of the above, the Group’s net profit for 4Q2011 declined 48% to S$13.3 million, from S$25.8 million in 4Q2010. FY2011 vs FY2010 Recurrent management fee income increased to S$90.9 million in FY2011 from S$84.6 million in FY2010. This was primarily due to (i) management fee contribution from a one-third interest in the MBFC Property which was acquired by Suntec REIT on 9 December 2010, (ii) management fees received from Cache which was listed on the SGX-ST on 12 April 2010, and (iii) higher management fees arising from an increase in the valuation of the property portfolios of the REITs under management. Acquisition and performance fees of S$21.3 million received in FY2011 comprised primarily of performance fees of S$18.5 million received in relation to the ARA Harmony Fund and acquisition fees of S$2.4 million relating to (i) the acquisition of a 51% interest in Harmony Partners Investments Limited by Suntec REIT, (ii) the acquisitions of 4 properties by Cache and (iii) the acquisition of 3 properties by AmFIRST REIT. The S$17.5 million of acquisition and performance fees received in FY2010 were primarily attributable to acquisition fees and corporate finance advisory fees received in relation to the acquisition of a one-third interest in the MBFC Property by Suntec REIT.
Asset Management Limited
Financial Statements Announcement For the financial year ended 31 December 2011
16
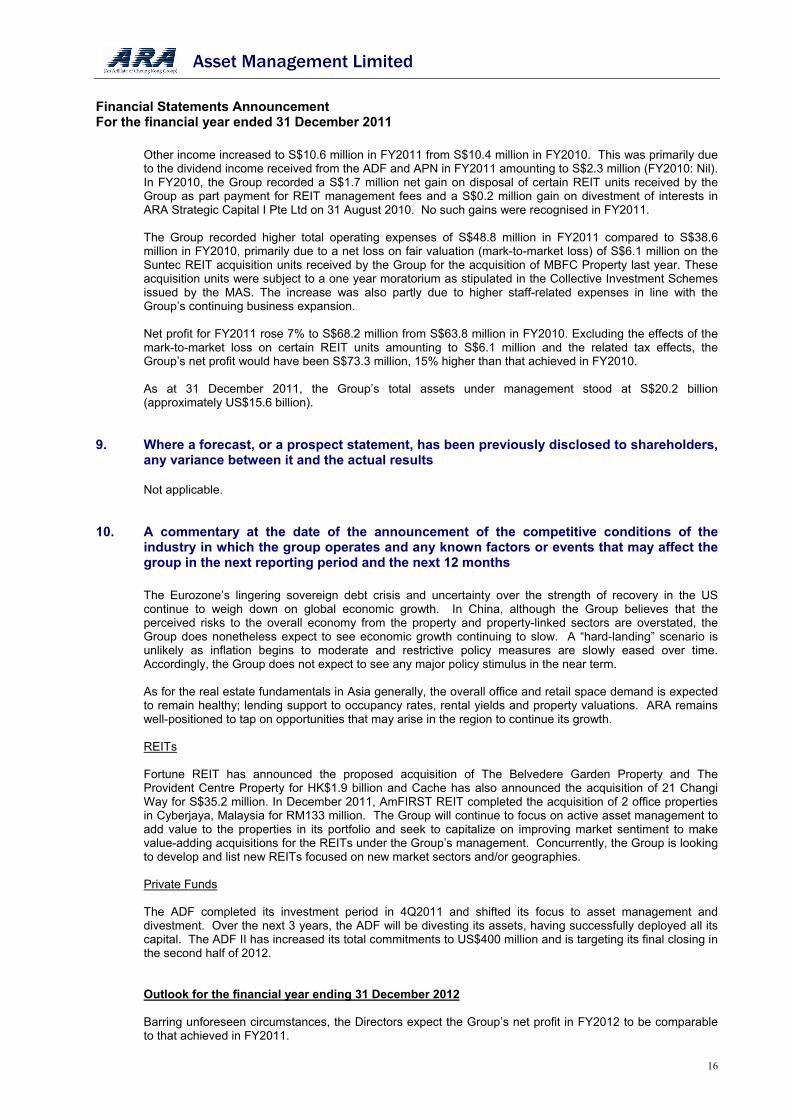
Other income increased to S$10.6 million in FY2011 from S$10.4 million in FY2010. This was primarily due to the dividend income received from the ADF and APN in FY2011 amounting to S$2.3 million (FY2010: Nil). In FY2010, the Group recorded a S$1.7 million net gain on disposal of certain REIT units received by the Group as part payment for REIT management fees and a S$0.2 million gain on divestment of interests in ARA Strategic Capital I Pte Ltd on 31 August 2010. No such gains were recognised in FY2011.
The Group recorded higher total operating expenses of S$48.8 million in FY2011 compared to S$38.6 million in FY2010, primarily due to a net loss on fair valuation (mark-to-market loss) of S$6.1 million on the Suntec REIT acquisition units received by the Group for the acquisition of MBFC Property last year. These acquisition units were subject to a one year moratorium as stipulated in the Collective Investment Schemes issued by the MAS. The increase was also partly due to higher staff-related expenses in line with the Group’s continuing business expansion. Net profit for FY2011 rose 7% to S$68.2 million from S$63.8 million in FY2010. Excluding the effects of the mark-to-market loss on certain REIT units amounting to S$6.1 million and the related tax effects, the Group’s net profit would have been S$73.3 million, 15% higher than that achieved in FY2010. As at 31 December 2011, the Group’s total assets under management stood at S$20.2 billion (approximately US$15.6 billion).
9. Where a forecast, or a prospect statement, has been previously disclosed to shareholders, any variance between it and the actual results
Not applicable. 10. A commentary at the date of the announcement of the competitive conditions of the
industry in which the group operates and any known factors or events that may affect the group in the next reporting period and the next 12 months
The Eurozone’s lingering sovereign debt crisis and uncertainty over the strength of recovery in the US continue to weigh down on global economic growth. In China, although the Group believes that the perceived risks to the overall economy from the property and property-linked sectors are overstated, the Group does nonetheless expect to see economic growth continuing to slow. A “hard-landing” scenario is unlikely as inflation begins to moderate and restrictive policy measures are slowly eased over time. Accordingly, the Group does not expect to see any major policy stimulus in the near term. As for the real estate fundamentals in Asia generally, the overall office and retail space demand is expected to remain healthy; lending support to occupancy rates, rental yields and property valuations. ARA remains well-positioned to tap on opportunities that may arise in the region to continue its growth. REITs Fortune REIT has announced the proposed acquisition of The Belvedere Garden Property and The Provident Centre Property for HK$1.9 billion and Cache has also announced the acquisition of 21 Changi Way for S$35.2 million. In December 2011, AmFIRST REIT completed the acquisition of 2 office properties in Cyberjaya, Malaysia for RM133 million. The Group will continue to focus on active asset management to add value to the properties in its portfolio and seek to capitalize on improving market sentiment to make value-adding acquisitions for the REITs under the Group’s management. Concurrently, the Group is looking to develop and list new REITs focused on new market sectors and/or geographies. Private Funds The ADF completed its investment period in 4Q2011 and shifted its focus to asset management and divestment. Over the next 3 years, the ADF will be divesting its assets, having successfully deployed all its capital. The ADF II has increased its total commitments to US$400 million and is targeting its final closing in the second half of 2012.
Outlook for the financial year ending 31 December 2012
Barring unforeseen circumstances, the Directors expect the Group’s net profit in FY2012 to be comparable to that achieved in FY2011.
Asset Management Limited
Financial Statements Announcement For the financial year ended 31 December 2011
17
11. Dividend
(a) Current Financial Period Reported On
Any dividend recommended for the current financial period reported on? Yes
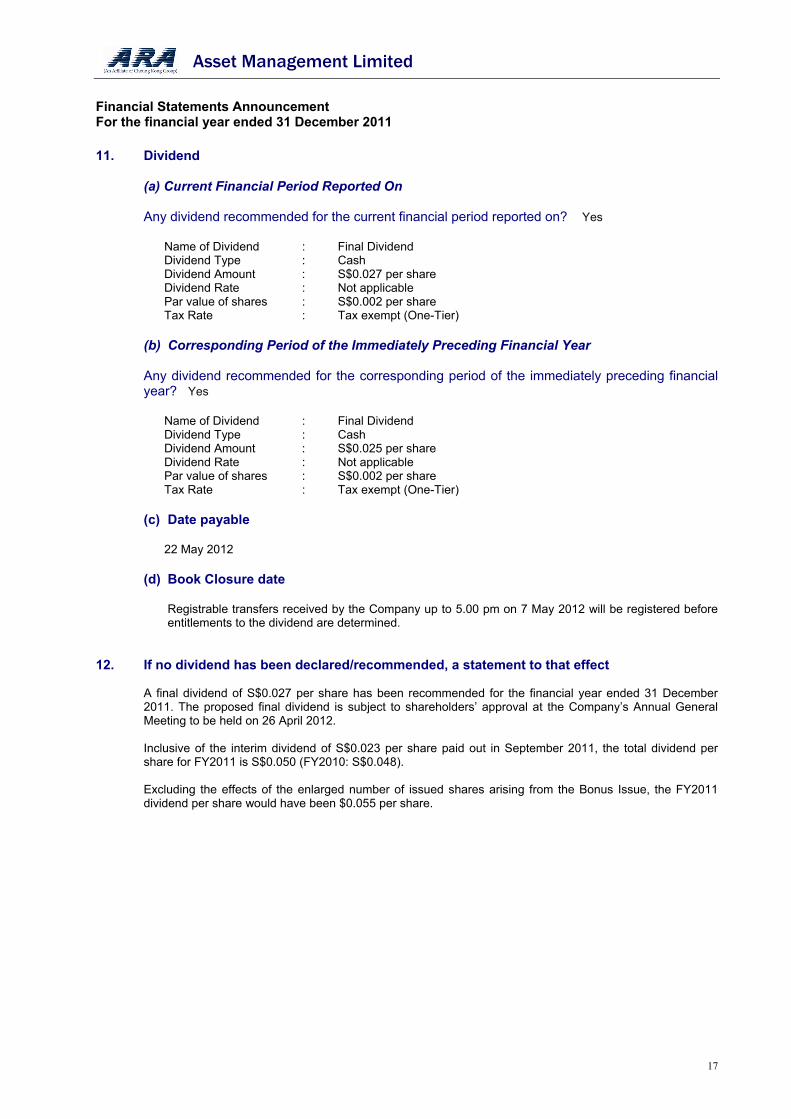
Name of Dividend : Final Dividend Dividend Type : Cash Dividend Amount : S$0.027 per share Dividend Rate : Not applicable Par value of shares : S$0.002 per share Tax Rate : Tax exempt (One-Tier)
(b) Corresponding Period of the Immediately Preceding Financial Year
Any dividend recommended for the corresponding period of the immediately preceding financial year? Yes
Name of Dividend : Final Dividend Dividend Type : Cash Dividend Amount : S$0.025 per share Dividend Rate : Not applicable Par value of shares : S$0.002 per share Tax Rate : Tax exempt (One-Tier)
(c) Date payable
22 May 2012
(d) Book Closure date
Registrable transfers received by the Company up to 5.00 pm on 7 May 2012 will be registered before entitlements to the dividend are determined.
12. If no dividend has been declared/recommended, a statement to that effect
A final dividend of S$0.027 per share has been recommended for the financial year ended 31 December 2011. The proposed final dividend is subject to shareholders’ approval at the Company’s Annual General Meeting to be held on 26 April 2012. Inclusive of the interim dividend of S$0.023 per share paid out in September 2011, the total dividend per share for FY2011 is S$0.050 (FY2010: S$0.048). Excluding the effects of the enlarged number of issued shares arising from the Bonus Issue, the FY2011 dividend per share would have been $0.055 per share.
Asset Management Limited
Financial Statements Announcement For the financial year ended 31 December 2011
18
PART II - ADDITIONAL INFORMATION REQUIRED FOR FULL YEAR ANNOUNCEMENT
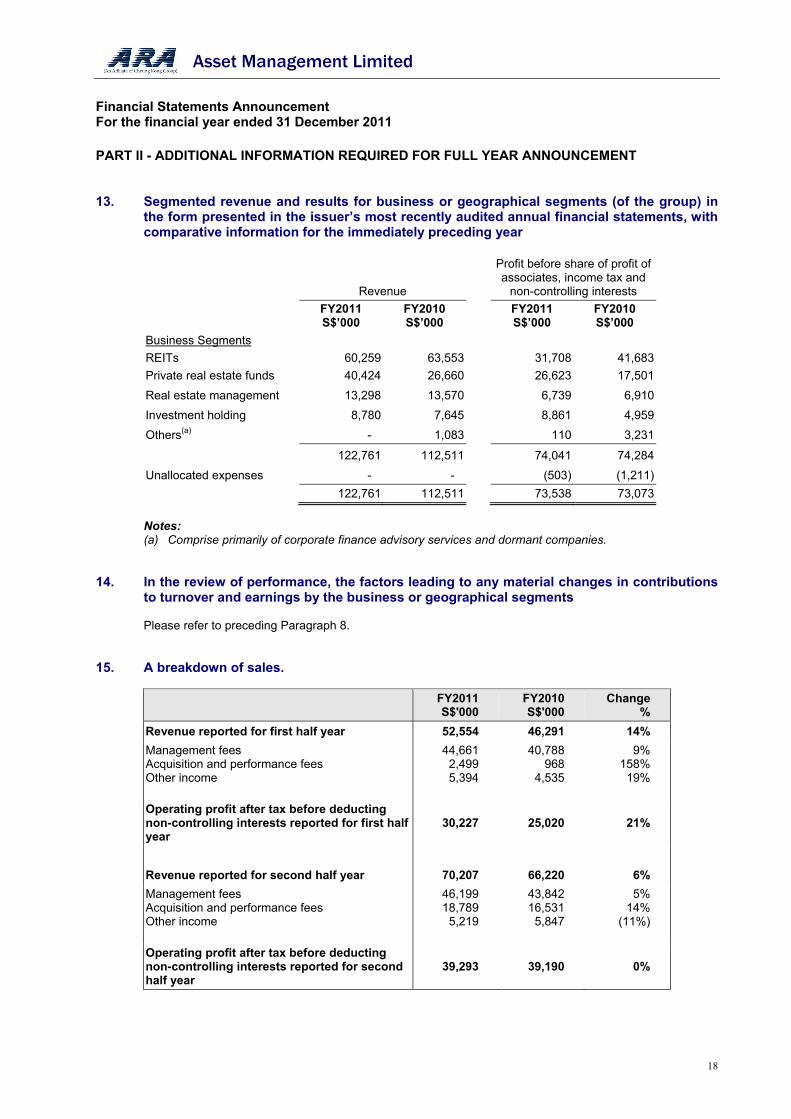
13. Segmented revenue and results for business or geographical segments (of the group) in the form presented in the issuer’s most recently audited annual financial statements, with comparative information for the immediately preceding year
Revenue
Profit before share of profit of associates, income tax and
non-controlling interests
FY2011S$’000
FY2010S$’000
FY2011S$’000
FY2010 S$’000
Business Segments
REITs 60,259 63,553 31,708 41,683
Private real estate funds 40,424 26,660 26,623 17,501
Real estate management 13,298 13,570 6,739 6,910
Investment holding 8,780 7,645 8,861 4,959
Others(a) - 1,083 110 3,231
122,761 112,511 74,041 74,284
Unallocated expenses - - (503) (1,211)
122,761 112,511 73,538 73,073
Notes:
(a) Comprise primarily of corporate finance advisory services and dormant companies. 14. In the review of performance, the factors leading to any material changes in contributions
to turnover and earnings by the business or geographical segments
Please refer to preceding Paragraph 8. 15. A breakdown of sales.
FY2011S$'000
FY2010 S$'000
Change %
Revenue reported for first half year 52,554 46,291 14%
Management fees Acquisition and performance fees Other income
44,661 2,499 5,394
40,788 968
4,535
9% 158%
19%
Operating profit after tax before deducting non-controlling interests reported for first half year
30,227 25,020 21%
Revenue reported for second half year 70,207 66,220 6%
Management fees Acquisition and performance fees Other income
46,199 18,789
5,219
43,842 16,531
5,847
5% 14%
(11%)
Operating profit after tax before deducting non-controlling interests reported for second half year
39,293 39,190 0%
Asset Management Limited
Financial Statements Announcement For the financial year ended 31 December 2011
19
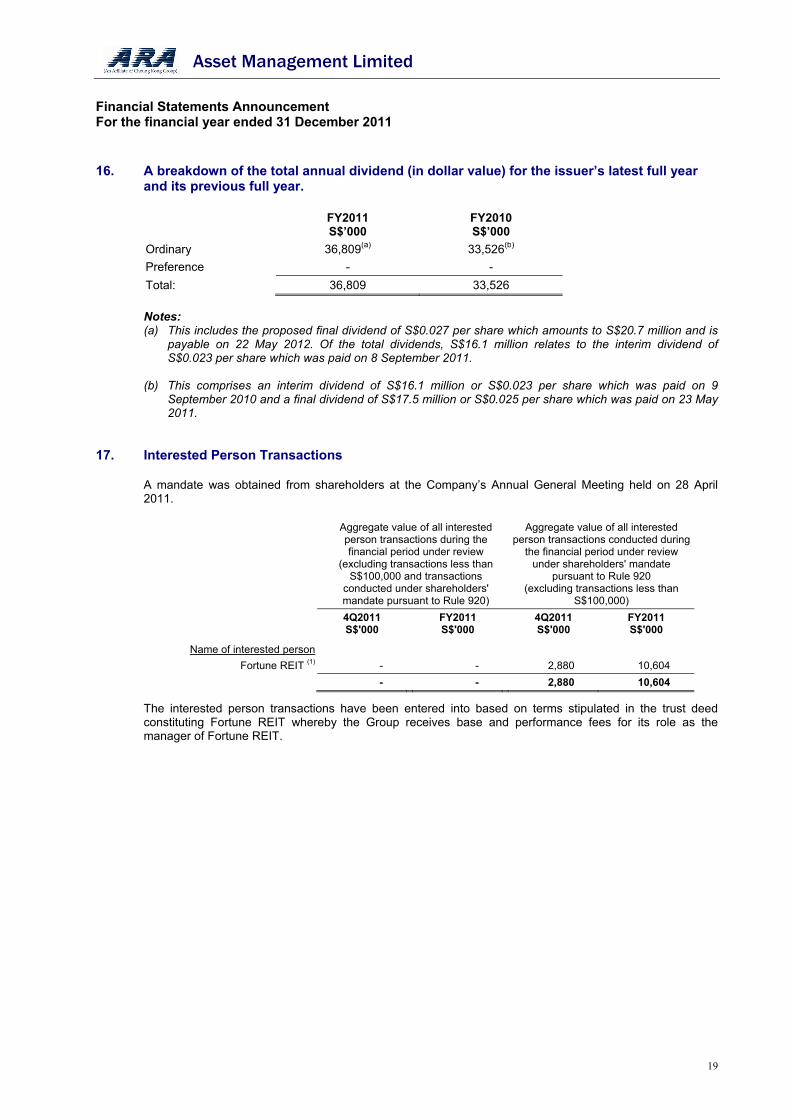
16. A breakdown of the total annual dividend (in dollar value) for the issuer’s latest full year
and its previous full year.
FY2011S$’000
FY2010S$’000
Ordinary 36,809(a) 33,526(b)
Preference - -
Total: 36,809 33,526
Notes: (a) This includes the proposed final dividend of S$0.027 per share which amounts to S$20.7 million and is
payable on 22 May 2012. Of the total dividends, S$16.1 million relates to the interim dividend of S$0.023 per share which was paid on 8 September 2011.
(b) This comprises an interim dividend of S$16.1 million or S$0.023 per share which was paid on 9
September 2010 and a final dividend of S$17.5 million or S$0.025 per share which was paid on 23 May 2011.
17. Interested Person Transactions
A mandate was obtained from shareholders at the Company’s Annual General Meeting held on 28 April 2011.
Aggregate value of all interested person transactions during the financial period under review
(excluding transactions less than S$100,000 and transactions
conducted under shareholders' mandate pursuant to Rule 920)
Aggregate value of all interested person transactions conducted during
the financial period under review under shareholders' mandate
pursuant to Rule 920 (excluding transactions less than
S$100,000)
4Q2011 S$'000
FY2011 S$'000
4Q2011 S$'000
FY2011 S$'000
Name of interested person
Fortune REIT (1) - - 2,880 10,604
- - 2,880 10,604
The interested person transactions have been entered into based on terms stipulated in the trust deed constituting Fortune REIT whereby the Group receives base and performance fees for its role as the manager of Fortune REIT.
Asset Management Limited
Financial Statements Announcement For the financial year ended 31 December 2011
20
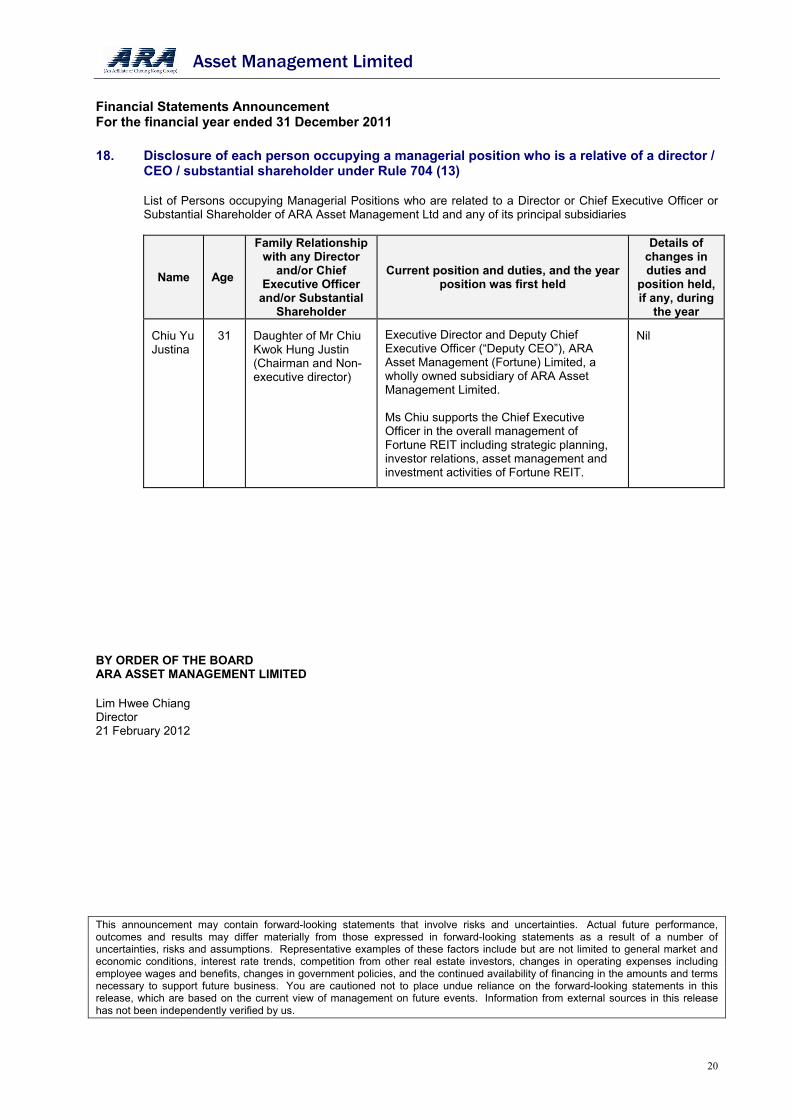
18. Disclosure of each person occupying a managerial position who is a relative of a director / CEO / substantial shareholder under Rule 704 (13)
List of Persons occupying Managerial Positions who are related to a Director or Chief Executive Officer or Substantial Shareholder of ARA Asset Management Ltd and any of its principal subsidiaries
Name Age
Family Relationship with any Director
and/or Chief Executive Officer
and/or Substantial Shareholder
Current position and duties, and the year position was first held
Details of changes in duties and
position held, if any, during
the year
Chiu Yu Justina
31
Daughter of Mr Chiu Kwok Hung Justin (Chairman and Non-executive director)
Executive Director and Deputy Chief Executive Officer (“Deputy CEO”), ARA Asset Management (Fortune) Limited, a wholly owned subsidiary of ARA Asset Management Limited. Ms Chiu supports the Chief Executive Officer in the overall management of Fortune REIT including strategic planning, investor relations, asset management and investment activities of Fortune REIT.
Nil
BY ORDER OF THE BOARD ARA ASSET MANAGEMENT LIMITED Lim Hwee Chiang Director 21 February 2012 This announcement may contain forward-looking statements that involve risks and uncertainties. Actual future performance, outcomes and results may differ materially from those expressed in forward-looking statements as a result of a number of uncertainties, risks and assumptions. Representative examples of these factors include but are not limited to general market and economic conditions, interest rate trends, competition from other real estate investors, changes in operating expenses including employee wages and benefits, changes in government policies, and the continued availability of financing in the amounts and terms necessary to support future business. You are cautioned not to place undue reliance on the forward-looking statements in this release, which are based on the current view of management on future events. Information from external sources in this release has not been independently verified by us.