Embed Size (px)
Citation preview

BLM LIBRARY
88000106 ^ y»
\
J
Archaeological Inventory
of the California Desert:
A Proposed Methodology
by
Margaret L. Weide
Archaeological Research Unit
University of California
Riverside, CA 92502
CALIFORNIA DFSFRT PLAN PROGRAWl
3610 CENTRAL AVE., SUITE 402 RIVERSIDE, CA 92506
Prepared For The;
USDI - BLM
Desert Planning Program
1695 Spruce Street
Riverside, CA 92507
Order No. 04960-PH3-15
December, 1973

;'}3gcment
cc era^ Center j

J ~1 0^'
Archaeological Inventory
of the California Desert:
A Proposed Methodology
CCL-
75: y . wV/
by
Margaret L. Weide
Archaeological Research Unit
University of California
Riverside, CA 92502
^irFORNiA DFSFRT PLAN PROGR; 36Iu CENTRAL AVE., SUITE 402 riverside, CA 92506
Bureau of Land Management Library Bldg, 50, Denver Federal Center Denver, CO S0225
Prepared For The:
USDI - BLM
Desert Planning Program
1695 Spruce Street
Riverside, CA 92507
Order No. 04960-PH3-15
December, 1973
BUREAU OF LAND MANAGEMENT LIBRARV Denver, Colorado
88000106

i* ’JlPT'iv- ‘Mr
.rZtt
Sf.’V%>.h ' V^' . T ■, ■ ',1 < ', . ‘
r-i"-..^;' ’H '^1 ’ 'iiy^Y'**'
‘ '■ ■ • ^
*.v ■ .1 •', r. « ^ 4 • I _
' ,'■■ ’'■ ‘ 4^;'„ .j"'' f V wir' -■ rv’.*' ^ V '■'•:■ i.-'r*-*' ''
I'jESfiti,' O'» fi ll‘g>*£ A*' ’#■ >,; W'li /' '"■^''®;!!!?3iai.
; ; -r' ‘- ;r. * il^*‘ ‘\.L
Vrnt^-. ■ ■' '■ , VVs" .
■4<"|'-' :>'. ' * , -..*^'
■:?f«.ji
fMfU IwSVilifc* 'f>*^
jjjii „■/
k in
^;4f,' ■ ii
h:rriit rj'^rti Kk^
' turn
‘■4’^ '„ ' %. ' '
j- *. ■.•VijA- .
' ^*if- ' i “v

TABLE OF CONTENTS
Page
INTRODUCTION I
NEED FOR MANAGEMENT OF THE ARCHAEOLOGICAL RESOURCES OF THE
CALIFORNIA DESERT: OUTLINES OF AI^ ARCHAEOLOGICAL PROGRAM DESIGN 2
OBJECTIVES OF THE ARCHAEOLOGICAL INVENTORY OF THE CALIFORNIA DESERT 5
ASSUMPTIONS AND APPROACH OF THE ARCHAEOLOGICAL INVENTORY 6
KINDS OF DATA NECESSARY 8
Non- Archaeological Data 8
Ethnographic-Ethnohistoric Data 11
Archaeological Data 13
Remote Sensing 14
BLM INVENTORY AREAS AS SAMPLING UNIVERSES 15
GENERAL SAMPLING STRATEGY/TECHNIQUE FOR ALL INVENTORY AREAS 16
Sample Size and Allocation 16
EXECUTION OF THE SAMPLING DESIGN 23
Suggested Organization of an Archaeological Team 24
Field Procedures 25
Recording a Site 25
Artifact Collection Policy 27
Handling of Incidentally Discovered Sites 28
PROGRAM OF EVALUATION AND SYNTHESIS 29
POTENTIAL INVENTORY AREAS 31
New York and Providence Mountain Area, Including the
Clark Mountains 34
Saline-Eureka Valleys 34
Chuckwalla Valley, Including Palen and Ford Dry Lakes
and the McCoy Mountains 35
Chemehuevi Valley, Including the Turtle and Whipple Mountains 35
Picacho Mountains, Including the Area South and East of the
Chocolate Mountains to the Colorado River and the Mexican
Border 35
Mojave Sink, Including Cave Canyon, the Mouth of the Mojave
River and Associated Dune Fields and the Area of
Pleostocene Lake Mojave 36
San Bernardino Foothills, Along the Northeast Edge of the
San Bernardino Mountains 36
SCHEDULING 38
LITERATURE CITED 39
40 ACKNOWLEDGEMENTS

I
''r" 'm ^ Bl ' '•*^. •- 'Tj- V . "i ,- ' \V*^f^v
■■.■El®. ,
_^... ■« -
WirtTHOS-W'JV'WI i ■ ^ >■ vv
-v;^. ’ * ■ ' ^ ■,’ ^ 1' *■ • » -■
.'iii" ., il
ft
.> H
tl
. Ai
v' ;<[.jiaac ^ ^s^uivo,. it^ae^^ .. . v/.;, :
Aiv«r^?t>¥.j sffT a:<'» eoyjri«2^ ft<>
I .:%V^
■i ft
. ..M. »«»«t;>;5^
V
*);. ji / A'.
et & 4', • :' , '»'.; ;v :•. :„ .)ai.j{<^ 4!A Kift aA'^ - ■ '4^' V. **“, - ® ' Wi > '* tn /•
1 ’1', ■ • .■•? pjiJ^ Y^oTvc^/w ,iuA iA.i4?fsw
^Tdl Wj^oXX/^/tSb •^s-U *tv»>3i«? ■‘'^" ,- r.' f*' '■v.*''-'
■■/iV,-
' y^/5*V'* •iSVXS'rH ■i ' ' .*^' ’
dl
fS ‘ ^
AS '
n
8X
x»' -r’. • ' ' f ■ "^ • " ■ ‘ ■ ' vTi
ftOim Of«J.i^,8: HHT • iHJlWiXH . «<V^T- »>a ><i ii<it:iB^Xui;.^’fy ?
■ ’ ••k*'l*»’ J. ^ *
y VVi . ' ‘ •■• > > :i4rii»T<*c>t»Jj • " yollo5 d0i'U'e»iiU>
v'^ <'1 eoiiC
-U
r... ?s
<■ , acy^ WCJ4 TAUJAVa 'lli ^ ^ t. ’' . ' fy
3>*>’J:A ‘/JI0T«3V«I a ■» ^ • -tf' ’ .lAi
Ae^ I ■?
^»d.> ;*rtbAJi 'f)i ,As‘T'A i 4f/ijjtf>i vi^7‘^ jlyt>Y w-uH :*■
‘fir- ^ .
ec ec
asaUiJ ^!EQ>£j-^(<>^i bfiH lAw^t jiiO^ .v]
.^^MnticiM ^i^>t!W hftft »&* ppirM^x;,[i I ^vAXiiV ivwis 'wilV '_».4v \n jfefcS ©.13^
fekfi''' ' *'■ tHt:t btxH -OJ^ ■ ’.-‘-j Z£. '* , ■■, ' • ' '|;'-l4-'*
^ rf^i.AKiA^ f.rfa ,^)Sov,i>k^ 9:xfO evt^aH ’
■..iV'a ■!
t^i/^ 'io »»,tA f^;a’^i'atv ajSXsrJ*'i :j^<&^ir|»latSit;asA iiAft ^
f'r .VAi^oH .^,jj JllJ to £»/<J 5rr6i-S.fvdAi.WJOA’5 •'pi ><>8 Ufc?. , J3
■ - ^. .. 4^' iiA^' ' t- :■ <•.;_i'_“ ^ \ " ''V^tt^-
^MiKixyge' > -,,;V^i^;- ‘,. , . . , ^ ... ^
■ • ■ '. .. ir'"'.l'-'» • • b'^r'wS r^X*^ ■
■ . ■' •;■'• / '■' z#K^^5r^^iHiV ■ ^ wra
i
r'-^ ‘ ». ^^■ > m ‘■'a* •■v*^'''- B!M.i^ ii- ‘,eM - •'’'^'rv-’^'tifl '* w:’4V'Vi A\-.' li.l'.'.- ■ - ■ .-;f,/l.. . 'fP
-lO'JtAHarrj i
INTRODUCTION
The California Desert includes a considerable quantity of archaeological
resources along with its many other values. As the Bureau of Land Management
seeks to meet the challenge of managing its desert lands for the common good,
it is appropriate that the archaeology of the area be numbered among its
considerations. Not only does the BLM have a legal responsibility to protect
archaeological remains under Federal law, but archaeology constitutes a public
resource in several respects. Understanding and enjoyment of the desert as a
recreational area is enhanced by understanding the ways prehistoric man lived
in this environment that strikes many as harsh and sterile. Archaeology is
the raw material for the unwritten history of several of the California
Indian peoples and is of special concern to them. It is also a scientific
resource, a proving ground where archaeologists can test and revise their
ideas about how man’s long years as a hunter and gatherer shaped his modern
lifeways, and through what socio-economic arrangements and technological
developments man adapted to a wide variety of environments.
Basic to management is inventory, and inventory of archaeological
resources on the scale of the California Desert is not easily accomplished.
Proposed here is a sampling design to discover the patterns of location of
archaeological resources in the desert and to make these patterns and
projections derived from them available as a data base for management
planning.

r-',. lii^i;iiifieiip 9.ld‘<TjE^t^a<K>3 a 9i»bol:^l !»;> »4T
V-!
i.f *' d .•.^, I ■ - ■ fS^'i *
noauta^ adS tol i^al^nm '
-■ ■ ■ ■ r ' - , .' . .^i. . 4fe ■ -- --1.1 it: «3i i^nomh asi* adl lo wu Jadl mJzitifcnqeit. Mi Jl
03 yd^Xldlaoo^^^ Xfi^oX a ovsrf HS8 ^/fist *oob. tXffO J'jJJ .««iji3ii-u^..'l0<^A>‘' '
alldoq A fi»jjuJtfSn»oi::>. vjVioAAdoiA 3wd tttt.ttim&j 0^1 gcii^^ifyist o**^’
1 K
'* A «A 3^98»b 'jd3 io hos griibotNlMTsboU (ajstvaa nf oo^ ..mAt»i '« ^ ^
bA'/li OACl oiilo3«i «\rav 9iii boiXtfiriiTS wX * . • > ■ • ■
•1 5j3oio*Arir»TA .oilToie bos de'»Ail &fi ^lom aisjIX tta Jaacai.oiiva» «i/fi ni
Axmoiliad od3 lo iorovAS >o ^oiMirf »d3 'lai >ai6 if*n'>ti>
■•' N V ■ /,- “» fS ■ atItiiJAf.aA » omIa pJ jX, .jaaiI'J o3 oioo^toa «i fewA a»fqcteii?|
tr ■ V ^ t"
aMtvoi'boA ihaj oo3 na^dv* sAivcaQ a ,
aaohoM tid bsq»df: aoaorfang b<ia ioiiwo o ae 83A0x ^xioX ««>d
.: . JLBDl;}oInifi<f::(o3^ fe»iA olwonoj^HaiiaoA iedv dguouR bfsu r *.
1. jjl, .aansamoTiv^ lo abiv' a oj hoaqAbt. nfcm Ai/jffMjOXAvjb V. ■/■;■'
lMot^oi4Mdo76 lo X'toyoitvni hera aX i OilniMX' ''],j. a 17 y ■ ■ m •*‘'
. bsdellqvoaoM 3oA.«i iiAOdMI i^iraaSirnO Arfi ^o ^3 «t (^r*:umii^3r y^' ll ^ t<i
5o ooiJit:>ol. io aoaaiiAq Ada aovosAib oi ^ 9X aiAft boAoqnal
i^fte'aoaoiaAq osodi sdAAi of f»ii» '>di rri a^aioovaa’ i8o4i»oic»o/.<b«ta, ^
•}' *? ' ■ ■
, •.;. “^ 3ntwic»^An*-« loi ABfld fUAb a aa ;»idt*X^A9A mod'i t]rt^vl^r*4b ’ ‘fci
. ^ /t
t
A^' „■; 7, ^>.r;
-,' .’»b:. *3 O
, •■■;', ' >!d n ,4*‘ ‘ ru
J •
''■‘ ■'■ vflife;-*..' -.i'.ww; ..,.iit •■■■£

-2-
NEED FOR MANAGEMENT OF THE ARCHAEOLOGICAL
RESOURCES OF THE CALIFORNIA DESERT:
OUTLINES OF AI^^ ARCHAEOLOGICAL PROGRAM DESIGN
The Bureau of Land Management has had the responsibility for protecting
the archaeological resources of its lands under the U. S. Antiquities Act of
1906. These responsibilities have been spelled out and expanded by the
Historic Sites Act of 1935, the Historic Preservation Act of 1966, the National
Environmental Policy Act of 1969 and the Bureau of Land Management Manual
sections 6231, 9351, 3509 and 3605. Federal lands such as those the BLM
holds in the southern California desert, protected by the Antiquities Act and
removed from centers of population concentration, constitute the major
reservoir of undisturbed archaeological materials in the United States.
These too are threatened. Current projections suggest that at the present
rate of site destruction only 20-50 years remain before essentially all the
archaeological remains in the country will have been destroyed. In less than
300 years man will have destroyed the evidence of more than 15,000 years of
prehistoric occupation.
If the archaeology of the California Desert is not to slip away in the
near future, a comprehensive program of preservation and management is
required. Through lack of means of enforcement, the Antiquities Act of itself
has provided little real protection. The resources that remain in the
California Desert are there largely because of the lack of development and
the relative inaccessibility of its remote areas, two factors that are
rapidly changing as a result of increasing population in adjacent areas and
greater mobility of that population.

-3-
The archaeological Inventory of the California Desert is designed to
provide inventory data on the nature, estimated numbers and distribution of
archaeological resources in the desert. It is the basic step in developing
an archaeological program design for the California Desert, which would
include the following:
1. Inventory the archaeological remains of the California Desert;
2. Long term protection of archaeological resources from:
a. Destruction by construction of facilities for increased use of
the desert, and related impacts,
b. Non-scientific exploitation including casual collecting,
systematic collecting for sale, exchange or private use as decorations, etc.
c. Damage by indirect effects of increased use of desert areas
resulting in erosion and other disturbance of the surface;
3. An interpretive program to enhance public enjo3niient of the desert
through the opportunity to learn how earlier peoples used and viewed these
same lands;
4. A program of public education that will result in the recognition
of archaeological resources, along with other desert values, as fragile and
easily destroyed, to be protected and conserved in the course of use of the
desert;
5. Monitoring the scientific use of archaeological resources through
existing and expanded federal policies requiring permits, justification of
proposed work and reporting of results;
6. Enforcement of laws and policies relating to protection and proper
use of archaeological resources;

-4-
7. Management planning to minimize direct and indirect impacts on
archaeological resources;
8. Adequately funded program of archaeological survey and salvage
permitting thorough recovery of archaeological information from localities
where overall management considerations dictate that archaeological resources
cannot be preserved;
9. Protection of lands reverting to BLM ownership until they can be
inventoried for archaeological resources, recognizing that lands previously
closed to public access, such as military reservations, may constitute unique
preserves of relatively undamaged archaeological resources; and
10. Inventory of lands to be exchanged out of BLM ownership to assure
that significant archaeological resources are not lost to public ownership
and protection through such exchange.

-5-
OBJECTIVES OF THE ARCHAEOLOGICAL INVENTORY
OF THE CALIFORNIA DESERT
1. The discovery and recognition of patterns of ethnographic and
prehistoric use of the Caifornia Desert area;
2. Identification of the biotic, topographic or hydrologic variables,
or combinations thereof that form the most accurate predictors of archaeological
locations;
3. Investigation of how well the variables employed in the Desert Study
P^^dict the location of archaeological resources;
4. Development of projections of expected density and distribution of
archaeological resources in the California Desert;
5. Delineation of areas of high archaeological sensitivity requiring
maximum protection;
6. Delineation of areas with a high probability of lower archaeological
sensitivity where development for economic or recreational activities should
endanger relatively few archaeological resources, resulting in minimal costs
for protection and/or salvage of what resources are present.

-6-
ASSUMPTIONS AND APPROACH OF THE
ARCHAEOLOGICAL INVENTORY
In approaching the problem of inventory by way of discovery of patterns
of site location relative to a series of environmental variables and the
development of projections based on these patterns, the archaeological
inventory assumes that:
1. Extraction of economic resources was a significant determinant of
the land use patterns practiced by the aboriginal inhabitants of the California
Desert. Location of archaeological sites, therefore, will have a regular
relation to the distribution of economic resources used by the past
inhabitants;
2. While we do not know these past economic systems in detail, or how
the distribution of economic resources has changed through time, we may
expect that they are closely related to current plant zones, physiography
and hydrology; and
3. That relations between these variables and archaeological locales
are of sufficient strength that predictions of site densities and locations
can be generated for management purposes. f
The first assumption is well justified in anthropological theory, although
how much of site location can be accounted for by the distribution of economic
resources remains under study. It is expected that this factor will vary
through time, between cultural groups and with different levels of socio¬
economic organization. With respect to the second and third assumptions,
similar work underway in restricted areas of the desert. Great Basin and

-7-
American Southwest indicate these are reasonable assumptions. From the
viewpoint of archaeological theory, the archaeological inventory of the
California Desert constitutes a large scale test of these assumptions.

-8-
KINDS OF DATA NECESSARY
Non-Archaeologlcal Data
The archaeological inventory requires a non-archaeological data at two
junctures, first in stratifying the inventory area prior to drawing the
samples, and later, in the analysis of site locations.
Three prime variables, hydrology, vegetation and physiography, will
stratify the random sample of areas to be examined, assuring large scale
projections of site densities for the inventory area. For each of these
variables the archaeological inventory will require maps of the inventory
area divided into zones according to these three variables. Table 1 shows
the magnitude of the subdivisions of the stratifying variables. Generally
they should correspond with or be closely related to the first-order sub¬
divisions of the Legend of the pertinent BLM Inventory, as worked out for
Vegetation, the only legend available at present.
In analyzing the locations of occupation sites and camps, the archaeological
inventory will require non-archaeological data from a wider variety of
disciplines and at a more detailed scale. Site catchment analysis, a prime
tool in identifying patterns of site location, focuses on the amounts and r
varieities of economic resources available within a given range of a site.
In dealing with peoples lacking vehicles and domesticated transportation
animals, the radius of the area of analysis is an estimate of the distance
which someone can walk, accomplish economic tasks and return within a day.
It is usually estimated at 5-10 km from the site. Within this radius the
following kinds of data are pertinent to hunting and collecting peoples.
a. Vegetation: density and distribution of plant species, especially
those of economic values;

-9-
TABLE 1 - STRATIFYING VARIABLES
A. Vegetation^
Archaeological Inventory Stratum
B. Hydrology'
B,
^LM Vegetation Map Legend Communities
* Saltbush Communities' '/xreosote Bush Communities
Desert Shrub Communities
Mountain Shrub Communities Conifer Communities
v1*inyon-Juniper
Grass Community V-Sagebrush Community
\/p o c <r
S n r r f ^ —
BLM Code
13 11
16
05 06 09
01 04
Springs and tanks, area defined as a circle .5 km radium from the spring or tank.
^2 Stream order less than three, area defined as a strip i km wide centering on the stream line.
Stream order three or larger, area defined as a strip 1 km wide centering on the stream line.
Areas within .5 km of relict features of past hydrology, such as past lake stands, now-dry washes, springs and tanks.
C. Physiography 3
Areas at distances greater than .5 km from water resources as defined above.
Sand dunes.
Basin floors and valley floodplains.
Bajada slopes and alluvial fans.
Mountain/bajada intersection, area defined as a strip 1 km wide centering on the break in slope.

-10-
TABLE 1 - continued
4 Slopes with exposed bedrock and/or greater than 10% slope.
Upland surfaces with less than 10% slopes.
Notes:
^Strata defined under Vegetation can be mapped directly from completed BLM Vegetation maps for the Desert.
^At the time of this writing it is not known what form water resources maps for the desert inventories will take. The subdivisions of this stratifying variable should be considered subject to adjustment to better utilize water resource inventory data when it becomes available.
^It is not now known how the BLM will handle physiographic classification. It appears that the physiographic classification implicit in the Soils Legend at the Soil Series level could be adapted to serve as a stratifier in the archaeological element if the BLM Inventory does not include a more explicit landform classification.
“^In areas where local lithology favors the development of caves and shelters, outcrop areas can be defined as a substratum and examined in second phase sampling.

-11-
b. Soils map;
c. Current hydrology Including flow estimates, reliability and long
term parameters of flow variation;
d. Wildlife: density, distribution and seasonal patterns;
e. Lithologic resources, particularly the availability of cherts,
obsidian and crystalline rocks for chipped stone manufacture;
f. Relict features of past hydrologic and pedologic regimes; and
g. Evidence of botanical and faunal changes, introduced species.
Ethnographic-Ethnohistoric Data
The record of desert land use in the period just preceding and subsequent
to European contact constitutes the richest part of the desert's archaeological
record, the time segment with the greatest potential for understanding and
interpreting aboriginal use and occupancy in the desert. The archaeological
resources dating to this period are complemented by the existence of written
materials of ethnographic and ethnohistoric content. Only for this period do
direct records exist of aboriginal life in the California Desert. Compilation
of the ethnographic and ethnohistoric information is vital to meaningful
interpretation of the late prehistoric archaeology of the desert, and
constitutes a prime source for meaningful models to be tested against the
archaeological record. Once compiled, this information will constitute a
tremendous data base for BLM interpretive programs enhancing the public's
understanding and appreciation of the California Desert.
Compilation of ethnohistoric data will emphasize:
1. Ethnobotanical survey to identify economic plants used by the
Indian groups of the desert, along with quantitative data as to their
importance and role in the socio-economic life;
several

-12-
2. Ethnofaunal survey with similar goals;
3. Evidence of site locations from oral literature, ethnographic
surveys and Spanish documents;
4. Survey of material culture collections and associated notes and
data from museum files for evidence of site location, technology and
economy; and
5. Survey of photographic collections for archaeological and
ethnographically relevant pictures.
Three general kinds of resources exist for the ethnographic-ethnohistoric
component; published materials, archival materials and Native Americans who
combine their knowledge of present Native American cultures with research
into written sources and can provide a most vital perspective. Ethnographers
and ethnohistorians have recently located a wealth of published and archival
materials bearing on the aboriginal inhabitants of the California Desert,
scattered in a dozen or more institutions throughout the country. They
must now be combed to retrieve the data useful to the archaeological inventory
and as interpretive materials.
Direct benefits to the archaeological inventory include:
,1. A complete map of ethnographically and historically documented sites
and their classification by tribe and where possible by use, structures and
features;
2. A thorough description of potential biotic resources available in
each area from the ethnographic view;
3. Documentation of known trade and exchange relationships; and
4. A catalog of artifacts for which there is ethnographic data as to
their culture of origin, techniques of manufacture and/or uses and functions
for comparison with archaeological materials.

-13-
Archaeological Data
The archaeological inventory requires the identification and study of a
representative sample of archaeological sites in each inventory area. The
internal organization of the site must be recorded so that it can be categorized
as to the kind of site it is. In addition, remains of tools and objects will
have to be examined to determine the general time periods of its use.
Categorization of a site as a temporary camp, quarry, semi-permanent
village, etc. requires data on the size of the site, presence of any structural
remains, associated permanent features such as bedrock grinding surfaces or
rock art, distribution of tools and refuse on the surface reflecting activities
carried on at the site and a general summary of the artifact inventory present.
Assignment of the site’s occupation period(s) requires identification of
temporally significant artifacts on its surface, which in the desert will be
primarily projectile point types and pottery types. Specifics of archaeological
data requirements and collection are spelled out in the section on Execution
of the Sampling Design.
Remote Sensing
The activities of prehistoric man in the desert areas in many cases did
not modify the surface of the earth sufficiently to be distinguished on aerial
photography or ERTS imagery, so that remote sensing techniques will not
record many of the loci of man's activities. Among those prehistoric features
that can be discerned by remote sensing at appropriate scales are rock
constructions such as ground figures and fish traps, mescal roasting pits,
sleeping circles" and trails in desert pavement, and irrigation channels.
While locations and distributions of the above kinds of archaeological
sites can be studied directly on aerial photos, most occupation sites will

-14-
not be visible on photos. In inventorying the bulk of desert sites, remote
sensing will have a two-fold role. First, the large scale mapping of
terrain with respect to the several variables of concern in archaeological
locational analysis will make possible investigation of the distribution of
archaeological resources at a scale not possible before. Results of
archaeological locational analysis can then be extended to additional areas
of the desert where natural resources mapping is available, greatly extending
the results of the archaeological inventory. Second, availability of map
correlated aerial photographs will enhance the speed and accuracy for the
on-the-ground field work portion of the archaeological inventory. Used in
conjunction with topographic maps they speed up location of quadrats to be
examined, delineation of site limits and site-catchment radius to be examined,
and provide rapid orientation to a site's microenvironment.
Once patterns of site location and site density relative to vegetation,
hydrology and physiography have been established for the California Desert
by studies in inventory areas, remote sensing can provide large scale mapping
of these biotic variables, from which projections of expected site locations,
densities and archaeologically sensitive areas can be made for the Desert as
a whole.

-15-
BLM INVENTORY AREAS AS SAMPLING UNIVERSES
The Bureau of Land Management Is approaching the California Desert through
resource Inventory of a series of inventory areas within the desert. These are
being selected to represent the several subregions of the desert areas with
consideration given to land ownership patterns and man's current impact on the
desert. While the Inventory areas selected by the BLM will not form a probability
sample of the desert this limitation is more than offset by the advantages to
be gained by coordinating the archaeological Inventory with other inventories.
Present BLM plans call for large scale mapping of inventory areas with
respect to soils, vegetation, water resources, minerals, geology and wildlife.
By working with BLM Inventory areas archaeologists will be able to draw on
these detailed studies and maps to stratify inventory areas for sampling.
In analysis phases, control of these variables will expedite microenvironmental
analysis of site locations, permitting control of more variables at a finer
level than were used to stratify the sample.
In the archaeological inventory, each inventory area will constitute a
universe for sampling purposes. Consistent use of the sampling procedure
outlined here in all inventory areas will produce a set of consistent data for
each inventory area, from which statements about site locations in the desert
as a whole and in the subregions can be made.
Prior to initiating the sampling strategy in any inventory area a thorough
background study should be completed, summarizing the available knowledge of
the area's ethnohistory, ethnography and prehistory, and assembling site
records and locations for all recorded archaeological sites in the area.

-16-
GENERAL SAMPLING STRATEGY/TECHNIQUE
FOR ALL INVENTORY AREAS
Multistage stratified random sampling is judged the appropriate sampling
design for the archaeological inventory of the Desert Study. As a form of
random sampling it will yield a probability sample and will permit calculation
of the reliability of site density estimates projected from these samples.
Stratification of the random sample provides two basic guarantees; first, a
fair allocation of the samples within the inventory area, and second, assurance
that site density distribution estimates relative to the basic management
variables selected as stratifiers will be forthcoming as central, basic results
of the study. Two-stage sampling permits allocation of the samples in ways
to maximize the information yield for a given amount of field time.
Archaeological judgment and the assumptions of the archaeological inventory
direct that three major variables, vegetation, hydrology and terrain physiography,
be selected as stratifying variables. Following Kish’s admonition (1965:101)
that "Generally, more gain accrues from the use of coarser divisions of several
variables than from the finer subdivisions on one," the proposed divisions of
the stratifying variables are outlined in Table 1.
Sample Size and Allocation
No rule has been established as to size of sample or sampling percentage
necessary for a study such as this. Flog and Hill (1971:21) discussing the
American Southwest state, "In order to analyze the effect of the variables
independently and in interaction we will need to sample territory that falls
within each of the extant sets... Somewhere between 25% and 50% of the
territory covered by each set should be samples. Twenty-five percent seems

-17-
CO be the sampling percentage necessary to obtain minimal accuracy while 50%
sample frequently seems necessary before really substantial accuracy can be
obtained." Several studies now underway in the Great Basin (Thomas 1969;
Hettinger 1973) are utilizing a 10% sample, with disproportionate allocation
of Che sample between strata. These sample sizes have been determined
entirely by operational pragmatics. Thomas says "Since this is a pilot study
in every sense and we cannot therefore make even a reasonable estimate as to
the sample variance, we are in no position to calculate proper sample size;
the sample must be determined strictly on economic considerations (1969:92-93)."
mlc considerations rule out samples of the size suggested by Hill and
Plog. On the other hand, 10% samples such as those being used with some
success by Thomas and Bettlnger in well watered valley systems in the Great
Basin may not yield an adequate number of site locations for analysis due to
lower expected site densities in the California desert. The sampling design
proposed here is a multistage stratified random sample, examining an area
equivalent to 15% of the land surface of the inventory area with disproportionate
allocation of that 15% among the strata. Tables 2a, 2b, 3a and 3b summarize
the expected results of such a sampling design in two hypothetical inventory
areas.
The first stage sample Includes 5% of the land surface of the inventory
area, allocated proportionately to all strata. Field survey of the first-stage
quadrats will allow identification of zones of very low densities which can
then be dropped from further sampling, allocating remaining field time to
zones where larger numbers and/or particularly significant sites may be
expected.
-18-
TABLE 2a - MODEL STUDY AREA 1
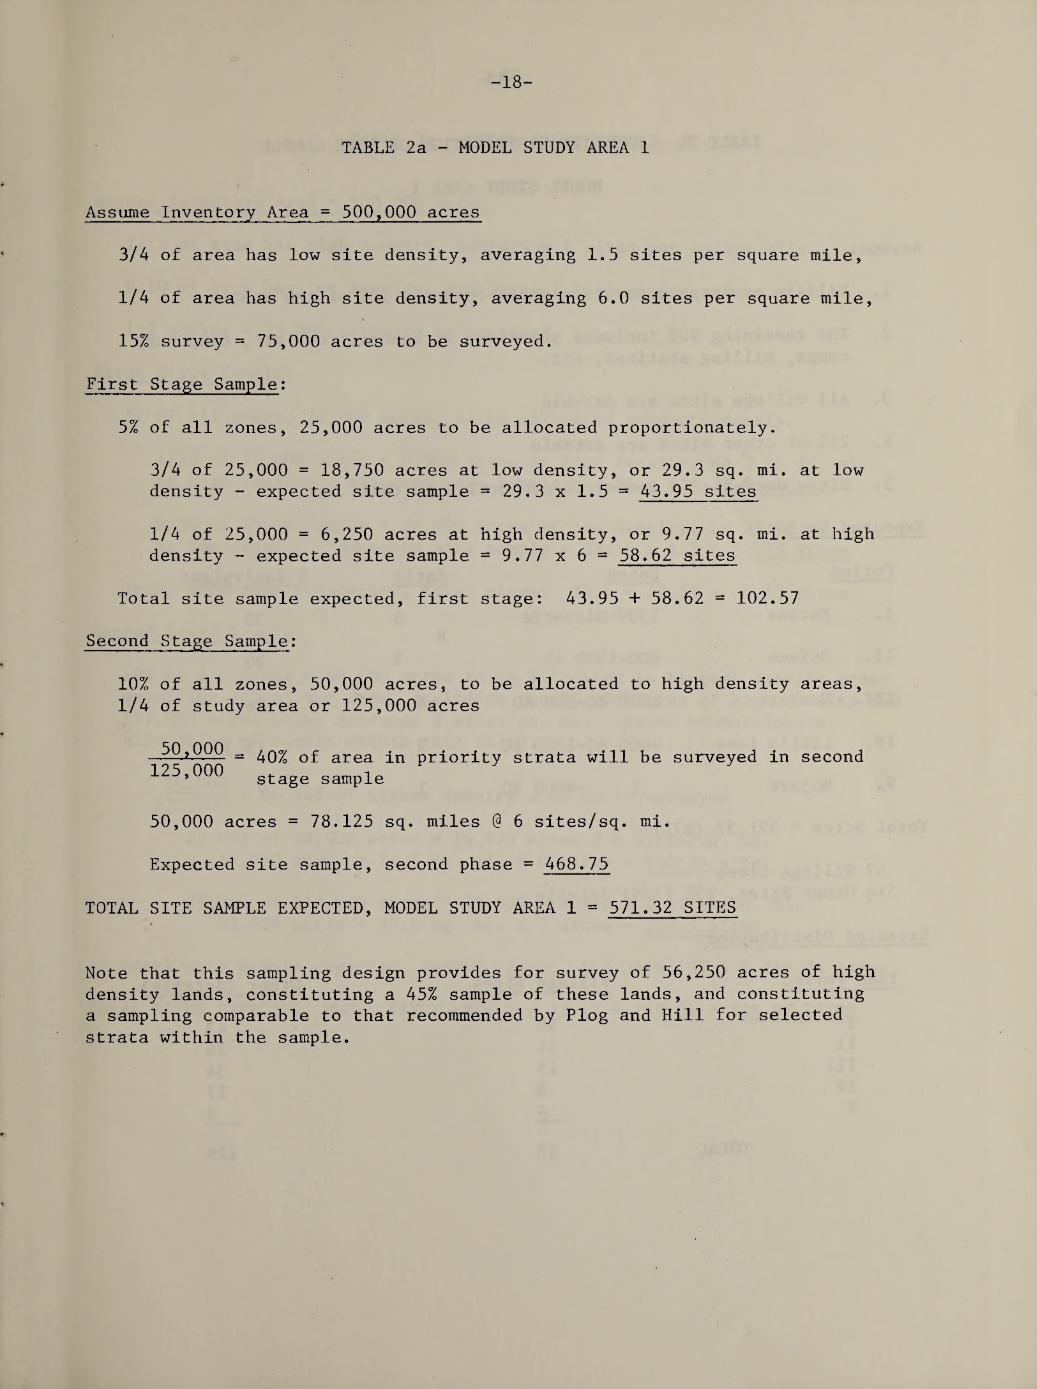
Assume Inventory Area = 500,000 acres
3/4 of area has low site density, averaging 1.5 sites per square mile,
1/4 of area has high site density, averaging 6.0 sites per square mile,
15% survey = 75,000 acres to be surveyed.
First Stage Sample:
5% of all zones, 25,000 acres to be allocated proportionately.
3/4 of 25,000 = 18,750 acres at low density, or 29.3 sq. mi. at low density - expected site sample = 29.3 x 1.5 = 43.95 sites
1/4 of 25,000 = 6,250 acres at high density, or 9.77 sq. mi. at high density - expected site sample = 9.77 x 6 = 58.62 sites
Total site sample expected, first stage: 43.95 + 58.62 = 102.57
Second Stage Sample;
10% of all zones, 50,000 acres, to be allocated to high density areas, 1/4 of study area or 125,000 acres
50,000 125,000
40% of area in priority strata will be surveyed in second stage sample
50,000 acres = 78.125 sq. miles @ 6 sites/sq. mi.
Expected site sample, second phase = 468.75
TOTAL SITE SAMPLE EXPECTED, MODEL STUDY AREA 1 = 571.32 SITES
Note that this sampling design provides for survey of 56,250 acres of high density lands, constituting a 45% sample of these lands, and constituting a sampling comparable to that recommended by Plog and Hill for selected strata within the sample.

-19-
TABLE 2b - EXPECTED DISTRIBUTION OF SITE SAMPLE
MODEL STUDY AREA 1
Assume:
1. 2.
Village or large occupation sites comprise 10% of the sample
The remaining 90% includes quarries, workshops, rock art camps, milling stations, etc.
temporary
3. All village sites are datable
4. 25% of other sites are datable
5. Sites decrease in geometric proportion to their age
Expected Ratio:
Period Dates Ratio % Equivalent
I. Marana 1300-Historlc 5 8
33
II. Haiwee 600-1300 AD 3 20
III. Newberry 1200 BC-600 AD 4 26.7
IV. Little Lake 4000 BC-1200 BC 2 13.3
V. Mo j ave ? -4000 BC 1 7
Total Sites = 571.32 (571)
57 Village Sites
514 Other Sites, 25% (129) datable
Expected Distribution:
Time Period Village Sites
I II
III IV V
19 11
15 8 4
Other (datable)
43 26 34 17
9
TOTAL 57 129

-20-
TABLE 3a - MODEL STUDY AREA 2
Assume Inventory Area = 500,000 acres
1/10 of area has high density, averaging 6 sites per square mile,
9/10 of area has low density, averaging 1.5 sites per square mile,
15% survey = 75,000 acres to be surveyed.
First Stage Sample:
5% of all zones, 25,000 acres, to be allocated proportionately.
1/10 of 25,000 acres = 2,500 acres at high density, or 3.91 sq. mi. at high density - expected site sample = 3.91 x 6 = 23.4 sites
9/10 of 25,000 acres = 22,500 acres at low density, or 35.16 sq. mi. at low density - expected site sample = 35.16 x 1.5 = 52.73 sites
Total site sample expected, first stage: 23.4 + 52.73 76.13 sites
Second Stage Sample:
10% of all zones = 50,000 acres to be allocated to highest density areas equalling 1/3 of the area, including the 50,000 acres of high density and 117,000 acres which averages 2 sites/sq. mi. Assume proportionate allocation of sample within this third.
50,000 125,000
29.94% of higher density area to be surveyed
29.94% of 50,000 acres = 14,970 acres @ 6 sites/sq. mi. 14,970 acres = 23.4 sq. mi. x 6 sites = 140.34 sites
29.94% of 117,000 acres = 35,029.8 acres @ 2 sites/sq. mi. 35,029 acres = 57.4 sq. mi. x 2 sites = 109.5 sites
Total site sample expected, second stage: 140.34 + 109.5 = 249.84 sites
TOTAL SITES EXPECTED, MODEL STUDY AREA 2 = 73.13 + 249.84 = 325.97 SITES

-21-
TABLE 3b - EXPECTED DISTRIBUTION OF SITE SAMPLE
MODEL STUDY AREA 2 1
Assume:
Same assumptions in Table 2b hold.
Total Sites = 325.97 = 326
33 Village Sites
293 Other Sites, 25% datable (73)
Expected Distribution:
Time Period Village Sites Other (datable)
I 11 24
II 7 15
III 9 19
IV ^ 10
V — -i.
TOTAL 33 73
<
i

-22-
The second stage sample is an area equivalent to 10% of the total study
area, but allocated only to priority strata, strata selected for further
sampling on the basis of the first stage sample. For example in model study
area 1 (Table 2a), a 500,000 acre study area, the second stage sample of 10%
will permit examination of 50,000 acres. As a result of the first stage
survey, strata comprising 1/4 of the study area were determined to be priority
strata. Thus in the second stage sample, strata comprising 125,000 acres are
to be sampled, by quadrats which will total 50,000 acres. This examination
of 50,000 acres of a total of 125,000 acres in the priority strata constitutes
a 40% sample of those priority strata, falling within Flog and Hill’s
recommended 25-50%, but for the selected strata only. It is recommended that
priority strata for second stage examination be defined so that they include
no more than 40% of the original study area, assuring adequate sampling of
these strata in the second stage.

-23-
EXECUTION OF THE SAMPLING DESIGN
USGS 15 minute series topographic maps are uniformly available for the
California Desert area and will serve as the base map for the archaeological
inventory. A mosaic of the 15 minute sheets for all quads in the inventory
area should be prepared as the base for stratification. Using BLM inventory
maps, the study area should first be subidivided into the prescribed
vegetation zones. The vegetation zones should then be subdivided into
physiographic areas. The final subdivision will then be by hydrology,
identifying the zones with positive water resources. Each delineated area
should then be identified by its strata. For instance, all areas marked A^
B2 C4 would be included in the stratum of areas with Desert Shrub vegetation
communities adjacent to low order streams at the mountain-bajada interface.
To draw the sample a rectangular grid of dots spaced at .5 km intervals,
keyed to the Universal Transverse Mercator Grid on the base maps would be
superimposed on the stratified map, each representing the center of a possible
quadrat. Each dot in each stratum would be numbered starting with 0001. The
number of quadrats constituting a 5% sample of each stratus is calculated.
Using a four-digit random numbers table, the requisite number of quadrats are
selected for each stratum and the selected quadrats are outlined on the base
map. Note that the position of the center of each quadrat determines which
strata it represents. If its boundaries transgress a stratum boundary, that
fact is ignored for the purposes of drawing the sample.
In drawing the second phase sample each stratum is identified with the
percentage sample to be drawn from it converted to the number of quadrats to
be examined. Using the 4-diglt random numbers table once again, the requisite
24-
number of quadrats are drawn for each stratum and the selected quadrats
outlined on the base map.
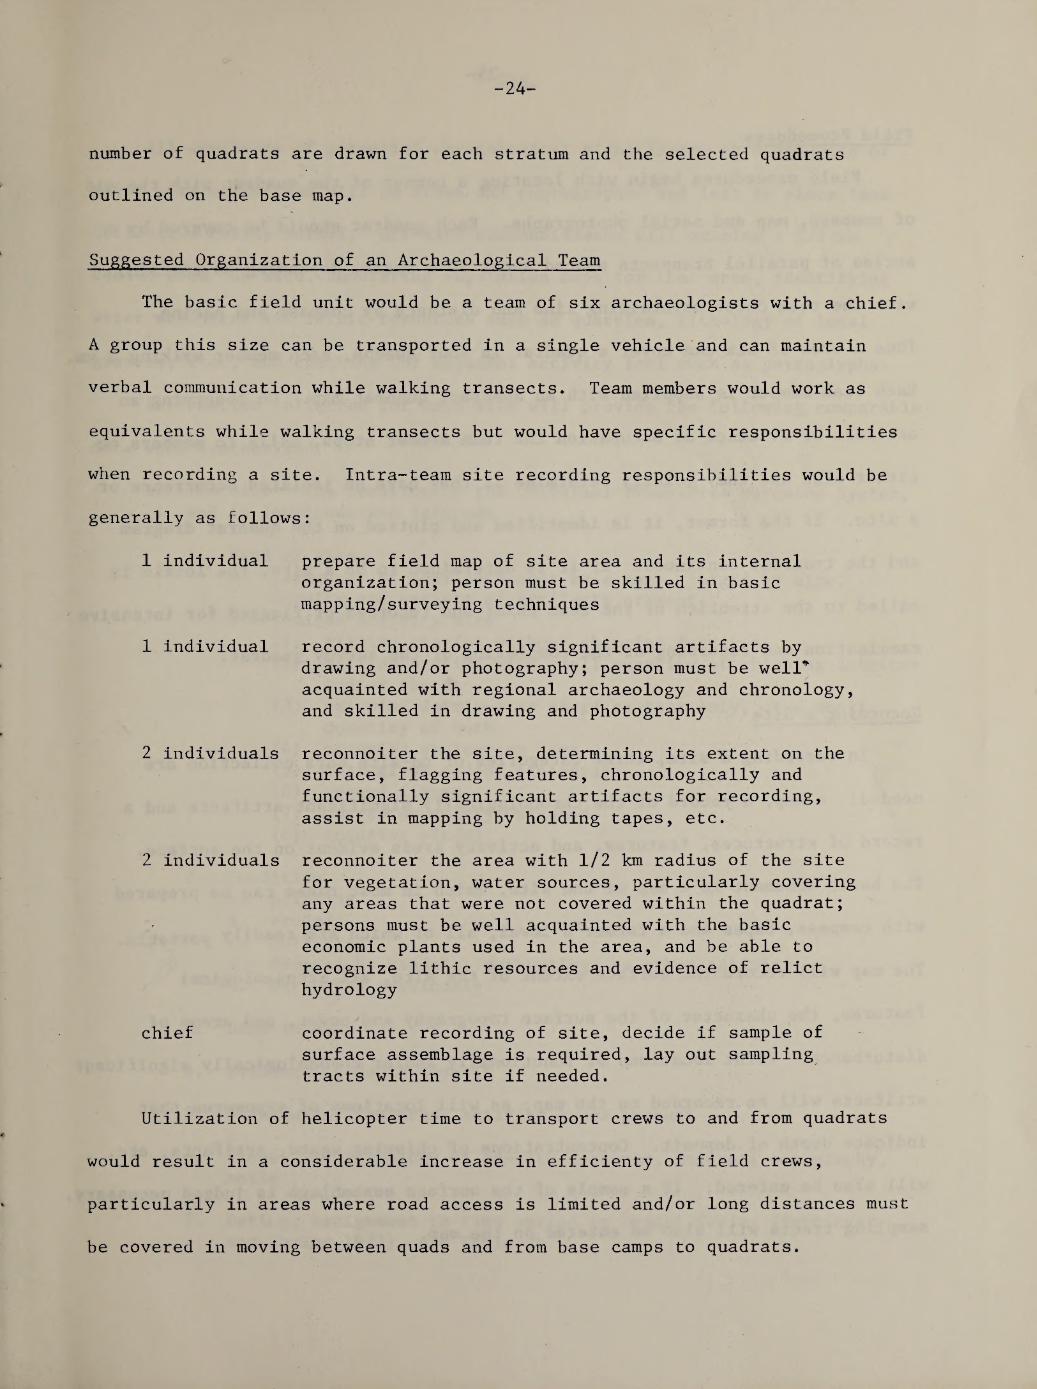
Suggested Organization of an Archaeological Team
The basic field unit would be a team of six archaeologists with a chief.
A group this size can be transported in a single vehicle and can maintain
verbal communication while walking transects. Team members would work as
equivalents while walking transects but would have specific responsibilities
when recording a site. Intra-team site recording responsibilities would be
generally as follows:
1 individual
1 individual
prepare field map of site area and its internal organization; person must be skilled in basic mapping/surveying techniques
record chronologically significant artifacts by drawing and/or photography; person must be well^ acquainted with regional archaeology and chronology, and skilled in drawing and photography
2 individuals
2 individuals
reconnoiter the site, determining its extent on the surface, flagging features, chronologically and functionally significant artifacts for recording, assist in mapping by holding tapes, etc.
reconnoiter the area with 1/2 km radius of the site for vegetation, water sources, particularly covering any areas that were not covered within the quadrat; persons must be well acquainted with the basic economic plants used in the area, and be able to recognize lithic resources and evidence of relict hydrology
chief coordinate recording of site, decide if sample of surface assemblage is required, lay out sampling tracts within site if needed.
Utilization of helicopter time to transport crews to and from quadrats
would result in a considerable increase in efficienty of field crews,
particularly in areas where road access is limited and/or long distances must
be covered in moving between quads and from base camps to quadrats.

-25-
Field Procedures
Field procedures begin with locating a corner of the quadrat with the aid t
of compass, map and aerial photographs. Each quadrat should be covered by a
series of parallel transects spaced about 20 m apart, depending on terrain,
with the team chief maintaining line and distance by compass and pacing.
Thus a crew of six can cover a quadrat in four sweeps, each member walking 2 km
Each team member is supplied with an abstract quadrat map. On observing an
artifact or evidence of occupation the team member stops, calls to members on
either side and they jointly determine if they have an isolated occurrence or
a site. If the former, it is identified and plotted on the quadrat diagram
and the transect continued. If it is determined to be a site, the locale is
called to the attention of the team chief and recorded or flagged for intensive
examination and recording at the completion of the survey quadrat.
Recording a Site
In recording a site, three categories of on-site data collection are
needed: a map, a record of the chronologically significant artifacts and a
structures, features, and activity areas evident on the surface.
The basic document is a map of the site, which in most cases can be prepared
with compass, tapes and a farmer's level, all of which are readily portable.
The map will record the surface extent of the site, all archaeological
features, the character of the surface topography and cover, and areas of
disturbance. Point locations of functionally and/or chronologically significant
artifacts will be recorded on the map, as will locations of exposures that
indicate depth of deposit. Concentrations of chipping waste, artifacts, etc.
will also be entered. If a sample of the surface assemblage is judged necessary,
sampling tracts will also be entered on the map.

-26-
All artifacts of potential chronological significance or diagnostic of
major site activities will be drawn and photographed and left in place (see
Collection Policy below). Off-site reconnaissance will examine a 1/2 km
radius from the site, annotating vegetation maps for that area, identifying
water resources and lithic resources such as quarries, lithology of local
gravels, etc., and checking for adjacent activity loci such as petroglyphs.
Information collected for each site will provide the following comparable
data when synthesized.
A. The Site - its location in the Universal Transverse Mercator System, and in longitude and latitude
1. Kind of site a. permanent or semi-permanent base camp, judged by size,
density and variety of artifacts present b. limited activity site
(1) milling station without chipping detritus (2) milling station with small quantity of chipping detritus
and/or sherds (3) chipping detritus or sherd scatter only, or a small
quantity of both (4) occupied shelter or cave (5) petroglyph and/or pictograph (6) ground figure (7) quarry or quarry/workshop (8) roasting pit(s)
2. Condition a. pristine
, b. eroded c. collected d. damaged by vandals, pothunting, or other activity e. excavated previously
3. Size in area
4. Evidence of depth deposit
5. Structures, features, activity areas present
6. Slope, and lithology of on-site features, internal topography, soils
7. Dating, assignment to time period in Descal Series (Bettinger and Taylor 1973), see Table 2b

-27-
B. Its Microenvlronmentl - data from field observations will be combined With data from other elements of the Desert Study inventory, maps and aerial photography ' ^r
1. Water resources, distance from site, kind, estimated flow, reliabilityj relict features of past hydrology
2. Major economic plants; presence/absence and densities of such plants as
Pinus Quercus
Prosopis, Acacia, Palo Verde, Ironwood Agave« Yucca
Opuntla, Echlnocactus Prunus
f
3. Number and areas of plant communities within designated radii of the site
4. Presence of lithic resources
5. Game, availability, density, seasonality
Artifact Collection Policy
The archaeological inventory requires that Information be gathered at
each site which will identify its general chronological position and its
general nature, to the extent that this is possible without excavation. As a
rule this information is obtainable from careful observation and recording at
the site. For this reason, no standard methods of surface collection are
included in the procedures outlined. A number of circumstances may occur in
the course of inventory work where samples of the surface assemblage are
required. Included would be situations where an institution is carrying on
research in conjunction with their inventory work, instances where laboratory
study is needed to clarify chronological significance of artifacts, cases where
The area within 1/2 km of the site will receive immediate field study. Zones of 5 km and 10 km radius around village sites, complex midden sites,
ling sites and caves or shelters containing complex midden should be examined by maps and aerial photographs for potential resources inventory.
e designated radii, 5 km and 10 km are based on the known distances exploited by modern hunter-collecters (Jarman 1972:713).

-28-
lithic frequencies of detritus may provide important time-space controls,
etc. Collection is not proscribed from the archaeological inventory, but
should be undertaken only when the need is clearly articulated, and then the
sampling technique adopted should be designated to suit those needs.
Handling of Incidentally Discovered Sites
In the course of work in an area, sites will be found in travel between
quadrats, etc., which do not fall into the inventory sample. Such sites
should be recorded in the same manner as sites found in quadrats. Information
from these sites must be kept separately and not used in any analysis or
estimating techniques dependent on probability samples.

-29-
PROGRAM OF EVALUATION AND SYNTHESIS
Data output of the archaeological field teams will be continually
monitored, permitting on-line evaluation of the progress of the archaeological
Inventory. Monitoring will focus on three aspects of the work progress, using
estimated projections as controls:
1. rate of quadrant examination;
2. rate of site discovery per quadrat; and
3. data quality, how many sites can be dated and assigned to kind on
the basis of field examination.
Continual monitoring of the data output will provide for quick recognition
of any problems that arise in operationalizing the archaeological inventory.
This continuous monitoring in combination with the 2-phase sampling design,
where allocation of the second stage will be determined at midstream in the
study, should assure discovery of sufficient sites for a meaningful analysis
and significant results.
Four foci will form the core of the data synthesis; areal site density
estimates, relationship of management variables to site locations, examination
of additional variables collected by the archaeological teams relative to site
location, and site catchment analysis. Site density estimates will be
calculated as direct blow-up estimates by areal zones corresponding to the
strata in the sampling design and will provide areal overlays reflecting
differing expected densities for the study area.
Second level analysis will identify the patterns of site location
relative to the main variables of the archaeological Inventory, the three
ylng variables of vegetation, hydrology and physiography. The actual
distribution of sites in the sample relative to each variable can be compared
-30-
with the expected distribution if the variable has no effect on distribution,
to identify the variables that affect the actual distribution. The sample of
sites from the inventory area as a whole will be examined relative to each
variable. Next, subsets of the site sample will be examined to identify non-
random distributions relative to the several variables. Prime subsets should
be defined by time period and by kind of sites. Where sample size permits,
site subsets defined by both time period and kind of site, such as semi¬
permanent sites of the Haiwee period, should be examined relative to each
variable. Since this data consists of category frequencies, primiarly on a
nominal scale, non-parametric statistics are appropriate, and Chi-square is
an appropriate statistic to test for significance of the above distributions
(Siegel, 1956). The distribution of the site populations and its subsets will
also be examined relative to combinations of the stratifying variables. Plog
and Hill (1971:28-31) suggest percentage point difference as a useful way of
looking at this kind of data, and again Chi-square provides an appropriate
test of significance. Comparison of the distribution of site subsets by
similar statistical means will sharpen the definition of the patterns of site
location appropriate to the several subsets.
The third level of analysis will focus on distribution of the site
population and its subsets relative to variables beyond the stratifying variables
such as lithology, soils, specifics of on-site vegetation; also on additional
variables defined pertinent to the specifics of the particular inventory area
in question. For instance, in the limited areas of the desert where prehistoric
agriculture may have been practiced, special variables pertinent to agricultural
patterns should be defined and studied in addition to the core variables
outlined here.

-31-
At the fourth level the analysis shifts from the site Itself to examination
of the microenvironment selected for a site location. The area around the
site, defined hy 5 km and 10 km radii and called the site catchment (Vita-
Finzi and Higgs 1970) is the unit of analysis. The area within these radii
is quantified as to the kinds and densities of economic plants available,
numbers of plant communities and areas thereof to identify ecotonal situations,
kinds of lithic resources available, kinds of physiographic zones and areas
thereof, estimated amount of water available, estimated kinds, amounts and
seasonal patterns of game. The various site subsets can be compared to each
other, to the population as a whole and to a randomly generated series of
hypothetical site locations to elucidate the variables and combinations
thereof. Chi-square in its several applications will provide a suitable
test of significance.
The four levels of analysis outlined above constitute the basic examination
of the data that will be required to elucidate the patterns of site location for
management purposes. Beyond the guidelines above, there are many other ways
of looking at the data. Which particular methods will be suitable depends on
the quality of the data. Further, methods of site location and site catchment
analysis are rapidly expanding in archaeology. Green's application of percentage
difference and comparison of means plus stepwise multiple regression to analysis
of locations of prehistoric Mayan sites in northern British Honduras is one
example of methods applicable to inventory data (Green 1973). Site location
models can be generated from our current understanding of past economic
behavior using mini-max theory and other useful modeling techniques, for
comparison against site locational data. While outcomes of these approaches
cannot be specified at this time, in similar work they are proving to be

-32-
sensitive, insightful techniques for examining patterns of site location and
identifying the factors that are the most significant determinants of site
locations, and thus will be the most accurate predictors for management studies.

-33-
POTENTIAL INVENTORY AREAS
From an archaeological viewpoint, the California Desert does not emerge
as Including some areas of extremely high priority for archaeology contrasting
with other, very low, priority areas. Rather than regionally based priorities,
the following considerations are important in selecting archaeological
inventory areas in the California Desert.
1. The need to identify and protect areas where the archaeological
resources remain relatively undamaged.
2. The need to inventory and protect or recover the remaining archaeological
values in areas receiving heavy damage.
3. Current research trends dictate some priorities:
a. the extent of prehistoric and early historic agriculture among
the California Indians has created interest in such diverse areas as the
Imperial-Coachella Valleys, Lake Mojave and the Eureka Valley.
b. continuing importance of the California Desert in research into
earlier periods of man's occupance of the New World focusing interest on areas
of the desert where relict features of Late Pleistocene environments are
evident such as the Mojave sink and the Pluvial Pinto River drainage through
Palen and Ford Lakes.
4. If predictive patterns are to emerge from the archaeological inventory
that will have desert-wide utility, the distribution of the inventory areas
will be crucial. Adequate geographic dispersion throughout the area, inclusion
of upland areas, closed basins, and through-flowing drainages will be important.
Adequate dispersal among the territories assigned to the ethnographic peoples
of the California Desert will be another way of checking the distribution.

-34-
With the above guidelines in mind, and recognizing that priorities will
change due to changes in use pattern and impact on the California Desert, and
also with changing research interests in the desert, the following areas are
recommended as inventory areas, in addition to the Yuha and El Paso/Red
Mountain areas already designated by the BLM.
New York and Providence Mountain Area, Including the Clark Mountains
The area is of considerable archaeological interest in that it presents a
very full range of desert vegetation and environments, from extensive areas
of pinyon-juniper to the creosote bush communities. Preliminary work in the
area by the San Bernardino County Museum and Emma Lou Davis indicate it is
rich in archaeological resources. While not heavily impacted at present, the
area has been opened to access by a BLM road and campsites, and impact is
expected to increase.
Saline-Eureka Valleys
These valleys are reported to contain a great wealth of archaeological
remains, spanning at least the past 3,500 years (Robarchek, "A Survey of
Archaeological Resources in the Saline-Eureka Valley Area,” for BLM) and are
suffering much illicit collecting and excavation. The area would provide a
sample of archaeology pertinent to the Great Basin Shoshoneans who occupied
the northern part of the California Desert. Recent examination of the Eureka
Valley indicates that the remains of a late prehistoric irrigation system may
be discerned there, suggesting for the first time that some aboriginal
agriculture may have been practiced there.

-35-
ClLuckwalla Valley, Including Palen and Ford Dry Lakes and th^. M.rny
In Pluvial times this valley was the seat of a major drainage from Pinto
Wash which probably emptied into the Colorado River. ' It has a high research
value in offering the opportunity to gain a fresh, modern perspective on the
classic Pinto complex dating 1,000-3,000 BC defined in the 1930’s in Pinto
Basin. The area includes evidence of trails and sleeping circles of considerable
antiquity and appears to be an excellent area for studying the long term changes
in late Pleistocene-Holocene climatic change and man’s adaptation to it. In
more recent times the Yuma-Mojave trail passed through it and it was a contact
zone between the Coachella Valley and the Colorado River peoples.
The area is receiving medium impact at present with mining having caused
much past damage. Anticipated opening of the area by the BLM will Increase
the Impact to serious levels, since much of the archaeology is on the surface
and is extremely vulnerable.
Chemehuevi Valley, Including the Turtle and Whipple Mountains
This area contains archaeological resources that have received limited
impact so far except for World War II military damage. It offers the
opportunity to study the prehistory of some of the Colorado River agricultural
peoples and the nature of their floodplain cultivation. The Turtle Mountains
are thought to have had a permanent village and to represent the opportunity to
study a contrasting, non-riverine adaptation within this inventory area.
PLcacho Mountains, Including the Area South and East of the Chocolate
Mountains to the Colorado River and the Mexican Border
Although little work has been done in this area, indications are that it
has a high level of archaeological resources, including an extremely Important,

-36-
extensive archaeological zone in the Picachos. Work by Malcolm Rogers indicates
that evidence for-human occupation spans many thousand years. The area
includes rock alignments, trails, cleared house rings and cairns. The
Picacho Mountains have suffered low impact so far except for mining. Other
areas have experienced heavy impact due to the military. Geothermal
explorations and development may pose an additional threat to the area.
Mojave Sink, Including Cave Canyon, the Mouth of the Mojave River and
Associated Dune Fields and the Area of Pleistocene Lake Mojave
This is the area where the classic Lake Mojave complex was defined, and
the relationship of man to the now extinct lake of 9,000-10,000 years ago
remains under investigation. Situated on the major interior drainage in the
California Desert, it has long been a focus of human habitation. Recently the
possibility of aboriginal agriculture has been raised for the Mojave sink.
The area is cut by a major interstate highway and there has been heavy impact
on the surface archaeology due to its fragile nature and widespread knowledge
of its existence.
San Bernardino Foothills, Along the Northeast Edge of the San Bernardino
Mountains
Known occupation of this area dates back to the Sayles Complex which may
date about 1,500 BC. In addition to the possibility of finding earlier
evidence, the area was intensively occupied in the late period by the Serrano,
evidenced by village sites along the skirt of the hills and special activity
sites such as roasting pits farther up the drainages. Trade routes from the
Mojave into the Morongo River valley passed through here. The area continues
to suffer major impacts from small tract subidivision, pothunting and con¬
struction of transmission lines to feed the Los Angeles metropolitan area.

-37-
In addition to the priority areas listed above, the following areas
would also be useful inventory areas:
1. Amargosa River drainage
2. A transect area from the Santa Rosa Mountains across the Coachella
Valley to the Orocopia Mountains
3. Calico Mountain area including Black Mountain, Alvord Mountains,
Lone Mountain, Superior Lake and Murphy Wells
4. Area including Bristol, Cadiz and Dale dry lakes
5. Old Woman Mountain area
6. Panamint Valley

-38-
SCHEDULING
It is recommended that the archaeological inventory be executed in a
five year period, with an initial sample of 3-4 inventory areas studied
during the first two years and the remainder studied in the third and fourth
years with the fifth year to complete analysis and reports.
Year 1. Selection of 3-4 inventory areas for archaeological resource analysis.
Initiation of first stage sampling in these areas, with on-line monitoring and data synthesis. Initiation of the ethnographic- ethnohistoric component.
2. Second stage sample designed and executed with on-line monitoring and data synthesis. Re-examination of sampling design and procedures, and incorporation of needed changes. Completion of ethnographic- ethnohistoric component.
3. Analysis and report of results of archaeological resource study completion for first set of areas. First stage sampling in remaining areas initiated, with on-line monitoring and analysis.
4. Second stage sampling in remaining areas with on-line monitoring and analysis.
5. Completion of analysis of data, report preparation and management recommendations.
Initiation of the archaeological inventory in any inventory area should be
placed so that initial mapping of vegetation communities, water resources and
physiography by other elements are available at the beginning of the archaeological
work to provide for stratification of the area for sampling.

-39-
LITERATURE CITED
Hettinger, Robert and R. E. Taylor
1973 Suggested Revisions in Interior Southern California Archaeological Sequences. In press.
Hettinger, Robert
1973 Personal communication.
Green, Ernes tene
1973 Location Analysis of Prehistoric Maya Sites in Northern Hritish Honduras, American Antiquity, vol. 38, no. 3, pp. 279-293.
Jarman, M. R.
1972 A Territorial Model for Archaeology: A Hehavioral and Geographical Approach. In Models in Archaeology, ed. by David L. Clark, pp. 705-734.
Kish, Leslie
1965 Survey Sampling. John Wiley and Sons, New York.
Plog, Fred and James N. Hill
1971 Explaining Variability in the Distribution of Sites. In The
Distribution of Prehistoric Population Aggregates, ed. by George J. Gummerman. Prescott College Anthropological Reports, No. 1, pp. 7-36.
Siegel, Sidney
1956 Nonparametrlc Statistics for the Hehavioral Sciences. Hook Co.
McGraw-Hill
Thomas, David H.
1969 Regional Sampling in Archaeology: A Pilot Great Hasin Research Design. Annual Report, UCLA Archaeological Survey, vol. 11, pp. 89-100.
Vita-Finzi, C. and E. S. Higgs
1970 Prehistoric Economy in the Mount Carmel Area of Palestine: Site
Catchment Analysis. Proceedings of the Prehistoric Society, vol, 36, pp. 1-37.

-40-
ACKNOWLEDGEMENTS
W
The Archaeological Inventory of the California Desert: A Proposed
Methodology as assembled by Dr. Margaret L. Weide for the Archaeological
Research Unit of the University of California, Riverside, with the cooperation
of the California Desert Archaeological Committee of the Society for California
Archaeology. Dr. Lowell Bean, California State University, Hayward, contributed
toward the ethnographic-ethnohistoric component. The cooperation and interest
of the Riverside District and Desert Planning staffs of the Bureau of Land
Management is gratefully acknowledged, particularly Herrick Hanks, Wesley
Chambers and James Hagihara. The comments of Dr. James Hill, Dr. Sylvia
Broadbent, Robert Bettinger, Philip Wilke and Roberta Greenwood are especially
acknowledged, as are the many other archaeologists who contributed their
comments and ideas.
The Archaeological Inventory of the California Desert: A Proposed
Methodology as presented here was designed to articulate closely with the
inventory plans of the California Desert Study as they stood in the fall of
1973, and may require modification as those plans evolve.
Bureau of Land Management Library Bldg. 50, Denver Federal Center Denver, CO 8U225

,.'.'7 ... !H%.t . Jiirft.
/.- loailoitJaw'fa# ortj'S^f^fsH .j jsjljifiai .M^a b*i£be«i» 1
r ssJiJlMtroO ift^i?^oX.o«^3xA Altr<o^iriftr> i»(f‘j la *
v^frAaAf' i.aV/ii
«5iiXK qiiXxiq[ ,T!#g«Xi.X06 .j^xstfwg
TrX^ilf i: |
'*.»1
f t _ <>1
^J*^ : Mr.* . ’.,^1 ..-i^' \»' *',:.?r^l^i'S3r '^t ^ ‘ .'
-• ■’' . fefTW 8/T^.ViJOa
Silti •!, A ;a*finia<I ci/«io^UiiO »rti io ifto:ff?d^I X^eti^lo^Pfi'siA 9^!T ,
^ la
c;iBv *>o»3a yatfS BM ybttJS Jnnoa Ata:io^XlMD„9CJ io ^xant^j v-^oJ^.»46
.e\>i
4.> '. ii:*'.,
vi{4«^iri/.iij.{, c. E., .ti* '^iLiM .'i. *. II .’. j^.'
' H, pi. 1-37. wfnaOlW? ''^^-'t!''^W’: '■ ■ _. ,. i>u Am '*'""
JW(®S
\l V ■ ,^ I
'! '.'■%! VJ.- ;■ '■•»;'?<
,

Bureau of Land Management Library Bldg. 50, Denver Federal Center Denver, CO 80225 ^

%
/ I