Embed Size (px)
Citation preview

AEDC-TR-68-87
r ARCHIVE COPY DO NOT LOAN
INVESTIGATION OF THE PERFORMANCE OF
A GERDIEN CONDENSER IN
LOW DENSITY SUPERSONIC FLOW
- —
1
=3 ^=!-D
~t—3 cr IU 1
s 3 =1 ==■
I 3 1 Ho
8 1 ^^^^=m . s^^^sgnj
8 ^^ i===ir^ 1 IU -■■■- —__!■ 1
■ 4 — ^= LT1
=
■2.
D. K. Smith
ARO, Inc.
June 1968
This document has been approved for public release and sale; its distribution is unlimited.
AEROSPACE ENVIRONMENTAL FACILITY
ARNOLD ENGINEERING DEVELOPMENT CENTER
AIR FORCE SYSTEMS COMMAND
ARNOLD AIR FORCE STATION, TENNESSEE
PROPERTY OF U. S. AIR FORCE AEDC LIBRARY
AF 40(600)1200

mm When U. S. Government drawings specifications, or other data arc used for any purpose other than a definitely related Government procurement operation, the Government thereby incurs no responsibility nor any obligation whatsoever, and the fact that the Government may have formulated, furnished, or in any way supplied the said drawings, specifications, or other data, is not to be regarded by implication or otherwise, or in any manner licensing the holder or any other person or corporation, or conveying any rights or permission to manufacture, use, or sell any patented invention that may in any way be related thereto.
Qualified users may obtain copies of this report from the Defense Documentation Center.
References to named commercial products in this report are not to be considered in any sense as an endorsement of the product by the United States Air Force or the Government.

AEDC-TR-68-87
INVESTIGATION OF THE PERFORMANCE OF
A GERDIEN CONDENSER IN
LOW DENSITY SUPERSONIC FLOW
D. K. Smith
ARO, Inc.
This document has been approved for public release and sale; its distribution is unlimited.

AEDCTR-68-87
FOREWORD
The work reported herein was performed at the request of the Air Force Cambridge Research Laboratory (AFCRL), Air Force Systems Command (AFSC), under Program Element 6240539F, Project 7663, Task 766301. The principal investigator is T. D. Conley of AFCRL. Technical assistance is provided AFCRL by Edmund Trzcinski of Adcole Corporation.
Design criteria for the test articles was supplied by AFCRL to ARO, Inc., and full-scale pressure and electrical models of the AFCRL ion density measurement probe configuration were designed and fabri- cated at the Arnold Engineering Development Center (AEDC).
The results of the tests presented were obtained by ARO, Inc. (a subsidiary of Sverdrup & Parcel and Associates, Inc.), contract opera- tor of the AEDC, Air Force Systems Command (AFSC), Arnold Air Force Station, Tennessee, under Contract AF40(600)-1200. The tests were conducted from July 10 to September 19, 1967, under ARO Project No. SB0703, and the manuscript was submitted for publication on March 25, 1968.
This technical report has been reviewed and is approved.
Paul L. Landry Roy R. Croy, Jr. Major, USAF Colonel, USAF AF Representative, AEF Director of Test Directorate of Test
li

AEDC-TR-68-87
ABSTRACT
A series of low density aerodynamic tests has been completed in the Aerospace Research Chamber 8V to provide information on the performance of a full-scale flight configuration of an ion density measurement probe. The tests were conducted at nominal Mach num- bers of 2 and 3 and simulated altitudes from 45 to 84 km at angles of attack from 0 to 15 deg. Experimental mass flow efficiency curves were established for a range of flight conditions, and the feasibility of measuring low ion densities Ln supersonic flows was investigated. The mass flow efficiency data compare well with calculated values at Mach 3 but agree less favorably at Mach 2.
in

AEDC-TR-68-87
CONTENTS
Page
ABSTRACT iii NOMENCLATURE vi
I. INTRODUCTION 1 II. APPARATUS 2
III. TEST CONDITIONS 4 IV. PROCEDURE 5 V. RESULTS AND DISCUSSION 6
VI. CONCLUSIONS 11 REFERENCES 11
APPENDIX
Illustrations
Figure
1. Schematic of Aerospace Research Chamber 8V . . . . 15
2. Installation of Test Equipment in ARC 8V 16
3. Full-Scale Test Models a. Pressure Model 17 b. Electrical Model 18
4. Basic Geometry and Dimensions of the Full- Scale Electrical Model 19
5. Basic Geometry and Dimensions of the Full- Scale Pressure Model ■ 20
6. Gerdien Condenser a. Schematic Diagram 21 b. Characteristic Current-Voltage Curve .... 21
7. Exit Conditions of Mach 2 and 3 Nozzles a. Mach 3 Nozzle, T0 = 290°K 22 b. Mach 2 Nozzle, T0 = 290°K 23
8. Mass Flow Efficiency versus Reservoir Pressure a. Mach = 2. 9 to 3. 5, T0 = 290°K 24 b. Mach = 1.6 to 1.94, T0 = 290°K .25
9. Effect of Reservoir Pressure on Probe Shock Position, Mach 3 Nozzle 26

AEDC-TR-68.87
Figure Page
10. Bow Shock Geometry on Pressure Model, Mach 3, P0 = 0. 1 Torr 27
11. Typical Ion Density Measurements a. Effect of Reservoir Pressure on Ion
Density 28 b. Effect of Angle of Attack on Ion Density ... 29
12. Comparison of Theoretical and Experimental Voltage for Current Saturation 30
NOMENCLATURE
A Area
AIN Intake area of model
e Charge per ion
I Current
L Length of outer electrode
SL Total length of probe
M Mach number
m Mass flow rate
N Ion density
P Pressure
R Inside radius of outer electrode, gas constant
Re Reynolds number
r Radius of inner electrode
T Temperature
U Gas velocity
V Voltage
a Angle of attack
7 Specific gas ratio
8 Boundary-layer thickness
6* Displacement thickness
VI

AEDC-TR.68-87
1 Mass now emciency
JU Charge mobility
p Gas density
SUBSCRIPTS
E Exit condition
o Reservoir, stagnation cc mditions
pm Pressure model
s Saturation
Free-stream conditions
SUPERSCRIPT
' Conditions immediately behind normal shock
vn

AEDC-TR.68-87
SECTION I INTRODUCTION
The electrical conductivity of the atmosphere is an important param- eter in the electrical balance of the lower atmosphere. It is also well known that the conductivity in the ionosphere is larger than in the strat- osphere because of the photoionization processes that begin to be effec- tive at an altitude of about 80 km. The electrical conductivity of the atmosphere has been investigated extensively in the troposphere and stratosphere below 30 km and in the ionosphere above 80 km. However, a lack of experimental results and applicable theory exists for the region between 30 and 80 km. This altitude range includes part of the D-region of the atmosphere where the physical processes are not well understood.
In support of the Air Force upper atmosphere research program, the Air Force Cambridge Research Laboratory (AFCRL) is investigating the ion densities in the D-region of the atmosphere. The AFCRL re- search effort is directed toward obtaining reliable experimental flight data to aid in establishing and verifying theoretical techniques applicable to the D-region of the atmosphere. The AFCRL flight test program employs a rocket that travels at supersonic velocities to carry an ion density measurement probe to the altitude where the ion densities meas- urements are to be made. A probe configuration known as the Gerdien condenser has been designed for AFCRL by the University of Utah Upper Air Research Group to measure ion densities of from 10^ to 104 ions/cm^ which are typical of the concentrations in the altitude regime from 30 to 80 km.
A series of tests has been completed in the Aerospace Environmental Facility (AEF) ARC 8V chamber to provide information on the perform- ance of the full-scale flight configuration of the ion density measurement probe through a range of simulated flight conditions. The tests were con- ducted through an angle-of-attack range from 0 to 15 deg, at nominal Mach numbers of 2 and 3, and at simulated altitudes from 45 to 84 km. A pressure model was used to measure static pressures inside the probe and total pressures at the probe exit for the purpose of determining the mass flow rates through the model for various attitudes and simulated flight conditions. An electrical model was employed during the develop- ment of a low temperature ion source and feasibility tests to measure low ion concentrations in supersonic flows.
This report contains results obtained from July through September, 1967. Another series of tests is planned for the fall of 1968.

AEDC-TR-68-87
SECTION II APPARATUS
2.1 TEST CHAMBER
2.1.1 General Description
The Aerospace Research Chamber (ARC 8V) consists of a horizontal, cylindrical vacuum tank complete with pumping system, supersonic nozzles, test gas supply system, test gas heating system, controls, and instrumentation suitable for conducting low density aerodynamic test or general high vacuum studies. The ARC 8V chamber is 10 ft in diameter and 20 ft long and is constructed of type 304L stainless steel for low out- gassing and good corrosion resistance. The wind tunnel configuration used for low density aerodynamic tests in the transitional and free molecular flow regimes is shown in Fig. 1, Appendix.
2.1.2 Pumping System
The pumping system consists of a 6-in. oil diffusion pump backed by a 750-cfm mechanical pump. Half of the chamber is lined with a liquid- nitrogen-cooled (77°K) liner which functions as a radiation shield for the main cryogenic pumping system cooled by a 10-kw gaseous helium refrig- erator. The gaseous-helium-cooled (20°K) cryogenic system is com- prised of 12 rectangular copper cryopanels arranged in a radial array with a total pumping surface of 240 ft2. The cryosystem is arranged for the pumping of a high volume flow of low density gas, and is capable of pumping mass flow rates up to 50 gm/sec for one to two minutes and 8 to 9 gm/sec continuously. The total pumping capacity is 2000 scf of a test gas.
2.2 AERODYNAMIC NOZZLES
Interchangeable nozzles are used to provide the required supersonic flow for aerodynamic tests. The two nozzles used during this test pro- duce nominal Mach numbers of 2 and 3 at their respective exits. The Mach 3 nozzle is a conical aluminum nozzle with an exit diameter of 76 cm and a length of 155 cm. The nozzle throat and divergent sections are cooled with liquid nitrogen to reduce the boundary-layer buildup within the nozzle and provide test core diameters from 20 to 60 cm at the exit. Pres- sure altitudes from 70 to 90 can be simulated at Mach 3, and the total temperature range available is from 300 to 1000°K. The Mach 2 nozzle is a contoured fiber glass nozzle with a 25-cm exit diameter and 60-cm
AEDOTR.68-87
length. No nozzle cooling is provided with this configuration, and the test core diameter at the nozzle exit varies from 10 to 20 cm. An altitude range from 45 to 70 km can be simulated with the available total temperature of 300°K at Mach 2.
2.3 TEST SUPPORT EQUIPMENT
The test models were supported in the chamber by a remotely operated angle-of-attack mechanism which pitched the models hori- zontally through an angle-of-attack range from 0 to 25 deg.in 5-deg increments. The pivot point of the angle-of-attack mechanism was located at the center of the inlet plane of the model which was positioned from 2 to 10 in. downstream of the nozzle exit plane. The pitot pres- sure probe was supported by a remotely operated scanner mechanism which positioned the probe horizontally and vertically across the exit plane of the test model at any desired location. The general arrange- ment of the model and associated equipment is shown in Fig. 2.
2.4 LOW TEMPERATURE ION SOURCE
A radio-frequency (RF) generator was used as the low temperature ion source to produce ion density variations in the test gas ahead of the model inlet. The frequency was 10 MHz. The maximum power was 50 w and was controlled by means of a power supply located outside the chamber. A ring-type antenna located at the nozzle exit and insulated from the nozzle was used during the Mach 3 tests. The antenna used during the Mach 2 tests consisted of a 1-in. strip of metal shimstock attached to the inside wall of the fiber glass nozzle approximately 10 in. upstream of the nozzle exit.
2.5 TEST MODELS
2.5.1 General
A probe configuration known as the Gerdien condenser is being flight tested by AFCRL to measure the low ion concentration in the alti- tude region between 30 and 80 km during supersonic flight. Basically, the Gerdien condenser is a cylindrical condenser with an outer and inner electrode consisting of an outer cylindrical tube and a rod centerbody, respectively. The electrodes are the conducting surfaces, and an outer shell shields the electrodes from the ions passing outside the probe.
Design criteria for a Gerdien condenser as described above was supplied ARO, Inc. by AFCRL, and a full-scale pressure model and a

AEDC-TR-68-87
full-scale electrical model of the AFCRL flight configuration were designed and fabricated at AEDC. The models were constructed of stainless steel with an outer diameter of 11. 2 cm and a length of 23. 4 cm. The inlet area of the models is 68. 6 cm2. Photographs of the pressure and electrical models are presented in Fig. 3.
2.5.2 Electrical Model
The outer shell or shield of the electrical model slips over and is insulated from the cylindrical tube or outer electrode by Micarta rings. The rod centerbody is supported and insulated with Teflon® from the tube and shell by two posts located axially within the probe. Beveled inlet and exit sections attach to the outer shell. The electri- cal lead to the rod centerbody, the inner electrode, is attached to one of the support posts, and the connection to the outer electrode is made directly to the cylindrical tube. The model was connected to ground through the outer shell. The basic geometry and dimensions of the electrical model are shown in Fig. 4.
2.5.3 Pressure Model
The pressure model is similar in construction to the electrical model except that the outer shell and cylindrical tube are one piece and no insulation is used with the pressure model. Four 3/16 in. - diam static pressure orifices were located along an axial ray on the inner wall of the cylindrical tube. The first pressure orifice is located 5. 34 cm downstream of the inlet plane, the second 6. 35 cm downstream of the first, the third 6. 35 cm downstream of the second, and the fourth orifice is 1. 27 cm upstream of the exit plane of the model. The pitot pressure probe was positioned in the exit plane at the desired horizontal and vertical location. Pressure model geom- etry and location of the static pressure orifices are shown in Fig. 5.
SECTION III TEST CONDITIONS
The pressure altitude to be simulated established the reservoir conditions for the Mach 2 and 3 nozzles. The Mach 2 nozzle pro- vides an altitude range from 45 to 70 km which corresponds to reser- voir total pressures from 7. 5 to 0. 2 torr and a total temperature of 300°K. Tests were conducted over the complete altitude range at Mach 2. The altitude range simulated with the Mach 3 nozzle was from 70 to 84 km which corresponds to reservoir total pressures from

AEDC.TR-68-87
3. 0 to 0. 2 torr at a total temperature of 300°K. The maximum alti- tude required at Mach 3 was less than the maximum of 90 km attain- able with the Mach 3 nozzle.
SECTION IV PROCEDURE
4.1 PRESSURE TESTS
With either the Mach 2 or 3 nozzle installed, the reservoir pres- sure and temperature were set to establish the desired test altitude. After the nozzle flow conditions stabilized, the static pressures along the inner wall of the cylindrical tube were recorded and the exit plane of the model was scanned in the vertical and horizontal plane with a pitot pressure probe. The pitot pressures were obtained from the centerline out to the outer wall of the model in 0. 25- or 0. 50-in. incre- ments. The smaller increment was used at the lower reservoir pres- sures where continuous testing was possible, and the complete survey could be accomplished in 20 or 30 min. At the higher reservoir pres- sures run times were limited; more than one run was required to com- plete the scanning of the exit plane, and the 0. 50-in. increment was used.
4.2 ION DENSITY MEASUREMENT TESTS
Flow conditions were established and the model angle of attack was set as during the pressure tests. The power setting on the RF gener- ator was adjusted for each reservoir pressure run to provide the most satisfactory noise-to-signal ratio. At some reservoir pressures the RF generator noise level was so high that it was not possible to obtain meaningful data. After the RF generator began ionizing a small part of the test gas flow, the voltage across the electrodes of the ion density measurement probe was stepped in 5- to 10-v increments from 0 to 100 v with a DC power supply. The resulting current was read on a micromicroammeter and is an indication of the ion density of the flow through the probe when the current is independent of the voltage and the mass flow through the probe is known.

AEDC-TR-68-87
SECTION V RESULTS AND DISCUSSION
5.1 THEORY OF GERDIEN CONDENSER
The Gerdien condenser is generally some type of cylindrical cham- ber with provisions for air to flow between inner and outer electrodes. The air flow is provided by motion of a rocket which carries the cham- ber through the atmosphere. When a voltage potential is placed across the electrodes of a Gerdien condenser and increased from 0 to V, ions and electrons will be collected on the electrodes. Figure 6 shows a schematic of the Gerdien condenser and a sketch of the characteristic current-voltage curve. The curve presented in Fig. 6 is divided into three regions where region "b" represents the saturated current and is independent of the voltage. In region "a" only some of the ions are being collected because the voltage applied is not enough for the given ion mobility, and in region''c" the high voltage potential causes second- ary ionization (Ref. 1). The Gerdien probe was designed so that Vs
would be less than 100 v for the attitude range simulated during the tests in the ARC 8V.
For voltages greater than Vs, Fig. 6, all ions and electrons will be collected (saturation of neutral plasma) and Vs can be determined from the relationship
V - U (R2- r2) In (H.M (Ref 2) v8 " 21.. (i \nvx. *i
where the ion mobility /u is assumed to be inversely proportional to the gas density:
P - PSLC -^r1 <Ref- 3>
For sea-level conditions (SLC),
• Mgi r = 1.4 cm2/v-sec and ps, p = 1.294 x 10"s gm/cm1.
Knowing the mass flow rate through the probe, the ion density can be calculated from
N = ls (Refs. 2, 3, and 4) 7u»AINe
and for angle of attack, a, the ion density
i ST = 5
<M 1 U0O°AINC0S ° >L = wü-T^-Tzrz. (Ref. 4)

AEDC-TR-68-87
Nominal values for the mass flow efficiency, n, can be calculated theoretically if the following conditions are assumed:
1. A bow shock ahead of the inlet and choked flow (M = 1) at the probe exit;
2. The central rod had negligible boundary layer; and
3. The outer wall was considered a flat plate.
The boundary-layer thickness can then be calculated for a given P' (stagnation pressure immediately behind the bow shock) by
8 = 6.] -J—> (Ref. 5)
where R6jg is proportional to PQ for constant T0 and Mach number and i = 23. 4 cm, the length of the probe.
Now the displacement thickness, 6*, can be calculated as
8* = 0.32S (Ref. 6)
The mass flow through the pressure probe is then obtained as follows:
0.540 P' W (R -8*)2
Sm - n— (Ref. 7)
For a given PQ , PQ can be determined for either the Mach 2 or 3 nozzle and the free-stream mass flow, m^, can be calculated.
Therefore the mass flow efficiency
0.540 Po» 77 (R _ s*)2
' " P~U
~A
INVT
O
At low Reynolds numbers the initial assumptions are not applicable because the boundary layer will merge within the probe and the stagna- tion pressure will decrease through the model. In view of these limita- tions, the mass flow efficiency, n, of the probe was determined experi- mentally by using the exit static pressure and the total pressures obtained at the exit plane and the following isentropic relationships:
pUA . J^ AP J (>) " [ (i.) Zz.1 r / \ y-i
y -i (Ref. 7)

AEDC-TR-68-87
When the shock is ahead of the inlet of the probe producing subsonic flow within the probe, then the mass flow through the pressure model is
tn__ = rtir. = pm b. f=?^ vE Jlgf* [fe)¥ -.] "»oo = PocUocAIN
For
and assuming T = T = T
Pg = constant across exit plane
P /Pjp = variable across exit plane
then the probe efficiency
/ ay PE i=N 2
i= 1 \ 1 cy-i)HTo P~U~A,N >j(wm¥-]
where the probe exit is divided into N areas of influence for each measured pitot pressure. The above relationship was used to obtain the mass flow efficiency of the probe except for the conditions where the shock was swallowed and the efficiency was one.
5.2 EXPERIMENTAL RESULTS
5.2.1 General
Full-scale pressure and electrical models of the AFCRL flight configuration of the ion density measurement probe were tested at Mach numbers of 2 and 3 and simulated pressure altitudes from 45 to 90 km. The free-stream flow parameters at the exit of the Mach 2 and 3 nozzles are presented in Fig. 7 as a function of reservoir supply pressure. The calibrated Mach number at the nozzle exit varies be- cause of boundary-layer growth in the nozzle with increasing altitude from 10 to 20 cm, and from 20 to 60 cm for the Mach 2 and 3 nozzles, respectively.

AEDC-TR-68-87
5.2.2 Pressure Measurements
The pitot pressure measurements, ^Ow • an<^ *ne ^as* downstream
static pressure measurement, PJJ;, were used to experimentally deter- mine the mass flow efficiency of the probe at the various flight attitudes and conditions. The free-stream mass flow rates were obtained from Fig. 7 for the appropriate Mach number and altitude test condition.
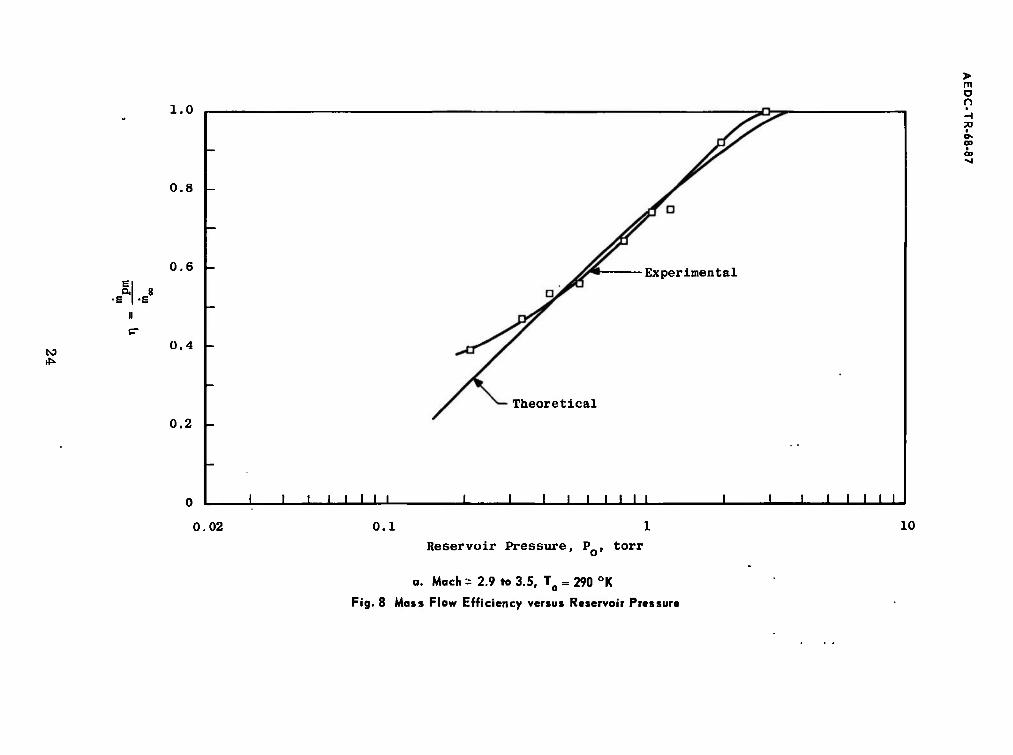
A comparison of the experimental and theoretical mass flow efficiencies as determined by the methods discussed in Section 5. 1 are presented in Fig. 8. For the Mach 3 condition, the theoretical and experimental data agree very well except at the low pressures or in the low Reynolds number region. The experimental data exhibit a much steeper slope at Mach 2 than the theoretical estimates as well as a dif- ferent pressure where the mass flow efficiency become one. This variation at Mach 2 is thought to result from the fact that the flat plate and the central rod boundary-layer assumptions are not valid as the Mach number approaches one. This is to be expected because the lower the Mach number the less boundary-layer buildup it takes to choke the flow within the probe and cause a bow shock and flow spillage.
The mass flow efficiencies approach one at supply pressures of 2. 9 torr for Mach 3 and 2. 0 torr for Mach 2, which corresponds to pressure altitudes of 72 and 56 km, respectively. At altitudes less than these the efficiencies are one for the corresponding Mach numbers. The experimental data presented in Fig. 8 for the various test condi- tions were used to provide ion density parameters during the electrical model tests and will be useful in supplying reliable mass flow data re- quired in the interpretation of the ion densities measured during actual flight tests at similar flight conditions.
The effect of reservoir pressure on the position of the probe shock wave for the Mach 3 tests is shown in Fig. 9. The most forward static pressure, Ppm, and the first indicator of shock attachment, is ratioed to the free-stream static pressure, P,,,, as a function of reservoir pres- sure and compared to the predicted normal-shock pressure ratio. The experimental data agree reasonably well with the predicted pressure ratio for reservoir pressures where the probe shock was detached. The static pressure ratio remained constant with increasing reservoir pres- sures up to approximately 2. 6 torr where the ratio decreased rapidly, indicating that the shock became attached and swallowed by the inlet. For conditions where the shock became swallowed, the mass flow effi- ciency is one and the reservoir pressure of 2. 6 torr where this is indi- cated to occur in Fig. 9 agrees well with the 2. 9 torr value of Fig. 8.

AEDCTR-68-87
The RF generator was used to illuminate the flow about the inlet of the pressure model in the low Reynolds number range at Mach 3. A typical flow visualization photograph of the detached shock ahead of the pressure model is shown in Fig. 10. Other Mach 3 photographic data showed that the shock was detached for reservoir pressures up to 0. 5 torr, the upper limit for obtaining meaningful visualization of the flow about the model.
5.2.3 Ion Density Measurements
Typical ion density measurements obtained with the electrical model during the feasibility tests to measure low ion concentrations in supersonic flows are shown in Fig. 11. The ion density values represent relative current readings and should not be interpreted as absolute ion density values. Various RF power settings were used to achieve the most desirable noise-to-signal ratio, and an increase in number value corresponds to an increase in power for the data pre- sented in Fig. 11. For the higher reservoir pressures with the Mach 2 nozzle, a wire mesh was placed between the antenna and the electrical model to shield the model from the high noise level inherent in the RF system.
Representative ion density measurements as a function of reser- voir pressure are presented in Fig. 11a at Mach numbers of 2 and 3 and various RF power settings. These ion density values were deter- mined by measuring the relative saturation current, Is, at the desired Mach number and altitude and using the corresponding free-stream velocity, Uw, and the appropriate mass flow efficiency, n, from Fig. 8. In general, Fig. 11a shows a decrease in ion density value with increasing reservoir pressure for a given RF power setting. This trend was ex- pected as it is easier to ionize a gas at lower pressures. The scatter in the data is the result of the inability to reduce the noise-to-signal ratio produced by the RF generator to a satisfactory level. No significant effect of angle of attack on ion density value is evident in Fig. lib from Q to 15 deg at Mach 2 for a constant RF power setting.
A comparison of the theoretical and experimental voltage at which current saturation occurs is presented in Fig. 12 in Mach 2 and 3 flows for a range of reservoir pressure. The wide variation between the predicted and experimental voltage at which current saturation occurred is attributed to the interference generated by the RF system during the ionization of the test gas. Shielding the model from the antenna with wire mesh filtered out some of the undesirable noise and the data agreed with the predicted values better than when the model was not shielded.
10

AEDC-TR-68-87
SECTION VI CONCLUSIONS
The results obtained during the pressure tests were used to determine the mass flow efficiencies over the simulated flight regime. There was good agreement between predicted and experimental mass flow efficiency data at a Mach number of 3. The predicted and experi- mental data varied significantly at Mach 2, and the deviation was attributed to assumptions that are not applicable for critical inlet opera- tion which exists at the lower Mach number. These results indicate that reliable experimental mass flow data are required in the interpreta- tion of the ion densities measured during flights into the D-region of the atmosphere. The electrical model tests demonstrated that it was feasible to make ion density measurements in low density supersonic flow. However, to obtain absolute ion density values, a low tempera- ture, noise-free ion source is required along with a segmented electri- cal model to ensure that all ions are captured and to eliminate any edge effects.
REFERENCES
1. von Engel, A. "Ionized Gases. " Oxford University Press, London, 1965 (Chapter 2, Sec. 2), pp. 6-10.
2. Imyanitou, I. M. "Instruments and Methods for Measuring Atmospheric Electricity. " (in Russian) 1957 (Chapter V).
3. Bourdeau, R. E. , Whipple, E. C., Jr., Clark, J. F. "Analytic and Experimental Electrical Conductivity between the Stratosphere and the Ionsphere. " Journal of Geophysical Research, Vol. 64, No. 10, October, 1959, p. 1363.
4. Boyld, R. L. F. "Direct Measurement Techniques for Ionization Density in the Collision Regime. " Second Conference on Direct Aeronomic Measurements in the Low Ionosphere, September 27-30, 1967, University of Illinois, Urbana, Illinois.
5. von Driest, E. R. "Investigation of Laminar Boundary Layer in Compressible Fluids Using the Crocco Method. " NACA TN 2597, January 1952.
6. Cohen, Clarence B. and Reshotko, Eli. "The Compressible Laminar Boundary Layer with Heat Transfer and Arbitrary Pressure Gradient. " NACA Report 1294, 1956.
7. Shapiro, A. H. "The Dynamics and Thermodynamics of Compressible Fluid Flow. " Vol. I, the Ronald Press Company, New York, 1953.
11

AEDC-TR-68-87
APPENDIX
ILLUSTRATIONS
13

-3-kw Heaters
Ui
LN„-Cooled Cryoliner
GHe-Cooled Cryopanel
-LN_-Cooled End Panel
LN„-Cooled Cone
LN2-Cooled Duct
-Typical Nozzle Installation > m
n
Fig. 1 Schematic of Aerospace Research Chamber 8V
00

03
n
Fig. 2 Installation of Test Equipment in ARC 8V

> m O n
a. Pressure Model
Fig. 3 Full-Scale Test Model s

CO
n
03 -~1
b. Electrical Model
Fig. 3 Concluded

CD
[ Outer Shell
»-— ——^
-23.4
zzni
17.3
1.27
4.675
TZ Inner Electrode
Teflon
Outer Electrode
Micarta-
Wire Leads
All Dimensions in Centimeters
Fig. 4 Basic Geometry and Dimensions of the Full-Scale Electrical Model
> m o n
00
00

to o
11.2
-5.35-
0.476
-6.35
0.952
-6.35-
V >-■
e n
1.27
4.675
h« 4.08 *-
o H 73 ■
<n
Ä 23.4-
1.27
TL Pi tot Probe
All Dimensions in Centimeters
Fig. 5 Basic Geometry and Dimensions of the Full-Scale Pressure Model

AEDC-TR-68-87
Outer Electrode
U Inner Electrode
a. Schematic Diagram
I
b. Characteristic Current-Voltage Curve
Fig. 6 Gerdien Condenser
21

to to
u .Q
ja o a
3.6
3.4
3.2
3.0
2.8
1.4.-
1.2
u d> 1.0 to
PI s u
Ü.8 -
P
°- 0.6 x 3 H
3 0.4 at S
0.2 -
2.6«- Ol-
0.4 0.8 1.2 1.6 2.0 2.4 2.8. 3.2
o n • H TO •
Reservoir Pressure, P , torr
a. Mach 3 Nozzle, T = 290 °K
Fig. 7 Exit Conditions of Mach 2 and 3 Nozzles

CO
u u 01
2.orNa o
s bfi
1.8
1.6 u a e
a i.
1.2
1.0>-
1.6
1.4
1.2
1.0
h 8 0.8 P 8
Q.
M I- 5 0.6
a 10 cd a
0.4
0.2
0 L_
1.0 2.0 3.0 4.0 5.0 6.0 7.0 8.0
Reservoir Pressure, PQ, torr n
b. Mach 2 Nozile, To - 290 °K
Fig. 7 Concluded
CO I
CD
al 8 ■s -e
1.0
0.8
0.6
0.4
0.2 -
> m n
00
Experimental
Theoretical
J '■'' J I ''''I J '''''
0.02 0.1 10
Reservoir Pressure, P, torr
a. Mach s 2.9 to 3.5, T = 290 °K O
Fig. 8 Mass Flow Efficiency versus Reservoir Pressure

CO
ft S ■e I -s
^— Theoretical
0.8
°x
0.6
So ^— Experimental
0.4
0.2 -
0 1 1 1 1 1 1 1 1 1 __L _l 1 III!
0.2 10
Reservoir Pressure, P , torr
b. Mach = 1.6 to 1.94, T0 = 290 °K
Fig. 8 Concluded
> m O n
©■ oo ■ 00 VI

> m o n
20.0 0» I 00 ■vl
to CT>
E O.
16.0
(0 OH 0
CO
+; i2.o N-e- 8.0
4.0
-8- o
Pressure Ratio for Normal Shock
Shock Attached and Being Swallowed
■0—9 0-0-
1.2 1.6 2.0 2.4 2.8
Reservoir Pressure. P . torr ' o
3.2 3.6
Fig. 9 Effect of Reservoir Pressure on Probe Shock Position, Mach 3 Nozzle

to
. ^BIB^H^HfcNVS ■ Fig. 10 Bow Shock Geometry on Pressure
Model, Mach 3, P =0.1 Torr o
> m o o
CD

AEDC-TR-68-87
10'
10 _
co a ü \ in e o
■H
•H m a a» Q a o
10 _
10 -
30
-
A
6
/L
Sym RF Setting
• a 2 * O 4
D 5
& A Max
-
- t Open Symbols: M = 2 with Wire Mesh
Closed Symbols: M = 2 without Wire Mesh
-
Flagged Symbols: M = 3 without Wire Mesh
-
o o
— o
D
- (
1 1 D
II
0.5 1.0 1.5 2.0 2.5 3.0
Reservoir Pressure, P , torr ' o
a. Effect of Reservoir Pressure on Ion Density
Fig. 11 Typical Ion Density Measurements
28

AEDC-TR-68-87
1 X 10
m
e o
a
a o
2 x 10'
-
- Mach 2, without Wire Mesh
PQ = 0.5 torr, RF Setting of 7
_*
r b * b
" I 1
5 10 15
Angle of Attack, a, deg
20
b. Effect of Angle of Attack on Ion Density
Fig. 11 Concluded
29

CO o
a o
■H
cd i»
+» fl (1) h h
O <H
(D bo at
o
28
24 _
20 -
16 _
12
8 -
4 -
Sym Experimental Data J ■" a Mach 3, No Wire Mesh /
A Mach 2, No Wire Mesh / ™ O Mach 2, Wire Mesh / O
- M = 2 (Theoretical) y
- o o( / - A * y^ o
o / ~ / o —
yT O ■* A /
- D py&
— a x ^t-0*0*00
- UX^ *"■*"—"""""
- ^^^«—■"•"■"""""'^ ^- M = 3 (Theoretical)
1 I I l I 1 1 l 1 I I I 1
> m o n
00
0.4 0.8 1.2 1.6 2.0 2.4 2.8 3.2
Reservoir Pressure, P , torr
Fig. 12 Comparison of Theoretical and Experimental
Voltage for Current Saturation

UNCLASSIFIED Security Classification . .
DOCUMENT CONTROL DATA -R&D (Security classllication ot till», body of abstract and Indexing annotation mull be entered when the ovarall report Is classified) I. ORIGINATING ACTIVITY (Corporate author)
Arnold Engineering Development Center ARO, Inc., Operating Contractor Arnold Air Force Station, Tennessee 37389
2«. REPORT SECURITY CLASSIFICATION
UNCLASSIFIED 2b. GROUP
N/A 3. REPORT TITLE
INVESTIGATION OF THE PERFORMANCE OF A GERDIEN CONDENSER IN LOW DENSITY SUPERSONIC FLOW
4. DESCRIPTIVE NOTES (Type ot report and Inclusive dates)
Final Report July 10 to September 19, 1967 5. AU THOR(S) (First name, middle Initial, last name)
D. K. Smith, ARO, Inc.
S- REPORT DATE
June 1968 7». TOTAL NO. OF PAGES
37 7b. NO. OF REFS
Ba. CONTRACT OR GRANT NO.
AF 40(600)-1200 b. PROJEC T NO. ,
7633
^Program Element 6240539F
«Task 766301
M. ORIGINATOR'S REPORT NUUBERIS]
AEDC-TR-68-87
9b. OTHER REPORT NOI5I (Any other numbers that may ba assigned this report)
N/A 10. DISTRIBUTION STATEMENT
This document has been approved for public release and sale; its distribution is unlimited.
II SUPPLEMENTARY NOTES
Available in DDC,
12. SPONSORING MILITARY ACTIVITY
Air Force Cambridge Research Labora- tory, L. G. Hanscom Field, Bedford, Massachusetts 07130
13 ABSTRACT
A series of low density aerodynamic tests has been completed in the Aerospace Research Chamber 8V to provide information on the performance of a full-scale flight configuration of an ion density measurement probe. The tests were conducted at nominal Mach num- bers of 2 and 3 and simulated altitudes from 45 to 84 km at angles of attack from 0 to 15 deg. Experimental mass flow efficiency curves were established for a range of flight conditions, and the feasibility of measuring low ion densities in supersonic flows was investigated. The mass flow efficiency data compare well with calculated values at Mach 3 but agree less favorably at Mach 2.
DD FORM I NOV SB 1473 UNCLASSIFIED
Security Classification

UNCLASSIFIED Security Classification
14. KEY WORD!
ROLE
E&Tconaenser probe
2ion density - -,
measuring instruments
atmospheric research
D-region
space simulation
supersonic flow
mass f low ^measurements
electrostatic probei"
/ ?-J
UNCLASSIFIED Security Classification