Embed Size (px)
Citation preview
Third quarter results 2017
Kenneth Hamnes, CEOSigmund Toth, CFO
2 November 2017
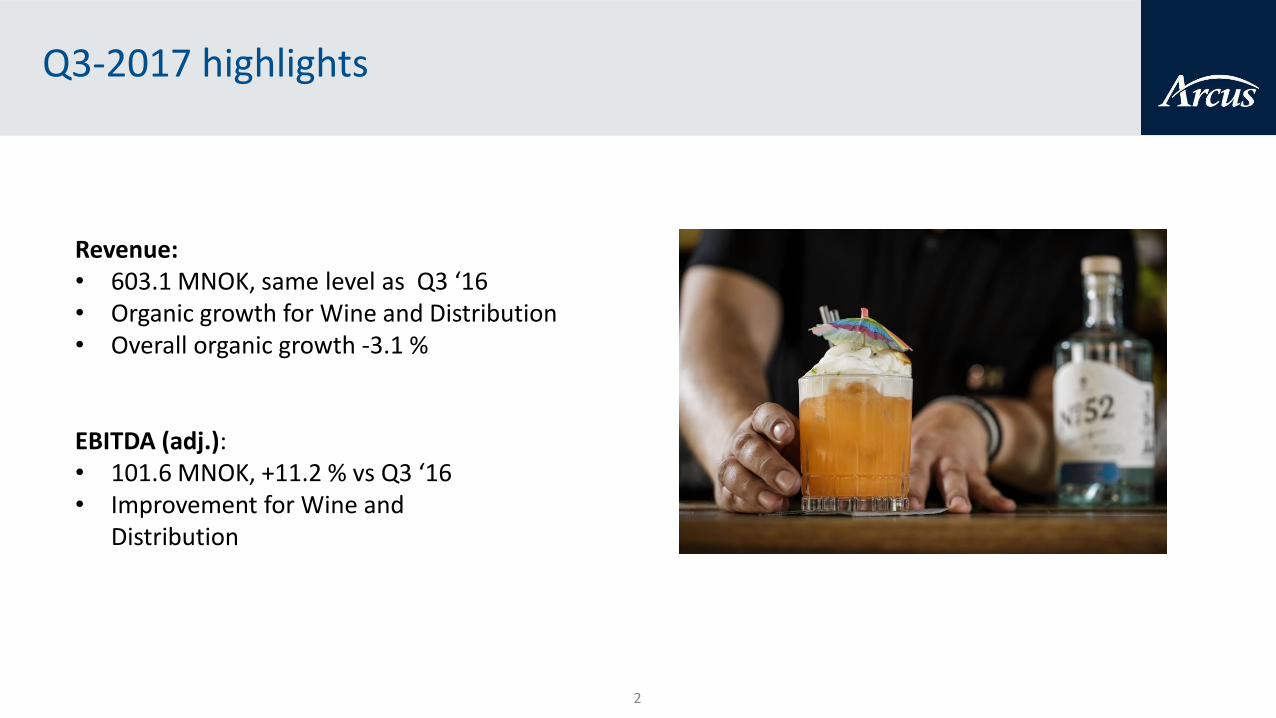
Q3-2017 highlights
Revenue: • 603.1 MNOK, same level as Q3 ‘16• Organic growth for Wine and Distribution• Overall organic growth -3.1 %
EBITDA (adj.): • 101.6 MNOK, +11.2 % vs Q3 ‘16• Improvement for Wine and
Distribution
2
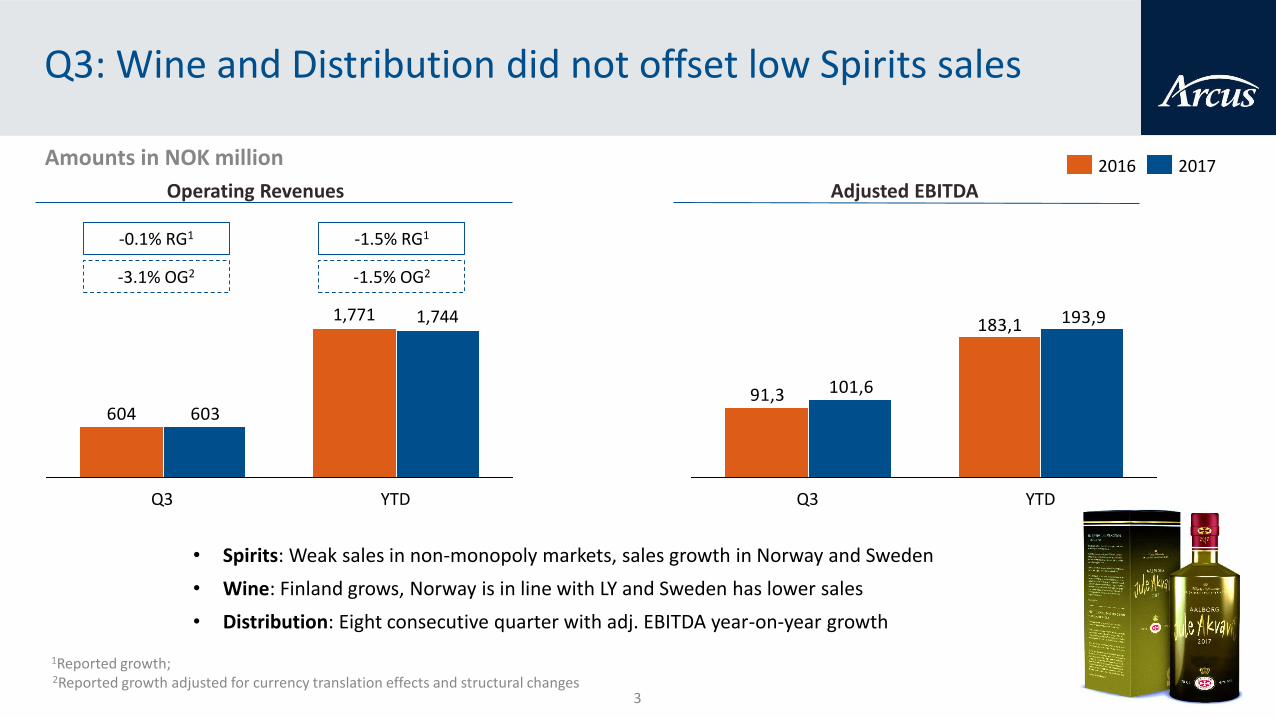
Q3: Wine and Distribution did not offset low Spirits sales
• Spirits: Weak sales in non-monopoly markets, sales growth in Norway and Sweden
• Wine: Finland grows, Norway is in line with LY and Sweden has lower sales
• Distribution: Eight consecutive quarter with adj. EBITDA year-on-year growth
Operating Revenues
604 603
Q3
1,771 1,744
YTD
20172016
183,1
91,3
193,9
101,6
Q3 YTD
Adjusted EBITDA
-3.1% OG2 -1.5% OG2
Amounts in NOK million
-0.1% RG1 -1.5% RG1
3
1Reported growth;2Reported growth adjusted for currency translation effects and structural changes
Distribution
Arcus ASA
Spirits2
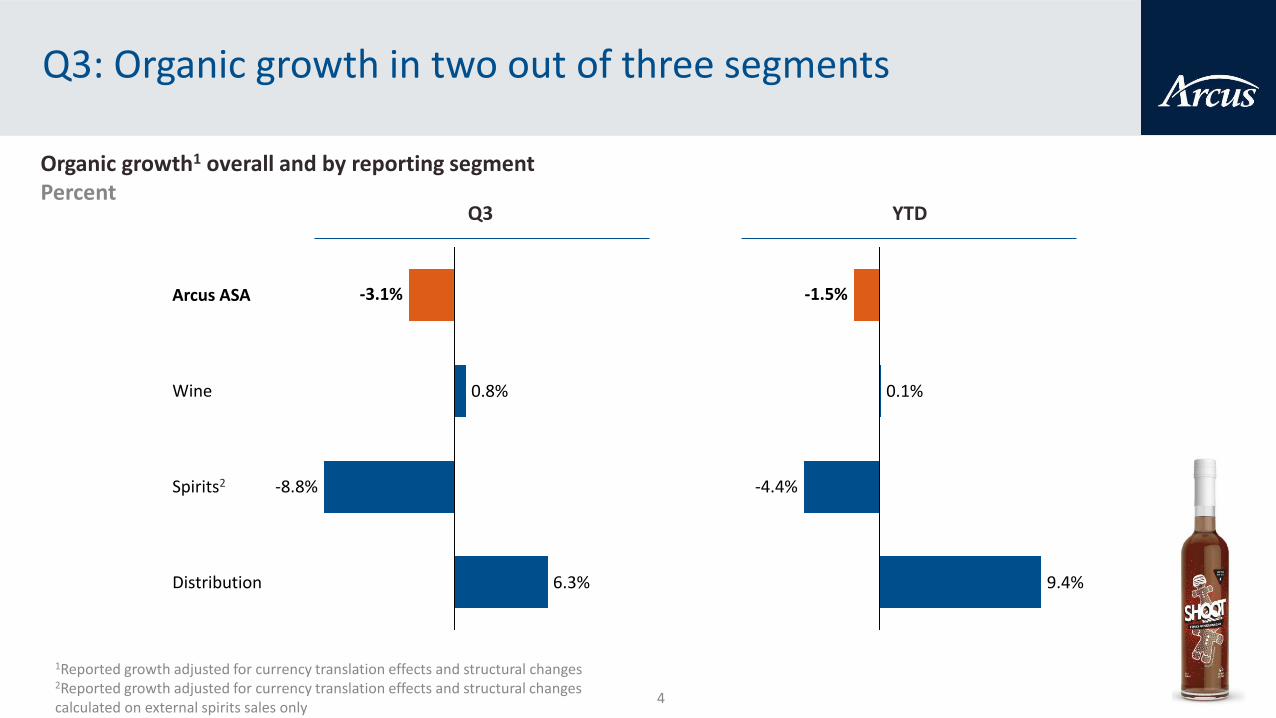
-3.1%
-8.8%
6.3%
Wine 0.8%
Organic growth1 overall and by reporting segmentPercent
0.1%
-1.5%
-4.4%
9.4%
Q3: Organic growth in two out of three segments
Q3 YTD
4
1Reported growth adjusted for currency translation effects and structural changes2Reported growth adjusted for currency translation effects and structural changes calculated on external spirits sales only
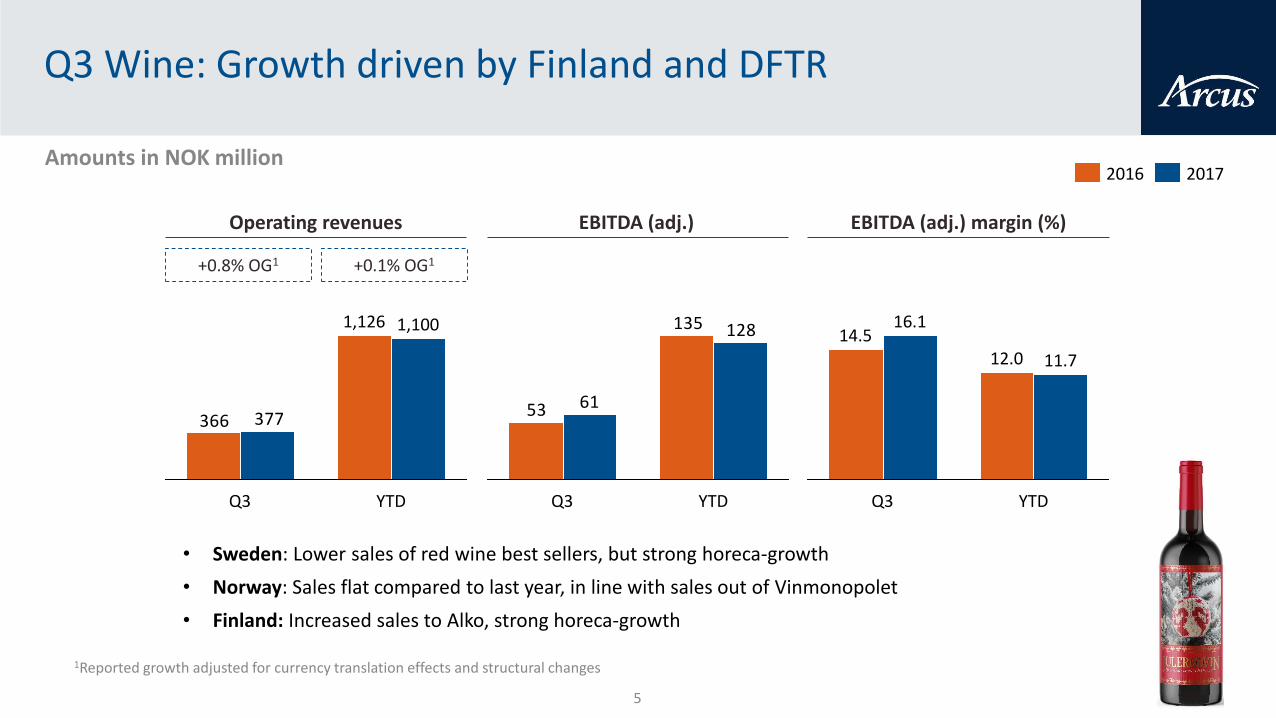
Q3 Wine: Growth driven by Finland and DFTR
• Sweden: Lower sales of red wine best sellers, but strong horeca-growth
• Norway: Sales flat compared to last year, in line with sales out of Vinmonopolet
• Finland: Increased sales to Alko, strong horeca-growth
+0.8% OG1 +0.1% OG1
YTD
12.0
Q3
16.1
11.7
14.5135
53
128
61
YTDQ3
366 377
YTD
1,1001,126
Q3
2016 2017
Operating revenues EBITDA (adj.) EBITDA (adj.) margin (%)
Amounts in NOK million
5
1Reported growth adjusted for currency translation effects and structural changes
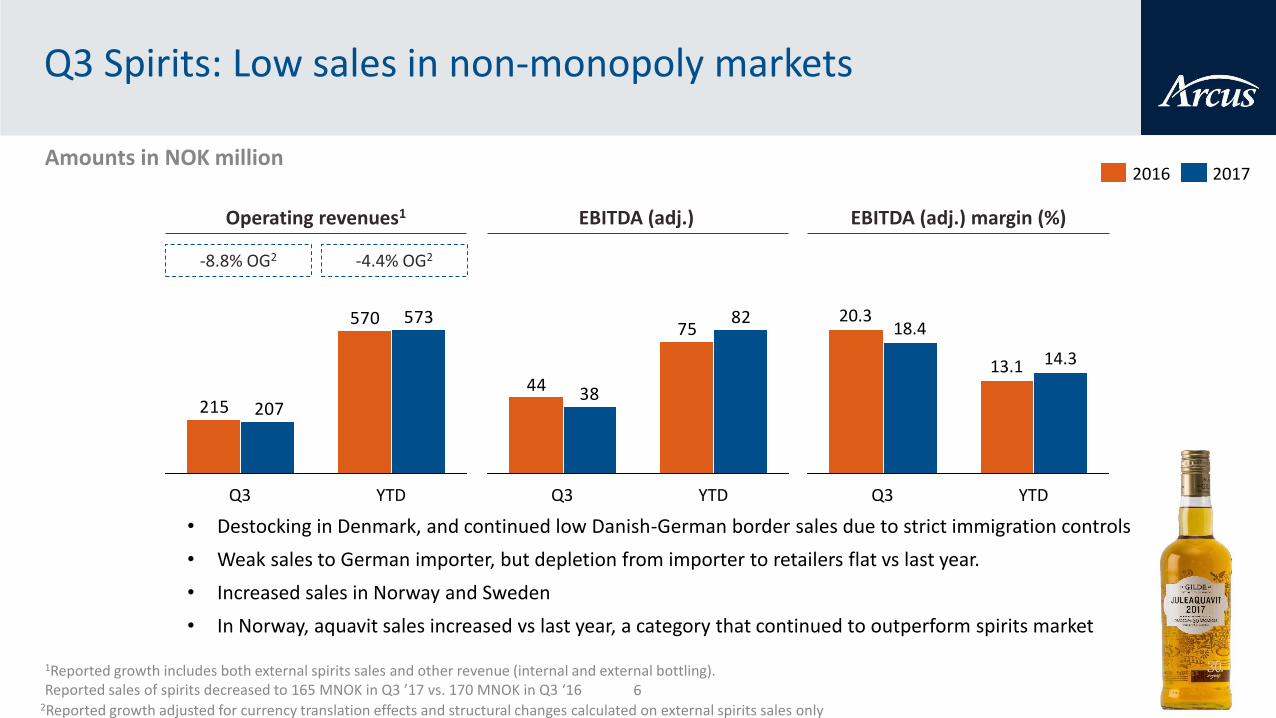
Q3 Spirits: Low sales in non-monopoly markets
6
-8.8% OG2 -4.4% OG2
YTD
14.313.1
20.3
Q3
18.475
44
82
38
YTDQ3
570
215
573
207
Q3 YTD
20172016
Operating revenues1 EBITDA (adj.) EBITDA (adj.) margin (%)
• Destocking in Denmark, and continued low Danish-German border sales due to strict immigration controls
• Weak sales to German importer, but depletion from importer to retailers flat vs last year.
• Increased sales in Norway and Sweden
• In Norway, aquavit sales increased vs last year, a category that continued to outperform spirits market
Amounts in NOK million
2Reported growth adjusted for currency translation effects and structural changes calculated on external spirits sales only
1Reported growth includes both external spirits sales and other revenue (internal and external bottling). Reported sales of spirits decreased to 165 MNOK in Q3 ’17 vs. 170 MNOK in Q3 ‘16
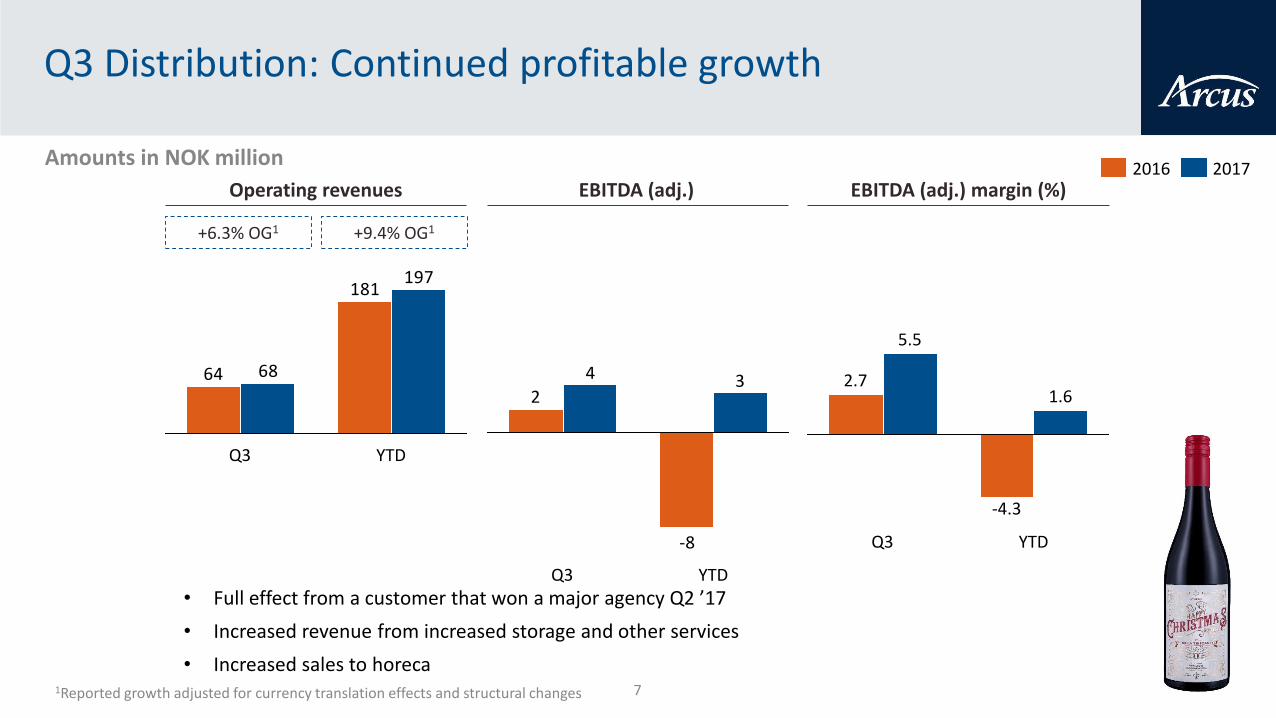
Q3 Distribution: Continued profitable growth
7
+6.3% OG1 +9.4% OG1
1.6
-4.3
Q3 YTD
5.5
2.7
-8
234
YTDQ3
181
64
197
68
YTDQ3
20172016Operating revenues EBITDA (adj.) EBITDA (adj.) margin (%)
• Full effect from a customer that won a major agency Q2 ’17
• Increased revenue from increased storage and other services
• Increased sales to horeca
Amounts in NOK million
1Reported growth adjusted for currency translation effects and structural changes
~ Arcus’ brand portfolio includes the iconic
Lysholm LINIE Aquavit dating back to 1805 ~
8
Financial performance
Sigmund Toth, CFO
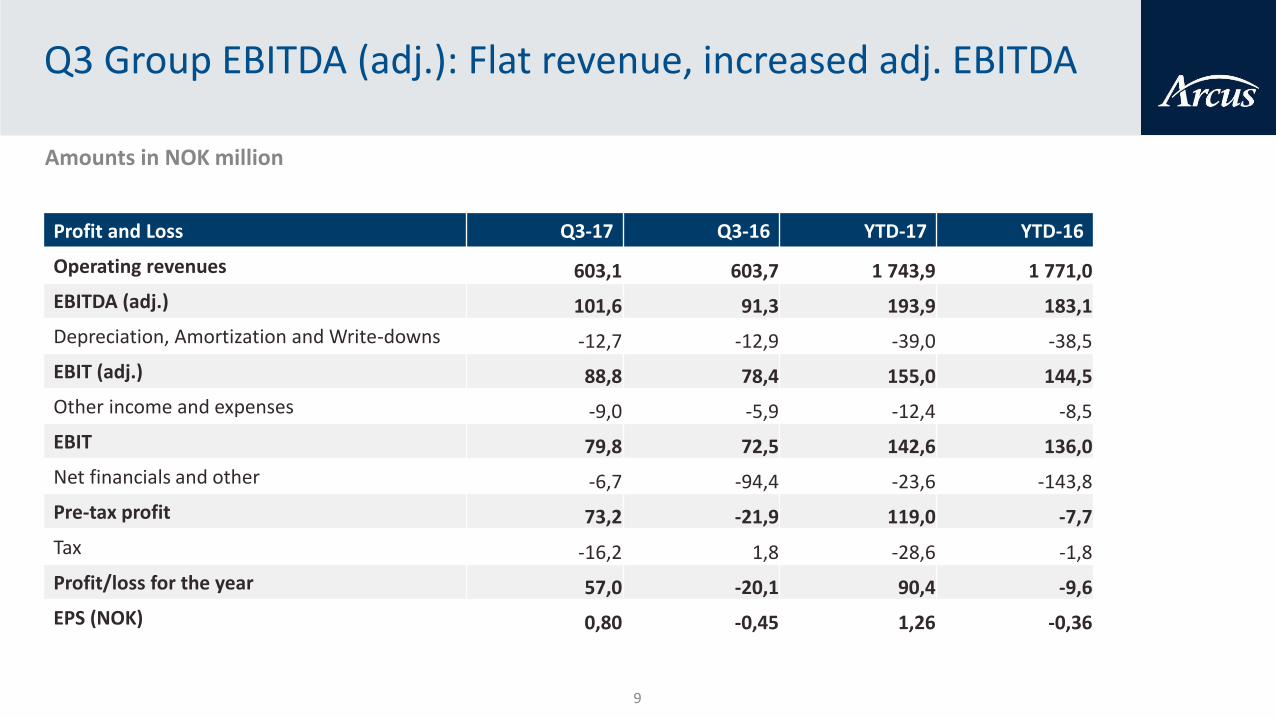
Q3 Group EBITDA (adj.): Flat revenue, increased adj. EBITDA
9
Amounts in NOK million
Profit and Loss Q3-17 Q3-16 YTD-17 YTD-16
Operating revenues 603,1 603,7 1 743,9 1 771,0
EBITDA (adj.) 101,6 91,3 193,9 183,1
Depreciation, Amortization and Write-downs -12,7 -12,9 -39,0 -38,5
EBIT (adj.) 88,8 78,4 155,0 144,5
Other income and expenses -9,0 -5,9 -12,4 -8,5
EBIT 79,8 72,5 142,6 136,0
Net financials and other -6,7 -94,4 -23,6 -143,8
Pre-tax profit 73,2 -21,9 119,0 -7,7
Tax -16,2 1,8 -28,6 -1,8
Profit/loss for the year 57,0 -20,1 90,4 -9,6
EPS (NOK) 0,80 -0,45 1,26 -0,36
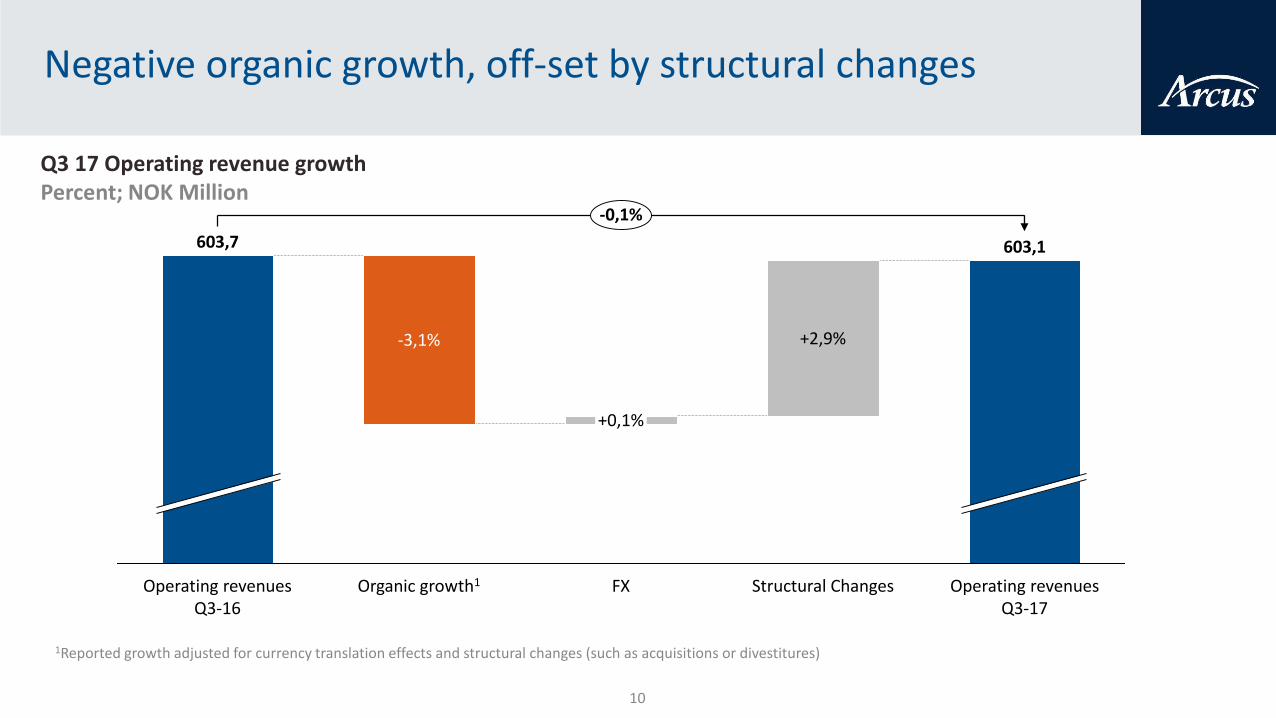
Negative organic growth, off-set by structural changes
10
603,7
FX
-3,1% +2,9%
Structural Changes Operating revenuesQ3-17
Operating revenuesQ3-16
Organic growth1
603,1
-0,1%
+0,1%
Q3 17 Operating revenue growthPercent; NOK Million
1Reported growth adjusted for currency translation effects and structural changes (such as acquisitions or divestitures)
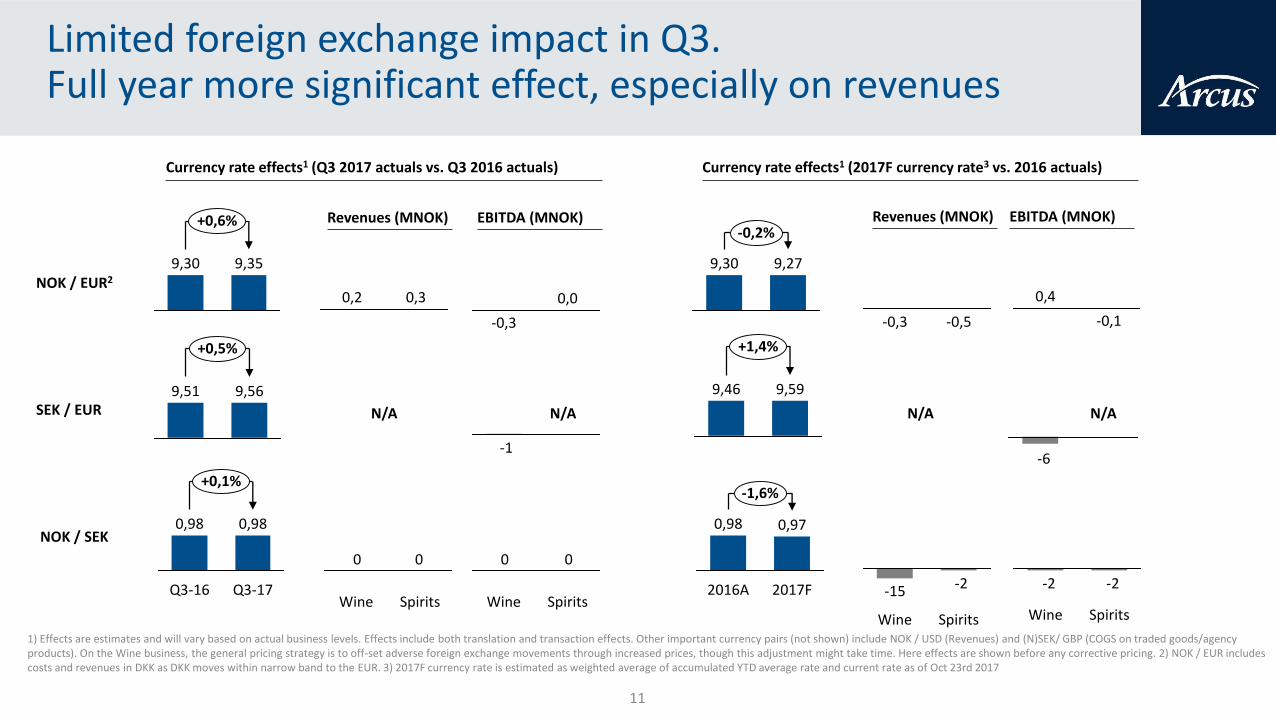
Limited foreign exchange impact in Q3. Full year more significant effect, especially on revenues
11
SEK / EUR
NOK / SEK
0,30,2
EBITDA (MNOK)Revenues (MNOK)
NOK / EUR2
+0,6%
9,359,30
0,0
-0,3 -0,5-0,3
-0,2%
9,279,30
-0,1
0,4
EBITDA (MNOK)Revenues (MNOK)
+0,5%
9,569,51
-1
+1,4%
9,599,46
-6
+0,1%
Q3-17
0,98
Q3-16
0,98
00
SpiritsWine
00
SpiritsWine2017F
0,98
2016A
0,97
-1,6%
-2
SpiritsWine
-15 -2-2
SpiritsWine
Currency rate effects1 (Q3 2017 actuals vs. Q3 2016 actuals) Currency rate effects1 (2017F currency rate3 vs. 2016 actuals)
N/A N/AN/A N/A
1) Effects are estimates and will vary based on actual business levels. Effects include both translation and transaction effects. Other important currency pairs (not shown) include NOK / USD (Revenues) and (N)SEK/ GBP (COGS on traded goods/agency products). On the Wine business, the general pricing strategy is to off-set adverse foreign exchange movements through increased prices, though this adjustment might take time. Here effects are shown before any corrective pricing. 2) NOK / EUR includes costs and revenues in DKK as DKK moves within narrow band to the EUR. 3) 2017F currency rate is estimated as weighted average of accumulated YTD average rate and current rate as of Oct 23rd 2017
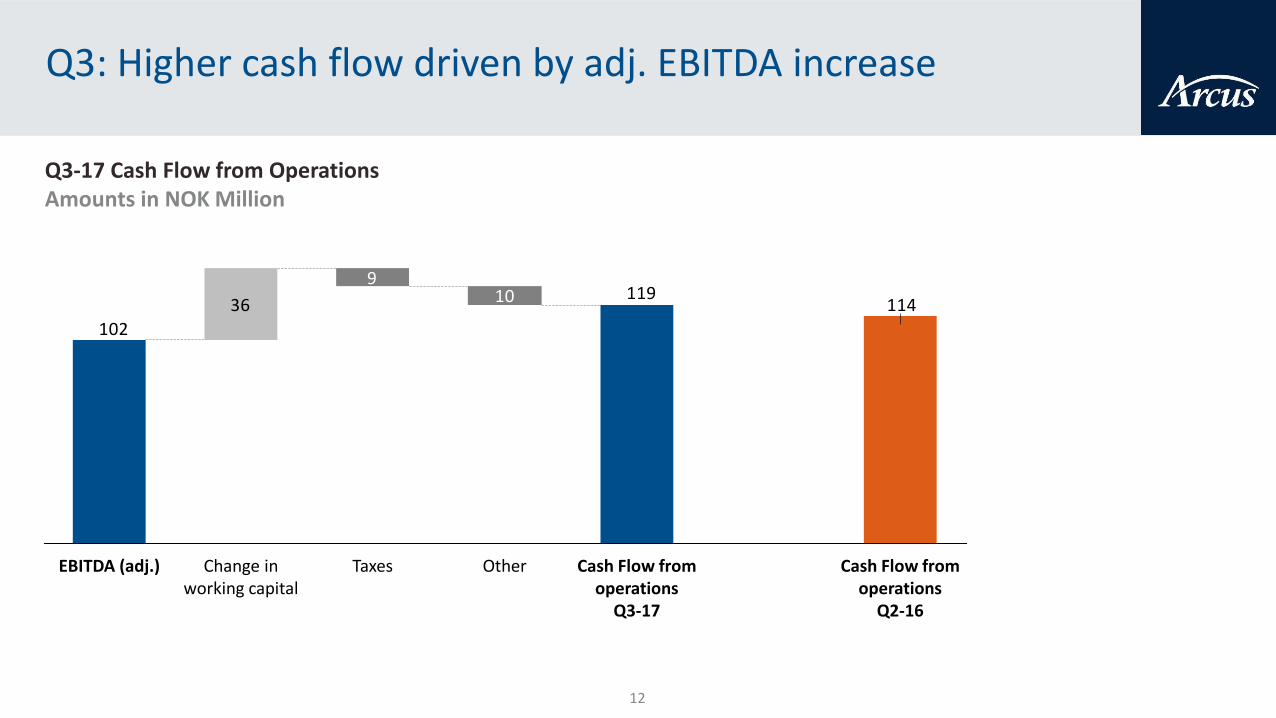
Q3-17 Cash Flow from OperationsAmounts in NOK Million
Q3: Higher cash flow driven by adj. EBITDA increase
12
114119
102
109
36
Other Cash Flow from operations
Q3-17
Cash Flow from operations
Q2-16
TaxesEBITDA (adj.) Change inworking capital
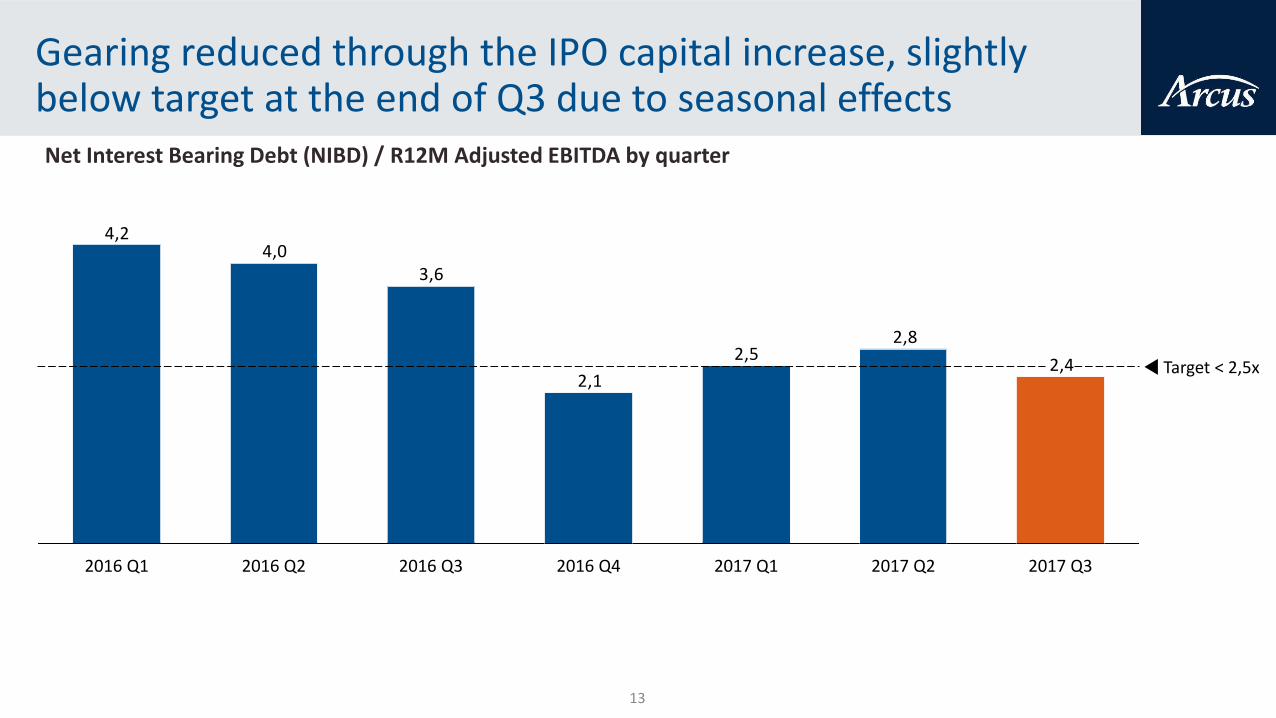
Gearing reduced through the IPO capital increase, slightly below target at the end of Q3 due to seasonal effects
13
2,4
2,82,5
2,1
3,64,0
4,2
2017 Q12016 Q42016 Q32016 Q1 2016 Q2 2017 Q3
Target < 2,5x
2017 Q2
Net Interest Bearing Debt (NIBD) / R12M Adjusted EBITDA by quarter
14
Strategy
Kenneth Hamnes, CEO
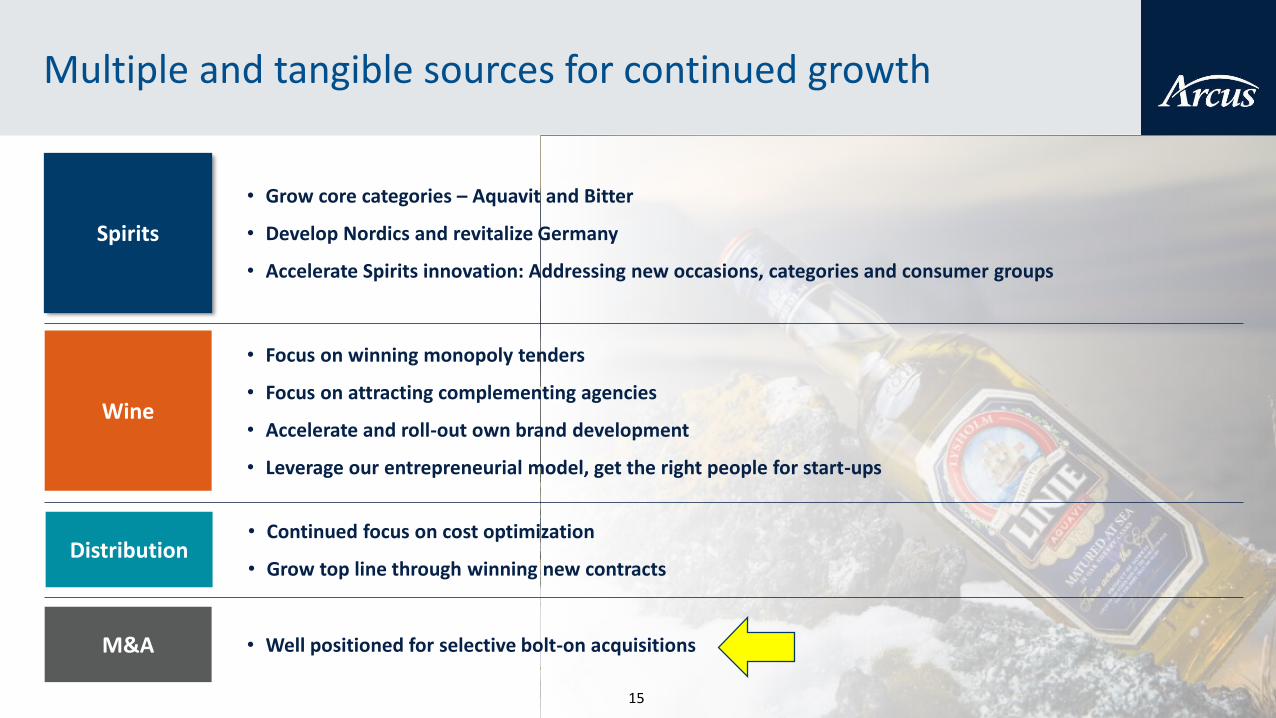
Multiple and tangible sources for continued growth
• Grow core categories – Aquavit and Bitter
• Develop Nordics and revitalize Germany
• Accelerate Spirits innovation: Addressing new occasions, categories and consumer groups
• Focus on winning monopoly tenders
• Focus on attracting complementing agencies
• Accelerate and roll-out own brand development
• Leverage our entrepreneurial model, get the right people for start-ups
• Well positioned for selective bolt-on acquisitions
Spirits
Wine
M&A
15
• Continued focus on cost optimization
• Grow top line through winning new contracts Distribution
16
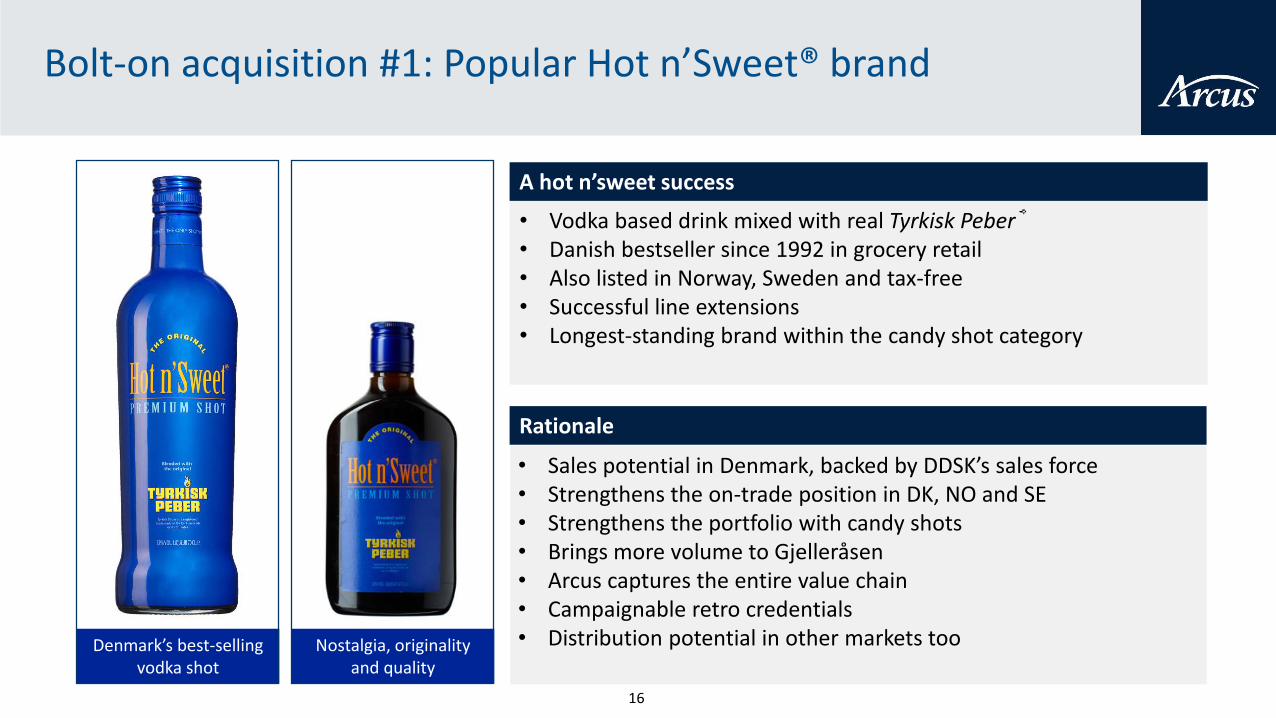
Bolt-on acquisition #1: Popular Hot n’Sweet® brand
• Vodka based drink mixed with real Tyrkisk Peber®• Danish bestseller since 1992 in grocery retail• Also listed in Norway, Sweden and tax-free• Successful line extensions• Longest-standing brand within the candy shot category
A hot n’sweet success
• Sales potential in Denmark, backed by DDSK’s sales force• Strengthens the on-trade position in DK, NO and SE• Strengthens the portfolio with candy shots• Brings more volume to Gjelleråsen• Arcus captures the entire value chain• Campaignable retro credentials• Distribution potential in other markets tooDenmark’s best-selling
vodka shot
Rationale
Nostalgia, originality and quality
16
17
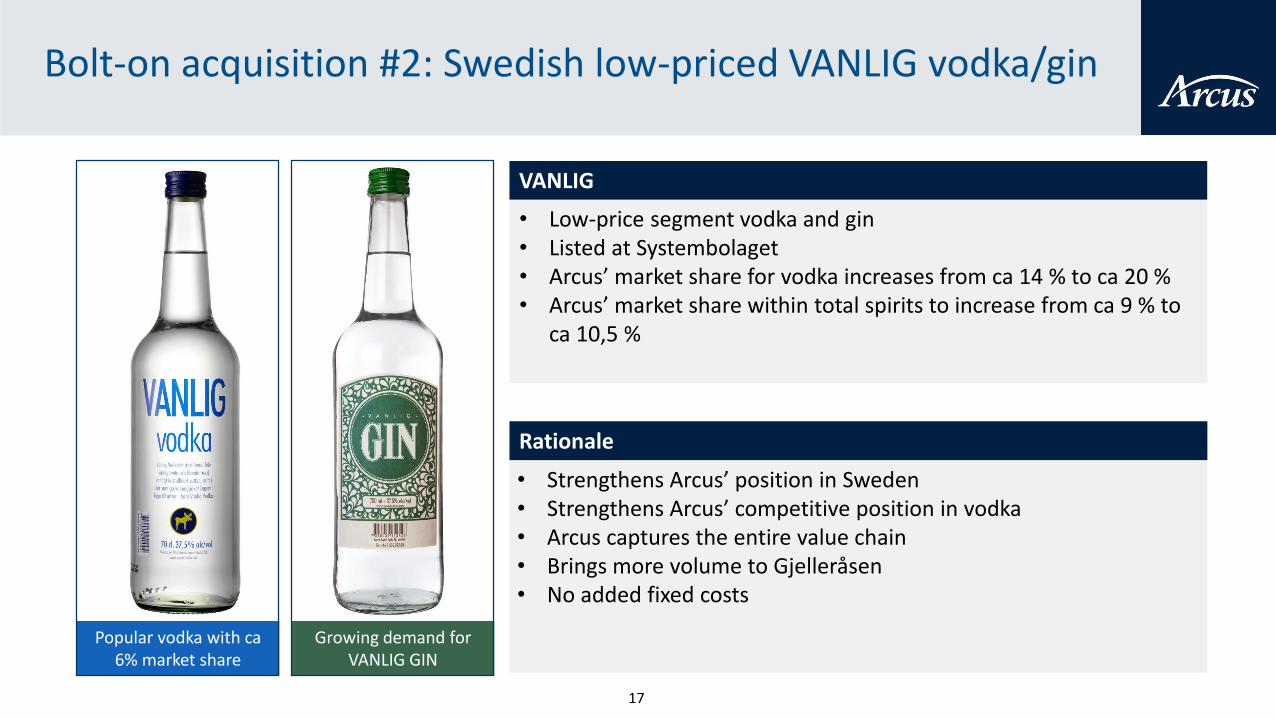
Bolt-on acquisition #2: Swedish low-priced VANLIG vodka/gin
• Low-price segment vodka and gin• Listed at Systembolaget• Arcus’ market share for vodka increases from ca 14 % to ca 20 %• Arcus’ market share within total spirits to increase from ca 9 % to
ca 10,5 %
VANLIG
• Strengthens Arcus’ position in Sweden• Strengthens Arcus’ competitive position in vodka• Arcus captures the entire value chain• Brings more volume to Gjelleråsen• No added fixed costs
Popular vodka with ca6% market share
Rationale
Growing demand for VANLIG GIN
17
Q&A
Kenneth Hamnes, CEOSigmund Toth, CFO
2 November 2017
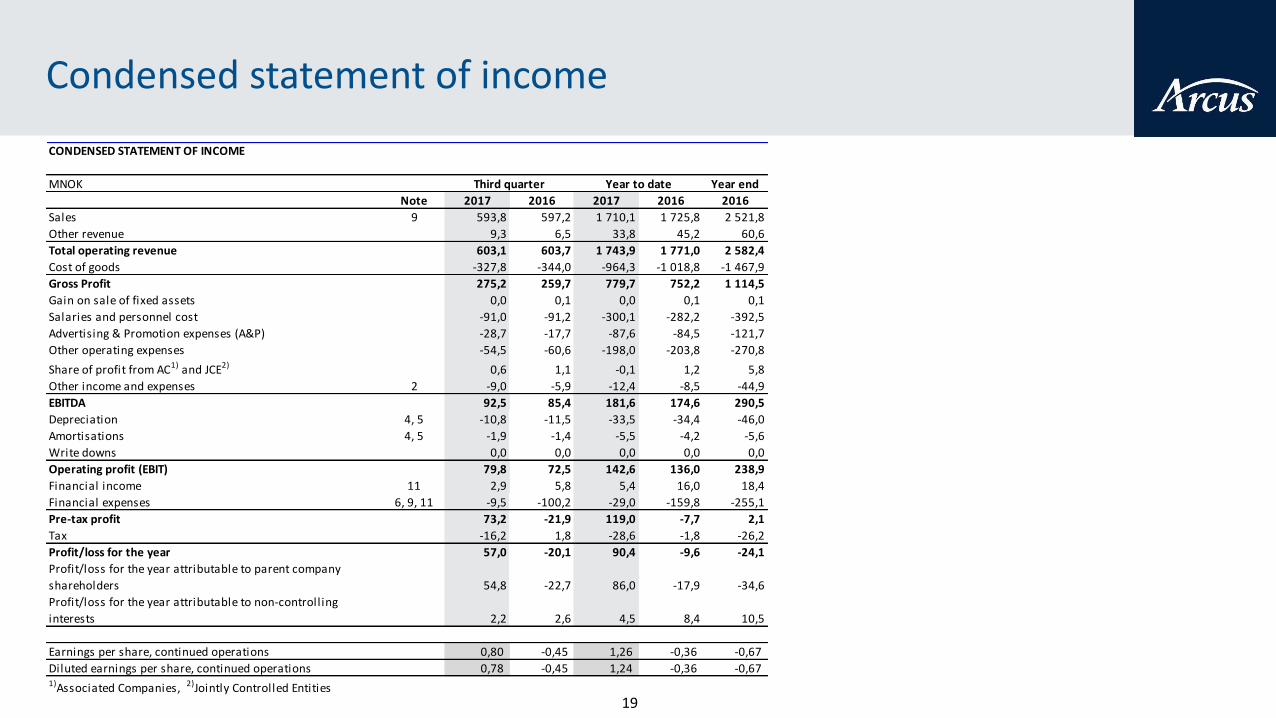
Condensed statement of income
CONDENSED STATEMENT OF INCOME
MNOK Year end
Note 2017 2016 2017 2016 2016
Sales 9 593,8 597,2 1 710,1 1 725,8 2 521,8
Other revenue 9,3 6,5 33,8 45,2 60,6
Total operating revenue 603,1 603,7 1 743,9 1 771,0 2 582,4
Cost of goods -327,8 -344,0 -964,3 -1 018,8 -1 467,9
Gross Profit 275,2 259,7 779,7 752,2 1 114,5
Gain on sale of fixed assets 0,0 0,1 0,0 0,1 0,1
Salaries and personnel cost -91,0 -91,2 -300,1 -282,2 -392,5
Advertising & Promotion expenses (A&P) -28,7 -17,7 -87,6 -84,5 -121,7
Other operating expenses -54,5 -60,6 -198,0 -203,8 -270,8
Share of profit from AC1) and JCE2) 0,6 1,1 -0,1 1,2 5,8
Other income and expenses 2 -9,0 -5,9 -12,4 -8,5 -44,9
EBITDA 92,5 85,4 181,6 174,6 290,5
Depreciation 4, 5 -10,8 -11,5 -33,5 -34,4 -46,0
Amortisations 4, 5 -1,9 -1,4 -5,5 -4,2 -5,6
Write downs 0,0 0,0 0,0 0,0 0,0
Operating profit (EBIT) 79,8 72,5 142,6 136,0 238,9
Financial income 11 2,9 5,8 5,4 16,0 18,4
Financial expenses 6, 9, 11 -9,5 -100,2 -29,0 -159,8 -255,1
Pre-tax profit 73,2 -21,9 119,0 -7,7 2,1
Tax -16,2 1,8 -28,6 -1,8 -26,2
Profit/loss for the year 57,0 -20,1 90,4 -9,6 -24,1
Profit/loss for the year attributable to parent company
shareholders 54,8 -22,7 86,0 -17,9 -34,6
Profit/loss for the year attributable to non-controlling
interests 2,2 2,6 4,5 8,4 10,5
Earnings per share, continued operations 0,80 -0,45 1,26 -0,36 -0,67
Diluted earnings per share, continued operations 0,78 -0,45 1,24 -0,36 -0,67 1)Associated Companies, 2)Jointly Controlled Entities
Third quarter Year to date
19
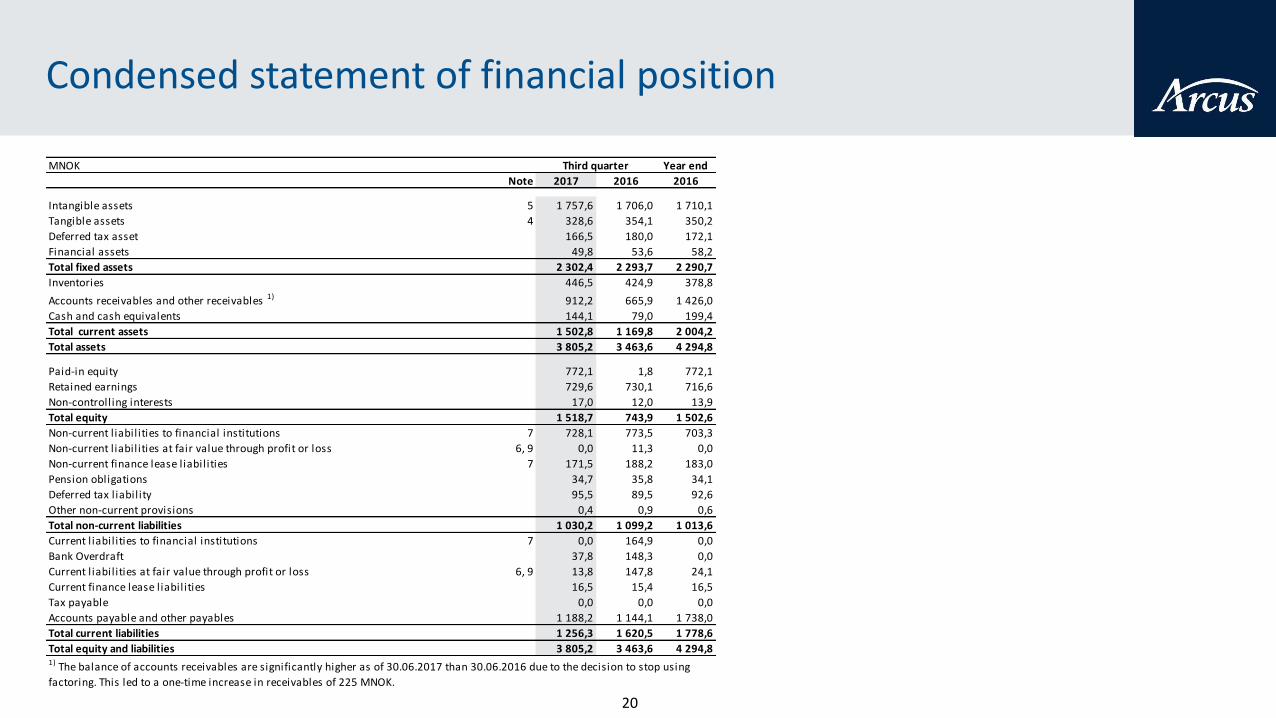
Condensed statement of financial position
MNOK Year end
Note 2017 2016 2016
Intangible assets 5 1 757,6 1 706,0 1 710,1
Tangible assets 4 328,6 354,1 350,2
Deferred tax asset 166,5 180,0 172,1
Financial assets 49,8 53,6 58,2
Total fixed assets 2 302,4 2 293,7 2 290,7
Inventories 446,5 424,9 378,8
Accounts receivables and other receivables 1) 912,2 665,9 1 426,0
Cash and cash equivalents 144,1 79,0 199,4
Total current assets 1 502,8 1 169,8 2 004,2
Total assets 3 805,2 3 463,6 4 294,8
Paid-in equity 772,1 1,8 772,1
Retained earnings 729,6 730,1 716,6
Non-controlling interests 17,0 12,0 13,9
Total equity 1 518,7 743,9 1 502,6
Non-current l iabilities to financial institutions 7 728,1 773,5 703,3
Non-current l iabilities at fair value through profit or loss 6, 9 0,0 11,3 0,0
Non-current finance lease liabilities 7 171,5 188,2 183,0
Pension obligations 34,7 35,8 34,1
Deferred tax liability 95,5 89,5 92,6
Other non-current provisions 0,4 0,9 0,6
Total non-current liabilities 1 030,2 1 099,2 1 013,6
Current l iabilities to financial institutions 7 0,0 164,9 0,0
Bank Overdraft 37,8 148,3 0,0
Current l iabilities at fair value through profit or loss 6, 9 13,8 147,8 24,1
Current finance lease liabilities 16,5 15,4 16,5
Tax payable 0,0 0,0 0,0
Accounts payable and other payables 1 188,2 1 144,1 1 738,0
Total current liabilities 1 256,3 1 620,5 1 778,6
Total equity and liabilities 3 805,2 3 463,6 4 294,81) The balance of accounts receivables are significantly higher as of 30.06.2017 than 30.06.2016 due to the decision to stop using
factoring. This led to a one-time increase in receivables of 225 MNOK.
Third quarter
20
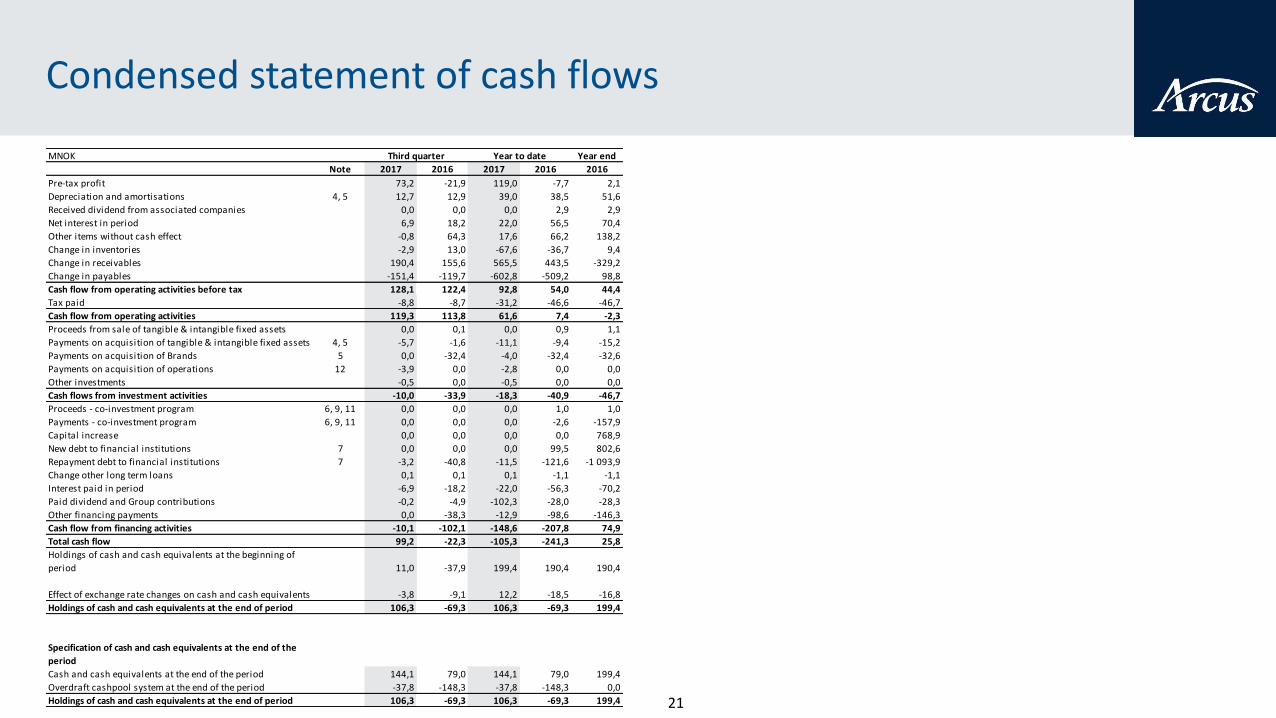
Condensed statement of cash flows
MNOK Year end
Note 2017 2016 2017 2016 2016
Pre-tax profit 73,2 -21,9 119,0 -7,7 2,1
Depreciation and amortisations 4, 5 12,7 12,9 39,0 38,5 51,6
Received dividend from associated companies 0,0 0,0 0,0 2,9 2,9
Net interest in period 6,9 18,2 22,0 56,5 70,4
Other items without cash effect -0,8 64,3 17,6 66,2 138,2
Change in inventories -2,9 13,0 -67,6 -36,7 9,4
Change in receivables 190,4 155,6 565,5 443,5 -329,2
Change in payables -151,4 -119,7 -602,8 -509,2 98,8
Cash flow from operating activities before tax 128,1 122,4 92,8 54,0 44,4
Tax paid -8,8 -8,7 -31,2 -46,6 -46,7
Cash flow from operating activities 119,3 113,8 61,6 7,4 -2,3
Proceeds from sale of tangible & intangible fixed assets 0,0 0,1 0,0 0,9 1,1
Payments on acquisition of tangible & intangible fixed assets 4, 5 -5,7 -1,6 -11,1 -9,4 -15,2
Payments on acquisition of Brands 5 0,0 -32,4 -4,0 -32,4 -32,6
Payments on acquisition of operations 12 -3,9 0,0 -2,8 0,0 0,0
Other investments -0,5 0,0 -0,5 0,0 0,0
Cash flows from investment activities -10,0 -33,9 -18,3 -40,9 -46,7
Proceeds - co-investment program 6, 9, 11 0,0 0,0 0,0 1,0 1,0
Payments - co-investment program 6, 9, 11 0,0 0,0 0,0 -2,6 -157,9
Capital increase 0,0 0,0 0,0 0,0 768,9
New debt to financial institutions 7 0,0 0,0 0,0 99,5 802,6
Repayment debt to financial institutions 7 -3,2 -40,8 -11,5 -121,6 -1 093,9
Change other long term loans 0,1 0,1 0,1 -1,1 -1,1
Interest paid in period -6,9 -18,2 -22,0 -56,3 -70,2
Paid dividend and Group contributions -0,2 -4,9 -102,3 -28,0 -28,3
Other financing payments 0,0 -38,3 -12,9 -98,6 -146,3
Cash flow from financing activities -10,1 -102,1 -148,6 -207,8 74,9
Total cash flow 99,2 -22,3 -105,3 -241,3 25,8
Holdings of cash and cash equivalents at the beginning of
period 11,0 -37,9 199,4 190,4 190,4
Effect of exchange rate changes on cash and cash equivalents -3,8 -9,1 12,2 -18,5 -16,8
Holdings of cash and cash equivalents at the end of period 106,3 -69,3 106,3 -69,3 199,4
Specification of cash and cash equivalents at the end of the
period
Cash and cash equivalents at the end of the period 144,1 79,0 144,1 79,0 199,4
Overdraft cashpool system at the end of the period -37,8 -148,3 -37,8 -148,3 0,0
Holdings of cash and cash equivalents at the end of period 106,3 -69,3 106,3 -69,3 199,4
Third quarter Year to date
21
22