Embed Size (px)
Citation preview

WORK ING PAPER SER IESNO 1704 / AUGUST 2014
ARE FOREIGN-OWNEDFIRMS DIFFERENT?
COMPARISON OF EMPLOYMENT VOLATILITY AND ELASTICITY
OF LABOUR DEMAND
Jaanika Meriküll and Tairi Rõõm
In 2014 all ECBpublications
feature a motiftaken from
the €20 banknote.
NOTE: This Working Paper should not be reported as representing the views of the European Central Bank (ECB). The views expressed are those of the authors and do not necessarily refl ect those of the ECB.
THE COMPETITIVENESS RESEARCH NETWORK
© European Central Bank, 2014
Address Kaiserstrasse 29, 60311 Frankfurt am Main, GermanyPostal address Postfach 16 03 19, 60066 Frankfurt am Main, GermanyTelephone +49 69 1344 0Internet http://www.ecb.europa.eu
All rights reserved. Any reproduction, publication and reprint in the form of a different publication, whether printed or produced electronically, in whole or in part, is permitted only with the explicit written authorisation of the ECB or the authors. This paper can be downloaded without charge from http://www.ecb.europa.eu or from the Social Science Research Network electronic library at http://ssrn.com/abstract_id=2464134. Information on all of the papers published in the ECB Working Paper Series can be found on the ECB’s website, http://www.ecb.europa.eu/pub/scientifi c/wps/date/html/index.en.html
ISSN 1725-2806 (online)ISBN 978-92-899-1112-2 (online)EU Catalogue No QB-AR-14-078-EN-N (online)
The Competitiveness Research NetworkTCompNetThis paper presents research conducted within the Competitiveness Research Network (CompNet). The network is composed of economists from the European System of Central Banks (ESCB) - i.e. the 28 national central banks of the European Union (EU) and the European Central Bank – a number of international organisations (World Bank, OECD, EU Commission) universities and think-tanks, as well as a number of non-European Central Banks (Argentina and Peru) and organisations (US International Trade Commission). The objective of CompNet is to develop a more consistent analytical framework for assessing competitiveness, one which allows for a better correspondence between determinants and outcomes. The research is carried out in three workstreams: 1) Aggregate Measures of Competitiveness; 2) Firm Level; 3) Global Value Chains CompNet is chaired by Filippo di Mauro (ECB). Workstream 1 is headed by Chiara Osbat, Giovanni Lombardo (both ECB) and Konstantins Benkovskis (Bank of Latvia); workstream 2 by Antoine Berthou (Banque de France) and Paloma Lopez-Garcia (ECB); workstream 3 by João Amador (Banco de Portugal) and Frauke Skudelny (ECB). Julia Fritz (ECB) is responsible for the CompNet Secretariat.The refereeing process of CompNet papers is coordinated by a team composed of Filippo di Mauro (ECB), Konstantins Benkovskis (Bank of Latvia), João Amador (Banco de Portugal), Vincent Vicard (Banque de France) and Martina Lawless (Central Bank of Ireland).The paper is released in order to make the research of CompNet generally available, in preliminary form, to encourage comments and suggestions prior to fi nal publication. The views expressed in the paper are the ones of the author(s) and do not necessarily refl ect those of the ECB, the ESCB, and of other organisations associated with the Network.
AcknowledgementsThe authors thank discussants of the paper at the following meetings: the annual conference of the Estonian Association of Economists in 2013; the NOeG conference in Innsbruck; the SMYE conference in Aarhus; the EACES workshop in Tartu; and the CompNet meeting in Frankfurt. Jaanika Meriküll is grateful for the fi nancial support from the European Social Fund and Estonian Science Foundation grant no. 8311. The views expressed are those of the authors and do not necessarily representthe offi cial views of Eesti Pank.
Jaanika MeriküllEesti Pank, University of Tartu; e-mail: [email protected]; [email protected]
Tairi RõõmEesti Pank, Tallinn University of Technology; e-mail: [email protected]
Abstract
This paper analyses differences in employment volatility in foreign-owned and domestic companies using firm-level data from 24 European countries. The presence of foreign-owned companies may lead to higher employment volatility because subsidiaries of multinational companies react more sensitively to changes in labour demand in host countries or because they are more exposed to external shocks. We assess the conditional em-ployment volatility of firms with foreign and domestic owners us-ing propensity score matching and find that it is higher in foreign-owned firms in about half of the countries that our study covers. In addition, we explore how and why labour demand elasticity differs between these two groups of companies. Our estimations indicate that labour demand can be either more or less elastic in subsidiaries of foreign-owned multinationals than in domestic en-terprises, depending on the institutional environments of their home and host countries.
JEL Codes: F23, J23, J51
Keywords: foreign direct investment (FDI), employment volatility, labour demand, labour market institutions, European Union
ECB Working Paper 1704, August 2014 1
Non-technical summary
There is a long-running debate about the potential adverse side effects of globalisation. The increase in employment volatility is one of the side effects usually depicted in a negative light, since it lessens job security (Scheve and Slaughter (2004); Geishecker et al. (2012)). Globalisation could increase the volatility of employment for two main reasons. First, internationalization of production may amplify the volatility of shocks that firms face (Bhagwati (1996)). Second, multinational companies may react to shocks more strongly, i.e. their elasticity of labour demand could be larger in absolute value.
An explanation why the second of the above-stated reasons can be the cause of increasing employment volatility was given by Rodrik (1997). He alleged that deeper international economic integration would make domestic workers more easily substitutable by foreign workers – the elasticity of sub-stitution of labour would increase. Consequently, labour demand would be-come more wage (or own-price) elastic. This result of globalization has been debated by Hijzen and Swaim (2010) who argue that the effect of globaliza-tion on the elasticity of labour demand is theoretically ambiguous and can be only empirically determined.
This paper analyses how one aspect of globalization – the internationaliza-tion of the ownership structure – contributes to employment volatility. Using the standard framework of labour demand and supply, we show that the dif-ferences in total employment volatility can be caused either by the foreign-owned firms’ different elasticity of labour demand or by their different expo-sure to economic shocks. The empirical analysis focuses on two aims. First, we evaluate differences in employment volatility in foreign-owned and do-mestically owned enterprises (FOEs and DOEs). Second, we assess whether these differences stem from the elasticity of labour demand. We employ firm-level panel data from the Bureau van Dijk’s Amadeus database, which covers 24 European countries and spans the years 2001–2009. We assess the condi-tional employment volatilities of FOEs and DOEs using propensity score matching, which enables us to control for differences in firm characteristics such as age, size, capital intensity, labour productivity, ownership concentra-tion, number of subsidiaries and primary business activity. A comparison of conditional employment volatilities implies that FOEs tend to have higher employment volatility than DOEs with similar characteristics. This difference is statistically significant in about half of the countries that our study covers. The average magnitude of the difference across all covered countries is around 10%, i.e. FOEs have approximately 10% higher employment volatili-ty.
Besides assessing the volatility of employment, we estimate labour de-mand equations for FOEs and DOEs using system GMM estimations and
ECB Working Paper 1704, August 2014 2
find that there are only a few European countries where labour demand elas-ticities of the two groups differ to a statistically significant degree. There is no conclusive result that elasticity of labour demand is higher in FOEs. The results are country-specific, indicating for example that foreign-owned firms have more elastic labour demand in Italy and Belgium and less elastic labour demand in France and Spain.
Given these findings, our study implies that although employment volatili-ty tends to be higher in FOEs than in DOEs, this gap in volatility is not unan-imously caused by their more elastic labour demand. We analyse the deter-minants of the elasticity of labour demand in foreign-owned multinationals further by assessing the role that labour market institutions play in this con-text.
Our estimations indicate that labour demand can be either more or less elastic in the subsidiaries of foreign-owned multinationals than in DOEs, depending on the institutional environments of their home and host countries. When FDI originates from a region with a more flexible institutional envi-ronment (e.g. from the USA to Western European countries) then the elastici-ty of labour demand is smaller in absolute value in FOEs than in DOEs. In the opposite case (e.g. when FDI is originating from Germany to CEE coun-tries) the elasticity of labour demand is higher.
A potential explanation for this finding is that in countries with rigid la-bour market regulations, multinational companies avoid changing domestic employment in response to economic shocks and instead use other margins of adjustment. Alternatively, multinational firms may choose the host countries where they establish subsidiaries by looking at the labour market institutions: if they operate in sectors that have highly volatile demand then they are more likely to move to countries with a flexible institutional environment and vice versa. In either case, the presence of the subsidiaries of foreign-owned multi-nationals would have an amplifying effect on the elasticity of labour demand in countries with flexible labour market institutions, whereas it would have a dampening effect in countries with rigid institutions.
ECB Working Paper 1704, August 2014 3
1. Introduction There is a long-running debate about the potential adverse side effects of
the internationalisation of ownership structures and those of globalisation in general. The increase in employment volatility is one of the side effects usu-ally depicted in a negative light, since it lessens job security (see e.g. Scheve and Slaughter (2004) and Geishecker et al. (2012)).1 We study differences in employment volatility between firms with domestic and foreign workers in Europe. For this purpose, we use firm-level panel data from Bureau van Dijk Amadeus database spanning the years 2001–2009. The Amadeus dataset in-cludes a detailed description of firms’ ownership structure, which enables us to disentangle companies by ownership type and to identify the number of subsidiaries for multinational and domestic enterprises.
Rodrik (1997) in his book “Has globalization gone too far?” is seen as the first to argue forcefully that the labour demand of foreign-owned companies is more elastic, contributing to higher employment volatility and lower job security. He alleges that deeper international economic integration may make domestic workers more easily substitutable by foreign workers. Consequent-ly, labour demand would become more wage (or own-price) elastic.
Another reason why globalisation increases the elasticity of labour de-mand is that deepening international integration of production results in more elastic product demand. This is an often-cited finding from the empirical lit-erature on international trade and FDI flows. According to the Hicks-Marshall laws of derived demand, more competition in the product markets (i.e. flatter product demand curves) should also lead to more elastic labour demand. Bhagwati (1996) stressed a related channel through which globalisa-tion may have increased employment volatility when he pointed out that global economic integration has made product markets more volatile. Greater volatility of product demand should lead to greater volatility of labour de-mand as well, since the latter is derived from the former.
An alternative view of the relationship between the international integra-tion of production and the elasticity of labour demand is proposed by Hijzen and Swaim (2010). They argue that the impact of FDI on the elasticity of labour demand is theoretically ambiguous and hence ultimately an empirical issue. While the internationalisation of the production process is expected to increase the ability of firms to substitute between factor inputs, the elasticity of substitution is only one of several factors determining the own-price elas-ticity of labour demand. Globalisation, which is associated with greater capi-
1 The other effects of globalisation remain beyond the scope of this paper. In particular,
the paper does not seek to undermine the positive effects of FDI (see e.g. Borensztein et al. (1998) on FDI and growth).
ECB Working Paper 1704, August 2014 4
tal mobility, will also tend to lead to a reduction in the cost share of labour. Making use of a decomposition of the determinants of labour demand elastic-ity into substitution and scale effects along the lines of Hamermesh (1993), Hijzen and Swaim (2010) demonstrate that a simultaneous increase in the constant-output elasticity of substitution and a decrease in the cost share of labour in production will have offsetting effects on the total own-price elas-ticity of labour demand. The former will increase elasticity via the substitu-tion effect, while the latter will decrease it via the scale effect. The result is that the net impact of globalisation can be either positive or negative, depend-ing on which of the two effects dominates.
Given the arguments outlined above, it is not a priori clear that a positive association exists between foreign ownership and employment volatility. The empirical evidence is mostly in favour of the existence of this relationship, but not universally so. Some examples in favour are studies by Bergin et al. (2009) and Levasseur (2010), which compare employment volatilities in spe-cific offshoring industries in home and host countries. In Bergin et al.’s pa-per, the country pair is the USA and Mexico, and in Levasseur’s study, Ger-many is compared with the Czech Republic and Slovakia. Both of these arti-cles focus on specific industries where the vertical integration of production is well documented and yield the result that employment is more volatile in the host country in an industry that specialises in subcontracting.
However, studies analysing a wider spectrum of industries and incorporat-ing services in addition to manufacturing do not always yield the result that globalisation is associated with increasing labour volatility. For example, an analysis by Buch and Schlotter (2013) using German industry-level data demonstrates that unconditional volatility of employment has exhibited a downward trend. According to this study, openness to trade and employment volatility are not significantly related across industries in Germany.
Most of the research papers investigating the labour market impacts of offshoring (or FDI more particularly) focus on the elasticity of labour de-mand. As explained above, the flattening of the demand curve is one factor that can contribute to an increase in employment volatility. The results of these studies are inconclusive. The evidence in support of the hypothesis that an increase in offshoring leads to more elastic labour demand is provided by several studies.2 On the other hand, research which has used data from vari-ous European countries mostly does not support this hypothesis.3 Among studies using plant-level or firm-level data, the only case where the higher
2 Supporting evidence can be found in Slaughter (2001) on the US data; Fabbri et al.
(2003) for the UK; and Görg et al. (2009) for Ireland. 3 Examples include Barba Navaretti et al. (2003); Buch and Lipponer (2010); and Hakka-
la et al. (2010).
ECB Working Paper 1704, August 2014 5
labour demand elasticity of foreign multinationals has found empirical sup-port is in Ireland (Görg et al. (2009)).
The purpose of our study is to assess the differences in employment vola-tility between firms with domestic and foreign owners. Using the standard framework of labour demand and supply, we show that the differences in total employment volatility can be caused either by the foreign-owned firms’ different elasticity of labour demand or by their different exposure to eco-nomic shocks. We assess the conditional employment volatilities of firms with foreign and domestic owners using propensity score matching, which enables us to control for differences in firm characteristics such as age, size, capital intensity, labour productivity, ownership concentration, and number of subsidiaries. A comparison of conditional employment volatilities implies that foreign-owned firms tend to have systematically higher employment volatility than domestically owned counterparts with similar characteristics, although this difference is not statistically significant for all the countries that our study covers.
Regarding the elasticity of labour demand, we do not find evidence to support Rodrik’s (1997) conjecture described above. The system GMM esti-mations of labour demand functions across 18 European countries indicate that the wage elasticity of labour demand is mostly not significantly different between foreign and domestically owned enterprises. For the few countries where the differences are significant the elasticity is not always larger in for-eign-owned firms. The main focus of our analysis is on assessing the role that labour market institutions play in this context.
The results of two earlier studies indicate that the effect of offshoring or foreign ownership on the elasticity of labour demand is dependent on labour market institutions. Barba Navaretti et al. (2003) show that long-term wage elasticity of labour demand is lower in multinational enterprises (MNEs) than in domestic firms and the ratio of the elasticities of MNEs and NEs is larger in countries with a stricter institutional environment. They argue that MNEs manage to bypass the regulations in a strict regulatory environment and con-clude that “labour market regulations are quite irrelevant to the labour market behaviour of MNEs” (Barba Navaretti et al. (2003, p. 718). The analysis of Hijzen and Swaim (2010) indicates that offshoring is associated with higher labour demand elasticity only in countries with relatively weak employment protection legislation, whereas they detect no significant effects for countries with more regulated labour markets.
In comparison to the earlier research, we take a step further and investi-gate the role of labour market institutions in a bilateral context by assessing the effects of differences in the institutional environment in the home and host countries of MNEs. We find that labour demand can be either more or
ECB Working Paper 1704, August 2014 6
less elastic in subsidiaries of foreign-owned multinationals than in domestic enterprises, depending on these institutional differences. When FDI origi-nates from a region with more flexible institutions then the elasticity of la-bour demand is smaller in absolute value in foreign-owned firms. In the op-posite case the elasticity of labour demand is higher. A potential explanation for this empirical finding is that it is easier for multinational companies to substitute between factor inputs and so they have more flexibility than do-mestic firms in choosing which channels of adjustment to use.
When MNEs need to adjust costs in response to economic shocks, then in the presence of strong restrictions on the adjustment of employment it is easi-er for them to alter other production costs or output prices and leave labour costs unadjusted. A multinational production network should be associated with easier adjustment via other margins than is the case for companies that have only domestic operations. In addition, MNEs can respond to shocks by adjusting employment in other locations abroad. If it is necessary to change employment in response to economic shocks then they can shift adjustments to countries or regions where it is easier to adjust. They can change employ-ment mostly at home when the labour market there is more flexible or shift the main bulk of adjustment to foreign affiliates when the local institutions in the host countries favour this.
It is worth noting that we use a similar explanation for our empirical find-ings to that evoked by Rodrik (1997). He asserted that multinational enter-prises have larger elasticity of substitution between production factors and this should increase their elasticity of labour demand. We add another layer to this argument as our empirical estimates imply that this greater ease of substituting between different inputs can also result in smaller elasticity of labour demand, depending on labour market institutions. Differences in insti-tutional environment can lead to a dual outcome: the presence of MNEs can have an amplifying effect on the elasticity of labour demand in countries with flexible labour market institutions, whereas it can have a dampening effect in countries with rigid institutions.
An alternative, though related, explanation for this empirical finding is that multinational firms choose the host countries where they will establish subsidiaries by looking at the labour market institutions: if MNEs operate in sectors characterised by highly volatile demand then they are more likely to move to countries with a flexible institutional environment. The formalisation of how flexible labour markets act as a comparative advantage is provided e.g. in Cunat and Melitz (2012).
The paper is organised as follows. The second section presents the theoret-ical model deriving the decomposition of employment volatility. The third section provides an overview of the Bureau van Dijk Amadeus firm-level
ECB Working Paper 1704, August 2014 7
data that we employ for the analysis. In the fourth section, we give an over-view of unconditional and conditional employment volatilities for foreign and domestically owned firms. Section 5 focuses on estimating labour de-mand equations for foreign and domestically owned firms and investigating the role of labour market institutions. The last section summarises.
2. Decomposition of employment volatility The subsidiaries of foreign-owned enterprises can have higher volatility
than local companies for two reasons. First, they may be exposed to more volatile shocks, which can then be transferred into more volatile labour de-mand, and second, they may behave differently from local enterprises as they can react to shocks of similar size more or less strongly by adjusting labour. This section will derive a decomposition of employment volatility into two subcomponents: a) a function of exogenous economic shocks; and b) a func-tion of the elasticities of labour supply and demand. This decomposition will enable us to demonstrate that employment volatility is positively related to the elasticity of labour demand as long as labour supply is not perfectly ine-lastic. This can be assumed to be the case if the subject of the analysis is a firm, as in the current study.
We build on the approach of Scheve and Slaughter (2004) and Barba Navaretti and Venables (2004) along the lines of Hamermesh (1993) to de-compose employment volatility. Let us assume a Cobb-Douglas production function with diminishing returns to scale where capital is fixed in the short-term and normalised to one:
(1) where Y denotes output, A is the parameter capturing technological progress and L denotes labour, while 0 < β < 1. Profit maximisation under perfect competition in all markets yields:
(2)
where W stands for wages, p is product price and the term pAβ is marginal revenue product, which captures exogenous price and productivity shocks. Solving for L and defining labour demand as LD results in the following la-bour demand equation:
/ (3)
ECB Working Paper 1704, August 2014 8
Given that the labour demand elasticity equals 1 / (β–1) in this case and defining ηLL as the absolute value of the wage elasticity of labour demand lets us rewrite equation (3) as:
(3’)
Let us assume the following labour supply function:
, (4)
where ηS denotes the wage elasticity of labour supply. The equilibrium em-ployment and wage can then be expressed as follows:
/ (5)
/ (6)
Taking natural logarithms of both sides of equations (5) and (6) (a mono-tonic transformation) yields:
/ ln (7)
/ ln (8) where w = ln(W) and l = ln(L).
Treating marginal revenue product as a random variable, we can express the variance of equilibrium employment and wages by building on equations (7) and (8) as follows:
/ (9)
/ (10)
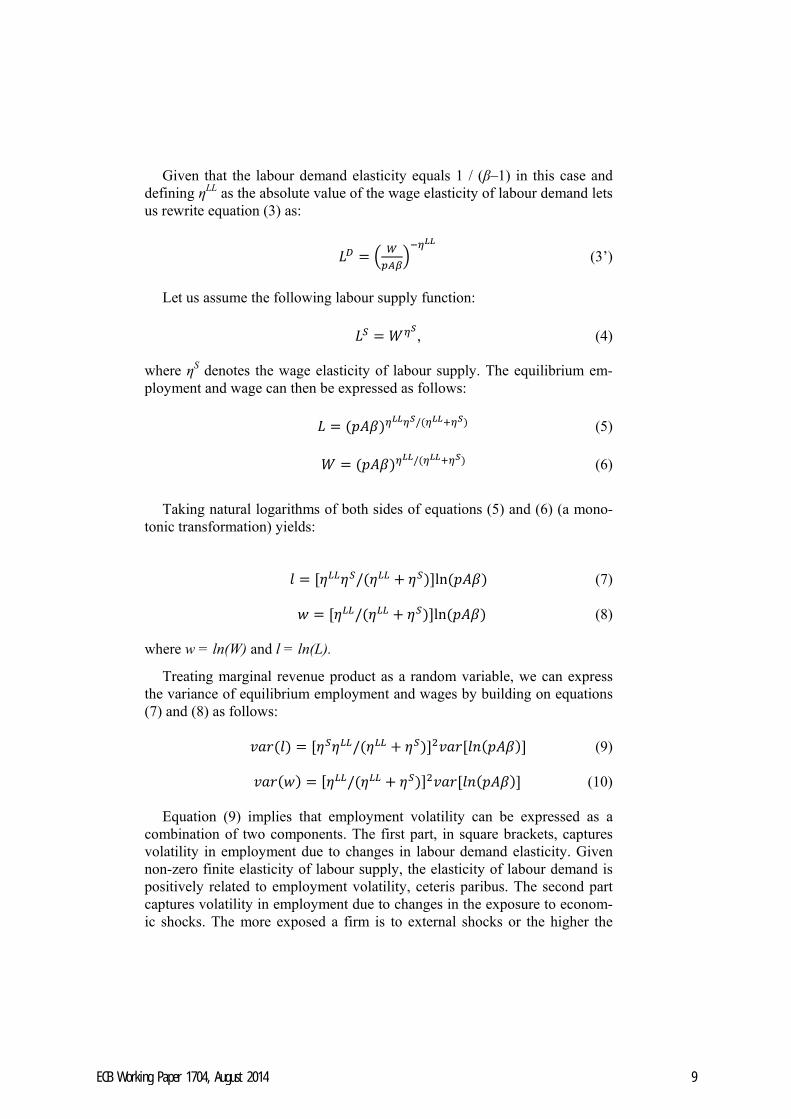
Equation (9) implies that employment volatility can be expressed as a
combination of two components. The first part, in square brackets, captures volatility in employment due to changes in labour demand elasticity. Given non-zero finite elasticity of labour supply, the elasticity of labour demand is positively related to employment volatility, ceteris paribus. The second part captures volatility in employment due to changes in the exposure to econom-ic shocks. The more exposed a firm is to external shocks or the higher the
ECB Working Paper 1704, August 2014 9
variation in marginal revenue product is, the higher its employment volatility is.
Note that when the labour supply is perfectly inelastic then changes in the elasticity of labour demand do not affect employment volatility. On the other hand, equation (10) implies that when the labour supply is perfectly elastic then changes in the elasticity of labour demand do not affect wage volatility. In general, the distribution of volatility between wages and employment de-pends on the slope of the labour supply curve. The more elastic it is, the larg-er employment volatility is relative to wage volatility, given a similar demand schedule and exogenous shocks to labour demand. Since labour market rigid-ities make the labour supply less elastic, it can be expected that employment will be more volatile in countries with flexible labour regulations, ceteris paribus.
The decomposition given in equation (9) illustrates that foreign-owned companies may have higher employment volatility because they react more sensitively to wage changes in a host country or because they are more ex-posed to external shocks. The latter might well be the case since foreign-owned MNEs are more likely to operate in several markets and to be hit by shocks more frequently than domestically owned enterprises.4 However, mul-tinationals may also be faced by a more dispersed structure of shocks, so whether they are more or less exposed to a volatile economic environment is an empirical issue that depends on the cross-country correlation of shocks.
3. The data
We use an Amadeus (Bureau van Dijk, see https://amadeus.bvdinfo.com) firm-level panel dataset that covers a large set of European countries and spans the years 2001–2009. Amadeus data includes information about the balance sheets and profit/loss statements of firms and detailed information on the ownership structure.
Our initial goal was to cover all the EU27 countries, but the set of coun-tries was reduced to 18 because of data availability. The Amadeus data on Greece and Lithuania do not cover employment costs while the data on Ire-land do not cover employment volumes. The Amadeus data on Austria, Cy-prus, Denmark, Hungary, Latvia, Luxembourg and Malta do not have enough
4 The focus in the current study is on comparing foreign and domestically owned compa-
nies. Practically all of the former are subsidiaries or affiliates of multinational companies. Although some of the domestically owned firms are also multinationals, the majority of firms in this group are local companies. Thus, as a group, foreign-owned firms can be ex-pected to be more exposed to shocks.
ECB Working Paper 1704, August 2014 10
observations to be suitable for econometric analysis. Our analysis includes Norway in addition to the EU member states. The default dataset covers 18 countries, 170 thousand firms and in total more than a million observations. In some cases, like when data on wage costs is not necessary for the analysis, the set of countries covered is larger. The variables for the empirical analysis are defined in Table 1.
Table 1: Variable definitions
Variable Definition
Employment (empl) Number of employees, head counts Wage (rwage) GDP deflator* deflated employment costs divided by employ-
ment Output (rturn) GDP deflator* deflated turnover (operational revenue for Den-
mark, Norway, UK) Foreign-owned en-terprise (FOE)
Foreign versus domestically owned enterprises (FOEs; DOEs), dummy variable. A firm is considered to be foreign-owned if its global ultimate owner is a foreigner (subsidiary) or its larg-est shareholder is a foreigner (associate). Ownership is time-invariant and fixed in the year 2009.
Age Firm’s age in years No of subsidiaries Number of recorded subsidiaries No of shareholders Number of recorded shareholders Peer’s employment Employment of the business group or the largest recorded
owner Capital intensity Total fixed assets per employee in real terms Labour productivity Deflated turnover divided by employment
Notes: The GDP deflator is taken from Eurostat and is at a 2-digit NACE 2008 level.
The ownership data are often missing in the Amadeus dataset. For some countries like Romania and Slovakia the data are only available for a small number of companies. The number of observations across the dynamic di-mension of the dataset is smaller than average for Germany as the years 2007–2009 are missing for almost all the firms. In general, larger firms tend to be overrepresented in the Amadeus sample in comparison to the whole population of firms.
We also impose filters to remove possibly erroneous observations and make the dataset more comparable across countries. These filters differ for matching and dynamic panel data analysis and these differences are discussed in the sections that cover these topics. Country-by-country estimations use
ECB Working Paper 1704, August 2014 11
monetary variables in their original currency, while estimations with pooled data across countries employ monetary variables transformed into euros5.
Appendix 1 presents the descriptive statistics of variables for foreign and domestically owned enterprises (FOEs and DOEs) separately for countries from Western Europe and from Central and Eastern Europe. The foreign-owned firms tend to be larger, to pay higher wages, to have higher capital intensity and labour productivity, to have more concentrated ownership and to operate more often in the manufacturing sector. In total, 18% of firms are foreign-owned in the final sample, while 30% of employment originates from foreign-owned companies. The sample of enterprises from Western Europe contains some very large firms, which make the samples of WE and CEE differ much more in the mean values of the variables analysed than in the medians.
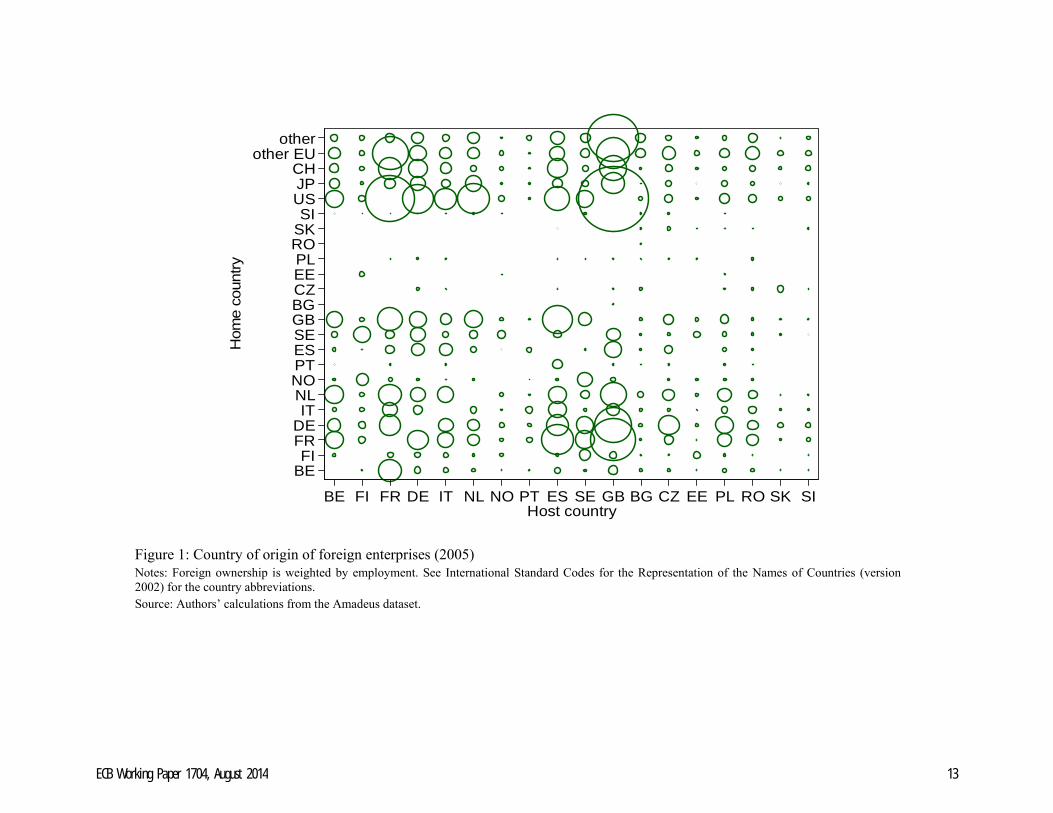
Figure 1 presents the origin of foreign investment from the host country perspective. FDI in EU countries mostly originates from other EU countries and is highly concentrated in terms of origins, with Germany, France, the Netherlands and the UK being the main home countries. Outside the EU the main country of origin is the USA. Central and Eastern Europe is an im-portant recipient of FDI from Western Europe but the FDI flows from Central and Eastern Europe to other EU countries are modest.
Our dataset imposes some limitations on what we can or cannot test. First, we cannot observe firm entry and exit in our data, which means that we can investigate firms’ employment adjustment only via the intensive margin. Se-cond, we do not cover employment across different skill groups as we only have data on total wages and employment. Third, our database consists of the balance sheets and profit/loss statements on a yearly basis but only includes ownership data for the year 2009, so it is possible that the firm ownership variable is subject to measurement error.
5 The source of the exchange rates is the European Central Bank Statistical Data Ware-
house: annual average bilateral exchange rates. [http://sdw.ecb.europa.eu/browse.do?node=2018794]
ECB Working Paper 1704, August 2014 12
BEFI
FRDEIT
NLNOPTESSEGBBGCZEEPL
ROSKSI
USJPCH
other EUother
Hom
e co
untry
BE FI FR DE IT NL NO PT ES SE GB BG CZ EE PL RO SK SIHost country
Figure 1: Country of origin of foreign enterprises (2005) Notes: Foreign ownership is weighted by employment. See International Standard Codes for the Representation of the Names of Countries (version 2002) for the country abbreviations. Source: Authors’ calculations from the Amadeus dataset.
ECB Working Paper 1704, August 2014 13
Trade and foreign ownership are sometimes difficult to disentangle. For example, part of production can be outsourced abroad to another company or a subsidiary can be established abroad to do this work within a business group. Offshoring is usually defined as a change in the supplier of intermedi-ate inputs and services from a domestic one to a foreign one. Offshoring can be international outsourcing, which means importing goods from other firms, or it can be the relocation of a firm’s own production so that some parts of the value-added chain are produced abroad within an affiliate or subsidiary. This relocation is also called in-house offshoring. OECD (2007) notes that offshoring via the establishment of a new affiliate is more common when OECD countries are offshoring to other developed countries. When OECD countries offshore to less developed countries the most common type of off-shoring is usually subcontracting. Most of the host countries covered in this study are OECD countries, meaning that in-house offshoring should be the most common type of offshoring to these countries and this is what our data-base captures.
4. Unconditional and conditional employment volatility In this section we will look at employment volatility across 24 European
countries6, differentiating between foreign and domestically owned enterpris-es. We start out by comparing the unconditional employment volatilities of FOEs and DOEs. This comparison performs a simple test as to whether firm-level employment volatility differs for these two firm groups, i.e. whether the overall volatility differs in the left-hand side of equation (9). Volatility is measured as a coefficient of variation (CV) for the time period 2001–2009. For better comparability, firms with fewer than 5 observations are excluded.
Next, to account for firm heterogeneity, we estimate conditional employ-ment volatilities. We use propensity score matching with the nearest neigh-bour and a caliper (maximum propensity score distance) algorithm. As it is sometimes difficult to find a common support for treatment and artificial counterfactual groups, we match the three nearest neighbours and introduce a caliper of 0.05 or 0.10, meaning the three nearest neighbours are selected within a propensity score of 5% or 10%. A caliper of 10% is used in country-by-country analysis, and a caliper of 5% in the analysis of country groups. We use matching with replacement, meaning that the same firms from the artificial counterfactual can be used more than once as a match. (See Calien-
6 We were able to increase the set of countries analysed here by adding Austria, Den-
mark, Greece, Hungary, Latvia and Lithuania as the employment and ownership data for these countries was available for a substantial number of firms, unlike the wage costs needed for the forthcoming sections.
ECB Working Paper 1704, August 2014 14
do and Kopeinig (2008) for a discussion of options for matching algorithms and Leuven and Sianesi (2003) for psmatch2 module for Stata).
We use control variables from 2005 and estimate the conditional volatility as a cross-section over this period of analysis. The control variables are: loga-rithm of firm age, logarithm of firm employment, number of subsidiaries, logarithm of number of shareholders, peer group employment, logarithm of capital per employee, logarithm of labour productivity, industry dummies (NACE Rev 2, at 2-digit level) and country dummies.
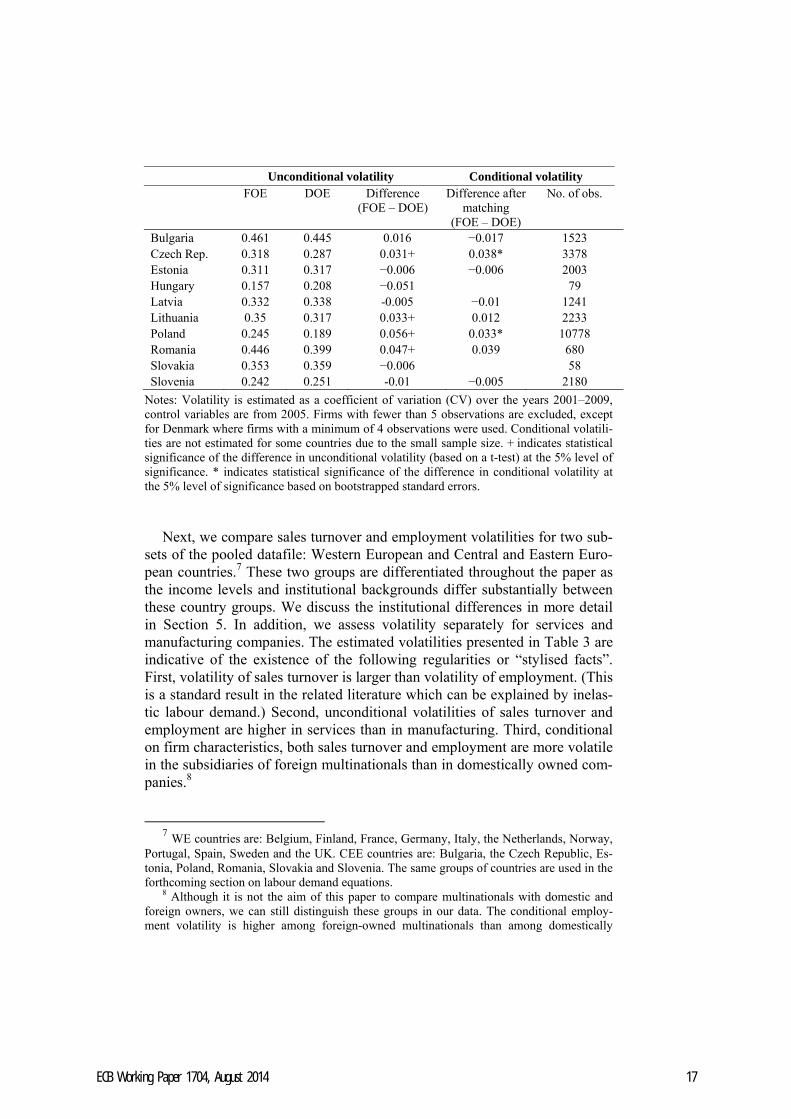
Table 2 presents unconditional sales turnover and employment volatilities for FOEs and DOEs for each country separately. In addition, it gives a pic-ture of the differences between conditional and unconditional volatilities for these two groups of enterprises. It can be observed that for the majority of countries unconditional sales turnover and employment volatilities are higher in FOEs than in DOEs. However, this is not a uniform result, since these dif-ferences are negative and statistically significant for several countries: turno-ver volatility is statistically significantly higher among domestic firms in France, Greece, Spain, the Czech Republic and Hungary, while employment volatility is higher among domestic firms in Greece and Spain. (Note that the Amadeus dataset is not a random sample and the estimated unconditional volatilities may not be representative of the whole population of firms.)
The estimation of conditional volatilities enables us to compare FOEs and DOEs with similar characteristics. The estimated figures presented in Table 2 imply that FOEs tend to have larger employment volatility than similar DOEs. The difference in the volatility of sales turnover in favour of FOEs is significantly positive for 11 countries out of the 19 for which these estimates could be assessed. (We could not apply propensity score matching for some countries as there was an insufficient number of observations and a lack of common support for matching.) The employment volatility is statistically significantly higher in FOEs than in DOEs in 10 countries out of the 19. There is only one country, Greece, where this relationship is the other way around, i.e. the conditional volatilities of sales turnover and employment are statistically significantly higher among DOEs than among FOEs.
ECB Working Paper 1704, August 2014 15
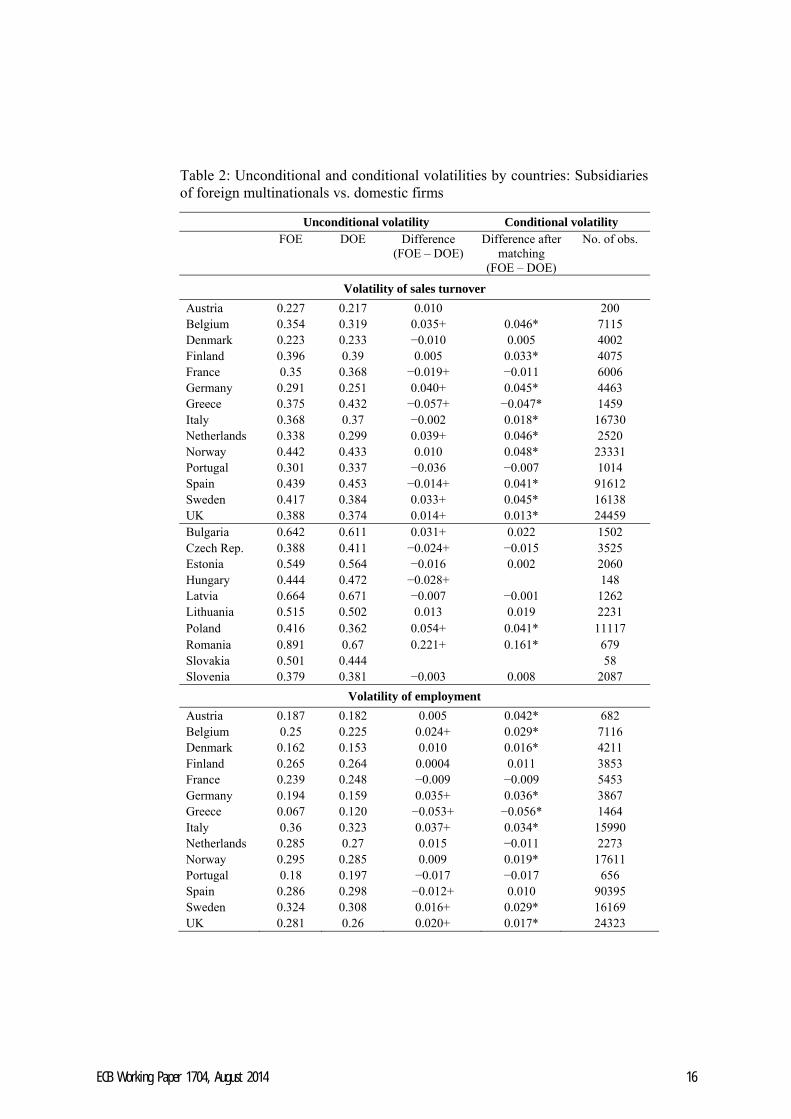
Table 2: Unconditional and conditional volatilities by countries: Subsidiaries of foreign multinationals vs. domestic firms
Unconditional volatility Conditional volatility FOE DOE Difference
(FOE – DOE) Difference after
matching (FOE – DOE)
No. of obs.
Volatility of sales turnover
Austria 0.227 0.217 0.010 200 Belgium 0.354 0.319 0.035+ 0.046* 7115 Denmark 0.223 0.233 −0.010 0.005 4002 Finland 0.396 0.39 0.005 0.033* 4075 France 0.35 0.368 −0.019+ −0.011 6006 Germany 0.291 0.251 0.040+ 0.045* 4463 Greece 0.375 0.432 −0.057+ −0.047* 1459 Italy 0.368 0.37 −0.002 0.018* 16730 Netherlands 0.338 0.299 0.039+ 0.046* 2520 Norway 0.442 0.433 0.010 0.048* 23331 Portugal 0.301 0.337 −0.036 −0.007 1014 Spain 0.439 0.453 −0.014+ 0.041* 91612 Sweden 0.417 0.384 0.033+ 0.045* 16138 UK 0.388 0.374 0.014+ 0.013* 24459 Bulgaria 0.642 0.611 0.031+ 0.022 1502 Czech Rep. 0.388 0.411 −0.024+ −0.015 3525 Estonia 0.549 0.564 −0.016 0.002 2060 Hungary 0.444 0.472 −0.028+ 148 Latvia 0.664 0.671 −0.007 −0.001 1262 Lithuania 0.515 0.502 0.013 0.019 2231 Poland 0.416 0.362 0.054+ 0.041* 11117 Romania 0.891 0.67 0.221+ 0.161* 679 Slovakia 0.501 0.444 58 Slovenia 0.379 0.381 −0.003 0.008 2087
Volatility of employment
Austria 0.187 0.182 0.005 0.042* 682 Belgium 0.25 0.225 0.024+ 0.029* 7116 Denmark 0.162 0.153 0.010 0.016* 4211 Finland 0.265 0.264 0.0004 0.011 3853 France 0.239 0.248 −0.009 −0.009 5453 Germany 0.194 0.159 0.035+ 0.036* 3867 Greece 0.067 0.120 −0.053+ −0.056* 1464 Italy 0.36 0.323 0.037+ 0.034* 15990 Netherlands 0.285 0.27 0.015 −0.011 2273 Norway 0.295 0.285 0.009 0.019* 17611 Portugal 0.18 0.197 −0.017 −0.017 656 Spain 0.286 0.298 −0.012+ 0.010 90395 Sweden 0.324 0.308 0.016+ 0.029* 16169 UK 0.281 0.26 0.020+ 0.017* 24323
ECB Working Paper 1704, August 2014 16
Unconditional volatility Conditional volatility FOE DOE Difference
(FOE – DOE) Difference after
matching (FOE – DOE)
No. of obs.
Bulgaria 0.461 0.445 0.016 −0.017 1523 Czech Rep. 0.318 0.287 0.031+ 0.038* 3378 Estonia 0.311 0.317 −0.006 −0.006 2003 Hungary 0.157 0.208 −0.051 79 Latvia 0.332 0.338 -0.005 −0.01 1241 Lithuania 0.35 0.317 0.033+ 0.012 2233 Poland 0.245 0.189 0.056+ 0.033* 10778 Romania 0.446 0.399 0.047+ 0.039 680 Slovakia 0.353 0.359 −0.006 58 Slovenia 0.242 0.251 -0.01 −0.005 2180
Notes: Volatility is estimated as a coefficient of variation (CV) over the years 2001–2009, control variables are from 2005. Firms with fewer than 5 observations are excluded, except for Denmark where firms with a minimum of 4 observations were used. Conditional volatili-ties are not estimated for some countries due to the small sample size. + indicates statistical significance of the difference in unconditional volatility (based on a t-test) at the 5% level of significance. * indicates statistical significance of the difference in conditional volatility at the 5% level of significance based on bootstrapped standard errors.
Next, we compare sales turnover and employment volatilities for two sub-sets of the pooled datafile: Western European and Central and Eastern Euro-pean countries.7 These two groups are differentiated throughout the paper as the income levels and institutional backgrounds differ substantially between these country groups. We discuss the institutional differences in more detail in Section 5. In addition, we assess volatility separately for services and manufacturing companies. The estimated volatilities presented in Table 3 are indicative of the existence of the following regularities or “stylised facts”. First, volatility of sales turnover is larger than volatility of employment. (This is a standard result in the related literature which can be explained by inelas-tic labour demand.) Second, unconditional volatilities of sales turnover and employment are higher in services than in manufacturing. Third, conditional on firm characteristics, both sales turnover and employment are more volatile in the subsidiaries of foreign multinationals than in domestically owned com-panies.8
7 WE countries are: Belgium, Finland, France, Germany, Italy, the Netherlands, Norway,
Portugal, Spain, Sweden and the UK. CEE countries are: Bulgaria, the Czech Republic, Es-tonia, Poland, Romania, Slovakia and Slovenia. The same groups of countries are used in the forthcoming section on labour demand equations.
8 Although it is not the aim of this paper to compare multinationals with domestic and foreign owners, we can still distinguish these groups in our data. The conditional employ-ment volatility is higher among foreign-owned multinationals than among domestically
ECB Working Paper 1704, August 2014 17
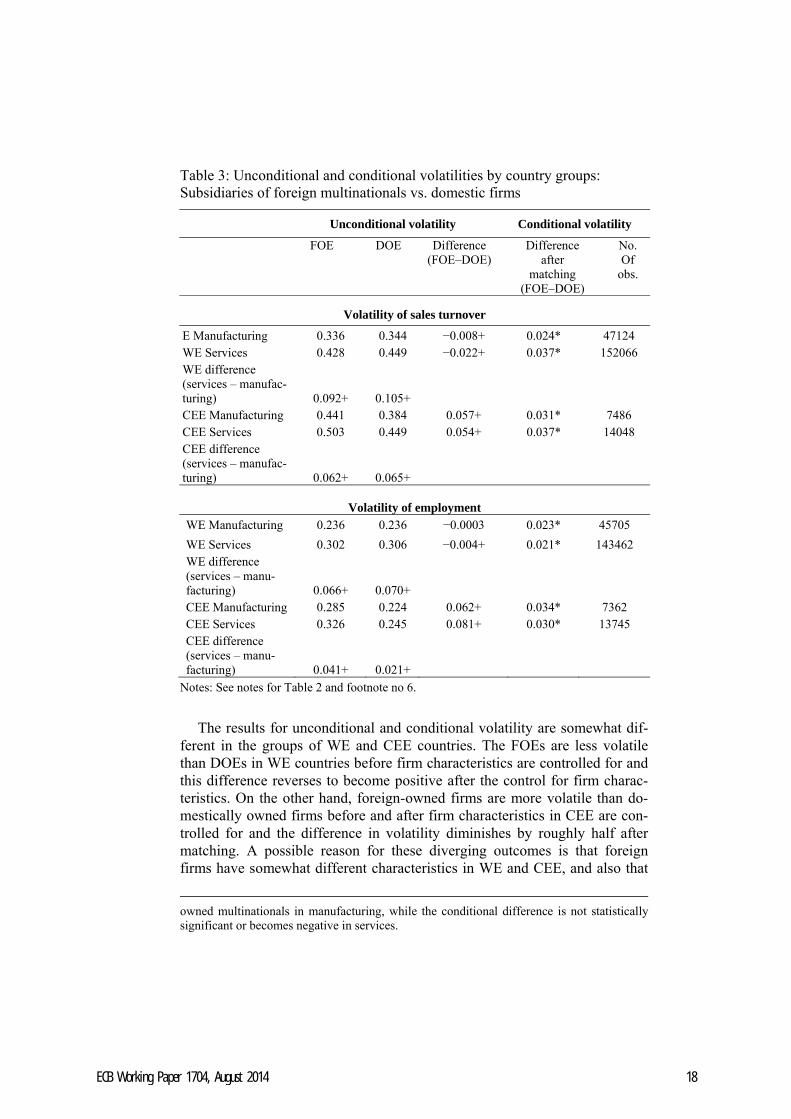
Table 3: Unconditional and conditional volatilities by country groups: Subsidiaries of foreign multinationals vs. domestic firms
Unconditional volatility Conditional volatility
FOE DOE Difference (FOE–DOE)
Difference after
matching (FOE–DOE)
No. Of
obs.
Volatility of sales turnover
E Manufacturing 0.336 0.344 −0.008+ 0.024* 47124 WE Services 0.428 0.449 −0.022+ 0.037* 152066 WE difference (services – manufac-turing) 0.092+ 0.105+ CEE Manufacturing 0.441 0.384 0.057+ 0.031* 7486 CEE Services 0.503 0.449 0.054+ 0.037* 14048 CEE difference (services – manufac-turing) 0.062+ 0.065+
Volatility of employment WE Manufacturing 0.236 0.236 −0.0003 0.023* 45705
WE Services 0.302 0.306 −0.004+ 0.021* 143462 WE difference (services – manu-facturing) 0.066+ 0.070+ CEE Manufacturing 0.285 0.224 0.062+ 0.034* 7362 CEE Services 0.326 0.245 0.081+ 0.030* 13745 CEE difference (services – manu-facturing) 0.041+ 0.021+
Notes: See notes for Table 2 and footnote no 6.
The results for unconditional and conditional volatility are somewhat dif-ferent in the groups of WE and CEE countries. The FOEs are less volatile than DOEs in WE countries before firm characteristics are controlled for and this difference reverses to become positive after the control for firm charac-teristics. On the other hand, foreign-owned firms are more volatile than do-mestically owned firms before and after firm characteristics in CEE are con-trolled for and the difference in volatility diminishes by roughly half after matching. A possible reason for these diverging outcomes is that foreign firms have somewhat different characteristics in WE and CEE, and also that
owned multinationals in manufacturing, while the conditional difference is not statistically significant or becomes negative in services.
ECB Working Paper 1704, August 2014 18
foreign firms operate in less volatile industries in WE and in more volatile areas in CEE. This finding is in accordance with the implications from the theoretical literature (Cunat and Melitz (2012)) that more flexible labour market institutions in CEE may attract more volatile FDI.
Appendix 2 presents the probit models behind these propensity score esti-mates. The appendix shows that the “propensity to be a foreign-owned firm” is often different in WE and CEE in terms of industry variables, meaning there are differences in the concentration of FDI to certain industries. For example there is relatively more FDI in labour-intensive manufacturing in-dustries in the CEE countries (textiles and wearing apparel, wood products and furniture manufacturing) and in some volatile manufacturing industries (non-metallic mineral products, fabricated metal products, electrical equip-ment, and motor vehicle manufacturing). The electrical equipment industry is one of the largest in the sample and one of the most volatile, like it is in the study of Cunat and Melitz (2012).
Second, these country groups differ in the conditional employment volatil-ity of foreign firms. While there are hardly any differences in conditional turnover volatility between WE and CEE, the difference in conditional em-ployment volatility is somewhat higher among foreign firms in CEE than foreign firms in WE. A “similar” foreign firm has 7–8% higher sales turnover volatility in WE than a DOE does and 8% higher sales turnover volatility in CEE, whereas a “similar” foreign firm has 7–10% higher employment vola-tility in WE and 12–15% higher employment volatility in CEE. This indicates that foreign firms are more prone to volatile employment in CEE than in WE.
The following section will investigate whether differences in labour de-mand elasticity could explain the higher employment volatility of foreign firms.
5. Elasticity of labor demand
5.1. Estimation methodology
We estimate the following labour demand equation, assuming that capital is fixed in the short-run and that employment is adjusted on a given output, yit
(a similar approach to Barba Navaretti (2003); and Görg et al. (2009)):
itstititit ywllit
21110 (11)
where lit is log(employment) in firm i at time t (t = 1, …,9); wit is log(real labour cost per employee); yit is log(real output); τt notes time dummies and
ECB Working Paper 1704, August 2014 19
γs sector dummies (NACE 2-digit industries). Estimations covering the data from multiple countries include time dummies for each country, i.e. time*country dummies. Sector dummies are included in the base specifica-tion. However, for some estimations sector dummies were excluded when specification tests indicated poor fit of the specification or unfeasible coeffi-cients were produced. Nominal variables are deflated by 2-digit industry lev-el GDP deflators to obtain real values, see also the discussion in the data sec-tion. The coefficient α1 captures firms’ employment persistence (speed of adjustment = 1 – α1). The coefficient β1 measures short-term wage elasticity of labour demand and β2 short-term output elasticity of labour demand. Long-term elasticities can be found by dividing short-term elasticities by the speed of adjustment.
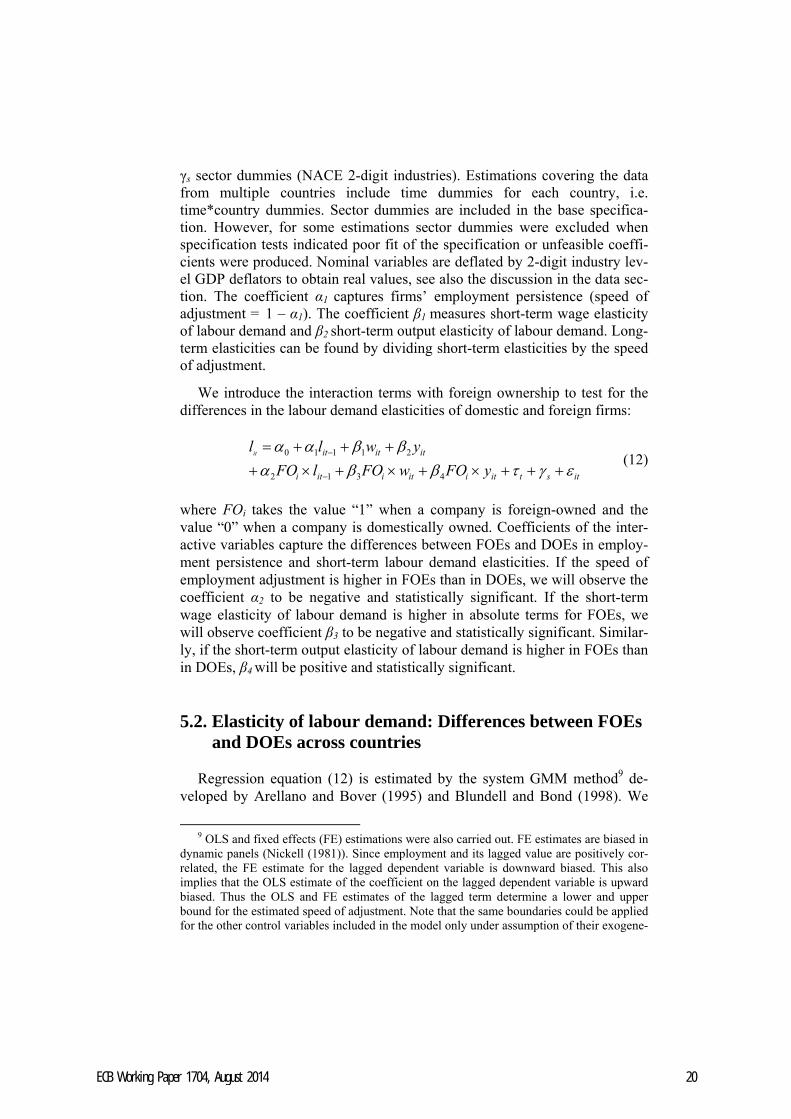
We introduce the interaction terms with foreign ownership to test for the differences in the labour demand elasticities of domestic and foreign firms:
itstitiitiiti
ititit
yFOwFOlFO
ywllit
4312
21110 (12)
where FOi takes the value “1” when a company is foreign-owned and the value “0” when a company is domestically owned. Coefficients of the inter-active variables capture the differences between FOEs and DOEs in employ-ment persistence and short-term labour demand elasticities. If the speed of employment adjustment is higher in FOEs than in DOEs, we will observe the coefficient α2 to be negative and statistically significant. If the short-term wage elasticity of labour demand is higher in absolute terms for FOEs, we will observe coefficient β3 to be negative and statistically significant. Similar-ly, if the short-term output elasticity of labour demand is higher in FOEs than in DOEs, β4 will be positive and statistically significant.
5.2. Elasticity of labour demand: Differences between FOEs
and DOEs across countries
Regression equation (12) is estimated by the system GMM method9 de-veloped by Arellano and Bover (1995) and Blundell and Bond (1998). We
9 OLS and fixed effects (FE) estimations were also carried out. FE estimates are biased in
dynamic panels (Nickell (1981)). Since employment and its lagged value are positively cor-related, the FE estimate for the lagged dependent variable is downward biased. This also implies that the OLS estimate of the coefficient on the lagged dependent variable is upward biased. Thus the OLS and FE estimates of the lagged term determine a lower and upper bound for the estimated speed of adjustment. Note that the same boundaries could be applied for the other control variables included in the model only under assumption of their exogene-
ECB Working Paper 1704, August 2014 20
employ a two-step system GMM estimation with Windmeijer-corrected standard errors.10 The lagged employment and real turnover are treated as endogenous variables in the model; real wages are treated as endogenous, pre-determined or exogeneous dependent on the coefficients and specifica-tion tests. We choose the dynamic form of our labour demand equation and the set of instruments from the serial correlation tests (Arellano and Bond (1991)) and the Hansen test for overidentifying restrictions (Hansen (1982)). We imply Hansen’s test for overidentifying restrictions for testing the validi-ty of the joint set of instruments. As is usual for system GMM estimations, the overidentification tests tend to reject the null hypothesis of no overidenti-fication in large and heterogeneous samples. Arellano and Bond (1991) show that rejection takes place too often in the presence of heteroskedasticity. Our pooled sample of all countries is relatively large, which increases the proba-bility that the tests of overidentifying restrictions are subject to type I error. The tests for second-order serial correlation are also subject to the criticism that they are inclined to type I error in samples with large cross-sections rela-tive to the time dimension.
OLS and fixed effects (FE) estimations were also carried out to assess the sensitivity of the estimated coefficients to the various estimation techniques. The estimated coefficients for other explanatory variables (except for the lagged dependent variable) tend to be between the OLS and FE for wages and output, and are often larger than the OLS and FE for ownership-interacted wages and output. The endogeneity of wage and output against employment in DOEs and FOEs should be accounted for by the system GMM estimation as most of the Hansen tests applied to our regressions do not reject the null hypothesis of no overidentification of instruments.
Our first choice for the dynamic form is that specified in equation (12). If the specification tests described above reject the assumption of no second-order autocorrelation or the validity of instruments, or the coefficient of the lagged dependent variable does not lie within the brackets of fixed effects and OLS estimation, we use the specification where the second lag of the dependent variable is added to the RHS. Since the time dimension of the sample is 9 years at maximum, we include at most 2 lags of the dependent variable. If the specification tests and OLS and FE brackets are not satisfied for this dynamic form either, the third specification adds the first lag of wag-es and output to the RHS. As a result the applied dynamic form varies from country to country.
ity, which in our specification is not valid. See Bond (2002) for this discussion. Difference GMM is not used in this paper as employment, output and wages are highly persistent time-series and hence their levels provide weak instruments for differences.
10 We use the xtabond2 command for Stata, see Roodman (2009).
ECB Working Paper 1704, August 2014 21
We also experimented with various sets of instruments and could not find a common set of instruments that would have been suitable for all countries. The differences in dynamic form and the set of instruments arise from differ-ent properties of the time-series across countries, cross-country differences in the time-dimension and object-dimension of the panel, and possibly also from differences in the institutions that shape the endogeneity of the explana-tory variables.
We start out by estimating the labour demand relationship as specified in equation (12) separately for each country. Only firms with at least 5 consecu-tive observations for employment, wages and output, and without any gap in these series are included in the estimation sample. Firms that show yearly growth of 100% or more in employment, wages or output are excluded and taken as measurement error or merger/acquisition, which we cannot control for. There are 18 countries covered in this and the following sub-sections. The estimated effects for the interactive variables imply whether the elasticity of labour demand is different for FOEs and DOEs in each country. The esti-mated coefficients for specification (12) are presented in Tables 1 and 2 in Appendix C. Estimates for the interactive variables capturing the differences between short-term wage and output elasticities and speed of adjustment are insignificant for the majority of the countries covered. However, when the estimates indicate a faster speed of adjustment for foreign firms, it is always accompanied by greater (absolute) wage and output elasticity, while slower speeds come with lower elasticity. Consequently, all three indicators imply either greater or lower flexibility of labour adjustment for foreign firms.
Appendix C indicates that the speed of adjustment of foreign firms is sta-tistically significantly higher in manufacturing in Italy and Slovenia and in services in Portugal and Bulgaria. The opposite is found in manufacturing in France and services in the Netherlands. The estimated coefficients on FO*log(rwage) are statistically significantly negative (implying larger elas-ticity in absolute terms in FOE) for manufacturing in Belgium and Italy, whereas they are statistically significantly positive for services in Finland and the Netherlands. The short-term output elasticity of labour demand is statisti-cally significantly lower for foreign firms in manufacturing in France and in services in Finland and the Netherlands. Thus, country-by-country regres-sions do not yield conclusive results for the difference in labour demand be-tween domestic and foreign companies. Grouping countries together in the groups of Western Europe and Central and Eastern Europe as in the previous section does not reveal any differences in foreign or domestic firms either (see Table 4).
ECB Working Paper 1704, August 2014 22
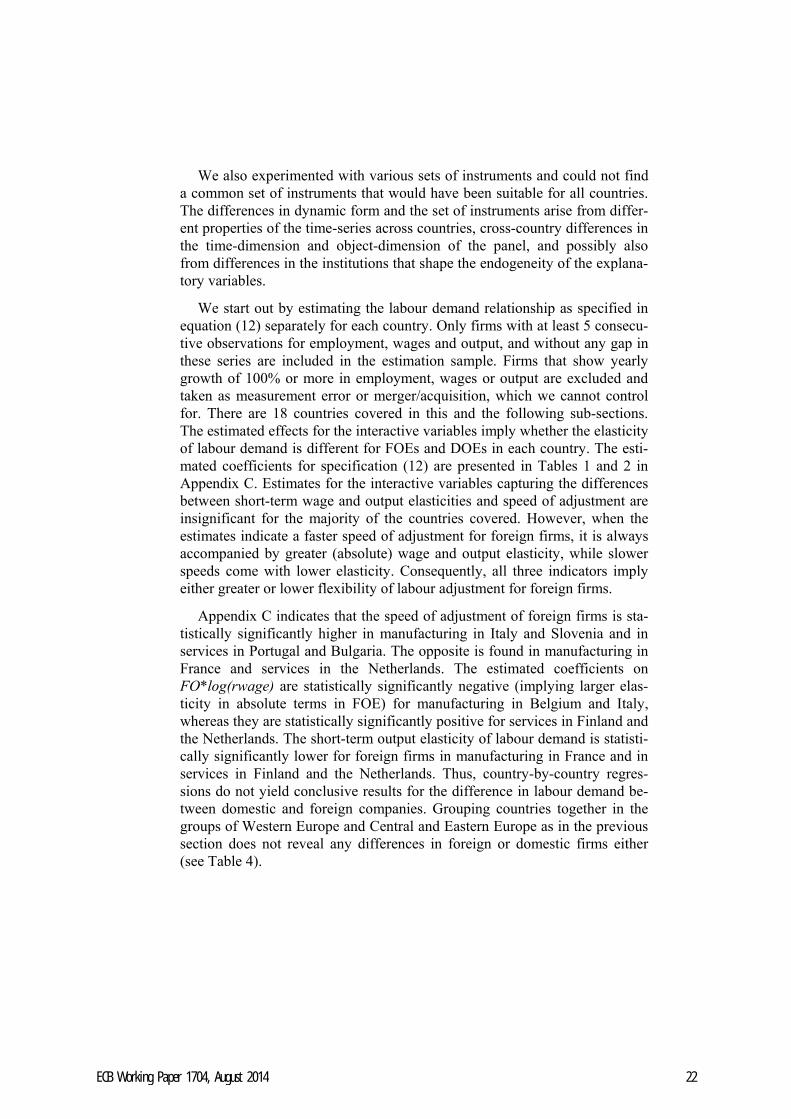
Table 4: Labour demand estimates of FOEs and DOEs, 2001–2009: country groups
Western Europe Central and Eastern Europe Manufacturing Services Manufacturing Services GMM SYS (3 .)
wage pre GMM SYS (3 5)
wage pre GMM-SYS (3 .)
wage pre GMM SYS (3 .)
wage ex L.log(empl) 0.853*** 0.611*** 0.856*** 0.737*** (0.081) (0.153) (0.101) (0.218) L2.log(empl) 0.011 (0.077) Log(rwage) −0.546*** −0.382*** −0.291** −0.675*** (0.085) (0.136) (0.125) (0.242) L.Log(rwage) 0.461*** (0.082) Log(rturn) 0.654*** 0.250** 0.274*** 0.504*** (0.064) (0.103) (0.087) (0.168) L.Log(rturn) −0.534*** (0.085) L.FO* log(empl) −0.073 0.207 −0.014 −0.082 (0.112) (0.134) (0.092) (0.265) L2.FO* log(empl) 0.087 (0.100) FO*log(rwage) 0.018 0.120 0.106 0.255 (0.072) (0.165) (0.102) (0.223) L. FO*log(rwage) −0.034 (0.073) FO*log(rturn) −0.001 −0.177 -0.067 −0.105 (0.066) (0.134) (0.078) (0.188) L. FO*log(rturn) 0.003 (0.055) Sector dummies yes yes yes yes Year*country dummies yes yes yes yes # of obs. 232058 718913 30648 58701 # of groups 41004 114224 4945 9721 Min obs. gr. 2 3 3 3 Mean obs. gr. 5.659 6.294 6.198 6.039 Max obs. gr. 7 8 8 8 # of instruments 211 188 182 158 Hansen p 0.123 0.441 0.601 0.555 AR(1) test −8.056 −3.144 −7.809 −2.958 AR(2) test 0.392 1.281 −1.192 −0.926 FDI in sample 0.187 0.158 0.416 0.334
Notes: System GMM estimations. Dependent variable: log(employment), 2001–2009. Two-step estimators with Windmeijer-corrected cluster robust standard errors in parentheses. Lagged employment and turnover are treated as endogenous; wages are treated as endoge-nous, pre-determined or exogenous dependent on specification tests. The range of lag lengths of GMM type instruments is reported at the top of each column in parentheses. “FO in the sample” refers to the share of foreign-owned companies. *, **, *** indicate statistical signif-icance at the 10%, 5% and 1% level of significance, respectively. See footnote no 6 for the list of host countries covered.
ECB Working Paper 1704, August 2014 23

There are even fewer statistically significant differences between domestic and foreign firms in long-run elasticities (see Appendix D). Long-run wage or turnover elasticity is found to be lower for foreign firms (in absolute val-ue) in services in Finland and Spain, and higher in services in Italy. The speed of adjustment is on average higher in services and long-run elasticities are higher in manufacturing, which is to be expected given the smaller firm size in services and the higher substitutability of labour in manufacturing. The results by country groups presented in Table 4 do not indicate any signif-icant differences between foreign and domestic firms in long-run elasticities either.
Overall we do not find similar conclusive results for foreign firms’ higher speed of adjustment to those found by Barba Navaretti et al. (2003). Howev-er, they used difference GMM for estimating the labour demand equations, which might be poorly identified due to weak instruments in estimations with highly persistent variables (see the discussion by Bond (2002)). Our results are in line with the findings of Buch and Lipponer (2010) and Hakkala et al. (2010), who find no statistically significant differences between the labour demand of foreign and domestic firms in Germany and Sweden. However, the results seem to be country-specific, as in some countries the differences between foreign and domestic firms are large and statistically significant. French and Spanish foreign firms, for example, seem to behave much more inelastically than their domestic counterparts, and it is worth noting that these countries have relatively strict employment protection legislation. The re-maining sections of the paper investigate whether the differences between domestic and foreign firms can be explained by the home and host country labour market institutions.
5.3. Elasticity of labour demand: Labour market
institutions
This section analyses whether labour market institutions could have an ef-fect on labour demand elasticities and whether institutions could explain the differences in elasticities of FOEs and DOEs. We separate the sample into domestically and foreign-owned firms and analyse how labour market institu-tions affect the elasticity of labour demand in the two groups. For this pur-pose, we introduce interaction terms with measures of labour market regula-tions to the labour demand equation and estimate the following specification on two subsamples, DOE and FOE:
itsctitctitctitct
ititit
yINSTwINSTlINST
ywllit
4312
21110 (13)
ECB Working Paper 1704, August 2014 24
where INSTct denotes the measure of labour market regulations in country c at time t and ηc denotes a set of country dummies.
We include two measures of labour market regulations in the regressions: union density, which is based on statistics from the OECD and ICTWSS da-tabase by Visser (2011), and the OECD’s employment protection legislation (EPL) index (Version 2 published in 2009).11 Appendix E presents the aver-age values of these measures for 2001–2009 across the countries covered and the USA. Despite significant differences in income and wage levels within Europe (see Appendix F), the strictness of employment protection legislation does not diverge much across European countries according to the OECD measure. The UK stands out with a low value for the EPL index, while Por-tugal and Spain have the highest EPL indices in Europe. The EPL index re-flects formal regulations. However, there is evidence that the actual labour market flexibility is higher in CEE due to weak enforcement of EPL (Eamets and Masso (2005)). To show a picture of the institutional differences in the home and host countries of MNEs, we present the weighted average measures of EPL and union density for the home countries of foreign subsid-iaries operating in each country in Appendix D.
We interpret both EPL and union density as proxies of labour market strictness. High union coverage is associated with more staggered employ-ment adjustments and should lead to less elastic labour demand. We include interactive country-year dummies in the regressions as additional controls for country-specific time trends capturing any other country-specific develop-ments that may affect the elasticity of labour demand.
We present the results separately for countries from Western Europe and those from Central and Eastern Europe as the enforcement of institutions could differ between these country groups and the overall cost of employ-ment adjustment is different due to the vast differences in wage costs (see Appendix E). EPL tends to be much more persistent over time than union coverage does during 2001–2009 in Europe. Union density measures exhibit more dynamism. The results (presented in Table 5 and 6) imply that more strictly regulated labour markets are associated with a lower speed of adjust-ment, lower wage elasticity for employment and lower output elasticity for employment among domestic firms, as could be expected. Union density de-clined in most countries and employment contracts become less strictly regu-lated in 2001-2009, although changes in EPL were less pronounced. Given these trends, the estimated coefficients imply that the reduction in the strict-
11 Our preferred measure of regulations related to collective bargaining would be union
coverage. However, this measure is often missing and only irregularly available for many of the countries that our dataset covers and therefore we use union density.
ECB Working Paper 1704, August 2014 25
ness of labour market regulations was associated with increasing elasticity of labour demand in 2001–2009.
Both of the measures we use (union density and EPL) yield similar results for domestic firms, since these two forms of labour market regulation tend to be complements: European countries that generally have more powerful un-ions also tend to have stricter EPL. (Please refer to the theoretical model de-veloped by Bertola and Rogerson (1997) for an explanation of why these two institutions should be complements.) It is worth noting that EPL has a statis-tically significant effect on domestic firms’ labour demand in WE, while un-ion density has a statistically significant effect on labour demand in the CEE countries. In Western European countries, our measure of union power (un-ion density) may yield insignificant results because it is not sufficiently cor-related with the actual coverage of collective bargaining. This is less of a problem in the CEE countries since union agreements are not typically ex-tended to non-union members, as is customary in several WE countries (such as France, Italy, and Spain), and therefore collective bargaining coverage and trade union membership have an almost one-to-one correspondence in CEE. On the other hand, the OECD’s EPL index may be a better measure of the actual strictness of labour regulations in WE than in CEE due to better en-forcement of labour regulations in WE. In conclusion, the insignificance of the estimated effects may stem from measurement errors in the indicators of the labour market institutions that we employ. When variables are measured with errors then the estimated effects tend to be biased towards zero.
The estimated results imply that a stricter regulatory environment is asso-ciated with less elastic labour demand for domestic firms. Surprisingly, the foreign firms’ reaction to host country institutions is different in WE and in CEE. While foreign firms in WE tend to behave even more elastically in the presence of stricter labour market institutions, foreign firms in CEE have less elastic labour demand in a stricter institutional environment. There is no good theoretical explanation for the estimated effects for WE. One possible expla-nation is that FDI in WE and CEE have different motivations and characters. Another explanation is that as the sample of foreign-owned companies in WE is dominated by companies hosted by the UK and originating from the US (see also Figure 1), the more inelastic US firms in the UK, with its relatively weak EPL, are distorting the relationship. If the UK is removed from the sample of foreign firms in WE, the statistically significantly negative effect of the host institutions disappears. This specific case illustrates the im-portance of also controlling for home country institutions in the estimations of host country effects, as we do in the following estimations (Tables 5 and 6).
ECB Working Paper 1704, August 2014 26

Table 5: Labour market institutions and the elasticity of labour demand, manufacturing 2001–2009, dependent variable: log(employment)
DOEs in WE
FOEs in WE
Host institutions Home institutions Ratio of host and home
institutions EPL (3 4)
wage pre UD (3 .) wage pre
EPL (3 .) wage pre
UD (3 .) wage pre
EPL (3 4) wage pre
UD (3 5) wage pre
EPL (3 5) UD (2 .) wage pre
L.lempl 0.621*** 0.947*** 0.759*** 0.855*** 0.792*** 0.740*** 0.828*** 0.842*** (0.154) (0.109) (0.117) (0.092) (0.109) (0.080) (0.072) (0.050)L2.lempl −0.018 (0.103) lrwage −0.637*** −0.507*** −0.229** −0.137** −0.174 −0.240*** −0.211*** −0.104** (0.184) (0.086) (0.103) (0.069) (0.131) (0.077) (0.062) (0.045) L.lrwage 0.334 0.410*** (0.232) (0.092) lrturn 0.626*** 0.590*** 0.211** 0.176** 0.163* 0.284*** 0.215*** 0.125*** (0.175) (0.090) (0.095) (0.069) (0.093) (0.056) (0.049) (0.029) L.lrturn −0.359* −0.512*** (0.213) (0.121) L.INST*lempl 0.121** −0.284 −0.004 −0.382*** −0.043 0.008 0.017 −0.002 (0.056) (0.183) (0.053) (0.141) (0.036) (0.064) (0.022) (0.006) L2.INST*lempl 0.056 (0.198) INST*lrwage 0.001 −0.183 −0.004 −0.296** −0.045 0.170* 0.057* −0.017 (0.069) (0.149) (0.054) (0.117) (0.054) (0.097) (0.031) (0.014) L.INST*lrwage 0.128 0.180 (0.087) (0.188) INST*lrturn 0.030 0.125 0.016 0.201* 0.039 −0.121* −0.041* 0.011 (0.060) (0.147) (0.048) (0.121) (0.042) (0.072) (0.023) (0.010) L.INST*lrturn −0.109 0.060 (0.080) (0.209) Sector dummies yes yes yes yes yes yes yes yes Year*country dummies
yes yes yes yes yes yes yes yes
# of obs. 222483 188720 51021 51021 49234 49460 49234 49460 # of gro~s 33395 33395 7609 7609 7346 7377 7346 7377 Min.. gr. 3 2 3 3 3 3 3 3 Mea.. gr. 6.662 5.651 6.705 6.705 6.702 6.705 6.702 6.705 Max.. gr. 8 7 8 8 8 8 8 8# of instr 167 209 212 212 168 188 204 256 Hansen p 0.597 0.897 0.063 0.031 0.225 0.285 0.442 0.214 AR(1) −13.578 −5.774 −9.316 −8.020 −5.520 −7.910 −9.707 −11.007 AR(2) 2.523 0.579 −1.915 −1.877 −1.457 −1.858 −1.876 −1.712 INST in sample 2.664 0.259 2.165 0.282 1.795 0.253 1.595 1.602
ECB Working Paper 1704, August 2014 27
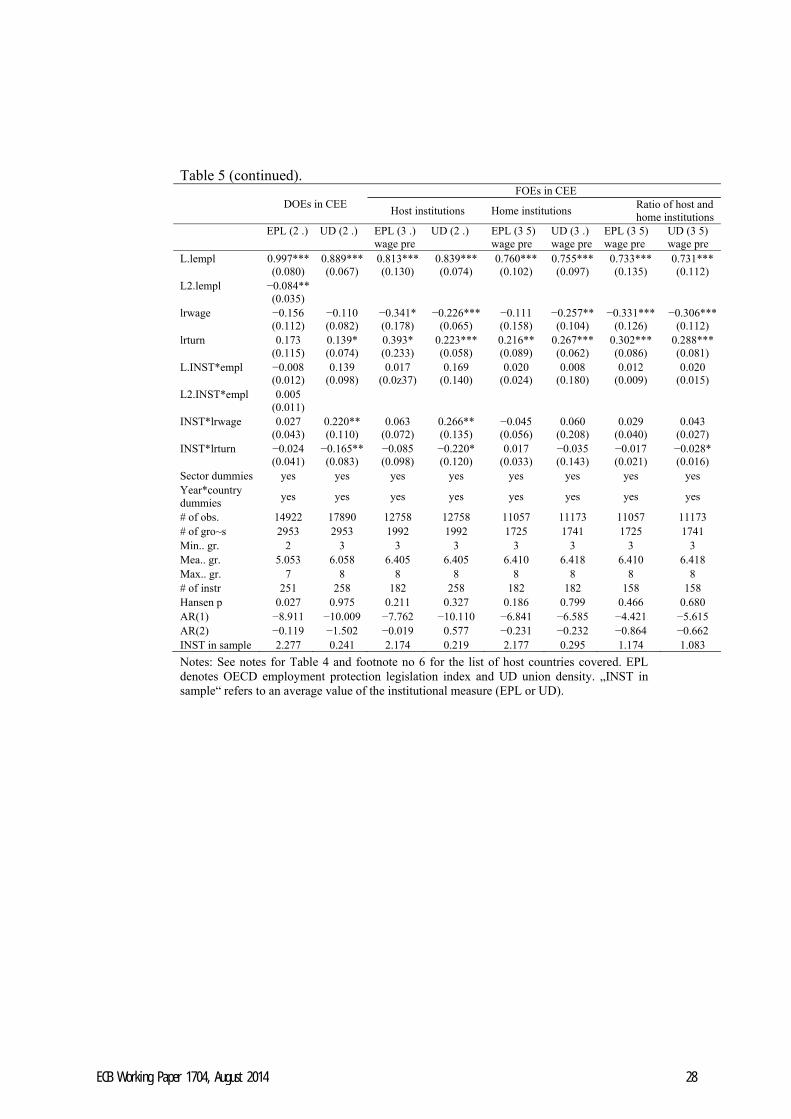
Table 5 (continued).
DOEs in CEE FOEs in CEE
Host institutions Home institutions
Ratio of host and home institutions
EPL (2 .) UD (2 .) EPL (3 .) wage pre
UD (2 .) EPL (3 5) wage pre
UD (3 .) wage pre
EPL (3 5) wage pre
UD (3 5) wage pre
L.lempl 0.997*** 0.889*** 0.813*** 0.839*** 0.760*** 0.755*** 0.733*** 0.731*** (0.080) (0.067) (0.130) (0.074) (0.102) (0.097) (0.135) (0.112) L2.lempl −0.084** (0.035) lrwage −0.156 −0.110 −0.341* −0.226*** −0.111 −0.257** −0.331*** −0.306*** (0.112) (0.082) (0.178) (0.065) (0.158) (0.104) (0.126) (0.112) lrturn 0.173 0.139* 0.393* 0.223*** 0.216** 0.267*** 0.302*** 0.288*** (0.115) (0.074) (0.233) (0.058) (0.089) (0.062) (0.086) (0.081) L.INST*empl −0.008 0.139 0.017 0.169 0.020 0.008 0.012 0.020 (0.012) (0.098) (0.0z37) (0.140) (0.024) (0.180) (0.009) (0.015) L2.INST*empl 0.005 (0.011) INST*lrwage 0.027 0.220** 0.063 0.266** −0.045 0.060 0.029 0.043 (0.043) (0.110) (0.072) (0.135) (0.056) (0.208) (0.040) (0.027)INST*lrturn −0.024 −0.165** −0.085 −0.220* 0.017 −0.035 −0.017 −0.028* (0.041) (0.083) (0.098) (0.120) (0.033) (0.143) (0.021) (0.016) Sector dummies yes yes yes yes yes yes yes yes Year*country dummies
yes yes yes yes yes yes yes yes
# of obs. 14922 17890 12758 12758 11057 11173 11057 11173 # of gro~s 2953 2953 1992 1992 1725 1741 1725 1741 Min.. gr. 2 3 3 3 3 3 3 3 Mea.. gr. 5.053 6.058 6.405 6.405 6.410 6.418 6.410 6.418 Max.. gr. 7 8 8 8 8 8 8 8# of instr 251 258 182 258 182 182 158 158 Hansen p 0.027 0.975 0.211 0.327 0.186 0.799 0.466 0.680 AR(1) −8.911 −10.009 −7.762 −10.110 −6.841 −6.585 −4.421 −5.615 AR(2) −0.119 −1.502 −0.019 0.577 −0.231 −0.232 −0.864 −0.662 INST in sample 2.277 0.241 2.174 0.219 2.177 0.295 1.174 1.083
Notes: See notes for Table 4 and footnote no 6 for the list of host countries covered. EPL denotes OECD employment protection legislation index and UD union density. „INST in sample“ refers to an average value of the institutional measure (EPL or UD).
ECB Working Paper 1704, August 2014 28
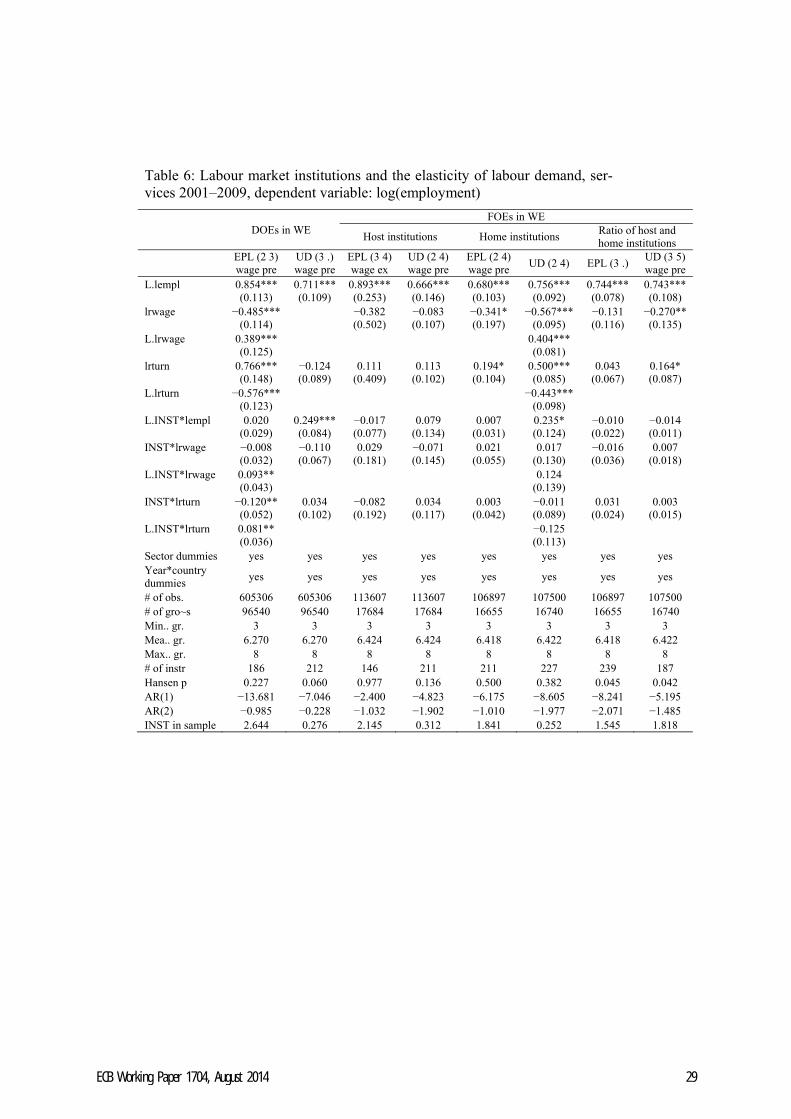
Table 6: Labour market institutions and the elasticity of labour demand, ser-vices 2001–2009, dependent variable: log(employment)
DOEs in WE
FOEs in WE
Host institutions Home institutions Ratio of host and home institutions
EPL (2 3) wage pre
UD (3 .) wage pre
EPL (3 4) wage ex
UD (2 4) wage pre
EPL (2 4) wage pre
UD (2 4) EPL (3 .) UD (3 5) wage pre
L.lempl 0.854*** 0.711*** 0.893*** 0.666*** 0.680*** 0.756*** 0.744*** 0.743*** (0.113) (0.109) (0.253) (0.146) (0.103) (0.092) (0.078) (0.108)lrwage −0.485*** −0.382 −0.083 −0.341* −0.567*** −0.131 −0.270** (0.114) (0.502) (0.107) (0.197) (0.095) (0.116) (0.135) L.lrwage 0.389*** 0.404*** (0.125) (0.081) lrturn 0.766*** −0.124 0.111 0.113 0.194* 0.500*** 0.043 0.164* (0.148) (0.089) (0.409) (0.102) (0.104) (0.085) (0.067) (0.087) L.lrturn −0.576*** −0.443*** (0.123) (0.098) L.INST*lempl 0.020 0.249*** −0.017 0.079 0.007 0.235* −0.010 −0.014 (0.029) (0.084) (0.077) (0.134) (0.031) (0.124) (0.022) (0.011)INST*lrwage −0.008 −0.110 0.029 −0.071 0.021 0.017 −0.016 0.007 (0.032) (0.067) (0.181) (0.145) (0.055) (0.130) (0.036) (0.018) L.INST*lrwage 0.093** 0.124 (0.043) (0.139) INST*lrturn −0.120** 0.034 −0.082 0.034 0.003 −0.011 0.031 0.003 (0.052) (0.102) (0.192) (0.117) (0.042) (0.089) (0.024) (0.015) L.INST*lrturn 0.081** −0.125 (0.036) (0.113) Sector dummies yes yes yes yes yes yes yes yes Year*country dummies
yes yes yes yes yes yes yes yes
# of obs. 605306 605306 113607 113607 106897 107500 106897 107500 # of gro~s 96540 96540 17684 17684 16655 16740 16655 16740 Min.. gr. 3 3 3 3 3 3 3 3 Mea.. gr. 6.270 6.270 6.424 6.424 6.418 6.422 6.418 6.422Max.. gr. 8 8 8 8 8 8 8 8 # of instr 186 212 146 211 211 227 239 187 Hansen p 0.227 0.060 0.977 0.136 0.500 0.382 0.045 0.042 AR(1) −13.681 −7.046 −2.400 −4.823 −6.175 −8.605 −8.241 −5.195 AR(2) −0.985 −0.228 −1.032 −1.902 −1.010 −1.977 −2.071 −1.485INST in sample 2.644 0.276 2.145 0.312 1.841 0.252 1.545 1.818
ECB Working Paper 1704, August 2014 29
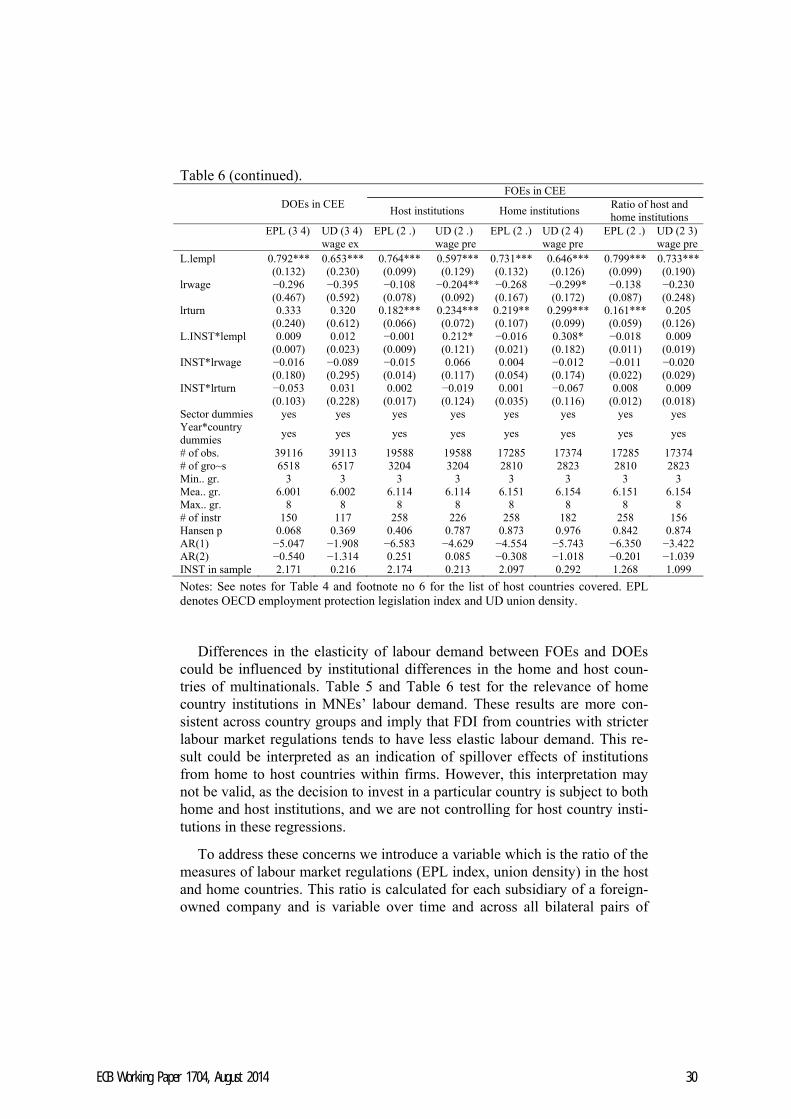
Table 6 (continued).
DOEs in CEE FOEs in CEE
Host institutions Home institutions
Ratio of host and home institutions
EPL (3 4) UD (3 4) wage ex
EPL (2 .) UD (2 .) wage pre
EPL (2 .) UD (2 4) wage pre
EPL (2 .) UD (2 3) wage pre
L.lempl 0.792*** 0.653*** 0.764*** 0.597*** 0.731*** 0.646*** 0.799*** 0.733*** (0.132) (0.230) (0.099) (0.129) (0.132) (0.126) (0.099) (0.190) lrwage −0.296 −0.395 −0.108 −0.204** −0.268 −0.299* −0.138 −0.230 (0.467) (0.592) (0.078) (0.092) (0.167) (0.172) (0.087) (0.248)lrturn 0.333 0.320 0.182*** 0.234*** 0.219** 0.299*** 0.161*** 0.205 (0.240) (0.612) (0.066) (0.072) (0.107) (0.099) (0.059) (0.126) L.INST*lempl 0.009 0.012 −0.001 0.212* −0.016 0.308* −0.018 0.009 (0.007) (0.023) (0.009) (0.121) (0.021) (0.182) (0.011) (0.019) INST*lrwage −0.016 −0.089 −0.015 0.066 0.004 −0.012 −0.011 −0.020 (0.180) (0.295) (0.014) (0.117) (0.054) (0.174) (0.022) (0.029) INST*lrturn −0.053 0.031 0.002 −0.019 0.001 −0.067 0.008 0.009 (0.103) (0.228) (0.017) (0.124) (0.035) (0.116) (0.012) (0.018) Sector dummies yes yes yes yes yes yes yes yes Year*country dummies
yes yes yes yes yes yes yes yes
# of obs. 39116 39113 19588 19588 17285 17374 17285 17374 # of gro~s 6518 6517 3204 3204 2810 2823 2810 2823 Min.. gr. 3 3 3 3 3 3 3 3 Mea.. gr. 6.001 6.002 6.114 6.114 6.151 6.154 6.151 6.154 Max.. gr. 8 8 8 8 8 8 8 8 # of instr 150 117 258 226 258 182 258 156 Hansen p 0.068 0.369 0.406 0.787 0.873 0.976 0.842 0.874 AR(1) −5.047 −1.908 −6.583 −4.629 −4.554 −5.743 −6.350 −3.422AR(2) −0.540 −1.314 0.251 0.085 −0.308 −1.018 −0.201 −1.039 INST in sample 2.171 0.216 2.174 0.213 2.097 0.292 1.268 1.099
Notes: See notes for Table 4 and footnote no 6 for the list of host countries covered. EPL denotes OECD employment protection legislation index and UD union density.
Differences in the elasticity of labour demand between FOEs and DOEs could be influenced by institutional differences in the home and host coun-tries of multinationals. Table 5 and Table 6 test for the relevance of home country institutions in MNEs’ labour demand. These results are more con-sistent across country groups and imply that FDI from countries with stricter labour market regulations tends to have less elastic labour demand. This re-sult could be interpreted as an indication of spillover effects of institutions from home to host countries within firms. However, this interpretation may not be valid, as the decision to invest in a particular country is subject to both home and host institutions, and we are not controlling for host country insti-tutions in these regressions.
To address these concerns we introduce a variable which is the ratio of the measures of labour market regulations (EPL index, union density) in the host and home countries. This ratio is calculated for each subsidiary of a foreign-owned company and is variable over time and across all bilateral pairs of
ECB Working Paper 1704, August 2014 30
home-host relationships. The decision to invest in a company in a particular country might be motivated by the difference in host and home institutions. Firms in countries with strict regulations might look for investments in coun-tries with weak regulations to reduce the costs of employment adjustment caused by demand volatility. Our results confirm this hypothesis; the institu-tional difference is statistically significant in manufacturing and the interac-tion terms indicate that the stricter the home country institutions are relative to those of the host country, the more elastic the labour demand is in the for-eign-owned subsidiary of an MNE in the host country compared to the de-mand of other MNEs. This regularity also holds in the opposite direction: the weaker the home country institutions are relative to those of the host country, the less elastic the labour demand of MNEs is as it is less costly for them to adjust for employment changes in their home country.
The relative distances between the measures of host and home country in-stitutions can explain only a small portion of the difference in labour demand elasticities between FOEs and DOEs. This result is at least partly caused by the use of measures which do not capture well the actual differences in insti-tutions. The OECD’s EPL index is based on formal legislation, which does not take account of the fact that law enforcement differs between countries. Labour market flexibility depends on norms and cultural attitudes in addition to formalised rules, and so the EPL index, which is a combination of different legislative procedures, is only a crude measure of the actual strictness of reg-ulations. Union density is also a poor measure for capturing variations in ac-tual union power across countries. Collective bargaining coverage would be a better measure but unfortunately the complete time series are not available for this variable for all the countries that our sample covers and so we could not use it.
The inclusion of country-level variables for the firm-level regression esti-mations together with the country-time interactions means that the effect of institutions could also be picked up by these dummies. In this context it is relevant that we can still observe statistically significant effects for institu-tions in addition to the country-specific time trends. However, because of the measurement problems discussed above, the variables that we employ have insufficient variation and do not capture the actual differences in labour mar-ket regulations to a full extent. Therefore we also carried out additional esti-mations which should capture the effect of institutions. These estimations, which are presented in the following section, can be considered as an addi-tional consistency check to the empirical findings described above.
ECB Working Paper 1704, August 2014 31
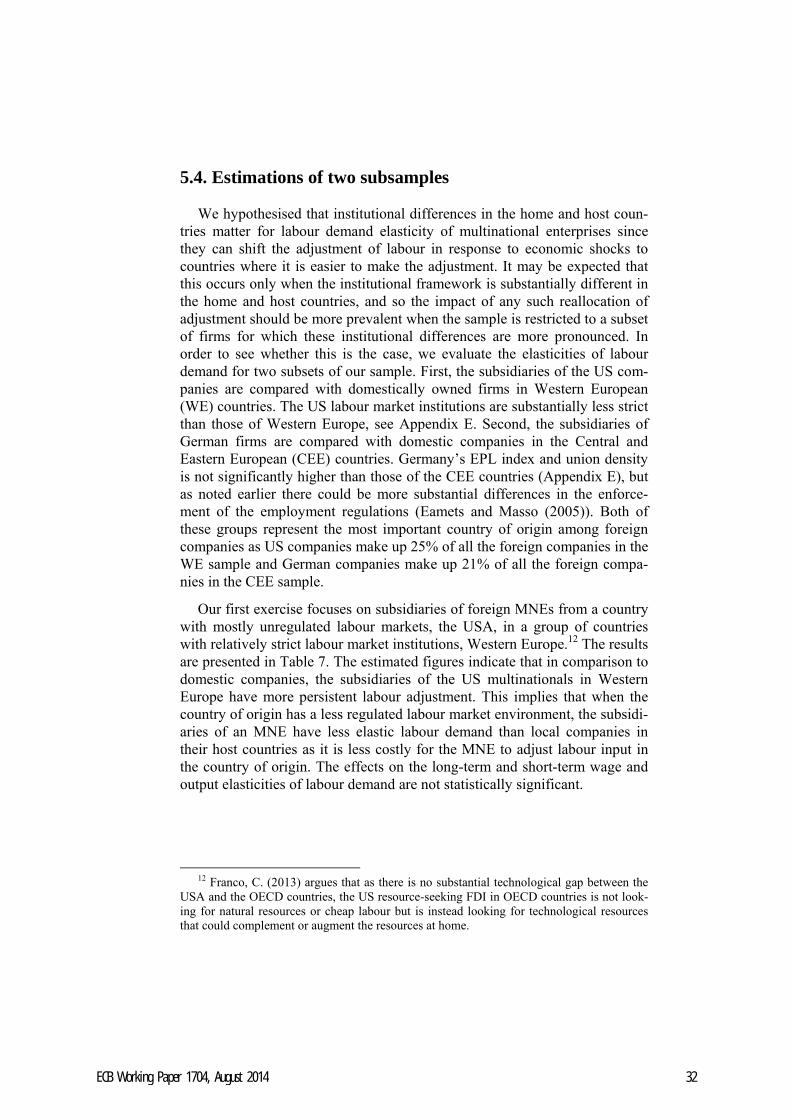
5.4. Estimations of two subsamples
We hypothesised that institutional differences in the home and host coun-tries matter for labour demand elasticity of multinational enterprises since they can shift the adjustment of labour in response to economic shocks to countries where it is easier to make the adjustment. It may be expected that this occurs only when the institutional framework is substantially different in the home and host countries, and so the impact of any such reallocation of adjustment should be more prevalent when the sample is restricted to a subset of firms for which these institutional differences are more pronounced. In order to see whether this is the case, we evaluate the elasticities of labour demand for two subsets of our sample. First, the subsidiaries of the US com-panies are compared with domestically owned firms in Western European (WE) countries. The US labour market institutions are substantially less strict than those of Western Europe, see Appendix E. Second, the subsidiaries of German firms are compared with domestic companies in the Central and Eastern European (CEE) countries. Germany’s EPL index and union density is not significantly higher than those of the CEE countries (Appendix E), but as noted earlier there could be more substantial differences in the enforce-ment of the employment regulations (Eamets and Masso (2005)). Both of these groups represent the most important country of origin among foreign companies as US companies make up 25% of all the foreign companies in the WE sample and German companies make up 21% of all the foreign compa-nies in the CEE sample.
Our first exercise focuses on subsidiaries of foreign MNEs from a country with mostly unregulated labour markets, the USA, in a group of countries with relatively strict labour market institutions, Western Europe.12 The results are presented in Table 7. The estimated figures indicate that in comparison to domestic companies, the subsidiaries of the US multinationals in Western Europe have more persistent labour adjustment. This implies that when the country of origin has a less regulated labour market environment, the subsidi-aries of an MNE have less elastic labour demand than local companies in their host countries as it is less costly for the MNE to adjust labour input in the country of origin. The effects on the long-term and short-term wage and output elasticities of labour demand are not statistically significant.
12 Franco, C. (2013) argues that as there is no substantial technological gap between the
USA and the OECD countries, the US resource-seeking FDI in OECD countries is not look-ing for natural resources or cheap labour but is instead looking for technological resources that could complement or augment the resources at home.
ECB Working Paper 1704, August 2014 32
Table 7: Labour market institutions: Estimations for two subsamples, 2001–2009, dependent variable: log(employment)
Notes: See notes for Table 5.
In the second case, we assess the differences in labour demand elasticities between the subsidiaries of German firms in CEE countries and domestically owned firms. The results are in accordance with our hypothesis in this sub-sample as well. The speed of adjustment is substantially higher in the subsid-iaries of German-owned firms than in the local companies in CEE. This sug-gests that foreign subsidiaries originating from home countries with a rela-tively strict institutional environment have a substantially higher speed of adjustment than domestic companies as it is more costly for the MNEs to adjust labour inputs in their home country. The effects on the long-term and short-term wage and output elasticities of labour demand are not statistically significant.
US FDI to Western Europe German FDI to Central and Eastern Europe
Manufacturing (lag 2 2) wage
pre
Services lag(3 4) wage
pre
Manufacturing (lag 3 5) wage
pre
Services (lag 3 5) wage pre
L.lempl 0.639*** 0.580* 0.942*** 0.897*** (0.073) (0.306) (0.110) (0.177) lrwage −0.161* −0.487 −0.178 −0.423** (0.090) (0.441) (0.134) (0.183) lrturn 0.252*** 0.435 0.159 0.309** (0.063) (0.291) (0.108) (0.132) L.fdiempl 0.221* 0.125 −0.406** −0.432** (0.132) (0.206) (0.186) (0.200) fdiwage 0.028 0.271 −0.195 −0.043 (0.105) (0.344) (0.162) (0.199) fditurn −0.067 −0.257 0.230 0.150 (0.089) (0.266) (0.141) (0.151) Sector dummies yes yes yes yes Year*country dummies yes yes yes yes # of obs. 235078 629588 20759 42903 # of gro~s 35243 100318 3398 7130 Min.. gr. 3 3 3 3 Mea.. gr. 6.670 6.276 6.109 6.017 Max.. gr. 8 8 8 8 # of instr 153 168 158 158 Hansen p 0.021 0.884 0.772 0.416 AR(1) −9.252 −2.075 −7.348 −5.025 AR(2) 1.102 −0.578 −1.737 −1.797 Share of FO in sample 0.054 0.039 0.138 0.088
ECB Working Paper 1704, August 2014 33
6. Conclusion The purpose of the current study is to analyse how employment volatility
differs in companies with foreign and domestic owners. Our analysis is based on an Amadeus firm-level dataset which covers more than 20 European countries. We derive employment volatility on the basis of standard labour supply and demand functions and demonstrate that it can be expressed as a combination of two components. The first component captures volatility due to changes in labour demand elasticity. Given a non-zero elasticity of labour supply, the elasticity of labour demand is positively related with employment volatility. The second component captures volatility in employment due to economic shocks. The more exposed a firm is to external shocks, the higher its employment volatility is. This decomposition indicates that the presence of foreign-owned companies may lead to higher employment volatility be-cause FOEs react more sensitively to wage changes in the host country or because they are more tightly integrated in international markets and are per se more exposed to external shocks.
The estimations of conditional volatility based on propensity score match-ing yield the result that employment tends to be more volatile in the subsidi-aries of foreign-owned MNEs than in domestically owned firms. However, larger volatility in foreign-owned enterprises is not unanimously caused by their more elastic labour demand. Our estimations imply that labour demand can be either more or less elastic in subsidiaries of foreign-owned multina-tionals, depending on the institutional environments of their home and host countries. When FDI originates from a region with a more flexible institu-tional environment (e.g. from the USA to Western European countries) then the elasticity of labour demand is smaller in absolute value in FOEs than in DOEs. In the opposite case (e.g. when FDI is originating from Germany to CEE countries) the elasticity of labour demand is higher.
A potential explanation for this finding is that in countries with rigid la-bour market regulations, multinational companies avoid changing domestic employment in response to economic shocks and instead use other margins of adjustment. They are more likely to do this than domestic firms are since it is easier for multinational companies to substitute between factor inputs. In addition to adjusting via alternative margins, they may also shift the adjust-ment of labour in response to economic shocks to subsidiaries which are lo-cated in countries with less regulated labour markets. Alternatively, multina-tional firms may choose the host countries where they establish subsidiaries by looking at the labour market institutions: if they operate in sectors that have highly volatile demand then they are more likely to move to countries with a flexible institutional environment. In either case, the presence of for-eign-owned firms would have an amplifying effect on the elasticity of labour
ECB Working Paper 1704, August 2014 34
demand in countries with flexible labour market institutions, whereas it would have a dampening effect in countries with rigid institutions.
Due to the limitations of the Amadeus data we can only study labour ad-justment via the intensive margin, i.e by assessing changes in employment in incumbent companies. Employment may also be more volatile in foreign-owned multinationals than in domestically owned firms as they are more likely to establish and close down subsidiaries. The second of these two mar-gins has been tested in the empirical literature and it has mostly been con-firmed that FOEs are more “footloose”, i.e. they have higher conditional exit rates, than DOEs (e.g. Bernard and Sjöholm (2003); Görg and Strobl (2003) Alvarez and Görg (2009); Wagner and Weche Gelübke (2011)). Investigation of the role that labour market institutions play in the entry and exit decisions of foreign multinationals would be an interesting area for further research that would complement the findings of the current study.
ECB Working Paper 1704, August 2014 35
References
ALVAREZ, R. AND GÖRG, H. (2009): “Multinationals and plant exit: Evi-dence from Chile”, International Review of Economics and Finance, Vol. 18, pp. 45–51.
ARELLANO, M. AND BOND, S. R. (1991): “Some Tests of Specification for Panel Data: Monte Carlo Evidence and an Application to Em-ployment Equations”, The Review of Economic Studies, Vol. 58, pp. 277–297.
ARELLANO, M. AND BOVER, O. (1995): “Another look at the instrumen-tal variable estimation of error-components models”, Journal of Econometrics, Vol. 68, pp. 29–51.
BARBA NAVARETTI, G.; TURRINI, A. AND CHECCHI, D. (2003): “Ad-justing Labour Demand: Multinational versus National Firms: A Cross-European Analysis”, Journal of the European Economic Asso-ciation, April–May 1(2–3), pp. 708 –719.
BARBA NAVARETTI, G. AND VENABLES, A. J. (2004): Multinational Firms in the World Economy, Princeton University Press.
BERGIN, P. R.; FEENSTRA, R. C. AND HANSON, G. H. (2009): “Off-shoring and Volatility: Evidence from Mexico's Maquiladora Indus-try”, The American Economic Review, Vol. 99, pp. 1664–1671.
BERNARD, A. B. AND SJÖHOLM, F. (2003): “Foreign Owners and Plant Survival”, NBER Working Paper Series, Working Paper No. 10039.
BERTOLA, G. AND ROGERSON, R. (1997): “Institutions and labor reallo-cation”, European Economic Review, Vol 41 (6), pp. 1147–1171.
BHAGWATI, J. (1996): A New Epoch?, unpublished book review, Columbia University
BLUNDELL, R. W. AND BOND, S. R. (1998): “Initial conditions and mo-ment restrictions in dynamic panel datamodels”, Journal of Econo-metrics, Vol. 87, pp. 115–143.
BOND, S. R. (2002): “Dynamic panel data models: a guide to micro data methods and practice”, Portuguese Economic Journal, Vol. 1, pp. 141–162.
BORENSZTEIN, E.; DE GREGORIO, J. AND LEE, J.-W. (1998): “How does foreign direct investment affect economic growth?”, Journal of International Economics, Vol. 45(1), pp. 115–135.
BUCH, C., M. AND LIPPONER, A. (2010): “Volatile multinationals? Evi-dence from the labor demand of German firms”, Labour Economics, Vol. 17, pp. 345–353.
ECB Working Paper 1704, August 2014 36
BUCH, C. AND SCHLOTTER, M. (2013): “Regional Origins of Employ-ment Volatility: Evidence from German states”, Empirica, Vol. 40, pp. 1–19.
CALIENDO, M. AND KOPEINIG, S. (2008): “Some practical guidance for the implementation of propensity score matching”, Journal of Eco-nomic Surveys, Vol. 22(1), pp. 31–72.
CUNAT, A. AND MELITZ, M., J. (2012): “Volatility, Labour Market Flexi-bility, and the Pattern of Comparative Advantage”, Journal of the Eu-ropean Economic Association, Vol. 10(2), pp. 225–254.
EAMETS, R. AND MASSO, J. (2005): “The Paradox of the Baltic States: Labour Market Flexibility but Protected Workers?”, European Jour-nal of Industrial Relations, Vol 11(1), pp. 71–90.
FABBRI, F.; SLAUGHTER, J., E. AND HASKEL, M., J. (2003): “Does Nationality of Ownership Matter for Labor Demands?”, Journal of the European Economic Association, Vol. 1, pp. 698–707.
FRANCO, C. (2013): “Exports and FDI motivations: Empirical evidence from U.S. foreign subsidiaries”, International Business Review, Vol. 22, pp. 47–62.
GAZES, S. AND NESPOROVA, A. (2004): “Labour markets in transition: balancing flexibility and security in Central and Eastern Europe”, Revue de l'OFCE, Vol. 91(5), pp. 23–54.
GEISHECKER, I.; RIEDL, M. AND FRIJTERS, P. (2012): “Offshoring and job loss fears: An econometric analysis of individual perceptions”, Labour Economics, Vol. 19(5), pp. 738–747.
GÖRG, H.; HENRY, M.; STROBL, E. AND WALSH, F. (2009): “Multina-tional companies, backward linkages, and labour demand elasticities”, Canadian Journal of Economics, Vol. 42, pp. 332–348.
GÖRG, H. AND STROBL, E. (2003): ““Footloose” multinationals”, The Manchester School, Vol. 71, pp. 1–19.
HAKKALA, K. N.; HEYMAN, F. AND SJÖHOLM, F. (2010): “Multina-tionals, skills, and wage elasticities”, Review of World Economics, Vol. 146, pp. 263–280.
HAMERMESH, D., S. (1993): Labor Demand. Princeton University Press.
HIJZEN, A. AND SWAIM P. (2010): “Offshoring, labour market institutions and the elasticity of labour demand”, European Economic Review, Vol. 54, pp. 1016–1034.
HANSEN, L., P. (1982): “Large Sample Properties of Generalized Method of Moments Estimators”, Econometrica, Vol. 50, pp. 1029–1054.
LEUVEN, E. AND SIANESI, B. (2003): “PSMATCH2: Stata module to perform full Mahalanobis and propensity score matching, common
ECB Working Paper 1704, August 2014 37

support graphing, and covariate imbalance testing”, [http://ideas.repec.org/c/boc/bocode/s432001.html].
LEVASSEUR, S. (2010): “International outsourcing over the business cycle: some intuition for Germany, the Czech Republic and Slovakia”, East-ern Journal of European Studies, Vol.1, pp. 165–185.
NICKELL, S. (1981): “Biases in Dynamic Models with Fixed Effects”, Econometrica, Vol. 49, pp. 1417–1426.
OECD (2007): Offshoring and Employment: Trends and Impacts, OECD Publishing: 2007, 220 p.
RODRIK, D. (1997): Has globalization gone too far?, Washington, DC: In-stitute for International Economics, 128 p.
ROODMAN, D. (2009): “How to do xtabond2: An introduction to difference and system GMM in Stata”, The Stata Journal, Vol. 9(1), pp. 86–136.
SCHEVE, K. AND SLAUGHTER, M. J. (2004): “Economic Insecurity and the Globalization of Production”, American Journal of Political Sci-ence, Vol. 48( 4), pp. 662–674.
SLAUGHTER, M., J. (2001): “International trade and labor–demand elastici-ties”, Journal of International Economics, Vol. 54, pp. 27–56.
VISSER, J. (2011): “Data Base on Institutional Characteristics of Trade Un-ions, Wage Setting, State Intervention and Social Pacts, 1960–2010 (ICTWSS)”, Amsterdam Institute for Advanced Labour Studies (AIAS), [http://www.uva-aias.net/208].
WAGNER, J. AND WECHE GELÜBKE, J., P. (2011): “Foreign Ownership and Firm Survival: First Evidence for Enterprises in Germany”, IZA Discussion Paper Series, Discussion Paper No. 6207.
ECB Working Paper 1704, August 2014 38
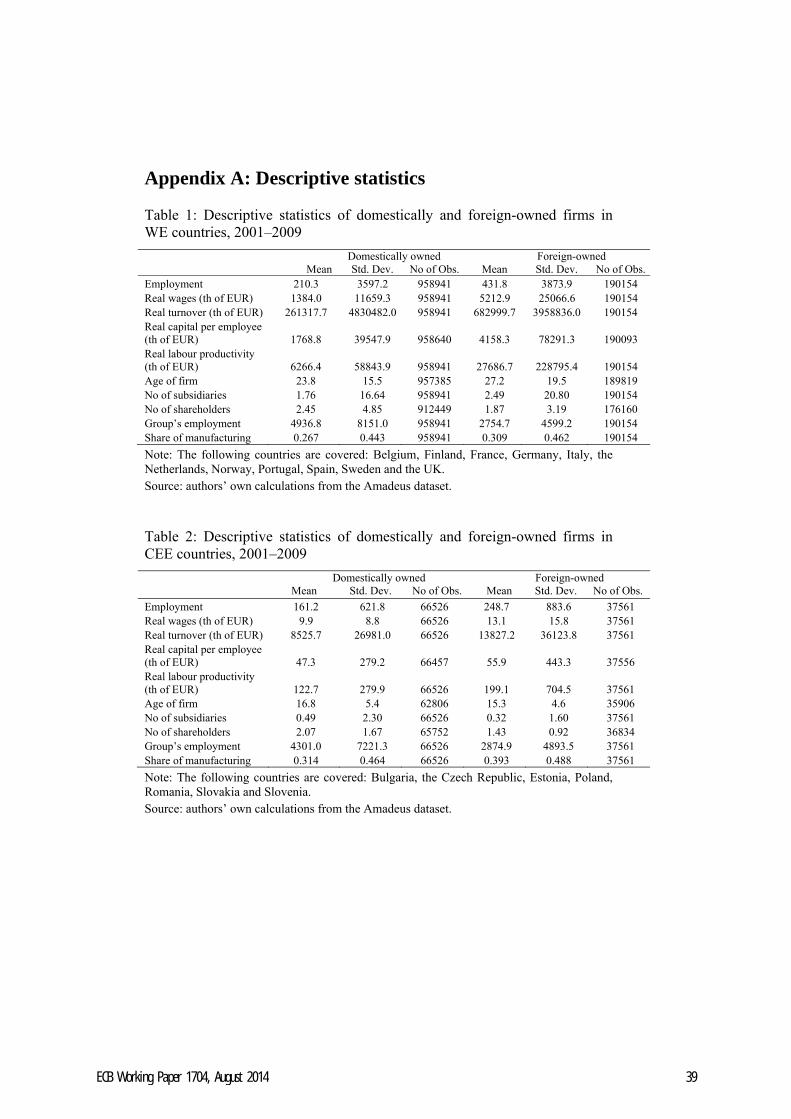
Appendix A: Descriptive statistics Table 1: Descriptive statistics of domestically and foreign-owned firms in WE countries, 2001–2009
Domestically owned Foreign-owned Mean Std. Dev. No of Obs. Mean Std. Dev. No of Obs.Employment 210.3 3597.2 958941 431.8 3873.9 190154 Real wages (th of EUR) 1384.0 11659.3 958941 5212.9 25066.6 190154 Real turnover (th of EUR) 261317.7 4830482.0 958941 682999.7 3958836.0 190154 Real capital per employee (th of EUR) 1768.8 39547.9 958640 4158.3 78291.3 190093 Real labour productivity (th of EUR) 6266.4 58843.9 958941 27686.7 228795.4 190154 Age of firm 23.8 15.5 957385 27.2 19.5 189819 No of subsidiaries 1.76 16.64 958941 2.49 20.80 190154 No of shareholders 2.45 4.85 912449 1.87 3.19 176160 Group’s employment 4936.8 8151.0 958941 2754.7 4599.2 190154 Share of manufacturing 0.267 0.443 958941 0.309 0.462 190154
Note: The following countries are covered: Belgium, Finland, France, Germany, Italy, the Netherlands, Norway, Portugal, Spain, Sweden and the UK. Source: authors’ own calculations from the Amadeus dataset. Table 2: Descriptive statistics of domestically and foreign-owned firms in CEE countries, 2001–2009
Domestically owned Foreign-owned Mean Std. Dev. No of Obs. Mean Std. Dev. No of Obs.
Employment 161.2 621.8 66526 248.7 883.6 37561 Real wages (th of EUR) 9.9 8.8 66526 13.1 15.8 37561 Real turnover (th of EUR) 8525.7 26981.0 66526 13827.2 36123.8 37561 Real capital per employee (th of EUR) 47.3 279.2 66457 55.9 443.3 37556 Real labour productivity (th of EUR) 122.7 279.9 66526 199.1 704.5 37561 Age of firm 16.8 5.4 62806 15.3 4.6 35906 No of subsidiaries 0.49 2.30 66526 0.32 1.60 37561 No of shareholders 2.07 1.67 65752 1.43 0.92 36834 Group’s employment 4301.0 7221.3 66526 2874.9 4893.5 37561 Share of manufacturing 0.314 0.464 66526 0.393 0.488 37561
Note: The following countries are covered: Bulgaria, the Czech Republic, Estonia, Poland, Romania, Slovakia and Slovenia. Source: authors’ own calculations from the Amadeus dataset.
ECB Working Paper 1704, August 2014 39
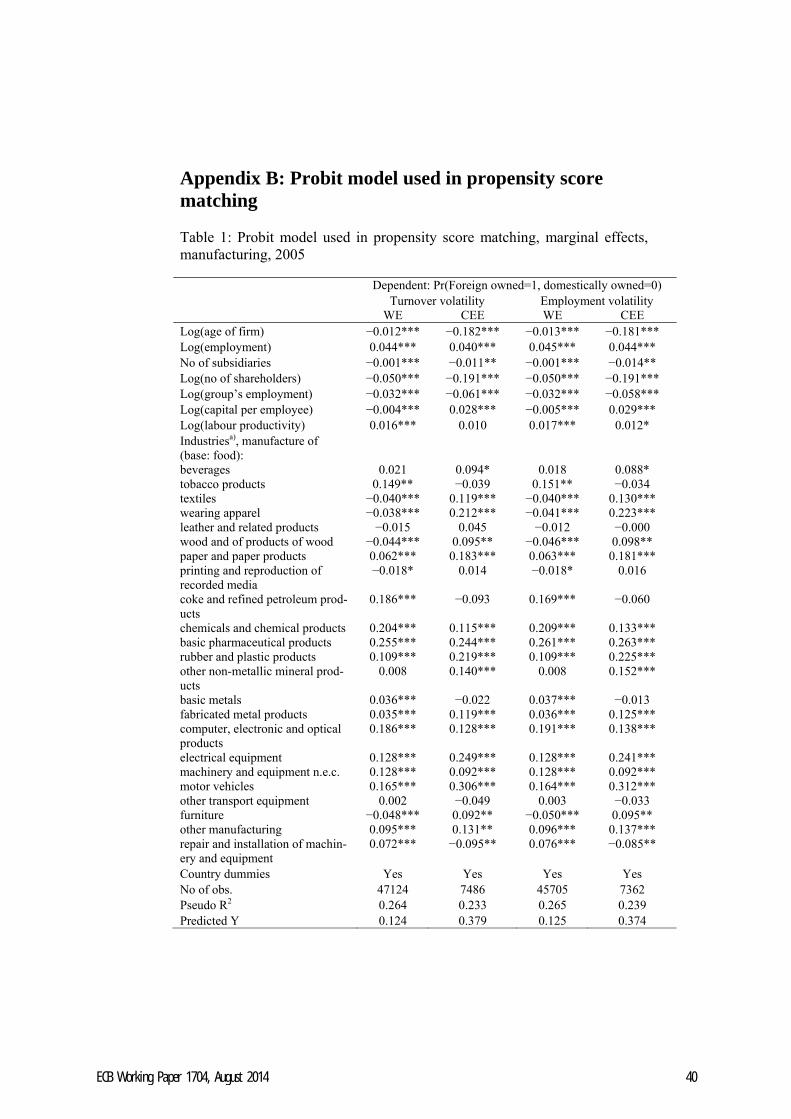
Appendix B: Probit model used in propensity score matching Table 1: Probit model used in propensity score matching, marginal effects, manufacturing, 2005 Dependent: Pr(Foreign owned=1, domestically owned=0) Turnover volatility Employment volatility WE CEE WE CEE Log(age of firm) −0.012*** −0.182*** −0.013*** −0.181*** Log(employment) 0.044*** 0.040*** 0.045*** 0.044*** No of subsidiaries −0.001*** −0.011** −0.001*** −0.014** Log(no of shareholders) −0.050*** −0.191*** −0.050*** −0.191*** Log(group’s employment) −0.032*** −0.061*** −0.032*** −0.058*** Log(capital per employee) −0.004*** 0.028*** −0.005*** 0.029*** Log(labour productivity) 0.016*** 0.010 0.017*** 0.012* Industriesa), manufacture of (base: food):
beverages 0.021 0.094* 0.018 0.088* tobacco products 0.149** −0.039 0.151** −0.034 textiles −0.040*** 0.119*** −0.040*** 0.130*** wearing apparel −0.038*** 0.212*** −0.041*** 0.223*** leather and related products −0.015 0.045 −0.012 −0.000 wood and of products of wood −0.044*** 0.095** −0.046*** 0.098** paper and paper products 0.062*** 0.183*** 0.063*** 0.181*** printing and reproduction of recorded media
−0.018* 0.014 −0.018* 0.016
coke and refined petroleum prod-ucts
0.186*** −0.093 0.169*** −0.060
chemicals and chemical products 0.204*** 0.115*** 0.209*** 0.133*** basic pharmaceutical products 0.255*** 0.244*** 0.261*** 0.263*** rubber and plastic products 0.109*** 0.219*** 0.109*** 0.225*** other non-metallic mineral prod-ucts
0.008 0.140*** 0.008 0.152***
basic metals 0.036*** −0.022 0.037*** −0.013 fabricated metal products 0.035*** 0.119*** 0.036*** 0.125*** computer, electronic and optical products
0.186*** 0.128*** 0.191*** 0.138***
electrical equipment 0.128*** 0.249*** 0.128*** 0.241*** machinery and equipment n.e.c. 0.128*** 0.092*** 0.128*** 0.092*** motor vehicles 0.165*** 0.306*** 0.164*** 0.312*** other transport equipment 0.002 −0.049 0.003 −0.033 furniture −0.048*** 0.092** −0.050*** 0.095** other manufacturing 0.095*** 0.131** 0.096*** 0.137*** repair and installation of machin-ery and equipment
0.072*** −0.095** 0.076*** −0.085**
Country dummies Yes Yes Yes Yes No of obs. 47124 7486 45705 7362Pseudo R2 0.264 0.233 0.265 0.239 Predicted Y 0.124 0.379 0.125 0.374
ECB Working Paper 1704, August 2014 40
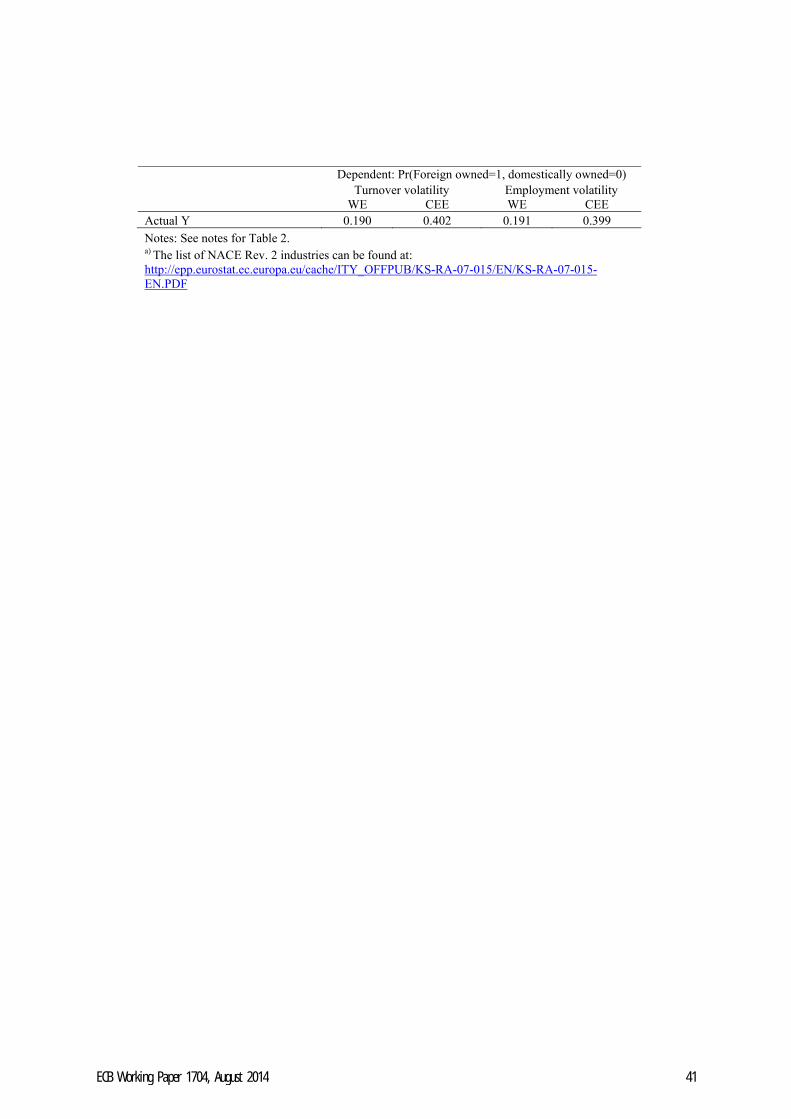
Dependent: Pr(Foreign owned=1, domestically owned=0) Turnover volatility Employment volatility WE CEE WE CEE Actual Y 0.190 0.402 0.191 0.399
Notes: See notes for Table 2. a) The list of NACE Rev. 2 industries can be found at: http://epp.eurostat.ec.europa.eu/cache/ITY_OFFPUB/KS-RA-07-015/EN/KS-RA-07-015-EN.PDF
ECB Working Paper 1704, August 2014 41

Table 2: Probit model used in propensity score matching, marginal effects, services, 2005
Dependent: Pr(Foreign owned=1, domestically owned=0) Turnover volatility Employment volatility WE CEE WE CEE Log(age of firm) −0.013*** −0.121*** −0.014*** −0.120*** Log(employment) 0.020*** 0.022*** 0.021*** 0.025*** No of subsidiaries −0.000*** 0.002 −0.000*** −0.000 Log(no of shareholders) −0.034*** −0.157*** −0.033*** −0.160*** Log(group’s employment) −0.017*** −0.030*** −0.017*** −0.028*** Log(capital per employee) −0.005*** −0.007*** −0.005*** −0.007**Log(labour productivity) 0.011*** 0.036*** 0.012*** 0.039*** Industriesa), (base: Electricity, gas, steam):
Water collection, treatment and supply
0.031* −0.202*** 0.038* −0.187***
Sewerage −0.026 −0.231*** −0.026 −0.218*** Waste collection, treatment and disposal
−0.049*** −0.031 −0.048*** −0.011
Remediation activities and other waste management
−0.065*** −0.121 −0.066*** −0.099
Construction of buildings −0.058*** −0.057* −0.060*** −0.041 Civil engineering −0.048*** −0.090*** −0.049*** −0.072** Specialised construction activities −0.056*** −0.060* −0.056*** −0.045 Wholesale and retail trade and repair of motor vehicles
−0.029*** 0.002 −0.029*** 0.024
Wholesale trade, except of motor vehicles
0.088*** 0.172*** 0.088*** 0.192***
Retail trade, except of motor vehicles −0.042*** 0.075** −0.041*** 0.095*** Land transport and transport via pipelines
−0.030*** −0.044 −0.029*** −0.035
Water transport 0.025* 0.024 0.028* 0.049 Air transport −0.027** −0.005 −0.028** 0.032 Warehousing and support activities for transportation
0.043*** 0.125*** 0.044*** 0.146***
Postal and courier activities −0.027* 0.207 −0.022 0.203 Accommodation −0.004 −0.052 −0.002 −0.047 Food and beverage service activities −0.050*** −0.033 −0.049*** −0.017Publishing activities 0.009 0.149*** 0.009 0.166*** Motion picture, video and television programme production
0.018 0.166** 0.021 0.211**
Programming and broadcasting activities
−0.015 −0.022 −0.013 0.008
Telecommunications 0.064*** 0.231*** 0.071*** 0.226*** Computer programming, consultancy and related activities
0.093*** 0.217*** 0.098*** 0.247***
Information service activities 0.033** 0.047 0.035** 0.101 Financial service activities, except insurance and pension funding
0.104*** 0.309*** 0.110*** 0.349***
Activities auxiliary to financial ser-vices and insurance activities
0.056*** 0.163*** 0.057*** 0.214***
Real estate activities 0.006 0.055 0.009 0.063* Legal and accounting activities −0.027*** 0.113* −0.021** 0.146**
ECB Working Paper 1704, August 2014 42
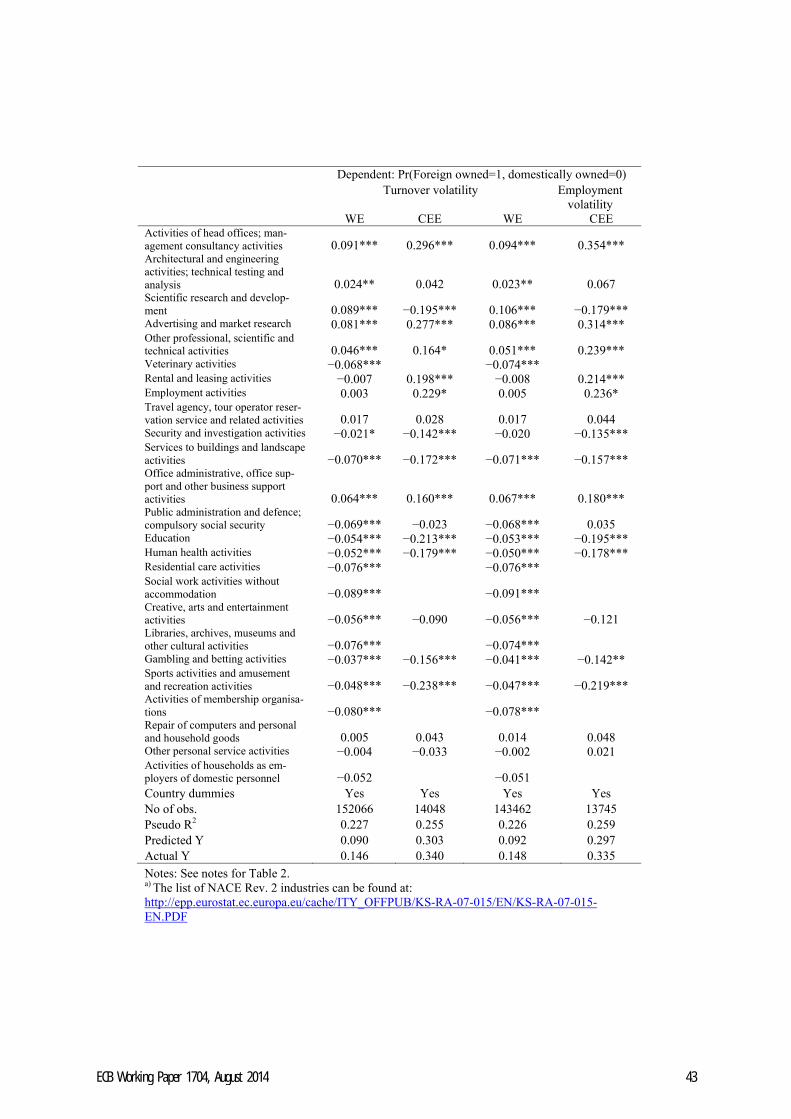
Dependent: Pr(Foreign owned=1, domestically owned=0) Turnover volatility Employment
volatility WE CEE WE CEE Activities of head offices; man-agement consultancy activities 0.091*** 0.296*** 0.094*** 0.354*** Architectural and engineering activities; technical testing and analysis 0.024** 0.042 0.023** 0.067 Scientific research and develop-ment 0.089*** −0.195*** 0.106*** −0.179*** Advertising and market research 0.081*** 0.277*** 0.086*** 0.314*** Other professional, scientific and technical activities 0.046*** 0.164* 0.051*** 0.239*** Veterinary activities −0.068*** −0.074*** Rental and leasing activities −0.007 0.198*** −0.008 0.214*** Employment activities 0.003 0.229* 0.005 0.236* Travel agency, tour operator reser-vation service and related activities 0.017 0.028 0.017 0.044 Security and investigation activities −0.021* −0.142*** −0.020 −0.135*** Services to buildings and landscape activities −0.070*** −0.172*** −0.071*** −0.157*** Office administrative, office sup-port and other business support activities 0.064*** 0.160*** 0.067*** 0.180*** Public administration and defence; compulsory social security −0.069*** −0.023 −0.068*** 0.035 Education −0.054*** −0.213*** −0.053*** −0.195*** Human health activities −0.052*** −0.179*** −0.050*** −0.178*** Residential care activities −0.076*** −0.076*** Social work activities without accommodation −0.089*** −0.091*** Creative, arts and entertainment activities −0.056*** −0.090 −0.056*** −0.121 Libraries, archives, museums and other cultural activities −0.076*** −0.074*** Gambling and betting activities −0.037*** −0.156*** −0.041*** −0.142** Sports activities and amusement and recreation activities −0.048*** −0.238*** −0.047*** −0.219*** Activities of membership organisa-tions −0.080*** −0.078*** Repair of computers and personal and household goods 0.005 0.043 0.014 0.048 Other personal service activities −0.004 −0.033 −0.002 0.021 Activities of households as em-ployers of domestic personnel −0.052 −0.051 Country dummies Yes Yes Yes Yes No of obs. 152066 14048 143462 13745 Pseudo R2 0.227 0.255 0.226 0.259 Predicted Y 0.090 0.303 0.092 0.297 Actual Y 0.146 0.340 0.148 0.335
Notes: See notes for Table 2. a) The list of NACE Rev. 2 industries can be found at: http://epp.eurostat.ec.europa.eu/cache/ITY_OFFPUB/KS-RA-07-015/EN/KS-RA-07-015-EN.PDF
ECB Working Paper 1704, August 2014 43
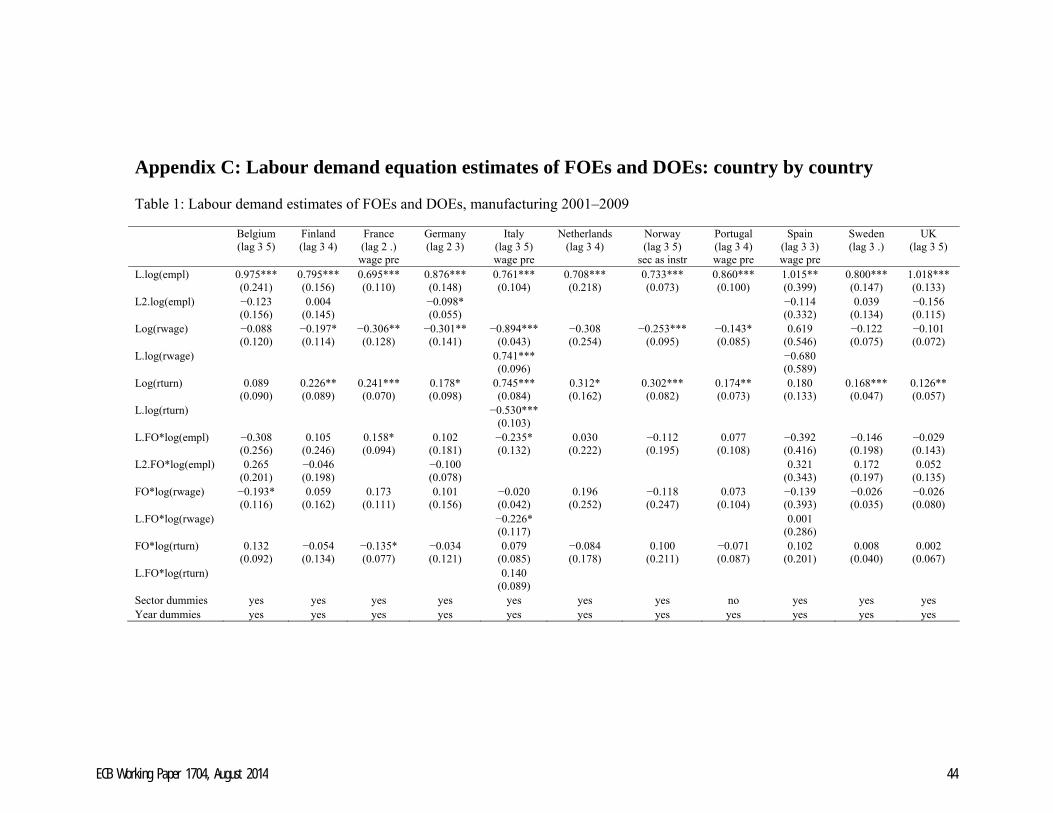
Appendix C: Labour demand equation estimates of FOEs and DOEs: country by country Table 1: Labour demand estimates of FOEs and DOEs, manufacturing 2001–2009
Belgium (lag 3 5)
Finland (lag 3 4)
France (lag 2 .) wage pre
Germany (lag 2 3)
Italy (lag 3 5) wage pre
Netherlands (lag 3 4)
Norway (lag 3 5)
sec as instr
Portugal (lag 3 4) wage pre
Spain (lag 3 3) wage pre
Sweden (lag 3 .)
UK (lag 3 5)
L.log(empl) 0.975*** 0.795*** 0.695*** 0.876*** 0.761*** 0.708*** 0.733*** 0.860*** 1.015** 0.800*** 1.018*** (0.241) (0.156) (0.110) (0.148) (0.104) (0.218) (0.073) (0.100) (0.399) (0.147) (0.133) L2.log(empl) −0.123 0.004 −0.098* −0.114 0.039 −0.156 (0.156) (0.145) (0.055) (0.332) (0.134) (0.115)Log(rwage) −0.088 −0.197* −0.306** −0.301** −0.894*** −0.308 −0.253*** −0.143* 0.619 −0.122 −0.101 (0.120) (0.114) (0.128) (0.141) (0.043) (0.254) (0.095) (0.085) (0.546) (0.075) (0.072) L.log(rwage) 0.741*** −0.680 (0.096) (0.589) Log(rturn) 0.089 0.226** 0.241*** 0.178* 0.745*** 0.312* 0.302*** 0.174** 0.180 0.168*** 0.126**
(0.090) (0.089) (0.070) (0.098) (0.084) (0.162) (0.082) (0.073) (0.133) (0.047) (0.057) L.log(rturn) −0.530*** (0.103) L.FO*log(empl) −0.308 0.105 0.158* 0.102 −0.235* 0.030 −0.112 0.077 −0.392 −0.146 −0.029
(0.256) (0.246) (0.094) (0.181) (0.132) (0.222) (0.195) (0.108) (0.416) (0.198) (0.143)L2.FO*log(empl) 0.265 −0.046 −0.100 0.321 0.172 0.052
(0.201) (0.198) (0.078) (0.343) (0.197) (0.135) FO*log(rwage) −0.193* 0.059 0.173 0.101 −0.020 0.196 −0.118 0.073 −0.139 −0.026 −0.026 (0.116) (0.162) (0.111) (0.156) (0.042) (0.252) (0.247) (0.104) (0.393) (0.035) (0.080) L.FO*log(rwage) −0.226* 0.001 (0.117) (0.286) FO*log(rturn) 0.132 −0.054 −0.135* −0.034 0.079 −0.084 0.100 −0.071 0.102 0.008 0.002 (0.092) (0.134) (0.077) (0.121) (0.085) (0.178) (0.211) (0.087) (0.201) (0.040) (0.067) L.FO*log(rturn) 0.140 (0.089) Sector dummies yes yes yes yes yes yes yes no yes yes yes Year dummies yes yes yes yes yes yes yes yes yes yes yes
ECB Working Paper 1704, August 2014 44
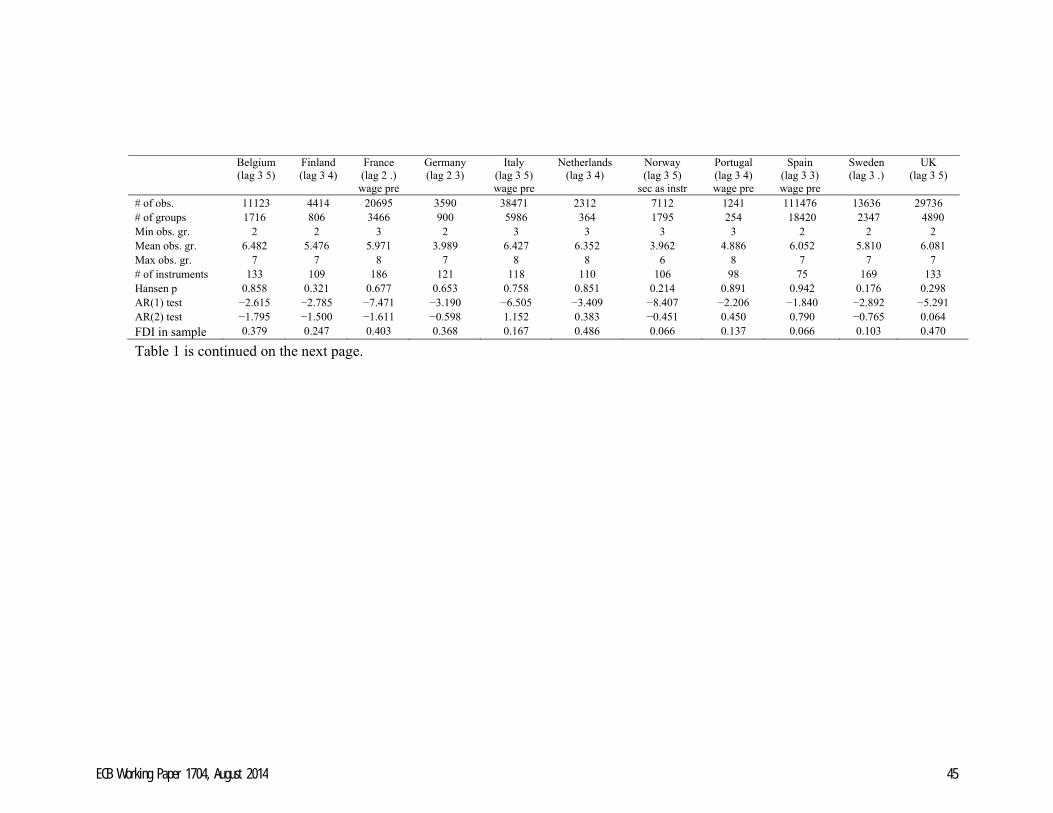
Table 1 is continued on the next page.
Belgium (lag 3 5)
Finland (lag 3 4)
France (lag 2 .) wage pre
Germany (lag 2 3)
Italy (lag 3 5) wage pre
Netherlands (lag 3 4)
Norway (lag 3 5)
sec as instr
Portugal (lag 3 4) wage pre
Spain (lag 3 3) wage pre
Sweden (lag 3 .)
UK (lag 3 5)
# of obs. 11123 4414 20695 3590 38471 2312 7112 1241 111476 13636 29736 # of groups 1716 806 3466 900 5986 364 1795 254 18420 2347 4890 Min obs. gr. 2 2 3 2 3 3 3 3 2 2 2 Mean obs. gr. 6.482 5.476 5.971 3.989 6.427 6.352 3.962 4.886 6.052 5.810 6.081 Max obs. gr. 7 7 8 7 8 8 6 8 7 7 7 # of instruments 133 109 186 121 118 110 106 98 75 169 133 Hansen p 0.858 0.321 0.677 0.653 0.758 0.851 0.214 0.891 0.942 0.176 0.298 AR(1) test −2.615 −2.785 −7.471 −3.190 −6.505 −3.409 −8.407 −2.206 −1.840 −2.892 −5.291 AR(2) test −1.795 −1.500 −1.611 −0.598 1.152 0.383 −0.451 0.450 0.790 −0.765 0.064 FDI in sample 0.379 0.247 0.403 0.368 0.167 0.486 0.066 0.137 0.066 0.103 0.470
ECB Working Paper 1704, August 2014 45

Table 1 (continued).
Bulgaria (lag 3 4)
Czech R. (lag 2 3)
Estonia (lag 2 4)
Poland (lag 3 .)
Romania (lag 2 .)
Slovakia (lag 2 2) wage pre
Slovenia (lag 2 4) wage ex, size*year
L.log(empl) 0.798*** 0.746*** 0.860*** 0.852*** 0.891*** 0.791*** 0.776*** (0.183) (0.117) (0.255) (0.117) (0.136) (0.110) (0.184) L2.log(empl) 0.001 −0.156 (0.029) (0.097) Log(rwage) −0.222 −0.270*** −0.285** −0.221* −0.199 −0.265** −0.346 (0.179) (0.098) (0.127) (0.114) (0.136) (0.122) (0.399) Log(rturn) 0.328** 0.184** 0.301* 0.196* 0.218* 0.146* 0.163 (0.128) (0.080) (0.160) (0.104) (0.112) (0.081) (0.149) L.FO*log(empl) 0.041 0.070 −0.102 −0.028 0.052 −0.038 −0.270* (0.149) (0.125) (0.231) (0.120) (0.177) (0.294) (0.160) L2.FO*log(empl) 0.057 0.080 (0.039) (0.113) FO*log(rwage) −0.009 0.125 −0.044 −0.002 0.111 −0.047 −0.039 (0.178) (0.104) (0.213) (0.129) (0.134) (0.176) (0.229) FO*log(rturn) −0.005 −0.122 0.011 0.003 −0.091 0.042 0.102 (0.122) (0.094) (0.174) (0.096) (0.128) (0.188) (0.171) Sector dummies yes yes yes yes yes yes yes Year dummies yes yes yes yes yes yes yes# of obs. 3518 4661 1585 11744 2230 536 5696 # of groups 589 850 304 1967 313 85 908 Min obs. gr. 3 2 2 3 3 4 3 Mean obs. gr. 5.973 5.484 5.214 5.971 7.125 6.306 6.273 Max obs. gr. 8 7 6 8 8 8 7 # of instruments 110 121 126 170 218 82 114 Hansen p 0.445 0.059 0.621 0.108 0.964 0.645 0.670 AR(1) test −3.852 −5.489 −2.319 −8.533 −4.403 −2.780 −3.560 AR(2) test 0.520 −0.089 −1.487 −1.506 −1.936 1.121 −1.045 FDI in sample 0.320 0.786 0.539 0.333 0.706 0.670 0.129 Notes: See notes for Table 4.
ECB Working Paper 1704, August 2014 46
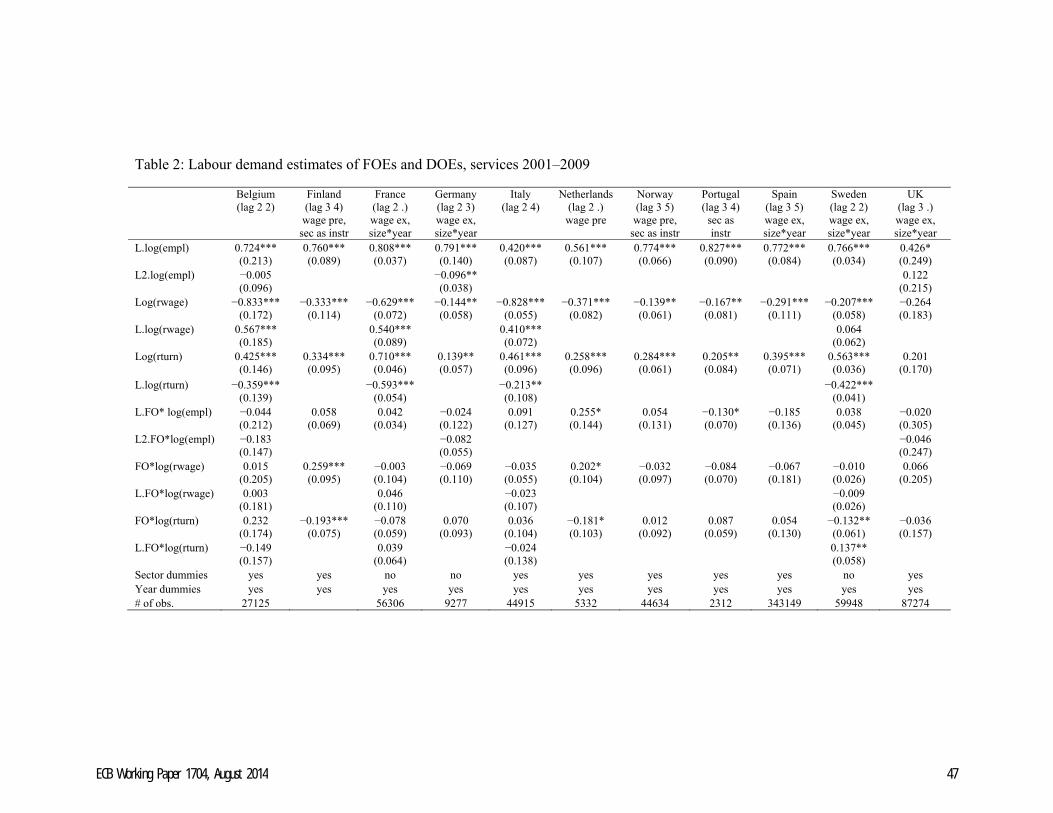
Table 2: Labour demand estimates of FOEs and DOEs, services 2001–2009
Belgium (lag 2 2)
Finland (lag 3 4)
wage pre, sec as instr
France (lag 2 .) wage ex, size*year
Germany (lag 2 3) wage ex, size*year
Italy (lag 2 4)
Netherlands (lag 2 .) wage pre
Norway (lag 3 5) wage pre,
sec as instr
Portugal (lag 3 4)
sec as instr
Spain (lag 3 5) wage ex, size*year
Sweden (lag 2 2) wage ex, size*year
UK (lag 3 .) wage ex, size*year
L.log(empl) 0.724*** 0.760*** 0.808*** 0.791*** 0.420*** 0.561*** 0.774*** 0.827*** 0.772*** 0.766*** 0.426* (0.213) (0.089) (0.037) (0.140) (0.087) (0.107) (0.066) (0.090) (0.084) (0.034) (0.249) L2.log(empl) −0.005 −0.096** 0.122 (0.096) (0.038) (0.215)Log(rwage) −0.833*** −0.333*** −0.629*** −0.144** −0.828*** −0.371*** −0.139** −0.167** −0.291*** −0.207*** −0.264 (0.172) (0.114) (0.072) (0.058) (0.055) (0.082) (0.061) (0.081) (0.111) (0.058) (0.183) L.log(rwage) 0.567*** 0.540*** 0.410*** 0.064 (0.185) (0.089) (0.072) (0.062) Log(rturn)
0.425*** 0.334*** 0.710*** 0.139** 0.461*** 0.258*** 0.284*** 0.205** 0.395*** 0.563*** 0.201(0.146) (0.095) (0.046) (0.057) (0.096) (0.096) (0.061) (0.084) (0.071) (0.036) (0.170)
L.log(rturn) −0.359*** −0.593*** −0.213** −0.422*** (0.139) (0.054) (0.108) (0.041) L.FO* log(empl) −0.044 0.058 0.042 −0.024 0.091 0.255* 0.054 −0.130* −0.185 0.038 −0.020
(0.212) (0.069) (0.034) (0.122) (0.127) (0.144) (0.131) (0.070) (0.136) (0.045) (0.305) L2.FO*log(empl) −0.183 −0.082 −0.046
(0.147) (0.055) (0.247) FO*log(rwage) 0.015 0.259*** −0.003 −0.069 −0.035 0.202* −0.032 −0.084 −0.067 −0.010 0.066 (0.205) (0.095) (0.104) (0.110) (0.055) (0.104) (0.097) (0.070) (0.181) (0.026) (0.205) L.FO*log(rwage) 0.003 0.046 −0.023 −0.009
(0.181) (0.110) (0.107) (0.026) FO*log(rturn) 0.232 −0.193*** −0.078 0.070 0.036 −0.181* 0.012 0.087 0.054 −0.132** −0.036 (0.174) (0.075) (0.059) (0.093) (0.104) (0.103) (0.092) (0.059) (0.130) (0.061) (0.157) L.FO*log(rturn) −0.149 0.039 −0.024 0.137**
(0.157) (0.064) (0.138) (0.058)Sector dummies yes yes no no yes yes yes yes yes no yes Year dummies yes yes yes yes yes yes yes yes yes yes yes # of obs. 27125 56306 9277 44915 5332 44634 2312 343149 59948 87274
ECB Working Paper 1704, August 2014 47
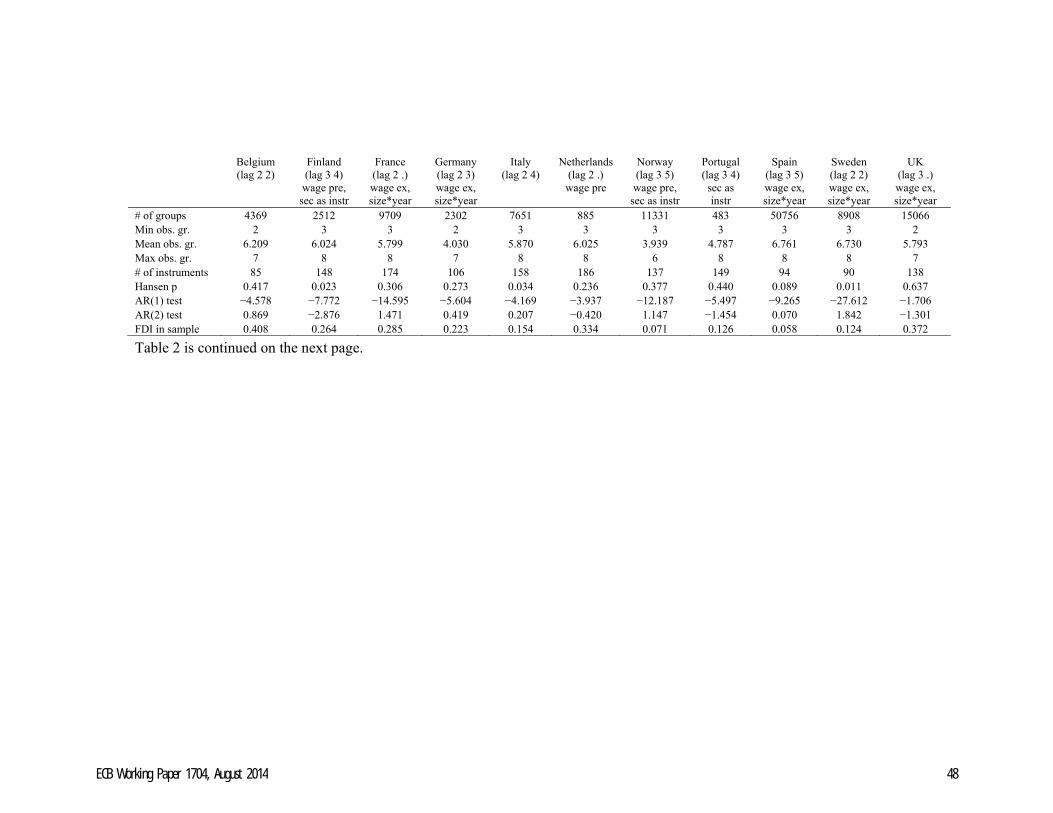
Table 2 is continued on the next page.
Belgium (lag 2 2)
Finland (lag 3 4)
wage pre, sec as instr
France (lag 2 .) wage ex, size*year
Germany (lag 2 3) wage ex, size*year
Italy (lag 2 4)
Netherlands (lag 2 .) wage pre
Norway (lag 3 5) wage pre,
sec as instr
Portugal (lag 3 4)
sec as instr
Spain (lag 3 5) wage ex, size*year
Sweden (lag 2 2) wage ex, size*year
UK (lag 3 .) wage ex, size*year
# of groups 4369 2512 9709 2302 7651 885 11331 483 50756 8908 15066Min obs. gr. 2 3 3 2 3 3 3 3 3 3 2 Mean obs. gr. 6.209 6.024 5.799 4.030 5.870 6.025 3.939 4.787 6.761 6.730 5.793 Max obs. gr. 7 8 8 7 8 8 6 8 8 8 7 # of instruments 85 148 174 106 158 186 137 149 94 90 138 Hansen p 0.417 0.023 0.306 0.273 0.034 0.236 0.377 0.440 0.089 0.011 0.637AR(1) test −4.578 −7.772 −14.595 −5.604 −4.169 −3.937 −12.187 −5.497 −9.265 −27.612 −1.706 AR(2) test 0.869 −2.876 1.471 0.419 0.207 −0.420 1.147 −1.454 0.070 1.842 −1.301 FDI in sample 0.408 0.264 0.285 0.223 0.154 0.334 0.071 0.126 0.058 0.124 0.372
ECB Working Paper 1704, August 2014 48
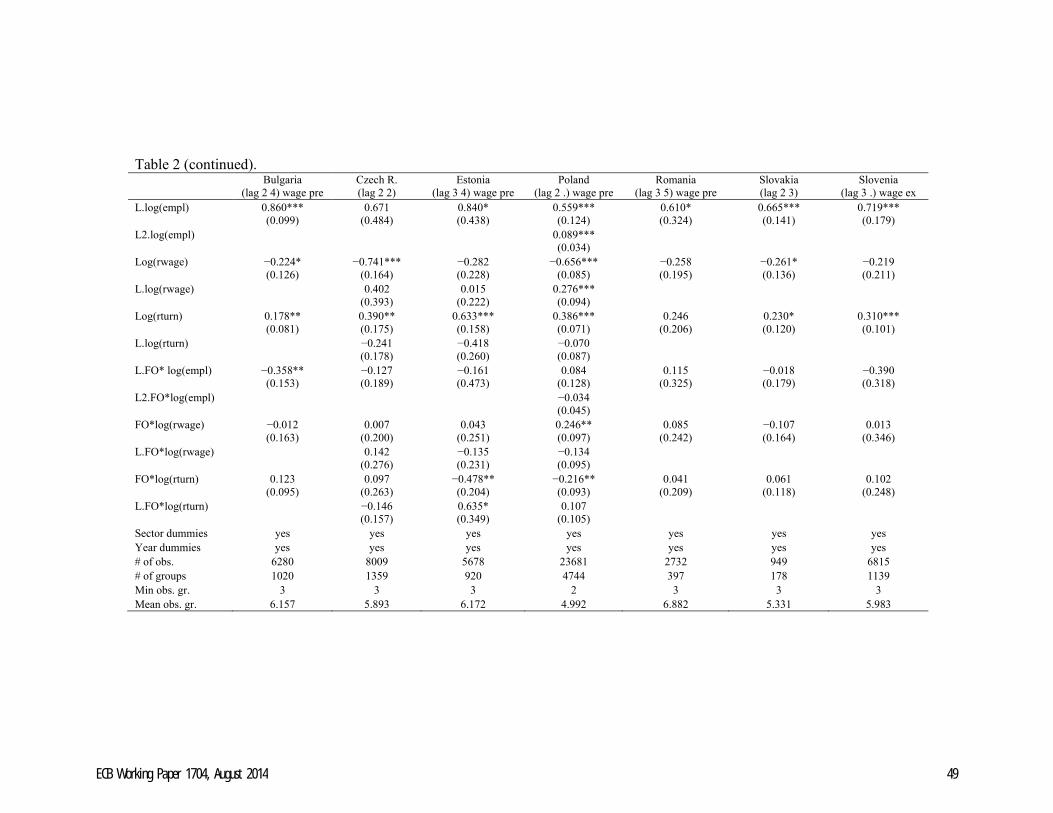
Table 2 (continued).
Bulgaria (lag 2 4) wage pre
Czech R. (lag 2 2)
Estonia (lag 3 4) wage pre
Poland (lag 2 .) wage pre
Romania (lag 3 5) wage pre
Slovakia (lag 2 3)
Slovenia (lag 3 .) wage ex
L.log(empl) 0.860*** 0.671 0.840* 0.559*** 0.610* 0.665*** 0.719*** (0.099) (0.484) (0.438) (0.124) (0.324) (0.141) (0.179) L2.log(empl) 0.089*** (0.034) Log(rwage) −0.224* −0.741*** −0.282 −0.656*** −0.258 −0.261* −0.219 (0.126) (0.164) (0.228) (0.085) (0.195) (0.136) (0.211) L.log(rwage) 0.402 0.015 0.276*** (0.393) (0.222) (0.094) Log(rturn) 0.178** 0.390** 0.633*** 0.386*** 0.246 0.230* 0.310*** (0.081) (0.175) (0.158) (0.071) (0.206) (0.120) (0.101) L.log(rturn) −0.241 −0.418 −0.070 (0.178) (0.260) (0.087) L.FO* log(empl) −0.358** −0.127 −0.161 0.084 0.115 −0.018 −0.390 (0.153) (0.189) (0.473) (0.128) (0.325) (0.179) (0.318) L2.FO*log(empl) −0.034 (0.045) FO*log(rwage) −0.012 0.007 0.043 0.246** 0.085 −0.107 0.013 (0.163) (0.200) (0.251) (0.097) (0.242) (0.164) (0.346)L.FO*log(rwage) 0.142 −0.135 −0.134 (0.276) (0.231) (0.095) FO*log(rturn) 0.123 0.097 −0.478** −0.216** 0.041 0.061 0.102 (0.095) (0.263) (0.204) (0.093) (0.209) (0.118) (0.248) L.FO*log(rturn) −0.146 0.635* 0.107 (0.157) (0.349) (0.105) Sector dummies yes yes yes yes yes yes yes Year dummies yes yes yes yes yes yes yes # of obs. 6280 8009 5678 23681 2732 949 6815 # of groups 1020 1359 920 4744 397 178 1139 Min obs. gr. 3 3 3 2 3 3 3 Mean obs. gr. 6.157 5.893 6.172 4.992 6.882 5.331 5.983
ECB Working Paper 1704, August 2014 49
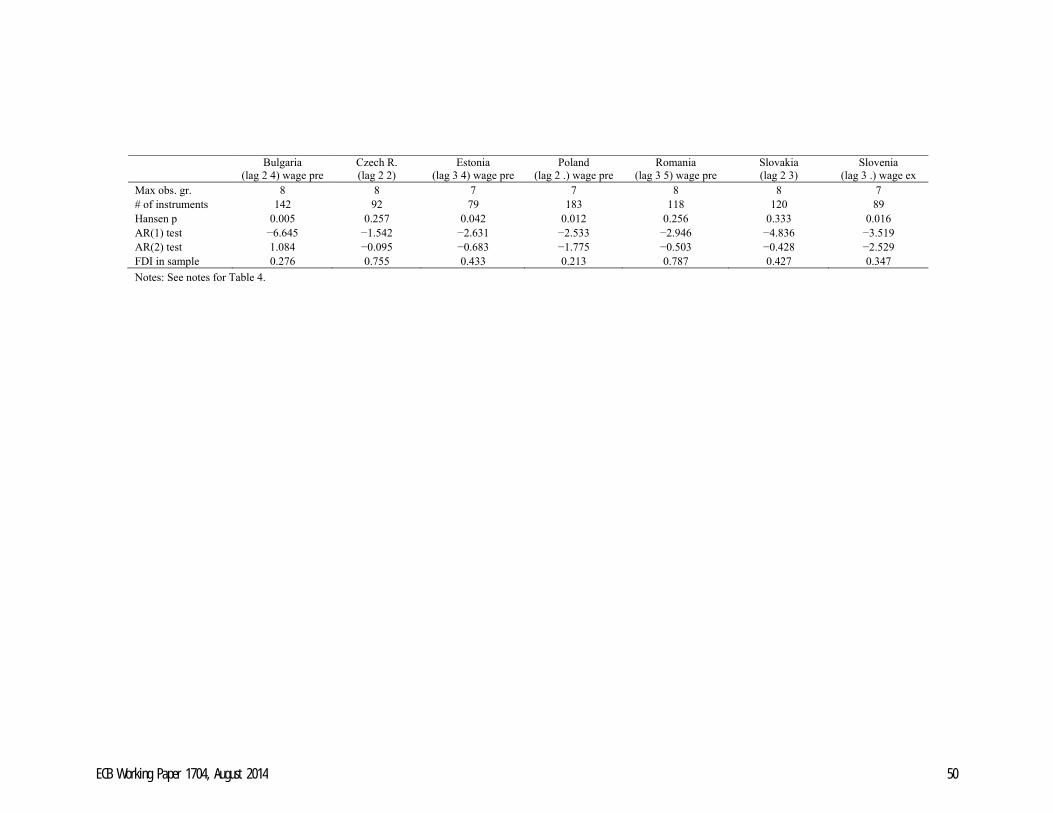
Bulgaria (lag 2 4) wage pre
Czech R. (lag 2 2)
Estonia (lag 3 4) wage pre
Poland (lag 2 .) wage pre
Romania (lag 3 5) wage pre
Slovakia (lag 2 3)
Slovenia (lag 3 .) wage ex
Max obs. gr. 8 8 7 7 8 8 7# of instruments 142 92 79 183 118 120 89 Hansen p 0.005 0.257 0.042 0.012 0.256 0.333 0.016 AR(1) test −6.645 −1.542 −2.631 −2.533 −2.946 −4.836 −3.519 AR(2) test 1.084 −0.095 −0.683 −1.775 −0.503 −0.428 −2.529 FDI in sample 0.276 0.755 0.433 0.213 0.787 0.427 0.347
Notes: See notes for Table 4.
ECB Working Paper 1704, August 2014 50
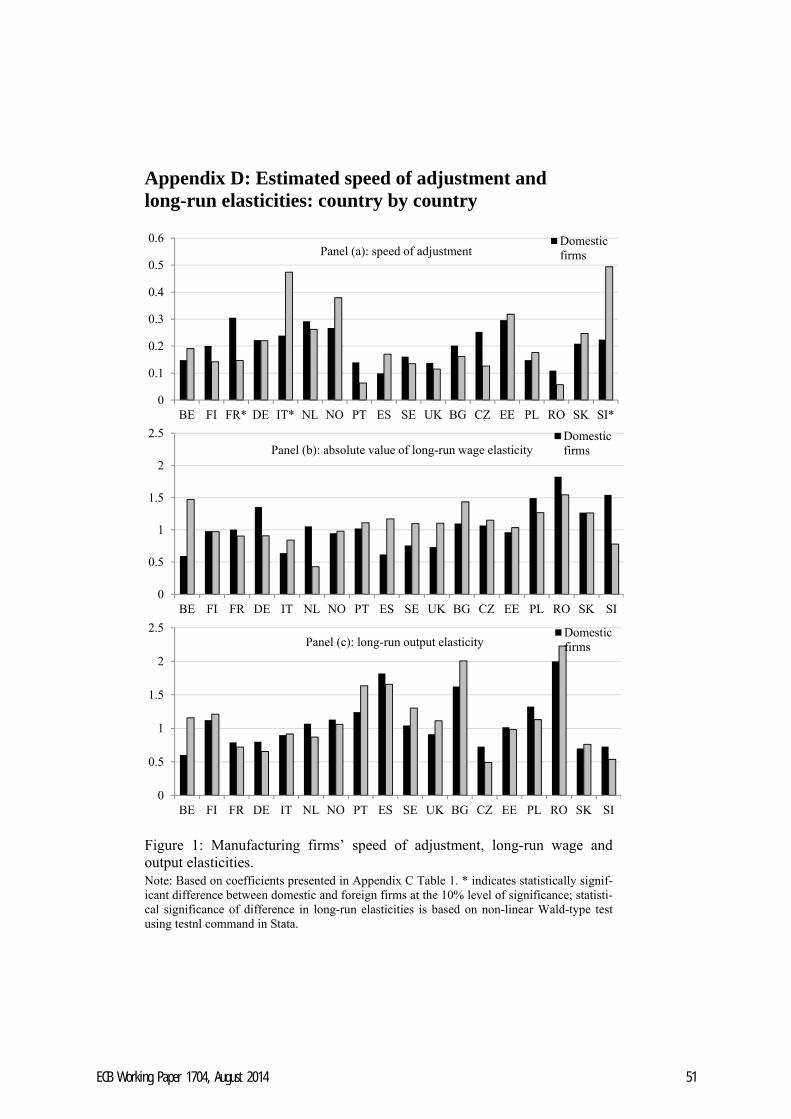
Appendix D: Estimated speed of adjustment and long-run elasticities: country by country
Figure 1: Manufacturing firms’ speed of adjustment, long-run wage and output elasticities. Note: Based on coefficients presented in Appendix C Table 1. * indicates statistically signif-icant difference between domestic and foreign firms at the 10% level of significance; statisti-cal significance of difference in long-run elasticities is based on non-linear Wald-type test using testnl command in Stata.
0
0.1
0.2
0.3
0.4
0.5
0.6
BE FI FR* DE IT* NL NO PT ES SE UK BG CZ EE PL RO SK SI*
Panel (a): speed of adjustmentDomesticfirms
0
0.5
1
1.5
2
2.5
BE FI FR DE IT NL NO PT ES SE UK BG CZ EE PL RO SK SI
Panel (b): absolute value of long-run wage elasticityDomesticfirms
0
0.5
1
1.5
2
2.5
BE FI FR DE IT NL NO PT ES SE UK BG CZ EE PL RO SK SI
Panel (c): long-run output elasticityDomesticfirms
ECB Working Paper 1704, August 2014 51
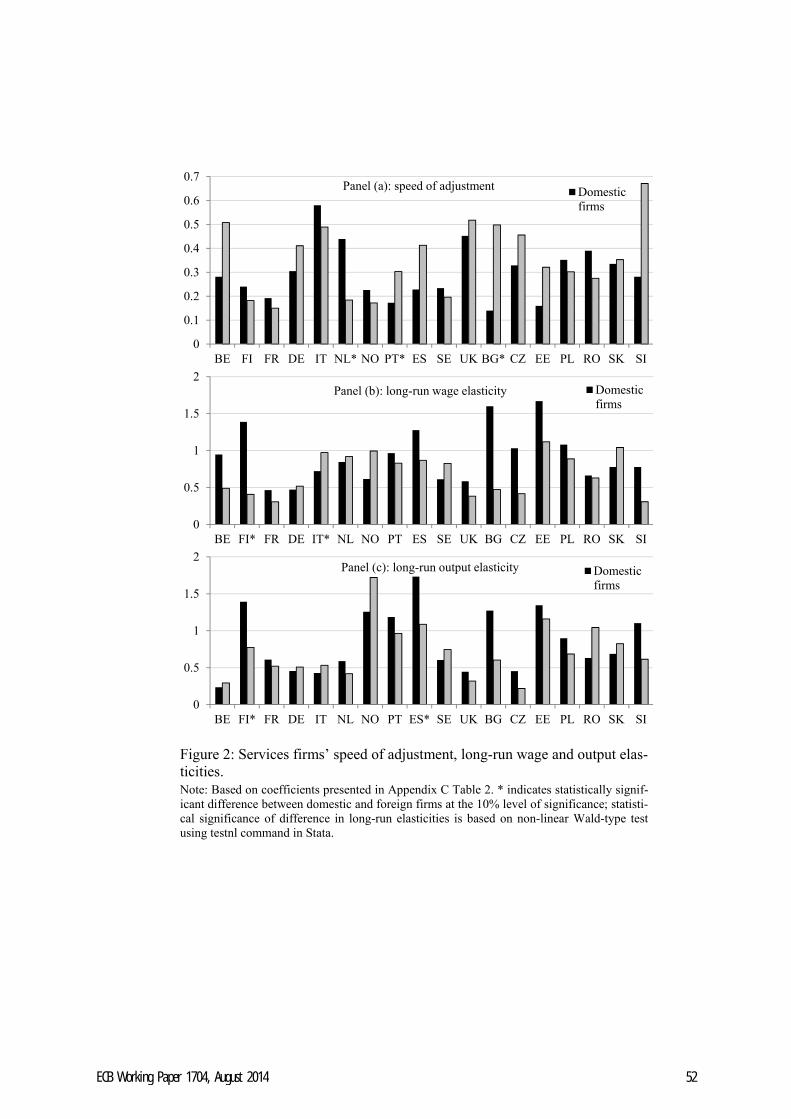
Figure 2: Services firms’ speed of adjustment, long-run wage and output elas-ticities. Note: Based on coefficients presented in Appendix C Table 2. * indicates statistically signif-icant difference between domestic and foreign firms at the 10% level of significance; statisti-cal significance of difference in long-run elasticities is based on non-linear Wald-type test using testnl command in Stata.
0
0.1
0.2
0.3
0.4
0.5
0.6
0.7
BE FI FR DE IT NL* NO PT* ES SE UK BG* CZ EE PL RO SK SI
Panel (a): speed of adjustment Domesticfirms
0
0.5
1
1.5
2
BE FI* FR DE IT* NL NO PT ES SE UK BG CZ EE PL RO SK SI
Panel (b): long-run wage elasticity Domesticfirms
0
0.5
1
1.5
2
BE FI* FR DE IT NL NO PT ES* SE UK BG CZ EE PL RO SK SI
Panel (c): long-run output elasticity Domesticfirms
ECB Working Paper 1704, August 2014 52
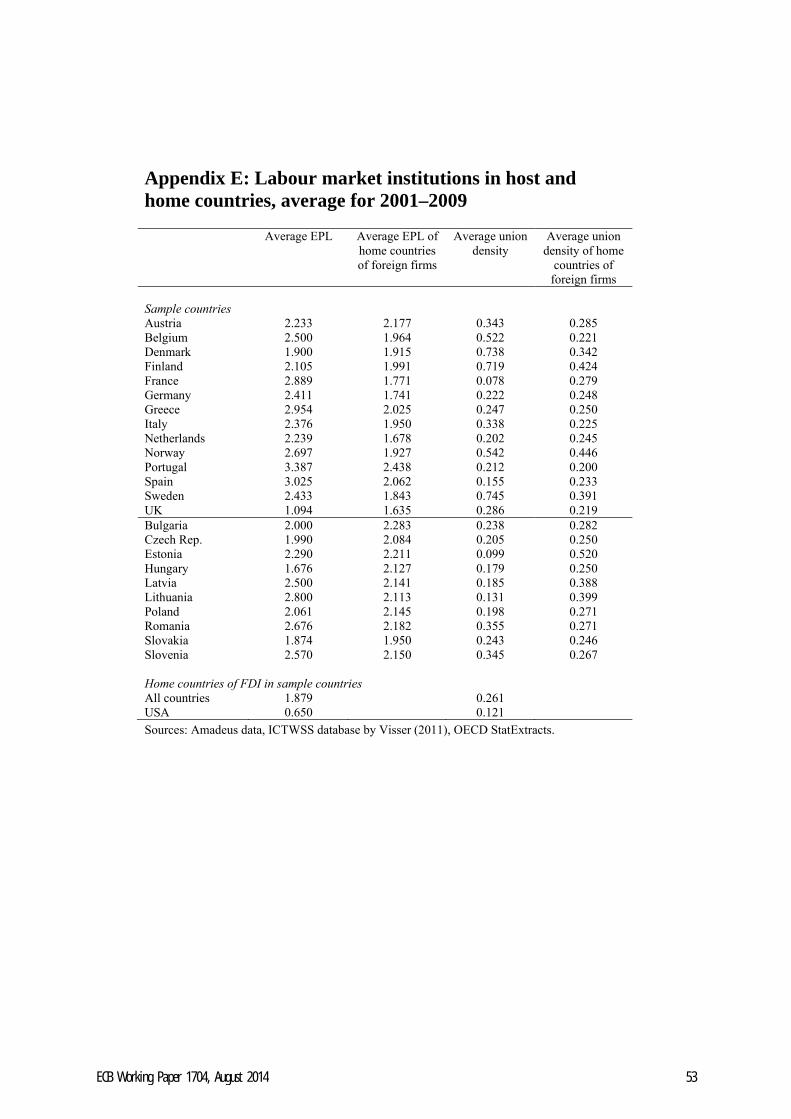
Appendix E: Labour market institutions in host and home countries, average for 2001–2009
Average EPL Average EPL of home countries of foreign firms
Average union density
Average union density of home
countries of foreign firms
Sample countries Austria 2.233 2.177 0.343 0.285 Belgium 2.500 1.964 0.522 0.221 Denmark 1.900 1.915 0.738 0.342 Finland 2.105 1.991 0.719 0.424 France 2.889 1.771 0.078 0.279 Germany 2.411 1.741 0.222 0.248 Greece 2.954 2.025 0.247 0.250 Italy 2.376 1.950 0.338 0.225 Netherlands 2.239 1.678 0.202 0.245 Norway 2.697 1.927 0.542 0.446 Portugal 3.387 2.438 0.212 0.200 Spain 3.025 2.062 0.155 0.233 Sweden 2.433 1.843 0.745 0.391 UK 1.094 1.635 0.286 0.219 Bulgaria 2.000 2.283 0.238 0.282 Czech Rep. 1.990 2.084 0.205 0.250 Estonia 2.290 2.211 0.099 0.520 Hungary 1.676 2.127 0.179 0.250 Latvia 2.500 2.141 0.185 0.388 Lithuania 2.800 2.113 0.131 0.399 Poland 2.061 2.145 0.198 0.271 Romania 2.676 2.182 0.355 0.271 Slovakia 1.874 1.950 0.243 0.246 Slovenia 2.570 2.150 0.345 0.267 Home countries of FDI in sample countries All countries 1.879 0.261 USA 0.650 0.121
Sources: Amadeus data, ICTWSS database by Visser (2011), OECD StatExtracts.
ECB Working Paper 1704, August 2014 53
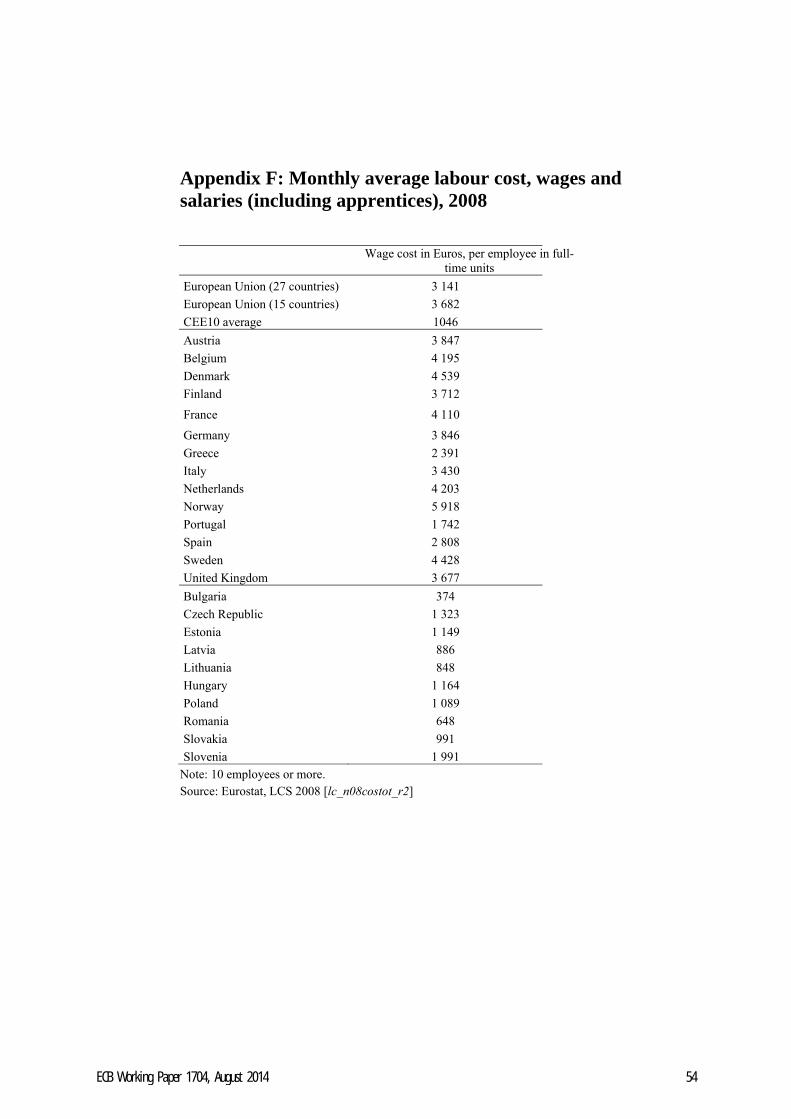
Appendix F: Monthly average labour cost, wages and salaries (including apprentices), 2008
Wage cost in Euros, per employee in full-
time units
European Union (27 countries) 3 141
European Union (15 countries) 3 682
CEE10 average 1046
Austria 3 847
Belgium 4 195
Denmark 4 539
Finland 3 712
France 4 110
Germany 3 846
Greece 2 391
Italy 3 430
Netherlands 4 203
Norway 5 918
Portugal 1 742
Spain 2 808
Sweden 4 428
United Kingdom 3 677
Bulgaria 374
Czech Republic 1 323
Estonia 1 149
Latvia 886
Lithuania 848
Hungary 1 164
Poland 1 089
Romania 648
Slovakia 991
Slovenia 1 991
Note: 10 employees or more. Source: Eurostat, LCS 2008 [lc_n08costot_r2]
ECB Working Paper 1704, August 2014 54