Embed Size (px)
Citation preview
R&D Activities and Innovativeness ofForeign-Owned Firms in Ohio
Asim Erdilek and Milton A. WolfDepartment of EconomicsWeatherhead School of ManagementCase Western Reserve University
.........................................................................................................................................................................................................
This paper is one of a series associated with the September 18, 1996, workshop “Global Linkagesto the Midwest Economy.” Linda M. Aguilar, Jack L. Hervey, and Thomas H. Klier served asworkshop conveners. The workshop was the sixth of a series held at the Federal Reserve Bank ofChicago as part of the 1996-97 project “Assessing the Midwest Economy.” Inquiries should bedirected to the Public Information Center, Federal Reserve Bank of Chicago, P.O. Box 834,Chicago, Illinois 60690-0834, or telephone (312) 322-5111. The Federal Reserve Bank ofChicago’s Web site can be accessed at http://www.frbchi.org.
............................................................................................................................................................................................................Federal Reserve Bank of Chicago 1
I. Introduction
A great deal of attention has been directed to the role of multinational corpora-tions (MNCs) in international R&D (research and development) activities and transferof technology.1 MNCs produce, own, and control most of the world’s advanced tech-nologies because they are responsible for a significant part of global R&D. According toBlomstrom [1992, 105], based on his review of the literature, “there is strong evidencethat multinational firms have contributed to a geographical diffusion of technology andthat active host countries can obtain access to modern technology via foreign directinvestment.” In fact, the desire to acquire modern technology may have become themost important reason why most countries try to attract direct foreign investment(DFI).2 Dunning [1993, 287], from his review of the literature, concludes “that, in thepast, both inward and outward DFI has often (though not always) been a significantcontributory factor to the level and structure of a country’s technological capacity.”According to OECD [1994, 69], based on an analysis of the technological links betweenparent companies and foreign affiliates in the OECD countries, “the bulk of technologyused by affiliates comes from the parent companies.”
Do foreign-owned firms transfer non-U.S. technologies to their U.S. subsidiar-ies, as we would expect on the basis of the theory of DFI, or do they rely primarily onU.S. technologies in establishing a beachhead in the United States? Do they contributesignificantly to U.S. technological capabilities through their R&D and technologytransfer activities or do their foreign parents confine R&D activities and best technolo-gies to their home countries?
The effects of foreign-owned firms in the United States on U.S. technologicalcapability have been controversial. Two earlier studies [Sametz and Backman, 1974;Ajami and Ricks, 1981] concluded that although the size of the U.S. market and theattractiveness of a new market or desire to preserve the existing U.S. market had beenthe most frequently cited reasons for inward DFI (IDFI) in the United States, theprimary motive was the desire to benefit from a higher level of U.S. technology andinnovation. This view still has proponents, especially as regards Japanese investmentsin U.S. R&D-intensive, high-technology sectors [OTA, 1993; OTA, 1994]. It seems tohave been reinforced by the fact that IDFI has consisted mainly of acquisition ofexisting U.S. firms (brownfield investments) rather than establishment of new firms(greenfield investments) [Aguilar, 1996].
Many other studies [e.g., McCulloch, 1991; Lipsey, 1993; Arrison et al., 1992;Florida and Kenney, 1994; OECD, 1994; Graham and Krugman, 1995; Reid andSchriesheim, 1996], however, have argued that the increasing role of MNCs in the U.S.economy has been primarily due to shifts in international technology and comparativeadvantage, in accordance with the theories of DFI and international trade, resulting insignificant technological benefits to the U.S. economy.
Since technology is partly a public good, DFI can also yield indirect productivitygains for the host country firms through external economies or spillovers. Blomstrom[1992, 95-100] divides these into (i) intraindustry spillovers (i.e., the effect of foreign
............................................................................................................................................................................................................2 Assessing the Midwest Economy
firms on the efficiency of their host country competitors) and (ii) interindustryspillovers (i.e., the effect of foreign firms on their local suppliers and customers).
Intraindustry spillovers can consist of greater competition, training of locallabor and management, and faster transfer of both product and process technology.As for interindustry spillovers, foreign firms can stimulate local suppliers of intermedi-ate goods to improve quality and reduce cost (“backward spillovers”), and can alsoenhance the productivity of local firms purchasing their products (“forwardspillovers”). Blomstrom [1992, 104] concludes, from his review of the empiricalliterature on spillovers, that “such effects exist, and that they may be substantial bothwithin and between industries, but there is no strong evidence on their exact nature.”Furthermore, Blomstrom and Kokko [1993] and Blomstrom et al. [1995] find thatspillovers vary significantly among host countries, increasing with their local capabilityand competition.
In this paper, we analyze the R&D activities and technology-related payments andreceipts, innovativeness, and competitiveness of foreign-owned firms in Ohio, on thebasis of our two case studies and survey data, which we collected from 180 companies.Using nonparametric tests, CHAID (Chi-squared Automatic Interaction Detector) andlogistic regression analyses, we explain these companies’ R&D expenditures; R&Dexpenditures to sales ratios; R&D employment; R&D employment to employment ratios;technology payments to and receipts from U.S. companies, major parent company, andother foreign companies; major orientation of their innovations; major contributions tothe modernization of Ohio’s economy and sources of competitiveness.3
II. Role of Foreign-Owned Companies in U.S.,R&D and Inward Technology Transfer
Most modern explanations of DFI focus on the role of ownership-specificadvantages, especially proprietary technological advantages exploited through inter-nalization [Dunning, 1993]. Therefore, we would expect U.S. IDFI to be motivated bythe superior R&D and technological assets of foreign companies. The recent growthof U.S.-based R&D activities by foreign-owned companies has been the subject ofseveral studies. According to the National Science Board [1996, chapter 4], from 1980through 1993, the annual real growth of R&D expenditures by U.S. affiliates of foreignfirms averaged 12%, more than thrice the real rate of growth in domestic R&Dspending by U.S. companies. Dalton and Serapio [1995] estimated nominal R&Dspending by the U.S. affiliates at more than $14.6 billion in 1993, up from $6.5 billionin 1987. They also found that the factors behind foreign R&D in the United Stateswere strikingly similar to those for U.S. R&D abroad, much of the R&D consisting ofapplied research. These factors ranged from helping the parent company to satisfyhost country buyer needs, keeping abreast of technological advances to enabling thecompanies exploit their proprietary special competencies in the host countries. At theend of 1994, there were more than 645 foreign-owned R&D centers in the UnitedStates, 224 of which were owned by Japanese parent companies. The second-largestnumber (109) belonged to U.K. companies.
............................................................................................................................................................................................................Federal Reserve Bank of Chicago 3
In their investigation of Japanese R&D in the United States, Florida and Kenney[1994, 345] found two underlying interrelated geographic concentration patterns:
On the one hand, Japanese R&D investment reflects an underlyingstrategy of “global localization” and the development of integratedinnovation-production complexes. In these cases, R&D is located inclose proximity to existing factory sites. On the other hand, JapaneseR&D investment aims aims to harness the new sources of knowledge andideas embedded in regionally based centers of innovation. In thesecases, R&D facilities locate in regional innovation complexes such asSilicon Valley in electronics or the Detroit area in automotive technol-ogy. Such investments function to gain access to pockets of knowledge,skill, and social capability inherent in such areas.The foreign-owned R&D centers employed more than 105,000 R&D workers at
the end of 1993, having risen from 104,000 employees (about 15% of the R&D em-ployment of all U.S. businesses) in 1992. The 1992 benchmark survey of IDFI by theU.S. Department of Commerce noted that U.S. affiliates of foreign companies, with ashare of only 6% in all U.S. business GDP, accounted for 17% of the privately fundedR&D performed by all U.S. businesses but for less than 1% of government-fundedR&D [Zeile, 1994, 164].
According to Reid and Schriesheim [1996, 42-47], R&D spending by U.S.affiliates of foreign-owned companies as a percentage of all privately funded R&D rosefrom 9.3% to 15.5% from the beginning of 1982 to the end of 1993, with Japanese-owned firms registering the fastest increase. This significant rise in R&D was accompa-nied by the rapid growth in IDFI during the same period. Close to two-thirds of allforeign-funded R&D in the United States is concentrated in a few high-technologysectors where foreign-owned firms have established strong export positions.
Foreigners become involved in American privately funded R&D for twobasic reasons: to serve customers in this country better and to gain betteraccess to American scientific and technological expertise. Most majorforeign-owned R&D facilities are located near major U.S. centers of R&Dactivity, and most affiliate R&D performed in the United States appearsdesigned to meet the immediate technical needs of U.S. based produc-tion facilities. Comparative surveys of U.S.- and foreign-owned multina-tional companies suggest that the motives for engaging in R&D inforeign markets and the type of R&D activity vary by industry but are notsignificantly influenced by the nationality of the company [Reid andSchriesheim, 1996, 4].Reid and Schriesheim [1996, 81] also find that, on the whole, foreign-owned
firms in the United States tend to receive significantly more codified technology fromtheir parent companies than they send to them or to other firms abroad. As for thecontributions of these firms to U.S. technological capabilities, Reid and Schriesheim[1996, 66-67] note the significant interindustry variation revealed by several empiricalstudies. In particular, they draw attention to the studies that have found significanttransfers of organizational and managerial innovations by U.S. affiliates of Japanese

............................................................................................................................................................................................................4 Assessing the Midwest Economy
companies in the automotive and steel sectors. Also, “case studies show that foreign-owned companies, and Japanese companies in particular, have imported significantamounts of advanced production technology and methodologies into the UnitedStates in several industries” [Reid and Schriesheim, 1996, 81].
These recent observations on the technological benefits of U.S. IDFI areconsistent with many earlier ones. For example, according to Cantor [1989], DFI hasplayed a major role in the U.S. steel industry since 1983, ranging from the construc-tion of specific product mills to joint ownership of entire steel plants. One importantreason for this IDFI was the import restrictions of the “voluntary export restraints”(VERs), which went into effect in late 1984 for five years. As we discuss in our first casestudy below, the USS Steel Division of USX Corporation entered into a joint venturewith Japan’s Kobe Steel Company to take over and modernize the operations of USX’sLorain, Ohio, works, which had been manufacturing steel pipe and tube products.Cantor [1989, 108] concludes that “the influx of foreign equity capital ... has contrib-uted to the modernization of the domestic industry by facilitating technology transferand by making investments economically feasible, given the relatively high cost ofcapital in the United States.”
The GAO [1988, 11], focusing on the rapidly rising Japanese DFI in the U.S.automotive and autoparts sectors in the 1980s, noted:
Reacting to the competitive pressures, U.S. auto manufacturers began tochange the way they were doing business. Some formed joint ventureswith Japanese automakers, which provided first-hand experience inJapanese production and management techniques. Many of the featureswhich made Japanese models a success are now being tried and imple-mented by U.S. automakers.Giese [1989], from her study of DFI in the U.S. automotive and autoparts
industries in the 1980s, concluded that, as in the case of steel, VERs had played acrucial role in motivating mostly Japanese DFI and that, subsequently, several U.S.companies in these industries had improved their competitiveness through technologytransfers from, or synergistic joint ventures with, foreign-owned firms. We discussHonda below as our second case study to illustrate the critical direct and indirect roleit has played in the resurgence of the U.S. auto industry.
In short, since the early 1980s, IDFI has played an increasingly significant rolein the development of U.S. technological capabilities through R&D activities of, andtechnology transfers by, foreign-owned firms. Within this general empirical frame-work, we now focus on the R&D activities, innovativeness, and competitiveness offoreign-owned firms in Ohio, beginning with our two case studies. These case studiesillustrate the critical technological contributions made by Japanese multinationalcorporations, reflecting Japan’s rise as a global technological power [Mowery andTeece, 1992], to the resurgence of U.S. steel and automotive industries as well as theeconomic development of Ohio.
............................................................................................................................................................................................................Federal Reserve Bank of Chicago 5
1. Case Study: USX and Kobe Steel Joint Venture
USS/Kobe Steel Company, a joint venture between USX, the parent firm of U.S.Steel International, Inc., the largest U.S. steel maker, and Kobe Steel, Ltd., Japan’s fifth-largest steel producer but leading steel bar products manufacturer, marked Kobe Steel’sfirst mainline steel venture in the United States. Owned 50% by USX and 50% by KobeSteel, it took over the assets, management, and business of the former Lorain Works,with 2,850 employees, located in Lorain, near Cleveland, Ohio. It was formed in July1989 to produce steel bars and pipes. Inputs to automotive applications, bars are used inmaking mainly engine parts and drive shafts, for which high-quality materials areessential. Tubular products, on the other hand, are used primarily in the oil and gasindustry. USS/Kobe Steel was to be managed by a committee consisting of six directors,three from USX and three from Kobe Steel, but chaired by one of the Japanese direc-tors, the president of Kobe Steel USA Inc., headquartered in New York City.
USX had approached Kobe Steel in February 1989 with the idea of the jointventure partnership to improve the Lorain Works, its only bar-making operation, and tomaintain its eroding leadership in the domestic bar market. Without the joint venture,the future would have been bleak for the Lorain Works and the Lorain community.Over the next five to ten years, the Lorain Works would have seen its volume slowly slipaway to competition from mostly nonunion minimills if its aging facilities had not beenmodernized. USX had focused its steel production and investment on sheet productsand committed no resources to the upgrading of the Lorain mill, its only bar and pipeproducts facility. Before the joint venture with Kobe Steel, the Lorain mill had beensupplying bar products to the Big Three auto producers, namely, GM, Ford, andChrysler, but not to any of the Japanese auto transplants, whose strict quality standardscould not be met. Before the joint venture, the work force of the Lorain mill, which wasa dark, dirty, and dreary work place, suffered from low morale and was apprehensiveabout its future, the future of its families, and the future of its community.
Appreciation of the U.S. dollar and protectionist trade policies had begun toaffect Kobe Steel exports to the United States adversely in the first half of the 1980s.Kobe’s exports of steel bars to the United States had been expected to increase rapidlywith the growth of Japanese auto transplants. Construction of a new steel plant in theUnited States would have been too costly. Instead, Kobe began to explore an alliancewith a U.S. producer. As a result, Kobe entered into a 50-50 joint venture with USS.The marketing advantage of USS was another reason why Kobe formed the jointventure. Kobe’s major contribution to the joint venture was to be in technology andquality control. Kobe was motivated by the growth of Japanese auto transplants andtheir increasing demand for high-quality steel. Furthermore, at that time Kobe Steelhad no tubular-products manufacturing in Japan. Its participation in USS/Kobe Steelwould enable it to acquire such capacity to supply both the U.S. and world markets.
At the time the USS/Kobe Steel Company was formed, Kobe Steel, Ltd. alreadyhad 21 subsidiaries, ventures, and other investments in the United States, including fourin Ohio. In 1988 Kobe Steel was the first Japanese steel company to establish a U.S.-based headquarters; it was known as Kobe Steel USA Inc. and was to provide overalldirection for Kobe Steel’s subsidiaries and oversee the activities of two U.S. researchfacilities, one at North Carolina’s Research Triangle Park and another in California’sSilicon Valley.
............................................................................................................................................................................................................6 Assessing the Midwest Economy
One of the critical elements in the formation of the joint venture was a technol-ogy transfer agreement between USS/Kobe Steel and Kobe Steel to be implementedunder the leadership of USS/Kobe Steel’s vice president for technology, a Japaneseexecutive with metallurgical engineering training, who later became the president ofKobe Steel USA Inc. Under this agreement Kobe Steel would receive for four yearslicensing royalties and technical fees for its technological contributions to the jointventure. Technology was transferred through four channels. First, 17 Kobe Steelengineers and scientists were employed full-time at the Lorain plant for the technologytransfer from Japan. Second, occasionally specialists from Kobe Steel came to Lorainfor limited periods to help solve technical problems encountered in the moderniza-tion process. Third, as the need arose, engineers and technical managers from USS/Kobe Steel spent time at Kobe Steel’s facilities in Japan to receive special trainingrequired by the modernization. Finally, USS/Kobe Steel personnel could consultfreely by telephone and fax with their counterparts in Kobe, Japan, on problem solvingin engineering and production.
In June 1990, USS/Kobe Steel announced its intention to initiate a massiveoverhaul of the Lorain mill, crucial for the company’s ability to compete. The com-pany noted that its ability to compete in bar products was critically dependent on itsmeeting the higher quality standards of U.S. domestic auto firms as well as those ofJapanese auto transplants. In the pipe market, where much of the company’s competi-tion came from imported steel, its customers were also insisting on higher-qualitytubular products. This required the modernization of its seamless pipe mills.
Key elements of the renovation and modernization package were tax abatementsfrom the city and smooth labor relations. In May 1991, USS/Kobe Steel began to spend$200 million to upgrade its Lorain mill. The improvements included installation of newequipment such as a second bloom caster, a machine that forms molten steel into longsections ready to be made into pipes or bars, rebuilding one of the plant’s blast furnaces,and upgrading the plant’s finishing mills. This represented the first phase of a six-project, five-year $410 million (later raised to $500 million) modernization programdespite a severe slump in the bar market, which had cut the plant’s production rate to50% of capacity, well below the industry average. The bar market had been plagued byexcess capacity and shrinking demand in the 1980s as autos were reduced in size anddesign changes, such as the switch to front-wheel drive, were introduced. The construc-tion and off-highway equipment market had also shrunk, and many bar plants were shutdown as operations were consolidated into fewer facilities.
In short, without Lorain mill’s modernization, to increase productivity, lowercosts, and improve quality, the plant would have been doomed to extinction soon. Thismodernization required Kobe Steel’s state-of-the-art technology. The improvementswould be accompanied by extensive training of hourly and salaried employees. Themodernization program required USS/Kobe Steel to bring its future labor costs undercontrol and to institute less restrictive work rules. This, in turn, necessitated the coop-eration of the national United Steel Workers (USW) union for allowing the USS/Kobeand the local USW union to negotiate a new labor agreement independent of the masteragreement between the USW and USS, which had covered the local plant through
............................................................................................................................................................................................................Federal Reserve Bank of Chicago 7
February 1991. This new agreement had to recognize the fact that unlike USS, whichwas mainly a flat-rolled steel producer, the Lorain mill produced primarily bar-shapedsteel with lower profit margins and faced stiff competition from many nonunion, low-cost producers such as North Star Steel and MacSteel, known as minimills. The nationalUSW leadership initially resisted but later accepted the separate agreement.
In order to improve USS/Kobe Steel’s labor-management relations, the state ofOhio awarded, in September 1990, a $50,000 Ohio Steel Futures Program granttoward a joint project between USS/Kobe Steel, the United Steel Workers of America,and Cleveland State University’s Industrial Relations Center. This grant contributed toa $140,392 project to develop and implement a model cooperative labor-managementeducation program at Cleveland State University (CSU).
In October 1991, USS/Kobe Steel began to modify its steel-bar mill operation inLorain to accommodate demand for smaller-diameter, lighter bars, interpreted widely asa foray into the market for steel-rod or wire-rod, used to produce steel wire and fasten-ers. Moreover, it moved up its rolling-mill modernization on its capital-spending prioritylist, all part of its five-year modernization program announced earlier.
In conclusion, USS/Kobe Steel, thanks to technology transfers from its Japa-nese parent, cleaner and safer working conditions for its employees, and improvedlabor-management relations, has modernized its facilities and increased production ofvalue-added products in line with capital investment and modernization programsimplemented since 1990. In 1994 it brought a new pulverized-coal injection facility online for its No. 3 blast furnace, and in 1995 it completed the installation of a continu-ous bloom caster. It also remodeled its ten-inch bar mill with the world’s fastest rollingspeed, and a reheating furnace.
These innovations have enabled the company to supply a wider range of barproducts, especially smaller-diameter-quality bars for auto parts. Due to improvementsin productivity and operational efficiency, USS/Kobe Steel, currently with 2,730 employ-ees and a crude steel production capacity of 2.4 million tons, has been profitable sinceits establishment. It has become a major direct and indirect supplier of the transplantoperations of Honda, Nissan, and Toyota, as well as the Big Three auto producers.
The first successful USS/Kobe Steel joint venture was soon followed by anotherone. This second 50-50 joint venture between Kobe Steel, Ltd., and USX Corporation,Pro-Tec Coating Company (originally named AZTEC), with a $200 million greenfieldfacility in Leipsic, near Toledo, Ohio, was formed in March 1990 and went intoproduction in January 1993 with 90 nonunion employees. This joint venture, initiatedby USX and encouraged by the success of USS/Kobe Steel, became profitable in itssecond year of operation. Pro-Tec produces world-class-quality coated steel sheetproducts mainly for U.S.- and Japanese-owned automotive plants in the United States.Its hot-dip galvanizing line is designed to supply high quality coated and corrosion-resistant sheet steel. Its master coils are supplied by USS’s Gary Works in Indiana,Mon Valley Works near Pittsburgh, and Fairfield Works near Birmingham, Alabama.The demand for galvanized steel had been growing as auto makers used more zinc-coated parts in their cars and extended their rust protection warranties.
............................................................................................................................................................................................................8 Assessing the Midwest Economy
Pro-Tec set a new steel industry world record for annual production by a hot-dip galvanizing line, making close to 651,000 prime tons of coated steel sheet in 1995,exceeding its annual 600,000-ton capacity. It was also certified in January 1996 asmeeting the stringent ISO 9002 quality assurance standards. For Kobe Steel, thisachievement marked its first production unit in the United States to have met thestringent ISO standards.
In summary, both of these successful steel industry joint ventures, onebrownfield and the other greenfield, illustrate the critical technological contributionsmade by Kobe Steel through direct investment to the resurgence of the U.S. steelindustry and the economic development of Ohio.
2. Case Study: Honda.
On 10 September 1979, the first U.S.-made Honda motorcycle rolled off anassembly line, with 64 workers in Marysville, Ohio, following an initial investment of$35 million. A decade later, in December 1989, Honda of America Manufacturing Inc.(HAM), part of Honda North America, Inc., a wholly owned subsidiary of HondaJapan, began production at its second automobile assembly plant in west-central Ohio.It had 6,400 workers at its two plants (automobile and motorcycle) in Marysville, anadditional 1,200 at its engine plant in Anna, and 150 at its new East Liberty automobileplant. Honda Accord, whose production had started in 1982, was the best-selling carin the United States. In Ohio, Honda began to produce motorcycle engines in 1985,the Honda Civic in 1986, and the Acura CL in 1996.
Honda is a major Japanese multinational corporation with 119 facilities in 46countries. Its total U.S. investment reached $3.2 billion in mid-1996 after producing552,995 cars and 128,107 motorcycles in Ohio in 1995. Since 1987, most Hondas soldin the United States have been manufactured in North America reaching 77% of totalsales in 1995. For the second year in a row, Honda, with 14,000 employees in manufac-turing (with 11,500 Ohio production workers who produce half of all the cars made inthe state), R&D, engineering, and marketing, was the top automobile exporter, sellingmore than 87,835 cars to 52 countries, 49,509 of them to Japan. By the end of 1996,Honda will produce every Accord sold in the United States in Marysville, Ohio. Whenthe redesigned 1998 Accords debut in late 1997, every one sold in 130 countries,including in Japan, will be built in Ohio.
In 1995, Honda Accord, with sales of 341,384 units, was the second best-sellingcar in the United States after Ford Taurus, which sold 366,266 units; Honda Civic, withsales of 289,435 units, was the fourth best-selling car after Toyota Camry, which sold328,595 units. Honda’s share of the passenger car market in 1995 was 10%, about thesame as the shares of Chrysler and Toyota.
In 1995, Honda purchased $4.6 billion in parts and materials from 353 NorthAmerican suppliers in 35 states, reaching a domestic content of at least 90% accordingto the EPA formula. It had more than 140 Ohio-based automotive and power equip-ment OEM (original equipment manufacture) suppliers. The top supplier states afterOhio were Michigan, Indiana, Illinois, Kentucky, North Carolina, Wisconsin, Georgia,and Texas.
............................................................................................................................................................................................................Federal Reserve Bank of Chicago 9
In September 1987, HAM had announced a five-part strategy for its futureoperations in the United States:• Export 70,000 cars per year to Japan and other countries• Increase domestic content to 75% by 1991• Increase U.S. R&D activities• Expand production engineering in the United States• Construct a second auto plant and further expand engine manufacturing in Ohio
In terms of the third part of its strategy, HAM had stipulated further:• Expand R&D employment in the United States to 500 from 180 employees• Designate as primary R&D goals the design and engineering of cars and testing
evaluations in the United States to develop new models for the U.S. market, andincreased U.S. sourcing
• Purchase the Transportation Research Center of Ohio for $31 million to supportfurther the R&D effort and provide a site for a second auto plant
As part of an infrastructure package worked out with the state government,Honda purchased for $31 million the Ohio Transportation Research Center adjacentto its East Liberty facilities, 40 miles northwest of Columbus, Ohio. The state alsomade various highway improvements in the area, provided rail lines in cooperationwith Conrail, financed site and infrastructure improvements, and funded the trainingof new Honda employees.
In July 1994, HAM announced its new five-part Automobile Strategy for theAmericas:• Increase annual automobile manufacturing capacity in the United States and
Canada from 610,000 to 720,000 units and begin auto manufacturing in Mexico• Expand annual capacity of the Ohio engine plant from 500,000 to 750,000 engines
in 1998• Expand U.S. R&D capabilities• Strengthen the auto sales networks in the Americas• Expand annual exports of Canadian-produced cars to more than 150,000 units by
1999, including component salesAfter completing nearly all of its July 1994 strategy in 1996, HAM announced in
May 1996 its Americas Strategy ’96 to expand and accelerate Honda’s self-reliantstrategy for the Americas through the end of the decade:• Increase annual production at the Ohio engine plant from 750,000 to 900,000,
including production of an all-new V6 engine in 1996 and the first-ever gasolineUltra Low Emission Vehicle (ULEV) engine in 1997
• Create an automatic transmission center for the Americas in Ohio and increaseannual production from 380,000 to 650,000 units
• Further localize production and sourcing of automatic transmission and enginecomponents by domestic suppliers, increasing supplier investment by more than$310 million and creating more than 1,200 new jobs
• Expand annual auto production in North America from 720,000 to 840,000 units,including production of a new van in 1998
• Expand U.S. R&D employment to 800 persons in 1996, four years ahead of theinitial expansion target.
............................................................................................................................................................................................................10 Assessing the Midwest Economy
In the R&D area, originally established in California in 1975 to conduct marketresearch, Honda R&D North America, Inc. (HRA), has steadily expanded the size andscope of its operations. In September 1996 it had 750 employees. Formally incorpo-rated in 1984, the primary mission of HRA today is to design, develop, and engineerproducts for customers in the Americas and to support local parts sourcing. LikeHonda R&D Co., Ltd., in Japan, HRA is a separate company with the flexibility topursue its design and development goals.
HRA has been involved in the design and development of many Honda prod-ucts, including the Accord Coupe, Accord Wagon, and Civic Coupe. All three modelsare manufactured exclusively in North America in both right-hand- and left-hand-driveversions, and exported to several countries. The Acura CL Coupe is the latest automo-bile conceived, designed, engineered, and produced exclusively in North America.
The continued expansion of HRA operations is expected to result in morelocally developed products. With the latest expansion of the company’s Ohio Centerin December 1995, the capital investment in R&D facilities in the United Statesexceeded $250 million. The Ohio Center, which began operations in 1985, is respon-sible for product development, prototype fabrication testing, support of North Ameri-can suppliers and technical support to manufacturing operations. The Los AngelesR&D Center is responsible for product planning, styling design, and market research.
In October 1996, Ohio State University in Columbus, Ohio, announced thecreation of two endowed chairs in engineering that will bear the name of Honda. Thetwo new Honda Chairs in Transportation, endowed with $1.5 million each, are in-tended to advance research in transportation, including ergonomics and materialsdevelopment. These chairs are being funded by the Transportation Research Endow-ment Program (TREP), which has in turn been largely funded by the surplus incomegenerated at the Transportation Research Center (TRC) Inc. in East Liberty, adjacentto Honda’s Ohio R&D Center. TRC Inc., now a part of HRA, had been sold in 1988 toHonda by the state of Ohio for $31 million, of which $6 million was earmarked for thecreation of TREP. Although owned by HAM, TRC Inc. is independently managed andconducts research and testing not only for Honda but also for many other clients,including the U.S. government and all U.S. and several foreign auto manufacturers.With 400 employees, TRC Inc. serves 170 clients at its outdoor crash safety testing siteand rough road course, and generates $20 million annually in revenues.
On the basis of this brief history of Honda’s U.S. operations, Honda’s technol-ogy transfer can be analyzed in terms of three effects [Craig et al., 1994, 26-44]:1. demonstration effect, 2. communication and location effect, and 3. competitivestrategy and policy effect.
1. Demonstration effect. Honda was the first foreign auto company to use foreignauto technologies in the United States successfully. It showed that Japanese produc-tion and management techniques can work in the United States. Although thesetechniques were well known in the United States, many people had believed that theycould not be applied there. Honda’s success was all the more remarkable followingthe earlier dismal failure of Volkswagen to produce passenger cars in Pennsylvania.Since Honda began producing passenger cars successfully in the United States in 1982,
............................................................................................................................................................................................................Federal Reserve Bank of Chicago 11
the share of transplants, primarily Japanese direct investments, in U.S. passenger carproduction has increased from 1.7% to 30.0% in 1995; their share in U.S. retail salesrose from 1.1% to 19.6% during the same period.
There were three important elements in the Japanese techniques introduced byHonda into the U.S. auto industry, still the largest U.S. manufacturing sector: (i)commitment to “Kaizen,” or “continuous improvement,” (ii) cooperative relationshipsbetween workers, managers, and suppliers, and (iii) heavy emphasis on measurementand statistical analysis of all business operations, from serious faults to misplaced labels,to identify precisely what required improvement.
2. Communication and location effect. Honda’s U.S. location of auto productiontriggered technology transfers to U.S. domestic auto producers and suppliers. It iswidely agreed that technology transfer is most effective through direct foreign invest-ment (DFI). There are two alternative channels of technology transfer through DFI:(i) Labor turnover, which has been very low in Honda’s case and thus not very signifi-cant and (ii) direct interaction among firms, which in Honda’s case has been verysignificant in terms of (a) Honda and its suppliers, and (b) Honda and its competitors.
In understanding the interaction between Honda and its suppliers, it is useful todistinguish between Honda’s Tier I (direct) and Tier II (indirect) suppliers. Hondahas brought with it many Japanese Tier I suppliers into the United States, several ofthem in joint ventures with itself. Honda helps its Tier I suppliers, who in turn helpthe Tier II suppliers. Also, Tier I suppliers that supply other U.S. auto companiesbenefit those companies.
3. Competitive strategy and policy effect. Honda’s U.S. location of auto productionchanged the competitive strategies of U.S. domestic producers and benefited U.S.consumers through cost reductions and quality improvements. It also affected theevolution of U.S. trade policies in general and bilateral trade relations with Japan inparticular.
The three essential components of Honda’s technology transfer to the U.S. autoindustry can be identified in terms of 1. supplier relations, 2. design partnerships,and 3. organizational technologies.
1. Supplier relations. Honda’s emphasis has been on long-term and mutuallybeneficial relationships with its suppliers [Fitzgerald, 1995]. Purchasing is considereda critical function by Honda’s top management. HAM has about 800 people workingwith its about 350 suppliers. Of the 800 workers, 300 are in purchasing, 200 are inquality, and 300 are in manufacturing. Purchasing outsources 75% to 80% in parts ofthe total cost of the car, including those supplied by Honda affiliates. Honda’s “con-tinuous improvement,” “hands-on” approach to its suppliers has been formalizedthrough its BP (alternatively known as “best practice,” “best price,” “best process,” orsometimes “big problem!”) Program, which is run by purchasing.4 Through BP Hondashows its suppliers how to reduce manufacturing to its basic components and minimizethe seven wastes of manufacturing: 1. Idle time, 2. Movement, 3. Rejects, 4. Down-time, 5. Over-production, 6. Delivery, and 7. Inventory. Recently, Honda has devel-oped its BQ (“best quality”) Program as an offshoot of BP, after realizing that 30% ofBP was quality related. In 1985, poor quality levels were near 7,000 ppm (parts permillion). In 1995, the level was down to between 100 and 200 ppm.
............................................................................................................................................................................................................12 Assessing the Midwest Economy
2. Design partnership. Honda has devolved increasing responsibility for partsdesign to its suppliers. It also works closely with suppliers on overall product design.They typically get involved two to three years before a new model is introduced. Somesuppliers spend up to three months working with Honda’s design engineers in Japan.Most suppliers send engineers to work with Honda’s engineers at HAM facilities inMarysville, Ohio. Honda expects suppliers to become experts in the technologyapplied to their parts.
3. Organizational technologies. Honda has emphasized and diffused to the U.S.automotive industry such principles and concepts as “the Honda Way,” “worker as theexpert,” “continuous improvement,” “quality circle,” and “just-in-time.” Honda’s cleanand well-lit Ohio plants have become showcases for the domestic auto industry. AtHonda all employees, who all wear white overalls, are addressed as “associates.” AtHonda all offices are organized as open space without walls; there are no executivedining rooms or special parking privileges for anyone. Perhaps an indication ofHonda’s successful labor-management relations is the fact that repeated attempts overthe last 15 years to unionize Honda’s work force have failed.
In short, Honda’s direct investment in the U.S. auto industry has been criticalto the resurgence of car making in both Ohio and the United States. Its has paved theway for other foreign car makers to start U.S. production and energized U.S. produc-ers to modernize their operations in order to compete more effectively with bothtransplants and imports. Ultimately, U.S. consumers have gained the most in beingable to buy lower-priced and better-quality cars.
III. Data and Methodology
We now turn to our statistical research, a comprehensive investigation of inwarddirect foreign investment (IDFI) in Ohio, required primary and firm-specific data onall foreign-owned companies operating in the state [Wolf, 1993]. Such data wereunavailable from either published or unpublished sources. We collected these datadirectly from the foreign-owned companies operating in Ohio. For this purpose, weused an eight-page questionnaire, a copy of which is available on request.5
Before we could mail our questionnaire, we had to try to determine the identi-ties of all the foreign-owned companies operating in Ohio. In discovering the namesand addresses of the companies, we received help from several sources, including theOhio Department of Development (ODOD).
We mailed a grand total of 723 questionnaires in May 1991. Each questionnairewas accompanied by a cover letter from the ODOD, signed by its director requestingparticipation in the study. According to KPMG Peat Marwick [1990], there were 547foreign-owned firms in Ohio, 166 of which (i) had their U.S. headquarters in Ohioand (ii) were at least 50% foreign owned. We began to receive responses in June 1991.Ninety-nine uncompleted questionnaires were returned to us because either (i) wehad used an incorrect address or (ii) the company had gone out of business, moved toanother state, or the forwarding address had expired and no other address was on filewith the post office and the company could not be found anywhere else in Ohio. Thisbrought the total down to 624. A follow-up letter was later sent to the non-respon-dents, again requesting that the completed questionnaire be returned.

............................................................................................................................................................................................................Federal Reserve Bank of Chicago 13
We received a total of 228 either partially or completely filled out question-naires by the end of 1991. We tried to telephone all the individual respondentsdirectly in order to either complete unanswered questions or clarify information.
The following is a summary of the 228 responses:180 Included in the study (as input into SPSS/Windows [Norusis, 1993])23 Excluded due to less than 10% foreign ownership
5 Excluded due to no operations in Ohio4 Excluded because the company/plant was closed
16 Returned to us as “not completed” because of company policy orvarious other reasons.
Of the 180 respondents included in the study, 154 firms, 86%, were engaged inmanufacturing. According to KPMG Peat Marwick, of the 166 foreign-owned firmswith U.S. headquarters in Ohio and with at least 50% foreign ownership, 119 firms,72%, were engaged in manufacturing.
In short, we attempted to survey all the foreign-owned firms (i.e., firms with atleast 10% foreign ownership) operating in Ohio, targeting our questionnaire at thatpopulation. Since a few firms from that target population refused to participate in thesurvey and since we may have also failed to contact a few others, we ended up with asampled population although that was not our intention. Of course, almost alwaysempirical researchers have to work with the sampled population and must assume thatthe sampled population is similar to the target population, at least with respect to theproperties under investigation. We believe that our sample is highly representative ofthe population of the IDFI firms operating in Ohio, in terms of both their numbersand their economic importance. It includes all the well-known and large firms thataccount for the bulk of assets, sales, employment, and the like. Nevertheless, ourresults could be subject to unknown sample bias.
Table 1 Percent of Manufacturing Employees in U.S. Affiliatesof Foreign Owned Companies
1988 1989 1990 1991 1992 1993 1994.....................................................................................................................................................................
Illinois 9.5 10.9 11.8 12.6 12.8 12.6 12.3
Indiana 8.4 10.0 13.7 13.0 13.6 13.4 13.3
Michigan 7.0 7.2 7.6 7.8 8.3 8.8 8.6
Ohio 7.9 10.1 11.2 11.9 12.3 12.3 12.2
Wisconsin 7.2 7.6 8.3 8.5 8.2 7.6 7.5
U.S. 8.2 9.5 10.4 11.0 11.2 11.3 11.4
Source: Fahim-Nader, Mahnaz and William J. Zeile, “Foreign Direct Investment in the United States, Survey ofCurrent Business, July 1996, pp. 102-130.
............................................................................................................................................................................................................14 Assessing the Midwest Economy
How important has been the role of foreign-owned companies in Ohio’seconomy? One way to measure this role is to look at employment. According to ourestimate, based on 175 responses of mostly manufacturing firms, in 1990 foreign-ownedcompanies had 70,083 employees in Ohio. The corresponding U.S. Department ofCommerce estimates were 72.3 thousand employees in 1990 and 70.7 thousand employ-ees in 1991 [Fahim-Nader and Zeile, 1996, 116]. Obviously, expressing this as a percent-age of total manufacturing employment is more revealing. Based on Fahim-Nader andZeile [1996, 116], from the beginning of 1988 to the end of 1994, the percentages forthe Great Lakes region states and for the United States are shown in Table 1.
IV. Empirical Results
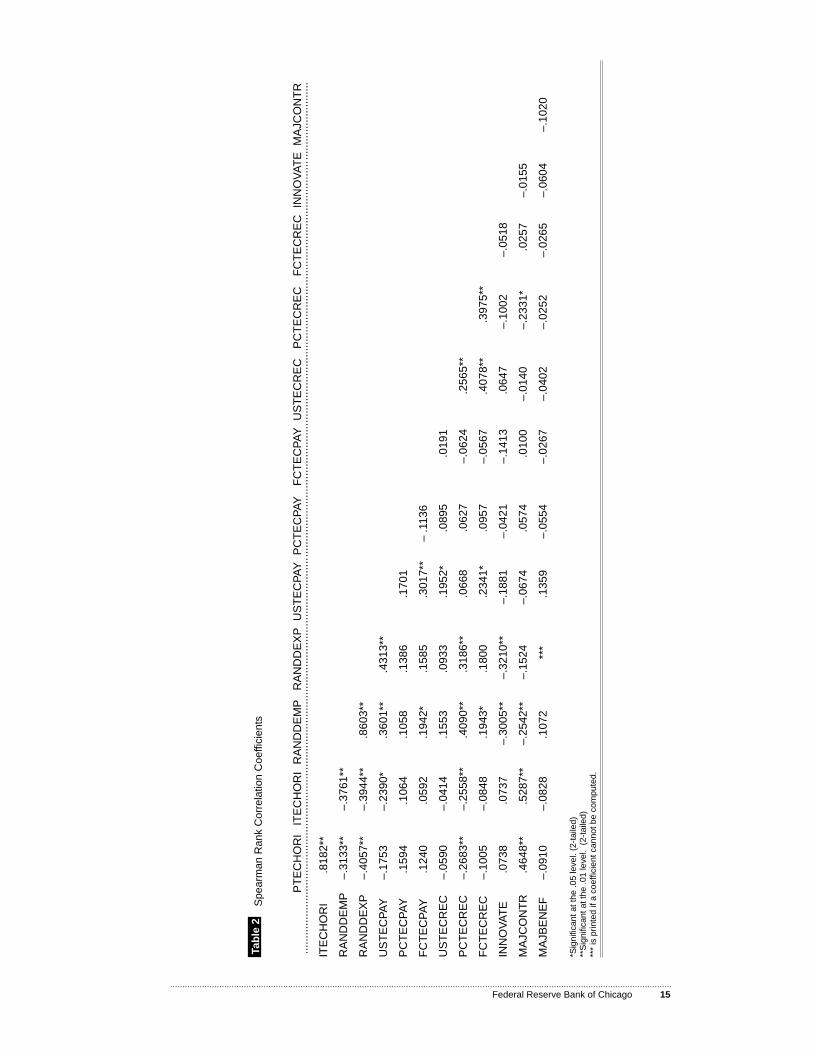
We used two different statistical techniques, CHAID (Chi-squared AutomaticInteraction Detector) analysis6 and logistic regression analysis [Norusis, 1994, 1-30], inanalyzing R&D activities, technology-related payments and receipts, and innovativenessof foreign-owned firms in Ohio. We supplemented them with several nonparametrictests [Conover, 1980; Hollander and Wolfe, 1973; Siegel, 1956]. Our empirical resultsare grouped under R&D activities, innovativeness, and competitiveness of foreign-owned firms in Ohio.
1. R&D Activities of Foreign-Owned Firms in Ohio
This section contains our empirical results on R&D activities in terms of R&Demployment, R&D expenditures, and technology payments to and receipts from U.S.and foreign companies.
R&D employmentFifty-nine percent of the respondents had no R&D employees. The observed
frequencies of the RANDDEMP (R&D employees) responses were significantly differ-ent from equal expected rankings according to the one-sample chi-square test. Ac-cording to table 2 below, RANDDEMP has, as expected, positive and significant rankcorrelation with RANDDEXP (R&D expenditures). It has also positive and significantrank correlation with USTECPAY (technology payments to U.S. companies),FCTECPAY (technology payments to nonparent foreign companies), PCTECREC(technology receipts from foreign parent company), and FCTECREC (technologyreceipts from nonparent foreign companies); and negative and significant rankcorrelation with PTECHORI (country of origin of present technology), ITECHORI(country of origin of initial technology), INNOVATE (major orientation of company’sinnovations), and MAJCONTR (major contribution of company to Ohio’s economy).
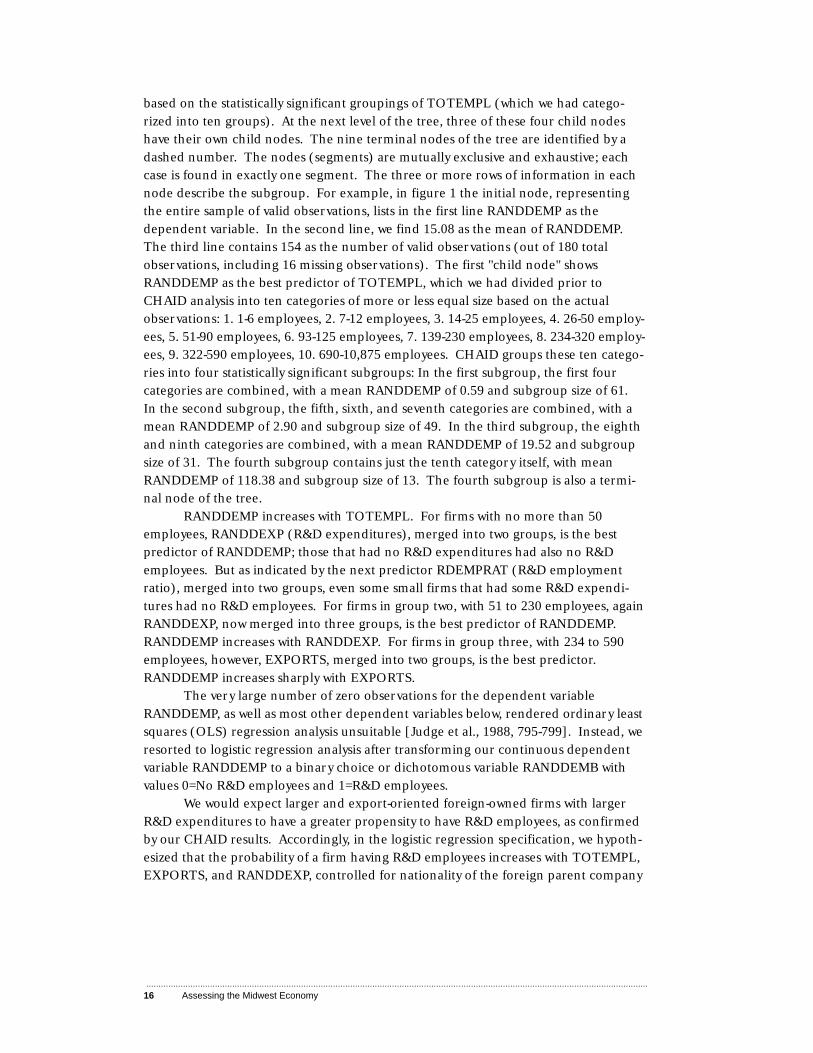
The best CHAID predictor of RANDDEMP, with a mean of 15, is TOTEMPL(total employment), merged into four groups in figure 1 below. In this figure, CHAIDshows the final subgroups (segments) as a tree diagram whose branches (nodes)represent the groups. The tree generates additional nodes as each of these groups issplit further into smaller groups. The initial or the parent (root) node of the treerepresents the total sample of valid observations and is the parent of four child nodes
............................................................................................................................................................................................................Federal Reserve Bank of Chicago 15
Tab
le 2
Spe
arm
an R
ank
Cor
rela
tion
Coe
ffici
ents
PT
EC
HO
RI
ITE
CH
OR
IR
AN
DD
EM
PR
AN
DD
EX
PU
ST
EC
PAY
PC
TE
CP
AY
FC
TE
CP
AY
US
TE
CR
EC
PC
TE
CR
EC
FC
TE
CR
EC
INN
OV
AT
EM
AJC
ON
TR
......
......
......
......
......
......
......
......
......
......
......
......
......
......
......
......
......
......
......
......
......
.....
......
......
......
......
......
......
......
......
......
......
......
......
......
......
......
......
......
......
......
......
......
......
......
......
....
ITE
CH
OR
I.8
182*
*
RA
ND
DE
MP
–.31
33**
–.37
61**
RA
ND
DE
XP
–.40
57**
–.39
44**
.860
3**
US
TE
CP
AY
–.17
53–.
2390
*.3
601*
*.4
313*
*
PC
TE
CP
AY
.159
4.1
064
.105
8.1
386
.170
1
FC
TE
CP
AY
.124
0.0
592
.194
2*.1
585
.301
7**
– .1
136
US
TE
CR
EC
–.05
90–.
0414
.155
3.0
933
.195
2*.0
895
.019
1
PC
TE
CR
EC
–.26
83**
–.25
58**
.409
0**
.318
6**
.066
8.0
627
–.06
24.2
565*
*
FC
TE
CR
EC
–.10
05–.
0848
.194
3*.1
800
.234
1*.0
957
–.05
67.4
078*
*.3
975*
*
INN
OV
AT
E.0
738
.073
7–.
3005
**–.
3210
**–.
1881
–.04
21–.
1413
.064
7–.
1002
–.05
18
MA
JCO
NT
R.4
648*
*.5
287*
*–.
2542
**–.
1524
–.06
74.0
574
.010
0–.
0140
–.23
31*
.025
7–.
0155
MA
JBE
NE
F–.
0910
–.08
28.1
072
***
.135
9–.
0554
–.02
67–.
0402
–.02
52–.
0265
–.06
04–.
1020
*Sig
nific
ant a
t the
.05
leve
l. (2
-tai
led)
**S
igni
fican
t at t
he .0
1 le
vel.
(2-
taile
d)**
* is
prin
ted
if a
coef
ficie
nt c
anno
t be
com
pute
d.
............................................................................................................................................................................................................16 Assessing the Midwest Economy
based on the statistically significant groupings of TOTEMPL (which we had catego-rized into ten groups). At the next level of the tree, three of these four child nodeshave their own child nodes. The nine terminal nodes of the tree are identified by adashed number. The nodes (segments) are mutually exclusive and exhaustive; eachcase is found in exactly one segment. The three or more rows of information in eachnode describe the subgroup. For example, in figure 1 the initial node, representingthe entire sample of valid observations, lists in the first line RANDDEMP as thedependent variable. In the second line, we find 15.08 as the mean of RANDDEMP.The third line contains 154 as the number of valid observations (out of 180 totalobservations, including 16 missing observations). The first "child node" showsRANDDEMP as the best predictor of TOTEMPL, which we had divided prior toCHAID analysis into ten categories of more or less equal size based on the actualobservations: 1. 1-6 employees, 2. 7-12 employees, 3. 14-25 employees, 4. 26-50 employ-ees, 5. 51-90 employees, 6. 93-125 employees, 7. 139-230 employees, 8. 234-320 employ-ees, 9. 322-590 employees, 10. 690-10,875 employees. CHAID groups these ten catego-ries into four statistically significant subgroups: In the first subgroup, the first fourcategories are combined, with a mean RANDDEMP of 0.59 and subgroup size of 61.In the second subgroup, the fifth, sixth, and seventh categories are combined, with amean RANDDEMP of 2.90 and subgroup size of 49. In the third subgroup, the eighthand ninth categories are combined, with a mean RANDDEMP of 19.52 and subgroupsize of 31. The fourth subgroup contains just the tenth category itself, with meanRANDDEMP of 118.38 and subgroup size of 13. The fourth subgroup is also a termi-nal node of the tree.
RANDDEMP increases with TOTEMPL. For firms with no more than 50employees, RANDDEXP (R&D expenditures), merged into two groups, is the bestpredictor of RANDDEMP; those that had no R&D expenditures had also no R&Demployees. But as indicated by the next predictor RDEMPRAT (R&D employmentratio), merged into two groups, even some small firms that had some R&D expendi-tures had no R&D employees. For firms in group two, with 51 to 230 employees, againRANDDEXP, now merged into three groups, is the best predictor of RANDDEMP.RANDDEMP increases with RANDDEXP. For firms in group three, with 234 to 590employees, however, EXPORTS, merged into two groups, is the best predictor.RANDDEMP increases sharply with EXPORTS.
The very large number of zero observations for the dependent variableRANDDEMP, as well as most other dependent variables below, rendered ordinary leastsquares (OLS) regression analysis unsuitable [Judge et al., 1988, 795-799]. Instead, weresorted to logistic regression analysis after transforming our continuous dependentvariable RANDDEMP to a binary choice or dichotomous variable RANDDEMB withvalues 0=No R&D employees and 1=R&D employees.
We would expect larger and export-oriented foreign-owned firms with largerR&D expenditures to have a greater propensity to have R&D employees, as confirmedby our CHAID results. Accordingly, in the logistic regression specification, we hypoth-esized that the probability of a firm having R&D employees increases with TOTEMPL,EXPORTS, and RANDDEXP, controlled for nationality of the foreign parent company
............................................................................................................................................................................................................Federal Reserve Bank of Chicago 17
Fig
ure
1C
HA
ID T
ree
for
R&
D E
mpl
oym
ent
rand
dem
p15
.08
n=15
4
rand
dexp rd
empr
at-1
-00.
00n=
38
all o
ther
s1.
57n=
23
1-5
3.00
n=12
1-4.
0.59
n=61 0
0.00
n=11
-2-
-3-
0-1
0.00
n=23
2. 2.46
n=13
3-5
8.46
n=13
5-7
2.90
n=49
rand
dexp
-4-
-5-
-6-
0-2.
1.31
n=13
3-8
32.6
7n=
18
expo
rts
-7-
-8-
1011
8.38
n=13
-9-
8-9
19.5
2n=
31
tote
mpl
Not
e: .
indi
cate
s m
issi
ng o
bser
vatio
ns in
sub
grou
ps.

............................................................................................................................................................................................................18 Assessing the Midwest Economy
(FPNATION). RANDDEXP, positively signed as expected, is highly significant in table3. EXPORTS, too, is highly significant but is negatively signed contrary to our expecta-tions. TOTEMPL, too, is negatively signed, but is insignificant. Perhaps the mostinteresting result is the overall high significance of FPNATION, based on the Japanese(negatively signed) and Dutch (positively signed) dummies.
R&D expendituresIn accordance with our finding on R&D employment, 51% of the respondents
had no R&D expenditures. The observed frequencies of the RANDDEXP responseswere significantly different from equal expected rankings according to the one-samplechi-square test. According to table 2, RANDDEXP has, as expected, positive andsignificant rank correlation with RANDDEMP. It has also positive and significant rankcorrelation with USTECPAY and PCTECREC, and negative and significant rankcorrelation with PTECHORI, ITECHORI, and INNOVATE.
The best CHAID predictor of RANDDEXP, with a mean of $2.5 million, isRANDDEMP, merged into two groups.7 RANDDEXP increases sharply withRANDDEMP. For firms with smaller RANDDEMP, RANDDEXP rises with predictorRDSRATIO (R&D sales ratio), merged into three groups. For firms with positiveRANDDEXP but relatively low RDSRATIO, FORCOMP (foreign employee compensa-tion) is the best predictor of RANDEXP. Firms with positive foreign compensationhad lower RANDDEXP.
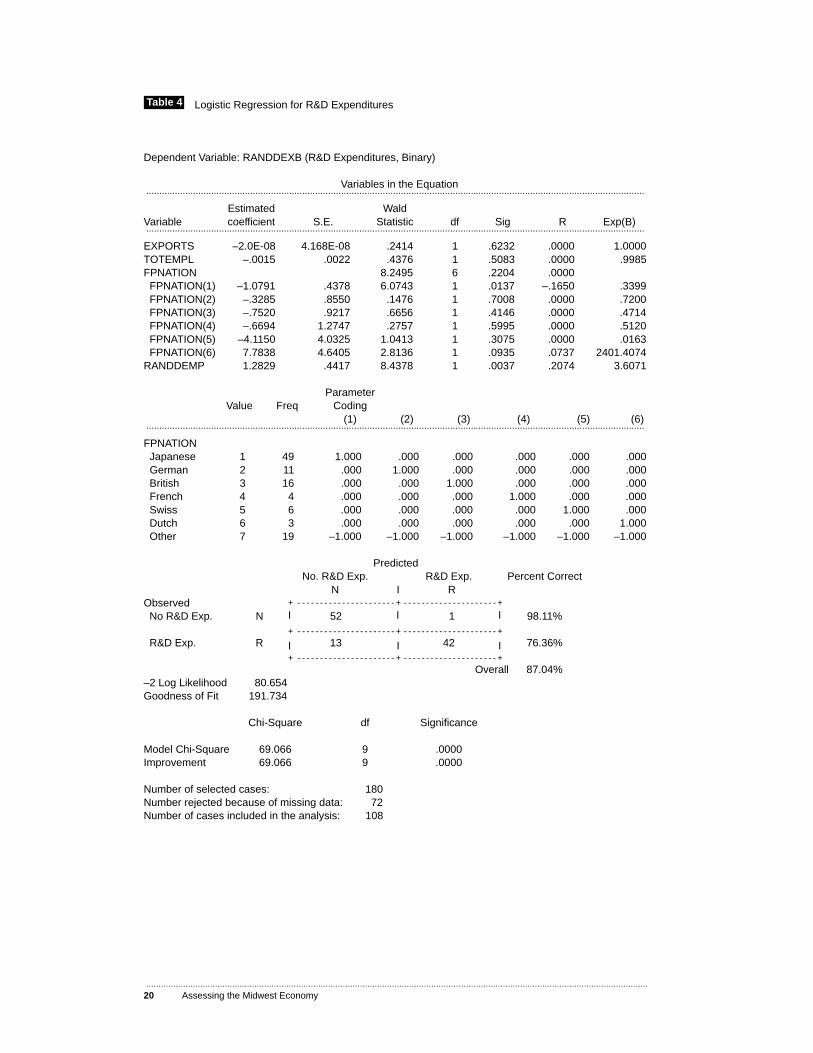
For the logistic regression analysis, we transformed our continuous dependentvariable RANDDEXP, with many zero observations, to a dichotomous variableRANDDEXB with values 0=No R&D expenditures and 1=R&D expenditures. Wewould expect larger and export-oriented foreign-owned firms with larger R&D employ-ment to have a greater propensity to have R&D expenditures, as confirmed by ourCHAID results. Accordingly, in the logistic regression specification, we hypothesizedthat the probability of a firm having R&D expenditures increases with TOTEMPL,EXPORTS, and RANDDEMP, controlled for nationality of the foreign parent company(FPNATION). RANDDEMP, positively signed as expected, is highly significant in table4. Both EXPORTS and TOTEMPL are negatively signed contrary to our expectationsbut are insignificant. Despite the overall insignificance of FPNATION, the Japanesedummy is negatively signed and is highly significant.
After the analysis of the R&D employment and expenditures, attention turns tothe R&D employment/total employment ratio and R&D expenditures/sales ratio inorder to investigate the R&D intensities of the foreign-owned firms in Ohio.8 Wecomputed the R&D employment/employment ratio, as our first measure of R&Dintensity, from the primary variables RANDDEMP and TOTEMPL (total employment).The best CHAID predictor of RDEMPRAT, with an overall mean of 7%,9 isRANDDEMP, merged into two groups. However, as noted earlier, 59% of the respon-dents had no R&D employees. RDEMPRAT has a mean of 0.17 for firms that reportedhaving R&D employees. For firms with R&D employees, RDSRATIO (R&D salesratio), merged into three groups, is the best predictor.

............................................................................................................................................................................................................Federal Reserve Bank of Chicago 19
+ - - - - - - - - - - - - - - - - - - - - - - + - - - - - - - - - - - - - - - - - - - - - +I I I
+ - - - - - - - - - - - - - - - - - - - - - - + - - - - - - - - - - - - - - - - - - - - - +
I I I+ - - - - - - - - - - - - - - - - - - - - - - + - - - - - - - - - - - - - - - - - - - - - +
Table 3 Logistic Regression for R&D Employment
Dependent Variable: RANDDEMB (R&D Employment, Binary)
Variables in the Equation................................................................................................................................................................................................
Estimated WaldVariable coefficient S.E. Statistic df Sig R Exp(B)................................................................................................................................................................................................
EXPORTS –1.1E-06 3.152E-07 11.7626 1 .0006 –.2554 1.0000RANDDEXP 3.39E-05 1.108E-05 9.3714 1 .0022 .2219 1.0000TOTEMPL –.0005 .0012 .1529 1 .6958 .0000 .9995FPNATION 20.1733 6 .0026 .2336 FPNATION(1) –2.4161 .6485 13.8789 1 0002 –.2817 .0893 FPNATION(2) –1.4680 .9901 2.1983 1 .1382 –.0364 .2304 FPNATION(3) –1.5863 1.1664 1.8497 1 .1738 .0000 .2047 FPNATION(4) –2.5823 2.4804 1.0839 1 .2978 .0000 .0756 FPNATION(5) –2.2156 2.5216 .7720 1 .3796 .0000 .1091 FPNATION(6) 11.9308 4.0130 8.8388 1 .0029 .2137 151866.80
ParameterValue Freq Coding
(1) (2) (3) (4) (5) (6)................................................................................................................................................................................................
FPNATION Japanese 1 49 1.000 .000 .000 .000 .000 .000 German 2 11 .000 1.000 .000 .000 .000 .000 British 3 16 .000 .000 1.000 .000 .000 .000 French 4 4 .000 .000 .000 1.000 .000 .000 Swiss 5 6 .000 .000 .000 .000 1.000 .000 Dutch 6 3 .000 .000 .000 .000 .000 1.000 Other 7 19 –1.000 –1.000 –1.000 –1.000 –1.000 –1.000
PredictedNo. R&D Employees R&D Employees Percent Correct
N I RObserved No R&D employees N 63 2 96.92%
R&D employees R 4 39 90.70%
Overall 94.44%–2 Log Likelihood 47.011Goodness of Fit 208.970
Chi-Square df Significance
Model Chi-Square 102.708 9 .0000Improvement 102.708 9 .0000
Number of selected cases: 180Number rejected because of missing data: 72Number of cases included in the analysis: 108
............................................................................................................................................................................................................20 Assessing the Midwest Economy
+ - - - - - - - - - - - - - - - - - - - - - - + - - - - - - - - - - - - - - - - - - - - - +I I I
+ - - - - - - - - - - - - - - - - - - - - - - + - - - - - - - - - - - - - - - - - - - - - +
I I I+ - - - - - - - - - - - - - - - - - - - - - - + - - - - - - - - - - - - - - - - - - - - - +
Table 4 Logistic Regression for R&D Expenditures
Dependent Variable: RANDDEXB (R&D Expenditures, Binary)
Variables in the Equation................................................................................................................................................................................................
Estimated WaldVariable coefficient S.E. Statistic df Sig R Exp(B)................................................................................................................................................................................................
EXPORTS –2.0E-08 4.168E-08 .2414 1 .6232 .0000 1.0000TOTEMPL –.0015 .0022 .4376 1 .5083 .0000 .9985FPNATION 8.2495 6 .2204 .0000 FPNATION(1) –1.0791 .4378 6.0743 1 .0137 –.1650 .3399 FPNATION(2) –.3285 .8550 .1476 1 .7008 .0000 .7200 FPNATION(3) –.7520 .9217 .6656 1 .4146 .0000 .4714 FPNATION(4) –.6694 1.2747 .2757 1 .5995 .0000 .5120 FPNATION(5) –4.1150 4.0325 1.0413 1 .3075 .0000 .0163 FPNATION(6) 7.7838 4.6405 2.8136 1 .0935 .0737 2401.4074RANDDEMP 1.2829 .4417 8.4378 1 .0037 .2074 3.6071
ParameterValue Freq Coding
(1) (2) (3) (4) (5) (6)................................................................................................................................................................................................
FPNATION Japanese 1 49 1.000 .000 .000 .000 .000 .000 German 2 11 .000 1.000 .000 .000 .000 .000 British 3 16 .000 .000 1.000 .000 .000 .000 French 4 4 .000 .000 .000 1.000 .000 .000 Swiss 5 6 .000 .000 .000 .000 1.000 .000 Dutch 6 3 .000 .000 .000 .000 .000 1.000 Other 7 19 –1.000 –1.000 –1.000 –1.000 –1.000 –1.000
PredictedNo. R&D Exp. R&D Exp. Percent Correct
N I RObserved No R&D Exp. N 52 1 98.11%
R&D Exp. R 13 42 76.36%
Overall 87.04%–2 Log Likelihood 80.654Goodness of Fit 191.734
Chi-Square df Significance
Model Chi-Square 69.066 9 .0000Improvement 69.066 9 .0000
Number of selected cases: 180Number rejected because of missing data: 72Number of cases included in the analysis: 108
............................................................................................................................................................................................................Federal Reserve Bank of Chicago 21
We computed the R&D expenditures/sales ratio as our second measure of R&Dintensity, with an overall mean of 2.62%,10 from the primary variables RANDDEXP andSALESREV (total sales). RANDDEXP, merged into two groups, is the best CHAIDpredictor; firms that reported positive RANDDEXP have positive RDSRATIO. For firmswith positive RANDDEXP, RDSRATIO rises with RDEMPRAT, merged into three groups.
Technology payments and receiptsBesides conducting in-house R&D for its own innovativeness, a company may
buy/sell technology from/to other U.S. or foreign companies. In analyzing thesepayments and receipts, we distinguished among U.S. companies, a foreign parentcompany, and other foreign companies as our respondents’ technology partners.
Seventy percent of the respondents made no technology payments to U.S.companies. The observed frequencies of the USTECPAY responses were significantlydifferent from equal expected rankings according to the one-sample chi-square test.According to table 2, USTECPAY has positive and significant rank correlation withRANDDEMP, RANDDEXP, FCTECPAY, USTECREC (technology receipts from U.S.companies), and FCTECREC (technology receipts from other foreign companies),and negative and significant rank correlation with ITECHORI. In CHAID analysis,USTECPAY rises with RANDDEXP, merged into three groups. Almost two-thirds of thefirms in the lowest RANDDEXP group, had no USTECHPAY and no TECHPAY (totaltechnology payments) at all.
Seventy-four percent of the respondents made no technology payments to theirmajor foreign parent companies. The observed frequencies of the PCTECPAY re-sponses were significantly different from equal expected rankings according to theone-sample chi-square test. In CHAID analysis, PCTECPAY rises with TECHPAY,merged into three groups. Among firms in the group with the highest averagePCTECPAY, those with lower FORPURCH (foreign purchases) had lower PCTECPAY.
Ninety-four percent of the respondents made no technology payments to otherforeign companies. The observed frequencies of the FCTECPAY responses weresignificantly different from equal expected rankings according to the one-sample chi-square test. According to table 2, FCTECPAY has positive and significant rank correla-tion with RANDDEMP and USTECPAY.
In CHAID analysis, FCTECPAY rises with TECHPAY, merged into two groups.More than half of the respondents, merged into the first group, however, had noFCTECPAY and no TECHPAY at all. Among firms in the group with positiveFCTECPAY, however, all those with positive PCTECPAY had zero FCTECPAY.
According to the Friedman Two-Way ANOVA and Kendall’s W tests, whichdetermine whether k samples have been drawn from the same population by compar-ing the distributions of k variables, USTECPAY had the highest and FCTECPAY had thelowest mean rank among USTECPAY, PCTECPAY, and FCTECPAY. This difference wasstatistically significant according to the Kendall’s W test but not the Friedman Two-WayANOVA test.
............................................................................................................................................................................................................22 Assessing the Midwest Economy
For an overall view of the technology payments, we added the primary variablesUSTECPAY, PCTECPAY, and FCTECPAY to focus on TECHPAY. Sixty percent of therespondents made no technology payments at all. In CHAID analysis, TECRPBAL(technology receipts-payments balance), merged into five groups, is the best predictorof TECHPAY. The larger the negative balance the larger was TECHPAY. Firms withzero TECRPBAL, about half of the respondents, had the smallest TECHPAY. Evenfirms with positive TECRPBAL had positive TECHPAY but on average less than thosewith negative TECRPBAL.
These results thus far indicate that most of our respondents not only do notundertake much in-house R&D but also do not buy technology from other firms,including their foreign parent companies. So perhaps it is not surprising that most ofthem also do not have technology receipts.
Eighty-four percent of the respondents had no technology receipts from U.S.companies. The observed frequencies of the USTECREC responses were significantlydifferent from equal expected rankings according to the one-sample chi-square test(i.e., R&D employees were not equally distributed among the different companies inthe sample). According to table 2, USTECREC has positive and significant rankcorrelation with USTECPAY, PCTECREC, and FCTECREC.
In CHAID analysis, USTECREC increases with TECHREC (total technologyreceipts), merged into three groups. The sign test revealed that USTECREC had astatistically significant tendency toward being lower than USTECPAY. However, theWilcoxon Matched-pairs signed-ranks test did not confirm this difference.
Ninety-four percent of the respondents had no technology receipts from theirmajor foreign parent companies. The observed frequencies of the PCTECRECresponses were significantly different from equal expected rankings according to theone-sample chi-square test. According to table 2, PCTECREC has positive and signifi-cant rank correlation with RANDDEMP, RANDDEXP, and FCTECREC, and negativeand significant rank correlation with PTECHORI (country of origin of present tech-nology), ITECHORI (country of origin of initial technology), and MAJCONTR (majorcontribution to Ohio’s economy).
In CHAID analysis, PCTECREC increases with TECHREC (total technologyreceipts), merged into two groups. Most of the respondents that had no PCTECREC,also had no TECHREC. But only one-third of the respondents that had positiveTECHREC also had positive PCTECREC. Among the firms that had positiveTECHREC, those with higher RDEMPRAT had larger PCTECREC.
Both the Wilcoxon Matched-pairs signed-ranks test and the sign test revealedthat PCTECREC had a statistically significant tendency toward being lower thanPCTECPAY. This suggests that, in accordance with the theory of DFI and with theempirical results on IDFI in the United States, technology transfers have occurred to agreater extent from foreign-based MNCs to their Ohio affiliates than the reverse.
Ninety-three percent of the respondents had no technology receipts from otherforeign companies. The observed frequencies of the FCTECREC responses weresignificantly different from equal expected rankings according to the one-sample chi-square test. According to table 2, FCTECREC has positive and significant rank correla-tion with RANDDEMP, USTECPAY, USTECREC, and PCTECREC.

............................................................................................................................................................................................................Federal Reserve Bank of Chicago 23
In CHAID analysis, FCTECREC increases with TECHREC, merged into twogroups. Most of the respondents that had no FCTECREC also had no TECHREC. Butonly one-third of the respondents that had positive TECHREC also had positiveFCTECREC. Neither the Wilcoxon Matched-pairs signed-ranks test nor the sign testrevealed a statistically significant difference between FCTECPAY and FCTECREC.
According to the Friedman Two-Way ANOVA and Kendall’s W tests, whichdetermine whether k samples have been drawn from the same population by compar-ing the distributions of k variables, USTECREC had the highest and FCTECREC hadthe lowest mean rank among USTECREC, PCTECREC, and FCTECREC. This differ-ence was statistically significant according to the Kendall’s W test but not the FriedmanTwo-Way ANOVA test.
For an overall view of the technology receipts, we added the primary variablesUSTECREC, PCTECREC, and FCTECREC. Eighty-two percent of the respondents hadno technology receipts at all. The best CHAID predictor for TECHREC, as it was forTECHPAY, is TECRPBAL, merged into three groups. Respondents with the relativelylarger average negative TECRPBAL had greater TECHREC than those with relativelysmaller average negative or zero TECRPBAL. Respondents with the largest averagepositive TECRPBAL, however, had the greatest average TECHREC.
We extended our investigation of the total technology payments and receipts bystudying their difference in terms of the technology receipts-payments balance(TECRPBAL). Fifty-five percent of the respondents had a zero receipts-paymentsbalance; only 11% had a positive balance. In CHAID analysis, respondents with zeroTECHREC, 81% of those for which TECRPBAL could be computed, had on average anegative balance. Respondents with positive TECHREC, on the other hand, had apositive balance.
Our finding that most foreign-owned companies in Ohio had either zero ornegative technology receipts-payments balance reflects the chronic negative balance atthe national level as shown in table 5. According to the U.S. Department of Com-merce, every year during the period from 1987 through 1993, the payments of royaltyand license fees by U.S. affiliates of foreign companies were substantially larger thantheir receipts.
Table 5 Technology Receipts-Payments Balance of U.S. Affiliates ($ million)
1987 1988 1989 1990 1991 1992 1993.....................................................................................................................................................................
Receipts 209 243 331 364 548 666 775
Payments 1,105 1,244 1,580 1,863 2,691 2,918 3,088
Balance –896 –1,001 –1,249 –1,499 –2,143 –2,253 –2,313
Source: Fouch, Gregory G., “Foreign Direct Investment in the United States: Detail for Historical-Cost Position andRelated Capital and Income Flows, 1993,” Survey of Current Business, August 1994, pp. 98-126.
............................................................................................................................................................................................................24 Assessing the Midwest Economy
2. Innovativeness of Foreign-Owned Firms in Ohio
As is often done, we distinguished between product-oriented and process-oriented innovativeness in examining the innovativeness of foreign-owned firms inOhio. The observed frequencies of the binary INNOVATE responses, 1=new productsand 2=new processes, were significantly different from equal expected rankingsaccording to both the one-sample chi-square test and the binomial test. According totable 2, INNOVATE has negative and significant rank correlation with RANDDEMPand RANDDEXP, indicating that product-oriented innovativeness required more R&Dthan process-oriented innovativeness.
In CHAID analysis, 63% of the 156 respondents indicated “new products” asopposed to “new processes” as their major innovatory orientation. The best predictorof INNOVATE is SERVICE (prompt and reliable service) as a source of competitive-ness, merged into two groups. Respondents who regarded SERVICE as “very impor-tant” had a significantly lower “new product” orientation than others. Among firmswith the higher “new product” orientation, those with the higher RDEMPRAT all had“new product” orientation. Among respondents who regarded SERVICE as “veryimportant,” the best predictor of INNOVATE is SALESREV, merged into five groups.Although there is no monotonic relationship between the two, firms in the largestsales revenue group had the strongest “new product” orientation.
Closely related to the R&D activities and innovativeness of the foreign-ownedfirms would be their major contribution to Ohio’s economy (MAJCONTR), which wedefined in three distinct ways. The observed frequencies of the MAJCONTR responseswere significantly different from equal expected rankings according to the one-samplechi-square test. “The creation of a new enterprise in an existing industry” was the majorcontribution of 55% of the respondents. Another 12% reported that “starting a newindustry” was their major contribution. The remaining responses were “foreign acquisi-tion of an existing U.S.-owned enterprise to form present company” (i.e., brownfieldinvestment). This implies that two-thirds of the responding companies in our surveywere started as greenfield investments. This is corroborated by the fact that two-thirds ofthe respondents reported directly that their initial foreign-ownership percentage wasgreater than zero. According to table 2, MAJCONTR has positive and significant rankcorrelation with PTECHORI and ITECHORI, indicating that greenfield investmentswere primarily foreign-technology based, and has negative and significant rank correla-tion with RANDDEMP and PCTECREC, indicating that brownfield investments wererelatively more R&D-oriented than greenfield investments.
In CHAID analysis, IFOWNPER (initial foreign ownership percentage), mergedinto two groups, is the best predictor of MAJCONTR. Among firms that were initiallyU.S. owned, 79% singled out “foreign acquisition of an existing U.S.-owned enterpriseto form present company” as their major contribution. PTECHORI, merged into twogroups, is the best predictor of MAJCONTR for the initially U.S.-owned firms. Thosethat had a foreign country as the origin of their present technology put a much higheremphasis on “creation of an altogether new enterprise to form present company” thanthose that had the United States as the origin.
............................................................................................................................................................................................................Federal Reserve Bank of Chicago 25
Another issue relating to the R&D activities and innovativeness of foreign-owned companies is the major beneficiaries of their innovativeness (MAJBENEF). Theobserved frequencies of the MAJBENEF responses were significantly different fromequal expected rankings according to the one-sample chi-square test. “Company’scustomers” were the major beneficiaries of all but one of the 167 respondents’sinnovativeness. Hence, CHAID analysis was pointless for this variable.
3. Competitiveness of Foreign-Owned Firms in Ohio
Regardless of their own R&D intensities and innovativeness, foreign-owned firms,relying on their existing store of knowledge or infusion of new technologies from theirforeign parents, could witness changes in the location of their competitors, in theirsources of competitiveness, and in the levels of their competitiveness over time.
When we asked our respondents to specify the location of their major competi-tors, “the United States” (excluding Ohio) was by far the most frequently specifiedlocation of major competitors, followed by “Ohio” and then “other foreign countries.”“Foreign parent company’s country” was the least important region of competitors. InCHAID analysis, EJTGRANT (expected job training grants as an incentive to locate inOhio), merged into two groups, is the best predictor of MAJCOMP.
We asked our respondents to rank separately the following sources of theircompetitiveness:
i. Lower prices of products (LOWPRICE)ii. Higher quality of products (HIQUALIT)
iii. Prompt and reliable service (SERVICE)iv. Product innovation (PRODUCT)v. Process innovation (PROCESS)
vi. Other source of competitiveness (OTHSOURS)According to the Friedman Two-Way ANOVA and Kendall’s W tests, which
determine whether k samples have been drawn from the same population by compar-ing the distributions of k variables, the responses to the six sources of competitivenesswere significantly different from each other.
The three most important questionnaire-specified sources of competitivenessfor the respondents were HIQUALIT, SERVICE, and PRODUCT, based on a largesample of 163 responses that ignored OTHSOURS, to which only 17 companies hadresponded out of 180 total companies in our sample. However, based on a muchsmaller sample of 15 companies that had responded to all sources of competitiveness,including OTHSOURS, OTHSOURS ranked the highest among all six factors, fol-lowed by HIQUALIT, SERVICE, and PRODUCT. “Name and reputation of thecompany,” “marketing creativity,” and “delivery” were the most important respondent-specified “other sources” of competitiveness.
When we asked our respondents to tell us what happened to their competitive-ness (COMPETIT) since the time of ownership by their present major foreign parents,almost two-thirds of the respondents indicated that their competitiveness had in-creased since the time of ownership by their present major foreign parents. Onlyabout 6% reported that their competitiveness had decreased.
............................................................................................................................................................................................................26 Assessing the Midwest Economy
This result is consistent with the finding of Li and Guisinger (1991) thatforeign-controlled firms in the United States had, both in the aggregate and by majorindustry group, lower business failure rates than domestically owned firms. These areboth empirical findings that we would expect on the basis of the ownership-advantageargument for DFI.
The best overall CHAID predictor of COMPETIT is FOUNYEAR (foundationyear of the Ohio company), merged into four groups. Although the relationshipbetween the two is not monotonic, it appears that the older firms were able to improvetheir competitiveness relatively more than the younger firms.
V. Summary of Empirical Results
Our empirical results can be summarized as follows:1. Majorities of the respondents had neither R&D employees nor R&D expen-
ditures, reflecting their R&D dependence on their foreign parent companies. More-over, majorities of the respondents had neither payments nor receipts for technology.As expected, R&D employment and R&D expenditures, as well as the R&D employ-ment and sales ratios, were highly and positively correlated.
2. The best CHAID predictor of R&D employment was total employment.Among the larger companies, the more export-oriented ones had a greater number ofR&D employees. The best CHAID predictor of R&D expenditures was R&D employ-ment. Among the companies with smaller R&D employment, those with larger R&Dsales ratios had larger R&D expenditures. In logistic regressions, the likelihood ofR&D employment increased, as expected, with R&D expenditures but decreased,contrary to our expectations, with exports. Perhaps the most interesting result wasthat Japanese-owned companies were significantly less likely and Dutch-owned compa-nies significantly more likely to have R&D employment. The likelihood of R&Dexpenditures increased, as expected, with R&D employment, but not with exports andtotal employment. Moreover, Japanese-owned companies were significantly less likelyto have R&D expenditures.
3. Our 7% estimate of the R&D employment ratio was greater than the U.S.Department of Commerce 1992 benchmark estimate of 4.8% for all foreign-ownednonbank firms in the United States. The best CHAID predictor of R&D employmentratio was R&D employment. Among the companies with larger R&D employment,those with higher R&D sales ratios had higher R&D employment ratios. Our 2.62%estimate of the R&D sales ratio was the same as the U.S. Department of Commerce1992 benchmark estimate of 2.6% for all foreign-owned nonbank firms in the UnitedStates. The best CHAID predictor of R&D sales ratio was R&D expenditures. Amongthe companies with larger R&D expenditures, those with higher R&D employmentratios had higher R&D sales ratios.
4. Among the three different components of total technology payments—payments to U.S. companies payments to the foreign parent company, and paymentsto nonparent foreign companies—the first component had the highest and the thirdcomponent had the lowest mean rank, suggesting that the United States was the most
............................................................................................................................................................................................................Federal Reserve Bank of Chicago 27
important source of technology for those companies making technology payments.Likewise, among the three different components of total technology receipts—receiptsfrom U.S. companies, receipts from the foreign parent company, and receipts fromnonparent foreign companies—the first component had the highest and the thirdcomponent had the lowest mean rank, suggesting that the United States was also themost important source of technology receipts. Technology receipts from the foreignparent company were significantly lower than technology payments to the foreignparent company, suggesting that, in accordance with the theory of DFI, technologytransfers have occurred to a greater extent from foreign-based MNCs to their Ohioaffiliates than the reverse.
5. The best CHAID predictor of total technology payments as well as of totaltechnology receipts was, not surprisingly, technology receipts-payments balance. Fifty-five percent of the respondents had a zero receipts-payments balance; only 11% had apositive balance. Our finding that most foreign-owned companies in Ohio had eitherzero or negative technology receipts-payments balance is consistent with a chronicallynegative balance at the national level.
6. The majority of respondents indicated “new products” as opposed to “newprocesses” as their major innovatory orientation. “The creation of a new enterprise”was the major contribution of 55% of the respondents. Another 12% reported that“starting a new industry” was their major contribution. This implies that two-thirds ofthe responding companies in our survey were started as greenfield investments.“Company’s customers” were the major beneficiaries of all but one of the 167respondents’s innovativeness.
7. “The United States” (excluding Ohio) was by far the most frequently speci-fied location of the major competitors, followed by “Ohio” and “other foreign coun-tries.” “Foreign parent company’s country” was the least important region of competi-tors. The three most important sources of competitiveness for the respondents werehigher quality of products, prompt and reliable service, and product innovation.Almost two-thirds of the respondents indicated that their competitiveness had in-creased since the time of ownership by their present major foreign parents. Onlyabout 6% reported that their competitiveness had decreased.
On the whole, our empirical results suggest that most foreign-owned firms inOhio appear to have contributed to the technological capabilities and innovativenessof the state’s economy, more through technology transfers from their foreign parentsand less through their own R&D activities.
............................................................................................................................................................................................................28 Assessing the Midwest Economy
References
Aguilar, Linda,“Foreign Direct Investment in the U.S. and Midwest,” Chicago Fed Letter, No. 105, May 1996.
Ajami, Riad A. and David A. Ricks,“Motives of Non-American Firms Investing in the United States,” Journal of International Business Studies, 12(Winter 1981), pp. 25-34.
Arrison, Thomas S., C. Fred Bergsten, Edward M. Graham, and Martha Caldwell, (eds.),Japan’s Growing Technological Capability: Implications for the U.S. Economy, National Academy Press Washing-ton, DC, 1992.
Footnotes
1 The term “R&D” covers a continuum of organized activities that are aimed at the discovery, assimilation,transfer, or application of knowledge, and that consist of three categories: basic research, appliedresearch, and development (Reid and Schriesheim [1996, 29].
2 Analytically, DFI differs from portfolio foreign investment in terms of presence of foreign managerialcontrol. Statistically, however, it is defined by the U.S. Department of Commerce in terms of 10% ormore foreign ownership.
3 This is the second in a series of papers containing our empirical findings derived from a comprehensiveinvestigation of foreign-owned firms in Ohio. The issues investigated include locational factors, state andlocal incentives, production and sales, employment, technology, innovation, and competitiveness. In ourfirst paper, Erdilek and Wolf (1997), we studied the country origins of the present and initial technolo-gies of these firms. We found that, consistent with DFI theory, for most firms, both the present and initialtechnologies have been sourced from their parent-firm countries.
4 For an example of the “Big Problem” that confronted and defeated one of Honda’s suppliers, seeMilbank [1990].
5 The results reported here differ from those in Wolf [1993] which were not obtained through the use ofCHAID (Chi-squared Automatic Interaction Detector) [Magidson, 1993] and logistic regression analyses[Norusis, 1994, 1-30].
6 CHAID is a module of SPSS/Windows for segmentation modeling to divide a population into segmentsthat differ in terms of a certain criterion. The CHAID algorithm has three stages: Merging, splitting, andstopping. It first divides a population into at least two mutually exclusive groups using the categories ofthe statistically most significant predictor variable. This variable is the one with the lowest p value, i.e.,the probability that we would observe the sample relationship between the predictor variable and thedependent variable if they were statistically independent. The predictor variable that has the lowest pvalue is the one least likely to be unrelated to the dependent variable [Magidson, 1993].
7 The rest of the CHAID figures, available on request, are not presented here due to space limits.
8 Our remaining empirical results are not based on logistic regression analysis because either they involveother R&D related activities, derived from or closely related to R&D employment and R&D expendituresfor which logistic regressions were reported, or they involve ordinal variables for which logistic regressionanalysis would not be meaningful.
9 Acording to the U.S. Department of Commerce 1992 benchmark survey of IDFI, the R&D employmentof non-bank U.S. affiliates was 4.8% of their total employment [Zeile, 1994, 165], much smaller than ourestimate. In 1989, the ratio of R&D engineers and scientists (E&S) to the total labor force in the UnitedStates was 76 per 10,000 employees [National Science Board, 1993, 67]. The ratio of all S&E in the U.S.labor force, however, was 298 per 10,000 workers, compared to 380 per employees in Japan [NationalScience Board, 1993, 84].
10 According to the U.S. Department of Commerce 1992 benchmark survey of inward DFI, the R&D salesratio of non-bank U.S. affiliates was 2.6%[Zeile, 1994, 165], the same as our estimate. In 1991, thenondefense R&D/GDP ratio in the United States was 1.9% compared with 3.0% in Japan [NationalScience Board, 1993, 99].
............................................................................................................................................................................................................Federal Reserve Bank of Chicago 29
Blomstrom, Magnus,Host Country Benefits of Foreign Investment, NBER Reprint No. 1703, National Bureau of EconomicResearch, Cambridge, MA, 1992.
Blomstrom, Magnus, and Ari Kokko,Policies to Encourage Inflows of Technology through Foreign Multinationals, NBER Working Paper No. 4289,National Bureau of Economic Research, Cambridge, MA, 1993.
Blomstrom, Magnus, Ari Kokko, and Mario Zejan,Host Country Competition, Labor Skills, and Technology Transfer by Multinationals, NBER Reprint No. 1955,National Bureau of Economic Research, Cambridge, MA, 1995.
Cantor, David J.,“Foreign Investment in the U.S. Steel Industry,” Foreign Direct Investment: Effects on the United States,Committee on Banking, Finance and Urban Affairs, U.S. House of Representatives, U.S. GovernmentPrinting Office, Washington, D.C.,1989, pp. 100-109.
Conover, W. J.,Practical Nonparametric Statistics. John Wiley & Sons, New York, NY, 1980.
Craig, Steven G., Thomas R. DeGregori, Janet E. Kohlhase, and Michael G. Palumbo,The Economic Impact of Honda’s U.S. Operations: Production, Sales and Distribution, and Technology Transfer,Department of Economics, University of Houston, Texas, unpublished report prepared for Honda NorthAmerica, May 1994.
Dalton, Donald H. and Manuel G. Serapio,Globalizing Industrial Research and Development, Office of Technology Policy, U.S. Department of Com-merce, Washington, D.C., October 1995.
Dunning, John H.,Multinational Enterprises and the Global Economy, Addison-Wesley Publishing Company, Reading, MA, 1993.
Erdilek, Asim and Milton A. Wolf,“Technology Origins of Foreign-Owned Firms in Ohio,” Technovation, 1997 (forthcoming).
Fahim-Nader, Mahnaz and William J. Zeile,“Foreign Direct Investment in the United States, Survey of Current Business, July 1996, pp. 102-130.
Fitzgerald, Kevin R.,“Medal of Excellence: Honda Wins!” Purchasing, 21 September 1995, pp. 2-9
Florida, Richard and Martin Kenney,“The Globalization of Japanese R&D: The Economic Geography of Japanese R&D Investment in theUnited States,” Economic Geography, Vol. 70, No. 4, October 1994, pp. 344-369.
Fouch, Gregory G.,“Foreign Direct Investment in the United States: Detail for Historical-Cost Position and Related Capitaland Income Flows, 1993,” Survey of Current Business, August 1994, pp. 98-126.
GAO(U.S. General Accounting Office), Foreign Investment: Growing Japanese Presence in the U.S. Auto Industry,Washington, D.C., March 1988.
Giese, Alenka S.,The Opening of Midwest Manufacturing to Foreign Companies: The Influx of Foreign Direct Investment, RegionalEconomic Issues Working Paper Series, WP-1989-5, February 1989.
Graham, Edward M. and Paul R. Krugman,Foreign Direct Investment in the United States, Third edition, Institute for International Economics, Washing-ton, D. C., 1995.
Hollander, Myles and Douglas A. Wolfe,Nonparametric Statistical Methods. New York: John Wiley & Sons, 1973.
Judge, George G., R. Carter Hill, William E. Griffiths, Helmut Lutkepohl, and Tsoung-Chao Lee,Introduction to the Theory and Practice of Econometrics. New York: John Wiley & Sons, 1988.
............................................................................................................................................................................................................30 Assessing the Midwest Economy
KPMG Peat Marwick,1990 Survey of Foreign-Based Companies with U.S. Headquarters in Ohio, KPMG Peat Marwick, Cleveland, OH,1990.
Li, Jiatao and Stephen Guisinger,“How Well Do Foreign Firms Compete in the United States?”Business Horizons (November/December),1991.
Lipsey, Robert E.,Foreign Direct Investment in the United States: Changes Over Three Decades, NBER Reprint No. 1851, NationalBureau of Economic Research, Cambridge, MA, 1993.
Magidson, Jay,SPSS for Windows: CHAID, SPSS Inc., Chicago, IL, 1993.
McCulloch, Rachel,“Why Foreign Corporations Are Buying into U.S. Business,” The Annals of the American Academy of Politicaland Social Science, 516 (July 1991), pp. 169-182.
Milbank, Dana,“Culture Clash: Making Honda Parts, Ohio Company Finds, Can Be Road to Ruin - Variety StampingTried Hard And Still Failed Tests, Ended Up in Bankruptcy - But Other U.S. Firms Succeed,” The WallStreet Journal, 5 October 1990, p. A1.
Mowery, David C. and David J. Teece,“The Changing Place of Japan in the Global Scientific and Technological Enterprise,” in Arrison,Thomas S., et al., (eds.), Japan’s Growing Technological Capability: Implications for the U.S. Economy, NationalAcademy Press Washington, DC, 1992, pp. 106-135.
National Science Board,Science & Engineering Indicators - 1993, Washington, D.C., U.S. Government Printing Office.
National Science Board,Science & Engineering Indicators - 1996, Washington, D.C., U.S. Government Printing Office.
Norusis, Marija J.,SPSS for Windows 6.0, SPSS Inc., Chicago, IL, 1993.
Norusis, Marija J.,SPSS Advanced Statistics 6.1, SPSS Inc., Chicago, IL, 1994.
OECD (Organization for Economic Cooperation and Development),The Performance of Foreign Affiliates in OECD Countries, Organization for Economic Cooperation andDevelopment, Paris, 1994.
OTA (Office of Technology Assessment),Multinationals and the National Interest: Playing by Different Rules, U.S. Government Printing Office,Washington, D. C., 1993, chapter 4.
OTA (Office of Technology Assessment),Multinationals and the U.S. Technology Base, U.S. Government Printing Office, Washington, D.C., 1994, pp.150-153.
Reid, Proctor P. and Alan Schriesheim (editors),Foreign Participation in U.S. Research and Development: Asset or Liability? National Academy of Engineering,National Academy Press, Washington, D.C., 1996.
Sametz, Arnold and Jules Backman,“Why Foreign Multinationals Invest in the United States,” Challenge (March/April 1974) pp. 44-47.
Siegel, Sidney,Nonparametric Statistics for the Behavioral Sciences, McGraw-Hill, New York, NY, 1956.
Wolf, Milton A.,A Profile of Direct Foreign Investment in Ohio, Unpublished Ph.D. Dissertation, Case Western ReserveUniversity, Cleveland, OH, 1993.
Zeile, William J.,“Foreign Direct Investment in the United States: 1992 Benchmark Survey Results,” Survey of CurrentBusiness, July 1994, pp. 154-186.