Embed Size (px)
Citation preview
Are Minnesota Workers Ready for Retirement? Trends in Plan Sponsorship, Participation, and Preparedness
Joelle Saad-Lessler, Teresa Ghilarducci, and Kate Bahn


01OVERVIEWMinnesota workers, like all American
workers, need workplace retirement
accounts to achieve an adequate retirement
income. But only a bare majority of workers
in Minnesota have access to retirement
accounts at work, and the share of workers
who do have these accounts is falling.
Though it is tempting to attribute the lack of
retirement readiness for Minnesota workers
to a recession, the reason for the lack of
pensions is structural - not enough people
have retirement coverage at work and,
when they do, the amounts saved are often
inadequate.
• Between 1999-2001 and 2009-2011,
the availability of employer-sponsored
retirement plans in Minnesota declined by
six percentage points, from 68 percent to 62
percent.1
Even when an employer sponsored
retirement plan is available, participation
is not universal. As a result, over half (51
percent) of Minnesota residents of prime-
age are not covered by a retirement plan as
of 2009-2011.
• 46 percent of Minnesota workers (1 million
people) did not participate in employer-
sponsored retirement plans in 2009-2011,
largely because their employer did not offer
one. In addition, 222,516 prime-age people
in Minnesota were not working in 2009-
2011 and, by definition, did not participate in
a current employer’s retirement plan.
• Almost all workers experienced a decline
in retirement plan sponsorship, but the
size of the drop differed across worker
demographics and classification. The only
workers whose retirement plan sponsorship
increased were the declining proportion
of workers who are covered by a union
contract at work.
• Workers covered by a union contract had
an increase in retirement plan sponsorship
of 1 percent, while workers who were not
covered by a union contract had a decrease
in sponsorship of 11 percent.
This paints a bleak picture of the future of
retirement income security in Minnesota,
and it has immediate implications for the
financial preparedness of Minnesota’s
residents near retirement.
• 42 percent of households in which the
head is near retirement age (55-64 years
old) will have to subsist almost entirely on
Social Security income or will not be able to

02retire at all due to negligible savings.2
The first section of this report looks at the
decline in sponsorship of retirement plans
by employers in Minnesota, including a
demographic breakdown. The second
section analyzes the rate of participation in
employer-sponsored retirement plans. The
third section examines if the group nearest
retirement (those aged 55-64 years old) is
prepared financially for post-work life. The
technical appendix lays out the report’s
methodology in detail.
Both the first and second sections rely on
2000-2002 and 2010-2012 data from the
Current Population Survey (CPS), a program
administered jointly by the Census Bureau
and the Bureau of Labor Statistics.3 The
third section uses data from the 10th and
11th waves of the 2008 panel of the Survey
of Income and Program Participation
(SIPP).4
The report findings suggest that the decline
in employer sponsorship of retirement plans
and the shift away from traditional pension,
defined benefit-type plans and toward
401(k)-type defined contribution plans are
jeopardizing the retirement income security
of Minnesota residents. This will result in
a greater number of workers experiencing
a dramatic drop in living standards as they
age.
03
RETIREMENT PLANSPONSORSHIPBY EMPLOYERS
Section One:
Employers have traditionally played an
integral role in the U.S. retirement system.
They have contributed to their employees’
retirement plans as part of a benefits
package designed to attract and keep
quality workers, bolstering their workers’
assets and easing the burden of saving for
retirement.
An employer who chooses to sponsor a
retirement plan for its employees plays a
significant role in the administration and
function of the plan. They decide what
type of plan to offer, how much they want
to contribute to the plan, and, in the case
of defined benefit plans, the investment
strategy of the accumulated funds.
The employer also decides whether to
offer a defined benefit (DB) and/or defined
contribution (DC) retirement plan. A DB plan
uses a formula that typically credits every
year of service with a certain percentage of
pay to determine lifetime pension benefits.
The employer invests the assets and
guarantees the pension, and the worker
implicitly pays for the DB plan with reduced
take-home earnings. With DC plans—most
are 401(k)s—the employer provides access
to a tax-advantaged savings account that
employees can contribute to on a voluntary
basis. The worker, not the employer, is in
charge of investing the assets. Employers
may also contribute to a DC plan, though
the level of contribution can vary from year
to year and employers are not required to
contribute anything.
This employer-sponsored system of
retirement savings has been an effective
way to save for retirement income
security in the U.S. in the past because the
compensation devoted to retirement asset
building is automatically deducted from
an employee’s paycheck, thereby reducing
the temptation to spend this portion of the
employee’s compensation package on day-
to-day consumption budget needs.

04Employer Sponsorship of Retirement Plans in Minnesota is DecliningThis report uses data from the Current
Population Survey (CPS) to analyze
employer sponsorship of retirement plans.
The CPS asked Minnesota residents who
worked in the previous calendar year5
about their retirement plan coverage
and participation.6 Responses to
these questions were used to examine
sponsorship levels for Minnesota residents
aged 25-64. To ensure all results are robust,
three years of data are pooled together
and averaged to yield information on each
point in time. In other words, data from
2000-2002 (2010-2012) yield information
on sponsorship levels in 1999-2001 (2009-
2011); we refer to these years hereon as
2001 (2011).
The CPS data reveal that Minnesota
workers’ access to employer-sponsored
retirement plans has fallen by six
percentage points in the past ten years –
signifying an overall downward trend in
retirement security for Minnesota residents.
As of 2011, only 62 percent of employed
Minnesota residents aged 25-64 worked
for an employer who offered access to a
retirement savings plan (DB and/or DC
plans described above). In other words, by
2011 about four out of ten workers residing
in Minnesota did not have access to a
retirement plan at work.
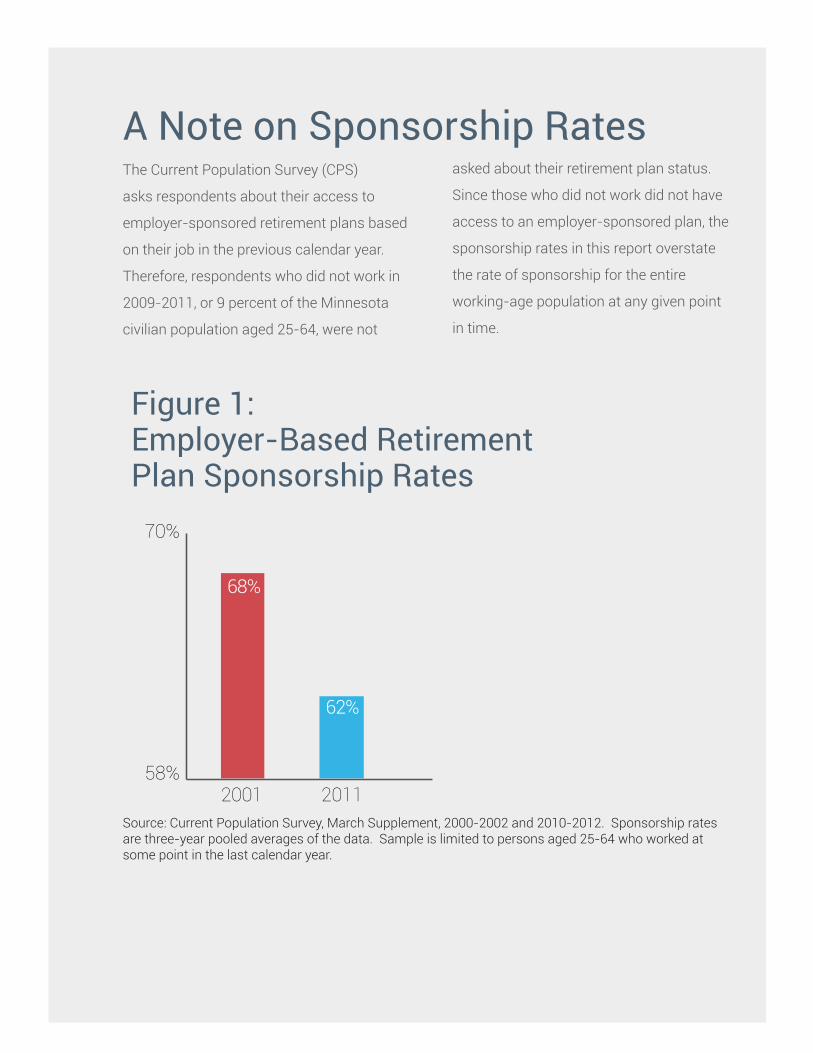
Figure 1:Employer-Based Retirement Plan Sponsorship Rates
A Note on Sponsorship RatesThe Current Population Survey (CPS)
asks respondents about their access to
employer-sponsored retirement plans based
on their job in the previous calendar year.
Therefore, respondents who did not work in
2009-2011, or 9 percent of the Minnesota
civilian population aged 25-64, were not
58%
70%
2001 2011
68%
62%
Source: Current Population Survey, March Supplement, 2000-2002 and 2010-2012. Sponsorship rates are three-year pooled averages of the data. Sample is limited to persons aged 25-64 who worked at some point in the last calendar year.
asked about their retirement plan status.
Since those who did not work did not have
access to an employer-sponsored plan, the
sponsorship rates in this report overstate
the rate of sponsorship for the entire
working-age population at any given point
in time.
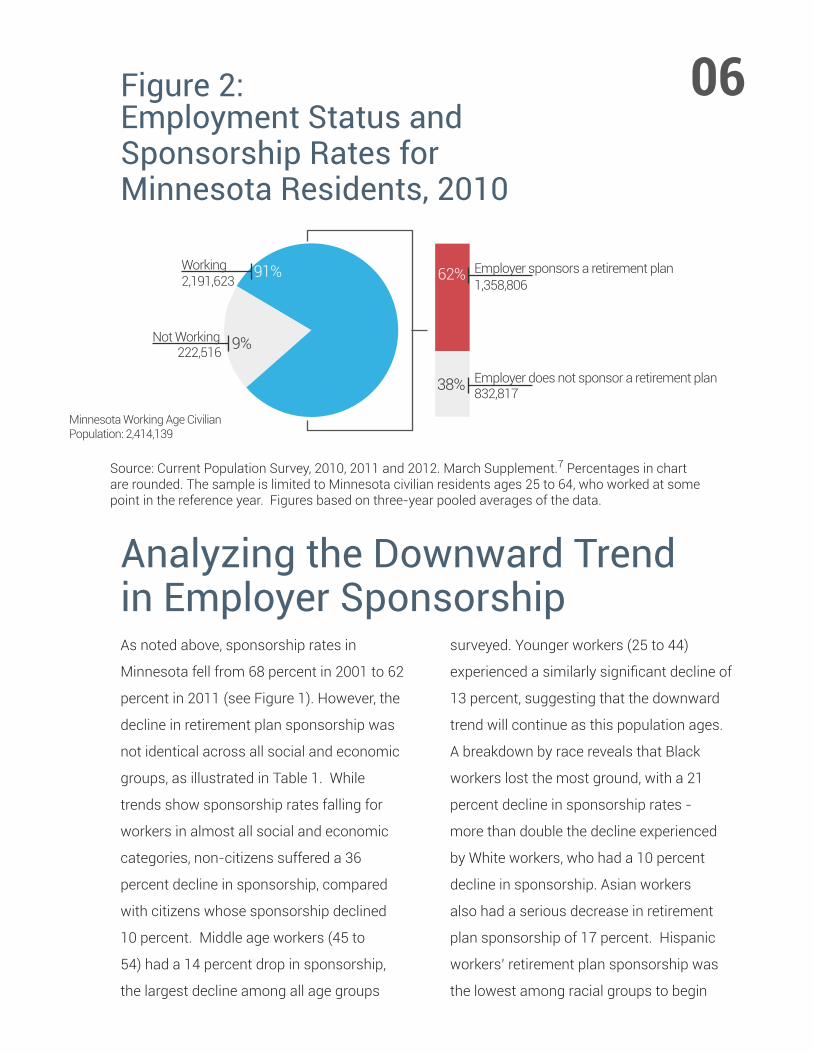
06
62%
38% Employer does not sponsor a retirement plan
Employer sponsors a retirement planWorking
Not Working222,516
2,191,623 1,358,806
832,817
Minnesota Working Age CivilianPopulation: 2,414,139
91%
9%
Figure 2: Employment Status and Sponsorship Rates for Minnesota Residents, 2010
Source: Current Population Survey, 2010, 2011 and 2012. March Supplement.7 Percentages in chart are rounded. The sample is limited to Minnesota civilian residents ages 25 to 64, who worked at some point in the reference year. Figures based on three-year pooled averages of the data.
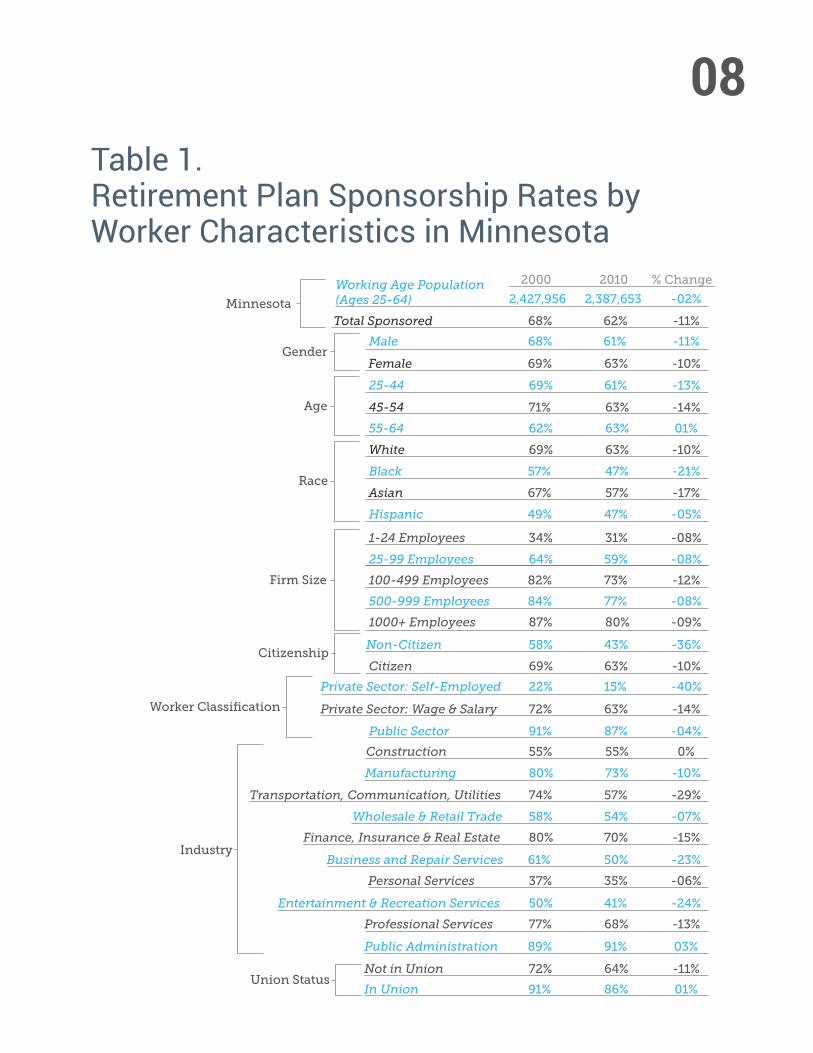
Analyzing the Downward Trend in Employer SponsorshipAs noted above, sponsorship rates in
Minnesota fell from 68 percent in 2001 to 62
percent in 2011 (see Figure 1). However, the
decline in retirement plan sponsorship was
not identical across all social and economic
groups, as illustrated in Table 1. While
trends show sponsorship rates falling for
workers in almost all social and economic
categories, non-citizens suffered a 36
percent decline in sponsorship, compared
with citizens whose sponsorship declined
10 percent. Middle age workers (45 to
54) had a 14 percent drop in sponsorship,
the largest decline among all age groups
surveyed. Younger workers (25 to 44)
experienced a similarly significant decline of
13 percent, suggesting that the downward
trend will continue as this population ages.
A breakdown by race reveals that Black
workers lost the most ground, with a 21
percent decline in sponsorship rates -
more than double the decline experienced
by White workers, who had a 10 percent
decline in sponsorship. Asian workers
also had a serious decrease in retirement
plan sponsorship of 17 percent. Hispanic
workers’ retirement plan sponsorship was
the lowest among racial groups to begin
07with, yet they suffered a further drop of 5
percent.
Retirement plan sponsorship also varied
across industries. The biggest decline
was for workers in Transportation,
Communication and Utilities with a 29
percent decrease in sponsorship rates,
a decrease within this industry from 74
percent sponsorship to only 57 percent.
There was also a 24 percent decline in
sponsorship for workers in Entertainment
and Recreation Services and a 23 percent
decline in sponsorship for workers in
Business and Repair Services.
In 2011, there were 233,990 self-employed
workers in Minnesota (10 percent of the
working age population). Self-employed
workers may establish retirement plans
for themselves, their spouses, and other
employees through several provisions of the
federal tax code. Among those options are
the “Solo 401(k),” the simplified employee
pension plan (SEP), and the SIMPLE-
IRA. Still, sponsorship rates for the self-
employed remained among the lowest of
all workers. In 2001, only 22 percent of
self-employed workers in Minnesota had
a sponsored plan, and that rate fell by a
full seven percentage points by 2011, a
decrease of two-fifths.
Decreasing sponsorship also varied by
firm size. Firms with 100 to 499 employees
showed the biggest proportional drop in
sponsorship of 12 percent. These firms
also had the largest absolute decline
in sponsorship rates, dropping from 82
percent to 73 percent. Firms of all other
sizes had a similar percentage change in
sponsorship of 8 or 9 percent, but small
firms had the lowest sponsorship levels (34
percent in 2001 and 31 percent in 2011).
Finally, unionized workers8 in Minnesota
experienced a 1 percent increase in their
rates of retirement plan sponsorship, while
their non-unionized counterparts suffered
an 11 percent drop. Union members also
have the highest rates of sponsorship - in
2011, their rate of sponsorship was 87
percent.
08Table 1. Retirement Plan Sponsorship Rates by Worker Characteristics in Minnesota
Working Age Population(Ages 25-64)Minnesota
Gender
Age
Race
Total Sponsored
Male
Female
25-44
2,427,956 2,387,653
68% 62%
68% 61%
69% 63%
69% 61%
45-54 71% 63%
55-64 62% 63%
White 69% 63%
Black 57% 47%
Asian 67% 57%
Hispanic 49% 47%
1-24 Employees 34% 31%
25-99 Employees 64% 59%
100-499 Employees 82% 73%
500-999 Employees 84% 77%
1000+ Employees
Citizen
87% 80%
Non-Citizen 58% 43%
69% 63%
Private Sector: Self-Employed 22% 15%
Private Sector: Wage & Salary 72% 63%
Public Sector 91% 87%
Manufacturing 80% 73%
Wholesale & Retail Trade 58% 54%
Finance, Insurance & Real Estate 80% 70%
Business and Repair Services 61% 50%
Personal Services 37% 35%
Transportation, Communication, Utilities 74% 57%
Construction 55% 55%
2000 2010
-02%
-11%
-11%
-10%
-13%
-14%
01%
-10%
-21%
-17%
-05%
-08%
-08%
-12%
-08%
-09%
-36%
-10%
-40%
-14%
-04%
-10%
-07%
-15%
-23%
-06%
Entertainment & Recreation Services 50% 41%
Professional Services 77% 68%
Public Administration 89% 91%
Not in Union 72% 64%
-24%
-13%
03%
In Union 91% 86% 01%
-11%
-29%
0%
% Change
Union Status
Firm Size
Industry
Citizenship
Worker Classification
09
EMPLOYEEPARTICIPATION RATES Even if an employer sponsors a retirement
plan, participation is not guaranteed. An
employer is permitted under the law to
exclude employees from participating in
a retirement plan if they have less than
one year of service, are part-time, or are
younger than 25.9 Moreover, the structural
differences between DB and DC plans
impact employee participation. In a DB plan,
worker participation is usually mandatory,
guaranteeing that each worker has a
retirement account if they are sponsored.
Under a DC plan, workers choose to
participate in the retirement plan.
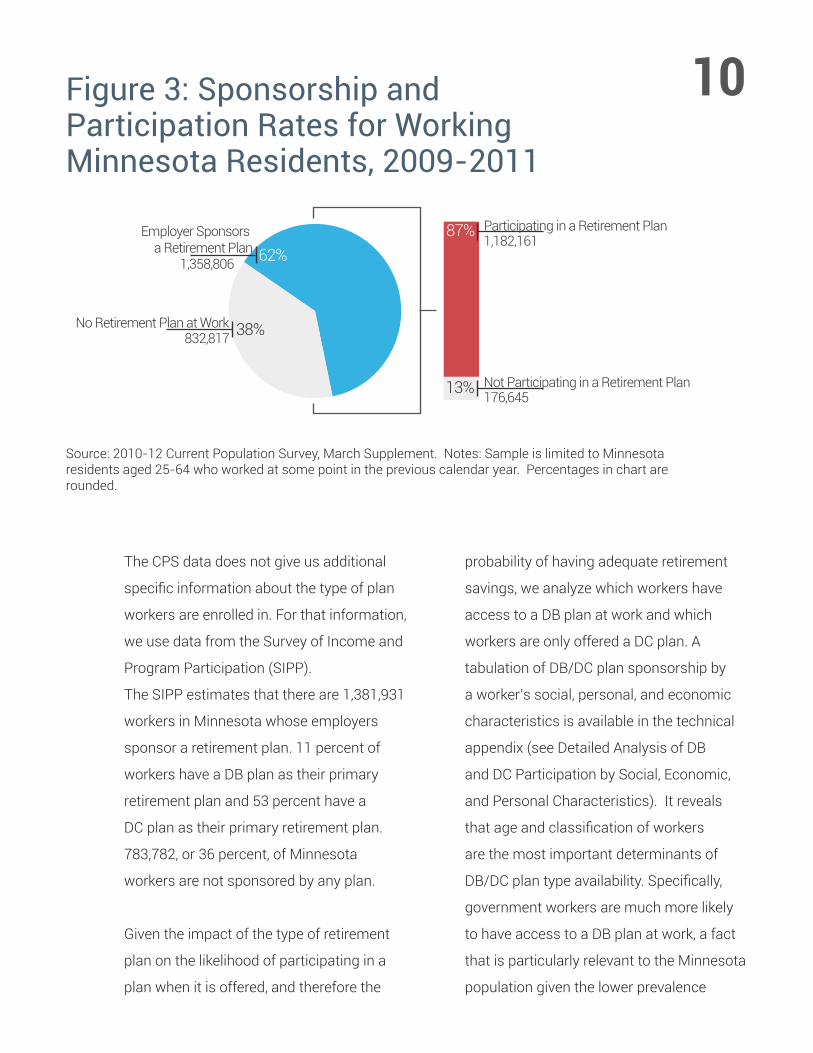
Figure 3 summarizes participation rates
for working Minnesota residents aged
25-64 in 2011 using data from the CPS.10
Of the 62 percent of workers whose
employers sponsored a retirement plan in
2011, 87 percent participated in the plan.
This means only 54 percent (62%*87%)
of Minnesota workers participated in an
employer-sponsored retirement plan in
2011. Put another way, 46 percent of
Minnesota workers (over 1 million people)
in 2011 did not participate in employer-
sponsored retirement plans either because
their employer did not offer one or the
employee did not participate for voluntary
or involuntary reasons. Furthermore, as
noted in the previous section, 222,516
working age people in Minnesota were not
working in 2011 and, by definition, were
not able to participate in an employer-
sponsored retirement plan. As a result, over
half (51 percent) of the civilian working
age population do not have a retirement
plan because they were not sponsored,
they could not participate, or they were not
working.
Section Two:
10
1,358,806
87%
13% Not Participating in a Retirement Plan
Participating in a Retirement PlanEmployer Sponsors a Retirement Plan
No Retirement Plan at Work
62%
38%832,817
1,182,161
176,645
Figure 3: Sponsorship and Participation Rates for WorkingMinnesota Residents, 2009-2011
Source: 2010-12 Current Population Survey, March Supplement. Notes: Sample is limited to Minnesota residents aged 25-64 who worked at some point in the previous calendar year. Percentages in chart are rounded.
The CPS data does not give us additional
specific information about the type of plan
workers are enrolled in. For that information,
we use data from the Survey of Income and
Program Participation (SIPP).
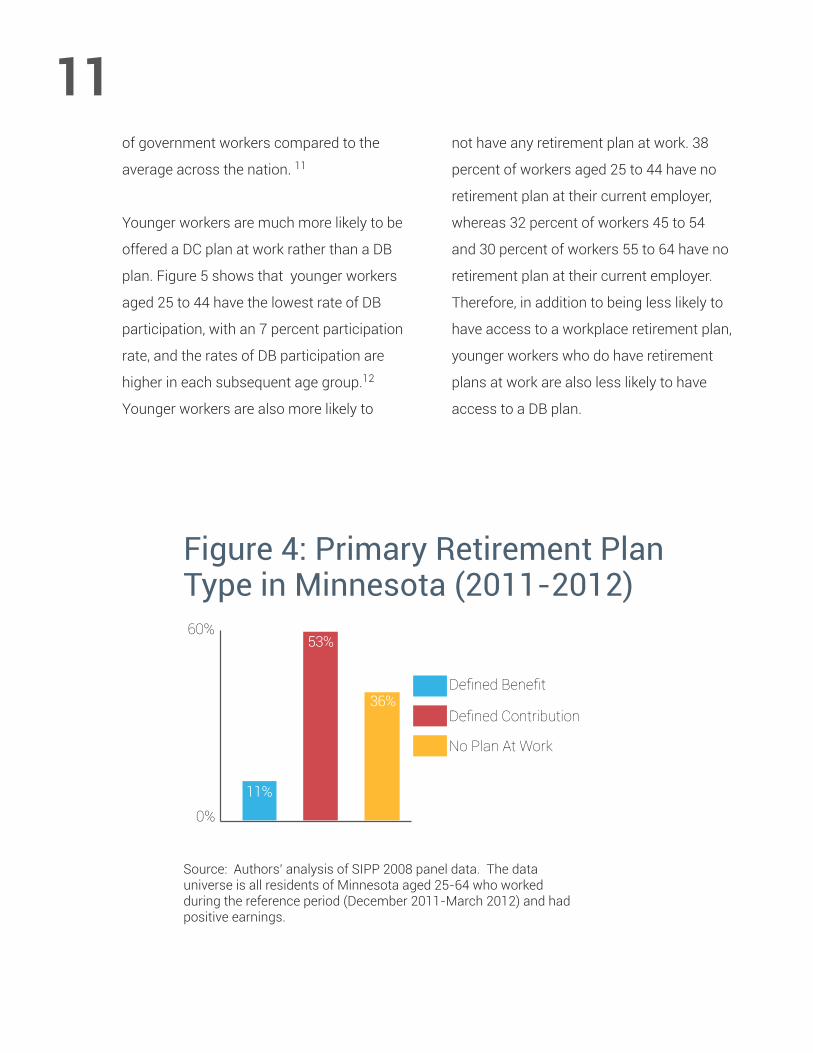
The SIPP estimates that there are 1,381,931
workers in Minnesota whose employers
sponsor a retirement plan. 11 percent of
workers have a DB plan as their primary
retirement plan and 53 percent have a
DC plan as their primary retirement plan.
783,782, or 36 percent, of Minnesota
workers are not sponsored by any plan.
Given the impact of the type of retirement
plan on the likelihood of participating in a
plan when it is offered, and therefore the
probability of having adequate retirement
savings, we analyze which workers have
access to a DB plan at work and which
workers are only offered a DC plan. A
tabulation of DB/DC plan sponsorship by
a worker’s social, personal, and economic
characteristics is available in the technical
appendix (see Detailed Analysis of DB
and DC Participation by Social, Economic,
and Personal Characteristics). It reveals
that age and classification of workers
are the most important determinants of
DB/DC plan type availability. Specifically,
government workers are much more likely
to have access to a DB plan at work, a fact
that is particularly relevant to the Minnesota
population given the lower prevalence
11
Figure 4: Primary Retirement Plan Type in Minnesota (2011-2012)
0%
60%
11%
53%
36%Defined Benefit
Defined Contribution
No Plan At Work
Source: Authors’ analysis of SIPP 2008 panel data. The data universe is all residents of Minnesota aged 25-64 who worked during the reference period (December 2011-March 2012) and had positive earnings.
of government workers compared to the
average across the nation. 11
Younger workers are much more likely to be
offered a DC plan at work rather than a DB
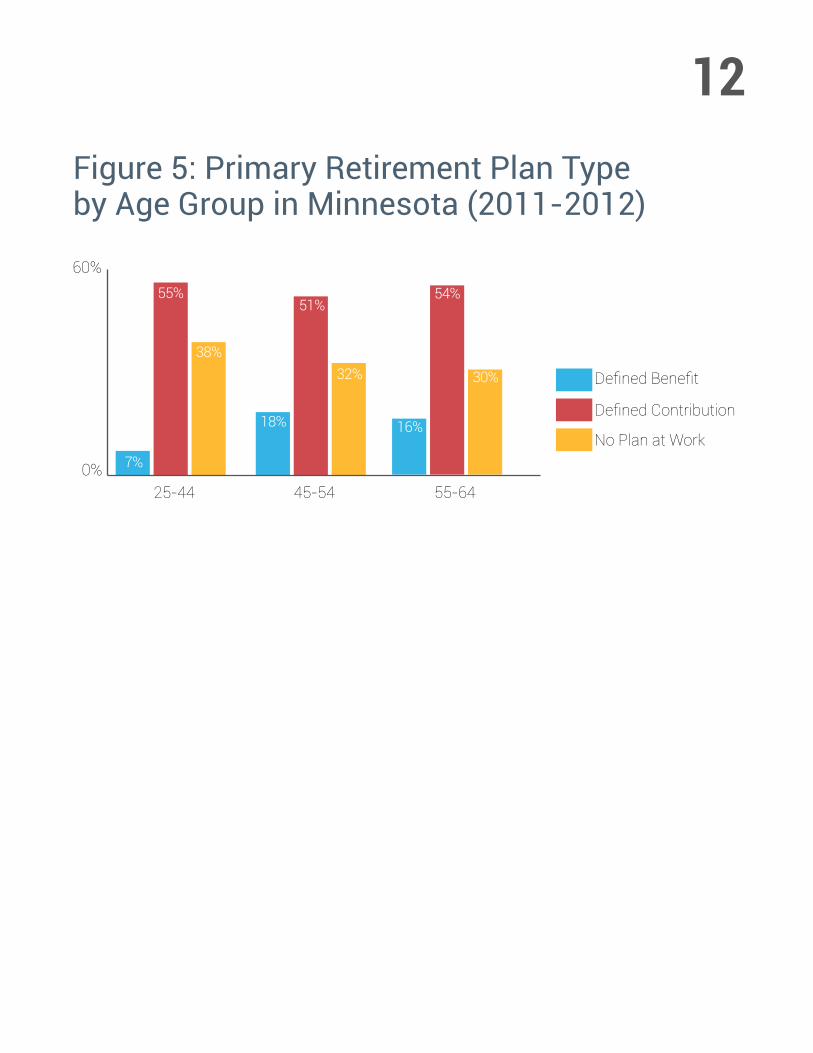
plan. Figure 5 shows that younger workers
aged 25 to 44 have the lowest rate of DB
participation, with an 7 percent participation
rate, and the rates of DB participation are
higher in each subsequent age group.12
Younger workers are also more likely to
not have any retirement plan at work. 38
percent of workers aged 25 to 44 have no
retirement plan at their current employer,
whereas 32 percent of workers 45 to 54
and 30 percent of workers 55 to 64 have no
retirement plan at their current employer.
Therefore, in addition to being less likely to
have access to a workplace retirement plan,
younger workers who do have retirement
plans at work are also less likely to have
access to a DB plan.
12Figure 5: Primary Retirement Plan Type by Age Group in Minnesota (2011-2012)
0%
60%
25-44 45-54 55-64
Defined Benefit
Defined Contribution
No Plan at Work7%
55%
18%
51%
32%
16%
54%
30%
38%
13
This report describes how a decline in
employer sponsorship of retirement plans,
coupled with the changing nature of plan
design, has eroded rates of participation
in retirement plans and, potentially, the
retirement security of Minnesota workers.
However, retirement plans provide only
one source of income in retirement. A
complete evaluation of Minnesota residents’
readiness for retirement must take into
account income from all sources.
The SIPP data offers a comprehensive
listing of survey respondents’ financial
assets, including the value of their bank
accounts, bonds and securities, savings
bonds, stocks and mutual funds, life
insurance policies, IRA/KEOGH accounts,
DC accounts, real estate holdings, home
equity, and business equity. There is also
information on total debt owed. This
data allows us to compute a household’s
total net worth to understand retirement
preparedness based on household assets.
These estimates do not factor in the
present cash value of projected Social
Security or DB pension benefits. For the
purposes of the present discussion, only the
financial preparedness of near-retirement
households in Minnesota, whose reference
person is aged 55 to 64, is considered.
Since younger households have more time
to accumulate savings for retirement, their
current net worth may or may not reflect the
level of preparedness they will have when
they reach retirement.
According to the SIPP data, the average
net worth of near-retirement households
residing in Minnesota is $213,676 for single
person households, $636,824 for married
couple households, and $268,236 for other
household types. This average net worth
can be converted to a cash income stream
of approximately $15,024 per year for single
person households, $37,848 for married
couple households, and only $8,304 for
other household types.13
However, net worth among Minnesota’s
near-retirement population is highly
concentrated. Average net worth numbers
WHAT THE FUTURE HOLDS FOR THOSE NEAR RETIREMENT AGE
Section Three:
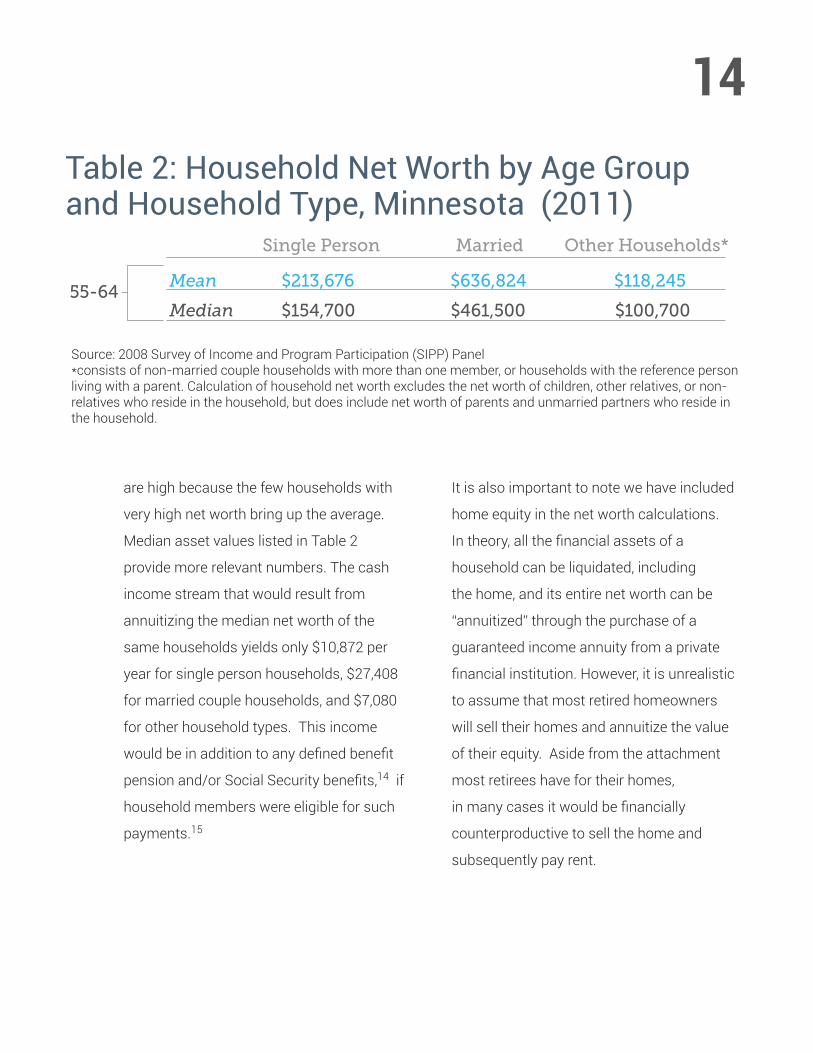
14Table 2: Household Net Worth by Age Group and Household Type, Minnesota (2011)
Source: 2008 Survey of Income and Program Participation (SIPP) Panel*consists of non-married couple households with more than one member, or households with the reference person living with a parent. Calculation of household net worth excludes the net worth of children, other relatives, or non-relatives who reside in the household, but does include net worth of parents and unmarried partners who reside in the household.
55-64Mean $213,676 $636,824 $118,245
Median $154,700 $461,500 $100,700
Single Person Married Other Households*
are high because the few households with
very high net worth bring up the average.
Median asset values listed in Table 2
provide more relevant numbers. The cash
income stream that would result from
annuitizing the median net worth of the
same households yields only $10,872 per
year for single person households, $27,408
for married couple households, and $7,080
for other household types. This income
would be in addition to any defined benefit
pension and/or Social Security benefits,14 if
household members were eligible for such
payments.15
It is also important to note we have included
home equity in the net worth calculations.
In theory, all the financial assets of a
household can be liquidated, including
the home, and its entire net worth can be
“annuitized” through the purchase of a
guaranteed income annuity from a private
financial institution. However, it is unrealistic
to assume that most retired homeowners
will sell their homes and annuitize the value
of their equity. Aside from the attachment
most retirees have for their homes,
in many cases it would be financially
counterproductive to sell the home and
subsequently pay rent.
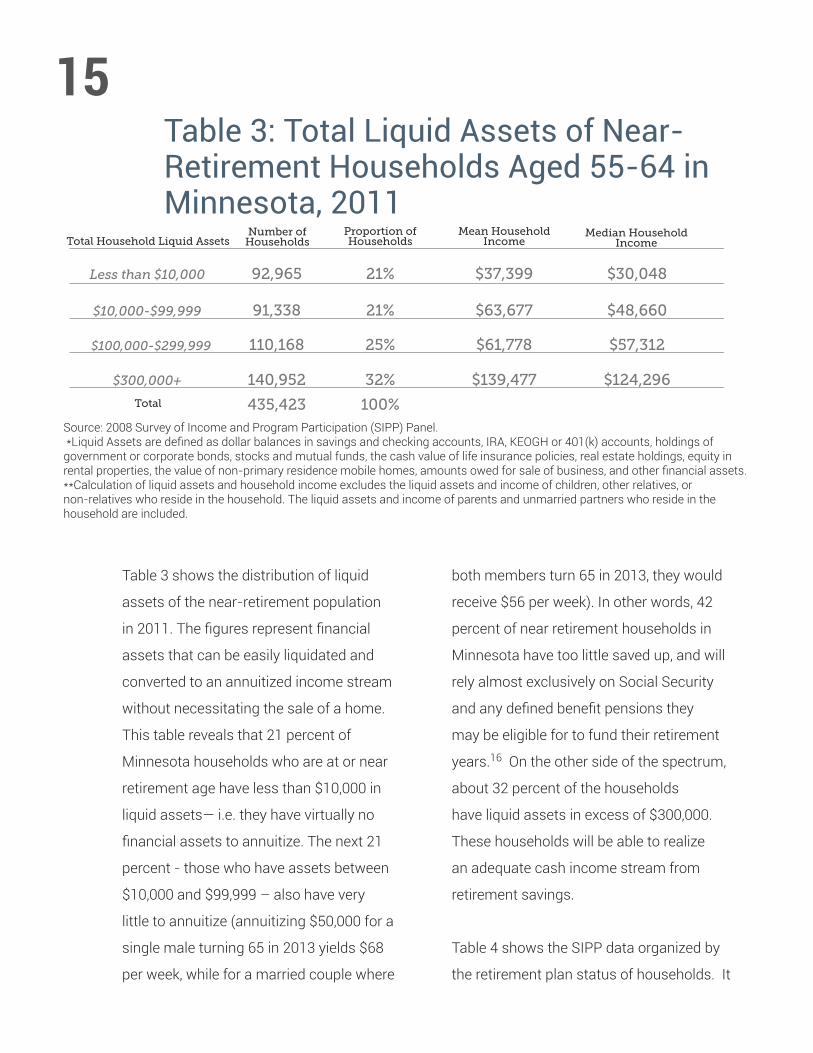
15Table 3: Total Liquid Assets of Near-Retirement Households Aged 55-64 in Minnesota, 2011
Less than $10,000 92,965 21% $37,399 $30,048
$10,000-$99,999 91,338 21% $63,677 $48,660
$100,000-$299,999 110,168 25% $61,778 $57,312
$300,000+ 140,952 32%
435,423 100%
$139,477 $124,296
Proportion ofHouseholds
Number ofHouseholdsTotal Household Liquid Assets
Total
Mean HouseholdIncome
Median HouseholdIncome
Source: 2008 Survey of Income and Program Participation (SIPP) Panel. *Liquid Assets are defined as dollar balances in savings and checking accounts, IRA, KEOGH or 401(k) accounts, holdings of government or corporate bonds, stocks and mutual funds, the cash value of life insurance policies, real estate holdings, equity in rental properties, the value of non-primary residence mobile homes, amounts owed for sale of business, and other financial assets.**Calculation of liquid assets and household income excludes the liquid assets and income of children, other relatives, or non-relatives who reside in the household. The liquid assets and income of parents and unmarried partners who reside in the household are included.
Table 3 shows the distribution of liquid
assets of the near-retirement population
in 2011. The figures represent financial
assets that can be easily liquidated and
converted to an annuitized income stream
without necessitating the sale of a home.
This table reveals that 21 percent of
Minnesota households who are at or near
retirement age have less than $10,000 in
liquid assets— i.e. they have virtually no
financial assets to annuitize. The next 21
percent - those who have assets between
$10,000 and $99,999 – also have very
little to annuitize (annuitizing $50,000 for a
single male turning 65 in 2013 yields $68
per week, while for a married couple where
both members turn 65 in 2013, they would
receive $56 per week). In other words, 42
percent of near retirement households in
Minnesota have too little saved up, and will
rely almost exclusively on Social Security
and any defined benefit pensions they
may be eligible for to fund their retirement
years.16 On the other side of the spectrum,
about 32 percent of the households
have liquid assets in excess of $300,000.
These households will be able to realize
an adequate cash income stream from
retirement savings.
Table 4 shows the SIPP data organized by
the retirement plan status of households. It
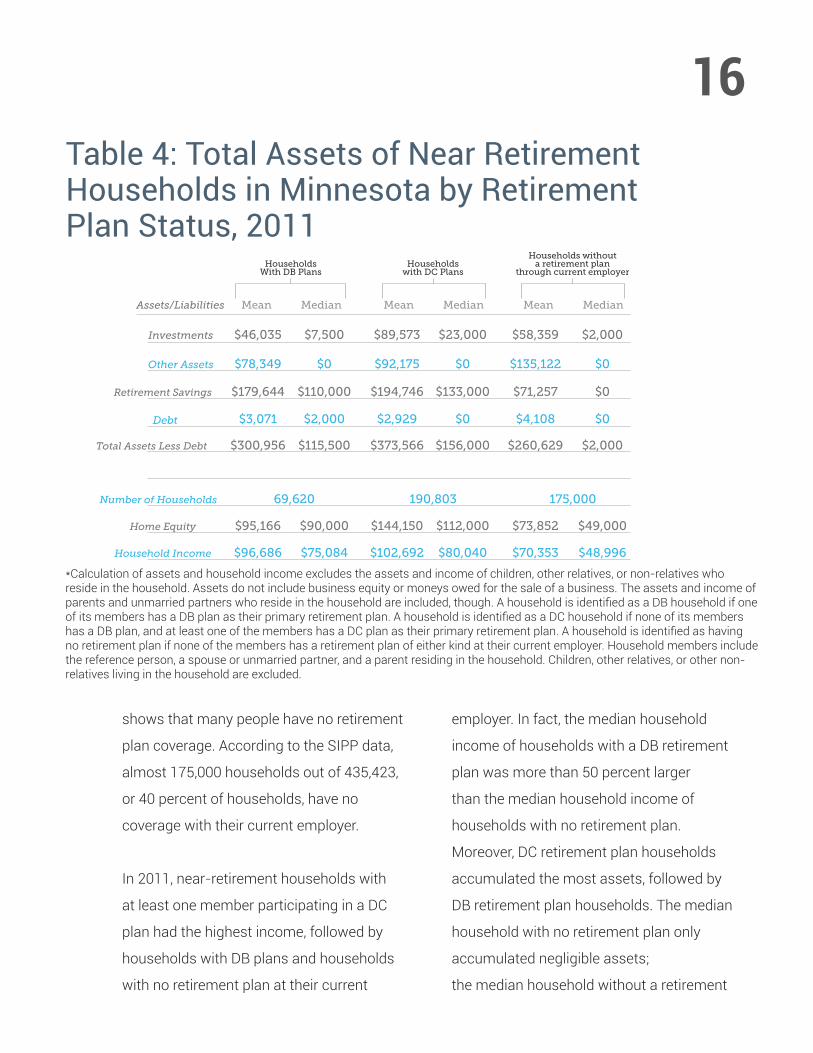
16Table 4: Total Assets of Near Retirement Households in Minnesota by Retirement Plan Status, 2011
MedianMean MedianMean MedianMean
Investments
Assets/Liabilities
$46,035 $7,500 $89,573 $23,000 $58,359 $2,000
$78,349 $0 $92,175 $0 $135,122 $0
$179,644 $110,000 $194,746 $133,000 $71,257 $0
$3,071 $2,000 $2,929 $0 $4,108 $0
Other Assets
Retirement Savings
$300,956 $115,500 $373,566 $156,000 $260,629 $2,000Total Assets Less Debt
69,620 190,803 175,000Number of Households
$95,166 $90,000 $144,150 $112,000 $73,852 $49,000Home Equity
$96,686 $75,084 $102,692 $80,040 $70,353 $48,996Household Income
Debt
Householdswith DC Plans
HouseholdsWith DB Plans
Households withouta retirement plan
through current employer
*Calculation of assets and household income excludes the assets and income of children, other relatives, or non-relatives who reside in the household. Assets do not include business equity or moneys owed for the sale of a business. The assets and income of parents and unmarried partners who reside in the household are included, though. A household is identified as a DB household if one of its members has a DB plan as their primary retirement plan. A household is identified as a DC household if none of its members has a DB plan, and at least one of the members has a DC plan as their primary retirement plan. A household is identified as having no retirement plan if none of the members has a retirement plan of either kind at their current employer. Household members include the reference person, a spouse or unmarried partner, and a parent residing in the household. Children, other relatives, or other non-relatives living in the household are excluded.
shows that many people have no retirement
plan coverage. According to the SIPP data,
almost 175,000 households out of 435,423,
or 40 percent of households, have no
coverage with their current employer.
In 2011, near-retirement households with
at least one member participating in a DC
plan had the highest income, followed by
households with DB plans and households
with no retirement plan at their current
employer. In fact, the median household
income of households with a DB retirement
plan was more than 50 percent larger
than the median household income of
households with no retirement plan.
Moreover, DC retirement plan households
accumulated the most assets, followed by
DB retirement plan households. The median
household with no retirement plan only
accumulated negligible assets;
the median household without a retirement

17plan has amassed only $2,000 in assets,
and they do not have a DB plan to fall back
on. This sum is too low to be annuitized. It
means these households will have to rely
exclusively on Social Security benefits to
fund their retirement years.
While Table 4 shows the retirement savings
of households based on the type of plan
they participate in, it does not reveal whether
those savings will be enough to fund
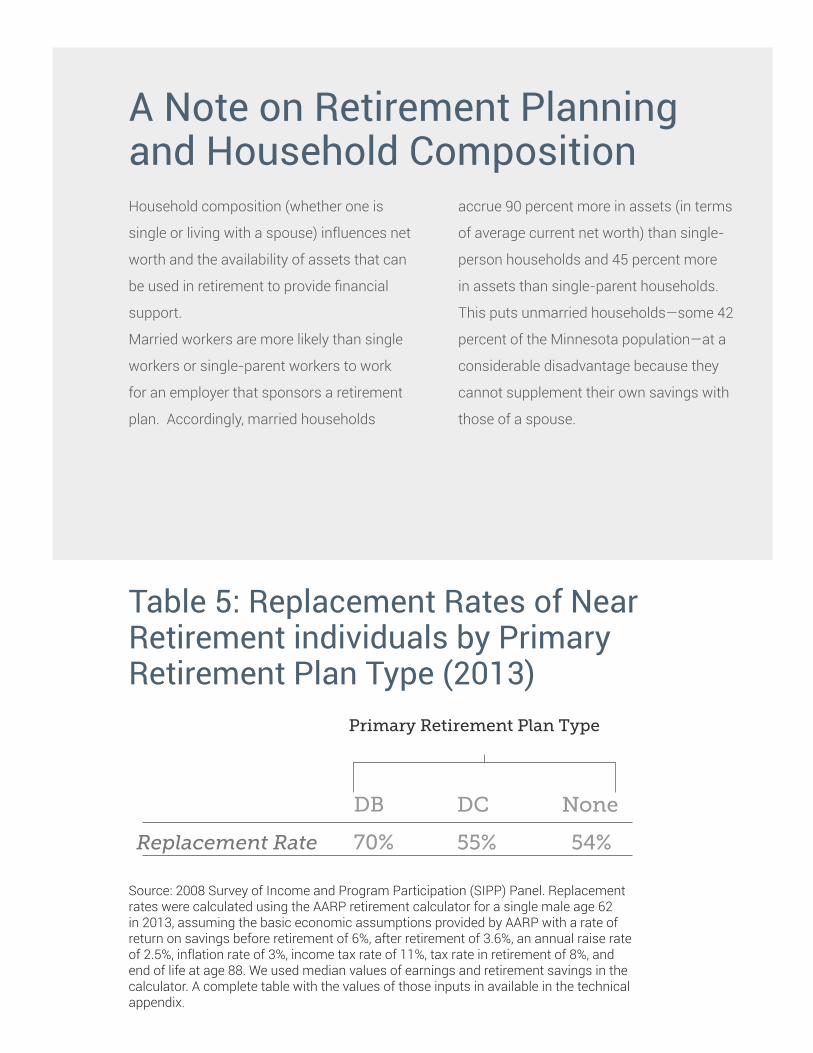
retirement. To do that, Table 5 computes
replacement rates for individuals age 62
in 2013 by their primary retirement plan
type taking into account estimated future
Social Security benefits, DB plan benefits,
and the value of retirement savings.. The
replacement rate is the ratio of retirement
income to pre-retirement earnings and is a
way to understand how much money you
will have to spend each year of retirement.
Workers with a DB plan had the highest
replacement rates, followed by workers
with DC plans and those with no retirement
plan at work at all. These findings are in
line with what has been found in previous
research.17 Most retirement experts agree
that replacement rates should be at least
70 percent of final salary, meaning that
individuals with a DB retirement plan will
be able to retire comfortably. However,
individuals who have a DC retirement plan
will not be ready for retirement. In fact,
they are no better off than those with no
retirement plan from the point of view
of being able to maintain their lifestyle
in retirement. In other words, with the
exception of those with access to a DB
plan at work, most Minnesota workers
will find themselves realizing low income
replacement rates, even when they do
everything right in their efforts to save for
retirement.
18
Table 5: Replacement Rates of Near Retirement individuals by Primary Retirement Plan Type (2013)
DC NoneDB
55% 54%70%Replacement Rate
Primary Retirement Plan Type
Source: 2008 Survey of Income and Program Participation (SIPP) Panel. Replacement rates were calculated using the AARP retirement calculator for a single male age 62 in 2013, assuming the basic economic assumptions provided by AARP with a rate of return on savings before retirement of 6%, after retirement of 3.6%, an annual raise rate of 2.5%, inflation rate of 3%, income tax rate of 11%, tax rate in retirement of 8%, and end of life at age 88. We used median values of earnings and retirement savings in the calculator. A complete table with the values of those inputs in available in the technical appendix.
A Note on Retirement Planning and Household CompositionHousehold composition (whether one is
single or living with a spouse) influences net
worth and the availability of assets that can
be used in retirement to provide financial
support.
Married workers are more likely than single
workers or single-parent workers to work
for an employer that sponsors a retirement
plan. Accordingly, married households
accrue 90 percent more in assets (in terms
of average current net worth) than single-
person households and 45 percent more
in assets than single-parent households.
This puts unmarried households—some 42
percent of the Minnesota population—at a
considerable disadvantage because they
cannot supplement their own savings with
those of a spouse.
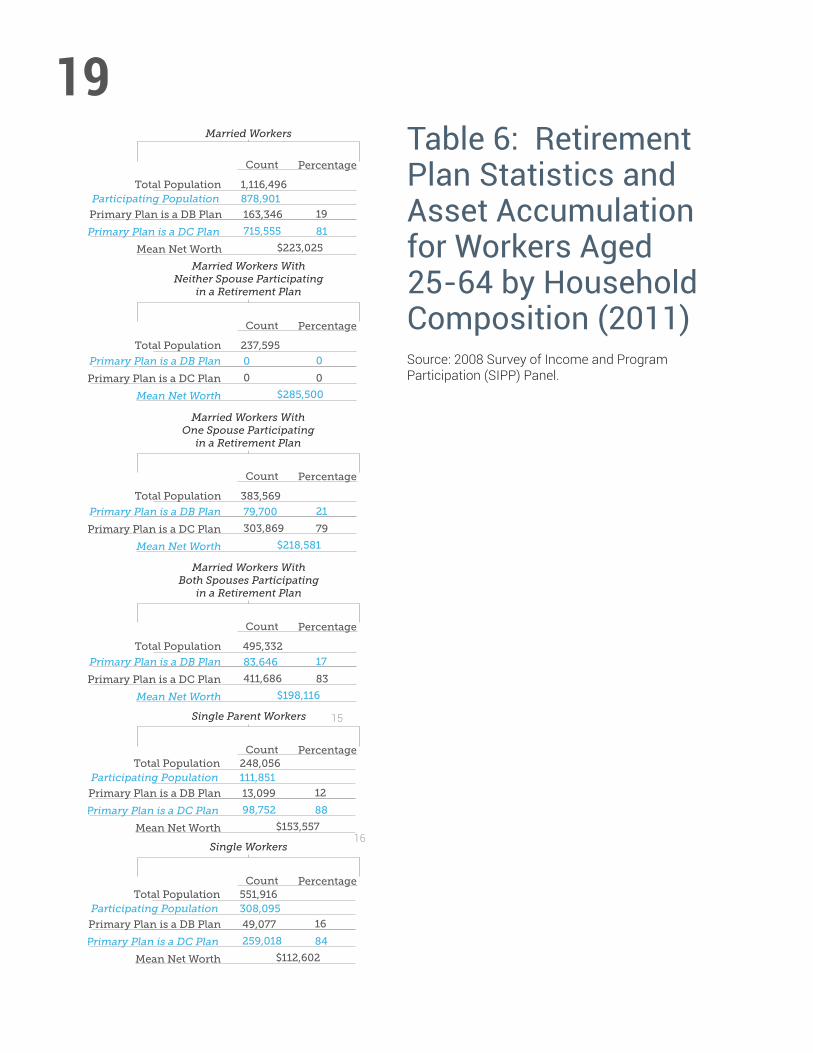
19
Total Population
Married Workers
1,116,496Participating Population 878,901
19
81
Count Percentage
Primary Plan is a DC Plan
Mean Net Worth $223,025
163,346
715,555
Married Workers WithNeither Spouse Participating
in a Retirement Plan
Married Workers WithOne Spouse Participating
in a Retirement Plan
Married Workers WithBoth Spouses Participating
in a Retirement Plan
Single Parent Workers
Primary Plan is a DB Plan
Total Population 383,569
21
79
Count Percentage
Primary Plan is a DC Plan
Mean Net Worth $218,581
79,700
303,869
Primary Plan is a DB Plan
Total Population 495,332
17
83
Count Percentage
Primary Plan is a DC Plan
Mean Net Worth $198,116
83,646
411,686
Primary Plan is a DB Plan
Count Percentage
Single Workers
Total Population 237,595
0
0
Count Percentage
Primary Plan is a DC Plan
Mean Net Worth $285,500
0
0
Primary Plan is a DB Plan
Total Population 248,056Participating Population 111,851
12
88Primary Plan is a DC Plan
Mean Net Worth $153,557
13,099
98,752
Primary Plan is a DB Plan
Count PercentageTotal Population 551,916
Participating Population 308,095
16
84Primary Plan is a DC Plan
Mean Net Worth $112,602
49,077
259,018
Primary Plan is a DB Plan
Table 6: Retirement Plan Statistics and Asset Accumulation for Workers Aged 25-64 by Household Composition (2011)Source: 2008 Survey of Income and Program Participation (SIPP) Panel.
15
16

CONCLUSIONThe analysis in this report has found
that employer sponsorship of retirement
plans has declined precipitously.18 Overall
participation in an employer-provided
retirement plan is low. As a result, 42
percent of near retirement households in
Minnesota will likely have to subsist almost
exclusively on their Social Security income
or be unable to retire at all.19 This paints a
discouraging picture of retirement readiness
for workers residing in Minnesota as of
2012. But how will things look in 10 or 20
years? Are the trends identified in the report
likely to reverse themselves?
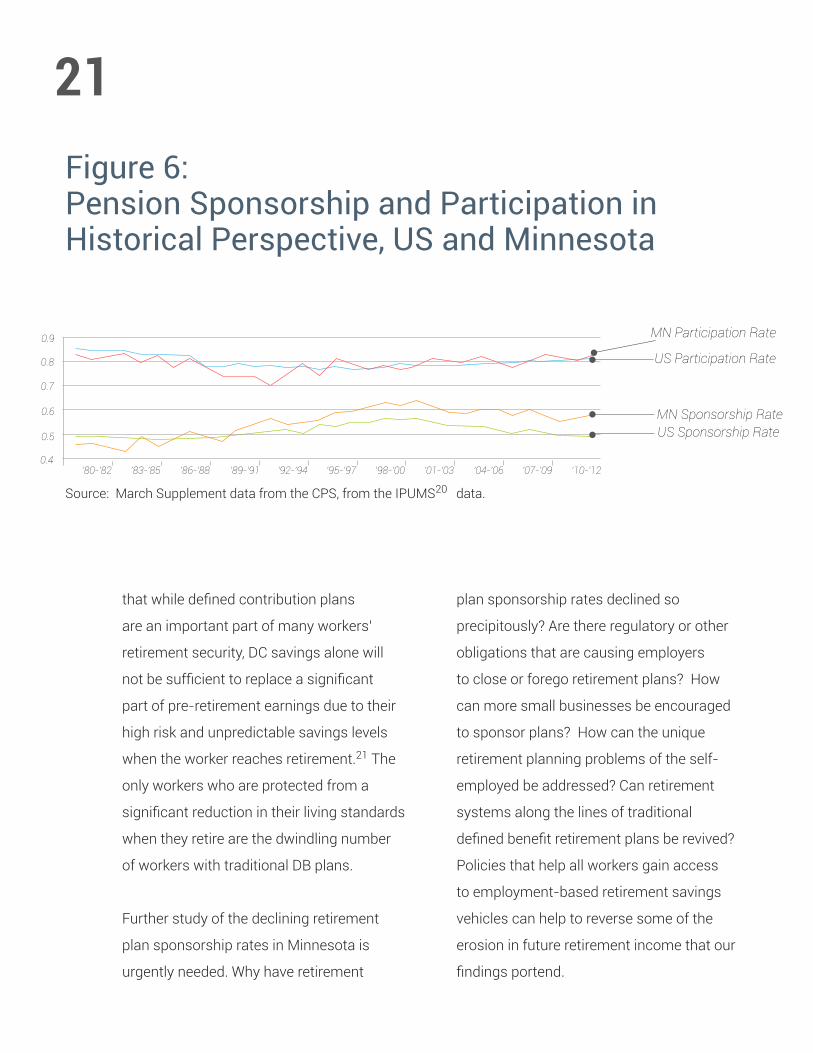
To help answer that question, Figure 5 plots
retirement sponsorship and participation
rates for Minnesota and the U.S. from 1980
through 2012. The trends are discouraging.
Retirement plan sponsorship fell from
1995 to2011, with a slight uptick in 2012.
Retirement plan participation rates seem to
be rising, but with lower sponsorship rates,
overall participation is down. Retirement
plan sponsorship has also fallen nationally,
a downward trend that started in 2000. This
suggests that the declining sponsorship
rates identified in this report are not a
temporary artifact of the 2008-2009
recession, but are a product of persistent
structural trends. If these trends continue,
it is likely that retirement plan sponsorship
and participation rates will continue to sink
and the retirement readiness of Minnesota
workers is likely to get worse absent efforts
to improve the situation.
Employer sponsorship of retirement plans in
Minnesota has eroded over the past decade,
dropping from 68 percent coverage of active
workers in 2001 to 62 percent coverage in
2011. For those Minnesota workers who
are lucky enough to have employers that
sponsor retirement plans, only 87 percent
report actively participating in a retirement
plan at work in 2011.
The consequences of declining sponsorship
and low participation rates will be higher
rates of poverty and a diminished ability for
workers to maintain their standard of living
in retirement. Our analysis further indicates
21
0.9
0.8
0.7
0.6
0.5
0.4‘80-’82 ‘83-’85 ‘86-’88 ‘89-’91 ‘92-’94 ‘95-’97 ‘98-’00 ‘01-’03 ‘04-’06 ‘07-’09 ‘10-’12
MN Sponsorship RateUS Sponsorship Rate
MN Participation Rate
US Participation Rate
Figure 6: Pension Sponsorship and Participation in Historical Perspective, US and Minnesota
Source: March Supplement data from the CPS, from the IPUMS20 data.
that while defined contribution plans
are an important part of many workers’
retirement security, DC savings alone will
not be sufficient to replace a significant
part of pre-retirement earnings due to their
high risk and unpredictable savings levels
when the worker reaches retirement.21 The
only workers who are protected from a
significant reduction in their living standards
when they retire are the dwindling number
of workers with traditional DB plans.
Further study of the declining retirement
plan sponsorship rates in Minnesota is
urgently needed. Why have retirement
plan sponsorship rates declined so
precipitously? Are there regulatory or other
obligations that are causing employers
to close or forego retirement plans? How
can more small businesses be encouraged
to sponsor plans? How can the unique
retirement planning problems of the self-
employed be addressed? Can retirement
systems along the lines of traditional
defined benefit retirement plans be revived?
Policies that help all workers gain access
to employment-based retirement savings
vehicles can help to reverse some of the
erosion in future retirement income that our
findings portend.

TECHNICAL APPENDIX
23MethodologyFor the purposes of this study, we use
pooled data from the March Supplements
of the 2000-2002 and 2010-2012 Current
Population Survey (CPS). In particular,
we use the variable PENSION which
asks whether the respondent’s union
or employer for his or her longest job
during the preceding calendar year had a
pension or other retirement plan for any
of the employees, and, if so, whether the
respondent was included in that plan. The
question specifically excluded retirement
support from Social Security. Pension
sponsorship and participation from the CPS
data refer to employer-based retirement
plan status in 1999-2001 and 2009-2011,
respectively. This question was only
asked of respondents who worked in the
previous calendar year. All tabulations
reflect weighted counts using the March
Supplement weights.
We also use data from waves 10 and 11
of the 2008 panel of the Survey of Income
and Program Participation. Specifically, we
use data from the Retirement Expectations
module in wave 11 of the 2008 SIPP
panel, as well as data from the Assets and
Liabilities, Real Estate, Stocks and Mutual
Funds, Value of Business, Rental Properties,
Interest Earning and Other Financial Assets
modules in wave 10 of the 2008 SIPP
panel. The reference period is different for
wave 10 and wave 11. The data for these
modules was collected in the 4th reference
month for each rotation (from August-
November 2011 for wave 10, and December
2011-March 2012 for wave 11). Because
wave 10 and wave 11 are four months
apart, their samples are not identical. Wave
10 contains 79,321 observations, while
wave 11 contains 78,101 observations. The
merged data set has 71,879 observations.
There were 7,442 observations in wave 10
that were not in wave 11. There were 6,222
observations in wave 11 that were not in
wave 10.
Since the merged data set drops a number
of observations, it does not exactly
mimic population numbers in the general
population. For example, the weighted
population count for the U.S. is 306.5
million for wave 10 alone, and 307.5 million
for wave11 alone. We use weights from
the fourth reference month of wave 10
data for the merged sample. The merged
sample represents 278 million, which is
less than the 313 million actually in the U.S.
population as of March 1,2012.
24The working sample in the SIPP is limited
to residents of Minnesota, aged 25-64 who
stated that they worked at some point in the
reference period (the past four months) and
who had positive earnings. This sample was
used to calculate sponsorship, participation
rates, the respondent’s primary plan type
(DB or DC) and to calculate current net
worth.
The Retirement Expectations module asks
respondents whether their primary source
of income in the previous four months was
from a job or a business. Based on that
answer, occupation, industry, firm size,
and class of worker status was assigned
from the most important job/business for
that person. Our sample does not drop
businesses that were unincorporated or that
earned or expected to earn less than $2500
per year. For such businesses, firm size was
assigned to be less than 25 employees.
Sponsorship of a retirement plan is defined
as the respondent answering affirmatively
a question about whether their employer (at
their most important job/business) offers a
retirement plan, and/or later in the survey,
the respondent says that their employer
offers a 401K plan.
Participation in a retirement plan is defined
as the respondent stating that their
employer sponsors a retirement plan, they
participate in such a plan, and/or they
participate in a 401K plan through their
employer.
The worker’s most important retirement
plan was deemed to be a Defined Benefit
(DB) plan if they answered that the plan
was based on earnings and years on the
job, or if it was a cash balance plan, or
they stated that the plan benefits would
be increased or decreased because of
participation in the Social Security program.
Alternatively, the most important plan was
determined to be a Defined Contribution
(DC) plan if the respondent stated that they
had an individual account plan, or they
had a 401K plan. For those who had only
one plan, the most important plan was
classified as a DC plan if they stated that
they could choose the investments in the
plan, or if they could take (or had already)
taken out a loan against the plan, or if the
contributions to the plan are tax deferred
and employer contributions depend fully
or in part on the employee’s contributions.
The latter characteristics were asked about
all retirement plans, not just the primary
plan; therefore they could only be used to
ascertain the nature of the most important
25retirement plan for those who had only one
retirement plan.
Respondents in the sample were asked
about the value of their assets. This is the
main value of the SIPP data over CPS data.
The SIPP sample gives us a snapshot of
earnings and assets for workers aged 25-64
in 2012. Assets include non-interest earning
checking accounts (jointly owned and
solely owned), interest earning accounts
(jointly owned and solely owned), bonds
and securities (jointly owned and solely
owned), savings bonds (solely owned),
equity in stocks and mutual funds (jointly
owned and solely owned), cash value
of life insurance policies, equity in other
financial investments, market value of IRA/
KEOGH accounts, the value of solely-owned
retirement DC accounts, the equity in rental
properties not on the land of residence
jointly-owned and solely-owned, home
equity (adjusted for share of ownership),
mobile home (adjusted for share of
ownership), other real estate (adjusted
for share of ownership), business equity
(adjusted for share of ownership), and
money owed to the respondent for the sale
of a business. We then subtract the debt
owed jointly and solely for loans, store bills/
credit cards, and other debt. This gives us a
measure of current net worth.
Household CalculationsHousehold members include the reference
person, a spouse or unmarried partner, and
a parent residing in the household. Children,
other relatives, or other non-relatives living
in the household are excluded. Therefore,
there are three kinds of households:
single person households only contain the
reference person, once all children, other
relatives and non-relatives are excluded;
married couple households contain the
reference person and their spouse, and
maybe a parent; other households are not
married couples, and yet have more than
one member – this could include unmarried
couples living with or without a parent, or a
single individual living with a parent.
Given who is included among members of
the household, calculation of household net
worth excludes the net worth of children,
other relatives, or non-relatives who reside
in the household, but does include net worth
of parents and unmarried partners who
reside in the household.
Households are identified as a DB
household if one of the members of the
household has a DB plan as their primary
retirement plan. Households are identified
as a DC household if none of the members

26has a DB plan, and at least one of the
members has a DC plan. Households are
identified as having no retirement plan if
none of the members has a retirement plan
of either kind at their current employer.
When calculating the annuity value of
assets, for a single person household and
for other households, the annuity value
was calculated for a hypothetical male in
Minnesota, who was born on June 1, 1947
(they were 64 at the time the sample was
collected in 2012). These calculations are
for a lifetime annuity without beneficiaries.
However, for married couple households, the
annuity value was calculated for a couple
residing in Minnesota, where one person
is a male born on June 1, 1947 (they were
64 at the time the sample was collected
in 2012), and the other person is a female
born on June 1, 1947. These calculations
are for a lifetime annuity where the survivor
continues to receive 100% benefit, without
beneficiaries.
27
Covered by Union ContractUnionization
Gender
Citizenship
Age
Race
Not Covered by Union Contract
Male
Female
15% 14%
85% 86%
52% 53%
48% 47%
Citizen 96% 91%
Non-Citizen 04% 10%
25-44 51% 52%
45-54 30% 28%
55-64 19% 20%
White 87% 67%
Black 04% 11%
Asian 04% 06%
Hispanic 04% 15%
Other 01% 02%
Manufacturing
Construction 06% 07%
15% 11%
Transportation, Communications, Utilities 04% 05%
Wholesale & Retail Trade 16% 16%
Personal Services 02% 03%
Professional Services 29% 28%
Public Administration 04% 06%
Public Sector 07% 08%
Private Sector: Self Employed 10% 10%
Private Sector: Wage & Salary 77% 74%
1-25 Employees 32% 34%
Entertainment & Recreation Services 02% 02%
Finance, Insurance, Real Estate 09% 07%
Business & Repair Services 07% 08%
Minnesota U.S.
Worker Classification
Firm Size
26-99 Employees 07% 07%
100-499 Employees 14% 13%
500-999 Employees 06% 05%
1000+ Employees 42% 41%
Industry
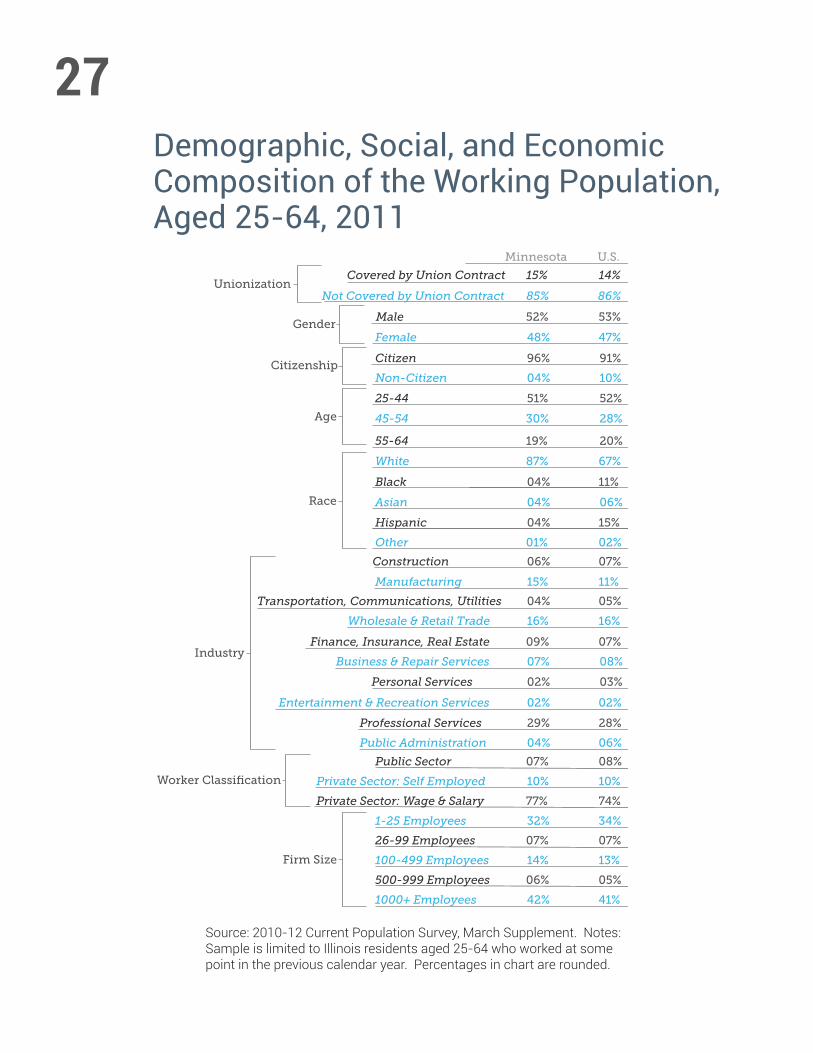
Demographic, Social, and Economic Composition of the Working Population, Aged 25-64, 2011
Source: 2010-12 Current Population Survey, March Supplement. Notes: Sample is limited to Illinois residents aged 25-64 who worked at some point in the previous calendar year. Percentages in chart are rounded.
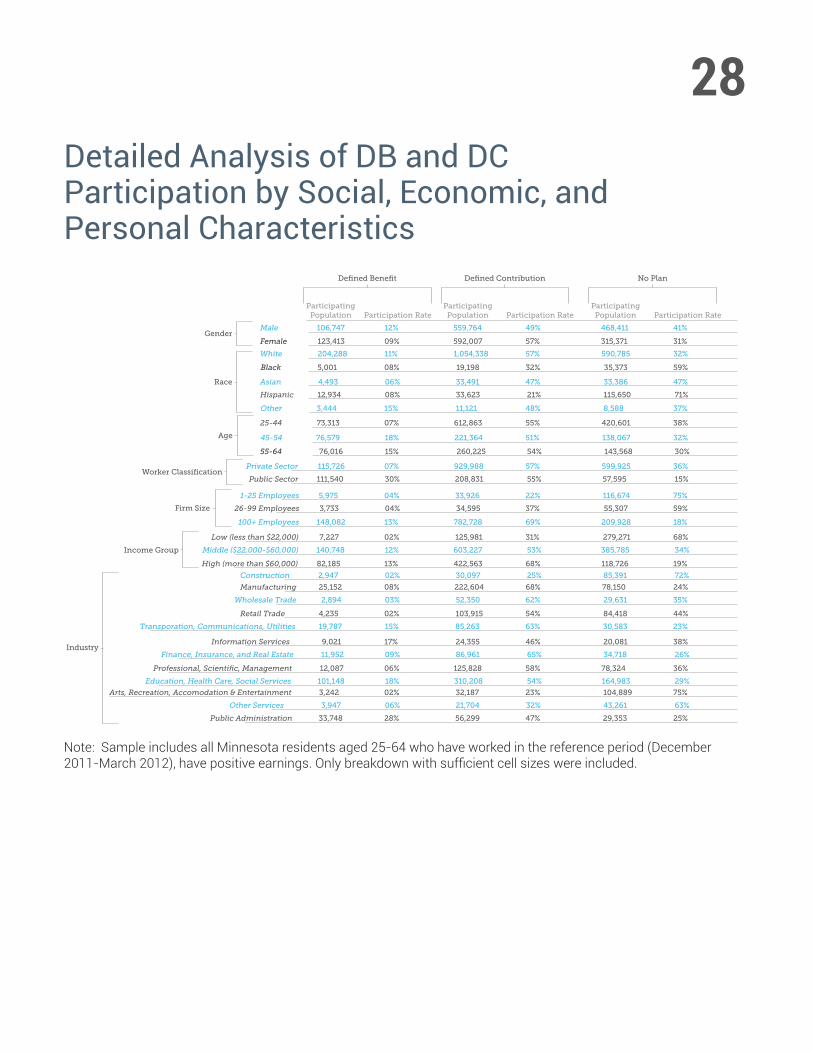
28
MaleGender
Defined Benefit Defined Contribution
Age
Race
Firm Size
Female
White
Black
12%106,747 49%559,764
57%592,00709%123,413
11%204,288 57%1,054,338
08%5,001 32%19,198
Asian 06%4,493 47%33,491
Hispanic 08%12,934 21%33,623
Other 15%3,444 48%11,121
25-44 07%73,313 55%612,863
45-54 18%76,579 51%221,364
55-64 15%76,016 54%260,225
Private Sector 07%115,726 57%929,988
Public Sector 30%111,540 55%208,831
1-25 Employees 04%5,975 22%33,926
26-99 Employees 04%3,733 37%34,595
100+ Employees 13%148,082 69%782,728
Participation RateParticipatingPopulation Participation Rate
ParticipatingPopulation
Industry
Worker Classification
Income Group
Low (less than $22,000) 02%7,227 31%125,981
Middle ($22,000-$60,000) 12%140,748 53%603,227
High (more than $60,000) 13%82,185 68%422,563
Construction 02%2,947 25%30,097
Manufacturing 08%25,152 68%222,604
Wholesale Trade 03%2,894 62%52,350
Retail Trade 02%4,235 54%103,915
Transporation, Communications, Utilities 15%19,787 63%85,263
Information Services 17%9,021 46%24,355
Finance, Insurance, and Real Estate 09%11,952 65%86,961
Professional, Scientific, Management 06%12,087 58%125,828
Education, Health Care, Social Services 18%101,148 54%310,208
Arts, Recreation, Accomodation & Entertainment 02%3,242 23%32,187
Public Administration 28%33,748 47%56,299
Other Services 06%3,947 32%21,704
No Plan
41%468,411
31%315,371
32%590,785
59%35,373
47%33,386
71%115,650
37%8,588
38%420,601
32%138,067
30%143,568
36%599,925
15%57,595
75%116,674
59%55,307
18%209,928
Participation RateParticipatingPopulation
68%279,271
34%385,785
19%118,726
72%85,391
24%78,150
35%29,631
44%84,418
23%30,583
38%20,081
26%34,718
36%78,324
29%164,983
75%104,889
25%29,353
63%43,261
Detailed Analysis of DB and DC Participation by Social, Economic, and Personal Characteristics
Note: Sample includes all Minnesota residents aged 25-64 who have worked in the reference period (December 2011-March 2012), have positive earnings. Only breakdown with sufficient cell sizes were included.
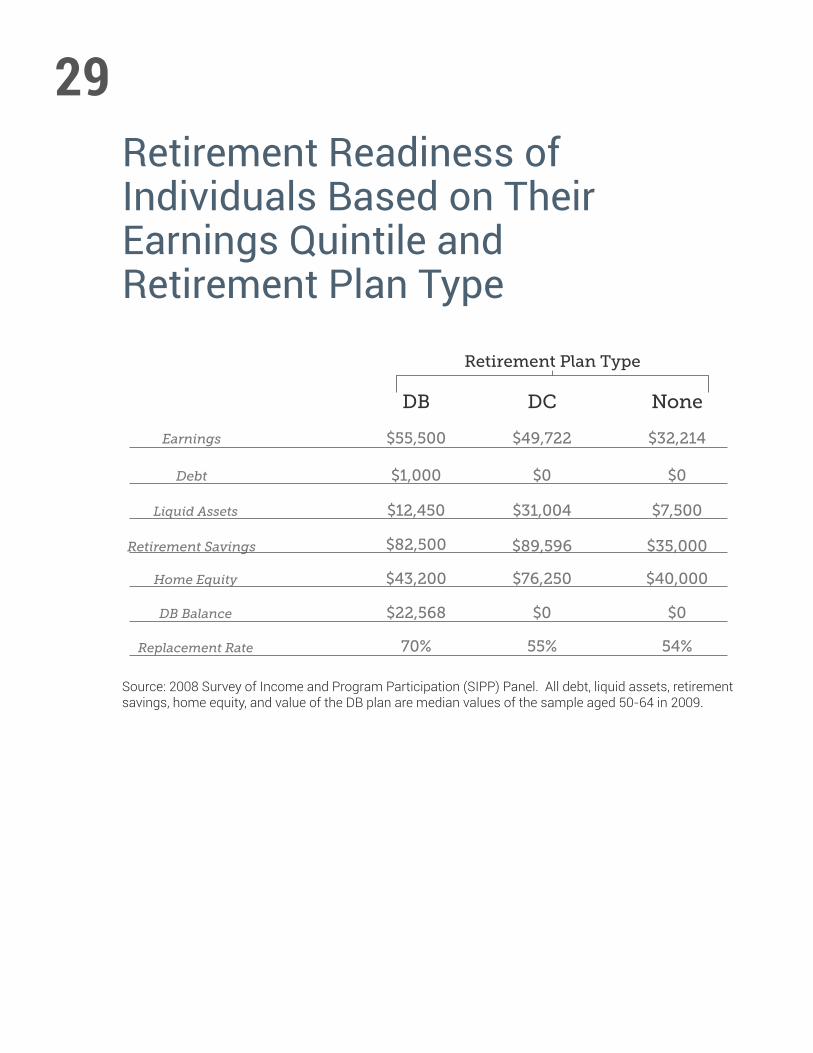
29
Earnings $49,722 $32,214
Debt $0 $0
Liquid Assets $31,004 $7,500
Retirement Savings $89,596
$55,500
$1,000
$12,450
$82,500
Home Equity $76,250 $40,000$43,200
DB Balance $0 $0$22,568
55% 54%70%Replacement Rate
$35,000
Retirement Plan Type
DB DC None
Retirement Readiness of Individuals Based on Their Earnings Quintile and Retirement Plan Type
Source: 2008 Survey of Income and Program Participation (SIPP) Panel. All debt, liquid assets, retirement savings, home equity, and value of the DB plan are median values of the sample aged 50-64 in 2009.

FOOTNOTES
1. All numbers from the pooled CPS data represent averages over the three years.
2. These are households where none of the members participate in a retirement plan at work, and who have saved too little to fund their retirement.
3. The CPS is a survey of households conducted each month to obtain comprehensive data on the labor force. Roughly 60,000 households are sampled across the United States by highly trained interviewers. Answers to survey questions from this representative group of households are used to make inferences about the entire population. For each point in time, we pool data from three years to increase the sample size at the state level.
4. The SIPP asks questions that are designed to capture the economic profile of people in the United States. Approximately 14, 000-36,700 households are interviewed in the United States over a 2½ - 4 year period about their cash and non-cash income, retirement plan participation, taxes, assets, liabilities, and participation in government transfer programs. The survey uses a 4-month recall period and interviews are conducted in person or over the telephone. We use data from waves 10 and 11 of the 2008 panel of the Survey of Income and Program Participation. The data for these modules was collected in the 4th reference month for each rotation (from August 2011-November 2011 for wave 10, and December 2011-March 2012 for wave 11).
5. Because the CPS data references a worker’s situation in the previous year, data from 2000-2002 (and 2010-2012) is used to analyze sponsorship levels in 1999-2001 (and 2009-2011). 6.Specifically, respondents were asked if their employer or union for their longest job held during the preceding calendar year had a pension or other retirement plan for any of the employees, and, if so, whether they were included in that plan.
7. Unlike pension data which refer to jobs held the previous year, employment status data reference the same year they are collected. Since we use data from 2000-2002 (2010-2012) to get data on pension sponsorship and participation in 1999-2001 (2009-2011), employment status data are gathered from 1999-2001 (2009-2011) data for the sample who are 24-63 years old (since pension data are limited to workers ages 25-64 in 2000-2002 (2010-2012)).
8. Unionized workers were workers who were members of a union, or who were not members of a union, but were covered by a union contract.
9. See U.S. Department of Labor. What You Should Know About Your Retirement Plan. “Federal law allows employers to include certain groups of employees and exclude others from a retirement plan. For example, your employer may sponsor one plan for salaried employees and another for union employees. Part-time employees may be eligible if they work at least 1,000 hours per year, which is about 20 hours per week.” http://www.dol.gov/ebsa/publications/wyskapr.html#chapter2 10. We use the CPS data to determine the fraction of Minnesota workers who are participating in an employer-sponsored plan. The CPS asks respondents if their union or employer sponsored a pension or other retirement plan for any of the employees, and, if so, whether they were included in that plan.
11. See Demographic Breakdown of the Minnesota Population in the technical appendix, page TK
12. When offered, participation in a DB plan is typically mandatory.
13. These numbers were computed from the Fidelity Guaranteed Income Calculator, given interest rate conditions on July 25, 2013. For a single person household and for ‘other’ households, the annuity value was calculated for a hypothetical male in Minnesota, who was born on June 1, 1947 (they were 64 during the reference period for the wave in 2011). These calculations are for a lifetime annuity without beneficiaries. However, for married couple households, the annuity value was calculated for a couple residing in Minnesota, where one person is a male born on June 1, 1947, and the other person is a female born on June 1, 1947. These calculations are for a lifetime annuity where the survivor continues to receive 100% benefit, without beneficiaries.

14. According to the Social Security Administration, Annual Statistical Supplement, 2012, the average monthly benefit awarded in 2012 for a retiree 65 years of age, we can estimate that the average male would receive $19,194 in annual Social Security income and the average female would receive $14,523 in annual Social Security income.
15. Note that the poverty threshold for single individuals aged 65 and over was $ 11,011 in 2012, while the threshold for two person households with the household head age 65 and over was $13.891. These thresholds are not adjusted to account for increased health costs as people age.
16. For anecdotal evidence of the financial difficulties facing those at or near retirement, see: Browning, E.S., “Retiring Boomers Find 401(k) Plans Fall Short,” The Wall Street Journal, February 19, 2011; Farnham, Alan, “Record Pessimism About Retirement,” ABC News, March 18, 2011; Farrell, Chris, “The Rising Price of Retirement,” Bloomberg Businessweek, April 12, 2011.
17. See the following studies for a detailed analysis of the employer-sponsored pension system in the U.S. and for evidence that employer-sponsored retirement plans are correlated with higher savings rates and individual wealth accumulation: Bailliu, Jeannine N. and Helmut Reisen. 1998. “Do Funded Pensions Contribute to Higher Aggregate Savings? A Cross-Country Analysis.” Review of World Economics. Volume 134, Number 4, 692-71; Bloom, David E., David Canning, Richard K. Mansfield, and Michael Moore, 2007. “Demographic Change, Social Security Systems, and Savings.” Journal of Monetary Economics. Volume 54, Issue 1, 92-114; Gale, William G., John Sabelhaus, and Robert E. Hall. 1999. “Perspectives on the Household Saving Rate.” Brookings Papers on Economic Activity, Vol. 1999, No. 1, 181-224.
18. This finding is consistent with other studies of trends in retirement plan sponsorship. See: Purcell, Patrick, “Pension Sponsorship and Participation: Summary of Recent Trends” (2008). Federal Publications. Paper 543, http://digitalcommons.ilr.cornell.edu/key_workplace/543; United States Government Accountability Office. 2009a, “Retirement Savings: Automatic Enrollment Shows Promise for Some Workers, but Proposals to Broaden Retirement Savings for Other Workers Could Face Challenges,” http://www.gao.gov/new.items/d1031.pdf; United States General Accounting Office. 2001. “Private Pensions: Issues of Coverage and Increasing Contribution Limits for Defined Contribution Plans,” September. http://www.gao.gov/new.items/d01846.pdf.
19. If Social Security benefits erode any further because of policy changes and an ever increasing premium for Medicare, workers in their 20s and 30s will be much worse off when it is time to retire.
20. Miriam King, Steven Ruggles, J. Trent Alexander, Sarah Flood, Katie Genadek, Matthew B. Schroeder, Brandon Trampe, and Rebecca Vick. Integrated Public Use Microdata Series, Current Population Survey: Version 3.0. [Machine-readable database]. Minneapolis: University of Minnesota, 2010.
21. See Browning, E.S., “Retiring Boomers Find 401(k) Plans Fall Short, The Wall Street Journal, February 19, 2011.

Credit for typefaces: Android Open Source Project for Roboto, exljbris Font Foundry for Museo Slab
500, and Ten by twenty for Nevis.

Schwartz Center For Economic Policy Analysis6 East 16th Street, 11th Floor212.229.5901 [email protected]