Embed Size (px)
Citation preview
1
Argo Group Reports 2021 Second Quarter Results
Net Income EPS of $1.92 per diluted common share and Operating EPS of $1.60 per diluted
common share driven by strong underwriting results and investment income
• Underwriting Results: Improved underwriting margins and reduced catastrophe losses resulted in a combined ratio of 95.4%, Argo's best quarterly combined ratio in more than two years.
• Accelerating Growth: Strong growth in both U.S. and International after adjusting for recent business exits and underwriting actions; market conditions remain favorable for continued growth.
• Return on Equity: Annualized return on average common shareholders' equity was 15.6% in the second quarter; annualized operating return on average common shareholders' equity was 13.1%.
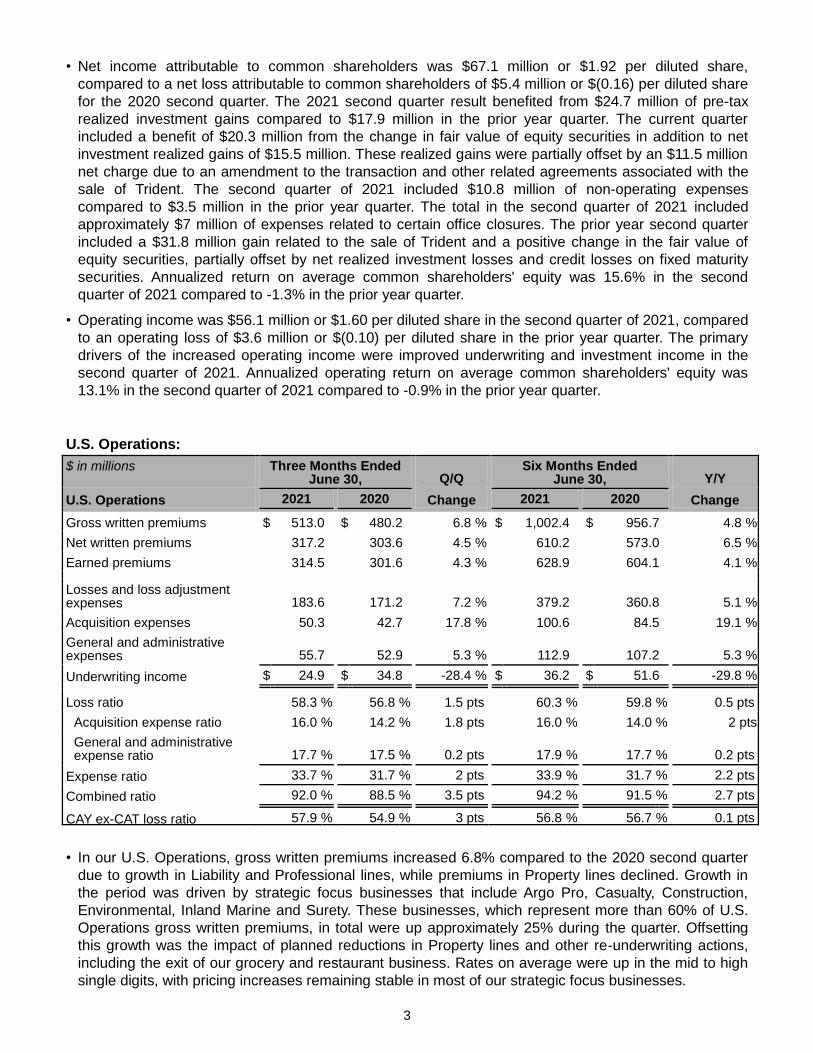
Hamilton, Bermuda - August 2, 2021 - Argo Group International Holdings, Ltd. (NYSE: ARGO) ("Argo" or the "Company") today announced financial results for the three and six months ended June 30, 2021. Argo reported second quarter 2021 net income attributable to common shareholders of $67.1 million or $1.92 per diluted common share, compared to a net loss attributable to common shareholders of $5.4 million or $(0.16) per diluted common share for the 2020 second quarter. Operating income in the second quarter of 2021 was $56.1 million or $1.60 per diluted common share, compared to an operating loss of $3.6 million or $0.10 per diluted common share for the 2020 second quarter. "Argo reported its highest quarterly operating income in more than ten years during the second quarter as a result of our focus on disciplined underwriting and strong investment contributions," said Argo Chief Executive Officer Kevin J. Rehnberg. "Our targeted growth efforts have accelerated across the company during 2021 and we remain optimistic about current market conditions and underwriting opportunities.
“We continue to focus on our strategic priorities of improving underwriting margins, reducing volatility and managing expenses. All of this is focused on generating superior shareholder returns over time.”
Second Quarter Consolidated Operating Highlights
$ in millions
Three Months Ended June 30, Q/Q
Six Months Ended June 30, Y/Y
Consolidated 2021 2020 Change 2021 2020 Change Gross written premiums $ 815.3 $ 799.6 2.0 % $ 1,571.8 $ 1,625.5 -3.3 %
Net written premiums 493.3 456.1 8.2 % 914.6 836.6 9.3 %
Earned premiums 470.3 433.4 8.5 % 936.4 868.4 7.8 % Underwriting income (loss) $ 21.4 $ 0.4 NM $ 3.5 $ (13.6) NM
Net investment income 52.7 1.4 NM 97.1 37.0 162.4 % Net income (loss) attributable to common shareholders $ 67.1 $ (5.4) NM $ 94.3 $ (30.1) NM Operating income (loss) $ 56.1 $ (3.6) NM $ 71.6 $ 8.9 704.5 % Loss ratio 57.7 % 63.0 % -5.3 pts 61.9 % 63.8 % -1.9 pts
Acquisition expense ratio 17.4 % 16.1 % 1.3 pts 17.2 % 16.2 % 1 pts
General and administrative expense ratio 20.3 % 20.8 % -0.5 pts 20.6 % 21.6 % -1 pts
Expense ratio 37.7 % 36.9 % 0.8 pts 37.8 % 37.8 % 0 pts
Combined ratio 95.4 % 99.9 % -4.5 pts 99.7 % 101.6 % -1.9 pts
CAY ex-CAT loss ratio 55.6 % 56.2 % -0.6 pts 55.6 % 56.7 % -1.1 pts

2
• Gross written premiums increased 2.0% to $815.3 million during the second quarter of 2021. Premium growth of 6.8% in U.S. Operations was partially offset by a 5.4% decline in International Operations. Adjusting for the sale of Ariel Re in November 2020 and planned or executed exits of business in Italy, Malta and the U.S. grocery business, underlying premiums grew approximately 14% during the second quarter of 2021. In the U.S., premium growth in strategic growth areas was up 25%, while overall growth was tempered by business exits and re-underwriting actions in certain underperforming businesses and property lines. The decline in International premiums was due to the sale of Ariel Re in November 2020 and planned exits of business in Italy and Malta, largely offset by growth in Syndicate 1200 reflecting continued rate increases and an increase in Argo's participation in Syndicate 1200's capacity. Pricing increases were in the high single digits on average across Argo, with the range varying by business line.
• The combined ratio was 95.4% during the second quarter of 2021 compared to 99.9% in the prior year
quarter. The improved combined ratio was driven by lower losses related to COVID-19 and natural
catastrophes, as well as an improved current accident year, ex-catastrophe ("CAY ex-CAT") loss ratio.
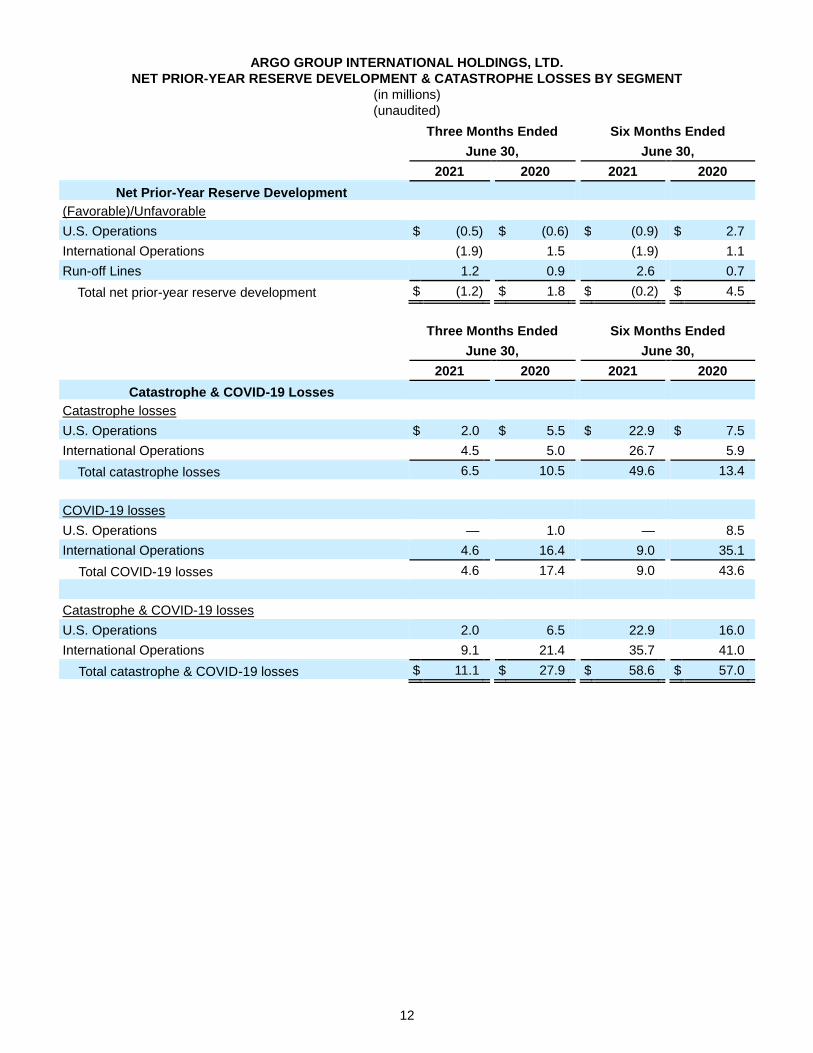
• Total catastrophe losses in the second quarter of 2021 were $11.1 million or 2.4 points on the loss ratio.
Natural catastrophes accounted for $6.5 million and losses related to the COVID-19 pandemic were
$4.6 million. Catastrophe losses in the second quarter of 2020 were $27.9 million or 6.4 points on the
loss ratio and included $17.4 million related to the COVID-19 pandemic.
• Net favorable reserve development for the 2021 second quarter was $1.2 million, or 0.3 points on the
loss ratio, and was recognized in both U.S. and International Operations. Net reserve development of
$1.8 million added 0.4 points to the loss ratio in the second quarter of 2020.
• The CAY ex-CAT loss ratio for the 2021 second quarter of 55.6% compares to 56.2% in the prior year
second quarter. In the U.S., the CAY ex-CAT loss ratio increased compared to the second quarter of
2020 as the prior year quarter benefited from a reduction in claims frequency due to the broader
economic slowdown. The improvement in the CAY ex-CAT loss ratio was driven by International
Operations and is primarily the result of continued remediation efforts and rate increases earning
through the results.
• The expense ratio in the second quarter of 2021 was 37.7% and was up 0.8 points from the prior year
quarter driven by the increase in the acquisition expense ratio. The acquisition expense ratio of 17.4%
increased 1.3 points compared to the prior year second quarter as a higher ratio in the U.S. was
partially offset by an improvement in International. The general and administrative expense ratio of
20.3% improved 0.5 points compared to the prior year second quarter.
• The CAY ex-CAT combined ratio was 93.3% in the second quarter of 2021, compared to 93.1% in the
prior year second quarter.
• Net investment income was $52.7 million in the 2021 second quarter compared to $1.4 million in the
prior year second quarter. Investment income from alternative investments was $29.9 million in the
second quarter of 2021 and included gains from both private equity and hedge fund investments.
Results for the prior year second quarter included losses from alternative investments of $23.4 million
as a result of significant financial market volatility. Net investment income excluding alternatives was
$22.8 million in the second quarter of 2021 and decreased 8.0% from the prior year quarter due
primarily to lower interest rates.
3
• Net income attributable to common shareholders was $67.1 million or $1.92 per diluted share,
compared to a net loss attributable to common shareholders of $5.4 million or $(0.16) per diluted share
for the 2020 second quarter. The 2021 second quarter result benefited from $24.7 million of pre-tax
realized investment gains compared to $17.9 million in the prior year quarter. The current quarter
included a benefit of $20.3 million from the change in fair value of equity securities in addition to net
investment realized gains of $15.5 million. These realized gains were partially offset by an $11.5 million
net charge due to an amendment to the transaction and other related agreements associated with the
sale of Trident. The second quarter of 2021 included $10.8 million of non-operating expenses
compared to $3.5 million in the prior year quarter. The total in the second quarter of 2021 included
approximately $7 million of expenses related to certain office closures. The prior year second quarter
included a $31.8 million gain related to the sale of Trident and a positive change in the fair value of
equity securities, partially offset by net realized investment losses and credit losses on fixed maturity
securities. Annualized return on average common shareholders' equity was 15.6% in the second
quarter of 2021 compared to -1.3% in the prior year quarter.
• Operating income was $56.1 million or $1.60 per diluted share in the second quarter of 2021, compared
to an operating loss of $3.6 million or $(0.10) per diluted share in the prior year quarter. The primary
drivers of the increased operating income were improved underwriting and investment income in the
second quarter of 2021. Annualized operating return on average common shareholders' equity was
13.1% in the second quarter of 2021 compared to -0.9% in the prior year quarter.
U.S. Operations:
$ in millions
Three Months Ended June 30, Q/Q
Six Months Ended June 30, Y/Y
U.S. Operations 2021 2020 Change 2021 2020 Change Gross written premiums $ 513.0 $ 480.2 6.8 % $ 1,002.4 $ 956.7 4.8 %
Net written premiums 317.2 303.6 4.5 % 610.2 573.0 6.5 %
Earned premiums 314.5 301.6 4.3 % 628.9 604.1 4.1 % Losses and loss adjustment expenses 183.6 171.2 7.2 % 379.2 360.8 5.1 %
Acquisition expenses 50.3 42.7 17.8 % 100.6 84.5 19.1 %
General and administrative expenses 55.7 52.9 5.3 % 112.9 107.2 5.3 %
Underwriting income $ 24.9 $ 34.8 -28.4 % $ 36.2 $ 51.6 -29.8 %
Loss ratio 58.3 % 56.8 % 1.5 pts 60.3 % 59.8 % 0.5 pts
Acquisition expense ratio 16.0 % 14.2 % 1.8 pts 16.0 % 14.0 % 2 pts
General and administrative expense ratio 17.7 % 17.5 % 0.2 pts 17.9 % 17.7 % 0.2 pts
Expense ratio 33.7 % 31.7 % 2 pts 33.9 % 31.7 % 2.2 pts
Combined ratio 92.0 % 88.5 % 3.5 pts 94.2 % 91.5 % 2.7 pts
CAY ex-CAT loss ratio 57.9 % 54.9 % 3 pts 56.8 % 56.7 % 0.1 pts
• In our U.S. Operations, gross written premiums increased 6.8% compared to the 2020 second quarter
due to growth in Liability and Professional lines, while premiums in Property lines declined. Growth in
the period was driven by strategic focus businesses that include Argo Pro, Casualty, Construction,
Environmental, Inland Marine and Surety. These businesses, which represent more than 60% of U.S.
Operations gross written premiums, in total were up approximately 25% during the quarter. Offsetting
this growth was the impact of planned reductions in Property lines and other re-underwriting actions,
including the exit of our grocery and restaurant business. Rates on average were up in the mid to high
single digits, with pricing increases remaining stable in most of our strategic focus businesses.
4
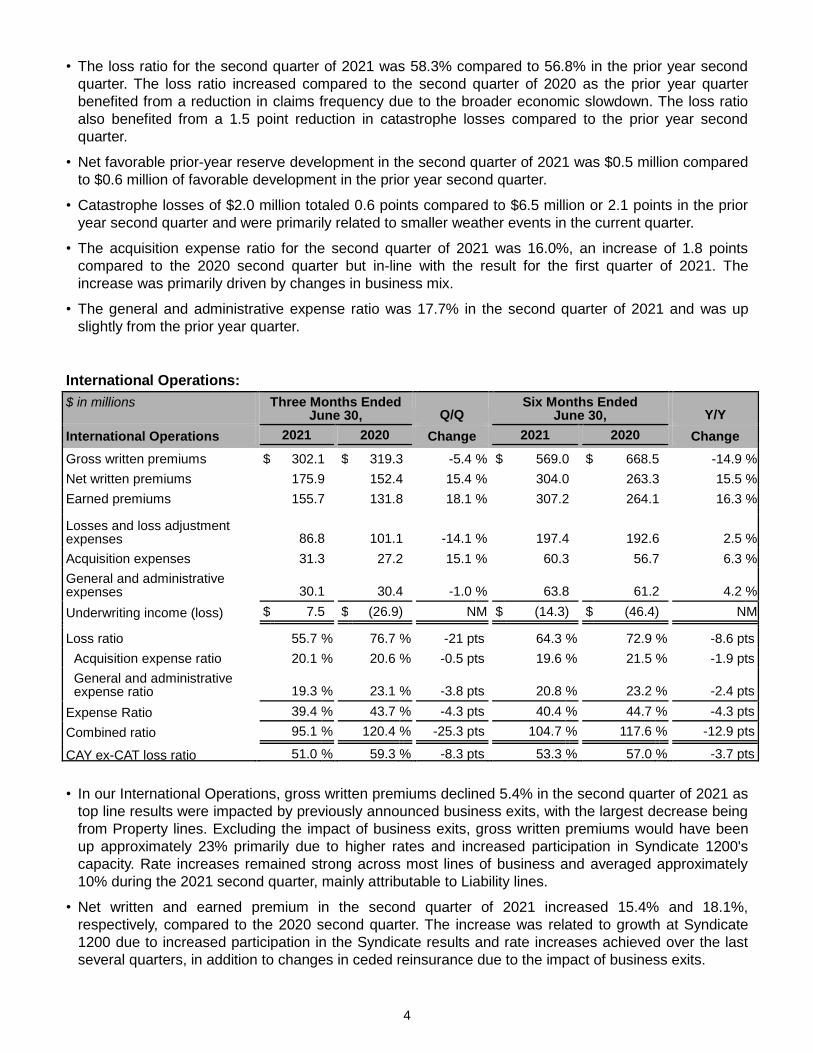
• The loss ratio for the second quarter of 2021 was 58.3% compared to 56.8% in the prior year second
quarter. The loss ratio increased compared to the second quarter of 2020 as the prior year quarter
benefited from a reduction in claims frequency due to the broader economic slowdown. The loss ratio
also benefited from a 1.5 point reduction in catastrophe losses compared to the prior year second
quarter.
• Net favorable prior-year reserve development in the second quarter of 2021 was $0.5 million compared
to $0.6 million of favorable development in the prior year second quarter.
• Catastrophe losses of $2.0 million totaled 0.6 points compared to $6.5 million or 2.1 points in the prior
year second quarter and were primarily related to smaller weather events in the current quarter.
• The acquisition expense ratio for the second quarter of 2021 was 16.0%, an increase of 1.8 points
compared to the 2020 second quarter but in-line with the result for the first quarter of 2021. The
increase was primarily driven by changes in business mix.
• The general and administrative expense ratio was 17.7% in the second quarter of 2021 and was up
slightly from the prior year quarter.
International Operations:
$ in millions
Three Months Ended June 30, Q/Q
Six Months Ended June 30, Y/Y
International Operations 2021 2020 Change 2021 2020 Change Gross written premiums $ 302.1 $ 319.3 -5.4 % $ 569.0 $ 668.5 -14.9 %
Net written premiums 175.9 152.4 15.4 % 304.0 263.3 15.5 %
Earned premiums 155.7 131.8 18.1 % 307.2 264.1 16.3 % Losses and loss adjustment expenses 86.8 101.1 -14.1 % 197.4 192.6 2.5 %
Acquisition expenses 31.3 27.2 15.1 % 60.3 56.7 6.3 %
General and administrative expenses 30.1 30.4 -1.0 % 63.8 61.2 4.2 %
Underwriting income (loss) $ 7.5 $ (26.9) NM $ (14.3) $ (46.4) NM
Loss ratio 55.7 % 76.7 % -21 pts 64.3 % 72.9 % -8.6 pts
Acquisition expense ratio 20.1 % 20.6 % -0.5 pts 19.6 % 21.5 % -1.9 pts
General and administrative expense ratio 19.3 % 23.1 % -3.8 pts 20.8 % 23.2 % -2.4 pts
Expense Ratio 39.4 % 43.7 % -4.3 pts 40.4 % 44.7 % -4.3 pts
Combined ratio 95.1 % 120.4 % -25.3 pts 104.7 % 117.6 % -12.9 pts
CAY ex-CAT loss ratio 51.0 % 59.3 % -8.3 pts 53.3 % 57.0 % -3.7 pts
• In our International Operations, gross written premiums declined 5.4% in the second quarter of 2021 as
top line results were impacted by previously announced business exits, with the largest decrease being
from Property lines. Excluding the impact of business exits, gross written premiums would have been
up approximately 23% primarily due to higher rates and increased participation in Syndicate 1200's
capacity. Rate increases remained strong across most lines of business and averaged approximately
10% during the 2021 second quarter, mainly attributable to Liability lines.
• Net written and earned premium in the second quarter of 2021 increased 15.4% and 18.1%,
respectively, compared to the 2020 second quarter. The increase was related to growth at Syndicate
1200 due to increased participation in the Syndicate results and rate increases achieved over the last
several quarters, in addition to changes in ceded reinsurance due to the impact of business exits.
5
• The loss ratio for the second quarter of 2021 was 55.7% compared to 76.7% in the prior year second
quarter. The improvement in the loss ratio is primarily the result of continued remediation efforts and
rate increases earning through results. The loss ratio in the current quarter also benefited from a
reduction in catastrophe losses compared to the second quarter of 2020.
• Catastrophe losses totaled 5.9 points in the second quarter of 2021, attributed to natural catastrophes
and losses related to COVID-19.
• The CAY ex-CAT loss ratio was 51.0% in the second quarter of 2021 compared to 59.3% in the prior
year second quarter. The improvement reflects the benefit of pricing and underwriting actions, as well
as a fewer number of large losses compared to the prior year quarter.
• Net favorable prior year reserve development in the second quarter of 2021 was $1.9 million or 1.2
points on the loss ratio, compared to modest reserve strengthening in prior year second quarter.
• The acquisition ratio improved 0.5 points to 20.1% during the quarter with the improvement driven by
actions to remove certain high-cost delegated authority arrangements.
• The general and administrative expense ratio of 19.3% improved 3.8 points from the prior year second
quarter and is attributable largely to growth in earned premiums.
Balance Sheet:
• Book value per common share was $50.34 at June 30, 2021, compared to $48.23 at March 31, 2021.
Including dividends paid, book value per common share increased 5.0% relative to March 31, 2021 due
to strong retained earnings and modest net unrealized gains on fixed income securities.
6
CONFERENCE CALL
Argo management will conduct an investor conference call starting at 10 a.m. EST on Tuesday, August 3, 2021. Participants in the U.S. can access the call by dialing (877) 291-5203. Callers dialing from outside the U.S. can access the call by dialing (412) 902-6610. Please ask the operator for the Argo earnings call. A live webcast of the conference call can be accessed at https://services.choruscall.com/links/argo210803.html.
A webcast replay will be available shortly after the live conference call and can be accessed at https://services.choruscall.com/links/argo210803.html. A telephone replay of the conference call will be available through August 10, 2021, to callers in the U.S. by dialing (877) 344-7529 and to callers outside the U.S. by dialing (412) 317-0088 (conference #10158065).
ABOUT ARGO GROUP INTERNATIONAL HOLDINGS, LTD.
Argo Group International Holdings, Ltd. (NYSE: ARGO) is an underwriter of specialty insurance products in the property and casualty market. Argo offers a full line of products and services designed to meet the unique coverage and claims-handling needs of businesses in two primary segments: U.S. Operations and International Operations. Argo and its insurance subsidiaries are rated ‛A-’ by Standard and Poor’s. Argo’s insurance subsidiaries are rated ‛A-’ by A.M. Best. More information on Argo and its subsidiaries is available at www.argogroup.com.
FORWARD-LOOKING STATEMENTS
This press release includes forward-looking statements that reflect our current views with respect to future events
and financial performance. Forward-looking statements include all statements that do not relate solely to historical
or current facts, and can be identified by the use of words such as "expect," "intend," "plan," "believe," “do not
believe,” “aim,” "project," "anticipate," “seek,” "will," “likely,” “assume,” “estimate,” "may," “continue,” “guidance,”
“objective,” “remain optimistic,” “improve,” “progress,” "path toward," “outlook,” “trends,” “future,” “could,” “would,”
“should,” “target,” “on track” and similar expressions of a future or forward-looking nature.
Such statements are subject to certain risks and uncertainties that could cause actual events or results to differ
materially. For a more detailed discussion of such risks and uncertainties, see Item 1A, “Risk Factors” in Argo’s
Annual Report on Form 10-K for the fiscal year ended December 31, 2020 and in other filings with the Securities
and Exchange Commission (“SEC”). The inclusion of a forward-looking statement herein should not be regarded as
a representation by Argo that Argo’s objectives will be achieved. Any forward looking statements speak only as of
the date of this press release. Argo undertakes no obligation to publicly update forward-looking statements, whether
as a result of new information, future events or otherwise. You should not place undue reliance on any such
statements.
NON-GAAP FINANCIAL MEASURES & OTHER METRICS
In presenting the Company's results, management has included and discussed in this press release certain non-
generally accepted accounting principles ("non-GAAP") financial measures within the meaning of Regulation G as
promulgated by the SEC. Management believes that these non-GAAP measures, which may be defined differently
by other companies, better explain the Company's results of operations in a manner that allows for a more complete
understanding of the underlying trends in the Company's business. However, these measures should not be viewed
as a substitute for those determined in accordance with generally accepted accounting principles ("U.S. GAAP").
“Underwriting income (loss)” is an internal performance measure used in the management of the Company’s
operations and represents net amount earned from underwriting activities (net premium earned less underwriting
expenses and claims incurred). Although this measure of profit (loss) does not replace net income (loss) computed
in accordance with U.S. GAAP as a measure of profitability, management uses this measure of profit (loss) to focus
our reporting segments on generating underwriting income. The Company presents Underwriting income as a
measure that is commonly recognized as a standard of performance by investors, analysts, rating agencies and
other users of its financial information.
“Current accident year (CAY) ex-CAT combined ratio” and the “Current accident year (CAY) ex-CAT loss ratio" are
internal measures used by the management of the Company to evaluate the performance of its underwriting activity
and represents the net amount of underwriting income excluding catastrophe related charges, the impact of
changes to prior year loss reserves and other one-time items that would impact expenses or net earned premium.
Although this measure does not replace the GAAP combined ratio it provides management with a view of the quality
of earnings generated by underwriting activity for the current accident year.
7
“Operating income (loss)" is an internal performance measure used in the management of the Company's
operations and represents operating results after-tax (at an assumed effective tax rate of 15%) and preferred share
dividends excluding, as applicable, net realized investment gains or losses, net foreign exchange gain or loss, non-
operating expenses, and other similar non-recurring items. The Company excludes net realized investment gains or
losses, net foreign exchange gain or loss, non-operating expenses, and other similar non-recurring items from the
calculation of operating income because these amounts are influenced by and fluctuate in part, by market
conditions that are outside of management’s control. In addition to presenting net income determined in accordance
with U.S. GAAP, the Company believes that showing operating income enables investors, analysts, rating agencies
and other users of the Company's financial information to more easily analyze our results of operations and
underlying business performance.
"Annualized return on average common shareholders’ equity" ("ROACE") is calculated using average common
shareholders' equity. In calculating ROACE, the net income attributable to common shareholders for the period is
multiplied by the number of periods in a calendar year to arrive at annualized net income available to common
shareholders. The Company presents ROACE as a measure that is commonly recognized as a standard of
performance by investors, analysts, rating agencies and other users of its financial information. "Annualized
operating return on average common shareholders' equity" is calculated using operating income (as defined above
and annualized in the manner described for net income (loss) attributable to common shareholders under ROACE
above) and average common shareholders' equity.
The “percentage change in book value per common share” includes (by adding) the effects of cash dividends paid
per common share to the calculated book value per common share for the current period. This adjusted amount is
then compared to the prior period’s book value per common share to determine the period over period change. The
Company believes that including the dividends paid per common share allows users of its financial statements to
more easily identify the impact of the changes in book value per common share from the perspective of investors.
Reconciliations of non-GAAP financial measures to their most directly comparable U.S. GAAP measures are
included in the attached tables and footnotes.
(financial tables follow)

8
ARGO GROUP INTERNATIONAL HOLDINGS, LTD.
CONSOLIDATED BALANCE SHEETS
(in millions, except per share amounts)
June 30, December 31,
2021 2020
(unaudited)
Assets
Total investments $ 5,185.9 $ 5,255.8 Cash 190.7 148.8 Accrued investment income 20.8 21.8 Receivables 3,541.6 3,688.8 Goodwill and intangible assets 207.8 207.8 Deferred acquisition costs, net 168.2 163.6 Ceded unearned premiums 591.0 575.1 Other assets 462.3 404.1
Total assets $ 10,368.3 $ 10,465.8
Liabilities and Shareholders' Equity
Reserves for losses and loss adjustment expenses $ 5,238.6 $ 5,406.0 Unearned premiums 1,473.7 1,464.8 Ceded reinsurance payable, net 920.2 950.4 Senior unsecured fixed rate notes 140.2 140.2 Other indebtedness 60.4 60.7 Junior subordinated debentures 258.0 257.8 Other liabilities 379.3 328.1
Total liabilities 8,470.4 8,608.0
Preferred shares 144.0 144.0 Common shareholders’ equity 1,753.9 1,713.8
Total shareholders' equity 1,897.9 1,857.8
Total liabilities and shareholders' equity $ 10,368.3 $ 10,465.8
Book value per common share $ 50.34 $ 49.40
9
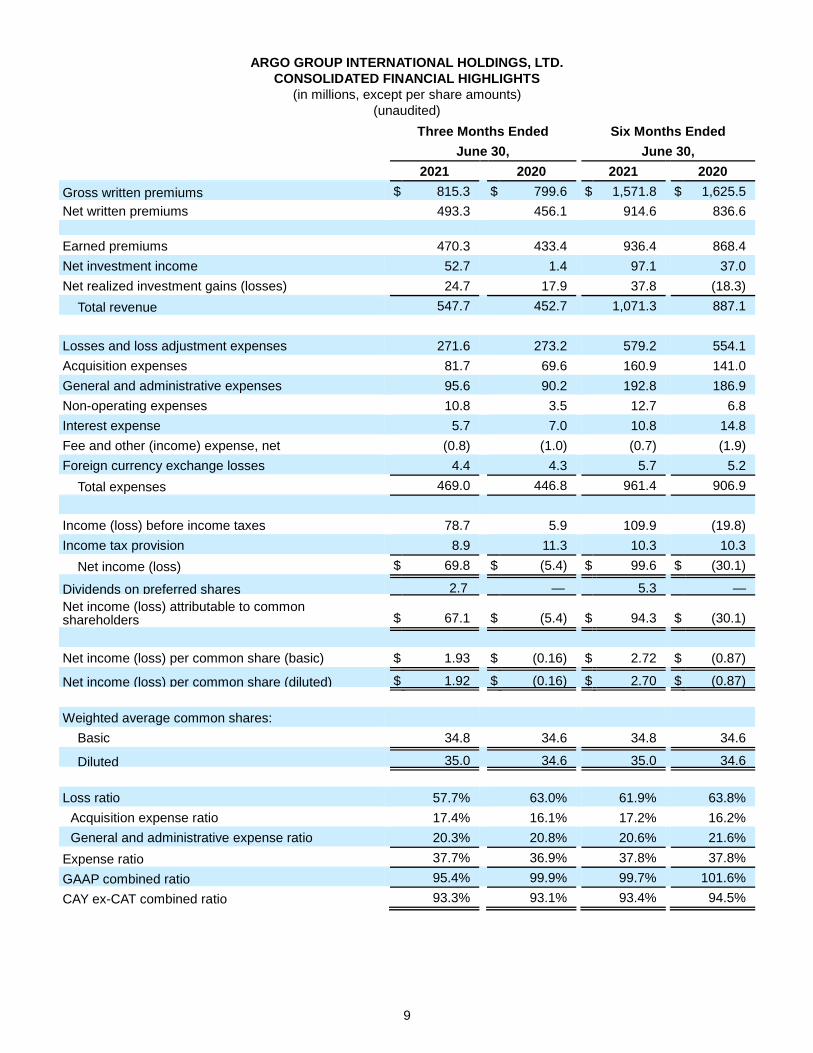
ARGO GROUP INTERNATIONAL HOLDINGS, LTD.
CONSOLIDATED FINANCIAL HIGHLIGHTS
(in millions, except per share amounts)
(unaudited)
Three Months Ended Six Months Ended
June 30, June 30,
2021 2020 2021 2020
Gross written premiums $ 815.3 $ 799.6 $ 1,571.8 $ 1,625.5
Net written premiums 493.3 456.1 914.6 836.6 Earned premiums 470.3 433.4 936.4 868.4
Net investment income 52.7 1.4 97.1 37.0
Net realized investment gains (losses) 24.7 17.9 37.8 (18.3)
Total revenue 547.7 452.7 1,071.3 887.1
Losses and loss adjustment expenses 271.6 273.2 579.2 554.1
Acquisition expenses 81.7 69.6 160.9 141.0
General and administrative expenses 95.6 90.2 192.8 186.9
Non-operating expenses 10.8 3.5 12.7 6.8
Interest expense 5.7 7.0 10.8 14.8
Fee and other (income) expense, net (0.8) (1.0) (0.7) (1.9)
Foreign currency exchange losses 4.4 4.3 5.7 5.2
Total expenses 469.0 446.8 961.4 906.9
Income (loss) before income taxes 78.7 5.9 109.9 (19.8)
Income tax provision 8.9 11.3 10.3 10.3
Net income (loss) $ 69.8 $ (5.4) $ 99.6 $ (30.1)
Dividends on preferred shares 2.7 — 5.3 —
Net income (loss) attributable to common shareholders $ 67.1 $ (5.4) $ 94.3 $ (30.1)
Net income (loss) per common share (basic) $ 1.93 $ (0.16) $ 2.72 $ (0.87)
Net income (loss) per common share (diluted) $ 1.92 $ (0.16) $ 2.70 $ (0.87)
Weighted average common shares:
Basic 34.8 34.6 34.8 34.6
Diluted 35.0 34.6 35.0 34.6
Loss ratio 57.7% 63.0% 61.9% 63.8%
Acquisition expense ratio 17.4% 16.1% 17.2% 16.2%
General and administrative expense ratio 20.3% 20.8% 20.6% 21.6%
Expense ratio 37.7% 36.9% 37.8% 37.8%
GAAP combined ratio 95.4% 99.9% 99.7% 101.6%
CAY ex-CAT combined ratio 93.3% 93.1% 93.4% 94.5%

10
ARGO GROUP INTERNATIONAL HOLDINGS, LTD.
SEGMENT DATA
(in millions)
(unaudited)
Three Months Ended Six months ended
June 30, June 30,
2021 2020 2021 2020
U.S. Operations
Gross written premiums $ 513.0 $ 480.2 $ 1,002.4 $ 956.7
Net written premiums 317.2 303.6 610.2 573.0
Earned premiums 314.5 301.6 628.9 604.1
Underwriting income 24.9 34.8 36.2 51.6
Net investment income 33.7 0.8 62.5 26.0
Interest expense (3.5) (4.2) (7.1) (9.1)
Fee income (expense), net (0.6) (0.2) (0.5) (0.4)
Operating income before taxes $ 54.5 $ 31.2 $ 91.1 $ 68.1
Loss ratio 58.3% 56.8% 60.3% 59.8%
Acquisition expense ratio 16.0% 14.2% 16.0% 14.0%
General and administrative expense ratio 17.7% 17.5% 17.9% 17.7%
Expense Ratio 33.7% 31.7% 33.9% 31.7%
GAAP combined ratio 92.0% 88.5% 94.2% 91.5%
CAY ex-CAT combined ratio 91.6% 86.6% 90.7% 88.4%
International Operations
Gross written premiums $ 302.1 $ 319.3 $ 569.0 $ 668.5
Net written premiums 175.9 152.4 304.0 263.3
Earned premiums 155.7 131.8 307.2 264.1
Underwriting income (loss) 7.5 (26.9) (14.3) (46.4)
Net investment income 13.9 0.5 25.9 9.1
Interest expense (1.5) (2.0) (2.9) (4.3)
Fee income (expense), net 0.9 0.9 0.5 1.8
Operating income (loss) before taxes $ 20.8 $ (27.5) $ 9.2 $ (39.8)
Loss ratio 55.7% 76.7% 64.3% 72.9%
Acquisition expense ratio 20.1% 20.6% 19.6% 21.5%
General and administrative expense ratio 19.3% 23.1% 20.8% 23.2%
Expense Ratio 39.4% 43.7% 40.4% 44.7%
GAAP combined ratio 95.1% 120.4% 104.7% 117.6%
CAY ex-CAT combined ratio 90.4% 103.0% 93.7% 101.7%

11
ARGO GROUP INTERNATIONAL HOLDINGS, LTD.
RECONCILIATION OF LOSS RATIOS
(unaudited)
Three Months Ended Six Months Ended
June 30, June 30,
2021 2020 2021 2020
U.S. Operations
Loss ratio 58.3 % 56.8 % 60.3 % 59.8 %
Prior accident year loss reserve development 0.2 % 0.2 % 0.1 % (0.5) %
Catastrophe losses (0.6) % (2.1) % (3.6) % (2.6) %
CAY ex-CAT loss ratio 57.9 % 54.9 % 56.8 % 56.7 %
International Operations
Loss ratio 55.7 % 76.7 % 64.3 % 72.9 %
Prior accident year loss reserve development 1.2 % (1.2) % 0.6 % (0.4) %
Catastrophe losses (5.9) % (16.2) % (11.6) % (15.5) %
CAY ex-CAT loss ratio 51.0 % 59.3 % 53.3 % 57.0 %
Consolidated
Loss ratio 57.7 % 63.0 % 61.9 % 63.8 %
Prior accident year loss reserve development 0.3 % (0.4) % — % (0.5) %
Catastrophe losses (2.4) % (6.4) % (6.3) % (6.6) %
CAY ex-CAT loss ratio 55.6 % 56.2 % 55.6 % 56.7 %
12
ARGO GROUP INTERNATIONAL HOLDINGS, LTD.
NET PRIOR-YEAR RESERVE DEVELOPMENT & CATASTROPHE LOSSES BY SEGMENT
(in millions)
(unaudited)
Three Months Ended Six Months Ended
June 30, June 30,
2021 2020 2021 2020
Net Prior-Year Reserve Development
(Favorable)/Unfavorable
U.S. Operations $ (0.5) $ (0.6) $ (0.9) $ 2.7 International Operations (1.9) 1.5 (1.9) 1.1 Run-off Lines 1.2 0.9 2.6 0.7
Total net prior-year reserve development $ (1.2) $ 1.8 $ (0.2) $ 4.5
Three Months Ended Six Months Ended
June 30, June 30,
2021 2020 2021 2020
Catastrophe & COVID-19 Losses
Catastrophe losses
U.S. Operations $ 2.0 $ 5.5 $ 22.9 $ 7.5 International Operations 4.5 5.0 26.7 5.9
Total catastrophe losses 6.5 10.5 49.6 13.4
COVID-19 losses
U.S. Operations — 1.0 — 8.5 International Operations 4.6 16.4 9.0 35.1
Total COVID-19 losses 4.6 17.4 9.0 43.6
Catastrophe & COVID-19 losses
U.S. Operations 2.0 6.5 22.9 16.0 International Operations 9.1 21.4 35.7 41.0
Total catastrophe & COVID-19 losses $ 11.1 $ 27.9 $ 58.6 $ 57.0

13
ARGO GROUP INTERNATIONAL HOLDINGS, LTD.
RECONCILIATION OF UNDERWRITING INCOME (LOSS) TO NET INCOME (LOSS)
CONSOLIDATED
(in millions)
(unaudited)
Three Months Ended Six Months Ended
June 30, June 30,
2021 2020 2021 2020
Net income (loss) $ 69.8 $ (5.4) $ 99.6 $ (30.1) Add (deduct):
Income tax provision 8.9 11.3 10.3 10.3 Net investment income (52.7) (1.4) (97.1) (37.0) Net realized investment (gains) losses (24.7) (17.9) (37.8) 18.3 Interest expense 5.7 7.0 10.8 14.8 Fee and other (income) expense, net (0.8) (1.0) (0.7) (1.9) Foreign currency exchange losses 4.4 4.3 5.7 5.2 Non-operating expenses 10.8 3.5 12.7 6.8
Underwriting income (loss) $ 21.4 $ 0.4 $ 3.5 $ (13.6)
14
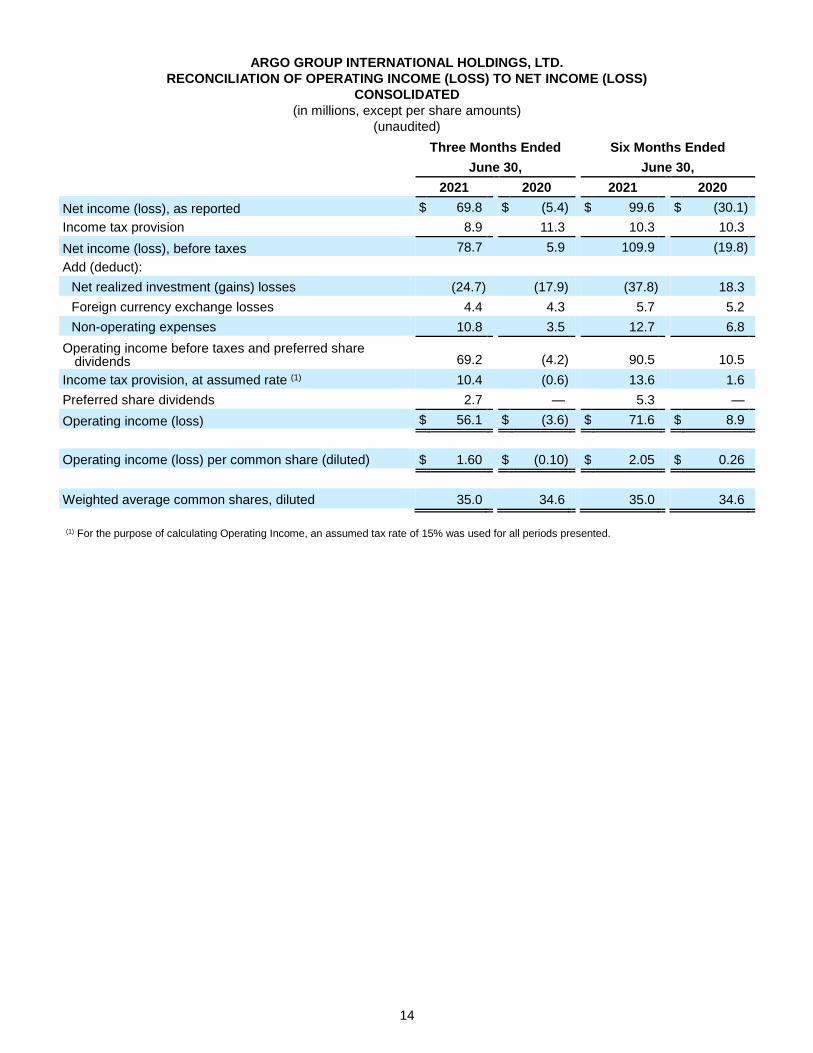
ARGO GROUP INTERNATIONAL HOLDINGS, LTD.
RECONCILIATION OF OPERATING INCOME (LOSS) TO NET INCOME (LOSS)
CONSOLIDATED
(in millions, except per share amounts)
(unaudited)
Three Months Ended Six Months Ended
June 30, June 30,
2021 2020 2021 2020
Net income (loss), as reported $ 69.8 $ (5.4) $ 99.6 $ (30.1) Income tax provision 8.9 11.3 10.3 10.3
Net income (loss), before taxes 78.7 5.9 109.9 (19.8) Add (deduct):
Net realized investment (gains) losses (24.7) (17.9) (37.8) 18.3 Foreign currency exchange losses 4.4 4.3 5.7 5.2 Non-operating expenses 10.8 3.5 12.7 6.8
Operating income before taxes and preferred share dividends 69.2 (4.2) 90.5 10.5
Income tax provision, at assumed rate (1) 10.4 (0.6) 13.6 1.6 Preferred share dividends 2.7 — 5.3 —
Operating income (loss) $ 56.1 $ (3.6) $ 71.6 $ 8.9
Operating income (loss) per common share (diluted) $ 1.60 $ (0.10) $ 2.05 $ 0.26
Weighted average common shares, diluted 35.0 34.6 35.0 34.6 (1) For the purpose of calculating Operating Income, an assumed tax rate of 15% was used for all periods presented.
15
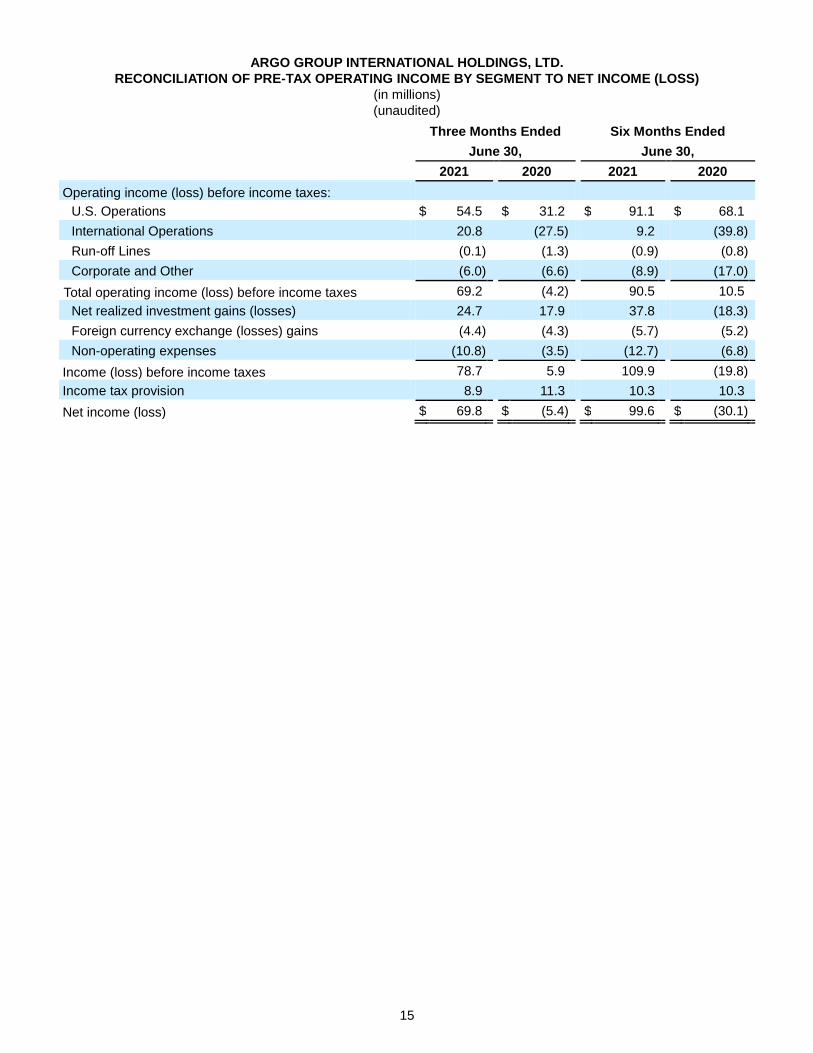
ARGO GROUP INTERNATIONAL HOLDINGS, LTD.
RECONCILIATION OF PRE-TAX OPERATING INCOME BY SEGMENT TO NET INCOME (LOSS)
(in millions)
(unaudited)
Three Months Ended Six Months Ended
June 30, June 30,
2021 2020 2021 2020
Operating income (loss) before income taxes:
U.S. Operations $ 54.5 $ 31.2 $ 91.1 $ 68.1 International Operations 20.8 (27.5) 9.2 (39.8) Run-off Lines (0.1) (1.3) (0.9) (0.8) Corporate and Other (6.0) (6.6) (8.9) (17.0)
Total operating income (loss) before income taxes 69.2 (4.2) 90.5 10.5 Net realized investment gains (losses) 24.7 17.9 37.8 (18.3) Foreign currency exchange (losses) gains (4.4) (4.3) (5.7) (5.2) Non-operating expenses (10.8) (3.5) (12.7) (6.8)
Income (loss) before income taxes 78.7 5.9 109.9 (19.8) Income tax provision 8.9 11.3 10.3 10.3
Net income (loss) $ 69.8 $ (5.4) $ 99.6 $ (30.1)
16
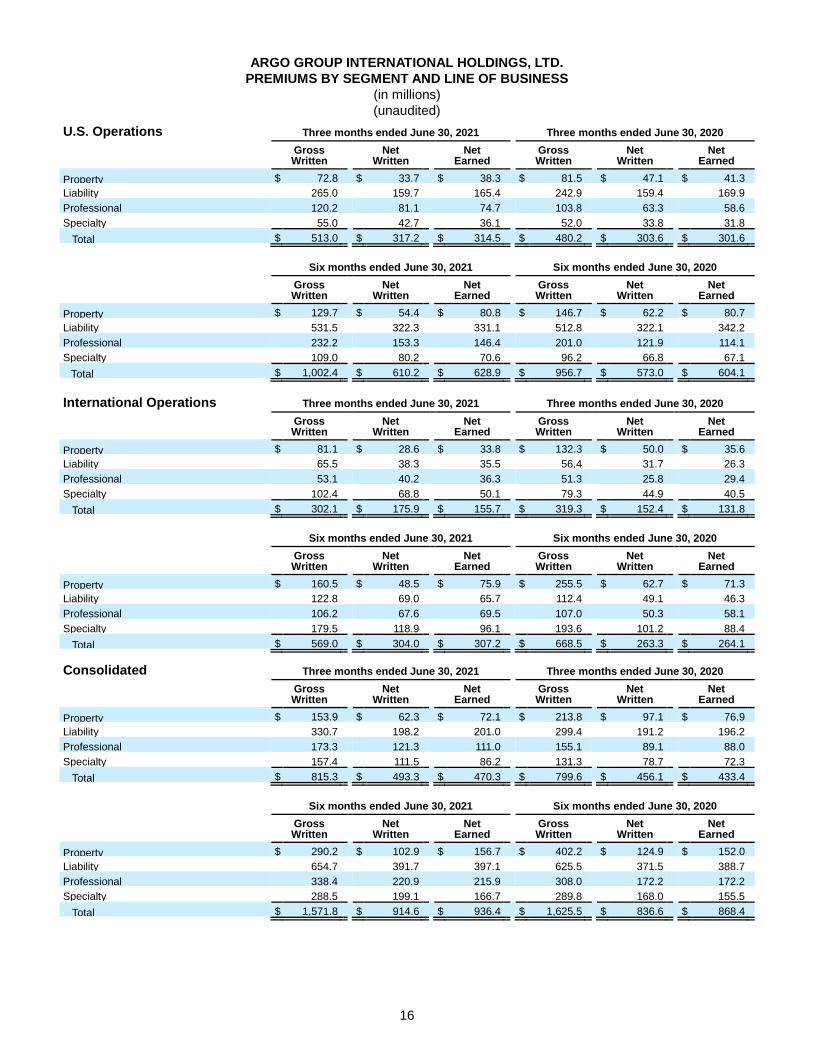
ARGO GROUP INTERNATIONAL HOLDINGS, LTD.
PREMIUMS BY SEGMENT AND LINE OF BUSINESS
(in millions)
(unaudited)
U.S. Operations Three months ended June 30, 2021 Three months ended June 30, 2020
Gross Written
Net Written
Net Earned
Gross Written
Net Written
Net Earned
Property $ 72.8 $ 33.7 $ 38.3 $ 81.5 $ 47.1 $ 41.3 Liability 265.0 159.7 165.4 242.9 159.4 169.9 Professional 120.2 81.1 74.7 103.8 63.3 58.6 Specialty 55.0 42.7 36.1 52.0 33.8 31.8
Total $ 513.0 $ 317.2 $ 314.5 $ 480.2 $ 303.6 $ 301.6
Six months ended June 30, 2021 Six months ended June 30, 2020
Gross Written
Net Written
Net Earned
Gross Written
Net Written
Net Earned
Property $ 129.7 $ 54.4 $ 80.8 $ 146.7 $ 62.2 $ 80.7 Liability 531.5 322.3 331.1 512.8 322.1 342.2 Professional 232.2 153.3 146.4 201.0 121.9 114.1 Specialty 109.0 80.2 70.6 96.2 66.8 67.1
Total $ 1,002.4 $ 610.2 $ 628.9 $ 956.7 $ 573.0 $ 604.1
International Operations Three months ended June 30, 2021 Three months ended June 30, 2020
Gross Written
Net Written
Net Earned
Gross Written
Net Written
Net Earned
Property $ 81.1 $ 28.6 $ 33.8 $ 132.3 $ 50.0 $ 35.6 Liability 65.5 38.3 35.5 56.4 31.7 26.3 Professional 53.1 40.2 36.3 51.3 25.8 29.4 Specialty 102.4 68.8 50.1 79.3 44.9 40.5
Total $ 302.1 $ 175.9 $ 155.7 $ 319.3 $ 152.4 $ 131.8
Six months ended June 30, 2021 Six months ended June 30, 2020
Gross Written
Net Written
Net Earned
Gross Written
Net Written
Net Earned
Property $ 160.5 $ 48.5 $ 75.9 $ 255.5 $ 62.7 $ 71.3 Liability 122.8 69.0 65.7 112.4 49.1 46.3 Professional 106.2 67.6 69.5 107.0 50.3 58.1 Specialty 179.5 118.9 96.1 193.6 101.2 88.4
Total $ 569.0 $ 304.0 $ 307.2 $ 668.5 $ 263.3 $ 264.1
Consolidated Three months ended June 30, 2021 Three months ended June 30, 2020
Gross Written
Net Written
Net Earned
Gross Written
Net Written
Net Earned
Property $ 153.9 $ 62.3 $ 72.1 $ 213.8 $ 97.1 $ 76.9 Liability 330.7 198.2 201.0 299.4 191.2 196.2 Professional 173.3 121.3 111.0 155.1 89.1 88.0 Specialty 157.4 111.5 86.2 131.3 78.7 72.3
Total $ 815.3 $ 493.3 $ 470.3 $ 799.6 $ 456.1 $ 433.4
Six months ended June 30, 2021 Six months ended June 30, 2020
Gross Written
Net Written
Net Earned
Gross Written
Net Written
Net Earned
Property $ 290.2 $ 102.9 $ 156.7 $ 402.2 $ 124.9 $ 152.0 Liability 654.7 391.7 397.1 625.5 371.5 388.7 Professional 338.4 220.9 215.9 308.0 172.2 172.2 Specialty 288.5 199.1 166.7 289.8 168.0 155.5
Total $ 1,571.8 $ 914.6 $ 936.4 $ 1,625.5 $ 836.6 $ 868.4
17
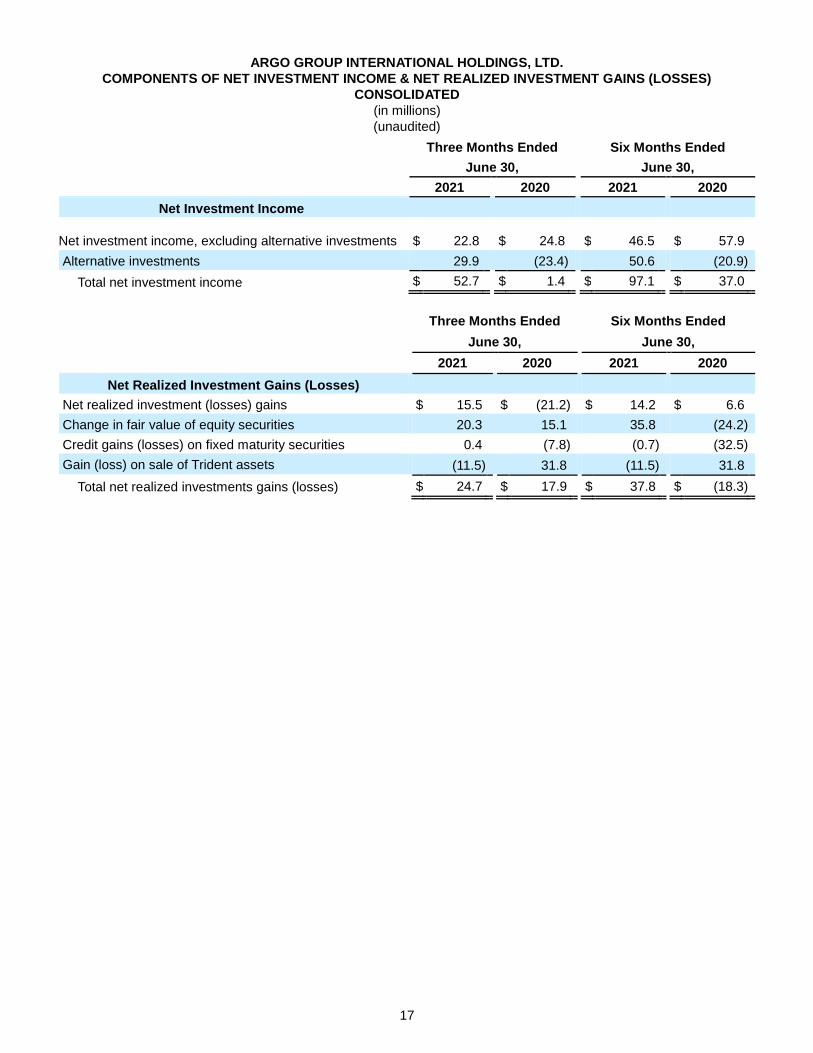
ARGO GROUP INTERNATIONAL HOLDINGS, LTD.
COMPONENTS OF NET INVESTMENT INCOME & NET REALIZED INVESTMENT GAINS (LOSSES)
CONSOLIDATED
(in millions)
(unaudited)
Three Months Ended Six Months Ended
June 30, June 30,
2021 2020 2021 2020
Net Investment Income
Net investment income, excluding alternative investments $ 22.8 $ 24.8 $ 46.5 $ 57.9
Alternative investments 29.9 (23.4) 50.6 (20.9)
Total net investment income $ 52.7 $ 1.4 $ 97.1 $ 37.0
Three Months Ended Six Months Ended
June 30, June 30,
2021 2020 2021 2020
Net Realized Investment Gains (Losses)
Net realized investment (losses) gains $ 15.5 $ (21.2) $ 14.2 $ 6.6 Change in fair value of equity securities 20.3 15.1 35.8 (24.2) Credit gains (losses) on fixed maturity securities 0.4 (7.8) (0.7) (32.5) Gain (loss) on sale of Trident assets (11.5) 31.8 (11.5) 31.8
Total net realized investments gains (losses) $ 24.7 $ 17.9 $ 37.8 $ (18.3)
18
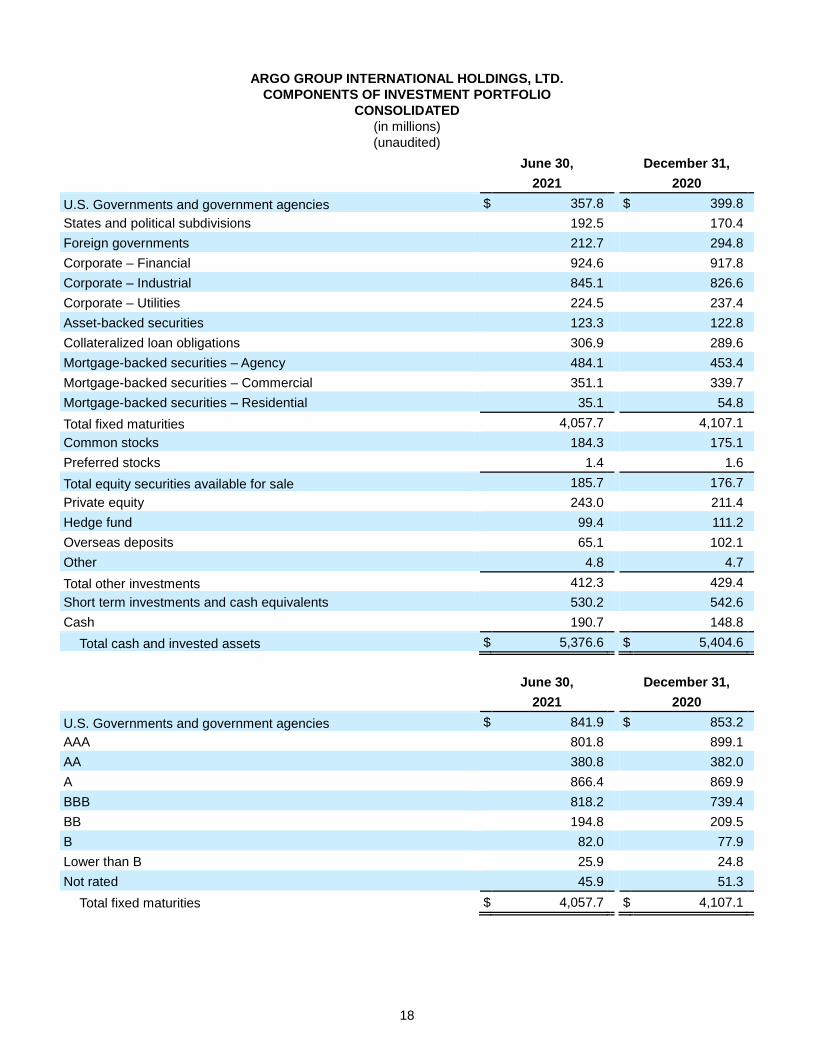
ARGO GROUP INTERNATIONAL HOLDINGS, LTD.
COMPONENTS OF INVESTMENT PORTFOLIO
CONSOLIDATED
(in millions)
(unaudited)
June 30, December 31,
2021 2020
U.S. Governments and government agencies $ 357.8 $ 399.8 States and political subdivisions 192.5 170.4 Foreign governments 212.7 294.8 Corporate – Financial 924.6 917.8 Corporate – Industrial 845.1 826.6 Corporate – Utilities 224.5 237.4 Asset-backed securities 123.3 122.8 Collateralized loan obligations 306.9 289.6 Mortgage-backed securities – Agency 484.1 453.4 Mortgage-backed securities – Commercial 351.1 339.7 Mortgage-backed securities – Residential 35.1 54.8
Total fixed maturities 4,057.7 4,107.1 Common stocks 184.3 175.1 Preferred stocks 1.4 1.6
Total equity securities available for sale 185.7 176.7 Private equity 243.0 211.4 Hedge fund 99.4 111.2 Overseas deposits 65.1 102.1 Other 4.8 4.7
Total other investments 412.3 429.4 Short term investments and cash equivalents 530.2 542.6 Cash 190.7 148.8
Total cash and invested assets $ 5,376.6 $ 5,404.6
June 30, December 31,
2021 2020
U.S. Governments and government agencies $ 841.9 $ 853.2 AAA 801.8 899.1 AA 380.8 382.0 A 866.4 869.9 BBB 818.2 739.4 BB 194.8 209.5 B 82.0 77.9 Lower than B 25.9 24.8 Not rated 45.9 51.3
Total fixed maturities $ 4,057.7 $ 4,107.1

19
ARGO GROUP INTERNATIONAL HOLDINGS, LTD.
SHAREHOLDER RETURN ANALYSIS
(in millions, except per share data)
(unaudited)
Three Months Ended Six Months Ended
June 30, June 30,
2021 2020 2021 2020
Net income (loss) attributable to common shareholders $ 67.1 $ (5.4) $ 94.3 $ (30.1)
Operating income (loss) (1) 56.1 (3.6) 71.6 8.9
Common Shareholders' Equity - Beginning of period $ 1,677.0 $ 1,613.5 $ 1,713.8 $ 1,763.7
Common Shareholders' Equity - End of period 1,753.9 1,707.7 1,753.9 1,707.7
Average Common Shareholders' Equity $ 1,715.5 $ 1,660.6 $ 1,733.9 $ 1,735.7
Common shares outstanding - End of period 34.843 34.645 34.843 34.645
Book value per common share $ 50.34 $ 49.29 $ 50.34 $ 49.29
Cash dividends paid per common share during 2021
0.31 0.62
Book value per common share, June 30, 2021 - including cash dividends paid $ 50.65 $ 50.96
Book value per common share, prior period (2) $ 48.23 $ 49.40
Change in book value per common share during 2021 4.4 % 1.9 %
Change in book value per common share including cash dividends paid, during 2021 (2) 5.0 % 3.2 %
Annualized return on average common shareholders' equity 15.6 % (1.3) % 10.9 % (3.5) %
Annualized operating return on average common shareholders' equity 13.1 % (0.9) % 8.3 % 1.0 %
(1) For the purpose of calculating Operating Income, an assumed tax rate of 15% was used for all periods presented.
(2) The percentage change in book value per common share is calculated by including cash dividends of $0.31 per common share and $0.62 per
common share paid to shareholders during the three and six months ended June 30, 2021, respectively. This adjusted amount (Book value
per common share, including dividends) is then compared to the book value per common share as of March 31, 2021 and December 31,
2021, respectively, to determine the change for the three and six months ended June 30, 2021.
Contact:
Brett Shirreffs David Snowden
Head of Investor Relations Senior Vice President, Communications
212.607.8830 210.321.2104