Embed Size (px)
Citation preview

Arialdi M. Miniño, MPHMargaret Warner, PhDNational Center for Health StatisticsPresented at the National Conference on Health StatisticsAugust 6, 2012Washington, DC
Tools, techniques and framework for the analysis of vital statistics data on external causes of injury death
Our goals for the course
• Understand the nature and structure of U.S. mortality data, particularly for records involving injury-related deaths
• Gain knowledge on tools for classifying and analyzing deaths from external causes– EC mortality matrix– Injury Diagnoses matrix
• Review selected figures, charts and tables from currently trending topics in public health
• Learn about resources on the web and elsewhere that will help analysts be more productive in the area of injury mortality statistics
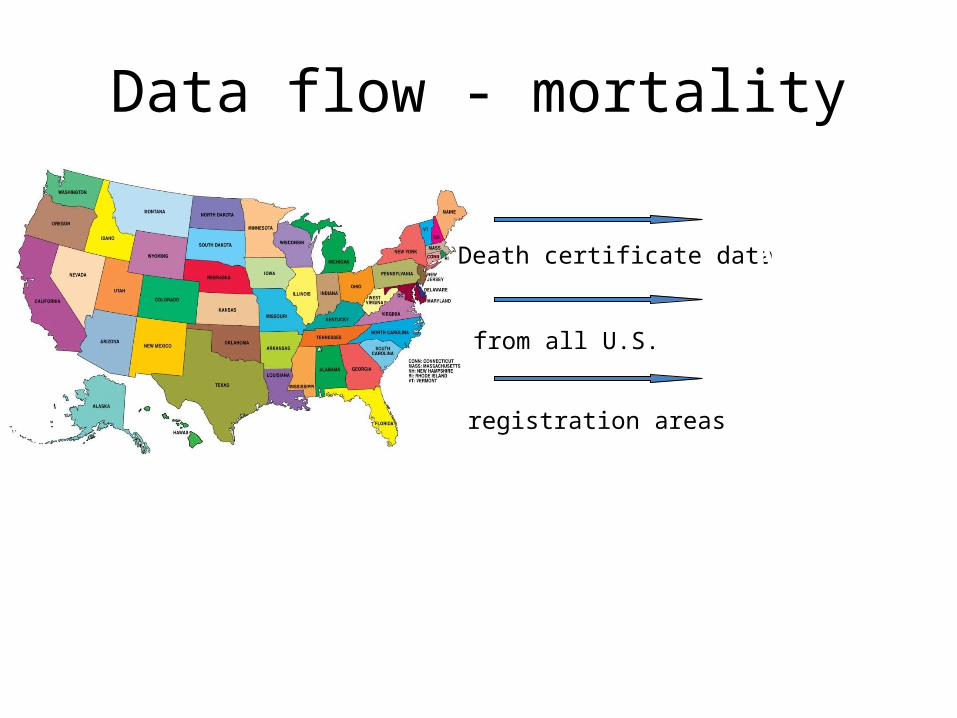
Data flow - mortality
Death certificate data
from all U.S.
registration areas
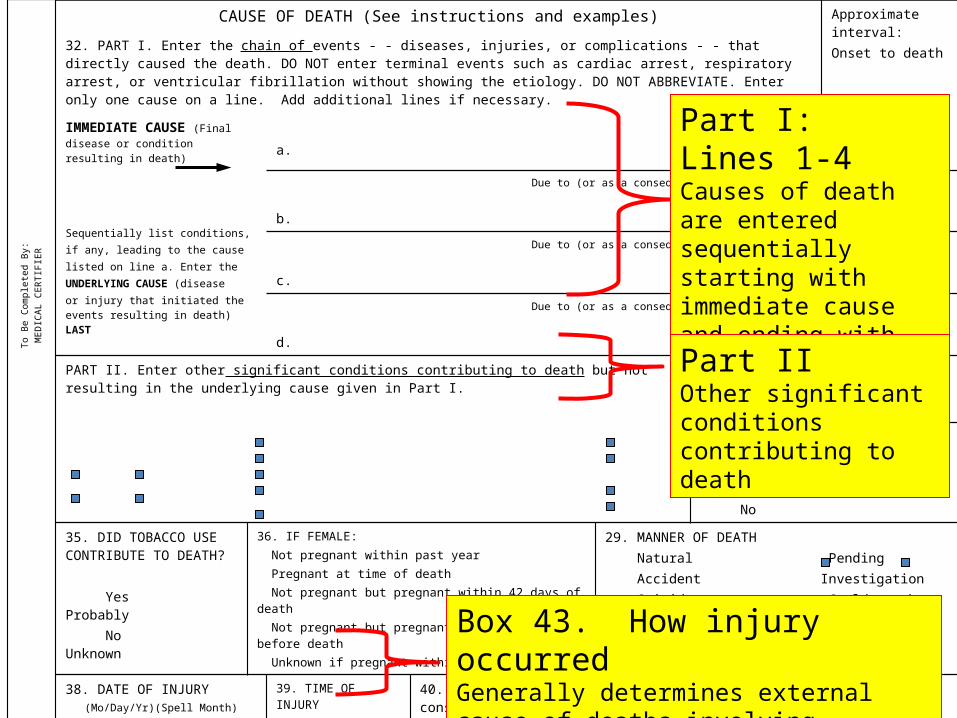
CAUSE OF DEATH (See instructions and examples) Approximate interval: Onset to death32. PART I. Enter the chain of events - - diseases, injuries, or complications - - that directly caused the death. DO NOT enter
terminal events such as cardiac arrest, respiratory arrest, or ventricular fibrillation without showing the etiology. DO NOT ABBREVIATE. Enter only one cause on a line. Add additional lines if necessary.
IMMEDIATE CAUSE (Final disease or condition resulting in death) a.
Sequentially list conditions, if any, leading to the cause listed on line a. Enter the UNDERLYING CAUSE (disease or injury that initiated the events resulting in death) LAST
Due to (or as a consequence of):
b.
Due to (or as a consequence of):
c.
Due to (or as a consequence of):
d.
PART II. Enter other significant conditions contributing to death but not resulting in the underlying cause given in Part I.
33. WAS AN AUTOPSY PERFORMED? Yes No
34. WERE AUTOPSY FINDINGS AVAILABLE TO COMPLETE THE CAUSE OF DEATH? Yes No
35. DID TOBACCO USE CONTRIBUTE TO DEATH?
Yes Probably No Unknown
36. IF FEMALE: Not pregnant within past year Pregnant at time of death Not pregnant but pregnant within 42 days of death Not pregnant but pregnant 43 days to 1 year before death Unknown if pregnant within the past year
29. MANNER OF DEATH Natural Pending Accident Investigation Suicide Could not be Homicide Determined
38. DATE OF INJURY(Mo/Day/Yr)(Spell Month)
39. TIME OF INJURY 40. PLACE OF INJURY (e.g., Decedent’s home, construction site, restaurant, wooded area)
41. INJURY AT WORK?
Yes No
42. LOCATION OF INJURY: State: City or Town: Street & Number: Apartment No. Zip Code:
43. DESCRIBE HOW INJURY OCCURRED 44. IF TRANSPORTATION INJURY, SPECIFY Driver/Operator Passenger Pedestrian Other (Specify)
To B
e C
ompl
eted
By:
ME
DIC
AL
CE
RT
IFIE
R
Part I: Lines 1-4 Causes of death are entered sequentially starting with immediate cause and ending with the underlying cause.
Part IIOther significant conditions contributing to death
Box 43. How injury occurredGenerally determines external cause of deaths involving injuries.
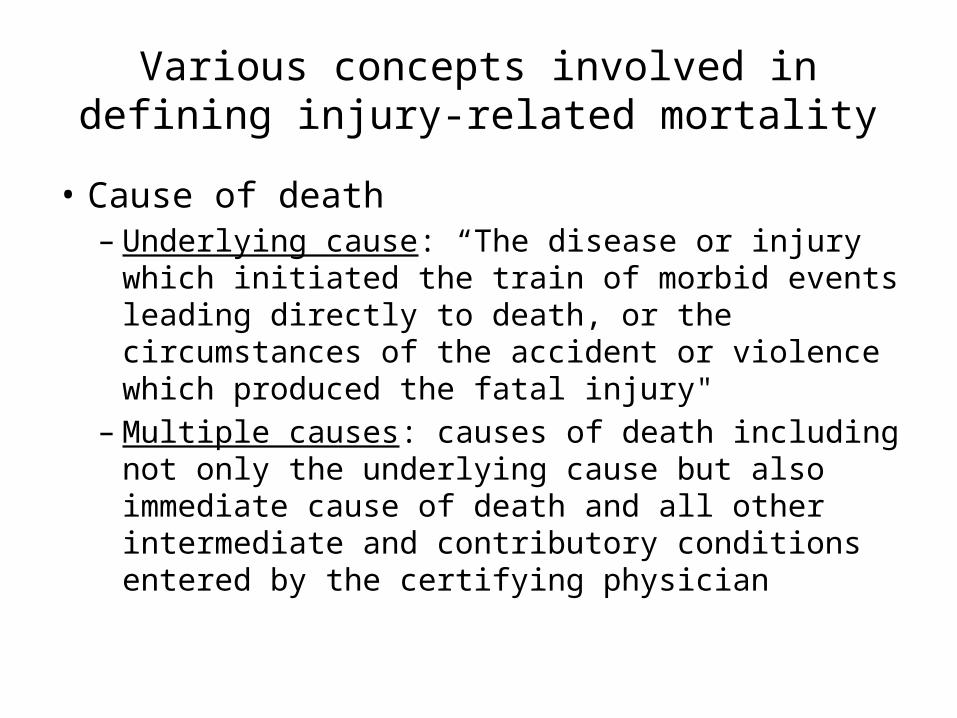
Various concepts involved in defining injury-related mortality
• Cause of death– Underlying cause: “The disease or injury which
initiated the train of morbid events leading directly to death, or the circumstances of the accident or violence which produced the fatal injury"
– Multiple causes: causes of death including not only the underlying cause but also immediate cause of death and all other intermediate and contributory conditions entered by the certifying physician
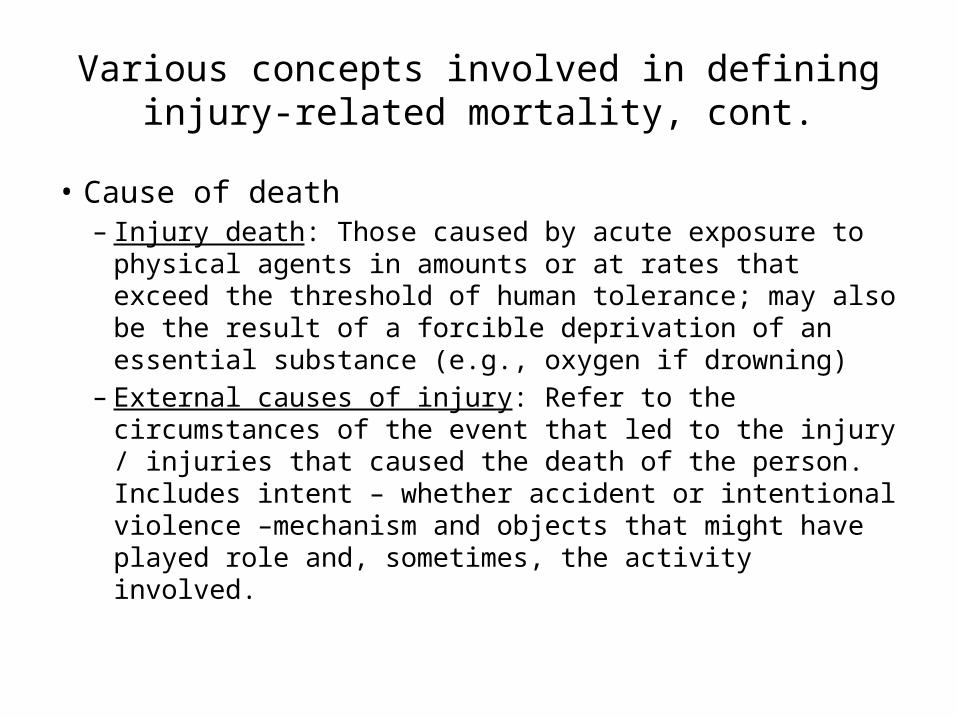
Various concepts involved in defining injury-related mortality, cont.
• Cause of death– Injury death: Those caused by acute exposure to physical
agents in amounts or at rates that exceed the threshold of human tolerance; may also be the result of a forcible deprivation of an essential substance (e.g., oxygen if drowning)
– External causes of injury: Refer to the circumstances of the event that led to the injury / injuries that caused the death of the person. Includes intent – whether accident or intentional violence –mechanism and objects that might have played role and, sometimes, the activity involved.
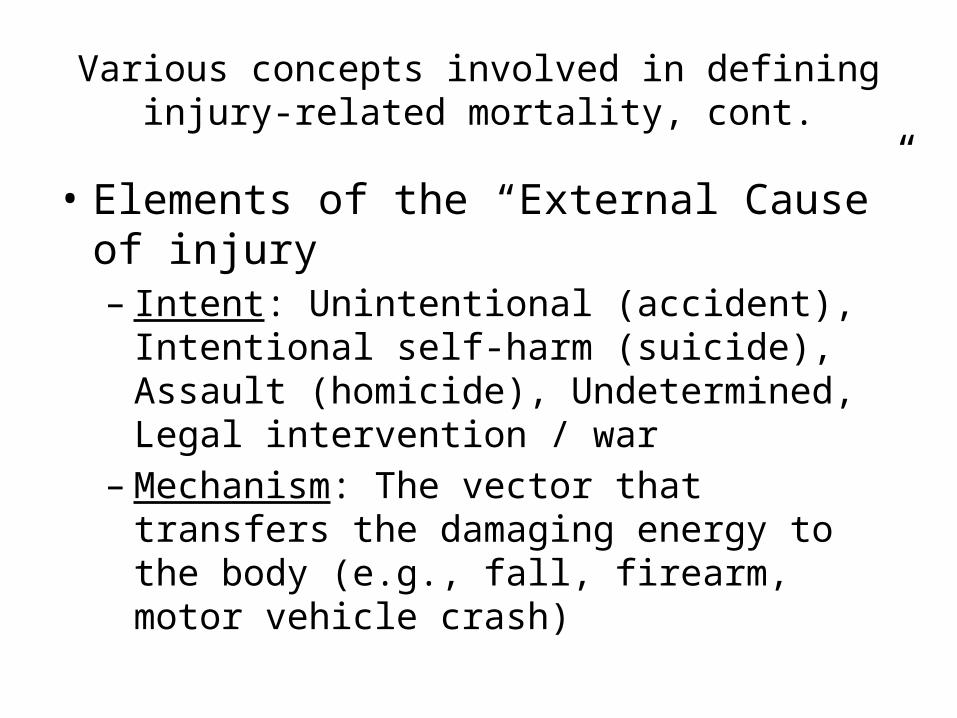
Various concepts involved in defining injury-related mortality, cont.
• Elements of the “External Cause” of injury– Intent: Unintentional (accident), Intentional self-
harm (suicide), Assault (homicide), Undetermined, Legal intervention / war
– Mechanism: The vector that transfers the damaging energy to the body (e.g., fall, firearm, motor vehicle crash)
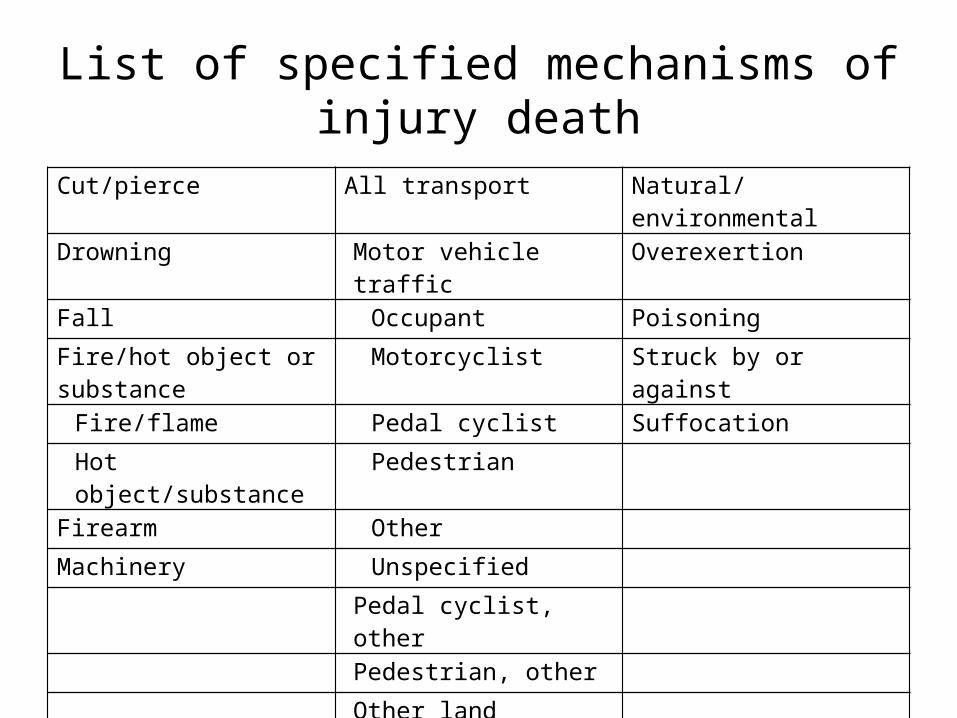
List of specified mechanisms of injury death
Cut/pierce All transport Natural/environmental
Drowning Motor vehicle traffic Overexertion
Fall Occupant Poisoning
Fire/hot object or substance Motorcyclist Struck by or against
Fire/flame Pedal cyclist Suffocation
Hot object/substance Pedestrian
Firearm Other
Machinery Unspecified
Pedal cyclist, other
Pedestrian, other
Other land transport
Other transport
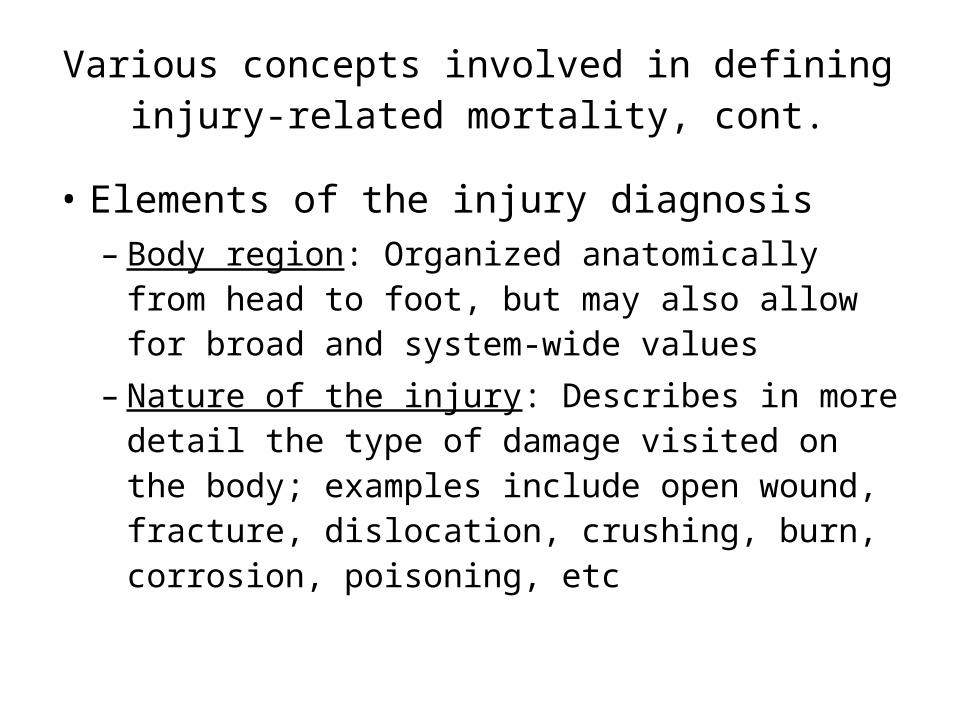
Various concepts involved in defining injury-related mortality, cont.
• Elements of the injury diagnosis– Body region: Organized anatomically from head to
foot, but may also allow for broad and system-wide values
– Nature of the injury: Describes in more detail the type of damage visited on the body; examples include open wound, fracture, dislocation, crushing, burn, corrosion, poisoning, etc
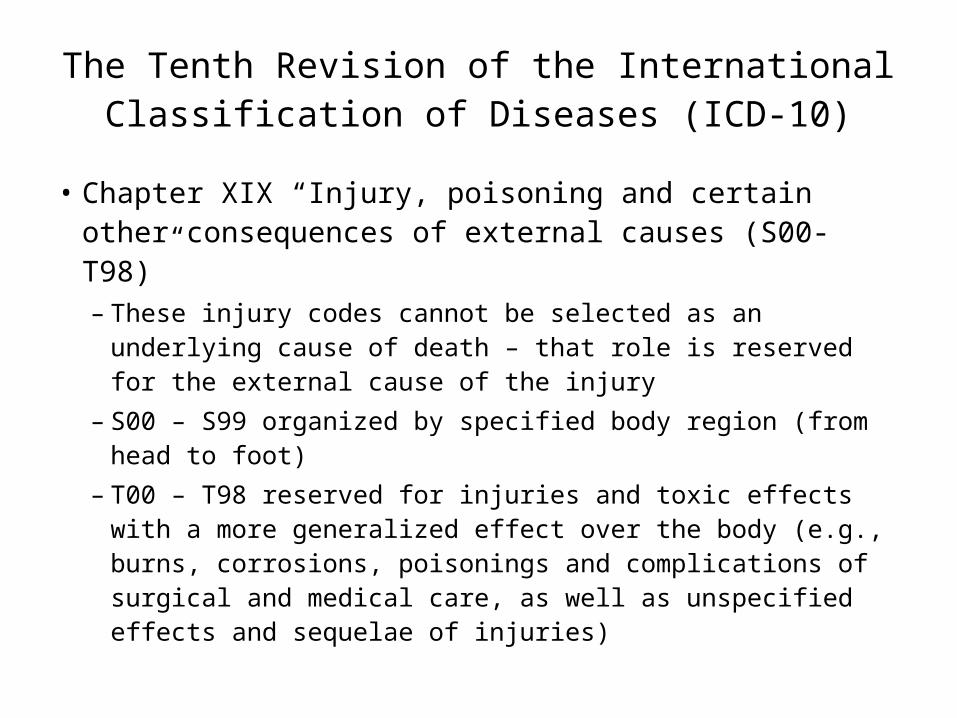
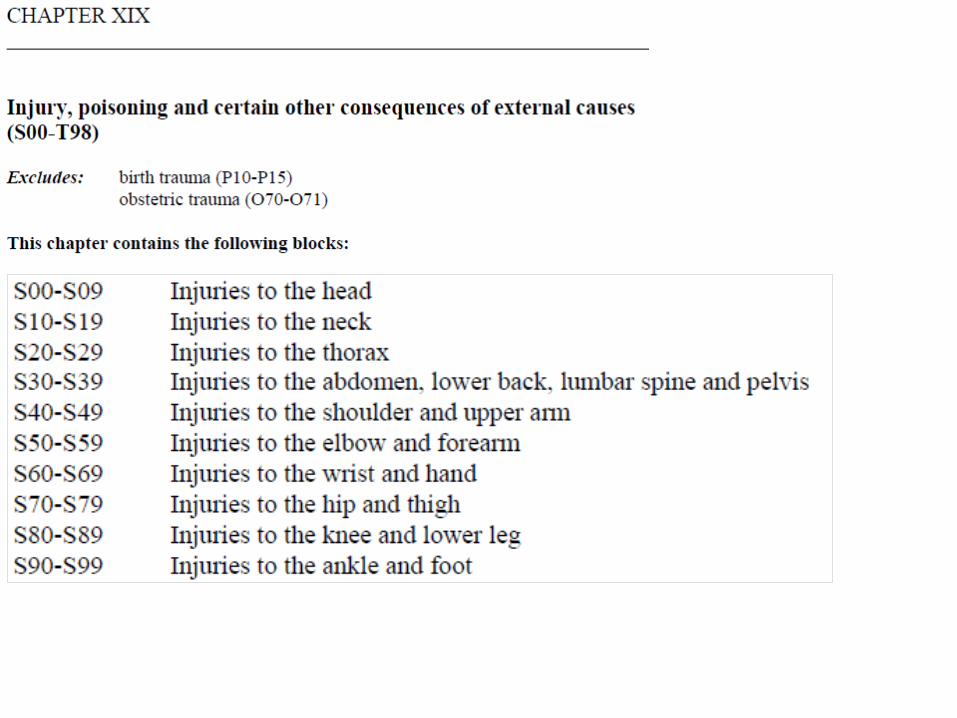
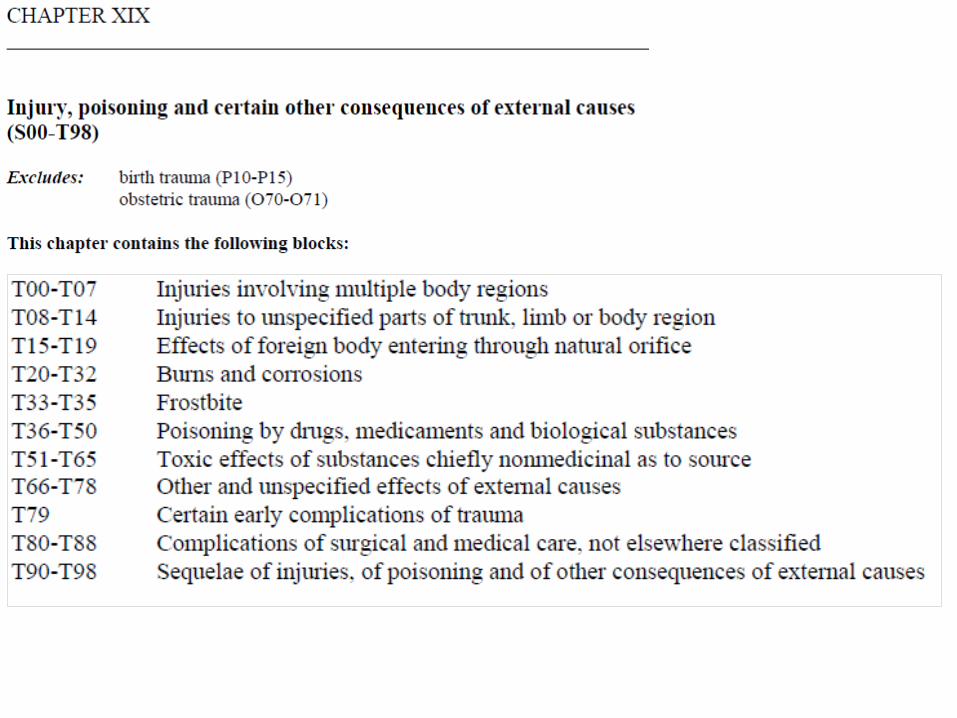
The Tenth Revision of the International Classification of Diseases (ICD-10)
• Chapter XIX “Injury, poisoning and certain other consequences of external causes (S00-T98)”– These injury codes cannot be selected as an underlying
cause of death – that role is reserved for the external cause of the injury
– S00 – S99 organized by specified body region (from head to foot)
– T00 – T98 reserved for injuries and toxic effects with a more generalized effect over the body (e.g., burns, corrosions, poisonings and complications of surgical and medical care, as well as unspecified effects and sequelae of injuries)
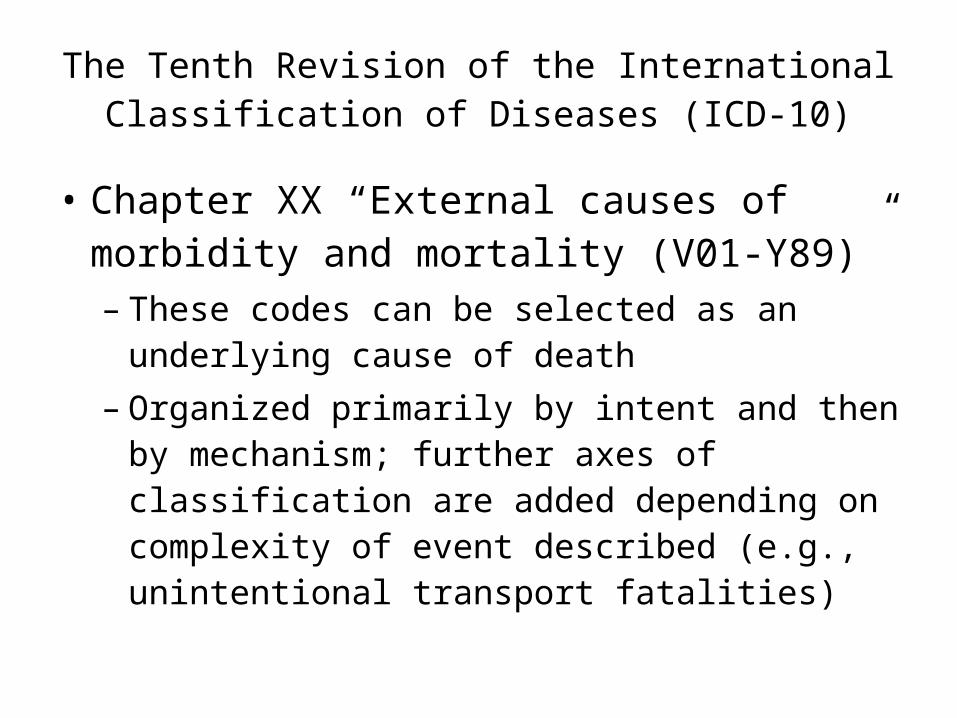
The Tenth Revision of the International Classification of Diseases (ICD-10)
• Chapter XX “External causes of morbidity and mortality (V01-Y89)”– These codes can be selected as an underlying
cause of death – Organized primarily by intent and then by
mechanism; further axes of classification are added depending on complexity of event described (e.g., unintentional transport fatalities)
Chapter XX “External causes of morbidity and mortality (V01-Y89)”
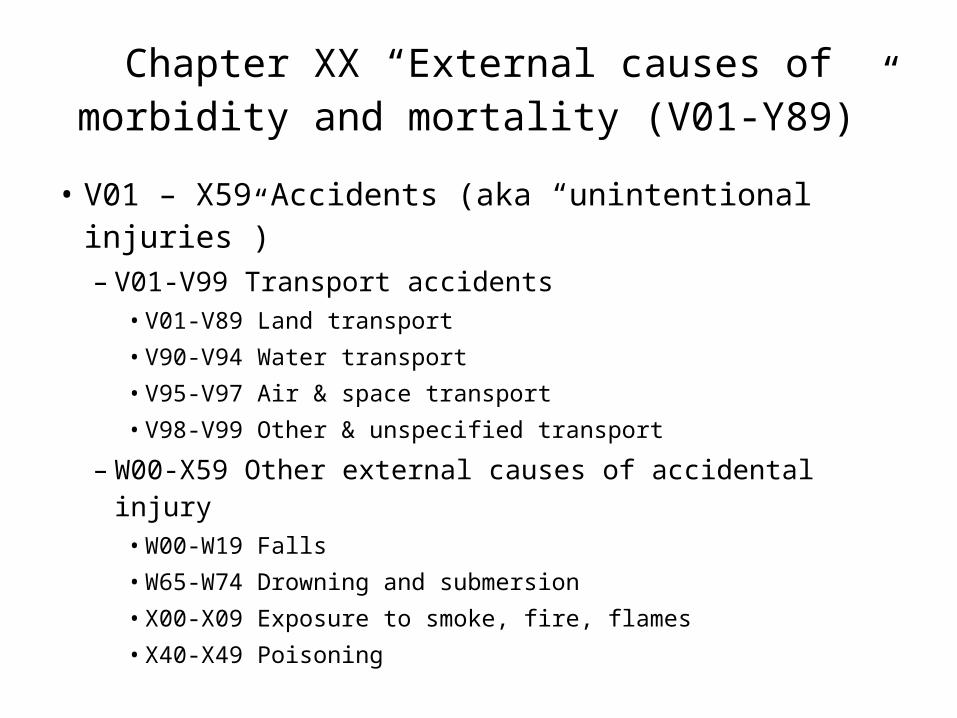
• V01 – X59 Accidents (aka “unintentional injuries”)– V01-V99 Transport accidents
• V01-V89 Land transport• V90-V94 Water transport• V95-V97 Air & space transport• V98-V99 Other & unspecified transport
– W00-X59 Other external causes of accidental injury• W00-W19 Falls• W65-W74 Drowning and submersion• X00-X09 Exposure to smoke, fire, flames• X40-X49 Poisoning
Chapter XX “External causes of morbidity and mortality (V01-Y89)”
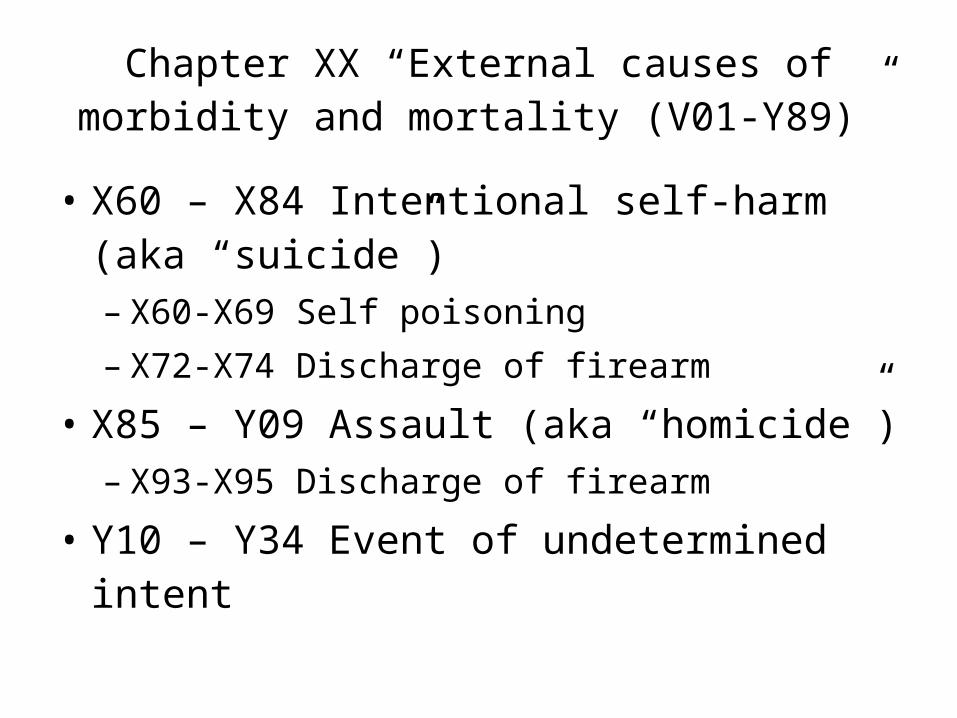
• X60 – X84 Intentional self-harm (aka “suicide”)– X60-X69 Self poisoning– X72-X74 Discharge of firearm
• X85 – Y09 Assault (aka “homicide”)– X93-X95 Discharge of firearm
• Y10 – Y34 Event of undetermined intent
Chapter XX “External causes of morbidity and mortality (V01-Y89)”
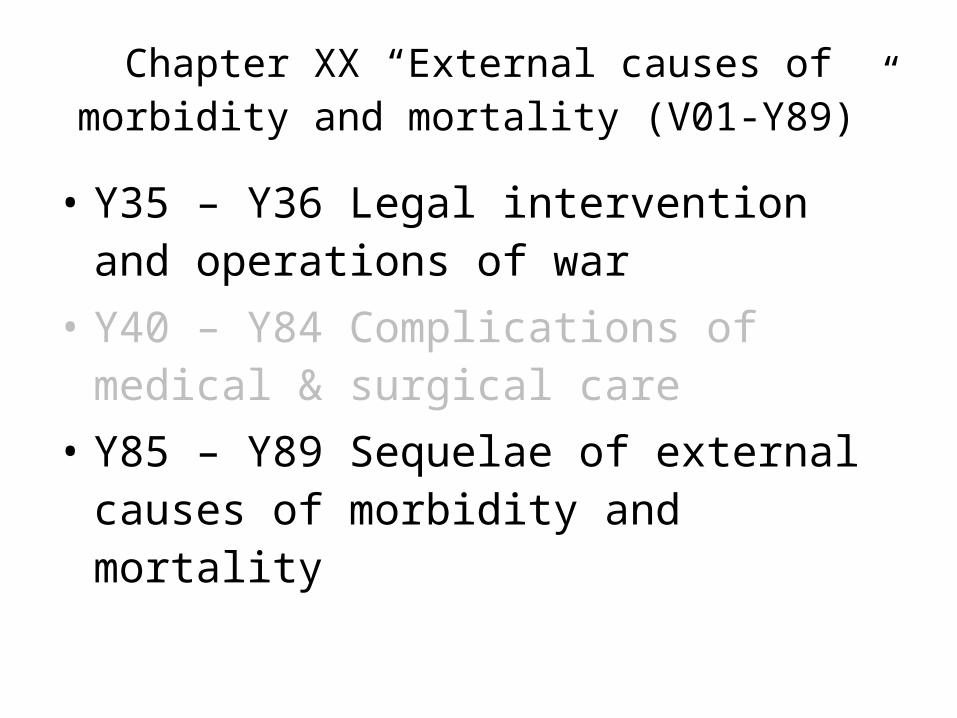
• Y35 – Y36 Legal intervention and operations of war
• Y40 – Y84 Complications of medical & surgical care
• Y85 – Y89 Sequelae of external causes of morbidity and mortality
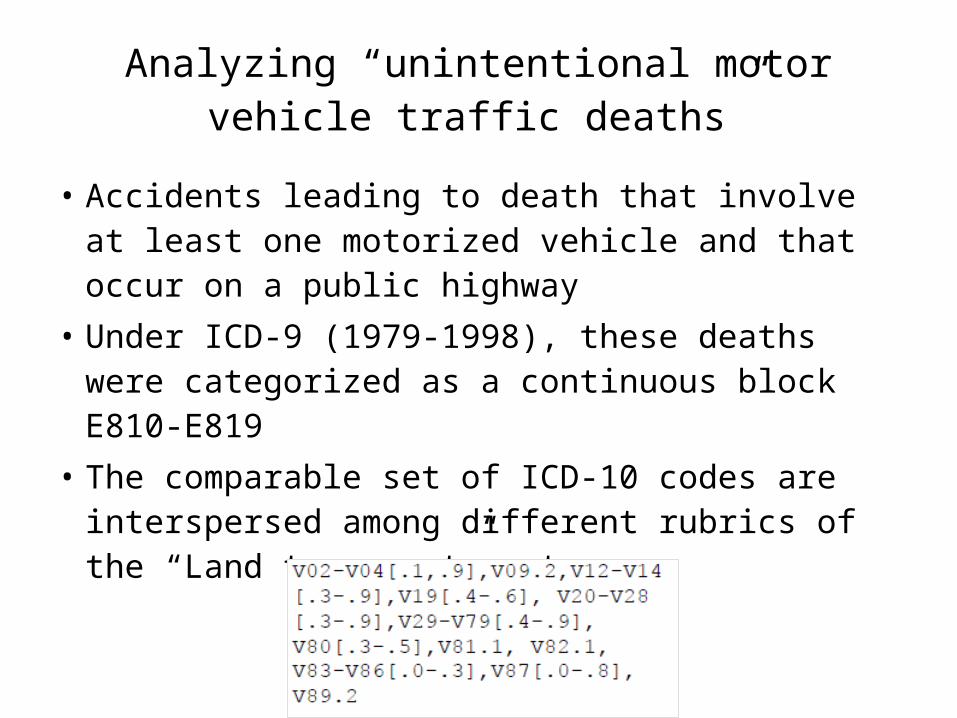
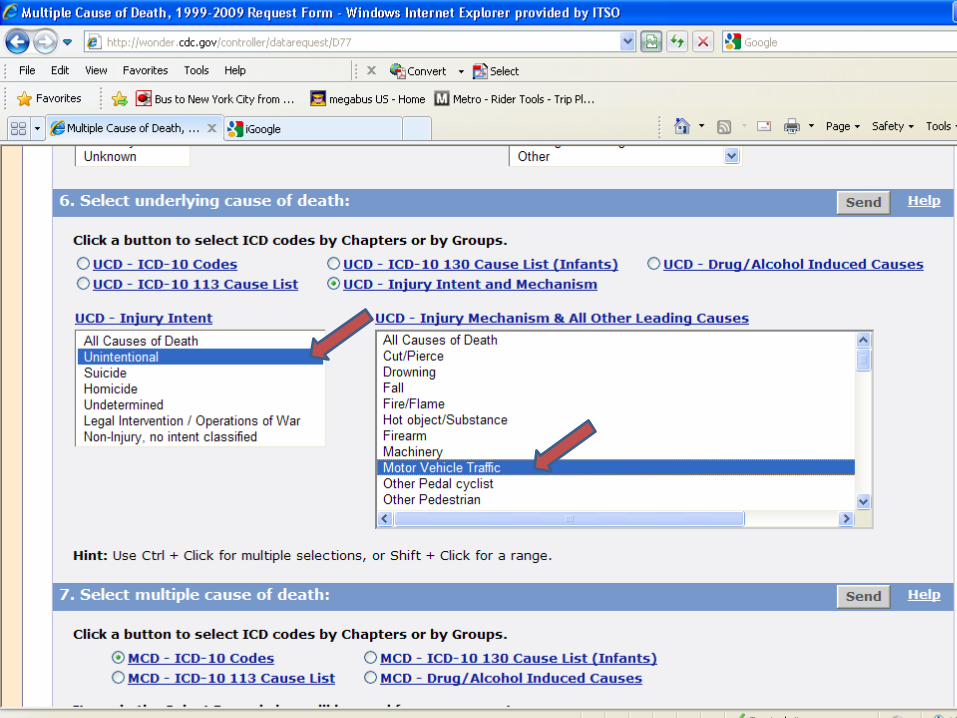
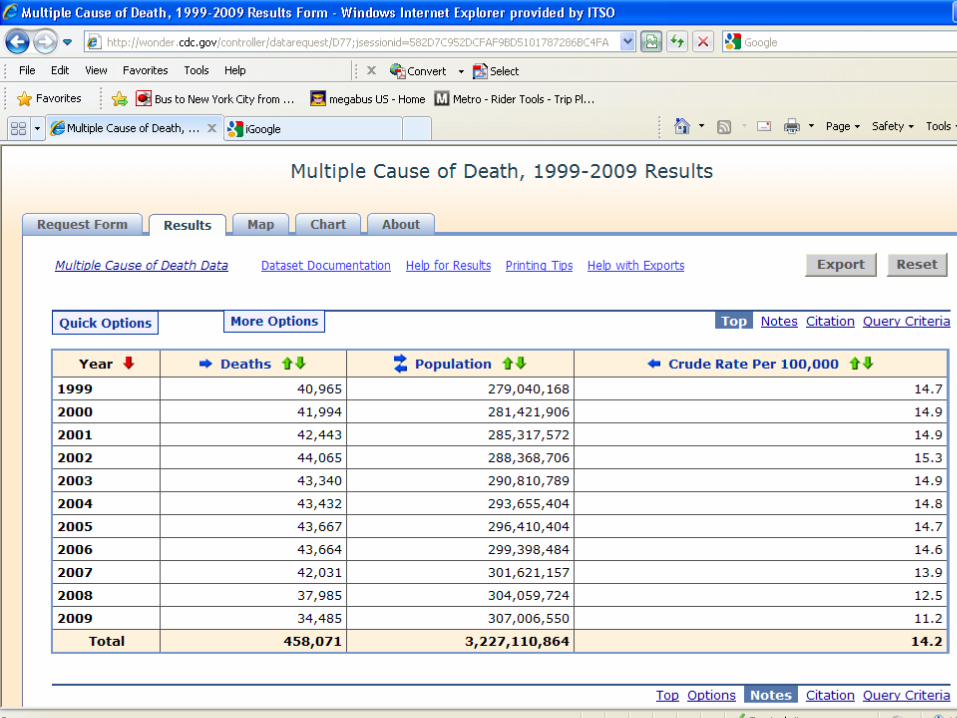
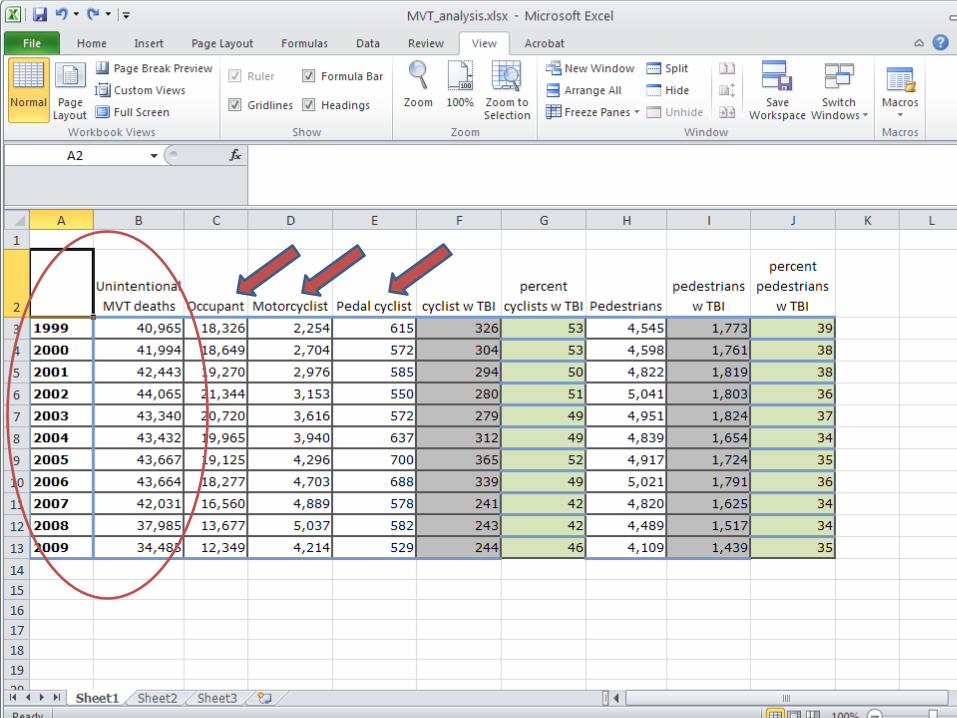
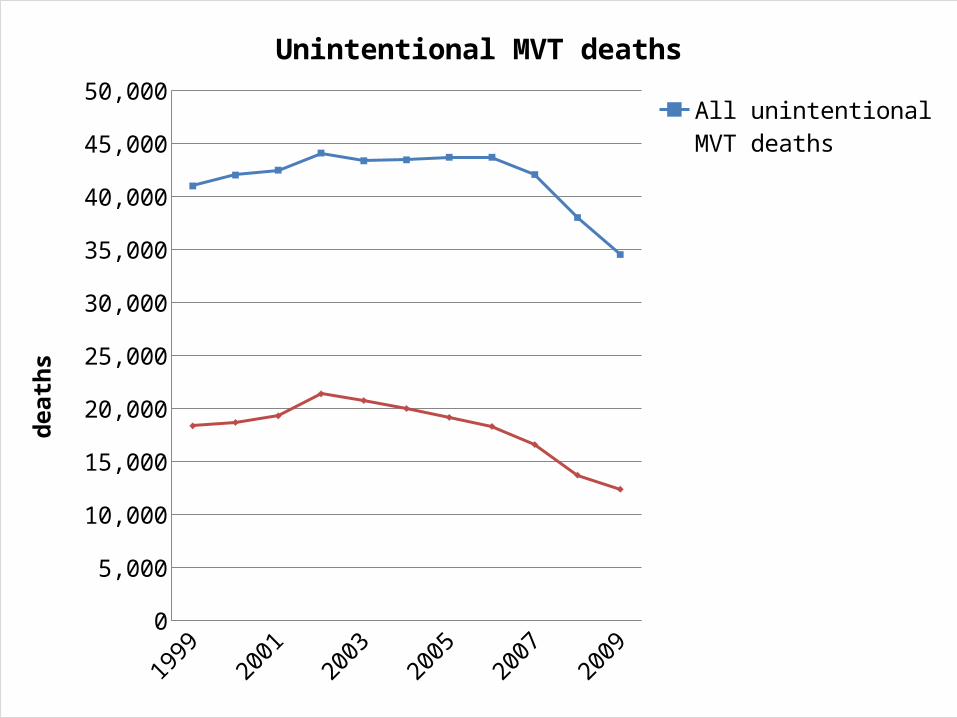
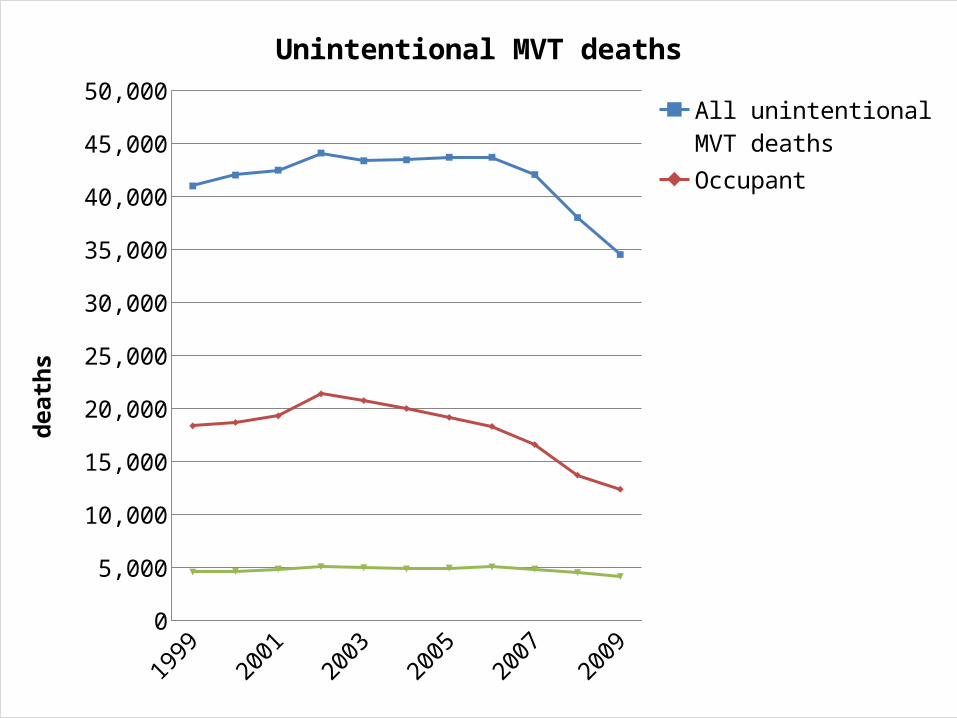
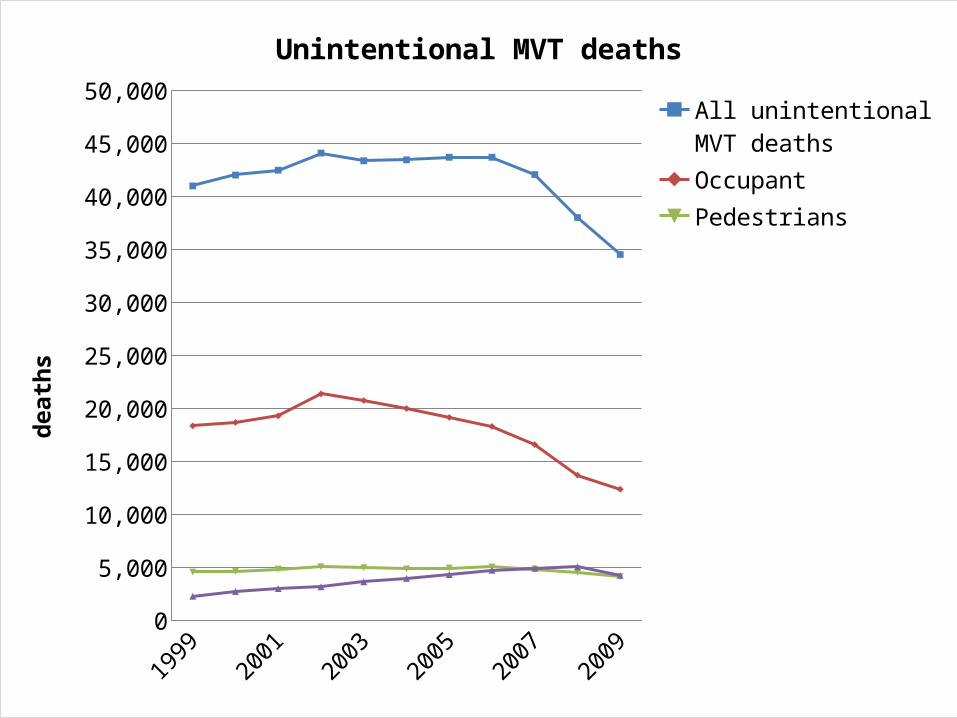
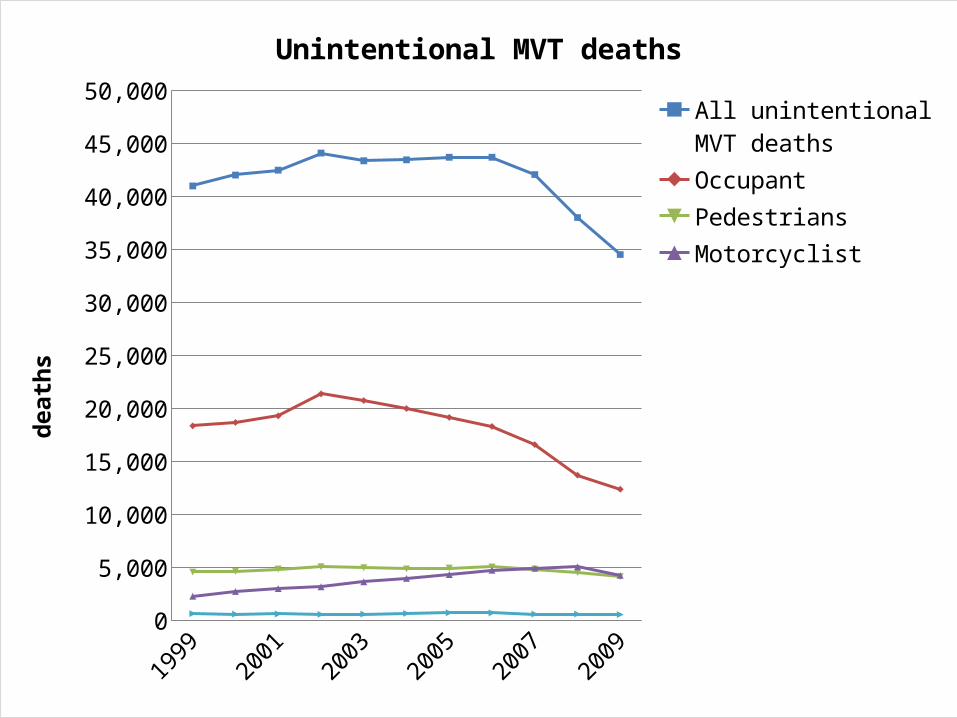
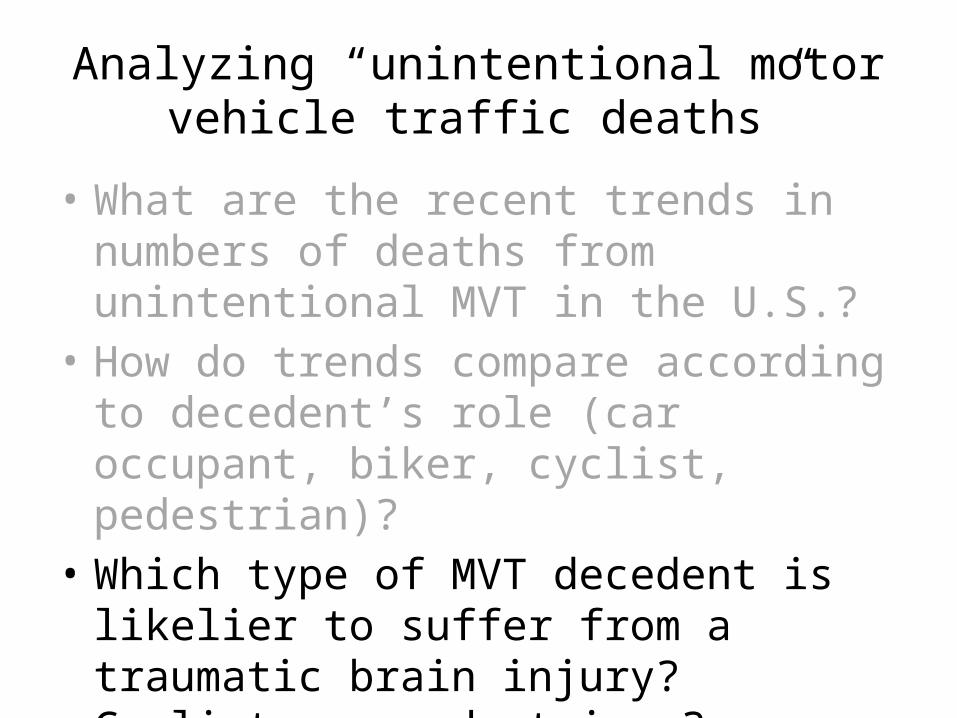
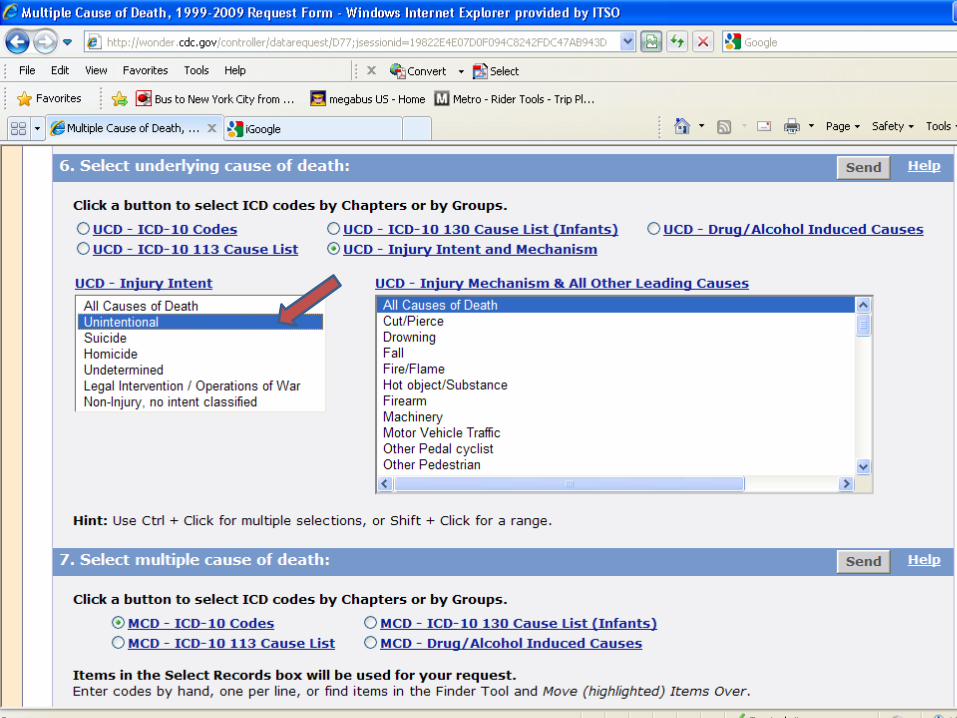
Analyzing “unintentional motor vehicle traffic deaths”
• Accidents leading to death that involve at least one motorized vehicle and that occur on a public highway
• Under ICD-9 (1979-1998), these deaths were categorized as a continuous block E810-E819
• The comparable set of ICD-10 codes are interspersed among different rubrics of the “Land transport” category:
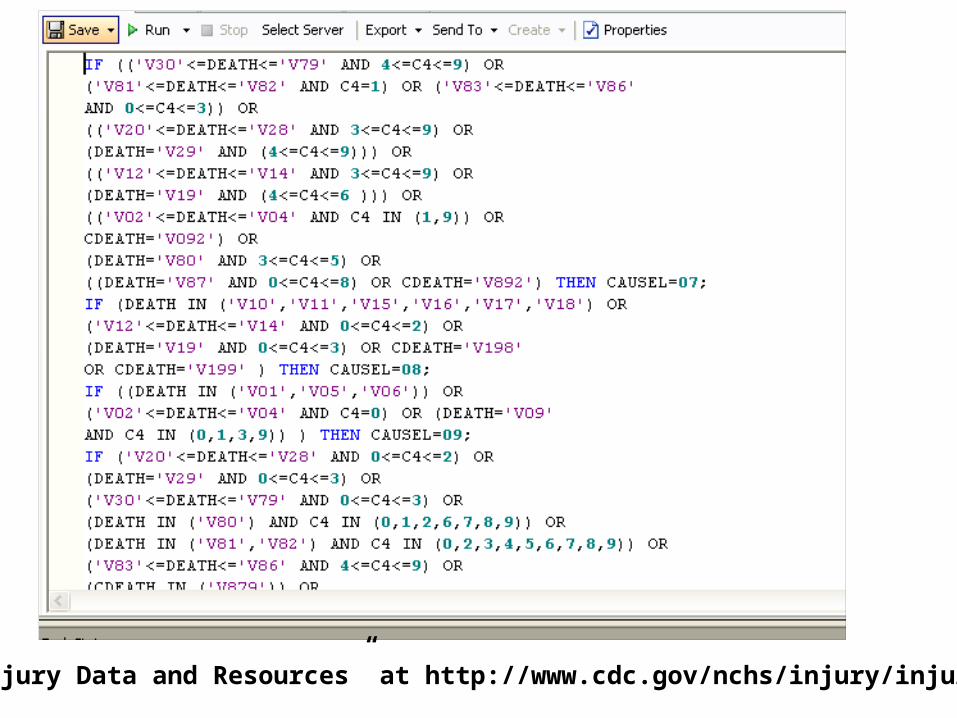
Source: “Injury Data and Resources” at http://www.cdc.gov/nchs/injury/injury_tools.htm
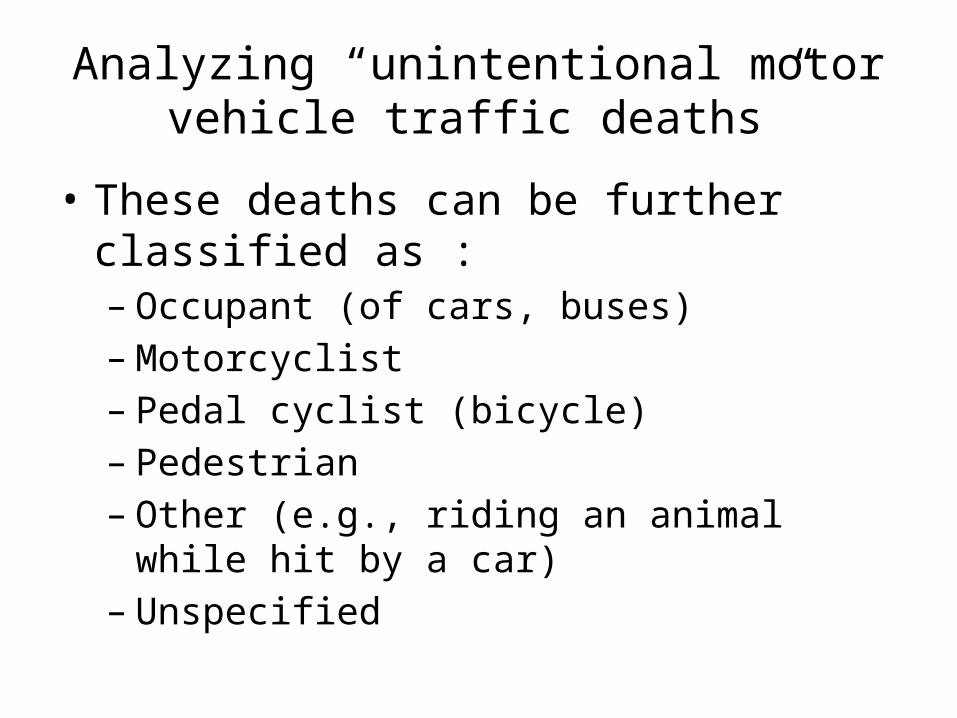
Analyzing “unintentional motor vehicle traffic deaths”
• These deaths can be further classified as :– Occupant (of cars, buses)– Motorcyclist– Pedal cyclist (bicycle)– Pedestrian– Other (e.g., riding an animal while hit by a car)– Unspecified

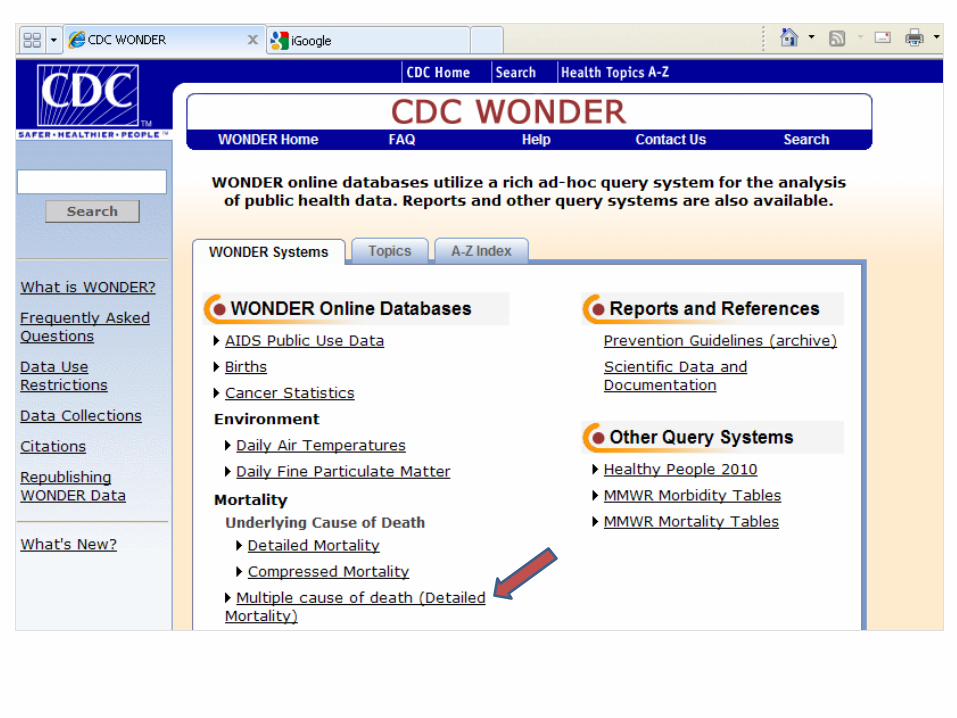
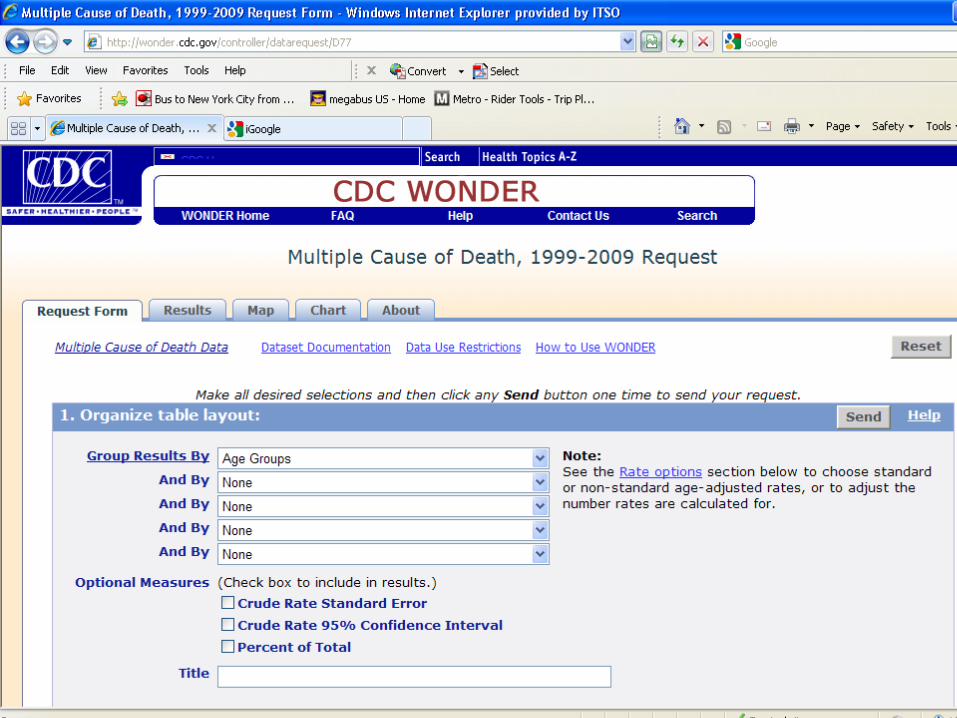
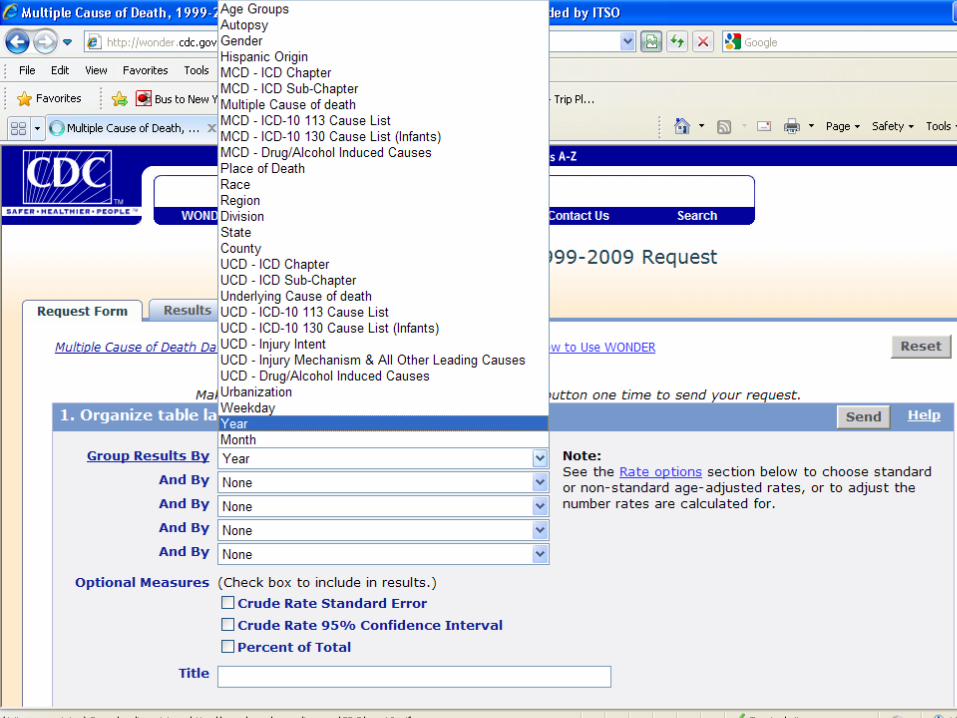
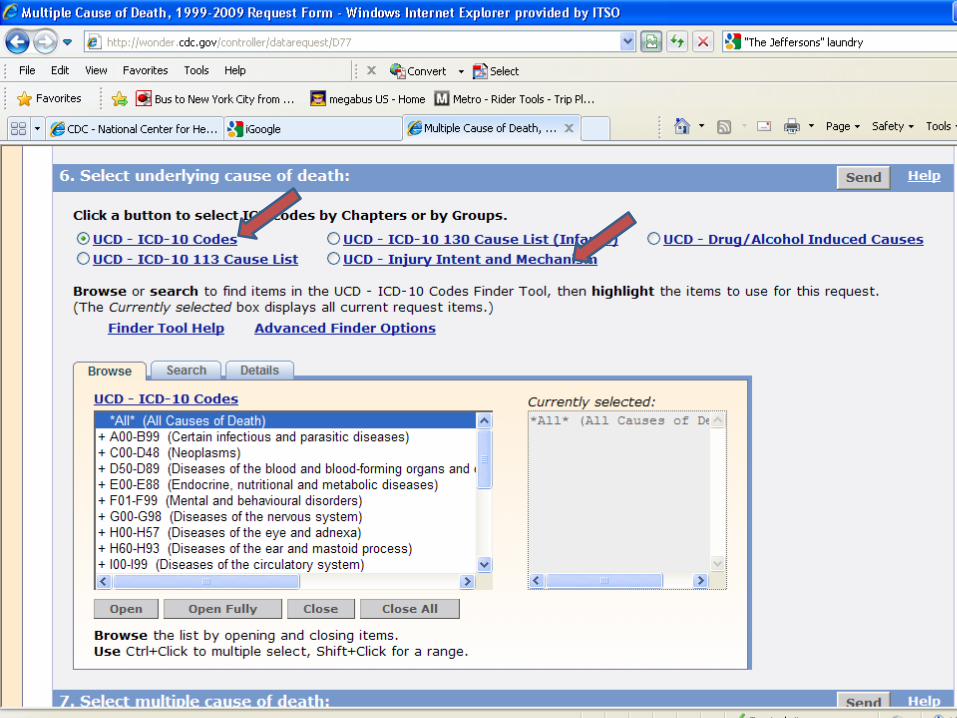
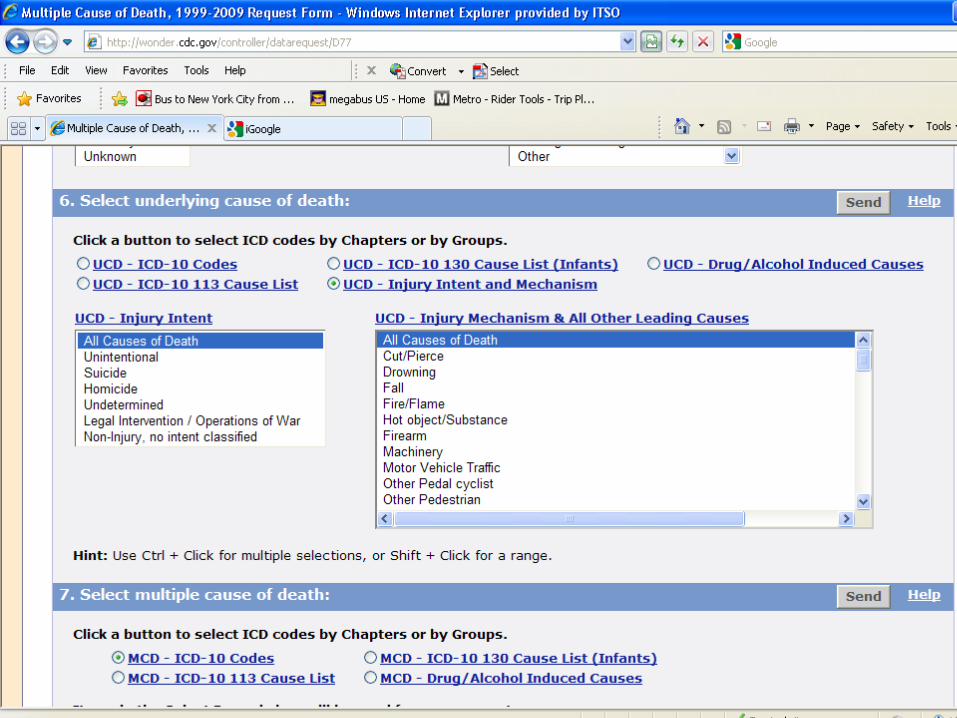
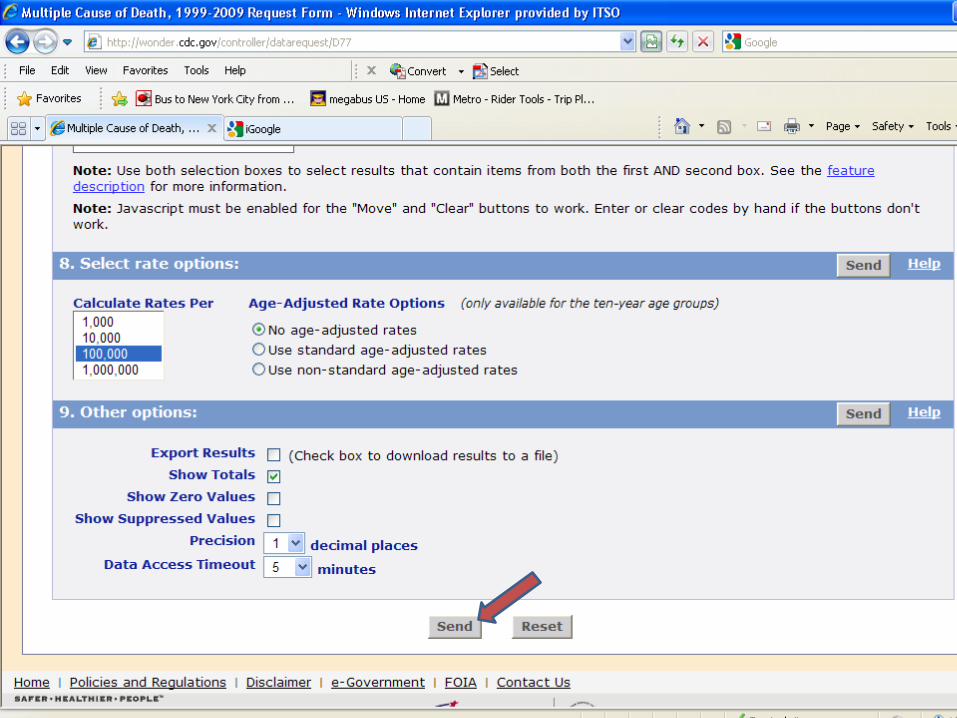
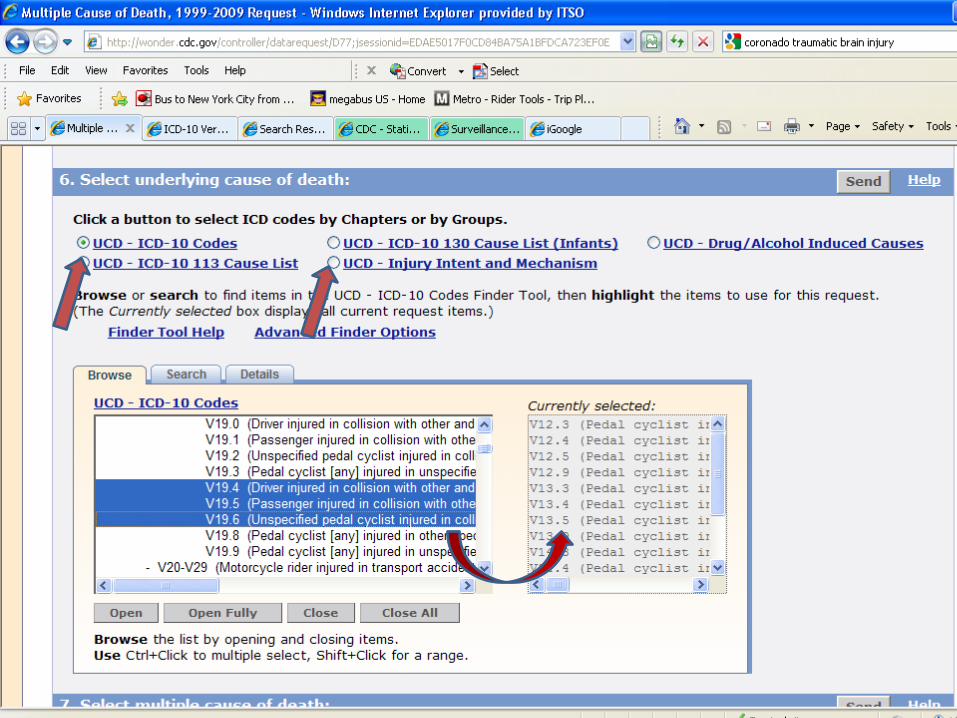
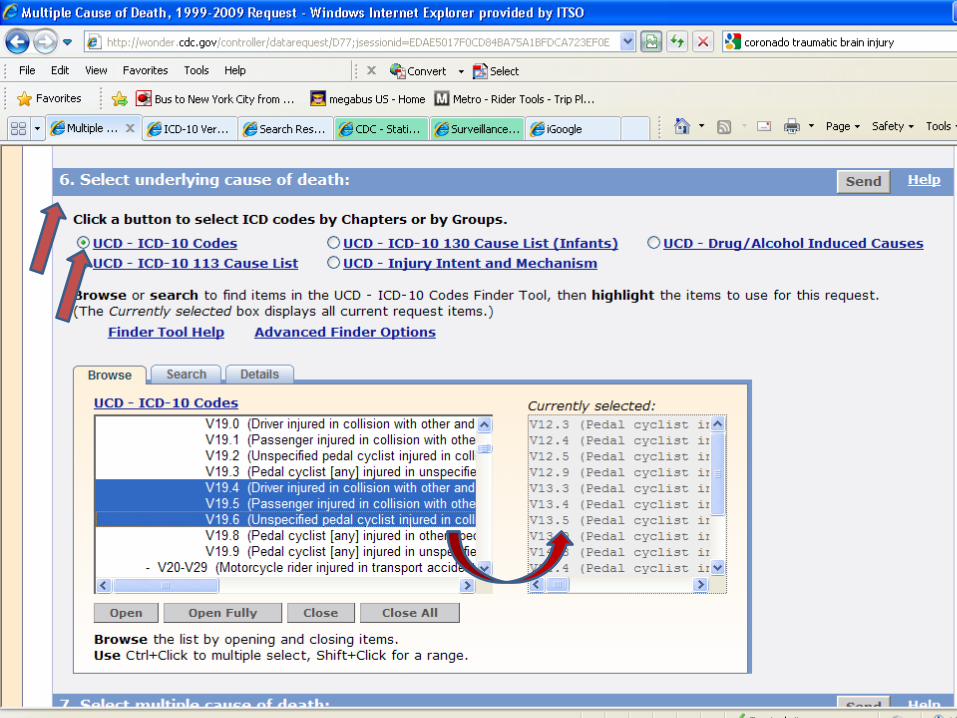
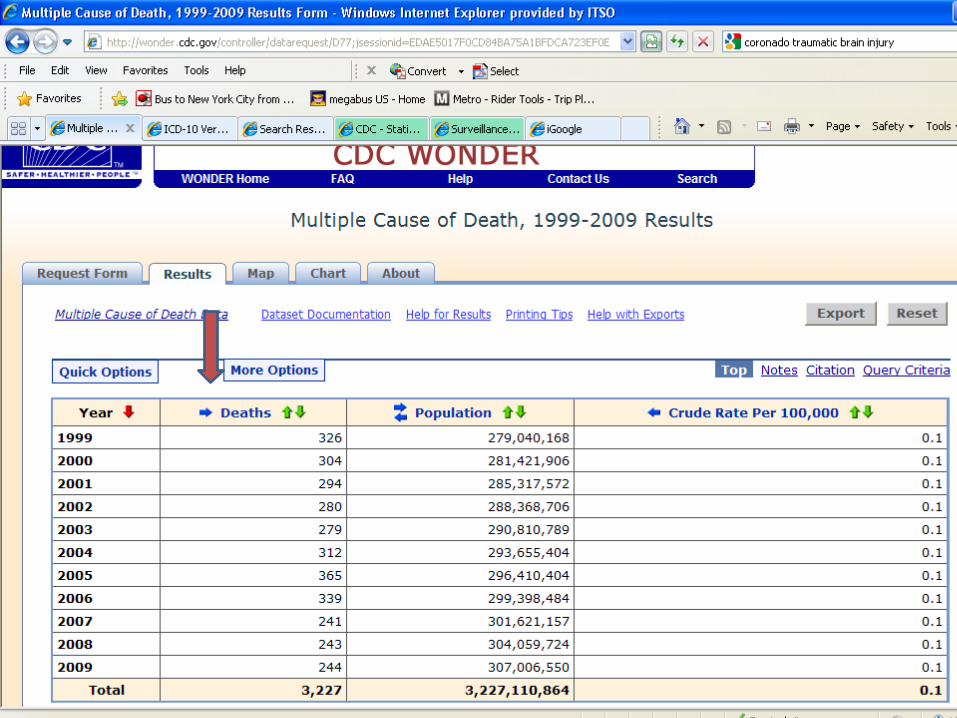
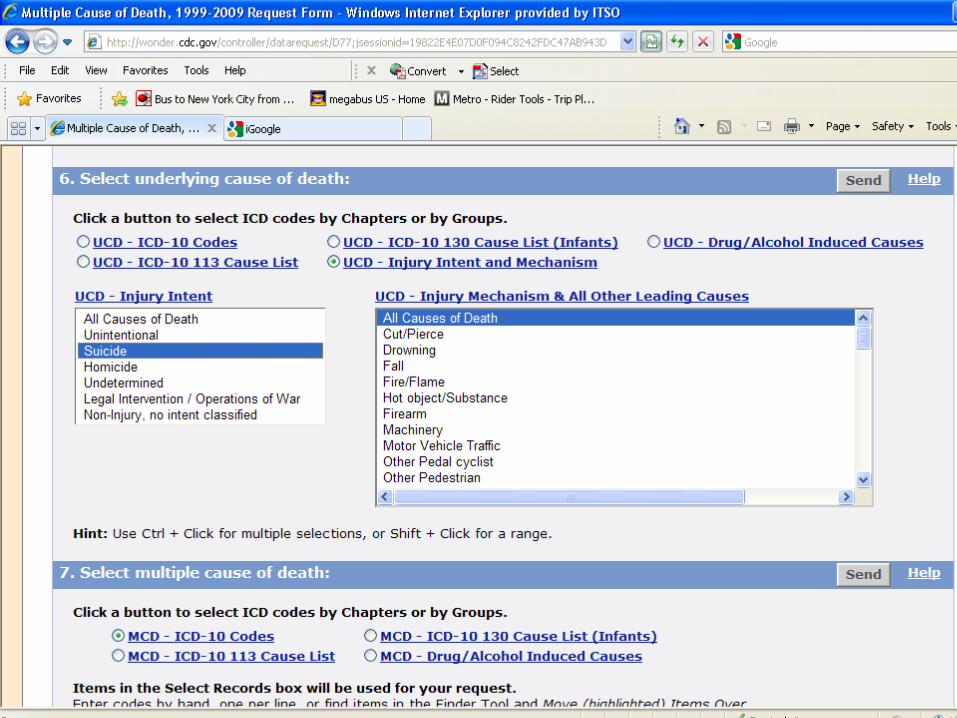
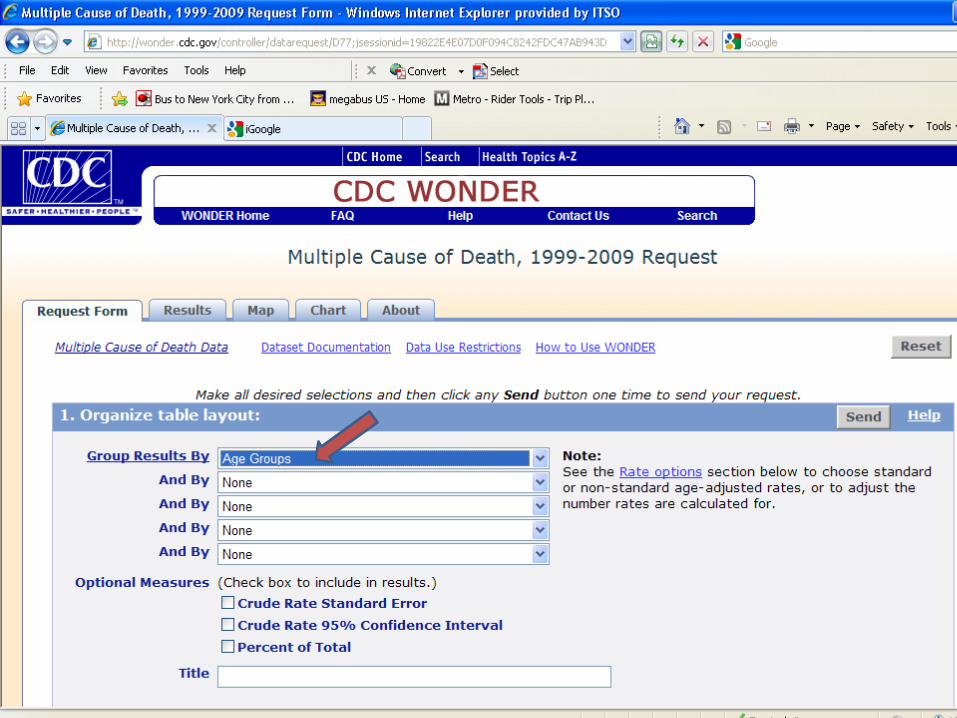
CDC WONDER – “Wide-ranging Online Data for Epidemiologic Research”
http://wonder.cdc.gov/
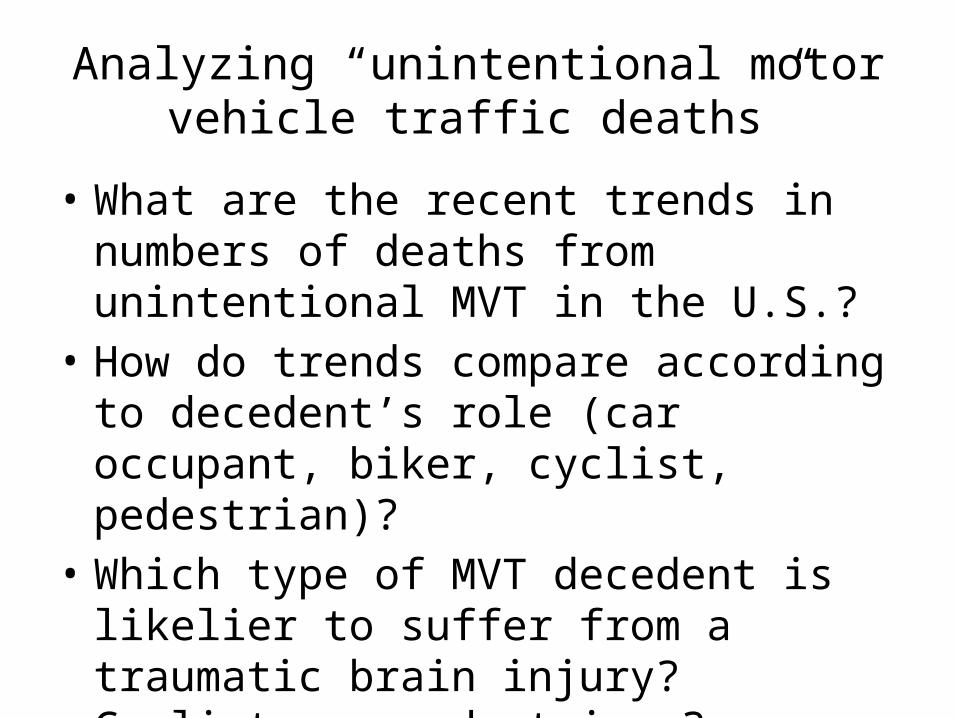
Analyzing “unintentional motor vehicle traffic deaths”
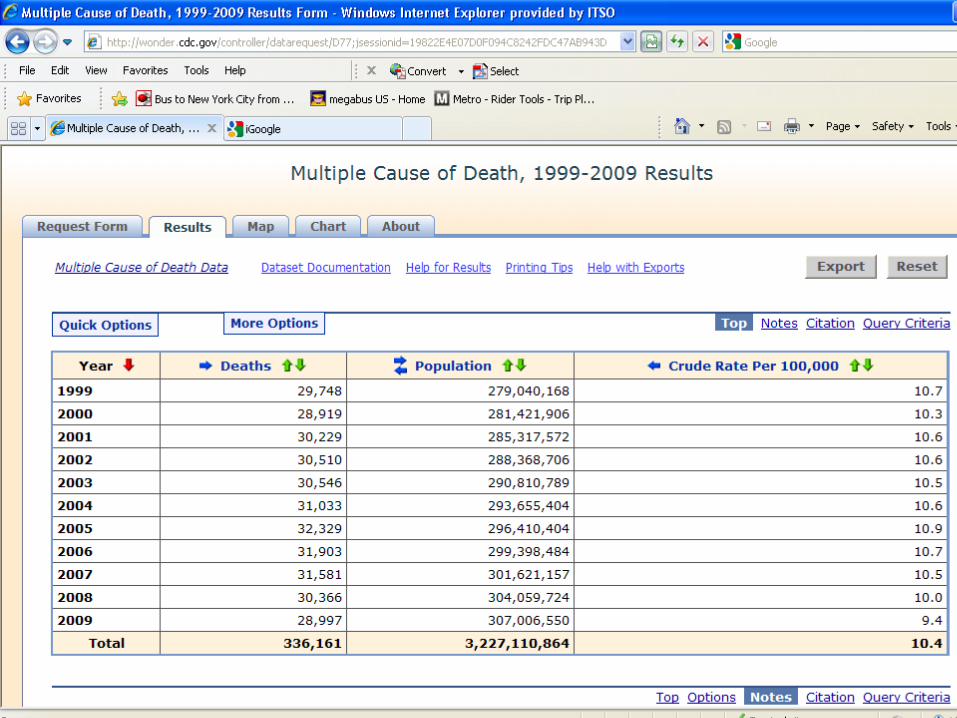
• What are the recent trends in numbers of deaths from unintentional MVT in the U.S.?
• How do trends compare according to decedent’s role (car occupant, biker, cyclist, pedestrian)?
• Which type of MVT decedent is likelier to suffer from a traumatic brain injury? Cyclists or pedestrians?
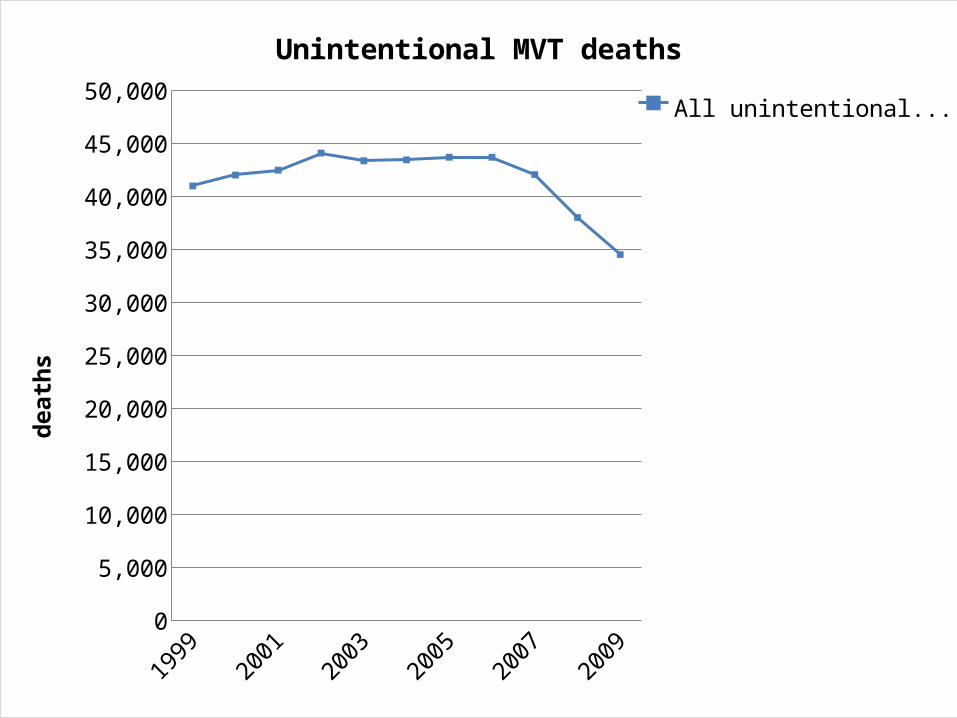
19992000
20012002
20032004
20052006
20072008
20090
5,000
10,000
15,000
20,000
25,000
30,000
35,000
40,000
45,000
50,000
Unintentional MVT deaths
All unintentional MVT deaths
deat
hs
Analyzing “unintentional motor vehicle traffic deaths”
• What are the recent trends in numbers of deaths from unintentional MVT in the U.S.?
• How do trends compare according to decedent’s role (car occupant, biker, cyclist, pedestrian)?
• Which type of MVT decedent is likelier to suffer from a traumatic brain injury? Cyclists or pedestrians?
19992000
20012002
20032004
20052006
20072008
20090
5,000
10,000
15,000
20,000
25,000
30,000
35,000
40,000
45,000
50,000
Unintentional MVT deaths
All unintentional MVT deathsOccupant
deat
hs
19992000
20012002
20032004
20052006
20072008
20090
5,000
10,000
15,000
20,000
25,000
30,000
35,000
40,000
45,000
50,000
Unintentional MVT deaths
All unintentional MVT deathsOccupantPedestrians
deat
hs
19992000
20012002
20032004
20052006
20072008
20090
5,000
10,000
15,000
20,000
25,000
30,000
35,000
40,000
45,000
50,000
Unintentional MVT deaths
All unintentional MVT deathsOccupantPedestriansMotorcyclist
deat
hs
19992000
20012002
20032004
20052006
20072008
20090
5,000
10,000
15,000
20,000
25,000
30,000
35,000
40,000
45,000
50,000
Unintentional MVT deaths
All unintentional MVT deathsOccupantPedestriansMotorcyclistPedal cyclist
deat
hs
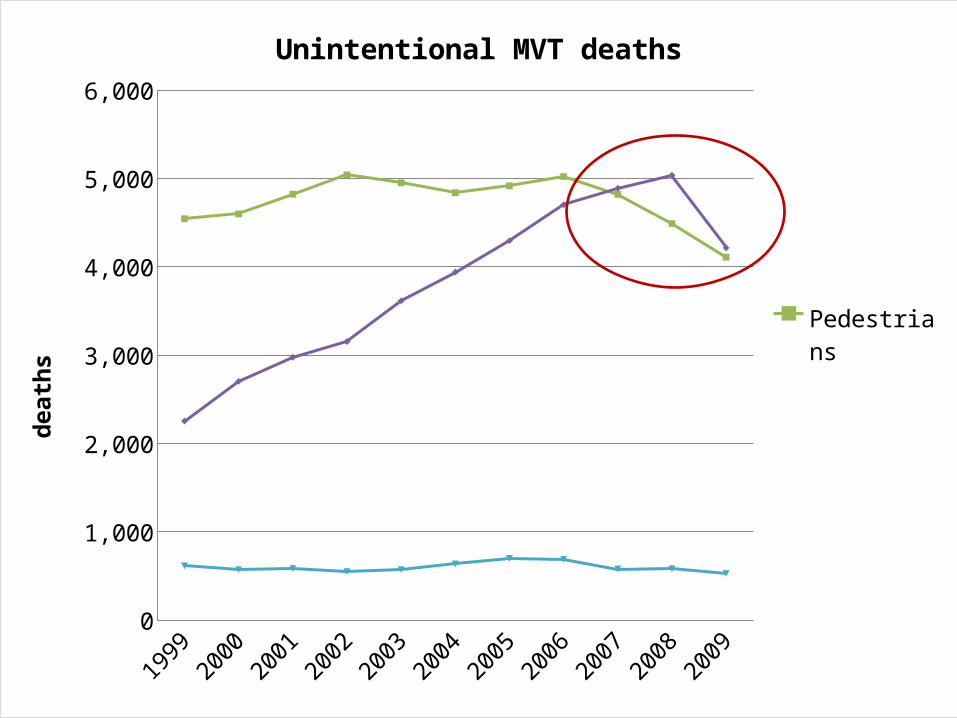
1999 2000 2001 2002 2003 2004 2005 2006 2007 2008 20090
1,000
2,000
3,000
4,000
5,000
6,000
Unintentional MVT deaths
PedestriansMotorcyclistPedal cyclist
deat
hs
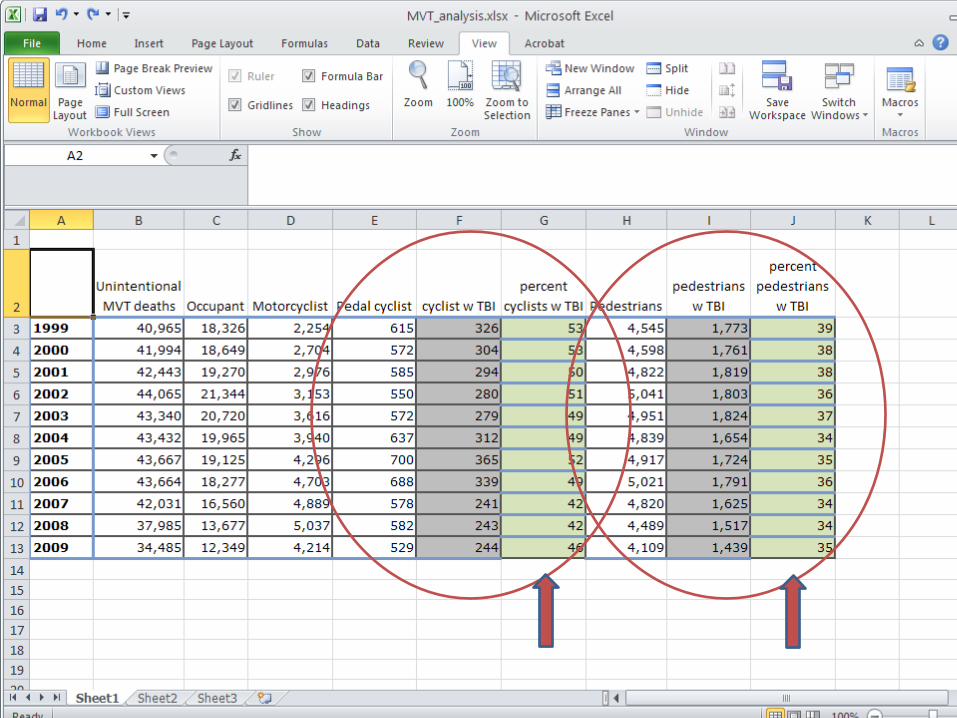
Analyzing “unintentional motor vehicle traffic deaths”
• What are the recent trends in numbers of deaths from unintentional MVT in the U.S.?
• How do trends compare according to decedent’s role (car occupant, biker, cyclist, pedestrian)?
• Which type of MVT decedent is likelier to suffer from a traumatic brain injury? Cyclists or pedestrians?
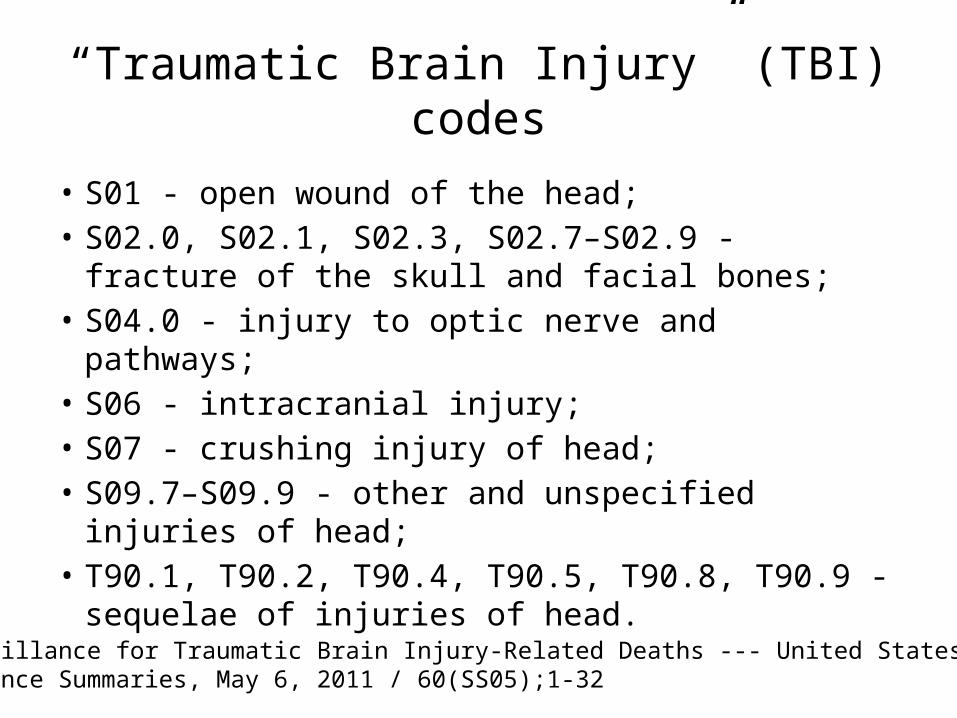
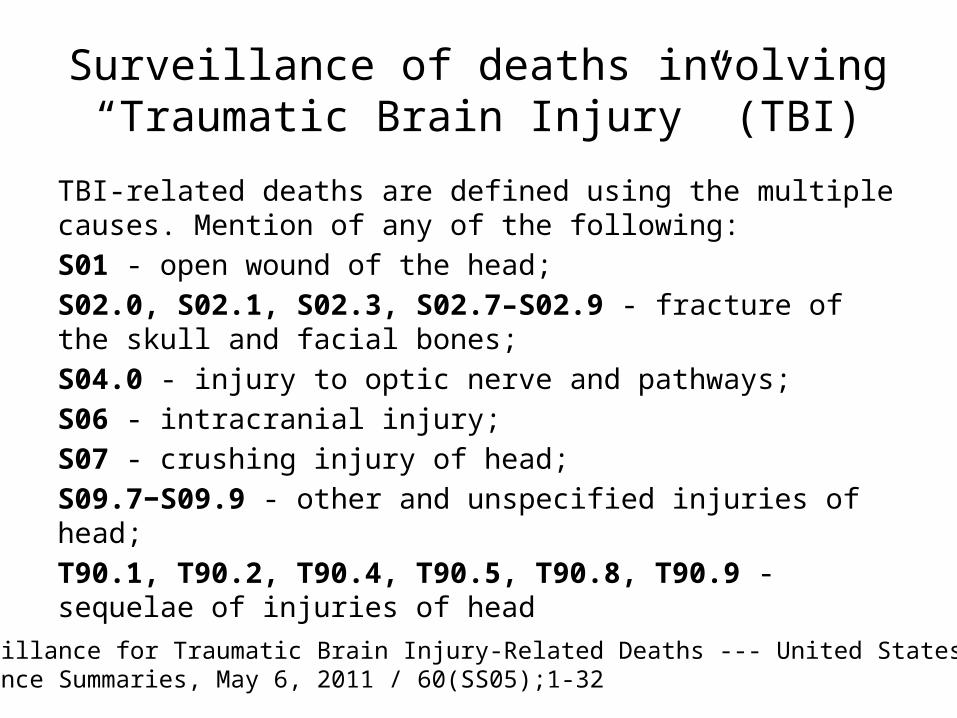
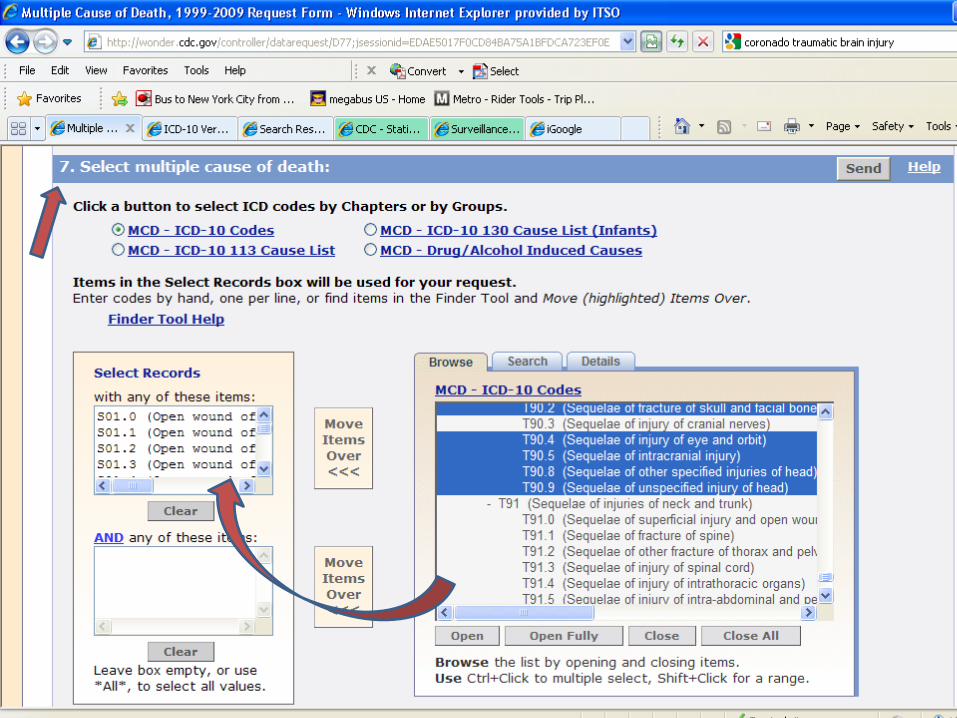
“Traumatic Brain Injury” (TBI) codes
• S01 - open wound of the head;• S02.0, S02.1, S02.3, S02.7–S02.9 - fracture of the
skull and facial bones;• S04.0 - injury to optic nerve and pathways;• S06 - intracranial injury;• S07 - crushing injury of head;• S09.7–S09.9 - other and unspecified injuries of head;• T90.1, T90.2, T90.4, T90.5, T90.8, T90.9 - sequelae of
injuries of head.Source: “Surveillance for Traumatic Brain Injury-Related Deaths --- United States, 1997—2007” MMWR Surveillance Summaries, May 6, 2011 / 60(SS05);1-32

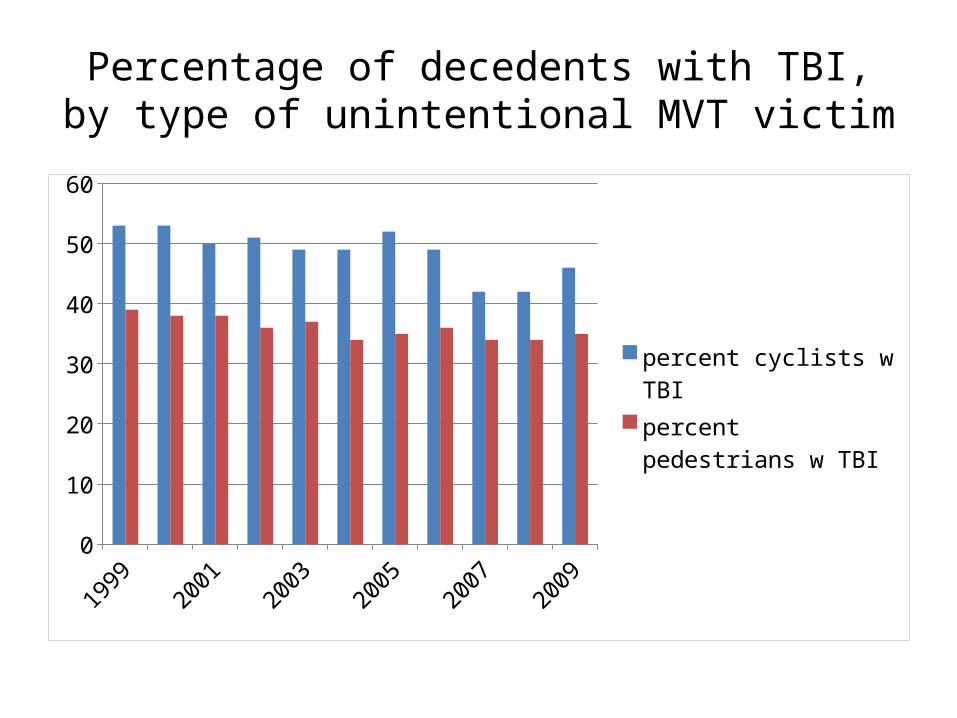
Percentage of decedents with TBI, by type of unintentional MVT victim
19992000
20012002
20032004
20052006
20072008
20090
10
20
30
40
50
60
percent cyclists w TBIpercent pedestrians w TBI
Surveillance of deaths involving “Traumatic Brain Injury” (TBI)
TBI-related deaths are defined using the multiple causes. Mention of any of the following:S01 - open wound of the head;S02.0, S02.1, S02.3, S02.7–S02.9 - fracture of the skull and facial bones;S04.0 - injury to optic nerve and pathways;S06 - intracranial injury;S07 - crushing injury of head;S09.7 −S09.9 - other and unspecified injuries of head;T90.1, T90.2, T90.4, T90.5, T90.8, T90.9 - sequelae of injuries of headSource: “Surveillance for Traumatic Brain Injury-Related Deaths --- United States, 1997—2007”
MMWR Surveillance Summaries, May 6, 2011 / 60(SS05);1-32
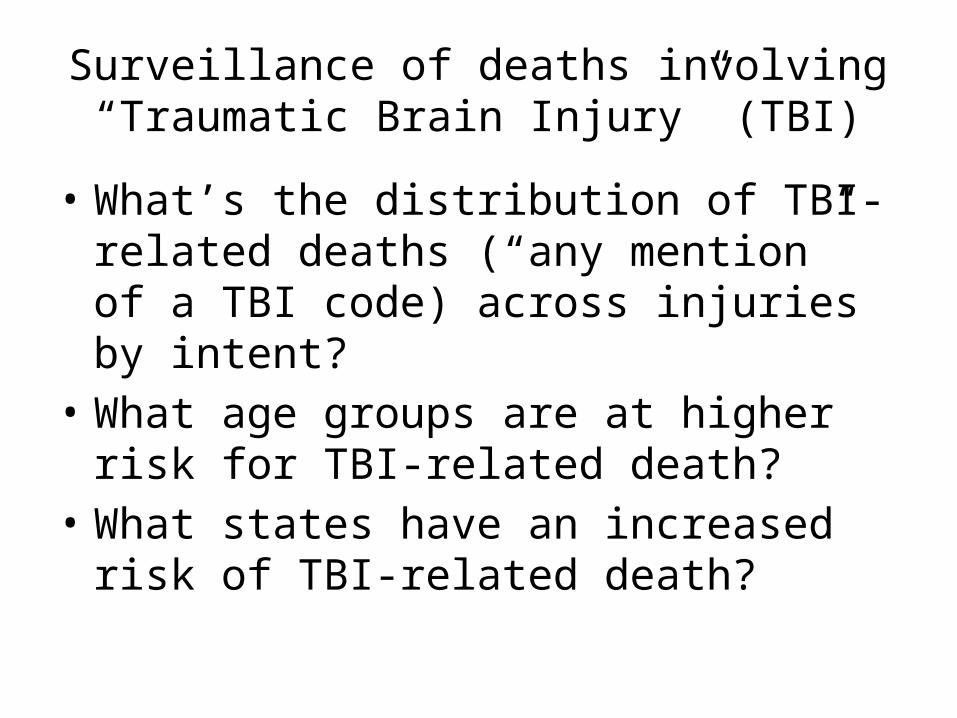
Surveillance of deaths involving “Traumatic Brain Injury” (TBI)
• What’s the distribution of TBI-related deaths (“any mention” of a TBI code) across injuries by intent?
• What age groups are at higher risk for TBI-related death?
• What states have an increased risk of TBI-related death?

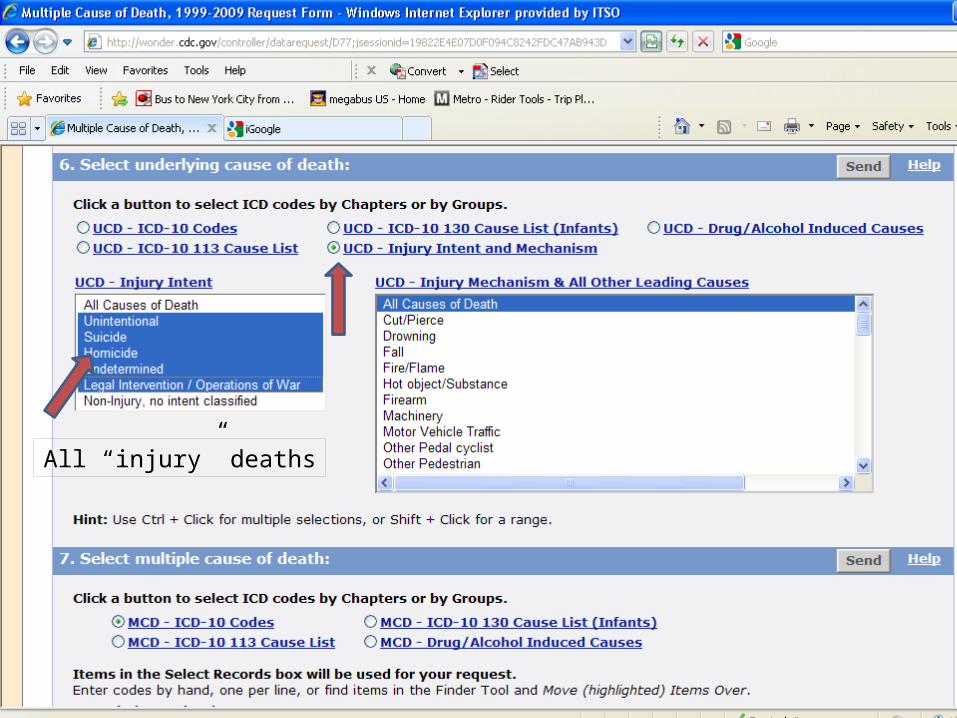
All “injury” deaths

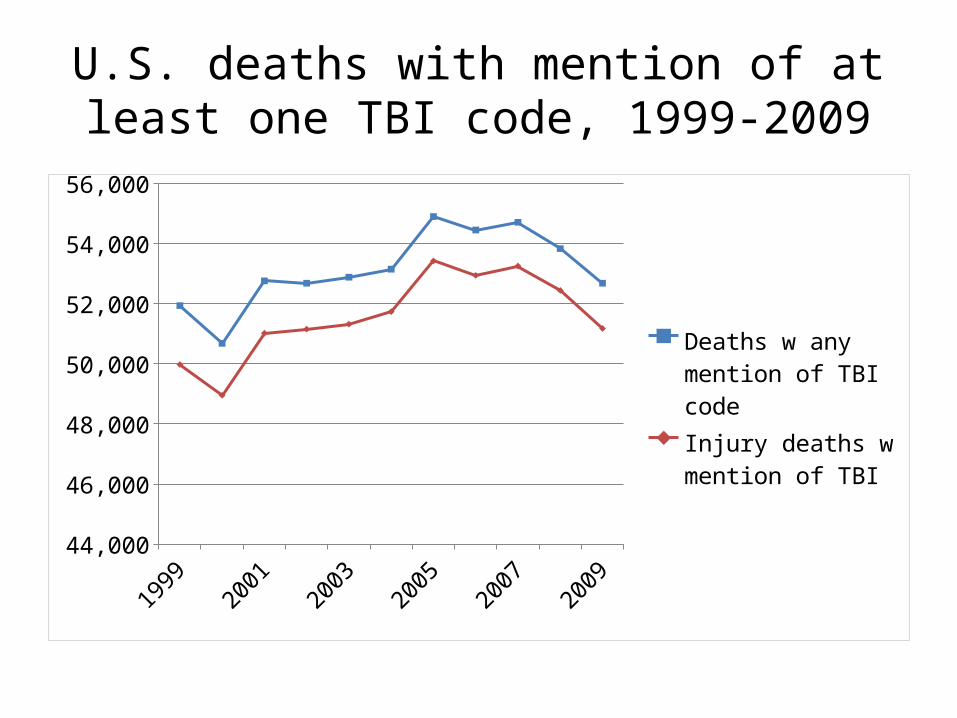
U.S. deaths with mention of at least one TBI code, 1999-2009
19992000
20012002
20032004
20052006
20072008
200944,000
46,000
48,000
50,000
52,000
54,000
56,000
Deaths w any mention of TBI codeInjury deaths w mention of TBI
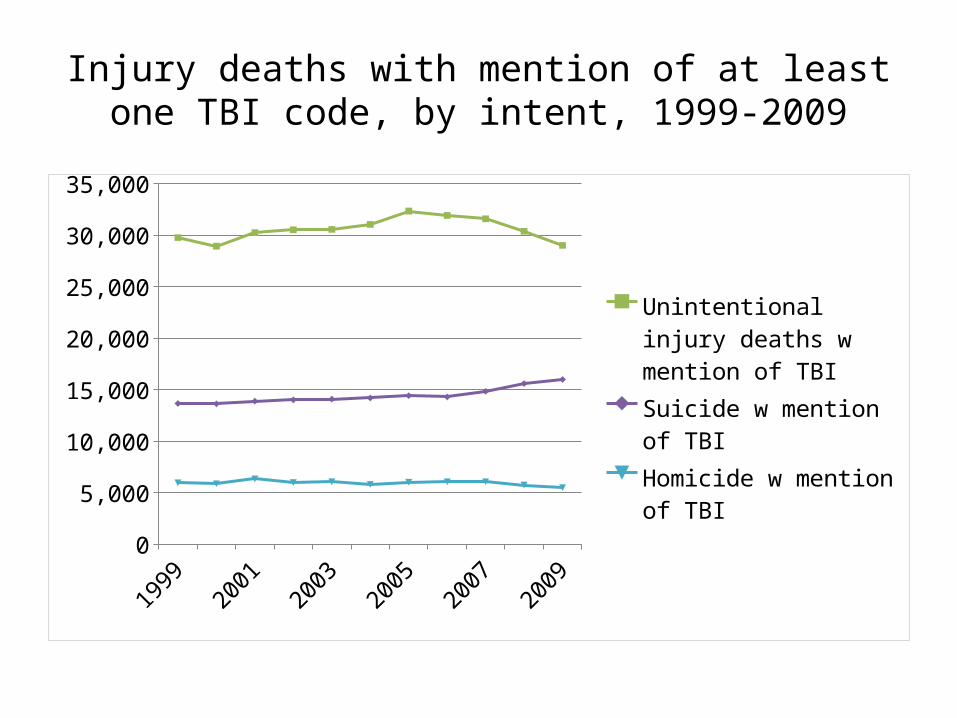
Injury deaths with mention of at least one TBI code, by intent, 1999-2009
19992000
20012002
20032004
20052006
20072008
20090
5,000
10,000
15,000
20,000
25,000
30,000
35,000
Unintentional injury deaths w mention of TBISuicide w mention of TBIHomicide w mention of TBI
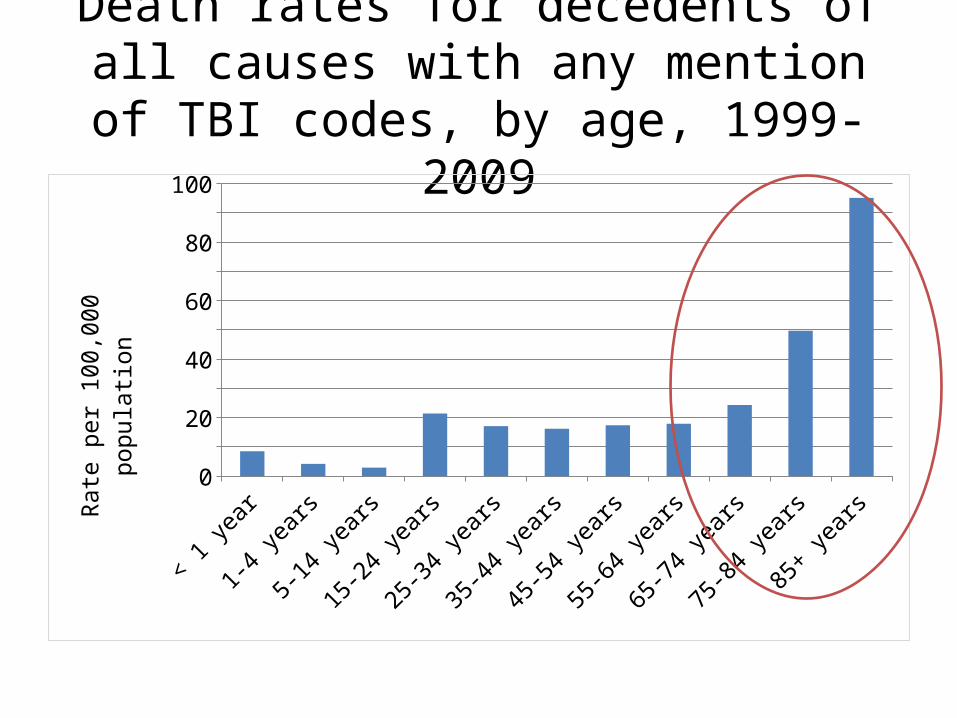
Death rates for decedents of all causes with any mention of TBI codes, by age,
1999-2009
< 1 year
1-4 years
5-14 years
15-24 years
25-34 years
35-44 years
45-54 years
55-64 years
65-74 years
75-84 years
85+ years
0
10
20
30
40
50
60
70
80
90
100
Rate
per
100
,000
pop
ulati
on
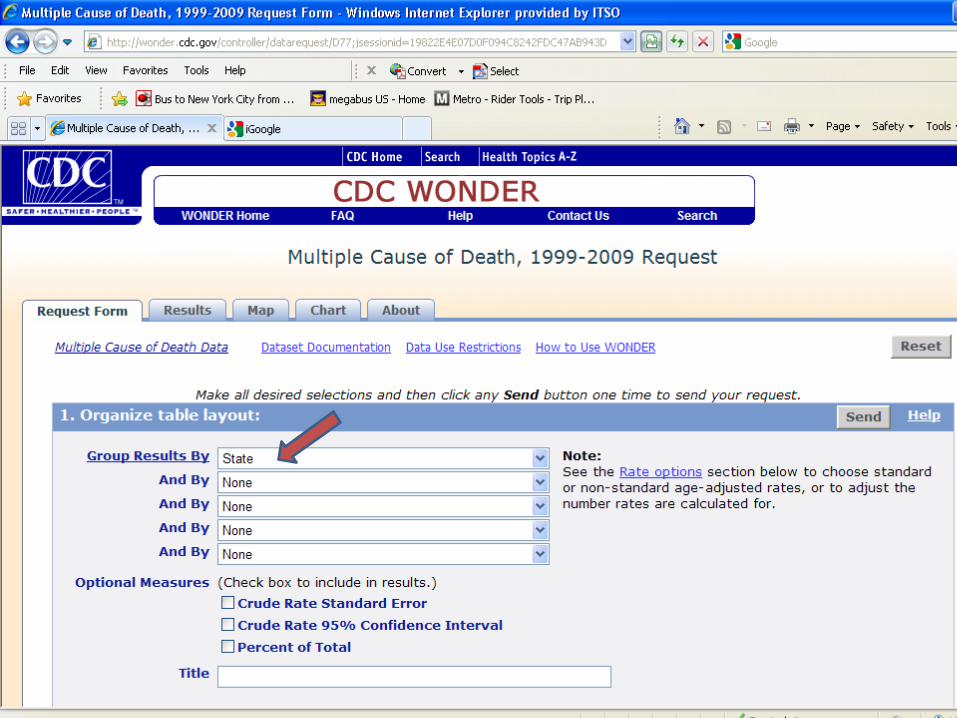
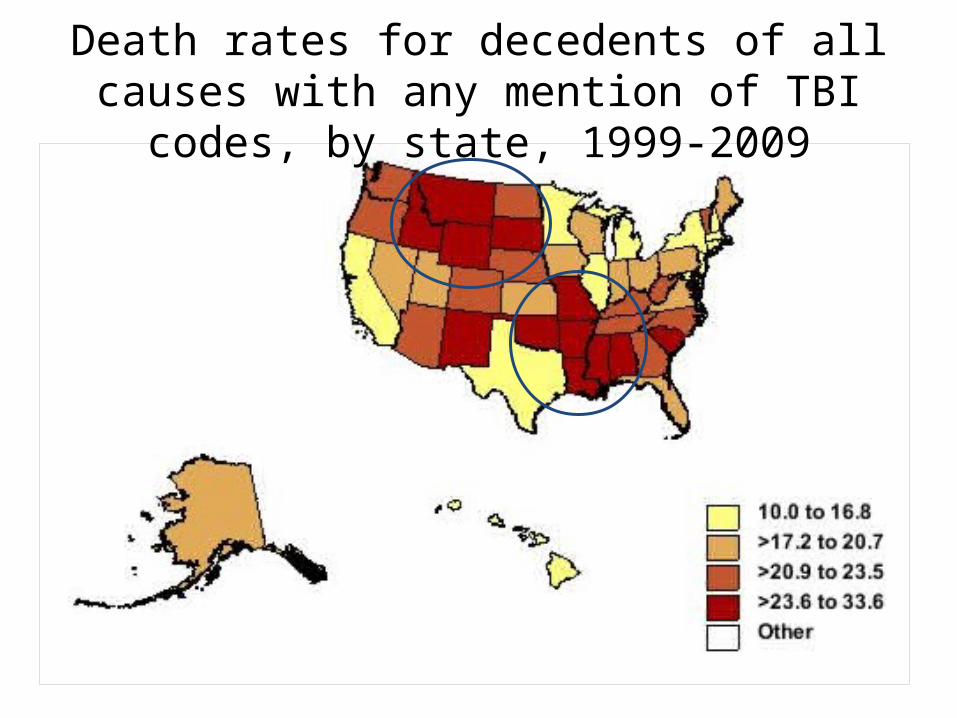
Death rates for decedents of all causes with any mention of TBI codes, by state, 1999-2009
WEB RESOURCES FOR INJURY-RELATED MORTALITY RESEARCH
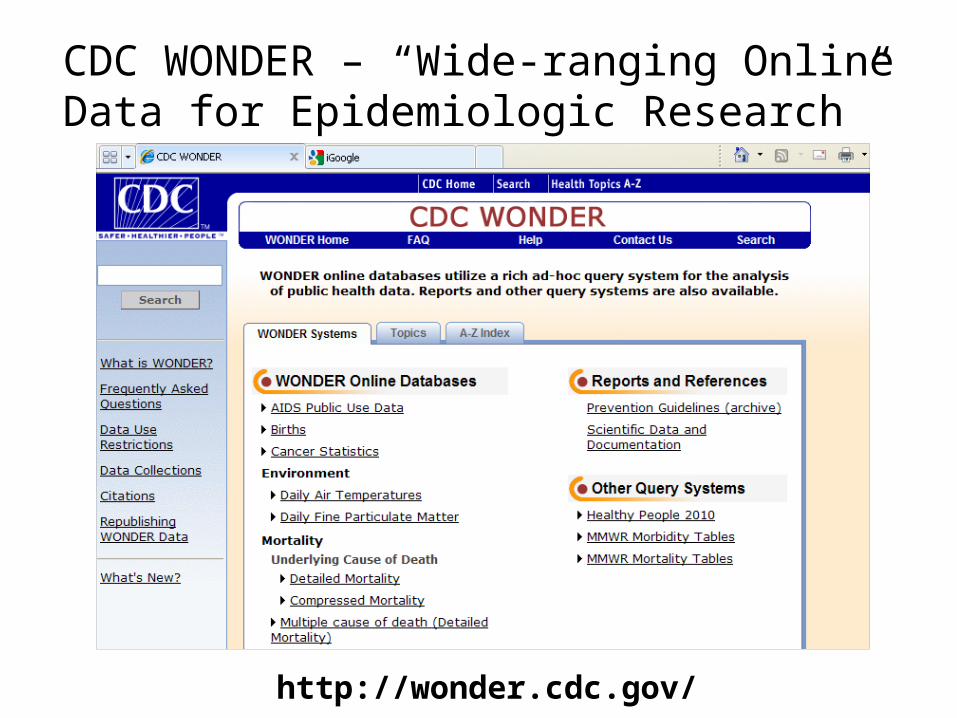
CDC WONDER – “Wide-ranging Online Data for Epidemiologic Research”
http://wonder.cdc.gov/
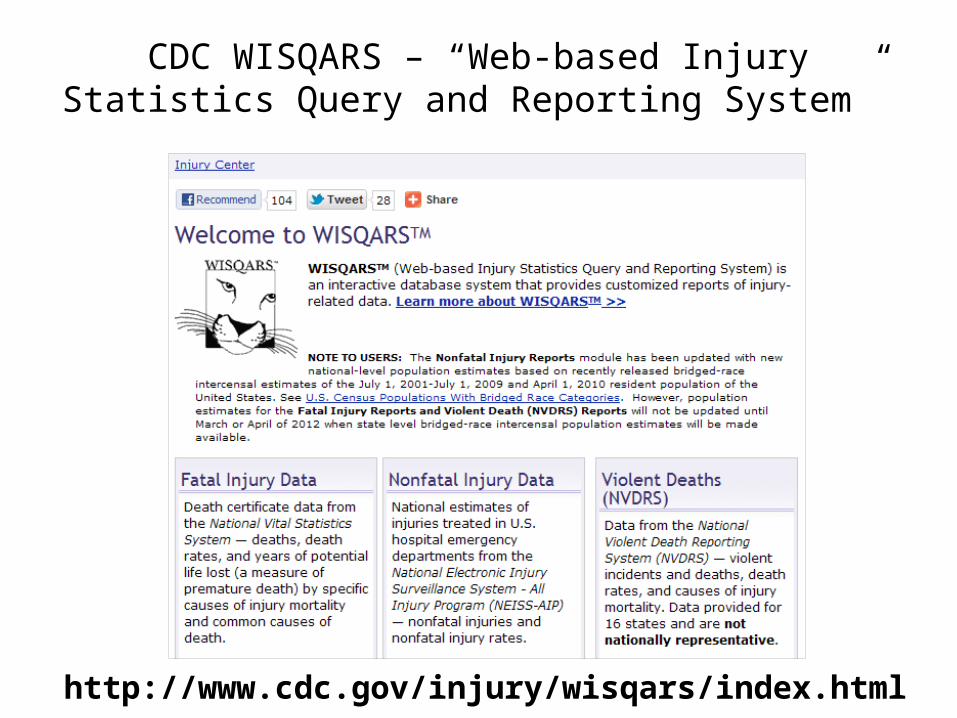
CDC WISQARS – “Web-based Injury Statistics Query and Reporting System”
http://www.cdc.gov/injury/wisqars/index.html
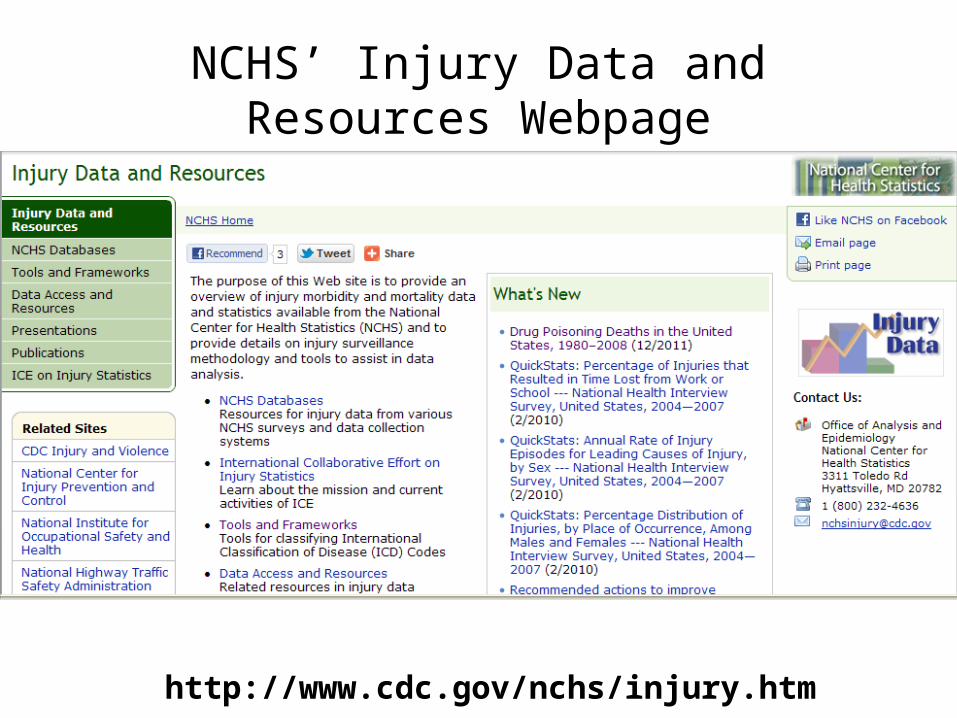
NCHS’ Injury Data and Resources Webpage
http://www.cdc.gov/nchs/injury.htm
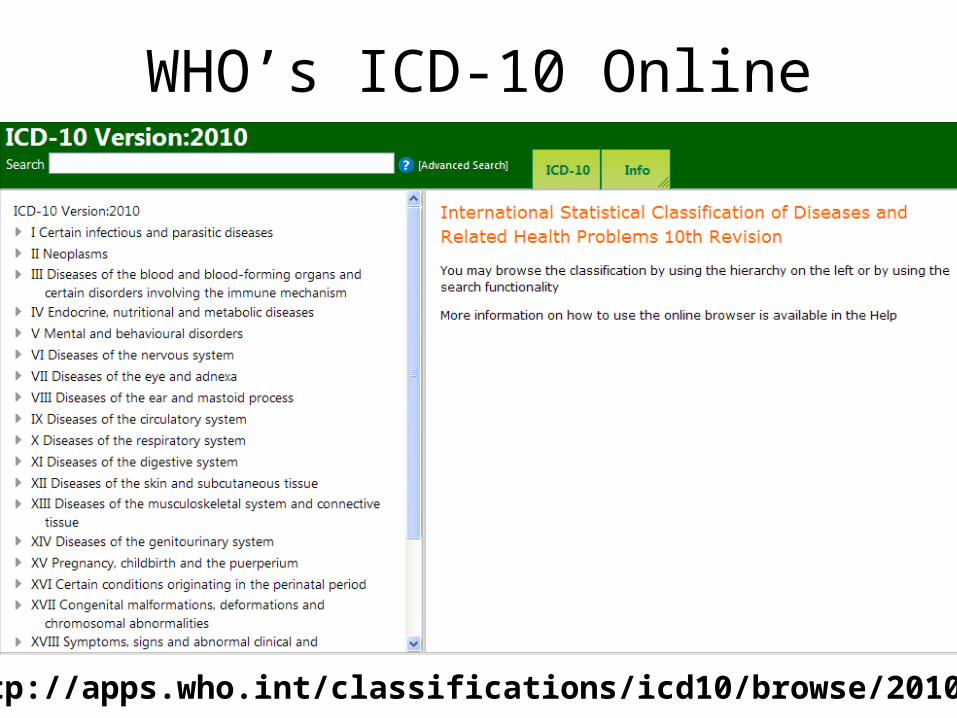
WHO’s ICD-10 Online
http://apps.who.int/classifications/icd10/browse/2010/en