Embed Size (px)
Citation preview

1
32nd Annual
Arizona / Utah
Frontier Movie Town/Kanab, UT – April 6, 2010
Washington County Fairgrounds/Hurricane, UT–April 7, 2010 Tour/Atkin’ Ranch – April 8, 2010

2
AZ/UT RANGE LIVESTOCK SPONSORS SPONSORS Beck Enterprises Boehringer-Ingelheim Crop Protection Services Dow Agro Sciences Genex Cooperative Inc. Global Animal Management Granite Seed Company Intermountain Farmers Association Manna Pro Products LLC Powder River Ridley Nutrition Solutions Scholzen Products Co Inc. Utah Beef Council Utah Cattlemen Association USDA NRCS-RC&D Utah Seed HOSTED BY The University of Arizona Utah State University Bureau of Land Management-AZ Strip District USDA Forest Service USDA, Natural Resources Conservation Service PROGRAM FUNDING ASSISTANCE BY Arizona Strip Grazing Board
ARS-USDA Fredonia NRCD Littlefield-Hurricane Valley NRCD USDA, Farm Service Agency PROGRAM PROMOTIONAL ITEMS DONATED BY Cal Ranch Dixie Gun & Fish Dixie Soil Conservation District Intermountain Farmers Association Kane County Farm Bureau Young Farmers Kane County Soil Conservation District Rutger C. Atkin Ranches Utah Beef Council Utah Cattlemen Association

3
AZ/UT RANGE LIVESTOCK PLANNING COMMITTEE
PLANNING COMMITTEE Joy Atkin
Jim Bowns Raymond Brinkerhoff
Deborah Bundy Whit Bunting Dustin Burger
C. Kim Chapman Raymon Christensen
Del Despain Howard Foremaster
Rob Grumbles Carson Gubler Doug Hansen Kip Hansen
Kevin Heaton Chad Horman Kelby Iverson
Richard Madrill Brian Monroe
Jeremy Peterson Chad Reid
Bob Sandberg Kyle Spencer
Doug Tolleson Dale ZoBell
We would like to express our sincere appreciation to those who have helped make this program possible.
Proceedings by Karma Wood, Staff Assistant III, USU Proceedings edited by Dale ZoBell, USU Beef Extension Specialist
Issued in furtherance of Cooperative Extension work, acts of May 8 and June 30, 1914, in cooperation with the U.S. Department of Agriculture, Cooperative Extension, College of Agriculture & Live Sciences, University of Arizona, Utah State University. The University of Arizona, Utah State University are equal opportunity, affirmative action institutions. They do not discriminate on the basis of race, color, religion, sex, national origin, age, disability, veteran status, or sexual orientation in its programs and activities.

4
2010 AZ/UT RANGE LIVESTOCK WORKSHOP
APRIL 6th APRIL 7th APRIL 8th - FIELD TOUR KANAB, UTAH Frontier Movie Town
HURRICANE, UTAH Washington County Fairgrounds
Atkin’s Ranch, AZ Strip Meet at AZ Strip BLM Office 345 E. Riverside Drive 7:30 AM Utah Time (6:30 AM AZ)
7:30-8:15 AM Registration 8:15-8:30 AM Welcome and Introductions 8:30-9:00 AM ARE GRAZING SYSTEMS WORTHY!
Lee Hughes, Ecologist, AZ Strip BLM 9:00-10:00 AM A DISCUSSION OF PERCEPTIONS AND EVIDENCE (RESEARCH AND
PRACTICAL) CONCERNING ROTATIONAL GRAZING ON RANGELANDS Team presentation: Dr. Doug Tolleson, Extension Range Specialist, V-V Ranch University of Arizona
and Brian Monroe, Rangeland Mgt. Specialist, Dixie National Forest, USFS 10:00-10:15 AM Sponsor Introductions 10:15-10:45 AM Break 10:45-11:15 AM A REVIEW OF CEDAR MOUNTAIN RESEARCH PROJECT
Dr. Jim Bowns, Professor Southern Utah University, Extension Range Specialist, Utah State University
11:15-12:00 PM COMMON VITAMIN AND MINERAL DEFICIENCIES IN AZ STRIP AND
SOUTHERN UTAH Dr. Jeffery Hall, Extension Livestock Specialist, Utah State University 12:00-12:30 PM NEW GRASSES FOR RANGELANDS
Dr. Kevin Jensen, Research Geneticist, USDA, Agricultural Research Service, Forage and Range Research Lab, Logan, Utah
12:30-1:15 PM Lunch
1:15-1:45 PM POUR ON CYDECTIN AND POUR ON THE POUNDS – LUNCH SPONSOR Jim Loughead, Senior Sales Representative, Cattle Boehringer Ingelheim

5
1:45-2:15 PM HISTORY OF THE ATKINS RANCH ON THE AZ STRIP Joy & Brandon Atkin, Owners/Managers, Rudger C. Atkin Ranches 2:15-2:45 PM RANGE HEIFER DEVELOPMENT Dr. Jim Sprinkle, Area Agent, Extension Specialist, University of Arizona 2:45-3:15 PM Break 3:15-3:45 PM LIVESTOCK MARKETING CLUB Dr. Dillon Feuz, Agriculture Economic Specialist, Utah State University 3:45-4:30 PM AZ/UT LIVESTOCK OWNERSHIP AND HEALTH REQUIREMENTS Dr. John Hunt, Associate Director AZ Department of Agriculture Dr. Bruce King, State Veterinarian, Utah Department of Agriculture Panel: Dr. King, Dr. Hunt, Brady Weaver, Raymon Christensen, Terry Menlove
4:30-4:45 PM Wrap up and evaluation

6
2010 AZ/UT RANGE LIVESTOCK WORKSHOP
TABLE OF CONTENTS
TOPIC/SPEAKER PAGE # ARE GRAZING SYSTEMS WORTHY, Lee Hughes………………………………………………………...7 A DISCUSSION OF PERCEPTIONS AND EVIDENCE (RESEARCH AND PRACTICAL) CONCERNING ROTATIONAL GRAZING ON RANGELANDS, Dr. Doug Tolleson and Brian Monroe……………………………………………………………………...8-12 A REVIEW OF CEDAR MOUNTAIN RESEARCH PROJECT, Dr. Jim Bowns………………………13-27 COMMON VITAMIN AND MINERAL DIFICIENCIES IN AZ STRIP AND SOUTHERN UTAH, Dr. Jeffery Hall……………………………………………………………………28-33 NEW GRASSES FOR RANGELANDS, Dr. Kevin Jensen……………………………………………..34-40 POUR ON CYDECTIN ANDE POUR ON THE POUNDS, Jim Loughhead…………………………..41-56 HISTORY OF THE ATKINS RANCH ON THE ARIZONA STRIP, Joy and Brandon Atkin………………………………………………………………………………………57 RANGE HEIFER DEVELOPMENT, Dr. Jim Sprinkle…………………………………………………58-87 LIVESTOCK MARKETING CLUB, Dr. Dillon Feuz………………………………………………….88-89 AZ/UT LIVESTOCK OWNERSHIP AND HEALTH REQUIREMENTS, Dr. John Hunt and Dr. Bruce King……………………………………………………………………....90-95

7
Abstract
Grazing systems: Are they worthy? Lee E Hughes-BLM
Research on grazing systems was summarized and analyzed in a recent synthesis paper in the January
2008 Rangeland Ecology and Management. It accepted only statistically tested and refereed papers. This eliminated many papers that had systematically gathered data (but not statistically tested) and that covered large landscapes. (The synthesis paper deals mostly with small experimental areas or paddocks). Many of these papers with systematically gathered data reflected more success with rotation grazing. The message from the 2008 synthesis paper is that rotation grazing shows results that have little to no difference from continuous grazing. The synthesis paper compared plant production and animal production. Research by Teague et al, was cited in the paper and stated that Teague’s research found rest from grazing, for periods of time in the grazing system, facilitated improved plant species composition. This is, of course, the objective of most BLM grazing systems.
This paper will look at three case histories of grazing systems on the Arizona Strip. The data is systematically gathered with pace frequency and dry weight rank methods.
The first case will look at an area in the Mohave Desert that was under continuous use, had been burned over and over-utilized during recent droughts. That area has had one allotment rested since 1990 and the other allotment has been under rest-rotation grazing since 1990. The two allotment’s data, gathered on most years since 1990, are compared for differences with the allotment under rotation and the one that has been rested. The allotment with total rest had more perennial grass develop and the allotment with rest rotation had a smaller increase in perennial grass but the shrubs increased more. According to ecological site data from the Natural Resource Conservation Service, the ranges eventually will be covered with desert shrubs and Joshua trees, as they were before the fires.
Two other allotments that have been under rest rotation since 1969 are examined.
The Little Tank allotment has trend with weather driven change occurring with the grazing system. Both forage and non-forage species showed the same magnitude of change or improvement through the years. The key areas are in late serial stage of succession. The key area examined is typical of all four.
The Clayhole allotment has an exclosure built 60 years ago. It was in a heavily used area and had little browse nor cool season grasses. Line point data is looked at for changes from 1952 to 1991 and pace frequency data from 1983-2005; and the data shows a noted improvement in cool season grass and browse after the grazing system was implemented. Also, the Big Warren area of the grazing system was looked at and it too showed improvement in species composition in both forage and non forage species.
Some data on animal production is shown and it is mixed. Some grazing systems showed improvement in weight and calf crops, some no difference and two showed decreases in calf weights.

8
A Discussion of Perceptions and Evidence (Research and Practical) Concerning Rotational Grazing on Rangelands:
Summary of Briske, et al. Rangeland Ecology and Management, 61:3-17, January 2008 Doug Tolleson
Rangeland Management Specialist University of Arizona, V Bar V Experimental Ranch
Introduction
The paper I am summarizing for this meeting has become a focal point for both public debate and personal introspection within the range profession during the last 2 years. I have been involved in some of each. The topic is obviously older than that; much discussion about the relative merits of various approaches to livestock grazing having been going on for many years. This current debate I think actually came to the forefront as a result of a symposium held during the annual Society for Range Management (SRM) meetings in Vancouver, BC (2006) that was a precursor to the journal paper. This was followed by a similar symposium in 2009, after the paper was published, at the SRM meetings in Albuquerque, NM. Panel discussions during these symposia were always spirited and sometimes heated. Many scientific facts were presented, many personal experiences were related, little was resolved. It was sort of like watching C-SPAN. The paper in question is a multi-author review and synthesis of the scientific literature concerning rotational grazing on rangelands. The organizing committee for this workshop felt that not only this journal paper, but the pros and cons of the topic as a whole, was worthy of discussion in this venue. Just from my personal experience, I know the paper has been cussed, discussed, misunderstood and I suspect, misused. My assignment is to summarize the paper and try to familiarize the audience with what it says about continuous versus rotational grazing, and hopefully, what we can learn from it.
Outline
The authors begin by introducing the topic and defining the “Dilemma of Grazing Systems”. They present a succinct history and useful description of various types of grazing systems. The second paragraph of the introduction is probably where much of the controversy begins as the authors state that “The preponderance of evidence generated from grazing experiments over the past 60 years has consistently indicated that rotational grazing is not superior to continuous grazing on rangelands…” and “Yet, in spite of clear and consistent experimental evidence demonstrating that rotational grazing and continuous grazing have similar effectiveness on rangelands, rotational grazing continues to be promoted and implemented as a superior grazing system…”. The stated objectives of the paper were to: “1) reevaluate the complexity, underlying assumptions, and ecological processes governing the response of grazed ecosystems, 2) summarize plant and animal production responses to rotational and continuous grazing, 3) characterize the prevailing perceptions influencing the assessment of rotational and continuous grazing, and 4) attempt to direct the profession toward a reconciliation of perceptions advocating support for rotational grazing systems with that of the experimental evidence.”
The authors next identify “Primary Sources of Complexity and Confusion” including the extreme variability in precipitation, ecological sites, objectives, and management ability found within the broad category of rangelands and grazing practices. The authors then lay a foundation for subsequent discussions by presenting “Unified Vegetation Responses to Grazing”. These were summarized in 4 unifying principles: “1) Chronic, intensive grazing is detrimental to plant growth and survival; 2) Primary productivity can be increased by lenient grazing and decreased by severe grazing; 3) Forage quality is often improved by frequent grazing; and 4) Species composition of plant communities can be modified in response to the frequency, intensity, and seasonality of grazing.” Each of these four topics is then discussed separately.

9
“Results of Experimental Grazing Research” begins with a meticulous description of the datasets and methods employed by the authors and the analytical rigor to which they were subjected. The authors follow with results concerning “the two most frequently quantified variables, plant production or standing crop biomass and animal production, expressed on both a per head and per unit area basis.” These results are presented by breaking out studies for which stocking rate was equal for continuous and rotational grazing, and for those in which stocking rate differed between the two.
The next section, “Why is Rotational Grazing not Supported by Experimental Data?”, is organized into 2 broad responses to the question posed in the section heading: a) “Presumed Benefits of Rotational Grazing Were Overextended”, and b) “Ecological Constraints Occur in All Grazed Ecosystems.” Example statements from each include: “rotational grazing may have been introduced with heightened and unrealistic expectations that were not founded on evidence-based recommendations” under the first sub-heading and, “The ability to optimize plant production and forage harvest takes on even greater complexity on rangelands because the periodicity and predictability of plant growth are constrained by limited and erratic precipitation.” under the second. Figure 3 in this section, which presents a hypothetical rotational grazing schedule with precipitation events and periods of plant growth superimposed, seems to synthesize the authors 2 answers to the question posed in the section heading.
“Perceptions for Continued Advocacy of Rotational Grazing” contains 3 broad arguments in support of rotational grazing: a) “Context of Experimental Research”, b) “Conservation Goals”, and c) “Involvement of Human Dimensions”. Statements which seem to capture the essence of these 3 arguments include “Grazing treatments are often applied on a more rigid schedule to ensure experimental integrity and repeatability compared to commercial systems that are adaptively managed.”, “The majority of grazing experiments have not collected the appropriate variables, at the appropriate scale, to evaluate environmental quality and conservation issues ”, and “A novel case study approach … compared adjacent ranches that had employed either continuous or rotational grazing to achieve the optimal production outcome. The strength of this approach is that it enables researchers to evaluate the entire ranch enterprise, including the capacity to manage adaptively for the best possible outcomes, within the constraints of the respective grazing regime.”, for sub-headings a, b, and c respectively.
The paper closes with a section entitled “Implications and Perception Reconciliation”. Here, the authors bring all the data they have gathered, all of the analyses they conducted, and their collective experience to bear in concluding that: “The experimental evidence indicates that rotational grazing is a viable grazing strategy on rangelands, but the perception that it is superior to continuous grazing is not supported by the vast majority of experimental investigations. There is no consistent or overwhelming evidence demonstrating that rotational grazing simulates ecological processes to enhance plant and animal production compared to that of continuous grazing on rangelands. We recommend that these evidence-based conclusions be explicitly incorporated into management and policy decisions addressing the predominant land use on rangelands.”. Outcome and Impact
Regardless of whether one agrees or disagrees with some or all of the Briske, et al. (2008) paper, I think several important issues emerge from the paper, the process of analysis that produced it, and the subsequent debate. Some of these issues are not strictly related to the topic of rotational grazing. First; “research” and “management” do not always value and or measure the same variables to determine “success”. Better integration of research and management is required to answer questions like “is management technique A superior to management technique B?” Second; rangelands and the ranches or
10
natural resource entities operating on them are too variable to adequately describe or analyze under the constraints of most experimental designs. There is no “one (or 3 or 4) size fits all” way to manage grazing or research. These statements do not, however, mean that such experimentation has no value for informing management. On the contrary, such work is vital to picking apart the intricacies of processes operating on various rangeland ecosystems, and the construction of a synthesis such as Briske, et al. (2008) would not be possible without them. Nor do these statements imply that “management oriented” or “applied” research is somehow less “scientific” or valuable than more “basic” research. Again, both have their place and their own importance. Both need to inform and facilitate the other. I think the most significant result from the paper is that we in the range profession have taken a long, hard, and overdue look at grazing management and grazing research, and how we interpret and evaluate the results of both. I commend the authors for taking on such a tough task and for participating in the ensuing debate. I think this process will ultimately cause all of us; managers, researchers, consultants, or educators to do a better job of critically evaluating how what we do affects rangelands and the continued production of goods and services from them. Acknowledgments: I want to thank David Briske, Larry Howery, Lamar Smith, and Rob Grumbles for their review of this “book report”. For a more detailed discussion of this topic I suggest the October 2009 issue of Rangelands (vol 31 # 5).

11
Grazing Systems Research Shortfalls (Dr. Ben Norton)
Researchers assumed that under continuous grazing; the most desirable plants would be selectively grazed, experiencing frequent and severe defoliation. They then assumed that a rotational grazing system would allow the manager to control defoliation frequency. However, studies of rotational grazing compared with continuous grazing showed that usually continuous grazing was better than or no worse than a rotational grazing system in terms of livestock production or vegetation. Researchers have given several reasons to explain why the results of grazing system studies have been counter-intuitive:
The theory of rotational grazing has been based on clipping studies. There are 2 problems with extrapolating from clipping studies to real-world grazing:
1. Continuous grazing in a simulated grazing (clipping) study is always represented by more frequent defoliation than the slated rotational grazing treatment, but this higher frequency of defoliation may not actually occur in a real-world grazing situation.
2. Clipping is a poor representation of the phenomenon of grazing. Grazing removes foliage at uneven heights, gradually over a long time in the case of larger plants; grazing leaves some leaves or tillers untouched, and nutrients from these intact tillers can be transferred to the neighboring defoliated tillers to help them recover; clipping does not allow for the trampling impacts associated with grazing; clipping does not include the return of defoliated material following digestion, in the form of manure and urine; clipping studies often ignore the competitive environment between plants in a grazed pasture.
Well defined parameters and rigidity is required in the experimental design of rotational grazing
studies, so that the grazing periods and rest periods is of fixed lengths. On a ranch, the manager would vary the scheduling of the rotation according to season and the specific condition of individual pastures.
Grazing studies have been too short, not allowing sufficient years for the grazing system to cause improvements in the composition of the vegetation. A positive effect of rotational grazing is more likely to be found in a research trial that lasts more than 10 years, [In this view, the benefit of a grazing system not in the rotational grazing per se, but via the change in vegetation that can result from a rotational grazing strategy but not from continuous grazing.]
The stocking rate employed in grazing studies has been too low. If the livestock are having a relatively light impact on the vegetation no matter what the grazing system is, then the ability of a rotational grazing system to express the difference in defoliation frequency imposed by the grazing schedule, or the benefit of a rest period following defoliation, is substantially limited. Unfortunately, few studies of grazing systems on rangelands have been conducted at more than one stocking rate.
At relatively high stocking rates, by the end of a grazing period the available forage is substantially reduced in quantity and quality, and animal performance declines, only to rise again in the early portion of the next grazing period when the animals enter a paddock that has been rested. This fluctuation in daily weight gain associated with the rotation is bad for livestock production overall. [The High Intensity Low Frequency grazing system is the best example of this problem.]

12
When animals enter a paddock that has been rested, the forage quality is lower and livestock production is reduced.
The process of moving animals around a series of paddocks in a rotation creates a social and psychological disturbance that reduces intake and suppresses production.
During the rest period of a rotation, there is no particular benefit to the composition of the vegetation, because the rest period doesn't affect species regeneration.
During the grazing period, there is heavier utilization on the most palatable species while the less palatable species are also being grazed somewhat, and this extreme defoliation on desirable species is not compensated by recovery during the rest period that follows the defoliation.
The research paddocks have been unrealistically small and grazed more uniformly than large paddocks.

13

14

15

16
17

18

19

20

21

22

23

24

25

26

27

28
Common Vitamin and Mineral Deficiencies in AZ Strip and So. Utah
Jeffery O. Hall, D.V.M., Ph.D., Diplomat A.B.V.T. Utah Veterinary Diagnostic Laboratory
Department of Animal, Dairy, and Veterinary Sciences Utah State University
Introduction Many minerals and vitamins have been proven in research studies to be essential for optimal growth, physiologic function, and productivity in animals. Data from the analytical section of the Utah Veterinary Diagnostic Laboratory would indicate a significant increase in incidence of vitamin and mineral deficiencies during 2009 and 2010. Much of this increase appears to be associated with producers decreasing or completely stopping the practice of vitamin-mineral supplementation. Based on interaction with producers, common discussions are of extremely high fuel, hay, and other production factors in the fall of 2008, which resulted in searches for ways to cut input costs. A common finding with many of the diagnosed deficiencies is a lack of vitamin-mineral supplementation either long term or due to cost cutting. Increasing incidence of adverse neonatal health effects, due to vitamin or mineral deficiencies, were observed in 2009, but further increases are occurring in 2010. This continued increase is likely due to some herds which stopped supplementation in the Fall of 2008 having body reserves that allowed for healthy calves in the Spring of 2009. But continued lack of supplementation has resulted in depletion of the body reserves and poor calf health in the Spring of 2010.
This paper is directed at the health effect of common vitamin and mineral deficiencies and provides a summarization of the most commonly analyzed tissues and fluids that are used for diagnosing specific deficiencies. The paper also touches on immune system effects and appropriate supplementation. Deficiency Diagnoses
Historically, testing for deficiencies has been performed on diets and/or dietary components to ensure “adequate” concentrations in the diet. However, general mineral analysis does not identify the chemical forms of these minerals, which can dramatically alter their bioavailability and utilization. In addition, certain dietary factors can alter bioavailability of certain vitamins as well. Although not possible for some of the minerals, the most specific means of diagnosing a mineral deficiency is by testing animals for unique functional deficits or deficiencies of specific mineral containing proteins or enzymes. This type of testing is often impractical from a field perspective, due to individual test costs or rigorous sample handling requirements. But, when possible, this type of testing eliminates the need to know the specific molecular characteristics of a dietary mineral and the potential for competitive interactions of antagonistic minerals for absorption/utilization. For minerals that do not have identified physiologic indices for which testing can be performed, direct quantification from animal tissues or serum may provide a reliable indication of the overall mineral status of the animal or group. Testing of adequacy of fat soluble vitamins is commonly achieved by testing serum or liver tissue. It is essential that serum be separated from the red blood cells soon after collection. In addition, serum should be maintained frozen and protected from sun light while being shipped to the testing laboratory. Vitamin and mineral deficiencies can be suggestively diagnosed by the development of clinical disease or by post-mortem identification of tissue lesions. But, proof of deficiencies often requires analytical verification since most do not have very unique clinical signs or lesions. In some instances, circumstantial proof of a deficiency can be provided by positive response to supplementation of a suspected deficient vitamins or minerals. But, positive response may have nothing to do with the supplementation and may be just a time responsive correction of some other clinical condition. An individual vitamin or mineral may have multiple means of measurement for identification of deficiencies, but

29
most have one that is more specific than the others. For example, dietary concentrations may or may not be reflective of the amount that is bioavailable. Or, an individual tissue concentration may or may not reflect functional availability at the target or functional site. The age of the animal being tested also is important for proper interpretation of status. For example, feti accumulate some minerals at different rates during gestation, necessitating adequate aging of the fetus for interpretation. In addition, some minerals, for which little is provided in milk, accumulate at higher concentrations during gestation in order to provide neonates with adequate body reserves for survival until they begin foraging. This is especially prevalent with copper, iron, selenium, and zinc. Thus, the “normal range” for these minerals in body storage tissues would be higher in early neonates than in an adult animal. One must be careful to make sure that the testing laboratory is interpreting the results based on the age of the animals tested, as some laboratories try to interpret all samples as if they were from adult animals. When individual animals are tested, the prior health status must be considered in interpreting vitamin and mineral concentration of tissues. Disease states can shift mineral from tissues to serum or serum to tissues. For example, diarrhea can result in significant loss of sodium, potassium, and calcium from the body. Or, acidosis will cause electrolyte shifts between tissues and circulating blood. It is known that infectious disease, stress, fever, endocrine dysfunction, and trauma can alter both tissue and circulating serum/blood concentrations of certain minerals and electrolytes. Thus, evaluation of multiple animals is much more reflective of mineral status within a group than testing individual animals that are ill or have died from other disease states. Live Animal Sampling A variety of samples are available from live animals that can be analyzed for vitamin-mineral content. The most common samples from live animals are serum and whole blood. These samples are adequate for measurement of several minerals, but it must be recognized that some disease states, as well as feeding times, can result in altered or fluctuating serum concentrations. Other samples from live animals that are occasionally used for analyses include liver biopsies, urine, and milk. But, since milk mineral content can vary through lactation, vary across lactations, and be affected by disease it is not typically used to evaluate whole animal mineral status. Furthermore, hydration status significantly affects urinary mineral concentrations, rendering it a poor sample for evaluation of mineral status. For Vitamin A and E, serum is the best sample. Serum should be separated from the red/white blood cell clot within the 1 to 2 hours of collection. If the serum sets on the clot for long periods of time, minerals that have higher intracellular content than serum can leach into the serum and falsely increase the serum content. Minerals for which this commonly occurs include potassium and zinc. In addition, hemolysis from both natural disease and due to collection technique can result in increase serum concentrations of iron, manganese, potassium, selenium, and zinc. Vitamin A and E can begin breaking down in serum if not separated from the red blood cells and frozen within 1-2 hours of collection. Serum for vitamin A and E analysis should be stored such that breakdown from sunlight exposure does not occur. The best type of collection tube for serum or whole blood is royal blue-top vaccutainer tubes, as they are trace-metal free. Typical red-top clot tubes will give abnormally increased results for zinc content as a zinc containing lubricant is commonly used on the rubber stoppers. For minerals other than zinc or vitamins A and E, serum samples from the typical red-top clot tubes are adequate. Similarly, serum separator tubes are typically adequate for vitamin-mineral analyses, except for zinc. Samples should be appropriately stored for adequate sample preservation. Liver biopsies, urine, and serum can be stored frozen long term or refrigerated if mineral analysis is to be completed within a few days. Whole blood and milk should be refrigerated but not frozen, as cell lysis or coagulation of solids, respectively, will result. Post-Mortem Animal Sampling
30
A variety of post-mortem animal samples are available that can be analyzed for vitamin-mineral content. The most common tissue analyzed for mineral content is liver, as it is the primary storage organ for many of the essential minerals. In addition, bone is used as the primary storage organ for calcium, phosphorous, and magnesium. For Vitamin A and E, liver is the tissue of choice for analysis, but it needs to be relatively fresh. Tissue degradation will correspondingly decrease the vitamin A and E present. Post mortem samples should be stored frozen until analyzed to prevent tissue degradation. If samples are to be analyzed within 1-2 days, they can be stored under refrigerated conditions. Copper Deficiency Copper deficiency is one of the most commonly encountered nutritional problem in ruminants, but copper excess is also commonly encountered, especially in sheep. In contrast, copper deficiency is rare in non-ruminants. Clinical signs of deficiency can present as a large array of adverse effects. Reduced growth rates, decreased feed conversion, abomasal ulcers, lameness, poor immune function, sudden death, achromotrichia, and impaired reproductive function are commonly encountered with copper deficiency. Cows will do all they can to ensure adequate copper is in calves when they are born. They will actually deplete their own body reserves to ensure neonatal adequacy. As such, neonates diagnosed with copper deficiencies are proof of maternal deficiencies. With copper being an essential component of the immune function, this maternal deficiency likely results in poor colostrums quality and inadequate neonatal protection even in calves that get adequate volumes of colostrums. The best method for diagnosing copper status is via analysis of liver tissue, although much testing is performed on serum. Deficiency within a herd will result in some animals that have low serum copper concentrations, but serum content does not fall until liver copper is significantly depleted. In herds that have had livers tested and found a high incidence of deficiency, it is not uncommon for a high percentage of the animals to have “normal” serum concentrations. At the Utah Veterinary Diagnostic Laboratory, it is commonly recommended that 10% of a herd or a minimum of 5-10 animals be tested in order to have a higher probability of diagnosing a copper deficiency via serum quantification. Even with herd deficiency, low serum copper concentrations may only be seen in 10% or more of the individuals. Herds that may be classified as marginally deficient based on liver testing may have predominantly “normal” serum copper concentrations. Thus, serum copper analysis should be viewed as a screening method only. Another factor that can influence diagnosis of copper deficiency in serum is the presence of high serum molybdenum. As the copper-sulfur-molybdenum complex that forms is not physiologically available for tissue use, “normal” serum copper content in the presence of high serum molybdenum should always be considered suspect. In addition, the form of selenium supplementation can alter the normal range for interpretation of serum copper status, with selenite supplemented cows having a lowered normal range for serum copper. Excessive supplementation of copper in dairy cattle is a relatively common finding at the Utah Veterinary Diagnostic Laboratory. Liver copper concentrations greater than 200 ppm are routinely identified. But, in recent months, some cases of deficiencies have been identified, due to cessation of mineral supplementation programs.
The recommended adequate liver copper concentration range in adult cattle is 25 to 100 ppm. In comparison, late term fetal or neonatal liver should have 65 to 150 ppm copper to be considered normal. Manganese Deficiency Manganese deficiency in ruminants is associated with impaired reproductive function, skeletal abnormalities, and less than optimal productivity. Cystic ovaries, silent heat, reduced conception rates, and abortions are reported reproductive effects. Neonates that are manganese deficient can be weak, small, and develop enlarged joints or limb deformities. Manganese deficiencies in beef cattle are most commonly seen in areas of highly alkaline soils, due to much poorer plant uptake of manganese. Manganese deficiency, although not reported often, is identified routinely in dairy cattle when tested. Of interest is the fact that most testing of beef cattle (greater than 95%) finds normal manganese concentrations in liver, blood, and serum, but in these same matrices greater than 50%, 75%, and 95%,

31
respectively, of dairy cattle tested are below recommended normal concentrations (unpublished data, Utah Veterinary Diagnostic Laboratory). This may, in part, be due to high calcium and phosphorous content of dairy rations, which can be antagonistic to the bioavailability of manganese. Of the samples available, liver is the most indicative of whole body status, followed by whole blood and then serum. As red blood cells have higher manganese content than serum, hemolysis can result in increased serum content. Since the normal serum concentration of manganese is quite low, many laboratories do not offer this analysis because of inadequate sensitivity. Overall, response to supplementation has frequently been used as a means of verifying manganese deficiency, but it is critical that a bioavailable form be utilized. Selenium Deficiency As an essential mineral, selenium is commonly identified as deficient in ruminants, but infrequently in dairy cattle. Selenium deficiency is also identified in many non-ruminant species. Selenium deficiency is associated with reduced growth rates, poor feed efficiency, poor immune function, impaired reproductive performance, and damage to muscle tissues. “White muscle disease”, a necrosis and scaring of cardiac and/or skeletal muscle, is linked to severe selenium deficiency; although, it can be caused by vitamin E deficiency as well. Cows will do all they can to ensure adequate selenium is in calves when they are born. They will actually deplete their own body reserves to ensure neonatal adequacy. As such, neonates diagnosed with selenium deficiencies are proof of maternal deficiencies. With selenium being an essential component of the immune function, this maternal deficiency likely results in poor colostrums quality and inadequate neonatal protection even in calves that get adequate volumes of colostrums. Diagnosis of a deficiency can be made by analysis of liver, whole blood, or serum for selenium content or by analysis of whole blood for glutathione peroxidase, a selenium dependent enzyme, activity. The most specific analysis is that of whole blood glutathione peroxidase, as it verifies true functional selenium status. Liver is the optimal tissue to analyze for selenium content as it is a primary storage tissue. With serum and whole blood, the former better reflects recent intake, while the latter better reflects long term intake status. Since seleno-proteins are incorporated into the red blood cells when they are made and the cells have a long half-life, selenium content of whole blood is a better reflection of intake over the previous months than serum. In order to adequately diagnose selenium deficiency, the dietary form of the selenium intake by the animals is important. Natural selenium, predominantly in the form of selenomethionine is metabolized and incorporated into selenium dependent proteins, but can also be incorporated into non-specific proteins in place of methionine. Inorganic selenium is metabolized and predominantly incorporated into selenium dependent proteins. Thus, “normal” concentrations in serum and whole blood differ depending on whether the dietary selenium is a natural organic form or an inorganic supplement.
The recommended adequate liver selenium concentration range in adult cattle is 0.25 to 0.50 ppm. In comparison, late term fetal or neonatal liver should have 0.35 to 0.65 ppm selenium to be considered normal. Zinc Deficiency Zinc is an essential mineral that is required by all cells in animals. Zinc plays a role in numerous enzymatic reactions. Deficiencies of zinc are associated with reduced growth, poor immune function, diminished reproductive performance, and poor offspring viability, as well as skin lesions in severe cases. Tissue zinc concentrations do not reflect body status well. Of the common samples tested, liver and serum are the best indicators of zinc status. But, serum and liver zinc can be altered by age, infectious diseases, trauma, fever, and stress. Response to zinc supplementation has shown that some animals having

32
low-end normal liver or serum zinc can still show improvement in some clinical conditions. Thus, liver and serum only verify deficiency when these samples have very low zinc content. Vitamin A Deficiency Vitamin A is an essential fat soluble vitamin in ruminants. It is essential for all cell replications and is especially important in epithelial integrity. It plays an important role in tight junctions between cells, as well as being an important an antioxidant in the body and in mucosal secretions. Vitamin A deficiency is associated with poor growth rates, poor feed intake, poor immune function, poor reproductive performance, and high incidences of diarrhea in calves. Loss of efficient tight junctions in the epithelial cell lining of the digestive tract allows opportunistic pathogens to invade and cause disease. Vitamin A is provided in the diet via green growing vegetation or supplementation. Dead, brown forages have relatively no Vitamin A content. Thus, for grazing livestock, they must accumulate enough body reserves of vitamin A to carry them through the winter and have enough left to provide adequate vitamin A to their offspring. Therefore, it is more common to see vitamin A deficiencies in the springs after significant drought years, due to decreased time for body reserve accumulation. Unlike minerals, much of the vitamin A provided to the neonate is via the colostrums and in milk fats. Also, early calving has increased the incidence of neonatal vitamin A deficiencies due to lack of green forage at the time of parturition. Vitamin A analysis can be efficiently performed on serum or liver tissue. It is important that samples be stored frozen and protected from light to prevent degradation of the vitamin A. Vitamin E Deficiency
Vitamin E is an essential fat soluble vitamin in ruminants. It is essential for all cells as an important antioxidant in the body in conjunction with selenium. Vitamin E deficiency is associated with poor growth rates, poor immune function, poor reproductive performance, poor muscle function, poor cardiovascular function, and “white muscle disease”. Vitamin E is provided in the diet via green growing vegetation or supplementation. Dead, brown forages have relatively no Vitamin E content. Thus, for grazing livestock, they must accumulate enough body reserves of vitamin E to carry them through the winter and have enough left to provide adequate vitamin E to their offspring. Therefore, it is more common to see vitamin E deficiencies in the springs after significant drought years, due to decreased time for body reserve accumulation. Much of the vitamin E provided to the neonate is via the colostrums and in milk fats, although it is also transferred across the placenta. Also, early calving has increased the incidence of neonatal vitamin E deficiencies due to lack of green forage at the time of parturition. Vitamin E analysis can be efficiently performed on serum or liver tissue. It is important that samples be stored frozen and protected from light to prevent degradation of the vitamin E. Effects on Immune Status Deficiencies in vitamins and minerals have a two part impact on immune function in neonates. Firstly, since neonates are still developing their immune capabilities, these deficiencies have a direct negative impact on that development. And, indirect immune compromise is via the mother’s poor immune function. At the time in which it is essential that the mothers be immune competent in order to produce antibodies for the colostrums, they often are deficient due to depletion from movement to the fetus. Additionally, poor immune function at the time of vaccination can result in very poor vaccine response, which in turn results in poor immune memory and antibody production. Thus, herd deficiencies would be expected to result in poor colostrums quality. This poor quality equates to a higher incidence of disease in the offspring due to poor maternal protection. Often this is seen as high incidence of neonatal diarrheas and/or high incidence of neonatal/juvenile pneumonias.
33
Optimization of Supplementation There are three basic time periods in which it is critical that vitamin-mineral status is optimal. Firstly, since the majority of minerals are transferred to the fetus during the last trimester of gestation, the three months prior to parturition are essential for offspring to be born with adequate body reserves and leave the mothers with enough to have good immune status for colostrum production. Secondly, as these vitamin-mineral deficiencies play a significant role in reproductive health, the time period from parturition to breeding is critical to ensure that the mother’s system is replenished for optimal breed-back efficiency. And, thirdly, any time period in which animals are to be vaccinated, one must ensure adequate vitamin-mineral status in order to maximize response to vaccines. I routinely suggest that animals be on a well balanced vitamin-mineral supplementation plan for a minimum of 30 days prior to any vaccination. Summary A variety of samples can be tested for vitamin-mineral content, but may not provide any indication of the overall mineral status of the animal. Appropriate diagnosis of mineral status involves thorough evaluation of groups of animals. The evaluation should include a thorough health history, feeding history, supplementation history, and analysis of several animals for their mineral status. Dietary mineral evaluation should only be used augment the mineral evaluation of animal groups. If minerals are deemed to be adequate in the diet, but the animals are found to be deficient, antagonistic interactive effects of other minerals need to be investigated. As an example, high sulfur or iron can cause deficiencies in copper and selenium even when there are adequate concentrations in the diet. Overall, common vitamin-mineral deficiencies are significant hindrances to profitability in the livestock industry. Poor reproductive performance results in increased incidence of culling for open cows. Poorer than optimal feed efficiency and weight gain impact the bottom line in terms of pounds of cattle sales. And, poor calf health results in deaths and disease. The resultant increased disease incidence results in lost income in terms of treatment costs and poorer overall growth rates and gains in affected animals.

34

35

36

37

38

39

40

41

42
43

44

45

46

47

48

49

50

51

52

53

54

55

56

57
R. C. Atkin Inc. R.C. Atkin Inc. is a sixth generation family cattle ranch on the Arizona Strip. It began in 1868 when William Atkin was called by Brigham Young to go to St. George. The ranch originally began with a few sheep which were run on Black Rock Mountain. Two generations later, in the early 20’s and 30’s, Rudger Clawson Atkin and his two brothers had built the herd to 5,000. By 1945 the sheep had been sold and replaced by cattle. In that same year the business left Black Rock Mountain, purchased Larsen pond and been building the cattle ranch from there. Over the years the ranch has grown through the purchase of different homesteads and permits from various ranchers. Today the ranch is located on the Main street Allotment which encompasses a little over 200,000 acres (about 330 sections) of BLM, state, and private land. R.C. Atkin Inc. runs a year-round cow calf operation of 1700 Animal Units. On average the ranch runs around 1300 cows and 50 bulls. The breed of cattle has changed over the years from short Herefords to a moderate framed 1,100 pound crossbred cow (Saler, Hereford, and Angus). Cattle are the sole income for the ranch so a lot of management is put into raising heifers that are going to have the genetics to continually improve the herd and produce calves that will make a good return. The focus of the ranch is raising cattle but by far the best thing that has been produced in the past 142 years is kids; some of our own and many others that have worked alongside us.
Over the years there have been many miles covered moving cows and checking water. A few things that every generation has learned to appreciate are good horses and good trucks. If you knew Clayton Atkin very well you knew that he always had a good truck with good tires.
The majority of the land on the ranch is leased by the BLM. Therefore, there are many opportunities to work with government agencies and R. C. Atkin Inc. has had a lot of success with them over the years. Rangeland improvement projects have included railing trees, building ponds and catchments, and recently doing a lot of spike treatments. Regardless of how many improvements are made, everyone knows that it only takes one good rain storm to make a great manager out of anyone.
In this part of the country, as any rancher knows, we rely on the rain to water livestock and sustain grass. The ranch operates with 1 well, 13 catchments, and 154 ponds. Water can get tight at times but it is during such times that we have learned to have faith in God and the blessing of moisture will come.
Behind the title of R. C. Atkin Inc. lies a family legacy of ranchers who have loved and respected the land. Today it continues with families who still believe in the American dream and cherish the ranching way
of life.

58
Heifer Development on Rangeland
Jim Sprinkle
Area Extension Agent, Animal Sciences, University of Arizona Doug Tolleson
Assistant Extension Specialist, Range Management, School of Natural Resources & the Environment, University of Arizona Introduction Heifer development is one of the three largest expenses for beef cattle operations when the opportunity cost for retaining heifers is factored in. One can purchase replacement heifers of breeding size or develop their own heifers in the feedlot, farm dry lot, irrigated pasture, or on range. In some areas of the country, companies which develop ranchers’ heifers for a fee are available as well. The option one chooses depends upon the timetable desired for heifer replacements and the economics of each option for a particular operation. Unless hampered by a lack of good quality, inexpensive feed, there is usually a cost advantage in developing heifers from the herd instead of purchasing them. However, each replacement heifer being developed on the range will replace approximately 60% of a mature cow, lowering stocking rate during the grazing season. When the cost of a replacement program is considered, it may bring additional income to the operation if quality replacement heifers can be purchased at a reasonable price. Because of a lack of capital and concerns related to herd biosecurity and genetic progress, most producers choose to raise replacement heifers. There is an advantage in knowing the performance of selected females’ dams and the ability to more closely match replacement females to the particular environment. Computer programs or worksheets are available (Whittier and Miller, 2009; adapted from Willett and Nelson, 1992) which allow one to calculate the costs of buying vs. retaining replacement heifers http://www.csubeef.com/content/view/70/71/ . The traditional approach to heifer development has been “feed them to breed them” (Funston et al., 2007; Roberts et al. 2008). Research from the late
1960s through the early 1980s documented that in order to achieve puberty, heifers need to weigh around 60 to 65% of mature weight at breeding time (see Patterson et al., 1992 for a complete history). For British breeds this is around 650 to 700 lbs. at around 14 to 15 months, and for Continental breeds, 750 to 800 lbs. at the same age. (There are exceptions to this rule; a small percentage of heifers will be pubertal while still nursing). Achieving the type of weight gain following weaning to meet this goal is rather easy in the feedlot, dry lot, and possibly irrigated pasture, but can be rather difficult on rangelands with poor quality winter forage. The disadvantage with feedlot development is cost. Cost comparisons in Table 1 indicate that if replacement rangeland heifers weigh at least 450 lbs. at weaning and achieve at least an 80% conception rate, then overall herd profitability can be increased. Table 1 includes the value of the heifer at weaning but when just considering development costs without the value of the heifer, the costs for a 450 lb. heifer was $187 compared to $238 for a drylotted heifer (60 days) achieving 85% conception. For a 500 lb. heifer, the cost differential was $147 vs. $213.
Table 1. Cost Comparison for Heifer Development
$49,735$50,843$50,063$56,794Gross Profit less Replacement Cost for 150 Cow Herd with 450 lb. wwt**
$55,079$56,360$55,283$63,488Gross Profit less Replacement Cost for 150 Cow Herd with 500 lb. wwt**
$669$672$738$750Cost per Heifer with 500 lb. Weaning Weight*
$655$660$711$750Cost per Heifer with 450 lb. Weaning Weight*
Range Development with 70% Conception
Range Development
with 80% Conception
Range Development
with 60 d Drylot & 85%
Conception
Purchase all Bred Heifers
*Includes value for selling heifers not bred.** Includes value for 23 cull cows sold. Herds are 150 cows, 131 cows for drylot, 130 cows for 80%, 127 cows for 70%.
More recently, research has indicated that Bos taurus heifers can be developed to 55% of mature weight and still have acceptable conception rates at breeding (Patterson et al., 1991; Patterson et al., 1992; Funston and Deutscher, 2004; Funston et al., 2007; Roberts et al., 2008; Funston et al., 2009; Larson et al., 2009; Roberts et al., 2009; Whittier, 2009). Most likely, the improvement in conception with lighter weight Bos taurus has been influenced by genetic selection for puberty over the last several
59
decades by such genetic parameters as increased scrotal size in yearling bulls (shown to be genetically correlated to puberty characteristics of female progeny). Unfortunately, the progress made with Bos indicus heifers with respect to achieving puberty at lower body weights has not appeared to keep pace with their Bos taurus contemporaries. Limited research (Patterson et al., 1989, 1991) suggests that conception rates for Brahman x Hereford heifers developed to lighter body weights prior to breeding are lowered to such a point (at least 15 to 20% and sometimes more) to preclude any type of management program utilizing restricted feeding for replacement heifers. Bos indicus heifers have been genetically matched to environments with poor quality feed resources for much of the year and this appears to be genetically compensated for in part by increased age and size at puberty. A characteristic of heifer development programs on rangeland with limited supplementation is that heifers will be able to conceive at 55% of mature weight. Unless of sufficient size at weaning, it is our recommendation that Bos indicus heifers be developed to 60% of mature weight utilizing at least 60 to 90 days feeding in a drylot with improved rations. Range Limitations and Mitigation Some of the challenges with developing heifers on rangeland are as follows: 1. Not as Experienced in Grazing 2. Smaller Rumen 3. Reduced Forage Quality and Quantity in Winter 4. Reduced Growth with Poor Quality Winter Forage 5. 8 to 10% Less Pubertal at Breeding (Restricted
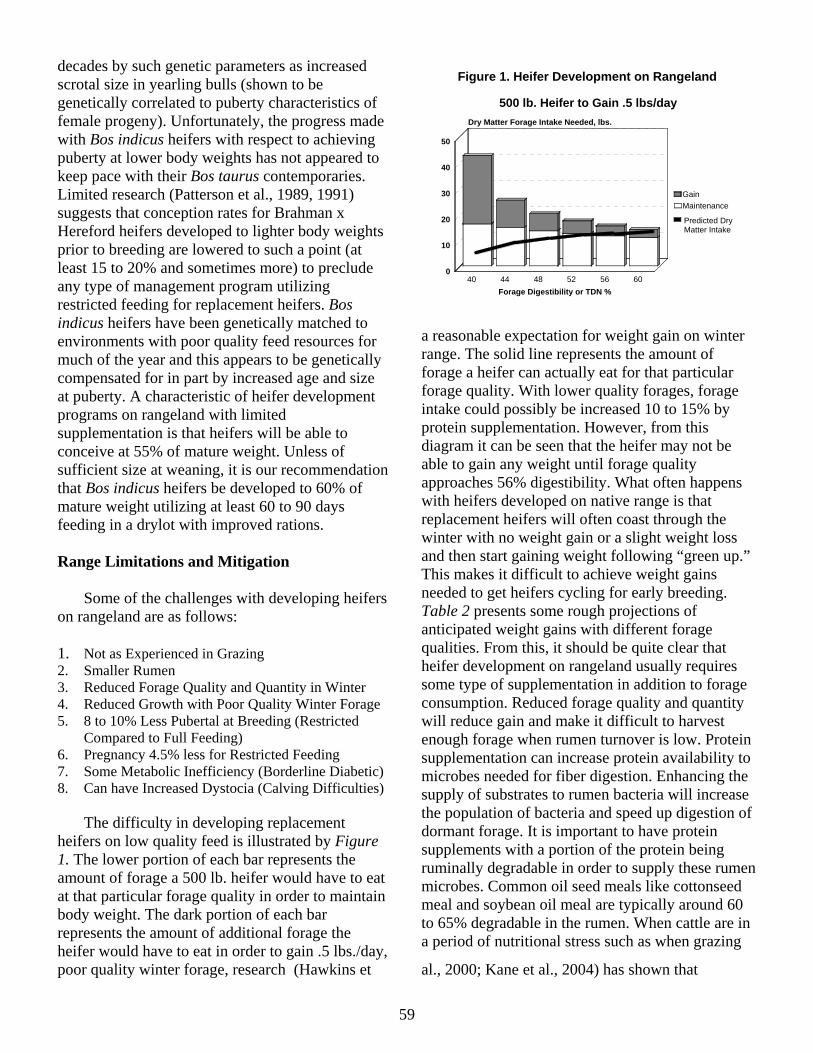
Compared to Full Feeding) 6. Pregnancy 4.5% less for Restricted Feeding 7. Some Metabolic Inefficiency (Borderline Diabetic) 8. Can have Increased Dystocia (Calving Difficulties) The difficulty in developing replacement heifers on low quality feed is illustrated by Figure 1. The lower portion of each bar represents the amount of forage a 500 lb. heifer would have to eat at that particular forage quality in order to maintain body weight. The dark portion of each bar represents the amount of additional forage the heifer would have to eat in order to gain .5 lbs./day,
a reasonable expectation for weight gain on winter range. The solid line represents the amount of forage a heifer can actually eat for that particular forage quality. With lower quality forages, forage intake could possibly be increased 10 to 15% by protein supplementation. However, from this diagram it can be seen that the heifer may not be able to gain any weight until forage quality approaches 56% digestibility. What often happens with heifers developed on native range is that replacement heifers will often coast through the winter with no weight gain or a slight weight loss and then start gaining weight following “green up.” This makes it difficult to achieve weight gains needed to get heifers cycling for early breeding. Table 2 presents some rough projections of anticipated weight gains with different forage qualities. From this, it should be quite clear that heifer development on rangeland usually requires some type of supplementation in addition to forage consumption. Reduced forage quality and quantity will reduce gain and make it difficult to harvest enough forage when rumen turnover is low. Proteinsupplementation can increase protein availability to microbes needed for fiber digestion. Enhancing the supply of substrates to rumen bacteria will increase the population of bacteria and speed up digestion of dormant forage. It is important to have protein supplements with a portion of the protein being ruminally degradable in order to supply these rumen microbes. Common oil seed meals like cottonseed meal and soybean oil meal are typically around 60 to 65% degradable in the rumen. When cattle are in a period of nutritional stress such as when grazing
poor quality winter forage, research (Hawkins et al., 2000; Kane et al., 2004) has shown that
Figure 1. Heifer Development on Rangeland
500 lb. Heifer to Gain .5 lbs/day
40 44 48 52 56 60
Forage Digestibility or TDN %
0
10
20
30
40
50
Dry Matter Forage Intake Needed, lbs.
Maintenance
Gain
Predicted Dry Matter Intake

60
providing a portion of the protein supplement in an undegradable or “bypass” form that escapes ruminal digestion by the microbes can reduce weight loss or slightly improve gain and enhance reproduction and puberty. It appears that a metabolic signal is involved with bypass protein which reduces futile energy dissipation cycles, insulin insensitivity, ketone synthesis, tissue breakdown, and severe glucose shortages (Hawkins et al., 2000). The ideal combination of ruminally degradable to undegradable protein is about 50:50 for cattle being supplemented in stressful conditions (Petersen, 2006). Feedstuffs high in bypass protein include feather meal, fish meal, and corn gluten meal. Table 3 lists the ingredients for a bypass protein supplement used by New Mexico State University. Managers developing heifers on rangelands should consider utilizing a bypass protein
supplement if heifers are 450 to 500 lbs when weaned. Using this type of supplement will help overcome some of the effects of reduced pubertal heifers and conception at breeding. Feed restriction or reduced intake can reduce the release of the reproductive hormones GnRH, FSH, and LH. The feeding of bypass protein at moderate levels has been shown to increase the release of both FSH and LH, leading to improved conception (Hawkins et al., 2000). It is important to remember however that more and more levels of bypass protein is not necessarily better. In a study done in New Mexico (Kane et al., 2004), heifers fed a high level of bypass protein (0.71 lbs. bypass protein, 2.5 lbs. 46% crude protein supplement; 61% bypass protein:39% ruminally degraded protein) had less FSH and LH amounts in the anterior pituitary gland
than did heifers either fed moderate (0.48 lbs. bypass protein, 2.5 lbs. 38% crude protein supplement; 50% bypass protein:50% ruminally degraded protein) or low levels (0.25 lbs. bypass protein, 2.5 lbs. 30% crude protein supplement; 34% bypass protein:66% ruminally degraded protein) of bypass protein. The moderate bypass supplement group also had improved FSH levels in the anterior pituitary when compared to the low bypass supplementation group. Based upon these data, it would seem that the 50:50 degradable to undegradable protein recommended by New Mexico State University is the ideal. In order to approximate the total amount of bypass protein for the moderate group, heifers should be fed no more than 3 lbs. per day of a 36% crude protein supplement with 50% bypass protein (3.00 lbs. X .36 X .50 = .54 lbs. bypass protein). Additional management actions that appear warranted in developing heifers on rangeland include using the best winter and early spring pastures for the heifers, using low birth weight EPD bulls, measuring pelvic areas at 12 months (should exceed 150 sq. cm) to cull heifers likely to have calving difficulty, and keeping 20% additional heifers than needed to account for reduced conception with lighter body weights. It is also helpful to have heifers at a reproductive tract score (LeFever and Odde, 1986) of 3 or greater at breeding. (No immature uterine tracts with less than 3/4" diameter uterine horns and no tone). Furthermore, it is also important to avoid nutritionally stressing replacement heifers after breeding and prior to calving. This will reduce growth in the pelvic opening and nullify attempts to manage for less calving difficulty. Compensatory Gain Following a period of nutritional stress, cattle frequently exhibit a period of compensatory gain when average daily gain exceeds what is expected. Research has shown that this is most likely due to reduced gastrointestinal tract and liver size (caused by the period of nutritional stress which makes these organs shrink). Coupled with this reduced gastrointestinal tract and liver size are reduced maintenance requirements (20% less for up to 90 days; NRC, 2000) for these high energy consumptive organs when they are shrunken in size
Table 3. Bypass Protein Supplement
36% crude proteinCottonseed Meal 33%Feather Meal 17%Fish Meal 5% Molasses 11%Ground Milo 24%

(Ferrell, 1988). At the same time maintenance requirements are reduced, appetite increases by at least 20%. If adequate forage quality and quantity is available in the spring following winter development of heifers on rangeland, spectacular gains can be made with replacement heifers prior to breeding. Several years’ data from Nebraska (Klopfenstein et al., 1999; Creighton et al., 2001) demonstrated the effects of compensatory gain with steers fed for a low rate of gain in the winter and then put on either bromegrass, warm season grass pastures, or rangeland for the summer. Figure 2 illustrates that summer daily gain for the steers fed to gain 0.7 lbs. during the winter was 50 to 60%
higher than that observed for steers fed to gain 1.75 lbs. during the winter. Forage intake during the summer following either low or high winter gains is reported in Figure 3. Steers fed at a low rate
Figure 3. Compensatory Gain of Steers on Rangeland
2.32
1.82
2.52
1.92
2.53
2.14
2.80
2.29
0.00
0.50
1.00
1.50
2.00
2.50
3.00
Bromegrass Summer Pasture Sandhills Range or Warm SeasonSummer Pastures
Forage Intake, % of Body Wt
Low Winter Gain, 0.7 lb/d (1996) High Winter Gain, 1.7 lb/d (1996)Low Winter Gain, 0.5 lb/d (1999) High Winter Gain, 1.5 lb/d (1999)
Klopfenstein et al., 1999 Nebraska Beef Cattle Reports http://digitalcommons.unl.edu/cgi/viewcontent.cgi?article=1411&context=animalscinbcr &Creighton et al., 2001 Nebraska Beef Cattle Reports http://digitalcommons.unl.edu/cgi/viewcontent.cgi?article=1290&context=animalscinbcrIn 1999, cattle grazed bromegrass first then warm season pastures during winter exhibited a compensatory level of summer intake on either cool or warm season grasses.
Examples of Range Heifer Development in the Southwest Researchers at New Mexico State University have been evaluating low vs. high input development of replacement heifers at the Corona Range and Livestock Research Center in central New Mexico (Hawkins et al., 2008). Annual precipitation is around 13 inches and elevation ranges from 5,701 to 6,720 feet. Vegetation includes varying cover of pinyon juniper with a understory of warm season grasses (blue grama, sideoats grama, hairy grama, sand dropseed, wolftail, threeawns, and black grama). Some of the first experiments were to compare traditional supplementation of 500 lb. heifers starting in November and extending to May to delayed supplementation with smaller amounts of protein supplement from November to January followed by full supplementation through May. The researchers determined that they could feed limited protein supplement from weaning to mid January (0.5 lbs./day fed once per week) followed by 2 lbs./day of bypass protein supplement (fed 2 or 3 times/wk.) to May with little reduction in heifer performance and body weight at breeding. The next experiments were to compare bypass protein supplementation to traditional cottonseed meal supplementation and to partial development in the feedlot. All heifers were placed on rangeland and fed 0.5 lbs./day (fed once/wk.) of a cottonseed meal supplement from October weaning until mid-January. From mid- January to mid-February, heifers developed on cottonseed meal and heifers that were to be placed in the feedlot received 2 lbs./day of cottonseed meal (fed 2 or 3 times/wk.) while the bypass heifers were placed on 2 lb./day (2 or 3 times/wk.) of 50%:50% degradable protein to bypass protein for that time period. In mid-February, feedlot heifers were moved to the feedlot for 90 days until mid-May. Heifers left on the ranch continued with their respective treatments until mid-May. Heifers were artificially inseminated once followed by a 45 day exposure to bulls. Results for two years of the study are shown in Table 4. As expected, the heifers developed in the feedlot were
Figure 2. Compensatory Gain of Steers on Rangeland
1.96
1.27
2.46
1.47
0
0.5
1
1.5
2
2.5
120 d SummerGrazing Period
62 d SummerGrazing Period
ADG, Lbs
Low Winter Gain, 0.7 lb/d High Winter Gain, 1.75 lb/d
Klopfenstein et al., 1999 Nebraska Beef Report http://digitalcommons.unl.edu/cgi/viewcontent.cgi?article =1411&context=animalscinbcr
5 years data

62
heavier at breeding time. However, there was no advantage in conception for these two years for feedlot heifers. Table 5 compares four years data for conception for rangeland heifers developed on bypass protein vs. those developed on cottonseed meal. There was a 14% increase in conception for bypass protein heifers over the traditional cottonseed meal developed heifers while both groups were similar in body weight. It indeed appears that feeding moderate levels of bypass protein alters metabolic functions and initiates signaling for reproductive hormones.
Table 6 presents the enterprise budget over 10 years at Corona for heifers developed in the feedlot vs. those developed on rangeland. Heifers developed on rangeland returned $62.82 more to the ranching operation than did the feedlot developed heifers. Heifer development on the Yavapai Ranch south of Seligman Arizona is more fully described in this proceedings by the ranch manager, James Linson. Heifers are weaned at 550 lbs., placed in a
drylot for 5 days until they get the bawl out, then placed in a fresh pasture that hasn’t had any grazing for a year. While in the drylot, heifers are trained to come to the horn to 32% protein cubes. Heifers remain separate from the cowherd during the entire development period. The first 60 days, heifers receive 0.5 lbs./day supplement (fed every other day), followed by 1 lb./day for 90 days (fed every other day) while it is wet and cold. For the last 30 days, heifers are increased to 2 lbs./day (fed every other day) of 32% protein in order to flush them prior to breeding. Heifers gain 0.5 lbs./day for 150 days then 1.5 lbs./day the last 30 days. The long term average for conception rate for these heifers is 85%. This has been achieved with 180 lbs. of total protein supplement for each heifer. Strategy Achieving acceptable weight gains on winter range in order to reach target weights for puberty can be a challenge. If weaned heifers weigh from 450 to 500 lbs. in late October and the target weight for breeding in June at 55% mature weight is 605 lbs., then heifers need to gain from 0.47 to 0.69 lbs. per day. If possible, gain which allows heifers to have at least one heat cycle before the breeding season starts will enhance fertility. By feeding bypass protein, one should be able to meet these target weights. If breeding earlier than June, amounts of protein supplement fed will need to be increased. Based upon computer modeling, published research, and limited diet quality data from NIRS fecal samples available for Arizona rangelands, expected weight gains were projected for
October/NovemberOctober/November
BypassBypass CSM onlyCSM only
531531 526526 528528
FeedlotFeedlot
JanuaryJanuary 580580 576576 578578
MarchMarch 605605 600600 629629
MayMay 634634 641641 712712
Pregnancy RatePregnancy Rate 97%97% 91%91% 81%81%
(n=42)(n=42)
Table 4. Cumulative Body Weights Table 4. Cumulative Body Weights and Pregnancy Ratesand Pregnancy Rates
(n=41)
Heifer body weight (lbs) and pregnancy data (2003 -04 & 2005-06)
(n=40)(n=40)
OctoberOctoberOctober
BypassBypassBypass CSM onlyCSM onlyCSM only
510 515 4.9510510 515515 4.94.9
+ SE++ SESE
JanuaryJanuaryJanuary 512 519 8.1512512 519519 8.18.1
MarchMarchMarch 543 547 9.3543543 547547 9.39.3
MayMayMay 565 573 10.4565565 573573 10.410.4
Pregnancy RatePregnancy RatePregnancy Rate 80% 66% P < 0.0580%80% 66%66% P < 0.05P < 0.05
(n=117)(n=117)(n=117)
Table 5. Cumulative Body Table 5. Cumulative Body Weights and Pregnancy RatesWeights and Pregnancy Rates
(n=122)(n=122)
Heifer body weight (lbs) and pregnancy data (four years)Heifer body weight (lbs) and pregnancy data (four years)
Table 6. Enterprise Budget, 10 yr. Avg.
Item High input Low input
Conception, % 88 71
Value at weaning 446.35 446.35
Total Costs 765.44 708.40
Gross Income 793.16 798.96
Net Income 27.72 90.54

63
replacement heifers using the following values for TDN from October to September of the following year: 59.56, 60.03, 60.04, 58.60, 60.17, 61.50, 62.00, 61.00, 59.00, 61.00, 62.00, and 62.00. These projections are displayed in Figures 4 and 5.
Figure 4. Heifer Development, 1100 lb. Mature Wt.
Heifer Weight, Lbs.
400
500
600
700
800
900
Oct
ober
Novem
ber
Decem
ber
Janua
ry
Febru
ary
Mar
chApr
il
May
June
July
August
Septe
mbe
r
Range: MinimalSupplement*
Range: MoreSupplement**
Range & 60 dDrylot
Breeding Target, 605 lb., 55% mature wt.
*0.5 lbs. suppl./d for 60 d then 2 lbs. suppl./d for 90 d**2 lbs. suppl./d for 30 d then 3 lbs. suppl./d for 90 d then 2 lbs suppl./d for 30 dRange/Drylot has 2 lbs. suppl./d for 30 d then 3 lbs. suppl./d for 30 d then 60 d drylot then 2 lbs. suppl./d for 30 d
450 lb. weaning wt.
Unless heifers weigh at least 450 lbs. at weaning, it is not possible to develop heifers on rangeland for late spring breeding without some time being spent in a drylot with an improved ration. If a 450 lb. heifer is fed minimum supplement over the winter following the New Mexico example, she would not achieve the target breeding rate until late summer or early fall (Figure 4). By feeding 180 lbs. more supplement over the winter, the 450 lb. heifer could achieve the targeted breeding weight by June.
Figure 5. Heifer Development, 1100 lb. Mature Wt.
Heifer Weight, Lbs.
400
500
600
700
800
900
Oct
ober
Novem
ber
Decem
ber
Janua
ry
Febru
ary
Mar
chApr
il
May
June
July
August
Septe
mbe
r
Range: MinimalSupplement 500WWT*
Range: 510WWT NMSU**
Range: YavapaiRanch 550 lb.WWT
Breeding Target, 605 lb., 55% mature wt.
*0.5 lbs. suppl./d for 60 d then 2 lbs. suppl./d for 90 d for a total of 210 lbs. suppl. fed**0.5 lbs. suppl./d for 90 d then 2 lbs. suppl./d for 120 d for a total of 285 lbs. suppl fedYavapai Ranch has 0.5 lbs. suppl./d for 60 d then 1 lbs. suppl./d for 90 d then 2 lbs. suppl./d for 30 d total of 180 lb.
It is easier to achieve the targeted breeding weight for heifers weighing 500 lbs. or more at weaning. Figure 5 presents expected performance for the Yavapai Ranch heifers weaned at 550 lbs., the NMSU heifers weaned at 510 lbs., and a heifer modeled for Arizona conditions weaned at 500 lbs. Supplementation for the Arizona heifer was halted in mid March with 75 lbs. less supplement being
fed than with the NMSU example. More supplement was modeled for being fed during early winter for the Arizona heifer. Both the NMSU and the Arizona heifers achieved the targeted breeding weight by May while the Yavapai Ranch heifer achieved breeding weight by April. Figure 6 presents the amount of supplement needed to develop heifers on rangeland varying in weaning weight from 450 to 550 lbs. Costs increase substantially as weaning weights decline to 450 lbs. As mentioned previously, it is not likely that heifers weighing 400 lbs. or less at weaning can be developed in a timely fashion for spring or early summer breeding without some time spent in a drylot.
Figure 6. Heifer Development on Rangeland
390
210180
0
50
100
150
200
250
300
350
400
Lbs. Protein Supplement Needed
450 lb. Weaning Wt.
500 lb. Weaning Wt.
550 lb. Weaning Wt.
1100 lb. Mature Weight, Breeding at 55% of Mature Weight450 lb. weaning wt at breeding weight in June, 500 lb. in May, 550 lb. in April
The following strategy is proposed for developing 450 to 500 lb. Bos taurus heifers on rangeland: I. 500 lb Weaning Weight a. Feed 0.5 lb supplement for 60 d and evaluate b. Feed 2.0 lb bypass protein for 30 d and evaluate c. If BCS good, continue 2.0 lb bypass protein for 30 d & evaluate d. If BCS not good, feed 3 lb bypass protein for 30 d & evaluate e. Middle February, evaluate BCS and winter conditions
If good, feed 2 lb. bypass protein for 30 more d If poor, feed 3 lb. bypass protein for 30 more d
f. Middle March, evaluate BCS and feed availability If poor, feed 2 lb. bypass protein for additional 30 d
II. 450 lb Weaning Weight a. Feed 2.0 lb supplement for 30 d b. Feed 3.0 lb bypass protein for 60 d and evaluate c. If BCS good and feed good, continue 3.0 lb bypass protein for 30
d and evaluate d. If BCS not good, bring heifers into drylot for 60 d e. Middle February, evaluate winter conditions
If good conditions, feed 2 lb bypass protein for 30 more d If poor conditions, feed 3 lb. bypass protein for 30 more d If BCS and winter conditions both poor, bring heifers into
drylot f. Middle March, evaluate BCS and feed availability
If poor, feed 2 to 3 lb bypass protein for additional 30 d

64
Since you will probably have to supplement your replacement heifers to achieve desired weight gains before breeding, you may want to consider adding an ionophore (Rumensin® or Bovatec®) to the protein supplement. In a review in the Oct. 21, 1996 issue of Feedstuffs, Huntington reported that grazing ruminant animals supplemented with ionophores had increased nitrogen digestibility and 6% greater weight gains than controls. These findings were determined on more than 2,000 cattle in over 30 studies. An additional advantage which has been observed by feeding Rumensin® to replacement heifers may be inducement of puberty at an earlier age (Lalman, et al., 1993). Conclusion
It is worth your while to do a financial analysis regarding heifer development on your ranch. Computer spreadsheets are available online for this purpose or you may contact the authors of this paper. We also have spreadsheets available for calculating daily gain on rangeland with varying amounts of supplement and differing forage quality. When replacement heifers are selected at weaning, weigh the heifers and then determine how much weight heifers will need to gain by breeding time. Next, count the number of days until the start of breeding time and calculate average daily gain needed. Target weights for heifers should be achieved at least one heat cycle (21 days) prior to the start of breeding season. It is to your advantage to select heavier heifers (at least 450 to 500 lbs.) so that the desired weight gain can be achieved without excessive cost. With recent advances in genetic progress, it is possible to develop Bos taurus heifers on rangeland to a lower percentage (55%) of mature weight and still achieve acceptable conception rates. Brahman cross cattle and heifers weighing less than 450 lbs. at weaning will most likely require some feeding time in a drylot in order to achieve acceptable conception rates. If developing heifers in the feedlot, tailor the heifer development program so that the feeding program will accommodate the desired weight gains without allowing heifers to get too fat. If heifers gain weight too rapidly (try not to exceed 2 lbs. ADG in the feedlot), it will increase
feed costs and decrease lifetime productivity due to excessive fat deposition in the udder. Feeding tables are available from the National Research Council or your local Cooperative Extension office which will predict the nutrient requirements needed for your heifer development feeding program. When developing heifers on rangeland, feeding bypass protein should be considered to enhance puberty and reproduction. Keep the total amount of bypass protein to no more than around 0.5 lbs./day (3 lbs. of a 36% crude protein ration with 50% bypass protein). Keep mineral supplements out to heifers according to mineral deficiencies in your area by season of the year. Certain areas of Arizona are deficient in selenium, copper, or zinc and most areas will be deficient in phosphorus when forage is dormant. If you need help in balancing rations for your forage base, contact your local extension office. Using low birth weight EPD bulls is an integral part of heifer development on rangeland. Having heifers in good body condition for breeding and selecting for adequate pelvic area are also good management practices to follow. Allowing heifers access to high quality winter pastures separate from the cowherd can aid in achieving desired weight gains. The bottom line is to achieve target breeding weights and ages in replacement heifers at breeding time. Combined with genetic selection for puberty, applying good management practices, and using bypass protein, heifer development on rangelands can be cost effective. Optimum conception rates on rangeland (rather than maximum conception rates in the feedlot) can bring more profitability into the herd, saving $40 to $50 per head in heifer development costs. An additional advantage to low input heifer development is that offspring from heifers and cows fed for reduced winter feed (as opposed to maximal inputs) appear to be programmed in utero for reduced maintenance and may actually be retained longer in the herd (Roberts et al., 2008).
Literature Cited
Creighton, K., M. Ullerich, and T. J. Klopfenstein. 2001. Undegradable intake protein supplementation of compensating grazing steers. 2001 Nebraska Beef Report pp 34-36. Available at http://digitalcommons.unl.edu/cgi/viewcontent.cgi?article=1290&context=animalscinbcr Accessed March 5, 2010.

65
Ferrell, C. L. 1988. Energy metabolism. In: D. C. Church (Ed.) The Ruminant Animal: Digestive Physiology and Nutrition. pp 250-268. Prentice-Hall, Englewood Cliffs, NJ.
Funston, R. N. and G. H. Deutscher. 2004. Comparison of
target breeding weight and breeding date for replacement beef heifers and effects on subsequent reproduction and calf performance. J. Anim. Sci. 82:3094-3099.
Funston, R., J. Martin, and A. Roberts. 2007. Heifer
development – then and now. Proc. Range Beef Cow Symposium XXI. 7 pp. December 1-3, 2009, Casper WY.
Available at: http://digitalcommons.unl.edu/rangebeefcowsymp/13/ .
Accessed March 20, 2010. Funston, R., J. Martin, and A. Roberts. 2009. Extensive heifer
development systems. Proc. Range Beef Cow Symposium XXI. pp. 22-27. December 1-3, 2009, Casper WY.
Havstad, K.M., and D. E. Doornbos. 1987. Effect of
biological type on grazing behavior and energy intake. In: M. K. Judkins, D. C. Clanton, M. K. Petersen, and J. D. Wallace (Ed.) Proc. Grazing Livest. Nutr. Conf. pp 9-15. Univ. of Wyoming, Laramie.
Hawkins, D. E., M. K. Petersen, M. G. Thomas, J. E. Sawyer,
and R. C. Waterman. 2000. Can beef heifers and young postpartum cows be physiologically and nutritionally manipulated to optimize reproductive efficiency? Proc. Am. Soc. Anim. Sci., 1999. Available at: http://www.asas.org/symposia/9899proc/0928.pdf . Accessed March 2, 2010.
Hawkins, D. E., K. K. Kane, S. Cox, and M. K. Petersen.
2008. Low versus high input development of replacement heifers. Proceedings Corona Range and Livestock Research Center Field Day. Available at: http://coronasc.nmsu.edu/documents/hhawkins-hiefer-input-crlrc-08.pdf . Accessed March 20, 2010.
Huntington, G. B. 1996. Grazing ruminant response to
ionophores affected by management, environment. Feedstuffs. October 21, 1996.
Kane, K. K., D. E. Hawkins, G. D. Pulsipher, D. J. Denniston,
C. R. Krehbiel, M. G. Thomas, M. K. Petersen, D. M. Hallford, M. d. Remmenga, A. J. Roberts, and D. H. Keisler. 2004. Effect of increasing levels of undegradable intake protein on metabolic and endocrine factors in estrous cycling beef heifers. J. Anim. Sci. 83:283-291.
Klopfenstein. T. J., D. J. Jordon, I. G. Rush, and T. Milton.
1999. Predicting amount of compensatory gain. 1999 Nebraska Beef Report pp 26-28. Available at: http://digitalcommons.unl.edu/cgi/viewcontent.cgi?article=1411&context=animalscinbcr . Accessed March 5, 2010.
Kronberg, S. L., K. M. Havstad, E. L. Ayers, and D. E. Doornbos. 1986. Influence of breed on forage intake of range beef cows. J. Range Manage. 39:421-423.
Lalman, D. L., M. K. Petersen, R. P. Ansotegui, M. W. Tess,
C. K. Clark, and J. S. Wiley. 1993. The effects of ruminally undegradeable protein, propionic acid, and monensin on puberty and pregnancy in beef heifers. J. Anim. Sci. 71:2843-2852.
Larson, D. M., A. S. Cupp, and R. N. Funston. 2009.
Extending grazing in heifer development systems decreases cost without compromising production. Proc. West. Sec. Amer. Soc. Anim. Sci. 60:67-71.
LeFever, D. G. and K. G. Odde. 1986. Predicting reproductive
performance in beef heifers by reproductive tract evaluation before breeding. pp 13-15. CSU Beef Program Report, Colorado State University, Fort Collins.
NRC. 2000. Nutrient Requirements of Beef Cattle. (7th Ed.).
National Academy Press, Washington, DC. Patterson, D. J., L. R. Corah, G. H. Kiracofe, J. S. Stevenson,
and J. R. Brethour. 1989. Conception rate in Bos Taurus and Bos indicus crossbred heifers after postweaning energy manipulation and synchronization of estrus with melengestrol acetate and fenprostalene. J. Anim. Sci. 67:1138-1147.
Patterson, D. J., L. R. Corah, J. R. Brethour, M. F. Spire, J. J.
Higgins, G. H. Kiracofe, J. S. Stevenson, and D. D. Simms. 1991. Evaluation of reproductive traits in Bos Taurus and Bos indicus crossbred heifers: Effects of postweaning energy manipulation. J. Anim. Sci. 69:2349-2361.
Patterson, D. J., R. C. Perry, G. H. Kiracofe, R. A. Bellows, R.
B. Staigmiller, and L. R. Corah. 1992. Management considerations in heifer development and puberty. J. Anim. Sci. 70:4018-4035.
Petersen, M. K. 2006. Strategic low cost supplementation.
Proc. West. Sec. Amer. Soc. Anim. Sci. 57:3-6. Roberts, A. J., E. E. Grings, M. D. MacNeil, R. C. Waterman,
L. Alexander, and T. W. Geary. 2008. Implications of going against the dogma of feed them to breed them. Proc. West. Sec. Amer. Soc. Anim. Sci. 60:85-88.
Roberts, A. J., T. W. Geary, E. E. Grings R. C. Waterman, and
M. D. MacNeil. 2009. Reproductive performance of heifers offered ad libitum or restricted access to feed for a one hundred forty-four day period after weaning. J. Anim. Sci. 87:3043-3052.
Sprinkle, J. E. 1992. Fecal output of different biological types
of beef cattle on native range throughout a production year. M. S. Thesis. Montana State University, Bozeman.

66
Wagner, M. W., K. M. Havstad, D. E. Doornbos, and E. L. Ayers. 1986. Forage intake or rangeland beef cows with varying degrees of crossbred influence. J. Anim. Sci. 63:1484-1490.
Whittier, J. C. 2009. Profitable cow and heifer pregnancy
rates. Proc. Range Beef Cow Symposium XXI. 7 pp. December 1-3, 2009, Casper WY. Available at: http://www.rangebeefcow.com/2009/documents/Whittier2009RBCSproceed.pdf . Accessed March 20, 2010.
Whittier, J. C. and K. Miller. 2009. Comparing purchasing -
vs- raising beef replacement females Excel spreadsheet. Available at: http://www.csubeef.com/content/view/70/71/ . Accessed March 19, 2010.
Willett, G. S., and D. D. Nelson. 1992. Raise or buy
replacements? Washington State Cooperative Extension Bulletin No. 1710., Department of Agricultural Economics, Hulbert Hall, Washington State University, Pullman, WA 99164-6210.
Any products, services, or organizations that are mentioned, shown, or indirectly implied in this publication do not imply endorsement by The University of Arizona.

a 500 lb. medium frame heifer with no supplementation, approximate Mcal ME required for maintenance=10.64/day. b TDN=total digestible nutrients, ME=metabolizable energy, Mcal=megacalories (1,000,000 calories), Neg=net energy for gain. Each 1 lb. of gain
requires 2.1 Mcal of Neg. Neg is energy available for gain after satisfying maintenance demands. c Estimates of forage intake at different forage digestibilites are best guesses based upon trends from the following research: Kronberg et al., 1986;
Wagner et al., 1986; Havstad and Doornbos, 1987; and Sprinkle, 1992. d Gain will probably be greater due to greater forage intake at this forage quality. If a heifer ate 13 lbs. of forage/day, average daily gain will be
approximately .4 lbs./day. High growth potential cattle may exceed this gain projection. Compensatory gain following a period of nutrient restriction will also include lower maintenance requirements and increased intake.
Issued in furtherance of Cooperative Extension work, acts of May 8 and June 30, 1914, in cooperation with the U.S. Department of Agriculture, James A. Christenson, Director, Cooperative Extension, College of Agriculture & Life Sciences, The University of Arizona. The University of Arizona is an equal opportunity, affirmative action institution. The University does not discriminate on the basis of race, color, religion, sex, national origin, age, disability, veteran status, or sexual orientation in its programs and activities.
Table 2. Forage Quality and Heifer Weight Gains a
TDN, %b ME,Mcal/lb. forageb Neg,Mcal/lb.forageb Est. forage intake lbs./dayc Est. weight loss or gain lbs./day
40 .66 .03 6.0 -4.2
42 .69 .07 6.0 -4.1
44 .72 .10 7.0 -3.5
46 .75 .13 8.5 -2.7
48 .79 .16 9.5 -2.0
50 .82 .19 9.5 -1.8
52 .85 .22 10.0 -1.3
54 .89 .25 10.0 -1.2
56 .92 .28 11.0 -.3
58 .95 .31 11.0 -.1
60 .98 .33 11.5 +.10d

68
Heifer Development on Yavapai Ranch
BACKGROUND My name is James Linson. I’m 61 years old, going on 40. Ha! I’ve been in the cattle
industry all my life. I’ve managed large and small operations over the years in New Mexico, Texas and now, in Arizona. I’m now managing the Yavapai Ranch in northwestern Arizona and have done so for the past five years.
Selecting and Training Yearling Replacement Heifers
You need to pick your replacements at weaning so you can start them on a feed program of your choice and put them on a preventive vaccination program for diseases such as Brucellosis, Lepto-Vibrio, and Trich. Pick them by age (older calves), confirmation, disposition and color. If you’re like me, I have a hard time picking the best heifers at weaning, so I like to pick at least 20% more heifers than I will actually need to bring cow herd numbers back where I want them. This 20% will make up for the heifers that don’t breed and the ones you do not like at preg testing time. We wean our calves at about 8 months of age, in the fall. We will wean the calves and then sort off the heifers we want to keep for replacements and start them on a feed program in a pen of their own. We wean them for about five days, then put them on grass in a pasture that has not been used for a whole year, so they have plenty of roughage to go with their protein. This saves on the cost of more hay than you need and gets them out of the dusty corral quicker, to help prevent sickness.
We usually start our heifers on 32% protein cubes in the corral, using a pickup with a horn so that the heifers will learn to come to the pickup and horn for their feed. That way, when you go to pasture, they are trained to come to the horn for their feed. We like to train them while they’re still in the corral by moving them around on horseback so that they get used to a horse and cowboy being around them. This helps keep them quiet and easier to handle in the pasture. Another thing that you can do while the heifers are in the weaning corral, if they are going to be on a hot fence in the pasture, is put a hot fence up inside the corral fence and train them to respect it. Feeding
We keep quite a few replacements every year – anywhere from 50 to 100 head. Like I said before, training your heifers in the corral at weaning is a real help in increasing gain. There are a lot of ways to feed your replacements and types of feed to use. I think these decisions should be made according to what you’re going to do with them when they leave the corral. We put our replacements on grass and start feeding them about one pound of 32% cottonseed cubes every other day. Feeding every other day gives the heifers time to go out and graze more roughage. I feel that if you feed every day, the heifers will stay on feed ground instead of grazing. I like to increase their feed about 30 days before putting the bulls out with them, to increase their energy for breeding. I usually increase to a pound per day, but still feed every other day.

69
Methods There are several different methods of feeding cattle. The one I described above works
best for us because of the size of pastures and the terrain. By using cubes, we can feed them on the ground in whatever area of pasture they are grazing at the time instead of having them come all the way in to one feeding area. If we used one feeding area, some of them would have to travel over a mile to feed. That would cut down on gain and growth, which is what we are looking for. Gains
If our replacement heifers weigh 550 pounds at weaning time, I figure they lose about 5% of weaning weight (for our heifers, 25 pounds), even on hay and cubes. This is due to the walking and bawling they do. If we start feeding a half pound of 32% cubes per head per day for the first 60 days, they will gain about 30 pounds, which is ½ pound per day. We then increase their feed to one pound per day for the cold and hopefully wet times. If it is not too cold or too much snow, they will continue to gain ½ pound per day for about 90 days or about 45 pounds.
Since we put our bulls out April 1st, we will start feeding them 2 pounds per day to build up their energy for breeding. They will gain about 1 ½ pounds per day for30 days, which is 45 pounds. They say a heifer needs to weigh half as much as they will when full grown. An Angus cow will weigh between 1000 and 1200 pounds. So, if your replacement heifers weighed 550 at weaning and lost 25 pounds, you’re starting your gain at 525 pounds. If you gain 30 pounds the first 60 days, 45 the next 90 days and 45 for the last 30 days before breeding, they should weigh about 645 pounds, which is a little over half of a 1200 pound cow. Summary
There are several different ways of growing replacement heifers out. I described our way, which seems to work well for us. When I came to the Yavapai Ranch, cow numbers were way down, about half. I’ve had to keep a lot of replacement heifers in the last five years. By using this system, I have increased the percentage of bred heifers from 50% to about 85%. This last year our breeding percentage was 92%. So, this way of growing replacement heifers seems to work well and doesn’t cost an arm and a leg. Good luck. James R. Linson, Mgr.

70

71

72

73
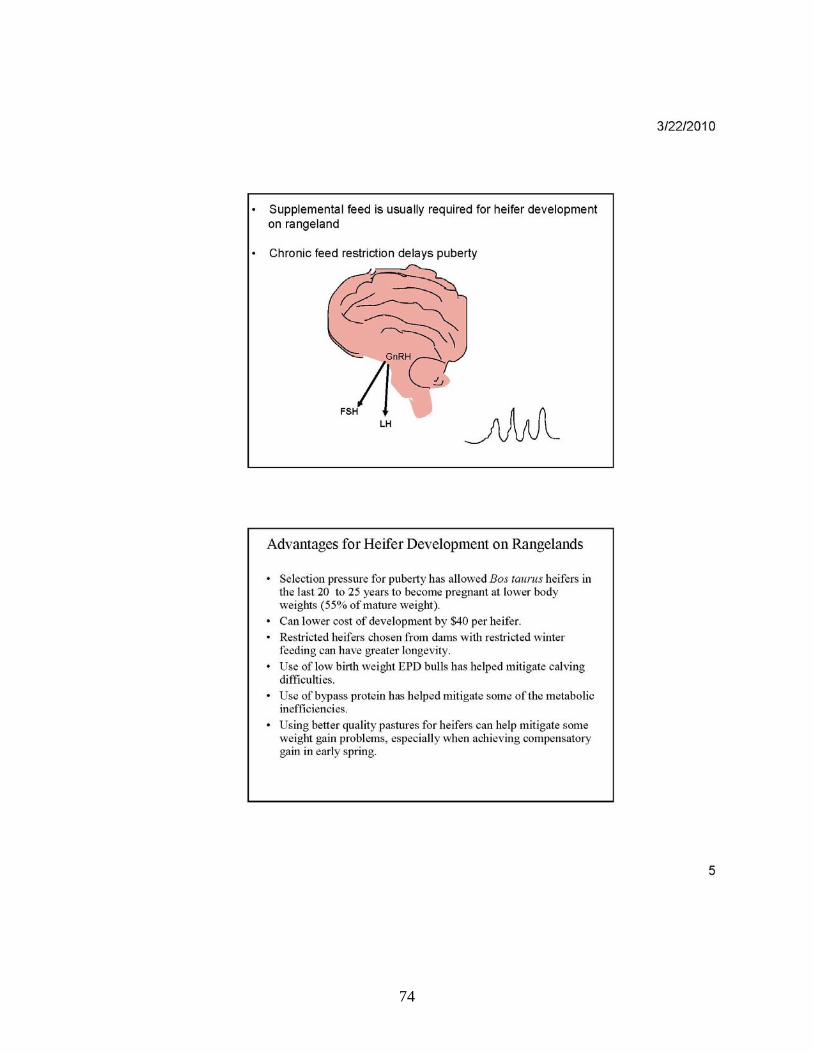
74

75

76

77

78
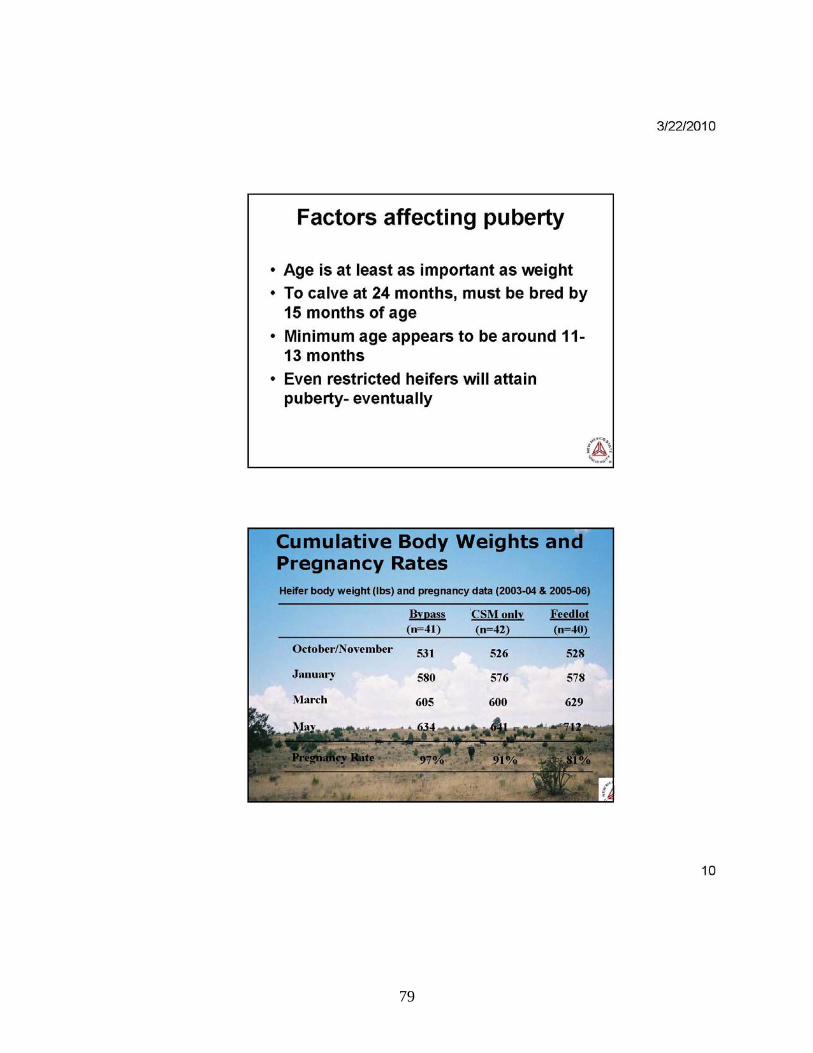
79

80

81

82

83

84

85

86
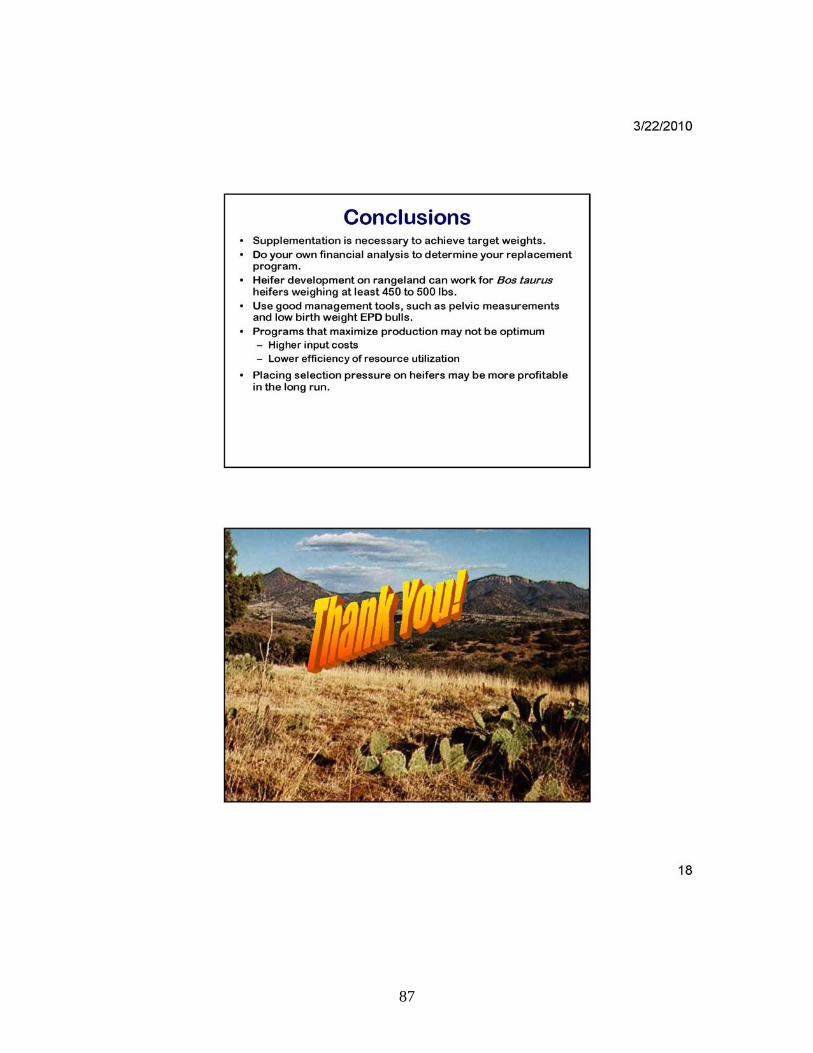
87

88
2010 AZ/UT Range Livestock Workshop
Risk Management and Marketing Club Introduction: Each producer who decides to join the club will receive 250 head of steer calves. There will be two cattle herd options and the costs for the calves will be based on the type of cow herd selected:.
1) Cross bred, red-hided cattle, low input operation, 80% calf crop, calves wean at 450 lbs 2) Solid black Angus X bred cattle, high input operation, 92% calf crop, calves wean at 650
lbs Input costs will be provided so that everyone is using the same cost factors. The idea of this exercise is to explore marketing alternatives and to try and pick the alternative(s) that will maximize net returns. You can sell all calves using one alternative, or split sales evenly into two different alternatives. (While we recognize this may not result in truck load lots, for simplicity sake, that is how the game will be played.) All sales are final; there will not be any “No sales”.
Marketing/Pricing Dates and Alternatives 1. Cash Forward Contract, July 5-9, 2010. Sell on Superior Livestock auction “Week in the Rockies” on July 5-9 2010, in Steamboat Springs Colorado for Nov. 1 delivery. Your price will be average actual sale price for that type of Utah cattle sold at the sale. 2a. Forward Price on July 7 by selling 1-3 CME Nov. Feeder Cattle Contracts. 2b. Forward Price on July 7 by purchasing 1-3 CME Nov. Feeder Cattle Put Options 2c. Forward Price on July 7 by purchasing LRP Feeder Cattle Insurance. 3. Cash Forward Contract, August 2-6, 2010. Sell on Superior Livestock auction “Video Royale” on August 2-6 2010, in Winnemucca Nevada. 4a. Forward Price on August 4 by selling 1-3 CME Nov. Feeder Cattle Contracts. 4b. Forward Price on August 4 by purchasing 1-3 CME Nov. Feeder Cattle Put Options 4c. Forward Price on August 4 by purchasing LRP Feeder Cattle Insurance. 5. Sell on the cash Market November 2, 2010 at the Salina Utah Producers Livestock Sale auction. Sale prices will be determined from the November 2 sale prices distributed through AMS. The calves will each be priced according to weight and type based on actual sale data. This is the default option. If you do nothing, all of your calves will be sold at this time. 6. On Nov. 2, if you chose either alternative 2 or 4, then those futures or options will be offset, and any indemnity from the insurance positions will be determined. Participating in alternatives 2 or 4 does not imply that the calves must be sold on Nov 2. They can still be retained in a feeding program. 7. On Nov 2, choose to Retain Ownership of your calves at your ranch until January 10, 2011. The calves will gain 100 lbs (1.4 lb adg) and be sold at the Salina Utah Producers Livestock Sale auction. Sale prices will be determined from the November 2 sale prices distributed through AMS. 8a. Forward Price on November 2 by selling 1-3 CME Jan. Feeder Cattle Contracts. 8b. Forward Price on November 2 by purchasing 1-3 CME Jan. Feeder Cattle Put Options 8c. Forward Price on November 2 by purchasing LRP Feeder Cattle Insurance.

89
9. On Nov 2 choose to Retain Ownership of lighter, red-hided calves by sending them to Kansas to graze wheat pastures for 150 days. Calves gain 300 lbs. (2 lb adg). Sell at the Dodge City, Kansas Auction on March 30, for the average market price for that weight of cattle. 10a. Forward Price on November 2 by selling 1-3 CME Mar. Feeder Cattle Contracts. 10b. Forward Price on November 2 by purchasing 1-3 CME Mar. Feeder Cattle Put Options 10c. Forward Price on November 2 by purchasing LRP Feeder Cattle Insurance. 11. On Nov 2 choose to Retain Ownership of heavier, Angus X calves by sending them to a Kansas feedlot for finishing for 180 days. Calves gain 600 lbs (3.33 lb adg). Sell on the average 5-market live price for the last week of April. (Since this will be after the 2011 AZ/UT Range Livestock meetings, Dr Feuz will use the futures market on April 1 and historical basis data to predict this sale price to be able to evaluate this alternative at next year’s meeting.) 12a. Forward Price on November 2 by selling 1-3 CME Apr. Live Cattle Contracts. 12b. Forward Price on November 2 by purchasing 1-3 CME Apr. Live Cattle Put Options 12c. Forward Price on November 2 by purchasing LRP Live Cattle Insurance. 13. March 30 all Futures, Options, or Insurance contracts from either 10 or 12 will be offset and net returns will be determined. All marketing, pricing, or retained ownership decisions must be made prior to the date of the decision. For example, if you want to sell on the 2nd video sale, you must notify me prior to August 2, or if you choose to retain ownership, you must notify me prior to November 2. About 10 days before each marketing/pricing date, you will receive via email a market update and projections for that alternative. Good Luck and have fun. If you have any questions, contact: Dillon Feuz Kevin Heaton 435-797-2296 435-676-1117 [email protected] [email protected]

90

91
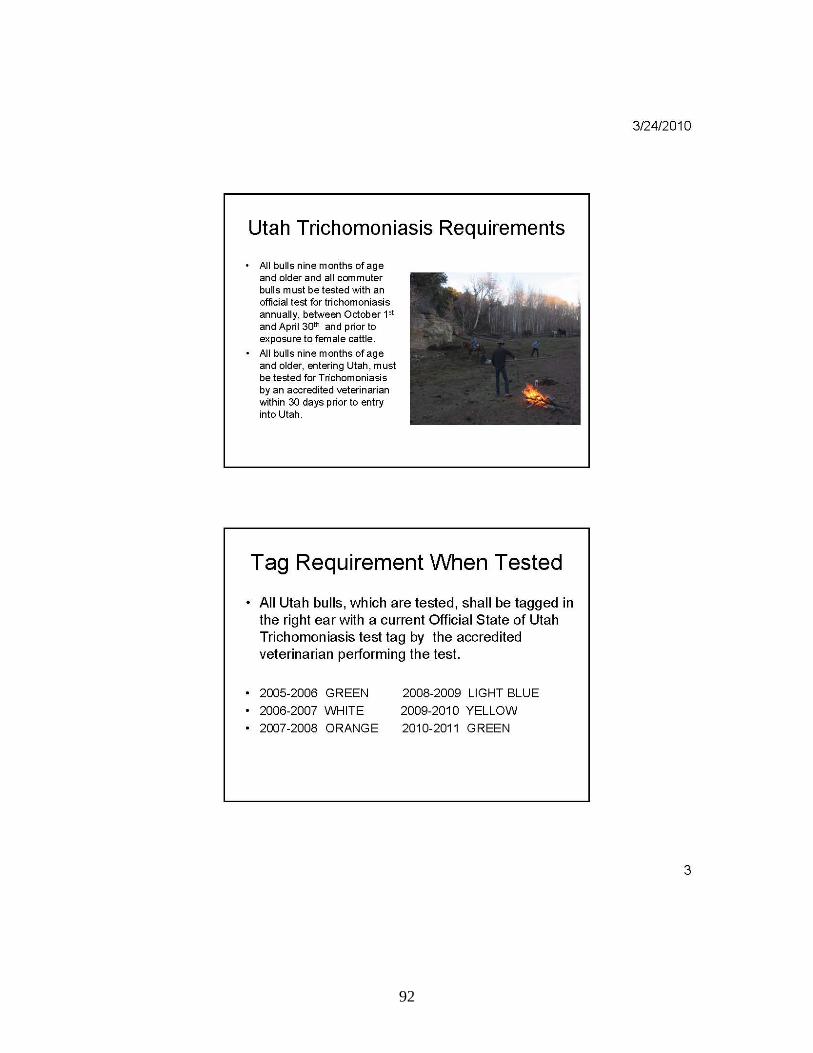
92
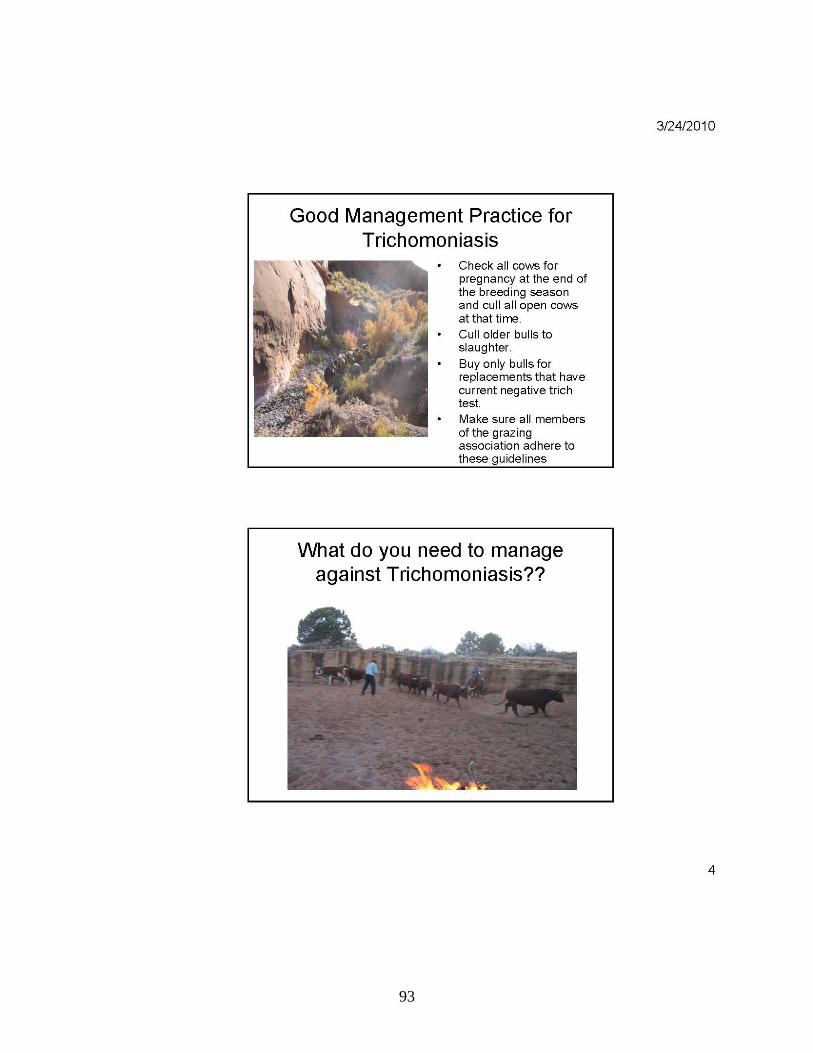
93

94

95