Embed Size (px)
Citation preview
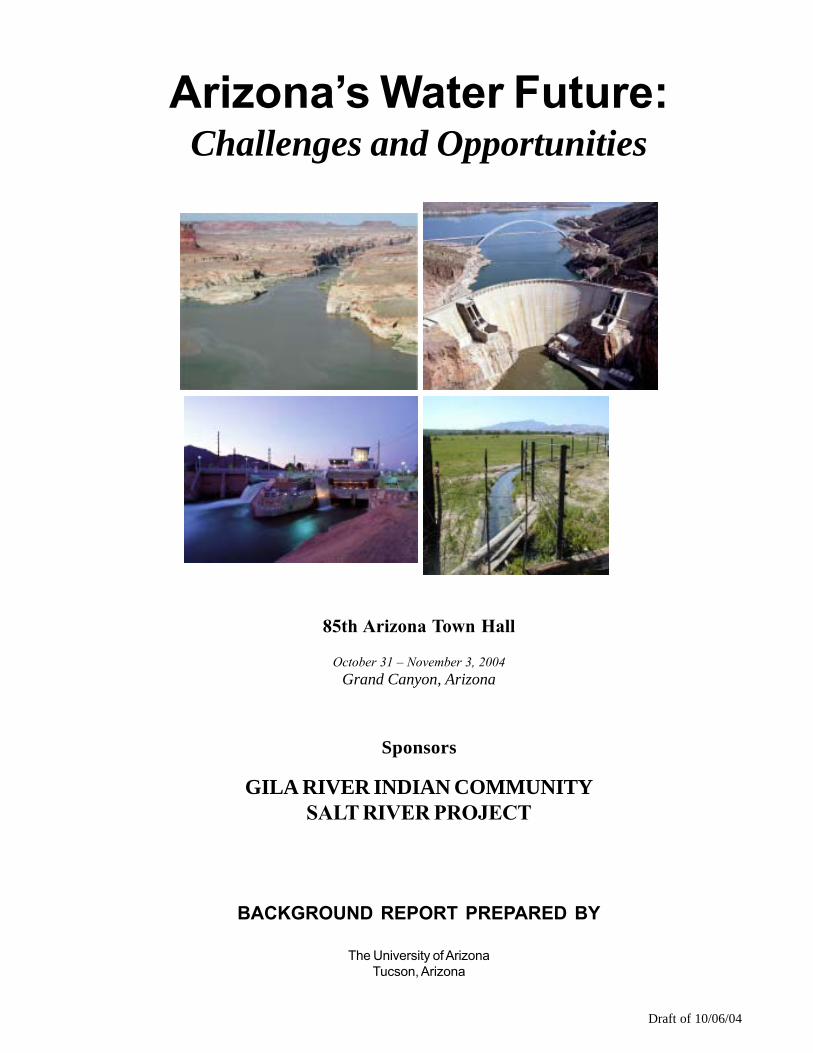
Arizona’s Water Future:Challenges and Opportunities
85th Arizona Town Hall
October 31 – November 3, 2004Grand Canyon, Arizona
Sponsors
GILA RIVER INDIAN COMMUNITYSALT RIVER PROJECT
BACKGROUND REPORT PREPARED BY
The University of ArizonaTucson, Arizona
Draft of 10/06/04
i Draft of 10/06/04
EIGHTY-FIFTH ARIZONA TOWN HALLOCTOBER 31 – NOVEMBER 3, 2004
ArizArizArizArizArizona’ona’ona’ona’ona’s s s s s WWWWWaaaaater Futurter Futurter Futurter Futurter Future:e:e:e:e:Challenges and Opportunities
Background Report Prepared By
The University of ArizonaPeter Likins, President
Office of Economic DevelopmentAND
Water Resources Research Center
Authors
Bonnie G. Colby Sharon B. MegdalDavid A. de Kok Katherine L. JacobsGary Woodard Marshall A. WordenRita Maguire
Sponsors
GILA RIVER INDIAN COMMUNITY
SALT RIVER PROJECT
Arizona Town Hall Research Committee
Darryl B, Dobras, ChairmanWarren L. Prostrollo, Vice Chairman
Timothy J. Barnett Patrick Graham Paul R. OrmeMichael J. Brophy Herb Guenther James L. ParsonsCatherine Connolly James Holway Fred H. RosenfeldHerb Dishlip Anna Jolivet Robert B. StrainPaul F. Eckstein Rodney Lewis John F. Sullivan

ii Draft of 10/06/04
Cover illustrations, clockwise from upper right: Roosevelt Dam and Lake; Arizona Strip; Ari-zona Falls on Salt River Project, 56th Street and Indian School Road, Phoenix; and Lake Powellin 2000.
iii Draft of 10/06/04
ARIZONA TOWN HALL Building consensus — Charting progress
Leaders in all areas of our communities face ever-greater complexity in their business and personal lives. These complexities drive them to focus more intensely and to narrow their viewpoints and beliefs on the challenges and opportunities they confront. Yet, the qualities and capabilities that have propelled these individuals to leadership in their own fields of endeavor are the very qualities essential to understanding and resolving the broader issues and concerns of all Arizonans.
Since 1962, the Arizona Town Hall has been bringing together leaders from across our state to carefully consider and discuss the critical challenges and opportunities facing our state. These leaders come with their varied expertise from a carefully selected cross-section of our state’s citizens. The participants at each Town Hall are geographically and occupationally balanced and represent the wide diversity of political, social and economic philosophies found in Arizona.
There have been eighty-four Town Halls to date. The eighty-fifth will be held at Grand Canyon, October 31 – November 3, 2004 and will address “Arizona’s Water Future: Challenges and Opportunities.” This Town Hall will examine Arizona’s future water supply as it relates to our state’s continuing rapid population growth, ongoing drought conditions, potential settlement of Indian water claims, need for water for environmental and recreational uses, and Arizona’s institutional and financial capacity to address future water needs.
To provide all participants in the Town Hall with fundamental background information from which to launch their detailed discussions, the University of Arizona developed the following background report. The research team consists of faculty and professionals from the University and ThinkAz—Arizona Center for Public Policy. Our sincere thanks are extended to University of Arizona President Peter Likins and the entire research team who worked so diligently to bring together thisdocument.
The timeline for the writing of this report was extremely short. Therefore, there was not sufficient opportunity for a detailed review by the Town Hall’s Research Committee of the material presented. Additional editing may take place between now and the time of the final publishing that also will include the recommendations developed at this Town Hall.
The specifics to be addressed at this Town Hall depend upon identification by you, the participants, of the most significant subject areas you consider necessary to cover. You should have received a questionnaire included with a memo of details dated October 1. We ask that you use that questionnaire to send us your questions and ideas on what needs to be discussed regarding Arizona’s water future. The concerns that you identify need not be limited to those discussed in this document. Your replies are key to the success of the Town Hall. Please take time right now to complete and return the enclosed questionnaire. Don’t wait until you’ve read this entire report to reply. At this point, we want your personal ideas on the most important issues to be discussed.
The recommendations that you develop at the Town Hall will be combined with the following background information into a final document and circulated widely throughout the state. That report will make a lasting contribution toward identifying what steps Arizona needs to take to ensure our state’s water future.
Sincerely,
Alan E. Maguire Chairman of the Board September 2004

iv Draft of 10/06/04
v Draft of 10/06/04
ACKNOWLEDGEMENTS
A seven-person research team from The University of Arizona and the Arizona Center forPublic Policy prepared this report.
The research team included persons from several disciplines: economics, anthropology, geog-raphy, environmental planning, public policy, law and chemistry. Different academic, research andpublic service units at The University of Arizona were represented on the writing team: Bonnie Colbyof the Department of Agricultural and Resource Economics; David de Kok of the Office of EconomicDevelopment; Kathy Jacobs of the Department of Soils, Water and Environmental Science, the WaterResources Research Center and SAHRA; Sharon Megdal of the Water Resources Research Centerand the Department of Agricultural and Resource Economics and; Gary Woodard of the Center forSustainability of semi-Arid Hydrology and Riparian Areas in the Department of Hydrology and WaterResources; and Marshall Worden from the Office of the Associate Vice President for Economic De-velopment. In addition, the research team included Rita Maguire of the Arizona Center for PublicPolicy.
The concept and initial outline for the report were developed in consultation with the Eighty-fifthArizona Town Hall Research Committee. That original outline was clarified in a series of meetingsinvolving the Research Committee, Kathy Jacobs, Sharon Megdal and Marshall Worden.
An initial but incomplete draft of the report was reviewed and critiqued by the Arizona TownHall Research Committee during August and early September 2004. The Committee, chaired byDarryl B. Dobras, comprises Shirley Agnos, ex officio, Timothy J. Barnett, Michael J. Brophy, CatherineConnolly, Herb Dishlip, Paul F. Eckstein, Chuck Essigs, Grady Gammage, Jr., Susan N. Goldsmith,Patrick Graham, Herb Guenther, James Holway, Janet Jennings, ex officio, Anna Jolivet, RodneyLewis, Rita Maguire, Elizabeth McNamee, David Modeer, Paul R. Orme, James. L. Parsons, M.D.,Warren L. Prostrollo, Jr., Vice Chairman, Fred H. Rosenfeld, Robert B. Strain, John F. Sullivan andD.S. (Sid) Wilson. The Research Committee’s thoughtful suggestions for improvement and correctionwere important and greatly appreciated.
Preparation of this background report was funded by The University of Arizona, Technology andResearch Initiative Fund (TRIF), Water Sustainability Program and by the University’s Office of Eco-nomic Development.
Several persons at the University of Arizona deserve thanks for their strong efforts in bringingthe final report to completion. In the Office of Economic Development, Kathleen Gardner preparedthe tables and text for the final manuscript, Linda Francis assisted in coordinating the technical, repro-duction and administrative details of the project and Lourdes Gonzalez and her staff handled themailing and distribution of the report. Kyle Carpenter in the Center for Sustainability of semi-AridHydrology and Riparian Areas assisted in preparing the maps found throughout the report. Ken Seasholesof the Arizona Department of Water Resources assisted in the design of the maps and reviewedsignificant portions of the report. The U.S. Bureau of Reclamation, the Salt River Project and the
vi Draft of 10/06/04
Central Arizona Project provided various data, graphics and photographs.
Finally, the kindness and patient direction from Shirley Agnos, President of the ArizonaTown Hall, needs to be recognized. She was a strong source of encouragement throughout thepreparation of the report and, once again, has made the Arizona Town Hall a valued experience.
Marshall A. WordenOffice of Economic DevelopmentThe University of Arizona
vii Draft of 10/06/04
CONTENTSLetter from Town Hall Board Chairman iiiAcknowledgments vContents viiList of Figures ixList of Tables xInitialisms, Acronyms and Abbreviations xi
Chapter 1—Challenges Met and RemainingKathy Jacobs and Marshall A. Worden 1
Historical and Institutional Perspective 2Achievements and Costs to Date 7Sustainability 10
Chapter 2—Major Themes in Arizona’s Water FutureKathy Jacobs and Marshall A. Worden 13
Difficult Choices and Hard Decisions 19
Chapter 3—Arizona’s Hydrology, Population and Border with MexicoDavid A. de Kok 21
Physiography and Hydrology 23Population Growth 30Forecasting Population Growth 32Population Growth and Water Use 34Sharing Water Along the Border with Mexico 38
Chapter 4—Climate, Drought and Water SupplyKathy Jacobs 47
Current Drought Conditions 47Climate “Drivers” 49Policy Implications of Global Warming for 52Water Supply Planning 52Drought Planning and Adaptation Options in Arizona 54Drought Task Force 54Approach and Objectives of the Drought Plan 55Arizona Drought Preparedness Plan 57
Chapter 5—Water Rights, Sources and IssuesKathy Jacobs 59
Sources of Water 59The Arizona Groundwater Management Act 62Water Rights Issues 66

viii Draft of 10/06/04
Riparian Protection 68
Chapter 6—Water Management in the Active Management AreasKathy Jacobs and Sharon Megdal 71
Present Conditions and Goals 73Meeting the Active Management Area Goals 82The Assured Water Supply Program 83Recharge and Recovery 85The Central Arizona Groundwater Replenishment District 86The Arizona Water Banking Authority 89Water Management Challenges Remain 90
Chapter 7—Water Supply and Management Beyond the ActiveManagement Areas
Kathy Jacobs and Sharon Megdal 95Access and Availability of Groundwater, Surface Water and Effluent 95Water Management 97Other Water Issues 106Potential Changes in Institutions, Policies and Regulations 110Drivers in Local Water Management Efforts 111Summary 113
Chapter 8—Tribal Water Settlements in ArizonaBonnie G. Colby 115
The Context for Tribal Water Settlements 116Overview of Selected Arizona Settlements 122Summary 123
Chapter 9—Environmental Issues and Water ManagementGary Woodard 125
Land Cover Changes and Water Supplies 125Land Cover Changes and Hydrologic Impacts 127Population Pressures and Development 131Freshwater Biodiversity 133Riparian Preservation 136Key Regulatory and Incentive Programs 137Water Quality Issues and Environmental Health 138
Chapter 10—Toward a Sustainable Water Supply: Tools and OpportunitiesKathy Jacobs and Rita Maguire 141

ix Draft of 10/06/04
Demand Reduction Options 142Supply Enhancement Options 143Summary 145
Chapter 11—Questions of Water, Growth and Policy 147Kathy Jacobs, Sharon Megdal and Marshall A. Worden
APPENDICESA—Past Town Hall Recommendations and Conclusions 151B—History of Groundwater Management in Arizona 157C—Assured Water Supply Program 163D—Underground Water Storage Recovery Program 171E—The Journey From Safe Yield to Sustainability
William M. Alley and Stanley A. Leake 181F—Water Quality Issues
Gary Woodard 187G—Major Streams, Recharge and Groundwater Resources
David A. de Kok 191H—Agriculture’s Diminishing Role in Arizona
David A. de Kok 195I—Waters Along the Border With Mexico
David A. de Kok 197J—Should Yuma Desalter Operate? Varied, Complex Issues are Raised
Sharon Megdal 203K—Governor’s Water Management Commission Executive Summary 205L—AMA Mandatory Conservation Requirements 209M—Storage and Recovery for AMAs 211N—County Efforts to Coordinate Land Use Plans With Water Supplies 213O—Growing Smarter Legislation Requiring a Water Resources Element 215P—Indian Water Rights Settlements
Bonnie Colby 217
Works Cited 227About the Authors 231
LIST OF FIGURES
1.1 Major Streams and Rivers 31.2 Active Management Areas and Irrigation Non-Expansion Areas 51.3 Roosevelt Dam 63.1 Precipitation 223.2 Physiographic Regions 233.3 Intensity of Surface Water Use 24
x Draft of 10/06/04
3.4 Aquifer Production 263.5 Intensity of Groundwater Use 273.6 SRP Service Area and Watershed 293.7 Yuma Desalting Plant Process Area 423.8 Solids Contact Reactor at the Yuma Desalting Plant 433.9 Control Block at the Yuma Desalting Plant 434.1 U.S. Drought Monitor 484.2 Current Reservoir Storage 494.3 Colorado River Flow, 1500-1950 504.4 Global Warming Phenomenon 536.1 Granite Reef Diversion Dam 846.2 Lower Santa Cruz Recharge Basins 847.1 Arizona Wathershed Alliance 1008.1 Arizona Indian Reservations 1169.1 Partitioning of Precipitation 1269.2 Old Growth Forests 1289.3 Creek Choked by Sediment and Ash 1299.4 Sediments Deposited Downstream in Reservoirs 1309.5 Spread of Juniper Near Acoma, New Mexico, 1899 and 1977 1309.6 Grasslands Being Supplanted by Creosote in New Mexico 1319.7 Less Grass, More Mesquite 1329.8 Evaporation Rates 1329.9 Santa Cruz River as Seen from A Mountain, 1940 and 1975 1339.10 Loss of Natural Flow in Arizona Streams 13511.1 Potential Water Supply Crises 148
LIST OF TABLES
3.1 Population Growth of Arizona’s Counties 313.2 Actual 2000 and Projected Population of Arizona’s Counties 333.3 Recent History of Estimated Water Use in Arizona's Counties 365.1 Colorado River Allocations 606.1 Phoenix AMA Water Budget 726.2 Tucson AMA Water Budget 746.3 Prescott AMA Water Budget 776.4 Pinal AMA Water Budget 786.5 Santa Cruz AMA Water Budget 806.6 Status of Recharge Permits as of July 2004 878.1 Arizona Settlements and Pending Negotiations 121
xi Draft of 10/06/04
Initialisms, Acronyms and Abbreviations
ACC Arizona Corporation CommissionADEM Arizona Division of Emergency ManagementADEQ Arizona Department of Environmental QualityADHS Arizona Department of Health ServicesADWR Arizona Department of Water ResourcesAF Acre-FeetAMA Active Management AreaARS Arizona Revised StatutesAWBA Arizona Water Banking AuthorityAWS Assured Water Supply
CAGRD Central Arizona Groundwater Replenishment DistrictCAP Central Arizona ProjectCAWCD Central Arizona Water Conservation DistrictCLIMAS Climate Assessment for the Southwest
DES Department of Economic Security
ED Endocrine DisruptorENSO El Niño-Southern OscillationEPA Environmental Protection ActET Evapotranspiration
GMA Groundwater Management ActGPCD Gallons per Capita per DayGRD Groundwater Replenishment DistrictGRIC Gila River Indian CommunityGSF Groundwater Savings FacilityGUAC Groundwater Users Advisory Council
HSR Hydrographic Survey Report
IBWC International Boundary and Water CommissionICUA Intentionally Created Unused ApportionmentIGFR Irrigation Grandfathered RightINA Irrigation Non-Expansion Area
M&I Municipal and IndustrialMSCP Multi-Species Conservation Plan
NIWWTP Nogales International Wastewater Treatment Plant
PDO Pacific Decadal OscillationPIA Practicably Irrigable Acreage
RNCA Riparian National Conservation Area
SAHRA Semi-Arid Hydrology and Riparian AreasSAWRSA Southern Arizona Water Rights Settlement ActSRP Salt River Project

xii Draft of 10/06/04
TDS Total Dissolved SolidsTMDL Total Maximum Daily Load
USF Underground Storage FacilitiesUWS Underground Water Storage, Savings and Replenishment Act
WMAP Water Management Assistance ProgramWMIDD Wellton-Mohawk Irrigation and Drainage District
1 Draft of 10/06/04
Chapter 1
WATER IN ARIZONA:CHALLENGES MET AND REMAINING
KATHY JACOBS AND MARSHALL A. WORDEN
The situation with respect to groundwater shortage and depletion is critical andgrowing worse in most sections of Arizona; . . .. As a general rule the presentsupply is inadequate to meet existing demand, resulting in severe overdrafts againstthe underground reservoirs. (Fourth Arizona Town Hall, 1964)
The goals set for the next 50 to 100 years should address the needs of sustainabledevelopment and preservation of water supplies for future generations of Arizo-nans. They should include achieving safe-yield in certain areas and looking be-yond domestic, industrial and agricultural uses to the effect water use and alloca-tion have on riparian areas, the environment and our overall quality of life. (Sev-enty-first Arizona Town Hall, 1997)
Arizona water managers, thus far protected from water shortage by legal rightsthat have guaranteed full delivery of the state’s share of the Colorado River de-spite dire drought conditions, are correct to raise the specter of water shortagesin the future. (Robert Glennon and Jennifer Pitt, 2004)
The Eighty-fifth Arizona Town Hall marks the fifth time in 40 years that it has convened
to wrestle in public conversation with the enormous and complex issue of providing, maintaining
and ensuring water of sufficient quantity and quality to meet the requirements of the citizens,
economy and environment of Arizona. Some topics, such as groundwater depletion and limited
water sources in various parts of the state, have remained constant throughout the decades. The
completion of the Central Arizona Project (CAP), the creation of the Arizona Department of
Water Resources and the promulgation of the Groundwater Management Act are milestones in
Arizona’s water management history. Now discussions of the terms “safe-yield” and
“sustainability” are coming to the forefront as Arizona evaluates the implications of continued
growth in the major metropolitan as well as the rural areas of the state. Through the years, Arizo-
nans have become more sensitive and sophisticated in their understanding of environmental re-
2 Draft of 10/06/04
lationships involving the human use of water. The public debate now regularly includes con-
cerns about climatic conditions and drought, riparian habitat, endangered species and the hydro-
logic connection between surface water and groundwater. The policy dialogue has become
much more complex during the last four decades. Something of that change is revealed in the
partial list of recommendations and conclusions from past Arizona Town Halls recorded in Ap-
pendix A. This background report explores the complexity of water management issues facing
Arizona at the beginning of the 21st century.
This chapter provides context and institutional background for Chapter 2’s discussion of
major themes in Arizona’s water future. Chapter 3 introduces water-related background material
on Arizona’s hydrology, population and border with Mexico; while Chapter 4 discusses the
implications for water management of climate variability and change. Chapter 5 describes the
sources of water available, the institutional aspects of water rights and associated issues. Chapter
6 addresses water management concerns in the five Active Management Areas (AMAs). Chap-
ter 7 introduces the water management issues beyond the boundaries of the AMAs, issues that are
significantly different than those faced in the major metropolitan areas. Chapter 8 details the
bases and specifics of existing and proposed Indian water settlements, while Chapter 9 outlines
environmental issues in the context of changing land use and land cover. Chapter 10 identifies
multiple demand management and supply enhancement approaches for addressing water supply
issues. The final chapter focuses on key policy and strategic questions for consideration by Town
Hall participants.
HISTORICAL AND INSTITUTIONAL PERSPECTIVE
Arizona’s history, politics and development patterns are strongly tied to water availability
and water management decisions. Arizona’s first settlements were all located near surface water
streams, and the fate of both ancient and modern residents has been affected by water availability.
A thousand years ago, the Hohokam Indians developed an extensive irrigation system in the Gila
and Salt River valleys to provide water to their fields. They cultivated thousands of acres and
WATER IN ARIZONA: CHALLENGES MET AND REMAINING

3 Draft of 10/06/04
supported a large population. Most
current population centers also are
located where water is relatively
plentiful, though the ability to store
and transport it over long distances
has dramatically changed develop-
ment patterns.
Federal water management
policies, such as the Reclamation
Act of 1902, have had a significant
impact on all aspects of Arizona’s
water supply and continue to affect
water allocations and costs today.
The Reclamation Act focused on
constructing a water storage and
delivery system to encourage irri-
gation of the western United States and “make the desert bloom.” This Act resulted in the devel-
opment of the Salt River Project (SRP), the CAP and the dams and diversions on the Colorado
River (Figure 1.1). Surface water supplies from these sources serve approximately 58 percent of
the water demand within the state.
Water Supplies and Sources
Four sources of water are available within Arizona: Colorado River water, other surface
water, groundwater and effluent. Each source is managed according to separate rules and defini-
tions that are discussed in Chapter 5. There is considerable complexity to the water rights sys-
tems. Colorado River water is available primarily to CAP contractors and users along the Colo-
rado River that have legal rights to a portion of Arizona’s allocation. Other significant surface
WATER IN ARIZONA: CHALLENGES MET AND REMAINING
4 Draft of 10/06/04
water sources include the Salt, Verde and Agua
Fria Rivers that serve the Phoenix metropolitan
areas. Groundwater is abundant in many of the
alluvial valleys of the state and serves over 40
percent of the water demand.
The Colorado River
The Colorado River is among the most
heavily regulated rivers in the world, affected by over 50 court decisions, state statutes, interstate
compacts and international treaties that are collectively known as the “Law of the River.” A key
component is the Colorado River Compact of 1922, which divided the Colorado River Basin into
an Upper and Lower Basin and apportioned 7.5 million acre-feet annually to each basin. The
Upper Basin was required to restrict its use so that the flow of the river at Lee’s Ferry would not
fall below an aggregate of 75 million acre-feet for any period of ten consecutive years. Although
Arizona did not ratify the Compact until 1944, this allocation became the centerpiece of the Law
of the River. In addition, the Mexican Treaty of 1944 annually allocated 1.5 million acre-feet of
Colorado River water to Mexico, to be increased in times of surplus to 1.7 million acre-feet, but
also to be reduced proportionately during years of “extraordinary” drought.
The Colorado River supplies much of the water needs of seven states in the United States,
two Mexican states and thirty-four Native American tribes. Ninety percent of the annual streamflow
is generated in the Upper Basin. The Bureau of Reclamation estimates the population of the areas
served with Colorado River water at 30 million (Bureau of Reclamation, August 2004), with 38
million projected by the year 2020. The associated dams generate an average of 12 billion kilo-
watt hours of electricity per year.
Meeting water rights obligations in the context of changing societal values and increasing
demands is bringing increasing pressure on the Law of the River. Water quality and environmen-
tal concerns, particularly the federal Endangered Species Act, also have altered the traditional
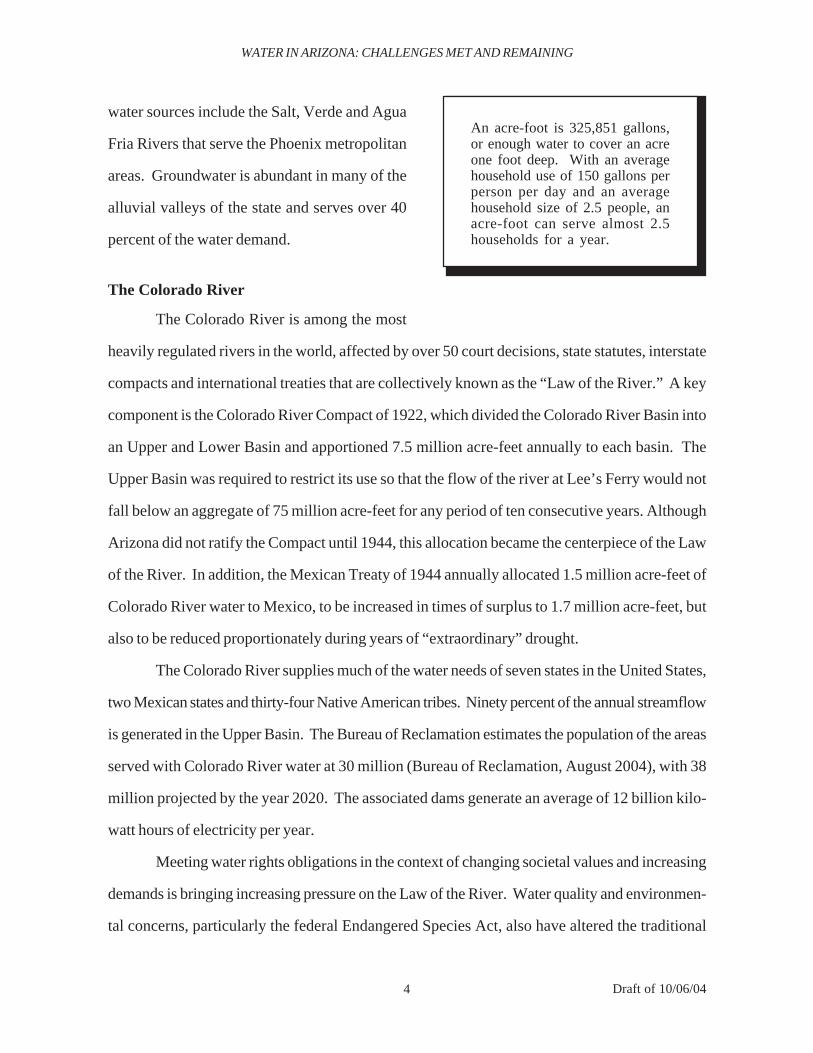
An acre-foot is 325,851 gallons,or enough water to cover an acreone foot deep. With an averagehousehold use of 150 gallons perperson per day and an averagehousehold size of 2.5 people, anacre-foot can serve almost 2.5households for a year.
WATER IN ARIZONA: CHALLENGES MET AND REMAINING
5 Draft of 10/06/04
roles of federal, state and local agencies. The continuing regional drought, including the extreme
conditions of 2002, draws attention to the importance of understanding climate variability and
change in the context of long-term water supply and the need for proactive mitigation of drought
impacts.
Groundwater and the Groundwater Management Act
Groundwater is the sole source of water supply for much of rural Arizona and is relatively
plentiful in large alluvial basins. The Colorado Plateau to the north and the southeastern part of
the state are dependent solely on groundwater. This source is of critical importance throughout
the state, providing over 40 percent of the state’s total water supply. Although Arizona adopted
a number of groundwater management regulations starting in 1945, no meaningful regulation of
groundwater use was in place until the 1980 Groundwater Management Act (GMA). The GMA
established the Arizona Department of Water Resources and focused groundwater management
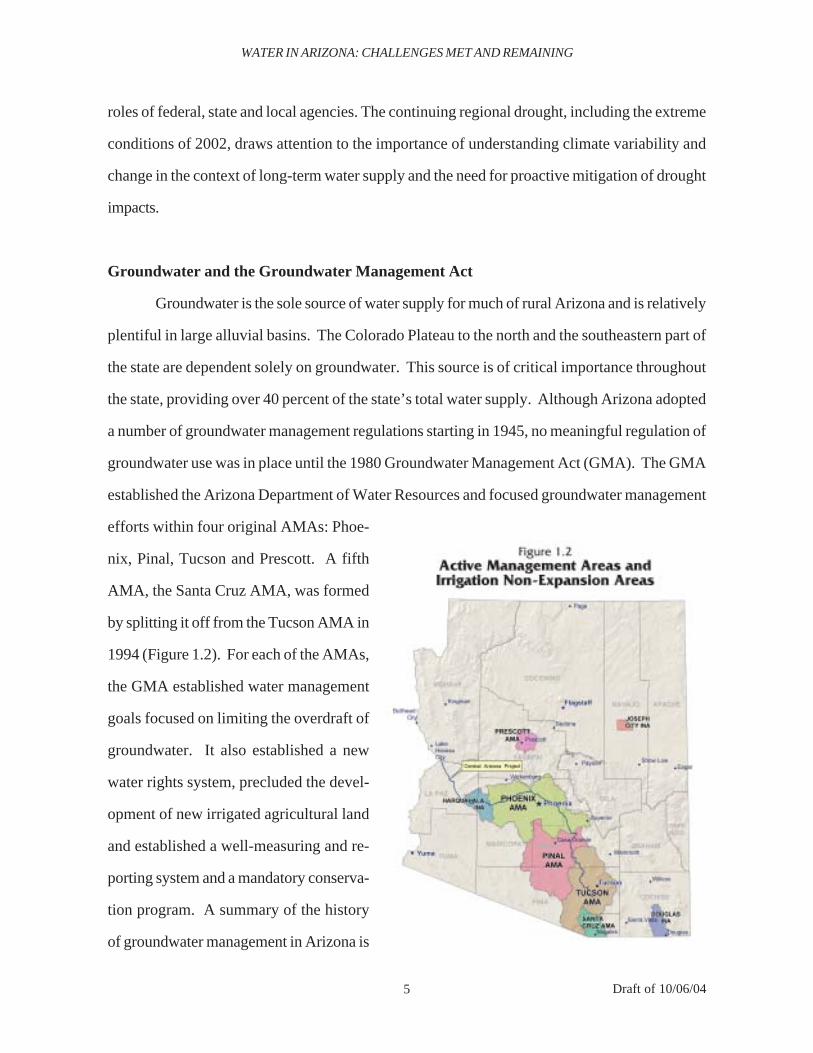
efforts within four original AMAs: Phoe-
nix, Pinal, Tucson and Prescott. A fifth
AMA, the Santa Cruz AMA, was formed
by splitting it off from the Tucson AMA in
1994 (Figure 1.2). For each of the AMAs,
the GMA established water management
goals focused on limiting the overdraft of
groundwater. It also established a new
water rights system, precluded the devel-
opment of new irrigated agricultural land
and established a well-measuring and re-
porting system and a mandatory conserva-
tion program. A summary of the history
of groundwater management in Arizona is
WATER IN ARIZONA: CHALLENGES MET AND REMAINING
6 Draft of 10/06/04
found in Appendix B.
Surface Water
The Gila River and its
tributaries is the largest watershed
within the state, draining the ma-
jority of central Arizona. Impor-
tant tributaries in southern Arizona
are the Santa Cruz and San Pedro
Rivers, and in central Arizona, the
Salt, Verde and Agua Fria Riv-
ers. However, the majority of
WATER IN ARIZONA: CHALLENGES MET AND REMAINING
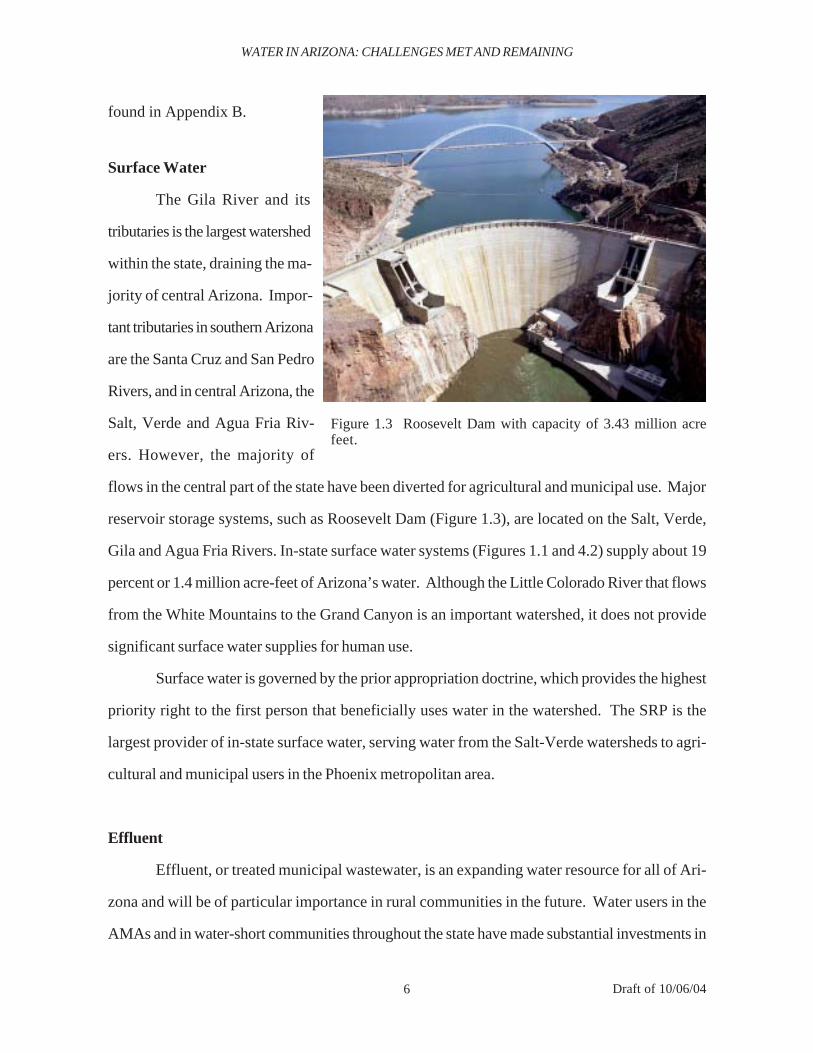
Figure 1.3 Roosevelt Dam with capacity of 3.43 million acrefeet.
flows in the central part of the state have been diverted for agricultural and municipal use. Major
reservoir storage systems, such as Roosevelt Dam (Figure 1.3), are located on the Salt, Verde,
Gila and Agua Fria Rivers. In-state surface water systems (Figures 1.1 and 4.2) supply about 19
percent or 1.4 million acre-feet of Arizona’s water. Although the Little Colorado River that flows
from the White Mountains to the Grand Canyon is an important watershed, it does not provide
significant surface water supplies for human use.
Surface water is governed by the prior appropriation doctrine, which provides the highest
priority right to the first person that beneficially uses water in the watershed. The SRP is the
largest provider of in-state surface water, serving water from the Salt-Verde watersheds to agri-
cultural and municipal users in the Phoenix metropolitan area.
Effluent
Effluent, or treated municipal wastewater, is an expanding water resource for all of Ari-
zona and will be of particular importance in rural communities in the future. Water users in the
AMAs and in water-short communities throughout the state have made substantial investments in
7 Draft of 10/06/04
reclaiming wastewater and expect to more fully utilize the available effluent. Municipal effluent
commonly is considered to be a renewable water supply, but it is only truly renewable when its
original source is renewable, i.e., CAP or surface water. Essentially, effluent use is the recycling
of water. Like CAP water, treated effluent can be used directly or stored underground for future
use.
ACHIEVEMENTS AND COSTS TO DATE
Arizona has made significant strides in water management over the last 25 years. Al-
though the water issues facing the state are daunting, they need to be understood in light of what
already has been accomplished. Clearly, the most dramatic change was caused by implementa-
tion of the GMA itself. It established a long-term water-planning horizon for the state that fo-
cused on a long-term water supply. For example, the Assured Water Supply (AWS) program is
probably the most far-sighted regulatory program connecting water supply and municipal de-
mand in the country. It requires that a demonstrated 100-year water supply of adequate quality
will be available prior to approval of new subdivisions. No other state requires a 100-year renew-
able water supply prior to development. Appendix C summarizes the Assured Water Supply
Program. The GMA charted a course for the municipal sector in AMAs to move away from
groundwater and towards renewable water supplies through the AWS Program. The AWS Rules,
adopted in 1995, require the use of renewable supplies and are based on the expectation that
municipal and industrial demand will continue to grow while the demands of other sectors will
diminish over time.
The Central Arizona Project
The CAP is the backbone of the State’s renewable water supply system. The CAP is
designed to bring 1.5 million acre-feet of Arizona’s 2.8 million acre-foot Colorado River alloca-
tion into central and southern Arizona. The CAP aqueduct has the capacity to annually deliver a
total of 1.8 million acre-feet, and its total cost exceeded $4 billion. The CAP aqueduct is 336
WATER IN ARIZONA: CHALLENGES MET AND REMAINING
8 Draft of 10/06/04
miles long and includes 15 pumping stations that lift the water from Lake Havasu to its terminus
south of Tucson. The CAP service area is limited to Maricopa, Pinal and Pima Counties. It is
operated by the Central Arizona Water Conservation District, which has taxing authority and a
board elected by the citizens within its three-county service area. Authorized in 1968, the CAP is
critical to achieving a sustainable water supply for the central portions of the state (Figure 1.1).
The CAP system, along with its storage, flood control and delivery components, is a major in-
vestment in water supply sustainability for the state. By providing a renewable supply to replace
dependence on mined groundwater, the investment in the CAP already has proven essential to
limiting groundwater overdraft and providing water supplies during drought.
Although the three-county CAP service area contains 82 percent of the population of the
state, substantial development pressure is facing communities in other counties. In addition to
providing water to its subcontractors, the CAP system has been delivering excess Colorado River
water to several entities that store water underground for various purposes and has delivered
substantial quantities of water to offset shortages in the SRP system. SRP purchased and ex-
changed nearly 500,000 acre-feet from the CAP between 1996 and 2003.
Institutional Innovations
The conversion from dependence on mined groundwater to use of renewable supplies
from the Colorado River has required the development of new institutions as well as major finan-
cial investments. For example, soon after the adoption of the GMA it became clear that recharge
would be a major component of storing and utilizing renewable water supplies. In 1986, signifi-
cant legislation was adopted that established the Underground Water Storage and Recovery Pro-
gram summarized in Appendix D. Since 1986 there have been numerous refinements and addi-
tional components. This program has been very successful and, as of 2002, had resulted in the
development of 66 storage facilities, primarily in the AMAs, and storage of over three million
acre-feet of water in the state.
Another institutional innovation that has been very successful is the Arizona Water Bank-
WATER IN ARIZONA: CHALLENGES MET AND REMAINING
9 Draft of 10/06/04
ing Authority (AWBA), which was established in 1996 to store excess Colorado River water for
use during future shortage years and to support other water management objectives as well as
interstate water banking. Annual water use is strongly affected by agricultural demand and the
availability of other surface water supplies within the state. The AWBA, in combination with
incentive pricing programs to encourage the short-term use of CAP water for agriculture and
underground storage, has enabled the full use of Arizona’s allocation.
Indian Water Right Settlements
Significant progress also has been made in finalizing Indian water rights claims. One of
the biggest variables in Arizona’s water supply picture has been how much water will be allo-
cated to the Native American tribes in the state and how that water ultimately will be used on and
off the reservations. As discussed in Chapter 8, settlements have now been completed with eight
tribes and four more settlements are pending. Tribal water rights claims are based on the federal
reserved rights doctrine—the “Winters Doctrine” of 1908. The Winters Doctrine indicates that
the priority date of the water rights for reservations is the date the reservation was established, and
the volume of the right is based on the purpose of the reservation. The large amount of poten-
tially irrigable acreage on the Gila River Indian Community reservation, along with their signifi-
cant historical dependence on the Gila River, has led to a large water right claim. The total
volume of water associated with tribal settlements in the Arizona Water Rights Settlement Act,
currently pending before Congress, is roughly half the total CAP allocation. Because tribal lands
are not subject to the GMA, tribes will have the opportunity to expand irrigated acreage on
reservations. However, other provisions are intended to mirror the limitations of the GMA.
The total amount of CAP water that will be available to Indian communities under the
pending Arizona Water Rights Settlement Act is 665,000 acre-feet, just short of one-half the total
CAP water available. The tribes may choose to lease some of this water for off-reservation uses
within Arizona. There are restrictions within the settlements themselves on how the water can be
used off reservation, but leasing is expected to be an outcome of several tribal settlements and
WATER IN ARIZONA: CHALLENGES MET AND REMAINING
10 Draft of 10/06/04
already is the source of water for non-reservation communities such as Anthem in Maricopa
County. Indian settlements also have important water management implications outside of reser-
vations because of the multiple agreements with water users who are part of the settlements. In
several cases, these agreements constrain the way water can be used in the vicinity of the reserva-
tion, and they also have more comprehensive impacts on water availability by limiting new agri-
cultural production and new wells in the affected watershed. For example, the Gila River Indian
Community Settlement, now pending before Congress, includes agreements that affect water
users in Safford, Duncan, Pima, Fort Thomas, Winkelman and Kearny as well as three mining
companies. Indian water settlements are discussed in more detail in Chapter 8.
SUSTAINABILITY
Discussion of future water needs for Arizona should be in the context of policy objectives
that are clearly articulated. Throughout this background report the various authors use the words
sustainable, sustainable development and sustainability–terms that have risen in importance in
scholarly analysis and policy debates regarding water management and water science. All three
of Arizona’s state universities have research centers focused on sustainability issues.
The management goal for three of the five AMAs (Phoenix, Prescott and Tucson) is
“safe-yield . . . a water management goal which attempts to achieve and thereafter maintain a
long-term balance between the annual amount of groundwater withdrawn in an AMA and the
annual amount of natural and artificial recharge in an AMA” (A.R.S. 45-562 A). However, there
is a distinction between safe-yield, which focuses on the amount of water that can be pumped
from an aquifer for water supply purposes without causing overdraft, and sustainable yield or
sustainable development, which many hydrologists view as more comprehensive concepts that
would maintain surface flows that recharge the groundwater and provide water for environmental
uses as well (Appendix E). Since sustainability is a concept that is approached differently by
various individuals based on personal values and is much-debated, this background report uses
the most commonly accepted working definition, that of the Brundtland Commission: “The abil-
WATER IN ARIZONA: CHALLENGES MET AND REMAINING
11 Draft of 10/06/04
ity of current generations to meet their needs without compromising the ability of future genera-
tions to meet their needs” (World Commission on Environment and Development, 1987).
Scale affects the application of the definition of sustainability. For example, Colorado
River water that is diverted into Arizona is viewed as a “renewable” supply from the perspective
of the state of Arizona, unlike groundwater that is in most cases renewed over such a long period
of time that it is viewed as non-renewable. However, diverting water from the Colorado River
affects the sustainability of downstream users and environments outside of the state and, there-
fore, has consequences that may be overlooked when viewing the water use only from the per-
spective of Arizona’s water users. For example, the Colorado River Delta environment has
changed substantially over time as larger quantities of water have been dammed and diverted
upstream, and this in turn has affected water flows to Mexico and the marine environment in the
Gulf of California.
Temporal issues also are of concern, since the impacts of water management decisions
may not become obvious until many years later. For example, there was little evidence of subsid-
ence of the land surface in the Tucson basin until about a decade ago. Since then, subsidence
avoidance has become a major policy objective for Tucson Water. Because we are dependent on
the use of groundwater models to understand water movement and availability in the subsurface,
because impacts of groundwater pumping are commonly not recognized for decades and because
the hydrologic system itself changes over time, a long-term view is needed in water supply plan-
ning.
WATER IN ARIZONA: CHALLENGES MET AND REMAINING

12 Draft of 10/06/04
WATER IN ARIZONA: CHALLENGES MET AND REMAINING

13 Draft of 10/06/04
Chapter 2
MAJOR THEMES IN ARIZONA’S WATER FUTURE
KATHY JACOBS AND MARSHALL A. WORDEN
Seven major themes or overarching concerns regarding Arizona’s water future are dis-
cussed in succeeding chapters. Information and discussion about each of these topics is found in
several places throughout the text; the themes are previewed in this chapter. They include:
• Drought, climate variability and change• Rural water supply• Growth, water supply and meeting management goals within the Active Manage-
ment Areas• Surface water adjudications• Riparian protection and endangered species• Water quality as a water management issue• Economics as a water management issue
Drought, Climate Variability and Change
Arizona currently is affected by a severe drought that is nearing a decade in length, with
the El Nino year of 1998 being an exception. Although some portions of the state have received
near-normal rainfall during the past year, experts believe that Arizona may be in the beginning
stages of a longer-term drought than has been experienced in the last 40 years. Part of the signifi-
cance of this drought is its regional nature. It is affecting the entire Colorado River watershed,
and consequently both Arizona’s in-state and Central Arizona Project (CAP) supplies are af-
fected. Reservoir conditions on the Colorado River and throughout the state have been at or near
record low levels in the last two years. In addition to increased wildfires–the Rodeo-Chedeski
fire in 2002 was the largest in the state’s history–the drought has resulted in significant economic
impacts on rural areas (particularly in the ranching, recreation and forest products sectors) that
generally do not have supplemental water supplies. Water supply conditions have been critical in
the summer months in Flagstaff, Prescott, Williams, Mayer, Payson, Pine-Strawberry and other
14 Draft of 10/06/04
communities on the Mogollon Rim as well as elsewhere in the state.
Although the extensive investments in water supply infrastructure for the Phoenix and
Tucson areas have provided substantial protection from the current drought, there are concerns
about the future in the case of continued droughts simultaneously affecting the Salt River-Verde
River system and the Colorado River system. Governor Napolitano has established a Task Force
to develop a state drought plan that would limit the state’s vulnerability to drought in the future.
The Arizona Drought Preparedness Plan is expected to be adopted in early fall of 2004. Drought
also has raised the stakes in: (1) negotiations with other Colorado River basin states, (2) shortage
sharing agreements, (3) long-term supply reliability discussions and (4) relations between the
United States and Mexico.
In addition to concerns about the effects of climate variability on water use and supply,
there is substantial scientific evidence that longer-term changes in climate conditions are occur-
ring. Scientists have observed that increases in average global temperatures already are affecting
water supply availability in the Colorado basin (Christensen et al., 2004). There also are concerns
about the implications of higher temperatures because they reduce soil moisture, increase evapo-
ration and transpiration by plants, and change snowpack and runoff volumes and timing. Climate
and drought considerations are further discussed in Chapters 3 and 4.
Rural Water Supply
Even in the absence of drought, water supply conditions in some communities of rural
Arizona are a serious problem. Growth rates are very high, with projected continued growth in
many communities that may not have water supplies or financial resources to sustain that growth.
There are inadequate mechanisms to ensure availability of water supplies to support growth in the
rural areas of the state. In addition, increasing demands for groundwater are very likely to affect
important springs and surface water flows that support riparian areas and recreation.
The portions of the state outside the Active Management Areas (AMAs) encompass 87
percent of the land area and almost a million people. According to Arizona Department of Eco-
MAJOR THEMES IN ARIZONA’S WATER FUTURE
15 Draft of 10/06/04
nomic Security data, the population in these areas is expected to nearly double in the next 50
years, but these projections probably are low, as discussed in Chapter 3. High population
growth rates, in combination with water supplies that often are susceptible to drought, increase
the likelihood that there will be water supply shortages in rural communities.
Areas of the state beyond the boundaries of the AMAs have significant challenges in
meeting their water supply needs because (1) many of these areas do not have adequate water
supply and demand data and (2) they, unlike the major metropolitan areas, generally are depen-
dent on a single water source. Lack of information is a major frustration for jurisdictions, water-
shed groups and land managers because they cannot make informed decisions without good
water supply data. From a data availability and water supply perspective, there are essentially
two Arizonas: the major metropolitan areas and irrigation districts served by the Colorado River
and the rest of the state, which has limited water supply alternatives and even more limited plan-
ning information. These issues are discussed further in Chapters 3 and 7 and Appendix G.
Growth, Water Supply and Meeting Management Goals Within the Active ManagementAreas
Concerns about whether the AMAs are on track to meet their management goals were
among the reasons that Governor Hull established the Governor’s Water Management Commis-
sion in 2000. An extensive evaluation of the ability of the AMAs to meet their management goals
resulted from that Commission’s activities. Regarding conditions of the individual AMAs, the
Commission (2000) concluded:
In the Phoenix and Tucson AMAs, water budgets based on current supply avail-ability projections indicate that achieving safe-yield may not be as difficult asmaintaining that condition . . . the expected population growth beyond 2025,particularly in the major metropolitan areas, may ultimately exceed the availabil-ity of renewable supplies and result in increasing costs for providing renewablewater supplies and again put pressure on groundwater availability. This situa-tion may occur earlier in the Prescott AMA, where renewable supplies are not asabundant or as readily available . . .
The Santa Cruz AMA goal of preventing long-term declines in local water tablelevels provides the means to deal with “sub-area” issues and physical water
MAJOR THEMES IN ARIZONA’S WATER FUTURE
16 Draft of 10/06/04
supply conditions, which does not exist in the others AMAs . . . Management ofthe water levels is an important objective due to the desire to protect the surfacewater flows and riparian habitat along the river while maximizing available sup-plies . . .
In the past the water management goal of the Pinal AMA was referred to as“planned depletion.” However, this characterization has recently been identi-fied as encompassing only one aspect of the management goal. Preserving watersupplies for non-irrigation users is also an important part of the Pinal AMA man-agement goal. Because agriculture can use mined groundwater supplies in thePinal AMA until they are no longer affordable, and sufficient groundwater ap-pears to be available based on projected needs, the goal of preserving the agri-cultural economies for as long as feasible is achievable well beyond 2025. Withregard to achieving the goal for non-irrigation uses and accommodating pro-jected population increases, strategies must be identified and implemented to loweroverall water use, specifically the non-residential component, and/or secure ad-ditional renewable supplies.
The ability to achieve and maintain the long-term management goals within the AMAs is
a key water management consideration for Arizona. Substantial progress has been made to date
through use of renewable supplies, conservation programs and conversion of rights. Continued
efforts will be required, but projections by the Arizona Department of Water Resources (ADWR)
show shortfalls in those efforts (Tables 6.1 through 6.5). In many cases ADWR’s ability to
influence critical water management decisions is both indirect and insufficient. Cooperative ef-
forts with regional entities and technically sophisticated long-term planning are likely to be criti-
cal to achieving the AMAs’ water management goals.
Decisions related to acquiring sufficient water supplies to meet the rapidly growing water
demands in the AMAs will need to be made in the context of ever-increasing competition for
water. Competition exists at multiple levels, both within Arizona and between the Colorado
River basin states and Mexico, particularly in the context of shortages. Recent discussions related
to ensuring reliable long-term water supplies for Assured Water Supply purposes in the context of
the Central Arizona Groundwater Replenishment District show that water interests are becoming
more aware of the risks of future shortages and are always vigilant about protecting their own
water rights. These topics are reviewed in Chapters 3 and 6.
MAJOR THEMES IN ARIZONA’S WATER FUTURE
17 Draft of 10/06/04
Surface Water Adjudications
A key variable in Arizona’s water supply picture is that most of the surface water rights in
the state have not been legally quantified and prioritized. Only the water rights that have been
established by court decree in separate legal actions have set volumes and priority dates. Because
the surface water rights system is based on prior appropriation (“first in time, first in right”), a
determination of the amount and priority of each right is required in order to manage the system.
Although formal court adjudications of the surface water rights are ongoing for the Gila River
and Little Colorado River, there is no indication that these proceedings will be completed in the
near future. Tribal claims generally have senior priority to state-based claims and could have a
significant impact on Arizona’s water supply picture. Chapters 5 and 8 and Appendix P discuss
this theme.
Riparian Protection and Endangered Species
Most of the state’s free-flowing streams that existed prior to the last century have been
affected by dams and diversions as well as by groundwater pumping that depletes the base flow.
The remaining free-flowing streams and shallow groundwater tables of the state support riparian
habitats that are the locations of Arizona’s greatest biodiversity. The riparian corridors are of
particular importance to migratory birds. These areas also are major contributors to Arizona’s
economy because they are destinations for recreation and tourism as well as contributors to the
quality of life in Arizona. Finding a balance between the needs of protected species through the
Endangered Species Act and the water supply needs of growing communities will be an ongoing
debate. A multi-species conservation plan for endangered species along the Colorado River,
mitigation requirements related to willow flycatcher habitat at Roosevelt Lake and issues associ-
ated with managing the San Pedro River are examples of ways in which habitat conservation
efforts will affect water supply availability in the future. These issues are discussed further in
Chapters 5 and 9.
MAJOR THEMES IN ARIZONA’S WATER FUTURE
18 Draft of 10/06/04
Water Quality as a Water Management Issue
Water supply limitations often are created by water quality problems. If a water source is
contaminated and a community cannot afford to treat the water prior to use, the water supply is
essentially unavailable. Ability to pay for treating water supplies depends on local economic
conditions as well as available financing mechanisms. Water quality protection programs in
Arizona are based on both federal and state law and primarily are administered by either the
Arizona Department of Environmental Quality or the United States Environmental Protection
Agency Region IX through the Safe Drinking Water Act.
Groundwater or surface water that contains contaminants at levels that exceed the pri-
mary water quality standards must be treated prior to use. Depending on the type and concentra-
tion of contaminants, different treatment and/or blending techniques can be used to meet the
standards prior to delivery to customers. Although virtually any contaminant can be removed
from water, the key water supply issue is the cost of treatment. If the treatment costs exceed the
willingness of the public to pay, the water supply is at least temporarily unusable.
The key water quality issues from a regulatory perspective in the state are summarized in
Appendix F. Of particular concern are nitrates in groundwater, primarily associated with former
agricultural and industrial sources or wastewater discharges, and arsenic, a naturally occurring
metal that appears at elevated levels in some parts of the state. The standard for arsenic is chang-
ing from 50 to 10 micrograms per liter, with the new standard becoming effective in January 2006
at an estimated cost to Arizona water providers of $100 million. The impact of this change in
standards is particularly significant for 300 small water systems, i.e., those systems serving less
than 10,000 people, which tend to be in rural areas. An area of increasing concern is the salinity
of water supplies in the AMAs since water imported from the Colorado River is higher in salinity
than the groundwater in many parts of the CAP service area. Concerns also are increasing about
industrial contamination of groundwater supplies in urban areas and the presence of pharmaceu-
ticals and other substances in discharged effluent.
MAJOR THEMES IN ARIZONA’S WATER FUTURE
19 Draft of 10/06/04
Economics as a Water Management Issue
Water is commonly viewed as a natural resource that is integral to supporting life, but it
also is a commodity and an economic input to multiple products. The cost of water has substan-
tial implications for influencing water management decisions and economic productivity. For
example, in the absence of regulation, federal subsidies and financial incentives, many Arizonans
who are customers of the CAP probably would be using groundwater today because groundwa-
ter often is cheaper than the full cost of CAP water and is in many cases of higher quality.
Changes in the cost of water, caused by changes in supply and demand or changes in energy
costs, have ripple effects throughout Arizona’s economy.
Economists agree that market-based systems can increase the efficiency of water use
because such systems result in moving the water rights to the “highest and best use,” i.e., to the
water use that can pay the highest price. There are equity, social and environmental consider-
ations associated with this perspective and, consequently, there are virtually no cases of a totally
unregulated water market in the United States. Without an established water rights system, how-
ever, it is difficult to implement even rudimentary market-related concepts such as leasing into
water management. Until the tribal claims and the surface water rights of the state are clear, it will
be difficult to develop more flexible market-based water management systems to address the
changing water needs of Arizona. These issues are primarily discussed further in Chapter 5.
DIFFICULT CHOICES AND HARD DECISIONS
This background report provides a context for discussing future decisions about water
supply and water management in Arizona. Difficult choices and hard decisions that have eco-
nomic, environmental and social consequences must be made. Tradeoffs between water quality
and water quantity, growth and economic development and environmental protection, agricul-
tural water use and municipal and industrial uses, cost of living and quality of life, private prop-
erty rights and protection of public values, are all significant issues that deserve to be addressed in
the public arena.
MAJOR THEMES IN ARIZONA’S WATER FUTURE
20 Draft of 10/06/04
The complexity of water issues in Arizona, however, often makes it difficult for all citi-
zens to participate in these public debates. Basic questions emerge regarding Arizona’s institu-
tional capacity to deal with the state’s water problems, the potential need for additional regulation
of water availability outside the AMAs, the types of new regulation and the responsible parties
for their enforcement, the financial resources necessary to pay for the transportation and storage
of new supplies for rural communities as well as drought and water supply planning needs.
Achieving a sustainable water future for all of Arizona is a worthy but daunting goal. The
significant drought that Arizona has been experiencing has brought the issue of sustainability of
our water supplies into sharper focus. Now is an excellent time to consider whether the efforts
that have been made to date will be sufficient to carry Arizona into the future, or whether the
dramatically expanding population, the lack of sufficient water resources in some rural areas, and
the increasing competition for municipal supplies justify additional efforts to ensure that Arizona’s
economy and quality of life can be sustained into the future.
MAJOR THEMES IN ARIZONA’S WATER FUTURE

21 Draft of 10/06/04
Chapter 3
ARIZONA’S HYDROLOGY, POPULATION ANDBORDER WITH MEXICO
DAVID A. DE KOK
There is no denying Arizona’s appeal. Hundreds of hopeful new residents enter Arizona
everyday. They are drawn by both Arizona’s great natural beauty, as popularized in the pages of
Arizona Highways, and its vibrant economy. The cumulative effect of this unrelenting migration
has made Arizona the exemplar of the Sun Belt phenomenon. From a half million people just
prior to the start of World War II, the state’s population soared ten-fold in just six decades. The
post-war boom shows no sign of slowing down. Although this growth has helped fuel a booming
economy, it also has taxed the state’s water resources, revealing the possible limits to growth in
some parts of the state.
The diversity of Arizona’s terrain, climate, flora and fauna is the state’s most striking
feature. Despite the state’s enormously varied physical components, there is one unifying element
that serves to define Arizona–its climate; except at its highest elevations Arizona is arid.
There is a strong relationship between elevation and precipitation, particularly in the western
and southern two-thirds of the state (Figure 3.1). Southwestern Arizona is a low-lying desert–a
place where evaporation far exceeds rainfall and where water is severely limiting to life most of
the time. The abruptly rising central highlands receive far more precipitation and experience
lower evaporation. The northeastern third of the state gets much less precipitation than the central
highlands due to its slightly lower elevation and its position in the rain shadow to the lee of the
highlands which intercept eastward traveling winter storms. The eastern two-thirds of Arizona
receives its maximum precipitation from summer monsoon storms, whereas the western third of
the state gets most of its rain in the winter. Each 1,000-foot increase in elevation generally is
accompanied by an increase of three inches in annual precipitation and a decrease of from three to

22 Draft of 10/06/04
ARIZONA’S HYDROLOGY, POPULATION AND BORDER WITH MEXICO
five degrees Fahrenheit in temperature. In reality, the distribution of precipitation is highly irregu-
lar and is affected by both the altitude and arrangement of the state’s landforms and their interac-
tion with seasonal weather patterns.
Precipitation by itself does not always translate into an available water resource. Evapo-
ration reduces it, rocks deflect and channel it and porous soils absorb it. This leads to Arizona’s
great water paradox–water is most readily available for human use in some of the state’s most
arid parts and, conversely, water is more difficult to access in some of the state’s wettest regions.
The recent drought has highlighted the precariousness of water resources in parts of the central
23 Draft of 10/06/04
ARIZONA’S HYDROLOGY, POPULATION AND BORDER WITH MEXICO
highlands and plateau uplands where water providers in such communities as Payson, Pine, Straw-
berry, Williams and Flagstaff have had to scramble to secure new water sources as shallow aqui-
fers and reservoirs have run dry.
PHYSIOGRAPHY AND HYDROLOGY
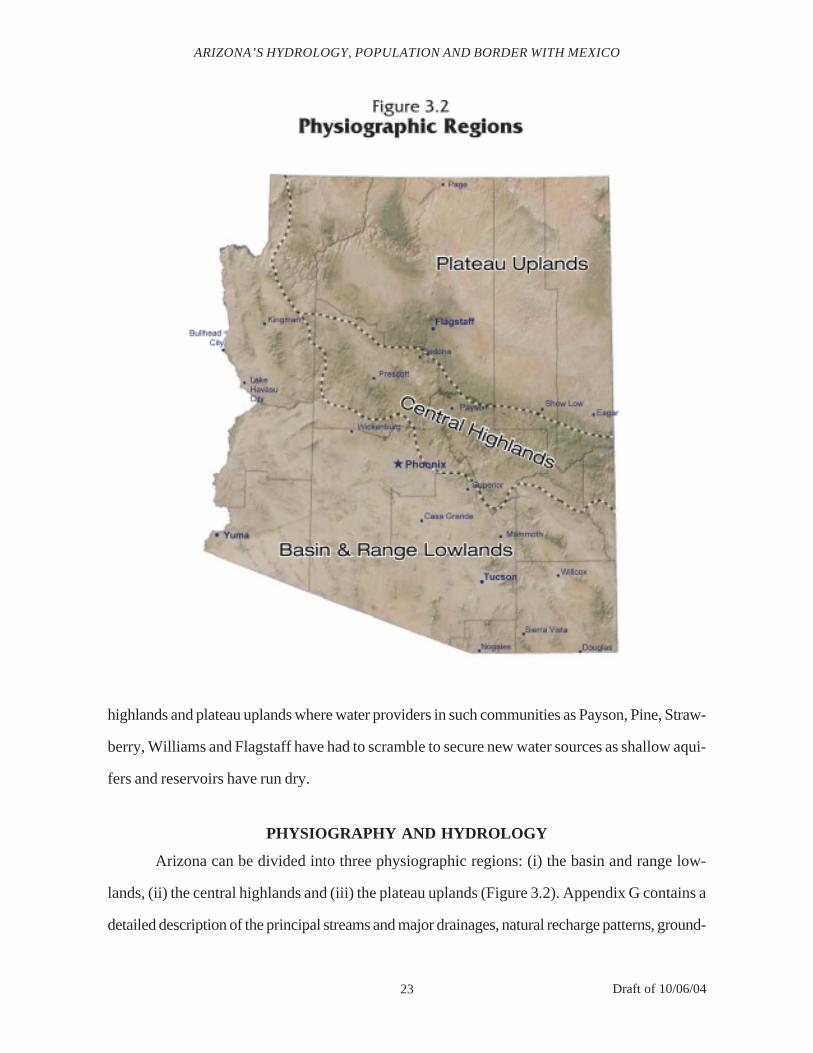
Arizona can be divided into three physiographic regions: (i) the basin and range low-
lands, (ii) the central highlands and (iii) the plateau uplands (Figure 3.2). Appendix G contains a
detailed description of the principal streams and major drainages, natural recharge patterns, ground-
24 Draft of 10/06/04
ARIZONA’S HYDROLOGY, POPULATION AND BORDER WITH MEXICO
water resources and regional aquifers found in these physiographical regions.
Basin and Range Lowlands
The basin and range lowlands contain 45 percent of the state’s land area and 89 percent of
its population. The lowlands include all of Yuma, La Paz, Pima, Pinal, Santa Cruz and Cochise
Counties as well as most of Maricopa County and portions of Mohave, Graham and Greenlee
Counties. The basin and range lowlands consist of isolated, northwest trending, uplifted fault
block mountain ranges jutting from alluvial sediments that form the broad desert basins. The
25 Draft of 10/06/04
ARIZONA’S HYDROLOGY, POPULATION AND BORDER WITH MEXICO
valley floors range in altitude from about 100 feet at Yuma to 4,600 feet near Sierra Vista. The
interspersed mountain ranges vary from 1,000 to 6,000 feet above the valleys and reach eleva-
tions as great as 10,700 feet above sea level in the Pinaleno Mountains. Annual precipitation in
the region generally averages less than ten inches, but ranges from four inches near Yuma to 30
inches along the peaks of the Santa Catalina and Chiricahua Mountains.
The basin and range lowlands generate very little runoff over most of their area. Streams
in the region are characterized by extreme seasonal variation in flow levels. Ephemeral streams
(those which flow only in response to precipitation events in their watersheds) in the low moun-
tain ranges and alluvial valleys experience maximum flows in the summer in response to mon-
soon storms. Streams in the higher mountain ranges have maximum seasonal runoff in late winter
and early spring as accumulated snowpacks melt off. Channel losses have a great effect on
alluvial valley streams. Low groundwater tables and sandy, usually dry channels encourage the
rapid infiltration of surface flows into the streambed. Channel losses in combination with the
region’s high evaporation rates result in streams that have relatively short stretches of surface
flow. Only runoff from major storms is usually carried to the lower reaches of the main stream
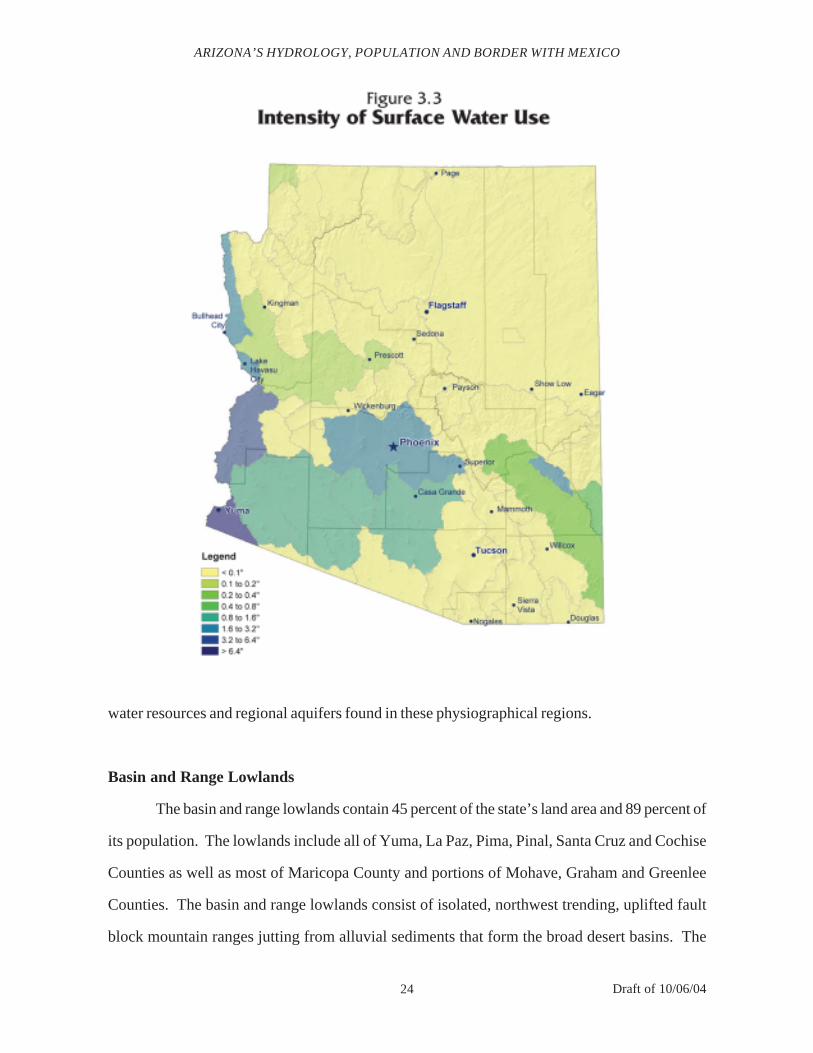
channels, many of which are controlled with dams. While the basin and range has the preponder-
ance of surface water use in Arizona (Figure 3.3), the source of that water primarily is outside the
physiographical region.1
Even as the basin and range lacks indigenous surface water, it is both the locale of the
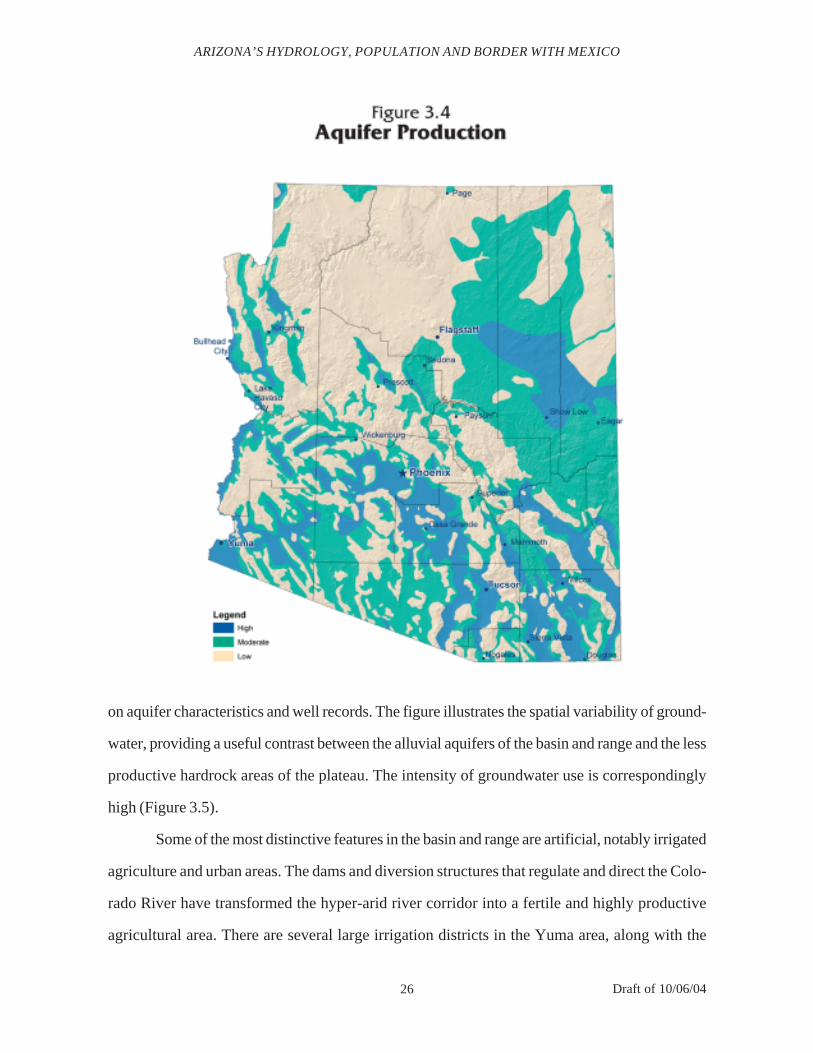
state’s most easily mined groundwater and the region with the most highly developed groundwa-
ter resources, with over 100,000 registered groundwater wells. Figure 3.4 shows in quite general
terms areas of Arizona where groundwater wells are likely to be capable of high flow rates, based
1 Figures 3.3 and 3.5 represent intensity as the volume of water used (in acre-inches) in the basin,divided by the area of the basin (in acres). The resulting units are simply inches, which can bethought of as the depth of water that would result if all the water used in the basin were spreaduniformly over the entire basin. While such units seem odd at first, they are, of course, used forprecipitation. The figures clearly illustrate the spatial variability of usage as well as the fact thatgroundwater resources are more widely used and available.
26 Draft of 10/06/04
ARIZONA’S HYDROLOGY, POPULATION AND BORDER WITH MEXICO
on aquifer characteristics and well records. The figure illustrates the spatial variability of ground-
water, providing a useful contrast between the alluvial aquifers of the basin and range and the less
productive hardrock areas of the plateau. The intensity of groundwater use is correspondingly
high (Figure 3.5).
Some of the most distinctive features in the basin and range are artificial, notably irrigated
agriculture and urban areas. The dams and diversion structures that regulate and direct the Colo-
rado River have transformed the hyper-arid river corridor into a fertile and highly productive
agricultural area. There are several large irrigation districts in the Yuma area, along with the
27 Draft of 10/06/04
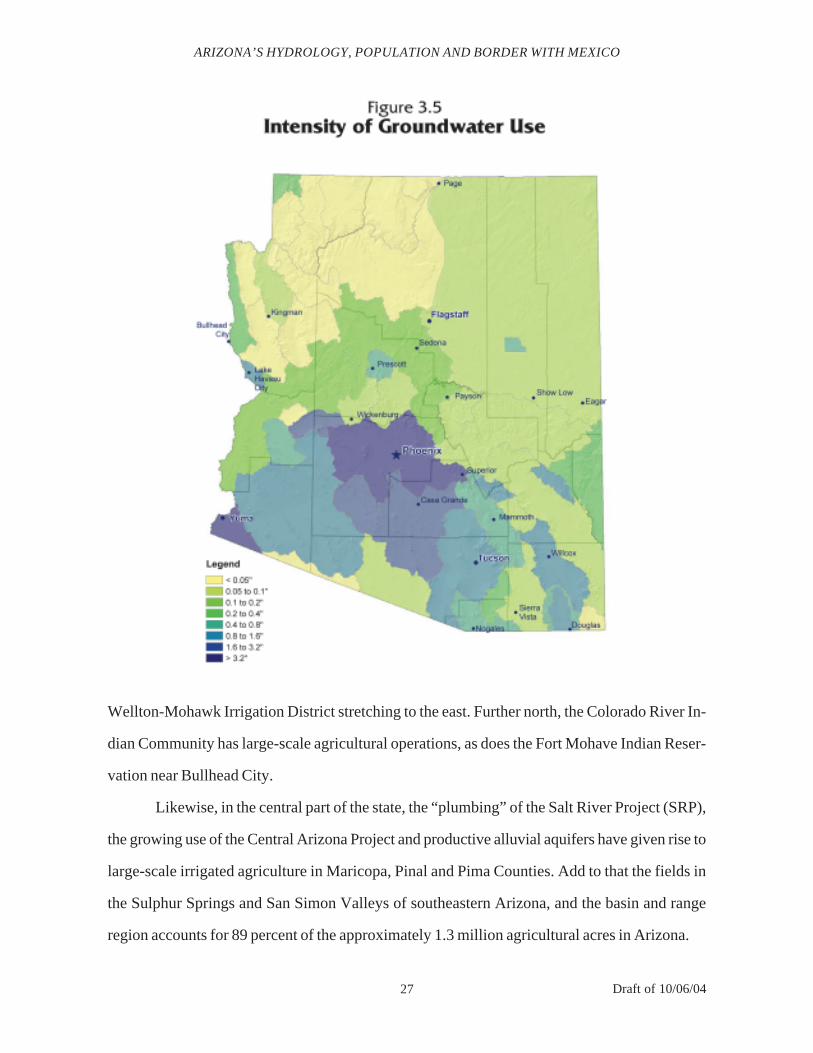
ARIZONA’S HYDROLOGY, POPULATION AND BORDER WITH MEXICO
Wellton-Mohawk Irrigation District stretching to the east. Further north, the Colorado River In-
dian Community has large-scale agricultural operations, as does the Fort Mohave Indian Reser-
vation near Bullhead City.
Likewise, in the central part of the state, the “plumbing” of the Salt River Project (SRP),
the growing use of the Central Arizona Project and productive alluvial aquifers have given rise to
large-scale irrigated agriculture in Maricopa, Pinal and Pima Counties. Add to that the fields in
the Sulphur Springs and San Simon Valleys of southeastern Arizona, and the basin and range
region accounts for 89 percent of the approximately 1.3 million agricultural acres in Arizona.
28 Draft of 10/06/04
ARIZONA’S HYDROLOGY, POPULATION AND BORDER WITH MEXICO
Central Highlands
The central highlands contain 15 percent of the state’s land area and five percent of its
population. The highlands are composed of parts of Mohave, Maricopa, Graham, Greenlee,
Navajo and Apache Counties, as well as most of Yavapai County and all of Gila County. The
highlands were formed by differential movements along complex fault systems resulting in sharp,
rugged mountains of extruded volcanic rock. The basins in the central highlands are generally
small, shallow and isolated from one another. Sharp, steep elevational differences characterize
this region, with altitudes ranging from 1,400 feet at Fort McDowell to 11,500 feet at Mount
Baldy. The region’s most salient feature is the 200 mile long Mogollon Rim which forms the
boundary between the central highlands and the plateau uplands. This northwesterly trending
escarpment ranges in height from 200 feet to over 2,000 feet. Annual precipitation in this region
ranges from ten inches near Fort McDowell to 40 inches on top of Mount Baldy.
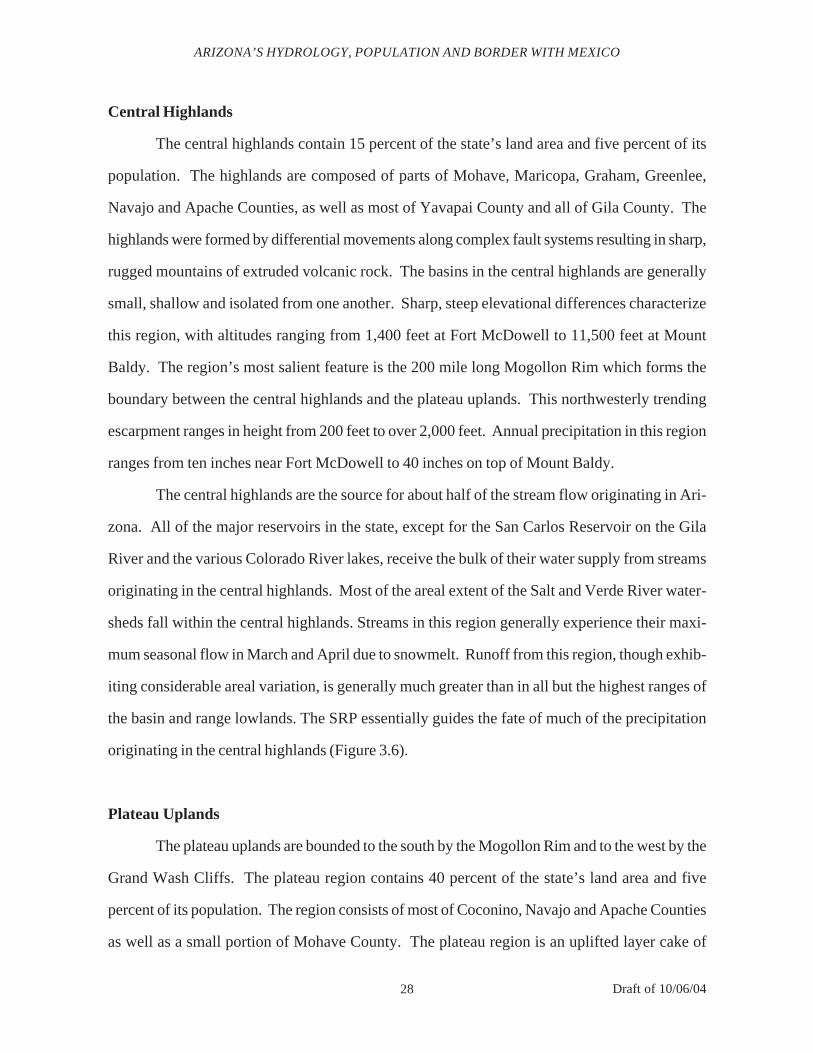
The central highlands are the source for about half of the stream flow originating in Ari-
zona. All of the major reservoirs in the state, except for the San Carlos Reservoir on the Gila
River and the various Colorado River lakes, receive the bulk of their water supply from streams
originating in the central highlands. Most of the areal extent of the Salt and Verde River water-
sheds fall within the central highlands. Streams in this region generally experience their maxi-
mum seasonal flow in March and April due to snowmelt. Runoff from this region, though exhib-
iting considerable areal variation, is generally much greater than in all but the highest ranges of
the basin and range lowlands. The SRP essentially guides the fate of much of the precipitation
originating in the central highlands (Figure 3.6).
Plateau Uplands
The plateau uplands are bounded to the south by the Mogollon Rim and to the west by the
Grand Wash Cliffs. The plateau region contains 40 percent of the state’s land area and five
percent of its population. The region consists of most of Coconino, Navajo and Apache Counties
as well as a small portion of Mohave County. The plateau region is an uplifted layer cake of
29 Draft of 10/06/04
ARIZONA’S HYDROLOGY, POPULATION AND BORDER WITH MEXICO
sedimentary rocks consisting mostly of sandstones interspersed with shales and limestones. The
relatively flat uplands are topped with eroding mesas and punctuated with volcanic buttes as well
as the towering San Francisco Mountains, the remnants of an ancient volcano. Without taking
into account the deeply entrenched Grand Canyon, the region ranges in altitude from 4,200 feet
near Cameron to 12,600 feet atop Humphreys Peak in the San Francisco Mountains. Annual
precipitation ranges from just six inches near Cameron to 35 inches on Humphreys Peak.
Much of the plateau uplands region consists of barren plateaus and mesas that are ringed
with the moisture-robbing Kaibab, San Francisco, Mogollon and White Mountains. With the
30 Draft of 10/06/04
ARIZONA’S HYDROLOGY, POPULATION AND BORDER WITH MEXICO
exception of the moisture intercepted by these surrounding highlands, little runoff originates in
this region. The stream flows that do descend from these highlands reach their maximum in the
spring as snowmelt occurs. Stream flow from the region’s lower central plateaus is usually con-
fined to the summer months and occurs only in response to intense thunderstorms. Outside the
localized streambed deposits, groundwater production in the plateau uplands is often poor. The
Little Colorado River Basin does contain three large regional aquifers, though availability and
quality vary (Figure 3.4 and Appendix G).
POPULATION GROWTH
Although Arizona is a high-growth state, many residents take this condition for granted
and have become blasé about the remarkable transformations that have occurred over the last
half-century. A review of the record of Arizona’s growth reveals some eye-popping results
(Table 3.1). The two most striking aspects shown in this half century of growth are the sheer
magnitude of that growth and its great variability across the state. In both the 1950s and 1960s
Arizona added about 50,000 residents per year. During the 1970s and 1980s the state added
about 95,000 residents per year. The boom decade of the 1990s brought in nearly 150,000
people per year. And despite a mild national recession at the start of this decade, Arizona added
nearly a half million people between April 1, 2000 and July 1, 2003.
The great range in the rate of population growth in Arizona’s counties highlights the fact
that the state’s man-made environment is as variable as its physical environment. With the con-
solidation, mechanization and decline of its copper industry, Greenlee County lost a third of its
populace between 1950 and 2000. Gila County’s mining economy has suffered even greater
decline, but the resulting population losses have been more than offset by the second home and
retirement home boom in the Payson-area high country. On the opposite end of the scale, Mohave
County’s population shot up 17-fold over the last half-century as people flocked to the Colorado
River Cities of Bullhead and Lake Havasu. The fact that Maricopa County’s enormous popula-
tion climbed by over 800 percent in the last five decades is testimony to the great appeal of its
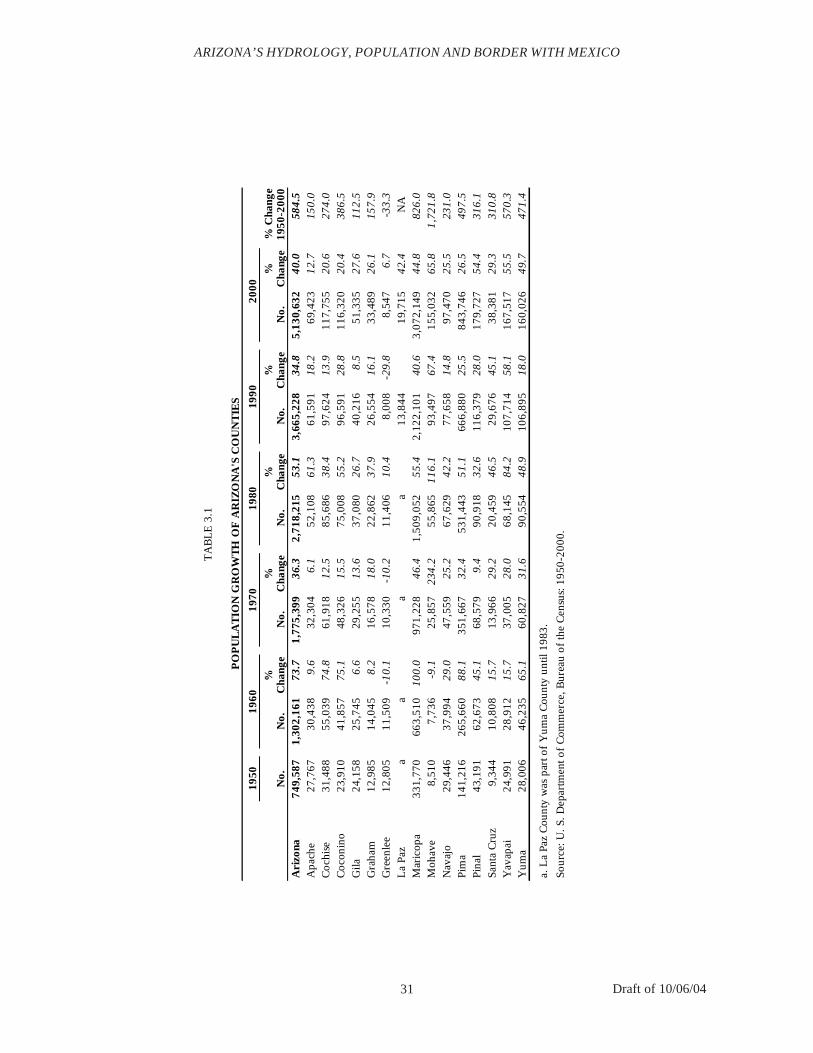
31 Draft of 10/06/04
ARIZONA’S HYDROLOGY, POPULATION AND BORDER WITH MEXICO
TA
BL
E 3
.1
PO
PU
LA
TIO
N G
RO
WT
H O
F A
RIZ
ON
A'S
CO
UN
TIE
S
1950
19
60
1970
19
80
1990
20
00
%%
%%
%%
Cha
nge
No.
No.
Cha
nge
No.
Cha
nge
No.
Cha
nge
No.
Cha
nge
No.
Cha
nge
1950
-200
0A
rizo
na74
9,58
71,
302,
161
73.7
1,77
5,39
936
.32,
718,
215
53.1
3,66
5,22
834
.8
5,13
0,63
240
.058
4.5
Apa
che
27,7
6730
,438
9.6
32,3
046.
152
,108
61.3
61,5
9118
.269
,423
12.7
150.
0C
ochi
se31
,488
55,0
3974
.861
,918
12.5
85,6
8638
.497
,624
13.9
117,
755
20.6
274.
0C
ocon
ino
23,9
1041
,857
75.1
48,3
2615
.575
,008
55.2
96,5
9128
.811
6,32
020
.438
6.5
Gila
24,1
5825
,745
6.6
29,2
5513
.637
,080
26.7
40,2
168.
551
,335
27.6
112.
5G
raha
m12
,985
14,0
458.
216
,578
18.0
22,8
6237
.926
,554
16.1
33,4
8926
.115
7.9
Gre
enle
e12
,805
11,5
09-1
0.1
10,3
30-1
0.2
11,4
0610
.48,
008
-29.
88,
547
6.7
-33.
3
La
Paz
aa
a
a
13
,844
19
,715
42.4
NA
M
aric
opa
331,
770
663,
510
100.
097
1,22
846
.41,
509,
052
55.4
2,12
2,10
140
.63,
072,
149
44.8
826.
0M
ohav
e8,
510
7,73
6-9
.125
,857
234.
255
,865
116.
193
,497
67.4
155,
032
65.8
1,72
1.8
Nav
ajo
29,4
4637
,994
29.0
47,5
5925
.267
,629
42.2
77,6
5814
.897
,470
25.5
231.
0Pi
ma
141,
216
265,
660
88.1
351,
667
32.4
531,
443
51.1
666,
880
25.5
843,
746
26.5
497.
5Pi
nal
43,1
9162
,673
45.1
68,5
799.
490
,918
32.6
116,
379
28.0
179,
727
54.4
316.
1
Sant
a C
ruz
9,34
410
,808
15.7
13,9
6629
.220
,459
46.5
29,6
7645
.138
,381
29.3
310.
8Y
avap
ai24
,991
28,9
1215
.737
,005
28.0
68,1
4584
.210
7,71
458
.116
7,51
755
.557
0.3
Yum
a28
,006
46,2
3565
.160
,827
31.6
90,5
5448
.910
6,89
518
.016
0,02
649
.747
1.4
a. L
a Pa
z C
ount
y w
as p
art o
f Y
uma
Cou
nty
until
198
3.
Sour
ce: U
. S. D
epar
tmen
t of
Com
mer
ce, B
urea
u of
the
Cen
sus:
195
0-20
00.
32 Draft of 10/06/04
ARIZONA’S HYDROLOGY, POPULATION AND BORDER WITH MEXICO
vigorous economy. The third fastest growing county in the last half-century was Yavapai, which
has drawn people in with its pleasant climate, the small town charm of Prescott and the affordable
home prices of Prescott Valley.
Between 2000 and 2003 Arizona’s population grew by 499,238 or 9.7 percent according
to Arizona Department of Economic Security (DES) estimates. Five counties exceeded that
growth rate: Pinal, Yavapai, Coconino, Maricopa and Mohave. Coconino County has some
communities that are encountering difficulties providing adequate water supplies during the cur-
rent drought and the Prescott Active Management Area is finding itself challenged to achieve its
safe-yield groundwater mandate even before the eventual construction of the thousands of new
homes slated for the Prescott and Chino Valleys. Both Coconino and Yavapai Counties may not
be able to sustain their current high growth rates far into the future.
FORECASTING POPULATION GROWTH
Forecasting is an inherently problematic task and the chances for significant error grow
with the length of the forecast. The rate of recent population growth in Arizona has not been
steady for either the state or the constituent counties. Migration, which is responsible for more
than two-thirds of Arizona’s population growth, is highly cyclical, rising and falling in reaction to
the economic cycle. Other factors that affect migration rates include demographic trends such as
the graying of America, the relative attractiveness of other regions and sharp changes in the rates
of international migration. Given this uncertainty, the concept of accurate population forecasts
for a high-growth state such as Arizona, and especially for individual counties or sub-county
areas, is almost an oxymoron.
The Population Statistics Unit of the DES develops Arizona’s official population projec-
tions. The projections are supposed to be updated on a regular basis as benchmark data from the
U.S. Census and other sources becomes available. However, the most recent DES population
projections appeared in 1997 and are, at this point, at considerable variance with both current
U.S. Census and DES estimates. This matters because many State agencies, including the De-

33 Draft of 10/06/04
ARIZONA’S HYDROLOGY, POPULATION AND BORDER WITH MEXICO
TA
BL
E 3
.2
AC
TU
AL
200
0 A
ND
PR
OJE
CT
ED
PO
PU
LA
TIO
N O
F A
RIZ
ON
A'S
CO
UN
TIE
S
Per
cent
Cha
nge
Cou
nty
2000
2010
2020
2030
2040
2050
2000
-205
0A
rizo
na5,
130,
632
6,14
5,12
57,
363,
625
8,62
1,05
09,
863,
625
11,1
70,9
7511
7.7
Apa
che
69,4
2376
,650
85,7
7594
,700
103,
700
113,
225
63.1
C
ochi
se11
7,75
513
7,02
515
0,00
016
0,05
016
7,40
017
4,55
048
.2
Coc
onin
o11
6,32
014
7,35
016
9,35
018
9,87
521
1,62
523
5,70
010
2.6
G
ila
51,3
3554
,600
60,7
5066
,375
70,1
7573
,700
43.6
G
raha
m33
,489
43,5
0050
,675
57,3
5063
,500
69,2
5010
6.8
G
reen
lee
8,54
79,
600
10,2
7510
,975
11,6
2512
,325
44.2
L
a Pa
z19
,715
25,1
0029
,075
31,9
7533
,900
35,6
0080
.6
Mar
icop
a3,
072,
149
3,70
9,57
54,
516,
100
5,39
0,77
56,
296,
225
7,26
4,72
513
6.5
M
ohav
e15
5,03
219
4,40
023
6,40
027
0,77
529
5,05
031
6,95
010
4.4
N
avaj
o97
,470
99,9
7511
1,95
012
3,45
013
4,32
514
7,27
551
.1
Pim
a84
3,74
61,
031,
625
1,20
6,25
01,
372,
325
1,52
2,62
51,
671,
175
98.1
Pi
nal
179,
727
199,
725
231,
225
255,
700
273,
050
288,
525
60.5
Sa
nta
Cru
z38
,381
46,2
5055
,100
64,4
5073
,900
84,4
7512
0.1
Y
avap
ai16
7,51
719
8,05
024
0,85
027
8,42
530
5,67
533
1,45
097
.9
Yum
a16
0,02
617
1,70
020
9,85
025
3,85
030
0,85
035
2,05
012
0.0
Sou
rce:
U.S
. Dep
artm
ent o
f C
omm
erce
, Bur
eau
of th
e C
ensu
s, 2
000;
and
Ari
zona
Dep
artm
ent o
f E
cono
mic
S
ecur
it y, R
esea
rch
Adm
inis
trat
ion,
Pop
ulat
ion
Sta
tistic
s U
nit,
1997
.

34 Draft of 10/06/04
ARIZONA’S HYDROLOGY, POPULATION AND BORDER WITH MEXICO
partment of Water Resources, rely on the projections for planning purposes. A decadal synopsis
of the 1997 DES population projections appears in Table 3.2. It shows Arizona’s population
doubling in about the next 45 years, with growth especially high in Maricopa, Santa Cruz and
Yuma Counties.
Although the projected growth portrayed in Table 3.2 looks impressive, and perhaps
formidable from a water planning perspective, it now appears likely that the projections are too
low, perhaps by a wide margin. The 1997 DES projection for Arizona’s population in the year
2000 was 4,961,953, which was 168,679 people or 3.3 percent, fewer than the U.S. Census
counted in that year. The DES had projected that Arizona would add 355,502 people between
2000 and 2003, whereas the state appeared to have added 499,238 people in that time span, a
shortfall of 28.8 percent.
As would be expected, there is considerable variation between the 1997 DES projections
for 2003 and the estimates for that year among Arizona’s counties. The projections seem to have
put more people into Graham, Greenlee and La Paz Counties than recent estimates show are
there. Projections for Apache, Cochise, Coconino, Pima and Santa Cruz Counties were within
one and a half percent of contemporary estimates. However, the projections under-predicted the
2003 populations of several counties by wide margins: 5.1 percent in Mohave County, 5.8 per-
cent in Gila County, 6.4 percent in Maricopa County, 10.9 percent in Yavapai County, 11.1
percent in Navajo County, 13.8 percent in Pinal and 15.5 percent in Yuma County.
Arizona State University’s Center for Business Research projects the state’s population to
be 8,305,000 in 2020, according to its middle growth scenario. Extrapolating from that projec-
tion, Arizona’s population would reach 13,015,000 in 2050, nearly 2,000,000 more than the
DES projection for that year.
POPULATION GROWTH AND WATER USE
It has been estimated that in 1950 the statewide use of water for municipal and manufac-
turing purposes totaled 125,000 to 150,000 acre-feet, about three percent of all water used. A
35 Draft of 10/06/04
ARIZONA’S HYDROLOGY, POPULATION AND BORDER WITH MEXICO
more detailed analysis of water use in 1958 estimated that municipal usage accounted for 3.6
percent of all water used, mining accounted for 1.3 percent, manufacturing was 0.6 percent,
power generation 0.1 percent and crop agriculture consumed 93.4 percent. By 1970 municipal
and manufacturing use claimed a seven percent share of state water use, mining was using 2.7
percent of the water and agriculture accounted for 89 percent of all water used.
Estimates of water use by category reveal that accounting for water usage in Arizona is
not always as simple as it sounds. The Arizona Department of Water Resources estimated that
municipal and industrial use comprised 20 percent of statewide water use in 1990 and agriculture
accounted for the remaining 80 percent. The University of Arizona’s Water Resources Research
Center estimated that in that same year municipal usage was 16.3 percent of the total, industrial
use was 7.2 percent and agriculture used the remaining 76.5 percent of the state’s water. The
U.S. Geological Survey estimated that water withdrawals for Arizona in 1990 were 10.8 percent
for public supply, 1.6 percent for thermoelectric, 2.4 percent for mining and 80.7 percent for
irrigation. Clearly, estimates vary by use definition, categorization and estimating organization.2
Although accuracy and reliability of the Geological Survey estimates can be questioned,
they do have two significant virtues—they are conducted every five years, including the decadal
census years, and they are available for a variety of geographic areas, from individual drainage
basins to counties. The lack of regular and frequent reportage of water use data by agencies
within Arizona serves as a hindrance to understanding the changing dynamics of water use in
such a rapidly growing state. The availability of county-level water use data allows comparison
and analysis of water use in conjunction with demographic and economic data that is most typi-
cally available at the county level but not at the groundwater basin or drainage basin level.
Selected categories of water usage from the last three Geological Survey estimates are
presented in Table 3.3. Statewide total water use, which grew between 1990 and 1995, declined
slightly by 2000. Patterns of total water use in individual counties varied considerably, reflecting
changes in major usage categories over time. Maricopa County, the state’s largest water using
county, has had a steady decline in total water usage since 1990, despite a 56 percent increase in
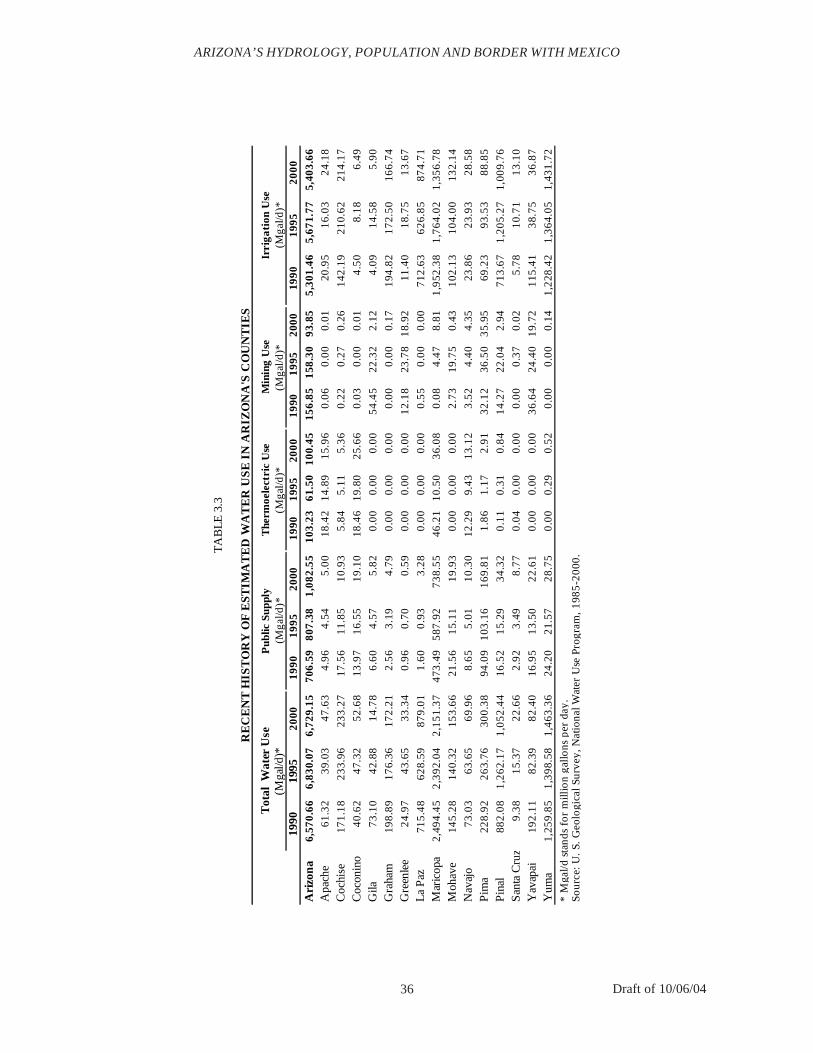
36 Draft of 10/06/04
ARIZONA’S HYDROLOGY, POPULATION AND BORDER WITH MEXICO
TA
BL
E 3
.3
RE
CE
NT
HIS
TO
RY
OF
EST
IMA
TE
D W
AT
ER
US
E I
N A
RIZ
ON
A'S
CO
UN
TIE
S
19
9019
9520
0019
9019
9520
0019
9019
9520
0019
9019
9520
0019
9019
9520
00
Ari
zon
a6,
570.
666,
830.
076,
729.
1570
6.59
807.
381,
082.
5510
3.23
61.5
010
0.45
156.
8515
8.30
93.8
55,
301.
465,
671.
775,
403.
66A
pach
e61
.32
39.0
347
.63
4.96
4.54
5.00
18.4
214
.89
15.9
60.
060.
000.
0120
.95
16.0
324
.18
Coc
hise
171.
1823
3.96
233.
2717
.56
11.8
510
.93
5.84
5.11
5.36
0.22
0.27
0.26
142.
1921
0.62
214.
17
Coc
onin
o40
.62
47.3
252
.68
13.9
716
.55
19.1
018
.46
19.8
025
.66
0.03
0.00
0.01
4.50
8.18
6.49
Gila
73.1
042
.88
14.7
86.
604.
575.
820.
000.
000.
0054
.45
22.3
22.
124.
0914
.58
5.90
Gra
ham
198.
8917
6.36
172.
212.
563.
194.
790.
000.
000.
000.
000.
000.
1719
4.82
172.
5016
6.74
Gre
enle
e24
.97
43.6
533
.34
0.96
0.70
0.59
0.00
0.00
0.00
12.1
823
.78
18.9
211
.40
18.7
513
.67
La
Paz
715.
4862
8.59
879.
011.
600.
933.
280.
000.
000.
000.
550.
000.
0071
2.63
626.
8587
4.71
Mar
icop
a2,
494.
452,
392.
042,
151.
3747
3.49
587.
9273
8.55
46.2
110
.50
36.0
80.
084.
478.
811,
952.
381,
764.
021,
356.
78
Moh
ave
145.
2814
0.32
153.
6621
.56
15.1
119
.93
0.00
0.00
0.00
2.73
19.7
50.
4310
2.13
104.
0013
2.14
Nav
ajo
73.0
363
.65
69.9
68.
655.
0110
.30
12.2
99.
4313
.12
3.52
4.40
4.35
23.8
623
.93
28.5
8
Pim
a22
8.92
263.
7630
0.38
94.0
910
3.16
169.
811.
861.
172.
9132
.12
36.5
035
.95
69.2
393
.53
88.8
5
Pin
al88
2.08
1,26
2.17
1,05
2.44
16.5
215
.29
34.3
20.
110.
310.
8414
.27
22.0
42.
9471
3.67
1,20
5.27
1,00
9.76
San
ta C
ruz
9.38
15.3
722
.66
2.92
3.49
8.77
0.04
0.00
0.00
0.00
0.37
0.02
5.78
10.7
113
.10
Yav
apai
192.
1182
.39
82.4
016
.95
13.5
022
.61
0.00
0.00
0.00
36.6
424
.40
19.7
211
5.41
38.7
536
.87
Yum
a1,
259.
851,
398.
581,
463.
3624
.20
21.5
728
.75
0.00
0.29
0.52
0.00
0.00
0.14
1,22
8.42
1,36
4.05
1,43
1.72
*
Mga
l/d s
tand
s fo
r m
illio
n ga
llons
per
day
.So
urce
: U. S
. Geo
logi
cal S
urve
y, N
atio
nal W
ater
Use
Pro
gram
, 198
5-20
00.
Irri
gati
on U
se(M
gal/d
)*M
inin
g U
seT
herm
oele
ctri
c U
se(M
gal/d
)*(M
gal/d
)*T
otal
Wat
er U
se(M
gal/d
)*P
ublic
Sup
ply
(Mga
l/d)*
37 Draft of 10/06/04
public supply use between 1990 and 2000, as the much larger irrigation use category fell by 30
percent over the same time period. This demonstrates the common notion that as cropland is
converted to residential neighborhoods water use declines.
Public supply water use, which provides the majority of residential and industrial water
use, grew in almost all counties between 1990 and 2000, and quite sharply between 1995 and
2000 in La Paz, Maricopa, Mohave, Navajo, Pima, Santa Cruz, Yavapai and Yuma Counties.
Public supply use in Cochise County declined by more than a third between 1990 and 2000.
Although thermoelectric water use is only about one and a half percent of total water use for the
state as a whole, it constitutes nearly a fifth of all water use in Navajo County, nearly a third of all
water use in Apache County and nearly a half of all water use in Coconino County. Mining
water use dropped precipitously in Arizona between 1995 and 2000, and especially so in Gila
and Pinal Counties as mines were closed in response to low copper prices. Gila County’s dra-
matic drop in mining water use between 1990 and 2000 caused an equally dramatic drop in total
water use, as mining’s share of all water use fell from 74 percent to 14 percent. Irrigation water
use in Arizona declined moderately between 1995 and 2000, led by large drops in Maricopa and
Pinal Counties. The trend was not universal however; irrigation water use in both Cochise and
Yuma Counties has climbed over the last ten years.
Factors that affect domestic water demand include the ethnic, income and age structure of
Arizona’s population, household size, housing type and residential lot size, water pricing, conser-
vation programs and climate changes. Water demand forecasts based on population projections
alone are likely to result in significant error, not only in terms of total demand, but also in terms of
indoor and outdoor demand, peak demand and seasonal demand. Incorporating factors such as
socio-demographics, housing stock changes and wealth is more difficult, but can greatly improve
water demand projections.
2 The long-term decline of agriculture’s role in the state’s economy is central to understandingtotal water use in Arizona. Appendix H describes this dramatic transformation during the last sixdecades.
ARIZONA’S HYDROLOGY, POPULATION AND BORDER WITH MEXICO
38 Draft of 10/06/04
SHARING WATER ALONG THE BORDER WITH MEXICO
The complexities of water issues are particularly knotty when it comes to watersheds and
water supplies that are shared with Mexico. The international boundary separates two different
legal systems with different political and decision-making structures, acutely different levels of
development and prosperity, different cultures, social structures and customs, and different per-
ceptions of environmental quality. These many differences come to the fore when actions in one
country affect the shared water resources of the other country. Appendix I assesses international
issues related to the San Pedro and Santa Cruz Rivers; the remainder of this chapter considers the
Colorado River.
The Colorado River
The Colorado River is the mightiest river in the driest part of North America. It drains a
242,000 square mile watershed that stretches over seven states and comprises nearly one-twelfth
of the land area of the continental United States. From its origin high in the Rocky Mountains of
Colorado, it flows for 1,450 miles before emptying into the upper end of the Gulf of California.
The Colorado, which means red in Spanish, got its name from the color of its sediment-rich
water. Historically, its flows were characterized by extreme variability both seasonally and annu-
ally, ranging from more than 24 million acre-feet some years to less than 5 million acre-feet in
drought years. Melting snows in the Rockies swelled its flow in the spring and the raging waters
were at their reddest as the flood waters picked up and moved millions of tons of sediment and
deposited them at its delta. By mid-summer the torrent would have abated considerably to be-
come a more placid and shallow stream. Needless to say, the Colorado River no longer is as it
was. The construction of Boulder Dam (now called Hoover Dam), which was completed in
1935, tamed the Colorado and evened out its flows. With the subsequent addition of Parker,
Davis and Glen Canyon Dams for storage and Imperial, Laguna and Morelos Dams for irrigation
diversion, the Colorado River was turned into a water storage and delivery system.
The first large-scale diversions of water from the lower Colorado River occurred in 1901.
ARIZONA’S HYDROLOGY, POPULATION AND BORDER WITH MEXICO
39 Draft of 10/06/04
The Colorado Development Company dredged a channel of the former Alamo River to create the
Alamo Canal that carried water downhill to its fields in the Imperial Valley west of Yuma. Since
the canal crossed the international border into Mexico before re-crossing the border at Mexicali,
the Mexican government required that half of the water from the canal be used on Mexican soil in
exchange for the concession to use the canal. The Colorado Development Company eventually
bought large tracts of land around Mexicali that it also developed into irrigated fields. Because
the Colorado River was as yet untamed, the intake for the Alamo Canal kept getting washed out
or silted up. In early 1905, the river started flowing through a new bypass into the canal and the
flow became uncontrollable. Water continued pouring through the Mexicali and Imperial Val-
leys to a low point 50 miles north of the border, where the ponded water became what is today the
Salton Sea.
Irrigated farming in the Mexicali and Imperial Valleys developed rapidly during the first
third of the Twentieth Century. During the 1930s, the Mexican government bought out most of
the Colorado River Land Company’s (the successor to the Colorado Development Company)
ownership of the Mexicali fields. As Mexican ownership of the Mexicali fields increased, so did
the binational competition to develop agricultural lands and efforts to claim rights for the water to
irrigate those lands.
In a 1906 legal ruling regarding the division of water from the upper Rio Grande between
the United States and Mexico, Attorney General Judson Harmon declared that in disputes over
international rivers, the country of origin retained the right to use as much of the disputed water as
it desired. With this ruling in mind, the United States ignored Mexico’s pleas to be included in the
talks between the seven Colorado River Basin states, which resulted in the Colorado River Com-
pact of 1922 and the Boulder Canyon Project Act of 1928 that together failed to apportion any
water to Mexico. This failure led Mexico to accelerate its efforts to develop as much irrigated
agriculture as it could on its side of the lower Colorado River valley in an attempt to define a
water usage history.
The Boulder Canyon Act also authorized the construction of the All-American Canal,
ARIZONA’S HYDROLOGY, POPULATION AND BORDER WITH MEXICO
40 Draft of 10/06/04
which carried Colorado River water directly to the Imperial Valley irrigation district without
traveling through Mexico. This further solidified the United States control over the waters of the
Colorado River. Mexico continued to receive Colorado River water through the Alamo Canal,
but it was now the very last water that was in the river.
The Mexican Water Treaty of 1945 allocated 1.5 million acre-feet of Colorado River
water to Mexico annually, with the provision that the amount could be increased to 1.7 million
acre-feet in wet years and reduced proportionally during years of extreme drought. The Treaty
did not explicitly guarantee a specific level of water quality, but instead stipulated that the deliv-
ered water be fit for domestic and agricultural use. The Treaty also allowed Mexico to build
Morelos Dam to the west of the City of Yuma to improve the flow of water to the Mexicali
Valley.
Settlers were irrigating alfalfa fields as early as 1875 along a stretch of the lower Gila
River called the Mohawk Valley, about 30 miles east of Yuma. By 1931, using electric pumps to
draw up underground water, the acreage under cultivation reached 6,200 acres. However, after
the completion of Coolidge Dam in 1935, the Gila River no longer delivered sufficient water to
replenish the Mohawk Valleys floodplain aquifers or to cleanse the poorly drained fields of accu-
mulated salts. The Mohawk Valley farmers therefore applied for, and eventually received, the
right to be included in the Gila Project, which was designed to bring Colorado River water to
irrigate Yuma Mesa. The Wellton-Mohawk Canal, which splits off of the Gila Gravity Main
Canal, was completed in 1957.
The delivery of Colorado River water failed to solve the Mohawk Valleys salinity prob-
lems. The irrigated acreage increased dramatically, and by 1959 there were 50,000 acres under
cultivation. The abrupt increase in irrigation and the area’s poor drainage qualities combined to
produce a sharp rise in the water table. As the groundwater rose to within four feet of the surface,
capillary action caused the water to be wicked up to the surface, depositing its salt load there
when the water evaporated. The solution to this problem was the installation of drainage wells
and the construction of a 58-mile long drainage channel to carry the tail-water to the Colorado
ARIZONA’S HYDROLOGY, POPULATION AND BORDER WITH MEXICO
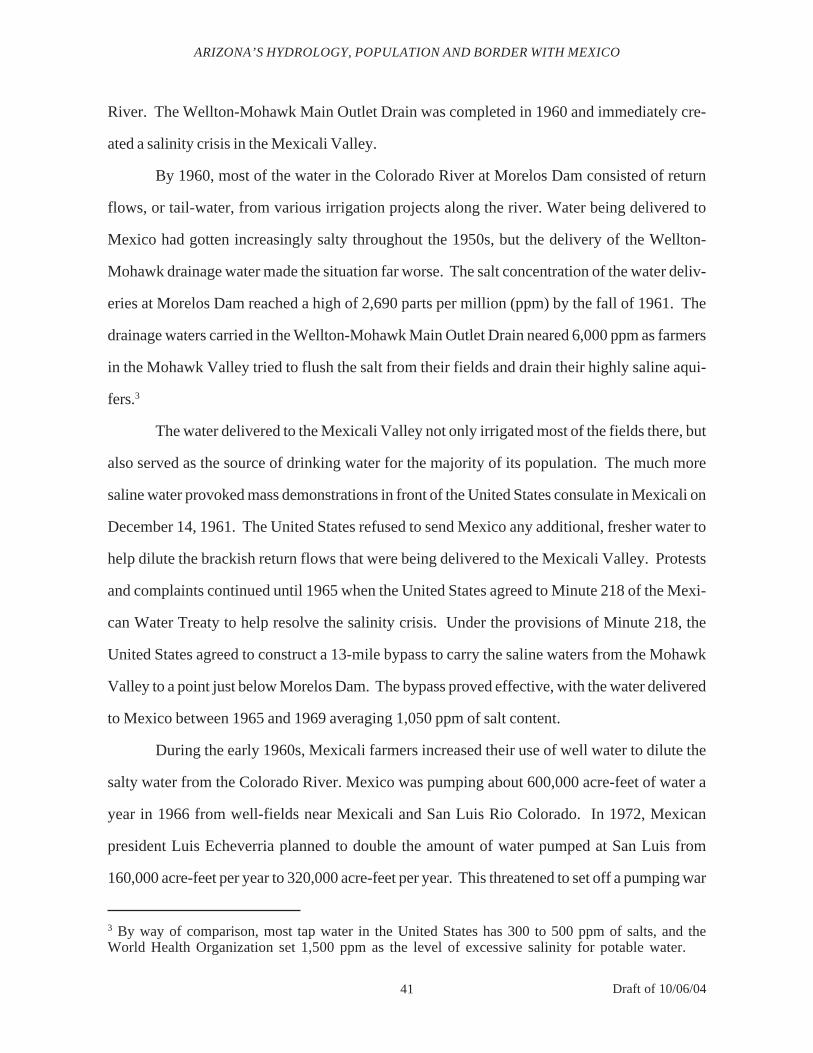
41 Draft of 10/06/04
River. The Wellton-Mohawk Main Outlet Drain was completed in 1960 and immediately cre-
ated a salinity crisis in the Mexicali Valley.
By 1960, most of the water in the Colorado River at Morelos Dam consisted of return
flows, or tail-water, from various irrigation projects along the river. Water being delivered to
Mexico had gotten increasingly salty throughout the 1950s, but the delivery of the Wellton-
Mohawk drainage water made the situation far worse. The salt concentration of the water deliv-
eries at Morelos Dam reached a high of 2,690 parts per million (ppm) by the fall of 1961. The
drainage waters carried in the Wellton-Mohawk Main Outlet Drain neared 6,000 ppm as farmers
in the Mohawk Valley tried to flush the salt from their fields and drain their highly saline aqui-
fers.3
The water delivered to the Mexicali Valley not only irrigated most of the fields there, but
also served as the source of drinking water for the majority of its population. The much more
saline water provoked mass demonstrations in front of the United States consulate in Mexicali on
December 14, 1961. The United States refused to send Mexico any additional, fresher water to
help dilute the brackish return flows that were being delivered to the Mexicali Valley. Protests
and complaints continued until 1965 when the United States agreed to Minute 218 of the Mexi-
can Water Treaty to help resolve the salinity crisis. Under the provisions of Minute 218, the
United States agreed to construct a 13-mile bypass to carry the saline waters from the Mohawk
Valley to a point just below Morelos Dam. The bypass proved effective, with the water delivered
to Mexico between 1965 and 1969 averaging 1,050 ppm of salt content.
During the early 1960s, Mexicali farmers increased their use of well water to dilute the
salty water from the Colorado River. Mexico was pumping about 600,000 acre-feet of water a
year in 1966 from well-fields near Mexicali and San Luis Rio Colorado. In 1972, Mexican
president Luis Echeverria planned to double the amount of water pumped at San Luis from
160,000 acre-feet per year to 320,000 acre-feet per year. This threatened to set off a pumping war
3 By way of comparison, most tap water in the United States has 300 to 500 ppm of salts, and theWorld Health Organization set 1,500 ppm as the level of excessive salinity for potable water.
ARIZONA’S HYDROLOGY, POPULATION AND BORDER WITH MEXICO
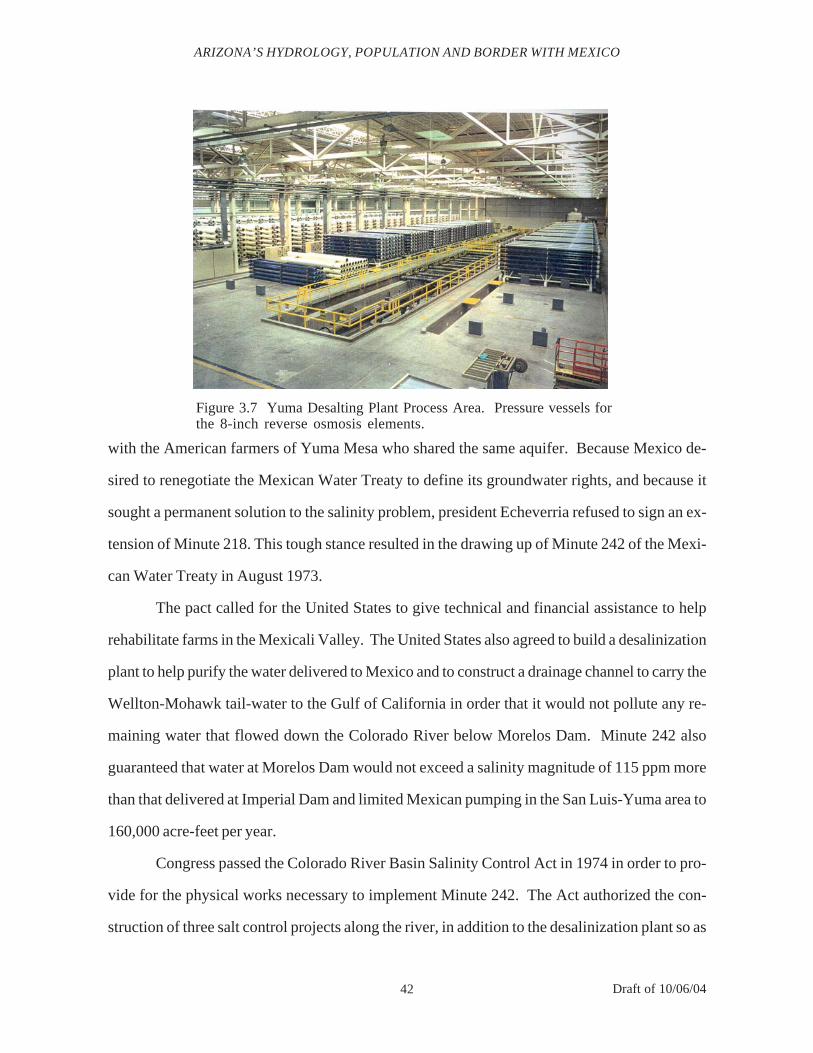
42 Draft of 10/06/04
with the American farmers of Yuma Mesa who shared the same aquifer. Because Mexico de-
sired to renegotiate the Mexican Water Treaty to define its groundwater rights, and because it
sought a permanent solution to the salinity problem, president Echeverria refused to sign an ex-
tension of Minute 218. This tough stance resulted in the drawing up of Minute 242 of the Mexi-
can Water Treaty in August 1973.
The pact called for the United States to give technical and financial assistance to help
rehabilitate farms in the Mexicali Valley. The United States also agreed to build a desalinization
plant to help purify the water delivered to Mexico and to construct a drainage channel to carry the
Wellton-Mohawk tail-water to the Gulf of California in order that it would not pollute any re-
maining water that flowed down the Colorado River below Morelos Dam. Minute 242 also
guaranteed that water at Morelos Dam would not exceed a salinity magnitude of 115 ppm more
than that delivered at Imperial Dam and limited Mexican pumping in the San Luis-Yuma area to
160,000 acre-feet per year.
Congress passed the Colorado River Basin Salinity Control Act in 1974 in order to pro-
vide for the physical works necessary to implement Minute 242. The Act authorized the con-
struction of three salt control projects along the river, in addition to the desalinization plant so as
ARIZONA’S HYDROLOGY, POPULATION AND BORDER WITH MEXICO
Figure 3.7 Yuma Desalting Plant Process Area. Pressure vessels forthe 8-inch reverse osmosis elements.
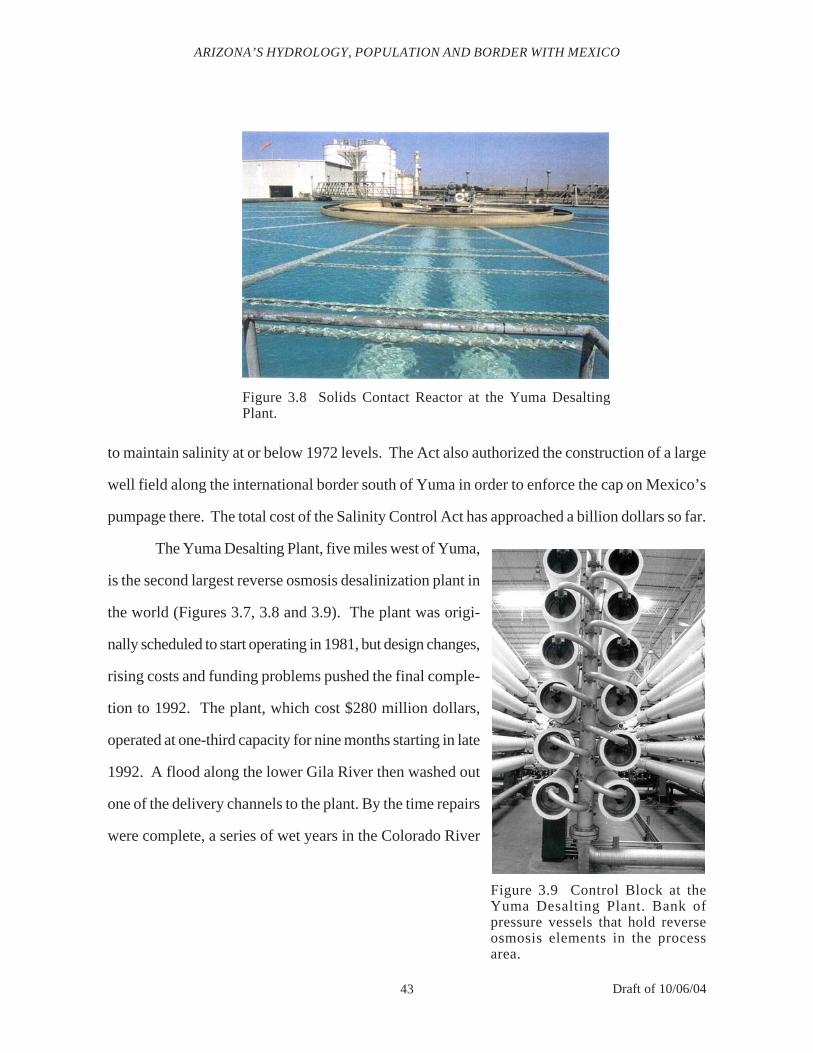
43 Draft of 10/06/04
Figure 3.8 Solids Contact Reactor at the Yuma DesaltingPlant.
Figure 3.9 Control Block at theYuma Desalting Plant. Bank ofpressure vessels that hold reverseosmosis elements in the processarea.
to maintain salinity at or below 1972 levels. The Act also authorized the construction of a large
well field along the international border south of Yuma in order to enforce the cap on Mexico’s
pumpage there. The total cost of the Salinity Control Act has approached a billion dollars so far.
The Yuma Desalting Plant, five miles west of Yuma,
is the second largest reverse osmosis desalinization plant in
the world (Figures 3.7, 3.8 and 3.9). The plant was origi-
nally scheduled to start operating in 1981, but design changes,
rising costs and funding problems pushed the final comple-
tion to 1992. The plant, which cost $280 million dollars,
operated at one-third capacity for nine months starting in late
1992. A flood along the lower Gila River then washed out
one of the delivery channels to the plant. By the time repairs
were complete, a series of wet years in the Colorado River
ARIZONA’S HYDROLOGY, POPULATION AND BORDER WITH MEXICO
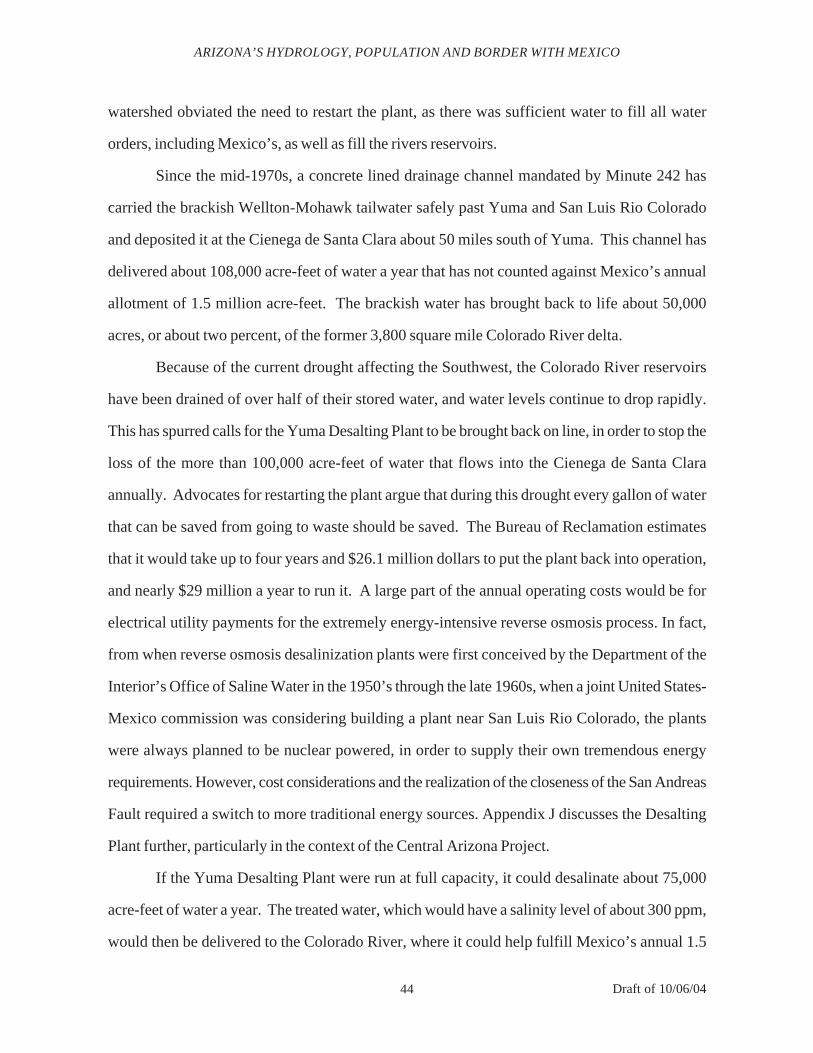
44 Draft of 10/06/04
watershed obviated the need to restart the plant, as there was sufficient water to fill all water
orders, including Mexico’s, as well as fill the rivers reservoirs.
Since the mid-1970s, a concrete lined drainage channel mandated by Minute 242 has
carried the brackish Wellton-Mohawk tailwater safely past Yuma and San Luis Rio Colorado
and deposited it at the Cienega de Santa Clara about 50 miles south of Yuma. This channel has
delivered about 108,000 acre-feet of water a year that has not counted against Mexico’s annual
allotment of 1.5 million acre-feet. The brackish water has brought back to life about 50,000
acres, or about two percent, of the former 3,800 square mile Colorado River delta.
Because of the current drought affecting the Southwest, the Colorado River reservoirs
have been drained of over half of their stored water, and water levels continue to drop rapidly.
This has spurred calls for the Yuma Desalting Plant to be brought back on line, in order to stop the
loss of the more than 100,000 acre-feet of water that flows into the Cienega de Santa Clara
annually. Advocates for restarting the plant argue that during this drought every gallon of water
that can be saved from going to waste should be saved. The Bureau of Reclamation estimates
that it would take up to four years and $26.1 million dollars to put the plant back into operation,
and nearly $29 million a year to run it. A large part of the annual operating costs would be for
electrical utility payments for the extremely energy-intensive reverse osmosis process. In fact,
from when reverse osmosis desalinization plants were first conceived by the Department of the
Interior’s Office of Saline Water in the 1950’s through the late 1960s, when a joint United States-
Mexico commission was considering building a plant near San Luis Rio Colorado, the plants
were always planned to be nuclear powered, in order to supply their own tremendous energy
requirements. However, cost considerations and the realization of the closeness of the San Andreas
Fault required a switch to more traditional energy sources. Appendix J discusses the Desalting
Plant further, particularly in the context of the Central Arizona Project.
If the Yuma Desalting Plant were run at full capacity, it could desalinate about 75,000
acre-feet of water a year. The treated water, which would have a salinity level of about 300 ppm,
would then be delivered to the Colorado River, where it could help fulfill Mexico’s annual 1.5
ARIZONA’S HYDROLOGY, POPULATION AND BORDER WITH MEXICO
45 Draft of 10/06/04
million acre-feet water allocation. The treated water would cost the United States about $311 per
acre-foot. The waste brine left over from the desalination process, at a salinity level of about
17,000 ppm (about half as salty as seawater), along with that portion of the Wellton-Mohawk
drainage water that went untreated, would then be delivered to the Cienega de Santa Clara. The
33,000 acre-feet of brine delivered to the Cienega each year would be less than a third of the
amount of water that currently flows there. Opponents of restarting the plant argue that this
would kill the recently rejuvenated Cienega and that less environmentally destructive method,
such as paying farmers to fallow land, should be considered.
In recent decades, environmentalists on both sides of the border have pressed for the
restoration of the Colorado River delta’s estuary habitat. They argue that a restored estuary
would not only support biodiversity and aid endangered species, but also would provide natural
wastewater filtration and treatment, nursery areas for fish and other marine organisms and eco-
nomic opportunities through recreational and other commercial uses. In 1993, the Mexican gov-
ernment established the Alto Golfo de California-Delta del Rio Colorado Biosphere Reserve to
safeguard the region. However, to date, the resources devoted to the Reserve have been minimal.
Dr. Edward Glenn, a professor of soil, water and environmental sciences at the Univer-
sity of Arizona, has estimated that sustaining a riparian corridor of native trees and other vegeta-
tion along a sixty mile reach of the Colorado River between Morelos Dam and the confluence
with the Rio Hardy would require a perennial flow of 50,000 acre-feet of water a year, along with
a simulated flood flow of 260,000 acre-feet of water every four years to regenerate trees and
cleanse the riverbanks of accumulated salt buildups. This would total 115,000 acre-feet of water
on an annualized basis and would be separate from the water needed to maintain the rejuvenated
Cienega de Santa Clara.
Thus far, the Mexican government has expressed no interest in such a project and de-
clines to devote any of its annual allocation of 1.5 million acre-feet of Colorado River water to
environmental uses. Arturo Herrera Solis, the commissioner of the Mexican section of the Inter-
national Boundary and Water Commission, has dismissed proposals to let the United States in-
ARIZONA’S HYDROLOGY, POPULATION AND BORDER WITH MEXICO
46 Draft of 10/06/04
clude the brackish water delivered to the Cienega de Santa Clara in Mexico’s annual river alloca-
tion. For its part, the United States does not want to use any more water from an already over-
allocated river to sustain an ecological project in another country.
However, even if drainage water were to continue to flow into the Cienega de Santa
Clara and additional water resources were dedicated to bringing back the main riparian section of
the Colorado River delta, the delta would still be a far cry from its character of a century ago. At
that time not only was the delta receiving some five trillion gallons of water a year, it was also
being invigorated by all the nutrients and sediment collected from its immense watershed. Prior
to construction of Glen Canyon Dam, the Colorado River near Phantom Ranch in the Grand
Canyon carried an average of 144 million tons of sediment a year. After the construction of the
dam the sediment load dropped to approximately18.7 million tons per year. The balance of the
sediment in now trapped in the bottom of Lake Powell. The accumulation of the trapped sedi-
ment not only deprives the delta of a necessary replenishing infusion, but also will eventually
convert Lake Powell from a reservoir into a terrace. To restore some measure of balance into the
Colorado River system would probably require the construction of a type of slurry conduit to
transport the sediment from where it is not wanted, Lake Powell, to where it is, the delta.
ARIZONA’S HYDROLOGY, POPULATION AND BORDER WITH MEXICO
47 Draft of 10/06/04
Chapter 4
CLIMATE, DROUGHT AND WATER SUPPLY
KATHY JACOBS
Climate drives Arizona’s water supply picture through both the supply and demand sides
of the equation. Air temperature has a strong impact on demand, while precipitation is our only
truly renewable source of water. Improving our understanding of past conditions and improving
our ability to predict likely future climate conditions will improve our adaptive capacity and limit
the negative economic impacts currently associated with climate extremes. Temperature and
precipitation patterns change on a daily, monthly, seasonal, inter-annual and decadal basis. Cli-
mate conditions, defined as prevailing weather conditions over a long period of time, do not
necessarily return to the same average condition, but rather the climate itself changes over
time. The southwestern United States has been unusually hot and dry in recent years, with 2002
being one of the driest years since the weather record began about a century ago. It is unclear
whether this is part of a long-term trend or the result of climate variability.
CURRENT DROUGHT CONDITIONS
The National Weather Service’s Arizona Drought Data site has a summary of precipita-
tion records for 83 Arizona stations. All stations in the state have developed a precipitation deficit
since 1998, the largest being Flagstaff, which has accumulated a 53.45-inch deficit. This is
almost three times the total normal annual rainfall of 22.91 inches. Research by the Climate
Assessment for the Southwest (CLIMAS) at the University of Arizona indicates that, across
Arizona, 1999 through 2003 was one of the driest five-year periods of winter precipitation in the
climate record.1 The National Drought Monitor produces a weekly map of drought conditions
1 For background on this subject, see http://www.ispe.arizona.edu/climas/research.html.

48 Draft of 10/06/04
nationwide.2 Figure 4.1 illus-
trates that the entire state was in
some degree of drought as of
September 23, 2004, ranging
from abnormally dry to extreme
drought.
Among the most visible
impacts of the drought have
been large-scale forest fires at
higher elevations throughout the
state, bark beetle infestations due
to drought-stressed trees across
the northern and eastern portions
of the state, significant statewide
impacts on cattle ranching due to
reduction in forage and changes
in habitat quality in key environ-
mental areas. In addition,
drought impacts on the water supply system have been substantial, with reservoirs on the Colo-
rado River at below 50 percent of capacity, the lowest level since Lake Powell was first filled,
Roosevelt Lake in the Salt River Project system currently at 28 percent (Figure 4.2) and ground-
water level declines documented throughout Arizona. Lake Powell is below ten million acre-feet
for the first time since May 1970; Lake Mead is at 14 million acre-feet for the first time since June
1964. Most other western states also have experienced critical water supply, wildfire and endan-
gered species issues.
CLIMATE, DROUGHT AND WATER SUPPLY
2 See http://www.drought.unl.edu/dm/monitor.html.
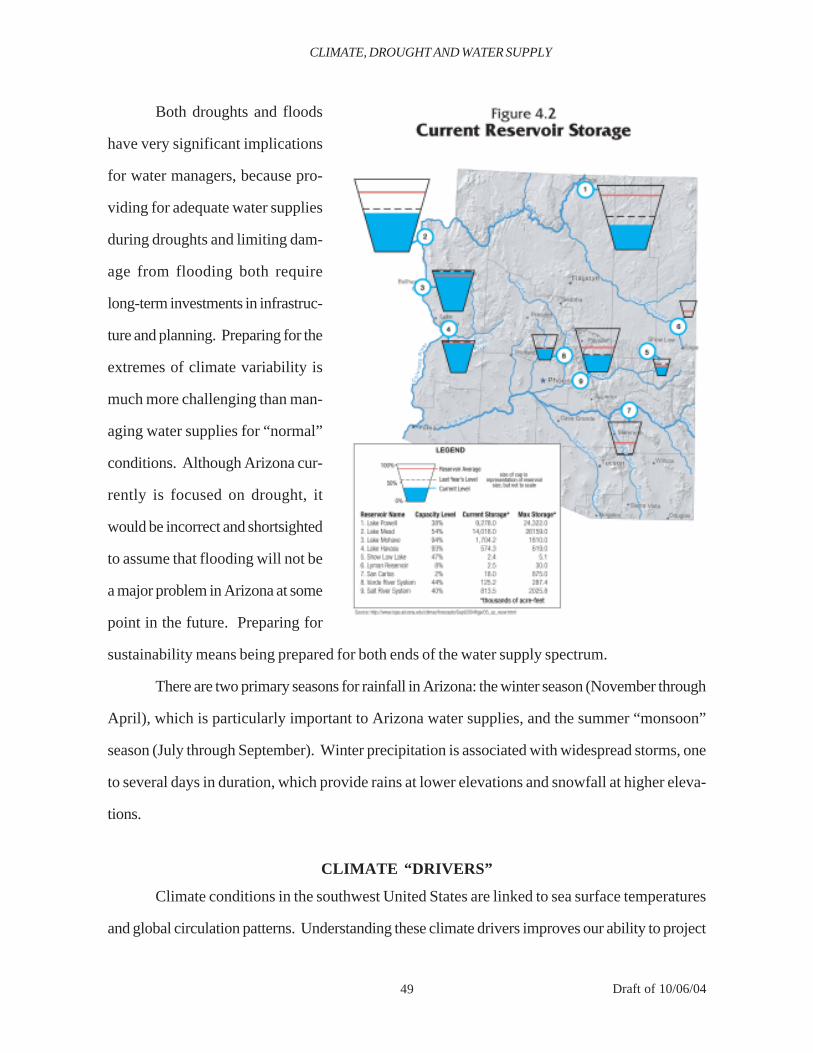
49 Draft of 10/06/04
Both droughts and floods
have very significant implications
for water managers, because pro-
viding for adequate water supplies
during droughts and limiting dam-
age from flooding both require
long-term investments in infrastruc-
ture and planning. Preparing for the
extremes of climate variability is
much more challenging than man-
aging water supplies for “normal”
conditions. Although Arizona cur-
rently is focused on drought, it
would be incorrect and shortsighted
to assume that flooding will not be
a major problem in Arizona at some
point in the future. Preparing for
sustainability means being prepared for both ends of the water supply spectrum.
There are two primary seasons for rainfall in Arizona: the winter season (November through
April), which is particularly important to Arizona water supplies, and the summer “monsoon”
season (July through September). Winter precipitation is associated with widespread storms, one
to several days in duration, which provide rains at lower elevations and snowfall at higher eleva-
tions.
CLIMATE “DRIVERS”
Climate conditions in the southwest United States are linked to sea surface temperatures
and global circulation patterns. Understanding these climate drivers improves our ability to project
CLIMATE, DROUGHT AND WATER SUPPLY
50 Draft of 10/06/04
probable future climate conditions. A key factor affecting winter precipitation is the El Niño-
Southern Oscillation (ENSO), which results from changes in equatorial Pacific Ocean sea sur-
face temperatures and associated atmospheric circulation. When ENSO is in its El Niño phase
due to warm temperatures in the eastern Pacific, Arizona frequently receives above average win-
ter precipitation. In the La Nina (cool) phase of ENSO, drought conditions generally prevail in
the southwest, though there are exceptions in both cases.
Summer precipitation currently is not well understood from the perspective of climate
“drivers,” but it is associated with the North American monsoon and typically is of high intensity
and short duration. Precipitation provided by the monsoons may be locally very important from
a range, forage and soil moisture perspective, but it varies substantially from place to place and is
not as important as winter precipitation for filling Arizona’s reservoirs.
Improved climate predictions can have great importance from an economic perspective
because drought causes severe hardship for some sectors, and there are many adaptive actions
that can be taken to limit impacts (Christensen et al., 2004). Very significant contributions to
understanding the history of climate conditions and drought over the past 1,000 years have been
made by the Laboratory of Tree Ring Research at the University of Arizona and others studying
a variety of proxy records such as ice, sediment and coral reef cores (Figure 4.3). For example,
although the amount of water allocated
among the Colorado River basin states and
Mexico is 16.5 million acre-feet and the
measured flow at the time of the Colorado
Compact in 1922 was 15.8 million acre-
feet, long-term tree ring records show an
average flow of only 13.5 million acre-feet.
Other evidence indicates that the average
long-term flow may be even lower. Thus,
CLIMATE, DROUGHT AND WATER SUPPLY
Figure 4.3 Colorado River Flow, 1500-1950.

51 Draft of 10/06/04
the Colorado River is over-allocated, potentially leading to additional conflict between the states.
The combination of a long-term record of climate conditions, which provides evidence of more
severe, sustained droughts in the past than those experienced in this century, and new understand-
ing of multi-decade climate variability patterns both lead to concerns about the reliability of future
water supplies to serve Arizona’s growing population (Jacobs and Garfin, in press).
An understanding of long-term trends in climate conditions is needed in order to give
context to Arizona’s water supply planning. For example, when compared to the tree-ring records
of the last 1,000 years, it appears that the last quarter of the twentieth century was abnormally wet.
Yet, the 30-year period from 1970 to 2000 is the time frame most commonly used to calculate the
“average” climate conditions for Arizona. If this time period was anomalously wet, as most
experts believe, water supply planning in the coming decades could be very problematic because
our assumptions about supply availability will have been overly optimistic. The previous 30-year
period of 1940 to 1970 contained the noted drought of the 1950s, which would have provided a
very different view of the “average” conditions.
Rapid “step” changes from one climate regime to another, such as the recent transition
from a multi-decade wet period to serious drought, may be associated with major ecological
change, especially wildfires. High levels of precipitation result in a buildup of forest fuels. Drought
following this buildup is likely to result in massive fire damage, such as has recently been experi-
enced in Colorado and Arizona (Swetnam and Betancourt, 1998). Thus, climate factors need to
be considered in addition to fire suppression in explaining current forest conditions.
Enhanced ability to predict probable future climate trends may be a significant tool for
resource managers in the future. For example, information about the likelihood of a wet winter
could allow reservoir managers to release more water to ensure that there is adequate flood flow
protection. Conversely, a projection of dry conditions might result in curtailing reservoir releases.
For this reason, recent increases in understanding the implications of multi-decade phases in the
sea surface temperatures of both the Pacific and Atlantic Ocean basins may become very impor-
tant. In the Pacific Ocean, a feature called the Pacific Decadal Oscillation (PDO) has been
CLIMATE, DROUGHT AND WATER SUPPLY
52 Draft of 10/06/04
associated with winter precipitation variations in the western United States (Mantua et al., 1997;
McCabe and Dettinger, 1999; and Sheppard et al., 2002). The PDO appears to have a 20 to 30
year cycle that may be related to long-term climatic conditions in Arizona. Sea surface tempera-
tures and western United States drought patterns since 1999 indicate the possibility that the PDO
might have shifted to a phase favoring dry conditions in Arizona for the next ~20 years. Multi-
decadal temperature changes in the Atlantic Ocean (the Atlantic Multi-decadal Oscillation) also
have recently been found to be associated with dry conditions in Arizona (McCabe et al., 2004).
If this is true, Arizona may not be well prepared for the implications, due to the high likelihood of
impacts on the Central Arizona Project (CAP) system in the relatively short term. Shortage
sharing discussions, now ongoing between the seven Colorado River basin states and within
Arizona, are of great importance in preparing for this possibility.
POLICY IMPLICATIONS OF GLOBAL WARMING FORWATER SUPPLY PLANNING
In addition to natural variability in climate, long-term human-induced climate change also
is altering the hydrologic cycle in important ways. There is evidence that the Colorado and other
western rivers are already being affected by changes in snowpack that are likely to be related to
global warming. Increases in temperature affect the rate of evaporation and water use by plants,
lowering soil moisture and increasing stress on water supplies. The key challenge for water
managers, who traditionally have looked at past climate conditions as an indicator of the future, is
anticipating the ways in which climate change may lead to new extremes or possibly even abrupt
changes in the climate system.
The earth’s surface has warmed over one degree Fahrenheit over the last century, leading
to melting glaciers and ice caps, sea level rise, extended growing seasons and changes in the
geographical distributions of plant and animal species documented by, among others, the Na-
tional Research Council and the Intergovernmental Panel on Climate Change (Figure 4.4). Al-
though the average temperature change seems small in comparison to daily temperature fluctua-
tions, the warming is not spread evenly over the globe. It is concentrated most heavily at higher
CLIMATE, DROUGHT AND WATER SUPPLY
53 Draft of 10/06/04
latitudes, and the impacts are most visible near the poles.
Uncertainties remain about the magnitude and effects of future climate change, but almost
all global climate models show that even very conservative assumptions about continued in-
creases in temperature in the two degree Centigrade range over the next 100 years lead to key
impacts from a water supply perspective. The most important consequence for the western United
States, other than increasing evaporation and plant water use, is a reduction in snowpack and
changes in runoff patterns (US Global Change Research Program, 2000). These changes may
require new investments in storage and water delivery facilities as well as changes in water de-
mand patterns to ensure sufficient water supply availability in critical areas. The primary policy
CLIMATE, DROUGHT AND WATER SUPPLY
FossilFuels
Land-useChange
1000 Years of Global CO2 and Temperature Change
Carbon Emissions (bt)
CO2 Concentrations (ppmv)
FossilFuels
Land use
Temperature Change (F)
Figure 4.4 Global warming phenomenon.

54 Draft of 10/06/04
implication of climate change is that it is likely to increase competition for water by increasing
demand while simultaneously reducing supplies that are dependent on snowpack. Water-depen-
dent habitats, such as riparian corridors in the southwest, have been identified as being among the
natural ecosystems most vulnerable to climate change and, therefore, natural resource managers
may have additional challenges ahead.
DROUGHT PLANNING AND ADAPTATION OPTIONS IN ARIZONA
Virtually all parts of Arizona currently have a cumulative water supply deficit due to
lower than average precipitation over multiple years. However, Arizona’s major urban areas,
Phoenix and Tucson, were until recently thought to be somewhat insulated from the impacts of
drought because of past federal and state investments in water supply sources such as the Salt
River Project and the CAP. In addition, Arizona’s efforts to manage the groundwater supplies in
the Active Management Areas of the state have made substantial contributions to reducing drought
impacts in those areas. However, recent drought conditions have raised awareness of the need
for a comprehensive state drought plan, including ways to address the possibility of long-term,
sustained drought conditions as well as short-term emergencies.
The most urgent need for drought planning is in the growing cities, towns and communi-
ties in the rural parts of the state, especially in the Central Highlands, the southeastern parts of the
state and the Colorado Plateau where alternative water supplies generally are very limited and the
economy, particularly the grazing, recreation and forestry-related sectors, is strongly affected by
drought. The environmental impacts of drought generally are more difficult to manage than the
societal impacts, and there are limited ways to limit the impacts on wildlife and vegetation.
DROUGHT TASK FORCE
In response to the current drought and in recognition of the need for better planning,
Governor Janet Napolitano established the Governor’s Drought Task Force by executive order
on March 20, 2003, requiring three major products:
• A short-term drought plan for the summer of 2003 that was adopted on July 10, 2003
CLIMATE, DROUGHT AND WATER SUPPLY
55 Draft of 10/06/04
and amended on June 10, 2004 for use in 2004;
• A long-term drought mitigation and coordination plan to address various specifiedareas of concern, i.e., the Arizona Drought Preparedness Plan itself; and
• Development and implementation of a statewide water conservation strategy.
The Drought Task Force is composed of various state agencies and elected officials.
Workgroups were established to solicit input from the municipal and industrial sectors, irrigated
agriculture, environmental and resource management interests, tribal governments and the com-
merce, recreation and tourism sectors. In addition, public and private sector volunteers who
supply much-needed expertise directly supported the planning process. The Task Force also was
aided by experts from the National Drought Mitigation Center and supported financially by the
United States Department of the Interior, Bureau of Reclamation. Current expectations are that
the drought plan will be adopted in October 2004.
Drought is cumulative and does not affect all economic sectors in the same ways. The
proposed Arizona Drought Preparedness Plan3 is designed to respond to the differences in water
supply availability and drought vulnerability for each sector and geographic area. The plan con-
tains a separate section called the “Operational Drought Plan,” which addresses the recommended
adaptation, mitigation and response activities.
APPROACH AND OBJECTIVES OF THE DROUGHT PLAN
The adopted mission statement for the Governor’s Drought Task Force is to develop a
sustainable drought planning process for Arizona that includes:
• Timely and reliable monitoring of drought and water supply conditions in the stateand an assessment of potential impacts;
• An assessment of the vulnerability of key sectors, regions, and population groups inthe state and potential actions to mitigate those impacts; and
CLIMATE, DROUGHT AND WATER SUPPLY
3 http://www.water.az.gov/gdtf/.
56 Draft of 10/06/04
• Assisting stakeholders in preparing for and responding to drought impacts, includingdevelopment of a statewide water conservation strategy and public awareness pro-gram.
The focus on a sustainable drought planning process, one that continues over time regard-
less of current drought status, has been a key objective from the beginning of this effort. How-
ever, sustaining the drought planning process over time will be resource intensive and the source
of resources is not yet clear.
The Drought Task Force adopted for the summers of 2003 and 2004 an emergency Po-
table Water Plan that focused on communities that have had drought-related supply problems in
the past. Response activities such as trucking of water are coordinated through the Arizona Divi-
sion of Emergency Management (ADEM). However, the longer-term Operational Drought Plan
will include a network of monitoring and response agencies and committees to address most
drought planning and response. While there is no funding for implementation of the Drought Plan
at this time, it does makes recommendations regarding funding and staffing.
The Drought Task Force developed a planning process that encourages the use of the
latest scientific information, particularly the use of climate forecasts and monitoring data at the
regional scale to enhance the utility of drought-related information for decision-makers. It is hoped
that providing longer-term climate projections, even those that are relatively uncertain, can pro-
vide valuable information about the possible range and intensity of drought. Such projections
allow a broader assessment of potential drought impacts and identification of early steps to reduce
vulnerability and enhance adaptive capacity.
Key vulnerabilities have been identified within the rural portions of the state, related pri-
marily to whether the supply source is drought prone and whether alternative water supplies are
available. The Arizona Short-Term Potable Water Plan, updated in June of 2004, noted that
several providers had been put into an emergency situation by the recent drought, with some
requiring trucked water. Others were identified as at risk. Based on information from the ADEM,
Arizona Department of Environmental Quality, Arizona Corporation Commission and Arizona
CLIMATE, DROUGHT AND WATER SUPPLY
57 Draft of 10/06/04
Department of Water Resources (ADWR) Rural Watershed Initiative Program, systems with
historic drought related problems have been identified in or near the communities of Sonoita,
Nicksville, Pine, Strawberry, Payson, Chloride, Dolan Springs, Bellemont, Mayer, Summerhaven,
Ashfork, Black Canyon City, Cottonwood, Eager, Seligman, Tusayan, Kirkland and Williams.
ARIZONA DROUGHT PREPAREDNESS PLAN
The Arizona Drought Preparedness Plan acknowledges that drought affects multiple sec-
tors in the same location differently and establishes trigger mechanisms4 or thresholds that are
related to the vulnerability of each sector and region rather than establishing statewide drought
stages. This approach is imperative in a state that is so dependent on imported surface water
supplies from the Colorado River, with reservoirs that hold a multi-year water supply and large
groundwater reserves. In the portions of the state that do not have these long-term, generally
reliable water supplies, sectors such as grazing and recreation are likely to be in serious drought
status more commonly than the major urban areas. The Plan is intended to be compatible with
existing institutions and water management activities and to focus on local government adapta-
tion and response options. The current draft indicates that communities may be required to de-
velop their own drought plans.
General recommendations in the Plan include:
• Fund a Drought Coordinator and two half-time staff persons to be located at the ADWR,in addition to adequately funding the State Climatologist, who will share responsibili-ties (1) to improve the state’s preparedness through implementation, assessment andimprovements to the Drought Preparedness Plan, including database development,monitoring enhancements and meeting coordination, and (2) to ensure that the droughtplanning process is maintained.
• Facilitate and encourage coordinated water planning between counties, cities and waterproviders.
• Require all potable water systems to develop a Drought Contingency Plan. This Plan
4 Crossing identified threshold conditions results in a change in drought status and may “trigger” particularresponses in the affected area.
CLIMATE, DROUGHT AND WATER SUPPLY
58 Draft of 10/06/04
could be part of an overall Water Plan for each system. Including a drought compo-nent and a water conservation component.
• Explore the need for and make recommendations on having potable water systemsprovide consistent and coordinated water supply information in order to identify thewater uses within the system and ensure reductions during times of critical need.
• Initiate immediately the Local Area Impact Assessment Groups to identify a structureand contacts and to facilitate the implementation of the Arizona Drought Prepared-ness Plan.
Proposed membership in Local Area Impact Assessment Groups consist of the following:
• County Government (Co-Chair)–County Emergency Manager• County Extension Agent (Co-Chair)• Rural Watershed Alliance Chair (Co-Chair)• ADWR (Monitoring Committee Liaison)• Local Governments• Potable Water Providers• Other Local Water suppliers• Tribal Government• Local Non-Governmental Organizations• Arizona Game and Fish• Irrigation Districts• Watershed Groups• Natural Resource Conservation Districts
Tables found in Appendix I of the Operational Drought Plan5 list sources of drought
vulnerability as well as adaptation and mitigation options for municipal and industrial, agricul-
tural, commerce, recreation and tourism, Indian nations and wildlife and watershed health.
5 http://www.water.az.gov/gdtf/.
CLIMATE, DROUGHT AND WATER SUPPLY
59 Draft of 10/06/04
Chapter 5
WATER RIGHTS, SOURCES AND ISSUES
KATHY JACOBS
Arizonans rely on four sources of water to meet their water demands: Colorado River
water, other surface water, effluent and groundwater. Arizona’s water supplies are physically
constrained by climate conditions, but they also are legally constrained through interstate and
international compacts, federal decrees and state law. Although surface water rights in Arizona
are based on the relatively common “prior appropriation” or “first in time, first in right” system,
the groundwater rights within the Active Management Areas (AMAs) are unique. This chapter
discusses the legal definitions of the sources of water, the water rights systems and issues associ-
ated with those systems. The issues described include institutional limits on sustainability.
SOURCES OF WATER
Colorado River Water
The Colorado River flows through seven states and Mexico prior to discharging into the
Gulf of California. Its flows are managed through a series of dams and diversions. Table 5.1
shows the allocation of the waters of the Colorado River between the four Upper Basin states,
three Lower Basin states and Mexico. The Upper Basin is allocated by percentages, while the
Lower Basin is allocated by volume. Arizona is allocated 2.8 million acre-feet from the Colorado
River. Colorado River water used in Arizona is subject to Congressional acts, interstate and
international compacts as well as court decrees, collectively known as the Law of the River. The
“water master,” the decision-making authority for the Lower Colorado, is the Secretary of the
Interior, who manages the river through the U.S. Bureau of Reclamation. The Colorado River
provides on average about 39 percent of Arizona’s water supplies. The Arizona Department of
Water Resources (ADWR) is responsible for making recommendations to the Secretary of the
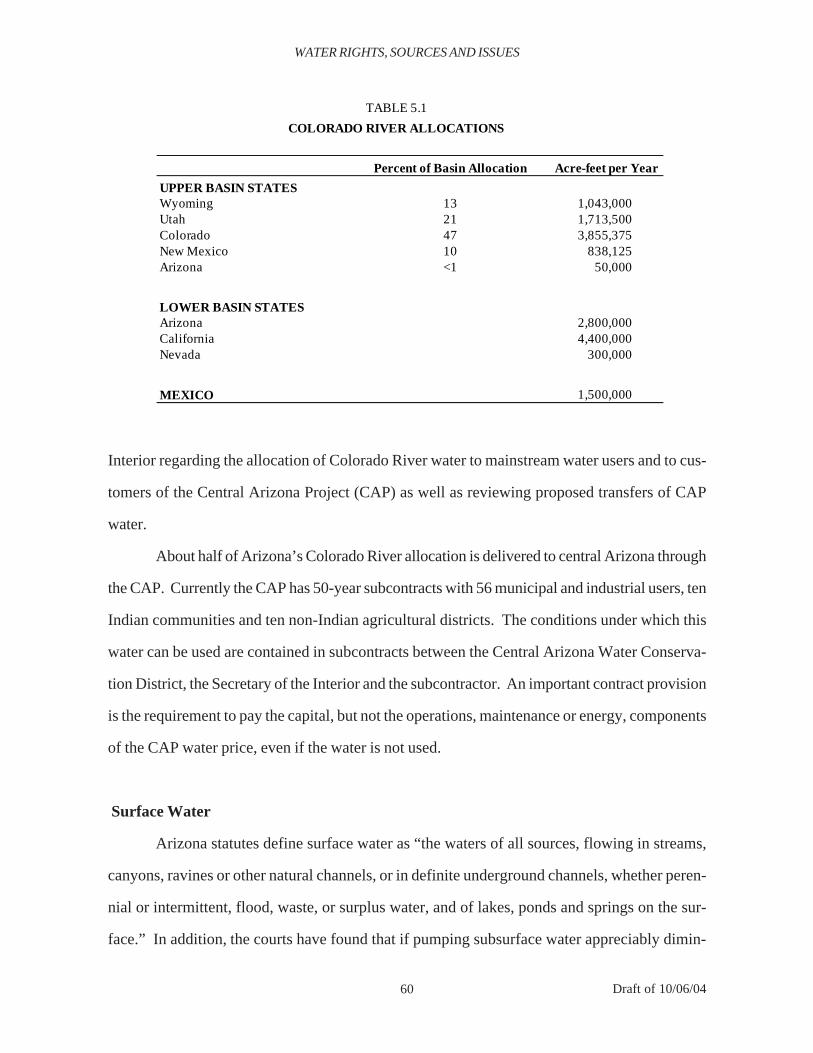
60 Draft of 10/06/04
Interior regarding the allocation of Colorado River water to mainstream water users and to cus-
tomers of the Central Arizona Project (CAP) as well as reviewing proposed transfers of CAP
water.
About half of Arizona’s Colorado River allocation is delivered to central Arizona through
the CAP. Currently the CAP has 50-year subcontracts with 56 municipal and industrial users, ten
Indian communities and ten non-Indian agricultural districts. The conditions under which this
water can be used are contained in subcontracts between the Central Arizona Water Conserva-
tion District, the Secretary of the Interior and the subcontractor. An important contract provision
is the requirement to pay the capital, but not the operations, maintenance or energy, components
of the CAP water price, even if the water is not used.
Surface Water
Arizona statutes define surface water as “the waters of all sources, flowing in streams,
canyons, ravines or other natural channels, or in definite underground channels, whether peren-
nial or intermittent, flood, waste, or surplus water, and of lakes, ponds and springs on the sur-
face.” In addition, the courts have found that if pumping subsurface water appreciably dimin-
WATER RIGHTS, SOURCES AND ISSUES
Percent of Basin Allocation Acre-feet per Year
UPPER BASIN STATESWyoming 13 1,043,000Utah 21 1,713,500Colorado 47 3,855,375New Mexico 10 838,125Arizona <1 50,000
LOWER BASIN STATESArizona 2,800,000California 4,400,000Nevada 300,000
MEXICO 1,500,000
TABLE 5.1
COLORADO RIVER ALLOCATIONS
61 Draft of 10/06/04
ishes the flow of the surface stream, then that water is deemed to be “subflow,” also a form of
surface water. Surface water from lakes, rivers and streams other than the Colorado River is
governed by the “doctrine of prior appropriation,” which means that the first person to put water
to beneficial and reasonable use, i.e., use without waste, acquires a superior right to later appro-
priators. Prior to June 12, 1919, a person could acquire a surface water right simply by applying
the water to a beneficial use and posting a notice of the appropriation at the point of diversion. On
June 12, 1919, the Arizona surface water code was enacted. Now known as the Public Water
Code, this law provides that a person must apply for and obtain a permit in order to appropriate
surface water. The surface water rights system is administered by the ADWR. Over the last
century, storage reservoirs and conveyance systems for surface water have been constructed
throughout the state. Major reservoir storage systems are located on the Salt, Verde, Gila and
Agua Fria Rivers. In-state surface water systems (Figures 1.1 and 4.2) supply about 19 percent or
1.4 million acre-feet of Arizona’s water.
Effluent
Effluent, or treated municipal wastewater can be treated to a quality that can be used for
virtually any purpose, including potable water supply. However, it is most commonly used for
agricultural irrigation, turf watering, industrial cooling, maintenance of riparian areas and artifi-
cial recharge. Effluent is an expanding source of water that has great value in meeting future
water supply needs. It currently serves only two percent or 0.14 million acre-feet of the total water
demand in the state. Legally, effluent is neither surface water nor groundwater, but is a third class
of water until it is discharged to a riverbed where it becomes surface water or percolates into the
groundwater table.
Groundwater
Groundwater means water under the surface of the earth regardless of the geologic struc-
ture in which it is standing or moving. Groundwater does not include water flowing in under-
WATER RIGHTS, SOURCES AND ISSUES

62 Draft of 10/06/04
ground streams with ascertainable beds and banks (A.R.S. § 45-101.5). Groundwater supplies on
average about 40 percent or 2.9 million acre-feet of the state’s water use. Since the 1940s, ground-
water has been pumped more rapidly in certain parts of the state than it has been replenished,
resulting in a condition called “overdraft” or “groundwater mining.” The areas of greatest con-
cern are within the AMAs, though significant conflicts over groundwater use and declines in
groundwater levels have developed in rural parts of the state as well. Large amounts of water are
stored in Arizona’s aquifers, but its use is limited by location, depth and quality. Groundwater
use also is affected by concerns that over-pumping will result in subsidence of the ground surface,
potentially damaging infrastructure and buildings as well as limiting the water storage capacity of
the aquifer. The groundwater rights and permits system was established in the 1980 Groundwa-
ter Management Act (GMA) and is administered by ADWR.
THE ARIZONA GROUNDWATER MANAGEMENT ACT
The GMA was adopted on June 12, 1980 in response to multiple pressures on the state’s
groundwater rights system. The pressures included lawsuits that threatened the water supplies of
the mining and municipal water use sectors related to the transportation of groundwater in the
Tucson area and a threat by the federal government to halt construction of the long-awaited CAP
unless groundwater management issues and concerns about the economic implications of severe
overdraft conditions in several parts of the state were addressed.
The GMA has three primary goals. The first is to control the severe overdraft occurring in
many parts of the state. The second is to provide a means to allocate the state’s limited groundwa-
ter resources within AMAs to most effectively meet the changing needs of the state. The third
goal is to offset Arizona’s use of groundwater through renewable water supply development. To
accomplish these goals, the GMA set up a comprehensive management framework and estab-
lished ADWR to administer its provisions.
WATER RIGHTS, SOURCES AND ISSUES
63 Draft of 10/06/04
Active Management Areas and Irrigation Non-Expansion Areas
The GMA created four initial AMAs, the Phoenix, Tucson, Pinal and Prescott AMAs,
with a fifth, the Santa Cruz AMA, established from a portion of the Tucson AMA in 1994
(Figure 1.2). Groundwater overdraft in the AMAs was more severe than in other parts of the state
and, therefore, the regulations in these areas are more substantial than elsewhere. The vast major-
ity of the state’s population lives in the AMAs. Although the management goals of the AMAs
differ, they all focus on reducing the overdraft and/or maintaining groundwater levels.
Three Irrigation Non-Expansion Areas (INAs) were established in rural farming areas
where the groundwater overdraft was less severe. The Douglas INA and the Joseph City INA
were established as the initial INAs. The Harquahala INA was designated in 1982. The manage-
ment objective in INAs is the prevention of further declines in groundwater supplies through
prohibition of irrigation acreage expansion. General provisions that apply to groundwater man-
agement on a statewide basis are discussed in the following sections. Chapter 6 provides a more
detailed description of the AMAs.
Statewide Groundwater Management Activities
The ADWR’s authorities relative to water management are relatively limited outside of
the AMAs. Statewide planning efforts include technical studies of local areas and assistance in
projecting future water demands. The most recent statewide water assessment available is the
Arizona Water Resources Assessment compiled by ADWR in 1994. There has been no update
of this comprehensive statewide water supply database since then, although an effort to compile
more recent data currently is underway.
The lack of current information on water supply and demand conditions outside the AMAs
limits planning and management activities. A Rural Watershed Initiative, started in 1998, has
provided technical assistance to 17 watershed groups to develop regional watershed solutions
through locally driven partnerships, complete water resource studies and evaluate management
options.
WATER RIGHTS, SOURCES AND ISSUES
64 Draft of 10/06/04
Statewide regulatory programs and requirements managed by ADWR include well drill-
ing, construction, licensing, registration and abandonment, groundwater transportation restric-
tions, adequate water supply requirements and surface water rights administration. ADWR con-
ducts testing for well drilling licenses and issues Notices of Intent to Drill for any well drilling and
construction that occurs in the state. ADWR enforces groundwater transportation restrictions and
maintains the provisions of the Water Adequacy Program throughout the state. Unlike the As-
sured Water Supply Program inside of the AMAs, the Adequacy Program allows new subdivi-
sions to be approved even if the water supplies are found to be inadequate. Chapter 7 contains a
more detailed description of the Water Adequacy Program.
Groundwater Rights in AMAs
The GMA established a new groundwater permit system designed to limit expanded use
of groundwater and protect the water rights of water users who were in place in 1980, when the
law was passed. Most groundwater withdrawals within AMAs are limited in volume on an
annual basis and are subject to conservation requirements. There is very limited ability to market
these rights. There are four basic requirements that must be met prior to pumping or using ground-
water in an AMA:
• Establish the legal right to withdraw the water,
• Obtain a well permit and employ a licensed well driller if a new well is required,
• Unless the well is an “exempt” well or subject to limited other exemptions, withdraw-als must be measured and annual groundwater withdrawals reported to ADWR, and
• Specific conservation program requirements and water use limitations apply to par-ticular kinds of water use within the AMAs.
Irrigation Grandfathered Rights. Within AMAs, anyone who owns land that was legally
irrigated with groundwater at anytime from January 1, 1975 to January 1, 1980 and has been
issued a Certificate of Irrigation Grandfathered Right (IGFR) by ADWR has the right to use
WATER RIGHTS, SOURCES AND ISSUES

65 Draft of 10/06/04
groundwater for irrigation of that land. Irrigation is defined as growing crops for sale or human or
animal consumption on two or more acres. The volume of IGFRs is established by the conserva-
tion requirements in the adopted management plan for each AMA through a maximum annual
groundwater allotment for each farm or specifically identified best management practices.
Type 1 Non-Irrigation Grandfathered Rights. A Type 1 non-irrigation grandfathered right
is associated with land permanently retired from farming and converted to a non-irrigation use.
This right, like an irrigation grandfathered right may be sold or leased only with the land. Type 1
rights are established based on a maximum of three acre-feet per acre of retired irrigated land and
generally are used for industrial purposes such as sand and gravel facilities, golf courses or dair-
ies. They are subject to specific conservation requirements in the industrial chapter of the man-
agement plan for each AMA.
Type 2 Non-Irrigation Grandfathered Rights. Groundwater withdrawn pursuant to a Type
2 non-irrigation grandfathered right generally can be used for any non-irrigation purpose. The
right is based on the maximum amount of water pumped for a non-irrigation use from a non-
exempt well, i.e., a well with a pumping capacity of greater than 35 gallons per minute, in any one
year between 1975 and 1980. Type 2 rights can be sold or leased separately from the land and
most often are used for industrial purposes. They generally are required to follow the conserva-
tion requirements associated with the industrial conservation programs in the management plans
for each AMA.
Service Area Rights. Service area rights allow cities, towns, private water companies and
irrigation districts to withdraw and transport groundwater to serve their customers. Most persons
within an AMA receive water through a municipal water provider pursuant to a service area right.
The volume of a service area right is not quantified, but is subject to either a gallons per capita per
day conservation limit or alternative conservation requirements based on best management prac-
tices.
Groundwater Withdrawal Permits. Groundwater withdrawal permits allow new with-
drawals of groundwater for limited nonirrigation uses. Seven types of withdrawal permits cur-
WATER RIGHTS, SOURCES AND ISSUES
66 Draft of 10/06/04
rently are allowed under the GMA. A General Industrial Use Permit, the most commonly used
type of permit, allows the withdrawal of groundwater for industrial uses outside the service area
of a city, town or private water company. Users of these permits generally are required to partici-
pate in the Industrial Conservation Program.
Exempt Wells. With minor exceptions, wells with a pump capacity of 35 gallons per
minute or less are legally “exempt” from many of the provisions of the GMA. Water can be
withdrawn from exempt wells for any purpose. Non-domestic exempt wells drilled after 1983
are limited to 10 acre-feet per year, but domestic wells can withdraw up to 56 acre-feet per year if
they are pumped on a full-time basis.
WATER RIGHTS ISSUES
Groundwater Rights
There are multiple water rights issues within the AMAs, many of which relate to the
grandfathered right and permit system in the GMA. The GMA protects pre-1980 pumpage rights
and allows for certain kinds of new groundwater withdrawal permits, potentially jeopardizing the
ability of the AMAs to meet their management goals. These rights allow the continued mining or
over drafting of groundwater.
Water rights issues recently identified in the context of Governor Jane Hull’s Water Man-
agement Commission include the amount of allowable groundwater pumping relative to the safe-
yield goals, the impact of exempt, domestic wells on existing water rights and the management
goals and specific issues related to municipal, agricultural and industrial groundwater rights. Ap-
pendix K contains the Executive Summary of the Governor’s Water Management Commission’s
findings and recommendations related to this issue.
Surface Water Rights and Adjudications
Adjudications are court proceedings in which the nature, extent and priority of water
rights are determined. The majority of the surface water rights in the state have not been formally
WATER RIGHTS, SOURCES AND ISSUES
67 Draft of 10/06/04
quantified at this time, although there are several court decrees in the central part of the state that
identify right holders and volumes. For example, the Kent Decree established the relative rights
of Salt River Valley landowners to the Salt and Verde Rivers and established which lands had
normal flow rights based on priority of use prior to delivery of stored water from Roosevelt Dam.
Until water rights are adjudicated, there is no clarity about the size of water rights and whether
they are senior or junior to other water rights in the same basin. The two general stream adjudica-
tions ongoing in the state, the Gila River Adjudication and the Little Colorado River Adjudica-
tion, are discussed further in Chapter 8. The exterior boundaries of these two adjudications
include more than half of the state, where most of the Indian reservations and federal land is
located. The adjudication courts have been working on Indian and federal non-Indian claims
first, and then intend to move to state-law-based water claims. There are nearly 26,500 parties in
the Gila River Adjudication and over 3,000 parties in the Lower Colorado River Adjudication.
Because of the complexity of the legal and hydrologic issues involved, final resolution of the
water rights in these basins is elusive. The adjudication proceedings have been ongoing for
several decades, and it is likely that there will be no significant resolution in the near future. This
lack of certainty limits management options and makes enforcement of the surface water law
more difficult.
The Distinction Between Groundwater and Surface Water
Arizona’s courts since statehood have handled surface water and groundwater separately,
despite the hydrologic connection between the two sources. This results in a number of legal and
institutional issues. Surface water allocations are based on the “first in time, first in right” priority
system. Groundwater generally is governed by the reasonable use doctrine that the landowner,
without waste, can use water beneath the land for any beneficial purpose. There is no priority
system for groundwater, other than the grandfathered groundwater rights system within the AMAs
that protects water users that were in place prior to the 1980 adoption of the GMA. Rights to
groundwater were relegated to the courts for some time before any action was taken by the state
WATER RIGHTS, SOURCES AND ISSUES
68 Draft of 10/06/04
legislature to regulate or control its use.
Because the water rights system does not acknowledge the hydrologic connection be-
tween surface water and groundwater, it generally is not possible to limit groundwater pumping
in order to protect surface water rights or riparian habitat. However, the courts have found that if
pumping subsurface water appreciably diminishes the flow of the surface stream, then the water
is deemed to be subflow and subject to the general adjudication. An Arizona Supreme Court case
determined in 2000 that a well is subject to adjudication if it is located either in the saturated
floodplain alluvium or outside of the younger alluvium and has a cone of depression that extends
into the subflow zone. Factors likely to be considered in individual cases include the elevation,
gradient, flow direction and chemical makeup of the water. Key problem areas within the state
related to the distinction between groundwater and surface water include the San Pedro River and
the Verde River basins.
RIPARIAN PROTECTION
The need to quantify and prioritize the surface water rights in the state as well as to
distinguish which water sources meet the legal definition of “groundwater” and which are “sur-
face water” is essential to a workable water management system. Resolving this confusion is of
particular concern in the areas where water is pumped from wells in the vicinity of surface water
streams. Establishing which wells are pumping groundwater and which are pumping subflow is
a necessary step for enforcing the surface water law. This determination generally has not been
made. Over-pumping of water from wells has had significant impacts on surface flows in the
state and has resulted in the elimination of a large percentage of the natural perennial flow of miles
of rivers.
Most of the remaining perennial flows in the state are outside of the AMAs (Figure 9.10),
and many support areas of high biodiversity, including endangered species, as well as have sig-
nificant aesthetic and recreational value. Many top tourist destinations within the state are associ-
ated with flowing water. Impacts of pumping on surface water flows are of particular concern
WATER RIGHTS, SOURCES AND ISSUES
69 Draft of 10/06/04
along the Salt, Verde and San Pedro Rivers.
There is a type of surface water right called “instream flow rights” that can be established
based on the need for particular flow levels to protect habitat or recreational uses. However, few
such rights have been established, and they have recent priority dates, so are generally junior to
other rightsholders in a watershed. The only state program that provides funding for riparian
protection and restoration, the Arizona Water Protection Fund, has received no appropriations for
the last few years. The Arizona Water Protection Fund Commission, which was created by the
legislature to preserve and enhance flows in rivers and streams and their associated riparian habi-
tats, continues to be staffed by ADWR, although only a few small restoration and riparian land
use management projects are still underway. Projects funded previously were instrumental in
preserving riparian habitats throughout the state. The lack of mechanisms to protect the remain-
ing riparian areas is an issue given development pressure and changing climate conditions.
WATER RIGHTS, SOURCES AND ISSUES

70 Draft of 10/06/04
WATER RIGHTS, SOURCES AND ISSUES
71 Draft of 10/06/04
Chapter 6
WATER MANAGEMENT IN THE ACTIVE MANAGEMENT AREAS
KATHY JACOBS AND SHARON MEGDAL
The 1980 Groundwater Management Act (GMA) mandates water planning and ground-
water management activities within the five Active Management Areas (AMAs) shown in Figure
1.2. The boundaries of the AMAs are, for the most part, coterminous with hydrologic basin
boundaries. Each of these areas has a statutory water management goal related to limiting over-
pumping of groundwater. Management plans must be adopted for each AMA every ten years to
further achievement of the goal. These regulatory plans—now the Third Management Plan for
each of the AMAs—include mandatory conservation requirements by municipal, agricultural
and industrial water use sectors (Appendix L). Irrigated agriculture cannot be expanded beyond
acreage irrigated during the late 1970s within the AMAs and the Irrigation Non-expansion Areas
(INAs), also depicted in Figure 1.2. An important provision of the GMA is that all large wells
must be measured and the annual water use reported to the Arizona Department of Water Re-
source (ADWR). This information has provided a useful database for water management. In
addition, the Assured and Adequate Water Supply Rules mandate that municipal water compa-
nies, whether they are privately or publicly owned, limit their use of groundwater for population
growth served by those companies.
The AMAs include more than 80 percent of the state’s population. The majority of the
state’s economic activity and more than 50 percent of the total water use occurs in these areas.
Therefore, achieving the water management objectives in these areas is a significant component
of achieving the water sustainability goal for the state. This chapter describes the five AMAs and
discusses their water management efforts and associated issues1.
1 The Final Report and Recommendations, Briefing Book, and Technical Advisory Committee Issue Papers of theGovernor’s Water Management Commission (2001) and the Transition Report by the Arizona Department ofWater Resources (2002) provide additional detail and foundation for the following sections.

72 Draft of 10/06/04
WATER MANAGEMENT IN THE ACTIVE MANAGEMENT AREAS
Mun
icip
alA
gric
ultu
ral
Indu
stri
alO
ther
Mun
icip
alA
gric
ultu
ral
Indu
stri
alO
ther
Gro
undw
ater
207,
112
403,
268
78,9
3713
5,67
913
2,10
0 -
94,7
00 -
133,
600
Gro
undw
ater
(In-
Lie
u)10
6,99
912
1,30
0
CA
P W
ater
171,
081
99,0
462,
227
045
2,60
050
,500
1,50
013
9,10
0
Surf
ace
Wat
er45
6,83
135
0,41
09,
102
144,
089
820,
700
21,5
0018
,400
185,
300
Eff
luen
t15
,459
63,7
6573
,374
2,32
523
3,40
060
,000
87,5
009,
000
Inci
dent
al R
echa
rge
61,0
5532
4,54
38,
378
67,0
6713
5,90
0 -
66,1
00 -
12,5
0012
4,60
0 -
Oth
er In
puts
Ove
rdra
ft
256,
500
- 263
,000
TA
BL
E 6
.1P
HO
EN
IX A
MA
WA
TE
R B
UD
GE
T(i
n ac
re fe
et)
195,
021
1998
20
25
146,
400
- 278
,900
Not
e: In
cide
ntal
Rec
harg
e is
wat
er th
at re
ente
rs th
e aq
uifi
er a
fter
use
or d
isch
arge
, Oth
er In
puts
incl
ude
Cut
s to
the
Aqu
ifie
r, C
anal
Rec
harg
e an
d N
et N
atur
al R
echa
rge
(Mou
ntai
n Fr
ont R
echa
rge,
Str
eam
Cha
nnel
Rec
harg
e an
d G
roun
dwat
er In
flow
- O
utfl
ows)
. B
udge
t is
from
G
over
nor's
Wat
er M
anag
emen
t Com
mis
sion
Fin
al R
epor
t, w
hich
ass
umes
non
-dro
ught
(pas
t 30
year
s) c
ondi
tion
s. P
er 2
003
legi
slat
ion,
cut
s to
th
e ac
quif
er n
o lo
nger
exi
st fo
r CA
GR
D re
plen
ishm
ent a
nd re
plen
ishm
ent r
eser
ve.
250,
693
73 Draft of 10/06/04
PRESENT CONDITIONS AND GOALS
Tables 6.1 through 6.5 summarize the water budgets for each of the five AMAs for 1998
and 2025 and describe current and anticipated water supply. The tables show the sources of water
and the uses of that water by municipal, agricultural, industrial and other sectors. Each table also
reports the amount of overdraft associated with the expected pumpage in 2025 and assumes
compliance with the conservation goals. These tables as well as the statutorily required Third
Management Plans provide an important indication of the progress the AMAs are making toward
meeting their respective water management goals.
Phoenix Active Management Area
The Phoenix AMA management goal is to reach safe-yield by 2025. Safe-yield is achieved
if groundwater withdrawals in the AMA do not exceed the long-term natural and artificial re-
charge. The Phoenix AMA encompasses 5,646 square miles in central Arizona and consists of
seven groundwater sub-basins. A diverse mix of water uses characterizes the AMA, with a
heavy and increasing emphasis on municipal and industrial use. Multiple sources of water—
Central Arizona Project (CAP) water, Salt River and Verde River surface waters, effluent and
groundwater—are available and being used to varying degrees. Approximately 2.4 million acre-
feet per year of water are used in the Phoenix AMA: 1.4 million acre-feet of renewable water
from the CAP, Salt River and Verde River surface waters and effluent, and 900,000 acre-feet of
groundwater. Agricultural use accounts for 55 percent of the total, while municipal (water served
by municipal water providers) accounts for 37 percent, and industrial use is seven percent. The
1998 water budget for the Phoenix AMA (Table 6.1) shows a 250,000 acre-foot overdraft. This
overdraft is expected to be reduced, but not eliminated, by 2025. The wide range of potential
overdraft results from uncertainty about the future of agricultural water use in the Phoenix AMA.
The Phoenix AMA staff administers 8,500 groundwater rights and permits in the Phoenix
AMA and Harquahala and Joseph City INAs. Approximately 7,300 of these rights are for irriga-
tion use, 650 are Type 1 and Type 2 non-irrigation grandfathered rights, 106 are rights held by
WATER MANAGEMENT IN THE ACTIVE MANAGEMENT AREAS
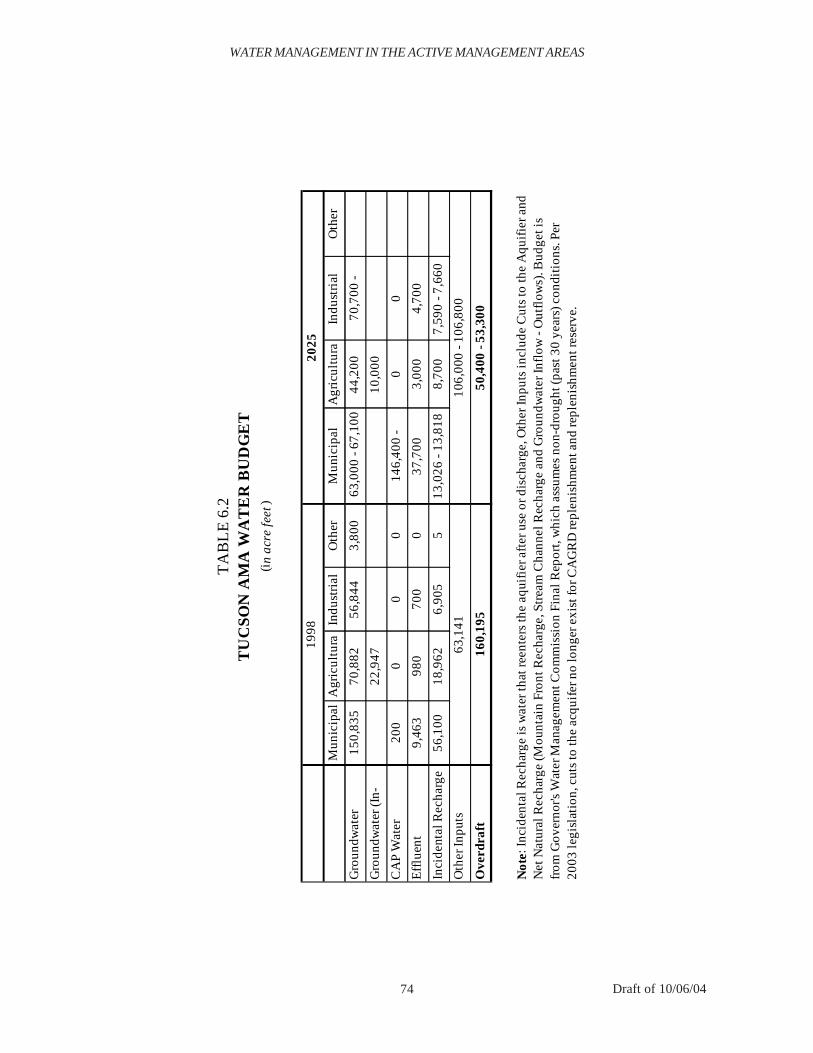
74 Draft of 10/06/04
WATER MANAGEMENT IN THE ACTIVE MANAGEMENT AREAS
Mun
icip
alA
gric
ultu
raIn
dust
rial
Oth
erM
unic
ipal
Agr
icul
tura
Indu
stri
alO
ther
Gro
undw
ater
150,
835
70,8
8256
,844
3,80
0 6
3,00
0 - 6
7,10
044
,200
70,7
00 -
Gro
undw
ater
(In-
22,9
4710
,000
CA
P W
ater
200
00
014
6,40
0 -
00
Eff
luen
t9,
463
980
700
037
,700
3,00
04,
700
Inci
dent
al R
echa
rge
56,1
0018
,962
6,90
55
13,0
26 -
13,8
188,
700
7,59
0 - 7
,660
Oth
er In
puts
Ove
rdra
ft
TA
BL
E 6
.2
(in
acre
feet
)
160,
195
63,1
41
1998
20
25
106,
000
- 106
,800
50,4
00 -
53,3
00
Not
e: In
cide
ntal
Rec
harg
e is
wat
er th
at re
ente
rs th
e aq
uifi
er a
fter
use
or d
isch
arge
, Oth
er In
puts
incl
ude
Cut
s to
the
Aqu
ifie
r and
N
et N
atur
al R
echa
rge
(Mou
ntai
n Fr
ont R
echa
rge,
Str
eam
Cha
nnel
Rec
harg
e an
d G
roun
dwat
er In
flow
- O
utfl
ows)
. Bud
get i
s fr
om G
over
nor's
Wat
er M
anag
emen
t Com
mis
sion
Fin
al R
epor
t, w
hich
ass
umes
non
-dro
ught
(pas
t 30
year
s) c
ondi
tion
s. P
er
2003
legi
slat
ion,
cut
s to
the
acqu
ifer
no
long
er e
xist
for C
AG
RD
repl
enis
hmen
t and
repl
enis
hmen
t res
erve
.
TU
CSO
N A
MA
WA
TE
R B
UD
GE
T
75 Draft of 10/06/04
municipal water providers and 36 are rights held by irrigation districts. There also are approxi-
mately 210 groundwater withdrawal permits in the Phoenix AMA. As in the other AMAs,
administration of these rights comprises annual pumpage report preparation and review, random
report audits, failure to file activities, debit and credit balance determinations for agricultural flex-
ibility accounts, conservation requirement reviews, water right conveyances and general assis-
tance to right holders.
Each of the AMAs also dedicates some staff time to technical assistance and long- range
planning. Water management planning and assistance projects of particular note in the Phoenix
AMA involve working with local water providers, developing future scenarios and using ADWR’s
hydrologic models to project future conditions. These efforts made a significant contribution to
regional water management in the West Valley; a project has recently been initiated with a coali-
tion of East Valley water providers.
Tucson Active Management Area
Like the Prescott and Phoenix AMAs, the Tucson AMA also has safe-yield as its man-
agement goal. The AMA encompasses 3,866 square miles in southeast Arizona and two ground-
water sub-basins. The AMA’s population is approximately 870,000 people. The AMA contains
five incorporated cities and towns: Tucson, South Tucson, Oro Valley, Marana and Sahuarita.
The average annual water use between 1998 and 2000 in the Tucson AMA was approximately
324,000 acre-feet, of which 90 percent was groundwater, seven percent was CAP water used in
lieu of groundwater in agriculture and three percent was effluent. Groundwater use is declining
as municipal providers, in particular the City of Tucson, are expanding the use of CAP water
through recharge and recovery activities. Municipal water use accounts for approximately 49
percent of total demand, agricultural use, 32 percent, and industrial use, 19 percent. The AMA
currently is over-drafting groundwater (Table 6.2).
There are 211 large irrigation rights (generally defined as farms of ten or more acres), 65
Type 1 rights, 349 Type 2 rights, one irrigation district and 147 municipal water providers regu-
WATER MANAGEMENT IN THE ACTIVE MANAGEMENT AREAS
76 Draft of 10/06/04
WATER MANAGEMENT IN THE ACTIVE MANAGEMENT AREAS
lated by the AMA. In addition, the Tucson AMA administers 52 groundwater withdrawal per-
mits and 65 recharge-related permits. Projections for the Tucson AMA show that overdraft will
be cut from around 160,000 acre-feet per year in 1998 to around 50,000 acre-feet per year in
2025.
Key assistance activities of the Tucson AMA staff include facilitating the development of
regional recharge and recovery strategies and conservation assistance focused on ordinance de-
velopment, educational presentations and work with the landscape industry to encourage effi-
cient irrigation.
Prescott Active Management Area
The Prescott AMA, like the Phoenix and Tucson AMAs, has a goal to achieve safe-yield
by 2025. Located in the northern portion of the state, it encompasses 485 square miles within
central Yavapai County. The physical environment of the AMA varies significantly, with major
differences in elevation, climate and precipitation. The area has been experiencing rapid growth.
Nearly 75,000 people reside within the Prescott AMA. Population in the AMA is projected to
increase to 148,000 people by 2025. Nearly 80 percent of the AMA’s current population resides
within the City of Prescott, the Towns of Prescott Valley and Chino Valley and the communities
of Dewey and Humboldt.
The City of Prescott and Prescott Valley Water District, the two large municipal water
providers in the AMA, supply the majority of potable water in the AMA. These two providers
supplied 11,050 acre-feet of groundwater or 76 percent of the total municipal groundwater de-
mand in 2001. Unlike the AMAs in Central Arizona, water users in the Prescott AMA do not
receive deliveries of surface water through major constructed water projects, such as the CAP.
One-half of the total water use comes from overdrafted groundwater (Table 6.3). Approximately
half the current water demand is agricultural; the other half is municipal. There are no new
renewable supplies available, though certain entities in the Prescott AMA have legal authority to
transfer groundwater from the Big Chino basin under certain conditions. It is not clear whether
77 Draft of 10/06/04
environmental and legal concerns associated with the proposed transfers will be resolved, but the
outcome of the water transfer decision will affect whether the Prescott AMA has the potential to
meet its management goal. Communities within the AMA also will need to decide whether any
imported water will be used solely to serve new growth (which they can legally do) or whether at
least some portion of the imported water will be used to offset the overcommitment of groundwa-
ter to already approved subdivisions. Key assistance activities for the Prescott AMA staff involve
assisting in evaluation of water management importation options.
Pinal Active Management Area
The Pinal AMA encompasses approximately 4,000 square miles in south central Arizona
and includes five groundwater sub-basins. In contrast to the Phoenix, Tucson and Prescott AMA
goals of safe-yield by 2025, the Pinal AMA has the dual goal of maintaining the agricultural
economy for as long as feasible while protecting water supplies for future municipal growth
(Table 6.4). The unique Pinal AMA management goal is evidence that the GMA recognized the
WATER MANAGEMENT IN THE ACTIVE MANAGEMENT AREAS
Municipal Agricultural Industrial Municipal Agricultural Industrial
Groundwater 11,805 4,489 576 13,574 3,200 300
Surface Water 0 0 1,500 900 0
Effluent 685 0 6,426 0 0
Incidental Recharge
0 3,822 55 0 1,025 15
Total 12,490 12,783 631 21,500 5,125 315
Other Inputs
Overdraft
PRESCOTT AMA WATER BUDGETTABLE 6.3
(in acre feet )
11,646
1,347
1998 2025
3,041
4,472
12,993
Note: Incidental Recharge is water that reenters the aquifier after use or discharge, Other Inputs include Cuts to the Aquifier and Net Natural Recharge (Mountain Front Recharge, Stream Channel Recharge and GW Inflow - Outflows). Budget is from Governor's Water Management Commission Final Report, which assumes non-drought (past 30 years) conditions. Per 2003 legislation, cuts to the acquifer no longer exist for CAGRD replenishment and replenishment
78 Draft of 10/06/04
WATER MANAGEMENT IN THE ACTIVE MANAGEMENT AREAS
Mun
icip
alA
gric
ultu
ral
Indu
stri
alO
ther
Mun
icip
alA
gric
ultu
ral
Indu
stri
alO
ther
Gro
undw
ater
18,7
0037
1,35
17,
088
44,3
2820
,833
451,
413
11,6
4768
,852
Gro
undw
ater
(In-
77,7
536,
510
CA
P W
ater
512
266,
367
087
,672
8,58
715
0,00
050
106,
964
Surf
ace
Wat
er53
411
4,95
80
43,5
2158
815
2,80
30
40,3
03
Eff
luen
t33
4,53
01,
204
5,23
12,
928
4,27
41,
139
5,23
1
Inci
dent
al R
echa
rge
9,89
019
9,51
20
39,2
7116
,453
181,
688
051
,237
Oth
er In
puts
Ove
rdra
ft26
7,60
6
Not
e: In
cide
ntal
Rec
harg
e is
wat
er th
at re
ente
rs th
e aq
uifi
er a
fter
use
or d
isch
arge
, Oth
er In
puts
incl
ude
Cut
s to
the
Aqu
ifie
r and
Net
Nat
ural
Rec
harg
e (M
ount
ain
Fron
t Rec
harg
e, S
trea
m C
hann
el R
echa
rge
and
Gro
undw
ater
Infl
ow -
Out
flow
s). B
udge
t is
from
Gov
erno
r's W
ater
Man
agem
ent C
omm
issi
on F
inal
Rep
ort,
whi
ch a
ssum
es n
on-d
roug
ht (p
ast 3
0 ye
ars)
con
diti
ons.
Per
200
3 le
gisl
atio
n, c
uts
to th
e ac
quif
er n
o lo
nger
exi
st fo
r CA
GR
D re
plen
ishm
ent a
nd re
plen
ishm
ent
rese
rve.
PIN
AL
AM
A W
AT
ER
BU
DG
ET
TA
BL
E 6
.4
(in
acre
feet
)
194,
154
60,9
89
1998
20
25
57,4
26
79 Draft of 10/06/04
WATER MANAGEMENT IN THE ACTIVE MANAGEMENT AREAS
need to respond to different water supply and economic conditions in different parts of the state.
Farming still is the largest and most vital industry in the AMA, with cotton and wheat the princi-
pal crops. Dairy operations as well as the production of hay and other feed products are increas-
ing. Agriculture accounts for 96 percent of the current water demand. Other important industries
include tourism, light manufacturing and food processing.
The region has been experiencing considerable residential growth, with the AMA’s popu-
lation now exceeding 120,000 people. The AMA contains four incorporated municipalities, the
largest being Casa Grande. There are four large irrigation districts, together encompassing ap-
proximately 247,000 acres of irrigable farmland. The Pinal AMA administers 1,413 rights and
permits, of which 1,200 are agricultural.
The Pinal AMA’s planning efforts are focused on using renewable supplies available to
the region (largely through in-lieu recharge deliveries to agricultural districts) and ensuring that a
sustainable supply is available for rapidly growing municipal and industrial uses. It is likely that
the Pinal AMA’s two goals can be met, though there are concerns about storage and recovery of
renewable supplies, agricultural supplies during drought and whether the Assured Water Supply
(AWS) criteria should be modified to ensure sustainable supplies for municipal growth.
Santa Cruz Active Management Area
The Santa Cruz AMA was established as a separate AMA in 1994. The region had been
part of the Tucson AMA prior to that time. The AMA currently is in a safe-yield condition, but
has shallow aquifers, limited supplies and significant unused rights. The AMA management goal
is to maintain the safe-yield condition and to prevent local water tables from experiencing long-
term declines. The Santa Cruz AMA encompasses approximately 716 square miles in the Upper
Santa Cruz Valley Basin and includes the City of Nogales. It contains a 45-mile reach of the
Santa Cruz River from the international border to the Continental gauging station, located a few
miles north of the Santa Cruz and Pima County line.
The Santa Cruz AMA is in the process of clarifying its water management goal and
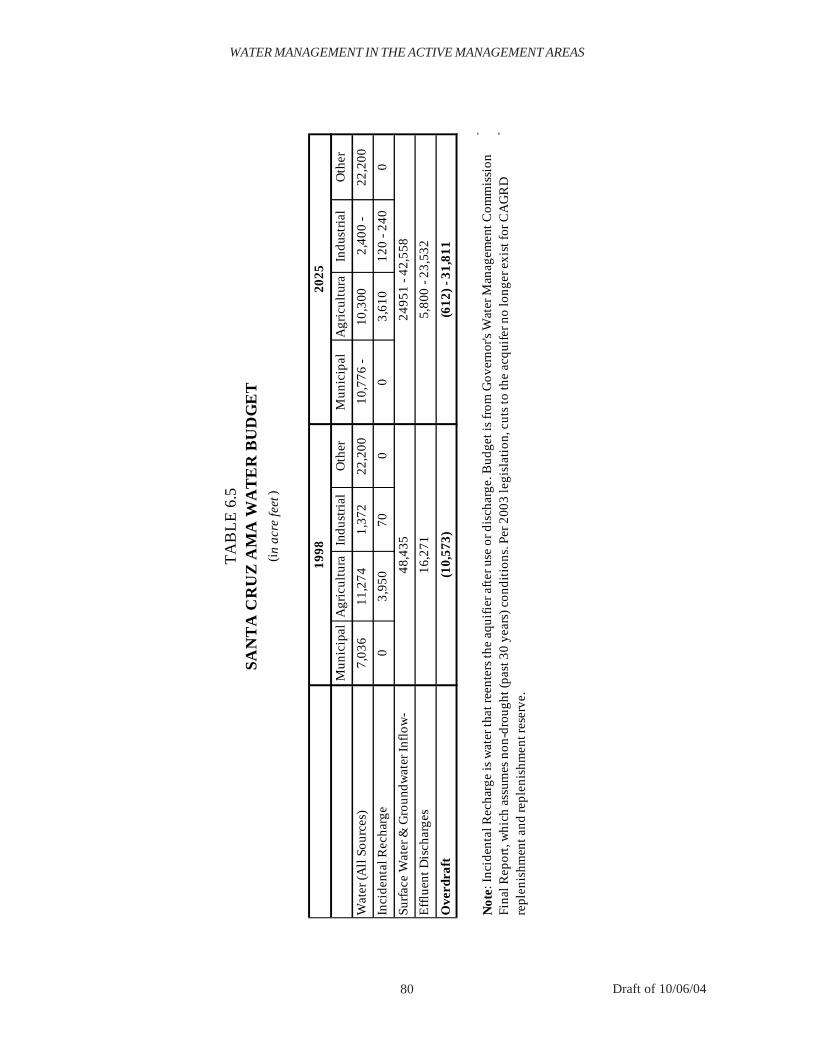
80 Draft of 10/06/04
WATER MANAGEMENT IN THE ACTIVE MANAGEMENT AREAS
Mun
icip
alA
gric
ultu
raIn
dust
rial
Oth
erM
unic
ipal
Agr
icul
tura
Indu
stri
alO
ther
Wat
er (A
ll S
ourc
es)
7,03
611
,274
1,37
222
,200
10,7
76 -
10,3
002,
400
- 22
,200
Inci
dent
al R
echa
rge
03,
950
700
03,
610
120
- 240
0
Surf
ace
Wat
er &
Gro
undw
ater
Infl
ow-
Eff
luen
t Dis
char
ges
Ove
rdra
ft
Not
e: In
cide
ntal
Rec
harg
e is
wat
er th
at re
ente
rs th
e aq
uifi
er a
fter
use
or d
isch
arge
. Bud
get i
s fr
om G
over
nor's
Wat
er M
anag
emen
t Com
mis
sion
Fi
nal R
epor
t, w
hich
ass
umes
non
-dro
ught
(pas
t 30
year
s) c
ondi
tion
s. P
er 2
003
legi
slat
ion,
cut
s to
the
acqu
ifer
no
long
er e
xist
for C
AG
RD
re
plen
ishm
ent a
nd re
plen
ishm
ent r
eser
ve.
SAN
TA
CR
UZ
AM
A W
AT
ER
BU
DG
ET
2495
1 - 4
2,55
848
,435
16,2
715,
800
- 23,
532
TA
BL
E 6
.5
(in
acre
feet
)
(10,
573)
1998
20
25
(612
) - 3
1,81
1
81 Draft of 10/06/04
developing AWS rules to better address the AMA’s unique hydrology, environmental and geo-
graphic characteristics. Although the region currently is assumed to be in safe-yield (Table 6.5),
regional growth, both in Arizona and Sonora, Mexico, will increase pressure on local water
supplies. The Santa Cruz River and the Nogales Wash both flow north across the border, and
effluent from Nogales, Mexico, is treated north of Nogales, Arizona, at the International Waste-
water Treatment Plant and discharged into the Santa Cruz River. Water in the border region is
truly a shared resource.
All demand sectors rely on water withdrawn from wells. Effluent from the International
Wastewater Treatment Plant, surface water, mountain front recharge and incidental recharge con-
tribute to the replenishment of the younger alluvial aquifer. Withdrawals from shallow wells,
therefore, are comprised of water originating from several sources. The average annual water use
in the Santa Cruz AMA is over 23,000 acre-feet. Municipal water use accounts for approxi-
mately 30 percent of total demand, agricultural use, 62 percent, and industrial use, eight percent,
though these percentages fluctuate significantly from year to year. The riparian vegetation along
the Santa Cruz River and its tributaries use another 22,000 acre-feet per year, an amount approxi-
mately equal to the municipal, industrial and agricultural demand in the AMA. There are 82
irrigation-grandfathered rights, nine Type 1 rights, 36 Type 2 rights and 14 municipal water
providers, four of which are large providers.
Maintaining a safe-yield condition and managing local water levels in the Santa Cruz
AMA is a much more complicated goal than that faced by the other AMAs. Issues such as the
inability to distinguish between surface water and groundwater, the lack of adjudication of sur-
face water rights, the uncertainty of continued delivery of effluent from Mexico and the need to
amend the well location and well replacement criteria as well as the AWS Rules to address the
specific management goal for the Santa Cruz AMA all need to be addressed. The wide range of
overdraft shown in Table 6.5 relates to the strong influence of surface water inflows on the water
budget. In wet years, safe-yield is not difficult to maintain, but in dry years there are major im-
pacts on groundwater levels.
WATER MANAGEMENT IN THE ACTIVE MANAGEMENT AREAS
82 Draft of 10/06/04
MEETING THE ACTIVE MANAGEMENT AREA GOALS
A comprehensive examination of the achievability and appropriateness of the AMA man-
agement goals was performed by the 49-member commission appointed by Governor Jane Dee
Hull in June of 2000. The Governor’s Water Management Commission was charged with re-
viewing the GMA and recommending changes needed to maintain a reliable and sustainable
water supply to meet current and future water needs in the AMAs. Appendix K contains the
executive summary of the Commission’s recommendations. In December 2001, the Commission
concluded that the goals and framework of the GMA were sound and should continue to guide
AMA water management decisions and investments. The Commission also endorsed the statu-
tory management goals of the AMAs. However, the Commission concluded that more work was
necessary in order to meet the management goals in the time frame established by the GMA.
The Commission recognized that, although groundwater overdraft conditions in the Phoe-
nix, Pinal, Tucson and Prescott AMAs persist, hydrologic conditions vary widely within the
AMAs, with some areas experiencing waterlogged conditions, e.g., the Buckeye area in the
Phoenix AMA, while others experience significant declines in water tables. Likewise, subsid-
ence and water quality problems as well as concerns about protecting riparian areas vary within
and among the AMAs. The Commission acknowledged that renewable water supplies are not
universally available and the costs of new major infrastructure can be prohibitively expensive,
especially for smaller communities. Regarding conditions of the individual AMAs, the Commis-
sion (2000) concluded:
In the Phoenix and Tucson AMAs, water budgets based on current supply avail-ability projections indicate that achieving safe-yield may not be as difficult asmaintaining that condition . . . the expected population growth beyond 2025,particularly in the major metropolitan areas, may ultimately exceed the availabil-ity of renewable supplies and result in increasing costs for providing renewablewater supplies and again put pressure on groundwater availability. This situa-tion may occur earlier in the Prescott AMA, where renewable supplies are not asabundant or as readily available . . .
The Santa Cruz AMA goal of preventing long-term declines in local water tablelevels provides the means to deal with “sub-area” issues and physical watersupply conditions, which does not exist in the others AMAs . . . Management of
WATER MANAGEMENT IN THE ACTIVE MANAGEMENT AREAS

83 Draft of 10/06/04
the water levels is an important objective due to the desire to protect the surfacewater flows and riparian habitat along the river while maximizing available sup-plies . . .
In the past, the water management goal of the Pinal AMA was referred to as“planned depletion.” However, this characterization has recently been identi-fied as encompassing only one aspect of the management goal. Preserving watersupplies for non-irrigation users is also an important part of the Pinal AMA man-agement goal. Because agriculture can use mined groundwater supplies in thePinal AMA until they are no longer affordable, and sufficient groundwater ap-pears to be available based on projected needs, the goal of preserving the agri-cultural economies for as long as feasible is achievable well beyond 2025. Withregard to achieving the goal for non-irrigation uses and accommodating pro-jected population increases, strategies must be identified and implemented to loweroverall water use, specifically the non-residential component, and/or secure ad-ditional renewable supplies.
Although some conditions have changed since the Commission published its findings, these con-
clusions in general continue to be relevant.
Achieving a sustainable water supply within the AMAs requires continued water man-
agement efforts and consideration of local conditions. While groundwater and surface water
availability depends to a considerable extent on geography, effluent is a growing resource in all of
the AMAs. However, successful residential conservation programs may reduce the growth rate
of effluent.
The management plans for each of the AMAs contain detailed information on their water
supplies and management programs. Important programs and mechanisms exist to facilitate achieve-
ment of the management goals. In addition to the conservation programs (Appendix L) that
address the demand side of the equation, there are multiple programs aimed at expanding the use
of renewable supplies. They include the AWS program, the Recharge and Recovery Program,
the Central Arizona Groundwater Replenishment District (CAGRD) and the Arizona Water Bank-
ing Authority.
THE ASSURED WATER SUPPLY PROGRAM
The GMA mandated the adoption of rules to implement a program of AWS. Prior to
WATER MANAGEMENT IN THE ACTIVE MANAGEMENT AREAS
84 Draft of 10/06/04
platting any new subdivisions in AMAs, a demonstration of sufficient water supplies to serve the
proposed development for 100 years is required. Either the water company providing water to
the development must have an AWS designation, or the developer must obtain an AWS Certifi-
cate. However, it was not until the 1995 adoption of the AWS Rules that the requirements for this
demonstration were codified. Although certain elements of the AWS program differ by AMA,
designation or certification of AWS requires that certain criteria be met to the satisfaction of the
ADWR. A successful applicant must show that the water to supply the new water use is physi-
cally, continuously and legally available for 100 years and that the water supply meets applicable
water quality standards. The proposed water use must be consistent with the management goal,
e.g., safe-yield, of the AMA. Finally, the applicant must establish financial capability to con-
struct the necessary infrastructure required for the proposed use.
The portfolio of water supplies held by municipal providers that have been designated as
having an AWS contains a variety of sources. These include groundwater, surface water, efflu-
ent, CAP water, CAGRD membership, recharge credits, extinguishment credits from retiring
grandfathered rights, groundwater transfers from basins outside of AMAs, water exchanges and
Indian leases. Many of these supplies bring new layers of administrative, legal and technical
complexity to water management in the state. In the Prescott and Santa Cruz AMAs, implemen-
tation of the AWS Rules has been especially challenging because of the unique hydrologic con-
ditions and lack of alternative supplies (Jacobs and Holway, 2004).
The consistency with the management goal provision of the GMA resulted in the AWS
Rule requirement to use renewable supplies to meet a substantial portion of new water demand.
Renewable supplies can be directly delivered to customers or indirectly through a program of
recharge and recovery. This provision is perhaps the most significant incentive for the use of
CAP water for water companies in the three AMAs served by the CAP, i.e., Phoenix, Pinal and
Tucson. Although the use of renewable water supplies is universally viewed as positive, it would
WATER MANAGEMENT IN THE ACTIVE MANAGEMENT AREAS
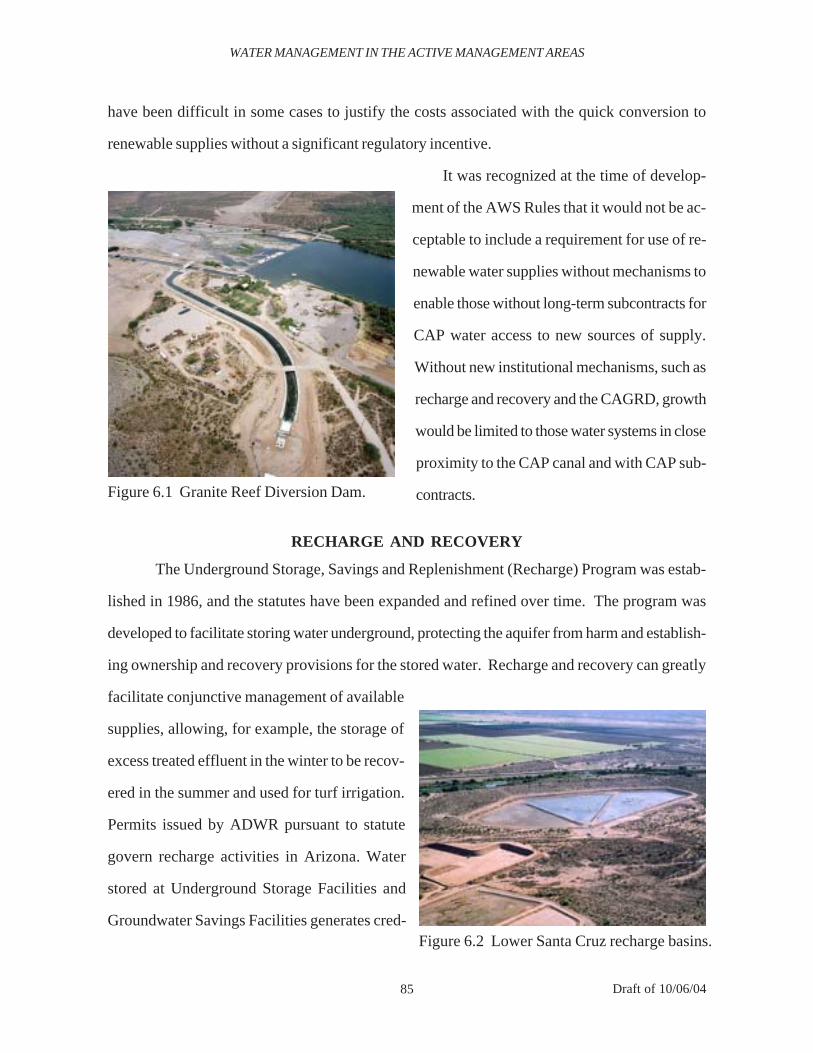
85 Draft of 10/06/04
have been difficult in some cases to justify the costs associated with the quick conversion to
renewable supplies without a significant regulatory incentive.
It was recognized at the time of develop-
ment of the AWS Rules that it would not be ac-
ceptable to include a requirement for use of re-
newable water supplies without mechanisms to
enable those without long-term subcontracts for
CAP water access to new sources of supply.
Without new institutional mechanisms, such as
recharge and recovery and the CAGRD, growth
would be limited to those water systems in close
proximity to the CAP canal and with CAP sub-
contracts.
RECHARGE AND RECOVERY
The Underground Storage, Savings and Replenishment (Recharge) Program was estab-
lished in 1986, and the statutes have been expanded and refined over time. The program was
developed to facilitate storing water underground, protecting the aquifer from harm and establish-
ing ownership and recovery provisions for the stored water. Recharge and recovery can greatly
facilitate conjunctive management of available
supplies, allowing, for example, the storage of
excess treated effluent in the winter to be recov-
ered in the summer and used for turf irrigation.
Permits issued by ADWR pursuant to statute
govern recharge activities in Arizona. Water
stored at Underground Storage Facilities and
Groundwater Savings Facilities generates cred-
WATER MANAGEMENT IN THE ACTIVE MANAGEMENT AREAS
Figure 6.1 Granite Reef Diversion Dam.
Figure 6.2 Lower Santa Cruz recharge basins.
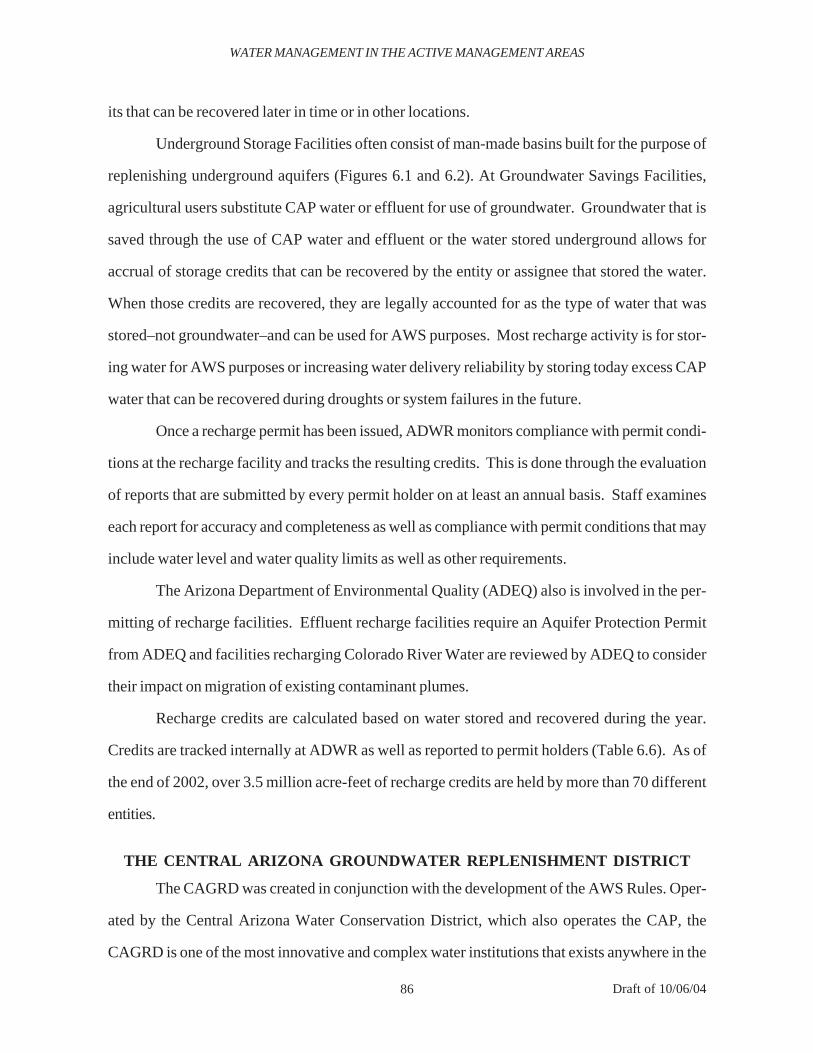
86 Draft of 10/06/04
its that can be recovered later in time or in other locations.
Underground Storage Facilities often consist of man-made basins built for the purpose of
replenishing underground aquifers (Figures 6.1 and 6.2). At Groundwater Savings Facilities,
agricultural users substitute CAP water or effluent for use of groundwater. Groundwater that is
saved through the use of CAP water and effluent or the water stored underground allows for
accrual of storage credits that can be recovered by the entity or assignee that stored the water.
When those credits are recovered, they are legally accounted for as the type of water that was
stored–not groundwater–and can be used for AWS purposes. Most recharge activity is for stor-
ing water for AWS purposes or increasing water delivery reliability by storing today excess CAP
water that can be recovered during droughts or system failures in the future.
Once a recharge permit has been issued, ADWR monitors compliance with permit condi-
tions at the recharge facility and tracks the resulting credits. This is done through the evaluation
of reports that are submitted by every permit holder on at least an annual basis. Staff examines
each report for accuracy and completeness as well as compliance with permit conditions that may
include water level and water quality limits as well as other requirements.
The Arizona Department of Environmental Quality (ADEQ) also is involved in the per-
mitting of recharge facilities. Effluent recharge facilities require an Aquifer Protection Permit
from ADEQ and facilities recharging Colorado River Water are reviewed by ADEQ to consider
their impact on migration of existing contaminant plumes.
Recharge credits are calculated based on water stored and recovered during the year.
Credits are tracked internally at ADWR as well as reported to permit holders (Table 6.6). As of
the end of 2002, over 3.5 million acre-feet of recharge credits are held by more than 70 different
entities.
THE CENTRAL ARIZONA GROUNDWATER REPLENISHMENT DISTRICT
The CAGRD was created in conjunction with the development of the AWS Rules. Oper-
ated by the Central Arizona Water Conservation District, which also operates the CAP, the
CAGRD is one of the most innovative and complex water institutions that exists anywhere in the
WATER MANAGEMENT IN THE ACTIVE MANAGEMENT AREAS
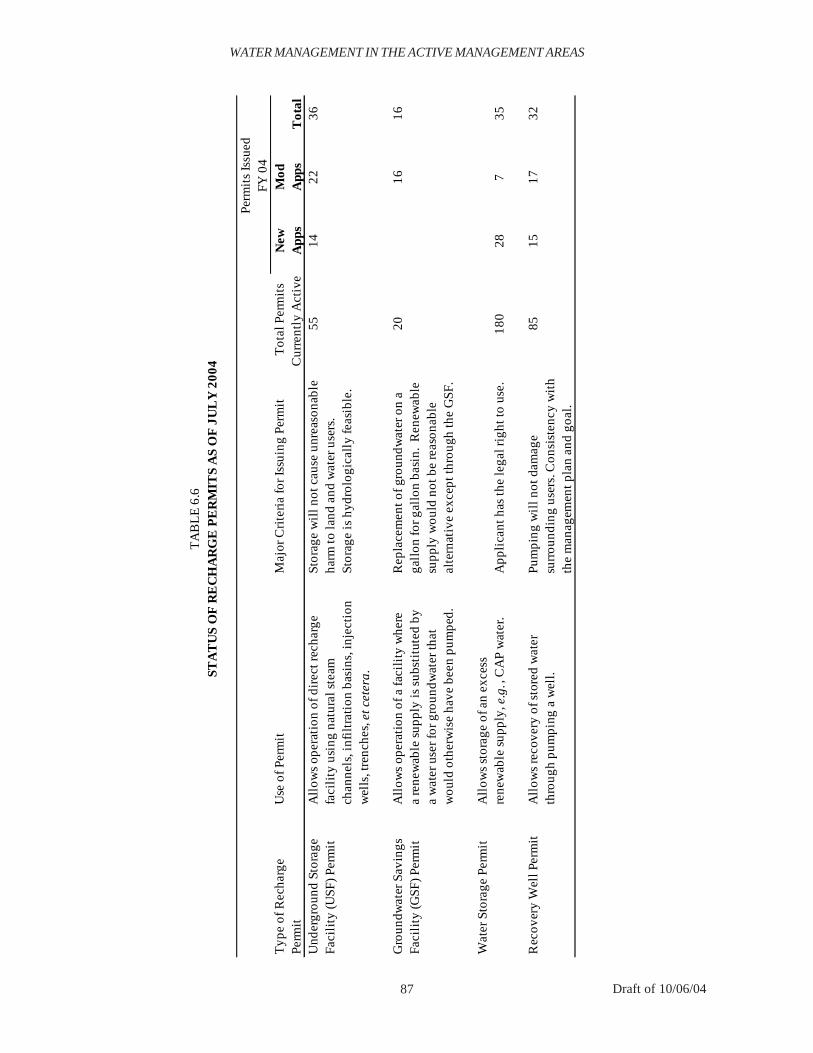
87 Draft of 10/06/04
Typ
e of
Rec
harg
eU
se o
f Per
mit
Maj
or C
rite
ria
for I
ssui
ng P
erm
it
Tot
al P
erm
its
New
Mod
Perm
it C
urre
ntly
Act
ive
App
sA
pps
Tot
alU
nder
grou
nd S
tora
geA
llow
s op
erat
ion
of d
irec
t rec
harg
eSt
orag
e w
ill n
ot c
ause
unr
easo
nabl
e55
1422
36Fa
cili
ty (U
SF) P
erm
itfa
cili
ty u
sing
nat
ural
ste
amha
rm to
land
and
wat
er u
sers
.ch
anne
ls, i
nfil
trat
ion
basi
ns, i
njec
tion
Stor
age
is h
ydro
logi
call
y fe
asib
le.
wel
ls, t
renc
hes,
et c
eter
a.
Gro
undw
ater
Sav
ings
A
llow
s op
erat
ion
of a
faci
lity
whe
reR
epla
cem
ent o
f gro
undw
ater
on
a 20
1616
Faci
lity
(GSF
) Per
mit
a re
new
able
sup
ply
is s
ubst
itut
ed b
yga
llon
for g
allo
n ba
sin.
Ren
ewab
le
a w
ater
use
r for
gro
undw
ater
that
supp
ly w
ould
not
be
reas
onab
lew
ould
oth
erw
ise
have
bee
n pu
mpe
d.al
tern
ativ
e ex
cept
thro
ugh
the
GSF
.
Wat
er S
tora
ge P
erm
itA
llow
s st
orag
e of
an
exce
ssre
new
able
sup
ply,
e.g
., C
AP
wat
er.
App
lica
nt h
as th
e le
gal r
ight
to u
se.
180
287
35
Rec
over
y W
ell P
erm
itA
llow
s re
cove
ry o
f sto
red
wat
erPu
mpi
ng w
ill n
ot d
amag
e85
1517
32th
roug
h pu
mpi
ng a
wel
l.su
rrou
ndin
g us
ers.
Con
sist
ency
wit
h th
e m
anag
emen
t pla
n an
d go
al.
TA
BL
E 6
.6ST
AT
US
OF
RE
CH
AR
GE
PE
RM
ITS
AS
OF
JU
LY
200
4
Per
mit
s Is
sued
FY
04
WATER MANAGEMENT IN THE ACTIVE MANAGEMENT AREAS
88 Draft of 10/06/04
United States. It was authorized to facilitate use of renewable supplies by new developments that
had no direct access to CAP water. The CAGRD is required to replenish in perpetuity all ground-
water pumped by its members that exceeds the groundwater use allowed under the AWS Rules.
Economic conditions over the past decade have resulted in an unexpectedly high rate of CAGRD
enrollment. Because the number of members of the CAGRD far exceeds the original expecta-
tions, ensuring adequate water supplies to meet its long-term obligations has proven to be chal-
lenging. For example, the CAGRD serves a substantial number of designated water providers as
well as individual subdivisions in the three-county CAWCD service area, i.e., Maricopa, Pinal
and Pima Counties.
Membership in the CAGRD is voluntary, but the CAGRD currently must accept as mem-
bers those who are (1) within the CAP service area, (2) can meet the other four AWS criteria and
(3) agree to pay CAGRD replenishment assessments. The CAGRD has three calendar years in
which to fulfill its replenishment obligation, which it does by storing water at permitted recharge
facilities. Because the water is essentially replacing groundwater, this storage is termed “replen-
ishment.” CAGRD performs the replenishment at recharge sites it selects within the AMA where
the replenishment obligation was generated.
Several CAGRD-related issues were considered during the deliberations of the Governor’s
Water Management Commission (Appendix K). Some of the issues have been or are being
addressed statutorily and/or through policy changes. The CAGRD itself does not currently have
a firm, 100-year supply of water for replenishment. The AWS Rules assume that the CAGRD
will fulfill its function, thus granting an AWS based on non-firm supplies, something not allowed
for individual municipal providers as part of their AWS portfolios. Recent amendments to its
statutes authorized a replenishment reserve and strengthened elements of the operating plan that
must be updated and submitted every ten years for ADWR approval. The CAGRD has been
working more actively with members and other stakeholders to project its future obligations and
methods for meeting them. Still, the popularity of the CAGRD as a mechanism for fulfilling the
renewable water utilization requirement of the AWS Rules has surprised nearly all involved.
WATER MANAGEMENT IN THE ACTIVE MANAGEMENT AREAS
89 Draft of 10/06/04
The high rate of enrollment, drought conditions and increased use of river water by others have
all required more careful evaluation of the CAGRD to ensure that it can meet its future replenish-
ment obligations in an affordable manner.
THE ARIZONA WATER BANKING AUTHORITY
The Arizona Water Banking Authority (AWBA) is another statutorily created innovative
mechanism that uses recharge to meet important state goals. The AWBA was established in
1996, shortly after Governor Fife Symington’s Central Arizona Project Advisory Committee
issued its report regarding use of CAP water. Concerns about California’s over-utilization of its
4.4 million acre-foot allocation and Nevada’s need for additional water supplies led to concerns
that Arizona’s allocation of Colorado River water could be at risk. The AWBA was created to
meet four primary objectives:
• Store water to ensure reliable municipal water deliveries during future shortages onthe Colorado River or CAP system failures;
• Support the management goals of the AMAs;
• Support Indian water rights settlements; and
• Provide for interstate banking of Colorado River water to assist Nevada and Califor-nia in meeting their water supply requirements while protecting Arizona’s entitle-ment.
Since 1997, the AWBA has stored over two million acre-feet of excess CAP water, more than
two-thirds of Arizona’s annual allocation of Colorado River water. AWBA operations have
enabled Arizona to fully use its Colorado River entitlement and to store water on behalf of the
other two Lower Basin states. The AWBA has been hailed as a major innovation in water man-
agement, and it has changed the tenor of interstate negotiations substantially by showing that
Arizona was serious about using its entire CAP allocation (Jacobs and Holway, 2004). The
AWBA does not compete with other water users for supplies; rather it uses water that is not used
by other contractors. It stands last in line in priority for water supplies and for storage space in
WATER MANAGEMENT IN THE ACTIVE MANAGEMENT AREAS
90 Draft of 10/06/04
recharge facilities.
The reason Arizona was not utilizing its full entitlement relates to the cost of CAP water
relative to groundwater. Failure to recognize the impact that the high cost of CAP water would
have on farmers lead to overly-ambitious projections regarding the demand for CAP water by
agriculture. It was expected that, in the early years of the CAP, agricultural entities would use all
excess CAP water, i.e., all of the state’s CAP allocation not used by municipal, industrial and
Indian demand. It was further assumed that agricultural use would phase out as the municipal,
industrial and Indian demand increased over time. In fact, the cost of CAP water, coupled with
the financial obligations associated with infrastructure construction, made use of full-cost CAP
water cost-prohibitive for agricultural users. In response, Arizonans developed the Groundwater
Savings or “in-lieu” recharge program and made major changes in the pricing policy for CAP
water, including the establishment of an agricultural incentive pricing system. These changes
have enabled agriculture to be major users of CAP water and reduced the overall size of the
state’s repayment obligation to the federal government (because low interest payments are made
on the debt for the portion of the CAP used by agriculture). The total number of credits stored in
Groundwater Savings facilities is listed in Appendix M.
Municipal and Indian CAP sub-contracts are not yet fully utilized by the sub-contractors
themselves but, nevertheless, Arizona has been able to use its full CAP allocation in recent years.
This is in part due to the activities of the AWBA to store excess CAP water, CAWCD programs
such as incentive pricing to reduce costs for agricultural users and the Groundwater Savings or in-
lieu recharge program. The drought also has increased the demand for CAP water, particularly
by the Salt River Project, since water supplies in other surface water systems have been signifi-
cantly curtailed.
WATER MANAGEMENT CHALLENGES REMAIN
The GMA has provided a sound framework for water management in the AMAs, and
significant progress has been made, particularly in the use of renewable water supplies. Yet,
WATER MANAGEMENT IN THE ACTIVE MANAGEMENT AREAS

91 Draft of 10/06/04
unresolved issues and challenges remain. Fundamentally, the ability to achieve and maintain
safe-yield is unknown, especially in light of existing groundwater rights and projections for addi-
tional growth.
Where is the “Next Bucket” of Water Coming From?
With an expanding population and no identification of the sources of water that will be
available for future urban growth, either per capita water use will have to be reduced or water use
will need to shift from other sectors to the municipal sector if safe-yield is to be achieved and
maintained. The “next bucket” of water to support growth in Arizona has not been identified,
although many believe that conservation and technologies like desalination will play a role. Ad-
ditional renewable supplies exist, but there are legal, political, physical, institutional and eco-
nomic challenges to putting them to use. A number of the supplies will have to be moved into the
AMAs with new or existing infrastructure, including the CAP. Yet the physical capacity of the
existing infrastructure to move water is limited.
Access to “Wheeling Capacity” for Non-CAP Supplies in the CAP Canal
The CAP under normal conditions delivers approximately 1.5 million acre-feet of Arizona’s
2.8-million acre-foot Colorado River allocation. However, the system is capable of delivering as
much as 1.9 million acre-feet each year on a nearly continuous basis under optimistic assump-
tions. Discussions have been initiated to set policies and priorities for that additional “wheeling”
capacity. Although these discussions have not been finalized, this capacity to move water is a
valuable asset that will affect future supply alternatives.
Long-Term Supplies for the Central Arizona Groundwater Replenishment District
The CAGRD’s Plan of Operation—currently under development—provides an intrigu-
ing glimpse into how future supplies may be developed. To meet the estimated 227,000 acre-foot
demand of members projected to be enrolled through 2015, the CAGRD has proposed a supply
WATER MANAGEMENT IN THE ACTIVE MANAGEMENT AREAS
92 Draft of 10/06/04
acquisition strategy, phased-in over three decades, that includes (1) importation of groundwater,
(2) Indian leases, (3) on-river Colorado River supplies and (4) the use of local effluent. It is
widely anticipated that other entities will pursue similar supply acquisitions in the coming de-
cades. How that process will proceed is unknown, but it will be strongly influenced by the rate of
population growth, competition for supplies and climatic conditions. There are indications, for
instance, that some holders of water rights along the mainstem of the Colorado River are willing
to enter into market-based transfers. However, the protracted and highly divisive dispute between
California’s Imperial Irrigation District and San Diego demonstrates how politically volatile such
transfers can become.
Sub-Area Management or Ability to Manage Local Water Levels to Avoid Negative
Impacts
Safe-yield is an AMA-wide goal based on total inflows and outflows to the basin, a water
budget balance that does not prevent over-pumping within localized areas in the AMA if they are
offset by groundwater storage elsewhere. These localized groundwater problems can have sig-
nificant impacts, such as subsidence of the ground or dewatering of surface flows. The Governor’s
Water Management Commission discussed this topic in detail, but no resolution was proposed.
Addressing Unique Management Issues in the AMAs
Meanwhile, the Prescott AMA seeks to determine how much groundwater it can reliably
withdraw from its aquifers and to import new groundwater supplies to support its rapid growth
without harming the Verde River and the quality of life that attracts that growth. The relatively
“young” Santa Cruz AMA must develop its AWS, recharge and well spacing programs to facili-
tate conjunctive management, meet its unique goal, and deal with the uncertainties associated
with its surface water supply and ensure the flow of effluent from an international treatment plant,
given that Mexico has a legal right to that water supply. The Pinal AMA is working to simulta-
neously meet the needs of agriculture and growing municipal and industrial uses by examining
WATER MANAGEMENT IN THE ACTIVE MANAGEMENT AREAS
93 Draft of 10/06/04
their AWS Rules and mechanisms to bring in renewable supplies for both municipal and indus-
trial growth and by considering recharge and recovery strategies by amending the AWS rules to
focus more fully on ensuring a renewable supply. The Tucson AMA continues to work through
issues related to current and future utilization of CAP water, including storage and recovery
needs. The Tucson area will need considerably more water stored for reliability than can cur-
rently be paid for by the AWBA in order to offset future shortages in municipal deliveries.
Planning for recovery of the millions of acre-feet stored by the AWBA in the Pinal and
Phoenix AMAs awaits attention and may prove to be expensive and somewhat controversial.
Major Indian water settlements await approval, and severe drought conditions only exacerbate
the issues. While much has been accomplished, much work remains for the water managers,
policy makers and the public in the AMAs. Of particular importance is building the neces-
sary institutional capacity and long-range planning and technical assistance capabilities to
meet these needs.
Integrating Water Quality Management with Water Quantity
Water quality problems affect the water supply picture within the AMAs in different
ways depending on the concentration of contaminants, the existing treatment capacity and cost
and the size of the water provider. The changing regulatory environment and perceptions of risk
related to water quality both have a substantial impact on quality-related management decisions.
Emerging water quality concerns such as pharmaceuticals and other contaminants in effluent
used for recharge also must be addressed and overcome. Likewise, options for responding to the
increasing salinity of the water supply will be an ongoing debate.
Need for Regional Coordination
Water interests within the AMAs have made great progress in working together on a
regional basis to resolve issues of mutual concern. Regional coordination will continue to be of
great importance in the future as competition for supplies increases. This will be of particular
WATER MANAGEMENT IN THE ACTIVE MANAGEMENT AREAS

94 Draft of 10/06/04
importance in achieving economies of scale for recharge, recovery and transportation infrastruc-
ture.
WATER MANAGEMENT IN THE ACTIVE MANAGEMENT AREAS
95 Draft of 10/06/04
Chapter 7
WATER SUPPLY AND MANAGEMENT BEYOND THE ACTIVEMANAGEMENT AREAS
KATHY JACOBS AND SHARON MEGDAL
The Groundwater Management Act (GMA) has provided a sound framework for water
management in the Active Management Areas (AMAs). This chapter discusses state, watershed
and community-based regulatory and non-regulatory efforts to manage water supplies for mu-
nicipal and industrial purposes outside of AMAs. Water supply availability and other rural water
issues also are addressed in this chapter. Beyond the boundaries of the AMAs, there are few
regulatory programs addressing groundwater management, very limited opportunities to access
imported water supplies and only sporadically reported water use data.
ACCESS AND AVAILABILITY OF GROUNDWATER,SURFACE WATER AND EFFLUENT
From a water supply perspective, access to imported surface water is the major character-
istic that distinguishes the central Arizona AMAs (Phoenix, Pinal and Tucson) from the rest of
the state, including the Prescott and Santa Cruz AMAs. Many communities and tribes along the
Colorado River in western Arizona have Colorado River water contracts and, consequently, their
water supply circumstances differ markedly from other parts of the state. For those without
contracts or with allocations smaller than their needs, legal access to Colorado River water re-
mains an issue.
Water providers and communities throughout the state are concerned about access to
water supplies sufficient for future growth. Although effluent use is prevalent in major munici-
palities, that source is relatively rare in the rest of the state. Outside of the AMAs, effluent is now
a significant source of supply only for Flagstaff, Payson, Sierra Vista and a few smaller commu-
96 Draft of 10/06/04
nities, such as Tusayan.
There are two major water supply distribution systems in the state, the Salt River Project
(SRP) and the Central Arizona Project (CAP). The watershed of the SRP system extends signifi-
cantly beyond the AMAs, but the benefits accrue primarily within the Phoenix AMA. SRP,
which began operating in 1903, was the first multi-purpose federal reclamation project and cur-
rently delivers more than a million acre-feet of water to its water service area of 240,000 acres and
other lands in the Phoenix metropolitan area. On average this supply is about two-thirds surface
water and one-third groundwater. The CAP system is interconnected with the SRP system,
providing maximum flexibility for conjunctive management. This has proven to be extremely
beneficial in the context of the recent drought, but does not result in enhanced water supplies
outside the AMAs.
Availability of water supplies has multiple components. Physical access to water is the
limiting factor in many places where there is no surface water and where groundwater may be
either very limited or difficult and expensive to withdraw. Reliability of supply also is important,
since some supplies are subject to seasonal or drought-related shortages. In some cases, physical
availability is not a problem, but there are legal impediments to the use of the water such as a
senior water right holder with a court decreed right to a particular supply. Financial access is the
third major challenge. If water supplies are available and water rights issues are resolved, there
still may be inadequate financial resources to build the required distribution and/or storage sys-
tem.
If major new pipelines or canals are constructed in the future to transfer water supplies
within the state, financial constraints may require a federal partner in the project. In some cases,
the partnership may develop as a component of Indian water settlements. Among the options that
have been evaluated is the piping of Colorado River water from Lake Powell south to Flagstaff
and then west to Williams and also east onto the Navajo and Hopi Reservations. Multiple other
water transfer, storage and exchange options are under consideration, including some that focus
on moving groundwater from one location to another. Water transfers generally entail multiple
WATER SUPPLY MANAGEMENT BEYOND THE ACTIVE MANAGEMENT AREAS
97 Draft of 10/06/04
legal, economic and political issues that may prove difficult to overcome. Currently transfers of
groundwater between basins are prohibited except for specific exemptions.
Communities that have considered the need to import water supplies to address expected
increased demand include Williams, Flagstaff, Grand Canyon Village-Tusayan, Pine-Payson-
Strawberry, Sierra Vista, the Navajo and Hopi Reservations and municipal users inside the Prescott
AMA.
WATER MANAGEMENT
Water Adequacy Program
As a consumer protection measure, a statewide water adequacy program has been in
place since 1973. The Water Adequacy Program, described in A.R.S. § 45-108 and in rules
adopted by the Arizona Department of Water Resources (ADWR) in 1995 (R12-15-715—R12-
15-725), requires subdivision developers to obtain a determination from the ADWR regarding
the availability of water supplies prior to marketing lots. Developers are required to disclose any
inadequacy of supply to potential buyers, but subdivisions can be and frequently are approved in
areas where the water supply is inadequate. Furthermore, the disclosure is required only in the
initial public report and, therefore, subsequent buyers generally are unaware of the water supply
conditions. In many cases, developers do not even submit hydrologic information to request an
adequacy statement and simply request that the department quickly issue them their inadequacy
letter so they can proceed with the approval and marketing of the subdivision.
Within the AMAs the Assured Water Supply (AWS) Program does not allow new subdi-
visions if the water supply is inadequate to serve the proposed use for 100 years. However, the
Water Adequacy Program is the only regulatory mechanism addressing water supplies for new
subdivisions outside of AMAs. Although the authority of the ADWR does not ensure adequacy
of water supplies for new subdivisions outside of AMAs, other jurisdictions have even more
limited authority to address the connections among land use, population growth and water sup-
ply. This situation is particularly frustrating to county land use jurisdictions, which have more
WATER SUPPLY MANAGEMENT BEYOND THE ACTIVE MANAGEMENT AREAS
98 Draft of 10/06/04
limited powers than cities and towns to deny approval of, or limit the size and density of, new
subdivisions. In spite of the limited authorities available to counties, efforts have been made to
coordinate land use plans with water supplies (Appendix N). The Water Adequacy Program is
clearly an insufficient tool to coordinate water supply with land use and population growth, yet it
currently is the only regulatory tool available.
Growing Smarter Water Planning Efforts
An effort to address growth-related issues and urban sprawl resulted in the passage of the
Growing Smarter Act of 1998 and the Growing Smarter Plus Act of 2000. Taken together, the
Growing Smarter legislation was intended, on the one hand, to provide a framework for compre-
hensive land use planning and zoning, including the acquisition of open space and, on the other
hand, to give residents of Arizona cities, towns and counties some tools to shape growth in their
own communities. The legislation includes the right to vote on general plans and restrictions on
how general and comprehensive plans can be amended. Growing Smarter Plus requires a water
resources element from: (1) municipalities with a population over 2,500, unless they have a popu-
lation under 10,000 and have an annual growth rate of less than two percent and (2) counties with
populations greater than 125,000. There are four counties and 23 communities outside of AMAs
that are required to produce a water resources element under these criteria. The legislative lan-
guage (Appendix O) requires identification based on existing data for:
• Known legally and physically available supplies,
• Future demand for water, and
• How demand will be served by currently available supplies or a plan to obtain thenecessary supplies.
In 2003 ADWR circulated a questionnaire that was sent to all cities, towns, counties,
Indian tribes and water providers to identify water issues and concerns outside AMAs. The
county version of the 2003 ADWR Rural Water Resources Questionnaire included multiple
WATER SUPPLY MANAGEMENT BEYOND THE ACTIVE MANAGEMENT AREAS
99 Draft of 10/06/04
questions related to the Growing Smarter legislation and its effectiveness. Findings included ob-
servations that:
• The Growing Smarter legislation appears to have had a very limited impact on im-proving the coordination between water management and population growth;
• Although many non-AMA jurisdictions have reported that this was a useful exercise,data are inadequate for meaningful planning, and the lack of enforcement means thatthe effort will be very uneven at best;
• No new state financial resources have been provided to counties or communities todevelop the needed information; and
• Although the legislation appears to give counties some authority in water resourceplanning, the focus seems to be on looking for water resources to facilitate projectedgrowth and not on considering the impacts of growth on available water resources ordeveloping a “carrying capacity” concept.
Counties have found preparation of the water resources element to be difficult. The
requirement is particularly difficult for the many rural municipalities that have no control over the
water suppliers within their jurisdictions. This means that the entities that actually run the water
systems and decide who to serve are not within the control of the land use planning authority and
themselves have no planning requirements. There frequently is little coordination between the
water companies and those who must submit the water resources element. The principal benefit
of the requirement for a water resources element is that it has made apparent the critical lack of
information and coordination in rural areas of Arizona. Within AMAs, the Growing Smarter
legislation appears to offer no benefit not already provided by the AWS Program.
Watershed Initiative Efforts
The call for an increasing focus on water issues in the non-AMA portions of the state
began to emerge during the mid-1990s. The ADWR encouraged these areas to form regional
groups of stakeholders to work towards local solutions to watershed problems. With technical
assistance from the ADWR, 17 watershed groups formed to conduct water resource stud-
WATER SUPPLY MANAGEMENT BEYOND THE ACTIVE MANAGEMENT AREAS
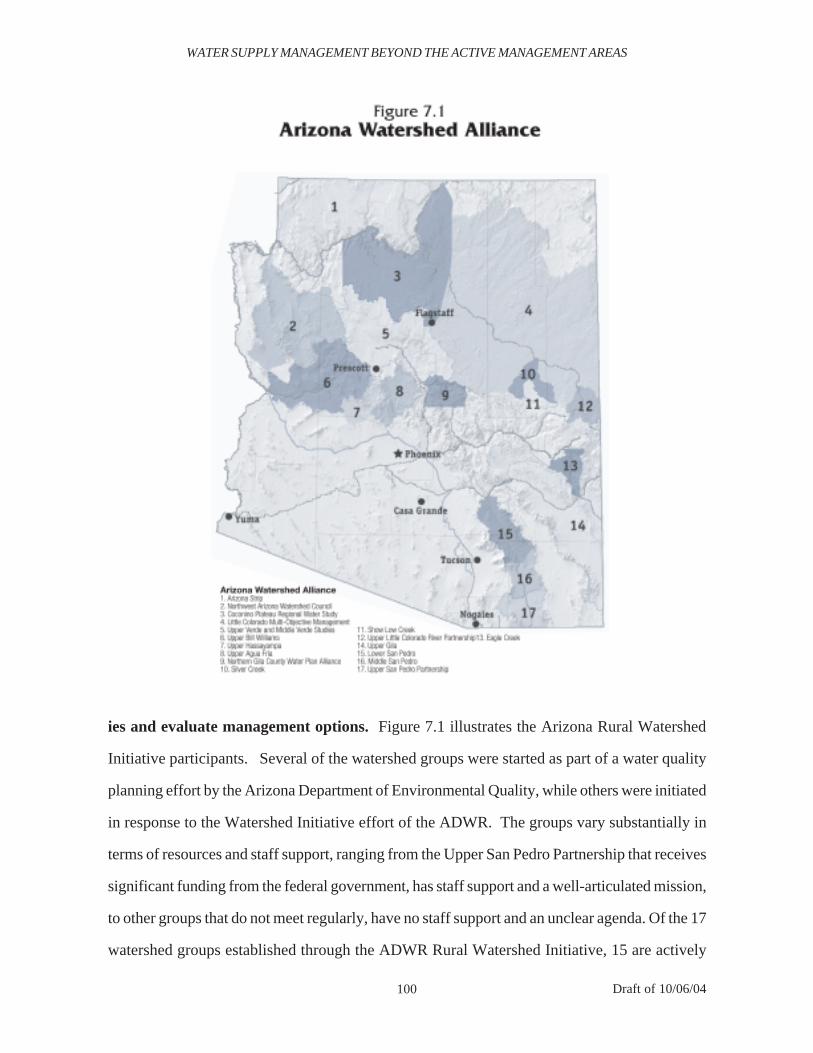
100 Draft of 10/06/04
ies and evaluate management options. Figure 7.1 illustrates the Arizona Rural Watershed
Initiative participants. Several of the watershed groups were started as part of a water quality
planning effort by the Arizona Department of Environmental Quality, while others were initiated
in response to the Watershed Initiative effort of the ADWR. The groups vary substantially in
terms of resources and staff support, ranging from the Upper San Pedro Partnership that receives
significant funding from the federal government, has staff support and a well-articulated mission,
to other groups that do not meet regularly, have no staff support and an unclear agenda. Of the 17
watershed groups established through the ADWR Rural Watershed Initiative, 15 are actively
WATER SUPPLY MANAGEMENT BEYOND THE ACTIVE MANAGEMENT AREAS
101 Draft of 10/06/04
working on regional solutions to water problems with the ultimate goal of developing a compre-
hensive water resource management plan for each. The Coconino Plateau Water Advisory Council,
the Upper and Middle Verde Groups, and the Upper San Pedro Partnership are the most active
and have the most resources available to them. The groups formed the Arizona Watershed Alli-
ance in 2000 to enhance coordination and raise the visibility of their issues.
The Rural Watershed Initiative was funded by the Legislature in 1999 at $1.2 million to
assist the groups with development of information to support water resources planning in their
areas. Although funding has diminished since then, matching funds from other entities have
assisted in keeping key projects funded and moving. The main projects funded by the Initiative
are U.S. Geological Survey hydrologic studies in the Coconino Plateau, Upper and Middle Verde,
Mogollon Highlands and San Pedro areas. None of these studies has been completed to date,
although preliminary work products are available.
Key issues for the watershed groups are: (1) most are entirely volunteer groups, with no
paid staff, and thus are severely constrained in their ability to accomplish a cohesive planning
effort; (2) inadequate hydrologic data; (3) key players, such as the managers of water companies,
are in many cases not part of the conversation; and (4) the multiple water management entities
involved have little incentive or ability to forge regional cooperative efforts. The absence of key
players makes meaningful planning very difficult. If the development of a readily accessible rural
water supply database is to occur, significant investments are needed.
The Watershed Initiative is focused on locally initiated efforts to manage water supplies.
The key advantage to this approach is empowering local citizens to find solutions that match the
specific problems in their own regions. However, given the strong private property rights senti-
ment in rural Arizona, it is not clear that all of the watersheds can find meaningful solutions that
generally are acceptable to the residents. A key issue is the lack of water management and land
planning authority.
In addition to the Rural Watershed groups, there are multiple other water-related groups
that address issues in the non-AMA portions of the state. They include the Navajo Nation’s
WATER SUPPLY MANAGEMENT BEYOND THE ACTIVE MANAGEMENT AREAS
102 Draft of 10/06/04
Municipal and Non-municipal Task Forces, the Oak Creek Canyon Task Force, the Mohave
County Water Authority, the Yavapai County Water Advisory Council, the Northern Arizona
Municipal Water Users Association and the Verde Watershed and Natural Resources Associa-
tion.
Regional Water Management
There is interest in the non-AMA areas in establishing regional water management enti-
ties to oversee the planning and management of water resources within watersheds. This issue
was raised as a top priority at the Arizona Watershed Alliance meeting in Globe in December of
2002 and has continued since then to be discussed in various forums, including Representative
Tom O’Halleran’s “Water Group,” an ad hoc group of interested parties. Many rural entities
are concerned that state-level regulatory entities will not develop appropriate solutions to
local problems, and that local management would be more acceptable. However, there are
very significant legal, financial and representational issues that need to be resolved if effective
regional entities with the legal and financial capability to implement water management solutions
are to be established. Experience with one such district, the Santa Cruz Valley Water District
within the Tucson AMA, demonstrated that such issues could undermine the structure of the local
entity, despite good intentions. The Santa Cruz Valley Water District was begun under provi-
sional authority but was unable to resolve taxation and representation issues and dissolved prior
to final establishment (Megdal, 2003).
Land use planning entities, particularly counties, are frustrated that they do not currently
have authority to consider water adequacy in approving new subdivisions. Although several
counties historically have used inadequate water supplies as a rationale for denying a subdivision
plat, the practice is not widespread. New subdivisions are allowed under the Water Adequacy
Program outside of AMAs even if the water supply is found to be inadequate by ADWR. The
only legal requirement is that the inadequacy finding be disclosed in the public report for the
initial owners of lots in such subdivisions. There have been numerous discussions of ways to
WATER SUPPLY MANAGEMENT BEYOND THE ACTIVE MANAGEMENT AREAS
103 Draft of 10/06/04
resolve this issue so that counties can have discretion to deny subdivision plats without being in
conflict with state statute. However, clear Arizona legislative authority for counties that choose
to use water supply availability, as determined by ADWR, as a condition of platting or zoning
could be an effective tool.
Conservation Efforts
Most potable water conservation efforts to date have occurred within AMAs, though
there are notable exceptions such as the Town of Payson, the Upper San Pedro Partnership and
the City of Flagstaff. Statewide conservation efforts have been very limited. Governor Napolitano’s
Executive Order of March 2002 establishing the Arizona Drought Task Force contains a require-
ment to “[d]evelop and implement a statewide conservation education strategy that emphasizes
educational advertising for good water habit development” and to form a work group on Conser-
vation Education to “design an educational advertising plan for use in water conservation educa-
tion throughout the state, but focused on rural areas.” The statewide conservation strategy cur-
rently is under development, but some educational programs now are promoted widely through-
out the state.
Payson, for example, distributes conservation literature, has a rebate program for conser-
vation investments, adopted conservation-oriented ordinances restricting turf and requiring low
water-use landscaping and waterless urinals in public restrooms, has conservation-oriented hook-
up policies, applies short-term water restrictions in response to drought and reuses its wastewater
for recharge and irrigation. Flagstaff uses all of the same methods except for conservation-ori-
ented hook-up policies and significantly has restricted outdoor watering year round in response to
drought.
Conservation opportunities exist outside the AMAs, in particular because many delivery
systems are not fully metered. However, potable water use on a per capita basis in the rural parts
of the state is relatively low in comparison to the larger urban areas. This is in part due to the lack
of available surface water for landscape irrigation. In addition, some parts of the state lack ad-
WATER SUPPLY MANAGEMENT BEYOND THE ACTIVE MANAGEMENT AREAS
104 Draft of 10/06/04
equate water delivery infrastructure. For example, water users on the Navajo Reservation, where
up to 50 percent of the rural residents haul their own water, use as little as ten gallons per person
per day. Many rural communities are resistant to the idea of conservation regulations since they
witness the higher water use rates within the AMAs. However, the differences in temperature
and precipitation throughout the state do result in higher demand for landscape water in the lower
desert areas, so these factors need to be taken into account when assessing water use efficiency.
Demand reduction is an option in some rural areas, but conservation yields are limited in cases
where there is already little discretionary water use.
Conservation opportunities in the non-AMA portions of the state include:
• System improvements to reduce leaks and enhance monitoring,• Expanding the use of meters,• Price-related conservation signals, such as rate structures that charge more for higher
volumes of water use,• Ordinances limiting high water-use landscaping and encouraging appropriate land-
scape irrigation design and scheduling,• Financial or other incentives for replacing high-water use fixtures with conserving
appliances, removing high water-use landscaping, incorporating water harvesting (col-lection of storm water), gray water (water from sinks and washing machines) andeffluent for landscape applications in new developments, and
• Conservation-oriented hookup policies and building code provisions.
Results from the Rural Water Resources Study questionnaire indicated that many water
providers in rural Arizona would like assistance with establishing or expanding their conserva-
tion programs. There is a high degree of interest in conservation as a water management tool, but
it has not been a high priority for many providers who may not have the resources or training to
pursue it. A statewide conservation office that would assist with conservation technology and
information transfer has been proposed on multiple occasions but has not yet been established.
Local Drought Planning and Mitigation Efforts
Significant impacts of drought outside of the AMAs include: ranchers reducing herd size
by two-thirds statewide over the past five years; severe wildfires in the mountains; widespread
WATER SUPPLY MANAGEMENT BEYOND THE ACTIVE MANAGEMENT AREAS
105 Draft of 10/06/04
bark beetle infestations and die-off of up to two million ponderosa and pinyon pines; forest clo-
sures limiting recreation opportunities; and health and safety concerns in many municipal supply
systems due to inadequate water supplies. The visibility of this issue has resulted in strong inter-
est in developing a state drought plan in order to limit such impacts in the future, with particular
focus on rural areas. Drought response efforts to date have focused entirely on reactive mecha-
nisms, such as hauling water, that may not reduce risk in the longer term.
The Governor’s Drought Task Force has focused on the need for drought planning within
rural communities because the major metropolitan areas have more water-supply options avail-
able. Assessment of vulnerabilities and development of mitigation strategies is expected to be an
ongoing process in the hope that the impacts of future droughts will be less substantial. However,
the lack of alternative supplies in many rural areas leaves them with a high degree of vulnerabil-
ity.
Legal limitations on the ability to transfer groundwater across basin boundaries also pose
some unique challenges in the context of drought. The 1991 Groundwater Transportation Act
was intended to protect rural areas from having their water exported to the AMAs to meet AWS
requirements. The Act, along with 1993 amendments, prohibits moving groundwater from one
basin to another, with certain specified exceptions. Ironically, it is now the rural areas that seek to
move groundwater from one basin to another in order to alleviate severe shortages outside the
AMAs. Exceptions to this prohibition have been allowed by ADWR permit, pursuant to annu-
ally re-adopted emergency legislation each year, over the last few years of severe drought condi-
tions.
One focus of the Operational Drought Plan is on improved monitoring of climate condi-
tions and impacts as well as on enhancing the reliability of municipal supply systems. However,
individual well owners in shallow and fractured rock aquifers, where productivity may be very
low, often feel drought impacts. High densities of domestic wells exacerbate the drought impacts
in some areas. The ADWR is monitoring public contacts related to individual well problems, but
this is a more difficult issue to address than water supplies for larger water systems. The Arizona
WATER SUPPLY MANAGEMENT BEYOND THE ACTIVE MANAGEMENT AREAS
106 Draft of 10/06/04
Drought Preparedness Plan currently is evolving and the specific structure of the adaptation and
mitigation efforts is not final.
Other than the Navajo Reservation, which recently adopted a sophisticated drought plan
with assistance from the Bureau of Reclamation and the National Drought Mitigation Center, no
communities or jurisdictions outside of the AMAs have officially adopted drought plans. Juris-
dictions and water providers that have had specific problems meeting water demand in their areas
have instituted drought-related conservation requirements and water use restrictions such as those
in Flagstaff and Payson. However, these were not in the context of a long-term drought response
or mitigation plan.
Curtailment plans exist for roughly 30 private water providers regulated by the Arizona
Corporation Commission (ACC). Some of these plans have been put in place in response to
emergency conditions experienced within the provider’s service area. Others were implemented
as part of a revised ACC standard procedure that requires these plans as part of the implementa-
tion of a new rate structure. The curtailment plans are not focused specifically on drought, but
instead on any problem that can cause a shortage of available supplies. In addition, they are not
focused on adaptation or mitigation options that would prevent the shortage in the first place.
Instead they focus just on restrictions of customer use during the duration of the problem. How-
ever, once they are in place, they provide the water company with authority to restrict water
deliveries to their customers in order to avoid more serious consequences.
A recommendation in the draft Drought Preparedness Plan is that all communities adopt a
drought plan for their own community. It is not clear at this time whether this recommendation
will become a requirement, and whether resources to support such activities will be available.
OTHER WATER ISSUES
Water Supply and Growth
The connection between water supply problems, drought and growth is complex. A tradi-
tional perspective is that water supply availability is an incentive for growth, and that lack of
supplies is a significant disincentive. Yet, water is being hauled from standpipes (water supply
WATER SUPPLY MANAGEMENT BEYOND THE ACTIVE MANAGEMENT AREAS
107 Draft of 10/06/04
valves used for filling tanks) and from larger communities as a regular business practice in much
of rural northern Arizona even in the absence of drought. The willingness to haul water may
mean that the theory that inadequate local water supplies limit growth does not apply. Still, it is
impractical and shortsighted to build communities without access to dependable water supplies.
Many communities, especially in northern Arizona and on the Mogollon Rim, already
have hit a threshold relative to their ability to serve new customers. However, the absence of
an enforceable water adequacy requirement means that most of these communities continue to
grow even though their water supplies do not. There clearly are health and welfare implications,
and state and federal agencies already have been involved in “bail-out” activities, e.g., water
hauling, that do not increase the likelihood of the development of a long-term solution.
Exempt Wells and Lot Splitting
“Exempt wells” are domestic wells with a maximum capacity of 35 gallons per minute.
They are exempt from regulation statewide, except that they must be registered, a Notice of
Intention to Drill must be filed with ADWR and they must be drilled by a licensed well driller in
accordance with state well construction standards. Exempt wells are common in rural Arizona
and are the primary source of drinking water in many areas, particularly where lots are split
without going through the subdivision process. A significant increase in the number of exempt
wells being drilled has been documented in every county in the state. In most counties, the
number of exempt wells drilled quadrupled between 1997 and 1998, and the high rate of well
drilling continued through 2002. There are significant restrictions on the use of such wells, in-
cluding the requirement to have a water right in order to use them and annual measurement and
reporting of water use.
In the ADWR Rural Water Resources Study Questionnaire, virtually all counties indi-
cated that lot splitting and exempt wells were a major concern, though only five water companies
indicated exempt wells affected water availability for their company. Under current Arizona real
estate law, parcels can be split into up to five lots without requiring subdivision review. This
WATER SUPPLY MANAGEMENT BEYOND THE ACTIVE MANAGEMENT AREAS
108 Draft of 10/06/04
practice is prevalent in rural, unincorporated parts of the state, and in many cases is the primary
source of new residential lots.
Since 1977 there have been efforts by the County Planning Directors to address the issues
associated with parcel splitting. Because a significant proportion of growth in rural communities
is occurring through this unregulated, unmonitored process, often referred to as “wildcat subdi-
viding,” coordination of land use and water supply availability is needed. Other impacts associ-
ated with lot splitting include multiple problems associated with road-building, maintenance and
access, inadequate sewer, water, solid waste, electric and gas service, health hazards and erosion
associated with dirt roads, inadequate addressing and road systems for emergency response, lack
of flood and fire protection and inadequate school facilities.
The primary means of providing water to areas with multiple parcel splits is through
exempt domestic wells, and the vast majority of lots are served by septic systems rather than
sewer facilities. Installing exempt wells too close to septic systems can result in health hazards. In
many cases the water supply for multiple domestic wells that are in close proximity to each other
is inadequate. Multiple exempt wells in close proximity to each other may dewater the area if the
aquifer is not very productive, leading to the need to deepen wells, drill new wells or haul water.
Although those who split lots into multiple parcels reduce their own development costs by not
going through the subdivision process, there are substantial taxpayer costs associated with bring-
ing such developments up to county codes when improvements eventually are made. These
public costs could be reduced if the services were planned for prior to development and ease-
ments for access were provided. The Arizona Department of Real Estate, with responsibility for
enforcing the subdivision laws, has limited compliance capability. Illegal lot splits generally are
investigated after the fact, and there is little recourse at that point.
Legislative efforts to address the lot-splitting issue occurred in 1978, 1994, 1995, 1997
and 2000. The Growing Smarter Plus legislation in 2000 required an affidavit from the seller to
the buyer in a lot-split, disclosing information regarding access, roads, utility availability, wells
and septic tanks. The buyer is required to record the affidavit. However, the overall issue is
WATER SUPPLY MANAGEMENT BEYOND THE ACTIVE MANAGEMENT AREAS
109 Draft of 10/06/04
largely unresolved and in some ways counties are now more restricted than previously in their
ability to address lot-split issues. A subdivision was defined as four or more lots prior to 1994.
Legislation changing the definition to six or more lots actually exacerbated the problem by in-
creasing the number of lots that can be created without going through the subdivision process.
Inadequate Data and Resources for Planning
Virtually all watershed groups and communities outside of the AMAs are hampered by
inadequate hydrologic information, although some basins, such as the Upper San Pedro, have
been extensively modeled. Most counties and jurisdictions also have indicated that they have
inadequate information with which to plan for future water needs. This was a priority issue at the
Arizona Rural Water Planning Conference held in Globe in December 2002. Groundwater
supplies are very difficult to estimate in undeveloped areas. As more wells are drilled, there
are increased opportunities to log the aquifer characteristics and measure water levels. Even in
basins that have a significant number of wells, however, there may be inadequate drilling logs.
The AMAs have a great advantage over areas of the state outside the AMAs regarding
the availability, amount and quality of information. Since 1984, all water pumped from wells
over 35 gallons per minute in AMAs has been required to be measured and reported to the state
by the well owners. This has resulted in an excellent database. There is virtually no annual
pumpage information outside of AMAs because metering is not required. This also limits
the ability to encourage efficiency in water delivery systems, since losses are generally not calcu-
lated. Without measured pumpage data, it is difficult to correlate changes in water levels with
inflows and outflows to an aquifer. A basic inflow-outflow calculation for a basin is key to
understanding whether additional growth can be sustained in the area.
Well Spacing
Within AMAs, new large (non-exempt, over 35 gallons per minute) wells are evaluated
for impacts on other wells in the vicinity before they are permitted. If the impact of the new well
WATER SUPPLY MANAGEMENT BEYOND THE ACTIVE MANAGEMENT AREAS
110 Draft of 10/06/04
will exceed ten feet of additional drawdown over a five-year period, the application will be de-
nied unless the impacts are mitigated. Outside of AMAs, there are no well spacing requirements.
This is yet another way that rural areas are at a disadvantage, because water users are not pro-
tected from impacts of new large wells.
POTENTIAL CHANGES IN INSTITUTIONS, POLICIESAND REGULATIONS
Over the past few years, legislative proposals have been discussed that would address
some of the issues described above. These include provisions to allow counties to consider a
finding of inadequacy of water supply in platting decisions, requirements for a regional evalua-
tion of water supplies in the context of Growing Smarter water elements, limitations on new
exempt wells within municipal water service areas, provisions to control lot splitting and require-
ments that 100 years of water be available for new developments outside of the AMAs. Though
the specifics of these proposals continue to evolve, there is considerable controversy. It is not
clear that an AWS provision for areas outside the AMAs could require use of renewable supplies
as they do within the AMAs, since there is no CAP supply available and other renewable sources
are prohibitively expensive in many areas. To date, there has been resistance to the introduction
of any form of assured water supply requirement in the non-AMA areas of the state.
Though watershed groups and local jurisdictions have supported the establishment of
regional water management entities, questions remain about how such groups would interface
with state regulatory authorities, whether effective programs can be implemented on a voluntary
basis, who will have authority to implement and enforce any regulatory provisions and how the
efforts would be funded. Legislation passed in 2003 did authorize the formation of voluntary,
multi-jurisdictional water infrastructure financing authorities to assist smaller jurisdictions in join-
ing together to fund infrastructure projects.
By establishing different management goals and allowing for the development of AMA
management plans, the GMA recognized that water management activities need to be tailored to
WATER SUPPLY MANAGEMENT BEYOND THE ACTIVE MANAGEMENT AREAS
111 Draft of 10/06/04
local conditions. Aside from major differences in physical water supply availability, communi-
ties differ in attitudes about the need for new regulations, potential for access to renewable sup-
plies, acceptability of proposals to transfer water and in ability to pay for technical assistance and
new infrastructure. These differences make implementation of a rural regulatory framework
challenging and may require an incremental approach.
DRIVERS IN LOCAL WATER MANAGEMENT EFFORTS
Despite the challenges associated with the diversity of water sources, geohydrology, en-
vironmental considerations and growth rates, progress toward developing and implementing water
plans is being made in some non-AMA areas. Why? Progress can be attributed to the existence
of “drivers” or external pressures on the system, as illustrated in the following examples.
The Upper San Pedro Partnership
Key drivers here are the need to maintain water flows for endangered species and to
preserve the San Pedro Riparian National Conservation Area, while protecting Fort Huachuca
and development in the Sierra Vista area. The futures of the Fort, riparian areas and endangered
species all have federal as well as local implications. The combination of these major concerns
resulted in the formation of the Upper San Pedro Partnership, historically an organization that
was voluntary and consensus based, made up of local jurisdictions, federal and state agencies and
environmental interests. They have now been given a federal mandate to produce a plan that
would ensure a sustainable water supply, with specific reporting deadlines. Funding for neces-
sary studies has been abundant because of the significant federal interest and the involvement of
several members of Arizona’s Congressional delegation. The area has been studied for some
time to determine if hydrologic conditions warrant the formation of an AMA. The area also is
important to environmental interests due to high biodiversity and bird habitat. Without the high
level of concern by various parties, and the financial resources that have been made available, it is
unlikely that the Partnership would have been as successful as it has been.
WATER SUPPLY MANAGEMENT BEYOND THE ACTIVE MANAGEMENT AREAS
112 Draft of 10/06/04
The Upper and Middle Verde Watershed Groups
Key drivers in this region relate to meeting the water needs of a rapidly growing region in
a way that does not adversely affect the environment that is largely responsible for the quality of
life and economic vitality of the area. Concerns are focused on ensuring continued flows in the
Verde River as well as protecting endangered species, while providing for continued growth.
Addressing issues in this region is complicated by the fact that part of the watershed falls within
the Prescott AMA. There are more than 20 associations and citizen groups interested in address-
ing these issues, including the Yavapai County Water Advisory Committee that is staffed full-
time by the County. Recently a consortium was formed to enhance communication and collabo-
ration. Even though many studies have been done and are underway, more work remains. Re-
cent deliberations regarding the Yavapai Land Exchange, which would exchange federally owned
land for private land in disconnected parcels, have engaged Arizona’s United States senators in
the discussion. Federal legislation has been contemplated, modeled to some extent on the Upper
San Pedro Partnership, that would provide financial resources as well as a requirement to develop
a plan.
The Colorado Plateau
The Colorado Plateau is an area with diverse populations and geography. The main
driver is the need to supply water to meet Indian and non-Indian demands in the face of limited
access and/or rights to renewable water supplies. There are concerns about the impact of the
Peabody Coal operation on water supplies and important springs across the Hopi and Navajo
lands. The City of Flagstaff has successfully used a variety of conservation measures that have
reduced per capita water use one percent per year since 1990. Although Flagstaff has made
strides in reducing water use, the city and others in the region have yet to agree upon plans for
augmenting water supplies. Water rights of the Navajo and Hopi Nations are under consideration
by the courts and may ultimately be decided in a settlement agreement with state, federal and local
WATER SUPPLY MANAGEMENT BEYOND THE ACTIVE MANAGEMENT AREAS
113 Draft of 10/06/04
parties that could result in new imported water supplies, most likely from the Colorado River.
However, there are numerous legal obstacles to a solution.
SUMMARY
Water issues outside of the AMAs are challenging, and in some cases ensuring a sustain-
able water supply may not be possible without importing water from elsewhere. The impacts of
drought are more severe in many areas outside the AMAs because of the limited size of
aquifers and the absence of multiple water supply sources, and financial resources are
scarce because of the relatively small size of the rural economies. There are polarized views
held by, on the one hand, those whose primary concern is protecting the quality of life that drew
them to the area in the first place and, on the other hand, private property rights and development
interests. Resolution of the water supply and growth issues will require significant leadership and
foresight as well as investments in renewable supplies. Despite these challenges, the likelihood
of positive outcomes in the areas listed above seems high because financial resources are avail-
able and there is a federal interest in resolution. Also, the magnifying power of drought has
helped to reveal the extent of the problem and helped to concentrate the thinking of those in-
volved.
WATER SUPPLY MANAGEMENT BEYOND THE ACTIVE MANAGEMENT AREAS

114 Draft of 10/06/04
WATER SUPPLY MANAGEMENT BEYOND THE ACTIVE MANAGEMENT AREAS
115 Draft of 10/06/04
Chapter 8
TRIBAL WATER SETTLEMENTS IN ARIZONA
BONNIE G. COLBY
Indian water settlements will play a crucial role in shaping the future of tribal and non-
Indian communities in Arizona. Numerous factors are creating unprecedented pressure to re-
solve tribal water claims, including the rapid growth of Arizona cities, full appropriation of de-
pendable surface water supplies, declining groundwater levels and environmental opposition to
new water development projects. Arizona Indian tribes control large amounts of land and have
vast entitlements to water resources. Nineteen Indian reservations account for 20 million acres
(28 percent) of the state’s land base (Figure 8.1). Some observers have calculated that the water
entitlements of Arizona tribes, many of which remain to be quantified, easily surpass the state’s
surface water supplies, all of which presently are used by other parties.
A complex and sometimes contradictory body of federal and state laws and policies gov-
erns the water rights of tribes and non-Indian water users. For decades, litigation was the tradi-
tional method to quantify tribal water rights throughout the western United States. In Arizona, the
state initiated a specific form of litigation–general stream adjudication–in order to clarify water
rights and quantify tribal and federal reserved water rights. Tribal water settlement discussions
occur in the context of Arizona’s adjudications. The negotiating process in Arizona, while more
ad hoc and private than in states like Montana, is productive. Parties in Arizona have achieved
eight settlements, more than any other state. The leadership of influential members of Congress
has helped many of Arizona’s settlements. For example, Senator Barry Goldwater and Represen-
tative John Rhodes were influential in securing the first tribal water settlement in the United
States, the Ak-Chin Settlement.
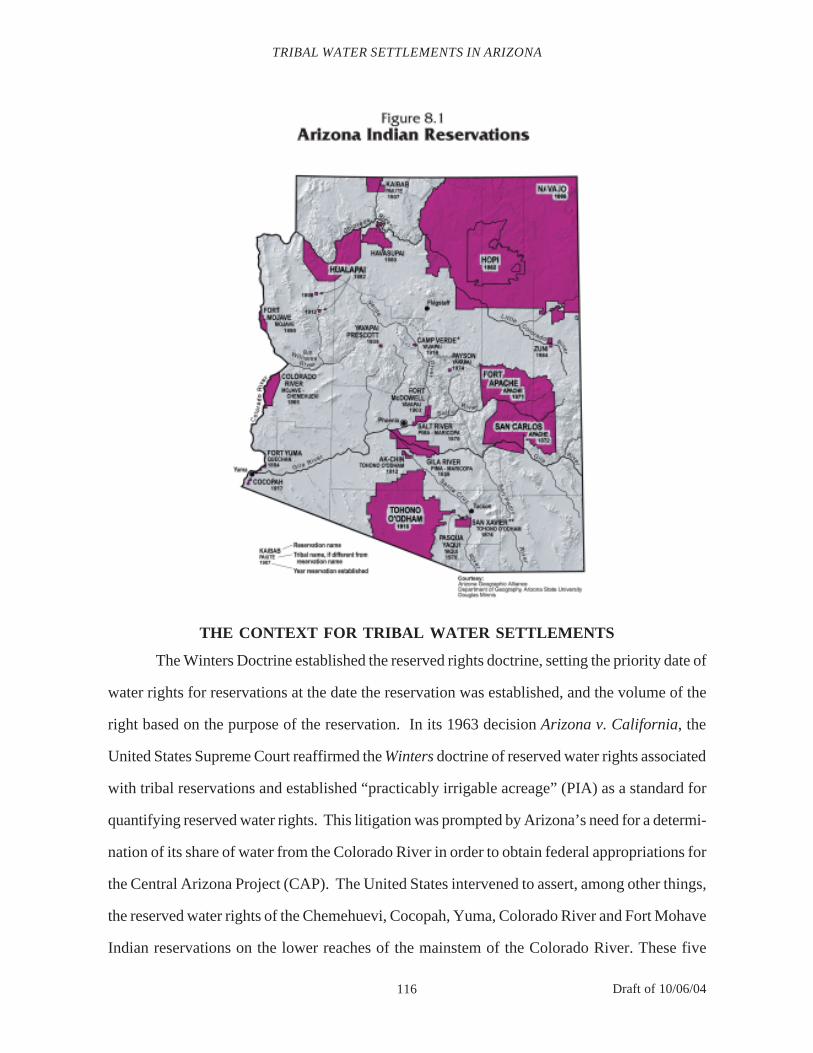
116 Draft of 10/06/04
THE CONTEXT FOR TRIBAL WATER SETTLEMENTS
The Winters Doctrine established the reserved rights doctrine, setting the priority date of
water rights for reservations at the date the reservation was established, and the volume of the
right based on the purpose of the reservation. In its 1963 decision Arizona v. California, the
United States Supreme Court reaffirmed the Winters doctrine of reserved water rights associated
with tribal reservations and established “practicably irrigable acreage” (PIA) as a standard for
quantifying reserved water rights. This litigation was prompted by Arizona’s need for a determi-
nation of its share of water from the Colorado River in order to obtain federal appropriations for
the Central Arizona Project (CAP). The United States intervened to assert, among other things,
the reserved water rights of the Chemehuevi, Cocopah, Yuma, Colorado River and Fort Mohave
Indian reservations on the lower reaches of the mainstem of the Colorado River. These five
TRIBAL WATER SETTLEMENTS IN ARIZONA
117 Draft of 10/06/04
reservations have quantified rights to over 900,000 acre-feet per year, with early priority dates
making these some of the most reliably and potentially valuable water rights in the southwest if
freely marketable.
In seeking to use water for the benefit of tribal members, Indian tribes in the arid West
face a gauntlet of complex federal environmental laws with the potential to limit much-needed
water development on reservations. The construction of community water supply facilities, taken
for granted in the rest of the country, is essential to Indian reservations. Water development has
only slowly advanced in Indian country, so the rivers and streams that can satisfy tribal water
needs frequently also provide the last remaining useful habitat for aquatic species on the brink of
extinction. On the Navajo Reservation, for example, approximately 40 percent of the population
lacks a potable domestic water supply. While there is a widely perceived value in conserving
endangered species and maintaining the habitat on which those species depend, this provides
little comfort to tribal members who haul water to their homes. Despite the seniority of tribal
reserved rights, Indian tribes encounter difficulties in using their water supplies due to the Endan-
gered Species Act and other applicable federal environmental laws.
These issues are acute in Arizona. Non-Indian communities have understandably sought
to maximize the use of water, including transportation of water over great distances or between
basins and construction of massive water storage projects. These activities required extensive
federal funding and took place with limited attention to environmental consequences. Projects
such as the CAP and the San Juan-Chama Project provide water to support large municipal
populations and maintain economic growth throughout the regions that they serve.
However, Indian tribes that seek to use water can find themselves at odds with those who
oppose the development of new water supplies in the West due to environmental consequences.
Existing water supplies commonly are committed to current non-Indian uses that are impractical
to dislodge in a negotiations setting.
With the confirmation of the reserved rights doctrine in Arizona v. California and the
increasing demands for water to meet growing populations and other uses in the area, it became
TRIBAL WATER SETTLEMENTS IN ARIZONA
118 Draft of 10/06/04
apparent that the question of tribal water rights could not be deferred forever. Identifying the
appropriate judicial forum for hearing cases concerning tribal water rights has been a key issue in
Indian water settlement efforts. Under the legal doctrine of sovereign immunity, the federal
government and tribes as sovereigns, historically could not be brought into state court to have
their water rights determined. This frustrated state attempts to quantify and prioritize all water
rights in general stream adjudications of basins where federal reserved water rights exist. In 1952
Congress passed the McCarran Amendment that allowed the federal government to be brought
into state general stream adjudications, thereby waiving its sovereign immunity in such matters.
Later, the Supreme Court ruled that the McCarran Amendment also applied to state adjudications
of Indian reserved water rights, which are held in trust by the United States. The McCarran
Amendment and related court rulings do not mean that Winters rights are quantified according to
state law, but only that the extent of the federal reserved water rights can be determined in state
court proceedings.
Adjudications are court determinations of water rights volumes and priorities. There are
two general stream adjudications ongoing in Arizona: the Gila River Adjudication, covering the
southern and central portions of the state and the Little Colorado River Adjudication, covering
the northeastern portion of the state. These two cases involve claims to water asserted by indi-
vidual users as well as municipalities, industrial users, irrigation districts, the State of Arizona and
the federal government on behalf of national forests, national parks, wilderness areas and numer-
ous Indian tribes. Both adjudications are over twenty years old. Costs to participants and to
federal and state taxpayers have been high and progress has been uneven.
The goal of both adjudications is to assure a comprehensive final determination of two
types of water rights: (1) rights subject to the state doctrine of prior appropriation and (2) rights
subject to claims based on federal law, including claims for national forests, national parks, wil-
derness areas and particularly the extent and priority of rights for Indian tribes. Because of the
potential magnitude of Indian water rights, uncertainly has existed for some time as to the impact
of these rights upon other users. The adjudications are intended to provide a process through
TRIBAL WATER SETTLEMENTS IN ARIZONA
119 Draft of 10/06/04
which a certain and lasting determination of Indian rights and the rights of federal land reserves
can be achieved, thereby assuring other water users of the relative value and security of their own
water uses. Summons were issued in both adjudications and served on potential claimants in each
watershed—a million summons in all. The summons required a claimant to file a statement with
the Arizona Department of Water Resources (ADWR) if the person claimed a water use in the
watershed. More than 24,000 parties in the Gila River Adjudication filed more than 83,500
statements of claimant and over 3,100 parties filed more than 11,300 claims in the Little Colorado
River Adjudication.
Legal issues have been the primary cause of delays in the adjudications process. The
general adjudication statutes went through substantial legislative changes in 1995. The constitu-
tionality of these amendments was litigated before the Arizona Supreme Court, causing delay in
adjudication proceedings until 1999. The Court ruled some provisions of the 1995 legislation
unconstitutional, upheld some and required that some provisions applied only prospectively.
The Arizona Supreme Court also has heard arguments on and ruled on several substan-
tial, long-standing legal issues. Two of these decisions are especially relevant to tribal water
rights. In 1999, the Arizona Supreme Court held that federal reserved rights extend to groundwa-
ter to the extent groundwater is necessary to accomplish the purpose of a reservation. In 2001, the
Arizona Supreme Court held that
• The purpose of a federal Indian reservation is to serve as a “permanent home andabiding place” to the people living there,
• The practicably irrigable acreage standard is not the exclusive measure to quantifywater rights on Indian lands,
• Quantifying an Indian reserved right is a fact-intensive, reservation-specific inquirythat must address numerous factors, such as a tribe’s land use plans, history, culture,geography, topography, natural resources, economic base, past water use, presentand projected future population and any others deemed relevant,
• Proposed uses must be reasonably feasible, and
TRIBAL WATER SETTLEMENTS IN ARIZONA
120 Draft of 10/06/04
• The amount of water adjudicated must be tailored to the reservation’s minimal need.
Following these rulings, major parties continue to engage in active efforts to resolve Indian and
federal reserved rights by negotiated settlement.
In Arizona v. California, the United States Supreme Court noted that the quantification of
reserved water rights, but not the use of the water, is determined by the purposes for which the
reservation was created. Since that time, tribes have used their Winters rights for a variety of
purposes on their reservations. Negotiated settlements often stipulate specific allowable uses. In
the Southern Arizona Water Rights Settlement Act (SAWRSA), for example, the settlement
legislation allows the Tohono O’odham Nation’s reserved water rights to be used “for any use,
including but not limited to agriculture, municipal, industrial, commercial, mining or recreational
use.” This language is typical of other settlements. While the use of Winters rights on the reserva-
tion generally has been free of controversy, transferring water use off the reservation has proven
contentious.
Tribes have not been authorized to permanently alienate (sell) their reserved water rights,
but can, with congressional approval, lease water for use off reservations. Some Indian law schol-
ars disagree on this point, arguing that congressional approval of off-reservation water leases is
not required. Nevertheless, Congress has delegated to the Secretary of the Interior the authority to
approve leases of Indian land to non-Indians, and some interpret this to include the water needed
to fulfill the purpose of the lease. Off-reservation leasing provisions are included in many of
Arizona’s negotiated settlements. They generate income for tribes, offset the impact of the settle-
ment on local non-Indian water users and, in some instances, help provide consistency with state
water management goals. Where off-reservation leasing of tribal water is contemplated in settle-
ment negotiations, the negotiating parties must decide on the extent of protection extended to
junior water rights. Protection of non-Indian water users has been addressed in a variety of ways
in negotiated settlements. In most Arizona settlements, tribes may lease only their CAP entitle-
ments and only within designated portions of the state.
TRIBAL WATER SETTLEMENTS IN ARIZONA
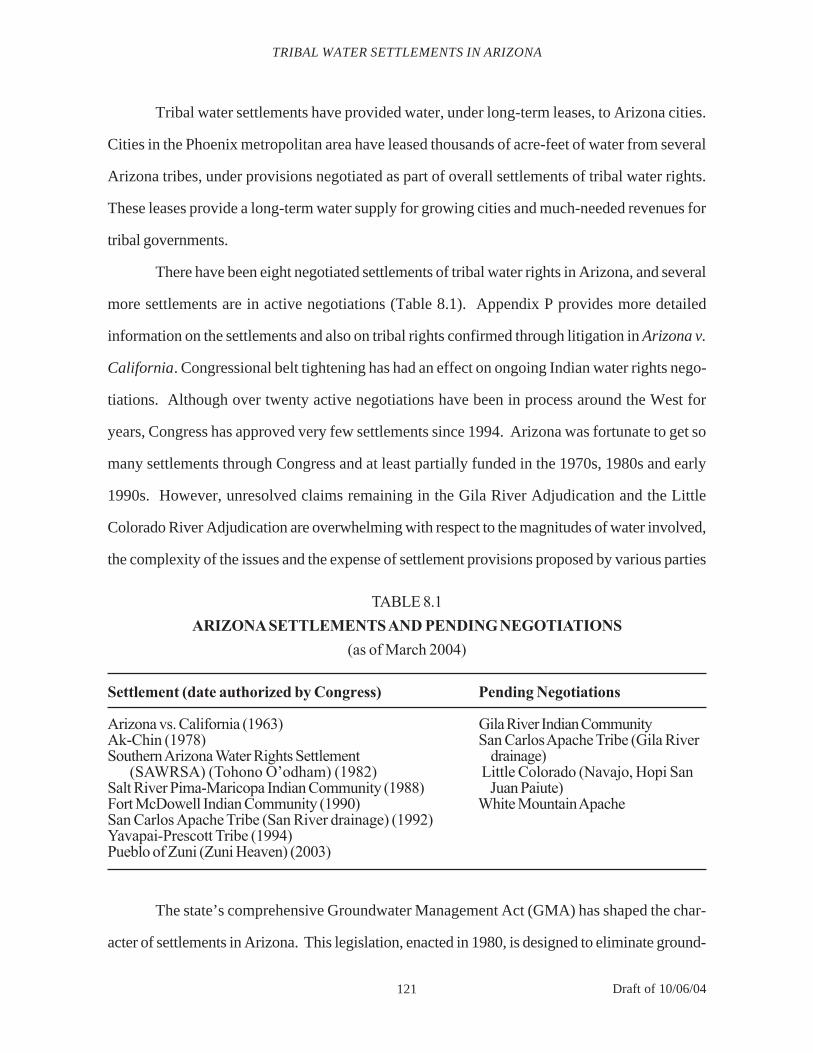
121 Draft of 10/06/04
Tribal water settlements have provided water, under long-term leases, to Arizona cities.
Cities in the Phoenix metropolitan area have leased thousands of acre-feet of water from several
Arizona tribes, under provisions negotiated as part of overall settlements of tribal water rights.
These leases provide a long-term water supply for growing cities and much-needed revenues for
tribal governments.
There have been eight negotiated settlements of tribal water rights in Arizona, and several
more settlements are in active negotiations (Table 8.1). Appendix P provides more detailed
information on the settlements and also on tribal rights confirmed through litigation in Arizona v.
California. Congressional belt tightening has had an effect on ongoing Indian water rights nego-
tiations. Although over twenty active negotiations have been in process around the West for
years, Congress has approved very few settlements since 1994. Arizona was fortunate to get so
many settlements through Congress and at least partially funded in the 1970s, 1980s and early
1990s. However, unresolved claims remaining in the Gila River Adjudication and the Little
Colorado River Adjudication are overwhelming with respect to the magnitudes of water involved,
the complexity of the issues and the expense of settlement provisions proposed by various parties
TABLE 8.1ARIZONA SETTLEMENTS AND PENDING NEGOTIATIONS
(as of March 2004)
Settlement (date authorized by Congress) Pending Negotiations
Arizona vs. California (1963) Gila River Indian CommunityAk-Chin (1978) San Carlos Apache Tribe (Gila RiverSouthern Arizona Water Rights Settlement drainage) (SAWRSA) (Tohono O’odham) (1982) Little Colorado (Navajo, Hopi SanSalt River Pima-Maricopa Indian Community (1988) Juan Paiute)Fort McDowell Indian Community (1990) White Mountain ApacheSan Carlos Apache Tribe (San River drainage) (1992)Yavapai-Prescott Tribe (1994)Pueblo of Zuni (Zuni Heaven) (2003)
The state’s comprehensive Groundwater Management Act (GMA) has shaped the char-
acter of settlements in Arizona. This legislation, enacted in 1980, is designed to eliminate ground-
TRIBAL WATER SETTLEMENTS IN ARIZONA

122 Draft of 10/06/04
water overdraft in selected areas of the state through strict limits on groundwater pumping, man-
datory conservation measures and increased reliance on renewable water sources. The state
insists that Indian water settlements be consistent with these goals, emphasizing the benefits to
tribes and other water users of decreased reliance on diminishing groundwater resources. The
constraints imposed by the GMA have resulted in increasingly complex provisions, as evident
from comparing earlier and later litigated and negotiated settlements.
Most of the Arizona settlements authorized by Congress in the last twenty years include
these key features:
• Provide federal project water to tribes through the CAP;
• Explicitly authorize leasing of tribal CAP water to water users in designated areaswithin Arizona; and
• Set groundwater pumping limits for the reservation.
OVERVIEW OF SELECTED ARIZONA SETTLEMENTS
The Arizona water adjudications, for all their complexity, delay and expense, have pro-
vided impetus for a series of innovative and important Indian water right settlements. One of
these, the Salt River Pima-Maricopa Indian Community Settlement (1991), was the first Indian
water settlement to be successfully incorporated into a final general stream adjudication decree.
Appendix P examines in detail several representative Arizona settlements: Ak-Chin, Salt River
Pima-Maricopa, Yavapai- Prescott, Southern Arizona Water Rights Settlement and the Zuni Heaven
Settlement. Because of the magnitude of the Gila River Indian Community Settlement and its
potential for approval in the short term, it is addressed below.
Current Status of the Gila River Adjudication
In recent years, the principal activity in the Gila River adjudication involves the water
rights claims of the Gila River Indian Community (GRIC). Parties in the adjudication entered
into settlement negotiations to accomplish a myriad of goals. The GRIC settlement is closely tied
TRIBAL WATER SETTLEMENTS IN ARIZONA
123 Draft of 10/06/04
with an agreement between the Central Arizona Water Conservation District (CAWCD) and the
Bureau of Reclamation over repayment for CAP costs. In fact, part of the money paid by CAWCD
into the Lower Colorado River Development Fund also will be used to implement the settlement
of the GRIC’s water rights. In exchange for the GRIC accepting a reduced amount of reserved
right water, $200 million from the CAWCD and CAP repayment money will be redirected to-
ward construction costs of a CAP water delivery system onto the Gila River Indian Reservation.
Thus, the GRIC would accept a Winters allocation of 653,500 acre-feet per year, of which 328,500
acre-feet would be met by CAP water.
Senator Kyl, accompanied by Senator McCain, introduced The Arizona Water Settle-
ments Act in the 107th Congress. A revision of a bill introduced in 2000, the new bill incorpo-
rates further negotiations. The new bill has three headings: the Central Arizona Project Settle-
ment, the Gila River Indian Community Water Rights Settlement and the Southern Arizona Wa-
ter Rights Settlement (SAWRSA). There is no heading for an agreement with the San Carlos
Apache Tribe. However, the bill does reference an “Upper Gila” settlement between the Gila
River Indian Community and the irrigation districts of the Safford Valley. In addition, the new
bill specifically addresses after-acquired trust lands in both the GRIC and the SAWRSA sections.
A second major adjustment occurred in the SAWRSA provision of the bill. The new bill states
that the pumping right obtained by the Tohono O’odham Nation in the 1982 settlement is not a
reserved right to groundwater, but is a right that hinges on the state enforcing well-spacing and
pumping protections in the areas surrounding the Nation. The GRIC obtained provisions that
limit future increases in groundwater pumping by non-Indian water users located near their reser-
vation. Further, the bill addresses mitigation provisions during sustained drought conditions as
well as equitable apportionment of water during drought shortages.
SUMMARY
Arizona now has a quarter-century of experience in negotiating Indian water right settle-
ments. The experiences recounted in this chapter demonstrate the innovative approaches that
TRIBAL WATER SETTLEMENTS IN ARIZONA

124 Draft of 10/06/04
have been employed both to settle past uncertainties and disputes and to plan for the future. Many
lessons may be drawn from this rich body of experiences. Settlements take many years and, even
when finally approved, the settling parties must give sustained attention to implementation. For
agreements to be implemented, they require money for water development or, in some cases, for
environmental restoration. Funding is always difficult to secure, especially in an era where state,
federal and tribal budgets are stretched thin.
As states, tribes, and federal agencies have gained more experience in negotiating water
settlements, problems overlooked in earlier agreements may be avoided. However, only the pas-
sage of time can disclose the unique, unanticipated problems of every agreement. Settlements
should include procedures for addressing these future problems, and negotiators and their succes-
sors must monitor implementation and stay committed to the goals and processes of the agree-
ment.
Most importantly, people make these agreements. Leaders among all the diverse interests
have reached out to bring others into the process. Specialists have generated and compiled hydro-
logic, legal, engineering and economic data. Negotiators have stayed at the table during exhaust-
ing, intense negotiations. Elected officials have approved the resulting accords and appropriated
money. Even after the excitement of successful legislation fades, people stay committed to the
settlement to ensure that water development occurs, watershed improvements are made, unantici-
pated problems are addressed, needed funds are appropriated and future disagreements are expe-
ditiously and fairly resolved. Fundamentally, Indian water right settlements are about people and
creating durable interpersonal relationships in Arizona watersheds.
TRIBAL WATER SETTLEMENTS IN ARIZONA
125 Draft of 10/06/04
Chapter 9
ENVIRONMENTAL ISSUES AND WATER MANAGEMENT
GARY WOODARD
Arizona’s environment and its water resources are inextricably linked. The ways we use
water alter the environment, and changes in the environment affect our water resources. Surface
water diversions and groundwater pumping have depleted or dried up much of the state’s streams
and rivers, causing the loss and alteration of extensive areas of aquatic and riparian habitat. Intro-
duction of exotic species has altered grasslands, reduced xeric desert areas and altered species
distributions.
A growing number of factors other than water use have contributed to major changes in
landscapes and ecosystems over the last 150 years, and the rates of change appear to be acceler-
ating. These land cover changes are affecting our water supplies in ways that we only partially
understand.
While these wholesale land cover changes continue, demand for and uses of our state’s
limited water resources are shifting and increasing. Traditional water uses–agriculture, mining,
domestic and industrial–increasingly are competing with new uses, many of them in-stream uses.
These include preserving habitat under the Endangered Species Act, supporting water-based
recreation and tourism and meeting tribal water claims and the requirements of interstate or inter-
national river compacts.
LAND COVER CHANGES AND WATER SUPPLIES
Land cover, soils and slope largely determine the partitioning of precipitation and thereby
available water supplies (Figure 9.1). After rain and snow fall to the ground, much of it evapo-
rates, but some runs off to streams and river channels and some infiltrates the soil. Soil moisture
can evaporate, be absorbed by plant roots and transpired or infiltrate deep below the surface,
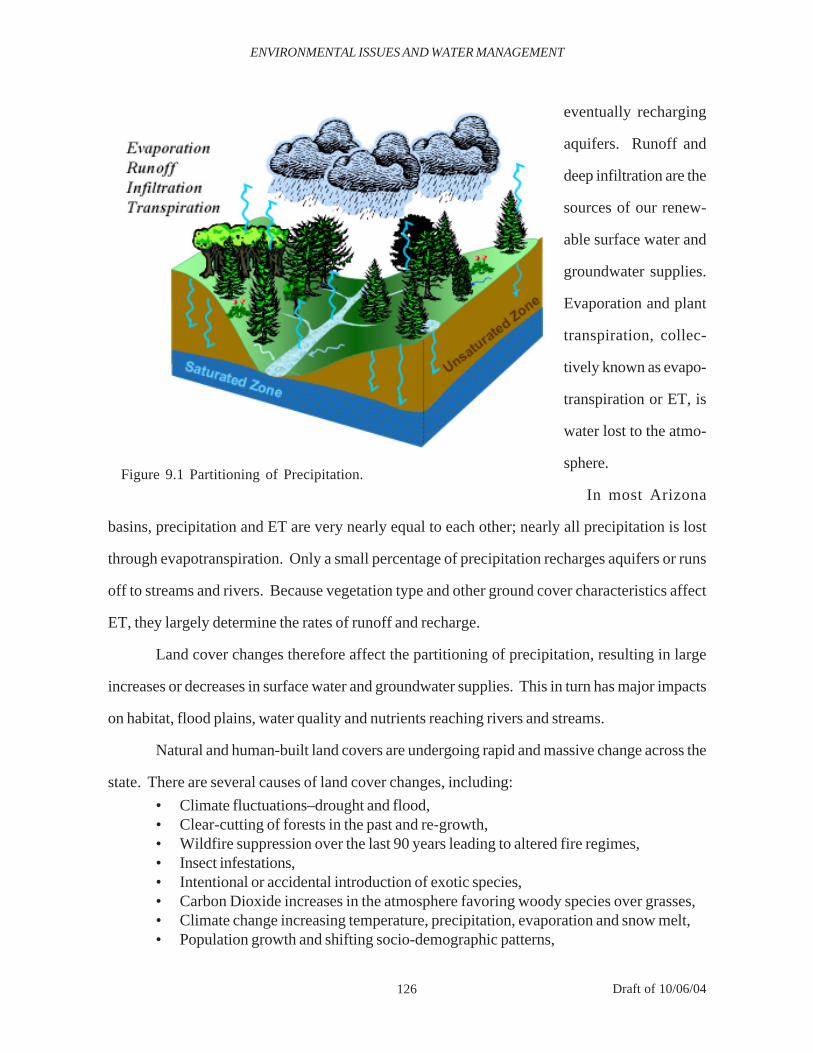
126 Draft of 10/06/04
eventually recharging
aquifers. Runoff and
deep infiltration are the
sources of our renew-
able surface water and
groundwater supplies.
Evaporation and plant
transpiration, collec-
tively known as evapo-
transpiration or ET, is
water lost to the atmo-
sphere.
In most Arizona
basins, precipitation and ET are very nearly equal to each other; nearly all precipitation is lost
through evapotranspiration. Only a small percentage of precipitation recharges aquifers or runs
off to streams and rivers. Because vegetation type and other ground cover characteristics affect
ET, they largely determine the rates of runoff and recharge.
Land cover changes therefore affect the partitioning of precipitation, resulting in large
increases or decreases in surface water and groundwater supplies. This in turn has major impacts
on habitat, flood plains, water quality and nutrients reaching rivers and streams.
Natural and human-built land covers are undergoing rapid and massive change across the
state. There are several causes of land cover changes, including:
• Climate fluctuations–drought and flood,• Clear-cutting of forests in the past and re-growth,• Wildfire suppression over the last 90 years leading to altered fire regimes,• Insect infestations,• Intentional or accidental introduction of exotic species,• Carbon Dioxide increases in the atmosphere favoring woody species over grasses,• Climate change increasing temperature, precipitation, evaporation and snow melt,• Population growth and shifting socio-demographic patterns,
ENVIRONMENTAL ISSUES AND WATER MANAGEMENT
Figure 9.1 Partitioning of Precipitation.
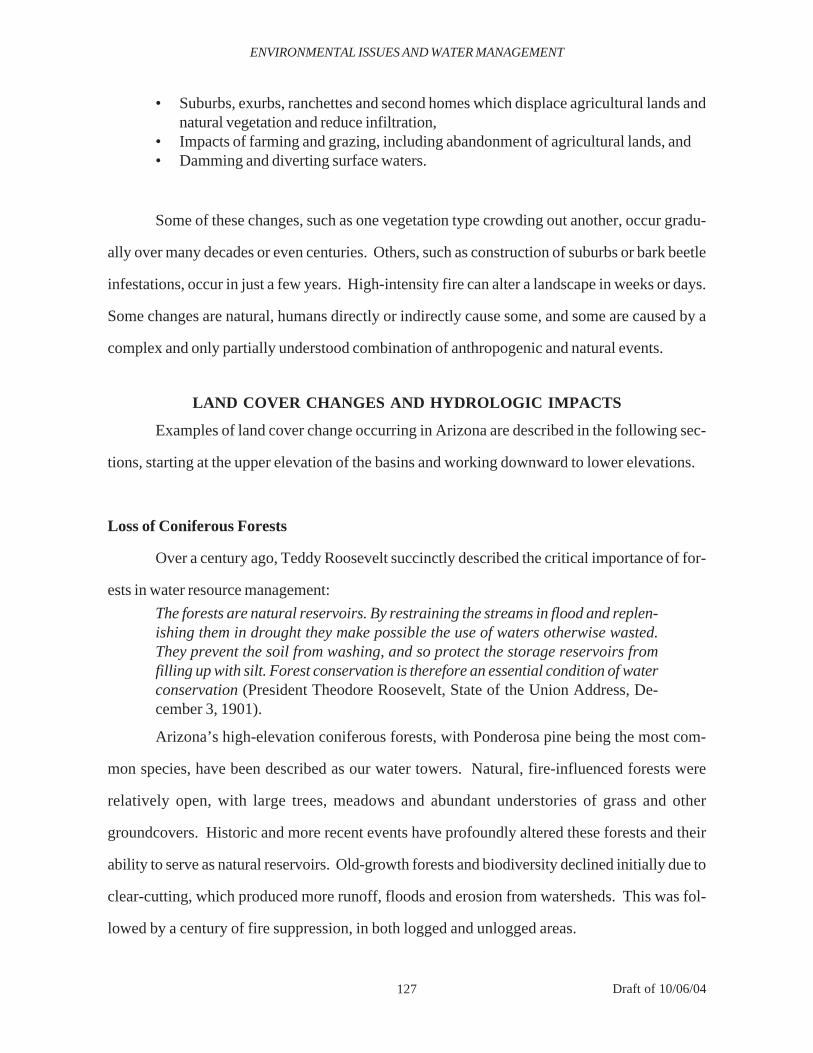
127 Draft of 10/06/04
• Suburbs, exurbs, ranchettes and second homes which displace agricultural lands andnatural vegetation and reduce infiltration,
• Impacts of farming and grazing, including abandonment of agricultural lands, and• Damming and diverting surface waters.
Some of these changes, such as one vegetation type crowding out another, occur gradu-
ally over many decades or even centuries. Others, such as construction of suburbs or bark beetle
infestations, occur in just a few years. High-intensity fire can alter a landscape in weeks or days.
Some changes are natural, humans directly or indirectly cause some, and some are caused by a
complex and only partially understood combination of anthropogenic and natural events.
LAND COVER CHANGES AND HYDROLOGIC IMPACTS
Examples of land cover change occurring in Arizona are described in the following sec-
tions, starting at the upper elevation of the basins and working downward to lower elevations.
Loss of Coniferous Forests
Over a century ago, Teddy Roosevelt succinctly described the critical importance of for-
ests in water resource management:
The forests are natural reservoirs. By restraining the streams in flood and replen-ishing them in drought they make possible the use of waters otherwise wasted.They prevent the soil from washing, and so protect the storage reservoirs fromfilling up with silt. Forest conservation is therefore an essential condition of waterconservation (President Theodore Roosevelt, State of the Union Address, De-cember 3, 1901).
Arizona’s high-elevation coniferous forests, with Ponderosa pine being the most com-
mon species, have been described as our water towers. Natural, fire-influenced forests were
relatively open, with large trees, meadows and abundant understories of grass and other
groundcovers. Historic and more recent events have profoundly altered these forests and their
ability to serve as natural reservoirs. Old-growth forests and biodiversity declined initially due to
clear-cutting, which produced more runoff, floods and erosion from watersheds. This was fol-
lowed by a century of fire suppression, in both logged and unlogged areas.
ENVIRONMENTAL ISSUES AND WATER MANAGEMENT
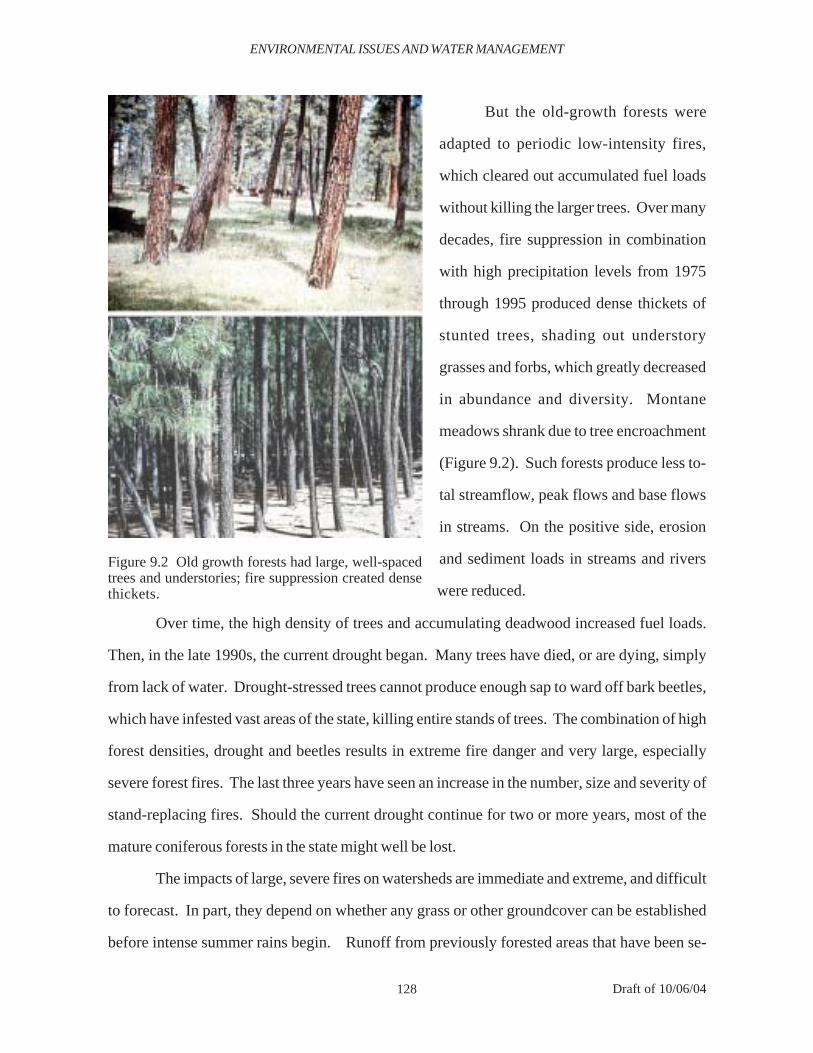
128 Draft of 10/06/04
But the old-growth forests were
adapted to periodic low-intensity fires,
which cleared out accumulated fuel loads
without killing the larger trees. Over many
decades, fire suppression in combination
with high precipitation levels from 1975
through 1995 produced dense thickets of
stunted trees, shading out understory
grasses and forbs, which greatly decreased
in abundance and diversity. Montane
meadows shrank due to tree encroachment
(Figure 9.2). Such forests produce less to-
tal streamflow, peak flows and base flows
in streams. On the positive side, erosion
and sediment loads in streams and rivers
were reduced.
ENVIRONMENTAL ISSUES AND WATER MANAGEMENT
Figure 9.2 Old growth forests had large, well-spacedtrees and understories; fire suppression created densethickets.
Over time, the high density of trees and accumulating deadwood increased fuel loads.
Then, in the late 1990s, the current drought began. Many trees have died, or are dying, simply
from lack of water. Drought-stressed trees cannot produce enough sap to ward off bark beetles,
which have infested vast areas of the state, killing entire stands of trees. The combination of high
forest densities, drought and beetles results in extreme fire danger and very large, especially
severe forest fires. The last three years have seen an increase in the number, size and severity of
stand-replacing fires. Should the current drought continue for two or more years, most of the
mature coniferous forests in the state might well be lost.
The impacts of large, severe fires on watersheds are immediate and extreme, and difficult
to forecast. In part, they depend on whether any grass or other groundcover can be established
before intense summer rains begin. Runoff from previously forested areas that have been se-
129 Draft of 10/06/04
verely burned often is increased by a fac-
tor of 10 or even 100, resulting in seri-
ous flooding and erosion.
Downstream, runoff from
burned areas often clogs stream channels
with sediment and boulders. Water qual-
ity effects include severe short-term tur-
bidity and near-zero dissolved oxygen
in streams draining burned areas, which
cause fish kills (Figure 9.3). Further
downstream, increased nutrients and dis-
solved organics may promote algae
growth in reservoirs. This can deplete
oxygen levels, leading to fish kills, and
may cause taste and odor problems for
municipal water users. Sediments de-
posited in reservoirs decrease the volume
ENVIRONMENTAL ISSUES AND WATER MANAGEMENT
Figure 9.3 Creek choked by sediment and ash afterrain on Chedeski burn area, Arizona, 2002.
of water that they can store (Figure 9.4).
Flood plains—areas likely to be inundated by particular storm intensity—are immediately
and greatly enlarged by these types of fires, and flash floods can cause property losses and even
deaths. Over the ensuing years, as vegetation begins to become re-established, there likely will
be more modest increases in runoff and stream base flow due to less water use by vegetation.
Pinyon-Juniper Expansion
Pinyon-Juniper woodlands have increased tremendously over the last several decades
and continue to expand across the landscape of Arizona and the West (Figure 9.5). They are
spreading both upslope and downslope and becoming denser. Today there are 50 to 60 million
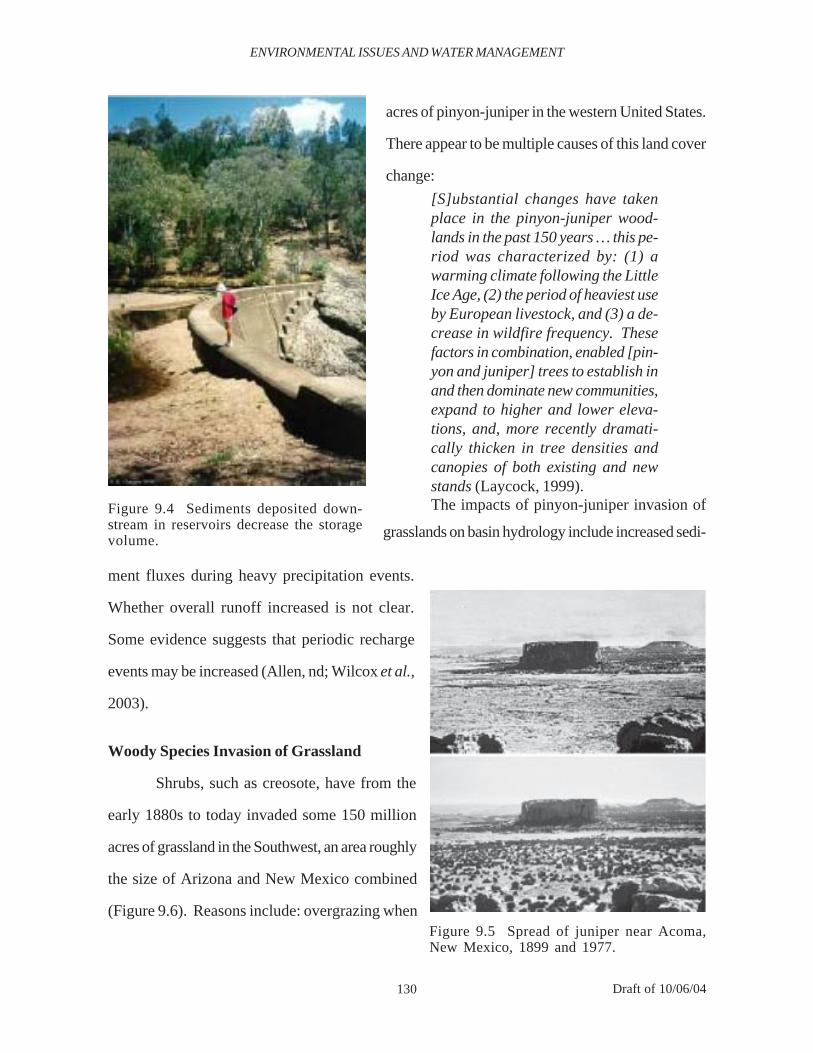
130 Draft of 10/06/04
Figure 9.4 Sediments deposited down-stream in reservoirs decrease the storagevolume.
acres of pinyon-juniper in the western United States.
There appear to be multiple causes of this land cover
change:
[S]ubstantial changes have takenplace in the pinyon-juniper wood-lands in the past 150 years … this pe-riod was characterized by: (1) awarming climate following the LittleIce Age, (2) the period of heaviest useby European livestock, and (3) a de-crease in wildfire frequency. Thesefactors in combination, enabled [pin-yon and juniper] trees to establish inand then dominate new communities,expand to higher and lower eleva-tions, and, more recently dramati-cally thicken in tree densities andcanopies of both existing and newstands (Laycock, 1999).The impacts of pinyon-juniper invasion of
grasslands on basin hydrology include increased sedi-
ENVIRONMENTAL ISSUES AND WATER MANAGEMENT
Figure 9.5 Spread of juniper near Acoma,New Mexico, 1899 and 1977.
ment fluxes during heavy precipitation events.
Whether overall runoff increased is not clear.
Some evidence suggests that periodic recharge
events may be increased (Allen, nd; Wilcox et al.,
2003).
Woody Species Invasion of Grassland
Shrubs, such as creosote, have from the
early 1880s to today invaded some 150 million
acres of grassland in the Southwest, an area roughly
the size of Arizona and New Mexico combined
(Figure 9.6). Reasons include: overgrazing when

131 Draft of 10/06/04
Europeans first reached the area; periodic drought; and increased levels of atmospheric CO2 that
have benefited woody species more than grasses.
At somewhat lower elevations, mesquite rather than creosote is successfully supplanting
grasses (Figure 9.7). Such incursions may take decades or occur quite rapidly. In the Upper San
Pedro basin between 1973 and 1986, mesquite increased by 415 percent, at the expense of grass-
lands, which decreased by 15 percent. Runoff is increased with woody species, particularly
during heavy precipitation events.
POPULATION PRESSURES AND DEVELOPMENT
On many desert basin floors, the most noticeable and rapid land cover changes are asso-
ciated with development. Arizona’s burgeoning population, shrinking household size, popular-
ity as a location for second homes and relatively affordable housing, all are fueling a long-term
boom in housing construction. Maricopa County continues to be one of the fastest-growing met-
ropolitan areas in the United States, and Pima County is well above average. Some rural Arizona
areas are growing even faster, including several communities along the Colorado River and the
Mogollon Rim.
Traditionally, most housing developments occurred as urban in-fill or suburbs that dis-
placed irrigated agriculture. Increasingly, development is occurring on raw desert land, often
ENVIRONMENTAL ISSUES AND WATER MANAGEMENT
Figure 9.6 Grasslands being supplanted by creosote in New Mexico.
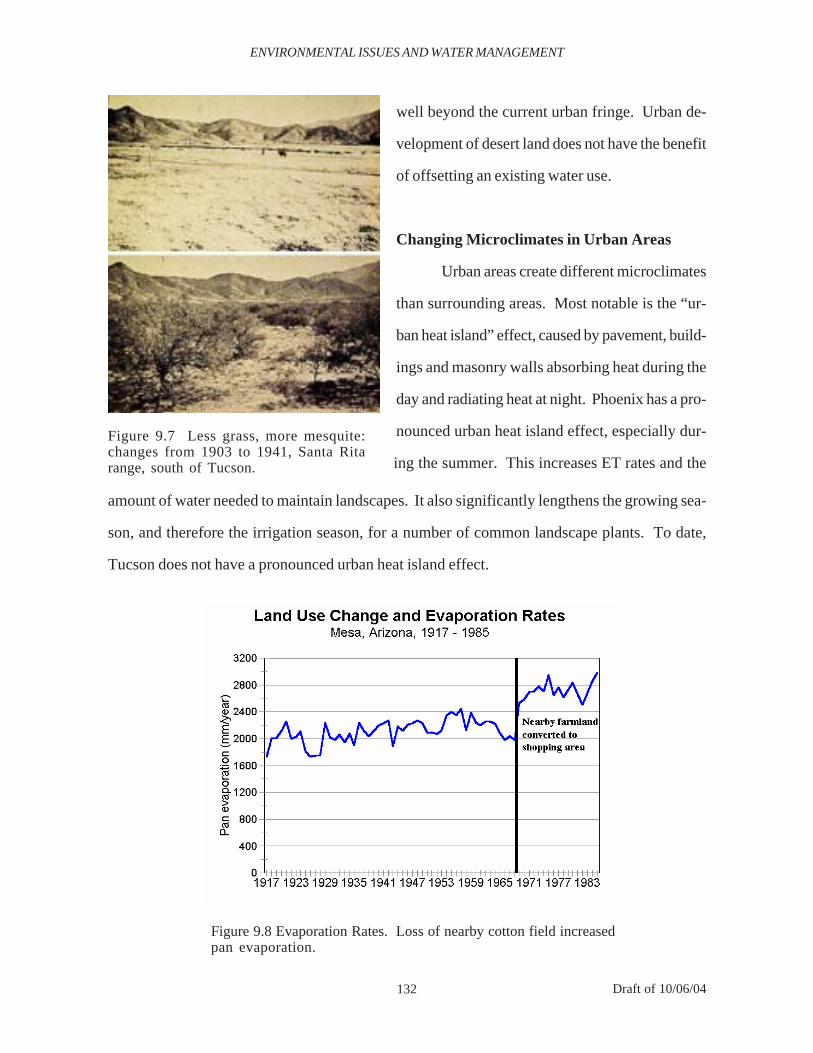
132 Draft of 10/06/04
Figure 9.7 Less grass, more mesquite:changes from 1903 to 1941, Santa Ritarange, south of Tucson.
well beyond the current urban fringe. Urban de-
velopment of desert land does not have the benefit
of offsetting an existing water use.
Changing Microclimates in Urban Areas
Urban areas create different microclimates
than surrounding areas. Most notable is the “ur-
ban heat island” effect, caused by pavement, build-
ings and masonry walls absorbing heat during the
day and radiating heat at night. Phoenix has a pro-
nounced urban heat island effect, especially dur-
ing the summer. This increases ET rates and the
ENVIRONMENTAL ISSUES AND WATER MANAGEMENT
Figure 9.8 Evaporation Rates. Loss of nearby cotton field increasedpan evaporation.
amount of water needed to maintain landscapes. It also significantly lengthens the growing sea-
son, and therefore the irrigation season, for a number of common landscape plants. To date,
Tucson does not have a pronounced urban heat island effect.
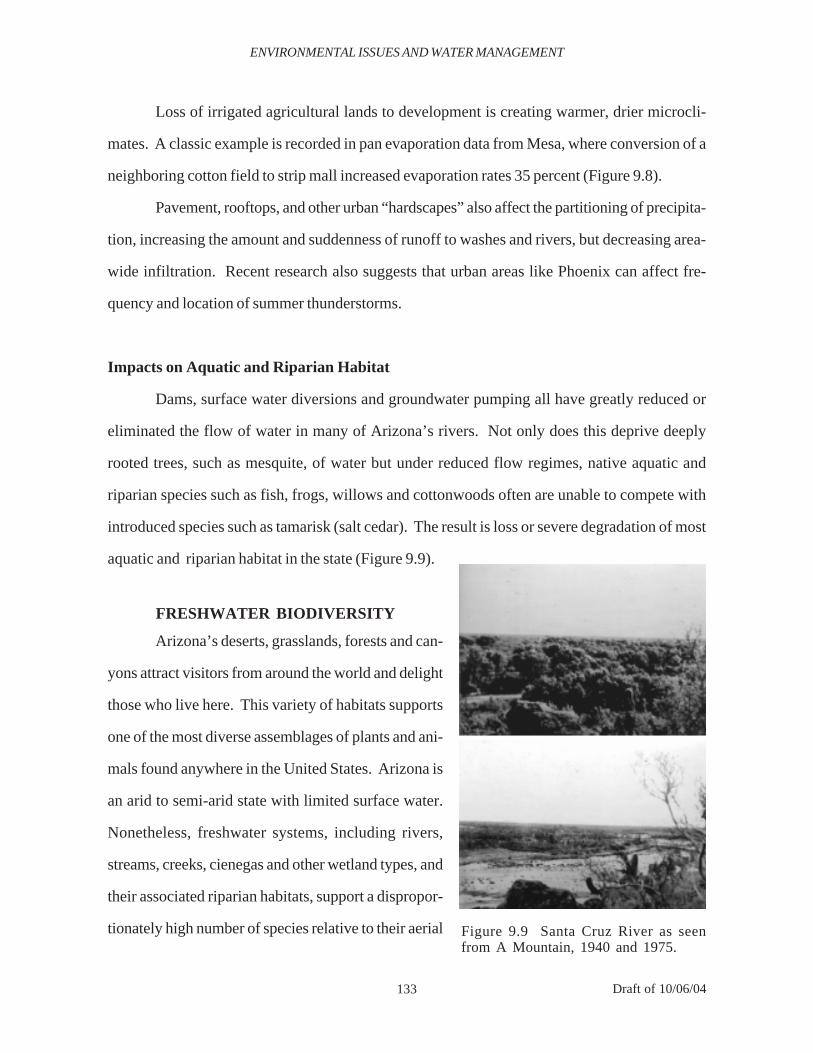
133 Draft of 10/06/04
Loss of irrigated agricultural lands to development is creating warmer, drier microcli-
mates. A classic example is recorded in pan evaporation data from Mesa, where conversion of a
neighboring cotton field to strip mall increased evaporation rates 35 percent (Figure 9.8).
Pavement, rooftops, and other urban “hardscapes” also affect the partitioning of precipita-
tion, increasing the amount and suddenness of runoff to washes and rivers, but decreasing area-
wide infiltration. Recent research also suggests that urban areas like Phoenix can affect fre-
quency and location of summer thunderstorms.
Impacts on Aquatic and Riparian Habitat
Dams, surface water diversions and groundwater pumping all have greatly reduced or
eliminated the flow of water in many of Arizona’s rivers. Not only does this deprive deeply
rooted trees, such as mesquite, of water but under reduced flow regimes, native aquatic and
riparian species such as fish, frogs, willows and cottonwoods often are unable to compete with
introduced species such as tamarisk (salt cedar). The result is loss or severe degradation of most
aquatic and riparian habitat in the state (Figure 9.9).
FRESHWATER BIODIVERSITY
Arizona’s deserts, grasslands, forests and can-
yons attract visitors from around the world and delight
those who live here. This variety of habitats supports
one of the most diverse assemblages of plants and ani-
mals found anywhere in the United States. Arizona is
an arid to semi-arid state with limited surface water.
Nonetheless, freshwater systems, including rivers,
streams, creeks, cienegas and other wetland types, and
their associated riparian habitats, support a dispropor-
tionately high number of species relative to their aerial
ENVIRONMENTAL ISSUES AND WATER MANAGEMENT
Figure 9.9 Santa Cruz River as seenfrom A Mountain, 1940 and 1975.
134 Draft of 10/06/04
extent. In addition, riparian corridors provide migratory birds and pollinating insects and bats
critical travel corridors.
Satisfying the water demands of a growing population while protecting aquatic ecosys-
tems and ecological services requires a collaborative and informed water management approach
that recognizes the value of aquatic and riparian ecosystems, develops the science to understand
how water management choices may affect those systems, and works with stakeholders to derive
water supply solutions that meet the needs of both human communities and natural ecosystems.
Such a water management approach is challenged in Arizona by a lack of legal mandate to
consider impacts to aquatic systems and by the legal separation of surface water and groundwa-
ter.
As a result, considerable damage has occurred to Arizona’s freshwater ecosystems over
the past 150 years (Figure 9.10). An estimated 91 percent of natural (unregulated) perennial flow
reaches has been lost from Arizona’s big rivers—the Salt, Verde, Gila, and Colorado Rivers—
due to diversions, reservoir development and groundwater pumping. At least 35 percent of natu-
ral perennial flow miles have been lost state-wide (based on Brown, Carmony and Turner, 1981,
Map of Perennial Streams). We have only recently begun to understand how natural freshwater
ecosystems provide the myriad of services we rely on, including clean water, mitigation of droughts
and floods, recharge of groundwater supplies, regeneration of soil and soil fertility, nutrient cy-
cling and extensive recreational opportunities. Many of the top recreational attractions in Arizona
are water-based, and hikers, birders, hunters and fishermen are a growing economic force.
The distribution of freshwater biological diversity in Arizona may be illustrated by in part
examining the number of native fish species in perennial streams. Arizona’s native fish are found
nowhere else on earth. They have survived droughts and flash floods for thousands of years.
However, human-caused changes are taking a toll. One species, the Santa Cruz pupfish, is
extinct and 20 of the 35 remaining native species or subspecies are federally listed as endangered,
threatened or candidate for listing under the Endangered Species Act.
Arizona’s rivers and streams also maintain Arizona’s riparian systems, which support the
ENVIRONMENTAL ISSUES AND WATER MANAGEMENT
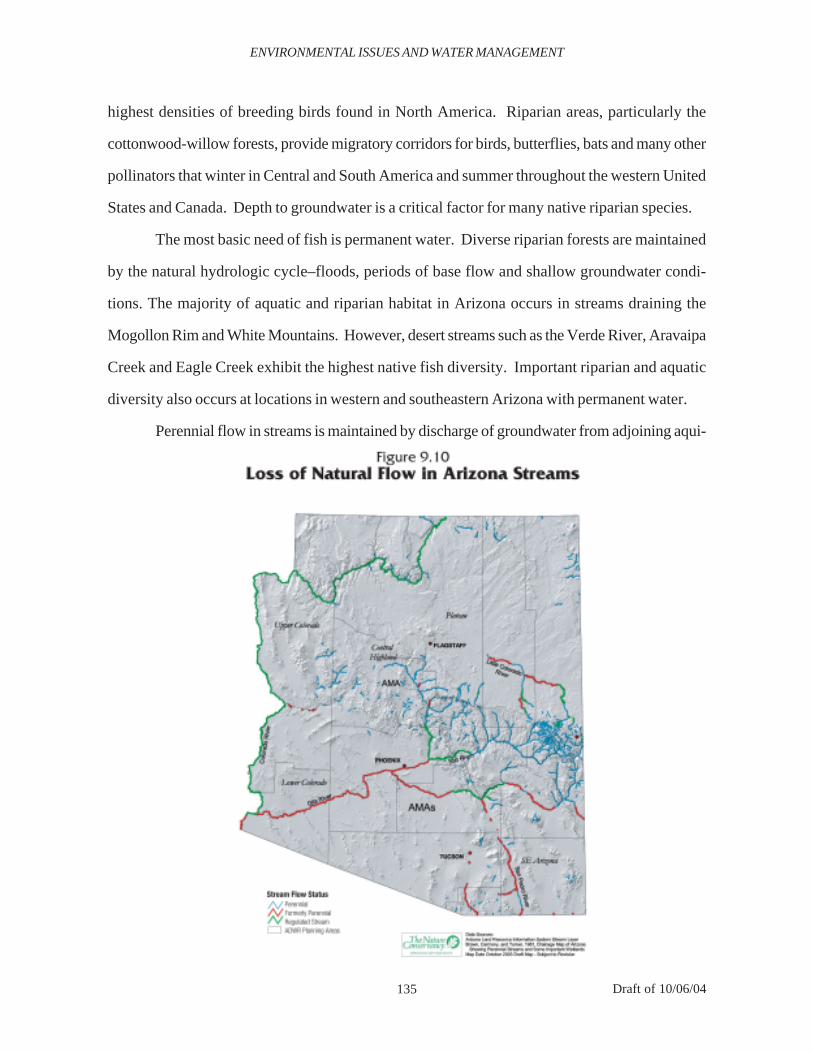
135 Draft of 10/06/04
highest densities of breeding birds found in North America. Riparian areas, particularly the
cottonwood-willow forests, provide migratory corridors for birds, butterflies, bats and many other
pollinators that winter in Central and South America and summer throughout the western United
States and Canada. Depth to groundwater is a critical factor for many native riparian species.
The most basic need of fish is permanent water. Diverse riparian forests are maintained
by the natural hydrologic cycle–floods, periods of base flow and shallow groundwater condi-
tions. The majority of aquatic and riparian habitat in Arizona occurs in streams draining the
Mogollon Rim and White Mountains. However, desert streams such as the Verde River, Aravaipa
Creek and Eagle Creek exhibit the highest native fish diversity. Important riparian and aquatic
diversity also occurs at locations in western and southeastern Arizona with permanent water.
Perennial flow in streams is maintained by discharge of groundwater from adjoining aqui-
ENVIRONMENTAL ISSUES AND WATER MANAGEMENT
136 Draft of 10/06/04
fers. Even streams supported by extensive aquifers may eventually be affected by groundwater
pumping at locations distant from the streams. Examples include the Verde River and the San
Pedro River, where rapid population growth is tapping groundwater aquifers whose discharge
maintains high-diversity fish and aquatic habitat.
The National Research Council (2001) has stated that the capability of the nation to suc-
cessfully meet challenges in water management while sustainably managing its water resources
will depend, in large part, on employing new knowledge gained through research. Improved
knowledge of groundwater recharge (water in) and discharge (water out) relationships and ground-
water-surface water interactions is needed to better understand the consequences of groundwater
use.
RIPARIAN PRESERVATION
There has been a growing awareness over the last 35 years that riparian habitats are
important for more than biological diversity. They have measurable economic value, their aes-
thetics are increasingly appreciated and, in general, they enhance quality of life. Our understand-
ing of how riparian areas work–the fluxes of water, carbon and energy, the relationship between
surface water and groundwater and native plant communities, and how nutrients cycle through
the systems–is incomplete, which makes preservation and/or restoration difficult. Riparian pres-
ervation and restoration efforts may include bank protection, fencing to exclude grazing, restor-
ing the natural hydrologic regime, eradicating exotic species and restoring native species.
Experience and research reveal that knowledge of the system is required to avoid failure
of preservation and restoration projects. For example, studies by researchers at Arizona State
University have estimated the minimum depth to water and flow conditions needed to maintain a
healthy cottonwood population. Riverine ecosystems are complex, yet our knowledge of the
water needs of these systems, and their attendant services to humans, is increasing.
Restoring base flows can be difficult since Arizona’s water laws recognize and reward
“development” of water, which means diverting it from a stream to further a traditional economic
ENVIRONMENTAL ISSUES AND WATER MANAGEMENT
137 Draft of 10/06/04
or domestic activity. In-stream flow rights were recognized only recently and have junior priority
relative to other surface water rights. In addition to legal barriers, the costs of acquiring and
converting senior water rights to in-stream rights can be high.
Social scientists have been tackling the issue of how to measure the value of the ecologi-
cal services provided by riparian habitats with some success. Research a decade ago estimated
the significant economic impacts of bird watchers along the Upper San Pedro River on the local
economy. Other studies are examining what people are willing to pay to hike and camp in
various river corridors. Research at the University of Arizona on the impact of proximity to and
quality of riparian habitat on home values reveals a significant price effect.
Proactive water management planning and water supply development can protect and
restore remaining aquatic and riparian systems and avoid costly and lengthy solutions that must
be applied to highly degraded systems. The Multi-Species Conservation Plan (MSCP), devel-
oped over the last nine years for the Lower Colorado River by Arizona, California and Nevada is
intended to avoid the potential economic and hydrologic consequences of protecting individual
species. Although the proposed plan will cost $620 million over 50 years, with $77.5 million
coming from Arizona water users, it likely will result in significant cost savings if implemented.
Proactive planning to protect natural systems rather than individual species is clearly more effec-
tive in the longer term (National Research Council, 2004).
KEY REGULATORY AND INCENTIVE PROGRAMS
Some existing programs, both regulatory and incentive-based, provide tools for address-
ing issues involving environmental impacts on water resources and vice versa. Some of these key
programs include:
• New federal programs for forest thinning aimed at reducing fire hazards and, in somecases, increasing available water supply,
• State and federal funds and non-governmental organization resources for eradicatingexotic species, such as tamarisk, and re-establishing native species, especially in ripar-ian corridors,
ENVIRONMENTAL ISSUES AND WATER MANAGEMENT
138 Draft of 10/06/04
• Federal projects investigating the impact of altered dam releases on downstream flowsand habitat, particularly in the Lower Colorado River,
• Arizona Water Protection Fund, which among other things, provides monies to groupsseeking to preserve or restore riparian habitat (but legislation may sunset in 2005), and
• Heritage Fund, which allows for acquisition of habitat.
WATER QUALITY ISSUES AND ENVIRONMENTAL HEALTH
Water quality problems are not necessarily environmental problems, but some constitu-
ents do significantly affect habitat quality. Heavy metals generally are toxic at very low levels and
can bioaccumulate or increase gradually within living tissues. This causes particular problems for
long-lived fauna at the top of the food chain.
Mercury is a persistent, bioaccumulating toxin found in surface waters, making it both a
public health and an environmental concern. It adversely affects the nervous system of both
humans and wildlife. Found in lakes and rivers throughout the United States, eating fish is the
single greatest source of exposure. The Arizona Department of Environmental Quality’s strategy
is to prevent new mercury from entering the environment and reducing contributions to surface
water from existing sources.
Nitrate is a common groundwater pollutant, almost always from human sources, includ-
ing fertilizers, septic tanks, sewage treatment plants and concentrated animal feeding operations.
Large portions of some Arizona aquifers have nitrate concentrations that render the water non-
potable. Nitrate can cause algal blooms in water and reduce dissolved oxygen that is required to
maintain aquatic species.
Salinity is a large and growing water quality problem in Arizona surface water and ground-
water. Measured as Total Dissolved Solids (TDS), salinity is composed of salts, minerals and
metals. A natural component of all surface and groundwaters, low levels of salinity have negli-
gible or even positive impacts. But undesirably high TDS levels affect virtually all water users.
High TDS water harms plants and may limit biodiversity.
ENVIRONMENTAL ISSUES AND WATER MANAGEMENT

139 Draft of 10/06/04
Endocrine disruptors (EDs) are compounds that disrupt the endocrine system by mimick-
ing or inhibiting the effects of hormones. Sources include discarded and partially metabolized
synthetic hormones and steroids, pesticides and industrial chemicals. EDs are persistent and can
bioaccumulate. Since the common functions of the endocrine system are reproduction and me-
tabolism, researchers are concerned that EDs accumulating in the environment may cause in-
creased breast cancer, sterility, other endocrine illness, and changes in wildlife populations. Of
particular concern are effluent-dominated waters, including flows in the Salt River through Phoe-
nix. Current research is examining impacts of low-level exposure on native fish. The Environ-
mental Protection Agency has made EDs a top priority and has established the Endocrine Disruptors
Research Initiative.
The hydrologic cycle is strongly affected by land use and vegetation cover. To be suc-
cessful, water sustainability efforts need to incorporate an understanding of the implications of
changes in environmental conditions over time.
ENVIRONMENTAL ISSUES AND WATER MANAGEMENT

140 Draft of 10/06/04
ENVIRONMENTAL ISSUES AND WATER MANAGEMENT
141 Draft of 10/06/04
Chapter 10
TOWARD A SUSTAINABLE WATER SUPPLY:TOOLS AND OPPORTUNITIES
KATHY JACOBS AND RITA MAGUIRE
Solutions to water supply problems generally fall into two categories: reducing demand
and increasing supply. There are a wide variety of tools available and opportunities to consider
within each category. Choosing which options are appropriate for a particular region, commu-
nity or water provider will depend on the nature of the problem as well as a number of feasibility
factors, including available resources and political and social considerations.
When considering a community’s water needs, population forecasts, current and pro-
jected per capita residential consumption and non-residential sector needs should be taken into
account. Moreover, the mix of uses, i.e., industrial, commercial and residential, can dramatically
alter the amount and patterns of water use.
Water shortages are caused by demand in excess of supply and can be addressed by
enhancing supplies, reducing demand or a combined approach. Whether the problem is seasonal,
drought-related or a long-term imbalance between demand and supply, the nature of the shortage
affects the selection of solutions.
Short-term water shortages are less costly and easier to address. For example, a tempo-
rary water shortage, whether caused by drought, equipment failure, poor water quality or the
need to meet peak demands on a seasonal basis, could be addressed through conservation, system
improvements, water hauling or the temporary acquisition of a new water supply.
On the other hand, overcoming water shortages that result from population growth is
more costly and requires long-term planning and long-term solutions, i.e., new facilities, signifi-
cant conservation investments and additional water rights). Rapidly growing populations in many
areas of Arizona, combined with increasing demand for water for recreation, aesthetic values and
142 Draft of 10/06/04
fish and wildlife habitat, have resulted in a growing need for additional water along with more
efficient use of existing supplies.
There are numerous options available to reduce the demand for water. Water conserva-
tion efforts aimed at reducing residential, industrial and agricultural consumption of water have
been implemented in the state’s five Active Management Areas (AMAs). Outside of the AMAs,
conservation has been mandated by some local jurisdictions. In other jurisdictions, voluntary
and/or education programs have been implemented.
DEMAND REDUCTION OPTIONS
System Improvements
• Leak Detection and Repair: Repairing leaks in pipelines, canals, water treatment andstorage and delivery systems often yields substantial water savings.
• Minimize Waste: Engineering improvements to treatment and delivery systems canminimize water loss. For example, reducing the pressure in the system is one meansof limiting losses.
• Metering: Metering or measuring water use can reduce demand even in the absenceof a conservation-oriented billing system. This often results in better monitoring toavoid leaks and raises awareness of water use by consumers
Customer and Resident Programs
• Educational Programs: Public education programs that advise residents about thelimitations of available supplies, the implications of personal decisions about wateruse and options for reducing demand are important components of any water conser-vation program. These programs could include information about low flow plumbingfixtures, proper utilization of xeriscape landscaping principles, water harvesting, graywater use and irrigation system maintenance.
• Incentive Programs: Programs that create financial incentives for adopting water con-servation measures help increase the likelihood that residents will implement and uti-lize water saving techniques. Reimbursements for low flow plumbing fixtures or land-scape retrofit to lower water use plants are examples of such programs.
• Assistance Programs: Direct assistance can be provided to water users to help imple-ment water saving measures such as irrigation scheduling assistance, advice abouthow to incorporate low water use vegetation into the landscape or audits of water useon residential and commercial properties.
TOWARD A SUSTAINABLE WATER SUPPLY: TOOLS AND OPPORTUNITIES
143 Draft of 10/06/04
Regulatory Controls
• Drought Restrictions: Typical drought restrictions include limiting the hours that watercan be used for domestic irrigation, car washing or other outdoor activities. Moredramatic restrictions, such as prohibitions on outdoor watering, are generally imple-mented only in emergency drought conditions.
• Conservation Ordinances: Local conservation ordinances can be established to limitthe quantity of water used for specific purposes or to ban certain high water use prac-tices. For example, local ordinances have been adopted that restrict the amount ofgrass permitted in new developments, e.g., golf courses, municipal easements and thecommon areas of residential communities, the types of landscaping and the use ofmisting systems.
Economic Signals• Incremental Pricing: A tiered rate structure or a conservation surcharge imposed by
the water provider can be used to encourage lower water use.
• Differential Hook-Up Fees: The fees charged to hook-up a home to water service canbe reduced in exchange for an agreement to incorporate water saving measures intothe home’s design, i.e., limit turf, low flow fixtures et cetera. Meter size also can beused to limit the total water available to particular developments or lots.
• Drought Penalties and Surcharges: Pricing mechanisms can be used to reduce wateruse during drought conditions, focusing on higher water users in a system or thosethat do not meet required reductions.
SUPPLY ENHANCEMENT OPTIONS
Local Supply Enhancements
• Surface Water Diversions: An application to divert surface water can be filed with theArizona Department of Water Resources (ADWR). However, most surface watersin Arizona are fully appropriated and it is likely that downstream water users willobject to new applications.
• Groundwater Pumping: ADWR regulates the construction of groundwater wells inArizona. The Department requires a Notice of Intention to Drill be filed for all wellsoutside AMAs. Within AMAs, a water right is required in addition to obtainingauthority to drill a well. Availability of groundwater varies dramatically based on thegeology of the area.
Effluent Use
• Reclaimed Wastewater System: Reclaimed water is highly treated wastewater thatcan be utilized for turf and landscape irrigation, i.e., golf courses, parks and play-
TOWARD A SUSTAINABLE WATER SUPPLY: TOOLS AND OPPORTUNITIES
144 Draft of 10/06/04
grounds, thereby reducing the amount of potable water needed. It also is suitable forsome industrial uses, particularly for cooling towers.
• On-Site Gray Water Use: Gray water is wastewater collected separately from sewageflow. Its use is restricted to the property from which it originated. Gray water sourcesinclude clothes washers, bathtubs, showers or sinks but not the kitchen sink, dish-washer or toilet. Using gray water can decrease the amount of potable water used forirrigation. There can be water quality issues associated with the use of gray water;guidelines established by the Arizona Department of Environmental Quality (ADEQ)govern its use.
• Water Purification/Potable Use: Poor quality water can be purified to increase itsutility. Reclaimed water that is treated to potable standards and used directly as po-table water can provide a ready supplement to existing supplies. However, directpotable use is uncommon.
• Recharge and Recovery of Effluent: Effluent is water treated at a municipal treatmentplant prior to being discharged. So long as the effluent meets appropriate water qual-ity standards established by ADEQ, it could be used to recharge aquifers, therebyreducing the risk of subsidence and enhancing groundwater supplies.
Import Water
• Temporary Transfers: A temporary water transfer involves paying for the use of wa-ter rights on a temporary basis. This type of transaction typically occurs when farmersopt to fallow their land and lease their water rights to a nearby community. Althoughuncommon in Arizona, temporary water transfers have been used to address short-term water needs in many states. Water markets have emerged in some states tofacilitate this process; a governing body typically runs such markets.
• Outright Purchase: Because most groundwater rights in Arizona are not easily sepa-rated from the land (the ability to do this is affected by whether the land is within anAMA or not), a permanent water transfer generally involves the purchase and retire-ment of agricultural land for its water rights to be used by non-agricultural interests.
• Dry Year Options: This approach can be utilized when a community has an adequatewater supply in most years, but is confronted with a water shortage in the driest years.Dry year options generally require a community or other water user to pay a flat sumof money for the option to purchase water when it is needed. When the option isexercised, the community pays an additional charge for the actual water usage, gener-ally by the acre-foot. This tool is being used increasingly in other western states, butthere are institutional limitations in Arizona.
TOWARD A SUSTAINABLE WATER SUPPLY: TOOLS AND OPPORTUNITIES

145 Draft of 10/06/04
Water Storage
• Distribution System Storage: Increasing water storage capacity can enhance the abil-ity to meet peak demand.
• Underground Storage: The availability of groundwater aquifers that are conducive toartificial recharge depends entirely on the local hydrology. Opportunities to utilizeunderground storage should be fully explored since artificial recharge is both legallyand physically complex.
• Surface Reservoirs: Most surface reservoirs in Arizona are man-made and opportuni-ties for new reservoir construction are limited by geographic and environmental con-ditions and regulatory requirements.
Other Water Supply Options
• Water Harvesting: Capturing water on a property for reuse can create a new supplyof water while decreasing demand for potable water on the site. Water harvesting isespecially useful for landscape irrigation. Water harvesting can be “passive,” mean-ing that the water delivery occurs through gravity alone, or “active,” including pumpsand more complex systems. Some water harvesting systems include storage for fu-ture use, while others involve land contouring to direct water to plants or retentionareas.
• Watershed Management: Decreasing the number of trees and shrubs in a naturalwatershed may increase the amount of water available for other uses. There are con-troversial aspects to thinning or removing vegetation for water supply purposes, in-cluding debate about the effectiveness and environmental implications of such tech-niques.
SUMMARY
Once viable water management options have been explored, they should be carefully
evaluated to identify the legal, financial, political and social ramifications of each alternative.
Relevant criteria for evaluating options include: costs, i.e., capital and operational costs over the
short and long-term; the reliability and risks associated with new supplies; potential environmen-
tal and social impacts; and identification of relevant institutional or legal constraints.
Voluntary programs such as educational, incentive and assistance programs can often be
implemented quickly; however, the results can vary and have only a temporary effect. A recent
study (Woodard, Weber and Stewart, 2004) conducted in the metropolitan Tucson area indicated
TOWARD A SUSTAINABLE WATER SUPPLY: TOOLS AND OPPORTUNITIES
146 Draft of 10/06/04
that over 60 percent of the surveyed households reported at least one type of water reuse activity.
Among those that did not reuse water, the top reasons given were “we don’t know how” and
“need help” followed by “not worth the cost,” “unsafe,” and “not worth the trouble.”
Before serious consideration of any alternative advances, it is wise to consider how and
when affected communities can provide input to the decisions makers. Failure to engage stake-
holders early on can result in unnecessary costs, delays or significant political limitations on the
ability to solve water problems.
TOWARD A SUSTAINABLE WATER SUPPLY: TOOLS AND OPPORTUNITIES
147 Draft of 10/06/04
Chapter 11
QUESTIONS OF WATER, GROWTH AND POLICY
KATHY JACOBS, SHARON MEGDAL AND MARSHALL A. WORDEN
In the long run, shortages of water quantity can be met only by increasing effi-ciency of existing uses, transfers of water between uses, reducing or eliminatingexisting water uses, the development of alternative sources of water such as de-salination, or by storing additional water in wet years for use in dry years.
Public and policy-level attention to water supply issues in drought conditionstends to disappear as soon as rain (or snow) relieves the drought. But drought isonly a magnifier of the larger problems associated with rapid population growthand environmental demands for water in areas where water supplies are alreadyover-allocated.
Simply put, the West has developed to the point that the social, economic andenvironmental consequences of water supply crises are no longer a local or re-gional issue. These crises now affect economies and resources of national impor-tance. (Bureau of Reclamation, 2004)
United States Secretary of the Interior, Gale Norton, recently launched Water 2025, a
national initiative that draws attention to the American West’s challenge of meeting the water
demands of people, cities, industry, agriculture and the environment. The Bureau of Reclamation
(2004) identified five realities of water management that are shared by Arizona and the other
Western states:
• Explosive population growth in arid areas,• Existing water supplies are inadequate,• Over-allocated water supplies can cause crises and conflict,• Aging water facilities limit management options, and• Crises management is not effective.
Along with the ongoing regional drought, this background report has drawn attention to
the considerable complexity of water management issues confronting the citizens, governments
148 Draft of 10/06/04
and localities of Arizona at the beginning of the 21st Century. The extent to which citizens and
elected officials are able to make difficult choices and hard decisions now may well determine if
crises can be avoided in the future.
Figure 11.1 illustrates the magnitude of potential water supply crises by 2025 for Arizona
as well as the Western United States, as determined by the Bureau of Reclamation. What is
immediately clear is the concentration in Arizona of potential supply crises. These include:
• Unmet rural water needs and potential for conflict on the Navajo and Hopi IndianReservations, and in the areas around Williams, Flagstaff and Prescott in Coconinoand Yavapai Counties, and in the White Mountains, the areas around Show Low,Winslow and Holbrook and significant portions of eastern Arizona,
• Conflict potential along the Colorado River south of Lake Mead,
QUESTIONS OF WATER, GROWTH AND POLICY
149 Draft of 10/06/04
• Conflict potential in the Central Arizona Project corridor between the Phoenix andTucson metropolitan areas.
In order to avoid these potential supply crises, Arizonans need to debate and seek public
policy answers to a long list of questions. Some of these questions include:
What is the potential role and need for additional infrastructure improvements forthe transportation and storage of water throughout Arizona?
How might such improvements, if needed, be financed?
What is the role of agricultural water rights in Arizona’s economic and watersupply future?
Does Arizona have the institutional capacity to deal with the water problems thatface the state?
Can and should water pricing be used as a water management tool to a greaterdegree in Arizona?
What are the effects in Arizona of current water-related regulation on economicdevelopment, housing affordability and quality of life?
Is Arizona prepared for the possibility of a multi-decade drought?
Should mandatory state drought response mechanisms, including restrictions onwater use or incremental water tax or fee increases, be linked to length or severityof drought conditions so as to better control water use?
How might changes in existing water-related regulations alter, favorably or unfa-vorably, the state’s economic vitality, sustainability, housing affordability andquality of life?
How might environmental interests, concerns and qualities in Arizona best beaddressed inside and outside of Active Management Areas?
How can land use and community and regional planning adequately and success-fully be linked to water supply planning in Arizona?
Is Arizona doing enough to address the water supply requirements for growingcommunities?
Should water allocation and regulatory mechanisms be developed for those parts
QUESTIONS OF WATER, GROWTH AND POLICY
150 Draft of 10/06/04
QUESTIONS OF WATER, GROWTH AND POLICY
of Arizona outside the Active Management Areas and, if so, who should imple-ment them?
Can the Active Management Areas meet the water demands of future citizensbased on currently available municipal supplies and, if not, where will the nextwater supply come from?
Does Arizona need additional regulatory mechanisms in the Active ManagementAreas to ensure achievement of the management goals?
From where are the financial resources and leadership going to come for long-term support of water resources planning and and management as well as droughtresponse in Arizona at state and community levels?
As noted by Secretary Norton, “Crisis management is not an effective solution for ad-
dressing long-term, systematic water supply problems.” Careful consideration of these and other
questions will enable Arizonans to approach water supply planning so that potential water crises
are avoided.
151 Draft of 10/06/04
Appendix A
PAST ARIZONA TOWN HALL RECOMMENDATIONSAND CONCLUSIONS
FOURTH ARIZONA TOWN HALLARIZONA’S WATER SUPPLY
April 6-8, 1964
The policy of the state should be to conserve water. All farmers, industries, and municipal and privatewater entities should continue sound conservation practices, and all organizations and agencies should alert theircustomers, members and employees to the need for preventing the waste of water.
We strongly urge the resolution of sectional differences and expediting hydrological, legal, engineeringand other studies bearing on this issue, both on federal and state levels. Specific studies are particularly needed onsuch systems as the Bill Williams River, Diamond Creek, The Virgin River, and the Little Colorado River.
No solution should be adopted which could in any manner be interpreted as an acceptance by the UnitedStates of any obligation to deliver to Mexico water of any particular quality. No solution should be suggested orimplemented which would result in any water in the Colorado River entering Mexico which is not chargeable toMexico’s treaty allocation.
The situation with respect to groundwater shortage and depletion is critical and growing worsein most sections of Arizona; exceptions exist, such as in the Yuma area, which are created by strictly localconditions. As a general rule the present supply in inadequate to meet existing demand, resulting in severeoverdrafts against the underground reservoirs.
[W]here a retreat of groundwater in any part of Arizona threatens to make the cost of pumping too highfor agricultural use, thereby threatening the existence of any community, every proper resource of the communityand state, intellectual and material, should be mustered to analyze and overcome the threat by whatever meansmay be devised, whether this be the introduction of light industry, the creation and application of new techniquesin agriculture, provisions for additional water from other sources, or any feasible combination of such practices.
In view of the fact that existing projects and proposals, including the Central Arizona Project,will leave Arizona still showing a water deficit, and assuming effective community and state conservation prac-tices, both before and after these projects are realized, the ultimate needs for full development will requirenegotiation of additional water supplies on a regional basis. Research should be continued into the possibility ofthe processing of saline water as a future solution to the regional water problem.
It is the widely held belief among Arizonans within the Central Arizona Project area that thisproject must and will serve the people of the entire state through exchanges, direct diversions and whatever othermeans may be devised. It is the firm purpose of the people of the state to work out such details on a basis of equityfor all parts of the geographic, economic, and political entity which is Arizonan.
Proven means of watershed management can improve the yield of water, improve grazing,increase timber production, and maintain the recreational use of land. This multiple use concept of the watershedshould be continued and emphasized. Profitable areas for expanded study in management are: vegetation modi-fication on watersheds, control of transportation losses in streambeds and canals, control of seepage in canals andreservoirs, and control measures against evaporation on lakes, reservoirs and elsewhere.
152 Draft of 10/06/04
The control of uneconomical water-consuming plants, such as salt cedars (phreatophytes), offers a greatopportunity to increase water yields. Additional research is necessary to achieve economic methods for elimina-tion of these plants. Full scale action programs toward this end should now be implemented.
In addition to canal and ditch lining, on-farm practices recommended for more attention include: proper timing ofirrigation, short-row irrigation, pump-back practices for reuse where feasible, stricter control of tail water fromirrigated fields, and better land leveling. We recommend for special attention:
1. Canal, lateral and ditch lining;2. Use of crop species requiring less water;3. More and better information on costs and savings to farmers of various conservation methods in
farming;4. More research into the economics of crops yields relative to water requirements.
Although in the experimental stage, sprinkler irrigation offers the opportunity of much more efficient useof water on the farm and substantial water savings in some areas.
[W]e urge each community to establish its conservation practices. To accomplish this, it is suggested thatthe local governing body create a permanent committee of persons competent to consider water programs andplan accordingly.
Sewage effluent offers a tremendous source of reusable water in Arizona. Since approximately half of thewater used in Arizona communities goes out as sewage, this source must receive additional attention.
Water catchment or “harvesting” systems are known to be the most efficient of all systems for gatheringrainfall. We strongly recommend a large-scale pilot program in a suitable location to determine the benefits thatcan be expected from such a program in Arizona.
[W]e recommend the creation by an appropriate state authority of a state-wide committee to make athorough study and analysis of the efforts in Arizona and in other states and areas, and of any other applicablefactors, with the goal of recommending the most efficient organization or centralization of water functions.
THIRTY-FIRST ARIZONA TOWN HALLARIZONA WATER –THE MANAGEMENT OF SCARCITY
October 9-12, 1977
There was general agreement that, for some parts of the state, existing sources of water in Arizona can befurther developed to increase accessibility. Methods which can be further developed include:
a) Drainage control and catchment;b) Evaporation suppression;c) Seepage control;d) Watershed management;e) Regional weather modification;f) Desalination;g) Effluent recycling for non-domestic and some agricultural uses;h) Improved agricultural irrigation techniques;i) Education promoting water conservation;j) Exploration for new water sources.
Proper watershed management, a proven economic technology, should be further utilized; Effluentsshould be used as efficiently as possible; conservation should be encouraged with water rate structures and
PAST ARIZONA TOWN HALL RECOMMENDATIONS AND CONCLUSIONS
153 Draft of 10/06/04
allocations that do not promote high use and inefficiency. Desalination also represents a potential source of waterfor Arizona. A greater investment should be made by the state in research and development of technologiesdesigned to reduce water quantity and quality problems. Especially important will be new methods for using andconserving agricultural water, since the agricultural sector has such a significant impact on total water use inArizona. Conservation measures should be encouraged primarily through the use of economic incentives andeducation rather than mandatory controls.
All agree that the present law is not adequate, and that it does not address the problems of groundwateroverdrafts.
Theoretically, there should be no difference between the law relating to groundwater and the law relatingto surface water. These two types of water are, in fact, inextricably tied together. As a practical matter, however, itis not feasible at the present time to begin treating these types of water identically.
Most participants believe that the State Legislature should have primary responsibility for the formula-tion of water policy in Arizona and urge that the Legislature act to discharge this responsibility by enactinglegislation which will provide an adequate groundwater law.
A great need exists to coordinate the activities of the numerous agencies responsible for the implemen-tation of the state’s water policy. The number of such agencies should be sharply reduced, and the functions of theremaining agencies should be clearly delineated. The consolidation of responsibility should result in moreeffective implementation of the established policy, and should avoid some of the inaction and inefficiency whichhas led to the present disjointed water policy.
Compensation for the settlement of valid Indian claims arising from federal actions should be made bythe federal government without adversely affecting Arizona interests. These issues are of national rather thansimply statewide concern.
A majority of the panelists supports a system of water priorities favoring domestic and urban users.Concern was expressed that a reasonable balance of priorities be maintained so that no segment of the state’seconomy would be seriously damaged. Any future system of water management in Arizona must accommodatethe allocations of water to which it is determined our Indian populations are entitled. Many panelists feel thataesthetic and recreational factors should also be given some degree of priority.
Arizona’s groundwater should be managed so as to avoid exhaustion of major water basins. Whilegroundwater overdrafts are currently a necessary part of our water system, they should be minimized to the extentpossible with a view toward preserving the major groundwater supplies forever.
Future planning and management must deal with the problem of groundwater transfers within basins, aswell as trans-basin diversions.
Future planning for surface waters should emphasize watershed management, reduction of transmissionloss, evaporation control, flood control, and construct effective storage facilities (both above and below ground)on all lands within the state, both public and private.
Water transfer projects like the CAP are indeed justified, and represent a significant component of thestate’s long-term water strategy.
Most panelists believe that no direct limitations should be placed on Arizona’s population, agricultureor industrial growth by means of water management, although a comprehensive water management plan willundoubtedly affect such growth. Incentives to conserve water should be further encouraged, with considerationgiven to imposing penalties for misuse of water.
The economic forces of supply and demand should also be given full opportunity to influence the
PAST ARIZONA TOWN HALL RECOMMENDATIONS AND CONCLUSIONS
154 Draft of 10/06/04
allocation of water to high-value uses. Market factors alone, however, may not be sufficient to achieve the desiredallocations, in which case regulatory constraints such as extraction taxes may be necessary. If implemented, suchconstraints must recognize existing property rights.
Although our entire water allocation system cannot be revamped, widespread support does exist forvesting some statewide regulatory agency with authority to regulate the use of groundwater.
Regulatory alternatives which might be considered in the future include the following:
a) Taxation;b) Improved definition of “reasonable use”;c) Limitations on decorative water uses;d) Penalties for water misuse.
Water rights, where they exist, are a form of private property. Consequently, the owner of such rights maylegally be entitled to compensation if they are taken from him, and most panelists concluded that such compen-sation is mandatory.
It is essential for the development of a comprehensive water plan for the state of Arizona that the reservedwater rights of the Indians and the Federal Government be finally defined and quantified. The Federal Govern-ment should accept financial responsibility for resolving on an equitable basis Indian claims, taking into consid-eration the legitimate water needs of all the interested parties.
FORTY-SEVENTH ARIZONA TOWN HALLMANAGING WATER QUALITY IN A WATER SCARCE STATE
October 27-30, 1985
[T]he state must accommodate development and growth, on the one hand, with protection of the environ-ment and public health, on the other. To achieve that balance, the issues of water quantity and quality must beviewed as inextricably interrelated. In short, no longer can we afford to consider these two issues in isolation.
Arizona’s success in developing a public philosophy for water quantity – as manifested by its enactmentof the Groundwater Management Act – demonstrates this state’s ability to develop a successful philosophytoward water quantity. The time for focusing on water quality is now at hand.
A review of the statutes governing the transfer of water should be undertaken to facilitate matching thequality of available water with its anticipated uses.
Water augmentation should be expanded by all means including storing floodwaters and other surpluswaters. Groundwater recharge should be further encouraged with attention to appropriate precaution to minimizedegradation of the aquifer. The protection and management of the state’s watersheds remain important. It is alsoimperative to recognize the importance of effluent as a valuable resource.
In examining sources and activities for possible regulation, Town Hall recommended that sources andactivities with a reasonable probability of impairing the state’s water quality should be regulated.
The participants reiterated their recognition that water quality and quantity issues are interrelated andthat a comprehensive approach to overall management of the resource must be implemented. All panels recog-nized that the present system is ineffective and that environmental issues – particularly water quality – do notreceive sufficient attention at the state level. Nevertheless, participants could not agree on the single best ap-proach to coordinating an appropriate, statewide response.
PAST ARIZONA TOWN HALL RECOMMENDATIONS AND CONCLUSIONS
155 Draft of 10/06/04
The Town Hall panels reviewed and recommended specific proposals to enhance the management ofwater quality and quantity in Arizona. Among the specific proposals suggested are the following: Location andsealing of abandoned wells to prevent pollution; Implementation of a water pricing system that encouragesconservation; Improvement of water yield and quality through improved watershed management; Encourage-ment of water allocation to a use consistent with its quality, to the extent economically feasible (and, conversely,establishment of quality standards based on nature of use); Augmentation of the water supply by constructingcatchment dams, recapturing and storing CAP water by recharge and other means devised to capture or conservewater
SEVENTY-FIRST ARIZONA TOWN HALLENSURING ARIZONA’S WATER QUANTITY AND QUALITY INTO THE 21ST CENTURY
October 26-29, 1997
The issues of water quantity, quality and allocations are tied together, but often difficult to reconcile.Despite the overriding concern about water quantity, attention also must be given to quality.
Town Hall believes that Arizona’s water supply can support current and predicted populations if waterresources are properly managed. How efficiently water is used will determine its availability. While in theory theavailable supply is substantial, the economic feasibility of securing sufficient useable and deliverable waterwhere needed is in question.
Delivery of Colorado River water, for example, could be reduced or interrupted in times of drought or bysystem failure. To prepare for future shortages, Arizona should expand the implementation of water bankingprocedures and groundwater recharge and should develop a long-term strategy for ensuring supply.
Town Hall believes greater emphasis should be placed on developing the technology and systemsnecessary to make more efficient use of reclaimed water. If the costs and reliability of this and other alternativesources, such as desalination and cloud seeding, could be controlled, our available water supply could be mod-estly augmented.
Town Hall believes the federal government’s role in managing Arizona water resources should be re-duced because decisions at the federal level do not adequately address the diversity and complexity of localneeds. More local input is needed. Local communities within hydrological boundaries should work as partnerswith state and federal governments and less as regulated entities.
Current water law and planning tend to address issues from the top down, where it may be appropriate tolook at laws more comprehensively, regulating and managing water rights first at the local level, moving from thebottom up.
Town Hall is dissatisfied with the current status of the adjudication of water rights process, with someeven calling the process a failure. The costs of the lengthy proceedings have been significant. Until the adjudica-tion of water rights is resolved, there is a cloud over the rights of water users that creates uncertainty and under-mines effective planning and management.
The goals set for the next 50 to 100 years should address the needs of sustainable development andpreservation of water supplies for future generations of Arizonans. They should include achieving safe-yield incertain areas and looking beyond domestic, industrial and agricultural uses to the effect water use and allocationhave on riparian areas, the environment and our overall quality of life.
Many felt groundwater data should be expanded beyond the AMAs to assist planners in determiningwhat level of development can be supported by existing supplies.
PAST ARIZONA TOWN HALL RECOMMENDATIONS AND CONCLUSIONS

156 Draft of 10/06/04
Water conservation programs should play a significant role in increasing the efficient use of water, evenin times of plentiful supply.
Recognizing that effluent is a valuable resource in an arid environment, suggestions offered by TownHall include using tax and rate-paying structures to encourage and increase efficient use of effluent for open turf,industrial, agricultural and commercial applications, and for building treatment plants and dual distributionsystems.
[T]he GMA has not been entirely effective nor entirely fair as applied and has been unable to achievemany of its stated goals. It does not apply to much of rural Arizona. It has a number of exemptions for agriculture,mining and certain urban demands that create challenges in its implementation.
The adequacy program must be strengthened in appropriate areas outside of AMAs to ensure a higherlevel of consumer protection. City and county planning authorities should be encouraged to consider lack ofadequate water resources in approving subdivision plats.
While the safe-yield goal is appropriate for some AMAs, it should not be a statewide goal. Arizona is toodiverse for one goal to meet all needs.
Where safe-yield is a goal, but is not being achieved, the groundwater use limitation across user groupsshould be reexamined. Responsibility for reaching safe-yield should be allocated among all users within theAMA.
Although the state can establish the regulations to be applied to address critical water supply issues innon-AMA areas, preparation and implementation of the individual plans should occur at the local level.
Sub-basin strategies should be considered, particularly in those areas that request them. Current AMAmanagement mechanisms were tailored to address general AMA water balance. They do not necessarily deal withspecific areas of localized water level decline, subsidence and water quality decline. We need to monitor subsid-ence, while recognizing the related development implications.
Through laws such as the Endangered Species Act and federal application for state instream flow rights,federal law currently plays an inappropriately significant role in developing water policy for Arizona. Manyfederal laws regulate from the top down and do not take local concerns into account. Ideally, the federal roleshould be minimized.
Current water management in Arizona is too fragmented.
Town Hall strongly recommends that consideration be give to merging some of the ADEQ’s waterquality programs into ADWR to ensure continuity in water management.
Additional financial resources will be required to perform geological, hydrological and other technicalwater studies, particularly in rural areas, to provide ADWR or other state agency technical assistance in non-AMAareas, to fund the activities of a consolidated agency, to assist in accelerated completion of the general streamadjudications and American Indian water rights settlements, and to increase public education and participationon water issues.
Current water pricing does not include total costs such as the external cost of replenishment, environ-mental regulations and American Indian water rights settlements. Most Arizona water users do not pay the trueeconomic cost of water.
PAST ARIZONA TOWN HALL RECOMMENDATIONS AND CONCLUSIONS
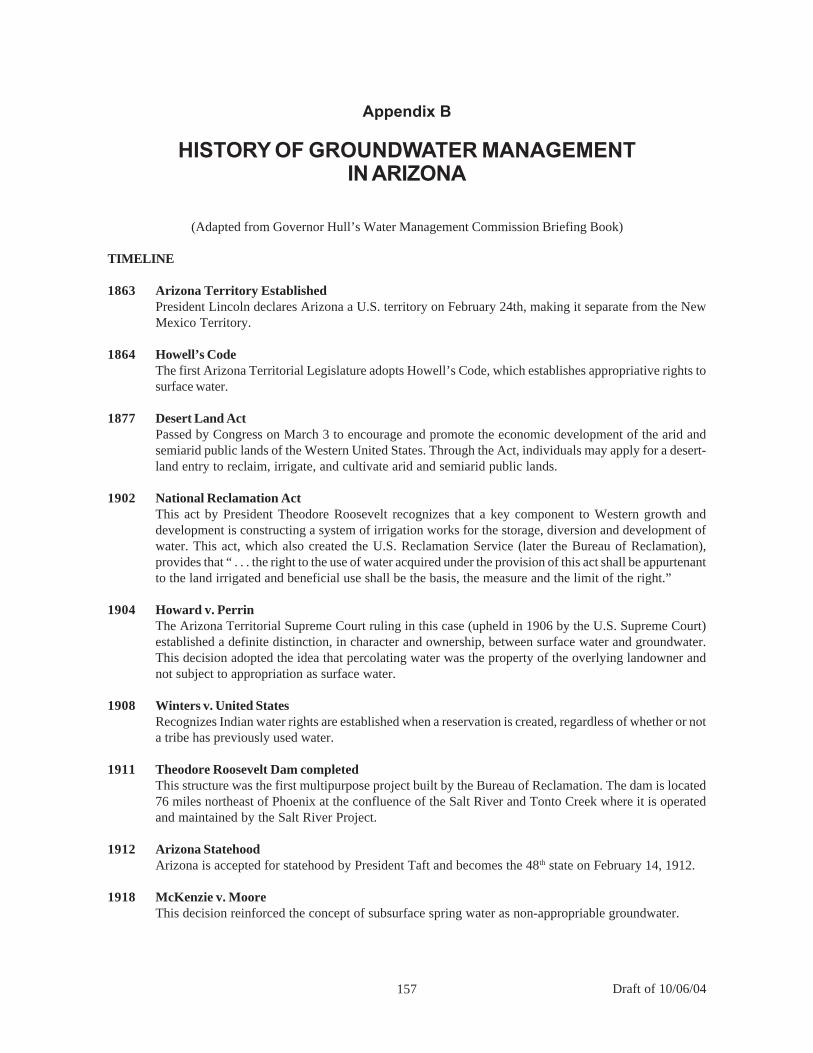
157 Draft of 10/06/04
Appendix B
HISTORY OF GROUNDWATER MANAGEMENTIN ARIZONA
(Adapted from Governor Hull’s Water Management Commission Briefing Book)
TIMELINE
1863 Arizona Territory EstablishedPresident Lincoln declares Arizona a U.S. territory on February 24th, making it separate from the NewMexico Territory.
1864 Howell’s CodeThe first Arizona Territorial Legislature adopts Howell’s Code, which establishes appropriative rights tosurface water.
1877 Desert Land ActPassed by Congress on March 3 to encourage and promote the economic development of the arid andsemiarid public lands of the Western United States. Through the Act, individuals may apply for a desert-land entry to reclaim, irrigate, and cultivate arid and semiarid public lands.
1902 National Reclamation ActThis act by President Theodore Roosevelt recognizes that a key component to Western growth anddevelopment is constructing a system of irrigation works for the storage, diversion and development ofwater. This act, which also created the U.S. Reclamation Service (later the Bureau of Reclamation),provides that “ . . . the right to the use of water acquired under the provision of this act shall be appurtenantto the land irrigated and beneficial use shall be the basis, the measure and the limit of the right.”
1904 Howard v. PerrinThe Arizona Territorial Supreme Court ruling in this case (upheld in 1906 by the U.S. Supreme Court)established a definite distinction, in character and ownership, between surface water and groundwater.This decision adopted the idea that percolating water was the property of the overlying landowner andnot subject to appropriation as surface water.
1908 Winters v. United StatesRecognizes Indian water rights are established when a reservation is created, regardless of whether or nota tribe has previously used water.
1911 Theodore Roosevelt Dam completedThis structure was the first multipurpose project built by the Bureau of Reclamation. The dam is located76 miles northeast of Phoenix at the confluence of the Salt River and Tonto Creek where it is operatedand maintained by the Salt River Project.
1912 Arizona StatehoodArizona is accepted for statehood by President Taft and becomes the 48th state on February 14, 1912.
1918 McKenzie v. MooreThis decision reinforced the concept of subsurface spring water as non-appropriable groundwater.
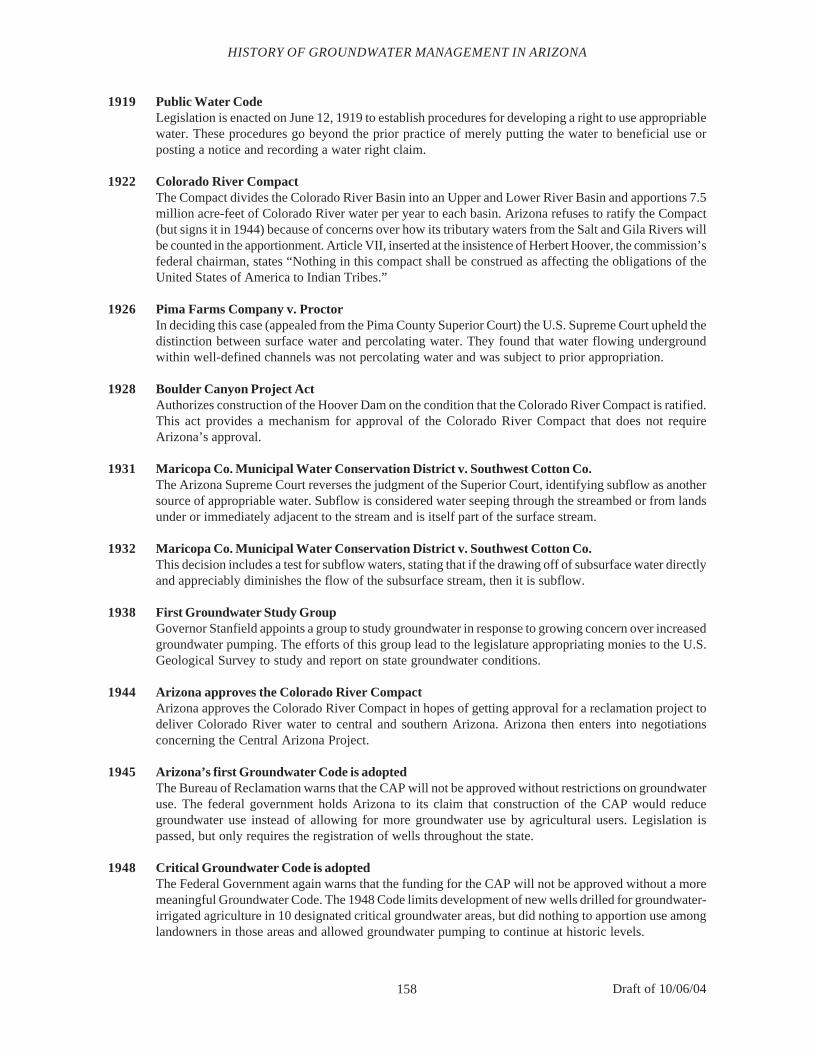
158 Draft of 10/06/04
1919 Public Water CodeLegislation is enacted on June 12, 1919 to establish procedures for developing a right to use appropriablewater. These procedures go beyond the prior practice of merely putting the water to beneficial use orposting a notice and recording a water right claim.
1922 Colorado River CompactThe Compact divides the Colorado River Basin into an Upper and Lower River Basin and apportions 7.5million acre-feet of Colorado River water per year to each basin. Arizona refuses to ratify the Compact(but signs it in 1944) because of concerns over how its tributary waters from the Salt and Gila Rivers willbe counted in the apportionment. Article VII, inserted at the insistence of Herbert Hoover, the commission’sfederal chairman, states “Nothing in this compact shall be construed as affecting the obligations of theUnited States of America to Indian Tribes.”
1926 Pima Farms Company v. ProctorIn deciding this case (appealed from the Pima County Superior Court) the U.S. Supreme Court upheld thedistinction between surface water and percolating water. They found that water flowing undergroundwithin well-defined channels was not percolating water and was subject to prior appropriation.
1928 Boulder Canyon Project ActAuthorizes construction of the Hoover Dam on the condition that the Colorado River Compact is ratified.This act provides a mechanism for approval of the Colorado River Compact that does not requireArizona’s approval.
1931 Maricopa Co. Municipal Water Conservation District v. Southwest Cotton Co.The Arizona Supreme Court reverses the judgment of the Superior Court, identifying subflow as anothersource of appropriable water. Subflow is considered water seeping through the streambed or from landsunder or immediately adjacent to the stream and is itself part of the surface stream.
1932 Maricopa Co. Municipal Water Conservation District v. Southwest Cotton Co.This decision includes a test for subflow waters, stating that if the drawing off of subsurface water directlyand appreciably diminishes the flow of the subsurface stream, then it is subflow.
1938 First Groundwater Study GroupGovernor Stanfield appoints a group to study groundwater in response to growing concern over increasedgroundwater pumping. The efforts of this group lead to the legislature appropriating monies to the U.S.Geological Survey to study and report on state groundwater conditions.
1944 Arizona approves the Colorado River CompactArizona approves the Colorado River Compact in hopes of getting approval for a reclamation project todeliver Colorado River water to central and southern Arizona. Arizona then enters into negotiationsconcerning the Central Arizona Project.
1945 Arizona’s first Groundwater Code is adoptedThe Bureau of Reclamation warns that the CAP will not be approved without restrictions on groundwateruse. The federal government holds Arizona to its claim that construction of the CAP would reducegroundwater use instead of allowing for more groundwater use by agricultural users. Legislation ispassed, but only requires the registration of wells throughout the state.
1948 Critical Groundwater Code is adoptedThe Federal Government again warns that the funding for the CAP will not be approved without a moremeaningful Groundwater Code. The 1948 Code limits development of new wells drilled for groundwater-irrigated agriculture in 10 designated critical groundwater areas, but did nothing to apportion use amonglandowners in those areas and allowed groundwater pumping to continue at historic levels.
HISTORY OF GROUNDWATER MANAGEMENT IN ARIZONA
159 Draft of 10/06/04
1951 Arizona’s second Groundwater Study Commission is formedIn response to the widely criticized provision in the 1948 Groundwater Code that allowed groundwaterpumping to continue at historic levels within critical areas, the second Groundwater Study Commissionis formed to draft a new groundwater bill. The legislature failed to pass any of the Commission’srecommendations and the Commission was ultimately abolished.
1952 Congress passes the McCarran AmendmentThis amendment allowed the federal government to be brought into state general stream adjudications,thereby waiving its sovereign immunity and allowing the extent of federal reserved water rights to bedetermined in state court proceedings.
Bristor v. Cheatham IControversial decision by the Arizona Supreme Court that stated percolating waters were subject to priorappropriation and that appropriation of water for domestic purposes constituted the highest beneficialuse. This ruling reverses nearly 50 years of common law that had stated that percolating water was notsubject to prior appropriation.
1953 Bristor v. Cheatham IIThis decision identified the American common law principle of reasonable use pertaining to groundwater.Specifically in this case, the water in question was not put to beneficial use on the land from which it waspumped, but rather used to irrigate non-adjacent property three miles from the well site.
1955 Southwest Engineering Co. v. ErnstThe plaintiff seeks legal recourse, claiming that the restrictions applying to the critical groundwaterareas designated by the 1948 Groundwater Code are unconstitutional. The decision upheld the generalconcept that certain areas may be managed differently, and specifically that the additional restrictionsplaced on agricultural groundwater users within areas designated by the 1948 Code as critical were notin and of itself unconstitutional.
1963 Arizona v. CaliforniaFollowing 11 years of costly litigation, the decision in Arizona v. California results in major power shiftsbetween the states and the federal government. Colorado River water was apportioned, with Californiareceiving 4.4 million acre-feet, Arizona 2.8 million acre-feet, and Nevada 300,000 acre-feet, with eachstate also awarded all the water in their tributaries. Arizona v. California opened the door for federalparticipation in Colorado River affairs, which many state delegates had hoped to avoid through theColorado River Compact. The decision interpreted the Boulder Canyon Act as empowering the Secretaryof Interior to act as water master of the Lower Colorado River, to apportion future surpluses and shortagesamong the states and even among users within the states.
1968 Colorado River Basin Project ActThe construction of the Central Arizona Project is authorized through the Colorado River Basin ProjectAct. The Act contains a provision that safeguards California’s 4.4 million acre-feet entitlement, statingthat in times of shortage this full amount will be delivered before any water is provided for the CAP. Thestated legislative purpose of the Act calls for “. . . furnishing irrigation water and municipal watersupplies to the water deficient areas of Arizona and western New Mexico…”
1969 Jarvis v. State Land Department IThe decision resulted in an injunction against the City of Tucson, prohibiting them from transportinggroundwater from city-owned wellfields in the Avra and Altar Valleys. The 1948 Groundwater Codedesignated both areas as critical. The court held that the property right to use the water was limited by thereasonable use doctrine on overlying land, not ownership.
HISTORY OF GROUNDWATER MANAGEMENT IN ARIZONA
160 Draft of 10/06/04
1970 Jarvis v. State Land Department IIThis decision uses surface water statute to modify the injunction placed against the City of Tucson in1969. The determination of appropriative rights (based on A.R.S. 45-147) gives preference to domesticand municipal uses over agricultural uses. However, Tucson was allowed to pump and transport the“annual historic maximum use” following the purchase and retirement of irrigated farmland.
1973 Construction of the CAP Canal begins at Lake Havasu City
1974 Water Rights Registration ActAllowed individuals alleging a water right claim that existed before June 12, 1919 to file a claim with thestate.
1976 Jarvis v. State Land Department IIIThe decision of Jarvis v. State Land Department II is modified, allowing the City of Tucson to pump only50 percent of the “annual historic maximum use.”
Farmer’s Investment Company v. BettwyThis case involved water transportation issues within a critical groundwater area, beginning with amining company’s transportation of water for use miles from where it was pumped, and eventuallyincluding the City of Tucson. In granting an injunction in favor of the plaintiff, the court found thatunder the reasonable use doctrine, water could not be pumped from one area for use in another area ifother wells suffered injury or damage as a result, although the two areas overlie a common source. Theinjunction was never acted upon, leaving it up to the legislature to establish a system of preference forrights based on economic interests, and opposing the findings of Jarvis v. State Land Department, limitedthe City of Tucson withdrawals to pre-1972 levels.
1977 Stockpond Water Rights Registration ActGranted statutory recognition of stockponds.
Amendments to the 1948 Groundwater CodeAs a result of the FICO decision, the 1977 Amendments to the 1948 Code established a permit system forthe transportation of groundwater. A 25-member Groundwater Study Commission was also established,charged with developing a new Groundwater Code that would address groundwater transportation andreduce groundwater overdraft occurring in parts of the State.
Federal Budget CutsPresident Carter announces that the CAP is among several Federal projects whose funding will be cut butlater removes the CAP from this “hit list”.
1978 Ak Chin Indian Settlement approved by Congress
1979 Groundwater Study Commission releases its Draft Report of Tentative RecommendationsSecretary of the Interior Cecil Andrus warns that funding for the CAP will not be allocated unless theState passes a Groundwater Code.
1980 Groundwater Management Code is passed and adoptedThe Arizona Department of Water Resources is created to administer Code provisions.
Southern Arizona Water Rights Settlement Act approved by CongressThe SAWRSA settlement was intended to resolve the water rights of the Tohono O’odham, but it wasnever fully implemented. (The final resolution of outstanding issues is currently before Congress in theArizona Water Rights Settlement Act).
HISTORY OF GROUNDWATER MANAGEMENT IN ARIZONA
161 Draft of 10/06/04
1984/ First Management Plans are adopted1985 The first of the five Management Plans called for by the Groundwater Management Act are adopted by
the Arizona Department of Water Resources for the Phoenix, Pinal, Prescott and Tucson ActiveManagement Areas.
1986 The Lakes BillGenerally restricts the construction of bodies of water larger than 12,320 square feet, with most kinds ofgroundwater and CAP water if it is to be used for landscape or scenic purposes.
1986 First Recharge Bill authorizing underground storage and recovery programs
1988 Salt River Pima-Maricopa Settlement approved by Congress
1989 Second Management Plans are adoptedThe Arizona Department of Water Resources for the Phoenix, Pinal, Prescott and Tucson ActiveManagement Areas adopts the second of the five Management Plans called for by the GroundwaterManagement Act.
1990 Fort McDowell Indian Community Settlement approved by Congress
Indirect RechargeThe Groundwater Code is amended to promote indirect recharge of excess CAP water.
1991 Groundwater Transportation ActSeverely restricted the ability of a municipal provider to transport groundwater from rural sub-basins tothe Phoenix, Pinal, Prescott and Tucson Active Management Areas, except those operating under aprevious agreement.
1992 San Carlos Apache Tribe (Gila River drainage) Settlement Approved by Congress
1993 Central Arizona Groundwater Replenishment DistrictCAGRD is established to serve as a groundwater replenishment entity for member lands and memberservice areas under the Central Arizona Water Conservation District. CAGRD must replenish excessgroundwater use by lands enrolled in the replenishment district, and therefore assist in meetingrequirements of the assured water supply program.
1994 Underground Water Storage, Savings and Replenishment ActThe legislature repeals previous enactments and consolidates all storage programs into a unified program.
Yavapai-Prescott Tribe Settlement approved by Congress
Water Protection FundAdministered by a commission which issues grants from the fund to water users for implementing projectsto protect Arizona rivers and streams, including the use of excess CAP water for riparian enhancement.
1995 Assured Water Supply RulesThe Assured Water Supply Rules call for Certificates and designation of Assured Water Supply to bedemonstrated primarily through the use of renewable water supplies.
1996 Arizona Water Banking AuthorityCreated as a mechanism for Arizona to fully utilize its CAP allotment. The Water Bank may annuallypurchase all or part of the state’s unused allotment and store it through recharge. The legislation alsoallowed the Water Bank to store water for other jurisdictions beside the state of Arizona.
HISTORY OF GROUNDWATER MANAGEMENT IN ARIZONA
162 Draft of 10/06/04
1999 Arizona Supreme Court held that federal reserved rights extend to groundwaterTo the extent groundwater is necessary to accomplish the purpose of a reservation, federal reserved rightsmay include groundwater.
Third Management Plans are adoptedThe Arizona Department of Water Resources for the Phoenix, Pinal, Prescott, Santa Cruz and TucsonActive Management Areas adopts the third of the five Management Plans called for by the GroundwaterManagement Act.
2000 Governor’s Water Management CommissionGovernor Jane Dee Hull announces the formation of the Governor’s Water Management Commission.
2003 Pueblo of Zuni (Zuni Heaven) Settlement approved by Congress
RELEVANT ARTICLES
1. Connall, Desmond D., Jr. (1982). “A History of the Arizona Groundwater Management Act.” Arizona State LawJournal 1982: Pp. 313-344.
This Law Review articles gives the political and legal background leading up to the creation of theArizona Groundwater Management Act, including the 1976 FICO case and the work of the originalArizona Water Commission.
2. Ferris, Kathy. (2000). “A Twenty-Year Retrospective.”This speech was given by Kathy Ferris at the May 2nd, 2000 Conference on the 20th Anniversary of theGroundwater Management Act in Tempe, AZ. The speech outlines the politics and work behind thecreation of the Arizona Groundwater Management Act.
3. Goldberg, Barbara. (2000). “Major Issues in the 1980 Groundwater Management Act.”This speech was given by Barbara Goldberg at the June 9th, 2000 Technical Advisory Committeemeeting. The speech outlines the water management issues facing the original Arizona Water Commissionand the rationale behind different components within the Arizona Groundwater Management Act.
HISTORY OF GROUNDWATER MANAGEMENT IN ARIZONA
163 Draft of 10/06/04
Appendix C
ASSURED WATER SUPPLY PROGRAMSource: Governor’s Water Management Commission Briefing Notebook, August 2000
CHAPTER IV
OVERVIEWASSURED WATER SUPPLY FOR NEW SUBDIVISIONS
Arizona’s Assured Water Supply Program is designed to sustain the State’s economic health by preserving ground-water resources and promoting long-term water supply planning. This is accomplished through regulations thatmandate the demonstration of renewable water supplies for new subdivisions. The program is an integral compo-nent of Arizona’s 1980 Groundwater Code, which was designed to address severe groundwater level decline ratesin major urban and agricultural areas.
HistoryIn 1973, the Arizona Legislature enacted a statewide water adequacy statute as a consumer protection measure(A.R.S. § 45-108). The law was passed in response to incidences of land fraud involving the sale of subdivisionlots that were later found to have insufficient water supplies. This law required developers to obtain a determina-tion from the State regarding the availability of water supplies prior to marketing new subdivision lots. Develop-ers were then required to disclose any “inadequacy” of the supply to potential lot buyers.
The 1980 Groundwater Code contains more rigorous provisions for new subdivisions in the Active ManagementAreas (AMAs). The 1980 Code prohibits the sale or lease of subdivided land in an AMA without demonstration ofan assured water supply. An assured water supply determination is required to gain approval of a subdivision platby local governments, and to obtain authorization to sell lots by the Department of Real Estate. A subdivision isdefined as land divided into six or more parcels where at least one parcel is less than 36 acres. Land divisionsresulting in parcels larger than 36 acres are classified as “unsubdivided” lands and do not require an assured watersupply determination.
1995 Assured Water Supply RulesIn 1991, the Arizona Department of Water Resources (ADWR) began developing formal administrative rules formeeting the statutory criteria. The effort, which involved considerable public input, culminated in the adoptionof the Assured Water Supply (AWS) Rules in February 1995.
The two most common types of documentation for an AWS are a Certificate of Assured Water Supply (Certificateof AWS) and a Designation of Assured Water Supply (Designation of AWS). New subdivisions are required by the1980 Groundwater Code to have a Certificate of AWS, unless a water provider designated as having an assuredwater supply serves them. The Certificate of AWS states that the developer has proven that sufficient watersupplies exist for the subdivision for 100 years. If the new subdivision or development is within the service areaof a Designated Water Provider, then a Certificate of AWS is not required; provided that the developer hasobtained a written commitment of service from a water provider designated as having an assured water supply. Asan example, if a subdivision is being built in the Tucson AMA within the City of Tucson’s service area, thedeveloper only needs to provide written proof to ADWR of the City of Tucson’s commitment of service to meetthe AWS requirements, since the City of Tucson has already met the AWS criteria and obtained a Designation ofAWS.
For municipal private water providers, a Designation of AWS is issued. This Designation of AWS states that themunicipality or private water provider has proven sufficient water supplies to service their current, committed andfuture demand for 100 years. Municipalities and private water providers are not required to apply for a Designa-
164 Draft of 10/06/04
tion of AWS, but there are incentives to do so. A Designated Water Provider can deliver water to new develop-ments within their service area without the new subdivision having to apply for their own Certificate of AWS. Themost populous cities within AMAs have obtained a Designation of AWS, and thus a majority of new subdivisionsqualify through this process.
Assured Water Supply CriteriaTo obtain an assured water supply determination, the statute requires a demonstration of:
1. Physical, legal and continuous water availability for 100 years;2. Water quality standards attainment;3. Financial capability to construct the delivery system and related features;4. Consistency with the AMA’s management plan; and5. Consistency with the AMA’s management goal.
Meeting the Assured Water Supply CriteriaDevelopers seeking a Certificate of AWS must demonstrate that sufficient qualifying water supplies are availableto meet subdivision demands for at least 100 years. Water providers seeking a Designation of AWS must demon-strate that sufficient qualifying supplies are available to meet current demand, committed demand (i.e. that whichis associated with recorded, undeveloped lots) and at least two years of projected growth for a 100 year period.
Accounting, Reporting and MonitoringA credit account is maintained by ADWR for each Certificate and Designation of AWS. The account is updatedannually based on reports filed by water providers. ADWR will review the AWS status of designated waterproviders periodically to determine whether the designation remains valid. Additionally, ADWR monitors theallowable groundwater account, which is based on:
1. Basic groundwater allocations: designation applications for existing water providers are allocated the1994 water usage multiplied by 7.5 in the Phoenix AMA, 15 in the Tucson AMA. In the Pinal AMA, thebasic allowance is determined by multiplying the population of the subdivision by 125 gallons perperson per day. In the Prescott AMA, the groundwater allowance is their 15 year demand of the develop-ment, multiplied by the number of years until 2025, divided by two. For example, if an existing waterprovider’s 1994 water usage was 1000 acre-feet in the Phoenix AMA, then 1000 X 7.5 = 7500 acre-feetwould equal their basic groundwater allocation.
2. Incidental Recharge Factor: Designated water providers, under the AWS Rules, annually receive anincidental recharge allocation of 4% of the demand of the previous year and may apply for a higherincidental recharge factor if they can demonstrate a higher incidental recharge in their service area.
3. Extinguishment credits: the extinguishment of grandfathered groundwater rights creates a credit basedon a calculation prescribed in the AWS rules (R12-15-803 MP), which varies depending on the AMA, thetype of right and the year of extinguishment.
A. Assured Water Supply Regulations for SubdivisionsTwo avenues exist for obtaining an AWS determination for a proposed subdivision. The method used will dependupon the access to a Designated Water Provider. If the water provider has acquired a Designation of AWS, then thedeveloper may obtain a written commitment of service from that water provider. If the water provider has notacquired a Designation of AWS, the developer must independently obtain a Certificate of AWS by submitting anapplication to ADWR.
Commitment of Service by a Designated Water ProviderDesignated water providers may include cities, towns and private water companies that have previously satisfiedthe AWS criteria for current, committed and projected customers. If a developer intends to take advantage of aprovider’s designated status, the developer need only obtain a written commitment from the provider to serve theproposed subdivision. The written commitment is presented to the platting entity, and must be noted on thesubdivision plat. An application to ADWR is not required.
Certificate of Assured Water SupplyTo acquire a Certificate of AWS for a proposed subdivision, the property owner must file an application with
ASSURED WATER SUPPLY PROGRAM
165 Draft of 10/06/04
ADWR. If the application is found to meet the AWS criteria, public notification is posted in a local newspaper. Ifno protests are received, a Certificate of AWS is issued. A typical application is processed in about three months.The Certificate of AWS is issued in the name of the property owner, and is valid only for that owner. A Certificateof AWS may be reissued in the name of a new owner if ADWR is notified within 90 days of the transaction.
Certificates of AWS are issued only for subdivision plats. For “master planned” areas that are not yet platted, thedeveloper may obtain a pre-qualification for an AWS determination by applying to ADWR for an Analysis ofAWS.
Assured Water Supply Statutory RequirementsWhile these basic criteria have been required since 1980, the 1995 AWS Rules strengthen the management goalcomponent significantly and establish standards for many sources of water, including Central Arizona Projectwater, other surface water and effluent. The 1995 AWS Rules also raise the depth-to-water standard, and simplifythe financial capability requirements. The most important provisions of the five program criteria are discussed inthe following sections.
1. Physical, Legal and Continuous Availability; R12-15-703The applicant must describe the sources of water to be served to the subdivision. This involves demonstrating theactual water availability and the existence of a delivery system.
Water must be physically and continuously available to the subdivision to meet its demand for at least 100 years.This is typically demonstrated through a hydrologic study which must be submitted with the application, unlessthe entity providing water has previously submitted a valid study to ADWR. To show that supplies will becontinuously available, adequate delivery, storage, and treatment works must also exist or be financed. Evidenceof a legal right to the water supply or supplies is also required.
A legally recognized water provider must be committed to supply service. If a system does not presently serve thearea, two options exist: a) a new water company or co-op may be established in accordance with the applicableArizona Corporation Commission, ADEQ and ADWR requirements; or b) the subdivision may be developed as a“dry lot subdivision” where individual domestic wells will be drilled on each lot by purchasers. If the subdivisionis to be served by a private water company, the proposed subdivision must be within the area prescribed in thecompany’s Certificate of Convenience and Necessity.
2. Water Quality; R12-15-704The applicant’s proposed source(s) of water must satisfy existing state water quality standards as well as otherwater quality standards applicable to the proposed use after treatment. ADWR will consider the possible migra-tion of poor quality water that may impact the applicant’s source. Designated providers must continue to satisfyall applicable state water quality requirements in order to maintain their designation.
3. Consistency with Management Goal; R12-15-705All five AMAs have water management goals related to reduction in groundwater use. The AWS Rules require thatmunicipal users in growing areas limit the use of mined groundwater through the use of alternative supplies andconservation practices. Mined groundwater is groundwater that is used in excess of the goal of the AMA. A certainamount of mined groundwater is allocated to Certificate and Designation of AWS applicants to allow for the“phasing in” of renewable supplies. Renewable supplies must meet any demand over the groundwater allocations.Each AMA, except the Santa Cruz AMA, has its own formula to calculate the amount of mined groundwater thatcan be used when demonstrating an AWS, which is discussed in Part Three, Chapter IV, Section C. Although theapplicant may meet the goal criterion through recharging a renewable supply outside of the service area and pumpgroundwater, the groundwater must still be physically available.
The following sections are general ideas for maintaining consistency with the management goal. It is important tokeep in mind that dry lot subdivisions of 20 lots or less are exempt from the consistency with management goalrequirement in all AMAs. For subdivisions that will be receiving groundwater in an AMA, the Certificate of AWS
ASSURED WATER SUPPLY PROGRAM
166 Draft of 10/06/04
applicant may demonstrate consistency with the management goal through any or all of the following methods:membership in the Groundwater Replenishment District (GRD), extinguishment credits, use of poor quality wateror use of water from a waterlogged area.
4. Consistency with Management Plan; R12-15-706The applicant will need to estimate the amount of water use per lot and for any additional subdivision featuressuch as golf courses, parks or lakes. A build-out schedule must be supplied for all subdivisions. Demand estimatesare evaluated in the context of water conservation guidelines.
If the subdivision is for more than 50 lots, a description of any proposed conservation measures will need to beprovided. If the development is designed so that it conforms to water conservation practices, it will be easier forthe serving provider to meet its conservation requirements as prescribed in the management plan for the AMA.While ADWR cannot deny a certificate application if the demand will make it more difficult for the provider tocomply with its conservation requirements, the provider will be notified of the potential impact of the newsubdivision. A certificate application will not be denied if the water provider is out of compliance with itsconservation requirements.
5. Financial Capability; R12-15-707The developer’s financial capability to construct the water delivery system is typically considered through theplatting entity’s process of approving a plat. The developer’s capacity to finance any features that are not in-cluded in the plat approval process, such as storage and treatment facilities, generally requires the posting of aperformance bond.
B. Assured Water Supply Regulations for Water Providers
If a water company is designated as having an assured water supply then individual subdivisions to be served bythe water company are relieved of having to independently demonstrate an AWS. The same basic criteria, whichapply to Certificates of AWS, also apply to water providers seeking a Designation of AWS. Important items thatare unique to the Designation of AWS are addressed in the following sections.
Physical, Legal, Continuous Availability; R12-15-703Demand and supply information must be provided for the entire service area. The water must be physically andcontinuously available to the water provider in amounts sufficient to meet current demand, committed demandand a minimum of two years of projected demands for at least 100 years. The water provider must have a legal rightto all water to be served. If the provider is not a city or town, applicable Arizona Corporation Commissionapprovals must exist for private water company regulations.
Consistency with Management Goal; R12-15-705“Consistency with the management goal” can be demonstrated through utilization of a CAP allocation, othersurface water, recharge credits, extinguished grandfathered water rights, water exchange agreements or member-ship in the GRD. If the water provider meets the consistency with the management goal requirement throughmembership in the GRD, the service area must be enrolled as a member service area. The provider will pay anannual assessment to the GRD based on the amount of mined groundwater pumped for the entire service area.
Consistency with Management Plan; R12-15-706Existing water providers can show consistency with the management plan if they are in compliance with theirconservation requirements. If the provider is out of compliance, the violation must be remedied by entering intoa stipulated agreement with ADWR. New water providers must describe the measures that will be implemented tomeet ADWR’s conservation requirements. If the water provider is out of compliance, the Designation could belost.
Financial Capabilities; R12-15-707To demonstrate financial capability for storage and treatment facilities, private water companies can show Ari-zona Corporation Commission approval of financing as evidence. Cities and towns can present evidence that
ASSURED WATER SUPPLY PROGRAM
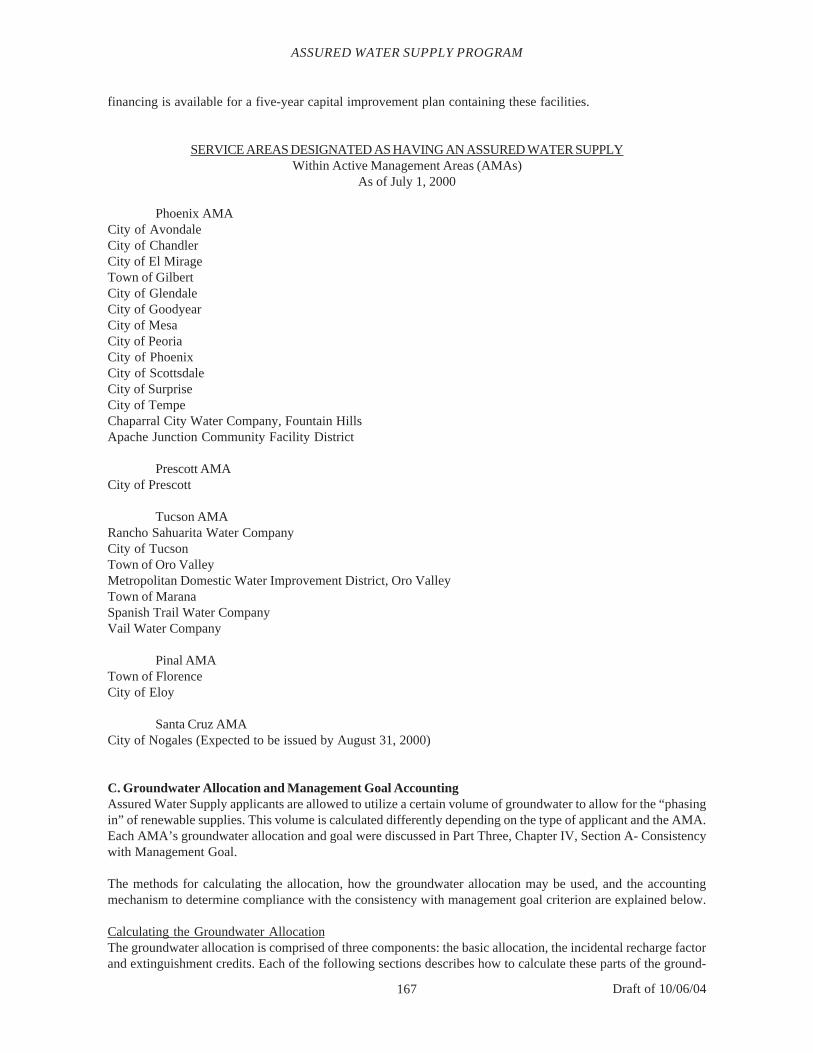
167 Draft of 10/06/04
financing is available for a five-year capital improvement plan containing these facilities.
SERVICE AREAS DESIGNATED AS HAVING AN ASSURED WATER SUPPLYWithin Active Management Areas (AMAs)
As of July 1, 2000
Phoenix AMACity of AvondaleCity of ChandlerCity of El MirageTown of GilbertCity of GlendaleCity of GoodyearCity of MesaCity of PeoriaCity of PhoenixCity of ScottsdaleCity of SurpriseCity of TempeChaparral City Water Company, Fountain HillsApache Junction Community Facility District
Prescott AMACity of Prescott
Tucson AMARancho Sahuarita Water CompanyCity of TucsonTown of Oro ValleyMetropolitan Domestic Water Improvement District, Oro ValleyTown of MaranaSpanish Trail Water CompanyVail Water Company
Pinal AMATown of FlorenceCity of Eloy
Santa Cruz AMACity of Nogales (Expected to be issued by August 31, 2000)
C. Groundwater Allocation and Management Goal AccountingAssured Water Supply applicants are allowed to utilize a certain volume of groundwater to allow for the “phasingin” of renewable supplies. This volume is calculated differently depending on the type of applicant and the AMA.Each AMA’s groundwater allocation and goal were discussed in Part Three, Chapter IV, Section A- Consistencywith Management Goal.
The methods for calculating the allocation, how the groundwater allocation may be used, and the accountingmechanism to determine compliance with the consistency with management goal criterion are explained below.
Calculating the Groundwater AllocationThe groundwater allocation is comprised of three components: the basic allocation, the incidental recharge factorand extinguishment credits. Each of the following sections describes how to calculate these parts of the ground-
ASSURED WATER SUPPLY PROGRAM
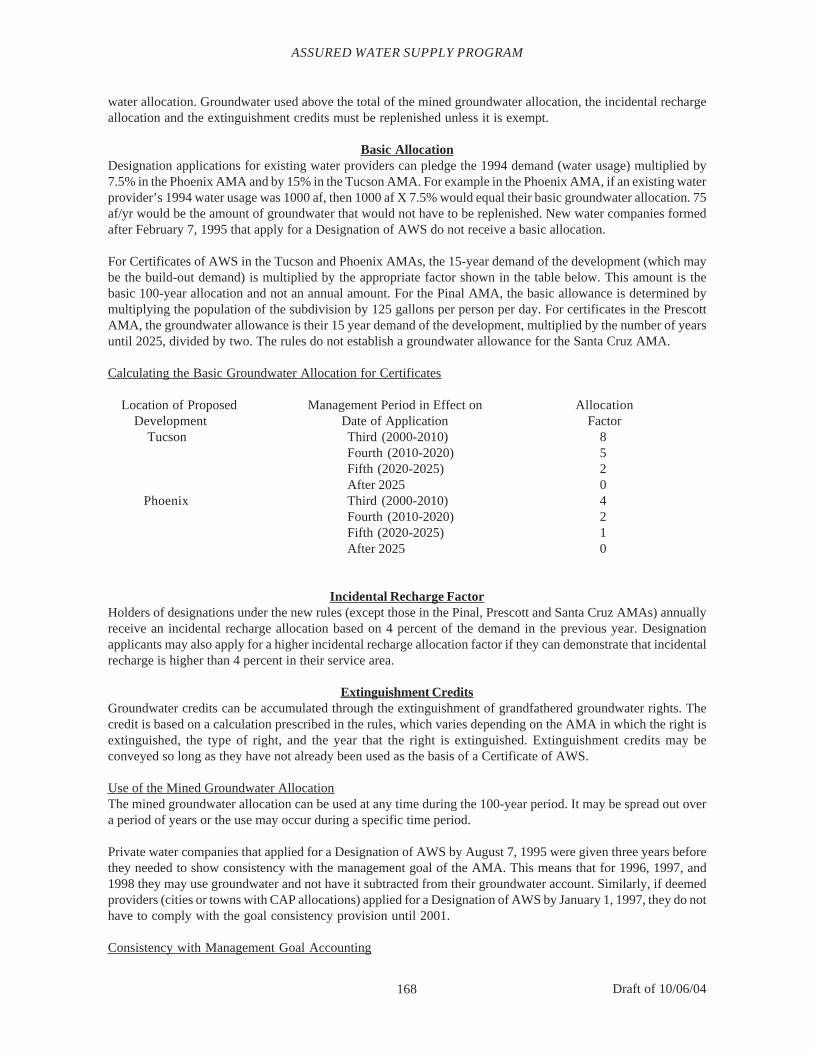
168 Draft of 10/06/04
water allocation. Groundwater used above the total of the mined groundwater allocation, the incidental rechargeallocation and the extinguishment credits must be replenished unless it is exempt.
Basic AllocationDesignation applications for existing water providers can pledge the 1994 demand (water usage) multiplied by7.5% in the Phoenix AMA and by 15% in the Tucson AMA. For example in the Phoenix AMA, if an existing waterprovider’s 1994 water usage was 1000 af, then 1000 af X 7.5% would equal their basic groundwater allocation. 75af/yr would be the amount of groundwater that would not have to be replenished. New water companies formedafter February 7, 1995 that apply for a Designation of AWS do not receive a basic allocation.
For Certificates of AWS in the Tucson and Phoenix AMAs, the 15-year demand of the development (which maybe the build-out demand) is multiplied by the appropriate factor shown in the table below. This amount is thebasic 100-year allocation and not an annual amount. For the Pinal AMA, the basic allowance is determined bymultiplying the population of the subdivision by 125 gallons per person per day. For certificates in the PrescottAMA, the groundwater allowance is their 15 year demand of the development, multiplied by the number of yearsuntil 2025, divided by two. The rules do not establish a groundwater allowance for the Santa Cruz AMA.
Calculating the Basic Groundwater Allocation for Certificates
Location of Proposed Management Period in Effect on AllocationDevelopment Date of Application Factor
Tucson Third (2000-2010) 8Fourth (2010-2020) 5Fifth (2020-2025) 2After 2025 0
Phoenix Third (2000-2010) 4Fourth (2010-2020) 2Fifth (2020-2025) 1After 2025 0
Incidental Recharge FactorHolders of designations under the new rules (except those in the Pinal, Prescott and Santa Cruz AMAs) annuallyreceive an incidental recharge allocation based on 4 percent of the demand in the previous year. Designationapplicants may also apply for a higher incidental recharge allocation factor if they can demonstrate that incidentalrecharge is higher than 4 percent in their service area.
Extinguishment CreditsGroundwater credits can be accumulated through the extinguishment of grandfathered groundwater rights. Thecredit is based on a calculation prescribed in the rules, which varies depending on the AMA in which the right isextinguished, the type of right, and the year that the right is extinguished. Extinguishment credits may beconveyed so long as they have not already been used as the basis of a Certificate of AWS.
Use of the Mined Groundwater AllocationThe mined groundwater allocation can be used at any time during the 100-year period. It may be spread out overa period of years or the use may occur during a specific time period.
Private water companies that applied for a Designation of AWS by August 7, 1995 were given three years beforethey needed to show consistency with the management goal of the AMA. This means that for 1996, 1997, and1998 they may use groundwater and not have it subtracted from their groundwater account. Similarly, if deemedproviders (cities or towns with CAP allocations) applied for a Designation of AWS by January 1, 1997, they do nothave to comply with the goal consistency provision until 2001.
Consistency with Management Goal Accounting
ASSURED WATER SUPPLY PROGRAM

169 Draft of 10/06/04
To determine compliance with the consistency with management goal requirements, ADWR establishes an ac-count for each holder of a Certificate or Designation of AWS which includes the water supply and demand statusof the holder. The account is updated annually and includes the volume of the mined groundwater allocation,including any extinguishment credits and the incidental recharge allocation as applicable. As mined groundwateris used, it will be subtracted from the account unless it is exempt.
Wet Water v. Paper WaterThe process of calculating the basic allocation, the incidental recharge factor and extinguishment credits pro-duces an amount of “paper water.” It may be the case that an existing water provider is entitled to an amount ofgroundwater on paper that does not exist in the aquifer. It is important to remember that physical availability ofthe water must still be proven, even if the applicant is entitled to a groundwater allocation.
ASSURED WATER SUPPLY PROGRAM

170 Draft of 10/06/04
ASSURED WATER SUPPLY PROGRAM

171 Draft of 10/06/04
Appendix D
UNDERGROUND WATER STORAGE ANDRECOVERY PROGRAM
Source: Governor’s Water Management Commission Briefing Notebook, August 2000
CHAPTER IIIOVERVIEW
CONVERSION TO RENEWABLE SUPPLIES
Current groundwater withdrawal authorities established in the Code, such as IGFRs, Type 1 and Type 2 Non-Irrigation Grandfathered Rights, withdrawal permits, and service area rights, plus groundwater allocations underthe Assured Water Supply (AWS) Rules, play a major role in groundwater overdraft. To address this problem, watermanagement efforts focus on ways to encourage water users to convert to renewable supplies. In the AMAs, theseefforts include an Augmentation and Recharge Program, the Underground Storage and Recovery Programs, andrenewable supply utilization requirements under the AWS Rules. Additional entities that assist in conversions torenewable supplies are the Central Arizona Groundwater Replenishment District (CAGRD) and the Arizona WaterBanking Authority (AWBA).
Augmentation and Recharge ProgramThe Augmentation and Recharge Program, in combination with conservation program efforts, is intended tosupport achievement of the management goal for each AMA by encouraging the acquisition, delivery, use andstorage of renewable water supplies now and in the future. Increasing the use of renewable supplies, particularlyCentral Arizona Project water and effluent, to replace groundwater mining is a key component of achieving themanagement goals for the Phoenix, Pinal and Tucson AMAs. For the Prescott and Santa Cruz AMAs, effluent,limited volumes of surface water and potential imported supplies will be depended upon to offset groundwaterpumping.
One of the most important factors that will shape the Augmentation Program is the unique opportunity to bringexcess CAP water into the AMAs (only Phoenix, Pinal and Tucson) and store it underground for future use. Asubstantial supply of CAP water has been physically available to augment the Phoenix, Pinal and Tucson AMA’swater supplies, but will not be fully utilized until some point in the future. Therefore, taking advantage of thissupply and storing it now while it is currently available is an opportunity that must be encouraged. The ArizonaWater Banking Authority (AWBA) provides the means to purchase and store CAP water that is not currently useddirectly, and that would otherwise remain in the Colorado River. Furthermore, the AWBA statutes specify thatsome of this water may be used “to fulfill the water management objectives” of the Groundwater Code.
Incentives to facilitate the utilization of renewable supplies have been incorporated into the Management Plans,providing “breaks” in the conservation requirements for the use of effluent and CAP water, under certain circum-stances. Financial assistance is provided through the augmentation assistance program for entities implementingaugmentation projects or studies that contribute to achieving the AMA management goal or resolving regionalwater management issues.
Underground Storage and Recovery ProgramsSeveral underground storage and recovery programs enacted under legislation during the late 1980s and early1990s were unified under the 1994 Underground Water Storage, Savings and Replenishment Act (UWS). TheUWS program allows individuals and entities to recharge water into aquifers, and later recover that water, once theindividual has received either a storage facility permit, water storage permit or a recovery well permit. Recoveryof stored water can occur either annually or long-term, which allows for flexibility in meeting fluctuating waterdemands and drought conditions.
172 Draft of 10/06/04
Assured Water Supply RulesMunicipal providers serving new municipal uses are required to utilize renewable supplies through acquisition ofan Assured Water Supply designation (Designation of AWS) or Certificate of Assured Water Supply (Certificate ofAWS). Because all new subdivisions must demonstrate the use of renewable supplies (through direct use orstorage and recovery) or join the Central Arizona Groundwater Replenishment District (CAGRD) so that theirgroundwater pumping will be replenished, most municipal water use will gradually transition to renewablesupplies. This transition is an important strategy in reducing the long-term reliance on groundwater. However,some amount of groundwater will be allowed to be pumped under the AWS Rules, which will further affectgroundwater levels and the rates of decline in each AMA.
Central Arizona Groundwater Replenishment DistrictThe establishment of a replenishment entity in the AMAs is closely tied to the Assured Water Supply Program(AWS Program). In 1993, the Legislature authorized CAWCD to undertake replenishment activities that allowmunicipal providers and new subdivisions seeking an assured water supply (either designation or Certificate ofAWS) to become members of the CAGRD. The CAGRD provides a mechanism for demonstrating consistency withthe management goal, required under the AWS Rules, in the Phoenix, Pinal and Tucson AMAs. Members cancontinue to pump groundwater and the CAGRD will replenish that groundwater using a renewable supply some-where in the same AMA.
Arizona Water Banking AuthorityIn 1996, the Arizona Water Banking Authority (AWBA) was created to assist Arizona in utilizing its 2.8 millionacre-feet annual apportionment of Colorado River water and to store unused Colorado River water for futureneeds, including for use in times of drought. Additionally, the AWBA can participate in interstate water bankingwith California and Nevada by entering into Storage and Interstate Release Agreements that allow Arizona tostore unused Colorado River water for California and Nevada.
A. Incentive Programs
Pricing incentives are one of the most effective tools in encouraging the conversion to the use of renewablesupplies. In 1992 the Central Arizona Water Conservation District (CAWCD) established an indirect, or in-lieurecharge program that priced a certain portion of CAP water well below the price of agricultural CAP water. Thefigures denoting deliveries of in-lieu water and agricultural groundwater pumping indicate that this pricingstructure had a dramatic effect on water use patterns, and was very effective in reducing groundwater pumping.
Agricultural CAP use was relatively small in the early 1990s. Therefore, the CAWCD, the managing entity of theCAP canal, established an incentive pricing program for non-Indian agricultural CAP water, beginning in 1994and ending in 2011, to encourage greater direct use of these supplies. This restructuring program was establishedprimarily to deal with the inability of the irrigation districts in the Pinal and Phoenix AMAs to meet theirobligations to CAWCD under their CAP subcontracts. In exchange for waiving their entitlement to CAP waterunder their subcontracts, the irrigation districts would receive excess and surplus CAP water. The program, called“target pricing,” created three pools of agricultural supplies to be available to the Phoenix, Pinal and TucsonAMAs. Pools 1 and 2 each contain a total of 200,000 acre-feet, whereas the amount in Pool 3 is not capped. Pool1 was made available to each district that executed a CAP subcontract prior to October 1, 1993. Pool 2 water wasmade available to non-Indian irrigation subcontractors who relinquished part or all of their original entitlementbetween October 7, 1993 and January 1, 1994. Pool 3 water consists of agricultural water remaining after sales ofPools 1 and 2 and is available to agricultural entities otherwise eligible to receive CAP water service at a priceequal to pumping energy costs plus a capital charge.
The benefits of target pricing are twofold. First, CAWCD and ADWR require the irrigation districts to use the lowcost pool water prior to taking any in-lieu water if the district is a groundwater savings facility (GSF). This benefitswater management efforts by ensuring that a portion of the agricultural water demand is met with CAP water andnot with groundwater–groundwater that is either pumped today or the future pumping of long-term storagecredits. Second, no interest is due on the total federal repayment obligation of the CAP canal for water supplied to
UNDERGROUND WATER STORAGE AND RECOVERY PROGRAM
173 Draft of 10/06/04
agricultural lands. Therefore, the more CAP water, including Pool water, used on agricultural lands, the less theoverall repayment debt becomes. For 1998, costs of Pools 1, 2 and 3 were set at $31, $21 and $43 per acre-foot,respectively. The price of Pools 1 and 2 increases $1.00 per acre-foot annually and the price of Pool 3 will bedetermined annually.
Provisions established under the agricultural, municipal and industrial conservation programs in the second andthird management plans provide regulatory incentives for the use of renewable water supplies. These incentiveshave focused primarily on the use of effluent but are extended to CAP and other renewable supplies.
RENEWABLE WATER SUPPLY UTILIZATION INCENTIVESPHOENIX ACTIVE MANAGEMENT AREA
MunicipalDelivery of effluent by a municipal water provider does not count against the gallons per capita per day (GPCD)requirement, unless effluent is recharged in one location and recovered outside the area of impact. This is anincentive for municipal providers to invest in reclaimed water systems (Chapter 5, section 5.8).
CAP water delivered by a municipal provider to a non-residential water user is excluded from the provider’s totalGPCD requirements for up to ten years if it is shown that the delivery will expedite the development of infrastruc-ture to deliver reclaimed effluent to the user in the future (Chapter 5, section 5.8).
The Alternative Conservation Program removes the non-residential portion of the GPCD requirement for provid-ers who limit their groundwater use to the highest annual use between 1980-1989, utilize renewable supplies fortheir remaining demand, and implement specific conservation measures for non-residential customers. This pro-gram also includes an incentive to extinguish existing grandfathered rights to groundwater (Chapter 5, section5.7.1.3.1).
The Non-Per-Capita Program removes the GPCD rate as a regulatory tool entirely in exchange for implementationof specified conservation programs. A “best management practices” approach is designed to achieve the samelevel of efficiency as the GPCD, but the point of compliance is implementation of the programs, not the level ofwater use. To qualify, water providers must phase out groundwater use, or have a Designation of AWS (Chapter 5,section 5.7.1.2.3).
IndustrialTurfEffluent use is discounted when calculating compliance with the annual allotment for each facility. For the ThirdManagement Plan, the incentive has been increased to a 40 percent discount (the Second Management Plandiscount was a maximum of 20 percent) (Chapter 6, section 6.3.5.3).
If 100 percent of the water used at a facility in a year is from a non-groundwater source, no compliance is requiredwith the annual allotment for that year.
Cooling TowersCooling towers that beneficially reuse 100 percent of their blowdown water are exempt from meeting the blowdownconcentration requirements (Chapter 6, section 6-602.B.1). Cooling towers that convert to at least 50 percenteffluent are exempt from the blowdown concentration requirements for one full year. If it is shown that they cannotmeet the requirements, amended blowdown concentration levels may be applied (new incentive in the ThirdManagement Plan) (Chapter 6, section 6-602.B.3).
Electric PowerElectric power generating facilities are given a full year with no blowdown concentration requirements ifthey convert to at least 50 percent effluent. If it is shown that they cannot meet the requirements, amendedblowdown concentration levels may be applied (new incentive in the Third Management Plan) (Chapter 6,section 6-505).
ASSURED WATER SUPPLY PROGRAM

174 Draft of 10/06/04
DairiesThe reuse of dairy wastewater by a grandfathered groundwater right holder is not counted toward compliance withthe dairy’s maximum annual water allotment (Chapter 6, section 6-703).
AgriculturalPursuant to A.R.S. § 45-467, effluent use cannot contribute to a farm exceeding its allotment in any year. Indetermining whether a farm exceeds its maximum annual groundwater allotment for a year, total water use,including groundwater, effluent, and surface water, is counted. Any effluent used that year is subtracted from theamount of groundwater that otherwise would have exceeded the farm’s allotment.Source: Third Management Plan
B. Underground Storage & Recovery Programs
In 1986, the Arizona legislature established the Underground Water Storage and Recovery Program to allowstorage of renewable water underground and to recover it at a later time for the storer’s use. Between 1986 and1993, the legislature added several other programs related to underground water storage. In 1994, the Arizonalegislature consolidated these various underground water storage programs into a unified program by enactingthe Underground Water Storage, Savings, and Replenishment Act (UWS). The UWS program is administered bythe Arizona Department of Water Resources (ADWR).
The UWS program has two sets of goals. The first set of goals is to encourage the use of renewable water suppliesto satisfy existing needs, to allow for effective and flexible storage of renewable water supplies not currentlyneeded, and to preserve non-renewable groundwater supplies. The second set of goals for the UWS program is toallow for the efficient and cost-effective management of water supplies by allowing the use of undergroundstorage facilities for filtration and distribution of surface water rather than constructing surface water treatmentplants and distribution systems. This UWS program goal allows storage of water in one location and recovery ina different location. Therefore, water may be stored near its source and recovered where it is needed. Although theUWS program contains some restrictions to this “transportation,” the program may be used to deliver water towhere it is needed without the expense of constructing canals and pipelines.
Recharge MethodsThere are various methods to recharge water. The UWS program recognizes two general categories of rechargefacilities. These are Groundwater Savings Facilities (GSF) and Underground Storage Facilities (USF). At GSFs,also called “in-lieu” recharge projects, an entity with an excess supply of renewable water (such as a municipalwater provider) delivers this water to a facility that would otherwise have pumped groundwater (such as a farm).The recipient then uses the renewable water in lieu of pumping groundwater. The supplier of the renewable waterthen earns credits to “recover” this renewable water at a later date from anywhere within the Active ManagementArea (AMA) that meet the requirements set forth in the ADWR Management Plans. The potential for increasing thenumber of GSF projects is limited by the loss of agricultural land in the AMAs. As agricultural land is taken out ofproduction due to urbanization or other factors, the acreage available for this type of project will decrease.
At USF projects water is physically added to an aquifer by a number of different means. The most commonly usedmethods are identified below (modified from Table 4 of Regional Recharge Committee Technical Report).• Off-Channel Constructed Shallow Spreading Basins: Designed to be operated in a wet-dry cyclic mode tomaintain high infiltration rates. The dry cycle is used to control the development of a biological film at the surfacethat impedes the movement of water. The water depth during the wet cycle is not more than five feet.• In-Channel Constructed Facilities: Facility functions within the active floodplain of a watercourse. May includeuse of inflatable dams, gated structures, levees and basins, compound channels, etc.• Managed In-channel Recharge: Facility involves no construction (other than monitoring devices). The naturalstream channel is used for “passive” recharge.• Injection Wells: Wells used to inject water directly into the water-bearing unit of the aquifer. Generally requiressource water that meets drinking water quality standards. Best and most direct method of limiting subsidencesince the water is recharged directly to the aquifer.
ASSURED WATER SUPPLY PROGRAM
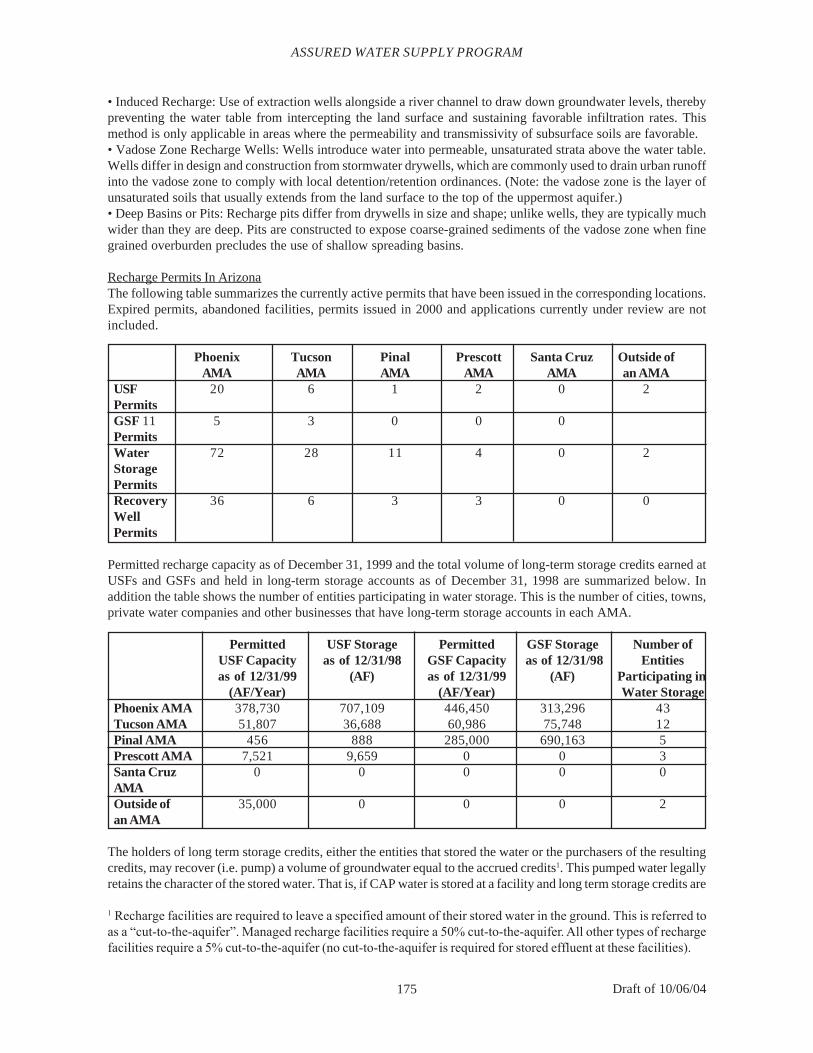
175 Draft of 10/06/04
• Induced Recharge: Use of extraction wells alongside a river channel to draw down groundwater levels, therebypreventing the water table from intercepting the land surface and sustaining favorable infiltration rates. Thismethod is only applicable in areas where the permeability and transmissivity of subsurface soils are favorable.• Vadose Zone Recharge Wells: Wells introduce water into permeable, unsaturated strata above the water table.Wells differ in design and construction from stormwater drywells, which are commonly used to drain urban runoffinto the vadose zone to comply with local detention/retention ordinances. (Note: the vadose zone is the layer ofunsaturated soils that usually extends from the land surface to the top of the uppermost aquifer.)• Deep Basins or Pits: Recharge pits differ from drywells in size and shape; unlike wells, they are typically muchwider than they are deep. Pits are constructed to expose coarse-grained sediments of the vadose zone when finegrained overburden precludes the use of shallow spreading basins.
Recharge Permits In ArizonaThe following table summarizes the currently active permits that have been issued in the corresponding locations.Expired permits, abandoned facilities, permits issued in 2000 and applications currently under review are notincluded.
Phoenix Tucson Pinal Prescott Santa Cruz Outside ofAMA AMA AMA AMA AMA an AMA
USF 20 6 1 2 0 2PermitsGSF 11 5 3 0 0 0PermitsWater 72 28 11 4 0 2StoragePermitsRecovery 36 6 3 3 0 0WellPermits
Permitted recharge capacity as of December 31, 1999 and the total volume of long-term storage credits earned atUSFs and GSFs and held in long-term storage accounts as of December 31, 1998 are summarized below. Inaddition the table shows the number of entities participating in water storage. This is the number of cities, towns,private water companies and other businesses that have long-term storage accounts in each AMA.
Permitted USF Storage Permitted GSF Storage Number ofUSF Capacity as of 12/31/98 GSF Capacity as of 12/31/98 Entitiesas of 12/31/99 (AF) as of 12/31/99 (AF) Participating in
(AF/Year) (AF/Year) Water StoragePhoenix AMA 378,730 707,109 446,450 313,296 43Tucson AMA 51,807 36,688 60,986 75,748 12Pinal AMA 456 888 285,000 690,163 5Prescott AMA 7,521 9,659 0 0 3Santa Cruz 0 0 0 0 0AMAOutside of 35,000 0 0 0 2an AMA
The holders of long term storage credits, either the entities that stored the water or the purchasers of the resultingcredits, may recover (i.e. pump) a volume of groundwater equal to the accrued credits1. This pumped water legallyretains the character of the stored water. That is, if CAP water is stored at a facility and long term storage credits are
ASSURED WATER SUPPLY PROGRAM
1 Recharge facilities are required to leave a specified amount of their stored water in the ground. This is referred toas a “cut-to-the-aquifer”. Managed recharge facilities require a 50% cut-to-the-aquifer. All other types of rechargefacilities require a 5% cut-to-the-aquifer (no cut-to-the-aquifer is required for stored effluent at these facilities).
176 Draft of 10/06/04
earned for that CAP water storage, then a volume of groundwater equal to that volume of credits may be pumped.However, this groundwater is considered to be CAP water for the purposes of the conservation requirements of theGroundwater Code.
The Arizona Water Banking Authority (AWBA) also functions as a storage and recovery program by storingunused Colorado River water to assist Arizona in times of drought, assist water users and providers in meetingconservation requirements, and assist Indian water rights claims settlements.
C. Central Arizona Groundwater Replenishment District
In 1993, the legislature created a groundwater replenishment authority to be operated by the Central ArizonaWater Conservation District (CAWCD) throughout its three-county service area. This replenishment authority ofCAWCD is commonly referred to as the Central Arizona Groundwater Replenishment District (CAGRD). In 1999,the legislature expanded CAWCD’s replenishment authorities and responsibilities by passing HB2262.
The purpose of the CAGRD is to provide a mechanism for landowners and water providers to demonstrate anassured water supply under the new Assured Water Supply Rules (AWS Rules) which became effective in 1995.
Relationship to AWS RulesThe benefits provided by the CAGRD cannot be fully understood without a basic understanding of the AWSRules. The AWS Rules are designed to protect groundwater supplies within each Active Management Area(AMA) and to ensure that people purchasing or leasing subdivided land within an AMA have a water supply ofadequate quality and quantity. Thus, in each AMA, new subdivisions must demonstrate to the Arizona Depart-ment of Water Resources (ADWR) that a 100-year assured water supply is available to serve the subdivision beforesales can begin. An assured water supply (AWS) can be demonstrated in two ways. First, the owner of the subdivi-sion can prove an AWS and receive a Certificate of AWS from ADWR. Or, the owner of a subdivision can receiveservice from a city, town or private water company which has been designated by ADWR as having an AWS.
There are five basic criteria for proving an AWS. An applicant for an AWS must prove that:1. a sufficient quantity of water is continuously available to satisfy the water demands of the development
for 100 years;2. the water source meets water quality standards;3. the proposed use of water is consistent with ADWR’s conservation standards;4. the proposed use is consistent with water management goals; and5. the applicant is financially capable of installing the necessary water distribution and treatment facilities.
Under the 1993 CAGRD enabling legislation, membership in the CAGRD provides a means by which an AWSapplicant can satisfy criterion number 4 above, which requires that the proposed water use be consistent with thewater management goals of the particular AMA. The consistency with management goals section of the AWSRules limits the quantity of mined groundwater that an applicant may use to demonstrate an AWS. The effect ofthis groundwater pumping limitation is to prevent new development from relying solely on mined groundwater toserve its water demands.
Development, however, is not stymied for those landowners and water providers who have no direct access to CAPwater or other renewable supplies. If a water provider or a landowner has access to groundwater and desires to relyexclusively on groundwater to demonstrate a 100 year water supply, it may do so, provided it joins the CAGRD.As a member of the CAGRD, the landowner or provider must pay the CAGRD to replenish any groundwaterpumped by the member which exceeds the pumping limitations imposed by the AWS Rules.
Replenishment Obligation of the CAGRDThe CAGRD must replenish (or recharge) in each AMA the amount of groundwater pumped by or delivered to itsmembers which exceeds the pumping limitations imposed by the AWS Rules. This category of water is referred toas “excess groundwater.”
ASSURED WATER SUPPLY PROGRAM
177 Draft of 10/06/04
Recharge may be accomplished through the operation of underground storage facilities or groundwater savingsfacilities. CAWCD may sell its indirect storage and recovery credits to the CAGRD at fair value.
Water used for replenishment may be CAP water or water from any other lawfully available source, exceptgroundwater withdrawn from within an AMA. For the foreseeable future, the water that the CAGRD will use forreplenishment will likely be excess CAP water.
MembershipMembership is voluntary. Any city, town, water company, subdivision or homeowner’s association located inPima, Pinal or Maricopa counties may join the CAGRD.
There are two types of members:a. Member Service Areas: The service area of a city, town or private water company, including any addi-
tions to or extensions of the service area.b. Member Lands: An individual subdivision with a defined legal description.
Physical Access to GroundwaterUnder the provisions of the 1993 CAGRD enabling legislation, membership in the CAGRD does not waive therequirement under the AWS Rules that an applicant must demonstrate the physical and legal availability ofgroundwater. Providers or subdivisions which rely on the CAGRD to meet the AWS requirements must still meetthe depth to groundwater criteria established in the AWS Rules and have the legal right to withdraw groundwaterfrom the point of withdrawal. The new authorities provided to the CAGRD in 1999 modify this requirement tosome extent for Member Service Areas, as described later in this section.
Replenishment Taxes/AssessmentsCosts of the CAGRD will be covered by a replenishment tax or replenishment assessment levied on CAGRDmembers. Water providers serving Member Service Areas will pay a replenishment tax directly to the CAGRDaccording to the number of acre-feet of excess groundwater they deliver within their service areas during a year.For Member Lands, a replenishment assessment will be collected by the county assessor from each tax parcelaccording to the number of acre-feet of excess groundwater delivered to that parcel.
Amount of the Replenishment Tax/AssessmentThe amount of the replenishment tax/assessment will be the CAGRD’s total cost per acre-foot of recharginggroundwater, including: the capital costs of constructing recharge facilities, water acquisition costs, operationand maintenance costs and administrative costs. By statute, the replenishment tax/assessment must be calculatedseparately for each AMA.
Additional Authorities Provided by the Legislature in 1999In 1999, the legislature expanded CAWCD’s replenishment authorities and responsibilities by passing HB 2262.Under this legislation, CAGRD’s role in helping members prove an AWS is extended beyond the consistency withmanagement goal criterion described above. Now the CAGRD may assist a Member Service Area in satisfyingcriterion number 1, (i.e., proof that a sufficient quantity of water is continuously available to satisfy the waterdemands within the service area for 100 years).
The new legislation allows ADWR to grant a designation of AWS to a water provider whose service area has beenenrolled as a Member Service Area of the CAGRD and has been granted “Water Availability Status” by theCAWCD Board. If the CAGRD decides to grant “Water Availability Status” to a Member Service Area, it mustformally adopt a resolution and prepare and file a detailed “Capability Plan” with ADWR. The plan must includea description of the replenishment facilities, transportation facilities, and water supplies that will be used toprovide a physically available supply of water to the Member Service Area. It must be a 100-year plan, which issubject to public review and a public hearing. The plan is to be updated every ten years. The bill also allows theCAGRD to make direct deliveries, under certain conditions, to Member Service Areas that have been grantedWater Availability Status.
ASSURED WATER SUPPLY PROGRAM

178 Draft of 10/06/04
D. Arizona Water Banking Authority
Arizona does not currently use its full 2.8 million acre-foot per year share of Colorado River water establishedunder Arizona vs. California, 373 U.S. 546 (1963). Any of Arizona’s apportionment not diverted from the main-stream by Arizona is available for use in California or Nevada. The Arizona Water Banking Authority (AWBA)was established in 1996 as a means to increase the utilization of Arizona’s Colorado River apportionment and tostore unused Colorado River water to meet Arizona’s future water supply needs. As Arizona directly uses more ofits Colorado River apportionment, the amount of excess CAP water available to the AWBA for storage is expectedto decrease.
The objectives of the AWBA include: (1) protecting municipal and industrial (M&I) users of CAP water fromshortages or disruptions of the CAP system; (2) assisting in meeting the management objectives of the state’sGroundwater Code (Code); (3) assisting in the settlement of Indian water rights claims; (4) exchanging water toassist Arizona’s Colorado River communities; and (5) exploring opportunities for interstate water banking withNevada and California. Although the AWBA has been working closely with the AMAs to identify storage oppor-tunities that would also help support water management objectives of each AMA, some recharge projects ideallylocated to meet some of these AWBA objectives may not optimally assist the AMAs in meeting their specificwater management goals, for example, hydrologically feasible sites located outside of the AMA.
Annual funding for the AWBA comes from four sources: (1) an ad valorem property tax of four cents per $100assessed valuation in the three-county CAP service area; (2) a groundwater withdrawal fee of $2.50 per acre-footin the Tucson, Phoenix and Pinal AMAs; (3) general fund appropriations; and (4) the proceeds of interstatebanking activities. The ad valorem tax collected for the AWBA in Maricopa County is estimated to be $6.1million in 1998. The 1997 groundwater withdrawal fee (collected in 1998) should generate $2.2 million. Generalfund money projected to be used for storage in the Phoenix AMA in 1998 is $235,000. Based on the $8.5 millionthat is currently available, the total recharge capacity that could be utilized by the AWBA in the Phoenix AMA isestimated at 121,000 to 170,000 acre-feet per year, based on water costs of $70 to $50 per acre-foot, respectively,which may be optimistic for the long-term.In 1998, the AWBA actually stored over 117,000 acre-feet of water.
The AWBA is authorized to enter into Storage and Interstate Agreements with entities in Nevada and Californiaunder certain conditions. Under these agreements, the out-of-state entity, known as the Consuming State, requestsArizona, known as the Storing State, to divert and store a set amount of Arizona’s unused apportionment ofColorado River water, which is financed by the Consuming State. Arizona must first verify that no in-stateColorado River right holders could utilize the unused apportionment requested by the Consuming State to bestored. Later, when the Consuming State needs additional water supplies beyond its Colorado River apportion-ment, the Consuming State requests Arizona to develop an Intentionally Created Unused Apportionment (ICUA)that matches the amount originally stored by Arizona for the Consuming State. The ICUA is developed bydecreasing Arizona consumptive use of Colorado River water and allowing the Consuming state to utilize thewater remaining on the mainstream. To the extent interstate water is stored within an AMA, the AMA wouldreceive a short-term benefit of additional water supplies imported into the AMA in advance, perhaps by decades,of when those supplies would be needed for direct use by the out-of-state entity.
E. Augmentation Assistance Program
The Arizona Department of Water Resources’ (ADWR) Water Management Assistance Program (WMAP) is in-tended to provide financial and technical resources and to assist in the development and implementation ofconservation programs, augmentation programs, and programs designed to monitor hydrologic conditions andassess water availability in the Active Management Area (AMA). This program is funded through a portion of thegroundwater withdrawal fee paid annually by those who withdraw groundwater in the AMA.
Augmentation assistance may take the form of financial assistance to water users, providing them the means tostudy, design, and construct renewable resource facilities. Assistance may also take the form of planning andtechnical assistance designed to develop AMA-wide and local area management strategies, as well as monitoring
ASSURED WATER SUPPLY PROGRAM

179 Draft of 10/06/04
activities. Current monitoring activities include providing staff assistance and funds for water availability andsubsidence monitoring studies.
ADWR administers this program through the awarding of contracts to water users, universities, consultants andother eligible persons. ADWR also provides legal, financial, and administrative support to the contracts program.Each AMA has a five-member Groundwater Users Advisory Council (GUAC) appointed by the governor torepresent various sectors of the regulated water community. A competitive application review process is con-ducted after which program staff and the GUAC formulate a set of funding recommendations for submittal to thedirector for final decision.
The goal of the Augmentation Assistance Program is to assist water users or other eligible persons within eachAMA in developing augmentation and recharge projects to maximize the use of renewable sources of water suchas Central Arizona Project, other surface water and effluent. ADWR will meet this goal by working toward thefollowing program objectives:
· Identify high priority funding areas, in consultation with the GUAC and the waterusing community, andadminister priority programs.
· Provide funds for the planning, design and construction of such augmentation and recharge projects.· Act as a central source for information on augmentation and recharge.· Increase public awareness of the importance of augmenting the AMA’s groundwater supplies.
In an effort to apply available funding and technical assistance to the most important projects, the AMA identifiesannual program priorities. With assistance from members of the water-using community and the GUAC, highpriority project categories are identified. Any applications for funding in these categories receive preferenceduring the application review and selection process.
Statutory authorization making monitoring and water availability assessments fundable under this program wasgiven in 1996. Projects that may be funded in this new category include water measurement, aquifer and geohy-drologic studies, land subsidence monitoring and aquifer compaction studies.
ASSURED WATER SUPPLY PROGRAM

180 Draft of 10/06/04
ASSURED WATER SUPPLY PROGRAM
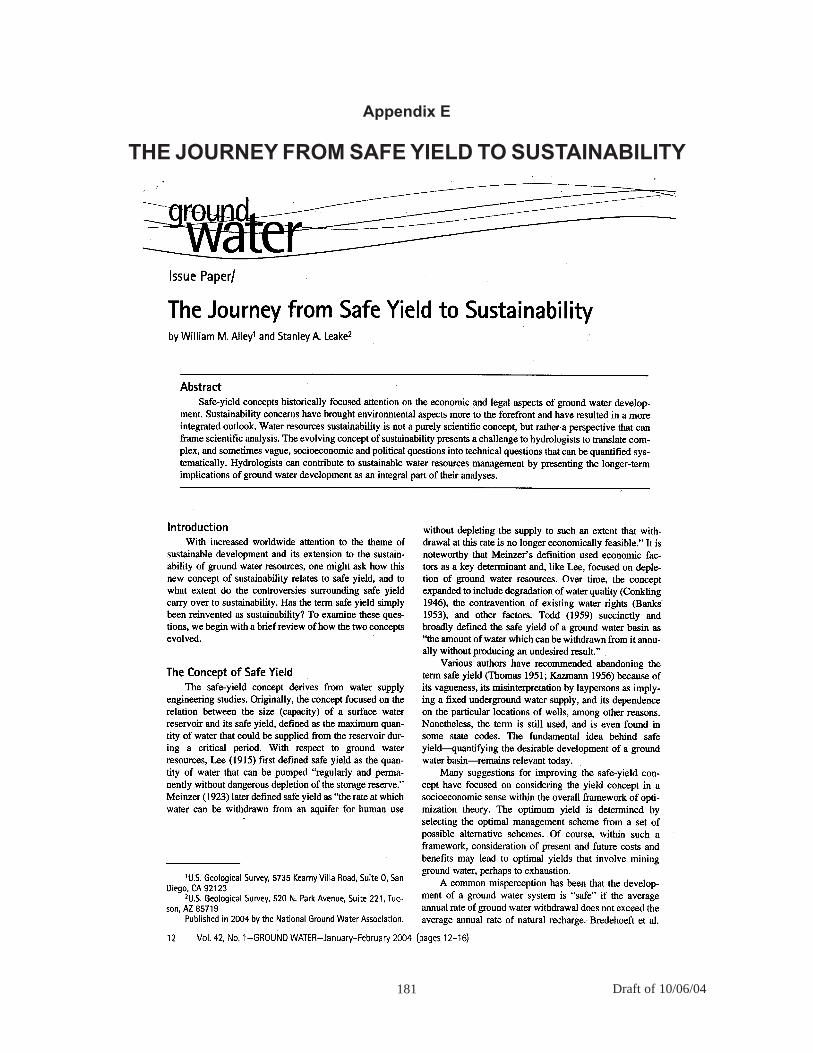
181 Draft of 10/06/04
Appendix E
THE JOURNEY FROM SAFE YIELD TO SUSTAINABILITY
182 Draft of 10/06/04
THE JOURNEY FROM SAFE YIELD TO SUSTAINABILITY
183 Draft of 10/06/04
THE JOURNEY FROM SAFE YIELD TO SUSTAINABILITY
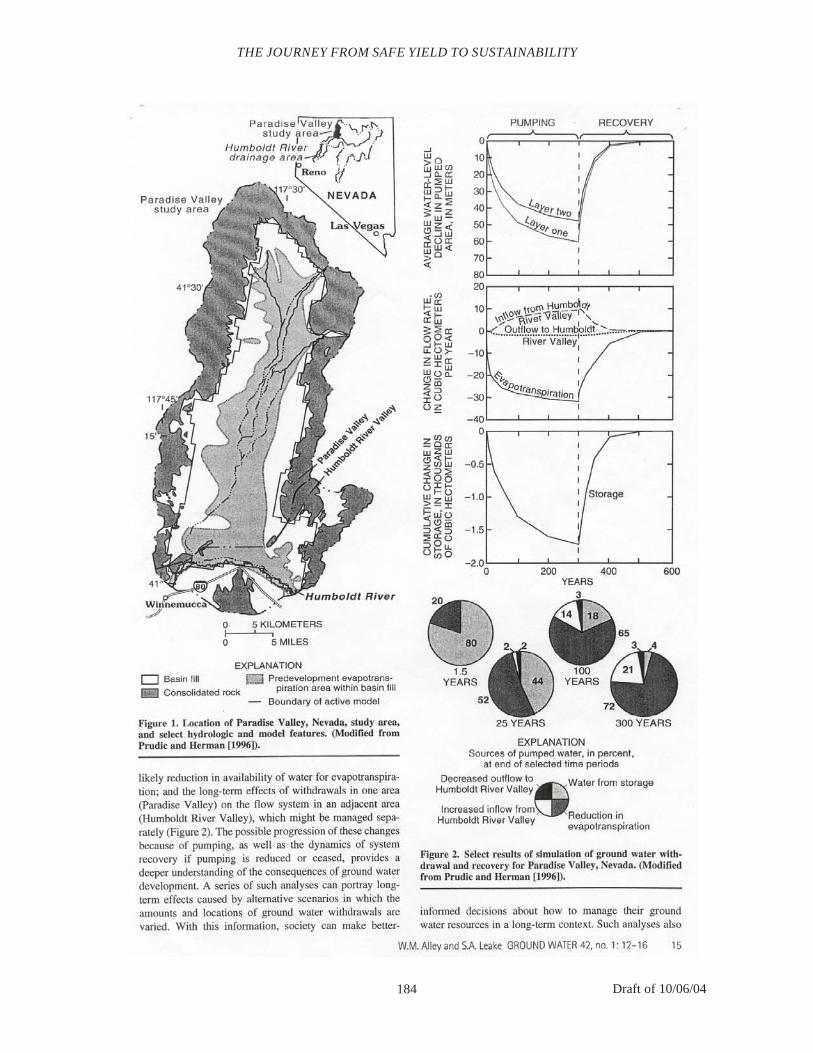
184 Draft of 10/06/04
THE JOURNEY FROM SAFE YIELD TO SUSTAINABILITY
185 Draft of 10/06/04
THE JOURNEY FROM SAFE YIELD TO SUSTAINABILITY

186 Draft of 10/06/04
THE JOURNEY FROM SAFE YIELD TO SUSTAINABILITY
187 Draft of 10/06/04
Appendix F
WATER QUALITY ISSUES
GARY WOODARD
The following sections describe key water quality issues from a regulatory perspective that affect Arizona’sfuture water requirements.
Arsenic
The federal Environmental Protection Agency (EPA) rule lowering the drinking water standard forarsenic from 50 micrograms per liter to 10 micrograms per liter becomes effective on January 23, 2006. Thischange has an extreme impact in Arizona because arsenic naturally occurs in a large number of groundwatersupplies used for drinking water at levels greater than 10 micrograms per liter. Many large systems and anestimated 300 small systems will have to treat, blend or develop alternative sources in order to meet the newstandard. Total cost to drinking water systems to comply is estimated at over $100 million. Concern aboutmanagement of arsenic-laden treatment residuals also has been expressed. Proper management is necessary toensure that other environmental problems are not created. The Arizona Department of Environmental Quality(ADEQ) has developed an Arsenic Master Plan to assist drinking water system owners in meeting the new arsenicstandard in 2006.
See http://www.adeq.state.az.us/environ/water/dw/arsenic.html for additional information.
Perchlorate
Perchlorate, a rocket fuel, munitions and pyrotechnic chemical, is present in Colorado River water fromHoover Dam to the Mexican border at levels of from 4 to 11 micrograms per liter. Perchlorate is an inorganic,soluble salt that is mobile in surface water and groundwater and resistant to degradation. The perchlorate contami-nation of the Colorado River is due to discharges into Lake Mead that originated from two manufacturingfacilities in Henderson, Nevada. Its occurrence in the lower Colorado River is a concern because the river suppliesdrinking water to millions of people in California and Arizona, including a large population in central Arizonadependent on supplies brought in by the Central Arizona Project (CAP).
No federal drinking water standard has yet been set for perchlorate. The current Arizona Health BasedGuidance Level is set at 14 micrograms per liter. California established a Public Health Goal of 6 micrograms perliter as a first step in promulgating a drinking water standard for use there. Standards setting has been highlycontroversial nationally due to differences of opinion regarding the health impact of perchlorate at low levels.Recent evidence of perchlorate residues in lettuce irrigated by Colorado River water and milk from cows fed onforage irrigated by Colorado River water has heightened concerns.
Governor Janet Napolitano recently formed a task force drawing from four state agencies–the Depart-ments of Environmental Quality, Water Resources, Health Services (ADHS) and Agriculture–to investigate theoccurrence levels of perchlorate in Arizona water sources, the risks, if any, it poses to public health, whetherArizona should develop a water quality standard for perchlorate, and to make recommendations for future action,if necessary.
Further information is available at http://www.adeq.state.az.us/function/about/perch.html.
188 Draft of 10/06/04
Lead
Lead in drinking water at schools has become a concern nationally because of the discovery of lead insome school systems at levels significantly higher than the EPA action level of 0.015 milligrams per liter in tapwater samples. The EPA action level was established to protect public health due to release of lead from lead pipesor soldered copper pipes in water system plumbing and distribution systems serving homes, schools and otherplaces of use. High lead levels are of special concern in schools because of the accumulative nature of lead inhuman bodies and the disproportionate adverse health consequences for children, who tend to absorb more leadthan the average adult. ADHS is gathering data from schools and is working with ADEQ to determine if elevatedlead levels are a concern in Arizona.
Mercury
Over the past several years, ADEQ has found increasing evidence of mercury contamination in the lakesand streams throughout Arizona. Based on monitoring results, ADEQ has issued fish consumption advisories onat least 12 water bodies in widely varying locations throughout the state including Alamo Lake, Upper and LowerLake Mary, Lyman Lake and Parker Canyon Lake. These water bodies will now require development of a totalmaximum daily load (TMDL) and plan of implementation to improve water quality.
Mercury is a toxic, persistent and bioaccumulative pollutant that is both a public health and an environ-mental concern. Mercury has a direct affect on the nervous system and has long been known to have toxic effectson humans and wildlife. Since eating fish is the single greatest source of mercury exposure for most people,preventing the entry of mercury into the environment is the best way to reduce mercury exposure that causeshealth effects.
ADEQ has developed a long-term, multi-media, multi-agency strategy that focuses on preventing newmercury from entering the environment and reducing contributions from existing sources. The strategy involvesadditional data collection and research to determine actual levels and sources of mercury in Arizona. The strategyalso addresses reduction of consumer products containing mercury and encouragement of new technologies thatcan reduce or replace the use of mercury and facilitate proper disposal of existing products at the end of theiruseful life.
See http://www.adeq.state.az.us/environ/water/assessment/ongoing.html#merc for additional information.
Sediment
Surface waters of Arizona that do not meet associated water quality standards are considered “impaired.” Underthe federal Clean Water Act, which is implemented in Arizona by ADEQ, impaired waters must be listed on a CleanWater Act Section 303(d) list. For each impaired water, a TMDL allocation must be completed and an implemen-tation plan developed to restore the waters to standards. In Arizona, suspended sediment, also measured asturbidity, is a major reason for impairment and is responsible for a large percentage of current or proposed listingson the 303(d) list.
Nitrate
Nitrate is one of the most common pollutants in the state’s groundwater and is almost always caused byanthropogenic activities that result in the transport of nitrogen to groundwater. These activities and sourcesinclude agriculture, septic tanks, sewage treatment plants and concentrated animal feeding operations. Largeportions of aquifers in Arizona contain groundwater with nitrate concentrations high enough to render the waterunfit for potable use. ADEQ water quality permitting requirements limit nitrogen discharges from industrialfacilities and sewage treatment plants. Agricultural fertilization practices are regulated through water qualitygeneral permits. ADEQ is proposing rules that will limit discharges of nitrogen from animal feeding operations
WATER QUALITY ISSUES

189 Draft of 10/06/04
and septic tank concentrations. Proposed regulations would require lined impoundments for wastewater at certainanimal feeding operations and allow ADEQ to designate Nitrogen Management Areas to control discharges fromconcentrations of septic tanks and other nitrogen sources.
Salinity
Salinity, measured by Total Dissolved Solids (TDS), is composed of salts, minerals and metals. A normalcomponent of drinking water, salinity can become undesirable in high concentrations and affect a wide range ofwater users, including industry, agriculture and municipalities. High TDS levels inhibit agricultural productionand also can become a corrosive element, destroying and damaging water delivery systems and water-usingappliances. The cost of these combined damages can be extreme. For example, the cost associated with salinitydamage for the Colorado River Basin is between approximately $500 million and $750 million per year. Addi-tional costs for many water users could include building or upgrading water treatment facilities and desaltingplants in order to remove unwanted salts and improve water quality.
In Arizona, high levels of TDS can occur in groundwater, effluent water and CAP water. Groundwater,usually relatively low in TDS, can increase in salinity as pumping continues to decrease ground water levels.Evaporation from open CAP canals and reservoirs, droughts and seasonal flows of the Colorado River andirrigation practices concentrate and contribute to increase CAP salinity levels. Effluent water from wastewatertreatment plants is higher in TDS than groundwater and can add TDS to streams and underground aquifers. Asmore CAP water reaches wastewater treatment plants, effluent TDS levels will increase. Plans to control the risingsalinity levels are being studied by the U.S. Bureau of Reclamation, through the Colorado River Basin SalinityControl Program.
Further information is available at http://www.usbr.gov/dataweb/html/crwq.html.
Endocrine Disrupters
An endocrine disrupter (ED) is a compound that disrupts the endocrine system by mimicking or inhibit-ing the effects of hormones. EDs can include a wide array of natural and synthetic hormones, steroids, pesticidesand other industrial chemicals. Unfortunately, EDs are persistent and can bioaccumulate in the environment, tolater be consumed through contaminated water and food supplies. Since the common functions of the endocrinesystem are reproduction and metabolism, some researchers are concerned that accumulation of EDs in the environ-ment may be the current cause of increased breast cancer, sterility, many other endocrine illness and changes inwildlife populations.
Current concerns have been directed toward effluent dominated water supplies, especially in arid areas,where riparian habitats rely on effluent outfall. The effects of persistent EDs in effluent dependent riparian areasare currently being researched, including the chronic effects of long-term, low-level exposure of EDs on nativefish species. Another concern is that recharge of effluent may accumulate EDs and negatively affect the waterquality for future generations.
To study the effects of EDs on people and wildlife, the EPA established the Endocrine DisruptorsResearch Initiative. In 1996, EDs were one of the EPA’s top six research priorities in the Office of Research andDevelopment. The National Research Council and other research groups are studying and monitoring EDs. Muchscientific uncertainty remains, as it is difficult to prove that a particular substance or ED is responsible for anendocrine effect.
Further information is available at http://www.epa.gov/endocrine/ for Arizona-specific information, alsosee http://www.ag.arizona.edu/AZWATER/awr/sep00/feature1.htm.
WATER QUALITY ISSUES

190 Draft of 10/06/04
WATER QUALITY ISSUES
191 Draft of 10/06/04
APPENDIX G
MAJOR STREAMS, RECHARGE ANDGROUNDWATER RESOURCES
DAVID A. DE KOK
Basin and Range Lowlands
The major streams of the basin and range lowlands are the Gila River and two of its tributaries, the SanPedro and Santa Cruz Rivers. The Salt, Verde and Agua Fria Rivers flow out of the central highlands and wereonce important contributors to the Gila River flow, though they are now all diverted for use in the Phoenix areaexcept during flood events. The Salt and Verde Rivers were perennial rivers (those that flow all the time, usuallybecause they are fed by a base flow, or spring, which seeps into the streambed because of a high water table),whereas the Agua Fria was interrupted (its surface flows occurred in some portions of the streambed but not othersdue to varying underlying geology). Together, they once ensured that the Gila River was perennial all the way tothe Colorado River except in years of extreme drought. Downstream from the Granite Reef Diversion Dam, theSalt River is perennial now only because of effluent outflows from sewage treatment plants. The Gila River hasperennial effluent flow for a few miles downstream of its junction with the Salt River but is ephemeral (flow indirect response to precipitation events) after that.
Natural recharge to the aquifers in the basin and range region is limited. In the low-lying western portionof the region it is exceedingly limited, occurring mostly in the form of groundwater underflow from neighboringbasins and occasionally as streambed infiltration from passing storms. Those basins abutting Lake Mead, LakeMohave and Lake Havasu have established a hydrologic connection with the lakes, and water tables rise and fallwith fluctuations in lake levels. Recharge takes place along the middle reaches of the Gila River from occasionalfloods that exceed the storage capacity of upstream dams, from underflow of floodwaters captured by the PaintedRock Reservoir, from incidental recharge of urban effluent and irrigation tailwater and from precipitation.
In the Lower Gila and Yuma basins, excessive recharge has created problems. Much like the drain of abathtub, this area, the state’s elevational low point, eventually receives that portion of Arizona’s waters that arenot lost to evaporation or immediate groundwater recharge. After completion of the canal system that divertsColorado River water to the fields of the Wellton-Mohawk Irrigation and Drainage District in 1957, water logging(groundwater levels near the surface of the land) threatened crop production in much of the area. In 1961 anetwork of wells began pumping excess groundwater into drainage canals to lower groundwater levels and relievewater logging. In the adjacent Yuma basin, groundwater levels are controlled by pumping for both irrigation anddrainage.
In the eastern portion of the basin and range region, recharge takes place from streambed infiltration ofthe area’s larger rivers (the Gila, San Pedro and Santa Cruz), from mountain-front recharge of precipitation cap-tured by the mountain ranges, from incidental recharge of urban effluent and irrigation tailwater and from directprecipitation. In Cochise County’s Sulphur Springs Valley, pumping by large scale irrigated agriculture loweredwater tables significantly, eventually resulting in cutbacks in crop production due to high pumping costs and anaccompanying leveling off of water table declines. However, unlike those basins adjacent to the Colorado or GilaRivers or along the path of the Central Arizona Project (CAP) system, there is no recharge of water from outside ofthe immediate drainage basins. This means that the net recharge into the valley is limited to only that whichnaturally occurs.
Recharge patterns throughout the basin and range region have been altered considerably by human use.Storage and diversion dams have decreased the natural recharge resulting from flood flows that in the past reachedthe alluvial valleys. Entrenchment of watercourses such as the San Simon and Santa Cruz Rivers lowered water
192 Draft of 10/06/04
tables, reduced local infiltration rates and sped floodwaters downstream at faster rates. Effluent outflows fromsewage treatment plants in Nogales, Tucson and Phoenix have brought perennial flows to new reaches of river andhave caused incidental recharge to occur in areas removed from the river’s former natural recharge sites.
Many of the basins in the basin and range lowlands experienced severe declines of their water tablesbetween the 1940s and the late 1970s. In the Harquahala Plain, the depth to groundwater in one location wentfrom 202 feet in 1955 to 532 in 1985. In the Salt River Valley, the depth to groundwater dropped from 181 feetin 1945 to 373 feet in 1980. In the Avra Valley, the water table depth went from 251 feet in 1955 to 346 feet in1975, before rising again to 310 feet in 1990. Since the early 1980s many of the lowland basins have achieved aleveling off or even a rebound in their water tables as irrigated agriculture has reduced production and utilitzedCAP supplies.
Central Highlands
The principal streams of the central highlands are the Salt and Verde Rivers and their tributaries. Thehighlands account for 30 percent of the total drainage of the two rivers but produce 65 percent of their combinedstreamflow. The chief runoff producing area of the Verde River is the Mogollon Rim-San Francisco Mountainregion. Significant drainages feeding the Verde River are Sycamore, Oak, Beaver, West Clear, Fossil and EastVerde Creeks. This drainage area of 1,900 square miles produces an average annual runoff of 300,000 acre-feet.(The entire Verde watershed of 6,600 square miles has an annual average runoff of 468,100 acre-feet). The SaltRiver’s chief runoff producing area consists of the drainage areas of the White and Black Rivers whose headwatersare on, respectively, the north and south slopes of Mount Baldy. Their combined drainage area of 1,860 squaremiles produces an average annual runoff of 380,000 acre-feet. (The entire Salt River watershed of 6,300 squaremiles has an annual average runoff of 666,800 acre-feet.) Other significant tributaries of the Salt River are Carrizo,Cibecue, Cherry and Tonto Creeks.
The other major watercourses of the central highlands are the Bill Williams, Hassayampa, Agua Fria andSan Carlos Rivers. The two major tributaries of the Bill Williams are the Santa Maria and Big Sandy Rivers. TheSanta Maria River drains mountains to the west of Prescott. The Big Sandy’s drainage area is to the northwest ofthe Santa Maria’s and includes portions of the basin and range lowlands to the southeast of Kingman. TheHassayampa River has its headwaters in the Bradshaw Mountains and drains the area south of Prescott. The AguaFria River’s 2,700 square mile drainage basin is immediately east of the Hassayampa’s. The San Carlos Riverdrains the area east of Globe and empties into the San Carlos Reservoir above Coolidge Dam.
Groundwater resources are much more variable in the central highlands region of Arizona than in thebasin and range lowlands. In the eastern central highlands water for the Pinetop-Lakeside-Show Low area ispumped from the Pinetop-Lakeside aquifer. This aquifer has exhibited no significant decline in storage. Wellproduction rates there can exceed 300 gallons per minute. Some wells in the central part of Payson have experi-enced water-level declines of four to five and one-half feet per year. This aquifer appears to be drought sensitive.
The depth to groundwater in the Verde Valley is generally less than 800 feet and wells produce at ratesof 30 to 150 gallons per minute, but yields in some areas may exceed 1,000 gallons per minute. Water levels herehave shown no appreciable change. Depths to water in Sedona range from 180 to 1,000 feet. Wells produce anaverage of about 70 to 80 gallons per minute. Groundwater levels in the area appear to be declining at a rate of lessthan one foot per year.
The Prescott area straddles two sub-basins, the Little Chino Valley and the Upper Agua Fria basin. Thedepth to groundwater ranges from 60 feet in the northwestern part of the valley to 580 feet near Granite Dells.Pumping for irrigation water near the Town of Chino Valley dropped water levels as much as 75 feet between 1940and 1982. A decline in irrigated acreage and a switch to less water consumptive crops has reduced the rate ofdecline and even allowed water levels to rise in some portions of the valley, however water levels are generallycontinuing to decline. In the Upper Agua Fria basin depth to groundwater ranges from 25 feet near Humbolt to530 feet in Prescott Valley. Highly localized water-level declines in the Prescott Valley of over 100 feet have beenrecorded, however generally the declines, while ongoing, are considerably less than that.
MAJOR STREAMS, RECHARGE AND GROUNDWATER RESOURCES
193 Draft of 10/06/04
Because of its many small, fragmented and fairly shallow basins, quantities of water stored in the centralhighlands are small relative to the amounts in storage in the basin and range lowlands. The limited storagecapacity of some of the region’s aquifers makes them particularly dependent on regular, frequent precipitation inorder to remain productive while being pumped at high volume. The climatic sensitivity of some aquifers hasalready proven troublesome to a few communities in the central uplands and could prove to be an even moredifficult problem for these burgeoning towns to address in the future. The limited amounts of irrigated agriculture,chiefly in the Verde and Chino Valleys, have never played as big a role in the region’s groundwater developmentas the farming in the basin and range lowlands. This has saved the central highland’s groundwater resources fromthe tremendous overdrafts that depleted some of the lowland basins, but it also has given the highlands verylimited amounts of agricultural land to retire in order to offset the rising water needs of its many fast growingcommunities. Annual groundwater withdrawals in the central highlands are generally increasing, having reacheda high of 92,000 acre-feet in 1989, and probably considerably more than that since estimates were last made in1990.
Plateau Uplands
The Little Colorado River is the major drainage for the plateau uplands. The river’s headwaters drain thenortheastern part of the White Mountains. Irrigation diversions near Springerville, Snowflake and St. Johns,along with considerable channel losses, prevent surface flow from reaching the Colorado River in all but thewettest years. Major tributaries of the Little Colorado River are the Puerco River, Silver Creek, Chevelon Creek,Clear Creek and Moenkopi Wash. About 360,000 acre-feet of water are discharged out of the Little ColoradoRiver Basin annually. Most of this is discharged into the Colorado River, including 160,000 acre-feet of highlysaline water that issues from springs along the lower 13 miles of the Little Colorado River.
Chinle Creek drains water from the northern third of the Little Colorado River Plateau basin and delivers18,100 acre-feet of water annually to the San Juan River in Utah. The Paria River, which originates in south-central Utah, is perennial for its entire 25-mile length from the Utah border until it enters the Colorado River nearLees Ferry. It discharges an average of 21,450 acre-feet of water per year. Kanab Creek and the Virgin River arethe major streams of the Arizona Strip, that portion of the state to the north and west of the Grand Canyon. TheVirgin River has an average annual discharge of 174,6000 acre-feet. Nearly all of the streams on the CoconinoPlateau flow only in response to rainfall or snowmelt. Waters from the eastern third of the plateau empty into theLittle Colorado River. The central and western third of the plateau is drained by the ephemeral Cataract Creek,which then empties into Havasu Creek. The Colorado River receives an average of 47,000 acre-feet of waterannually from Havasu Creek.
Arizona’s upland plateau region is far larger than the central highland region, but groundwater resourcedevelopment is only slightly greater than it is in the highlands. Approximately 112,000 acre-feet of groundwaterwere withdrawn from the plateau region in 1989. Some portions of the upland plateau have virtually no economi-cally retrievable groundwater. Major population centers are few and widely dispersed. Due to short growingseasons, among other reasons, agriculture has only a limited presence in the region. Groundwater developmentson the Navajo and Hopi Reservations are for the most part limited to small wells for domestic and livestock use,although the Black Mesa Coal Mine is a significant industrial user of groundwater from one regional aquifer.
The Arizona Strip is composed of five groundwater basins: the Paria basin, the Kanab basin, the ShivwitsPlateau basin, the Virgin River basin and the Grand Wash basin. Because they are virtually empty of people, therehas been almost no groundwater development in the Paria, Shivwits Plateau and Grand Wash basins. About 2,000acre-feet of groundwater were withdrawn from the Kanab Plateau basin in 1985 to support the communities ofColorado City, Moccasin and Fredonia and to irrigate a few hundred acres of crops and pasture. This amountalmost certainly has climbed with Colorado City’s explosive growth. Alluvium along the washes in the ShortCreek-Cane Beds area proved to be the most productive aquifer, with yields of up to 200 gallons per minute. Inthe Arizona portion of the Virgin River basin 6,000 acre-feet of groundwater were withdrawn for irrigation in1990.
The Coconino Plateau basin lies in north-central Arizona, south of the Grand Canyon and to the north
MAJOR STREAMS, RECHARGE AND GROUNDWATER RESOURCES
194 Draft of 10/06/04
and west of Flagstaff. The basin’s two major settlements are the City of Williams and the Grand Canyon-Tusayanarea. Groundwater development has been negligible because of the great depth to and the limited yields of wellsin the basin. However, in the summer of 2003 the City of Williams began drilling a 4,000-foot well, the deepestmunicipal well in the Southwest, in response to the droughts effects on its surface reservoirs. A 3,000-foot wellnear Tusayan yields only 80 gallons per minute. In general, springs such as Blue Springs and Havasu Springs thatdrain into the Little Colorado and Colorado Rivers drain the basin’s potential aquifers. The Little Colorado RiverPlateau basin, at 27,300 square miles, is the state’s largest groundwater basin. The basin’s groundwater is con-tained by numerous, small local aquifers as well as three large regional aquifers. Streambed deposits of the LittleColorado River and its tributaries are important sources for domestic water supplies. However, the quality of waterfrom these aquifers varies considerably. The alluvial aquifer along the Puerco River has radiochemical contami-nation from the 1979 Church Rock uranium mine tailings pond spill. Downstream movement of these radionu-clides continues due to discharges from the sewage treatment plant in Gallup, New Mexico.
The three regional aquifers in the Little Colorado River Basin are known as the D-, N- and C- aquifers.The uppermost aquifer, the D-aquifer, extends for 3,125 square miles. Water from this aquifer is used for domesticsupplies in the north central parts of the basin where the other two regional aquifers are too deep. Because of itshigh concentrations of dissolved solids, water from this source is used only where no other water is available. Theintermediate-lying N-aquifer covers an area of 6,250 square miles. Water from this aquifer is suitable for mostuses. The N-aquifer is a source of water for the Navajo and Hopi Reservations as well as the Black Mesa CoalMine. The C-aquifer, at 21,655 square miles, is by far the most extensive aquifer and it underlies most of the LittleColorado River Basin. It is for the most part utilized only south of the Little Colorado River, as it is either toodeeply buried or has too high a concentration of dissolved solids north of the river. Flagstaff, Heber, Overgaard,Show Low, Snowflake and Concho use the C-aquifer. Although a few cones of depression are developing in areasof heavy pumpage in the D- and C-aquifers, they are still largely in a state of hydraulic equilibrium. Portions ofthe N-aquifer are showing decline due to heavy pumping for the contentious Black Mesa Coal Mine slurrypipeline, which carries coal to Southern California Edison Company’s Mohave Generating Station near BullheadCity. Some opponents of the slurry pipeline expect that the Station will close in 2005 when it must be retrofittedto meet more stringent clean-air standards.
MAJOR STREAMS, RECHARGE AND GROUNDWATER RESOURCES
195 Draft of 10/06/04
Appendix H
AGRICULTURE’S DIMINISHING ROLE IN ARIZONADAVID A. DE KOK
Agriculture has long been the primary developer and user of Arizona’s water resources. It was agriculture thatinstigated the construction of the Salt, Gila and Colorado River storage and diversion dams and it was agriculturethat first used large numbers of high capacity pumps to irrigate fields that were beyond the reach of canal-distributed river water. Groundwater use shot up from about one and a quarter million acre-feet per year in 1940,to about four and a half million acre-feet a year in 1960, before eventually reaching nearly six million acre-feet peryear in the mid-1970s. The tremendous increase in groundwater pumpage after World War II occurred as a directresult of the rapid spread of irrigated fields throughout Arizona’s farm belt, which was made possible by widelyavailable turbine pump technology.
Despite the feverish post-war expansion of irrigated agriculture in Arizona, the industry was losing itseconomic prominance as other economic sectors far outpaced it. Agriculture’s share of personal income fell from12.5 percent in 1940, to 7.3 percent in 1961, to 2.7 percent in 1970, to 1.9 percent in 1980, to 1.0 percent in 1990and finally to 0.5 percent in 2000. However, agriculture continues to be an important component of the economyin many of the state’s more rural areas. Farm income constitutes 9.7 percent of personal income in Yuma County,6.9 percent of personal income in La Paz County and 5.3 percent of personal income in Pinal County. In boomingMaricopa County, where farm income is second only to that of Yuma County, agriculture makes up only a quarterof one percent of all personal income.
Over the last two decades Arizona’s agricultural economy has not only been battling the nationwidephenomenon of shrinking agricultural profit margins but also has been losing ground, literally, to urban en-croachment, particularly in Maricopa County where crop acreage has fallen by some 50 percent, more than aquarter million acres. The post-war growth and decline of the state’s cropped acreage can be tracked in Table H.1.Irrigated agriculture reached its greatest extent in Pima County in 1958 and in Maricopa County in 1960.Farming continued to expand throughout the rest of the state for another decade and a half, reaching a statewidezenith of 1,429,210 harvested acres in 1976. Arizona’s harvested acreage dropped rapidly in the late 1970s andearly 1980s as high-energy prices and falling water tables and purchase and retirement of farm lands by citiescombined to rein in groundwater-irrigated fields.
Although crop agriculture has exhibited a fairly steady statewide decline since the mid-1970s, thepattern has not been consistent across all counties. In Cochise County, where the combination of falling watertables, high energy costs and low commodity hit farmers particularly hard, crop acreage plummeted from 133,150acres in 1976 to just 32,000 acres by 1990. Crop acreage there has since rebounded modestly to 42,500 acres in2000. Crop acreage in Yuma County fell from nearly 300,000 acres in 1980 to just over 175,000 acres in 1985. Ithas been steadily growing since then and reached nearly 225,000 acres by 2000.
Crop acreage in Pinal County has yo-yoed from 284,270 acres in 1980, to 192,405 acres in 1985, to 227,970 acresin 1995 before dropping to 181,175 acres in 2000. Urban encroachment is beginning to claim an increasing shareof Pinal County farmlands as fields near Casa Grande, Florence and Eloy are being readied for future subdivisions.There is little reason to think that this pattern of urban encroachment, which began in the vicinity of Phoenix inthe 1960s, will not continue to claim farm fields throughout Pinal County and perhaps eventually down the GilaValley towards Yuma. In a reversal of the old rural fears that city dwellers would buy up water rights and ship waterto the cities, urbanization is in many areas migrating to the farm fields. Although this conversion from farm tosuburb usually lessens the total water demand appurtenant to that land, it also hardens that demand, as urban wateruse cannot be allowed to go “fallow” during a drought. This loss of water management elasticity is one of thegrowing perils of our state’s burgeoning population.
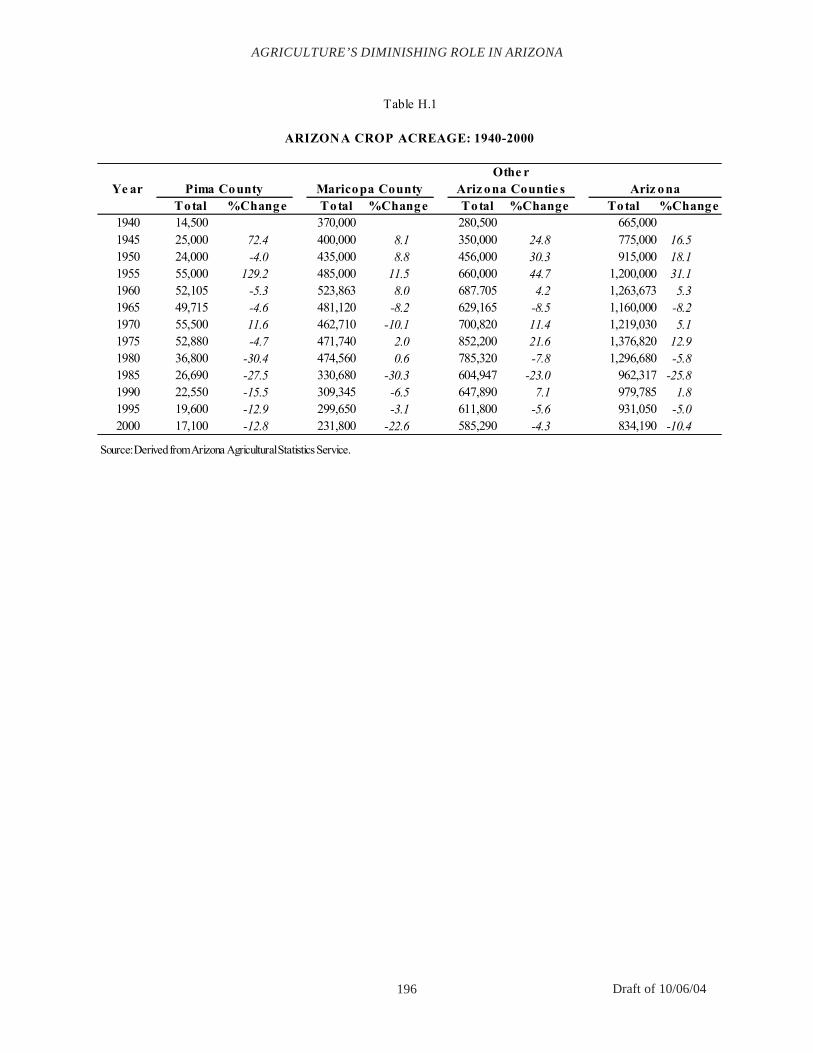
196 Draft of 10/06/04
AGRICULTURE’S DIMINISHING ROLE IN ARIZONA
Table H.1
ARIZONA CROP ACREAGE: 1940-2000
Othe rYe ar Pima County Maricopa County Ariz ona Countie s Ariz ona
Total %Change Total %Change Total %Change Total %Change1940 14,500 370,000 280,500 665,000 1945 25,000 72.4 400,000 8.1 350,000 24.8 775,000 16.51950 24,000 -4.0 435,000 8.8 456,000 30.3 915,000 18.11955 55,000 129.2 485,000 11.5 660,000 44.7 1,200,000 31.11960 52,105 -5.3 523,863 8.0 687.705 4.2 1,263,673 5.31965 49,715 -4.6 481,120 -8.2 629,165 -8.5 1,160,000 -8.21970 55,500 11.6 462,710 -10.1 700,820 11.4 1,219,030 5.11975 52,880 -4.7 471,740 2.0 852,200 21.6 1,376,820 12.91980 36,800 -30.4 474,560 0.6 785,320 -7.8 1,296,680 -5.81985 26,690 -27.5 330,680 -30.3 604,947 -23.0 962,317 -25.81990 22,550 -15.5 309,345 -6.5 647,890 7.1 979,785 1.81995 19,600 -12.9 299,650 -3.1 611,800 -5.6 931,050 -5.02000 17,100 -12.8 231,800 -22.6 585,290 -4.3 834,190 -10.4
Source: Derived from Arizona Agricultural Statistics Service.
197 Draft of 10/06/04
Appendix I
WATERS ALONG THE BORDER WITH MEXICODAVID A. DE KOK
The San Pedro River
The San Pedro River, which has its headwaters near the Sonoran mining city of Cananea, flows northwardand, after crossing the international border just south of Palominas, continues another 140 miles northwestwardbefore it joins the Gila River. The river is ephemeral along most of its reach, flowing only in response to localrainfall. The San Pedro has a perennial stretch of about 18 miles between Hereford and a point just south ofFairbank.
The Upper San Pedro Basin, which is bounded to the west by the Huachuca, Mustang, Whetstone andRincon Mountains and to the east by the Mule, Dragoon, Little Dragoon and Winchester Mountains, has twointerconnected aquifers: a regional aquifer composed of alluvial basin-fill and a floodplain aquifer of alluviumfrom the San Pedro Rivers channel. The total amount of water stored in these two aquifers of the Upper San PedroBasin is estimated to be 59 million acre-feet. The regional aquifer is the main source of supply for Sierra Vista andFort Huachuca. Precipitation that occurs along the mountain fronts is the most significant source of recharge ofthe regional aquifer.
The floodplain aquifer, which spans the San Pedro’s floodplain, ranges in depth from 40 to 150 feet andis very permeable, with well yields of 200 to 1,800 gallons per minute. It is this aquifer that is the main source ofsupply for most of the irrigated fields in the region. The streambed alluvium is primarily recharged from surface-water infiltration; however, it also receives water from the regional aquifer, underflow from Mexico and percola-tion from irrigation return flows and runoff water. Because of the floodplain aquifers reliance on surface-waterflows, water levels fluctuate seasonally, rising slightly in the spring and summer and declining in the fall andwinter.
The amount of groundwater recharged into the Upper San Pedro Basin aquifer is thought to total about30,000 acre-feet per year. Of this total, approximately 75 percent comes from Mexico as underflow and surfaceflow. Mexico is not bound by treaty to deliver any set amount of water from the San Pedro River to the UnitedStates. Agricultural water use in the Mexican portion of the Upper San Pedro amounts to about 14,000 acre-feetannually. Cananea, a city of about 35,000, uses nearly 6,300 acre-feet of water a year. The copper mine atCananea was pumping 12,500 acre-feet a year in 1999. Although Cananea and Naco have not grown at the samepace as other northern Sonoran towns, there is little likelihood that they will maintain their current size and waterdemand. The mines at Cananea pump groundwater for use in several mining processes and then discharge theresulting wastewater outside the San Pedro River Basin and into the south-flowing Rio de Sonora River Basin.This unquantified regional outflow obviously lessens the amount of water flowing north into Arizona.
Not all of the water reaching Arizona from Mexico in the San Pedro River Basin is of high quality. In1977 and 1978 tailing pond spillages at the Cananea copper mine repeatedly contaminated San Pedro Riversurface water with concentrations of copper, iron, manganese and zinc. There were smaller reoccurrences of thesespillages in the 1980s. Since the mid-1980s there also have been repeated instances of spillage from sewageponds at Naco, Sonora, dumping raw sewage into Greenbush Draw that empties into the San Pedro. Livestock andother farming operations also have led to increased nitrate levels in the San Pedro River.
The population of Sierra Vista, which was 32,983 in 1990, was estimated to have grown to 40,430 in2003. Pumping from the regional aquifer to supply Sierra Vista and Fort Huachuca has created a cone of depres-sion, or a lowering of the water table, in the location of the main well fields. There were approximately 12,700acres of irrigated land in the Upper San Pedro in 1990, but these fields were primarily irrigated by wells in thefloodplain aquifer. The amount of irrigated land in the Upper San Pedro Basin has since dropped due to the 1988
198 Draft of 10/06/04
creation of the San Pedro Riparian National Conservation Area (RNCA). The Act creating the Conservation Areaalso created an explicit federal reserved right to enough water to fulfill the purposes of the Area. The San PedroRNCA, which was the first RNCA, was created to protect and enhance the riparian areas and associated resources,and the aquatic, wildlife, archaeological, paleontological, scientific, cultural, recreational, educational, scenicand other resources and values.
The difficulty for Sierra Vista and Fort Huachuca was that the growing cone of depression beneath theirwell fields was threatening to eventually intersect the floodplain aquifer. This could potentially begin to drainthis aquifer, which would likely dewater a portion of the San Pedro River’s perennial flow. To counter this threatto the San Pedro RNCA the City of Sierra Vista has constructed the Sierra Vista Wastewater Recharge Project. Theintent is to create an underground wall of water between the RNCA floodplain aquifer and the City well field’scone of depression.
An additional concern beyond the overdraft of groundwater (which was just over 10,000 acre-feet in1990) is the Gila River Indian Community’s claims to the San Pedro Sub-basin water. Because the Communitydraws its water from the Gila River downstream from the Upper San Pedro River Basin, they contend that theBasin’s waters are part of the supply for their reservation. This matter should be clarified through the ArizonaWater Settlement Act now under consideration in Congress.
Concern about the overdraft of groundwater in the Upper San Pedro River Basin has been growing fordecades. In the 1960s, the Central Arizona Project (CAP) was envisioned to bring Colorado River water to the SanPedro via a pipeline from Tucson. Water was to be stored in a reservoir created by a dam to be built on the river atCharleston. The CAP pipeline idea was revived in 1994, when Interior Secretary Bruce Babbitt ordered a study onbuilding a pipeline from the end of the CAP aqueduct in Tucson to Sierra Vista. The idea again surfaced inNovember 2003 in an editorial in the Arizona Daily Star, where Mr. Babbitt championed the idea of delivering15,000 acre-feet of CAP water to Sierra Vista. The cost of the proposed $71 million to $95 million pipeline wouldbe bourn, at least in part, by the federal government to assure the continued existence of Fort Huachuca.
At about the same time as the most recent appearance of the CAP pipeline concept, another idea to savethe San Pedro’s surface flows came to light. This would involve pumping water from the abandoned mines underTombstone and using it to help the San Pedro River. The total quantity of water available and the effects of minepumping on the City of Tombstone’s water wells are unknown. Additional questions about the efficacy of themine pumping proposal include the extent that the mine water would have to be treated to bring it up to federalstandards, the cost of pumping from the 400 to 500 foot depth of the mines, the effect that dewatering of the mineswould have on the structural integrity of the timber support posts in the mines once they were exposed to air, thepossibility of subsidence caused by the pumping and the possibility of an existing hydrologic connectionbetween the mine’s aquifer and the River, which might make the pumping counterproductive.
Although the Upper San Pedro River Basin has enormous groundwater reserves that could sustain thecurrent overdraft for centuries, continued overpumping poses a very real threat to the river’s perennial flow andthe tremendous biodiversity, especially bird-life, which relies upon it. To meet this threat the Upper San PedroPartnership was formed to bring together the region’s various stakeholders to suggest ways in which waterresources can be managed. The group has set a goal of ending the groundwater overdraft by 2011. Given thatnearly 23,000 acre-feet of the surface and groundwater that replenishes the Upper San Pedro comes from Mexico,which has no legal obligation to maintain that continuing supply, and given that some proponents are pushing forFort Huachuca to double its size with the addition of new operations drawn from the next round of base closures,the Partnership faces a great challenge in achieving its goals. A new organization, the San Pedro BinationalWatershed Alliance, which is composed of the Partnership and several municipal, Sonoran and federal entitiesfrom Mexico, may ease concerns about the continuing flow of the San Pedro. The Alliance hopes to establish abinational, holistic, ecosystem-based approach to natural resources conservation and environmental planning.
The Santa Cruz River
The Santa Cruz River crosses the international border twice, first flowing into Mexico from Arizona’sSan Raphael Valley two miles east of Lochiel and then flowing into the United States five and a half miles east of
WATERS ALONG THE BORDER WITH MEXICO
199 Draft of 10/06/04
Nogales. Between the two crossing points the river flows for 32 miles through Mexico. The permeable portion ofthe basin near the border is only about 300 feet thick at its greatest extent, greatly limiting the aquifer that suppliesAmbos Nogales with water.
The basin-fill sediments near Nogales are divided into three aquifers: the younger alluvium, the olderalluvium and the Nogales formation. The younger alluvium is the most widely used and productive of theaquifers, with well yields up to a thousand gallons per minute. There is a hydraulic connection between surfaceflows and this aquifer. Groundwater levels decline and recover in association with river flows or their absence.The surface water flows of the Santa Cruz River are extremely variable, ranging from just a few hundred acre-feetsome years to 88,000 acre-feet in 1979. The mean surface flow near the international border since 1935 is 19,110acre-feet and the median is 14,283 acre-feet. The recent drought has greatly limited the replenishing surface flows,to just 628 acre-feet in 2002 and 936 acre-feet in 2003.
The older alluvium stores a considerable amount of water, but is a poor transmitter of water to wells. Wellyields in the older alluvium seldom surpass 30 gallons per minute and, consequently, this aquifer has not beenwidely tapped. The far deeper Nogales formation has poor water bearing characteristics and has not been widelydeveloped. The few productive wells generally yield less than 30 gallons per minute.
Although the two communities of Ambos Nogales share a common watershed and a wastewater collec-tion and treatment system, their water supply and distribution systems are nearly independent of each other. Theshared groundwater basin and the topographical gradient have guided the development of the fresh water andwastewater systems, but the international line separating the communities has repeatedly complicated the build-ing and maintenance of this infrastructure. A shared distribution system existed until 1911, when the City ofNogales, Arizona purchased the system and used public funds to install a well in the Santa Cruz River and expandthe Arizona side of the distribution system. Thereafter, Nogales, Sonora was left to eventually develop its ownwater supply system, which it did in 1940.
Nogales, Arizona also led the way in the development of a sewer system. By the end of World War IIvirtually all of the City’s residents and businesses were served by this system. However, Nogales, Sonora still didnot have a sewer system in place and instead relied on cesspools and outhouses. The Mexican health departmentbegan developing plans for a sewer system in the early 1940s, but the Nogales Wash topography dictated that atreatment plant and its sewage outfall line would have to be located across the border in the United States.Eventually, the International Boundary and Water Commission (IBWC) persuaded the U.S. Congress to fund ajoint treatment plant. The first international wastewater treatment facility for Ambos Nogales was completed in1951.
Flooding is another problem common to the two communities of Ambos Nogales. Major floods sweptAmbos Nogales in 1905, 1909, 1914, 1915, 1926 and 1930. The 1930 flood took five lives, caused much propertydamage and spurred Arizona’s Senator Carl Hayden to get the two federal governments to design and build a jointflood control project. The IBWC built the system in the 1930s and the 1940s. The flood control system currentlyconsists of two covered channels and additional lined open canals.
Nogales, Arizona is entirely dependent upon groundwater for its fresh water needs. The water supply anddistribution system is owned and operated by the City of Nogales. Two main well fields, the Potrero Wash andSanta Cruz fields, feed the system and provide an adequate supply of fresh water for the City’s current needs;however each field’s future productivity is to some extent threatened. A cone of depression has developed aroundthe Potrero Wash well field and water table levels there fell over 20 feet below the level of the surrounding watertable between 1982 and 1995. Additionally, a small plume of poor quality water developed in northern Nogales,which curtailed the City’s pumpage from one of its major production wells. Plans are under way to clean thecontaminated water to potable water quality standards and deliver the treated water to the nearby Palo Duro GolfCourse. The threats to the Santa Cruz well field may occur over a longer time period but be more consequential.Nogales, Sonora is undertaking an upgrade of its water system, which is likely to reduce inflows to Nogales,Arizona’s well fields.
WATERS ALONG THE BORDER WITH MEXICO
200 Draft of 10/06/04
The water pumped from the Potrero and Santa Cruz well fields is chlorinated on-site and then movedthrough the delivery system to the City’s four main storage reservoirs whose combined capacity is nearly fivemillion gallons. The City supplied 4,290 acre-feet of water to 18,975 people in 1995. The water usage rate was202 gallons per capita per day (GPCD). This high rate of per capita usage stems from several causes. On a dailybasis 30,000 people cross the international border from Nogales, Sonora into the City of Nogales. Additionalvisitors arrive from the north via Interstate 19. None of these daily visitors are counted as part of the service areapopulation when calculating Nogales GPCD. Additionally, the City’s water system suffers from a high volume ofunaccounted water losses. It was estimated that in 1990, ten percent of water usage was lost through leakage in thedelivery system, and an additional ten percent went unrecorded either through unmetered or under-metereddeliveries.
Almost 50 percent of the City’s water is delivered to single-family residences, 24 percent of the watergoes to commercial users and about 13 percent is used by apartment dwellers. The Nogales Water Department alsostill supplies some water to Nogales, Sonora customers through four separate water mains, two of which are amongthe water department’s 50 largest customers. Because the level of water consumption by these account owners islarger than would be expected given the nature of their businesses, it is assumed that some of the water is beingused for other purposes or by other users.
Aside from the four above-mentioned water lines, the Nogales, Sonora fresh water delivery system isentirely separate from the Nogales, Arizona system. However, because of the shared watershed and topography,the maintenance, operation and plans for the Sonoran water system have a direct effect on the Nogales, Arizonasystem. The underlying water problem in Nogales, Sonora is the lack of a sound distribution system. The Nogales,Sonora water system gets 15 percent of its water from wells in the Nogales Wash, 45 percent from wells in the SantaCruz River and 40 percent from wells in the Los Alisos River watershed.
About 36 percent of the Nogales, Sonora population is not connected to the water supply system. Theseresidents must haul their own water or buy it from large water trucks, or pipas. The pipas are usually filled fromwells within Nogales Wash, which are very drought sensitive and frequently run low in the early summer. In thesummers of both 2002 and 2003, Nogales, Arizona provided a temporary water line to help keep the pipas on theirappointed rounds. Connection to the water supply system, however does not guarantee a steady supply of water.In the summertime, even some affluent neighborhoods must put up with water shortages, which means water isrationed and available only a few hours a day. It is estimated that average water usage in Nogales, Sonora onlyamounts to between 40 and 60 GPCD. The relatively wide range of the estimate is due to the uncertainty about theNogales, Sonora population. The official population estimate for the year 2000 was 213,784, but many knowl-edgeable observers think 350,000 might be closer to the reality. Nogales, Sonora currently consumes 18,500 acre-feet of water a year.
In order to deal with this water crisis, Nogales, Sonora has embarked on a $39 million plan to meet theshortfall and prepare for the continued rapid rate of growth. The plan proposes to increase pumpage along theSanta Cruz River from 6,300 acre-feet per year to 15,200 acre-feet per year. The projected Mexican pumpagewould then represent about 75 percent of the long-term annual flow in the Santa Cruz River at the internationalborder. This could have a severe impact on Nogales, Arizona’s Santa Cruz well field, both increasing pumpingcosts from a much-lowered water table and exposing the well field to greater susceptibility to drought. Mexicandewatering of the Upper Santa Cruz River basin could limit the ability of Nogales, Arizona to accommodate futuregrowth. There currently is no international agreement to guarantee that there is water in the Santa Cruz Riverwhen it reaches Arizona. However, the Arizona Department of Water Resources and the IBWC are engaged in ahydrologic modeling effort so as to understand the relationship between pumpage and flows in the binationalUpper Santa Cruz basin.
As has been discussed, Nogales, Arizona and Nogales, Sonora share a single wastewater treatment plant.The first joint facility went into operation in September 1951, sixteen years after it was authorized. The plantquickly became overwhelmed, with raw sewage being bypassed during 1960.
After considerable negotiation, the Mexican government agreed in 1967 to join with the United States in
WATERS ALONG THE BORDER WITH MEXICO

201 Draft of 10/06/04
constructing a new, larger Nogales International Wastewater Treatment Plant (NIWWTP) nine miles north of theborder near Rio Rico at the confluence of the Nogales Wash and the Santa Cruz River. The new plant beganoperating in 1972. By 1982 the plants daily capacity was once again being regularly exceeded and about 60percent of its influent was coming from Sonora. After more negotiations an expansion of the plant was begun in1989. The constant struggle to keep the capacity of the NIWWTP ahead of, or at least not too far behind, the areaspopulation growth has been just one of the difficulties facing the Ambos Nogales wastewater system.
The specter of disease outbreaks has been the driving force behind the communities’ improvements totheir wastewater systems. In the summer of 1990, monsoon rains broke numerous sewer lines all over Nogales,Sonora. The resulting contamination of Nogales Wash was linked to 42 cases of hepatitis A among residentsclustered around the Wash. Cholera has been found in the Wash and a February 1991 test turned up the poliovirus. It is estimated that 14 to 21 percent of the Nogales, Sonora population faces health risks due to sewer linebreaks.
Despite a large operating budget and expanded capacity, the NIWWTP has repeatedly had difficultymeeting water quality standards. High inflow into the plant has occasionally forced the release of wastewaterbefore treatment has been completed. This has caused the plant to be cited for excessive levels of suspendedsediments in its effluent. In addition, the NIWWTP has been cited for excessive levels of phenols, cyanide andmercury. The plant is not designed to remove these chemicals that most likely come from the Mexican maquiladoras.The only way to remove these chemicals from the effluent is to prevent them from entering the sewage system inthe first place. The lack of an industrial pretreatment program in Nogales, Sonora is another of the systemsinadequacies.
The treated outflow from the NIWWTP flows through the Santa Cruz River channel for about 14 milesbefore it completely infiltrates into the riverbed near Tubac. Despite the intermittently high pollution levels ofthe river at its confluence with Nogales Wash, the river manages to cleanse itself as it flows to Tubac and isperiodically diluted with fresh rainwater runoff. The effluent discharges from the NIWWTP have stabilized thewater table along this section of the Santa Cruz River and have helped to maintain one of the few healthy ripariangallery forests left in Arizona.
Nogales, Sonora has rights to a portion of the NIWWTP effluent equal to its influent contribution, whichis now about two-thirds of the total output. The international treaty between the United States and Mexico allowsSonora to retain or reduce the amount of influent at any time and also allows it to transport the treated effluentback to Mexico at any time. Although Nogales, Sonora currently has no means to make use of its share of effluent,it has developed a plan to construct a wastewater treatment plant of its own in Los Alisos, as well as pump stationsto convey sewage to the new plant. To address its water supply shortfall, the Mexican government plans torecharge effluent into its own well fields. The current expectation is that Mexico would continue to send the sameamount of influent to the NIWWTP as it now does, and that the new Los Alisos Plant would serve the portion of theNogales, Sonora metropolitan area south of the Nogales Wash Basin boundary. However, if the Los Alisos plantwere to treat some of the effluent from the Nogales Wash Basin and recharge into the Los Alisos Basin, it would belost to the Santa Cruz River system forever, since the Los Alisos Basin is a tributary to the Magdalena River inMexico.
WATERS ALONG THE BORDER WITH MEXICO

202 Draft of 10/06/04
WATERS ALONG THE BORDER WITH MEXICO
203 Draft of 10/06/04
Appendix J
SHOULD YUMA DESALTER OPERATE? VARIED, COMPLEXISSUES ARE RAISED
SHARON MEGDAL, PH.D.
In May, I visited the Yuma Desalting Plant, which has recently been the focus of much attention. Whetheror not the plant is operated has implications for water deliveries to Mexico under U.S. treaty obligations and isimportant to Central Arizona. It is also important to those concerned about the Cienega de Santa Clara environ-mental habitat. My visit was very informative.
The U.S. Bureau of Reclamation built the plant to address the high salinity of tail water from the Wellton-Mohawk Irrigation District. About 100,000 acre feet of irrigation water applied to district land but unused bycrops was flowing back to the Colorado River. Its very high salt content raised concerns about the water. To meetthe requirements of Minute 242 of the 1944 treaty with Mexico, the treatment plant was built to remove the saltfrom the Wellton-Mohawk tail water. To keep the salty water from flowing into the Colorado River while the plantwas under design and construction, Reclamation built a 53-miles bypass canal. This canal diverted the water tothe Santa Clara Slough in Mexico.
The bypass canal was built as an interim measure prior to the plant becoming operational. Completed in1992, the plant operated only for a short period in 1993. It was shut down due to operational issues. Also, excessColorado River flows met water obligations to Mexico without operating the plant.
Over the years the Santa Clara Slough, now known as the Cienega de Santa Clara, has benefited from this“bypass” water. In recognition of the important habitat of the Cienega and surrounding area, the Mexican govern-ment declared the region a Mexican National Biosphere. There is significant interest in keeping the Wellton-Mohawk tail water flowing to the Cienega. But, at the same time, the water was intended to be used to meet the U.S.obligation to deliver 1.5 million acre feet of water to Mexico annually. During wet years, meeting this obligationhas not been of concern. In times of drought, however, every drop of water counts, and the water deliveries to theCienega do not count toward meeting the U.S. obligation. Many Arizona water interests are concerned that thefederal obligation to deliver 1.5 million acre feet of water annually to Mexico be satisfied without causingdisproportionately adverse effects to Arizona.
What started out as a water quality issue has essentially become a water quantity matter. With droughtconditions persisting, storage along the Colorado River is at very low levels. If Wellton-Mohawk water is nottreated for delivery to Mexico, that water has to come from elsewhere. Recently, the water has come from storageat Lake Mead. If river supplies, including amounts in storage, are short, Central Arizona Project deliveries are thefirst to be cut, as the CAP holds the most junior rights to the river. The worst case scenario: The entire 1.5 million-acre-feet CAP entitlement would be cut before others with Colorado River allocations experience cutbacks. Thisis why the Central Arizona Water Conservation District, the operators of the CAP, have been advocating operationof the Yuma Desalting Plant.
Water issues are complex. And the question of whether or not to run the Yuma Desalting Plant is noexception. There are multiple implications to consider, including environmental and economic. The U.S. Bureauof Reclamation, with responsibility for operating the Yuma Desalting Plant and managing the Colorado Rivergenerally, is considering its options. Governor Napolitano, who recently visited the plant, and others in Arizonaare likewise evaluating alternatives. Scrutiny of the complicated modeling of the Colorado River scenarioscontinues. Significant uncertainties are involved. We know there will be shortages. Their frequency and severityover the next 100 years will determine the impacts on the region served by CAP and the Colorado River watershedmore generally. If CAP experiences a cutback, users of non-Indian agricultural water will be the first to be cut back
204 Draft of 10/06/04
within the Arizona system.
These users of CAP water have rights to use groundwater, but their ability to do so depends on thecondition of their well delivery systems, and there could be significant cost implications associated with the re-substitution of groundwater for surface water. The Arizona Water Banking Authority has been storing water onbehalf of CAP municipal water users for several years. So, the impact of any future municipal supply cutbacks willdepend on their cumulative size relative to the amount of water stored by the bank. If agriculture returned togroundwater and municipal water users began drawing upon stored water, water tables throughout Central Ari-zona would obviously be affected
What are the costs and benefits of running the Yuma Desalting Plant to treat the tail water from theWellton-Mohawk Irrigation District? A lot of effort is going into identifying alternatives, including land fallow-ing in Arizona. Everything depends upon projections and assumptions. The answer to the question is difficult toprovide but must be pursued.
Visiting the plant and the adjacent national water treatment research center helped me realize that theYuma Desalting Plant is an asset, not the “white elephant” it has been called. It can be operated, if not to treat theirrigation tail water, then to treat water for other purposes, such as delivery of Colorado River water to municipali-ties in Arizona and/or in Mexico.
Yes, issues related to operating the plant are complex. Their resolution will likely require not onlycareful analysis but compromise and flexibility.
Note: Good background papers on the Yuma Desalting Plant are “The Yuma Desalinization Plant: ArizonaPerspectives,” by Tom Carr, Arizona Department of Water Resources (August 2002) and “Dealing with theColorado River’s Salinity: What is the Future of the Yuma Desalting Plant?” by Sue McClurg, Water EducationFoundation (Winter 2003-2004).
Originally published in May-June 2004 “Arizona Water Resource,” a newsletter of the University of Arizona’sWater Resources Research Center
SHOULD YUMA DESALTER OPERATE? VARIED, COMPLEX ISSUES ARE RAISED
205 Draft of 10/06/04
Appendix K
GOVERNOR’S WATER MANAGEMENT COMMISSIONEXECUTIVE SUMMARY
DECEMBER 2001
The December 2001 Final Report of the Governor’s Water Management Commission (Commission)completes a two and a half-year examination of the Groundwater Code (Code) and water quantity management inArizona’s Active Management Areas (AMA). The Commission concludes that the goals and legal framework ofthe Code are sound and as such should continue to guide water management decisions and investments in theAMAs. Further, the Commission endorses the statutory management goal of each individual AMA, recognizing asappropriate their differing hydrologic and political characteristics.
The Final Report briefly describes the issue identification efforts of the Commission’s Technical Advi-sory Committee (TAC) and the five individual AMA Task Forces that preceded the appointment of the Commis-sion. It also details the Governor’s charge to the Commission, the activities of the Commission, and the approxi-mately 50 individual recommendations the Commission is forwarding to the Governor.
Governor Jane Dee Hull appointed the 49-member Commission in June 2000 to review the 21–year-oldGroundwater Management Act and recommend changes–if necessary–to ensure that the five Active ManagementAreas within the State continue to maintain a reliable, sustainable water supply to meet current and future needs.Specifically, the Governor charged the Commission to:
1. “Evaluate progress toward meeting the goals of the 1980 Groundwater Management Act and the man-agement goals of each of the five Active Management Areas to assure that the goals are appropriate andachievable.”
2. “Evaluate mechanisms to reduce the use of mined groundwater, increase the utilization of renewablewater supplies and most efficiently meet the water needs in the Active Management Areas.”
3. “Evaluate whether changes are needed in statutes, rules, or policies to improve the effectiveness of watermanagement in the Active Management Areas at the state and local levels of government.”
The Commission held 18 public meetings and two weekend retreats, also open to the public. Addition-ally, 300 meetings with extensive public involvement were held by Commission subcommittees and work groupsand by the TAC and AMA Task Forces. The issues for Commission consideration were presented in a series ofseven issue papers developed by the individual AMA Task Forces and the 33-member TAC. The initial issuesincluded: continued groundwater pumping by existing right holders as well as new industrial users and the impactof this pumping on achieving the management goals; how to address sub-area or critical area conditions; prolif-eration and concentration of small capacity exempt wells; utilization of renewable supplies; concerns about theCentral Arizona Groundwater Replenishment District (CAGRD); and long-term water supply reliability.
The Commission, after extensive debate, achieved consensus on approximately 50 recommendations forpublic review. A series of public Open Houses were held in each AMA the first week of October 2001 to solicitpublic comments. These comments were used to further refine the recommendations and in late October 2001, theCommission adopted their conclusions and the final package of recommendations for the Governor to consider.
The Commission recognizes that although groundwater mining has not been eliminated, water users, inresponse to the goals and requirements set forth in the Code, have significantly reduced groundwater mining inthree of the five AMAs since the 1980s. However, current data indicate the Phoenix, Prescott and Tucson AMAsmay not reach their goal of safe-yield by 2025. The actions recommended by the Commission, which include anumber of statutory changes, are focused on fine-tuning aspects of the Code and other activities. These actionswill assist in further reducing groundwater mining and will maintain the stability and certainty necessary for
206 Draft of 10/06/04
investments in water supplies, delivery infrastructure and efficiency improvements which are vital to Arizona’sfuture.
The Commission recommendations will: increase the utilization of renewable supplies to help ensuresustainability; address allowable pumping to reduce groundwater mining; protect ecologically significant habi-tats; and enhance water resources planning and technical assistance. The major recommendations are summarizedbelow in the seven categories established by the Commission. The full set of recommendations is covered in detailin Section V of the Commission’s Final Report.
A. Renewable Supplies – Utilization of renewable supplies has increased over the past 20 years, facili-tated by the construction of surface water treatment plants and the completion of the Central Arizona Project(CAP) allowing the use of Colorado River water either directly or indirectly through artificial recharge andrecovery projects. The Commission addressed issues related to the utilization of renewable supplies in all AMAs.These issues included: 1) how to maximize the use of available renewable supplies until currently unused CAPwater is fully utilized by municipal, industrial and Indian entities; 2) how to ensure that regulatory programs andinstitutions promote efficient storage and use of renewable supplies; 3) how to facilitate cooperative efforts tofinance infrastructure; 4) how to define the long-term role of the Central Arizona Groundwater ReplenishmentDistrict (CAGRD); and 5) how to ensure the long-term adequacy of renewable supplies to achieve a sustainablewater supply.
Recommendations include authorizing enabling legislation for a multi-jurisdictional infrastructure fi-nancing authority to issue revenue bonds or use other financing alternatives intended for financing multi-juris-dictional water infrastructure projects that benefit a specified geographic area.
The Commission is also recommending changes to the authority and responsibilities of the CAGRD. TheCAGRD is an entity that currently uses excess CAP water to replenish mined groundwater on behalf of certainsubdivisions or water providers in the Phoenix, Pinal and Tucson AMAs for assured water supply purposes. Twoof the most significant changes recommended are a requirement for the CAGRD to establish a replenishmentreserve to help secure water supplies for CAGRD members and an enrollment fee for new subdivisions. This“reserve” would take advantage of currently available CAP supplies to store sufficient water to meet 20 years ofdemand for CAGRD members.
The Commission also made a number of general recommendations in the category of Renewable Sup-plies that do not specify statutory or rules changes, but which are intended to encourage actions outside of theCommission process.
B. Allowable Groundwater Pumping - While a number of major water users within the AMAs have become lessreliant on groundwater, other existing right holders and even new users continue to rely on groundwater. Issuesaddressed by the Commission include: 1) the continued pumping of groundwater pursuant to legitimate with-drawal authorities allowed under the Code, described as “holes in the bucket”, which are projected to negativelyeffect the ability to achieve AMA management goals; and 2) the localized impacts that may be created bygroundwater withdrawals. Recommendations developed to address these issues include: 1) new well permittingand impact requirements; 2) a “mined groundwater tax” for existing municipal and industrial groundwater users;3) an obligation for new municipal and industrial groundwater users to utilize renewable supplies or replenishtheir mined groundwater with renewable supplies; and 4) changes to the exempt well statutes.
The Commission considered and then proposed a recommendation that would limit certain new wellsfrom being drilled within “designated riparian area protection zones” located within the AMAs. These zones areproposed to be legislatively delineated on a map and are based on a 1/2 mile buffer adjacent to specified streamsegments or cienegas within an AMA. The limitations apply not only to non-exempt wells, but exempt wells (awell with a pump capacity of 35 gallons per minute or less). Aside from this recommendation being limited to newwells in an AMA, several other exclusions apply including: 1) replacement wells; 2) stock watering wells; and 3)exempt wells used for domestic purposes and proposed to pump less than two acre-feet per year. There are alsoprovisions that allow certain categories of users to get waivers if a demonstration of hardship or non-impact on the
GOVERNOR’S WATER MANAGEMENT COMMISSION EXECUTIVE SUMMARY
207 Draft of 10/06/04
designated riparian area can be made.
The Commission is also recommending changes that would eliminate or reduce groundwater mining bycertain municipal and industrial water users within the AMAs. (Designated water providers and members of theCAGRD are not included in this recommendation, as they are subject to the Assured Water Supply Rules.) First,the recommendation requires certain existing municipal and industrial water users (who currently have no obliga-tion to use renewable supplies) to pay a phased-in “Mined Groundwater Tax.” This tax would be used to replacea portion of the mined groundwater or to fund water-planning activities aimed at finding a mechanism to reducereliance on mined groundwater. Second, certain new municipal and industrial water users would be required tomake use of renewable supplies or replenish all of their mined groundwater over a period of time. This would alsoresult in a statutory expansion of the CAGRD’s current authority and allow the CAGRD to enroll industrialcustomers as well as municipal customers who predate or are not required to comply with the Assured WaterSupply Rules. Finally, the recommendation eliminates issuance of certain new groundwater permits or rightswithout a full replenishment obligation after 2025 (2040 in Pinal AMA). This last proposal applies in all AMAs;however, provisions for Pinal, Prescott and Santa Cruz recognize the unique conditions within these areas.Additionally, certain users are exempted from this recommendation including agricultural users, metal miningoperations and untreated water providers.
The Commission is also recommending changes to the exempt well statutes. These changes only applywithin the AMAs. The first proposal would require that new exempt wells be limited to a pump capacity of 20gallons per minute (a reduction from the current 35 gallons per minute); however, up to 35 gallons per minutecould be requested based on a demonstrated need for a higher flow rate. A second set of proposals relates to exemptwells that are within the service area of (or affected by) a water provider or other groundwater withdrawal author-ity. Within a municipal provider service area, new exempt wells would not be permitted without a denial of servicefrom the provider. Another provision would limit the ability of existing exempt well owners to prevent the drillingof new non-exempt wells (using more than 35 gallons per minute) and would eliminate the ability for a newexempt well owner to protest impacts from a subsequent new non-exempt well.
C. Environment & Economic - The Commission recognized that environmental concerns were not addressed inthe 1980 Groundwater Code. A number of proposals to protect the environment were presented and discussed. Thefollowing recommendations address some of the water needs of environmental habitats within the State. First, theCommission recommends the establishment of zones around specified and legislatively adopted riparian areas forprotection from new groundwater withdrawals, within the AMAs. This recommendation is directly linked to thediscussion above under the Allowable Groundwater Pumping category.
The Commission is also recommending several statutory changes to increase funding and responsibili-ties of the Arizona Water Protection Fund.
D. Conservation – ADWR establishes “conservation requirements” for agricultural, industrial, and municipalwater users within the AMAs. Issues raised included the role and effectiveness of conservation efforts in achievingthe goals of each AMA and potential improvements for the current programs.
The recommendation in this category is for the Governor to initiate creation of a nonprofit cooperativeassociation to serve Arizona’s need for effective water conservation, education and research throughout the State.
E. Management Goals – The Commission concluded that the management goals were appropriate in each of theAMAs; however, the Commission also recognized the unique needs of the Pinal, Prescott, and Santa Cruz AMAs.As such, the Commission recommends local water users and the Department of Water Resources continue to worktogether to develop new programs to achieve the management goals in these AMAs.
F. Water Resources Planning - The Commission recognizes the need for better data and long range planning inthe AMAs and throughout Arizona. Specifically the Commission recommends: 1) continued support for fundingthe current Rural Watershed Initiative; 2) initiation of discussions between stakeholders from throughout Arizonato develop and fund a planning process for addressing the state’s future water demands; and 3) preparation of a
GOVERNOR’S WATER MANAGEMENT COMMISSION EXECUTIVE SUMMARY
208 Draft of 10/06/04
periodic report on hydrologic conditions and progress towards meeting the goals of each AMA, and a separatebiennial summary report of conditions in the AMAs to the Legislature.
G. Costs Of Water Management Programs - The Commission recognizes that some of the 50 recommendationsthey are forwarding to the Governor will create additional work for the Arizona Department of Water Resourcesand water users throughout the state. The Commission recommends the Governor and the legislature considermechanisms to ensure the Department of Water Resources has sufficient resources to carry out programs recom-mended by the Commission, to maintain current programs and to provide timely and quality technical assistanceand water management planning for the State of Arizona.
Arizonans, by working together on water resources, have already achieved enormous gains in our effortto manage this vital resource effectively. The Commission is confident that implementing the package of recom-mendations we are forwarding to the Governor will maintain and enhance Arizona’s water management efforts.
GOVERNOR’S WATER MANAGEMENT COMMISSION EXECUTIVE SUMMARY
209 Draft of 10/06/04
Appendix L
AMA MANDATORY CONSERVATION REQUIREMENTS
Mandatory, enforceable conservation requirements are specified in the AMA Management Plans for theagricultural, industrial and municipal water use sectors.
Agriculture
In general, water use for irrigated agriculture is limited through the establishment of maximum annualgroundwater allotments for each irrigation-grandfathered right. These allotments are based on acreage and cropsgrown between 1975 and 1980, multiplied by the water requirements of those crops and assuming maximumconservation efficiency. Alternatively, agricultural water users now have the option to apply for a “best manage-ment practices program,” implementing measures designed to reduce overall water use and increase irrigationefficiencies. In addition to these volumetric limitations, there is a prohibition on new irrigated agriculturalacreage within the AMAs.
Industry
Industrial water use is defined as a non-irrigation (non-agricultural) use of water not supplied by a city,town or private water company, including animal industry use and expanded animal industry use. Industrial waterusers include: (1) turf facilities (schools, parks, golf courses, home owner associations and lakes over ten acres insize), (2) sand and gravel facilities, (3) metal mining facilities, (4) large-scale power plants, (5) large-scale coolingfacilities, (6) dairy operations and (7) cattle feedlot operations. These industrial rights are generally regulatedwith annual volumetric groundwater allotments, but the management plans also require the use of specific conser-vation technologies in particular industries such as metal mining and sand and gravel.
Municipal
The GMA requires municipal water users (cities, towns, private water companies and irrigation districtsthat supply water for non-irrigation uses) to develop programs that result in reasonable reductions in per capitause. These reductions are based on a gallons per capita per day rate for customers within the service areas of themunicipal providers that serve more than 500 people or use more than 100 acre-feet of water per year. The gallonper capita per day rate is converted to an annual volume for each water provider, allowing the water provider todevelop its own conservation program and measures that will achieve the targeted reduction set by the State. Themeasures that have been employed by municipal water providers to meet the state targets include conservationoriented rate structures, landscaping and plumbing ordinances, and education, incentive and water audit pro-grams. Municipal providers that qualify for an AWS also have the option to apply for a “best managementpractices” type of program.
No other states have comprehensive groundwater conservation programs that are as rigorous as those within theAMAs, though some states do have drought-related measures that are more stringent.

210 Draft of 10/06/04
AMA MANDATORY CONSERVATION REQUIREMENTS
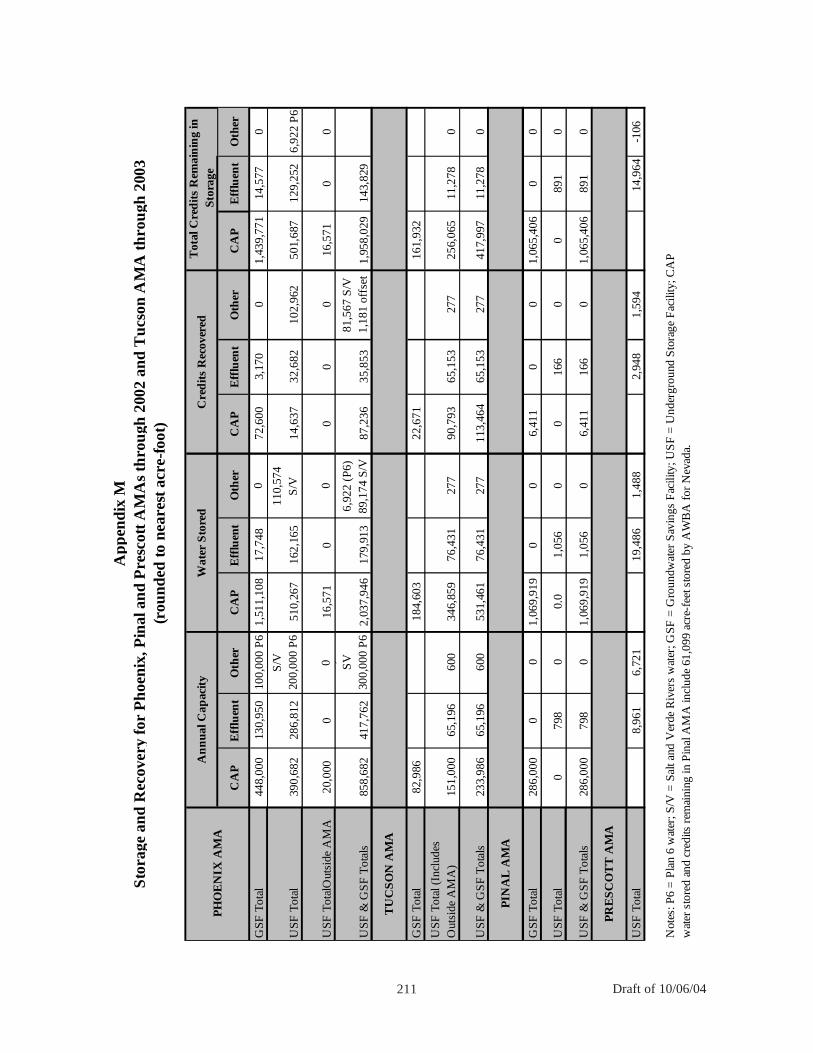
211 Draft of 10/06/04
CA
PE
fflu
ent
Oth
erC
AP
Eff
luen
tO
ther
CA
PE
fflu
ent
Oth
erC
AP
Eff
luen
tO
ther
448,
000
130,
950
100,
000
P6
1,51
1,10
817
,748
072
,600
3,17
00
1,43
9,77
114
,577
0
390,
682
286,
812
S/V
20
0,00
0 P
651
0,26
716
2,16
5
110,
574
S/V
14,6
3732
,682
102,
962
501,
687
129,
252
6,92
2 P
6
20,0
000
016
,571
00
00
016
,571
00
858,
682
417,
762
, SV
30
0,00
0 P
62,
037,
946
179,
913
6,92
2 (P
6)89
,174
S/V
87,2
3635
,853
81,5
67 S
/V
1,18
1 of
fset
1,95
8,02
914
3,82
9
82,9
8618
4,60
322
,671
161,
932
151,
000
65,1
9660
034
6,85
976
,431
277
90,7
9365
,153
277
256,
065
11,2
780
233,
986
65,1
9660
053
1,46
176
,431
277
113,
464
65,1
5327
741
7,99
711
,278
0
286,
000
00
1,06
9,91
90
06,
411
00
1,06
5,40
60
0
079
80
0.0
1,05
60
016
60
089
10
286,
000
798
01,
069,
919
1,05
60
6,41
116
60
1,06
5,40
689
10
8,96
16,
721
19,4
861,
488
2,94
81,
594
14,9
64-1
06
Not
es: P
6 =
Pla
n 6
wat
er; S
/V =
Sal
t and
Ver
de R
iver
s w
ater
; GS
F =
Gro
undw
ater
Sav
ings
Fac
ility
; US
F =
Und
ergr
ound
Sto
rage
Fac
ility
; CA
P
wat
er s
tore
d an
d cr
edits
rem
aini
ng in
Pin
al A
MA
incl
ude
61,0
99 a
cre-
feet
sto
red
by A
WB
A f
or N
evad
a.
App
endi
x M
Sto
rage
and
Rec
over
y fo
r P
hoen
ix, P
inal
and
Pre
scot
t AM
As
thro
ugh
2002
and
Tuc
son
AM
A th
roug
h 20
03(r
ound
ed to
nea
rest
acr
e-fo
ot)
US
F &
GS
F T
otal
s
US
F T
otal
Out
side
AM
A
Tot
al C
red
its
Rem
ain
ing
in
Stor
age
GS
F T
otal
US
F T
otal
PH
OE
NIX
AM
AA
nn
ual C
apac
ity
Wat
er S
tore
d
Cre
dit
s R
ecov
ered
GS
F T
otal
US
F T
otal
(In
clud
es
Out
side
AM
A)
US
F &
GS
F T
otal
s
TU
CS
ON
AM
A
GS
F T
otal
US
F T
otal
PIN
AL
AM
A
US
F T
otal
US
F &
GS
F T
otal
s
PR
ES
CO
TT
AM
A

212 Draft of 10/06/04
STORAGE AND RECOVERY FOR -AMAs
213 Draft of 10/06/04
Appendix N
COUNTY EFFORTS TO COORDINATE LAND USE PLANSWITH WATER SUPPLIES
In spite of the limited authorities available to counties, efforts have been made to coordinate land useplans with water supplies. Some examples include:
• In the Golden Valley area of Mohave County, 22 square miles were down-planned in part to preservewater supplies and to establish lot-splitting limits. Mohave County will approve power plants only ifthey use “dry cooling” technology when the aquifer is threatened by depletion or subsidence. TheCounty also has added to its water conservation element a goal that seeks water supplies in perpetuity.
• In the Empirita Ranch area of Pima County, because of water availability concerns, the land acquisitionagreement included pumping limits on groundwater to protect Cienega Creek and reduced housingdensities were included in the Comprehensive Plan.
• Santa Cruz County has a rural planning zone that recommends limits on new development and a ruralzoning pattern to sustain limited groundwater resources.
• Yavapai County has included reduced densities in the Comprehensive Plan in response to water supplyconcerns.
Though most of Pima County is within an AMA and as with other AMAs, issues related to riparianprotection are not specifically addressed in state law or the management plans. Pima County has identified anumber of regional plan policies that are intended to reduce risk to riparian areas, including (Pima County, 2002):
• limiting pumping near shallow groundwater by using land use controls and the purchase of developmentand water rights;
• maximizing the use of CAP and effluent and limiting specific water uses;
• limiting rezonings outside of the CAP and effluent water delivery areas and providing incentives tolandowners;
• using CAP and effluent for riparian restoration;
• limiting turf water use through a golf course water ordinance;
• minimizing human impact to aquatic and riparian ecosystems by development, roads and trails; andencouraging land use decisions that maintain the function and quality of watercourses.

214 Draft of 10/06/04
COUNTY EFFORTS TO COORDINATE LAND USE PLANS WITH WATER SUPPLIES
215 Draft of 10/06/04
Appendix 0
GROWING SMARTER LEGISLATION REQUIRINGA WATER RESOURCES ELEMENT
(excerpted)
9-461.05. General plans; authority; scope
D. For cities and towns having a population of more than two thousand five hundred persons but less than tenthousand persons and whose population growth rate exceeded an average of two per cent per year for the ten yearperiod before the most recent United States decennial census and for cities and towns having a population of tenthousand or more persons according to the most recent United States decennial census, the general plan shallinclude, and for other cities and towns the general plan may include:
5. A water resources element that addresses:
(a) The known legally and physically available surface water, groundwater and effluent supplies.(b) The demand for water that will result from future growth projected in the general plan, added to existing uses.(c) An analysis of how the demand for water that will result from future growth projected in the general plan willbe served by the water supplies identified in subdivision (a) of this paragraph or a plan to obtain additionalnecessary water supplies.
F. The water resources element of the general plan does not require:
1. New independent hydrogeologic studies.2. The city or town to be a water service provider.
11-821. County plans; definitions
C. In addition to the other matters that are required or authorized under this section and article 1 of this chapter, forcounties having a population of more than one hundred twenty-five thousand persons according to the mostrecent United States decennial census, the county plan shall include, and for other counties the county plan mayinclude:
3. Planning for water resources that addresses:
(a) The known legally and physically available surface water, groundwater and effluent supplies.(b) The demand for water that will result from future growth projected in the county plan, added to existing uses.(c) An analysis of how the demand for water that will result from future growth projected in the comprehensiveplan will be served by the water supplies identified in subdivision (a) of this paragraph or a plan to obtainadditional necessary water supplies.
E. The water resources element of the comprehensive plan does not require:1. New independent hydrogeologic studies.2. The county to be a water service provider.

216 Draft of 10/06/04
GROWING SMARTER LEGISLATION REQUIRING A WATER RESOURCES ELEMENT
217 Draft of 10/06/04
APPENDIX P
INDIAN WATER RIGHT SETTLEMENTS
BONNIE G. COLBY
Ak-Chin Water SettlementThe 21,840-acre Ak-Chin Reservation was established in 1912 and is located in the midst of a productive
agricultural area in south central Arizona. Prior to completion of the Central Arizona Project (CAP), neighboringirrigators, as well as the Ak-Chin Indian Community, were wholly dependent on groundwater for irrigation anddomestic purposes. By the 1960s, the Indian community was irrigating approximately 10,000 acres with ground-water pumped from depths of 40 to 50 feet. Due to the success of the tribal farming enterprise, the Indian commu-nity had achieved near economic self-sufficiency. Extensive off-reservation pumping nearby caused sharp de-clines (approximately 20 feet per year) in groundwater levels beneath the reservation and the Indian community’sirrigated acreage declined from 10,000 to less than 5,000 acres.
The Indian community asked the United States in 1976 to file suit against non-Indian pumpers on behalfof the community. In recognition of its trust responsibility to provide the Ak-Chin with a reliable water supply, thefederal government entered into negotiations with the community to settle its water claims. The State of Arizonaand local non-Indian water users supported this approach.
After two years of negotiations and before a lawsuit was filed, the Department of the Interior reached anagreement with the Indian community. The settlement provided for both an interim water supply to meet theemergency needs of the Indian community and a permanent water supply within 25 years. The settlement envi-sioned developing a well field on nearby federal land to provide the interim supply. Under the act, the federalgovernment would be liable for the replacement cost of the water if it failed to meet the delivery obligations.
While the federal administration was supportive of the Ak-Chin’s claim to water, it was concerned aboutoverall cost and federal liability, in light of the uncertain nature of the water supply. Despite these concerns, thesettlement was passed by Congress and signed by President Carter in 1978. Although enjoying the support of theState of Arizona and local water users, this first settlement was opposed by most other western states. Senator BarryGoldwater and Representative John Rhodes were influential in securing the Ak-Chin settlement.
The settlement was amended in 1984 when the anticipated water supplies proved insufficient and toocostly. The revised agreement, negotiated with the active involvement of Senator Goldwater and RepresentativesMorris Udall and John McCain, provided for the federal government to pay damages for failure to make timelydelivery of the interim water supply and modified the funding and delivery schedules for the permanent watersupply. The federal government provided the community with $15 million to meet interim water needs, contrib-uted other economic development grants and loan forgiveness worth $28.7 million and moved the permanentsupply deadline up to 1988. In exchange, the Indian community relieved the federal government of its responsi-bility to provide an interim water supply and agreed to an overall reduction in its permanent water entitlement.Under the revised settlement, the community receives 75,000 acre-feet of water in normal years, as little as 72,000acre-feet in dry years and up to 85,000 acre-feet in wet years.
The water supply was secured by reallocating 50,000 acre-feet per year of Colorado River water from theYuma Mesa Division of the Gila Project to the Ak-Chin Indian Community. This water, which is delivered to thecommunity through the CAP canal, was an unused portion of a 300,000 acre-feet allocation available to the YumaMesa Division under contracts entered into according to the Boulder Canyon Project Act of 1928. The transferredColorado River water retains its priority date, a priority superior to that of the CAP, making the entitlement senior
218 Draft of 10/06/04
by Arizona standards.
The federal government provided the Yuma Mesa Division with a $9.4 million grant for improvementsand conservation measures and to forgive federal loan obligations worth approximately $17.8 million in ex-change for transferring 50,000 acre-feet of its CAP allocation. The balance of the Community’s water entitlementis provided from the Ak-Chin’s 58,300 acre-feet CAP allocation. The portion of these supplies not needed to meetthe obligations of the settlement is to be re-allocated on an interim basis to the CAP, potentially making addi-tional water available to central and southern Arizona water users. This latter provision makes excess Ak-Chinwater available for future Indian water settlements in Arizona. Arizona’s agricultural community argues that theywere promised any excess water. This proved to be a contentious issue in the San Carlos Apache Tribe settlement,which relies on this source of water to satisfy tribal entitlements.
The federal government bears the entire financial obligation under this settlement and also is responsiblefor the replacement cost of any water that it fails to deliver to the community. The federal Office of Managementand the Budget has strenuously opposed federal liability for damages in more recent Indian water settlements andnow also insists on reasonable local contributions.
The original settlement did not provide for off-reservation leasing of any portion of the Indiancommunity’s entitlement, due to strong opposition to the principle of off-reservation marketing by the State,western governors, local irrigators and other non-Indian interests. In 1992, fourteen years after the originallegislation’s enactment, Congress passed a bill, supported by the State of Arizona, the Indian community andlocal water users, that amends the settlement to allow off-reservation leasing of portions of the water entitlementin select areas of the state.
In an innovative agreement, the Ak-Chin leased part of their water right under a 100-year contract to alarge Arizona developer. By increasing their water efficiency through drip irrigation and computer monitoringsystems, the community was able to lease 10,000 acre-feet annually to provide the 100-year assured water supplyto the Del Webb Corporation for a planned community of 40,000 people north of Phoenix.
In addition, the Arizona Department of Water Resources (ADWR) promulgated a new rule to specificallyaccommodate transactions like the Ak-Chin–Del Webb deal. Under current Arizona law, a developer needs a 100-year perpetual assured water supply before its development can be approved. Conversely, most tribal settlementsrestrict tribal water leasing to contracts not exceeding 100 years. Thus, if a developer leases 100 years of waterfrom a tribe to meet its assured supply, the developer must find replacement water for the last years of the 100-yearperiod. Under the new rule, developers and tribes may renew 100-year leases each year to satisfy the state require-ment of 100-year assured supplies. The new ADWR rule gives flexibility to providers using Colorado River orCAP water leased from an Arizona Indian community to meet their assured water supply requirements. If the leasedwater initially satisfies the 100-year assured supply requirement, the department will wait until the fiftieth year toreview the developer’s assured supply certificate. At that time, the developer must show evidence of activenegotiations with the tribe to renew the lease. To ensure security to customers, tribal leased water can account foronly 15 percent or less of the provider’s total water supply.
The Ak-Chin Water Settlement of 1978 was among the first Indian water right disputes resolved througha legislative settlement. This settlement has several interesting features:
• The original settlement agreement was between the United States and the Ak-Chin Indian Communityand did not involve the State of Arizona or local water users directly.
• This is one of only two Indian water settlements passed by Congress in which the federal governmentbears the entire financial burden.
• Imported surface water supplies were used to satisfy the Community’s entitlement.
INDIAN WATER RIGHT SETTLEMENTS
219 Draft of 10/06/04
• The Ak-Chin settlement had to be amended in 1984, six years after its enactment and further amended in1992, illustrating the difficulty of achieving finality on these complex issues.
The active involvement of key members of Arizona’s congressional delegation, who held leadership positions inCongress, greatly assisted in the formulation and passage of this settlement and amendments.
Salt River Pima-Maricopa Indian Community Water Settlement
The Salt River Pima-Maricopa Indian Community Water Settlement addresses water disputes that haveexisted between the Indian Community and other water users in the Salt River Valley for more than 110 years. Thisagreement illustrates the increasing complexity of Arizona settlements. Only a few of the significant aspects of thesettlement are discussed here.
• These disputes involved the water supplies and water delivery arrangements of two Indian Communities,seven Phoenix area cities and towns and three irrigation districts.
• The settlement relies on intricate arrangements for water transfers and exchanges, leasebacks, contractmodifications and ratifications and modified storage rights to satisfy the Community’s water entitle-ment.
• Determining an equitable measure of the local cost share posed a major obstacle in obtaining federalapproval for the bill.
Pima and Maricopa Indians irrigated land along the Gila River in central Arizona prior to the arrival ofSpanish explorers. During the mid-1800s, immigrants, miners, and the United States army relied on these tribes formuch of their food and hay supplies. In order to protect these lands from encroachment by non-Indians, the GilaRiver Indian Reservation was established in 1859. Beginning in 1868, upstream diversions by non-Indiansdepleted much of the water supply available to the reservation. During the 1870s, Pima and Maricopa Indians insearch of more dependable water supplies began migrating from the Gila River Reservation to cultivate landsalong the Salt River. By 1879, the Indians had brought about 3,400 acres under cultivation. In order to protectthese Indians from further displacement by non-Indians, some of whom were attempting to homestead on theIndian’s improved lands, the Salt River Pima-Maricopa Indian Reservation was created by Executive Order in1879.
In 1905 a suit was filed in state court to determine the priority and ownership of water rights in the SaltRiver Valley in preparation for completion of the Salt River Project (SRP), an early Bureau of Reclamation projectwhich serves Phoenix area farms and cities. The federal government filed claims on behalf of the Salt River Pima-Maricopa Indian Community on the basis of its prior appropriation rights under state law. The United States filedno claims for reserved water rights, even though the Supreme Court’s landmark Winters case had been decided in1908. The resulting Kent Decree, issued by the court in 1910, awarded the Salt River Indian Community 18,766acre-feet per year of the natural flow of the Salt and Verde Rivers. The Indian community’s repeated appeals tohave the United States reopen the Kent Decree were unsuccessful.
The water supply problems of the Indian community were compounded when it was excluded fromreceiving storage water from the SRP. In 1935, the Secretary of the Interior and the SRP agreed to build BartlettDam on the Verde River, in part to provide 20,000 acre-feet annually to the Salt River Reservation. The BartlettDam agreement provides a complex accounting system to allocate the storage rights behind the dam. WhenBartlett Dam was operated with other SRP reservoirs, this accounting system worked to the disadvantage of theIndian Community, effectively reducing its water storage credits.
For many years the Indian community protested the water entitlement it received under both the KentDecree and the Bartlett Dam agreement. By the early 1980s the community had initiated a series of lawsuitsagainst the federal government, the SRP and local cities and irrigation districts. Concurrent efforts to negotiate
INDIAN WATER RIGHT SETTLEMENTS
220 Draft of 10/06/04
failed to yield an acceptable compromise. In the 1980s, when the Community was joined in the Gila RiverAdjudication, the United States claimed a total of 202,000 acre-feet annually on behalf of the Community.
Because these lawsuits threatened key water delivery arrangements for irrigators and for the Phoenixmetropolitan area, non-Indians had a strong incentive to seek a negotiated settlement, rather than await theuncertain outcome of litigation. Negotiations resumed in 1985, with the added incentive of developing a cost-sharing plan to speed completion of the CAP. The overall cost of the settlement and how it was to be distributedamong the federal government, the Indian community and local water users emerged as a critical issue that shapedthe character of the final agreement. After more than two years of intensive negotiations, a local settlement wasreached in 1988 and ratified by Congress later that same year.
The settlement entitles the Indian Community to a maximum of 122,400 acre-feet annually (4.5 acre-feetper acre water duty applied to the 27,200 irrigable acres on the reservation). The water is to be provided from acombination of sources, including
• firming up existing rights under the Kent Decree and Bartlett Dam agreement,
• a series of exchanges involving CAP and non-CAP Colorado River water,
• Salt and Verde River water, and
• groundwater pumped from beneath the reservation.
In addition, a trust fund was established to enable the Community to rehabilitate, further develop, and maintain itsirrigation systems and to put the settlement water to beneficial use.
The settlement relies upon complex transfers, leases and exchanges to provide water for the IndianCommunity and to protect existing non-Indian water users. For instance, the settlement requires the cities toprovide the Indian Community with 20,000 acre-feet annually of Salt and Verde River water available through theSRP. In exchange, the Secretary of the Interior will provide the cities with 22,000 acre-feet per year of pre-CAPpriority Colorado River water. The settlement provided that the Colorado River water could be made availablefrom the Wellton-Mohawk Irrigation and Drainage District (WMIDD) near Yuma, even though WMIDD is not aparty to the settlement. In exchange, WMIDD received certain benefits from the federal government. Anotherprovision of the act authorizes the Community to lease its entire 13,300 acre-feet per year CAP allocation to localcities for 99 years for $16 million. This leasing provision is the only exception to the settlement’s blanketprohibition on marketing or using the community’s entitlement off-reservation. Surrounding non-Indian waterusers are limited in their groundwater use by the Groundwater Management Act (GMA). The tribe may pump38,000 acre-feet annually from groundwater wells, but groundwater use restrictions could become more stringentin the future if the East Salt River sub-basin is no longer in “safe yield,” as determined by ADWR.
The overall goals of these arrangements were to satisfy the Community’s entitlement with native ground-water and surface flows, to minimize the impact of the settlement on existing non-Indian water users and toprovide the cities with renewable surface supplies. In addition to protecting existing water supplies, a major goalof local non-Indians in this settlement was to preserve and affirm existing water delivery agreements.
Local cities negotiated lease contracts with the Community for the CAP water. Phoenix contracted backin the late 1980s to begin taking their leased portion of the Community’s water in 2001. In exchange, the City ofPhoenix provided the Community a one-time lump-sum payment of approximately $1,200 per acre-foot. One ofthe important features of the lease is that the water retains its Indian priority and character. This means that whenPhoenix orders the water, the city is not obliged to pay the CAP capital repayment cost it would if it were orderingthe water as “the city.” In addition, in times of shortage, the water retains its Indian priority date.
Congress has made necessary appropriations for settlement implementation. The settlement has beenapproved by the court presiding over the Gila River general stream adjudication and will be incorporated in the
INDIAN WATER RIGHT SETTLEMENTS
221 Draft of 10/06/04
final decree of that adjudication. Implementation of this settlement is proceeding smoothly.
Zuni Heaven SettlementThe Pueblo of Zuni reservation is located in northwestern New Mexico, near the four-corners region
where Arizona, New Mexico, Utah and Colorado join. From time immemorial, the Zuni Tribe has made a pilgrim-age to Kothluwala:wa, or “Zuni Heaven.” Zuni Heaven is a relatively flat and marshy riparian area of the LittleColorado River, approximately three miles downstream of the Zion Reservoir near Hunt Valley, Arizona. Formany centuries selected members of the Zuni Tribe have trekked by foot or horseback over 110 miles to performreligious ceremonies for two days during the summer solstice period every four years. In 1877, the land thatcomprised Zuni Heaven was lost to the tribe as a result of an executive order. In 1984, Congress passed a law toreacquire lands around the religious site in northeastern Arizona as well as permanent rights of ingress and egress.Recently, the tribe purchased other lands needed for the restoration of the area in fee simple.
Though the Zuni reacquired the land, Zuni Heaven was much altered due to the construction of the ZionDam in 1920. The dam trapped sediment in the reservoir so outflows scoured the channel of the Little ColoradoRiver to the extent that the river abandoned its historical floodplain and caused rapid destruction of the surround-ing wetlands that supported watercress, cottonwoods and willows. Groundwater pumping by nearby non-Indiansexacerbated the destruction by draining the artesian springs. Finally, the introduction of non-native plants liketamarisks, along with cattle grazing, further damaged the Zuni religious site.
Under the 1984 congressional act and subsequent 1990 legislation, the Zuni are funded to coordinatewith the Bureau of Reclamation, the Environmental Protection Agency and the Arizona Water Protection Fund todevelop a program to restore the wetlands. The legislation establishes the Zuni Indian Resource DevelopmentTrust Fund and provides an appropriation of $25 million to aid in the restoration plan. Further, the act declarescertain private lands in Arizona to be Zuni Indian Reservation. According to the legislative history, the lands wereredesignated as reservation because “extensive damageS to the trust lands within the Zuni Indian Reservationhave occurred, including severe land erosion, loss of timber and minerals, spoliation of archaeological sites, andloss of the use of water; . . . these damages have occurred, in part, by reasons of acts and omissions of the UnitedStates in breach of its trust responsibility” (Zuni Claims Settlement Act, 1990).
Further, to successfully ensure proper habitat restoration, the Zuni acquired a couple of large ranchesupstream from the Heaven. Though few water rights were associated with the purchase of the ranches, the Zunineed this land to facilitate the volume of water delivery necessary to properly irrigate the critical restoration areas.Some parties to the settlement objected to the Zuni putting such fee lands into trust. Eventually, the talks focusedon allowing a small corridor of land along the Little Colorado River to go into trust, with the rest remaining in feeunless Congress passed legislation authorizing the trust status.
Water quality was another important issue. Some parties to the negotiations wanted the tribe to waivewater quality damages, i.e., waive the right to sue for a certain quality of the tribe’s entire decreed right. The tribewas willing to waive claims beyond a level of “natural water quality,” or reasonable rises and falls of water qualitydue to currently practiced circumstances. The tribe was not willing to waive claims to damages that result from theintroduction of a hazardous substance into the water supply.
In the later stages of the negotiation, the parties proposed to enable the tribe to purchase water rightssurrounding the Zuni Heaven land in order to retire those rights from use. Though the tribe asserts a PracticablyIrrigable Acreage-type claim for the fertile area, the dominant focus of the four-year settlement negotiation was forwater to restore the religious spot as an “oasis.” Non-Indian reliance on groundwater pumping altered the naturalhydrologic conditions so that springs no longer irrigate the area. The cornerstone of the negotiated settlement isa voluntary exchange of water rights so the Zuni may use mostly surface water to irrigate the land to its originalwetland habitat. The parties agreed to allow the Zuni Tribe, or the United States on its behalf, to purchase up to3,600 acre-feet of rights from willing upstream sellers in the Norviel Decree Area, with the rights retaining theNorviel Decree priority date. Once these rights are severed and transferred for the benefit of the tribe, state law willno longer apply and the tribe may use the water in any way it deems appropriate on the reservation.
INDIAN WATER RIGHT SETTLEMENTS
222 Draft of 10/06/04
In addition, the parties agreed not to object to Zuni pumping of up to 1,500 acre-feet per year ofgroundwater on-reservation to supplement the surface water irrigation. The groundwater will be used to ensureconstant saturation of the most critical religious habitat, even in drought or shortage years. Further, two largeutility companies with operations in the area developed “non-interference” groundwater compacts with the tribe.SRP agreed not to pump groundwater south of a specified area, and Tucson Electric Power agreed not to movetheir groundwater pumping operation any closer to the Little Colorado River than its current site. Finally, smaller,private parties to the settlement, who are located within an area critical to the restoration habitat, agreed to limittheir groundwater pumping to a rate below 500 gallons per minute. These agreements are “Pumping ProtectionAgreements” that effectively create buffer zones surrounding the reservation that require limited or no use ofgroundwater by non-Indians in that area.
Some parties in the settlement maintained that the Zuni Heaven deal had to be included in an overallLittle Colorado River settlement. Though the Zuni Heaven portion of the Little Colorado River talks is minutecompared to the claims, issues and price tags of other interests, the Zuni lands represent a significant piece ofleverage with which other Native Americans would like to bargain, due to their close proximity to powerful utilityinterests. In addition, the federal government has multiple, and sometimes competing, trust obligations in theLittle Colorado River negotiation and must make sure a binding and favorable agreement for one tribe does notunduly prejudice another trust beneficiary. While there was some resistance to the Zuni Heaven settlement beingintroduced as a stand-alone piece of legislation, all local parties eventually signed off on the settlement agree-ment.
Senator Jon Kyl, accompanied by Senator John McCain, introduced the Zuni Indian Tribe Water RightsSettlement Act of 2002 in July of the 107th Congress. The bill is an agreement with the tribe, the United States, theState of Arizona and major water users in the area of the tribe’s religious lands in northeastern Arizona. Thesettlement provides the tribe with necessary resources to acquire lands around the religious site from willingsellers to restore the wetland environment that previously existed. In exchange for this settlement, the tribe waivesits rights and claims it may have in the pending Little Colorado River Adjudication. The bill was reported fromcommittee to the Senate in October 2002 after changes were made over concern about the water quality waiverprovisions and the United States’ liability as sovereign and trustee, right-of-way access across tribal trust land andsovereign immunity and removal issues. The bill passed Congress and was signed into law by President Bush onJune 23, 2003.
Southern Arizona Water Rights Settlement
Achieving a legislatively approved settlement is not an end in itself but an important milepost on theway to settlement implementation. No settlement can anticipate all the problems that will arise in the future. Sincenegotiators had little experience to guide them, some of the earlier pioneering agreements were incomplete or haddeficiencies or problems that must be reconsidered. The Southern Arizona Water Rights Settlement Act (SAWRSA)is one example.
The Tohono O’odham Nation located near Tucson historically has used groundwater to irrigate the cropsof its agriculture-based culture. In the late 1970s, groundwater depletion began to make farming on the reserva-tion increasingly expensive and difficult. To resolve the tense situation between thirsty Tucson and the tribes, thefederal government promised a “firm delivery” of imported surface water and reclaimed municipal effluent in theSouthern Arizona Water Rights Settlement. As a condition to receiving their entitlement, the tribe agreed to limitgroundwater pumping beneath the San Xavier Reservation to 10,000 acre-feet annually and to the existingpumped quantity below the Schuk Toak Reservation. The tribes have the right to off-reservation marketing oftheir groundwater entitlement, as long as it is marketed within the Tucson Active Management Area (AMA). Inaddition, the federal government is liable for damages in the amount of replacement costs if it fails to make its“firm delivery” quantity. The settlement also authorized the federal government to construct and operate deliverysystems on and off the reservations to enable the Nation to put their entitlements to beneficial use. Additionally,SAWRSA uses a three-way deal with the City of Tucson so the Secretary of the Interior can use the city’s effluentto satisfy the nation’s entitlement.
INDIAN WATER RIGHT SETTLEMENTS
223 Draft of 10/06/04
Further amendments to SAWRSA are currently included in the proposed Gila River Basin settlement.The proposed SAWRSA amendments have many provisions. The proposed amendments would oblige the Secre-tary of the Interior to deliver 37,800 acre- feet of agriculturally suitable water annually to the San Xavier andSchuk Toak Districts of the Nation, as well as another 28,200 acre-feet annually of non-Indian agricultural prioritywater from the main project works of the CAP. As a condition of its water delivery, the proposed amendmentrequires that the Nation limit the quantity of groundwater withdrawals by non-exempt wells beneath the reserva-tion districts. The Nation must also allocate as the “first right of beneficial consumptive use” a certain amount ofits water to groundwater storage, instream flows and riparian and vegetation habitat. The Nation will enact andmaintain a comprehensive water code to manage and establish permit requirements for the water resources of theNation. Significantly, this code must be specifically sensitive to the Nation’s allottees and must include specificpermitting and judicial review processes for allottee applications.
The 1982 SAWRSA provided that the City of Tucson would deliver about 22,000 acre-feet per year ofeffluent to the federal government to assist the United States in meeting its total obligation to the tribe. The Nationhas declined to use effluent for its agricultural needs, so the Department of the Interior looked for ways the federalgovernment could recharge the effluent in exchange for state groundwater credits or CAP water delivery. Theproposed SAWRSA amendments include a mechanism for the federal government to receive groundwater or CAPcredits from the state for recharging Tucson’s effluent so the Nation may use or save such credits. These amend-ments to SAWRSA will allow the Nation to receive groundwater credits for certain recharge and storage acts andfor the retiring of their grandfathered well rights. Like their non-Indian neighbors, the Nation would like todevelop these flex credits under the GMA code to have the groundwater for its future use or value. A significantchange in the 2000 act allows the Nation to market its waters within the three-county CAP service area, not just theTucson AMA.
The SAWRSA amendments within the proposed Gila River settlement also are designed to settle litiga-tion by Nation allottees that arose from the 1982 settlement as well as adjust some of the old restrictions on theNation’s water usage. Tribal allottees contend that they had only token representation in the 1982 negotiationsand dispute some of SAWRSA’s terms. The proposed SAWRSA amendments would reallocate benefits betweenthe Nation and the allottees as well as provide additional water to the Nation.
Yavapai-Prescott Indian Tribe Settlement
In 1994, Congress enacted the Yavapai-Prescott Indian Tribe Water Settlement Act. The Act settles thetribe’s water rights claims by: (1) confirming the tribe’s right to pump groundwater within the boundaries of thereservation, (2) providing for the relinquishment of the tribe’s CAP contract, the proceeds to be used for a waterservice contract with the City of Prescott, and (3) providing that the tribe may divert a portion of the water fromGranite Creek currently diverted by the Chino Valley Irrigation District.
The Act also provides authorization to the Tribe and the City of Prescott to market their CAP water to theCity of Scottsdale, which has been completed. The Act required a state appropriation of $2 million that was madein the 1994 session of the Arizona State Legislature and was added to the tribe’s CAP proceeds fund. The GilaRiver General Stream Adjudication approved this settlement for incorporation into the final decree in that case.
Little Colorado River Settlement Talks
As early as 1986, an attorney for the Hopi Tribe suggested the establishment of a Settlement Committeeto explore possibilities for a negotiated settlement. In 1987, Judge Minker, the Superior Court Judge for theadjudication, set forth the general framework of the adjudication, including a schedule for preparation of hydro-graphic survey reports (HSRs). Among many provisions was the establishment of a Settlement Committee “tomeet and explore the settlement potential of this litigation.” The parties involved in the settlement negotiationsinclude four tribes, multiple state and federal agencies, four large electric power utilities and numerous waterdistricts, water users and municipal and county governments.
The ADWR filed the Hydrographic Survey Report for the Silver Creek watershed, part of the Little
INDIAN WATER RIGHT SETTLEMENTS
224 Draft of 10/06/04
Colorado River adjudication, in 1990. At the conclusion of the objection period, more than 3,450 objections hadbeen filed by individuals and three tribes (Navajo Nation, Hopi Tribe and San Juan Southern Paiute) or the UnitedStates on the behalf of the tribes in an effort to protect Indian water rights. In 1992, Special Master Thorsoncommenced proceedings to resolve objections to the Silver Creek HSR. Initially, objections were organized intocontested cases involving many issues of broad legal significance concerning state law water rights. The com-plexity of this litigation soon convinced the parties and the court that a different approach was necessary.
In January 1994, Judge Minker modified previous orders concerning the schedule for HSRs, requestingADWR to proceed with an Indian Lands HSR. This change in focus was rooted in the excessive numbers ofobjections filed to the Silver Creek HSR, resulting in numerous pleadings, contentious hearings and undueburdens on all parties, especially small claimants, and on the court. Judge Minker sought to curtail lengthy andcostly litigation by focusing attention on claims of reserved rights of Indian lands and federal agencies.
During the first half of 1994, Judge Minker granted stays of the litigation schedule for the ongoing SilverCreek proceedings. This was done to enable the parties to concentrate on prospects for settlement, rather thanexpend time and resources at litigation. After Judge Minker stayed litigation, the Settlement Committee metfrequently and settlement negotiations intensified. This was especially true after Judge Minker appointed JudgeMichael C. Nelson, Presiding Judge of the Apache County Superior Court, as settlement judge to oversee andmanage the negotiations. In the ensuing time, all parties have praised Judge Nelson’s effectiveness and dedicationto the settlement process.
The first focus among the parties was to seek protection of existing water uses while providing somemeans of developing “wet water” for Indian lands. As talks were getting underway, Secretary of the Interior BruceBabbitt suggested that any settlement should address issues surrounding the Black Mesa Mine. The Hopi Tribeand others, including some environmental groups, have opposed Peabody Western Coal Company’s use ofunderground water from the N-Aquifer to slurry coal from Black Mesa Mine to the Mohave Generating Station inLaughlin, Nevada. Secretary Babbitt urged consideration of a pipeline from Lake Powell to the Black Mesa Mineand to the various Indian communities in the basin.
Under Judge Nelson’s guidance, negotiations were split into “North” and “South” issues. On the “North”side, talks involved the proposed Lake Powell pipeline and sharing of water resources available to the NavajoNation and the Hopi Tribe. The “South” issues are those affecting the vast majority of individual, non-Indianclaimants in the watershed. Primary among the issues is grandfathering existing uses, some means of assuringfuture uses and developing “wet water” for the Navajo Nation.
At the same time, the Pueblo of Zuni and water users in the eastern portion of the watershed engaged infruitful talks, also with Judge Nelson’s help. On a fourth front, state parties and federal agencies have conductednegotiations with respect to the non-Indian federal claims of the National Park Service, Forest Service and Bureauof Land Management. During 2001, parties filed several stipulations as to water right abstracts. The adjudicationcourt has indicated it will approve the stipulations, once minor technical changes are made.
In early 1998, in fact, Judge Minker expressed frustration about continuing to pursue a settlement thatperpetually seems to be just beyond reach. Truth about actual settlement possibilities may lie in confidentialdocuments not available for review. The Navajo Nation and Hopi Tribe concur on the need for a pipeline fromLake Powell to the two reservations. Senator Kyl commissioned a $1 million study through the Bureau ofReclamation to review existing reports concerning the feasibility and cost of the pipeline and other water devel-opment projects. The tribes have agreed to forego any challenge to existing surface water and groundwater uses(“grandfathered” uses) in exchange for limiting future surface diversions. The tribes have proposed methods tomanage shared aquifers and the waters of five washes and arroyos that traverse both reservations. CAP water maybe made available to supply the reservations, but there are significant questions about diversion of that water fromLake Powell.
There is a proposal to divert excess water in the southern portion of the watershed that flows north toward
INDIAN WATER RIGHT SETTLEMENTS
225 Draft of 10/06/04
the reservations from the Mogollon Rim. Reservoirs would be constructed or enlarged in the “Three Canyon”area. The Endangered Species Act or other environmental laws could affect the new or expanded reservoirs orproposed pipelines.
Water marketing has been an important issue for the Navajo Nation. The ADWR has firmly opposed anypossibility of marketing water, especially CAP water, outside of the watershed.
Finally, Judge P. Ballinger, who replaced Judge Minker as the adjudication judge, has requested ADWRto proceed with the Hopi Tribe HSR. In anticipation of returning to litigation, Judge Ballinger has ordered partiesto submit disclosures concerning the claimed reserved rights of the Hopi Tribe, Navajo Nation, San Juan SouthernPaiute Tribe and the Zuni Pueblo. The Hopi Tribe and the United States also were invited to file new or amendedstatements of claimant.
To summarize, settlement negotiations remain active on some of the unresolved issues in the LittleColorado River Adjudication. It is not possible to predict whether a comprehensive settlement can be achievedand lengthy litigation averted.
INDIAN WATER RIGHT SETTLEMENTS

226 Draft of 10/06/04
INDIAN WATER RIGHT SETTLEMENTS
227 Draft of 10/06/04
WORKS CITED
Allen, Craig D. nd. Runoff, Erosion, and Restoration Studies in Pinon-Juniper Woodlands of theSoutheastern Jemez Mountains. U.S. Geological Survey, Jemez Mountains Field Station,Midcontinent Ecological Science Center.
Arizona Department of Water Resources. 2002. Transition Report. Phoenix
Brown, Carmony, and Turner. 1981. Drainage Map of Arizona Showing Perennial Streams andSome Important Wetlands. Phoenix: Arizona Game and Fish Department.
Bureau of Reclamation. 2004. Water 2025: Preventing Crises and Conflict in the West. Washing-ton, D.C.: U.S. Department of the Interior.
Christensen, N.S., A.W.Wood, N Voisin, D.P. Lettenmaier and R.N. Palmer. 2004. The Effectsof Climate Change on the Hydrology and Water Resources of the Colorado River Basin. Cli-matic Change. 62: 337-63.
Fourth Arizona Town Hall. 1964. Arizona’s Water Supply. Carl Hodges, editor. Phoenix: Ari-zona Academy.
Glennon, R. and J. Pitt. Our water future needs creativity. The Arizona Republic. May 10, p. B7.
Governor’s Drought Task Force. 2004. Arizona Drought Preparedness Plan. Draft. Phoenix.
Governor’s Drought Task Force. 2004. Arizona Drought Management Plan. Draft. Phoenix
Governor’s Water Management Commission. 2000. Briefing Book. Water Management Frame-work for AMAs, Groundwater Use Restrictions and Requirements. Phoenix: Arizona Depart-ment of Water Resources.
Governor’s Water Management Commission. 2002. Final Report and Recommendations. Phoe-nix: Arizona Department of Water Resources.
Jacobs, K.L. and G.M. Garfin. In press. Arizona’s Drought Planning: Focusing on Adaptation.Water Resources Impact.
Jacobs, K. L. and J. M. Holway. 2004. Lessons Learned from Twenty Years of GroundwaterManagement in Arizona, USA. Hydrogeology Journal. 12, No. 1.
228 Draft of 10/06/04
Mantua, N.J., S.R. Hare, Y. Zhang, J.M. Wallace, and R.C. Francis. 1997. A Pacific interdecadalclimate oscillation with impacts on salmon production. Bulletin American Meteorological Soci-ety. 78:1069–79.
McCabe G.J., and M.D. Dettinger. 1999. Decadal variations in the strength of ENSOteleconnections with precipitation in the western United States. International Journal of Clima-tology. 19:1399–1410.
McCabe, G.J., M. A. Palecki, and J.L. Betancourt. 2004. Pacific and Atlantic Ocean influenceson multidecadal drought frequency in the United States. Proceedings of the National Academyof Sciences. 101:12.
Megdal, Sharon B. 2003. We Need to Regulate Well Drilling Throughout the State – but How?Arizona Water Resource. Tucson: University of Arizona Water Resources Research Center.
Megdal, Sharon B, and Jacqueline Moxley. 2003. Managing to Avoid Crisis: A Look at WaterManagement Efforts in Rural Arizona. Arizona Review. Tucson: University of Arizona Depart-ment of Economics.
National Research Council. 2001. A report by the Water Science and Technology Board of theNational Research Council.
National Research Council. 2004. Endangered and Threatened Species of the Platte River. Wash-ington, D.C.: National Academy Press.
Seventy-first Arizona Town Hall. 1997. Ensuring Arizona’s Water Quantity and Quality into the21st Century. Marshall A. Worden, editor. Phoenix: Arizona Town Hall.
Sheppard, P.R., A.C. Comrie, G.D. Packin, K. Angersbach and M.K. Hughes. 2002. The cli-mate of the Southwest. Climate Research. 21:219-38.
Swetnam, T.W. and J.L. Betancourt. 1998. Mesoscale Disturbance and Ecological Response toDecadal Climatic Variability in the American Southwest. Journal of Climate. 2: 3128-47.
US Global Change Research Program, National Assessment Synthesis Team. 2000. ClimateChange Impacts on the United States: The Potential Consequences of Climate Variability andChange: Overview. Cambridge University Press.
Wilcox, Bradford P., David D. Breshears and H.J. Turin. 2003. Hydraulic Conductivity in aPinon-Juniper Woodland: Influence of Vegetation. Soil Science Society American Journal. 76.
Woodard, Gary, Matt Weber and Steve Stewart. 2004. Factors of domestic water demand ingrowing cities: Looking beyond population and price. Paper presented at the British Hydrologi-cal Society International Conference on Hydrology: Science & Practice for the 21st Century.London.
WORKS CITED
229 Draft of 10/06/04
WORKS CITED
World Commission on Environment and Development. 1987. Our Common Future, OxfordUniversity Press.
Zuni Claims Settlement Act. 1990. Statements on Introduced Bills and Joint Resolutions (Senate– February 28, 1990). U.S. Senate.

230 Draft of 10/06/04
WORKS CITED
231 Draft of 10/06/04
ABOUT THE AUTHORS
Bonnie G. Colby is Professor of Agricultural and Resource Economics at The University ofArizona, where she has been a faculty member since 1983. She received her doctorate in eco-nomics from the University of Wisconsin and her undergraduate degree from the University ofCalifornia. Her expertise is in the economics of inter-jurisdictional water disputes, water rightsvaluation, water transactions and water policy. She has authored over one hundred journal ar-ticles and five books, including the books Braving the Currents: Resolving Conflicts Over theRiver Basins of the West, Water Markets in Theory and Practice and Indian Water Rights: Nego-tiating the Future. She has provided testimony on these matters to tribal councils, state legisla-tures, courts and Congress. In addition to her teaching and research, Dr. Colby advises public,private and non-profit sector organizations on water management and valuation of water resources.Since the mid-1980s, she has developed dozens of water acquisition and water pricing plans forparties involved in water settlements and litigation.
David A. de Kok is a Program Director in the Office of Economic Development at The Univer-sity of Arizona. He was educated as an anthropologist and geographer at The University of NewMexico and has held a variety of research positions at the University since 1980. de Kok’s re-search specialties include cultural ecology, rural development, demographic and housing analy-sis and land use assessment. He co-authors the quarterly Metropolitan Tucson Land Use Studyand has conducted applied community development research in all counties of Arizona, on sev-eral of the Indian reservations and in over 40 of Arizona’s cities and towns. de Kok was one ofthe authors or editors of several Arizona Town Hall background reports, including Youth at Risk:Preparing Arizona’s Children for Success in the 21st Century (1994), Arizona’s Growth and theEnvironment—A World of Difficult Choices (1996), Ensuring Arizona’s Water Quantity andQuality into the 21st Century (1998), Meeting the Challenges and Opportunities of Arizona’sGrowing Senior Population (1998), Moving All of Arizona into the 21st Century Economy (2001)and Health Care Options: Healthy Aging—Later Life Decisions(2003).
Katharine L. Jacobs is a member of the faculty of The University of Arizona’s Soil, Water andEnvironmental Science Department. She is located at the Water Resources Research Center andis the Deputy Director of SAHRA, the NSF Center for Sustainability of semi-Arid Hydrologicand Riparian Areas. She also is affiliated with the Institute for the Study of the Planet Earth. Shewas the director of the Tucson Active Management Area (AMA) of the Arizona Department ofWater Resources (ADWR) from 1988 through 2001 and worked on statewide rural water re-sources issues and drought planning from 2002-2003. In 2001-2002 she worked at the NationalOceanic and Atmospheric Administration, focusing on the use of scientific information in policyand decision-making. Ms. Jacobs earned her M.L.A. in environmental planning from the Univer-sity of California, Berkeley. Her expertise is in groundwater management and developing practi-cal, appropriate solutions to difficult public policy issues. She has been involved in all aspects ofimplementation of the Arizona 1980 Groundwater Management Act, including establishing wa-ter rights and permits, developing mandatory conservation requirements for municipal, agricul-tural and industrial water users, developing plans for artificial recharge, and writing the AssuredWater Supply Rules. She has served on three National Research Council panels, Valuing Ground-
232 Draft of 10/06/04
water (1994), Review of the Climate Change Science Plan (2004) and Endangered Species onthe Platte River (2004). She was the water sector liaison on the Synthesis Team for the U.S.National Assessment of the Consequences of Climate Variability and Change.
Rita Pearson Maguire is the President and CEO of ThinkAZ, an independent, non-partisanresearch center that examines the critical public policy issues facing Arizona. Research at ThinkAZconcentrates on education, natural resource management, healthcare, immigration, fiscal policyand governance issues. Ms. Maguire established ThinkAZ in 2002. From 1993 through 2001,Ms. Maguire served as Director of the ADWR. Prior to 1993, she served as Deputy Chief of Staffto Governor Fife Symington. In this capacity, Ms. Maguire oversaw the operation of ten stateagencies, including the ADWR. As Director of ADWR, she also represented the State of Arizona’sinterests in the operation of the Colorado River at both the state and federal levels and played acentral role in Indian water rights settlement negotiations. Ms. Maguire was a key figure in thedevelopment of the Arizona Water Bank Authority. She also was responsible for enlarging wa-ter banking activities into a regional enterprise, the first of its kind in the country, enabling Ne-vada and California to store Colorado River water in Arizona’s aquifers. Additionally, she wasinstrumental in creating the Arizona Water Protection Fund. Ms. Maguire was a member of theTown Hall Research Committee for the 1997 Arizona Town Hall on Ensuring Arizona’s WaterQuantity and Quality into the 21st Century. She has earned three degrees from Arizona StateUniversity: a B.S. in Political Science, a Masters of Business Administration, and a Juris Doctor-ate.
Sharon B. Megdal is Director of The University of Arizona Water Resources Research Center(WRRC). She also serves as Professor and Specialist, Department of Agricultural and ResourceEconomics. Dr. Megdal’s work at the University focuses on state and regional water resourcesmanagement and policy. She is a frequent lecturer and writes a column for the WRRC’s bi-monthly newsletter, The Arizona Water Resource. Recent papers include “How Water Manage-ment in Tucson, Arizona Has Affected the Desert’s Landscape” and “Managing to Avoid Crisis:A Look at Water Management Efforts in Rural Arizona,” which was co-authored with JackieMoxley. Megdal holds Ph.D. and M.A. degrees in economics from Princeton University, whereshe specialized in public sector economics and econometrics, and an A.B. degree in economicsfrom Douglass College of Rutgers University, where she was Phi Beta Kappa. In 1985 Gover-nor Bruce Babbitt appointed her to the Arizona Corporation Commission, where she served untilJanuary 1987. Megdal served as Executive Director of the Santa Cruz Valley Water District fromNovember 1991 until the closure of the District in June 1994. Dr. Megdal completed a six-yearterm on the Arizona State Transportation Board in January 1997; in 1996 she served as Chairmanof the Board. Dr. Megdal also served as President of MegEcon Consulting, a firm established in1987. Dr. Megdal currently serves as Vice Chair of the Arizona Medical Board and was a mem-ber of the Arizona Water Quality Appeals Board from February 2002 to February 2004. Sheserves on the Tucson Airport Authority. Other past public service activities include serving asCo-Chair of the Governor’s Transportation Vision 21 Task Force and as a member of theGovernor’s Water Management Commission.
ABOUT THE AUTHORS
233 Draft of 10/06/04
Gary Woodard is Associate Director of the NSF Science and Technology Center for Sustainabilityof semi-Arid Hydrologic and Riparian Areas (SAHRA), headquartered in the Department ofHydrology and Water Resources, The University of Arizona. His responsibilities include knowl-edge transfer, public outreach and professional development and international and selected edu-cational activities. He also conducts research on municipal water demand and conservation is-sues that affect semi-arid and arid regions. Woodard earned a B.S. in chemistry from the Univer-sity of Michigan in 1976. After two years of basic research on catalytic converters at the GeneralMotors Research Center, he returned to the University of Michigan, receiving degrees in bothLaw (JD) and Public Policy Studies (MPP) in 1981. Woodard joined the University of Arizona’sCollege of Business and Public Administration in 1982. He moved to the Water ResourcesResearch Center in the College of Agriculture in 1991 as associate director. He moved to theCollege of Engineering and became Assistant Director of SAHRA in 2000. Woodard also hastaught in the Departments of Agricultural and Resource Economics and of Hydrology and WaterResources. Water education and outreach efforts initiated by Woodard include publishing South-west Hydrology, developing several Web-based tools and services for both water professionalsand the general public and organizing a series of media briefings on research and forecasts on theongoing drought. Policy issues studied by Woodard include forecasting municipal water demandand evaluating water conservation strategies; analyzing utility regulation and rate structure issues,and inter-basin water transfers in the West and their impacts on rural areas of origin. Woodard haspublished several dozen articles and monograms on various research topics and given numeroustalks to various professional organizations.
Marshall A. Worden, Senior Officer for Policy and Strategic Initiatives in the Office of theAssociate Vice President for Economic Development and Adjunct Social Scientist, Departmentof Geography and Regional Development, has been at The University of Arizona since 1973.Educated as a geographer, he holds degrees from the George Washington University and theUniversity of Chicago. Worden’s research specialties include regional economic developmentand issues of community growth and decline. He co-authors the quarterly Metropolitan TucsonLand Use Study. Worden was one of the authors or editors of several Arizona Town Hall back-ground reports, including Youth at Risk: Preparing Arizona’s Children for Success in the 21stCentury (1994), Arizona’s Growth and the Environment—A World of Difficult Choices (1996),Ensuring Arizona’s Water Quantity and Quality into the 21st Century (1998), Meeting the Chal-lenges and Opportunities of Arizona’s Growing Senior Population (1998), Moving All of Ari-zona into the 21st Century Economy (2001) and Health Care Options: Healthy Aging—LaterLife Decisions(2003). Recent service includes membership on the Board of Trustees of SterlingCollege (Kansas) and of Northminster Presbyterian Church (Tucson) as well as the Board ofDirectors of the Industrial Development Authority of the City of Tucson, of the Pima CountyReal Estate Research Council and of Presbyterians for Renewal (Louisville). Worden also is theSecretary of the Campus Research Corporation.
ABOUT THE AUTHORS

234 Draft of 10/06/04
ABOUT THE AUTHORS

ARIZONA TOWN HALL Building consensus — Charting progress
Draft of 10/06/04