Embed Size (px)
Citation preview
1WMO: Climate and Water Department www.apfm.info
WMO
Training Workshop on Integrated Flood Management for the Nile Basin Countries
Flood risk assessment/mapping
23-27 November 2009-09-16 Nairobi, Kenya
Armin Petrascheckformer member of
Federal Office for Environment

2
1. Introduction, Objectives2. Hazard and risk assesment3. Hazard and risk maps
Content

3
Maps are an information tool indicating :- WHAT (Hazard and Risk parameters)- WHERE (Geographic extend)
The information is elaborated:- The hazard analysis- The analysis of vulnerability
The first step: What can happen?
Knowledge has only value if it is applied.
Therefore the results of the above analysis must be given to the different actors. Since spatial distribution is essential, maps are a good tool to inform. But maps must be accompanied by reports.
This information is one of the backbones for the IFM planning.
4
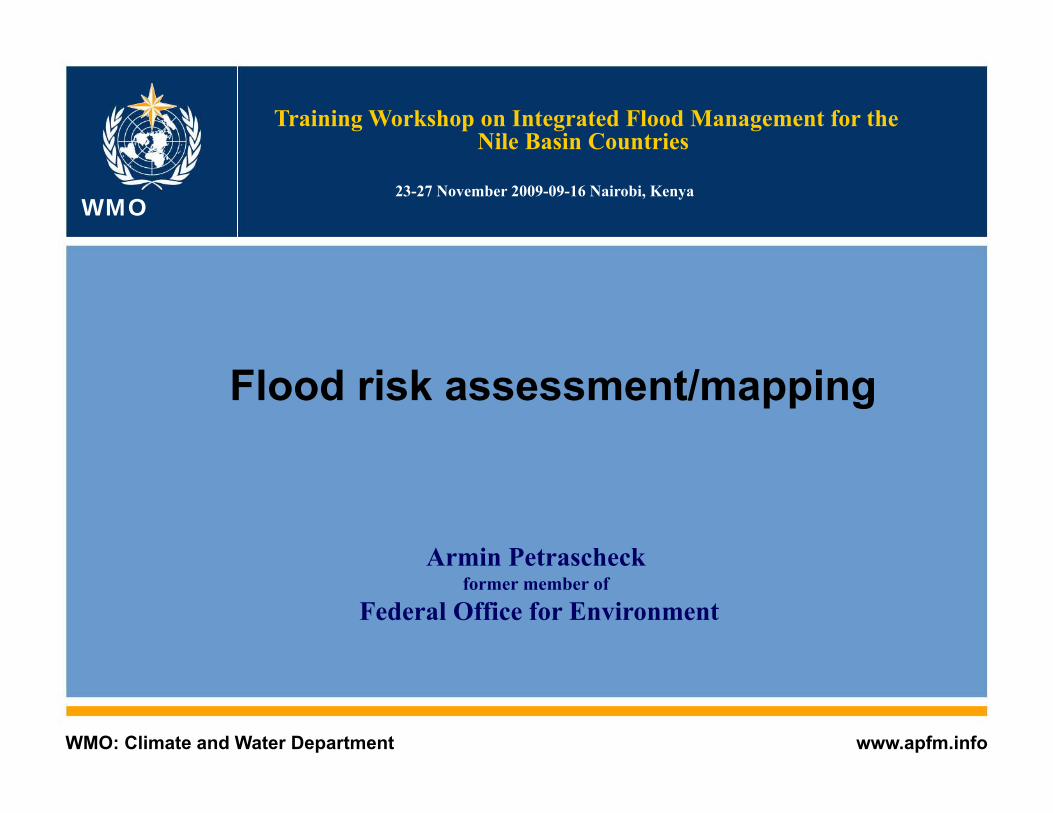
Different maps for different uses
Preliminarymaps

5
What can be done depends on the physical parameters of the event.Economic justification depends on the consequences and the probability of the event.
To establish a plan I must know
1. What can be affected? (extend)2. What is the impact? (magnitude / intensity)3. What are the consequences? (vulnerability)4. What can be done? (measures)5. Which safety can we afford? (economy)
The sequence is of importance
Establishement of flood management plans

6
Going from general to detail
1. Basin wide analysis2. Historic events3. Which processes (type of floods)4. Parameter estimation (probability, impact)5. Risk assessment6. Maps
Although the main focus is on the hazard analysis we must keep an eye on vulnerability of the affected areas, since if there are no consequences no details are necessary.
How to proceed?

7
Flood types• Riverine floods• Pluvial floods• Flash floods• Landslides • Debris and mud flows• Gacial lake outburst• Coastal flooding• Ground water• Lake overflows• Ice jams• Dam failure• Levee breaches

8
Hazard parameters
1. Depth of inundation2. Duration3. Extend4. Rising velocity5. Current velocity (pressure)6. Debris (blocks, wood)7. Sand and mud8. Oil and other
chemical agents

9
Methods for hazard analysis
1. Historic events2. Geomorphologic analysis3. Hydrologic studies4. Mathematical modeling5. Failure analysis (capacity,
stability)The most important is to analyze the events , which already happened. Documentation of new events should be made.The next important is to go into the field, look for traces and signs indicating hazards
10
Determine vulnerability and risk
Must be carried out after hazard analysis and needs:
- Data on present land use- Data on persons effected- Data on buildings, industries and
infrastructure- Hot spots like hospitals, chemical
depots, ect.For the above objects the sensitivity to flooding must be determined

11
Probability of eventsFor economic evaluation quantitative
probabilities must be assigned.For long records standard techniques can be
applied, but for many processes (debris flow, tsunamis) they must be estimated. For communication the words: rare, very rare ar easier understood then return periods.
Events of three probabilities should be investigated-
• Relative frequent (Return Period 10 to 30 years)
• Rare (Return period around 100 years• Extreme

12
• gives the frame for detailed evaluation and optimization
• causes the maximum damage and the highest risk for life and measures are the most urgent
• serves for control of effectiveness of protection measures and determination of residual risk
• identify safe places which are safe since even in an extreme event
Extreme event: Why?

13
What is an extreme event?
Switzerland Annual flood peaks of the Langeten
Austria: Annual flood peaks of the Kamp riverEstimation 2002420 m3/s
Values estimated Values reliable

14
How to extrapolate ?
After event
Before event
The estimation of the probability for extreme events is extremely uncertain
Example Austria Kamptal
Flood 2002 estimated to be 420 m3/sCalculated return period 2000 -10000years
Return period in years
Observed floods so far

15
Definition:The extreme event exceeds substantially the 100 years flood or the highest observed flood
There is no specific probability assigned, since depending on data and methods the results may vary considerable. As very rough figure 150% of the 100 years flood may be applied, however this may depend on the type of the river, the available information on historic floods and other meteorological, hydrologic or hydraulic characteristics.
Extreme event

16
Selection of map typeWhen preparing a map I must be clear• Which message I want to transmit• Whom I want to inform• What shall he do with the information• What does he need• Is the information understandableAs basis for planning we must go from general to detailOverview: Scale smaller 1:25’000Detailed: Scale larger 1:25’000
17
Application• Planning: Impacts of urbanisation, other land
uses and climate change• Regulatory: Land use regulation and building
codes• Emergency response: Location for building
shelters and earmarking escape routes• Vulnerability: spatial characterization of flood
vulnerability of the population• Asset management• Flood Insurance• Public awareness• Informational/Educational: record of flood
magnitudes in an area

18
• frame for detailed evaluation• quick recognition of possible conflicts• overview on existing risks• priority setting for detailed planning• RAISING AWARNESS
Preliminary assessment or indicative flood maps (small scale): Purpose
HQ 50 EHQ Synthetic map

19
Obligatory• type of hazard• limits of possibly affected area (extreme event)• settlements and important sensible objects
Desirable • extend of historic floods• indications on frequency and intensity (depth)
Scale: 1:100’000 until 1:25’000
Preliminary assessment or indicative flood maps: Content

20
Flooding probable
Flooding possible
Example: Indicative map Canton Aargau (CH)
21
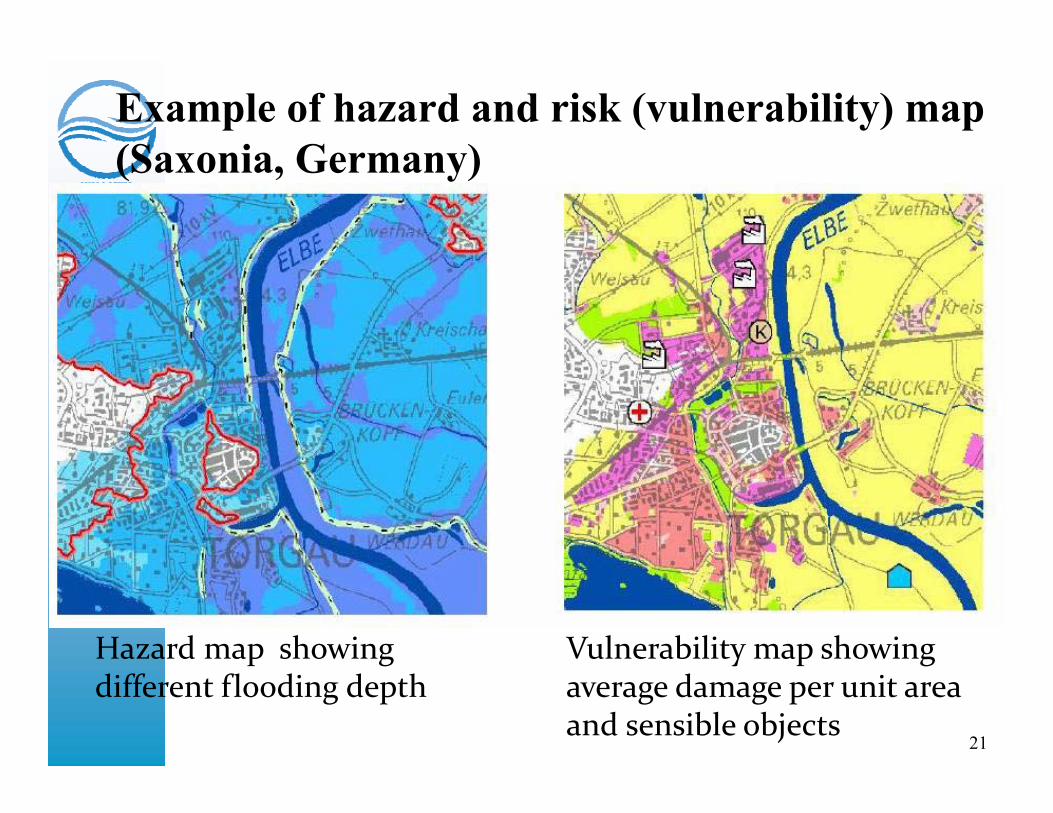
Example of hazard and risk (vulnerability) map (Saxonia, Germany)
Hazard map showing different flooding depth
Vulnerability map showing average damage per unit area and sensible objects

22
Flood hazard maps
Flood emergency
maps
Hazard zoningmaps
Hydrographs fordesign events
Flood Risk maps
Hazard analysis
Land use planning Flood management planningForecasting and warning
Emergency/rescueplanning Investment and insurance
planning
Construction and
rehabilitation
Depending on the type of information and the users
Detailed maps
23
For Realisation:Result of the planning process leading to action:
• Flood emergency maps• Flood zoning maps for land use planning• Flood defence projects planned measures
For Planning:Basic information spatial distribution of parameters
• Flood event maps • Flood hazard maps (depth, velocity, etc.)• Vulnerability maps (exposed values)
Different types of maps for different purposes

24
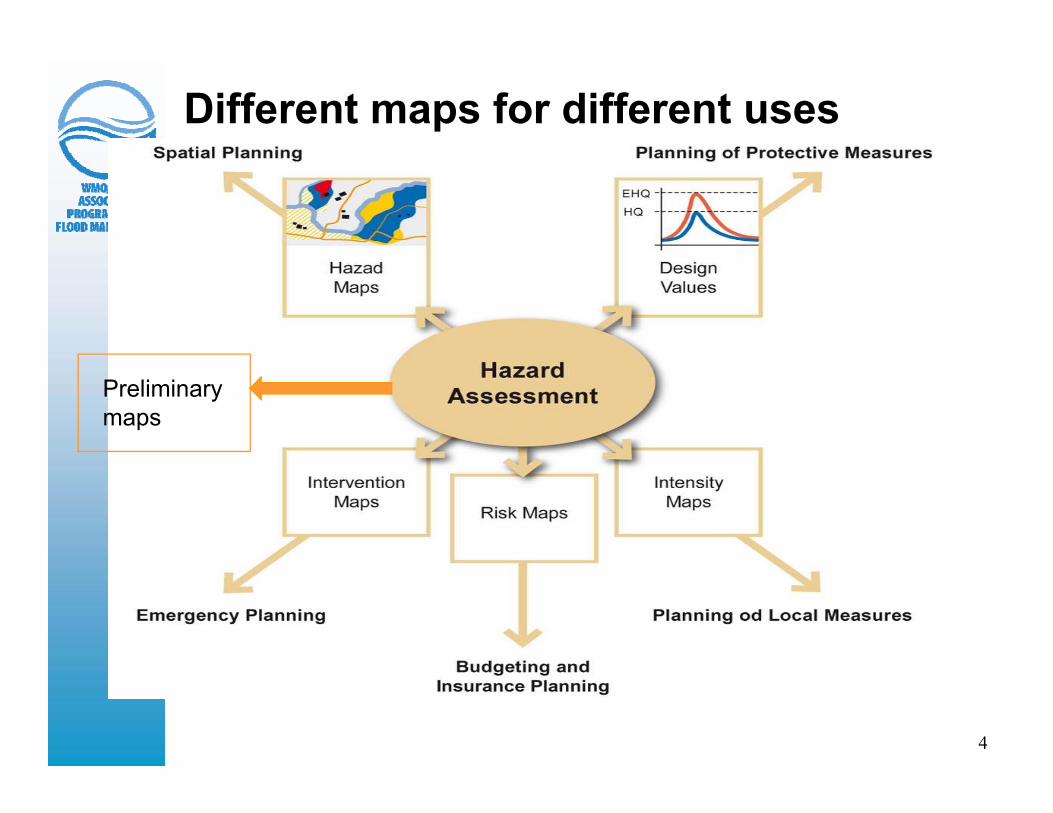
R=30 R=100 R=1000
• detailed assessment of flood depth • return period: 30, 100, 1000yr• water depth in 0.25m / 0.5m steps• scale 1:5000• high topographic accuracy 10cm
Hazard map Canton Aargau showing flooding depth for different return periods
Detailed maps

25
Example: Hazard map for spatial planning Canton Nidwalden
30j 300j100j 1000j
0.5m
2m
Land use planning• red: no new constructions allowed• blue: constructions allowed with restrictions• yellow: informations for the land-owners

26
Example: Emergency map Canton Graubünden
from planning to action

27
• Flood risk maps are the first step to a risk management plan showing where we have conflicts but also where we have potential retention areas.
• Small scale flood risk maps are needed for strategic planning and priority setting. transfer information to politics and general public. The content must be restricted to the essentials to be easily understood.
Indicative or preliminary maps (small scale)
• Preliminary flood risk maps should be established rapidly. The necessary details can be elaborated in the later phases.
• Preliminary flood risk maps should focus on the hazard. Vulnerability is necessary but only in a general way.

28
• The information included in the flood map is elaborated by specialists in the process of hazard and risk analysis. This is a continuous process. The maximum of knowledge is needed when planning the measures.
Final or detailed maps (large scale)
Detailed maps should contain all information necessary for a certain action.
Content must be adopted to the use. Examples are:• spatial planning• emergency operations• Risk assessment (insurance)• Planning of mitigation measures (p.e: Water proofing of houses)

29
Mapping is important - but not everywhere
Thank you for your attention