Embed Size (px)
Citation preview

Armstrong
World
Industries
Investor Day 2014 May 21, 2014
2
Safe Harbor Statement
This presentation consists of this slide deck and the associated remarks and comments, all of which are integrally related, are
intended to be presented and understood together. Our disclosures in this presentation, including without limitation, those relating to
guidance, future operating or financial performance, including, without limitation, the building products “mid-cycle” outlook and in our
other public documents and comments contain forward-looking statements within the meaning of the Private Securities Litigation
Reform Act. Those statements provide our future expectations or forecasts and can be identified by our use of words such as
"anticipate," "estimate," "expect," "project," "intend," "plan," "believe," "outlook," "target," "predict," "may," "will," "would," "could,"
"should," "seek," and other words or phrases of similar meaning. Forward-looking statements, by their nature, address matters that
are uncertain and involve risks because they relate to events and depend on circumstances that may or may not occur in the future.
A more detailed discussion of the risks and uncertainties that may affect our ability to achieve the projected performance is included
in the “Risk Factors” and “Management’s Discussion and Analysis” sections of our recent reports on Forms 10-K and 10-Q filed with
the SEC. As a result, our actual results may differ materially from our expected results and from those expressed in our forward-
looking statements. Forward-looking statements speak only as of the date they are made. We undertake no obligation to update any
forward-looking statements beyond what is required under applicable securities law. The information in this presentation is only
effective as of the date given, May 21, 2014, and is subject to change. Any distribution of this presentation after May 21, 2014 is not
intended and will not be construed as updating or confirming such information.
In addition, we will be referring to “non-GAAP financial measures” as defined by the SEC. A reconciliation of the differences between
these measures with the most directly comparable financial measures calculated in accordance with GAAP can be found in our SEC
filings and on the Investor Relations section of our website at www.armstrong.com. Adjusted EBITDA is earnings before interest,
taxes, depreciation, amortization, net the impact of discrete expenses and income, including, for example plant closures,
restructuring actions, and other large unusual items. Net sales includes the impact of foreign exchange rates.
Armstrong competes globally in many diverse markets. References to "market" or "share" data are simply estimations based on a
combination of internal and external sources and assumptions. They are intended only to assist discussion of the relative
performance of product segments and categories for marketing and related purposes. No conclusion has been reached or should be
reached regarding a "product market," a "geographic market" or “market share,” as such terms may be used or defined for any
economic, legal or other purpose.

3
Basis of Presentation Explanation
All figures throughout the presentation are in $ millions unless otherwise noted. Figures may not add due to rounding.
When reporting our financial results within this presentation, we make several adjustments. Management
uses the non-GAAP measures below in managing the business and believes the adjustments provide
meaningful comparisons of operating performance between periods. As reported results will be footnoted
throughout the presentation.
• We report in comparable dollars to remove the
effects of currency translation on the P&L. The
budgeted exchange rate for 2013 was used for
all currency translations in 2013 and prior years.
• We remove the impact of discrete expenses and
income. Examples include plant closures,
restructuring actions, and other large unusual
items.
• Taxes for normalized Net Income and EPS are
calculated using a constant 39% for 2013 results,
which are based on the expected full year
historical tax rate.
Comparable
Dollars
Other
Adjustments
Net Sales Yes No
Gross Profit Yes Yes
SG&A Expense Yes Yes
Equity Earnings Yes Yes
Operating Income Yes Yes
Net Income Yes Yes
Cash Flow No No
Return on Capital Yes Yes
EBITDA Yes Yes
What Items Are Adjusted

4
Agenda
12:15-12:20pm Introduction and Agenda
Thomas Waters, Vice President, Treasury and Investor Relations
12:20-12:50pm Strategic Outlook: Retrospective Review & What’s Next for Armstrong
Matthew Espe, Chief Executive Officer
12:50-2:00pm Value Creation Model and Strategic Priority Review
Victor Grizzle, Chief Executive Officer Armstrong Ceilings
Mike Shirk, Vice President, Global Architectural Specialties Armstrong
Ceilings
Tom Mangas, Chief Executive Officer Armstrong Flooring
2:00-2:10pm Break
2:10-2:40pm Financial Performance Review & Mid Cycle Outlook
Dave Schulz, Chief Financial Officer
2:40-2:50pm Closing Comments
Matthew Espe, Chief Executive Officer
2:50-3:30pm Formal Q&A
3:30-4:30pm Cocktail Reception & Product Display Showcase

Armstrong
Overview
Matthew Espe Chief Executive Officer,
Armstrong World Industries

6
Management Team
• Matt Espe, Chief Executive Officer
• Dave Schulz, Chief Financial Officer
• Vic Grizzle, Chief Executive Officer Armstrong Ceilings
• Tom Mangas, Chief Executive Officer Armstrong Flooring
• Mark Hershey, General Counsel & Chief Compliance Officer
• Don Maier, SVP Global Operations
• Ellen Romano, SVP Human Resources
• Steve Poole, VP Global Business Development & Corporate
Communications

7
Armstrong Highlights
35 Manufacturing Facilities
in 8 Countries
30% % of Sales from Innovative
New Products Introduced in
the Past 5 Years
8,600+ Team Members
Worldwide
Billion Worldwide
Sales
2.7
80% North American Commercial
Distributors have been with
AWI for 20+ years
100+ Countries have Armstrong
Ceilings or Floors
Customer Relationships
Worldwide
9,000+ 80 Billion Square Feet of Installed
Commercial Space in the
U.S.
Millions of Installations Globally

8
• As a leader in the design and
manufacture of floor and ceiling
solutions, these powerful words
capture what the company provides to
its customers
• This new platform builds on
Armstrong’s brand legacy of integrity,
quality and trust, and extends it to
incorporate its focus on innovation and
creativity
• Through our innovative and sustainable
ceiling and flooring solutions, we help
our customers expand their design
possibilities to create high-functioning,
beautiful interiors for homes and
commercial office, healthcare,
educational and retail spaces around
the world.
Inspiring Great Spaces
Building on the power of our brand

9
Inspiring Great Spaces
Building on the power of our brand
VIDEO
10
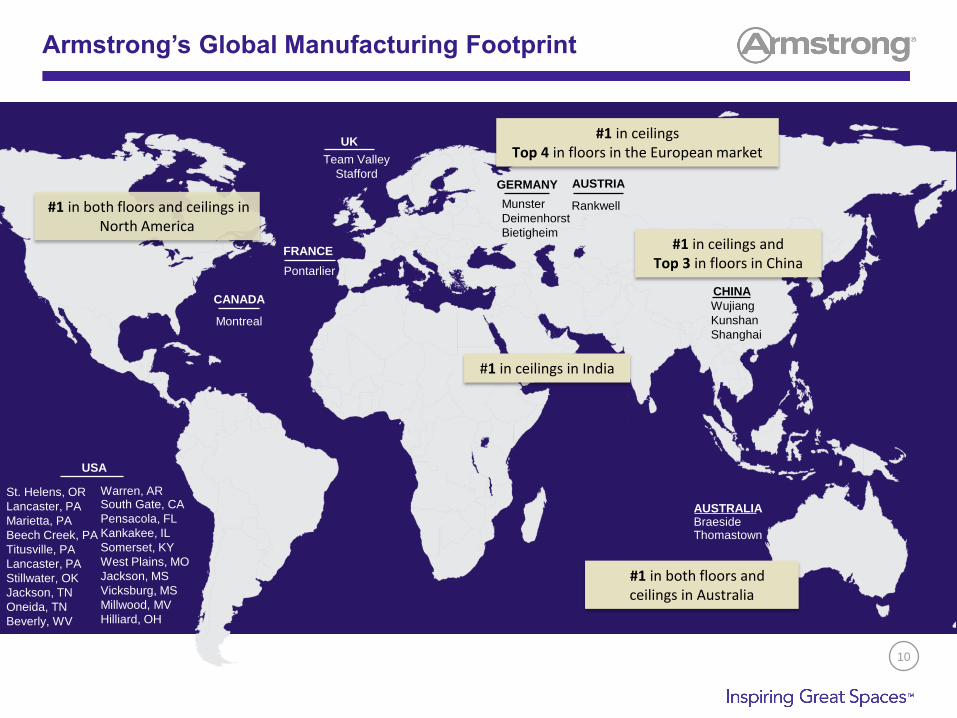
Armstrong’s Global Manufacturing Footprint
AUSTRALIA Braeside Thomastown
Warren, AR South Gate, CA
Pensacola, FL
Kankakee, IL
Somerset, KY
West Plains, MO
Jackson, MS
Vicksburg, MS
Millwood, MV
Hilliard, OH
St. Helens, OR
Lancaster, PA
Marietta, PA
Beech Creek, PA
Titusville, PA
Lancaster, PA
Stillwater, OK
Jackson, TN
Oneida, TN
Beverly, WV
USA
Montreal
CANADA
Team Valley
Stafford
UK
Rankwell
AUSTRIA
Pontarlier
FRANCE
Munster
Deimenhorst
Bietigheim
GERMANY
Wujiang
Kunshan
Shanghai
CHINA
#1 in ceilings Top 4 in floors in the European market
#1 in both floors and ceilings in North America
#1 in ceilings in India
#1 in ceilings and Top 3 in floors in China
#1 in both floors and ceilings in Australia
11
Key Milestones – Positive Momentum
Cost
Management
Initiatives
Capital
Market
Activity
Organic
Investment
Portfolio
Management
Management
2010 2011 2012 2013 2014
New CEO and CFO
Leverage recap
and $800M
special dividend
Announced $150M
cost
out initiative
Cost out initiative
raised to
$165M and then
$185M
Cost out initiative
concluded > $200M
in 2012
Simplex ceilings
acquisition
(Architectural
Specialties)
Divestiture of
Cabinets and
Patriot flooring
distribution
businesses
Announced organic
investment in emerging
markets –
began construction of 3
plants in China
New global
Ceilings CEO
New CFO and global Flooring CEO
Both internal promotions
Delivered over $20M in manufacturing
productivity in 2013
Growth through focus on innovation,
product adjacency opportunities, design
and environmental leadership
Completion of Chinese facilities in 2013
and Russian facility in early 2015
Announced North American LVT
manufacturing investment with expected
completion in 1H 2015
Armstrong repurchases
~5M shares ($260M)

Active and
Ongoing
Value Creation
Matthew Espe
Chief Executive Officer,
Armstrong World Industries

13
• Protect and grow our North
American businesses
• Invest and grow in key international
and emerging markets
• Optimize our portfolio through
ongoing evaluation of strategic
opportunities by business, by
geography and across the company
• Seek adjacent opportunities to
expand our product line and
geographic reach
• Build on our core competency of
driving specifications in the architect
and designer communities while
working with our distribution partners
to create and enhance value
Armstrong’s Business Priorities

14
1. Position company to benefit
from recovery in North
American residential and
commercial construction
2. Customer focused innovation in
ceilings and floors
3. Capture new and increased
spend in established and
growth markets
4. Capital structure and allocation
Active and Ongoing Value Creation
1.0
2.0
3.0
4.0
Ceiling
Flooring
2013
$3.5 - $3.7
Sa
les
($
Bil
lio
n)
Mid-cycle
Outlook
$2.7

15
Ways to Drive Value Creation
1. North American Recovery
2. Growth in International Markets
3. Innovation in Ceilings and Flooring

16
Macro Economic Drivers: Key North America Metrics
• Dodge commercial starts – ~20% of our
business
• GDP – Commercial repair and remodel ~80%
of our business and is largely GDP driven
• ABI – best of the forward indicators but timing
is problematic, and it only captures large
projects
• US Census data on new home starts
• Disposable income
• Unemployment
• Household net worth
• Existing home sales
• Home prices
US Commercial Architecture Billings Index
US Residential US Home Starts
45
50
55
0.0
0.5
1.0
1.5
2.0
2.5
Housing Starts: SF Housing Starts: MF
Ind
ex
Ho
us
ing
Sta
rts
(Millio
ns
)

17
Leveraging Macro Trends: North America
• Anticipated multi-year recovery • 2014 is an inflection point for the
commercial market
• Expect the beginning of a multi-year
recovery based on recent strong new
commercial starts
Commercial:
Residential:
• New home construction has grown
double-digits since 2012
• Growth in remodel and repair less
than expected
• Expect new home construction to grow
steadily towards 1.5M starts
• Expect remodel and repair spend to grow
towards mid-single-digits
Market Conditions Review Market Outlook

18
• North American plants located in key
distribution areas Over 20 plants in North America – aids in
distribution, recycling of product and customer
relationships
• Ability to capitalize on increased volume Current plants are running at ~70% capacity
utilization; can support increase in volume
A 10% increase in volume would require an
increase in production workforce by 2%
35% – 45% margins
• Enormous base of existing installations
creates ability to leverage annuity stream
Positioned for a North American Commercial Recovery
Our most profitable market – recovery drives strong earnings growth

19
Ways to Drive Value Creation
1. North American Recovery
2. Growth in International Markets
3. Innovation in Ceilings and Flooring

20
Macroeconomic Drivers: International Metrics
• International commercial macroeconomic market indicators are not as
transparent or consistent as North American data
• Internal knowledge from our leading share position combined with
select external indicators provides us with a more informed view
• GDP – the best predictor of our volumes
• Euroconstruct data
• Sector specific data and forecasts
• Vertical specific forecasts – for emerging markets, but are highly volatile
Select International Commercial External Drivers

21
Macro Trends: Core International Markets
UK
Sales increased more than expected
since 2012, driven by share gains
Western Europe
Weakness in the North and continued
declines in the South
Australia
Impact of past stimulus dampened
demand for 2010 – 2013
Market flat in 2014, modest growth in 2015
and beyond
Market Conditions Review Market Outlook
Markets bottom in 2014, modest recovery
beginning in 2015
Mixed results by segment in 2014

22
Macro Trends: Emerging Markets
Russia
Strong volume growth, continued
evolution of price and mix since 2012
Changing population demographics
driving growth trends
• Office down in 2014, growth in 2015 & beyond
• Healthcare and education growth to continue
China
Double-digit growth in healthcare and
education as expected, office disappoints
Monitoring market conditions closely
India / SE Asia
Continued double-digit growth
Continued profitable growth of over
10% annually
Middle East
Good volume growth and continued high
price and mix
Continued double-digit growth
Market Conditions Review Market Outlook

23
• Executing on emerging markets
growth investments Three China plants up and running
China metal ceilings plant on-line by
2015
Closely monitoring conditions in Russia;
on the ground operations continue as
normal, plant scheduled to begin
shipping Q1 2015
• Global manufacturing footprint we
need for the coming years is in place Remain confident on benefits of growth
in key markets, but timing uncertain
• We have remained agile to market
conditions Ability to redeploy assets based on
regional opportunities
Positioned for Global Growth
24
Ways to Drive Value Creation
1. North American Recovery
2. Growth in International Markets
3. Innovation in Ceilings and Flooring

25
• Dynamic strategy driven by customer
needs
• Deploying NPD, R&D, and technical
resources globally to the highest
value creation opportunities Development of global and multi-
generational product platforms
Patent applications increased more than
5x since 2010
• Differentiation that is valued by
customers = higher margins
• Innovation is not limited to just new
products but extends to “how” we do
business
Renewed Focus on Innovation
Innovation efforts accelerating
0
10
20
30
40
2010 2011 2012 2013
Patent Activity
First Filed Utility Applications
0%
10%
20%
30%
2010 2011 2012 2013
New Product Sales*
* Metric based on % of total sales for products introduced in the last five years.
# o
f P
ate
nt
Ap
pli
cati
on
s
% o
f S
ale
s
Armstrong
Ceilings Overview
Victor Grizzle
Chief Executive Officer,
Armstrong Ceilings

27
Inspiring Great Spaces
“In most of the great buildings in the
world, the ceilings are the most
spectacular"

28
Global Ceilings
22 Manufacturing Facilities
in 8 Countries
3,300 Team Members
Worldwide Billion Worldwide Sales
1.3
100+ Countries Have
Armstrong Ceilings
50,000+ Architect/Designer
Relationships
22 Years of Highly
Profitable WAVE JV

29
65%
35%
95%
5%
Commercial
Residential
Global Ceilings Revenue Mix
Commercial vs. Residential
Sales by End-Use Segment
Office 30% - 40% Retail 20% - 30% Education 15% - 25% Healthcare 5% - 15%
~90% of
business in
China is new
construction
~80% of
business in
North America
is remodel &
refresh
New vs. Remodel
Worldwide
market leader
in commercial
ceiling
business
Remodel New

30
Geographic and Product Mix
• Leading share position in all three geographies
• 60% of sales in North America - the core earnings driver of the
business
• Architectural Specialties growth accelerating
2013 Sales by Geography Total = $1.3B
2013 Sales by Product
85%
15%
60%
30%
10%
Americas
EMEA
Pacific Rim Architectural
Specialties
Mineral Fiber

31
• Seamless customer relationship –
customers buy an Armstrong ceiling
system
• Greater than 100% ROIC
• Over $225 million in cash dividends to
Armstrong from 2011 to 2013
• 8 Manufacturing plants in 5 countries
• Products and services help drive
specifications and deliver efficiency to
contractors
WAVE – Armstrong/Worthington 22-Year JV
Integral to Armstrong Ceiling business success

32
Our Mission
To be the best in the world in ceilings solutions…committed to win in
the entire ceilings market
From:
Mineral Fiber Leadership
$3 billion market
100%
Mineral Fiber
Mineral Fiber
Metal
Other Specialty
Other
$6 billion market
To:
Ceilings Solutions Leadership

33
Strategic Priorities
• Go-to-market and fulfillment investments
Results 2010 – 2013
• Americas EBITDA margin
+900 bps
1. Strengthen our position in core markets
• Position to benefit from commercial
recovery
• Expand margins and drive mix
1
• >15% sales CAGR
• Expanded capacity
2. Build a leadership position in key
emerging markets
2
• >10% sales CAGR
(2011-2013)
• Margin expansion while
investing for growth
• Build a global leadership position in
Architectural Specialties
• Differentiated capability build-out
3
34
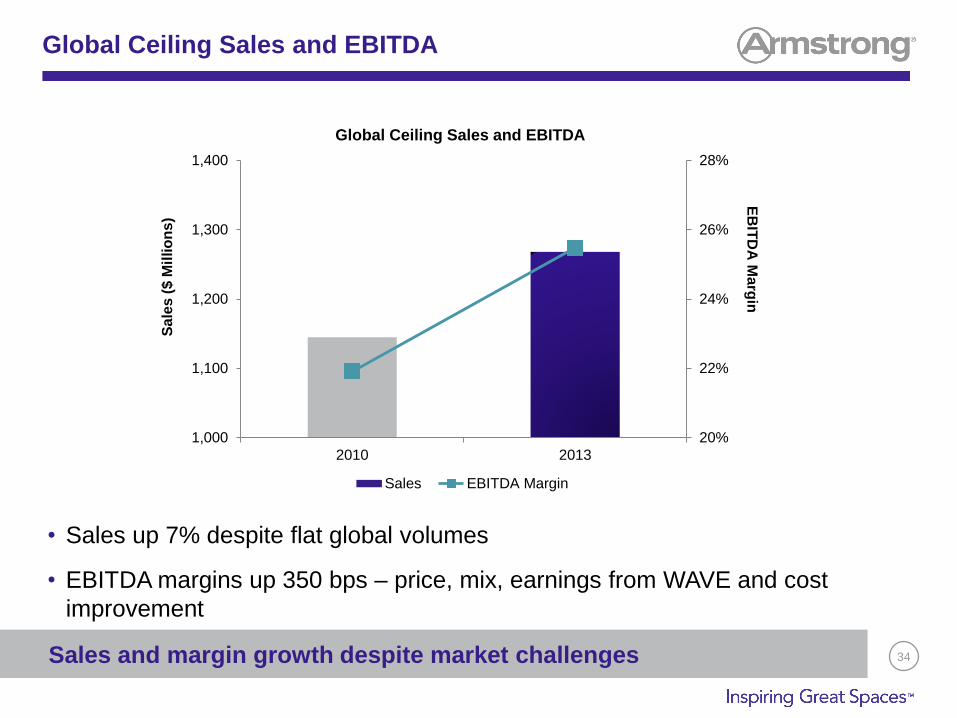
Global Ceiling Sales and EBITDA
• Sales up 7% despite flat global volumes
• EBITDA margins up 350 bps – price, mix, earnings from WAVE and cost
improvement
Sales and margin growth despite market challenges
Sa
les
($
Mil
lio
ns
)
EB
ITD
A M
arg
in
20%
22%
24%
26%
28%
1,000
1,100
1,200
1,300
1,400
2010 2013
Global Ceiling Sales and EBITDA
Sales EBITDA Margin
35
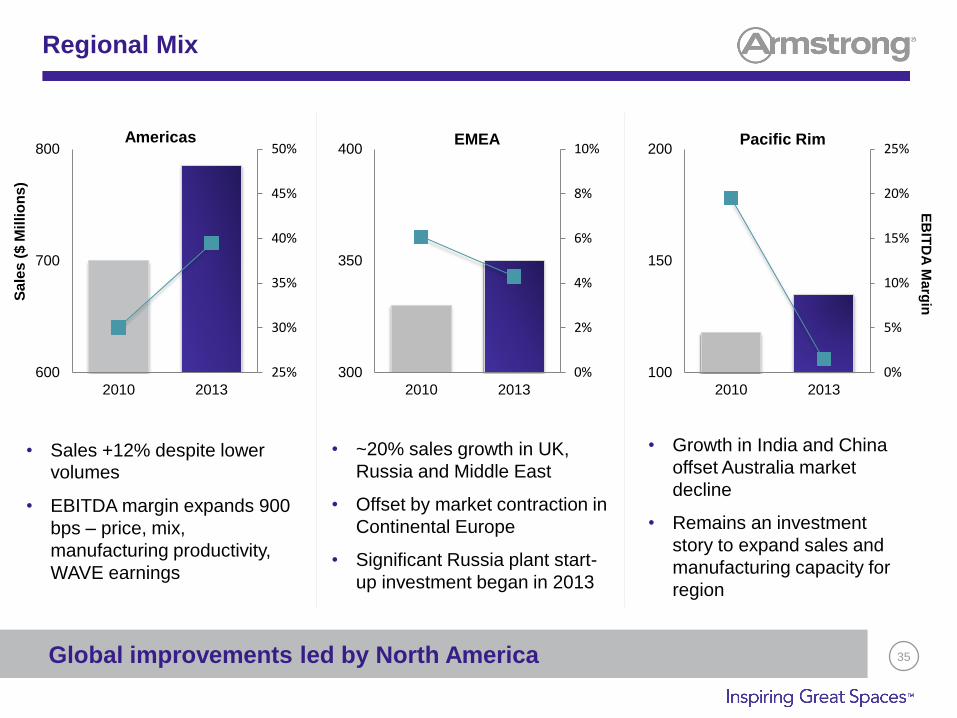
Regional Mix
Global improvements led by North America
• ~20% sales growth in UK,
Russia and Middle East
• Offset by market contraction in
Continental Europe
• Significant Russia plant start-
up investment began in 2013
• Sales +12% despite lower
volumes
• EBITDA margin expands 900
bps – price, mix,
manufacturing productivity,
WAVE earnings
• Growth in India and China
offset Australia market
decline
• Remains an investment
story to expand sales and
manufacturing capacity for
region
25%
30%
35%
40%
45%
50%
600
700
800
2010 2013
Americas
0%
2%
4%
6%
8%
10%
300
350
400
2010 2013
EMEA
0%
5%
10%
15%
20%
25%
100
150
200
2010 2013
Pacific Rim
EB
ITD
A M
arg
in
Sa
les
($
Mil
lio
ns
)

36
China & Russia Investments
• Growth markets . . . large potential
• High-end office sector growth below initial
expectations in China
• Second China plant started on time, under
budget
• Russia market and sales growth impacted by
current political instability and weakening of the
ruble
• Russia on time/budget . . . online 1Q15
• Accretion to ROIC delayed 2 years
Investing in local capabilities for a leadership position
Alabuga, Russia
Wujiang, China

37
Ceilings Innovation
Design
Build
Occupy
Indoor Environmental
Quality:
• Acoustics matching space needs
• Healthy buildings
• Energy efficient
Design / Visual:
• Monolithic visuals
• Unique solutions/specials
• “Expressive” designs
Engineered Solutions:
• Pre-fabrication
• Designed for higher productivity
• Contractor services

38
• Leverage global reach and scale
• Win specification game Multi-product offering … 1-stop
shopping
Supported with design services
• Remodel opportunity
• Prepared for demand uptick Capacity to support a 20% increase
in volume with a 4% increase in
production workforce
Our Winning Formula

39
“Freedom Tower” – Conde Nast
Recently won the ceilings supply for
Conde Nast, an anchor tenant for
this iconic building, taking 25% of
the floors
Why Armstrong:
• Only company able to combine our
acoustical tile, Architectural Specialties
and grid solutions to effectively meet
customer’s challenging needs
• Provided design services to enable a
unique visual
• Ability to support a compressed
construction schedule
Case Study: One World Trade Center

40
Armstrong Ceilings – Summary
• Leading global position in ceilings . . . financially stronger than ever
• Global footprint to leverage for speed efficiency and customer value
• Innovation leader . . . committed to be
• Broadest portfolio to meet more of our customers’ needs
• Strong, passionate, loyal employee base . . . committed to win

Architectural
Specialties
Mike Shirk
Vice President, Global
Architectural Specialties,
Armstrong Ceilings

42
Architectural Specialties (AS) Overview
Enhancing our value to core customers in a differentiated way
• Specialty ceiling systems targeted at customer need for a design-oriented aesthetic
• Same customer as mineral fiber ceilings, often combined on the same project
• Many different materials and product forms
• Lower volume, higher price, sometimes involving custom design and engineering
What Is AS? What Makes Armstrong Unique?
Easiest To Do
Business With
Global
footprint to
support global
projects
Broadest portfolio of on-
trend specialty ceiling
solutions in the world
Consistently
high level of
quality
A “high
touch” service
model

43
A Look Back at The Last 2 Years
Actions
• Established a repeatable growth strategy
• Redeployed resources to most attractive markets
• Built best team in the industry – 30+ new leaders,
organization and talent development
• Expanded global capabilities – new solutions,
advantaged fulfillment, sales excellence
Impact
• Changed the trajectory – from flat sales 2009 – 2011 to
double-digit CAGR 2011 – 2013
• Broad-based growth – 10 of 13 geographic reporting
units with >20% sales growth 2011 – 2013
• Expanded margins while investing for future
Recent AS Projects
Shanghai Center, China
Fisht Olympic Stadium, Sochi Russia
King Abdulaziz Airport, Saudi Arabia

44
Exciting New Solutions Recently Launched
Rapid innovation model driven by the voice of our customers
Concealed
Linear Wood:
Floating modular
panelized wood
with several
staggered visuals
Design
Services:
Collaborative
early design
support to help
customers
realize visions
within budgets
Blades
Concepts:
Flowing
horizontal 3D
wood visuals
and translucent
color effects
Fabric
Ceilings:
Large-format
and point
canopy
solutions with
3D geometry
45
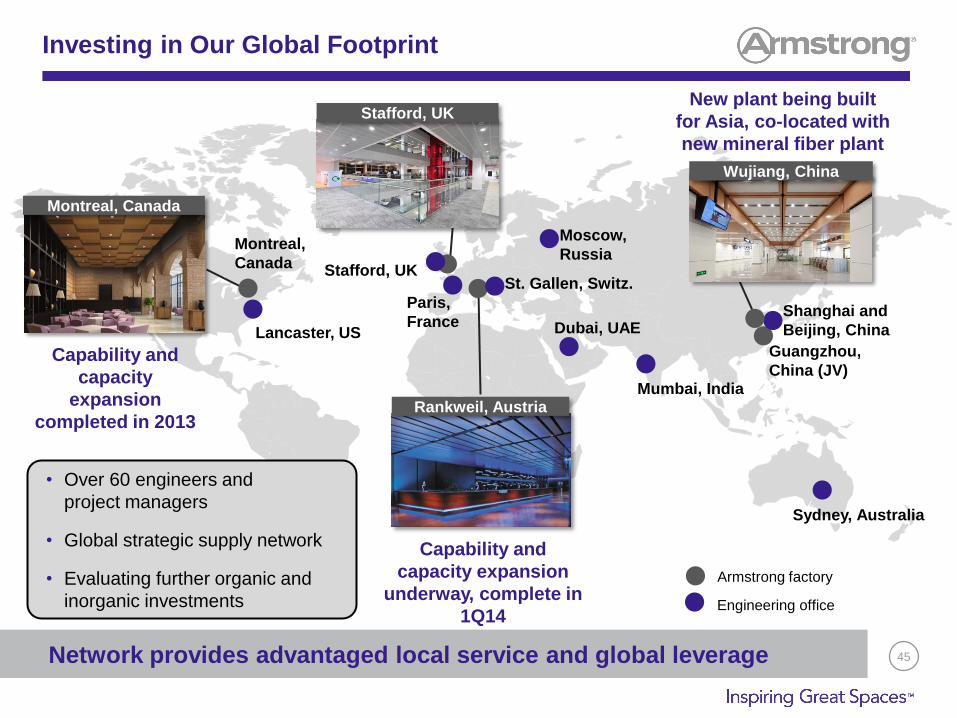
Investing in Our Global Footprint
Network provides advantaged local service and global leverage
Armstrong factory
Engineering office
Montreal,
Canada
Lancaster, US
Stafford, UK
Paris,
France
Moscow,
Russia
St. Gallen, Switz.
Dubai, UAE Shanghai and
Beijing, China
Mumbai, India
Sydney, Australia
Guangzhou,
China (JV) Capability and
capacity
expansion
completed in 2013
Capability and
capacity expansion
underway, complete in
1Q14
New plant being built
for Asia, co-located with
new mineral fiber plant
Stafford, UK
Wujiang, China
Rankweil, Austria
• Over 60 engineers and
project managers
• Global strategic supply network
• Evaluating further organic and
inorganic investments
Montreal, Canada

46
The AS Financial Equation
Big Penetration
Opportunity
Attractive Stand-Alone
Economics
Total Ceilings
Portfolio Synergies
• $2B market opportunity
• Highly incremental –
low cannibalization of
existing sales
An attractive ROIC-accretive global growth engine
• Incremental margin%
same as total ceilings
• ROIC% > total ceilings
• Lower fixed asset
intensity
• Unique multi-product
specifications
• Customer loyalty
driver

47
Architectural Specialties – Summary
• Differentiated approach – deliver enhanced value to our customers
• Attractive economics – incremental growth, high ROIC, portfolio
synergies
• Strategy is working – changed trajectory in last 2 years, broad-based
growth
• Keeping foot on the accelerator – continued capability buildout,
>10% CAGR

Armstrong
Flooring
Overview
Tom Mangas Chief Executive Officer,
Armstrong Flooring

49
Global Flooring
19 Manufacturing Facilities
in 4 Countries
~4,800 Team Members
Worldwide Billion Worldwide Sales
1.5
8,000,000+ Annual Visitors to Global Websites
#1 Flooring Brand
in North America
45% % of Sales from Innovative
New Products Introduced
in the Past 5 Years

50
Global Flooring Revenue Mix
Commercial
40%
Residential
60%
Total Business
Remodel
70%
New
30%
Remodel
75%
New
25%
Commercial Residential
Office 5% - 15% Retail 15% - 25% Education 20% - 30% Healthcare 20% - 30% Other 15% - 25%
Balanced exposure to Residential and Commercial recovery
Sales by End-Use Segment
51
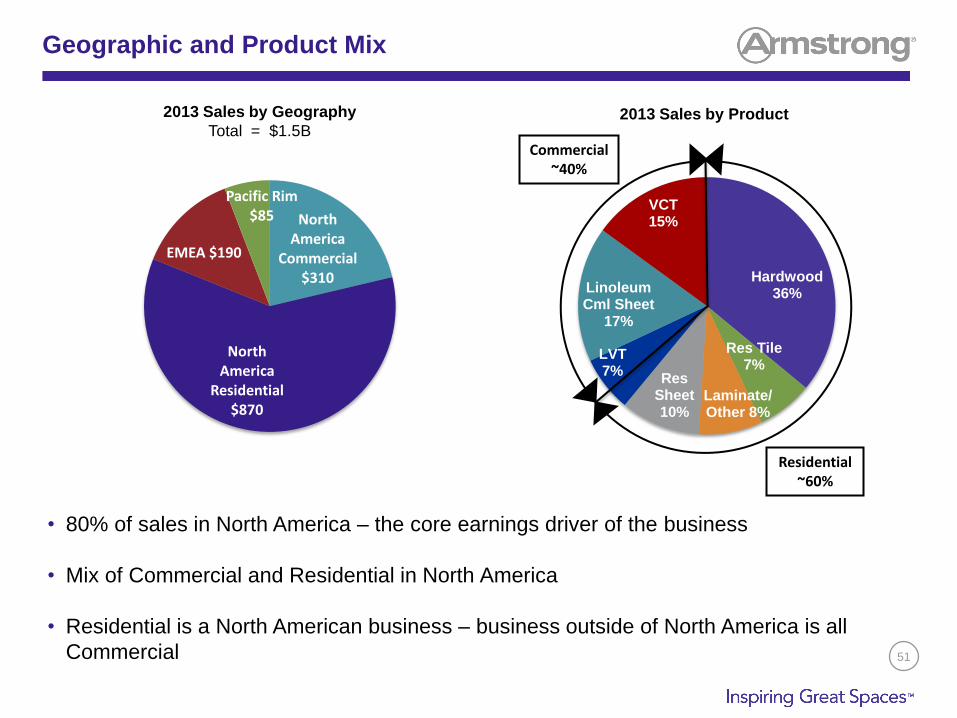
Geographic and Product Mix
• 80% of sales in North America – the core earnings driver of the business
• Mix of Commercial and Residential in North America
• Residential is a North American business – business outside of North America is all
Commercial
2013 Sales by Geography
Total = $1.5B 2013 Sales by Product
North America
Commercial $310
North America
Residential $870
EMEA $190
Pacific Rim $85
Hardwood 36%
Res Tile 7%
Laminate/ Other 8%
Res Sheet 10%
LVT 7%
Linoleum Cml Sheet
17%
VCT 15%
Residential ~60%
Commercial ~40%

52
Global Flooring Total Sales and EBITDA
• Sales down 3% due to volume declines, product exits in Europe and divestiture of the
Patriot distribution business
• EBITDA margins improve almost 300 bps despite volume declines and investments in
China
EB
ITD
A M
arg
in
Global Flooring Sales and EBITDA
Sa
les
($
Mil
lio
ns
)
4.0%
6.0%
8.0%
1,400
1,500
1,600
2010 2013
Sales EBITDA Margin
Aggressively remixing portfolio to faster growth markets and products
while dramatically lowering costs

53
Resilient Flooring
North American performance drives segment profit growth
Sa
les
($
Mil
lio
ns
) E
BIT
DA
Ma
rgin
• Sales down only 2% despite
double digit volume declines
• Margins expand 675 bps
despite negative volume
leverage (manufacturing
productivity, mix and price all
improve)
• Dramatic cost actions have not
been sufficient with European
downturn
• Structurally challenged business
• Sales flat; Weakness in
Australia, but China sales
+60%
• EBITDA margins impacted by
plant / commercial investment
in China and Australian
weakness
5%
10%
15%
20%
600
650
700
2010 2013
Americas
-5.0%
-3.5%
-2.0%
-0.5%
150
250
350
2010 2013
EMEA
-5%
0%
5%
10%
15%
50
75
100
2010 2013
Pacific Rim

54
Wood Flooring
• Residentially focused business has grown sales from the trough, but housing starts and
remodel activity still significantly below long-term averages
• Margins depressed by low volumes and inflation, manufacturing and mix challenges in
2013
Disappointing profitability in 2013 given 16% sales growth vs. 2012
Sa
les
($
Mil
lio
ns
)
Wood Sales and EBITDA
EB
ITD
A M
arg
in
0.0%
3.0%
6.0%
400
500
600
2010 2013
Sales EBITDA Margin

55
Where To Play:
• Win in the Healthcare, Education and
Retail sectors
• Dramatically increase share in fast-
growing LVT
• Protect our leading share position in
VCT in North America
• Drive disproportionate sales and profit
growth in fast-growing emerging
markets
• Improve profitability of Commercial
Sheet platforms
Our Strategy – Commercial Flooring
Goals: Extend leadership share and returns

56
Where To Play:
• Dramatically improve profitability in
the Wood segment
• Significantly increase share in fast-
growing LVT
• Protect our leading share position in
Sheet Vinyl
• Expand accessories and floor care
solutions to sweeten the mix
Our Strategy – Residential Flooring
Goals: Restore wood segment attractiveness and extend leadership
share and margins in residential resilient products

57
How To Win:
• Deliver superior customer and
consumer value through best-in-class
service, quality and product
innovation
• Reduce non value-added costs
through LEAN approach
• Win with winning customers
• Improve gross margins to increase
investment in key business drivers
• Strengthen the product and
geographic portfolio to be more
structurally attractive
• Grow a winning organization
Our Strategy – Flooring Worldwide
Faster innovation, lower costs, stronger customer partnerships

58
Wood – A Cyclical Business
With the right strategy, Wood can deliver above cost of capital through
cycle
• Leadership share in North America; sales still 38% off peak
• At trough volumes in 2011 and 2012, EBITDA margins were +10% and ROIC was +8%
• Nearly $50M in commodity inflation in 2013; estimating another $30-$35M in 2014
• New strategy to cap production, price for anticipated inflation and drive higher mix paid
off in seasonally softer Q1
Sa
les
($
Mil
lio
ns
)
Wood Sales and EBITDA
EB
ITD
A M
arg
in
0.0%
5.0%
10.0%
15.0%
400
500
600
2011 2012 2013 Q1 2014
Sales EBITDA Margin

59
Emerging Market Investments
Aggressively responding to softer market conditions with
countermeasures
Thesis – 2010 • Enormous and fast growing market opportunity in China, Southeast Asia and
India
• Healthcare and Education growing faster than the overall market
• Evolution of building standards drives conversion to resilient flooring
2010 – 2013 • Market volume growth below initial expectations
• Invested in sales and marketing resources and grew sales in China 60%
• Market share in China to #2 from #4 on commercially specified jobs
• China investments were expected to be ROIC accretive in 2015. Now expected to be accretive in 2017
Actions • More aggressive sales and marketing actions in Southeast Asia
• Sustaining investment in SG&A as we still believe in the growth and profitability opportunity
• Reevaluating global supply chain to benefit from lower cost Commercial Sheet production in China

60
Innovation in Commercial Flooring
• Innovation is driving value creation
• Customer preferences driving New Product Development (NPD) efforts
• New to market installation methods provide added value
• Breakthrough coatings to extend product life and reduce maintenance
Natural Creations (LVT) Migrations Tile (BBT) Linoleum
Global new product development focus will bring bigger product
innovations to more markets faster

61
Innovation in Residential Flooring
Luxe™- Luxury Vinyl Plank
Alterna™ – Engineered Stone
American Scrape™ - Hardwood
CushionStep™- Vinyl Fiberglass Sheet
Driving style and design for unique
realistic visuals
Differentiated fastening technologies are
faster and easier to install and repair
Proprietary texturing process creates
an authentic hand crafted look
Proprietary technology replicates the detail,
texture and variation of natural stone
Design, styling, materials and performance drive consumer purchases

62
Innovation in Installation and Durability
• TRUESHIELD™ is a hydrophobic coating
for homogeneous sheet flooring Reduces maintenance costs
Lower cost of ownership
Resists scuff, stain & scratch
TRUESHIELD™ FLIP™ FasTak iset™
First-to-market with meaningful solutions
• FLIP™ is a hand-held spray adhesive Permanent & Fast drying
• FasTak™ & iset™ are factory applied
adhesive systems for residential and
commercial LVT Immediate occupancy, no wet glue
Fast & easy install, repair, and replace

63
• LVT is the fastest growing product in
the resilient flooring segment
• Armstrong realizing double digit
growth
• Category has reached the scale
where manufacturing vs. sourcing
makes sense
• $41M capital investment within
existing Lancaster, PA floor site to
produce ~$150M of products
• High IRR investment enabling share
gain, cost savings, better customer
service and lower working capital
Luxury Vinyl Tile

64
Retail Case Study –
Why Armstrong
Product Solutions • Design Leadership • Brand Recognition
• LVT in all stores / BBT in most stores
• Bamboo & striated visual
• Environmental statement (bio-based tiles)
• Local access, fast installation and easy to maintain
Partnership
Consultative • Service • Reliability
• 2012: Striations bio-based tile as a prototype
• 2013: Over 420 stores refurbished
• 2014: Planning over 460 locations (continued expansion 2015)
Sector: Refresh drives traffic – likely source of pent up demand

65
Respected Healthcare (HC) Solutions
• Armstrong brand and service well respected globally
• Medintech® and Medintech Plus® are recognized HC
standards
• Armstrong linoleum, homogeneous and heterogeneous
flooring are known for HC performance and design
• Brand promise and product performance command
premium
Armstrong Recognized as HC Standard
• Armstrong product innovations meet functionality needs: Heavy load compatibility, sanitary guidelines, energy efficiency,
superior coatings, non-intrusive maintenance
Global Demand
• Asia and Middle East growth includes HC expansion with
public and private resources
• Competition in HC industry drives remodel and
renovation
Armstrong in Healthcare
Private Hospital, Shanghai, China
(Phase I)
Phoenix Children’s Hospital, Phoenix, AZ
Healthcare expansion and remodel provides global opportunity

66
• Resilient flooring is a valuable
franchise with significant
incremental margins
• Executing our plan to restore
Wood structural attractiveness
• Driving strong growth in emerging
markets
• Better utilizing our global footprint
to lower costs and speed
innovation
• Clear strategies to win
Armstrong Flooring – Summary
Financial
Summary
Dave Schulz
Chief Financial Officer,
Armstrong World Industries

68
• Positioned to benefit from North
American commercial recovery
• Capture growth in established
international and emerging
markets
• Maintain a flexible balance sheet
to execute opportunistic
acquisitions
• Generate significant free cash
flow to fund investments and
return value to shareholders
Focused on Value Creation
ROIC is our key long-term financial metric

69
0
100
200
300
400
500
600
700
800
2006 Price / Mix Volume Input Costs Mfg Costs SG&A WAVE PensionCredit
2013
($ M
illi
on
s)*
EBITDA History
Discrete cost-out program 2010
– 2012 drove over $200M of
savings in SG&A and
Manufacturing
Significant volume erosion since peak earnings
$400 $370
$310
($430)
($195)
$105 $15
($50) $215
*Bridge figures rounded to nearest $5M
EBITDA History 2006 – 2013

70
• Created and maintained an efficient balance sheet
• Prioritized investments in capital expenditures to drive global growth
• Returned surplus cash via special dividends and share repurchase
• Cash generation aided by low cash tax rate from Chapter 11 Net Operating Loss (NOL) carry-forward
0.00
500.00
1,000.00
1,500.00
2,000.00
2,500.00
YE 2009 Borrowing Cash Flow fromBusiness
Capex SpecialDividends
Sharerepurchase
YE 2013
$570
($655)
($260) ($1,300)
$600
Cash Flow History
Significant cash investments and returns to shareholders
$1,180
$135
($ M
illi
on
s)
*Bridge figures rounded to nearest $5M
Cash Flow History 2009 – 2013
Includes
$275M of
strategic
investments
71
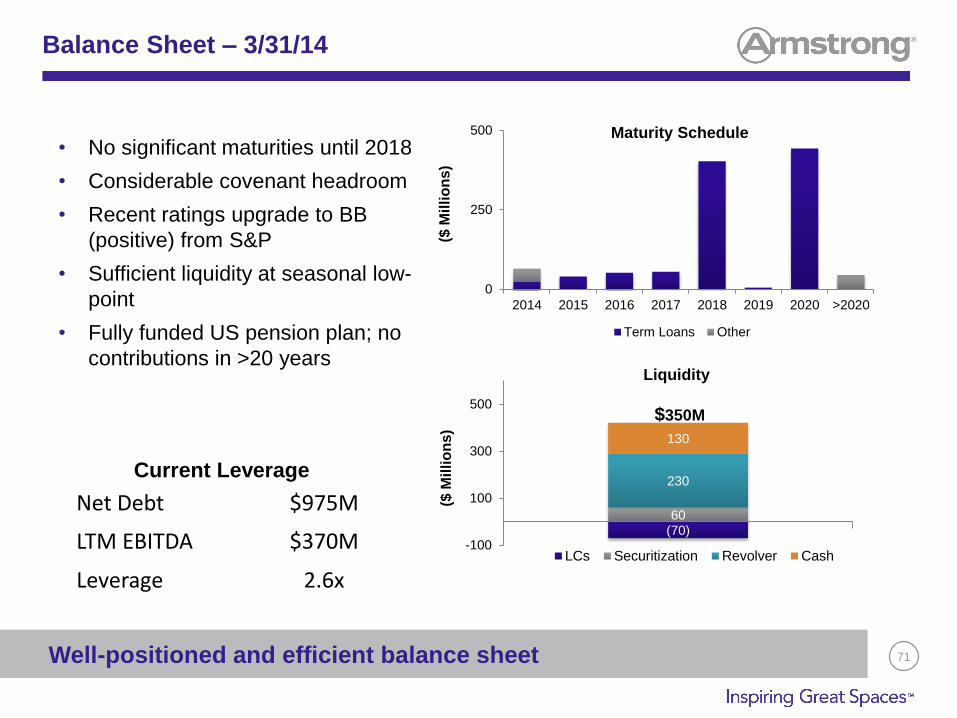
Balance Sheet – 3/31/14
Well-positioned and efficient balance sheet
Net Debt $975M
LTM EBITDA $370M
Leverage 2.6x
• No significant maturities until 2018
• Considerable covenant headroom
• Recent ratings upgrade to BB
(positive) from S&P
• Sufficient liquidity at seasonal low-
point
• Fully funded US pension plan; no
contributions in >20 years
Current Leverage
(70) 60
230
130
-100
100
300
500
($ M
illi
on
s)
Liquidity
LCs Securitization Revolver Cash
$350M
0
250
500
2014 2015 2016 2017 2018 2019 2020 >2020
($ M
illi
on
s)
Maturity Schedule
Term Loans Other

72
Mid-Cycle Outlook
• Volumes in North America and Europe down >30% from peak in 2007
Price and mix gains partially mask the severity of the downturn
• “Mid-cycle” occurs when market conditions support recovery of 2/3 of
volume vs. peak in 2007
Timing of end-use sector likely to be uneven
Residential leads
Office then retail follow
Healthcare and education lag
Market recovery key to sales and profit rebound
*Data lagged to correspond to timing of Armstrong sales
0
600
1200
1800
0
300
600
900
1200
2007 2010 2013
Housing Starts
Non-Residential Starts* Housing Starts*
No
n-R
esid
en
tia
l S
tart
s (
M s
q f
t)
Ho
usin
g S
tarts
(K)

73
Mid-Cycle Sales
• Market recovery
• Continued price and mix gains
• Outsized sales growth in emerging markets and via Architectural Specialties
Significant volume growth opportunities, plus price and mix
50%
70%
90%
110%
0
1,000
2,000
3,000
4,000
2007 - Sales Peak 2010 - Sales Trough 2013 - Volume Trough Mid-cycle
Sale
s ($
Mill
ion
s)
Sales: 2007 – Mid-cycle
Ceilings Resilient Wood Volume
$2.6 $2.7
$3.5 - $3.7 $3.3
74
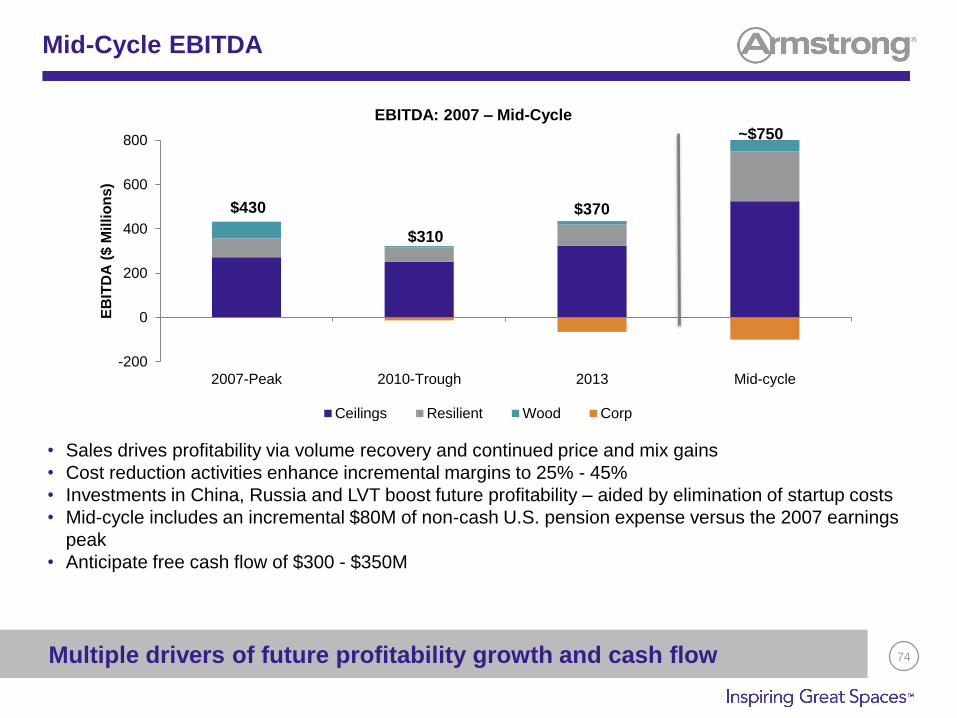
• Sales drives profitability via volume recovery and continued price and mix gains
• Cost reduction activities enhance incremental margins to 25% - 45%
• Investments in China, Russia and LVT boost future profitability – aided by elimination of startup costs
• Mid-cycle includes an incremental $80M of non-cash U.S. pension expense versus the 2007 earnings
peak
• Anticipate free cash flow of $300 - $350M
-200
0
200
400
600
800
2007-Peak 2010-Trough 2013 Mid-cycle
EB
ITD
A (
$ M
illi
on
s)
EBITDA: 2007 – Mid-Cycle
Ceilings Resilient Wood Corp
Mid-Cycle EBITDA
Multiple drivers of future profitability growth and cash flow
$430
$310
$370
~$750
75
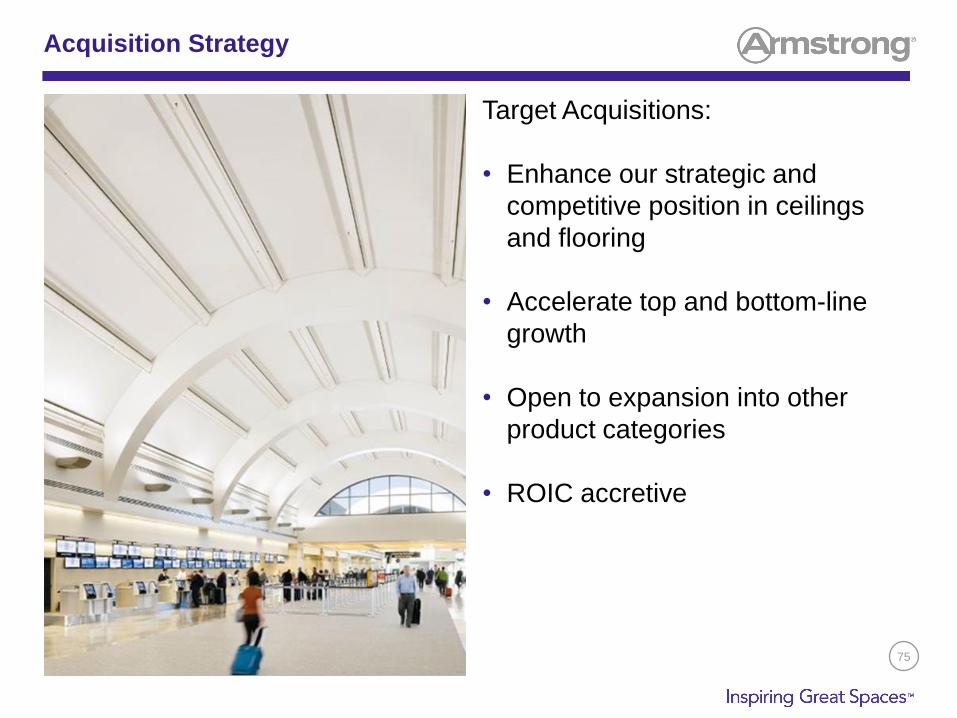
Acquisition Strategy
Target Acquisitions:
• Enhance our strategic and
competitive position in ceilings
and flooring
• Accelerate top and bottom-line
growth
• Open to expansion into other
product categories
• ROIC accretive

76
• Free cashflow will increase
significantly as plant builds wind
down in early 2015 Partially offset by increased US cash
taxes as foreign tax credits are
consumed in 2014 and 2015
• Prioritize use of capital Capital expenditures to drive organic
growth
Acquisitions
Return value to shareholders
(dividends and/or share repurchases)
• Target 2-3x net leverage on trailing
12-month EBITDA
Capital Deployment
Future cash distributions likely to be less episodic than in the past

Closing
Comments
Matthew Espe Chief Executive Officer,
Armstrong World Industries

78
• Protect and grow our North
American businesses
• Invest and grow in key international
and emerging markets
• Optimize our portfolio – ongoing
evaluation of strategic opportunities
by business, by geography and
across the company
• Seek adjacent opportunities to
expand our product line and
geographic reach
• Build on our core competency of
driving specifications in the architect
and designer communities while
working with our distribution partners
to create and enhance value
Armstrong’s Business Priorities

Armstrong
World
Industries
Appendix

80
Armstrong Attendees
Speakers
• Matthew Espe, Chief Executive Officer
• Dave Schulz, Chief Financial Officer
• Victor Grizzle, Chief Executive Officer Armstrong Ceilings
• Thomas Mangas, Chief Executive Officer Armstrong Flooring
• Michael Shirk, VP, Global Architectural Specialties Armstrong Ceilings
• Thomas Waters, VP, Treasury & Investor Relations
Armstrong Ceilings
• Charlie Chiappone, CEO, WAVE
• David Cookson, SVP, Americas Armstrong Ceilings
• Russell Mitchell, SVP of Global Technologies Armstrong Ceilings
• Joann Davis Brayman, VP, Americas Commercial Marketing
Armstrong Ceilings

81
Armstrong Attendees
Armstrong Flooring
• Dennis Schemm, VP, Global Finance Armstrong Flooring
• Dominic Rice, VP & GM, North America Commercial Armstrong Flooring
• Charles Grogan, VP, Global Operations Armstrong Flooring
• Tom Ellis, VP, Global Commercial Marketing Armstrong Flooring
• Mara Villanueva-Heras, VP, Residential Marketing Armstrong Flooring
• Denise Bird, GM, Global New Product Development Armstrong Flooring
Corporate
• Ellen Romano, SVP, Human Resources
• Don Maier, SVP, Global Operations
• Steve Poole, VP, Global Business Development & Corporate
Communications
• Mark Hershey, General Counsel & Chief Compliance Officer
• Chris Parisi, VP & Assoc. General Counsel Corporate Governance
• Jennifer Johnson, Sr. Mgr., Global Corporate Communications & Public
Affairs
• Kristy Rohrbaugh, Mgr., Investor Relations
• Leighann Tully, Finance Assoc., Investor Relations

82
In July 2010, Matthew J. Espe was appointed CEO of Armstrong World Industries, Inc., in Lancaster, Pennsylvania. He brings 30 years of experience in sales, marketing, distribution and management in global manufacturing businesses to Armstrong from his previous position at Ricoh Americas Corporation, a subsidiary of Ricoh Company, Ltd., where he served as Chairman and CEO. Prior to this role, Mr. Espe was Chairman and CEO of IKON Office Solutions, Inc., a $4 billion office equipment distributor and services provider with 24,000 employees. The company was acquired by Ricoh in 2008. Before joining IKON in 2002, Mr. Espe was president and CEO of GE Lighting. In a career that spanned 22 years there, he managed multiple functional areas, including sales, marketing, distribution and manufacturing as well as management within several business units. Along with a wealth of experience, he also brings a finely-tuned global perspective, having led businesses in Europe, Asia and North America. Mr. Espe is also a member of the board of Unisys Corporation. He is an active volunteer and member of the board of United Way of Southeastern Pennsylvania. He graduated from the University of Idaho and has an MBA from Whittier College.
Matthew J. Espe
Chief Executive Officer

83
David S. Schulz is senior vice president and CFO of Armstrong
World Industries, Inc., in Lancaster, Pennsylvania.
Mr. Schulz joined Armstrong in 2011 as vice president, finance for
Armstrong Building Products. Prior, he served as CFO of Procter &
Gamble Company’s Americas snacks division, and from 2008 to
2009 as the finance director for the Coffee business unit of the J.M.
Smucker Co. following the merger of P&G’s Folgers Coffee Co. with
Smucker. His experience covers a wide range of finance leadership
positions encompassing operational finance, planning and analysis,
mergers and acquisitions, and financial reporting. Well known as a
strong business partner, Mr. Schulz actively engages with other
functions to drive improvement. Prior to joining Procter & Gamble,
Mr. Schulz was an officer in the United States Marine Corps.
He earned his bachelor’s degree in finance from Villanova University
in 1987 and a master’s degree in management from the U.S. Naval
Postgraduate School in 1993.
David S. Schulz
Chief Financial Officer

84
Victor “Vic” Grizzle is executive vice president and CEO, Armstrong
Ceilings, in Lancaster, Pennsylvania.
Mr. Grizzle has 23 years of experience in process improvement,
sales, marketing and global business leadership. He comes to
Armstrong from Valmont Industries, a $2 billion global leader of
infrastructure support structures for utility, telecom and lighting
markets, and manufacturer of mechanized irrigation equipment for
large scale farming, where he was group president of Global
Structures, Coatings and Tubing since 2005. Prior to Valmont, Mr.
Grizzle was president of the commercial power division of
EaglePicher Corporation, a $700 million diversified manufacturer
and marketer of advanced technology and industrial products for
space, defense, automotive, filtration, pharmaceutical, environmental
and commercial applications. Before that, he spent 16 years at
General Electric Corporation.
Mr. Grizzle graduated from California Polytechnic University with a
Bachelor of Science in Mechanical Engineering.
Victor Grizzle
Chief Executive Officer Armstrong Ceilings
85
Thomas B. Mangas is executive vice president and CEO of
Armstrong Floor Products Worldwide, in Lancaster, Pennsylvania.
Mr. Mangas joined Armstrong in February 2010 as senior vice
president and Chief Financial Officer. In November of 2013, he was
appointed executive vice president and CEO of Armstrong’s global
flooring business. Prior to Armstrong, he was vice president and
CFO of the $28 billion beauty and grooming business of Procter &
Gamble Co. after a steady progression of finance roles at that
company. He has broad domestic, international and global
experience including implementing tough cost management
initiatives, exploiting new growth opportunities, product innovation,
acquisition integration, strategic planning, resource allocation, and
organization development.
He earned his bachelor’s degree in Economics and History from the
University of Virginia in 1990.
Thomas B. Mangas
Chief Executive Officer Armstrong Flooring

86
Michael F. Shirk is Vice President, Worldwide Architectural
Specialties, of Armstrong World Industries, Inc., and he is based in
Lancaster, PA.
Mr. Shirk became Vice President, Worldwide Architectural
Specialties in July 2011 and has responsibility for developing and
growing the specialty ceilings business globally. Mr. Shirk joined
Armstrong in late 2009 as Vice President, Business
Development. He came to Armstrong from Bain and Company,
where he led a variety of strategy and performance improvement
programs in the industrials, technology and consumer products
industries. Prior to Bain, he worked at Lockheed Martin Corporation
in various sales, operations and engineering roles.
Mr. Shirk is a member of the Board of The High Companies, a
diversified industrial manufacturer and commercial real estate
company. He earned a BS in Mechanical Engineering from Bucknell
University, an MS in Mechanical Engineering from University of
Pennsylvania and an MBA from MIT’s Sloan School of
Management.
Michael F. Shirk
VP, Global Architectural Specialties Armstrong Ceilings

87
Thomas J. Waters is Vice President, Treasury and Investor Relations
of Armstrong World Industries, Inc.
Mr. Waters joined Armstrong in 1998 as Manager, Capital Markets.
Since then he has held the positions of Director of Investor
Relations, General Manager of Finance and IT for Building Products
Europe, General Manager Financial Planning and Analysis for North
American Floor Products. He was named Treasurer in 2008, and
added investor relations responsibilities in 2010.
Prior to Armstrong, Mr. Waters worked for American Airlines in
Dallas, TX in both Treasury and Operational Finance roles.
Mr. Waters earned a BA from Binghamton University, and a MBA
from the Walter A. Haas School of Business at the University of
California, Berkeley.
Thomas J. Waters
VP, Treasury & Investor Relations

88
Kristy Rohrbaugh is Investor Relations Manager of Armstrong World
Industries, Inc., in Lancaster, Pennsylvania.
Ms. Rohrbaugh became Investor Relations Manager in December of
2010 and has responsibility for managing all external investor
communications. Ms. Rohrbaugh joined Armstrong in November of
2008 as External Reporting Manager.
Prior to Armstrong, Ms. Rohrbaugh spent over 5 years in public
accounting as an auditor and advisor to clients in the construction
engineering, banking, utility, and manufacturing industries with a
focus on SEC reporting and Sarbanes-Oxley compliance. Ms.
Rohrbaugh is also a Certified Public Accountant and member of the
AICPA. She previously served as Treasurer of the York Hospital
Auxiliary, a Wellspan affiliated non-profit organization.
Ms. Rohrbaugh earned a bachelor of science with dual degrees in
Business Administration and Accounting, and an MBA from York
College of Pennsylvania.
Kristy S. Rohrbaugh
Manager, Investor Relations

89
Investor Relations Contact Information
Kristy Rohrbaugh, CPA, MBA
Investor Relations Manager
Armstrong World Industries
2500 Columbia Avenue
Lancaster, PA 17604
P: 717-396-6354
F: 717-396-6128
Thomas J. Waters
VP, Treasury and Investor Relations
Armstrong World Industries
2500 Columbia Avenue
Lancaster, PA 17604
P: (717) 396-6354
F: (717) 396-6136