Embed Size (px)
Citation preview

ARMY 2020 DATA - INFANTRY RESTRUCTURING Following the Strategic Defence and Security Review (SDSR) in 2010 a wide ranging study into the
future size and structure of the Army was initiated by the Chief of the General Staff (CGS). This
study, known as Army 2020, took note of the anticipated requirements outlined in the SDSR report
along with the plans outlined in the Defence Transformation announcement of 18 July 2011 for an
integrated Army of 120,000 consisting of 82,000 regular personnel, 30,000 trained reservists and a
margin for 8,000 Reservists in training, and proposed a future Army structure that would be able to
meet these.
The outcome of this study was announced in the House on 5 July (Official Report 5 July 2012:
Column 1085) and included the decision that the Army would reduce the number of Infantry
battalions in the Army’s Order of Battle from 36 to 31 battalions.
The Army took account of a number of criteria in reaching the decision on which battalions would
be withdrawn. These were:
• maintaining a Regimental system which is largely regionally aligned;
• demographic sustainability of Regiments according to projected regional supply of recruits
in the 2020 timeframe;
• proportionality of outcome, with no Regimental cap badge deletions and no regiment losing
more than one battalion in a re-organisation;
• balancing the whole Infantry structure to maintain variety of roles and parity of opportunity
of experience for officers and soldiers;
• taking account of previous decisions on mergers and deletions;
• historical manning performance; and
• ensuring a solution that the Army would see as fair and equitable.
Drawing on demographic data produced by the Office for National Statistics for the age cohort
across the UK from which Infantry recruits are typically drawn (15-29 age group), and taking
account of historical trends in terms of the percentage of that cohort likely to join the Army, an
assessment was made of which regiments were likely to be the least sustainable in the future if
they retained their current structure. This work also included a comparison of each regiment’s
historical outflow so the likely recruiting requirement could be determined.
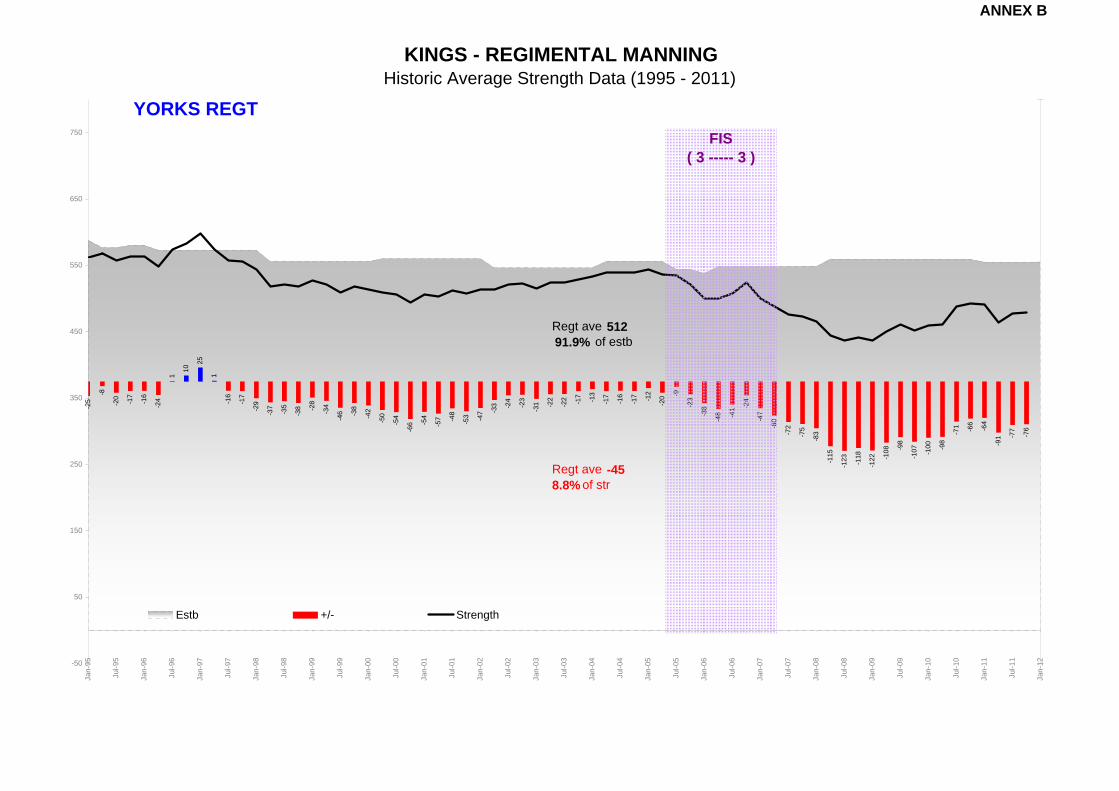
The Army’s analysis showed that those regiments likely to be the least sustainable in future were
the Royal Regiment of Scotland (predicted to be 1.75 battalions short), The Yorkshire Regiment
(predicted to be 0.8 battalions short), The Mercian Regiment (predicted to be 0.56 battalions short)

and the Royal Welsh Regiment (predicted to be 0.55 battalions short). It was therefore decided to
remove one battalion from each of these regiments.
After the removal of these four battalions, and taking account of the criteria that there should be no
Regimental cap badge deletions and no regiment losing more than one battalion, determining the
fifth battalion to be withdrawn required the application of criteria that went wider than
demographics.
Taking account of the need to maintain equity of opportunity across the Infantry Divisions and
therefore having discounted those regiments that were already losing a battalion, and those which
were single battalion regiments, options were reduced to taking a battalion from one of four
Divisions of Infantry:
The Rifles.
The Parachute Regiment
The King’s Division: The Duke of Lancaster’s Regiment, The Yorkshire Regiment.
The Queen’s Division: The Princess of Wales’s Royal Regiment, The Royal Regiment of
Fusiliers (RRF), The Royal Anglian Regiment.
The Rifles were discounted as they had already undergone the most Regimental amalgamation
during the last two reorganisations and demographic projections suggested that they will remain
the most strongly manned out to 2020. The Parachute Regiment was excluded on account of its
specific and unique role. The King’s Division had already been reduced under the Future Infantry
Structure (FIS) of 2005, taking it from six battalions to five, and was to be reduced again to four
battalions by having a Yorkshire Battalion earmarked for removal from the Order of Battle. Taking
this into account, the Army decided that the remaining Infantry battalion ought to be found from The
Queen’s Division Regiments; this Division had not been affected by the FIS reductions of 2005,
had retained the same scale of three Regiments, each with two battalions, since 1994, and would
otherwise have had six battalions in comparison to other Divisions with five or less.
When reviewing manning performance from across The Queen’s Division, the RRF, with average
historical undermanning of 13.3% since FIS, proved to be the historically least well manned of the
three regiments and was therefore determined to be the one from which a battalion should be
withdrawn.
After the withdrawal of five battalions from across the Infantry, the Army’s analysis showed that
future manning should be sustainable with sufficient recruits predicted to fill the necessary posts
across all battalions.

The key information used by the Army to inform the decisions made is attached in the following annexes. List of Annexes Annex A – A Record of British Infantry Amalgamation and Disbandment – 1958 to 2007 This is a historic chart showing how the Infantry has changed structurally since 1958, including previous amalgamations and disbandments. Annex B - Historic Manning Data Manning data is provided at Divisional, Regimental and Battalion level. These sheets show the following
a. Required manning level (the establishment) - shaded gray. b. Actual manning level (the strength) – black line c. Over and under manning (surplus/deficits) - red and blue bars
This data has been compiled from the Infantry Battalion Strength Report which is produced quarterly using manning figures provided by individual battalions. It is a readily available source of data. The sheets also highlight the Future Infantry Structure (FIS) period which was the last significant change in Infantry structures. The data also marks where operational deployments have been undertaken. This historic data was not the primary decision making tool. It was only used once the forward looking demographic data had identified the first four battalions for withdrawal. Annex C - Average Infantry Battalion Manning This sheet was developed from the historic manning data and summarises the historic average surplus and deficit strength by battalion and ranks them in order of manning. Annex D - Infantry Battalion Outflow A set of three sheets showing the percentage outflows against strength by Battalion due to completion of service, premature voluntary release (PVR) and services no longer required (SNLR). There are a number of reasons why personnel may opt for PVR – both personal and service related. Personnel may leave the Army due to SNLR for a number of administrative reasons, not all of which imply that the individual is at fault in any way. Outflow was not a major influencing factor in the decision making process. There are so many variants– both personal decisions and service constraints - which contribute to outflow that it was not considered a reasonable driver for deletions. Annex E - Commenting on the Logical Integrity of Regional Definitions/Boundaries This sets out the difference between the existing Regional Boundaries used in the Army’s recruiting activities and the UK’s political and economic regional boundaries. This is important as the data used by the Army to determine the future demographics was collected from the Office for National

Statistics (ONS) website and is based on slightly different geographic areas. The data had to be adjusted to reflect actual Infantry recruiting areas. It includes two maps which show the variation. Annex F - Population Projection by the Office for National Statistics This is an extract of 2010 data from the Office for National Statistics (ONS) showing the population projection out to 2020. ONS source data: 2010 - Based National Population Projections - published 23 November 2011 Annex G - Sustaining Regional Infantry Regiments – Recruiting Pool This chart shows the number of males in the age bracket 15 to 29 years (which is the current Infantry recruiting pool) in both 2010 and 2020. The data has been derived from ONS source data: 2010 - Based National Population Projections - published 23 November 2011 (Annex F). Annex H - Estimate of Sustainability These tables show the outcome of the demographic work on how many battalions of manning are sustainable in the future. Annex I - Sustaining Regional Infantry Regiments There are three sets of this data at Regional, Divisional and Regimental level showing how we expect recruiting performance to vary between 2010 and 2020 in line with ONS population projections (Annex F). Each set of data has also been produced three times – baseline forecast, optimistic and pessimistic – to acknowledge that we have had to make some assumptions on how the population may change, thereby giving an expected view along with best and worst case scenarios. Annex J - Assessment of Future Demographic Supply in Relation to Regimental Demand This sheet shows how regimental sustainability will change as successive Battalions are removed, and which should be next in line for removal based solely on demographic information. It should be noted that after the removal of four battalions, and taking account of the criteria that there should be no Regimental cap badge deletions and no regiment losing more than one battalion, determining the fifth battalion to be withdrawn required the application of criteria that went wider than demographics.

1992 - 1994
1992 - 1994
A Record of British Infantry Amalgamation and Disbandment - 1958 to 2007
1st Bn Grenadier Guards
2nd Bn Grenadier Guards
1st Bn Coldstream Guards
2nd Bn Coldstream Guards
1st Bn Scots Guards
2nd Bn Scots Guards
1st Bn Irish Guards
1st Bn Welsh Guards
The Royal Scots
The Royal Scots Fusiliers
The King's Own Scottish Borderers
The Black Watch
The Queen's Own Cameron Highlanders
The Gordon Highlanders
The Argyll and Sutherland Highlanders
The Cameronians
The Highland Light Infantry
Seaforth Highlanders
The Devonshire Regiment
The Dorset Regiment
The Cheshire Regiment
The Royal Welch Fusiliers
The South Wales Borderers
The Welch Regiment
The Gloucestershire Regiment
The Worcestershire Regiment
The Sherwood Foresters
The Royal Hampshire Regiment
The South Staffordshire Regiment
The North Staffordshire Regiment
The Royal Berkshire Regiment
The Wiltshire Regiment
The King's Shropshire Light Infantry
The Somerset Light Infantry
The Duke of Cornwall's Light Infantry
The King's Own Yorkshire Light Infantry
The Durham Light Infantry
The Oxfordshire and Buckinghamshire Light Infantry
The King's Royal Rifle Corps
The Rifle Brigade
1st Bn The Parachute Regiment
2nd Bn The Parachute Regiment
3rd Bn The Parachute Regiment
1 GREN GDS
1 IG
1 WG
1 COLDM GDS
1 SG
The Royal Highland Fusiliers1 SCOTS
2 SCOTS
3 SCOTS
4 SCOTS
5 SCOTSQueen’s Own Highlanders The Highlanders
1 PARA / SFSG
2 PARA
3 PARA
The Devonshire and Dorset Regiment
The Staffordshire Regiment
The Duke of Edinburgh’s Royal Regiment
The Royal Regiment of Wales
The Worcestershire and Sherwood Foresters Regiment
The Somerset and Cornwall Light Infantry
1st Green Jackets
2ND Green Jackets
3rd Green Jackets
1st Bn The Light Infantry
2nd Bn The Light Infantry
3rd Bn The Light Infantry
1st Bn The Royal Green Jackets
2nd Bn The Royal Green Jackets
3rd Bn The Royal Green Jackets
The Royal Glostestershire, Berkshire and Wiltshire Regiment
1st Bn The Light Infantry
2nd Bn The Light Infantry
1st Bn The Royal Green Jackets
2nd Bn The Royal Green Jackets
1 RIFLES
2 RIFLES
3 RIFLES
4 RIFLES
5 RIFLES
1 MERCIAN
2 MERCIAN
3 MERCIAN
1 R WELSH
2 R WELSH
The King's Own Royal Regiment
The Border Regiment
The King's Regiment
The Manchester Regiment
The Duke of Wellington's Regiment
The York and Lancaster Regiment
The King's Own Royal Border Regiment
The King's Regiment(Manchester & Liverpool) The King's Regiment
2 YORKS
1 YORKS
3 YORKS
1 LANCS
2 LANCS
The South Lancashire Regiment
The Loyal Regiment
The East Lancashire RegimentThe Lancashire Regiment
The Queen’s Lancashire Regt
The Royal Inniskilling Fusiliers
The Royal Ulster Rifles
The Royal Irish Fusiliers
1st Bn The Royal Irish Rangers
2nd Bn The Royal Irish Rangers1 R IRISH
The West Yorkshire Regiment
The East Yorkshire Regiment
The Green Howards
The Queen's Royal Regiment
The East Surrey Regiment
The Buffs
The Queen's Own Royal West Kent Regiment
The Royal Sussex Regiment
The Middlesex Regiment
The Queen's Surrey Regiment
The Queen's Own Buffs
1st Bn The Queen's Regiment
2nd Bn The Queen's Regiment
3rd Bn The Queen's Regiment
1 PWRR
2 PWRR
The Royal Norfolk Regiment
The Suffolk Regiment
The Royal Lincolnshire Regiment
The Northamptonshire Regiment
The Essex Regiment
The Bedforshire and Hertfordshire Regiment
The Royal Leicestershire Regiment
1st East Anglian Regiment
2nd East Anglian Regiment
3rd East Anglian Regiment
1st Bn The Royal Anglian Regt
2nd Bn The Royal Anglian Regt
3rd Bn The Royal Anglian Regt
1 R ANGLIAN
2 R ANGLIAN
The Royal Northumberland Fusilier
The Royal Warwickshire Regiment
The Royal Fusiliers
The Lancashire Fusiliers
The Royal Warwickshire Fusiliers
1st Bn The RoyalRegt of Fusiliers
2nd Bn The Royal Regt of Fusiliers
3rd Bn The RoyalRegt of Fusiliers
1 RRF
2 RRF
2006 - 2007
2006 - 2007
1964 - 1970
1964 - 1970
1958 - 1963
1958 - 1963
Prince of Wales’s Own Regt of Yorkshire
Current StructureFISOptions for Change
Amalgamation
Disbandment
RN/RMRAF
Army
Grenadier Guards
Coldstream Guards
Scots Guards
Irish Guards
Welsh Guards
Royal Regiment of Scotland
Duke of Lancaster’s Regiment
Yorkshire Regiment
Royal Irish Regiment
Royal Anglian Regiment
Royal Regiment of Fusiliers
Princess of Wales’s Royal Regiment
Royal Welsh Regiment
Mercian Regiment
The Rifles
Parachute Regiment
2:1.2
2:1.2
2:1.2
1:1
9:5
4:3
3:1
7:2
7:2
7:2
3:2
3:3
1:1
4:2
13:5
5:3
1958:2012
+ PDIC
+ PDIC
+ PDIC
ANNEX A

ANNEX A
THIS PAGE IS INTENTIONALLY BLANK

ANNEX B
DIVISIONAL MANNINGHistoric Strength Data (1995 - 2011)
THE GUARDS DIVISION (incl PDICs)14
8
69
-7
-89
-143
-284
-355
-300
-305
-352
-360
-319
-329
-348 -336 -3
20 -291
-222 -210
-68
-4
53
18
-31
-1
56
-64 -57
-18
-37
-91
-116
-151
-264
-330
-215
-151 -1
17
-149
-188 -1
54
-246
-268
-412
-409
-440 -428 -419
-347
-240
-240
-290
-235 -2
14
-277
-392
-312
-264
-112
-149
-74
-79
-92 -6
7
-74
-155
-205 -197
-250
250
750
1250
1750
2250
2750
3250
3750
4250Ja
n-95
Jul-9
5
Jan-
96
Jul-9
6
Jan-
97
Jul-9
7
Jan-
98
Jul-9
8
Jan-
99
Jul-9
9
Jan-
00
Jul-0
0
Jan-
01
Jul-0
1
Jan-
02
Jul-0
2
Jan-
03
Jul-0
3
Jan-
04
Jul-0
4
Jan-
05
Jul-0
5
Jan-
06
Jul-0
6
Jan-
07
Jul-0
7
Jan-
08
Jul-0
8
Jan-
09
Jul-0
9
Jan-
10
Jul-1
0
Jan-
11
Jul-1
1
Jan-
12
Estb +/- Strength
FIS( 5 ----- 5 )
-192Div ave6.7% of str
2874Div ave93.7% of estb

ANNEX B
FT GDS - BATTALION MANNINGHistoric Strength Data (1995 - 2011)
559
1 GREN GDS (incl PDIC)
110
70
54
8
-7
-42
-68
-67
-87
-109
-118
-118
-119 -113
-95
-106
-105
-89
-124
-66
-41
-64
-84
-61
-36
-14
-35 -2
5
-23 -18
-34
-34 -2
6
-72
-71
-43
-24 -1
0
2
-2
8
0
-22
-84
-30
-56 -4
2
-56
-60
-20
-6
-34
-59
-74 -70 -6
1
-27
-34
17
5
47
15
43
55
33
20
-7
0
-50
50
150
250
350
450
550
650
750
Jan-
95
Jul-9
5
Jan-
96
Jul-9
6
Jan-
97
Jul-9
7
Jan-
98
Jul-9
8
Jan-
99
Jul-9
9
Jan-
00
Jul-0
0
Jan-
01
Jul-0
1
Jan-
02
Jul-0
2
Jan-
03
Jul-0
3
Jan-
04
Jul-0
4
Jan-
05
Jul-0
5
Jan-
06
Jul-0
6
Jan-
07
Jul-0
7
Jan-
08
Jul-0
8
Jan-
09
Jul-0
9
Jan-
10
Jul-1
0
Jan-
11
Jul-1
1
Jan-
12
Estb +/- Strength
FIS( 1 ----- 1 )
604Bn ave94.5% of estb
-35Bn ave5.9% of str
|---- H6 ----| |--- H11 ---|

ANNEX B
FT GDS - BATTALION MANNINGHistoric Strength Data (1995 - 2011)
1 COLDM GDS (incl PDIC)
33
14
-10
-10
-16
-29 -25
5 7
-33
-40 -34
-46
38
8
25 33 36 40
80
111
111
45 41
50
8
-2
-29
38
27
5
-2
-10
-23
-74
-46
-23 -18
-22
-45
-51
-53 -49 -43
-63 -4
8
-65 -5
6
-54
-23
-34
-44
-18 -1
0
-55
-63
-63
-68
-29
-27 -24
-54
-59 -4
4
-49
-54 -50 -44
-50
50
150
250
350
450
550
650
750
Jan-
95
Jul-9
5
Jan-
96
Jul-9
6
Jan-
97
Jul-9
7
Jan-
98
Jul-9
8
Jan-
99
Jul-9
9
Jan-
00
Jul-0
0
Jan-
01
Jul-0
1
Jan-
02
Jul-0
2
Jan-
03
Jul-0
3
Jan-
04
Jul-0
4
Jan-
05
Jul-0
5
Jan-
06
Jul-0
6
Jan-
07
Jul-0
7
Jan-
08
Jul-0
8
Jan-
09
Jul-0
9
Jan-
10
Jul-1
0
Jan-
11
Jul-1
1
Jan-
12
Estb +/- Strength
FIS( 1 ----- 1 )
643Bn ave97.6% of estb
-16Bn ave2.5% of str
|---- H7 ----| |--- H11 ---|

ANNEX B
FT GDS - BATTALION MANNINGHistoric Strength Data (1995 - 2011)
1 SG (incl PDIC)
59
30
-1
-41
-62
-77
-85
-84
-87
-90
-98 -8
7
-92
-143
-142 -1
34 -123 -1
11
-86 -7
1 -59
-34
27 23
-7
-13
-42
3
-35 -2
5
-34
-39
-52
-85
-106
-77 -6
5 -59
-57
-63
-44
-71
-49
-112
-115
-122
-128 -1
20
-91
-90
-59
-57
-37 -2
7
-43
-145 -1
38
-138
-117 -1
06
-90
-54
-82 -77
-53
-54
-54 -51
-50
50
150
250
350
450
550
650
750
Jan-
95
Jul-9
5
Jan-
96
Jul-9
6
Jan-
97
Jul-9
7
Jan-
98
Jul-9
8
Jan-
99
Jul-9
9
Jan-
00
Jul-0
0
Jan-
01
Jul-0
1
Jan-
02
Jul-0
2
Jan-
03
Jul-0
3
Jan-
04
Jul-0
4
Jan-
05
Jul-0
5
Jan-
06
Jul-0
6
Jan-
07
Jul-0
7
Jan-
08
Jul-0
8
Jan-
09
Jul-0
9
Jan-
10
Jul-1
0
Jan-
11
Jul-1
1
Jan-
12
Estb +/- Strength
FIS( 1 ----- 1 )
603Bn ave89.8% of estb
-68Bn ave11.3% of str
|--- T11 ---| |--- H12 ---|

ANNEX B
FT GDS - BATTALION MANNINGHistoric Strength Data (1995 - 2011)
1 IG -3
7
-35
-15
-15
-16
-66
-105 -9
3 -90
-93
-69 -6
2 -50
-103
-89 -86 -83
-52 -4
4
-19
-20
32
16 22 22 17
-11
0 6 5
-16
-27
-36
-47
-65
-38
-19
-19
-38
-42
-41
-67
-68
-70
-84 -7
7
-99
-107
-71 -68
-75
-79 -6
7
-66 -60
-68
-38
-5
24
-9 -9
17
38
22
14
-27
-47
-67
-50
50
150
250
350
450
550
650
750
Jan-
95
Jul-9
5
Jan-
96
Jul-9
6
Jan-
97
Jul-9
7
Jan-
98
Jul-9
8
Jan-
99
Jul-9
9
Jan-
00
Jul-0
0
Jan-
01
Jul-0
1
Jan-
02
Jul-0
2
Jan-
03
Jul-0
3
Jan-
04
Jul-0
4
Jan-
05
Jul-0
5
Jan-
06
Jul-0
6
Jan-
07
Jul-0
7
Jan-
08
Jul-0
8
Jan-
09
Jul-0
9
Jan-
10
Jul-1
0
Jan-
11
Jul-1
1
Jan-
12
Estb +/- Strength
FIS( 1 ----- 1 )
520Bn ave92.8% of estb
-40Bn ave7.7% of str
|---- T10 ----| |--- H13 ---|

ANNEX B
FT GDS - BATTALION MANNINGHistoric Strength Data (1995 - 2011)
1 WG -1
7 -10
-35 -31
-42
-70
-72 -6
1 -48
-27
-35 -1
8
-22
-27 -1
8
-19 -13 -6
4 8 5 8 14
-56
-30
58
26
-6 -4
-26 -1
2
-14
-27
-37
-14 -11
-20 -1
1
-34
-36 -2
6
-55
-80
-103
-117
-137
-94 -8
0 -71
-39
-66
-76
-54 -3
7
-49
-55 -4
6
-19
-7
-12
2
-3
-32 -2
3 -19
-40
-47 -3
5
-50
50
150
250
350
450
550
650
750
Jan-
95
Jul-9
5
Jan-
96
Jul-9
6
Jan-
97
Jul-9
7
Jan-
98
Jul-9
8
Jan-
99
Jul-9
9
Jan-
00
Jul-0
0
Jan-
01
Jul-0
1
Jan-
02
Jul-0
2
Jan-
03
Jul-0
3
Jan-
04
Jul-0
4
Jan-
05
Jul-0
5
Jan-
06
Jul-0
6
Jan-
07
Jul-0
7
Jan-
08
Jul-0
8
Jan-
09
Jul-0
9
Jan-
10
Jul-1
0
Jan-
11
Jul-1
1
Jan-
12
Estb +/- Strength
FIS( 1 ----- 1 )
505Bn ave94.0%of estb
-32Bn ave6.4% of str
|--- H10 ---|

ANNEX B
DIVISIONAL MANNINGHistoric Strength Data (1995 - 2011)
THE SCOTTISH DIVISION-3
0
-110
-166
-251
-317
-344
-403
-501
-506
-577
-602
-447
-471
-515
-609
-559
-610 -5
95
-510
-509
-513 -4
76 -467
-428 -4
03
-408 -398 -3
63
-385
-414 -3
77
-395
-415
-432
-386
-346 -3
27
-331
-347 -3
30
-342
-449 -4
12
-439
-477
-607
-278
-155
-242
-319
-323
-338 -3
19
-370
-332
-398
-476
-507
-444
-524 -5
07
-450 -439
-398
-402
-399 -3
68
-412
-250
250
750
1250
1750
2250
2750
3250
3750
4250Ja
n-95
Jul-9
5
Jan-
96
Jul-9
6
Jan-
97
Jul-9
7
Jan-
98
Jul-9
8
Jan-
99
Jul-9
9
Jan-
00
Jul-0
0
Jan-
01
Jul-0
1
Jan-
02
Jul-0
2
Jan-
03
Jul-0
3
Jan-
04
Jul-0
4
Jan-
05
Jul-0
5
Jan-
06
Jul-0
6
Jan-
07
Jul-0
7
Jan-
08
Jul-0
8
Jan-
09
Jul-0
9
Jan-
10
Jul-1
0
Jan-
11
Jul-1
1
Jan-
12
Estb +/- Strength
FIS( 6 ----- 5 )
2739Div ave87.1%of estb
-407Div ave14.9% of str

ANNEX B
SCOTS - BATTALION MANNINGHistoric Strength Data (1995 - 2011)
559
1 KOSB -3
1
-34
-41
-46 -3
8
-38
-38
-53
-60
-87
-96
-50
-54 -3
7
-74
-81
-88
-103
-55
-59
-33
11
25 25 22
-6 -7
-12
5
-4 -3
-12
-25
-51
-50
-50
-83
-54
-62 -56 -52
-76 -73
-81
-107
-110
-50
50
150
250
350
450
550
650
750
Jan-
95
Jul-9
5
Jan-
96
Jul-9
6
Jan-
97
Jul-9
7
Jan-
98
Jul-9
8
Jan-
99
Jul-9
9
Jan-
00
Jul-0
0
Jan-
01
Jul-0
1
Jan-
02
Jul-0
2
Jan-
03
Jul-0
3
Jan-
04
Jul-0
4
Jan-
05
Jul-0
5
Jan-
06
Jul-0
6
Jan-
07
Jul-0
7
Jan-
08
Jul-0
8
Jan-
09
Jul-0
9
Jan-
10
Jul-1
0
Jan-
11
Jul-1
1
Jan-
12
Estb +/- Strength
FIS( 1 ----- 0 )
494Bn ave91.6%of estb
-45Bn ave9.2% of str

ANNEX B
SCOTS - BATTALION MANNINGHistoric Strength Data (1995 - 2011)
1 RS / 1 SCOTS-5
9
-74
-72
-72 -6
4 -52
-85
-165 -160
-167
-169
-169
-149
-164
-181 -1
64
-190 -1
81
-184 -1
74
-182 -1
73 -170
-111
-125 -1
11
-131
-100
-130
-105
-104
-121
-101
-105 -9
6 -82 -7
0 -56
-61
-76
-77
-91 -88
-91 -87
-131
16
63
21
-11 -6
1 1
-1
32
2
-80
-81 -7
2
-84
-42
-42
-52
-53
-64
-75
-43
-77
-50
50
150
250
350
450
550
650
750
Jan-
95
Jul-9
5
Jan-
96
Jul-9
6
Jan-
97
Jul-9
7
Jan-
98
Jul-9
8
Jan-
99
Jul-9
9
Jan-
00
Jul-0
0
Jan-
01
Jul-0
1
Jan-
02
Jul-0
2
Jan-
03
Jul-0
3
Jan-
04
Jul-0
4
Jan-
05
Jul-0
5
Jan-
06
Jul-0
6
Jan-
07
Jul-0
7
Jan-
08
Jul-0
8
Jan-
09
Jul-0
9
Jan-
10
Jul-1
0
Jan-
11
Jul-1
1
Jan-
12
Estb +/- Strength
FIS( 1 ----- 1 ) ( +1 )
455Bn ave83.5% of estb
-90Bn ave19.8% of str
|--- T11 ---| |-- H11 & H12 --|

ANNEX B
SCOTS - BATTALION MANNINGHistoric Strength Data (1995 - 2011)
1 RHF / 2 SCOTS22 24
-13
-29
-81
-91
-111
-116 -1
05
-103
-109
-68
-89
-120
-126 -120
-91
-92
-27
-30
-58
-62
-70 -5
9
-62
-66
-46 -43
-73
-94
-61
-76
-79 -7
1 -56 -52
-51
-64 -5
7 -40
-59
-61 -5
1
-80
-85
-111
-99
-40
-83
-86 -80 -77 -6
9
-76
-80
-61
-62
-90
-56
-92
-99 -8
2 -68 -5
1
-50 -3
9
-66
-76
-50
50
150
250
350
450
550
650
750
Jan-
95
Jul-9
5
Jan-
96
Jul-9
6
Jan-
97
Jul-9
7
Jan-
98
Jul-9
8
Jan-
99
Jul-9
9
Jan-
00
Jul-0
0
Jan-
01
Jul-0
1
Jan-
02
Jul-0
2
Jan-
03
Jul-0
3
Jan-
04
Jul-0
4
Jan-
05
Jul-0
5
Jan-
06
Jul-0
6
Jan-
07
Jul-0
7
Jan-
08
Jul-0
8
Jan-
09
Jul-0
9
Jan-
10
Jul-1
0
Jan-
11
Jul-1
1
Jan-
12
Estb +/- Strength
FIS( 1 ----- 1 )
493Bn ave87.6%of estb
-70Bn ave
14.2% of str
|---- H8 ----| |--- H13 ---|
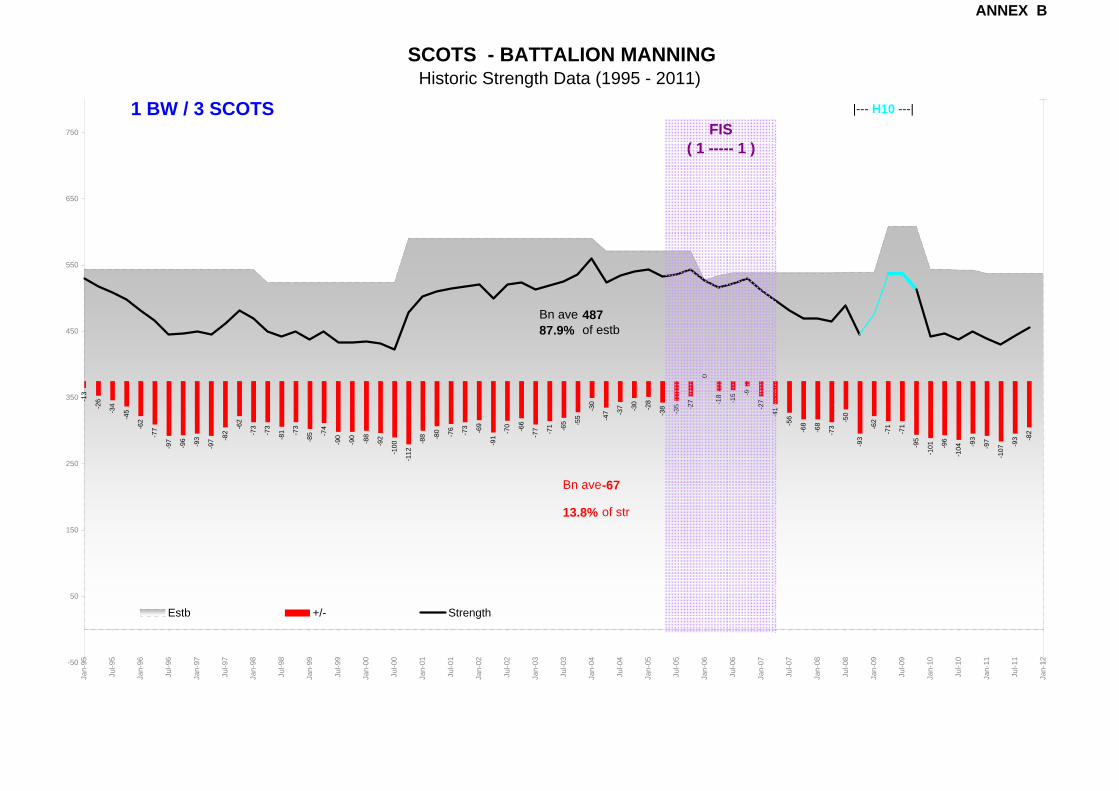
ANNEX B
SCOTS - BATTALION MANNINGHistoric Strength Data (1995 - 2011)
1 BW / 3 SCOTS-1
3
-26
-34
-45
-62
-77
-97
-96 -93
-97 -8
2
-62
-73
-73
-81 -7
3
-85 -7
4
-90
-90
-88
-92
-100
-112
-88 -8
0 -76 -73 -69
-91
-70 -66
-77 -71 -65 -5
5
-30
-47 -3
7 -30
-28
-38 -35 -2
7
0
-18
-16 -9
-27
-41
-56
-68
-68
-73
-50
-93
-62
-71
-71
-95
-101 -9
6
-104 -9
3
-97
-107
-93 -8
2
-50
50
150
250
350
450
550
650
750
Jan-
95
Jul-9
5
Jan-
96
Jul-9
6
Jan-
97
Jul-9
7
Jan-
98
Jul-9
8
Jan-
99
Jul-9
9
Jan-
00
Jul-0
0
Jan-
01
Jul-0
1
Jan-
02
Jul-0
2
Jan-
03
Jul-0
3
Jan-
04
Jul-0
4
Jan-
05
Jul-0
5
Jan-
06
Jul-0
6
Jan-
07
Jul-0
7
Jan-
08
Jul-0
8
Jan-
09
Jul-0
9
Jan-
10
Jul-1
0
Jan-
11
Jul-1
1
Jan-
12
Estb +/- Strength
FIS( 1 ----- 1 )
487Bn ave87.9% of estb
-67Bn ave
13.8% of str
|--- H10 ---|

ANNEX B
SCOTS - BATTALION MANNINGHistoric Strength Data (1995 - 2011)
1 HLDRS / 4 SCOTS48
36
45
27
10
-1
-13
-19
-22
-53
-75 -5
9
-75
-108
-129
-108
-155 -149
-159
-161 -1
50
-149
-150
-157
-138
-118 -1
07
-86
-96
-96
-97 -8
8
-87
-100 -9
0 -81
-84 -81
-89 -8
0 -77
-90 -7
8 -74
-77
-100
-41
-52
-61
-68
-74
-100
-112
-112
-134
-148
-169
-170 -1
61
-176 -172 -1
62
-163
-162
-165 -1
47
-102
-102
-50
50
150
250
350
450
550
650
750
Jan-
95
Jul-9
5
Jan-
96
Jul-9
6
Jan-
97
Jul-9
7
Jan-
98
Jul-9
8
Jan-
99
Jul-9
9
Jan-
00
Jul-0
0
Jan-
01
Jul-0
1
Jan-
02
Jul-0
2
Jan-
03
Jul-0
3
Jan-
04
Jul-0
4
Jan-
05
Jul-0
5
Jan-
06
Jul-0
6
Jan-
07
Jul-0
7
Jan-
08
Jul-0
8
Jan-
09
Jul-0
9
Jan-
10
Jul-1
0
Jan-
11
Jul-1
1
Jan-
12
Estb +/- Strength
483Bn ave83.5% of estb
-95Bn ave19.8% of str
FIS( 1 ----- 1 )
|---- T12 ----| |--- H14 ---|

ANNEX B
SCOTS - BATTALION MANNINGHistoric Strength Data (1995 - 2011)
1 A and SH / 5 SCOTS3
-36
-51
-86 -82
-85
-59 -5
2
-66
-70
-71
-39 -3
1 -13
-18 -13 -1
4 5 5
-2
-11 -2
-14
-12
-27
-31
-49
-22
-24
-42 -3
2
-46 -3
4 -29 -26
-9
-29
-41
-48
-49
-93 -87
-86
-121
-137
-138
-117
-92
-113 -107
-94
-71
-108 -1
00 -98
-103 -9
5 -84 -7
7
-93
-68 -5
2 -39 -2
6
-31
-64
-75
-50
50
150
250
350
450
550
650
750
Jan-
95
Jul-9
5
Jan-
96
Jul-9
6
Jan-
97
Jul-9
7
Jan-
98
Jul-9
8
Jan-
99
Jul-9
9
Jan-
00
Jul-0
0
Jan-
01
Jul-0
1
Jan-
02
Jul-0
2
Jan-
03
Jul-0
3
Jan-
04
Jul-0
4
Jan-
05
Jul-0
5
Jan-
06
Jul-0
6
Jan-
07
Jul-0
7
Jan-
08
Jul-0
8
Jan-
09
Jul-0
9
Jan-
10
Jul-1
0
Jan-
11
Jul-1
1
Jan-
12
Estb +/- Strength
487Bn ave89.9% of estb
-54Bn ave11.2% of str
FIS( 1 ----- 1 )
|---- H8 ----| |--- H13 ---|

ANNEX B
THIS PAGE IS INTENTIONALLY BLANK

ANNEX B
DIVISIONAL MANNINGHistoric Strength Data (1995 - 2011)
THE QUEEN'S DIVISION-6
0
-223
-153
-227
-312
-343
-341 -3
14
-273 -2
55
-255
-259
-346
-264
-278
-356
-404
-362
-384
-393
-467
-335
-293
-328
-203
-248
-172
-241
-257 -2
26
-175
-202
-199
-150
-167
-107 -8
7
-122 -1
00
-61 -3
7
-108
-124
-131
-239
-319
-388
-411
-331 -3
09
-271
-300
-341
-386 -3
71
-416
-298 -2
69
-184 -176
7
57
87
7
42
-15
-31
-97
-250
250
750
1250
1750
2250
2750
3250
3750
4250Ja
n-95
Jul-9
5
Jan-
96
Jul-9
6
Jan-
97
Jul-9
7
Jan-
98
Jul-9
8
Jan-
99
Jul-9
9
Jan-
00
Jul-0
0
Jan-
01
Jul-0
1
Jan-
02
Jul-0
2
Jan-
03
Jul-0
3
Jan-
04
Jul-0
4
Jan-
05
Jul-0
5
Jan-
06
Jul-0
6
Jan-
07
Jul-0
7
Jan-
08
Jul-0
8
Jan-
09
Jul-0
9
Jan-
10
Jul-1
0
Jan-
11
Jul-1
1
Jan-
12
Estb +/- Strength
FIS( 6 ----- 6 )
3134Div ave93.3% of estb
-225Div ave
7.2% of str

ANNEX B
QUEENS - REGIMENTAL MANNINGHistoric Average Strength Data (1995 - 2011)
PWRR5
-14
-38
-54
-71
-74
-80
-79
-83 -78
-79
-94
-108 -104
-115
-122
-120
-117
-124
-122
-151
-122 -119
-84 -6
7 -52
-55 -4
1 -32 -27
-8
8
26
43
17 22
13
-3
9
-1
9
-5 -9 -9
-49
-65
-98
-115
-78 -6
5
-72 -68
-72
-76 -6
7
-79
-54 -3
6 -26 -1
4
17 15 17 16
5 7
-2
19
-50
50
150
250
350
450
550
650
750
Jan-
95
Jul-9
5
Jan-
96
Jul-9
6
Jan-
97
Jul-9
7
Jan-
98
Jul-9
8
Jan-
99
Jul-9
9
Jan-
00
Jul-0
0
Jan-
01
Jul-0
1
Jan-
02
Jul-0
2
Jan-
03
Jul-0
3
Jan-
04
Jul-0
4
Jan-
05
Jul-0
5
Jan-
06
Jul-0
6
Jan-
07
Jul-0
7
Jan-
08
Jul-0
8
Jan-
09
Jul-0
9
Jan-
10
Jul-1
0
Jan-
11
Jul-1
1
Jan-
12
Estb +/- Strength
FIS( 2 ----- 2 )
515Regt ave93.6%of estb
-48Regt ave9.3% of str

ANNEX B
QUEENS - BATTALION MANNINGHistoric Strength Data (1995 - 2011)
1 PWRR-4
-29
-52
-51
-78
-102
-108
-107
-109
-121
-127 -121
-131 -1
20
-134
-151
-162 -1
44 -141 -1
30
-176
-138 -1
31
-104
-61 -5
0
-71 -6
0
-35 -30
5
32 29
52
23 21
10
0
14 10 11
-25
-26
-26
-60
-82
-145 -141
-106
-104
-105
-86
-95 -8
6
-65
-84 -6
8
-46 -3
6 -21
15 17
8 6 6
-2
13
-9
-50
50
150
250
350
450
550
650
750
Jan-
95
Jul-9
5
Jan-
96
Jul-9
6
Jan-
97
Jul-9
7
Jan-
98
Jul-9
8
Jan-
99
Jul-9
9
Jan-
00
Jul-0
0
Jan-
01
Jul-0
1
Jan-
02
Jul-0
2
Jan-
03
Jul-0
3
Jan-
04
Jul-0
4
Jan-
05
Jul-0
5
Jan-
06
Jul-0
6
Jan-
07
Jul-0
7
Jan-
08
Jul-0
8
Jan-
09
Jul-0
9
Jan-
10
Jul-1
0
Jan-
11
Jul-1
1
Jan-
12
Estb +/- Strength
FIS( 1 ----- 1 )
519Bn ave89.5% of estb
-61Bn ave
11.7% of str
|--- T13 ---||---- H9 ----|

ANNEX B
QUEENS - BATTALION MANNINGHistoric Strength Data (1995 - 2011)
2 PWRR14
2
-24
-56
-63 -4
5
-52
-51
-57
-34 -30
-67
-85
-88
-96 -93 -7
7
-90
-106
-114
-125
-105
-106
-64
-73
-54 -3
9 -21
-28 -23
-21 -17
23
34
11
23 16
-6
3
-12
6
15 8 8
-37
-48
-50
-88
-50
-25
-38
-50
-48
-65
-69
-73
-39 -2
5 -16 -7
18 20 22 28 25
11
0 5
-50
50
150
250
350
450
550
650
750
Jan-
95
Jul-9
5
Jan-
96
Jul-9
6
Jan-
97
Jul-9
7
Jan-
98
Jul-9
8
Jan-
99
Jul-9
9
Jan-
00
Jul-0
0
Jan-
01
Jul-0
1
Jan-
02
Jul-0
2
Jan-
03
Jul-0
3
Jan-
04
Jul-0
4
Jan-
05
Jul-0
5
Jan-
06
Jul-0
6
Jan-
07
Jul-0
7
Jan-
08
Jul-0
8
Jan-
09
Jul-0
9
Jan-
10
Jul-1
0
Jan-
11
Jul-1
1
Jan-
12
Estb +/- Strength
FIS( 1 ----- 1 )
510Bn ave93.6% of estb
-35Bn ave6.8% of str
|---- TRB ----|

ANNEX B
QUEENS - REGIMENTAL MANNINGHistoric Average Strength Data (1995 - 2011)
RRF-3
3
-33
-11
-21
-39
-61
-62 -56 -4
8
-55 -3
8 -30
-30
-33
-39
-46
-63 -5
0 -37
-39
-51
-29 -23
-99
-37
-67
-9
-68
-66 -5
9 -56
-74
-92 -7
8 -68 -5
6
-35
-39
-39 -2
6
-27
-44
-42
-48
-67
-82
-86 -83
-89
-91 -7
2
-97
-96
-99
-99
-114 -1
02
-109
-78
-88
-48
-25 -1
0
-22 -1
5 -11
-19
-33
-50
50
150
250
350
450
550
650
750
Jan-
95
Jul-9
5
Jan-
96
Jul-9
6
Jan-
97
Jul-9
7
Jan-
98
Jul-9
8
Jan-
99
Jul-9
9
Jan-
00
Jul-0
0
Jan-
01
Jul-0
1
Jan-
02
Jul-0
2
Jan-
03
Jul-0
3
Jan-
04
Jul-0
4
Jan-
05
Jul-0
5
Jan-
06
Jul-0
6
Jan-
07
Jul-0
7
Jan-
08
Jul-0
8
Jan-
09
Jul-0
9
Jan-
10
Jul-1
0
Jan-
11
Jul-1
1
Jan-
12
Estb +/- Strength
FIS( 2 ----- 2 )
514Regt ave90.5% of estb
-54Regt ave10.5% of str

ANNEX B
QUEENS - BATTALION MANNINGHistoric Strength Data (1995 - 2011)
1 RRF-5
0
-50
-7
10
-22
-22
-83
-94 -8
2
-83
-51 -3
8 -20
-25 -22
-33
-41 -2
8 -14
-19
-23
-37 -33
-95
-58
-148
-18
-64
-86 -81
-49
-72
-86 -80 -6
4
-62
-29
-48
-53
-30
-34
-51
-50
-54 -4
5
-69
-76
-77
-99
-99
-79
-92
-92
-100 -9
6
-114
-118
-118
-123 -119
-62
-33
0 3 2
-3
-11
-38
-50
50
150
250
350
450
550
650
750
Jan-
95
Jul-9
5
Jan-
96
Jul-9
6
Jan-
97
Jul-9
7
Jan-
98
Jul-9
8
Jan-
99
Jul-9
9
Jan-
00
Jul-0
0
Jan-
01
Jul-0
1
Jan-
02
Jul-0
2
Jan-
03
Jul-0
3
Jan-
04
Jul-0
4
Jan-
05
Jul-0
5
Jan-
06
Jul-0
6
Jan-
07
Jul-0
7
Jan-
08
Jul-0
8
Jan-
09
Jul-0
9
Jan-
10
Jul-1
0
Jan-
11
Jul-1
1
Jan-
12
Estb +/- Strength
FIS( 1 ----- 1 )
522Bn ave90.2% of estb
-56Bn ave10.8% of str
|--- T13 ---|

ANNEX B
QUEENS - BATTALION MANNINGHistoric Strength Data (1995 - 2011)
2 RRF-1
5
-15
-15
-51
-56
-100
-41
-17 -13
-26
-25 -21
-40
-40
-56
-58
-85 -7
1 -59
-58
-79
-20 -1
2
-102
-16
15
0
-71
-46 -3
7
-62
-76
-97
-75 -71
-50 -4
0 -30 -24 -21
-19
-36
-34
-41
-88
-95
-96 -8
9 -79
-82 -6
5
-102
-100 -9
8
-101
-114
-85
-99
-32
-57
-34 -1
7
-20
-46 -3
1 -19
-27
-27
-50
50
150
250
350
450
550
650
750
Jan-
95
Jul-9
5
Jan-
96
Jul-9
6
Jan-
97
Jul-9
7
Jan-
98
Jul-9
8
Jan-
99
Jul-9
9
Jan-
00
Jul-0
0
Jan-
01
Jul-0
1
Jan-
02
Jul-0
2
Jan-
03
Jul-0
3
Jan-
04
Jul-0
4
Jan-
05
Jul-0
5
Jan-
06
Jul-0
6
Jan-
07
Jul-0
7
Jan-
08
Jul-0
8
Jan-
09
Jul-0
9
Jan-
10
Jul-1
0
Jan-
11
Jul-1
1
Jan-
12
Estb +/- Strength
FIS( 1 ----- 1 )
505Bn ave90.7% of estb
-52Bn ave10.2% of str

ANNEX B
QUEENS - REGIMENTAL MANNINGHistoric Average Strength Data (1995 - 2011)
R ANGLIAN REGT-3
-66
-28
-40
-47 -3
7 -29 -23
-6
5
-11 -6
-35
5
15
-11
-20 -15
-32
-36 -32 -1
8
-6
19
3
-6
-22 -1
3
-31 -28 -24
-35
-34
-41 -3
3 -20
-22 -19
-20
-4 -1 -6
-11 -9 -5
-13
-11 -8
2 1 8 15
-3
-19
-20 -16
6 10 12 14
35 35 39
8
20
-1 -3
-14
-50
50
150
250
350
450
550
650
750
Jan-
95
Jul-9
5
Jan-
96
Jul-9
6
Jan-
97
Jul-9
7
Jan-
98
Jul-9
8
Jan-
99
Jul-9
9
Jan-
00
Jul-0
0
Jan-
01
Jul-0
1
Jan-
02
Jul-0
2
Jan-
03
Jul-0
3
Jan-
04
Jul-0
4
Jan-
05
Jul-0
5
Jan-
06
Jul-0
6
Jan-
07
Jul-0
7
Jan-
08
Jul-0
8
Jan-
09
Jul-0
9
Jan-
10
Jul-1
0
Jan-
11
Jul-1
1
Jan-
12
Estb +/- Strength
FIS( 2 ----- 2 )
539Regt aveof estb
-11Regt ave2.0% of str
98.0%

ANNEX B
QUEENS - BATTALION MANNINGHistoric Strength Data (1995 - 2011)
-8
56
-7
1 R ANGLIAN-2
0 -17 -12
-24
-38 -2
9 -24
-27 -1
9
1
-18
-20
-56
-23
43
-34
-49
-22
-60 -5
3 -45
-13
-15
-2
7
-17
-34
-7
-28 -1
6 -8 -3
-18
-34
-34
-15
-25
-24
-26 -1
6 -5
-11
-13
-17 -8
-17 -13 -2
19 19
29 36
23
2 6 13
42 38 42 40
63
55
38
12 15
1
-1
-19
-50
50
150
250
350
450
550
650
750
Jan-
95
Jul-9
5
Jan-
96
Jul-9
6
Jan-
97
Jul-9
7
Jan-
98
Jul-9
8
Jan-
99
Jul-9
9
Jan-
00
Jul-0
0
Jan-
01
Jul-0
1
Jan-
02
Jul-0
2
Jan-
03
Jul-0
3
Jan-
04
Jul-0
4
Jan-
05
Jul-0
5
Jan-
06
Jul-0
6
Jan-
07
Jul-0
7
Jan-
08
Jul-0
8
Jan-
09
Jul-0
9
Jan-
10
Jul-1
0
Jan-
11
Jul-1
1
Jan-
12
Estb +/- Strength
FIS( 1 ----- 1 )
550Bn ave98.7% of estb
-7Bn ave1.3% of str
|---- H6 ----| |--- H11 ---|

ANNEX B
QUEENS - BATTALION MANNINGHistoric Strength Data (1995 - 2011)
2 R ANGLIAN15
-114
-43
-55
-55 -4
5 -33 -1
8
7 8
-4
8
-14
32
-13
13 10
-7 -4
-19
-19
-22
4
39
-2
6
-10
-18
-34
-39
-40
-66 -5
0 -47 -3
2 -24 -19 -14
-14
8 4 0
-9 -1 -1 -8 -8
-14
-16
-18 -13 -6
-29
-39
-46
-44 -3
0 -19
-19 -1
2
7 15
39
4
25
-3 -5 -9
-50
50
150
250
350
450
550
650
750
Jan-
95
Jul-9
5
Jan-
96
Jul-9
6
Jan-
97
Jul-9
7
Jan-
98
Jul-9
8
Jan-
99
Jul-9
9
Jan-
00
Jul-0
0
Jan-
01
Jul-0
1
Jan-
02
Jul-0
2
Jan-
03
Jul-0
3
Jan-
04
Jul-0
4
Jan-
05
Jul-0
5
Jan-
06
Jul-0
6
Jan-
07
Jul-0
7
Jan-
08
Jul-0
8
Jan-
09
Jul-0
9
Jan-
10
Jul-1
0
Jan-
11
Jul-1
1
Jan-
12
Estb +/- Strength
FIS( 1 ----- 1 )
527Bn ave97.3% of estb
-14Bn ave2.7% of str
|---- T12 ----| |--- TRB ---|

ANNEX B
DIVISIONAL MANNINGHistoric Strength Data (1995 - 2011)
THE KING'S DIVISION-1
55
-82
24
-110 -100
-160
-57
-53 -2
7
-176
-238 -2
16
-238
-268 -259
-318
-245
-296
-343 -3
10
-394
-340
-353
-369
-314
-320 -2
96
-302
-253 -2
19 -212 -1
79
-202 -1
80
-189 -1
60 -140 -131
-141 -129 -115
-157 -1
19
-221
-317
-369
-387
-388
-461
-51
-139
-161
-192
-293
-336
-403 -3
77 -341
-290
-290
-215 -1
99
-116
-155 -145
-270 -2
53
-266
-250
250
750
1250
1750
2250
2750
3250
3750
4250Ja
n-95
Jul-9
5
Jan-
96
Jul-9
6
Jan-
97
Jul-9
7
Jan-
98
Jul-9
8
Jan-
99
Jul-9
9
Jan-
00
Jul-0
0
Jan-
01
Jul-0
1
Jan-
02
Jul-0
2
Jan-
03
Jul-0
3
Jan-
04
Jul-0
4
Jan-
05
Jul-0
5
Jan-
06
Jul-0
6
Jan-
07
Jul-0
7
Jan-
08
Jul-0
8
Jan-
09
Jul-0
9
Jan-
10
Jul-1
0
Jan-
11
Jul-1
1
Jan-
12
Estb +/- Strength
FIS( 6 ----- 5 )
2971Div ave92.9% of estb
-228Div ave7.7%of str

ANNEX B
KINGS BATTALION MANNINGHistoric Strength Data (1995 - 2011)
1 KORBR-1
6
-18
68
-63 -4
6
-76
-53
-60 -54
-80
-87 -83
-54 -48
-74
-92 -87
-101
-108
-110
-139
-100
-111 -1
04
-87
-31
-63
-37 -1
9
-28
-32 -26
-28
-56
-56
-70 -5
7 -49
-49
-49 -4
0
-47 -42
-56
-89
-119
-138
-232
-379
-50
50
150
250
350
450
550
650
750
Jan-
95
Jul-9
5
Jan-
96
Jul-9
6
Jan-
97
Jul-9
7
Jan-
98
Jul-9
8
Jan-
99
Jul-9
9
Jan-
00
Jul-0
0
Jan-
01
Jul-0
1
Jan-
02
Jul-0
2
Jan-
03
Jul-0
3
Jan-
04
Jul-0
4
Jan-
05
Jul-0
5
Jan-
06
Jul-0
6
Jan-
07
Jul-0
7
Jan-
08
Jul-0
8
Jan-
09
Jul-0
9
Jan-
10
Jul-1
0
Jan-
11
Jul-1
1
Jan-
12
Estb +/- Strength
FIS( 1 ----- 0 )
496Bn ave96.2% of estb
-73Bn ave14.7% of str

ANNEX B
KINGS - REGIMENTAL MANNINGHistoric Average Strength Data (1995 - 2011)
LANCS REGT-2
6 -19
28
-20 -17
-30 -2
0
-28
-34
-60
-63 -5
5 -50
-53
-52
-68 -5
3
-64
-68
-65
-89
-63
-64 -5
7 -51
-50
-51 -48 -3
8
-40
-46 -3
6
-37
-38
-41 -36 -33 -2
7
-31 -26
-27
-33
-30
-51
-67
-75
-88
-105
-106
65
38 33 28 26
16
-25
-5 -9
3
15
42 48 49
21 24
1
-11
-20
-50
50
150
250
350
450
550
650
750
Jan-
95
Jul-9
5
Jan-
96
Jul-9
6
Jan-
97
Jul-9
7
Jan-
98
Jul-9
8
Jan-
99
Jul-9
9
Jan-
00
Jul-0
0
Jan-
01
Jul-0
1
Jan-
02
Jul-0
2
Jan-
03
Jul-0
3
Jan-
04
Jul-0
4
Jan-
05
Jul-0
5
Jan-
06
Jul-0
6
Jan-
07
Jul-0
7
Jan-
08
Jul-0
8
Jan-
09
Jul-0
9
Jan-
10
Jul-1
0
Jan-
11
Jul-1
1
Jan-
12
Estb +/- Strength
FIS( 3 ----- 2 )
531Regt ave94.8% of estb
-29Regt ave5.4% of str

ANNEX B
KINGS BATTALION MANNINGHistoric Strength Data (1995 - 2011)
1 QLR / 1 LANCS-2
9
-33 -2
2
-28
-33
-35
-35
-45
-58
-98
-96
-64 -60 -54
-29
-64
-43
-50
-56 -53
-62 -4
6 -31
-31 -1
9 -7
1
-24
-25
-36
-40 -2
7
-38
-12
-16
5
-1
14
3
14
3
-12 -8 -6
-20
-19
-79 -7
0
88
79
63
7
-6
-10
-36 -2
9 -13 -7
5
20
60 52
33
-6
-19
-46
-57 -51
-50
50
150
250
350
450
550
650
750
Jan-
95
Jul-9
5
Jan-
96
Jul-9
6
Jan-
97
Jul-9
7
Jan-
98
Jul-9
8
Jan-
99
Jul-9
9
Jan-
00
Jul-0
0
Jan-
01
Jul-0
1
Jan-
02
Jul-0
2
Jan-
03
Jul-0
3
Jan-
04
Jul-0
4
Jan-
05
Jul-0
5
Jan-
06
Jul-0
6
Jan-
07
Jul-0
7
Jan-
08
Jul-0
8
Jan-
09
Jul-0
9
Jan-
10
Jul-1
0
Jan-
11
Jul-1
1
Jan-
12
Estb +/- Strength
FIS( 1 ----- 1 ) (+.5 )
539Bn ave96.2% of estb
-21Bn ave3.9% of str
|--- H12 ---||--- T11 ---|

ANNEX B
KINGS BATTALION MANNINGHistoric Strength Data (1995 - 2011)
1 KINGS / 2 LANCS-3
4
-7
37 31 28 22 29
21
11
-1 -7
-18
-36
-56 -52 -48 -3
0
-42
-40 -3
3
-66
-43
-49 -3
5
-47
-111
-91 -8
3 -69 -5
7
-67 -5
6 -44
-45
-51 -4
4
-42
-45
-47 -44
-43 -39
-41
-91
-93 -8
6
-48
-13
-28
51
13
58 62 61 68
-21
3
-10
0
10
24
43
64
48
67
48
35
12
-50
50
150
250
350
450
550
650
750
Jan-
95
Jul-9
5
Jan-
96
Jul-9
6
Jan-
97
Jul-9
7
Jan-
98
Jul-9
8
Jan-
99
Jul-9
9
Jan-
00
Jul-0
0
Jan-
01
Jul-0
1
Jan-
02
Jul-0
2
Jan-
03
Jul-0
3
Jan-
04
Jul-0
4
Jan-
05
Jul-0
5
Jan-
06
Jul-0
6
Jan-
07
Jul-0
7
Jan-
08
Jul-0
8
Jan-
09
Jul-0
9
Jan-
10
Jul-1
0
Jan-
11
Jul-1
1
Jan-
12
Estb +/- Strength
FIS( 1 ----- 1 ) (+.5 )
538Bn ave96.8% of estb
-18Bn ave3.3% of str
|----- TRB -----|
ANNEX B
KINGS - REGIMENTAL MANNINGHistoric Average Strength Data (1995 - 2011)
YORKS REGT-2
5
-8
-20 -17
-16
-24
1
10
25
1
-16
-17
-29
-37
-35
-38 -2
8
-34
-46 -3
8
-42
-50
-54
-66 -5
4
-57 -4
8
-53 -47 -3
3 -24
-23
-31 -2
2
-22 -17 -13
-17
-16
-17 -12
-20 -9
-23
-38
-48 -4
1 -24
-47
-60
-72
-75
-83
-115
-123 -118
-122 -1
08 -98
-107 -1
00 -98
-71 -66
-64
-91 -7
7
-76
-50
50
150
250
350
450
550
650
750
Jan-
95
Jul-9
5
Jan-
96
Jul-9
6
Jan-
97
Jul-9
7
Jan-
98
Jul-9
8
Jan-
99
Jul-9
9
Jan-
00
Jul-0
0
Jan-
01
Jul-0
1
Jan-
02
Jul-0
2
Jan-
03
Jul-0
3
Jan-
04
Jul-0
4
Jan-
05
Jul-0
5
Jan-
06
Jul-0
6
Jan-
07
Jul-0
7
Jan-
08
Jul-0
8
Jan-
09
Jul-0
9
Jan-
10
Jul-1
0
Jan-
11
Jul-1
1
Jan-
12
Estb +/- Strength
FIS( 3 ----- 3 )
512Regt ave91.9% of estb
-45Regt ave8.8% of str

ANNEX B
KINGS BATTALION MANNINGHistoric Strength Data (1995 - 2011)
1 PWO / 1 YORKS-2
8
-27 -1
4
-31 -27
-32 -1
7
3
12
-2
-12
-34 -2
2
-56
-19
-48 -3
6
-42
-60
-41
-60
-82
-88
-95
-96
-98 -93 -89
-70 -65 -5
2 -46
-45
-16
-17
-1
1 0
-5
0 3 3
49
9 2
-24 -1
3
-25 -1
8
-18
-33
-39
-60
-88
-87 -81
-107
-80 -6
3
-97
-100
-100
-49 -3
6
-45
-104
-85
-98
-50
50
150
250
350
450
550
650
750
Jan-
95
Jul-9
5
Jan-
96
Jul-9
6
Jan-
97
Jul-9
7
Jan-
98
Jul-9
8
Jan-
99
Jul-9
9
Jan-
00
Jul-0
0
Jan-
01
Jul-0
1
Jan-
02
Jul-0
2
Jan-
03
Jul-0
3
Jan-
04
Jul-0
4
Jan-
05
Jul-0
5
Jan-
06
Jul-0
6
Jan-
07
Jul-0
7
Jan-
08
Jul-0
8
Jan-
09
Jul-0
9
Jan-
10
Jul-1
0
Jan-
11
Jul-1
1
Jan-
12
Estb +/- Strength
FIS( 1 ----- 1 )
492Bn ave91.9% of estb
-43Bn ave8.8% of str
|--- T13 ---|
|-------- +GRC --------

ANNEX B
KINGS BATTALION MANNINGHistoric Strength Data (1995 - 2011)
-8
56
-7
1 GH / 2 YORKS-3
1 -15
-56
-24
-28
-57
-9
13
34
-22
-58
-14
-47
-64
-63
-76
-80 -75
-74 -69
-83 -78 -7
1
-83 -7
5
-74
-84
-87 -84
-38 -3
0
-57
-65 -62 -59
-57 -4
4
-47 -3
6
-37 -2
4
-38
-47
-49
-56
-60
-62
-1
-57
-96
-100
-100
-112
-112
-114
-133 -1
22 -113
-120
-120
-127 -1
18
-78 -72
-71
-81
-62
-75
-50
50
150
250
350
450
550
650
750
Jan-
95
Jul-9
5
Jan-
96
Jul-9
6
Jan-
97
Jul-9
7
Jan-
98
Jul-9
8
Jan-
99
Jul-9
9
Jan-
00
Jul-0
0
Jan-
01
Jul-0
1
Jan-
02
Jul-0
2
Jan-
03
Jul-0
3
Jan-
04
Jul-0
4
Jan-
05
Jul-0
5
Jan-
06
Jul-0
6
Jan-
07
Jul-0
7
Jan-
08
Jul-0
8
Jan-
09
Jul-0
9
Jan-
10
Jul-1
0
Jan-
11
Jul-1
1
Jan-
12
Estb +/- Strength
FIS( 1 ----- 1 )
499Bn ave88.6% of estb
-65Bn ave12.9% of str
|---- H11 ---||---- H7 ----|

ANNEX B
KINGS BATTALION MANNINGHistoric Strength Data (1995 - 2011)
1 DWR / 3 YORKS-1
7
18 11 5 6
18
28
15
28 27 22
-3
-19
10
-22
10
31
14
-5 -4
16 9
-3
-21
10
1
34
18 14
5 9
33
18 11 10 7 3
-4 -7
-13
-14
-24
-30
-28
-61
-61 -4
7
-47
-67
-67
-82
-87 -7
6
-144
-167
-139
-138 -1
31
-112 -1
03
-72
-76
-86
-89 -7
7
-87 -84
-54
-50
50
150
250
350
450
550
650
750
Jan-
95
Jul-9
5
Jan-
96
Jul-9
6
Jan-
97
Jul-9
7
Jan-
98
Jul-9
8
Jan-
99
Jul-9
9
Jan-
00
Jul-0
0
Jan-
01
Jul-0
1
Jan-
02
Jul-0
2
Jan-
03
Jul-0
3
Jan-
04
Jul-0
4
Jan-
05
Jul-0
5
Jan-
06
Jul-0
6
Jan-
07
Jul-0
7
Jan-
08
Jul-0
8
Jan-
09
Jul-0
9
Jan-
10
Jul-1
0
Jan-
11
Jul-1
1
Jan-
12
Estb +/- Strength
FIS( 1 ----- 1 )
546Bn ave95.1% of estb
-28Bn ave5.2% of str

ANNEX B
THIS PAGE IS INTENTIONALLY BLANK

ANNEX B
DIVISIONAL MANNINGHistoric Strength Data (1995 - 2011)
THE PoW DIVISION-1
24
-138 -1
19
-116
-168
-203
-217
-248 -2
28
-249
-275
-218
-265
-367
-247
-250
-257
-328
-379
-418
-369
-297
-330 -319
-242 -2
22 -203
-220
-219
-214
-319
-203
-277
-299 -286 -2
55 -237
-238 -2
20
-231
-289
-388
-325
-409
-473
-483
-533
-633
-588 -5
58
-572
-623 -6
04
-491
-436 -4
10
-325 -3
07
-234 -226
-157
-190
-218
-257
-254
-275 -2
58
-263
-250
250
750
1250
1750
2250
2750
3250
3750
4250Ja
n-95
Jul-9
5
Jan-
96
Jul-9
6
Jan-
97
Jul-9
7
Jan-
98
Jul-9
8
Jan-
99
Jul-9
9
Jan-
00
Jul-0
0
Jan-
01
Jul-0
1
Jan-
02
Jul-0
2
Jan-
03
Jul-0
3
Jan-
04
Jul-0
4
Jan-
05
Jul-0
5
Jan-
06
Jul-0
6
Jan-
07
Jul-0
7
Jan-
08
Jul-0
8
Jan-
09
Jul-0
9
Jan-
10
Jul-1
0
Jan-
11
Jul-1
1
Jan-
12
Estb +/- Strength
FIS( 7 ----- 5 )
3171Div ave91.2% of estb
-306Div ave
9.6% of str

ANNEX B
PoW BATTALION MANNINGHistoric Strength Data (1995 - 2011)
1 D and D / RIFLES-2
1
-22 -1
1 -9 -2
-18
-22
-34
-40
-53
-58
-56
-67
-32 -2
2
-26
-35
-35
-63
-76
-96
-74
-79
-88
-51 -4
4
-66 -5
9
-69
-80
-83
-82 -7
1
-69 -6
0 -43
-45
-62
-39 -2
5
-50 -4
2
-50
50
150
250
350
450
550
650
750
Jan-
95
Jul-9
5
Jan-
96
Jul-9
6
Jan-
97
Jul-9
7
Jan-
98
Jul-9
8
Jan-
99
Jul-9
9
Jan-
00
Jul-0
0
Jan-
01
Jul-0
1
Jan-
02
Jul-0
2
Jan-
03
Jul-0
3
Jan-
04
Jul-0
4
Jan-
05
Jul-0
5
Jan-
06
Jul-0
6
Jan-
07
Jul-0
7
Jan-
08
Jul-0
8
Jan-
09
Jul-0
9
Jan-
10
Jul-1
0
Jan-
11
Jul-1
1
Jan-
12
Estb +/- Strength
FIS( 1 ----- 0 )
517Bn ave91.3% of estb
-50Bn ave
9.6% of str

ANNEX B
PoW BATTALION MANNINGHistoric Strength Data (1995 - 2011)
1 RGBW / RIFLES30
6
-3
5
15 11 7
-12
-22
-37
-49 -44
-49
-62
-81
-95
-104
-126
-141
-149
-171
-124
-132 -1
17
-74
-39
-74 -6
7
-80 -7
3
-84
-59
-74
-77 -6
6 -60 -4
3
-8
-24 -18
-22
-41
-50
50
150
250
350
450
550
650
750
Jan-
95
Jul-9
5
Jan-
96
Jul-9
6
Jan-
97
Jul-9
7
Jan-
98
Jul-9
8
Jan-
99
Jul-9
9
Jan-
00
Jul-0
0
Jan-
01
Jul-0
1
Jan-
02
Jul-0
2
Jan-
03
Jul-0
3
Jan-
04
Jul-0
4
Jan-
05
Jul-0
5
Jan-
06
Jul-0
6
Jan-
07
Jul-0
7
Jan-
08
Jul-0
8
Jan-
09
Jul-0
9
Jan-
10
Jul-1
0
Jan-
11
Jul-1
1
Jan-
12
Estb +/- Strength
FIS( 1 ----- 0 )
489Bn ave89.4% of estb
-58Bn ave11.8% of str

ANNEX B
PoW - REGIMENTAL MANNINGHistoric Average Strength Data (1995 - 2011)
MERCIAN REGT-2
5 -22 -17
-19
-29
-30
-32
-34 -28
-26 -21 -1
4
-20
-51
-22
-7 -5
-11
-26
-29
-5
-14
-17
-18
-18
-28 -1
4
-17 -15
-25
-33
-13
-23
-40
-42 -35
-40
-45 -42
-46
-50
-64
-62
-81
-95
-105
-113
-116 -113 -108
-116
-119 -113
-94 -7
8 -70 -6
3
-65 -5
1 -44 -39
-41
-50
-54
-56
-58
-57
-64
-50
50
150
250
350
450
550
650
750
Jan-
95
Jul-9
5
Jan-
96
Jul-9
6
Jan-
97
Jul-9
7
Jan-
98
Jul-9
8
Jan-
99
Jul-9
9
Jan-
00
Jul-0
0
Jan-
01
Jul-0
1
Jan-
02
Jul-0
2
Jan-
03
Jul-0
3
Jan-
04
Jul-0
4
Jan-
05
Jul-0
5
Jan-
06
Jul-0
6
Jan-
07
Jul-0
7
Jan-
08
Jul-0
8
Jan-
09
Jul-0
9
Jan-
10
Jul-1
0
Jan-
11
Jul-1
1
Jan-
12
Estb +/- Strength
FIS( 3 ----- 3 )
507Regt ave91.7%of estb
-46Regt ave9.1% of str

ANNEX B
PoW BATTALION MANNINGHistoric Strength Data (1995 - 2011)
1 CHESHIRE / 1 MERCIAN
13 17
9
-18
-31
-49
-74
-90
-89 -8
2 -64 -4
7 -41
-52
-51
-27 -1
0
0 7 4 7
-7
8 9 4
-13
0 1
-1
-33
-35
-36
-47
-77
-81
-79
-89 -8
0 -66
-68 -5
0
-70
-90
-115
-85
-90
-101
-101
-110
-97
-99
-105
-125 -1
11 -100
-109 -105
-89
-95
-76 -6
5
-68
-68
-66 -4
9 -40
-65
-73
-50
50
150
250
350
450
550
650
750
Jan-
95
Jul-9
5
Jan-
96
Jul-9
6
Jan-
97
Jul-9
7
Jan-
98
Jul-9
8
Jan-
99
Jul-9
9
Jan-
00
Jul-0
0
Jan-
01
Jul-0
1
Jan-
02
Jul-0
2
Jan-
03
Jul-0
3
Jan-
04
Jul-0
4
Jan-
05
Jul-0
5
Jan-
06
Jul-0
6
Jan-
07
Jul-0
7
Jan-
08
Jul-0
8
Jan-
09
Jul-0
9
Jan-
10
Jul-1
0
Jan-
11
Jul-1
1
Jan-
12
Estb +/- Strength
FIS( 1 ----- 1 )
485Bn ave89.7%of estb
-56Bn ave11.4% of str
|--- H12 ---||--- T11 ---|
|-------- +GRC -------|
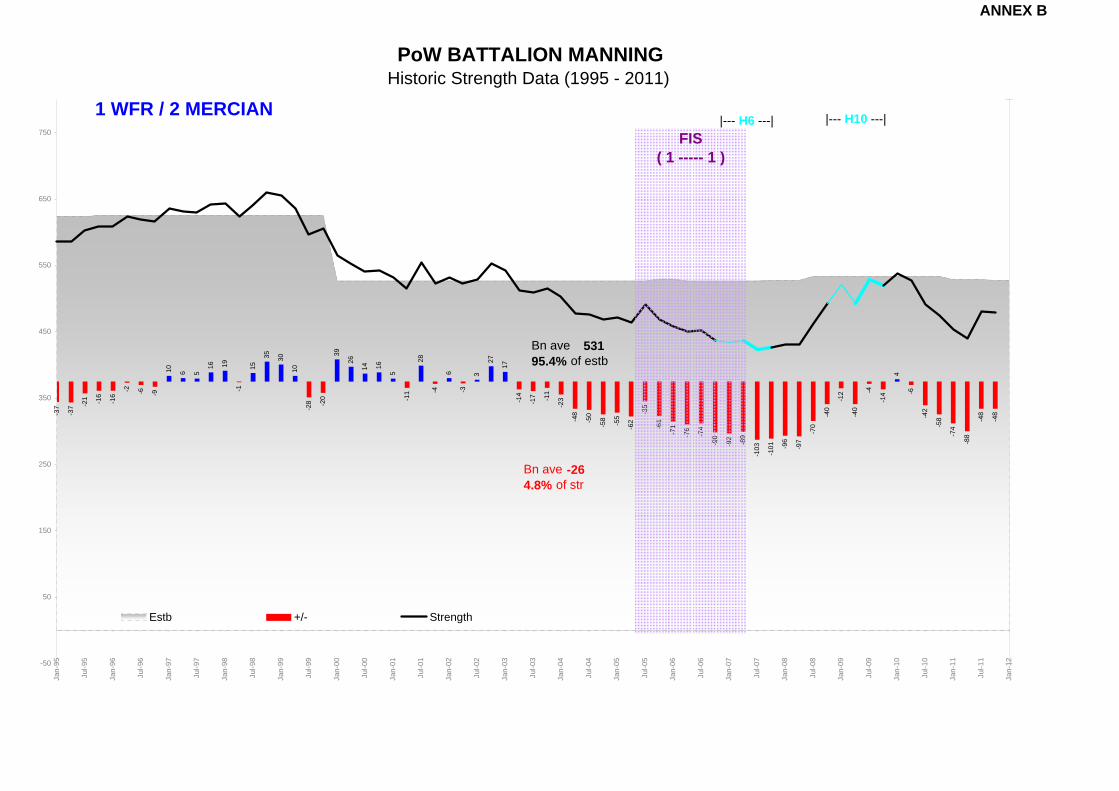
ANNEX B
PoW BATTALION MANNINGHistoric Strength Data (1995 - 2011)
1 WFR / 2 MERCIAN
-37
-37 -2
1 -16
-16
-2 -6 -9
10 6 5
16 19
-1
15
35 30
10
-28 -2
0
39
26
14 16
5
-11
28
-4
6
-3
3
27
17
-14
-17 -11
-23
-48
-50
-58 -55
-62
-35
-61
-71
-76
-74
-90
-92 -89
-103
-101 -9
6
-97
-70
-40
-12
-40
-4
-14
4
-6
-42
-58
-74
-88
-48
-48
-50
50
150
250
350
450
550
650
750
Jan-
95
Jul-9
5
Jan-
96
Jul-9
6
Jan-
97
Jul-9
7
Jan-
98
Jul-9
8
Jan-
99
Jul-9
9
Jan-
00
Jul-0
0
Jan-
01
Jul-0
1
Jan-
02
Jul-0
2
Jan-
03
Jul-0
3
Jan-
04
Jul-0
4
Jan-
05
Jul-0
5
Jan-
06
Jul-0
6
Jan-
07
Jul-0
7
Jan-
08
Jul-0
8
Jan-
09
Jul-0
9
Jan-
10
Jul-1
0
Jan-
11
Jul-1
1
Jan-
12
Estb +/- Strength
FIS( 1 ----- 1 )
531Bn ave95.4% of estb
-26Bn ave4.8% of str
|--- H10 ---||--- H6 ---|

ANNEX B
PoW BATTALION MANNINGHistoric Strength Data (1995 - 2011)
1 STAFFORDS / 3 MERCIAN -5
2 -47 -3
8 -22
-39
-40
-16
-2 -4 -3 -3
-11
-39
-100
-29
-29
-34
-44
-58
-71 -6
2
-61
-74
-78 -6
2
-61
-70
-49
-49 -3
8
-68
-31
-40 -2
9
-27 -1
6 -7 -7
-10
-12
-46
-59
-62
-66
-129
-150
-163 -158
-138
-138
-145
-150
-119
-75 -6
3
-62
-71 -65 -5
3 -43
-56 -50 -4
1
-39
-45
-45
-57
-70
-50
50
150
250
350
450
550
650
750
Jan-
95
Jul-9
5
Jan-
96
Jul-9
6
Jan-
97
Jul-9
7
Jan-
98
Jul-9
8
Jan-
99
Jul-9
9
Jan-
00
Jul-0
0
Jan-
01
Jul-0
1
Jan-
02
Jul-0
2
Jan-
03
Jul-0
3
Jan-
04
Jul-0
4
Jan-
05
Jul-0
5
Jan-
06
Jul-0
6
Jan-
07
Jul-0
7
Jan-
08
Jul-0
8
Jan-
09
Jul-0
9
Jan-
10
Jul-1
0
Jan-
11
Jul-1
1
Jan-
12
Estb +/- Strength
|--- H14 ---|FIS
( 1 ----- 1 )
522Bn ave90.2% of estb
-56Bn ave10.8% of str

ANNEX B
PoW - REGIMENTAL MANNINGHistoric Average Strength Data (1995 - 2011)
R WELSH REGT-1
2
-18
-17
-15
-21
-28
-30
-37
-36
-43
-53 -4
4
-51
-54 -4
6
-57
-61
-74
-75
-83
-88
-64
-70 -67
-47 -3
4
-40
-42
-44 -3
5
-55 -4
1
-52 -4
5 -40 -37 -3
0 -26
-24
-23
-35
-49
-69
-84
-94 -8
4
-98
-142 -1
24 -117 -113
-134
-132
-104
-102
-100
-69 -5
7 -41
-47
-20
-33
-34
-47 -43
-51 -4
4 -36
-50
50
150
250
350
450
550
650
750
Jan-
95
Jul-9
5
Jan-
96
Jul-9
6
Jan-
97
Jul-9
7
Jan-
98
Jul-9
8
Jan-
99
Jul-9
9
Jan-
00
Jul-0
0
Jan-
01
Jul-0
1
Jan-
02
Jul-0
2
Jan-
03
Jul-0
3
Jan-
04
Jul-0
4
Jan-
05
Jul-0
5
Jan-
06
Jul-0
6
Jan-
07
Jul-0
7
Jan-
08
Jul-0
8
Jan-
09
Jul-0
9
Jan-
10
Jul-1
0
Jan-
11
Jul-1
1
Jan-
12
Estb +/- Strength
FIS( 2 ----- 2 )
506Regt ave89.9% of estb
-57Regt ave11.2%of str

ANNEX B
PoW BATTALION MANNINGHistoric Strength Data (1995 - 2011)
1 RWF / 1 R WELSH -2
7
3 0
-10
-31
-44 -3
5
-43
-18 -14
-37 -2
1
-29
-9 -2
-34
-32
-35 -2
7
-29 -1
9
-20
-5
-13
-16
-3
6
-12 -9
25
0
-19
-22 -1
0 -9 -2
2 7
16 16 17
-23
-43
-50
-62
-20
-36
-119 -1
10
-96 -7
9
-115
-115
-77
-79
-81
-43
-44 -3
5 -30
3
-28
-31
-47 -3
9 -35 -1
8
-23
-50
50
150
250
350
450
550
650
750
Jan-
95
Jul-9
5
Jan-
96
Jul-9
6
Jan-
97
Jul-9
7
Jan-
98
Jul-9
8
Jan-
99
Jul-9
9
Jan-
00
Jul-0
0
Jan-
01
Jul-0
1
Jan-
02
Jul-0
2
Jan-
03
Jul-0
3
Jan-
04
Jul-0
4
Jan-
05
Jul-0
5
Jan-
06
Jul-0
6
Jan-
07
Jul-0
7
Jan-
08
Jul-0
8
Jan-
09
Jul-0
9
Jan-
10
Jul-1
0
Jan-
11
Jul-1
1
Jan-
12
Estb +/- Strength
510Bn ave94.5% of estb
-30Bn ave5.8% of str
FIS( 1 ----- 1 )
|--- H11 ---|

ANNEX B
PoW BATTALION MANNINGHistoric Strength Data (1995 - 2011)
1 RRW / 2 R WELSH-3
0
-58 -55 -4
6
-64 -61
-71 -5
8
-65
-66
-69 -5
5
-59
-111
-77 -74
-72
-98
-69
-77 -6
7
-37
-62 -4
8
-48
-51
-27
-30 -1
7 -12
-52
-3
-40 -2
3
-26
-44 -3
2
-40
-47
-66
-83
-91
-95
-117
-126
-147
-159
-165
-138
-138
-146
-152 -149 -1
31 -124 -118
-94
-69
-47
-63
-43 -38
-36
-47
-47
-67
-70
-49
-50
50
150
250
350
450
550
650
750
Jan-
95
Jul-9
5
Jan-
96
Jul-9
6
Jan-
97
Jul-9
7
Jan-
98
Jul-9
8
Jan-
99
Jul-9
9
Jan-
00
Jul-0
0
Jan-
01
Jul-0
1
Jan-
02
Jul-0
2
Jan-
03
Jul-0
3
Jan-
04
Jul-0
4
Jan-
05
Jul-0
5
Jan-
06
Jul-0
6
Jan-
07
Jul-0
7
Jan-
08
Jul-0
8
Jan-
09
Jul-0
9
Jan-
10
Jul-1
0
Jan-
11
Jul-1
1
Jan-
12
Estb +/- Strength
|--- H13 ---||--- T10 ---| |--- H10 & H11 ---|
FIS( 1 ----- 1 )
519Bn ave87.9% of estb
-71Bn ave13.8% of str

ANNEX B
DIVISIONAL MANNINGHistoric Strength Data (1995 - 2011)
THE RIFLES-1
60
-194
-217 -2
00
-231
-237
-262
-282
-215
-228 -217
-257 -2
38
-235 -2
13 -198 -1
69 -151
-159
-159
-97
-10
-39
-61 -4
3
-40
-72 -64 -2
9
-84 -77 -5
6
-85 -5
2
-7
5
30
82
48
12
-10
-79
-187
-209
-322
-392
-416
-372
-428
103
48
12
-50 -2
6
-50
-7
46
123
184
157
202
120
120
93 78
-25
-47
-128
-250
250
750
1250
1750
2250
2750
3250
3750
4250Ja
n-95
Jul-9
5
Jan-
96
Jul-9
6
Jan-
97
Jul-9
7
Jan-
98
Jul-9
8
Jan-
99
Jul-9
9
Jan-
00
Jul-0
0
Jan-
01
Jul-0
1
Jan-
02
Jul-0
2
Jan-
03
Jul-0
3
Jan-
04
Jul-0
4
Jan-
05
Jul-0
5
Jan-
06
Jul-0
6
Jan-
07
Jul-0
7
Jan-
08
Jul-0
8
Jan-
09
Jul-0
9
Jan-
10
Jul-1
0
Jan-
11
Jul-1
1
Jan-
12
Estb +/- Strength
2132
FIS( 4 -- 6 -- 5 )
2411Div ave96.3%of estb
-93Div ave3.9% of str

ANNEX B
RIFLES BATTALION MANNINGHistoric Strength Data (1995 - 2011)
1 RGBW30
6
-3
5
15 11 7
-12
-22
-37
-49 -44
-49
-62
-81
-95
-104
-126
-141
-149
-171
-124
-132 -1
17
-74
-39
-74 -6
7
-80 -7
3
-84
-59
-74
-77 -6
6 -60 -4
3
-8
-24 -18
-22
-38
-37
-35
-47
-85
-207
-224
-50
50
150
250
350
450
550
650
750
Jan-
95
Jul-9
5
Jan-
96
Jul-9
6
Jan-
97
Jul-9
7
Jan-
98
Jul-9
8
Jan-
99
Jul-9
9
Jan-
00
Jul-0
0
Jan-
01
Jul-0
1
Jan-
02
Jul-0
2
Jan-
03
Jul-0
3
Jan-
04
Jul-0
4
Jan-
05
Jul-0
5
Jan-
06
Jul-0
6
Jan-
07
Jul-0
7
Jan-
08
Jul-0
8
Jan-
09
Jul-0
9
Jan-
10
Jul-1
0
Jan-
11
Jul-1
1
Jan-
12
Estb +/- Strength
FIS( 0 -- 1 -- 0)
481Bn ave88.3%of estb
-64Bn ave
13.3% of str
(PoW Division)

ANNEX B
RIFLES BATTALION MANNINGHistoric Strength Data (1995 - 2011)
1 D and D / 1 RIFLES-2
1
-22 -1
1 -9 -2
-18
-22
-34
-40
-53
-58
-56
-67
-32 -2
2
-26
-35
-35
-63
-76
-96
-74
-79
-88
-51 -4
4
-66 -5
9
-69
-80
-83
-82 -7
1
-69 -6
0 -43
-45
-62
-39 -2
5
-50
-53
-61
-66
-68 -6
1 -57
-72
21
7
-14
-19
23 18
9 6
26
36 36
56
13 16
35
24 24
58
-4
-50
50
150
250
350
450
550
650
750
Jan-
95
Jul-9
5
Jan-
96
Jul-9
6
Jan-
97
Jul-9
7
Jan-
98
Jul-9
8
Jan-
99
Jul-9
9
Jan-
00
Jul-0
0
Jan-
01
Jul-0
1
Jan-
02
Jul-0
2
Jan-
03
Jul-0
3
Jan-
04
Jul-0
4
Jan-
05
Jul-0
5
Jan-
06
Jul-0
6
Jan-
07
Jul-0
7
Jan-
08
Jul-0
8
Jan-
09
Jul-0
9
Jan-
10
Jul-1
0
Jan-
11
Jul-1
1
Jan-
12
Estb +/- Strength
|--- H9 ---| |--- H14 ---|FIS
( 1 ----- 1 )
525Bn ave94.4% of estb
-31Bn ave6.0% of str
(PoW Division)

ANNEX B
RIFLES BATTALION MANNINGHistoric Strength Data (1995 - 2011)
1 RGJ / 2 RIFLES-4
9
-71
-72
-79
-81
-111
-116
-98 -8
6 -75
-84
-111 -1
03
-128
-129
-100
-64
-27
-25
-31
-36
-8
-11
-17 -11
-13
-40
-13
-20
-44
-50 -45
-55
-33
-37 -1
9 -9
14
5 0 2
-20
-23
-47
-70
-79
-82
-3
-40
38
10 11
-13
-20
-28
1
35
71
42
13 13 8 12
-5
10
-14
-15 -10
-50
50
150
250
350
450
550
650
750
Jan-
95
Jul-9
5
Jan-
96
Jul-9
6
Jan-
97
Jul-9
7
Jan-
98
Jul-9
8
Jan-
99
Jul-9
9
Jan-
00
Jul-0
0
Jan-
01
Jul-0
1
Jan-
02
Jul-0
2
Jan-
03
Jul-0
3
Jan-
04
Jul-0
4
Jan-
05
Jul-0
5
Jan-
06
Jul-0
6
Jan-
07
Jul-0
7
Jan-
08
Jul-0
8
Jan-
09
Jul-0
9
Jan-
10
Jul-1
0
Jan-
11
Jul-1
1
Jan-
12
Estb +/- Strength
|--- H10 ---|FIS( 1 ----- 1 )
506Bn ave93.8% of estb
-34Bn ave6.6% of str

ANNEX B
RIFLES BATTALION MANNINGHistoric Strength Data (1995 - 2011)
1 LI / 3 RIFLES-2
2
-22
-70
-76 -6
3
-62 -5
1 -35 -2
8
-61
-68
-71 -5
9
-33
-52
-24 -21
-2
2
-6
11 5 2
-8
1
11
-11 -9 -3
17
-6 -2 -8
2
38
17
29 22
-1
-18
-22
-29
-41
-49
-50 -44 -3
5 -27 -1
1
2 10
-6
-17
-18 -9
8 5 8
19
49
60 54
39
30
18
-5
-24
-34
-50
50
150
250
350
450
550
650
750
Jan-
95
Jul-9
5
Jan-
96
Jul-9
6
Jan-
97
Jul-9
7
Jan-
98
Jul-9
8
Jan-
99
Jul-9
9
Jan-
00
Jul-0
0
Jan-
01
Jul-0
1
Jan-
02
Jul-0
2
Jan-
03
Jul-0
3
Jan-
04
Jul-0
4
Jan-
05
Jul-0
5
Jan-
06
Jul-0
6
Jan-
07
Jul-0
7
Jan-
08
Jul-0
8
Jan-
09
Jul-0
9
Jan-
10
Jul-1
0
Jan-
11
Jul-1
1
Jan-
12
Estb +/- Strength
FIS( 1 ----- 1 )
539Bn ave97.7% of estb
-13Bn ave2.3% of str
|--- H11 ---|

ANNEX B
RIFLES BATTALION MANNINGHistoric Strength Data (1995 - 2011)
-8
56
-7
2 RGJ / 4 RIFLES-2
6
-38
-54
-55
-64
-68
-73
-80
-58
-57 -4
6
-57
-59 -4
4
11
-60
-69
-96
-96 -8
8
-54
5
-3
-16
-16
-14
-13
-16
1
-42 -3
1
-29
-44 -3
7 -25 -1
3
5
27
14 12 9
-6
-10
3
-62
-70
-80
-32
-45
22
5
-2
16
-15
-39
-20
-32
-9
44 42
52
42 37
18 17
-26
-56
-60
-50
50
150
250
350
450
550
650
750
Jan-
95
Jul-9
5
Jan-
96
Jul-9
6
Jan-
97
Jul-9
7
Jan-
98
Jul-9
8
Jan-
99
Jul-9
9
Jan-
00
Jul-0
0
Jan-
01
Jul-0
1
Jan-
02
Jul-0
2
Jan-
03
Jul-0
3
Jan-
04
Jul-0
4
Jan-
05
Jul-0
5
Jan-
06
Jul-0
6
Jan-
07
Jul-0
7
Jan-
08
Jul-0
8
Jan-
09
Jul-0
9
Jan-
10
Jul-1
0
Jan-
11
Jul-1
1
Jan-
12
Estb +/- Strength
FIS( 1 ----- 1 )
551Bn ave95.6% of estb
-25Bn ave4.6% of str
|--- T10 ---|

ANNEX B
RIFLES BATTALION MANNINGHistoric Strength Data (1995 - 2011)
2 LI / 5 RIFLES-6
3
-63
-21
10
-23
4
-22
-69
-43 -3
5 -19
-18
-17
-30
-43
-14
-15
-26
-40 -34 -1
8 -12
-27 -2
0 -17
-24
-8
-26
-7
-15
10
20 22 16 17 20
5
19
30
18
1
-24
-22 -18
-39
-84 -7
3
-46 -3
6
20 16 23
-17
4 8
-5
32 27
43
17 21
3
16 15 9
-4
-10
-20
-50
50
150
250
350
450
550
650
750
Jan-
95
Jul-9
5
Jan-
96
Jul-9
6
Jan-
97
Jul-9
7
Jan-
98
Jul-9
8
Jan-
99
Jul-9
9
Jan-
00
Jul-0
0
Jan-
01
Jul-0
1
Jan-
02
Jul-0
2
Jan-
03
Jul-0
3
Jan-
04
Jul-0
4
Jan-
05
Jul-0
5
Jan-
06
Jul-0
6
Jan-
07
Jul-0
7
Jan-
08
Jul-0
8
Jan-
09
Jul-0
9
Jan-
10
Jul-1
0
Jan-
11
Jul-1
1
Jan-
12
Estb +/- Strength
FIS( 1 ----- 1 )
565Bn ave98.2% of estb
-11Bn ave1.9% of str
|--- T13 ---|
2 LI / 5 RIFLES-6
3
-63
-21
10
-23
4
-22
-69
-43 -3
5 -19
-18
-17
-30
-43
-14
-15
-26
-40 -34 -1
8 -12
-27 -2
0 -17
-24
-8
-26
-7
-15
10
20 22 16 17 20
5
19
30
18
1
-24
-22 -18
-39
-84 -7
3
-46 -3
6
20 16 23
-17
4 8
-5
32 27
43
17 21
3
16 15 9
-4
-10
-20
-50
50
150
250
350
450
550
650
750
Jan-
95
Jul-9
5
Jan-
96
Jul-9
6
Jan-
97
Jul-9
7
Jan-
98
Jul-9
8
Jan-
99
Jul-9
9
Jan-
00
Jul-0
0
Jan-
01
Jul-0
1
Jan-
02
Jul-0
2
Jan-
03
Jul-0
3
Jan-
04
Jul-0
4
Jan-
05
Jul-0
5
Jan-
06
Jul-0
6
Jan-
07
Jul-0
7
Jan-
08
Jul-0
8
Jan-
09
Jul-0
9
Jan-
10
Jul-1
0
Jan-
11
Jul-1
1
Jan-
12
Estb +/- Strength

ANNEX B
THIS PAGE IS INTENTIONALLY BLANK

ANNEX B
DIVISIONAL MANNINGHistoric Strength Data (1995 - 2011)
THE ROYAL IRISH REGT-5
-16
-72 -4
1 -19
-54
-68 -61
-66
-141 -134
-136
-144 -1
11
-140
-176 -167
-169
-168
-169 -1
50
-171 -164 -1
50 -135 -1
20 -113 -9
6
-111
-66
-109
-122
-122
-142 -1
11
-45
-44
-40
-41
-39
-39
-48
-46
-44
-64
-98 -8
4
-99
-96
-94
-99
-116
-111 -105
-113 -106
-81 -75 -67
-68
-19
-29
-28
-1 -9
-30
-38
-34
-250
250
750
1250
1750
2250
2750
3250
3750
4250Ja
n-95
Jul-9
5
Jan-
96
Jul-9
6
Jan-
97
Jul-9
7
Jan-
98
Jul-9
8
Jan-
99
Jul-9
9
Jan-
00
Jul-0
0
Jan-
01
Jul-0
1
Jan-
02
Jul-0
2
Jan-
03
Jul-0
3
Jan-
04
Jul-0
4
Jan-
05
Jul-0
5
Jan-
06
Jul-0
6
Jan-
07
Jul-0
7
Jan-
08
Jul-0
8
Jan-
09
Jul-0
9
Jan-
10
Jul-1
0
Jan-
11
Jul-1
1
Jan-
12
Estb +/- Strength
FIS( 1 ----- 1 )
475Div ave84.4%of estb
-88Div ave
18.5% of str

ANNEX B
R IRISH BATTALION MANNINGHistoric Strength Data (1995 - 2011)
FIS( 0 -- 1 -- 0)
481Bn ave88.3%of estb
-64Bn ave
13.3% of str
1 R IRISH
-5
-16
-72
-41
-19
-54
-68 -6
1
-66
-141 -1
34
-136
-144
-111
-140
-176 -1
67
-169
-168
-169
-150
-171 -1
64 -150 -1
35 -120 -1
13
-96
-111
-66
-109
-122
-122
-142
-111
-45
-44 -40
-41
-39
-39
-48
-46
-44
-64
-98 -8
4
-99 -96
-94
-99
-116 -111 -105
-113 -1
06
-81 -75 -6
7
-68
-19
-29
-28
-1
-9
-30
-38 -34
-50
50
150
250
350
450
550
650
750
Jan-
95
Jul-9
5
Jan-
96
Jul-9
6
Jan-
97
Jul-9
7
Jan-
98
Jul-9
8
Jan-
99
Jul-9
9
Jan-
00
Jul-0
0
Jan-
01
Jul-0
1
Jan-
02
Jul-0
2
Jan-
03
Jul-0
3
Jan-
04
Jul-0
4
Jan-
05
Jul-0
5
Jan-
06
Jul-0
6
Jan-
07
Jul-0
7
Jan-
08
Jul-0
8
Jan-
09
Jul-0
9
Jan-
10
Jul-1
0
Jan-
11
Jul-1
1
Jan-
12
Estb +/- Strength
475Bn ave84.4% of estb
-88Bn ave18.5% of str
FIS( 1 ----- 1 )
|---- H8 ----| |--- H13 ---|
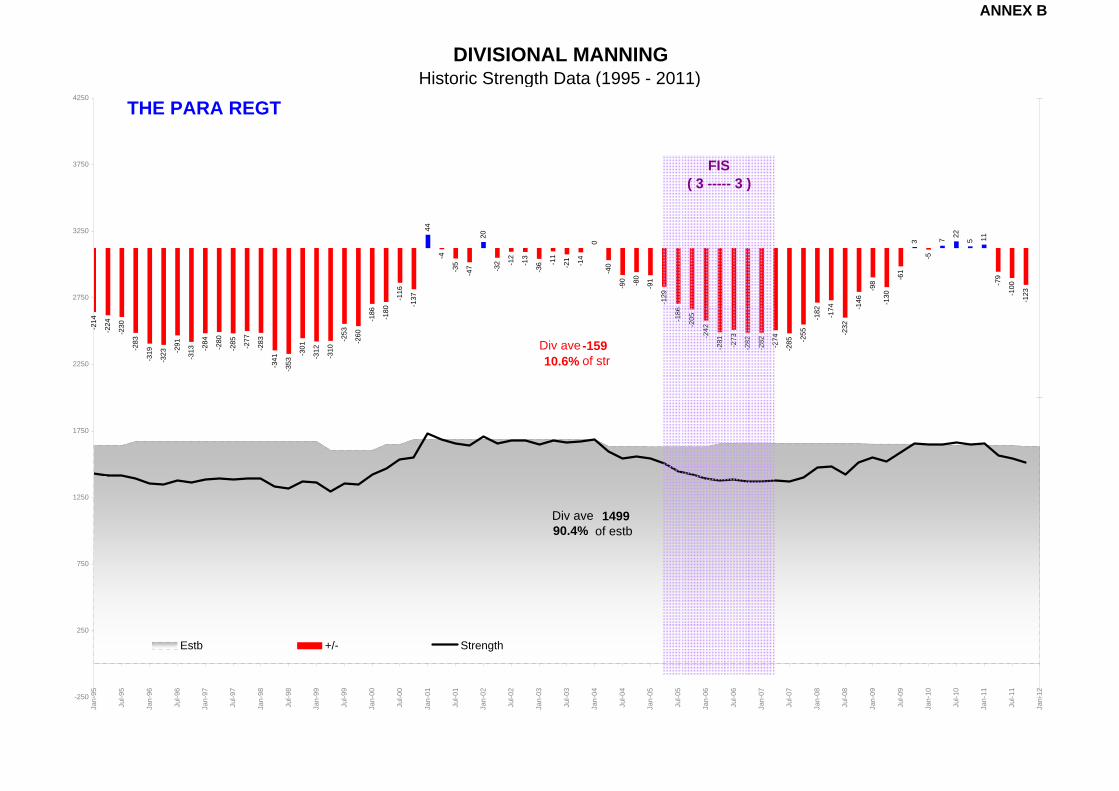
ANNEX B
DIVISIONAL MANNINGHistoric Strength Data (1995 - 2011)
THE PARA REGT-2
14
-224
-230
-283
-319
-323 -2
91
-313 -2
84
-280
-285 -277
-283
-341
-353
-301
-312
-310
-253
-260
-186 -180
-116
-137
44
-4
-35
-47
20
-32 -1
2
-13
-36 -1
1
-21 -14
0
-40
-90 -80
-91
-129
-186
-205
-242
-281 -273
-282
-282 -274
-285 -2
55
-182 -174
-232
-146
-98
-130
-61
3
-5
7 22
5 11
-79
-100
-123
-250
250
750
1250
1750
2250
2750
3250
3750
4250Ja
n-95
Jul-9
5
Jan-
96
Jul-9
6
Jan-
97
Jul-9
7
Jan-
98
Jul-9
8
Jan-
99
Jul-9
9
Jan-
00
Jul-0
0
Jan-
01
Jul-0
1
Jan-
02
Jul-0
2
Jan-
03
Jul-0
3
Jan-
04
Jul-0
4
Jan-
05
Jul-0
5
Jan-
06
Jul-0
6
Jan-
07
Jul-0
7
Jan-
08
Jul-0
8
Jan-
09
Jul-0
9
Jan-
10
Jul-1
0
Jan-
11
Jul-1
1
Jan-
12
Estb +/- Strength
FIS( 3 ----- 3 )
1499Div ave90.4% of estb
-159Div ave10.6% of str

ANNEX B
PARA BATTALION MANNINGHistoric Strength Data (1995 - 2011)
1 PARA - SFSG(-)-7
4
-87 -83
-97
-113 -109
-126
-125
-102
-70
-32
-46
-61
-68
-81
-94
-105
-124
-91 -8
1
-99
-54
-52
-50
25
6
-10
-27 -1
8
4 7 10 13 17
38 34 31
-6
-40 -3
1 -16
-48
-66
-64
-79
-110
-92
-104
-81
-81
-92
-92
-64 -5
4
-74
-47 -42
-49
-21
16
-4 -1
16
-5
-10
1
-6
-27
-50
50
150
250
350
450
550
650
750
Jan-
95
Jul-9
5
Jan-
96
Jul-9
6
Jan-
97
Jul-9
7
Jan-
98
Jul-9
8
Jan-
99
Jul-9
9
Jan-
00
Jul-0
0
Jan-
01
Jul-0
1
Jan-
02
Jul-0
2
Jan-
03
Jul-0
3
Jan-
04
Jul-0
4
Jan-
05
Jul-0
5
Jan-
06
Jul-0
6
Jan-
07
Jul-0
7
Jan-
08
Jul-0
8
Jan-
09
Jul-0
9
Jan-
10
Jul-1
0
Jan-
11
Jul-1
1
Jan-
12
Estb +/- Strength
FIS( 1 ----- 1)
491Bn ave91.1% of estb
-48Bn ave
9.8% of str
|----------------------------- H -----------------------------|

ANNEX B
PARA BATTALION MANNINGHistoric Strength Data (1995 - 2011)
2 PARA-5
4
-65
-78
-80
-96
-94
-48
-52
-50
-70
-104
-122 -1
06
-128
-101
-72
-19
-70
-96
-119 -1
06
-125
-81 -6
9
-5 -6
-16
-24
32
6
-21 -1
2
-28 -1
8
-35 -2
1 -16
5
-8
-19
-29
-39
-64
-69
-79
-85 -82
-89
-103
-103
-84
-83
-48
-53
-84
-50
-2
-18 -9 -3
2 0 3 7
17
-55
-72
-71
-50
50
150
250
350
450
550
650
750
Jan-
95
Jul-9
5
Jan-
96
Jul-9
6
Jan-
97
Jul-9
7
Jan-
98
Jul-9
8
Jan-
99
Jul-9
9
Jan-
00
Jul-0
0
Jan-
01
Jul-0
1
Jan-
02
Jul-0
2
Jan-
03
Jul-0
3
Jan-
04
Jul-0
4
Jan-
05
Jul-0
5
Jan-
06
Jul-0
6
Jan-
07
Jul-0
7
Jan-
08
Jul-0
8
Jan-
09
Jul-0
9
Jan-
10
Jul-1
0
Jan-
11
Jul-1
1
Jan-
12
Estb +/- Strength
FIS( 1 ----- 1 )
505Bn ave90.7% of estb
-52Bn ave10.3% of str
|---- H8 ----| |--- H13 ---|

ANNEX B
PARA BATTALION MANNINGHistoric Strength Data (1995 - 2011)
3 PARA-8
6 -72 -69
-106
-110
-120 -117
-136 -132
-140
-149
-109
-116
-145
-171
-135
-188
-116
-66 -60
19
-1
17
-18
24
-4 -9
4 6
-42
2
-11
-21 -1
0
-24
-27 -1
5
-39
-42 -3
0
-46 -42
-56
-72
-84
-86
-99 -8
9
-98 -9
0
-109
-80 -7
0 -67
-74
-49
-54
-63
-31
-10 -3
8 3 3 4
-25 -22
-25
-50
50
150
250
350
450
550
650
750
Jan-
95
Jul-9
5
Jan-
96
Jul-9
6
Jan-
97
Jul-9
7
Jan-
98
Jul-9
8
Jan-
99
Jul-9
9
Jan-
00
Jul-0
0
Jan-
01
Jul-0
1
Jan-
02
Jul-0
2
Jan-
03
Jul-0
3
Jan-
04
Jul-0
4
Jan-
05
Jul-0
5
Jan-
06
Jul-0
6
Jan-
07
Jul-0
7
Jan-
08
Jul-0
8
Jan-
09
Jul-0
9
Jan-
10
Jul-1
0
Jan-
11
Jul-1
1
Jan-
12
Estb +/- Strength
FIS( 1 ----- 1 )
503Bn ave89.6% of estb
-59Bn ave11.7% of str
|---- H8 ----| |--- H13 ---|

ANNEX B
RGR - REGIMENTAL MANNINGHistoric Strength Data (1995 - 2011)
RGR 12
0
30
8
-45
-2
-23
-176
-292
107
43
-14 -7
55
44
24
-32
32
-3
-13
-71
7
-1 -5
-37
16
-8
-18
11
-49
160
20
78 73
36
1
21
151 17
0
118
40
30
19
59
40
-28
-26
-28
-108
36 36
126
121
232 24
3
293
230
178
181
117
175
210
249 255
398
399
261
233
204
-250
250
750
1250
1750
2250
2750
3250
3750
4250Ja
n-95
Jul-9
5
Jan-
96
Jul-9
6
Jan-
97
Jul-9
7
Jan-
98
Jul-9
8
Jan-
99
Jul-9
9
Jan-
00
Jul-0
0
Jan-
01
Jul-0
1
Jan-
02
Jul-0
2
Jan-
03
Jul-0
3
Jan-
04
Jul-0
4
Jan-
05
Jul-0
5
Jan-
06
Jul-0
6
Jan-
07
Jul-0
7
Jan-
08
Jul-0
8
Jan-
09
Jul-0
9
Jan-
10
Jul-1
0
Jan-
11
Jul-1
1
Jan-
12
Estb +/- Strength
FIS( 2 ----- 2)
1572Regt ave104.6% of estb
69Regt ave9.8% of str

ANNEX B
THIS PAGE IS INTENTIONALLY BLANK

ANNEX C
Div Battalion % of str Div Battalion % of str1 GREN GDS 1 7.69% Sorted 1 GREN GDS 1 1.38%1 COLDM GDS 1 -0.07% 1 DWR 1 COLDM GDS 1 7.18%1 SG 1 9.99% COLDM GDS 1 SG 1 12.53%1 IG 7.40% 1 WFR 1 IG 5.42% Sorted1 WG 4.64% 2 LI 1 WG 6.90% 2 LANCS1 RS 27.78% 1RWF 1 SCOTS 7.42% 1 R ANGLIAN1 KOSB 8.53% 2 R ANGLIAN 2 SCOTS 15.42% 1 RIFLES1 RHF 13.19% 1 LI 3 SCOTS 16.98% 3 RIFLES1 BW 13.75% 1 R ANGLIAN 4 SCOTS 29.54% 5 RIFLES1 HLDRS 16.83% 1 WG 5 SCOTS 16.65% 2 RIFLES1 A and SH 7.30% 1 QLR 4 RIFLES1 PWRR 12.90% 2 RGJ 1 PWRR 7.22% 1 LANCS2 PWRR 7.83% 1 PWO 2 PWRR 3.57% 1 GREN GDS1 RRF 9.54% 1 KINGS 1 RRF 13.28% 2 R ANGLIAN2 RRF 8.24% 1 A and SH 2 RRF 13.30% 2 PWRR1 R ANGLIAN 3.95% 1 IG 1 R ANGLIAN -4.39% 1 IG2 R ANGLIAN 3.13% 1 CHESHIRE 2 R ANGLIAN 2.04% 1 PARA1 QLR 6.00% 1 GREN GDS 1 LANCS -0.87% 2 PARA1 KORBR 11.57% 2 PWRR 2 LANCS -6.09% 1 WG1 KINGS 6.82% 1 STAFFORDS 1 YORKS 15.12% COLDM GDS1 PWO 6.75% 2 RRF 2 YORKS 23.89% 1 PWRR1 GH 9.54% 1 KOSB 3 YORKS 20.40% 1 SCOTS1 DWR -0.90% 1 GH 3 PARA1 CHESHIRE 7.59% 1 RRF 1 MERCIAN 18.71% 2 MERCIAN1 WFR 1.28% 1 D and D 2 MERCIAN 11.41% 1 R WELSH1 STAFFORDS 7.97% 1 RGJ 3 MERCIAN 14.04% 1 SG1RWF 2.84% 1 SG 1 R WELSH 11.51% 1 RRF1 RRW 10.78% 1 PARA 2 R WELSH 16.93% 2 RRF1 RGBW 11.81% 1 RRW 1 R IRISH
1 D and D 9.57% 2 PARA 3 MERCIAN1 RGJ 9.96% 1 KORBR 1 RIFLES -3.76% 1 YORKS1 LI 3.68% 1 RGBW 2 RIFLES -1.73% 2 SCOTS2 RGJ 6.12% 3 PARA 3 RIFLES -2.28% 5 SCOTS2 LI 2.66% 1 PWRR 4 RIFLES -0.92% 2 R WELSH
1 RHF 5 RIFLES -1.96% 3 SCOTS
R IR 1 R IRISH 20.93% 1 BW R IR 1 R IRISH 13.51% 1 MERCIAN
1 PARA 10.06% 1 HLDRS 1 PARA 6.68% 3 YORKS2 PARA 10.79% 1 R IRISH 2 PARA 6.79% 2 YORKS3 PARA 12.57% 1 RS 3 PARA 7.88% 4 SCOTS
1 PDICs included within Regt strengths +ve % = undermannedGRCs excluded from data -ve % = overmanned
RIF
LES
PA
RA
Surplus / Deficit Ranking - % of Strength (1995 - 2011)AVERAGE INFANTRY BATTALION MANNING
QU
EEN
SFT
GD
SK
ING
SS
CO
TSP
oW
Pos FIS(2007 - 2011)
Pre FIS(1995 - 2005)
PoW
RIF
LES
PA
RA
FT G
DS
SC
OTS
QU
EEN
SK
ING
S

ANNEX C
THIS PAGE IS INTENTIONALLY BLANK

ANNEX D
Div Battalion
Apr
-09
Jul-0
9
Oct
-09
Jan-
10
Apr
-10
Jul-1
0
Oct
-10
Jan-
11
Apr
-11
Jul-1
1
TOTAL
1 GREN GDS 0.3% 0.6% 0.6% 0.7% 0.9% 0.2% 0.2% 0.35%1 COLDM GDS 0.2% 0.3% 2.3% 1.4% 1.0% 0.2% 0.5% 0.5% 0.5% 0.69%1 SG 0.2% 0.2% 0.2% 0.2% 0.5% 0.5% 0.9% 0.5% 0.30%1 IG 0.7% 0.9% 1.3% 0.2% 0.7% 0.2% 0.2% 0.42%1 WG 0.2% 0.9% 0.4% 0.6% 1.2% 0.2% 0.2% 1.4% 0.50%TOTAL 0.07% 0.30% 0.69% 0.57% 0.54% 0.71% 0.23% 0.47% 0.41% 0.49% 0.45%1 SCOTS 0.2% 0.2% 0.2% 1.0% 1.1% 0.9% 1.2% 0.48%2 SCOTS 0.5% 0.2% 0.7% 2.1% 0.6% 0.4% 0.4% 0.6% 0.54%3 SCOTS 0.2% 0.2% 0.8% 0.2% 0.7% 0.7% 0.2% 0.5% 0.7% 0.5% 0.45%4 SCOTS 0.5% 0.7% 1.2% 0.2% 0.2% 0.9% 0.7% 0.2% 0.2% 0.47%5 SCOTS 0.9% 1.1% 0.2% 0.2% 0.4% 0.4% 0.2% 0.4% 0.4% 1.2% 0.53%TOTAL 0.43% 0.46% 0.57% 0.53% 0.26% 0.38% 0.55% 0.51% 0.51% 0.75% 0.49%1 PWRR 0.2% 1.0% 0.7% 0.3% 0.22%2 PWRR 0.2% 0.2% 0.2% 0.2% 0.4% 0.5% 0.2% 0.4% 0.2% 0.24%
PWRR 0.2% 0.1% 0.1% 0.7% 0.6% 0.3% 0.1% 0.2% 0.3% 0.23%1 RRF 0.2% 0.7% 0.9% 1.0% 0.3% 2.1% 1.6% 0.72%2 RRF 1.8% 0.2% 0.4% 1.6% 1.2% 0.2% 0.54%
RRF 0.1% 1.0% 0.5% 0.8% 0.6% 1.1% 1.9% 1.1% 0.64%1 R ANGLIAN 0.2% 0.2% 0.6% 0.3% 0.3% 0.5% 0.2% 0.23%2 R ANGLIAN 0.6% 0.2% 0.2% 0.6% 0.2% 0.2% 0.9% 0.2% 0.30%
R ANGLIAN 0.3% 0.1% 0.2% 0.4% 0.4% 0.1% 0.6% 0.3% 0.3% 0.1% 0.26%TOTAL 0.19% 0.06% 0.06% 0.42% 0.50% 0.41% 0.47% 0.41% 0.69% 0.42% 0.37%1 LANCS 1.1% 0.2% 0.8% 2.0% 0.2% 0.2% 0.4% 0.9% 1.0% 0.67%2 LANCS 1.7% 2.7% 0.2% 1.7% 0.2% 0.5% 0.4% 0.74%
LANCS 0.6% 0.9% 0.4% 2.4% 0.1% 0.9% 0.2% 0.2% 0.7% 0.7% 0.70%1 YORKS 0.2% 0.2% 0.2% 0.2% 1.4% 0.4% 0.28%2 YORKS 0.5% 0.7% 0.5% 0.2% 0.5% 0.4% 1.1% 2.0% 0.2% 1.1% 0.73%3 YORKS 0.6% 0.8% 0.2% 0.2% 0.8% 0.8% 0.2% 0.2% 0.4% 0.41%
YORKS 0.4% 0.5% 0.2% 0.1% 0.5% 0.5% 0.4% 1.2% 0.1% 0.6% 0.47%TOTAL 0.49% 0.68% 0.32% 1.17% 0.31% 0.68% 0.31% 0.73% 0.40% 0.64% 0.57%1 MERCIAN 0.7% 0.2% 0.6% 3.2% 1.5% 0.64%2 MERCIAN 0.2% 0.2% 0.6% 0.4% 0.4% 2.9% 0.6% 0.51%3 MERCIAN 0.4% 0.2% 0.5% 1.3% 1.8% 2.7% 0.69%
MERCIAN 0.3% 0.1% 0.2% 0.1% 0.1% 0.2% 0.3% 1.5% 1.7% 1.7% 0.62%1 R WELSH 0.8% 0.8% 0.6% 0.7% 0.6% 0.8% 0.4% 0.6% 0.4% 1.2% 0.70%2 R WELSH 0.6% 0.5% 1.2% 0.7% 1.1% 0.9% 0.4% 0.54%
R WELSH 0.7% 0.7% 0.3% 1.0% 0.3% 0.7% 0.8% 0.3% 0.7% 0.8% 0.62%TOTAL 0.44% 0.31% 0.23% 0.45% 0.19% 0.42% 0.51% 1.02% 1.31% 1.30% 0.62%1 RIFLES 0.2% 2.5% 2.2% 2.2% 3.4% 3.9% 1.43%2 RIFLES 0.2% 0.2% 0.5% 0.2% 0.9% 0.4% 1.3% 1.2% 0.8% 0.55%3 RIFLES 0.2% 0.2% 0.5% 0.5% 0.4% 0.2% 0.2% 0.4% 1.0% 0.34%4 RIFLES 0.5% 0.5% 0.7% 1.3% 1.5% 0.42%5 RIFLES 0.8% 0.2% 0.3% 0.2% 0.3% 0.2% 0.5% 0.24%TOTAL 0.07% 0.10% 0.75% 0.17% 0.69% 0.79% 0.17% 0.46% 1.24% 1.58% 0.59%1 R IRISH 1.0% 0.4% 0.8% 1.3% 0.2% 0.2% 1.1% 1.5% 2.9% 0.95%TOTAL 1.04% 0.41% 0.82% 1.31% 0.19% 0.18% 1.10% 1.53% 2.91% 0.95%1 PARA 0.2% 0.2% 0.8% 0.4% 0.15%2 PARA 0.4% 0.5% 2.1% 4.2% 4.4% 1.09%3 PARA 3.1% 0.5% 0.4% 2.0% 0.6% 0.6% 0.72%TOTAL 0.13% 1.09% 0.18% 0.30% 0.06% 1.63% 1.66% 1.56% 0.66%
Grand Total 0.28% 0.28% 0.40% 0.60% 0.40% 0.53% 0.34% 0.69% 0.86% 0.96% 0.53%PDICs included within Regt strengths Key:
Significantly above Infantry AverageAbove Infantry AverageBelow Infantry Average
Date
INFANTRY BATTALION OUTFLOWCompletions Outflow - % of Strength (2009 - 2011)
FT G
DS
SC
OTS
R IR
ISP
AR
AQ
UEE
NS
KIN
GS
PoW
RIF
LES

ANNEX D
Div Battalion
Apr
-09
Jul-0
9
Oct
-09
Jan-
10
Apr
-10
Jul-1
0
Oct
-10
Jan-
11
Apr
-11
Jul-1
1
TOTAL
1 GREN GDS 0.2% 0.6% 0.6% 0.6% 0.6% 0.7% 0.6% 0.5% 0.44%1 COLDM GDS 0.7% 0.3% 0.3% 0.7% 1.2% 0.9% 2.0% 0.61%1 SG 0.3% 1.1% 0.14%1 IG 0.5% 0.9% 1.1% 2.2% 2.1% 2.0% 0.86%1 WG 2.1% 1.0% 3.0% 2.2% 2.3% 1.07%TOTAL 0.04% 0.51% 0.31% 0.13% 0.84% 0.74% 0.80% 0.80% 0.69% 1.12% 0.60%1 SCOTS 0.2% 2.1% 0.2% 0.8% 0.33%2 SCOTS 1.4% 0.2% 0.7% 0.7% 1.1% 0.6% 0.2% 0.4% 0.6% 0.58%3 SCOTS 0.9% 1.9% 0.6% 1.8% 2.7% 1.6% 0.7% 2.0% 1.2% 1.33%4 SCOTS 0.7% 0.2% 0.2% 1.8% 0.4% 0.2% 0.9% 0.8% 0.53%5 SCOTS 1.4% 0.7% 0.4% 1.1% 1.4% 0.6% 2.8% 3.6% 1.4% 1.37%TOTAL 0.91% 1.05% 0.39% 1.05% 1.07% 0.51% 0.25% 1.26% 1.26% 0.58% 0.84%1 PWRR 1.1% 1.8% 2.1% 1.3% 1.6% 2.0% 1.6% 1.5% 0.7% 2.1% 1.57%2 PWRR 3.3% 2.5% 1.5% 0.7% 0.5% 0.7% 0.5% 1.2% 1.1% 1.9% 1.39%
PWRR 2.2% 2.2% 1.9% 1.1% 1.2% 1.5% 1.2% 1.5% 0.9% 2.2% 1.48%1 RRF 2.1% 0.19%2 RRF 1.6% 0.8% 3.1% 1.4% 2.2% 1.0% 2.2% 1.25%
RRF 1.1% 0.9% 0.4% 1.7% 0.8% 1.2% 0.5% 1.2% 0.70%1 R ANGLIAN 1.5% 2.0% 1.7% 3.1% 1.5% 0.9% 2.6% 1.34%2 R ANGLIAN 3.3% 2.9% 0.4% 0.4% 2.4% 4.2% 1.1% 1.4% 1.7% 1.7% 1.94%
R ANGLIAN 1.5% 1.3% 1.0% 1.3% 2.1% 3.8% 1.3% 0.7% 1.2% 2.1% 1.62%TOTAL 1.60% 1.43% 1.09% 0.80% 1.55% 1.91% 1.16% 0.71% 0.87% 1.75% 1.29%1 LANCS 0.5% 0.8% 2.1% 2.0% 1.8% 1.6% 0.8% 0.4% 1.00%2 LANCS 2.9% 2.6% 0.2% 1.1% 1.1% 0.7% 0.7% 1.3% 1.03%
LANCS 1.7% 1.7% 0.1% 1.6% 1.0% 1.4% 1.1% 0.7% 0.8% 1.01%1 YORKS 0.7% 0.8% 0.2% 0.9% 1.8% 0.8% 1.0% 2.8% 0.89%2 YORKS 0.5% 1.7% 1.5% 1.0% 0.4% 1.3% 1.1% 1.6% 2.3% 1.15%3 YORKS 1.5% 0.8% 0.8% 1.5% 1.5% 0.2% 0.2% 0.8% 1.6% 0.88%
YORKS 0.7% 0.7% 0.9% 1.3% 1.4% 0.5% 0.8% 0.3% 1.7% 1.3% 0.97%TOTAL 1.15% 0.40% 1.25% 0.74% 1.51% 0.71% 1.07% 0.69% 1.24% 1.12% 0.99%1 MERCIAN 0.9% 0.7% 0.9% 0.8% 3.0% 0.62%2 MERCIAN 4.3% 3.8% 0.7% 1.3% 0.8% 1.3% 2.0% 1.8% 1.7% 1.76%3 MERCIAN 1.8% 1.5% 1.1% 2.4% 1.1% 1.6% 0.2% 0.4% 0.99%
MERCIAN 2.3% 2.1% 0.7% 1.3% 0.8% 0.9% 0.5% 0.7% 0.5% 1.5% 1.13%1 R WELSH 1.8% 1.2% 2.0% 1.8% 0.68%2 R WELSH 1.1% 2.4% 1.4% 1.1% 0.4% 0.4% 0.4% 1.7% 0.87%
R WELSH 0.6% 1.2% 1.6% 0.6% 0.8% 1.1% 0.2% 1.7% 0.78%TOTAL 1.61% 1.22% 0.90% 0.79% 1.14% 0.73% 0.59% 0.90% 0.40% 1.57% 0.98%1 RIFLES 0.7% 0.9% 0.2% 0.2% 0.19%2 RIFLES 0.8% 1.6% 1.5% 2.0% 0.6% 1.5% 0.9% 1.5% 1.0% 0.2% 1.16%3 RIFLES 0.7% 0.7% 0.7% 2.0% 2.4% 2.8% 2.1% 3.1% 2.7% 3.2% 2.03%4 RIFLES 1.1% 1.0% 0.8% 1.0% 0.6% 1.5% 1.7% 1.0% 1.3% 0.8% 1.06%5 RIFLES 0.6% 0.8% 1.6% 0.8% 0.2% 0.6% 0.2% 2.0% 4.1% 1.07%TOTAL 0.79% 0.98% 0.92% 1.14% 0.79% 1.31% 0.98% 1.51% 0.95% 1.66% 1.10%1 R IRISH 0.8% 1.6% 0.4% 0.4% 2.9% 1.3% 1.0% 0.4% 0.87%TOTAL 0.83% 1.64% 0.41% 0.37% 2.85% 1.27% 0.95% 0.39% 0.87%1 PARA 1.4% 1.7% 0.9% 0.9% 1.5% 1.5% 1.5% 4.2% 2.6% 2.7% 1.88%2 PARA 0.6% 0.6% 0.5% 1.8% 2.0% 1.4% 0.7% 0.78%3 PARA 1.6% 1.5% 0.7% 0.9% 1.1% 3.0% 0.4% 0.91%TOTAL 1.18% 0.75% 0.97% 0.91% 1.39% 1.26% 1.09% 1.33% 1.92% 1.04% 1.18%
Grand Total 1.02% 0.95% 0.82% 0.77% 1.23% 1.03% 0.87% 0.97% 0.98% 1.28% 0.99%PDICs included within Regt strengths Key:
Significantly above Infantry AverageAbove Infantry AverageBelow Infantry Average
Date
INFANTRY BATTALION OUTFLOWPVR Outflow - % of Strength (2009 - 2011)
FT G
DS
SC
OTS
R IR
ISP
AR
AQ
UEE
NS
KIN
GS
PoW
RIF
LES
Personnel may PVR for a number of both personal and service related reasons. A high PVR rate does not mean there is any problem with a specific battalion.

ANNEX D
Div Battalion
Apr
-09
Jul-0
9
Oct
-09
Jan-
10
Apr
-10
Jul-1
0
Oct
-10
Jan-
11
Apr
-11
Jul-1
1
TOTAL
1 GREN GDS 0.2% 1.1% 0.5% 0.3% 0.9% 1.0% 0.4% 0.6% 0.8% 1.0% 0.67%1 COLDM GDS 0.9% 0.5% 2.6% 2.3% 0.9% 1.2% 1.0% 0.2% 0.96%1 SG 0.3% 1.2% 2.1% 1.8% 0.3% 0.8% 0.3% 1.8% 0.8% 0.96%1 IG 0.4% 1.3% 0.5% 1.5% 0.9% 0.9% 0.4% 1.8% 0.77%1 WG 1.5% 1.4% 0.2% 0.2% 0.2% 0.35%TOTAL 0.21% 0.47% 1.13% 0.97% 1.14% 0.84% 0.47% 0.60% 0.90% 0.77% 0.75%1 SCOTS 0.7% 1.1% 0.2% 1.8% 0.6% 0.2% 1.3% 1.2% 0.71%2 SCOTS 0.9% 0.8% 0.9% 0.9% 0.4% 0.4% 0.6% 0.6% 1.5% 0.71%3 SCOTS 0.4% 1.3% 0.4% 1.4% 0.4% 1.3% 0.5% 0.9% 0.2% 0.68%4 SCOTS 0.2% 0.2% 1.1% 0.2% 0.9% 0.8% 0.36%5 SCOTS 0.7% 0.9% 0.7% 1.7% 1.0% 0.6% 0.8% 0.4% 1.0% 0.4% 0.80%TOTAL 0.52% 0.67% 0.65% 1.05% 0.77% 0.38% 0.59% 0.17% 0.93% 0.83% 0.66%1 PWRR 0.5% 0.5% 0.2% 0.2% 0.8% 1.8% 0.8% 1.3% 1.0% 1.0% 0.82%2 PWRR 0.6% 0.2% 0.2% 1.2% 0.4% 0.4% 0.4% 0.33%
PWRR 0.6% 0.3% 0.1% 0.2% 0.6% 1.0% 1.1% 0.9% 0.8% 0.8% 0.59%1 RRF 0.2% 0.2% 0.4% 0.2% 0.6% 0.3% 1.6% 1.4% 1.0% 0.5% 0.67%2 RRF 0.2% 1.8% 1.9% 1.2% 0.6% 2.7% 3.5% 1.4% 1.6% 1.49%
RRF 0.2% 1.1% 1.2% 0.8% 0.6% 1.7% 2.8% 0.9% 1.4% 1.2% 1.06%1 R ANGLIAN 0.2% 0.5% 0.3% 0.2% 2.0% 0.5% 0.7% 0.43%2 R ANGLIAN 0.6% 1.5% 0.8% 1.3% 1.1% 2.1% 0.4% 0.7% 1.3% 0.4% 1.02%
R ANGLIAN 0.00%TOTAL 0.35% 0.69% 0.59% 0.53% 0.56% 1.48% 1.19% 0.65% 0.93% 0.75% 0.78%1 LANCS 0.7% 0.5% 1.0% 1.3% 0.5% 0.7% 0.7% 1.1% 2.3% 0.8% 0.93%2 LANCS 1.2% 1.9% 1.7% 1.3% 1.9% 0.7% 1.9% 0.7% 0.5% 0.9% 1.26%
LANCS 0.9% 1.2% 1.3% 1.3% 1.2% 0.7% 1.3% 0.9% 1.4% 0.8% 1.09%1 YORKS 0.9% 0.7% 0.5% 1.8% 0.2% 0.4% 0.9% 0.54%2 YORKS 1.9% 1.2% 1.0% 1.2% 0.7% 0.9% 1.3% 2.0% 0.7% 1.1% 1.19%3 YORKS 0.8% 0.4% 0.6% 2.8% 0.6% 1.0% 0.8% 0.8% 0.6% 0.84%
YORKS 0.6% 0.7% 0.7% 0.8% 1.4% 1.1% 0.8% 1.0% 0.8% 0.6% 0.85%TOTAL 0.74% 0.88% 1.01% 1.02% 1.32% 0.90% 1.03% 0.95% 1.04% 0.68% 0.96%1 MERCIAN 0.9% 0.5% 1.7% 1.3% 2.1% 1.7% 1.2% 0.2% 1.9% 1.15%2 MERCIAN 1.9% 0.2% 0.6% 0.9% 0.8% 0.2% 0.7% 0.2% 0.8% 0.65%3 MERCIAN 3.5% 1.5% 0.9% 0.7% 2.2% 0.9% 1.4% 3.8% 5.9% 2.08%
MERCIAN 1.5% 1.3% 0.9% 0.8% 1.7% 1.1% 0.6% 2.0% 2.3% 0.9% 1.32%1 R WELSH 0.6% 1.4% 3.2% 0.9% 0.8% 1.8% 1.4% 1.2% 0.8% 0.2% 1.24%2 R WELSH 0.2% 1.8% 1.5% 1.4% 0.4% 0.7% 0.5% 0.9% 1.7% 1.1% 1.01%
R WELSH 0.4% 1.6% 2.3% 1.2% 0.6% 1.2% 1.0% 1.1% 1.3% 0.7% 1.12%TOTAL 1.05% 1.45% 1.48% 0.98% 1.26% 1.16% 0.74% 1.61% 1.90% 0.79% 1.24%1 RIFLES 1.2% 2.8% 0.5% 1.3% 1.3% 1.2% 1.3% 1.3% 0.7% 1.15%2 RIFLES 0.2% 1.6% 0.9% 0.5% 0.4% 1.3% 0.9% 0.6% 0.4% 0.68%3 RIFLES 0.9% 0.5% 0.3% 1.2% 1.1% 1.1% 1.2% 0.63%4 RIFLES 0.9% 1.4% 1.1% 0.8% 0.7% 0.2% 1.9% 0.7% 1.0% 0.86%5 RIFLES 0.3% 0.3% 1.9% 2.2% 1.3% 0.3% 0.3% 1.3% 0.3% 0.84%TOTAL 0.28% 1.08% 1.46% 0.74% 0.76% 0.93% 0.35% 1.30% 0.73% 0.70% 0.83%1 R IRISH 0.8% 2.5% 0.2% 0.4% 0.2% 0.2% 0.41%TOTAL 0.83% 2.46% 0.19% 0.38% 0.18% 0.18% 0.41%1 PARA 0.9% 0.4% 0.13%2 PARA 0.2% 0.4% 0.4% 0.4% 0.2% 0.4% 0.4% 0.22%3 PARA 0.6% 1.5% 0.2% 0.2% 0.7% 0.5% 0.2% 0.2% 0.41%TOTAL 0.26% 0.50% 0.12% 0.06% 0.18% 0.67% 0.36% 0.19% 0.19% 0.25%
Grand Total 0.49% 0.88% 0.93% 0.78% 0.86% 0.88% 0.72% 0.81% 0.95% 0.68% 0.80%PDICs included within Regt strengths Key:
R IR
ISP
AR
AQ
UEE
NS
KIN
GS
PoW
RIF
LES
INFANTRY BATTALION OUTFLOWSNLR Outflow - % of Strength (2009 - 2011)
FT G
DS
SC
OTS
Significantly above Infantry AverageAbove Infantry AverageBelow Infantry Average
Date
There are a number of reasons why a serviceman may no longer be required. It may be for disciplinary reasons, but could be for a variety of administrative reasons which are not the fault of the individual.

ANNEX D
THIS PAGE IS INTENTIONALLY BLANK

ANNEX E
1
2011/12/07 HQ Inf/001 ‘COMMENTING ON THE LOGICAL INTEGRITY OF REGIONAL DEFINITIONS / BNDYS’. References: A. ONS Map: United Kingdom: Regions, Counties & Unitary Authorities 2011. B. LWC MMC 019733 10/05 Infantry Divisional & Regimental Recruiting Areas Map.
National Infantry Regiments.
1. A number of national infantry regiments exist: PARA (UK), GREN GDS & COLDM GDS (England), SCOTS, R IRISH, R WELSH.
English Regional Definition.
2. The UK Govt’s administrative definition of English regions is based upon European Parliamentary Constituency and English Regional Development Agency boundaries (Ref A). The Army definition of region is based upon the Regional Force lay down (Ref B). Infantry regional definition is based upon historical recruiting areas (Ref B). These definitions do not entirely correlate. The Office of National Statistics (ONS) collects data based on Nomenclature of Units for Territorial Statistics (NUTS) divisions. NUTS 1 is the regional level. Again there is not precise correlation with other regional definitions. Realistically, it is prudent to assess that regional definitions will continue to evolve. Any, potentially painful, attempt to tie regimental footprints too tightly to these iterative definitions may be temporary. Of note, at lower levels, NUTS 2 & 3, the clarity of data available to support recruiting activity is significantly clearer. Demographic analysis can provide justification of decisions regarding infantry recruiting policies. Whilst ONS data is abundant, analysis to interpret the data has been limited, introducing subjectivity into judgements and sustainability conclusions. Whilst there is confusion in defining region (eg NUTS 1), the detailed nature of the NUTS 2 &3 data enables its modular use to support a given regional definition. There is high confidence in Army Regional data sets as an illustration of sustainability, but a more detailed analysis will better generate assumptions to support forecasting to withstand detailed public scrutiny.
Administrative Region versus Army Region, versus Regional Infantry Regiment.
3. The Army currently defines the English regions through its RF bde boundaries. In the South East, two RF bdes (2X & 145X) occupy one English region (though AVANTI will adjust this). Of greater concern, for the East & East Midlands, two English regions are represented by just one RF bde (49X). This situation is repeated in the North East and Yorks & Humber regions (15X). This is further complicated by the historic recruiting presence of RRF / MERCIAN / RIFLES in 49X and RRF / RIFLES in 15X. RRF, MERCIAN and RIFLES are considered regional infantry regiments yet their recruiting scope extends across more than one English region as a result of earlier amalgamations of antecedent regiments. National regiments also recruit in 15X and 49X including Scots, Welsh & Irish. The celtic Foot Guards regiments hold a unique position, having the
BLUF:
• Army regional definitions (RF Brigades) do not correlate with political and economic regional identities in the East, East & West Midlands & North East. Seven infantry regiments (SG, IG, WG, RRF, YORKS, MERCIAN, RIFLES) have footprints which span the Army’s RF brigades.
• The advent of the Recruit Partnering Project (RPP) presents an opportunity to better identify future regional recruiting capacity to re-balance Inf recruiting.
• The complexity & consequences of demographic data are not fully understood at present, but the presentation of statistics based on RF brigades is viable for decision support.
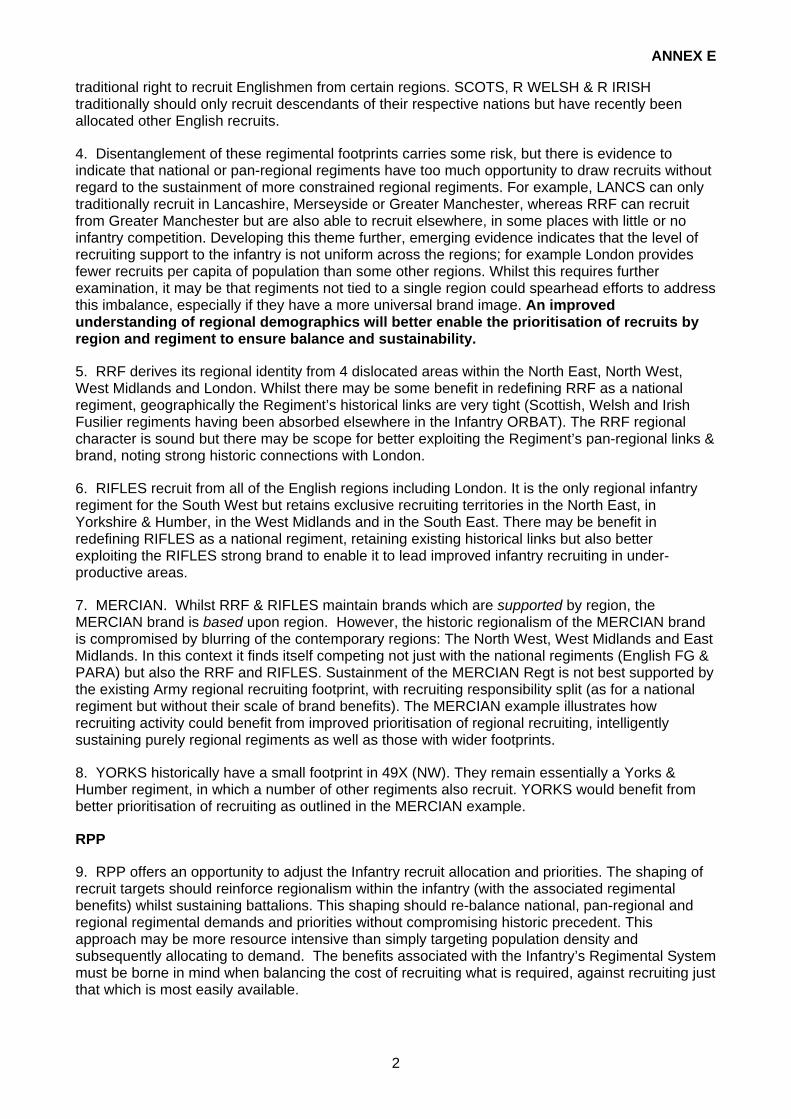
ANNEX E
2
traditional right to recruit Englishmen from certain regions. SCOTS, R WELSH & R IRISH traditionally should only recruit descendants of their respective nations but have recently been allocated other English recruits.
4. Disentanglement of these regimental footprints carries some risk, but there is evidence to indicate that national or pan-regional regiments have too much opportunity to draw recruits without regard to the sustainment of more constrained regional regiments. For example, LANCS can only traditionally recruit in Lancashire, Merseyside or Greater Manchester, whereas RRF can recruit from Greater Manchester but are also able to recruit elsewhere, in some places with little or no infantry competition. Developing this theme further, emerging evidence indicates that the level of recruiting support to the infantry is not uniform across the regions; for example London provides fewer recruits per capita of population than some other regions. Whilst this requires further examination, it may be that regiments not tied to a single region could spearhead efforts to address this imbalance, especially if they have a more universal brand image. An improved understanding of regional demographics will better enable the prioritisation of recruits by region and regiment to ensure balance and sustainability.
5. RRF derives its regional identity from 4 dislocated areas within the North East, North West, West Midlands and London. Whilst there may be some benefit in redefining RRF as a national regiment, geographically the Regiment’s historical links are very tight (Scottish, Welsh and Irish Fusilier regiments having been absorbed elsewhere in the Infantry ORBAT). The RRF regional character is sound but there may be scope for better exploiting the Regiment’s pan-regional links & brand, noting strong historic connections with London.
6. RIFLES recruit from all of the English regions including London. It is the only regional infantry regiment for the South West but retains exclusive recruiting territories in the North East, in Yorkshire & Humber, in the West Midlands and in the South East. There may be benefit in redefining RIFLES as a national regiment, retaining existing historical links but also better exploiting the RIFLES strong brand to enable it to lead improved infantry recruiting in under-productive areas.
7. MERCIAN. Whilst RRF & RIFLES maintain brands which are supported by region, the MERCIAN brand is based upon region. However, the historic regionalism of the MERCIAN brand is compromised by blurring of the contemporary regions: The North West, West Midlands and East Midlands. In this context it finds itself competing not just with the national regiments (English FG & PARA) but also the RRF and RIFLES. Sustainment of the MERCIAN Regt is not best supported by the existing Army regional recruiting footprint, with recruiting responsibility split (as for a national regiment but without their scale of brand benefits). The MERCIAN example illustrates how recruiting activity could benefit from improved prioritisation of regional recruiting, intelligently sustaining purely regional regiments as well as those with wider footprints.
8. YORKS historically have a small footprint in 49X (NW). They remain essentially a Yorks & Humber regiment, in which a number of other regiments also recruit. YORKS would benefit from better prioritisation of recruiting as outlined in the MERCIAN example.
RPP
9. RPP offers an opportunity to adjust the Infantry recruit allocation and priorities. The shaping of recruit targets should reinforce regionalism within the infantry (with the associated regimental benefits) whilst sustaining battalions. This shaping should re-balance national, pan-regional and regional regimental demands and priorities without compromising historic precedent. This approach may be more resource intensive than simply targeting population density and subsequently allocating to demand. The benefits associated with the Infantry’s Regimental System must be borne in mind when balancing the cost of recruiting what is required, against recruiting just that which is most easily available.

Produced by ONS GeographyGIS & Mapping Unit
Contains Ordnance Survey data © Crown copyright and database right 2011Council Areas in Scotland and District Council Areas in Northern Ireland are equivalent to Unitary Authorities in England and Wales, but are shown separately. 1
SwSw
ReReWkWk BFBF
WMWM SlSlSSSS
MwyMwyTkTk
NtNtDeDe
LrLr RRPePe
SS
TWTW
RCRCMMSTST
HpHp
DD
KHKHBplBpl
BnDBnD
BSBSNSNS
BB
SGSGCaCa
MonMon
NN
TTNPTNPTMTMT
CyCy
BGBG
VGVG
RCTRCTBdBd
SoSo
PoPoBHBH
WLWL
AA
DCDC
ELEL
MdMd
EdEd
ClCl
GG
EDEDWDWD
ERER
RnRn NLNLInIn
NELNEL
WtWtHnHn
LL
MKMK
BoBoPlPl
TyTyPyPy
Cheshire Ea
st
Cheshire Ea
st
Swansea
Swansea
Eile
an Si
ar
Eile
an Si
ar
Aberdee
nshi
re
Aberdee
nshi
re
North Ayrshire
North Ayrshire
Dumfries & Galloway
Dumfries & Galloway
Merseyside
Merseyside
North North
Lincolnshire
Lincolnshire
Leicestershire Leicestershire
Cere
digio
n
Cere
digio
n
Pembrokeshire
Pembrokeshire
Wrexham
Wrexham
Flintshire
Flintshire
Denbighshire
Denbighshire
Worcestershire
Worcestershire
Nor
th
amptonshire
Nor
th
amptonshire
Bedf
ordshire
Bedf
ordshire
Cent
ral
Cent
ral
Her
tford
shire
Her
tford
shire
Buckinghamshire
Buckinghamshire
SouthYorkshire
SouthYorkshire
Tyneand
Wear
Tyneand
Wear
WestMidlands
WestMidlands
West YorkshireWest Yorkshire
GreaterLondonGreaterLondon
GreaterManchester
GreaterManchester
CambridgeshireCambridgeshire
BedfordBedford
CumbriaCumbria
DerbyshireDerbyshire
DevonDevon
Isles of ScillyIsles of Scilly
DorsetDorset
County DurhamCounty Durham
East SussexEast Sussex
EssexEssexGloucestershireGloucestershire
HampshireHampshire
KentKent
LancashireLancashire
LincolnshireLincolnshire
NorfolkNorfolk
NorthumberlandNorthumberland
North YorkshireNorth Yorkshire
OxfordshireOxfordshire
ShropshireShropshire
Cheshire Westand
Chester
Cheshire Westand
Chester
SomersetSomerset
StaffordshireStaffordshire
SuffolkSuffolk
SurreySurrey
WarwickshireWarwickshire
West SussexWest Sussex
WiltshireWiltshire
East Ridingof YorkshireEast Ridingof Yorkshire
YorkYork
County of Herefordshire
County of Herefordshire
WestBerkshire
WestBerkshire
Isle ofWightIsle ofWight
Isle ofAngleseyIsle ofAnglesey
GwyneddGwynedd
ConwyConwy
PowysPowys
CarmarthenshireCarmarthenshire
Cornwall
Cornwall
Not
ting
ham
shir
e
Not
ting
ham
shir
e
AngusAngus
Argyll & ButeArgyll & Bute
Scottish BordersScottish BordersEastAyrshire
EastAyrshire
FalkirkFalkirk
FifeFife
HighlandHighlandMorayMoray
Orkney IslandsOrkney Islands
Perth & KinrossPerth & Kinross
Shetland IslandsShetland Islands
SouthAyrshireSouth
Ayrshire
SouthLanarkshire
SouthLanarkshire
StirlingStirling
Newry and Mourne Newry and Mourne
BaBa
BeBe
Antr
im
Antr
im
Col
erai
ne
Col
erai
ne
Lim
avad
y Li
mav
ady
CrCr
NDND
NtaNta CfCf
DownDownArmaghArmagh BanbridgeBanbridge
LisburnLisburn
ArdsArdsDungannonDungannon
CookstownCookstown
FermanaghFermanagh
StrabaneStrabane
OmaghOmagh
DerryDerry
BallymenaBallymena
LarneLarne
MoyleMoyle
Magherafelt
Magherafelt
Craigavon
Craigavon
East of England
Yorkshire andThe Humber
North West
West Midlands
East Midlands
South East
South West
North East
London
East of England
Yorkshire andThe Humber
North West
West Midlands
East Midlands
South East
South West
North East
London
Scotland
Northern Ireland
Wales
Scotland
Northern Ireland
Wales
A Aberdeen CityA Aberdeen City
Cl ClackmannanshireCl Clackmannanshire
DC Dundee CityDC Dundee City
EL East LothianEL East Lothian
Ed City of EdinburghEd City of Edinburgh
Md MidlothianMd Midlothian
WL West LothianWL West Lothian
Hp HartlepoolHp Hartlepool
M MiddlesbroughM Middlesbrough
RC Redcar and ClevelandRC Redcar and Cleveland
ST Stockton-on-TeesST Stockton-on-Tees
D DarlingtonD Darlington
Hn HaltonHn Halton
Wt WarringtonWt Warrington
BnD Blackburn with DarwenBnD Blackburn with Darwen
Bpl BlackpoolBpl Blackpool
KH City of Kingston upon HullKH City of Kingston upon Hull
NEL North East LincolnshireNEL North East Lincolnshire
De DerbyDe Derby
Lr LeicesterLr Leicester
R RutlandR Rutland
Nt NottinghamNt Nottingham
TW Telford and WrekinTW Telford and Wrekin
S Stoke-on-TrentS Stoke-on-Trent
BS Bath and North East SomersetBS Bath and North East Somerset
B City of BristolB City of Bristol
NS North SomersetNS North Somerset
SG South GloucestershireSG South Gloucestershire
Py PlymouthPy Plymouth
Ty TorbayTy Torbay
Bo BournemouthBo Bournemouth
Pl PoolePl Poole
Pe PeterboroughPe Peterborough
Sw SwindonSw Swindon
Re ReadingRe Reading
Sl SloughSl Slough
WM Windsor and MaidenheadWM Windsor and Maidenhead
Wk WokinghamWk Wokingham
SS Southend-on-SeaSS Southend-on-Sea
Tk ThurrockTk Thurrock
Mwy MedwayMwy Medway
BF Bracknell ForestBF Bracknell Forest
L LutonL Luton
MK Milton KeynesMK Milton Keynes
BH Brighton and HoveBH Brighton and Hove
Po PortsmouthPo Portsmouth
So SouthamptonSo Southampton
NPT Neath Port TalbotNPT Neath Port Talbot
Bd BridgendBd Bridgend
VG The Vale of GlamorganVG The Vale of Glamorgan
RCT Rhondda Cynon TafRCT Rhondda Cynon Taf
MT Merthyr TydfilMT Merthyr Tydfil
Cy CaerphillyCy Caerphilly
BG Blaenau GwentBG Blaenau Gwent
T TorfaenT Torfaen
Mon MonmouthshireMon Monmouthshire
N NewportN Newport
Ca CardiffCa Cardiff
WD West DunbartonshireWD West Dunbartonshire
ED East DunbartonshireED East Dunbartonshire
ER East RenfrewshireER East Renfrewshire
G Glasgow CityG Glasgow City
In InverclydeIn Inverclyde
NL North LanarkshireNL North Lanarkshire
Rn RenfrewshireRn Renfrewshire
Nta NewtownabbeyNta Newtownabbey
Cf CarrickfergusCf Carrickfergus
ND North DownND North Down
Cr CastlereaghCr Castlereagh
Be BelfastBe Belfast
Ba BallymoneyBa Ballymoney
Please visit the ONS Geography web pages for the latestinformation: www.statistics.gov.uk/geography
Boundaries shown in England are effective as follows:Regions at 1st April 2011 (see note below), Non-Metropolitan Countiesat 1st April 2009, Metropolitan Counties at 1st April 1996, GreaterLondon Authority at 22nd December 1999 and Unitary Authorities at1st April 2009.
Government Offices for the Regions closed at the end of March 2011.The former Government Office Regions (England) are now referred toas 'regions' for statistical purposes. Scotland, Northern Ireland andWales are not regions, but are often used as equivalents for thepurpose of representing statistics that cover the whole of the UK.
Boundaries shown in the rest of the UK are effective as follows:Unitary Authorities in Wales at 1st January 2010, Council Areas inScotland at 1st April 2010 and District Council Areas in Northern Irelandat 1st April 1992.
District Council Areas (Northern Ireland)
Council Areas (Scotland)
Unitary Authorities (England and Wales)
Greater London (England)
Metropolitan Counties (England)
Non-Metropolitan Counties (England)
Regions (England)
Key
United Kingdom: Regions, Counties and Unitary Authorities,1 2011ANNEX E

�����
�����
�����
����
����
�����
����
�����
� ��� ����� �������
����
� ���
�����
����
�����
����
�����
�����
���
��� ����
���
��
��
��
��
��
��
����
��
��
��
�� ��
��
��
����
��
����
��
��
����
��
��
��
����
��
����
����
��
��
��
��
��
����
��
��
����
��
��
��
����
��
��
��
��
��
��
����
��
����
��
��
��
��
��
��
������
��
��
��
��
��
�� ��
��
��
��
��
����
���
���� �
�����
�� �
�����
�����
���� �
�����
���� �
�����
������
�����
�� �
����
��� ����������� ��
�������
�����������
��� ���
�����
����
������������
������������� ����������
�����������
�����������
�������
������������
�������� �����
����� ��������
��������
��������
������������
������������
������������
������������
���������
��� ����
������� �������
�� ������
���
������
������
�� ��� ���� ���� ��������
���������
���������
��������������
� ������
�� ������
�������������
������������
�������� ������������
������
��� ��������
���������� �
������������
�������� ����������
���������
����� �
������ �
�� ��
����
����������
���� ���
� �
� ��
�� ��� ������
������������
�����������������
����������
�������
��������������
����� �! ���"
�"���""�
!������
��"����#�$��
%�&'��(�
)�����������*��
%��+��*�
���&��
)�"&����
%" &����!��,��
-.����
��������"�
/��*������������&����
�� &����
%����&����������&����
��������
���*������
����$�� %����#!
���"�����/��(���
��������
-���'�����
��"��'��
/�$�+��
�������
���'��
0.����
�"����
#�������
������
��(������������
� �"�!��'��������""�
)�"(�����/�$��
�&�����
������'��
������&���$�����
���������������
�"�*����������
����"���
���"&�����
��"*������
�����*�
�������#�����������"'���
�����
������� ��&'�����
%����'������
!�������
�����*�
1������ ��
1��������
������&����
��' � �"���&����������
��$����
�"��*�����
���"�����&
���*�����
#�������
������'��
��"$����&����/��"� ���
���� �
��������� ��
�������&
������
���*�"�
�����'������
#��*("�
���*�����
�����'������
��������������#��
��"���""
��"��""
���#)�-�/��������
������������!����
/��' ���������&
���(�����!����
�������"�
���(���
����������"�
���.��&
/��'���
�����
�������
��**"�����"�
������$��
#�" ���� ���(��������2-%00�
���������
�"�*(���"
/���"��
��������
����������)������
�������������#�"���
���*(����
�������"���
��� �*���"�0"���&
#�"���.
#���������"�
��(����"�
�#-))�-�/�������&
�����"� /��*�����
����"������"�*('���
%������ ����"�
���*�����
��������
1����""
�--/�
#����������(
�*�����������&�'
1�������������#�""
����"������
�*��'������
%������
1����*(
���"��"�
�������$��
���(������ ������� �
����"��'������/��"������ !������
#���"����"
/�&�����
#�.��&
�-����!�-� %0��!�-
���������
�-�)��!
���������
�����*(�����!����
1�"&����*(
��������""#�&�"���
%���"� �����������'�����
�����0��" ��'��(
������*(��-��0�-
)�"(��(
/�����&"���
%����
����"���1��(*�"�
/�����
��'�����
0'��
�" ��
�������������
���-�
1��0�-!-�
3 43 53
3 43 53 63
/ ����
����������
��"������
0&���
-����(�""��
��&���
�1-
�'������
)������""��&
��$������
���� �
���� ��������
���
� ���
�������� �� �����
������� ������������
�����������������
��� ���������"
���������
���������
������ �������
����������
�����������
� ��
����
������� ����
������ �
�����������
�������� ����
���������
������������
����
�����-��
����
)00!�� �/��7��801��)�-�
��� ���
)00!�� �/��7��801��)�-�
������������������� ��� ���� ���������� ��
������������������������
����!�������������������
����!�����"#�������$�%�������������&'�$�(
�����) * �+�,����-�� � ��� ��������+�'�������������������&'�$�
. �+������-!�&�����������+!�����+���'��+����+������$������&'+������+��/�������$
0 �+��!�1�������$�$������$����& �+����+����&"����"����&�����������������-2��"���$�����"����&����������
����� ������� ��
)00!�� �/��7��8��0!�
��������� ������
)00!�� �/��7��9��8: --�;��/�2�7)8���������#
�������
)00!�� �/��7��8������)�-�����#
�������� �
)00!�� �/��7��9���9���8: --�;��/�2�7)8�-�����)�-�����#
������
)00!�� �/��7��8�)�-�
���������
)00!�� �/��7��8�)�-�
��� ������ �
)00!�� �/��7��8: --�;��/�2�7%�8
���������� ��
)00!�� �/��7��9���9���8: --�;��/�2�7�""�����8�)�-�����#
��
��
��
��
��
��� ������ ������� ��� ��� ������ ����� ������ ����������� �
���3����
��������4$�
����
� ������)�-�
ANNEX E

ANNEX F
2010-based National Population ProjectionsPublished 23 November 2011
ContentsCoverage: United KingdomProjection Type: High fertility/ Low life expectancy/ High migration variant projectionTable title: Projected populations at mid-years by age last birthday in five year age groupsAge groups: Five year age groups and all agesSex: Persons, males, femalesYears: All individual years 2010-2035, and additional years 2036, 2041, 2046, 2051, 2056, 2060, 2061, 2066, 2071, 2076, 2081, 2085, 2090, 2100, 2110Unit: Thousands
These statistics may be used, excluding logos, under the terms of the Open Government Licence. http://www.nationalarchives.gov.uk/doc/open-government-licence/
email: [email protected]

ANNEX F
Population projections by the Office for National StatisticsUnited Kingdom 2010-basedMALES, thousands High fertility/ Low life expectancy/ High migration variant projection
Projected populations at mid-years by age last birthday in five-year age groups
Ages 2010 2011 2012 2013 2014 2015 2016 2017 2018 2019 2020 2021 2022 2023 2024 2025 2026 2027 2028 2029 2030 2031———— ———— ———— ———— ———— ———— ———— ———— ———— ———— ———— ———— ———— ———— ———— ———— ———— ———— ———— ———— ———— ———— ————
0- 4 1,977 2,018 2,068 2,116 2,174 2,234 2,291 2,328 2,352 2,367 2,375 2,378 2,378 2,376 2,373 2,367 2,360 2,354 2,348 2,343 2,341 2,341 5- 9 1,762 1,798 1,847 1,901 1,942 1,984 2,025 2,075 2,122 2,179 2,239 2,297 2,333 2,358 2,373 2,380 2,383 2,383 2,382 2,378 2,373 2,366
10-14 1,825 1,793 1,758 1,745 1,750 1,770 1,806 1,855 1,909 1,949 1,991 2,032 2,082 2,129 2,186 2,246 2,304 2,340 2,365 2,380 2,387 2,390 15-19 2,013 1,972 1,945 1,920 1,894 1,868 1,835 1,799 1,786 1,791 1,810 1,847 1,896 1,949 1,990 2,031 2,072 2,122 2,169 2,227 2,287 2,344 20-24 2,213 2,241 2,259 2,252 2,243 2,217 2,176 2,146 2,118 2,091 2,063 2,030 1,995 1,982 1,987 2,006 2,043 2,091 2,145 2,185 2,227 2,267 25-29 2,169 2,227 2,306 2,373 2,416 2,446 2,477 2,489 2,478 2,466 2,437 2,395 2,365 2,337 2,310 2,283 2,250 2,215 2,202 2,207 2,226 2,263 30-34 1,960 2,014 2,074 2,148 2,217 2,283 2,344 2,419 2,482 2,523 2,550 2,581 2,592 2,581 2,569 2,540 2,499 2,469 2,442 2,415 2,388 2,355 35-39 2,085 2,027 1,975 1,947 1,959 1,997 2,052 2,110 2,181 2,248 2,312 2,372 2,447 2,510 2,550 2,578 2,608 2,619 2,608 2,597 2,568 2,527 40-44 2,293 2,271 2,234 2,191 2,137 2,091 2,034 1,982 1,952 1,963 2,000 2,054 2,111 2,182 2,248 2,312 2,371 2,445 2,508 2,548 2,575 2,605 45-49 2,250 2,282 2,309 2,313 2,301 2,271 2,249 2,211 2,169 2,115 2,069 2,012 1,960 1,932 1,943 1,979 2,033 2,089 2,159 2,225 2,288 2,347 50-54 1,965 2,019 2,071 2,120 2,174 2,228 2,260 2,286 2,290 2,279 2,249 2,228 2,191 2,150 2,096 2,051 1,996 1,945 1,917 1,928 1,964 2,017 55-59 1,759 1,768 1,794 1,831 1,869 1,915 1,969 2,020 2,069 2,122 2,175 2,208 2,234 2,238 2,227 2,199 2,178 2,143 2,102 2,050 2,007 1,953 60-64 1,840 1,841 1,764 1,710 1,688 1,677 1,687 1,712 1,749 1,787 1,832 1,885 1,935 1,983 2,035 2,087 2,119 2,145 2,149 2,139 2,112 2,092 65-69 1,412 1,474 1,594 1,668 1,703 1,721 1,722 1,651 1,601 1,581 1,572 1,582 1,607 1,643 1,679 1,723 1,774 1,822 1,868 1,918 1,967 1,998 70-74 1,160 1,158 1,166 1,196 1,235 1,280 1,338 1,451 1,521 1,555 1,573 1,574 1,510 1,466 1,448 1,441 1,450 1,474 1,508 1,542 1,582 1,630 75-79 894 909 927 950 973 987 987 998 1,027 1,065 1,106 1,159 1,261 1,324 1,355 1,370 1,370 1,316 1,278 1,264 1,258 1,267 80-84 607 624 639 654 666 682 699 718 741 762 776 779 790 817 850 885 929 1,013 1,066 1,090 1,102 1,100 85-89 326 332 341 350 362 377 393 408 423 436 452 468 485 504 521 533 536 545 566 591 617 648 90-94 110 123 133 140 146 151 156 163 170 179 189 201 212 223 233 245 256 268 281 291 299 301 95-99 22 24 26 27 30 35 40 43 46 49 51 54 57 60 65 70 76 82 87 92 98 104
100 & over 2 2 2 3 3 4 4 5 5 6 7 8 9 10 10 11 12 13 14 15 17 19
All ages 30,643 30,917 31,232 31,555 31,884 32,215 32,544 32,869 33,192 33,512 33,830 34,143 34,451 34,753 35,049 35,338 35,619 35,895 36,163 36,425 36,681 36,932
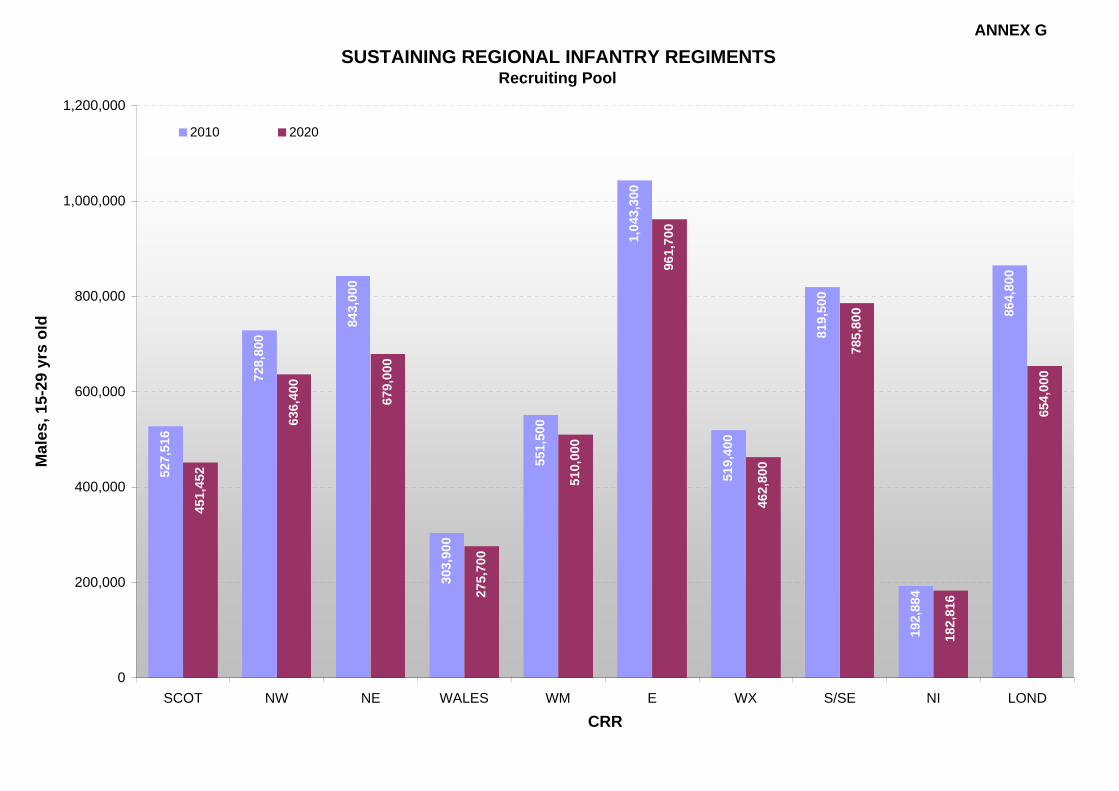
ANNEX GSUSTAINING REGIONAL INFANTRY REGIMENTS
Recruiting Pool
527,
516
728,
800
843,
000
303,
900
551,
500
1,04
3,30
0
519,
400
819,
500
192,
884
864,
800
451,
452
636,
400
679,
000
275,
700
510,
000
961,
700
462,
800
785,
800
182,
816
654,
000
0
200,000
400,000
600,000
800,000
1,000,000
1,200,000
SCOT NW NE WALES WM E WX S/SE NI LOND
CRR
Mal
es, 1
5-29
yrs
old
2010 2020

ANNEX G
THIS PAGE IS INTENTIONALLY BLANK

ANNEX H
Estimate of Sustainability.
The regions will support the following battalions of manning in 2020 (traditional demand in italics):
Region NW 42X
NI 38X
Wales 160X
WM 143X
Wx 43X
Scotland 51X
NE/Y&H 15X
E/EM 49X
London S&SE 2&145X
Bns 4.4 to 4.9
(4.8)
1.3 (1.9)
2.4 to 2.6
(3.0)
3.5 to 3.6
(3.1)
1.9 to 2.0
(2.5)
4.3 to 4.4
(6.1)
4.7 to 5.2
(5.0)
3.6 to 4.3
(3.5)
2.6 to 3.8
(2.1)
2.6 to 2.9
(3.4)
From within their own traditional recruiting areas, the Infantry Divisions & Regiments will support the following battalions of manning in 2020 (traditional demand in italics):
Regt
Gre
n G
ds
Col
dm G
ds
SG
IG
WG
SCO
TS
PWR
R
RR
F
R A
NG
LIA
N
LAN
CS
YOR
KS
MER
CIA
N
R W
ELSH
RIF
LES
R IR
SH
PAR
A
Bns 0.9 to 1.1
(1.2)
1.1 to 1.3
(1.2)
1.0 to 1.1
(1.2)
0.6 to 0.7
(1.0)
1.0 to 1.1
(1.0)
1.7 to 2.0
(2.0)
1.9 to 2.5
(2.0)
1.5 to 1.7
(2.0)
1.4 to 1.6
(2.0)
2.0 to 2.2
(3.0)
2.1 to 2.5
(3.0)
1.4 to 1.5
(2.0)
Div FG QD KD PoW
Bns 4.7 to 5.3
(5.6)
3.1 to 3.2
(5.0)
5.1 to 6.3
(6.0)
3.4 to 3.8 (5.0)
3.5 to 4.0 (5.0)
5.0 to 5.8
(5.0)
0.9 (1.0)
2.3 to 2.7
(3.0)

ANNEX H
THIS PAGE IS INTENTIONALLY BLANK

ANNEX I
Recruits No. of Bns % rate of effort Recruits No. of Bns % rate of effort
Traditional Reqt 615 4.84 13.6% Traditional Reqt 776 6.11 17.2%Actual Inf 649 4.88 15.3% Actual Inf 487 4.84 11.5%
Actual Army 1705 12.82 15.6% Actual Army 934 9.29 8.6%Actual Defence 2687 20.20 15.7% Actual Defence 1414 14.06 8.2%
Pop Change Rct Pool Rct Pool Pop ChangeAdjusted Inf 622 4.67 15.1% Adjusted Inf 433 4.30 10.5%
Adjusted Army 1634 12.28 15.3% Adjusted Army 830 8.25 7.8%Adjusted Defence 2575 19.35 15.3% Adjusted Defence 1256 12.66 7.5%
Recruits No. of Bns % rate of effort Recruits No. of Bns % rate of effort
Traditional Reqt 250 1.97 5.5% Traditional Reqt 645 5.08 14.3%Actual Inf 144 1.38 3.4% Actual Inf 694 5.59 16.4%
Actual Army 281 2.69 2.6% Actual Army 1922 15.48 17.6%Actual Defence 341 3.27 2.0% Actual Defence 2921 23.53 17.0%
Pop Change Rct Pool Rct Pool Pop ChangeAdjusted Inf 137 1.31 3.3% Adjusted Inf 616 4.96 14.9%
Adjusted Army 268 2.57 2.5% Adjusted Army 1706 13.74 16.0%Adjusted Defence 326 3.12 1.9% Adjusted Defence 2592 20.88 15.5%
Recruits No. of Bns % rate of effort Recruits No. of Bns % rate of effort
Traditional Reqt 377 2.97 8.3% Traditional Reqt 440 3.46 9.7%Actual Inf 333 2.60 7.9% Actual Inf 521 3.82 12.3%
Actual Army 744 5.81 6.8% Actual Army 1627 11.93 14.9%Actual Defence 1100 8.59 6.4% Actual Defence 2596 19.03 15.1%
Pop Change Rct Pool Rct Pool Pop ChangeAdjusted Inf 320 2.50 7.8% Adjusted Inf 537 3.93 13.0%
Adjusted Army 715 5.58 6.7% Adjusted Army 1677 12.29 15.7%Adjusted Defence 1057 8.25 6.3% Adjusted Defence 2676 19.62 16.0%
Recruits No. of Bns % rate of effort Recruits No. of Bns % rate of effort
Traditional Reqt 394 3.10 8.7% Traditional Reqt 276 2.17 6.1%Actual Inf 465 3.59 11.0% Actual Inf 376 3.14 8.9%
Actual Army 1248 9.63 11.4% Actual Army 826 6.89 7.6%Actual Defence 1834 14.16 10.7% Actual Defence 980 8.17 5.7%
Pop Change Rct Pool Rct Pool Pop ChangeAdjusted Inf 494 3.81 12.0% Adjusted Inf 381 3.18 9.3%
Adjusted Army 1325 10.23 12.4% Adjusted Army 838 6.99 7.9%Adjusted Defence 1947 15.03 11.6% Adjusted Defence 994 8.29 5.9%
Recruits No. of Bns % rate of effort Recruits No. of Bns % rate of effort
Traditional Reqt 312 2.46 6.9% Traditional Reqt 436 3.43 9.6%Actual Inf 234 2.05 5.5% Actual Inf 330 2.55 7.8%
Actual Army 738 6.48 6.8% Actual Army 888 6.86 8.1%Actual Defence 1601 14.05 9.3% Actual Defence 1686 13.02 9.8%
Pop Change Rct Pool Rct Pool Pop ChangeAdjusted Inf 225 1.97 5.5% Adjusted Inf 355 2.74 8.6%
Adjusted Army 710 6.23 6.7% Adjusted Army 954 7.37 9.0%Adjusted Defence 1540 13.52 9.2% Adjusted Defence 1811 13.99 10.8%
2010
2010
1.4%
7.4%
6.2%
2010
2020
2020
2010
2020
2010
2020
20202010
20202010
20202010
20202010
2020
-3.8%
-11.2%
-11.3%
3.1%
-4.2%
-4.5%
-3.9%
20202010
SUSTAINING REGIONAL INFANTRY REGIMENTSBaseline Forecast Baseline ForecastREGIONAL SUMMARY - Potential to support Infantry Battalions
QUEEN'SR ANGLIANPoW
R WELSH
R IRISH
QUEEN'SPWRR
RIFLES
RIFLES
PoWMERCIAN
KINGSYORKS
KINGSLANCS
RIFLES
QUEENSRRF
RIFLES
SCOTS
Definitions Traditional Reqt = The requirement base on an Infantry size of 35.6 Bns. Pop Change = % change of 15-29 yr old cohort from 2010 to 2020. Actual = Actual figures based on 3yr ave historic rate. Adjusted = 2010 figures adjusted for 2020 in proportion to the future population change.
143 BdeWM
43 BdeWX
160 BdeWALES
38 BdeNI
42 BdeNW
728,800
698,376
192,884
184,126
551,500
585,605
519,400
499,772
303,900
292,013
11.4%
11.1%
3.0%
2.9%
4.8%
4.6%
8.6%
9.3%
8.1%
7.9%
51 BdeSCOT
15 BdeNE
49 BdeE
Londist
527,516
468,693
843,000
748,094
1,043,300
1,075,371
864,800
877,217
819,500
880,401
2 BdeSE
145 BdeS
8.2%
7.4%
13.2%
11.9%
16.3%
17.0%
13.5%
13.9%
12.8%
14.0%

ANNEX I
Recruits No. of Bns % rate of effort Recruits No. of Bns % rate of effort
Traditional Reqt 615 4.84 13.6% Traditional Reqt 776 6.11 17.2%Actual Inf 649 4.88 15.3% Actual Inf 487 4.84 11.5%
Actual Army 1705 12.82 15.6% Actual Army 934 9.29 8.6%Actual Defence 2687 20.20 15.7% Actual Defence 1414 14.06 8.2%
Pop Change Rct Pool Rct Pool Pop ChangeAdjusted Inf 658 4.95 15.0% Adjusted Inf 439 4.36 10.0%
Adjusted Army 1729 13.00 15.2% Adjusted Army 841 8.36 7.4%Adjusted Defence 2725 20.49 15.3% Adjusted Defence 1273 12.66 7.1%
Recruits No. of Bns % rate of effort Recruits No. of Bns % rate of effort
Traditional Reqt 250 1.97 5.5% Traditional Reqt 645 5.08 14.3%Actual Inf 144 1.38 3.4% Actual Inf 694 5.59 16.4%
Actual Army 281 2.69 2.6% Actual Army 1922 15.48 17.6%Actual Defence 341 3.27 2.0% Actual Defence 2921 23.53 17.0%
Pop Change Rct Pool Rct Pool Pop ChangeAdjusted Inf 138 1.33 3.2% Adjusted Inf 650 5.23 14.8%
Adjusted Army 271 2.59 2.4% Adjusted Army 1800 14.49 15.9%Adjusted Defence 328 3.15 1.8% Adjusted Defence 2735 22.03 15.3%
Recruits No. of Bns % rate of effort Recruits No. of Bns % rate of effort
Traditional Reqt 377 2.97 8.3% Traditional Reqt 440 3.46 9.7%Actual Inf 333 2.60 7.9% Actual Inf 521 3.82 12.3%
Actual Army 744 5.81 6.8% Actual Army 1627 11.93 14.9%Actual Defence 1100 8.59 6.4% Actual Defence 2596 19.03 15.1%
Pop Change Rct Pool Rct Pool Pop ChangeAdjusted Inf 332 2.59 7.6% Adjusted Inf 579 4.25 13.2%
Adjusted Army 741 5.79 6.5% Adjusted Army 1810 13.27 15.9%Adjusted Defence 1096 8.55 6.1% Adjusted Defence 2888 21.17 16.2%
Recruits No. of Bns % rate of effort Recruits No. of Bns % rate of effort
Traditional Reqt 394 3.10 8.7% Traditional Reqt 276 2.17 6.1%Actual Inf 465 3.59 11.0% Actual Inf 376 3.14 8.9%
Actual Army 1248 9.63 11.4% Actual Army 826 6.89 7.6%Actual Defence 1834 14.16 10.7% Actual Defence 980 8.17 5.7%
Pop Change Rct Pool Rct Pool Pop ChangeAdjusted Inf 528 4.08 12.0% Adjusted Inf 454 3.79 10.4%
Adjusted Army 1417 10.94 12.5% Adjusted Army 998 8.33 8.8%Adjusted Defence 2082 16.07 11.7% Adjusted Defence 1185 9.88 6.6%
Recruits No. of Bns % rate of effort Recruits No. of Bns % rate of effort
Traditional Reqt 312 2.46 6.9% Traditional Reqt 436 3.43 9.6%Actual Inf 234 2.05 5.5% Recruits +/- No. of Bns +/- Actual Inf 330 2.55 7.8%
Actual Army 738 6.48 6.8% Traditional Reqt 4,521 35.6 Actual Army 888 6.86 8.1%Actual Defence 1601 14.05 9.3% Actual Inf 4,233 -288 -35.60 Actual Defence 1686 13.02 9.8%
Pop Change Rct Pool Actual Army 10,913 87.9 Rct Pool Pop ChangeAdjusted Inf 232 2.03 5.3% Actual Defence 17,160 138.1 Adjusted Inf 377 2.91 8.6%
Adjusted Army 732 6.48 6.4% Pop Change Adjusted Army 1013 7.82 8.9%Adjusted Defence 1588 13.93 8.9% Adjusted Inf 4,387 35.5 -0.08 Bn Loss Adjusted Defence 1923 14.85 10.8%
Adjusted Army 11,352 91.1Adjusted Defence 17,823 142.8
14.0%
20102010
20.9%
20102020
2020
13.5%
-0.8%
5.9%
Optimistic Optimistic
-0.4%
REGIONAL SUMMARY - Potential to support Infantry Battalions
-10.0%
-6.4%
11.2%
1.4%
-3.7%
20102020
2010
SUSTAINING REGIONAL INFANTRY REGIMENTS20
1020
2020
1020
202020
2010
2020
2010
2020
202020
1020
202020
2010
QUEEN'SR ANGLIAN
PoWR WELSH
R IRISH
QUEEN'SPWRR
RIFLES
RIFLES
PoWMERCIAN
KINGSYORKS
KINGSLANCS
RIFLES
QUEENSRRF
RIFLES
SCOTS
DefinitionsTraditional Reqt = The requirement base on an Infantry size of 35.6 Bns.Pop Change = % change of 15-29 yr old cohort from 2010 to 2020.Actual = Actual figures based on 3yr ave historic rate.Adjusted = 2010 figures adjusted for 2020 in proportion to the future population change.
143 BdeWM
43 BdeWX
160 BdeWALES
38 BdeNI
42 BdeNW
728,800
739,201
192,884
185,766
551,500
626,218
519,400
515,094
303,900
302,778
11.4%
10.9%
3.0%
2.7%
4.8%
4.5%
8.6%
9.2%
8.1%
7.6%
51 BdeSCOT
15 BdeNE
49 BdeE
Londist
527,516
474,954
843,000
789,379
1,043,300
1,160,559
864,800
1,045,318
819,500
934,588
2 BdeSE
145 BdeS
8.2%
7.0%
13.2%
11.7%
16.3%
17.1%
13.5%
15.4%
12.8%
13.8%

ANNEX I
Recruits No. of Bns % rate of effort Recruits No. of Bns % rate of effort
Traditional Reqt 615 4.84 13.6% Traditional Reqt 776 6.11 17.2%Actual Inf 649 4.88 15.3% Actual Inf 487 4.84 11.5%
Actual Army 1705 12.82 15.6% Actual Army 934 9.29 8.6%Actual Defence 2687 20.20 15.7% Actual Defence 1414 14.06 8.2%
Pop Change Rct Pool Rct Pool Pop ChangeAdjusted Inf 586 4.41 15.2% Adjusted Inf 427 4.25 11.1%
Adjusted Army 1540 11.58 15.4% Adjusted Army 819 8.14 8.2%Adjusted Defence 2427 18.24 15.4% Adjusted Defence 1239 12.32 7.9%
Recruits No. of Bns % rate of effort Recruits No. of Bns % rate of effort
Traditional Reqt 250 1.97 5.5% Traditional Reqt 645 5.08 14.3%Actual Inf 144 1.38 3.4% Actual Inf 694 5.59 16.4%
Actual Army 281 2.69 2.6% Actual Army 1922 15.48 17.6%Actual Defence 341 3.27 2.0% Actual Defence 2921 23.53 17.0%
Pop Change Rct Pool Rct Pool Pop ChangeAdjusted Inf 136 1.30 3.5% Adjusted Inf 582 4.69 15.1%
Adjusted Army 266 2.55 2.7% Adjusted Army 1612 12.99 16.2%Adjusted Defence 323 3.09 2.0% Adjusted Defence 2450 19.73 15.6%
Recruits No. of Bns % rate of effort Recruits No. of Bns % rate of effort
Traditional Reqt 377 2.97 8.3% Traditional Reqt 440 3.46 9.7%Actual Inf 333 2.60 7.9% Actual Inf 521 3.82 12.3%
Actual Army 744 5.81 6.8% Actual Army 1627 11.93 14.9%Actual Defence 1100 8.59 6.4% Actual Defence 2596 19.03 15.1%
Pop Change Rct Pool Rct Pool Pop ChangeAdjusted Inf 309 2.41 8.0% Adjusted Inf 496 3.63 12.8%
Adjusted Army 689 5.38 6.9% Adjusted Army 1548 11.35 15.5%Adjusted Defence 1019 7.95 6.5% Adjusted Defence 2471 18.11 15.7%
Recruits No. of Bns % rate of effort Recruits No. of Bns % rate of effort
Traditional Reqt 394 3.10 8.7% Traditional Reqt 276 2.17 6.1%Actual Inf 465 3.59 11.0% Actual Inf 376 3.14 8.9%
Actual Army 1248 9.63 11.4% Actual Army 826 6.89 7.6%Actual Defence 1834 14.16 10.7% Actual Defence 980 8.17 5.7%
Pop Change Rct Pool Rct Pool Pop ChangeAdjusted Inf 459 3.54 11.9% Adjusted Inf 311 2.60 8.1%
Adjusted Army 1233 9.51 12.4% Adjusted Army 683 5.70 6.9%Adjusted Defence 1811 13.98 11.5% Adjusted Defence 811 6.76 5.2%
Recruits No. of Bns % rate of effort Recruits No. of Bns % rate of effort
Traditional Reqt 312 2.46 6.9% Traditional Reqt 436 3.43 9.6%Actual Inf 234 2.05 5.5% Recruits +/- No. of Bns +/- Actual Inf 330 2.55 7.8%
Actual Army 738 6.48 6.8% Traditional Reqt 4,521 35.6 Actual Army 888 6.86 8.1%Actual Defence 1601 14.05 9.3% Actual Inf 4,233 -288 -35.60 Actual Defence 1686 13.02 9.8%
Pop Change Rct Pool Actual Army 10,913 87.9 Rct Pool Pop ChangeAdjusted Inf 218 1.91 5.6% Actual Defence 17,160 138.1 Adjusted Inf 333 2.57 8.6%
Adjusted Army 688 6.04 6.9% Pop Change Adjusted Army 895 6.91 9.0%Adjusted Defence 1492 13.09 9.5% Adjusted Inf 3,857 31.3 -4.29 Bn Loss Adjusted Defence 1700 13.13 10.8%
Adjusted Army 9,973 80.1Adjusted Defence 15,743 126.4
2010
2020
2010
2020
-16.1%
-4.8%
-9.7%
-5.4%
-7.4%
2020
2010
-17.3%
0.8%
2010
2020
2010
20202010
20202010
SUSTAINING REGIONAL INFANTRY REGIMENTS2010
20202010
20202010
-12.4%
Pessimistic PessimisticREGIONAL SUMMARY - Potential to support Infantry Battalions
2020
2010
2020
-1.2%
-6.8%
-8.4%
2020
QUEEN'SR ANGLIAN
PoWR WELSH
R IRISH
QUEEN'SPWRR
RIFLES
RIFLES
PoWMERCIAN
KINGSYORKS
KINGSLANCS
RIFLES
QUEENSRRF
RIFLES
SCOTS
143 BdeWM
43 BdeWX
160 BdeWALES
38 BdeNI
42 BdeNW
728,800
658,316
192,884
182,494
551,500
544,696
519,400
484,093
303,900
281,399
11.4%
11.2%
3.0%
3.1%
4.8%
4.8%
8.6%
9.3%
8.1%
8.3%
51 BdeSCOT
15 BdeNE
49 BdeE
Londist
527,516
462,330
843,000
707,182
1,043,300
992,890
864,800
715,572
819,500
826,276
2 BdeSE
145 BdeS
8.2%
7.9%
13.2%
12.1%
16.3%
17.0%
13.5%
12.2%
12.8%
14.1%
DefinitionsTraditional Reqt = The requirement base on an Infantry size of 35.6 Bns.Pop Change = % change of 15-29 yr old cohort from 2010 to 2020.Actual = Actual figures based on 3yr ave historic rate.Adjusted = 2010 figures adjusted for 2020 in proportion to the future population change.

ANNEX I
FT GDS DIV Recruits No. of Bns % rate of effort POW DIV Recruits No. of Bns % rate of effort
Traditional Reqt 669 5.60 14.8% Traditional Reqt 713 5.00 15.8%Act Inf (In Bdy) 608 5.09 15.8% Act Inf (In Bdy) 533 3.74 13.8%
Act Inf (Out Bdy) 77 0.65 20.5% Act Inf (Out Bdy) 74 0.53 19.6%Pop Change Pop Change
Adj Act Inf (In Bdy) 595 4.99 15.8% Adj Act Inf (In Bdy) 537 3.77 14.2%+/- of Trad Reqt -73 -0.61 9.8% +/- of Trad Reqt -176 -1.23 23.5%
SCOTS Recruits No. of Bns % rate of effort RIFLES Recruits No. of Bns % rate of effort
Traditional Reqt 506 5.00 11.2% Traditional Reqt 513 5.00 11.3%Act Inf (In Bdy) 368 3.64 9.5% Act Inf (In Bdy) 561 5.46 14.5%
Act Inf (Out Bdy) 111 1.10 29.5% Act Inf (Out Bdy) 6 0.06 1.7%Pop Change Pop Change
Adj Act Inf (In Bdy) 327 3.23 8.7% Adj Act Inf (In Bdy) 555 5.41 14.7%+/- of Trad Reqt -179 -1.77 23.9% +/- of Trad Reqt 42 0.41 -5.6%
QUEENS DIV Recruits No. of Bns % rate of effort PARA Recruits No. of Bns % rate of effort
Traditional Reqt 803 6.00 17.8% Traditional Reqt 518 3.00 11.5%Act Inf (In Bdy) 727 5.57 18.8% Act Inf (In Bdy) 422 2.44 10.9%
Act Inf (Out Bdy) 31 0.25 8.4% Act Inf (Out Bdy) 0 0.00 0.0%Pop Change Pop Change
Adj Act Inf (In Bdy) 745 5.69 19.7% Adj Act Inf (In Bdy) 424 2.46 11.2%+/- of Trad Reqt -58 -0.44 7.8% +/- of Trad Reqt -94 -0.54 12.6%
KINGS DIV Recruits No. of Bns % rate of effort R IRISH Recruits No. of Bns % rate of effort
Traditional Reqt 705 5.00 15.6% Traditional Reqt 94 1.00 2.1%Act Inf (In Bdy) 549 3.90 14.2% Act Inf (In Bdy) 92 0.97 2.4%
Act Inf (Out Bdy) 52 0.38 13.9% Act Inf (Out Bdy) 24 0.26 6.4%Pop Change Pop Change
Adj Act Inf (In Bdy) 503 3.57 13.3% Adj Act Inf (In Bdy) 88 0.93 2.3%+/- of Trad Reqt -202 -1.44 27.1% +/- of Trad Reqt -7 -0.07 0.9%
INFANTRY Recruits +/- No. of Bns +/-Traditional Reqt 4,521 35.6Act Inf (In Bdy) 3,860 -662 30.8 -4.79
Act Inf (Out Bdy) 376 3.2Pop Change
Adj Act Inf (In Bdy) 3,774 30.0+/- of Trad Reqt -747 -5.7
2010
-11.2%
2020
0.6%
2020
2020
2010
-8.4% -4.5%
2020
-1.3%
2010
2020
2010
2010
Baseline Forecast SUSTAINING REGIONAL INFANTRY REGIMENTSDIVISIONAL SUMMARY - Potential to support Infantry Battalions
2.8%
2020
2010
-0.9%
2020
2010
2020
Baseline Forecast
0.8%
-1.0%
2010
2020
2010
DefinitionsTraditional Reqt = The requirement based on an Infantry size of 35.6 Bns.Act = Actual figures based on 3yr ave historic rate.(In Bdy) / (Out Bdy) = Nos recruited inside / outside traditional recruiting areas.Pop Change = % change of 15-29 yr old cohort from 2010 to 2020.Adj = Figures for 2020 adjusted in proportion to the future pop change.

ANNEX I
FT GDS DIV Recruits No. of Bns % rate of effort POW DIV Recruits No. of Bns % rate of effort
Traditional Reqt 669 5.60 14.8% Traditional Reqt 713 5.00 15.8%Act Inf (In Bdy) 608 5.09 15.8% Act Inf (In Bdy) 533 3.74 13.8%
Act Inf (Out Bdy) 77 0.65 20.5% Act Inf (Out Bdy) 74 0.53 19.6%Pop Change Pop Change
Adj Act Inf (In Bdy) 636 5.33 15.8% Adj Act Inf (In Bdy) 566 3.95 14.0%+/- of Trad Reqt -33 -0.27 6.6% +/- of Trad Reqt -147 -1.03 29.8%
SCOTS Recruits No. of Bns % rate of effort RIFLES Recruits No. of Bns % rate of effort
Traditional Reqt 506 5.00 11.2% Traditional Reqt 513 5.00 11.3%Act Inf (In Bdy) 368 3.64 9.5% Act Inf (In Bdy) 561 5.46 14.5%
Act Inf (Out Bdy) 111 1.10 29.5% Act Inf (Out Bdy) 6 0.06 1.7%Pop Change Pop Change
Adj Act Inf (In Bdy) 331 3.28 8.2% Adj Act Inf (In Bdy) 593 5.78 14.7%+/- of Trad Reqt -175 -1.72 35.4% +/- of Trad Reqt 80 0.78 -16.3%
QUEENS DIV Recruits No. of Bns % rate of effort PARA Recruits No. of Bns % rate of effort
Traditional Reqt 803 6.00 17.8% Traditional Reqt 518 3.00 11.5%Act Inf (In Bdy) 727 5.57 18.8% Act Inf (In Bdy) 422 2.44 10.9%
Act Inf (Out Bdy) 31 0.25 8.4% Act Inf (Out Bdy) 0 0.00 0.0%Pop Change Pop Change
Adj Act Inf (In Bdy) 822 6.29 20.4% Adj Act Inf (In Bdy) 458 2.65 11.4%+/- of Trad Reqt 19 0.15 -3.8% +/- of Trad Reqt -60 -0.35 12.1%
KINGS DIV Recruits No. of Bns % rate of effort R IRISH Recruits No. of Bns % rate of effort
Traditional Reqt 705 5.00 15.6% Traditional Reqt 94 1.00 2.1%Act Inf (In Bdy) 549 3.90 14.2% Act Inf (In Bdy) 92 0.97 2.4%
Act Inf (Out Bdy) 52 0.38 13.9% Act Inf (Out Bdy) 24 0.26 6.4%Pop Change Pop Change
Adj Act Inf (In Bdy) 533 3.77 13.2% Adj Act Inf (In Bdy) 88 0.94 2.2%+/- of Trad Reqt -172 -1.22 34.9% +/- of Trad Reqt -6 -0.06 1.2%
INFANTRY Recruits +/- No. of Bns +/-Traditional Reqt 4,521 35.6Act Inf (In Bdy) 3,860 -662 30.8 -4.79
Act Inf (Out Bdy) 376 3.2Pop Change
Adj Act Inf (In Bdy) 4,029 32.0+/- of Trad Reqt -493 -3.7
2020
2020
7.1%
5.8%
2020
2010
Optimistic SUSTAINING REGIONAL INFANTRY REGIMENTSDIVISIONAL SUMMARY - Potential to support Infantry Battalions
Optimistic
2010
6.9%
-10.0%
2010
2020
2010
-3.7%
8.6%
2020
2010
-3.3%
13.3%
2020
5.9%
2010
2020
2010
2010
2020
2020
2010
DefinitionsTraditional Regt = The requirement based on an Infantry size of 35.6 Bns.Act = Actual figures based on 3yr ave historic rate.(In Bdy) / (Out Bdy) = Nos recruited inside / outside traditional recruiting areas.Pop Change = % change of 15-29 yr old cohort from 2010 to 2020.Adj = Figures for 2020 adjusted in proportion to the future pop change.

ANNEX I
FT GDS DIV Recruits No. of Bns % rate of effort POW DIV Recruits No. of Bns % rate of effort
Traditional Reqt 669 5.60 14.8% Traditional Reqt 713 5.00 15.8%Act Inf (In Bdy) 608 5.09 15.8% Act Inf (In Bdy) 533 3.74 13.8%
Act Inf (Out Bdy) 77 0.65 20.5% Act Inf (Out Bdy) 74 0.53 19.6%Pop Change Pop Change
Adj Act Inf (In Bdy) 555 4.65 15.8% Adj Act Inf (In Bdy) 505 3.54 14.3%+/- of Trad Reqt -113 -0.95 11.3% +/- of Trad Reqt -209 -1.46 20.9%
SCOTS Recruits No. of Bns % rate of effort RIFLES Recruits No. of Bns % rate of effort
Traditional Reqt 506 5.00 11.2% Traditional Reqt 513 5.00 11.3%Act Inf (In Bdy) 368 3.64 9.5% Act Inf (In Bdy) 561 5.46 14.5%
Act Inf (Out Bdy) 111 1.10 29.5% Act Inf (Out Bdy) 6 0.06 1.7%Pop Change Pop Change
Adj Act Inf (In Bdy) 323 3.19 9.2% Adj Act Inf (In Bdy) 517 5.04 14.7%+/- of Trad Reqt -183 -1.81 18.4% +/- of Trad Reqt 4 0.04 -0.4%
QUEENS DIV Recruits No. of Bns % rate of effort PARA Recruits No. of Bns % rate of effort
Traditional Reqt 803 6.00 17.8% Traditional Reqt 518 3.00 11.5%Act Inf (In Bdy) 727 5.57 18.8% Act Inf (In Bdy) 422 2.44 10.9%
Act Inf (Out Bdy) 31 0.25 8.4% Act Inf (Out Bdy) 0 0.00 0.0%Pop Change Pop Change
Adj Act Inf (In Bdy) 670 5.11 19.0% Adj Act Inf (In Bdy) 391 2.26 11.1%+/- of Trad Reqt -133 -1.02 13.3% +/- of Trad Reqt -127 -0.74 12.7%
KINGS DIV Recruits No. of Bns % rate of effort R IRISH Recruits No. of Bns % rate of effort
Traditional Reqt 705 5.00 15.6% Traditional Reqt 94 1.00 2.1%Act Inf (In Bdy) 549 3.90 14.2% Act Inf (In Bdy) 92 0.97 2.4%
Act Inf (Out Bdy) 52 0.38 13.9% Act Inf (Out Bdy) 24 0.26 6.4%Pop Change Pop Change
Adj Act Inf (In Bdy) 475 3.37 13.5% Adj Act Inf (In Bdy) 87 0.92 2.5%+/- of Trad Reqt -230 -1.64 23.1% +/- of Trad Reqt -7 -0.08 0.7%
INFANTRY Recruits +/- No. of Bns +/-Traditional Reqt 4,521 35.6Act Inf (In Bdy) 3,860 -662 30.8 -4.79
Act Inf (Out Bdy) 376 3.2Pop Change
Adj Act Inf (In Bdy) 3,522 28.1+/- of Trad Reqt -999 -7.6
2010
-12.4%
2020
-7.3%
2020
2020
2010
-13.5% -5.4%
2020
-8.4%
2010
2020
2010
2010
Pessimistic SUSTAINING REGIONAL INFANTRY REGIMENTSDIVISIONAL SUMMARY - Potential to support Infantry Battalions
-7.4%
2020
2010
-8.6%
2020
2010
2020
Pessimistic
-5.3%
-7.7%
2010
2020
2010
DefinitionsTraditional Reqt = The requirement based on an Infantry size of 35.6 Bns.Act = Actual figures based on 3yr ave historic rate.(In Bdy) / (Out Bdy) = Nos recruited inside / outside traditional recruiting areas.Pop Change = % change of 15-29 yr old cohort from 2010 to 2020.Adj = Figures for 2020 adjusted in proportion to the future pop change.

ANNEX I
GREN GDS Recruits No. of Bns % rate of effort LANCS Recruits No. of Bns % rate of effort YORKS Recruits No. of Bns % rate of effort PWRR Recruits No. of Bns % rate of effort
Traditional Reqt 143 1.20 3.2% Traditional Reqt 303 2.00 6.7% Traditional Reqt 402 3.00 8.9% Traditional Reqt 258 2.00 5.7%Act Inf (In Bdy) 117 0.98 3.0% Act Inf (In Bdy) 232 1.53 6.0% Act Inf (In Bdy) 317 2.36 8.2% Act Inf (In Bdy) 222 1.72 5.8%
Act Inf (Out Bdy) 4 0.03 1.1% Act Inf (Out Bdy) 9 0.06 2.4% Act Inf (Out Bdy) 43 0.32 11.5% Act Inf (Out Bdy) 10 0.07 2.5%Pop Change Pop Change Pop Change Pop Change
Adj Act Inf (In Bdy) 119 1.00 3.2% Adj Act Inf (In Bdy) 222 1.47 5.9% Adj Act Inf (In Bdy) 282 2.10 7.5% Adj Act Inf (In Bdy) 236 1.83 6.2%+/- of Trad Reqt -24 -0.20 3.2% +/- of Trad Reqt -80 -0.53 10.7% +/- of Trad Reqt -120 -0.90 16.1% +/- of Trad Reqt -22 -0.17 3.0%
COLDM GDS Recruits No. of Bns % rate of effort R ANGLIAN Recruits No. of Bns % rate of effort
Traditional Reqt 143 1.20 3.2% Traditional Reqt 326 2.00 7.2%Act Inf (In Bdy) 142 1.19 3.7% Act Inf (In Bdy) 255 1.56 6.6%
Act Inf (Out Bdy) 15 0.12 3.9% Act Inf (Out Bdy) 9 0.05 2.3%Pop Change Pop Change
Adj Act Inf (In Bdy) 143 1.19 3.8% Adj Act Inf (In Bdy) 262 1.61 6.9%+/- of Trad Reqt -1 -0.01 0.1% +/- of Trad Reqt -64 -0.39 8.5%
SG Recruits No. of Bns % rate of effort RRF Recruits No. of Bns % rate of effort
Traditional Reqt 143 1.20 3.2% Traditional Reqt 219 2.00 4.8%Act Inf (In Bdy) 142 1.19 3.7% Act Inf (In Bdy) 250 2.28 6.5%
Act Inf (Out Bdy) 13 0.11 3.6% Act Inf (Out Bdy) 13 0.12 3.5%Pop Change Pop Change
Adj Act Inf (In Bdy) 128 1.07 3.4% Adj Act Inf (In Bdy) 247 2.26 6.6%+/- of Trad Reqt -15 -0.13 2.0% +/- of Trad Reqt 28 0.26 -3.8%
IG Recruits No. of Bns % rate of effort MERCIAN Recruits No. of Bns % rate of effort
Traditional Reqt 119 1.00 2.6% Traditional Reqt 466 3.00 10.3%Act Inf (In Bdy) 81 0.68 2.1% Act Inf (In Bdy) 349 2.24 9.0%
Act Inf (Out Bdy) 34 0.28 9.0% Act Inf (Out Bdy) 40 0.26 10.6%Pop Change Pop Change
Adj Act Inf (In Bdy) 78 0.65 2.1% Adj Act Inf (In Bdy) 357 2.30 9.5%+/- of Trad Reqt -41 -0.35 5.5% +/- of Trad Reqt -109 -0.70 14.5%
WG Recruits No. of Bns % rate of effort R WELSH Recruits No. of Bns % rate of effort
Traditional Reqt 119 1.00 2.6% Traditional Reqt 247 2.00 5.5%Act Inf (In Bdy) 127 1.06 3.3% Act Inf (In Bdy) 184 1.49 4.8%
Act Inf (Out Bdy) 11 0.09 2.9% Act Inf (Out Bdy) 34 0.28 9.0%Pop Change Pop Change
Adj Act Inf (In Bdy) 128 1.07 3.4% Adj Act Inf (In Bdy) 177 1.43 4.7%+/- of Trad Reqt 8 0.07 -1.1% +/- of Trad Reqt -70 -0.57 9.3%
RRS Recruits No. of Bns % rate of effort PARA Recruits No. of Bns % rate of effort
Traditional Reqt 506 5.00 11.2% Traditional Reqt 518 3.00 11.5%Act Inf (In Bdy) 368 3.64 9.5% Act Inf (In Bdy) 422 2.44 10.9%
Act Inf (Out Bdy) 111 1.10 29.5% Act Inf (Out Bdy) 0 0.00 0.0%Pop Change Pop Change
Adj Act Inf (In Bdy) 327 3.23 8.7% Adj Act Inf (In Bdy) 424 2.46 11.2%+/- of Trad Reqt -179 -1.77 23.9% +/- of Trad Reqt -94 -0.54 12.5%
RIFLES Recruits No. of Bns % rate of effort Recruits +/- No. of Bns +/- R IRISH Recruits No. of Bns % rate of effort
Traditional Reqt 513 5.00 11.3% Traditional Reqt 4,521 35.6 Traditional Reqt 94 1.00 2.1%Act Inf (In Bdy) 561 5.46 14.5% Act Inf (Inside Bdy) 3,860 -662 30.8 -4.79 Act Inf (In Bdy) 92 0.97 2.4%
Act Inf (Out Bdy) 6 0.06 1.7% Act Inf (Outside Bdy) 376 3.2 Act Inf (Out Bdy) 24 0.26 6.4%Pop Change Pop Change Pop Change
Adj Act Inf (In Bdy) 555 5.41 14.7% Adj Act Inf (In Bdy) 3,773 30.0 Adj Act Inf (In Bdy) 88 0.93 2.3%+/- of Trad Reqt 42 0.41 -5.6% +/- of Trad Reqt -748 -5.6 +/- of Trad Reqt -7 -0.07 0.9%
2010
SUSTAINING REGIONAL INFANTRY REGIMENTSREGIMENTAL SUMMARY - Potential to support Infantry Battalions
2010
2010
2020
2010
Baseline Forecast Baseline Forecast
2010
5.9%
2.8%
2010
2.0%
2010
2020
2020
2020
2010
2010
2020
2020
-11.0%
2020
-4.2%
2020
2020
-1.0%
2010
0.4%
2010
INFANTRY
-4.5%
-0.9%
2.5%
-3.9%
0.6%
-1.3%
2020
2010
2020
2010
2020
0.5%
2020
2010
2010
2020
2010
2020
-11.2%
-3.5%
2010
2020
-9.7%
2020
DefinitionsTraditional Reqt = The requirement based on an Infantry size of 35.6 Bns.Act = Actual figures based on 3yr ave historic rate.(In Bdy) / (Out Bdy) = Nos recruited inside / outside traditional recruiting areas.Pop Change = % change of 15-29 yr old cohort from 2010 to 2020.Adj = Figures for 2020 adjusted in proportion to the future pop change.

ANNEX I
GREN GDS Recruits No. of Bns % rate of effort LANCS Recruits No. of Bns % rate of effort YORKS Recruits No. of Bns % rate of effort PWRR Recruits No. of Bns % rate of effort
Traditional Reqt 143 1.20 3.2% Traditional Reqt 303 2.00 6.7% Traditional Reqt 402 3.00 8.9% Traditional Reqt 258 2.00 5.7%Act Inf (In Bdy) 117 0.98 3.0% Act Inf (In Bdy) 232 1.53 6.0% Act Inf (In Bdy) 317 2.36 8.2% Act Inf (In Bdy) 222 1.72 5.8%
Act Inf (Out Bdy) 4 0.03 1.1% Act Inf (Out Bdy) 9 0.06 2.4% Act Inf (Out Bdy) 43 0.32 11.5% Act Inf (Out Bdy) 10 0.07 2.5%Pop Change Pop Change Pop Change Pop Change
Adj Act Inf (In Bdy) 131 1.09 3.2% Adj Act Inf (In Bdy) 235 1.55 5.8% Adj Act Inf (In Bdy) 298 2.22 7.4% Adj Act Inf (In Bdy) 257 2.00 6.4%+/- of Trad Reqt -13 -0.11 2.6% +/- of Trad Reqt -67 -0.45 13.7% +/- of Trad Reqt -105 -0.78 21.2% +/- of Trad Reqt -1 0.00 0.1%
COLDM GDS Recruits No. of Bns % rate of effort R ANGLIAN Recruits No. of Bns % rate of effort
Traditional Reqt 143 1.20 3.2% Traditional Reqt 326 2.00 7.2%Act Inf (In Bdy) 142 1.19 3.7% Act Inf (In Bdy) 255 1.56 6.6%
Act Inf (Out Bdy) 15 0.12 3.9% Act Inf (Out Bdy) 9 0.05 2.3%Pop Change Pop Change
Adj Act Inf (In Bdy) 157 1.31 3.9% Adj Act Inf (In Bdy) 288 1.76 7.1%+/- of Trad Reqt 14 0.11 -2.8% +/- of Trad Reqt -38 -0.24 7.8%
SG Recruits No. of Bns % rate of effort RRF Recruits No. of Bns % rate of effort
Traditional Reqt 143 1.20 3.2% Traditional Reqt 219 2.00 4.8%Act Inf (In Bdy) 142 1.19 3.7% Act Inf (In Bdy) 250 2.28 6.5%
Act Inf (Out Bdy) 13 0.11 3.6% Act Inf (Out Bdy) 13 0.12 3.5%Pop Change Pop Change
Adj Act Inf (In Bdy) 132 1.11 3.3% Adj Act Inf (In Bdy) 277 2.53 6.9%+/- of Trad Reqt -11 -0.09 2.3% +/- of Trad Reqt 58 0.53 -11.8%
IG Recruits No. of Bns % rate of effort MERCIAN Recruits No. of Bns % rate of effort
Traditional Reqt 119 1.00 2.6% Traditional Reqt 466 3.00 10.3%Act Inf (In Bdy) 81 0.68 2.1% Act Inf (In Bdy) 349 2.24 9.0%
Act Inf (Out Bdy) 34 0.28 9.0% Act Inf (Out Bdy) 40 0.26 10.6%Pop Change Pop Change
Adj Act Inf (In Bdy) 82 0.69 2.0% Adj Act Inf (In Bdy) 382 2.46 9.5%+/- of Trad Reqt -37 -0.31 7.5% +/- of Trad Reqt -84 -0.54 17.0%
WG Recruits No. of Bns % rate of effort R WELSH Recruits No. of Bns % rate of effort
Traditional Reqt 119 1.00 2.6% Traditional Reqt 247 2.00 5.5%Act Inf (In Bdy) 127 1.06 3.3% Act Inf (In Bdy) 184 1.49 4.8%
Act Inf (Out Bdy) 11 0.09 2.9% Act Inf (Out Bdy) 34 0.28 9.0%Pop Change Pop Change
Adj Act Inf (In Bdy) 134 1.12 3.3% Adj Act Inf (In Bdy) 184 1.49 4.6%+/- of Trad Reqt 15 0.12 -3.0% +/- of Trad Reqt -63 -0.51 12.9%
RRS Recruits No. of Bns % rate of effort PARA Recruits No. of Bns % rate of effort
Traditional Reqt 506 5.00 11.2% Traditional Reqt 518 3.00 11.5%Act Inf (In Bdy) 368 3.64 9.5% Act Inf (In Bdy) 422 2.44 10.9%
Act Inf (Out Bdy) 111 1.10 29.5% Act Inf (Out Bdy) 0 0.00 0.0%Pop Change Pop Change
Adj Act Inf (In Bdy) 331 3.28 8.2% Adj Act Inf (In Bdy) 458 2.65 11.4%+/- of Trad Reqt -175 -1.72 35.4% +/- of Trad Reqt -60 -0.35 12.1%
RIFLES Recruits No. of Bns % rate of effort Recruits +/- No. of Bns +/- R IRISH Recruits No. of Bns % rate of effort
Traditional Reqt 513 5.00 11.3% Traditional Reqt 4,521 35.6 Traditional Reqt 94 1.00 2.1%Act Inf (In Bdy) 561 5.46 14.5% Act Inf (Inside Bdy) 3,860 -662 30.8 -4.79 Act Inf (In Bdy) 92 0.97 2.4%
Act Inf (Out Bdy) 6 0.06 1.7% Act Inf (Outside Bdy) 376 3.2 Act Inf (Out Bdy) 24 0.26 6.4%Pop Change Pop Change Pop Change
Adj Act Inf (In Bdy) 593 5.78 14.7% Adj Act Inf (In Bdy) 4,029 32.0 Adj Act Inf (In Bdy) 88 0.94 2.2%+/- of Trad Reqt 80 0.78 -16.3% +/- of Trad Reqt -493 -3.6 +/- of Trad Reqt -6 -0.06 1.2%
2020
INFANTRY
5.9%
2020
2010
2020
2010
2020
-9.7%
2020
2020
2010
-3.5%
2020
0.5%
2020
-1.0%
2010
0.4%
2010
2020
-11.2%
2010
0.6%
2010
2020
2010
-0.9%
2.5%
-3.9%
2010
-4.5%
SUSTAINING REGIONAL INFANTRY REGIMENTSREGIMENTAL SUMMARY - Potential to support Infantry Battalions
2020
2020
2010
2010
2020
2020
-11.0%
2010
2020
2010
2020
-4.2%
Optimistic Optimistic
2010
5.9%
2.8%
2010
2.0%
2010
2020
2010
DefinitionsTraditional Reqt = The requirement based on an Infantry size of 35.6 Bns.Act = Actual figures based on 3yr ave historic rate.(In Bdy) / (Out Bdy) = Nos recruited inside / outside traditional recruiting areas.Pop Change = % change of 15-29 yr old cohort from 2010 to 2020.Adj = Figures for 2020 adjusted in proportion to the future pop change.
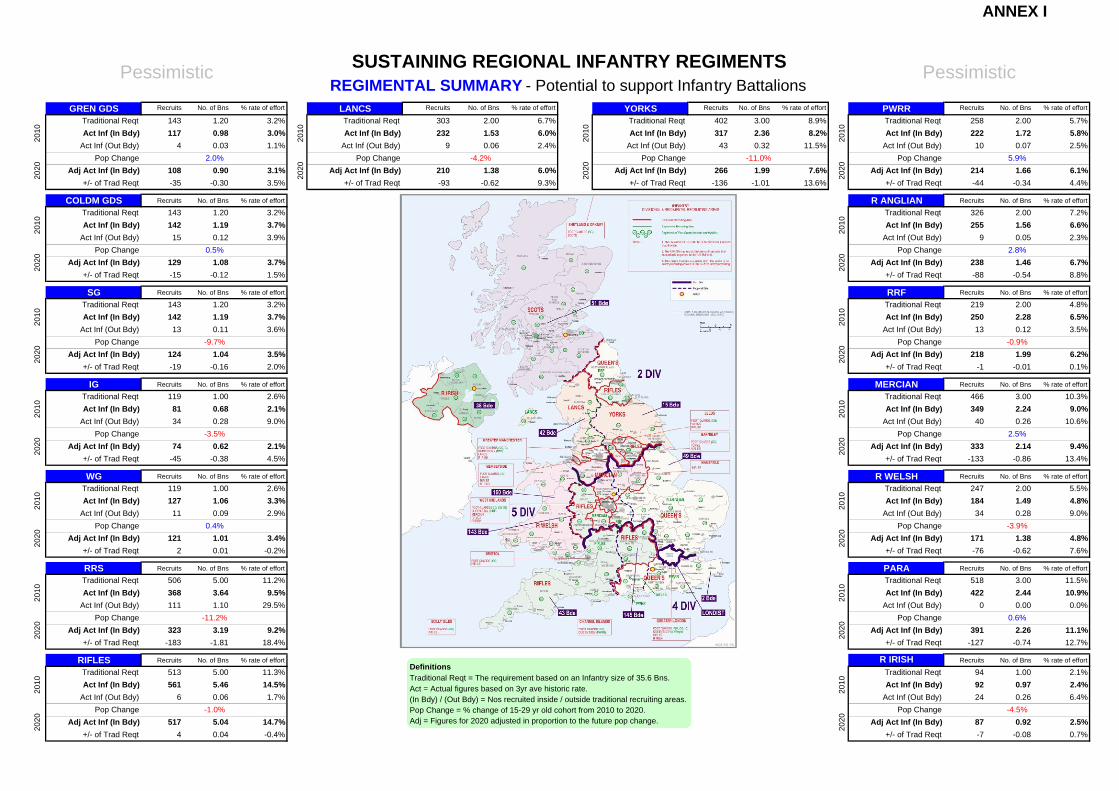
ANNEX I
GREN GDS Recruits No. of Bns % rate of effort LANCS Recruits No. of Bns % rate of effort YORKS Recruits No. of Bns % rate of effort PWRR Recruits No. of Bns % rate of effort
Traditional Reqt 143 1.20 3.2% Traditional Reqt 303 2.00 6.7% Traditional Reqt 402 3.00 8.9% Traditional Reqt 258 2.00 5.7%Act Inf (In Bdy) 117 0.98 3.0% Act Inf (In Bdy) 232 1.53 6.0% Act Inf (In Bdy) 317 2.36 8.2% Act Inf (In Bdy) 222 1.72 5.8%
Act Inf (Out Bdy) 4 0.03 1.1% Act Inf (Out Bdy) 9 0.06 2.4% Act Inf (Out Bdy) 43 0.32 11.5% Act Inf (Out Bdy) 10 0.07 2.5%Pop Change Pop Change Pop Change Pop Change
Adj Act Inf (In Bdy) 108 0.90 3.1% Adj Act Inf (In Bdy) 210 1.38 6.0% Adj Act Inf (In Bdy) 266 1.99 7.6% Adj Act Inf (In Bdy) 214 1.66 6.1%+/- of Trad Reqt -35 -0.30 3.5% +/- of Trad Reqt -93 -0.62 9.3% +/- of Trad Reqt -136 -1.01 13.6% +/- of Trad Reqt -44 -0.34 4.4%
COLDM GDS Recruits No. of Bns % rate of effort R ANGLIAN Recruits No. of Bns % rate of effort
Traditional Reqt 143 1.20 3.2% Traditional Reqt 326 2.00 7.2%Act Inf (In Bdy) 142 1.19 3.7% Act Inf (In Bdy) 255 1.56 6.6%
Act Inf (Out Bdy) 15 0.12 3.9% Act Inf (Out Bdy) 9 0.05 2.3%Pop Change Pop Change
Adj Act Inf (In Bdy) 129 1.08 3.7% Adj Act Inf (In Bdy) 238 1.46 6.7%+/- of Trad Reqt -15 -0.12 1.5% +/- of Trad Reqt -88 -0.54 8.8%
SG Recruits No. of Bns % rate of effort RRF Recruits No. of Bns % rate of effort
Traditional Reqt 143 1.20 3.2% Traditional Reqt 219 2.00 4.8%Act Inf (In Bdy) 142 1.19 3.7% Act Inf (In Bdy) 250 2.28 6.5%
Act Inf (Out Bdy) 13 0.11 3.6% Act Inf (Out Bdy) 13 0.12 3.5%Pop Change Pop Change
Adj Act Inf (In Bdy) 124 1.04 3.5% Adj Act Inf (In Bdy) 218 1.99 6.2%+/- of Trad Reqt -19 -0.16 2.0% +/- of Trad Reqt -1 -0.01 0.1%
IG Recruits No. of Bns % rate of effort MERCIAN Recruits No. of Bns % rate of effort
Traditional Reqt 119 1.00 2.6% Traditional Reqt 466 3.00 10.3%Act Inf (In Bdy) 81 0.68 2.1% Act Inf (In Bdy) 349 2.24 9.0%
Act Inf (Out Bdy) 34 0.28 9.0% Act Inf (Out Bdy) 40 0.26 10.6%Pop Change Pop Change
Adj Act Inf (In Bdy) 74 0.62 2.1% Adj Act Inf (In Bdy) 333 2.14 9.4%+/- of Trad Reqt -45 -0.38 4.5% +/- of Trad Reqt -133 -0.86 13.4%
WG Recruits No. of Bns % rate of effort R WELSH Recruits No. of Bns % rate of effort
Traditional Reqt 119 1.00 2.6% Traditional Reqt 247 2.00 5.5%Act Inf (In Bdy) 127 1.06 3.3% Act Inf (In Bdy) 184 1.49 4.8%
Act Inf (Out Bdy) 11 0.09 2.9% Act Inf (Out Bdy) 34 0.28 9.0%Pop Change Pop Change
Adj Act Inf (In Bdy) 121 1.01 3.4% Adj Act Inf (In Bdy) 171 1.38 4.8%+/- of Trad Reqt 2 0.01 -0.2% +/- of Trad Reqt -76 -0.62 7.6%
RRS Recruits No. of Bns % rate of effort PARA Recruits No. of Bns % rate of effort
Traditional Reqt 506 5.00 11.2% Traditional Reqt 518 3.00 11.5%Act Inf (In Bdy) 368 3.64 9.5% Act Inf (In Bdy) 422 2.44 10.9%
Act Inf (Out Bdy) 111 1.10 29.5% Act Inf (Out Bdy) 0 0.00 0.0%Pop Change Pop Change
Adj Act Inf (In Bdy) 323 3.19 9.2% Adj Act Inf (In Bdy) 391 2.26 11.1%+/- of Trad Reqt -183 -1.81 18.4% +/- of Trad Reqt -127 -0.74 12.7%
RIFLES Recruits No. of Bns % rate of effort Recruits +/- No. of Bns +/- R IRISH Recruits No. of Bns % rate of effort
Traditional Reqt 513 5.00 11.3% Traditional Reqt 4,521 35.6 Traditional Reqt 94 1.00 2.1%Act Inf (In Bdy) 561 5.46 14.5% Act Inf (Inside Bdy) 3,860 -662 30.8 -4.79 Act Inf (In Bdy) 92 0.97 2.4%
Act Inf (Out Bdy) 6 0.06 1.7% Act Inf (Outside Bdy) 376 3.2 Act Inf (Out Bdy) 24 0.26 6.4%Pop Change Pop Change Pop Change
Adj Act Inf (In Bdy) 517 5.04 14.7% Adj Act Inf (In Bdy) 3,523 28.1 Adj Act Inf (In Bdy) 87 0.92 2.5%+/- of Trad Reqt 4 0.04 -0.4% +/- of Trad Reqt -999 -7.5 +/- of Trad Reqt -7 -0.08 0.7%
2010
SUSTAINING REGIONAL INFANTRY REGIMENTSREGIMENTAL SUMMARY - Potential to support Infantry Battalions
2010
2010
2020
2010
Pessimistic Pessimistic
2010
5.9%
2.8%
2010
2.0%
2010
2020
2020
2020
2010
2010
2020
2020
-11.0%
2020
-4.2%
2020
2020
-1.0%
2010
0.4%
2010
INFANTRY
-4.5%
-0.9%
2.5%
-3.9%
0.6%
-8.4%
2020
2010
2020
2010
2020
0.5%
2020
2010
2010
2020
2010
2020
-11.2%
-3.5%
2010
2020
-9.7%
2020
DefinitionsTraditional Reqt = The requirement based on an Infantry size of 35.6 Bns.Act = Actual figures based on 3yr ave historic rate.(In Bdy) / (Out Bdy) = Nos recruited inside / outside traditional recruiting areas.Pop Change = % change of 15-29 yr old cohort from 2010 to 2020.Adj = Figures for 2020 adjusted in proportion to the future pop change.

ANNEX I
THIS PAGE IS INTENTIONALLY BLANK

ANNEX J
Assessment of Future Demographic Supply in Relation to Regimental DemandDeletion of Units Based on UK Supply Shortfall
1st Pass
-0.24
-0.06
-0.40
-0.28
-0.59
-0.55
-0.07
-0.39
-1.75
-0.80
-2.00 -1.50 -1.00 -0.50 0.00
GREN GDS
COLDM GDS
SG
IG
WG
SCOTS
PWRR
LANCS
RRF
R ANGLIAN
RIFLES
YORKS
MERCIAN
R WELSH
R IRISH
PARA
Bns of manning
2nd Pass
-0.24
-0.06
-0.40
-0.28
-0.55
-0.07
-0.39
-0.75
-0.80
-0.59
-1.50 -1.00 -0.50 0.00Bns of manning
3rd Pass
-0.23
-0.75
-0.05
-0.37
-0.27
-0.55
-0.07
-0.36
-0.58
-1.50 -1.00 -0.50 0.00Bns of manning
4th Pass
-0.21
-0.03
-0.32
-0.25
-0.07
-0.23
-0.55
-0.56
-1.50 -1.00 -0.50 0.00Bns of manning
5th Pass
-0.13
-0.28
-0.17
-0.07
-0.26
-0.55
-1.50 -1.00 -0.50 0.00Bns of manning
6th Pass
-1.00 -0.50 0.00 0.50 1.00Bns of manning
Manningsustainability
reached
NotesUnit of measure - Bns of Manning

ANNEX J
THIS PAGE IS INTENTIONALLY BLANK