Embed Size (px)
Citation preview
WP/16/225
Arrears to the IMF – A Ghost of the Past?
by Anne Oeking and Mariusz Sumlinski
IMF Working Papers describe research in progress by the author(s) and are published to elicit comments and to encourage debate. The views expressed in IMF Working Papers are those of the author(s) and do not necessarily represent the views of the IMF, its Executive Board, or IMF management.
© 2016 International Monetary Fund WP/16/225
IMF Working Paper
Finance Department
Arrears to the IMF – A Ghost of the Past?
Prepared by Anne Oeking and Mariusz Sumlinski1
Authorized for distribution by Olaf Unteroberdoerster
November 2016
Abstract
In this paper, we consider incidences of arrears to the IMF, focusing on protracted arrears cases and attempt to identify determinants of their occurrence. We use narrative and formal methods. In addition, we analyze determinants of the duration of arrears. We find that previous arrears, reserves coverage, and institutional quality are among the main determinants of arrears. In addition, we identify a role for political developments, including civil unrest, which make arrears more likely to arise and to last longer. We conclude that improved macroeconomic conditions and turnaround of political fortunes would help to clear the currently remaining protracted arrears cases.
JEL Classification Numbers: F33, F34
Keywords: Arrears, International Monetary Fund, External Debt
Author’s E-Mail Address: [email protected], [email protected]
1 We would like to thank Tom Krueger, Olaf Unteroberdoerster, Chris Geiregat, participants in the IMF’s FIN Economist Seminar, and departmental reviewers for helpful comments and suggestions.
IMF Working Papers describe research in progress by the author(s) and are published to elicit comments and to encourage debate. The views expressed in IMF Working Papers are those of the author(s) and do not necessarily represent the views of the IMF, its Executive Board, or IMF management.
1
Contents
I. Introduction ........................................................................................................................... 2
II. Literature Review ................................................................................................................. 3
III. Stylized Facts ...................................................................................................................... 4
Comparison of Relevant Variables across Country Groups ............................................. 4
Dynamics of Relevant Variables around Arrears Occurrence and Clearance .................. 7
IV. Triggers and Common Determinants of Arrears ................................................................ 9
A. Triggers ............................................................................................................................ 9
B. Econometric Analysis .................................................................................................... 16
Econometric Model ......................................................................................................... 16
Data and Methodological Issues ..................................................................................... 17
Estimation Results .......................................................................................................... 18
Robustness ...................................................................................................................... 22
Predicting Protracted Arrears .......................................................................................... 24
V. Duration Analysis .............................................................................................................. 26
Econometric Model ......................................................................................................... 26
Choice of Explanatory Variables .................................................................................... 27
Estimation Results .......................................................................................................... 27
VI. Conclusions and Policy Implications................................................................................ 32
Annex ...................................................................................................................................... 34
References ............................................................................................................................... 38
2
I. INTRODUCTION
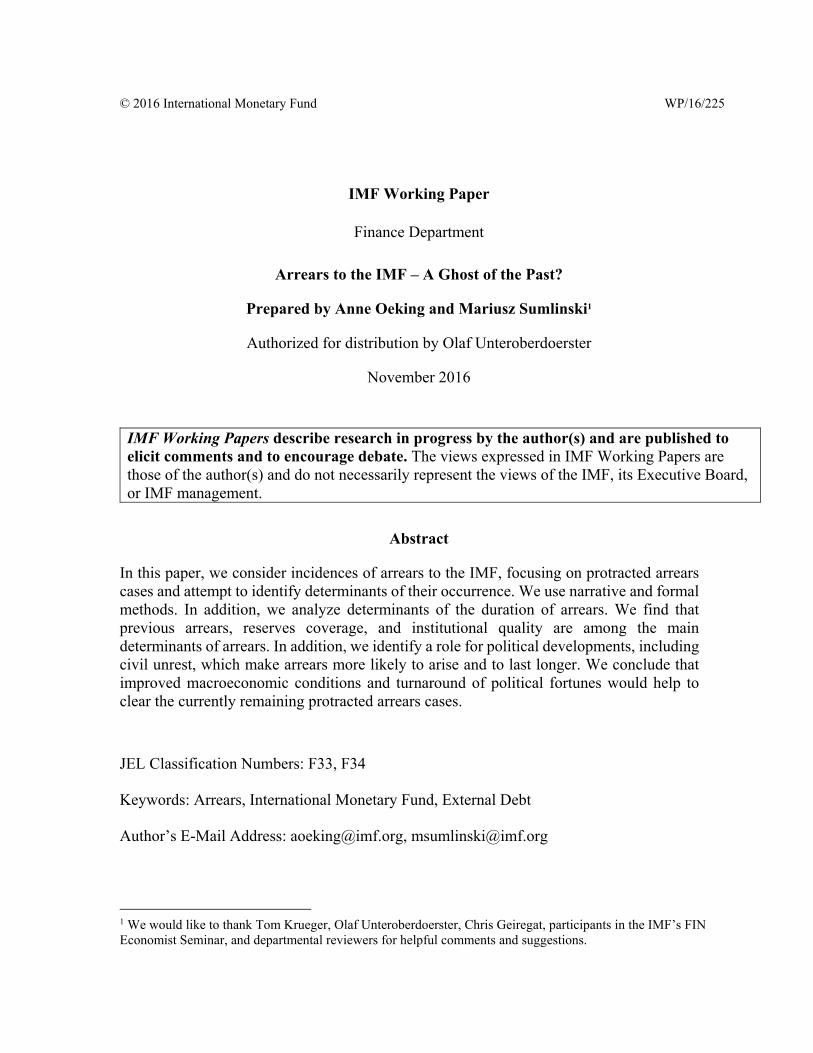
The IMF experienced a period of steady accumulation of protracted arrears by members in the 1980-90s (see Figure 1).2 At the risk of overgeneralization, a country running protracted arrears to the IMF could be characterized as a small, commodity-export dependent country with political problems (or with just the latter) (Boughton 2001, ch. 16; 2012; ch. 16). Since then, the IMF has had to deal with the resolution of thirty cases of protracted arrears. While every case has been different, to resolve arrears each case has required some combination of reversal of bad fortunes, improved economic performance, establishment of a record of cooperation on policies and payments with the IMF, and political and financial support by advanced IMF members. New bilateral loans and grants allowed restructuring of debt in arrears and facilitated movement towards sustainability (Boughton, ibid.).
Figure 1: Protracted Arrears to the IMF
(light blue: ongoing)
Today, protracted arrears to the IMF appear to be a ghost of the past. There are only three remaining protracted arrears cases – Sudan, Somalia, and Zimbabwe – that started in 1984, 1987, and 2001, respectively.3 No IMF member has accumulated protracted arrears since 2001. The most recent resolution of protracted arrears was in March 2008 when Liberia, after 22 years of ineligibility to borrow from the IMF, repaid SDR 543 million once it qualified for debt relief under the HIPC Initiative. Before then, in 2003, Afghanistan and in 2004, Iraq cleared their arrears.
In addition to these protracted arrears, the IMF at times experiences short-term arrears when members miss their payments to the IMF for up to 180 days. While on average about 20
2 Protracted arrears are defined as obligations overdue by six months or more. 3 At the time of writing the paper, Zimbabwe was still in arrears to the IMF. Zimbabwe cleared its arrears on October 20, 2016.
CambodiaNicaragua
GuyanaChad
VietnamSudan
Sierra LeoneLiberia
TanzaniaZambia
Gambia, ThePeruJamaica
ZambiaSierra Leone
SomaliaHonduras
PanamaDRC
HaitiHonduras
Dominican RepublicDRCIraq
HaitiBosnia and Herzegovina
Federal Republic of YugoslaviaCentral African Republic
Afghanistan, Islamic Republic of Zimbabwe
2010 201520052000199519901980 19851975
3
countries incurred short-term arrears per year in the 1980s and 1990s, the short-term arrears have diminished in frequency and duration. In 2015, only a handful of members accumulated short-term arrears and one has to go back to 2006 to count ten country cases of short-term arrears.
While based on the above, new protracted arrears may appear as likely as ghosts, risks of their reappearance remain. Three protracted arrears cases persist and short-term arrears keep occurring. Recognizing these facts, in this paper, we re-examine the determinants of arrears to the IMF and use a novel approach analyzing their duration, with a special focus on new data capturing political factors.
The paper is structured as follows. In Section II we review the relevant literature. In Section III we present stylized facts, and in Section IV we discuss determinants of arrears. We begin with a qualitative discussion of “triggers” of what turned out to be protracted arrears cases, and end with estimation of a logit model of probability of arrears occurrence. In Section V we model the duration of protracted arrears cases and conclude in Section VI.
II. LITERATURE REVIEW
The literature on the causes and consequences of arrears, sovereign debt crises, and defaults is extensive.4 Most of the studies focus on defaults on privately held sovereign debt or debt owed to Paris Club official creditors. Only a few focus on arrears to the IMF.
Among those, Aylward and Thorne (1998) study the determinants of arrears to the IMF. They use a logit model to identify the financial and macroeconomic variables correlated with the probability of a country accumulating arrears to the IMF. They analyze arrears occurrence among 138 countries over 1976-93 with 1,410 country-year observations including 103 observations of arrears and define as arrears any obligations overdue by at least three months. They conclude that arrears are more likely with larger (in terms of quota) use of IMF credit, a higher inflation rate, lower per capita income, or a slower rate of economic growth.
In another study, Oka (2003) attempts to identify early warning indicators of occurrence of arrears to the IMF. He analyzes arrears occurrence among 118 countries over 1980-97 with 1,375 country-year observations including 63 country-year arrears observations and defines as arrears any obligation overdue for at least six months. He concludes that arrears are more likely
4 For example, Das et al. (2012) provide a survey of issues related to sovereign debt restructurings and an overview of related empirical literature; Reinhart and Rogoff (2008) use a new dataset for a quantitative analysis of the history of financial crises; Sturzenegger and Zettelmeyer (2007) give an account of sovereign debt crises in emerging market economies over the last decade. Manasse et al. (2003) survey the literature on predicting sovereign debt crises. Across the literature researchers identify financial ratios such as reserves to imports to be consistently important as determinants of external debt repayment; for other macroeconomic variables the results are less clear. The history of repayment has also been found to play a role.
4
when IMF debt outstanding relative to quota or IMF debt service to exports is high, reserves to imports or export growth are low, or when arrears to other external creditors are rising. The early warning indicators considered by him appear to accurately identify countries that incurred arrears to the IMF, but at the same time they issue many false alarms.
In this paper we contribute to that literature through the study of occurrence of arrears and their duration. The latter is new as neither Aylward and Thorne (1998) nor Oka (2003) analyzed duration of arrears. We use an expanded and revised data set (1975-2015) and a different modelling strategy. We do not exclude from the definition of arrears any of their temporal manifestations, i.e., we analyze protracted arrears (longer than six months in duration) either on their own or within a larger pool of arrears lasting more than a day, a week, or a month. This study of occurrence of arrears to the IMF is closely related to the literature on the determinants of sovereign debt default, but considers factors specific to debt outstanding to the IMF.
Any analysis of arrears to the IMF must address the issue of a small number of observations to be explained. As noted above, there have been only thirty instances of protracted arrears to the IMF since its founding in 1945. For frequentist statistical analyses which require a larger number of observations for the power of their tests this may present a problem. However, we must recognize that 189 members of the IMF of which only 27 incurred arrears in the last 75 years are a binding state of nature. In effect, as is often the case in macro-empirical work, the arrears cases constitute a population of events under study, not a sample. While, therefore, we do not consider “a small number of observations to be explained” a problem, we note that the small number of data points matters for econometric estimations and the predictive power of models. That said, we augment the discussion of the results of our statistical analyses with descriptive and qualitative analyses to come to reasonable and reasoned conclusions that might not be picked up by the statistical tests owing to their diminished power.
III. STYLIZED FACTS
Comparison of Relevant Variables across Country Groups
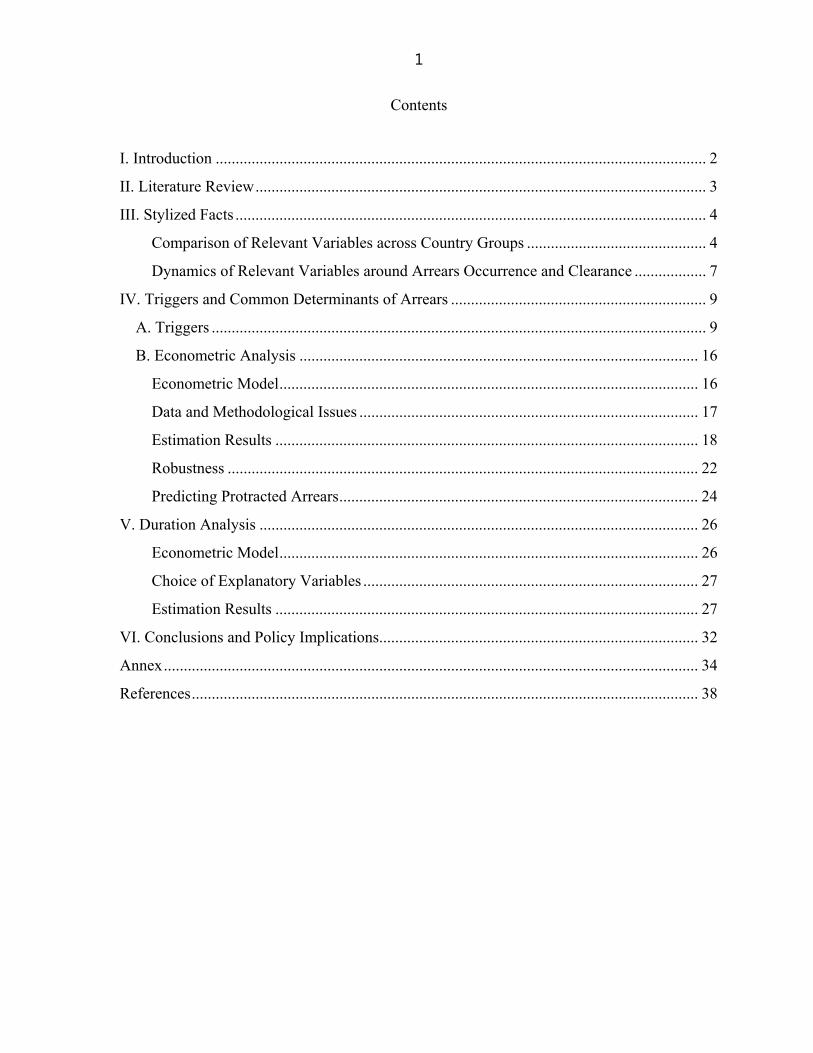
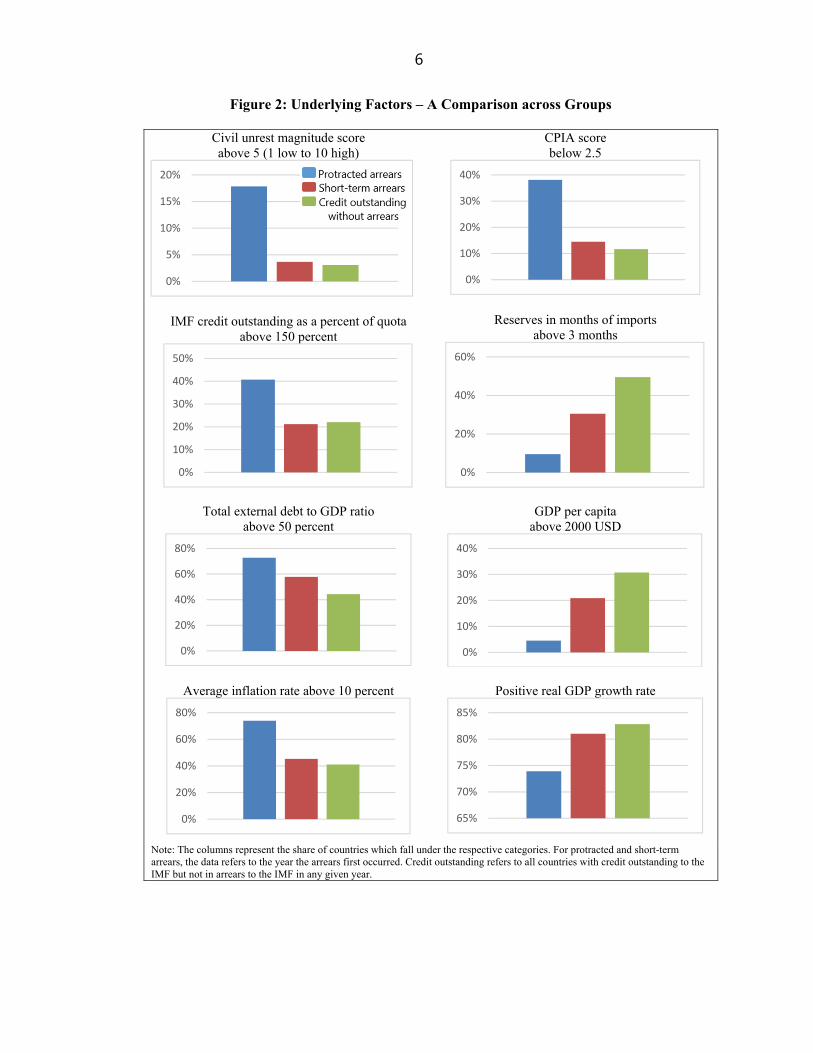
We begin by dividing the countries in our dataset into three groups: countries with protracted arrears, countries with short-term arrears,5 and countries with credit outstanding to the IMF but not in arrears, and compare their performance on a number of variables relevant to our analysis.6 These variables measure the level of institutional and macroeconomic development and the magnitude of indebtedness to the IMF (see Figure 2). We conclude that on average,
5 Short-term arrears are here defined as overdue for more than 7 days and less than 6 months. 6 A list of variables and their sources can be found in Annex III.

5
countries with protracted arrears performed worse than countries with short-term arrears or countries with credit to the IMF outstanding but not in arrears.
A six times higher percentage of countries with protracted arrears had an above average score on civil unrest (around 18 percent), compared to the no arrears group (3 percent) and 4.5 times higher compared to the short-term arrears group (4 percent). Around 38 percent of protracted arrears countries had low institutional development (measured by the CPIA score) compared to 14 and 12 percent for the two comparator groups.
Forty percent of the protracted arrears cases had credit outstanding to the IMF above 150 percent of its quota, while among the two comparators it was only around half this percentage. As regards international reserves coverage in the protracted arrears group, only 10 percent of countries had reserves above 3 month of prospective imports, while it was 30 percent for short-term arrears cases and 50 percent for all other countries with credit outstanding. Around 73 percent of protracted arrears cases had external debt to GDP higher than 50 percent, compared to 58 percent of short-term arrears cases and 44 percent of all other countries crossing that threshold.
Finally, more countries in the protracted arrears group had an inflation rate above 10 percent (74 percent versus 45 percent for short-term arrears and 41 percent for all other countries) and fewer of them grew (74 percent, i.e., 26 percent of countries actually shrank in the year arrears occurred) than countries with short-term arrears (81 percent) or no arrears (83 percent). Clearly, the countries that accumulated protracted arrears performed worse than others across a wide range of indicators.
6
Figure 2: Underlying Factors – A Comparison across Groups
Civil unrest magnitude score above 5 (1 low to 10 high)
CPIA score below 2.5
IMF credit outstanding as a percent of quota
above 150 percent
Reserves in months of imports
above 3 months
Total external debt to GDP ratio
above 50 percent
GDP per capita
above 2000 USD
Average inflation rate above 10 percent
Positive real GDP growth rate
Note: The columns represent the share of countries which fall under the respective categories. For protracted and short-term arrears, the data refers to the year the arrears first occurred. Credit outstanding refers to all countries with credit outstanding to the IMF but not in arrears to the IMF in any given year.
0%
5%
10%
15%
20%
0%
10%
20%
30%
40%
0%
10%
20%
30%
40%
50%
0%
20%
40%
60%
0%
20%
40%
60%
80%
0%
10%
20%
30%
40%
0%
20%
40%
60%
80%
65%
70%
75%
80%
85%
7
Dynamics of Relevant Variables around Arrears Occurrence and Clearance
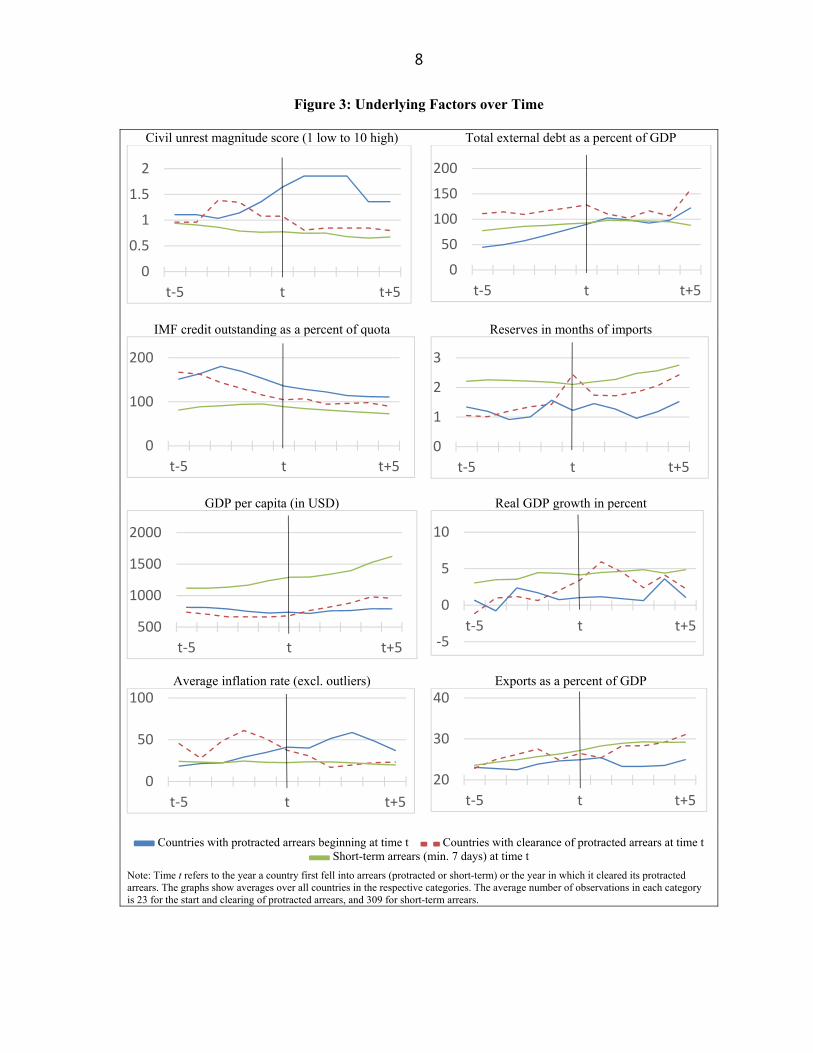
To complement the perspective from using control groups, we show how the relevant variables behaved around the time of protracted arrears and short-term arrears occurrence, and around the time of protracted arrears clearance (Figure 3). As can be seen in Figure 3 the variables of interest follow different patterns. First, there are clear level differences. Around the time of arrears occurrence, as well as five years before and after, countries with protracted arrears have higher credit to the IMF outstanding than countries with short-term arrears, they are poorer than countries with short-term arrears, and their macroeconomic and political indicators are worse than for countries with short-term arrears. At the time of arrears clearance, some of these differences have disappeared.
Then there are dynamic differences. Most notably, countries with protracted arrears had more severe civil unrest episodes around the time of arrear occurrence, with a steep increase in the magnitude of civil unrest in the years leading up to the arrears. Shortly before and after the time of arrears resolution, civil unrest in protracted arrears countries on average dropped, while still at a higher level than in short-term arrears countries.
While external debt to GDP ratios are similar at the time of arrears occurrence, ratios increased more steeply for protracted arrears countries in the years preceding arrears occurrence than they did for short-term arrears. The IMF credit outstanding to quota ratio peaks about three years before occurrence of protracted arrears and decreases afterwards, and at time of arrears clearance has reached a level much closer to that of short-term arrears countries. Both before and after arrears occurrence, countries with protracted arrears had on average lower reserves in months of imports than short-term arrears countries; reserve levels slowly converge only after arrears clearance.
Countries with protracted arrears had on average lower growth across the entire time span under consideration. Inflation was at comparable levels for countries with protracted and short-term arrears some years before arrears occurrence, but increased immediately before and after countries fell into protracted arrears. The opposite holds for export to GDP ratios. At the time of clearing of arrears or shortly afterwards, most of these indicators are similar to the values for short-term arrears countries.
8
Figure 3: Underlying Factors over Time
Civil unrest magnitude score (1 low to 10 high) Total external debt as a percent of GDP
IMF credit outstanding as a percent of quota Reserves in months of imports
GDP per capita (in USD) Real GDP growth in percent
Average inflation rate (excl. outliers) Exports as a percent of GDP
Countries with protracted arrears beginning at time t Countries with clearance of protracted arrears at time t Short-term arrears (min. 7 days) at time t
Note: Time t refers to the year a country first fell into arrears (protracted or short-term) or the year in which it cleared its protracted arrears. The graphs show averages over all countries in the respective categories. The average number of observations in each category is 23 for the start and clearing of protracted arrears, and 309 for short-term arrears.
0
0.5
1
1.5
2
t-5 t t+5
0
50
100
150
200
t-5 t t+5
0
100
200
t-5 t t+50
1
2
3
t-5 t t+5
500
1000
1500
2000
t-5 t t+5 -5
0
5
10
t-5 t t+5
0
50
100
t-5 t t+5
20
30
40
t-5 t t+5
9
IV. TRIGGERS AND COMMON DETERMINANTS OF ARREARS
A. Triggers
Every instance of arrears has its “trigger”.7 For a short-term arrear, it may be as simple and easy to identify (and to correct) as miscounting of the days preceding an obligation’s due date. For protracted arrears, identification of the triggers may be more complicated as suggested by Boughton (2001) who notes that “[t]he origins of the problem, however, lay in the first half of
the 1980s, when the IMF was lending heavily to developing countries that were struggling to cope with the international debt crisis, the widespread recession in industrial countries, and the associated withdrawal of commercial and bilateral official loans. […] Overall, the reasons for countries failing to repay the IMF were complex, and they varied from case to case. No uniform pattern emerges from either an economic or a political perspective.”8
In this section, utilizing Boughton’s (2001, 2012) reading of protracted arrears cases we identify events that led up to the accumulation of arrears (“triggers”) or shared “categories of triggers” of arrears. We distinguish between triggers that are political (e.g., wars, political acts, etc.), global – i.e., affecting potentially all economies and beyond individual control (e.g., commodity price swings, weather events, or a debt crisis) and country-specific (structural or macroeconomic e.g., corruption, poor policy implementation, etc.). Annex I lists all protracted arrears cases (resolved and ongoing) to the IMF.
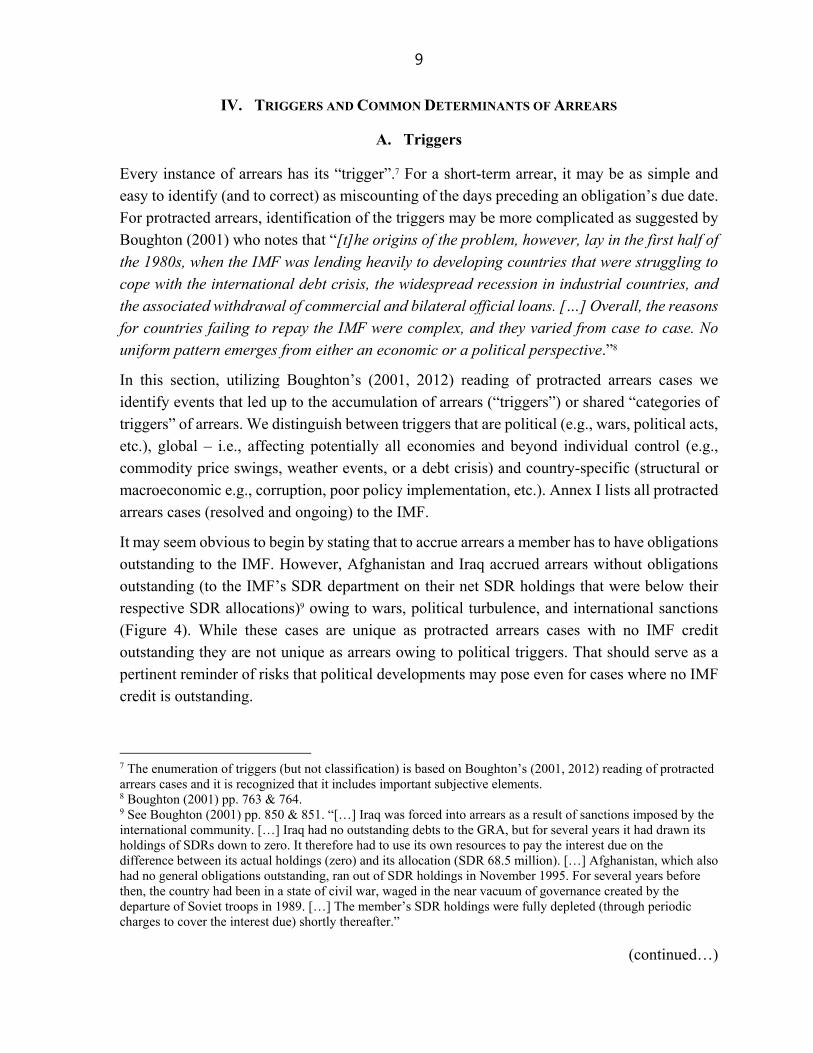
It may seem obvious to begin by stating that to accrue arrears a member has to have obligations outstanding to the IMF. However, Afghanistan and Iraq accrued arrears without obligations outstanding (to the IMF’s SDR department on their net SDR holdings that were below their respective SDR allocations)9 owing to wars, political turbulence, and international sanctions (Figure 4). While these cases are unique as protracted arrears cases with no IMF credit outstanding they are not unique as arrears owing to political triggers. That should serve as a pertinent reminder of risks that political developments may pose even for cases where no IMF credit is outstanding.
7 The enumeration of triggers (but not classification) is based on Boughton’s (2001, 2012) reading of protracted arrears cases and it is recognized that it includes important subjective elements. 8 Boughton (2001) pp. 763 & 764. 9 See Boughton (2001) pp. 850 & 851. “[…] Iraq was forced into arrears as a result of sanctions imposed by the international community. […] Iraq had no outstanding debts to the GRA, but for several years it had drawn its holdings of SDRs down to zero. It therefore had to use its own resources to pay the interest due on the difference between its actual holdings (zero) and its allocation (SDR 68.5 million). […] Afghanistan, which also had no general obligations outstanding, ran out of SDR holdings in November 1995. For several years before then, the country had been in a state of civil war, waged in the near vacuum of governance created by the departure of Soviet troops in 1989. […] The member’s SDR holdings were fully depleted (through periodic charges to cover the interest due) shortly thereafter.”
(continued…)
10
In Figure 4 we include nine cases (names in bold) – Cambodia, Democratic Republic of Congo (twice), Honduras, Peru, Vietnam, Zambia (twice), and Zimbabwe – that happened when the authorities, even when seemingly having had the resources to continue servicing their obligations to the IMF, decided not to.10 They account for nearly one third of all arears cases to the IMF – a non-trivial proportion suggesting once again a need for vigilant assessment of the authorities’ commitment to service IMF’s obligations. Figure 4 also shows that in most cases of arrears with political triggers, the latter’s impact was combined with effects from the two other trigger categories – country-specific or global. In thirteen cases either country-specific (four cases) or global and country-specific (nine) triggers combined with political triggers to produce arrears. That sums up to 21 cases of arrears (70 percent of total) in which political factors appear to have played a role in line with the noted above tendency of countries with protracted arrears experiencing higher than average incidences of civil unrest.
Figure 4: Political and Other Triggers for Protracted Arrears Cases
10 For examples, see Boughton (2001) ch. 16: “When Alan García was elected president of Peru in July 1985, he immediately declared a state of emergency and announced that for the time being Peru would spend no more than 10 percent of its foreign exchange earnings on external debt service.”; “On May 1, Kaunda suddenly and unexpectedly broke off negotiations and announced that Zambia was rejecting “the way of the IMF” and henceforth would “determine our own destiny.” As part of the new program, Zambia (like Peru two years earlier) would limit its debt-service payments to external creditors to 10 percent of export earnings …”; “When the IMF complained about the arrears in February 1984, the authorities responded that they had asked their correspondent banks in the United States to transfer the required funds to the IMF, but that the U.S. government was blocking them from doing so. […] the Executive Board did note that Vietnam held more than enough unencumbered gold reserves to service its overdue obligations to the IMF without touching the blocked assets in U.S. banks.”
Haiti (x2), Liberia, Nicaragua
Country Specific
Political
Congo DR (x2), Guyana, Honduras, Peru, Somalia, Sudan, Zambia (x2)
Country Specific
GlobalPolitical
Afghanistan, Bosnia, Cambodia, Iraq, Panama, Serbia, Vietnam, Zimbabwe
Political
11
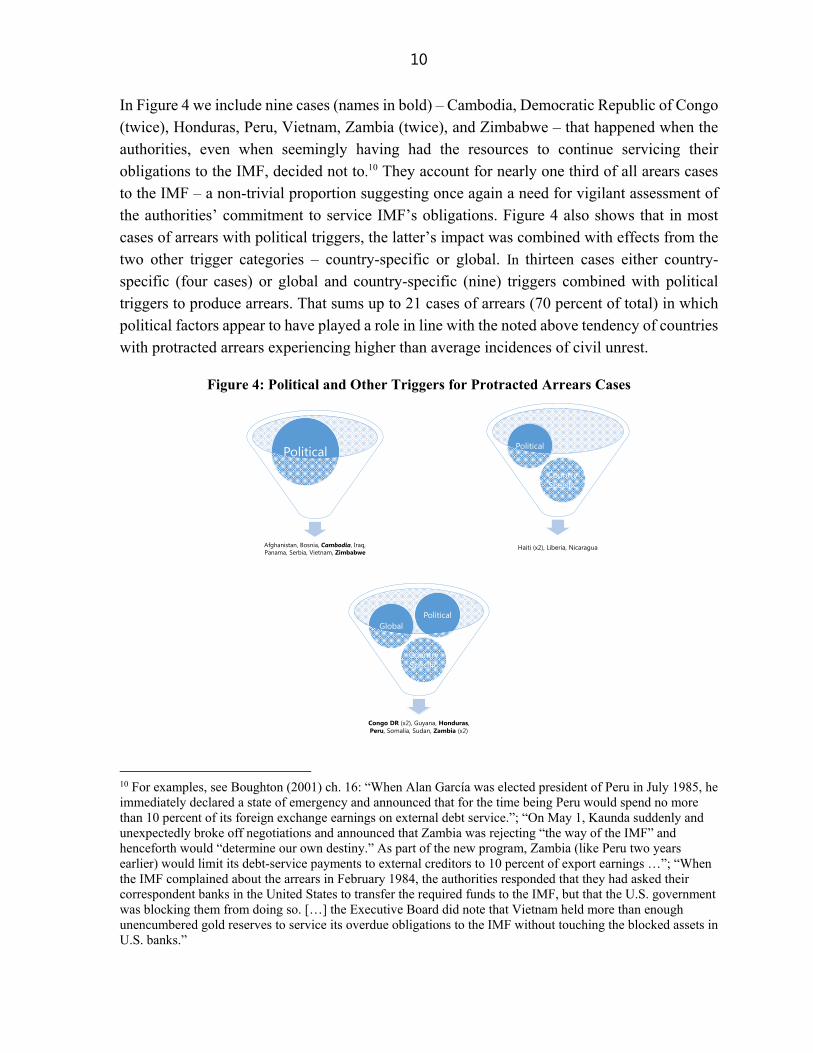
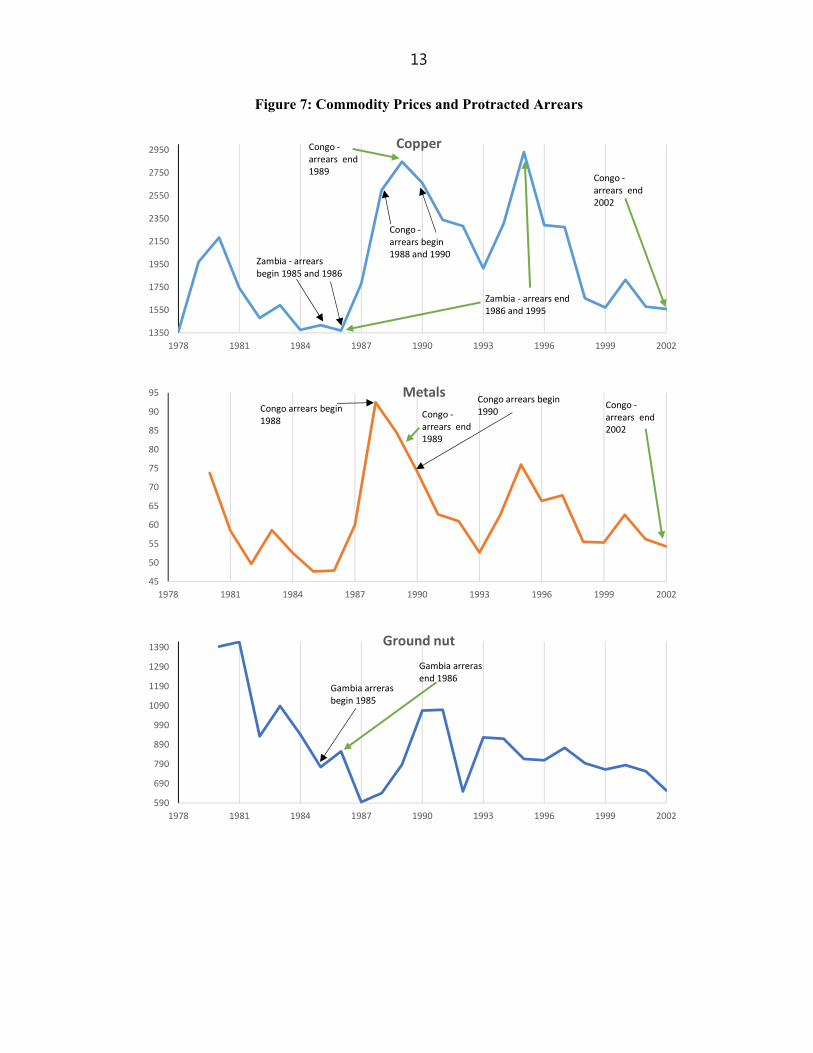
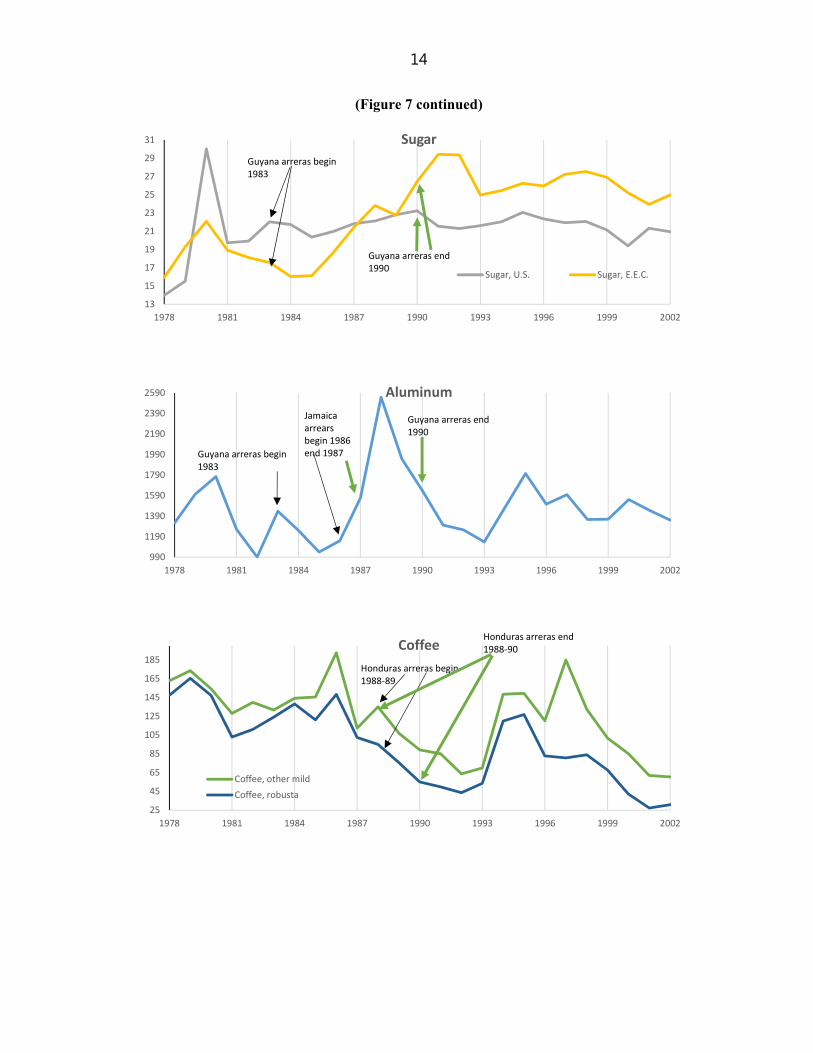
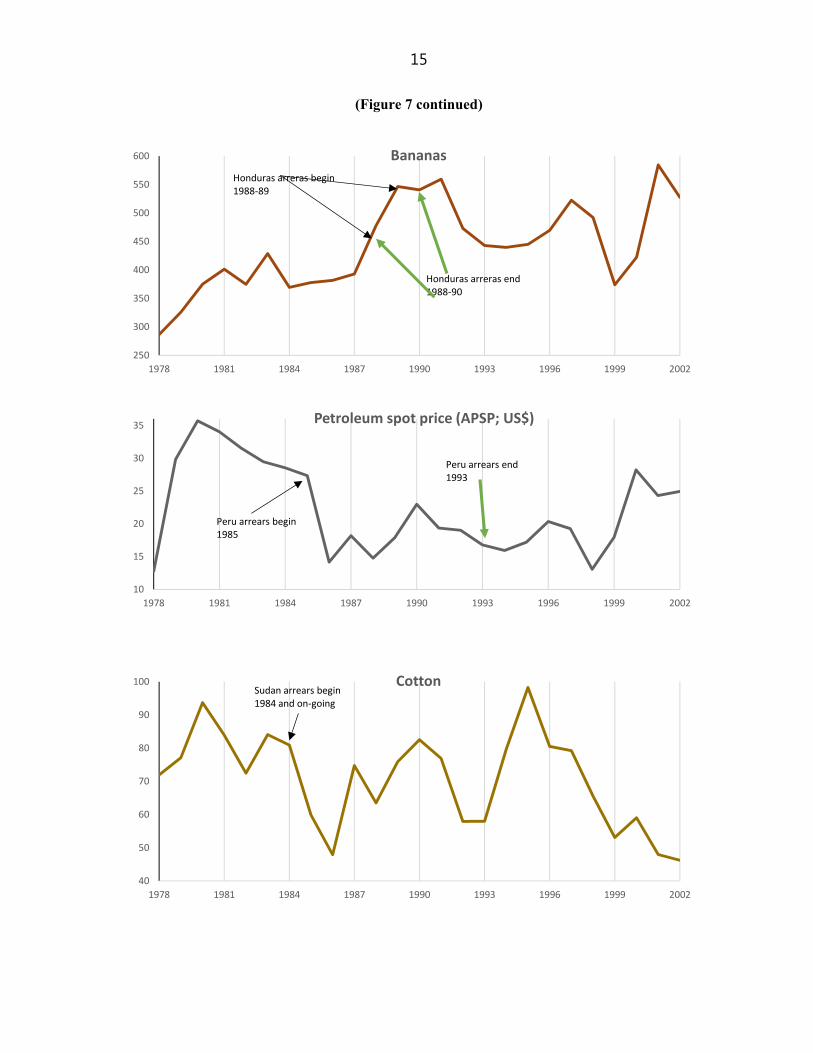
Figure 5 lists 13 arrears cases which we classify as at least partly owing to global triggers (as defined above). Only one case (Dominican Republic) of protracted arears can be ascribed to global triggers alone. Among the other 12 cases, three were reinforced by country-specific triggers and the remaining nine combined with political and country-specific triggers. Most of the global factors included a decline in commodity prices for commodity exporting countries. Figure 7 maps the beginning and end of protracted arrears cases for which we list global triggers as critical factors. For some of the cases, local troughs and peaks for commodity price time series coincide with the beginning and end of arrears. For others, the relation is less clear, suggesting that other factors – country-specific or political – may have been more decisive.
Figure 5: Global and Other Triggers for Protracted Arrears Cases
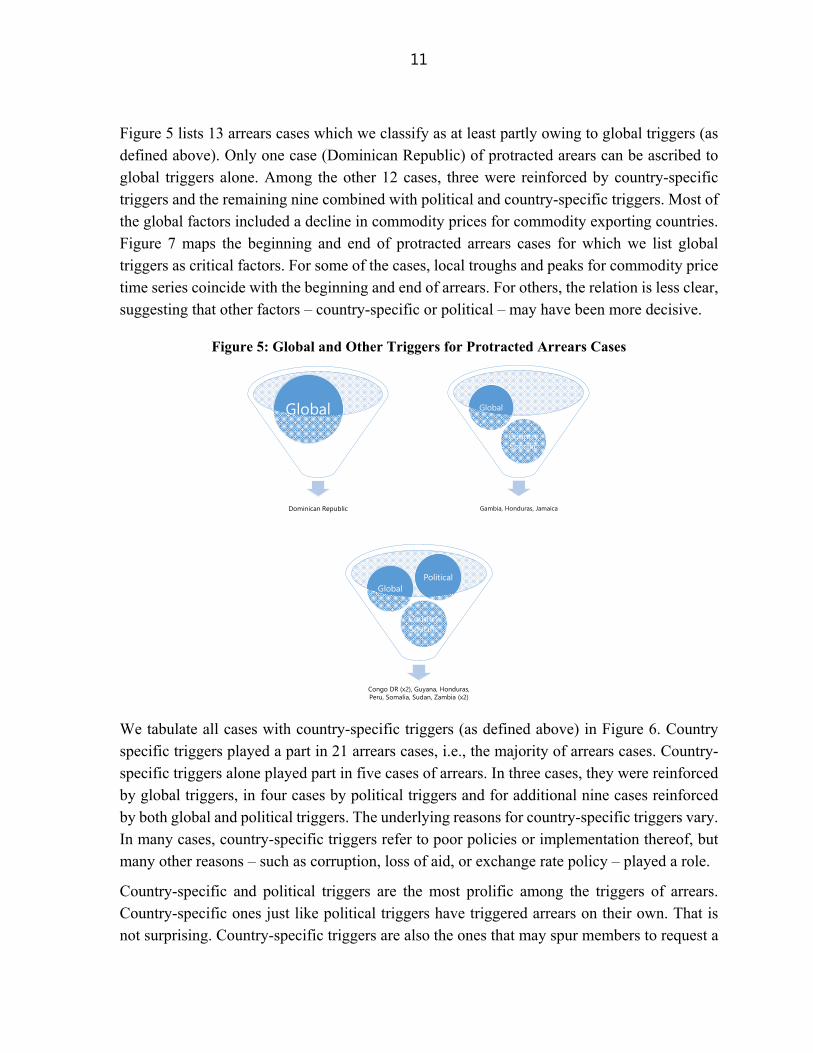
We tabulate all cases with country-specific triggers (as defined above) in Figure 6. Country specific triggers played a part in 21 arrears cases, i.e., the majority of arrears cases. Country-specific triggers alone played part in five cases of arrears. In three cases, they were reinforced by global triggers, in four cases by political triggers and for additional nine cases reinforced by both global and political triggers. The underlying reasons for country-specific triggers vary. In many cases, country-specific triggers refer to poor policies or implementation thereof, but many other reasons – such as corruption, loss of aid, or exchange rate policy – played a role.
Country-specific and political triggers are the most prolific among the triggers of arrears. Country-specific ones just like political triggers have triggered arrears on their own. That is not surprising. Country-specific triggers are also the ones that may spur members to request a
Dominican Republic
Global
Gambia, Honduras, Jamaica
Country Specific
Global
Congo DR (x2), Guyana, Honduras, Peru, Somalia, Sudan, Zambia (x2)
Country Specific
GlobalPolitical
12
program from the IMF. After all, the IMF’s programs are to provide flexible and tailored support to achieve, maintain, or restore a stable and sustainable macroeconomic position, e.g., in the balance of payments, consistent with strong and durable poverty reduction and growth which may include correcting poor policies (e.g., Haiti), supporting reduction of heavy indebtedness (e.g., Jamaica), correcting inappropriate foreign exchange policies (e.g., Chad, Tanzania) and so on.
Figure 6. Country-specific and Other Triggers for Protracted Arrears Cases
Central African Rep., Chad, Sierra Leone (x2), Tanzania
Country specific
Gambia, Honduras, Jamaica
Global
Country Specific
Haiti (x2), Liberia, Nicaragua
Country Specific
Political
Congo DR (x2), Guyana, Honduras, Peru, Somalia, Sudan, Zambia (x2)
Country Specific
GlobalPolitical
13
Figure 7: Commodity Prices and Protracted Arrears
1350
1550
1750
1950
2150
2350
2550
2750
2950
1978 1981 1984 1987 1990 1993 1996 1999 2002
Copper
Congo -arrears begin 1988 and 1990
Zambia - arrears begin 1985 and 1986
Zambia - arrears end 1986 and 1995
Congo -arrears end 2002
Congo -arrears end 1989
45
50
55
60
65
70
75
80
85
90
95
1978 1981 1984 1987 1990 1993 1996 1999 2002
MetalsCongo arrears begin 1988
Congo -arrears end 1989
Congo -arrears end 2002
Congo arrears begin 1990
590
690
790
890
990
1090
1190
1290
1390
1978 1981 1984 1987 1990 1993 1996 1999 2002
Ground nut
Gambia arreras begin 1985
Gambia arreras end 1986
14
(Figure 7 continued)
13
15
17
19
21
23
25
27
29
31
1978 1981 1984 1987 1990 1993 1996 1999 2002
Sugar
Sugar, U.S. Sugar, E.E.C.
Guyana arreras begin 1983
Guyana arreras end 1990
990
1190
1390
1590
1790
1990
2190
2390
2590
1978 1981 1984 1987 1990 1993 1996 1999 2002
Aluminum
Guyana arreras begin 1983
Jamaica arrearsbegin 1986 end 1987
Guyana arreras end 1990
25
45
65
85
105
125
145
165
185
1978 1981 1984 1987 1990 1993 1996 1999 2002
Coffee
Coffee, other mild
Coffee, robusta
Honduras arreras begin 1988-89
Honduras arreras end 1988-90
15
(Figure 7 continued)
250
300
350
400
450
500
550
600
1978 1981 1984 1987 1990 1993 1996 1999 2002
Bananas
Honduras arreras begin 1988-89
Honduras arreras end 1988-90
10
15
20
25
30
35
1978 1981 1984 1987 1990 1993 1996 1999 2002
Petroleum spot price (APSP; US$)
Peru arrears begin 1985
Peru arrears end 1993
40
50
60
70
80
90
100
1978 1981 1984 1987 1990 1993 1996 1999 2002
CottonSudan arrears begin 1984 and on-going

16
B. Econometric Analysis
Econometric Model
Following the descriptive analysis presented above we turn to a model-based analysis in this section and use a logit model to estimate probabilities of arrears occurrence. In this model, we formalize arrears accumulation to the IMF as:
∗ ′ (1)
where ∗ is the probability of a country accumulating arrears to the IMF, is a vector of
explanatory variables, and is an error term. As we do not observe the probability of falling
into arrears but only an actual instance of arrears accumulation we quantify ∗ using observable instances of arrears accumulation as a dummy variable, assigning one to every instance of arrears and zero otherwise.
To estimate equation (1) we need to transform our observable, dichotomous, dependent
variable into a continuous, non-negative variable based on the odds ratio , where
is the odds of accumulating arrears for country , and is the probability of
accumulating arrears for country . We accomplish that using a logit transformation i.e., taking
logs of the odds-ratio as follows: log log . This allows us to use
maximum likelihood to estimate the following logit equation:
(2)
We estimate a pooled logit. This is the second best strategy as ideally we would like to allow for unobserved heterogeneity across countries and include country fixed effects. However, the fixed effects estimation is possible only for a severely restricted data set. In a fixed effects model, countries that have never incurred arrears and for which the dependent variable does not vary over time are excluded from the data set as a result of the required data transformation. Therefore, the estimation performed on a very restricted subset of data would be neither informative nor comparable with the model estimated for the full data set.11
The dependent variable is a binary variable indicating the year a country has fallen into arrears to the IMF. We use various measures for the dependent variable depending on the duration of arrears: more than six months (i.e., protracted arrears), longer than one month, longer than one week, as well as all arrears irrespective of their duration.12 For each arrears case we use only the first country-year observation as a marker of arrears occurrence i.e., the dependent variable takes the value of one for the beginning year of each arrears spell. We set all annual data points
11 We estimate a fixed effects model for illustrative purposes. The result can be found in Annex II. 12 We also considered arrears of duration longer than three months, but this included few additional observations compared to the protracted arrears cases and did not yield additional findings. We consider arrears longer than one week to exclude very short-term arrears that occurred mainly due to technical problems.

17
after the first year of occurrence of protracted arrears up to their clearance date as missing observations and all other cases as zero. This is motivated by the following. Just like the previous literature, we pool our data to estimate our models. In a pooled regression each country-year observation of the explanatory variables must be treated as independent from each other. That is not necessarily so, as demonstrated by Aylward and Thorne (1998) who discovered that being in arrears (of at least three months) in the previous year is the strongest determinant of being in arrears the next year. In cases when arrears lasted for several years, an analysis including subsequent years of arrears would confound determinants of entry into arrears with subsequent state dependency.13 Noting that, we hypothesize that there might be something special about the first instance of each arrears spell as it is not preceded by a state of being in arrears. We attempt to identify the determinants of that first instance of arrears since if we can understand what causes it we may be able to avert it. It is worth noting that this strategy only restricts the country-year observations for protracted arrears as our temporal unit is a year and only protracted arrears last more than one year; all other arrears instances are resolved within a year of their occurrence.
Data and Methodological Issues
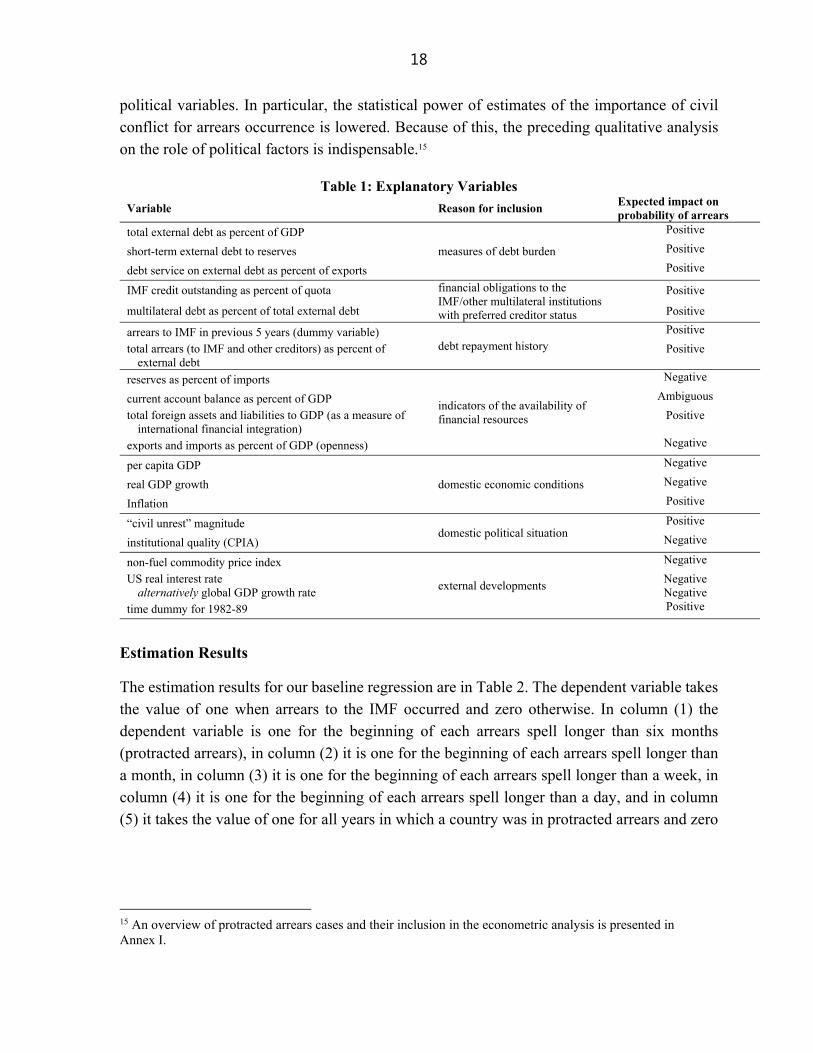
Based on the discussion in sections III. and IV.A. above (and in line with the literature), we select explanatory variables across seven categories as reported in Table 1.14 Our dataset includes all countries with credit outstanding to the IMF in a given year i.e., 3,354 country-year observations over 1974-2014. This includes 142 different countries of which 114 countries have experienced short-term or protracted arrears, many of them repeatedly.
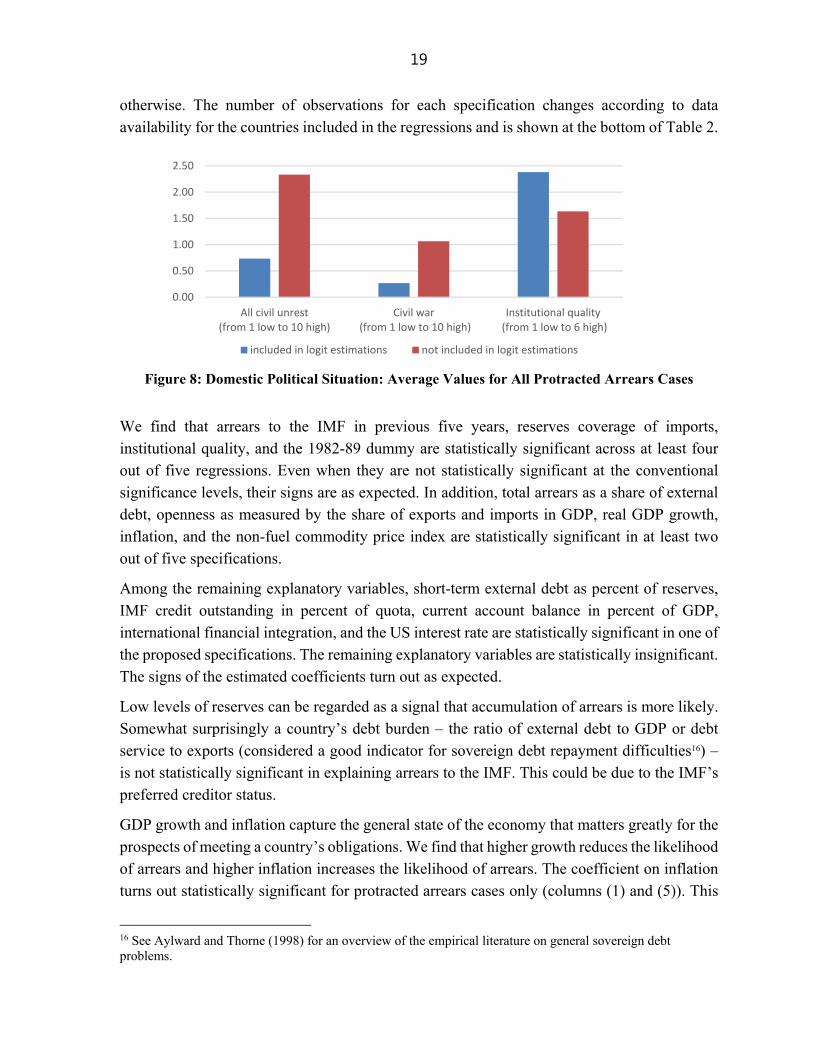
The incompleteness of either country or variable coverage results in exclusion of some countries with protracted arrears from our regressions. This issue concerns mostly countries where arrears were triggered by political problems (see Section IV.A above). Figure 8 shows that countries excluded due to incomplete data coverage on average experienced more civil conflict and had on average worse institutional quality at the time of arrears occurrence. The exclusion of these countries from the data set is not random and could therefore lead to biased estimates, with the estimated coefficients most likely a lower bound of the impact of the
13 Nevertheless, for completeness, in Table 2 column (5) we also show results in which our dependent variable takes the value one for all years in which a country was in protracted arrears. 14 We also considered other specifications, e.g., including IMF credit outstanding percent of exports or IMF credit outstanding percent of reserves; results turned out similar. Indicators on government fiscal positions could not be included due to data limitations. The CPIA index is only available from 2005 onwards. Since institutional quality is a slow-moving variable, we impute the 2005 value for all years considered. The time dummy controls for effects of the 1980s debt crisis (usually dated to 1982-89). It has been argued (cf. Aylward and Thorne 1998) that the debt crisis could have lowered the cost of occurring arrears to the IMF, e.g., because the loss of international reputation would have been smaller as more countries experienced repayment problems, or because creditor’s capital flows were already diminished and further negative implications limited.
(continued…)
18
political variables. In particular, the statistical power of estimates of the importance of civil conflict for arrears occurrence is lowered. Because of this, the preceding qualitative analysis on the role of political factors is indispensable.15
Table 1: Explanatory Variables
Variable Reason for inclusion Expected impact on probability of arrears
total external debt as percent of GDP
measures of debt burden
Positive
short-term external debt to reserves Positive
debt service on external debt as percent of exports Positive
IMF credit outstanding as percent of quota financial obligations to the IMF/other multilateral institutions with preferred creditor status
Positive
multilateral debt as percent of total external debt Positive
arrears to IMF in previous 5 years (dummy variable) debt repayment history
Positive
total arrears (to IMF and other creditors) as percent of external debt
Positive
reserves as percent of imports
indicators of the availability of financial resources
Negative
current account balance as percent of GDP Ambiguous
total foreign assets and liabilities to GDP (as a measure of international financial integration)
Positive
exports and imports as percent of GDP (openness) Negative
per capita GDP
domestic economic conditions
Negative
real GDP growth Negative
Inflation Positive
“civil unrest” magnitude domestic political situation
Positive
institutional quality (CPIA) Negative
non-fuel commodity price index
external developments
Negative
US real interest rate alternatively global GDP growth rate
Negative Negative
time dummy for 1982-89 Positive
Estimation Results
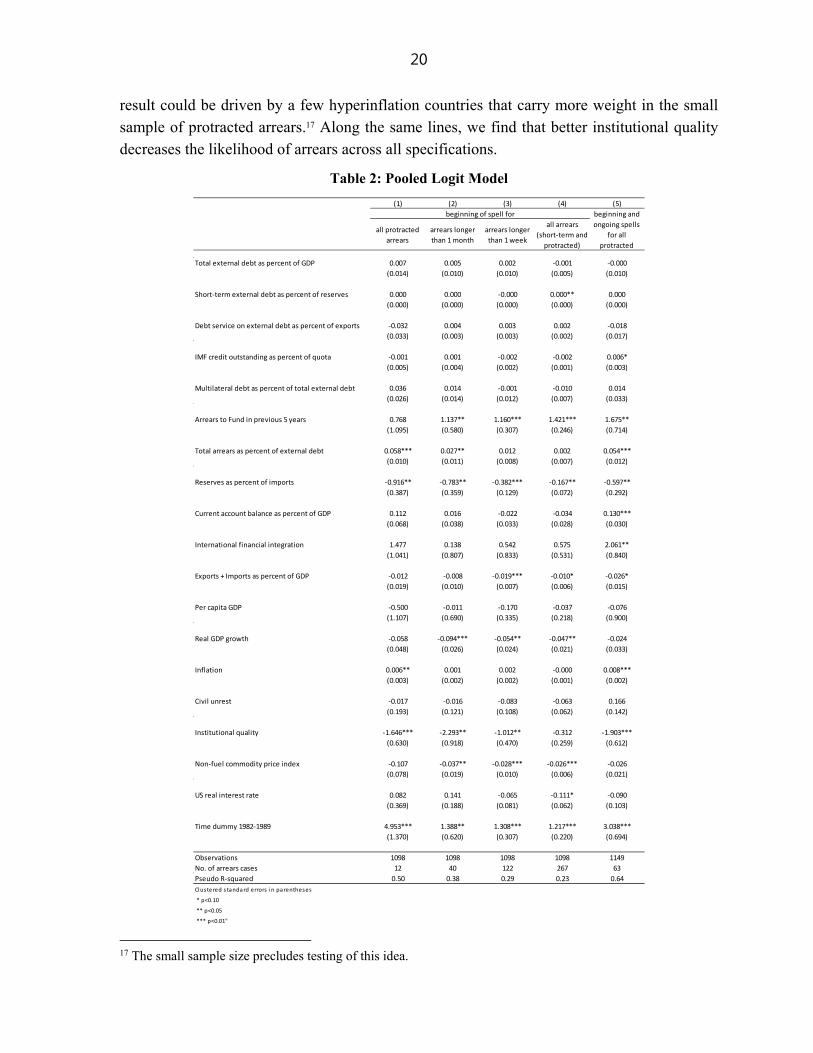
The estimation results for our baseline regression are in Table 2. The dependent variable takes the value of one when arrears to the IMF occurred and zero otherwise. In column (1) the dependent variable is one for the beginning of each arrears spell longer than six months (protracted arrears), in column (2) it is one for the beginning of each arrears spell longer than a month, in column (3) it is one for the beginning of each arrears spell longer than a week, in column (4) it is one for the beginning of each arrears spell longer than a day, and in column (5) it takes the value of one for all years in which a country was in protracted arrears and zero
15 An overview of protracted arrears cases and their inclusion in the econometric analysis is presented in Annex I.
19
otherwise. The number of observations for each specification changes according to data availability for the countries included in the regressions and is shown at the bottom of Table 2.
Figure 8: Domestic Political Situation: Average Values for All Protracted Arrears Cases
We find that arrears to the IMF in previous five years, reserves coverage of imports, institutional quality, and the 1982-89 dummy are statistically significant across at least four out of five regressions. Even when they are not statistically significant at the conventional significance levels, their signs are as expected. In addition, total arrears as a share of external debt, openness as measured by the share of exports and imports in GDP, real GDP growth, inflation, and the non-fuel commodity price index are statistically significant in at least two out of five specifications.
Among the remaining explanatory variables, short-term external debt as percent of reserves, IMF credit outstanding in percent of quota, current account balance in percent of GDP, international financial integration, and the US interest rate are statistically significant in one of the proposed specifications. The remaining explanatory variables are statistically insignificant. The signs of the estimated coefficients turn out as expected.
Low levels of reserves can be regarded as a signal that accumulation of arrears is more likely. Somewhat surprisingly a country’s debt burden – the ratio of external debt to GDP or debt service to exports (considered a good indicator for sovereign debt repayment difficulties16) – is not statistically significant in explaining arrears to the IMF. This could be due to the IMF’s preferred creditor status.
GDP growth and inflation capture the general state of the economy that matters greatly for the prospects of meeting a country’s obligations. We find that higher growth reduces the likelihood of arrears and higher inflation increases the likelihood of arrears. The coefficient on inflation turns out statistically significant for protracted arrears cases only (columns (1) and (5)). This
16 See Aylward and Thorne (1998) for an overview of the empirical literature on general sovereign debt problems.
0.00
0.50
1.00
1.50
2.00
2.50
All civil unrest(from 1 low to 10 high)
Civil war (from 1 low to 10 high)
Institutional quality (from 1 low to 6 high)
included in logit estimations not included in logit estimations
20
result could be driven by a few hyperinflation countries that carry more weight in the small sample of protracted arrears.17 Along the same lines, we find that better institutional quality decreases the likelihood of arrears across all specifications.
Table 2: Pooled Logit Model
17 The small sample size precludes testing of this idea.
(1) (2) (3) (4) (5)
all protracted
arrears
arrears longer
than 1 month
arrears longer
than 1 week
all arrears
(short-term and
protracted)
Total external debt as percent of GDP 0.007 0.005 0.002 -0.001 -0.000
(0.014) (0.010) (0.010) (0.005) (0.010)
Short-term external debt as percent of reserves 0.000 0.000 -0.000 0.000** 0.000
(0.000) (0.000) (0.000) (0.000) (0.000)
Debt service on external debt as percent of exports -0.032 0.004 0.003 0.002 -0.018
(0.033) (0.003) (0.003) (0.002) (0.017)
IMF credit outstanding as percent of quota -0.001 0.001 -0.002 -0.002 0.006*
(0.005) (0.004) (0.002) (0.001) (0.003)
Multilateral debt as percent of total external debt 0.036 0.014 -0.001 -0.010 0.014
(0.026) (0.014) (0.012) (0.007) (0.033)
Arrears to Fund in previous 5 years 0.768 1.137** 1.160*** 1.421*** 1.675**
(1.095) (0.580) (0.307) (0.246) (0.714)
Total arrears as percent of external debt 0.058*** 0.027** 0.012 0.002 0.054***
(0.010) (0.011) (0.008) (0.007) (0.012)
Reserves as percent of imports -0.916** -0.783** -0.382*** -0.167** -0.597**
(0.387) (0.359) (0.129) (0.072) (0.292)
Current account balance as percent of GDP 0.112 0.016 -0.022 -0.034 0.130***
(0.068) (0.038) (0.033) (0.028) (0.030)
International financial integration 1.477 0.138 0.542 0.575 2.061**
(1.041) (0.807) (0.833) (0.531) (0.840)
Exports + Imports as percent of GDP -0.012 -0.008 -0.019*** -0.010* -0.026*
(0.019) (0.010) (0.007) (0.006) (0.015)
Per capita GDP -0.500 -0.011 -0.170 -0.037 -0.076
(1.107) (0.690) (0.335) (0.218) (0.900)
Real GDP growth -0.058 -0.094*** -0.054** -0.047** -0.024
(0.048) (0.026) (0.024) (0.021) (0.033)
Inflation 0.006** 0.001 0.002 -0.000 0.008***
(0.003) (0.002) (0.002) (0.001) (0.002)
Civil unrest -0.017 -0.016 -0.083 -0.063 0.166
(0.193) (0.121) (0.108) (0.062) (0.142)
Institutional quality -1.646*** -2.293** -1.012** -0.312 -1.903***
(0.630) (0.918) (0.470) (0.259) (0.612)
Non-fuel commodity price index -0.107 -0.037** -0.028*** -0.026*** -0.026
(0.078) (0.019) (0.010) (0.006) (0.021)
US real interest rate 0.082 0.141 -0.065 -0.111* -0.090
(0.369) (0.188) (0.081) (0.062) (0.103)
Time dummy 1982-1989 4.953*** 1.388** 1.308*** 1.217*** 3.038***
(1.370) (0.620) (0.307) (0.220) (0.694)
Observations 1098 1098 1098 1098 1149
No. of arrears cases 12 40 122 267 63
Pseudo R-squared 0.50 0.38 0.29 0.23 0.64
Clustered standard errors in parentheses
* p<0.10
** p<0.05
*** p<0.01"
beginning of spell for beginning and
ongoing spells
for all
protracted
21
Somewhat surprisingly, the measure of a country’s political environment (civil unrest) is not statistically significant. As noted above, that is most likely due to data limitations and should not be interpreted as suggesting that political developments do not matter for arrears occurrence. As shown in Section IV.A above, a historical narrative suggests a link between a majority of arrears cases and political developments.
Previous arrears to the IMF (short-term and protracted) increase the likelihood of arrears occurrence as shown also by Aylward and Thorne (1998). This may capture the fact that repeat offenders feel less shame about incurring short-term arrears repeatedly. This is in line with the more recent findings of Reinhart and Rogoff (2008) that for sovereign debt crises those who previously defaulted are more likely to default again in the future.
Based on the results in Table 2 we conclude that a country with a history of arrears to the IMF, higher total arrears burden, lower international reserves, higher inflation, lower GDP growth, lower institutional quality, and facing weak non-fuel commodity prices would be more likely to accumulate arrears to the IMF than its opposite. In addition, the arrears occurrence would have been more likely during 1982-89 than at any other time.
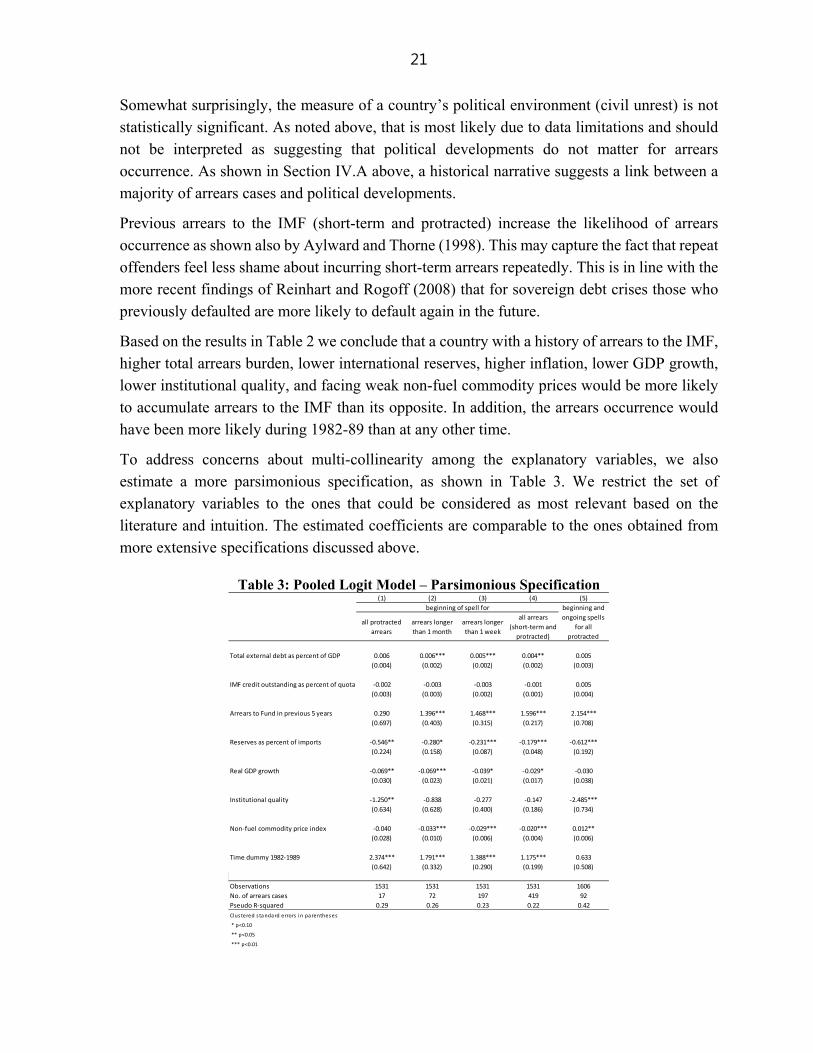
To address concerns about multi-collinearity among the explanatory variables, we also estimate a more parsimonious specification, as shown in Table 3. We restrict the set of explanatory variables to the ones that could be considered as most relevant based on the literature and intuition. The estimated coefficients are comparable to the ones obtained from more extensive specifications discussed above.
Table 3: Pooled Logit Model – Parsimonious Specification
(1) (2) (3) (4) (5)
all protracted
arrears
arrears longer
than 1 month
arrears longer
than 1 week
all arrears
(short-term and
protracted)
Total external debt as percent of GDP 0.006 0.006*** 0.005*** 0.004** 0.005
(0.004) (0.002) (0.002) (0.002) (0.003)
IMF credit outstanding as percent of quota -0.002 -0.003 -0.003 -0.001 0.005
(0.003) (0.003) (0.002) (0.001) (0.004)
Arrears to Fund in previous 5 years 0.290 1.396*** 1.468*** 1.596*** 2.154***
(0.697) (0.403) (0.315) (0.217) (0.708)
Reserves as percent of imports -0.546** -0.280* -0.231*** -0.179*** -0.612***
(0.224) (0.158) (0.087) (0.048) (0.192)
Real GDP growth -0.069** -0.069*** -0.039* -0.029* -0.030
(0.030) (0.023) (0.021) (0.017) (0.038)
Institutional quality -1.250** -0.838 -0.277 -0.147 -2.485***
(0.634) (0.628) (0.400) (0.186) (0.734)
Non-fuel commodity price index -0.040 -0.033*** -0.029*** -0.020*** 0.012**
(0.028) (0.010) (0.006) (0.004) (0.006)
Time dummy 1982-1989 2.374*** 1.791*** 1.388*** 1.175*** 0.633
(0.642) (0.332) (0.290) (0.199) (0.508)
Observations 1531 1531 1531 1531 1606
No. of arrears cases 17 72 197 419 92
Pseudo R-squared 0.29 0.26 0.23 0.22 0.42
Clus tered s ta ndard errors in pa rentheses
* p<0.10
** p<0.05
*** p<0.01
beginning of spell for beginning and
ongoing spells
for all
protracted
22
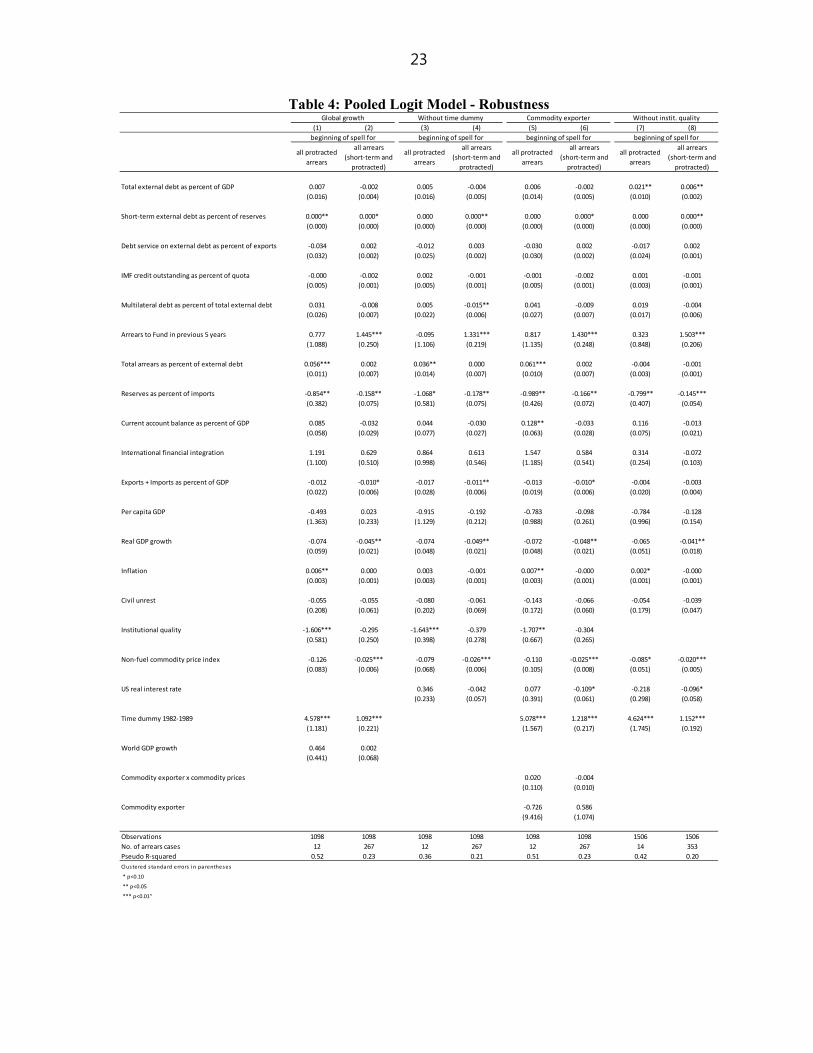
Robustness
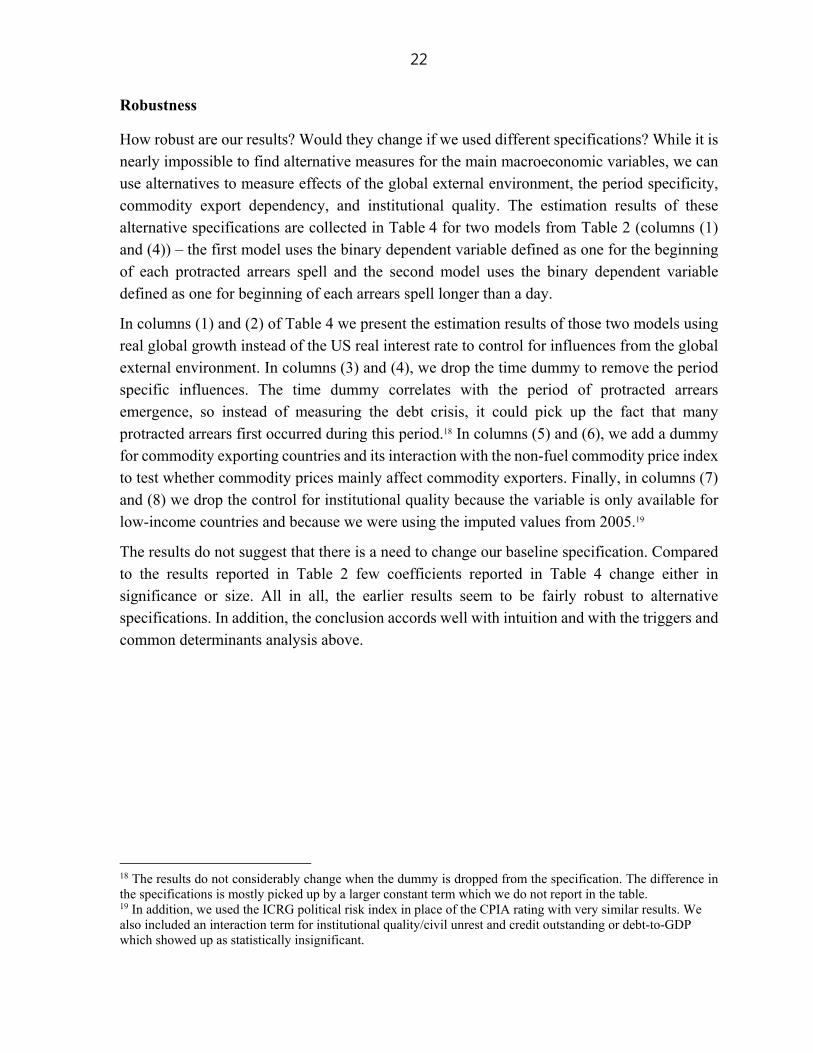
How robust are our results? Would they change if we used different specifications? While it is nearly impossible to find alternative measures for the main macroeconomic variables, we can use alternatives to measure effects of the global external environment, the period specificity, commodity export dependency, and institutional quality. The estimation results of these alternative specifications are collected in Table 4 for two models from Table 2 (columns (1) and (4)) – the first model uses the binary dependent variable defined as one for the beginning of each protracted arrears spell and the second model uses the binary dependent variable defined as one for beginning of each arrears spell longer than a day.
In columns (1) and (2) of Table 4 we present the estimation results of those two models using real global growth instead of the US real interest rate to control for influences from the global external environment. In columns (3) and (4), we drop the time dummy to remove the period specific influences. The time dummy correlates with the period of protracted arrears emergence, so instead of measuring the debt crisis, it could pick up the fact that many protracted arrears first occurred during this period.18 In columns (5) and (6), we add a dummy for commodity exporting countries and its interaction with the non-fuel commodity price index to test whether commodity prices mainly affect commodity exporters. Finally, in columns (7) and (8) we drop the control for institutional quality because the variable is only available for low-income countries and because we were using the imputed values from 2005.19
The results do not suggest that there is a need to change our baseline specification. Compared to the results reported in Table 2 few coefficients reported in Table 4 change either in significance or size. All in all, the earlier results seem to be fairly robust to alternative specifications. In addition, the conclusion accords well with intuition and with the triggers and common determinants analysis above.
18 The results do not considerably change when the dummy is dropped from the specification. The difference in the specifications is mostly picked up by a larger constant term which we do not report in the table. 19 In addition, we used the ICRG political risk index in place of the CPIA rating with very similar results. We also included an interaction term for institutional quality/civil unrest and credit outstanding or debt-to-GDP which showed up as statistically insignificant.
23
Table 4: Pooled Logit Model - Robustness
(1) (2) (3) (4) (5) (6) (7) (8)
all protracted
arrears
all arrears
(short-term and
protracted)
all protracted
arrears
all arrears
(short-term and
protracted)
all protracted
arrears
all arrears
(short-term and
protracted)
all protracted
arrears
all arrears
(short-term and
protracted)
Total external debt as percent of GDP 0.007 -0.002 0.005 -0.004 0.006 -0.002 0.021** 0.006**
(0.016) (0.004) (0.016) (0.005) (0.014) (0.005) (0.010) (0.002)
Short-term external debt as percent of reserves 0.000** 0.000* 0.000 0.000** 0.000 0.000* 0.000 0.000**
(0.000) (0.000) (0.000) (0.000) (0.000) (0.000) (0.000) (0.000)
Debt service on external debt as percent of exports -0.034 0.002 -0.012 0.003 -0.030 0.002 -0.017 0.002
(0.032) (0.002) (0.025) (0.002) (0.030) (0.002) (0.024) (0.001)
IMF credit outstanding as percent of quota -0.000 -0.002 0.002 -0.001 -0.001 -0.002 0.001 -0.001
(0.005) (0.001) (0.005) (0.001) (0.005) (0.001) (0.003) (0.001)
Multilateral debt as percent of total external debt 0.031 -0.008 0.005 -0.015** 0.041 -0.009 0.019 -0.004
(0.026) (0.007) (0.022) (0.006) (0.027) (0.007) (0.017) (0.006)
Arrears to Fund in previous 5 years 0.777 1.445*** -0.095 1.331*** 0.817 1.430*** 0.323 1.503***
(1.088) (0.250) (1.106) (0.219) (1.135) (0.248) (0.848) (0.206)
Total arrears as percent of external debt 0.056*** 0.002 0.036** 0.000 0.061*** 0.002 -0.004 -0.001
(0.011) (0.007) (0.014) (0.007) (0.010) (0.007) (0.003) (0.001)
Reserves as percent of imports -0.854** -0.158** -1.068* -0.178** -0.989** -0.166** -0.799** -0.145***
(0.382) (0.075) (0.581) (0.075) (0.426) (0.072) (0.407) (0.054)
Current account balance as percent of GDP 0.085 -0.032 0.044 -0.030 0.128** -0.033 0.116 -0.013
(0.058) (0.029) (0.077) (0.027) (0.063) (0.028) (0.075) (0.021)
International financial integration 1.191 0.629 0.864 0.613 1.547 0.584 0.314 -0.072
(1.100) (0.510) (0.998) (0.546) (1.185) (0.541) (0.254) (0.103)
Exports + Imports as percent of GDP -0.012 -0.010* -0.017 -0.011** -0.013 -0.010* -0.004 -0.003
(0.022) (0.006) (0.028) (0.006) (0.019) (0.006) (0.020) (0.004)
Per capita GDP -0.493 0.023 -0.915 -0.192 -0.783 -0.098 -0.784 -0.128
(1.363) (0.233) (1.129) (0.212) (0.988) (0.261) (0.996) (0.154)
Real GDP growth -0.074 -0.045** -0.074 -0.049** -0.072 -0.048** -0.065 -0.041**
(0.059) (0.021) (0.048) (0.021) (0.048) (0.021) (0.051) (0.018)
Inflation 0.006** 0.000 0.003 -0.001 0.007** -0.000 0.002* -0.000
(0.003) (0.001) (0.003) (0.001) (0.003) (0.001) (0.001) (0.001)
Civil unrest -0.055 -0.055 -0.080 -0.061 -0.143 -0.066 -0.054 -0.039
(0.208) (0.061) (0.202) (0.069) (0.172) (0.060) (0.179) (0.047)
Institutional quality -1.606*** -0.295 -1.643*** -0.379 -1.707** -0.304
(0.581) (0.250) (0.398) (0.278) (0.667) (0.265)
Non-fuel commodity price index -0.126 -0.025*** -0.079 -0.026*** -0.110 -0.025*** -0.085* -0.020***
(0.083) (0.006) (0.068) (0.006) (0.105) (0.008) (0.051) (0.005)
US real interest rate 0.346 -0.042 0.077 -0.109* -0.218 -0.096*
(0.233) (0.057) (0.391) (0.061) (0.298) (0.058)
Time dummy 1982-1989 4.578*** 1.092*** 5.078*** 1.218*** 4.624*** 1.152***
(1.181) (0.221) (1.567) (0.217) (1.745) (0.192)
World GDP growth 0.464 0.002
(0.441) (0.068)
Commodity exporter x commodity prices 0.020 -0.004
(0.110) (0.010)
Commodity exporter -0.726 0.586
(9.416) (1.074)
Observations 1098 1098 1098 1098 1098 1098 1506 1506
No. of arrears cases 12 267 12 267 12 267 14 353
Pseudo R-squared 0.52 0.23 0.36 0.21 0.51 0.23 0.42 0.20
Clustered s ta ndard errors in parentheses
* p<0.10
** p<0.05
*** p<0.01"
Global growth Without time dummy Commodity exporter Without instit. quality
beginning of spell for beginning of spell for beginning of spell for beginning of spell for
24
Predicting Protracted Arrears
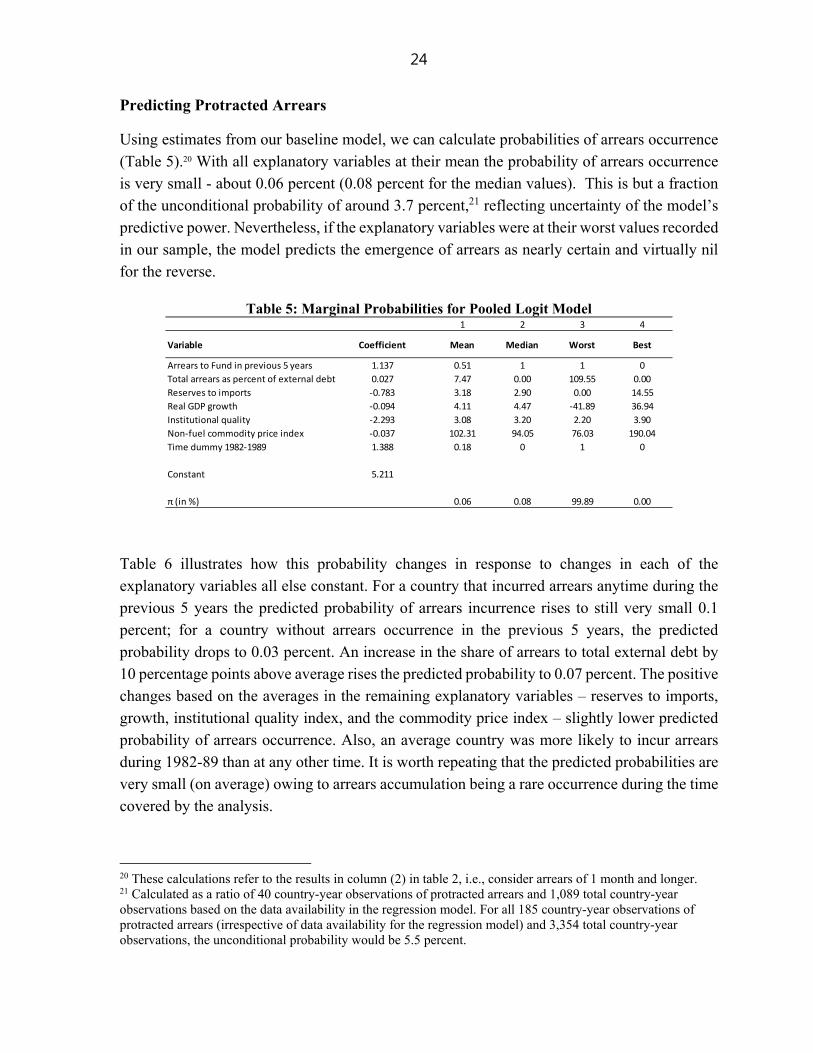
Using estimates from our baseline model, we can calculate probabilities of arrears occurrence (Table 5).20 With all explanatory variables at their mean the probability of arrears occurrence is very small - about 0.06 percent (0.08 percent for the median values). This is but a fraction of the unconditional probability of around 3.7 percent,21 reflecting uncertainty of the model’s predictive power. Nevertheless, if the explanatory variables were at their worst values recorded in our sample, the model predicts the emergence of arrears as nearly certain and virtually nil for the reverse.
Table 5: Marginal Probabilities for Pooled Logit Model
Table 6 illustrates how this probability changes in response to changes in each of the explanatory variables all else constant. For a country that incurred arrears anytime during the previous 5 years the predicted probability of arrears incurrence rises to still very small 0.1 percent; for a country without arrears occurrence in the previous 5 years, the predicted probability drops to 0.03 percent. An increase in the share of arrears to total external debt by 10 percentage points above average rises the predicted probability to 0.07 percent. The positive changes based on the averages in the remaining explanatory variables – reserves to imports, growth, institutional quality index, and the commodity price index – slightly lower predicted probability of arrears occurrence. Also, an average country was more likely to incur arrears during 1982-89 than at any other time. It is worth repeating that the predicted probabilities are very small (on average) owing to arrears accumulation being a rare occurrence during the time covered by the analysis.
20 These calculations refer to the results in column (2) in table 2, i.e., consider arrears of 1 month and longer. 21 Calculated as a ratio of 40 country-year observations of protracted arrears and 1,089 total country-year observations based on the data availability in the regression model. For all 185 country-year observations of protracted arrears (irrespective of data availability for the regression model) and 3,354 total country-year observations, the unconditional probability would be 5.5 percent.
1 2 3 4
Variable Coefficient Mean Median Worst Best
Arrears to Fund in previous 5 years 1.137 0.51 1 1 0
Total arrears as percent of external debt 0.027 7.47 0.00 109.55 0.00
Reserves to imports -0.783 3.18 2.90 0.00 14.55
Real GDP growth -0.094 4.11 4.47 -41.89 36.94
Institutional quality -2.293 3.08 3.20 2.20 3.90
Non-fuel commodity price index -0.037 102.31 94.05 76.03 190.04
Time dummy 1982-1989 1.388 0.18 0 1 0
Constant 5.211
π (in %) 0.06 0.08 99.89 0.00
25
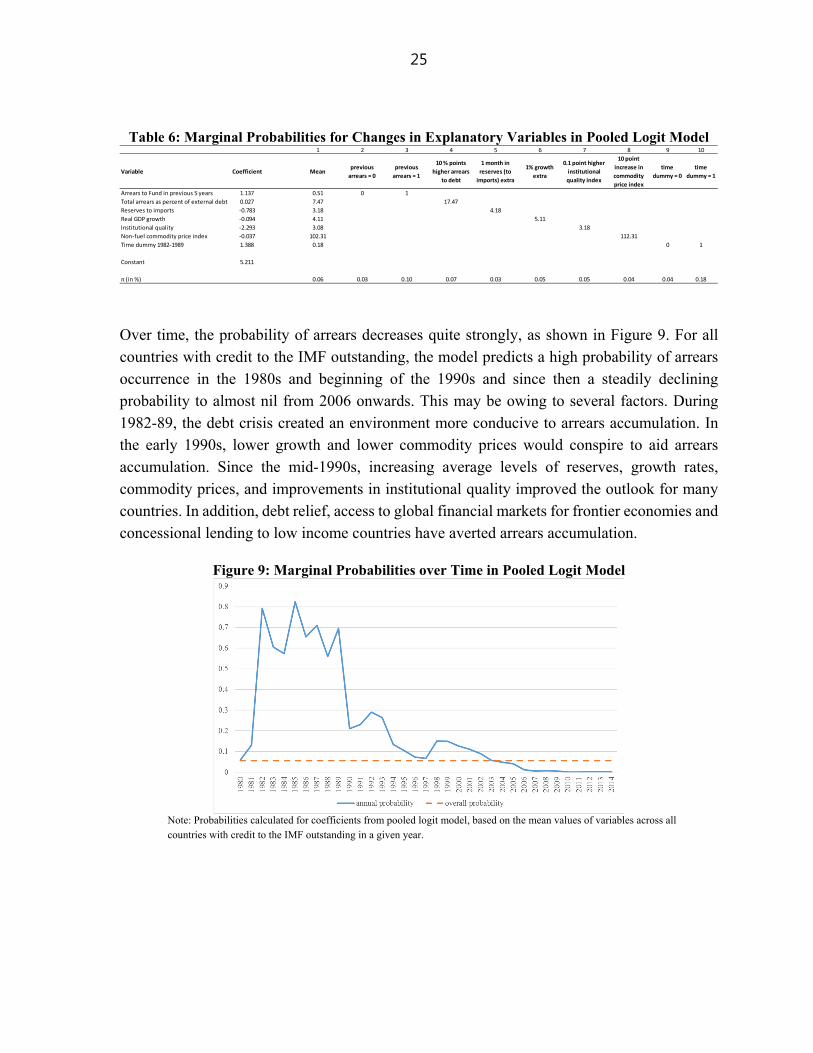
Table 6: Marginal Probabilities for Changes in Explanatory Variables in Pooled Logit Model
Over time, the probability of arrears decreases quite strongly, as shown in Figure 9. For all countries with credit to the IMF outstanding, the model predicts a high probability of arrears occurrence in the 1980s and beginning of the 1990s and since then a steadily declining probability to almost nil from 2006 onwards. This may be owing to several factors. During 1982-89, the debt crisis created an environment more conducive to arrears accumulation. In the early 1990s, lower growth and lower commodity prices would conspire to aid arrears accumulation. Since the mid-1990s, increasing average levels of reserves, growth rates, commodity prices, and improvements in institutional quality improved the outlook for many countries. In addition, debt relief, access to global financial markets for frontier economies and concessional lending to low income countries have averted arrears accumulation.
Figure 9: Marginal Probabilities over Time in Pooled Logit Model
Note: Probabilities calculated for coefficients from pooled logit model, based on the mean values of variables across all countries with credit to the IMF outstanding in a given year.
1 2 3 4 5 6 7 8 9 10
Variable Coefficient Meanprevious
arrears = 0
previous
arrears = 1
10 % points
higher arrears
to debt
1 month in
reserves (to
imports) extra
1% growth
extra
0.1 point higher
institutional
quality index
10 point
increase in
commodity
price index
time
dummy = 0
time
dummy = 1
Arrears to Fund in previous 5 years 1.137 0.51 0 1
Total arrears as percent of external debt 0.027 7.47 17.47
Reserves to imports -0.783 3.18 4.18
Real GDP growth -0.094 4.11 5.11
Institutional quality -2.293 3.08 3.18
Non-fuel commodity price index -0.037 102.31 112.31
Time dummy 1982-1989 1.388 0.18 0 1
Constant 5.211
π (in %) 0.06 0.03 0.10 0.07 0.03 0.05 0.05 0.04 0.04 0.18
26
V. DURATION ANALYSIS
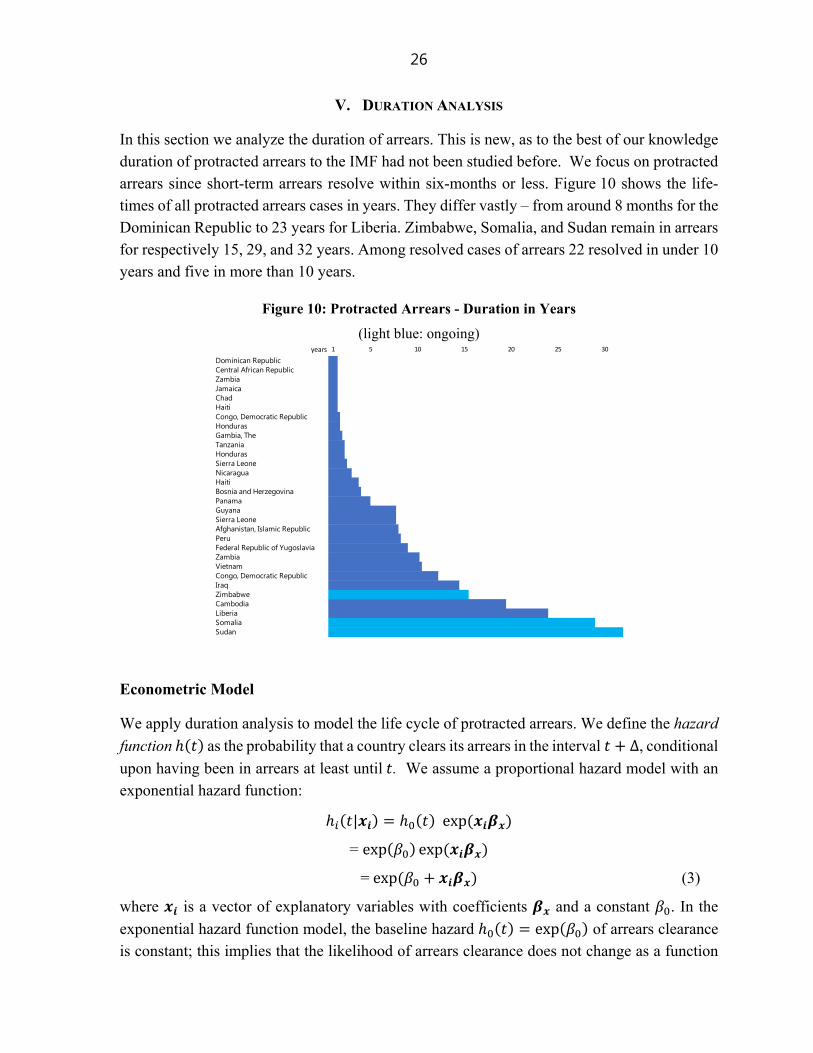
In this section we analyze the duration of arrears. This is new, as to the best of our knowledge duration of protracted arrears to the IMF had not been studied before. We focus on protracted arrears since short-term arrears resolve within six-months or less. Figure 10 shows the life-times of all protracted arrears cases in years. They differ vastly – from around 8 months for the Dominican Republic to 23 years for Liberia. Zimbabwe, Somalia, and Sudan remain in arrears for respectively 15, 29, and 32 years. Among resolved cases of arrears 22 resolved in under 10 years and five in more than 10 years.
Figure 10: Protracted Arrears - Duration in Years
(light blue: ongoing)
Econometric Model
We apply duration analysis to model the life cycle of protracted arrears. We define the hazard
function as the probability that a country clears its arrears in the interval ∆, conditional
upon having been in arrears at least until . We assume a proportional hazard model with an exponential hazard function:
| exp
= exp exp
=exp (3)
where is a vector of explanatory variables with coefficients and a constant . In the
exponential hazard function model, the baseline hazard exp of arrears clearance is constant; this implies that the likelihood of arrears clearance does not change as a function
years
Dominican RepublicCentral African RepublicZambiaJamaicaChadHaitiCongo, Democratic Republic HondurasGambia, TheTanzaniaHondurasSierra LeoneNicaraguaHaitiBosnia and HerzegovinaPanamaGuyanaSierra LeoneAfghanistan, Islamic RepublicPeruFederal Republic of YugoslaviaZambiaVietnamCongo, Democratic Republic IraqZimbabweCambodiaLiberiaSomaliaSudan
25 302015101 5
27
of time. The likelihood (or hazard) can change over time only owing to changes in , i.e., to changes in variables that affect resolution of arrears.22
Choice of Explanatory Variables
We chose as explanatory variables those that illustrate, in line with intuition, that each resolved arrears case required some combination of reversal of bad fortunes, improved economic performance, establishment of a record of cooperation on policies and payments with the IMF, and political and financial support by advanced IMF members.23 The longer those are lacking the longer would a country remain in arrears. Hence, we include as explanatory variables IMF credit outstanding to quota, real GDP growth, episodes of civil unrest, and the percentage share of exports to advanced economies to total exports.24 Outstanding IMF credit to quota is included as relatively higher credit would indicate relatively worse fortunes more difficult to reverse. Also, a larger credit would be more difficult to repay and a decreasing path of credit outstanding serves as a signal that authorities are advancing cooperation on policies and payments with the IMF. Real GDP growth captures the improvements in economic performance and strong growth should make it easier to move towards arrears clearance. The inclusion of a civil unrest measure in a country accounts for the importance of political developments as discussed above. Finally, the relative amount of trade with advanced economies serves as a proxy for the support by advanced IMF members to a country in arrears.25
Estimation Results
We begin with standard non-parametric survival analysis results based on unconditional
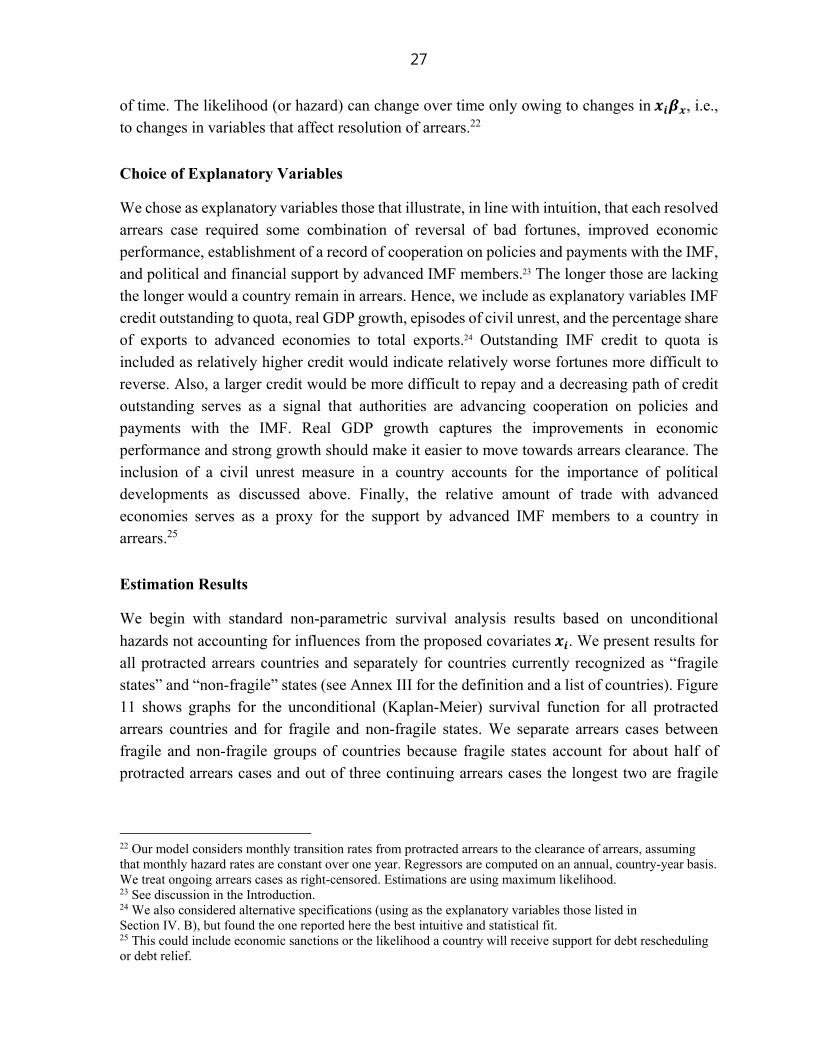
hazards not accounting for influences from the proposed covariates . We present results for all protracted arrears countries and separately for countries currently recognized as “fragile states” and “non-fragile” states (see Annex III for the definition and a list of countries). Figure 11 shows graphs for the unconditional (Kaplan-Meier) survival function for all protracted arrears countries and for fragile and non-fragile states. We separate arrears cases between fragile and non-fragile groups of countries because fragile states account for about half of protracted arrears cases and out of three continuing arrears cases the longest two are fragile
22 Our model considers monthly transition rates from protracted arrears to the clearance of arrears, assuming that monthly hazard rates are constant over one year. Regressors are computed on an annual, country-year basis. We treat ongoing arrears cases as right-censored. Estimations are using maximum likelihood. 23 See discussion in the Introduction. 24 We also considered alternative specifications (using as the explanatory variables those listed in Section IV. B), but found the one reported here the best intuitive and statistical fit. 25 This could include economic sanctions or the likelihood a country will receive support for debt rescheduling or debt relief.
28
states. Also, the separation allows us to capture the importance of political factors. We were not able to do that formally before owing to data limitations.
The graph for all protracted arrears countries begins at 1 (or 100 percent probability of remaining in arrears) when all arrears cases begin and are certain to remain (trivially, since we deal with protracted arrears i.e., those that lasted more than six months) in arrears until the next period. Then, the probability of survival as an arrears case for two years drops as cases are cleared and it continues to drop until the longest surviving cases of arrears remain.
The analysis of survival as an arrears case for fragile and non-fragile states reveals some stark differences between the two groups. Past year one, once the arrears cases get established as protracted, the probability of survival as a protracted arrears case for a non-fragile country is much lower than for a fragile country. At about 9 years, the median life-time as a protracted arrears case for fragile states is about twice the median life-time for non-fragile states. The survival rates for fragile states decline at a much slower pace past their median life-time than the survival rates for non-fragile states and are higher. Finally, the non-fragile protracted arrears cases cease after eighteen years while the fragile ones continue past the twenty-year mark with a survival probability of about 25 percent.
Nelson-Aalen cumulative hazard estimates allow us to judge the stability of the hazard rate for the life-time of a protracted arrears case.26 For all arrears cases the Nelson-Aalen estimates suggest a steady exit from arrears until about year five which slows down progressively until about year 23 when only the ongoing cases remain. The Nelson-Aalen estimates for fragile and the non-fragile states mirror the survival function dynamics described above. The hazard rates for the non-fragile states change more rapidly and decline to zero sooner than the hazard rates for the fragile states. For the latter, the cumulative hazard estimates indicate more prolonged arrears hazard that stabilizes at about year 23 as the fragile arrears cases became the longest surviving ones. Below we compare the non-parametric results with the parametric estimates of our duration model.
26 Nelson-Aalen cumulative hazard estimates allow us to determine whether the prospects for exit from arrears are improving, deteriorating, or remaining constant. A straight line approximation for the mapping of the cumulative hazard function would indicate that survival rates remain broadly stable with the steady reduction of arrears cases. A convex line would indicate the relatively accelerated exit from arrears and a concave line the opposite – a slowing exit from arrears.
29
Figure 11: Unconditional Benchmarks
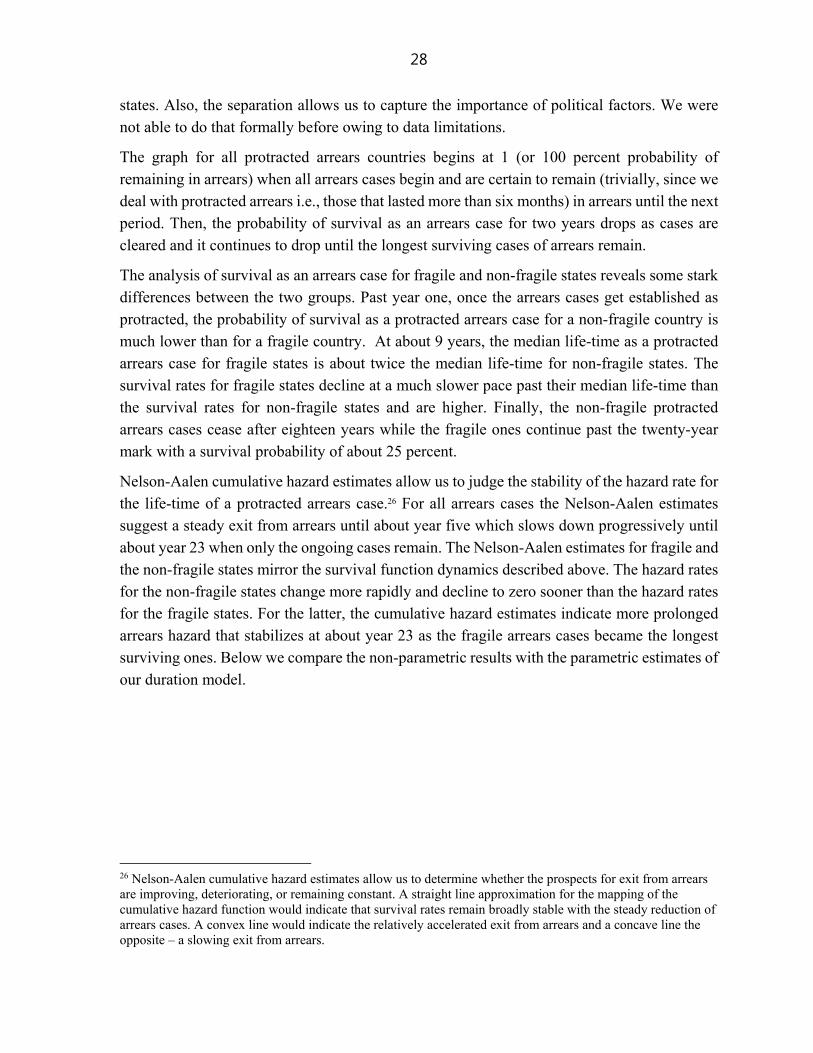
Table 7 includes the estimation results of our (parametric) hazard model including covariates
proposed above. Positive estimated coefficients (i.e., hazard ratios greater than 1) indicate that a one-unit increase in the explanatory variable results in a higher probability that arrears clearance will occur in a given time interval. Negative coefficients (or hazard ratios smaller than 1) indicate that a one-unit increase in the explanatory variable results in a lower probability that arrears clearance will occur in a given time interval. The results accord with the intuition: more IMF credit outstanding and more civil unrest are associated with lower probability of arrears clearance. Higher real GDP growth and a higher export share to advanced economies raise the probability of arrears clearance. As a robustness check we compare the results from the parametric exponential hazard model to the estimated coefficients from the semiparametric Cox model and find both models broadly similar.
0.0
00
.25
0.5
00
.75
1.0
0
0 10 20 30analysis time
Kaplan-Meier survival estimate
0.0
00
.25
0.5
00
.75
1.0
0
0 10 20 30analysis time
non-fragile states fragile states
Kaplan-Meier survival estimates0
.00
0.5
01
.00
1.5
02
.00
0 10 20 30analysis time
Nelson-Aalen cumulative hazard estimate
0.0
01
.00
2.0
03
.00
0 10 20 30analysis time
non-fragile states fragile states
Nelson-Aalen cumulative hazard estimates
30
Table 7: Results Duration Analysis
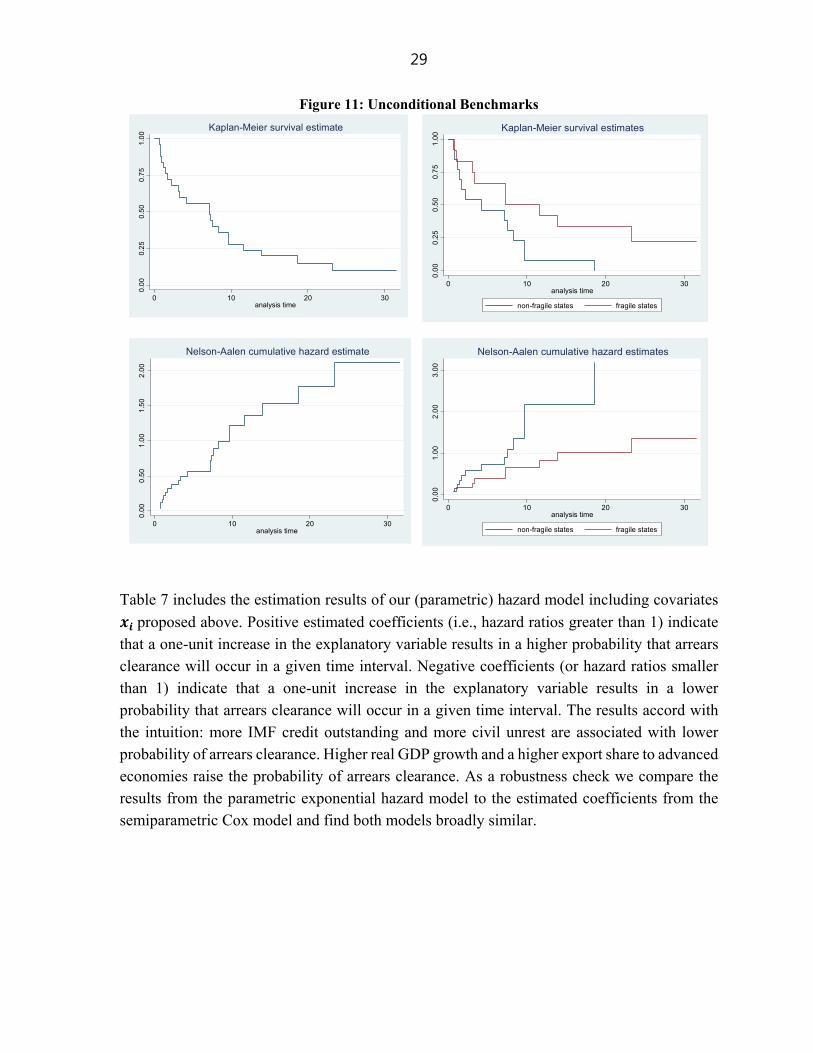
In addition, we estimate the exponential model separately for the groups of fragile states and non-fragile states. Results in Table 8 show that IMF credit outstanding to quota as well as civil unrest are only relevant for arrears duration in fragile countries; the export share to advanced economies on the contrary is significant only in the model for non-fragile states. We can conclude that slightly different forces are at play in fragile states and other countries.
Table 8: Results Duration Analysis by Fragility
Variable
Coefficients Hazard ratio Coefficients Hazard ratio
IMF credit outstanding as percent of quota -0.007** 0.993 -0.005 0.995
(0.003) (0.003)
Real GDP growth 0.062*** 1.064 0.113** 1.119
(0.019) (0.056)
Civil unrest -0.165* 0.848 -0.235* 0.790
(0.074) (0.110)
Share of exports to advanced economies 0.028** 1.028 0.044** 1.045
(0.011) (0.023)
Constant -2.603*** 0.074
(0.977)
Log-likelihood
Number of observations
Robus t s tandard errors in parentheses
* p<0.10
** p<0.05
*** p<0.01"
Exponential model Cox model
-18.61
130
-30.75
130
Variable
Coefficients Hazard ratio Coefficients Hazard ratio
IMF credit outstanding as percent of quota -0.014** 0.986 -0.006 0.994
(0.007) (0.004)
Real GDP growth 0.074*** 1.076 0.067* 1.070
(0.018) (0.040)
Civil unrest -0.277* 0.758 0.033 1.033
(0.111) (0.121)
Share of exports to advanced economies -0.010 0.990 0.068*** 1.070
(0.012) (0.026)
Constant 1.243 3.464 -5.766** 0.003
(3.730) (0.007)
Log-likelihood
Number of observations
Robust s tandard errors in parentheses
* p<0.10
** p<0.05
*** p<0.01"
Fragile states Non-fragile states
-5.17 -9.40
67 63

31
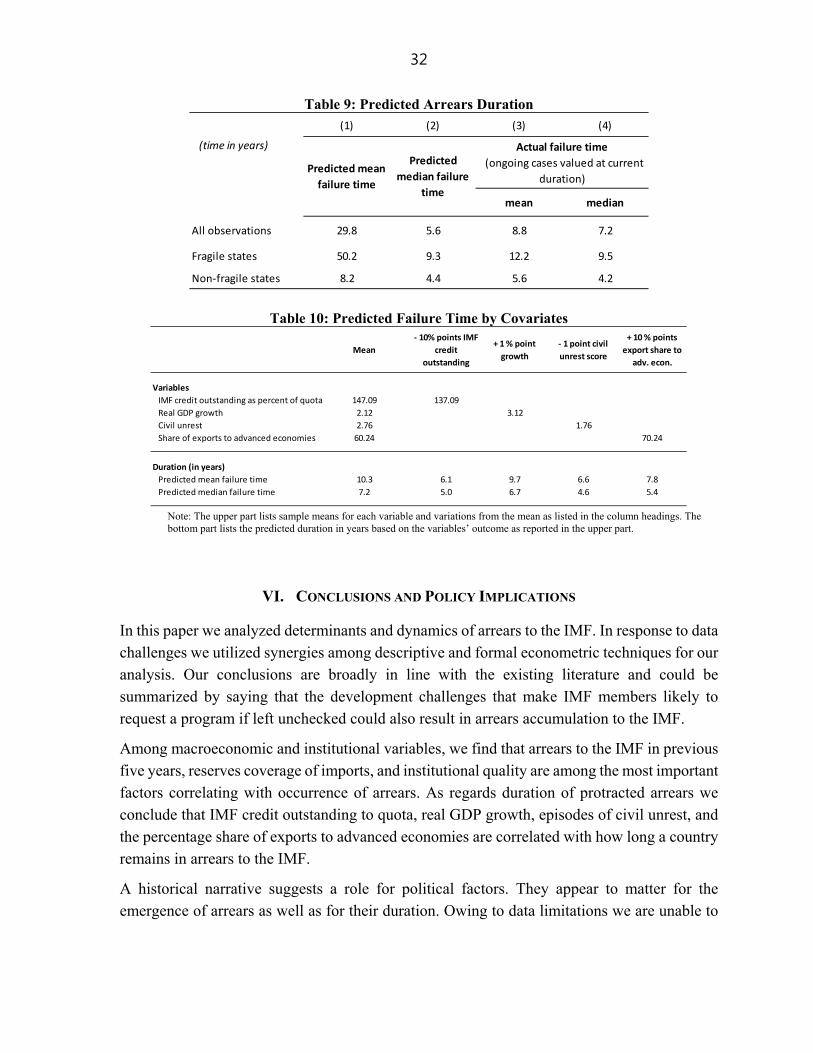
Next, in Table 9 we show the actual and predicted mean and median times to remain in arrears for all arears cases as well as for the fragile and non-fragile cases.27 The predicted survival time is conditional on covariates and varies over countries and with time. The predicted mean and median duration of protracted arrears is much longer for fragile states than they are for non-fragile states as also shown by the Kaplan-Meier survival estimates. The predicted median durations do not deviate far from the actual parameters since the median values do not suffer from outliers. The only noticeable deviation is for the predicted average duration for fragile states which is four time higher than the actual average duration; these results are biased due to inclusion of ongoing cases. For the ongoing arrears cases, the model predicts longer duration of arrears for every time point estimate. The actual average duration is calculated using the observed duration for the three ongoing arrears cases (Somalia 28.5 years, Sudan 31.5 years, and Zimbabwe 14.9 years) – shorter than predicted durations.
In Table 10 we present sensitivity analysis for the estimated mean/median duration of a protracted arrears spell. With all variables at their means the predicted mean (median) duration is about 10 (7) years. With 10 percentage points less IMF credit outstanding or a one point drop in the score for civil unrest, the predicted mean (median) duration drops to 6 (5) years. An extra percentage point of growth has relatively small effects on duration. Finally, a 10 percentage point higher share of exports to advanced economies slightly reduces predicted duration. Large improvements in duration of arrears come from lower accumulation of credit to the IMF and from reduction of civil unrest incidences. This points to two, in retrospect, fairly obvious recommendations for shortening duration of arrears. First, the scrutiny granted to repeat arrangements should increase in line with challenges faced by the borrowing country. Second, once the country finds itself accumulating arrears it should recognize the importance of a peaceful political environment to their clearance. The better it can protect itself from fragility the shorter its predicted time laboring towards arrears clearance. The anecdotal evidence surrounding the arrears clearance path of countries that suffered civil unrest – most recently Liberia – confirms that conclusion.
27 Individual mean values are calculated for each arrears case i at time t using our maximum-likelihood
estimates: | | . Individual median values are the 50th percentile survival in arrears time. is the survival function measuring the probability of staying in arrears beyond time t.
32
Table 9: Predicted Arrears Duration
Table 10: Predicted Failure Time by Covariates
Note: The upper part lists sample means for each variable and variations from the mean as listed in the column headings. The bottom part lists the predicted duration in years based on the variables’ outcome as reported in the upper part.
VI. CONCLUSIONS AND POLICY IMPLICATIONS
In this paper we analyzed determinants and dynamics of arrears to the IMF. In response to data challenges we utilized synergies among descriptive and formal econometric techniques for our analysis. Our conclusions are broadly in line with the existing literature and could be summarized by saying that the development challenges that make IMF members likely to request a program if left unchecked could also result in arrears accumulation to the IMF.
Among macroeconomic and institutional variables, we find that arrears to the IMF in previous five years, reserves coverage of imports, and institutional quality are among the most important factors correlating with occurrence of arrears. As regards duration of protracted arrears we conclude that IMF credit outstanding to quota, real GDP growth, episodes of civil unrest, and the percentage share of exports to advanced economies are correlated with how long a country remains in arrears to the IMF.
A historical narrative suggests a role for political factors. They appear to matter for the emergence of arrears as well as for their duration. Owing to data limitations we are unable to
(1) (2) (3) (4)
(time in years)
mean median
All observations 29.8 5.6 8.8 7.2
Fragile states 50.2 9.3 12.2 9.5
Non-fragile states 8.2 4.4 5.6 4.2
Actual failure time
(ongoing cases valued at current
duration)Predicted mean
failure time
Predicted
median failure
time
Mean
- 10% points IMF
credit
outstanding
+ 1 % point
growth
- 1 point civil
unrest score
+ 10 % points
export share to
adv. econ.
Variables
IMF credit outstanding as percent of quota 147.09 137.09
Real GDP growth 2.12 3.12
Civil unrest 2.76 1.76
Share of exports to advanced economies 60.24 70.24
Duration (in years)
Predicted mean failure time 10.3 6.1 9.7 6.6 7.8
Predicted median failure time 7.2 5.0 6.7 4.6 5.4
33
capture the importance of political factors in a direct and formal way but we consider the descriptive evidence very persuasive.
In terms of policy implications, we believe that the policies and procedures followed by the IMF while approving and reviewing arrangements with members provide a necessary first line of defense against arrears accumulation. These procedures (e.g., access norms and limits, debt sustainability reviews, etc.) aim at assuring prudent use of IMF’s resources. In addition, reviews and analyses of macroeconomic stability and trends attempt to map out their developments and advocate policies and actions to assure stable macroeconomic performance and the institutional adjustments supportive of such performance. Grounded in the presented analysis we would advocate devoting increased attention to repeat arrangements and to political developments. We note however, that any model-based recommendations have to be heavily qualified as the explanatory power of the models is low owing to data and methodological issues discussed earlier in the paper.
As regards duration, in the remaining three protracted arrears cases political developments and the institutional frameworks appear to play an important role. Sudan had been embroiled in conflicts of various intensities since its independence and unable to establish a lasting macroeconomic stability. In addition, a lack of financing assurances from its creditors for debt relief has so far hindered an arrears clearance operation with the IMF. Somalia has only recently re-established institutions recognized as sovereign by the outside world.28 Zimbabwe has been pursuing disruptive macroeconomic policies motivated by a politically driven development agenda that led to it being cut-off from the international community. The evidence presented in this paper suggests that clearance of arrears in all three cases will require a decisive turnaround of political fortunes and a strengthening of the macroeconomic policy framework.
Many issues related to the analysis presented here remain for the future research agenda. Among those are implications of IMF program design and conditionality for the occurrence of arrears, analysis of the magnitude of arrears, as well as analysis of the dynamic interaction among the global/local factors and arrears occurrence.
28 The recognition of Somalia by the international community occurred following the formation of the Federal Government of Somalia (FGS) in August 2012. The IMF recognized the FGS in April 2013.
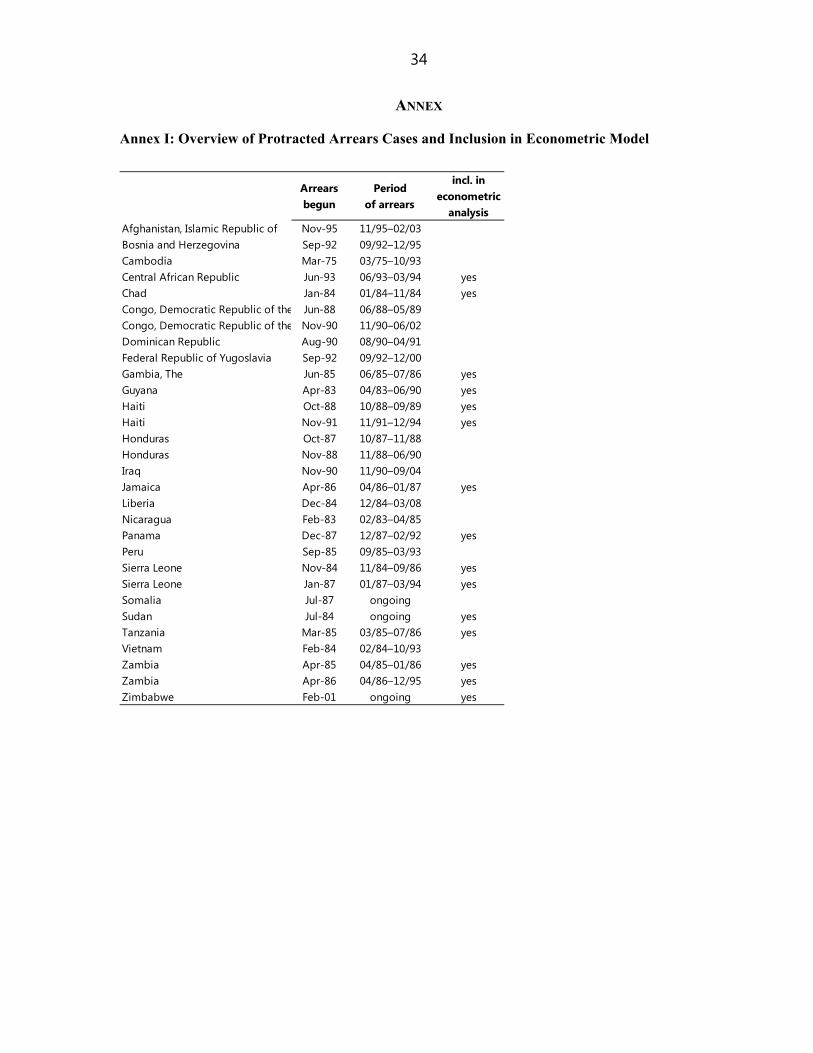
34
ANNEX
Annex I: Overview of Protracted Arrears Cases and Inclusion in Econometric Model
Arrears begun
Period of arrears
incl. in econometric
analysisAfghanistan, Islamic Republic of Nov-95 11/95–02/03Bosnia and Herzegovina Sep-92 09/92–12/95Cambodia Mar-75 03/75–10/93Central African Republic Jun-93 06/93–03/94 yesChad Jan-84 01/84–11/84 yesCongo, Democratic Republic of the Jun-88 06/88–05/89Congo, Democratic Republic of the Nov-90 11/90–06/02Dominican Republic Aug-90 08/90–04/91Federal Republic of Yugoslavia Sep-92 09/92–12/00Gambia, The Jun-85 06/85–07/86 yesGuyana Apr-83 04/83–06/90 yesHaiti Oct-88 10/88–09/89 yesHaiti Nov-91 11/91–12/94 yesHonduras Oct-87 10/87–11/88Honduras Nov-88 11/88–06/90Iraq Nov-90 11/90–09/04Jamaica Apr-86 04/86–01/87 yesLiberia Dec-84 12/84–03/08Nicaragua Feb-83 02/83–04/85Panama Dec-87 12/87–02/92 yesPeru Sep-85 09/85–03/93Sierra Leone Nov-84 11/84–09/86 yesSierra Leone Jan-87 01/87–03/94 yesSomalia Jul-87 ongoingSudan Jul-84 ongoing yesTanzania Mar-85 03/85–07/86 yesVietnam Feb-84 02/84–10/93Zambia Apr-85 04/85–01/86 yesZambia Apr-86 04/86–12/95 yesZimbabwe Feb-01 ongoing yes
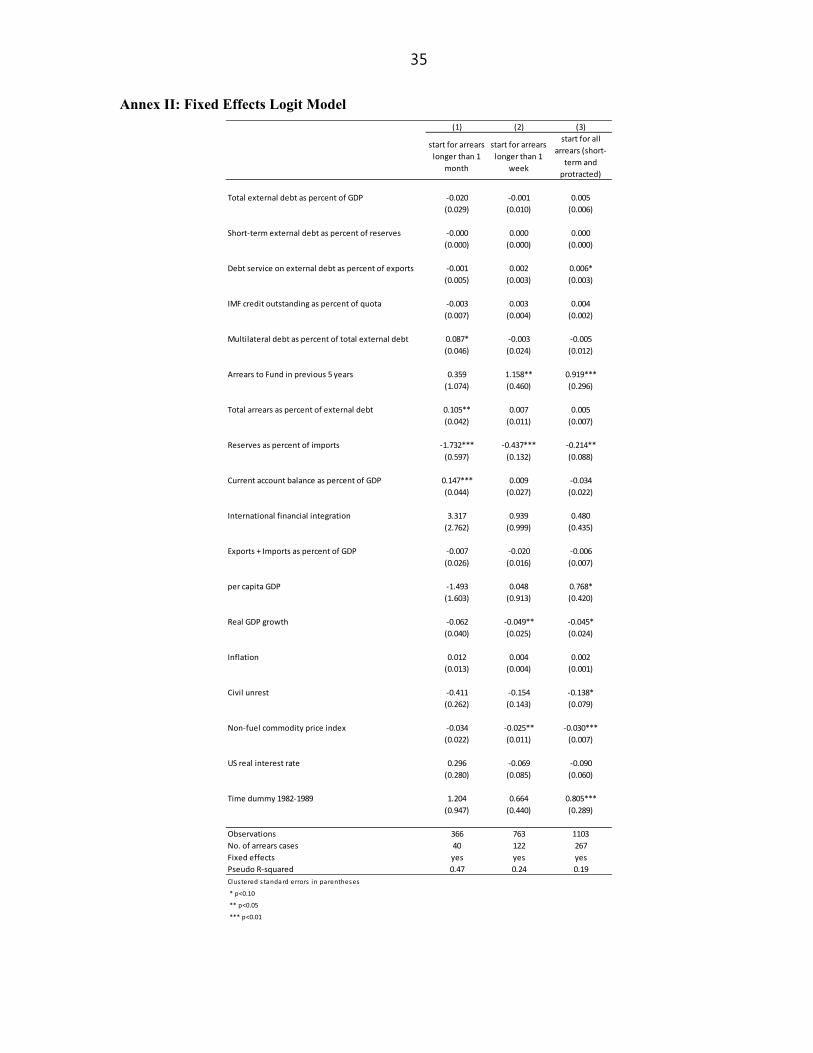
35
Annex II: Fixed Effects Logit Model
(1) (2) (3)
start for arrears
longer than 1
month
start for arrears
longer than 1
week
start for all
arrears (short-
term and
protracted)
Total external debt as percent of GDP -0.020 -0.001 0.005
(0.029) (0.010) (0.006)
Short-term external debt as percent of reserves -0.000 0.000 0.000
(0.000) (0.000) (0.000)
Debt service on external debt as percent of exports -0.001 0.002 0.006*
(0.005) (0.003) (0.003)
IMF credit outstanding as percent of quota -0.003 0.003 0.004
(0.007) (0.004) (0.002)
Multilateral debt as percent of total external debt 0.087* -0.003 -0.005
(0.046) (0.024) (0.012)
Arrears to Fund in previous 5 years 0.359 1.158** 0.919***
(1.074) (0.460) (0.296)
Total arrears as percent of external debt 0.105** 0.007 0.005
(0.042) (0.011) (0.007)
Reserves as percent of imports -1.732*** -0.437*** -0.214**
(0.597) (0.132) (0.088)
Current account balance as percent of GDP 0.147*** 0.009 -0.034
(0.044) (0.027) (0.022)
International financial integration 3.317 0.939 0.480
(2.762) (0.999) (0.435)
Exports + Imports as percent of GDP -0.007 -0.020 -0.006
(0.026) (0.016) (0.007)
per capita GDP -1.493 0.048 0.768*
(1.603) (0.913) (0.420)
Real GDP growth -0.062 -0.049** -0.045*
(0.040) (0.025) (0.024)
Inflation 0.012 0.004 0.002
(0.013) (0.004) (0.001)
Civil unrest -0.411 -0.154 -0.138*
(0.262) (0.143) (0.079)
Non-fuel commodity price index -0.034 -0.025** -0.030***
(0.022) (0.011) (0.007)
US real interest rate 0.296 -0.069 -0.090
(0.280) (0.085) (0.060)
Time dummy 1982-1989 1.204 0.664 0.805***
(0.947) (0.440) (0.289)
Observations 366 763 1103
No. of arrears cases 40 122 267
Fixed effects yes yes yes
Pseudo R-squared 0.47 0.24 0.19
Clustered s tandard errors in parenthes es
* p<0.10
** p<0.05
*** p<0.01
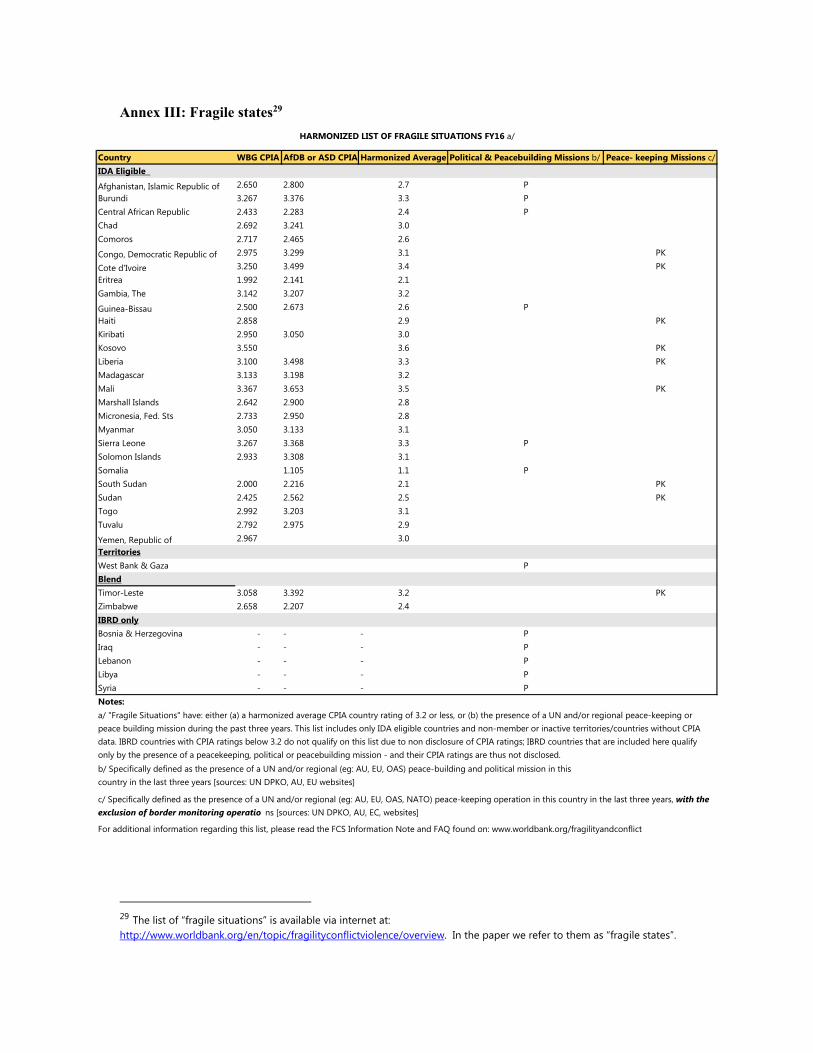
Annex III: Fragile states29
29 The list of “fragile situations” is available via internet at: http://www.worldbank.org/en/topic/fragilityconflictviolence/overview. In the paper we refer to them as “fragile states”.
Country WBG CPIA AfDB or ASD CPIA Harmonized Average Political & Peacebuilding Missions b/ Peace- keeping Missions c/IDA Eligible
Afghanistan, Islamic Republic of 2.650 2.800 2.7 PBurundi 3.267 3.376 3.3 PCentral African Republic 2.433 2.283 2.4 PChad 2.692 3.241 3.0Comoros 2.717 2.465 2.6
Congo, Democratic Republic of 2.975 3.299 3.1 PK
Cote d'Ivoire 3.250 3.499 3.4 PKEritrea 1.992 2.141 2.1Gambia, The 3.142 3.207 3.2
Guinea-Bissau 2.500 2.673 2.6 PHaiti 2.858 2.9 PKKiribati 2.950 3.050 3.0Kosovo 3.550 3.6 PKLiberia 3.100 3.498 3.3 PKMadagascar 3.133 3.198 3.2Mali 3.367 3.653 3.5 PKMarshall Islands 2.642 2.900 2.8Micronesia, Fed. Sts 2.733 2.950 2.8Myanmar 3.050 3.133 3.1Sierra Leone 3.267 3.368 3.3 PSolomon Islands 2.933 3.308 3.1Somalia 1.105 1.1 PSouth Sudan 2.000 2.216 2.1 PKSudan 2.425 2.562 2.5 PKTogo 2.992 3.203 3.1Tuvalu 2.792 2.975 2.9
Yemen, Republic of 2.967 3.0TerritoriesWest Bank & Gaza PBlendTimor-Leste 3.058 3.392 3.2 PKZimbabwe 2.658 2.207 2.4IBRD onlyBosnia & Herzegovina - - - PIraq - - - PLebanon - - - PLibya - - - PSyria - - - PNotes:
For additional information regarding this list, please read the FCS Information Note and FAQ found on: www.worldbank.org/fragilityandconflict
HARMONIZED LIST OF FRAGILE SITUATIONS FY16 a/
a/ "Fragile Situations" have: either (a) a harmonized average CPIA country rating of 3.2 or less, or (b) the presence of a UN and/or regional peace-keeping or peace building mission during the past three years. This list includes only IDA eligible countries and non-member or inactive territories/countries without CPIA data. IBRD countries with CPIA ratings below 3.2 do not qualify on this list due to non disclosure of CPIA ratings; IBRD countries that are included here qualify only by the presence of a peacekeeping, political or peacebuilding mission - and their CPIA ratings are thus not disclosed.b/ Specifically defined as the presence of a UN and/or regional (eg: AU, EU, OAS) peace-building and political mission in thiscountry in the last three years [sources: UN DPKO, AU, EU websites]
c/ Specifically defined as the presence of a UN and/or regional (eg: AU, EU, OAS, NATO) peace-keeping operation in this country in the last three years, with the exclusion of border monitoring operatio ns [sources: UN DPKO, AU, EC, websites]
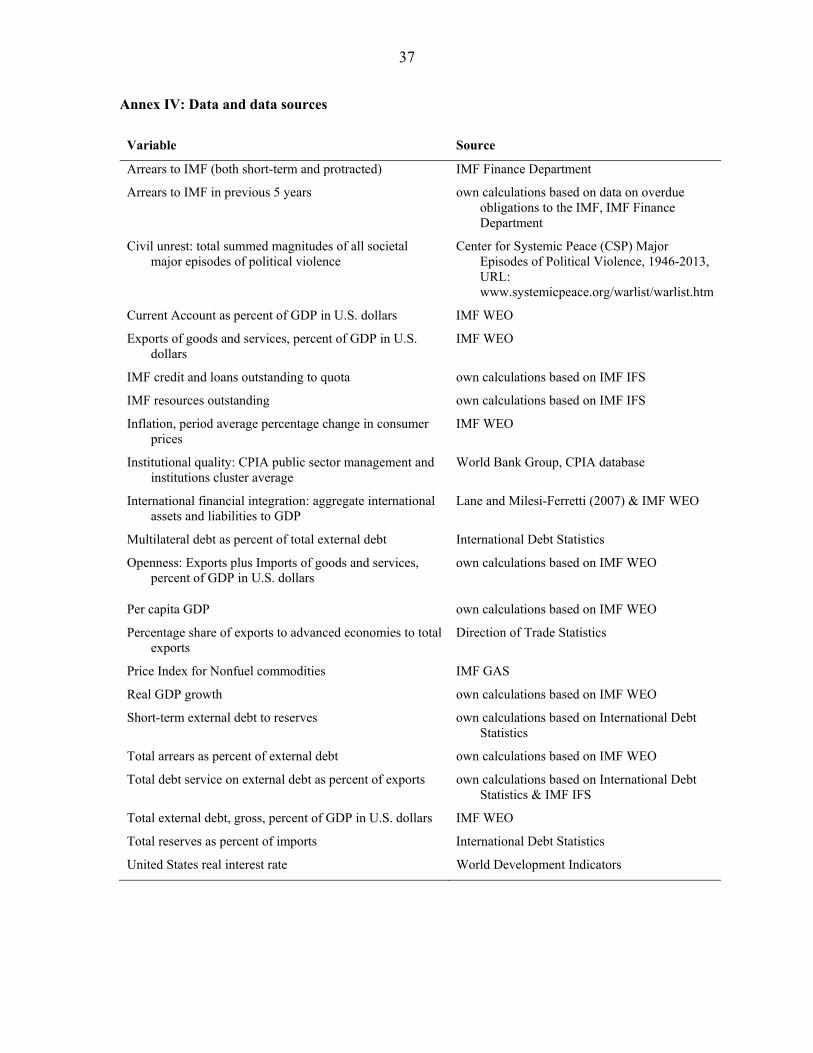
37
Annex IV: Data and data sources
Variable Source
Arrears to IMF (both short-term and protracted) IMF Finance Department
Arrears to IMF in previous 5 years own calculations based on data on overdue obligations to the IMF, IMF Finance Department
Civil unrest: total summed magnitudes of all societal major episodes of political violence
Center for Systemic Peace (CSP) Major Episodes of Political Violence, 1946-2013, URL: www.systemicpeace.org/warlist/warlist.htm
Current Account as percent of GDP in U.S. dollars IMF WEO
Exports of goods and services, percent of GDP in U.S. dollars
IMF WEO
IMF credit and loans outstanding to quota own calculations based on IMF IFS
IMF resources outstanding own calculations based on IMF IFS
Inflation, period average percentage change in consumer prices
IMF WEO
Institutional quality: CPIA public sector management and institutions cluster average
World Bank Group, CPIA database
International financial integration: aggregate international assets and liabilities to GDP
Lane and Milesi-Ferretti (2007) & IMF WEO
Multilateral debt as percent of total external debt International Debt Statistics
Openness: Exports plus Imports of goods and services, percent of GDP in U.S. dollars
own calculations based on IMF WEO
Per capita GDP own calculations based on IMF WEO
Percentage share of exports to advanced economies to total exports
Direction of Trade Statistics
Price Index for Nonfuel commodities IMF GAS
Real GDP growth own calculations based on IMF WEO
Short-term external debt to reserves own calculations based on International Debt Statistics
Total arrears as percent of external debt own calculations based on IMF WEO
Total debt service on external debt as percent of exports own calculations based on International Debt Statistics & IMF IFS
Total external debt, gross, percent of GDP in U.S. dollars IMF WEO
Total reserves as percent of imports International Debt Statistics
United States real interest rate World Development Indicators
38
REFERENCES
Aylward, L. and R. Thorne, 1998, “An Econometric Analysis of Countries’ Performance to the
International Monetary Fund”, IMF Working Paper No. 32 (Washington: International Monetary Fund).
Boughton, J. M., 2001, Silent Revolution: The International Monetary Fund 1979–1989, International Monetary Fund, Washington DC.
Boughton, J. M., 2012, Tearing Down Walls: The international Monetary Fund 1990-1999, International Monetary Fund, Washington DC.
Das, U., M. Papaioannou, and C. Trebesch, 2012, “Sovereign Debt Restructurings 1950–2010: Literature Survey, Data, and Stylized Facts.” IMF Working Paper No. 203 (Washington: International Monetary Fund).
Lane, P. R. and G. M. Milesi-Ferretti, 2007, "The external wealth of nations mark II: Revised and extended estimates of foreign assets and liabilities, 1970–2004", Journal of International Economics 73, November, 223-250.
Manasse, P., N. Roubini and A. Schimmelpfennig, 2003, “Predicting Sovereign Debt Crises”, IMF Working Paper No. 221 (Washington: International Monetary Fund).
Oka, C., 2003, “Anticipating Arrears to the IMF: Early Warning Systems”, IMF Working Paper No. 18 (Washington: International Monetary Fund).
Reinhart, C., and K. Rogoff, 2008, “This Time is Different: A Panoramic View of Eight Centuries of Financial Crises.” NBER Working Paper No. 13882.
Sturzenegger, F., and J. Zettelmeyer, 2007, Debt Defaults and Lessons from a Decade of Crises. MIT Press.