Embed Size (px)
Citation preview
Supplementary data
Domain-Boundary Independency of Raman Spectra for Strained
Graphene at Strong Interfaces
Yunlu Wang, Yang Wang‡, Chen Xu, Xuewei Zhang, Le Mei, Miao Wang,
Yang Xia, Pei Zhao, Hongtao Wang
Figure S1. Home-made tensile testing machine modified from a micrometer-equipped multi-axis
stage (MAX313D, ThorLabs, Inc.).
1
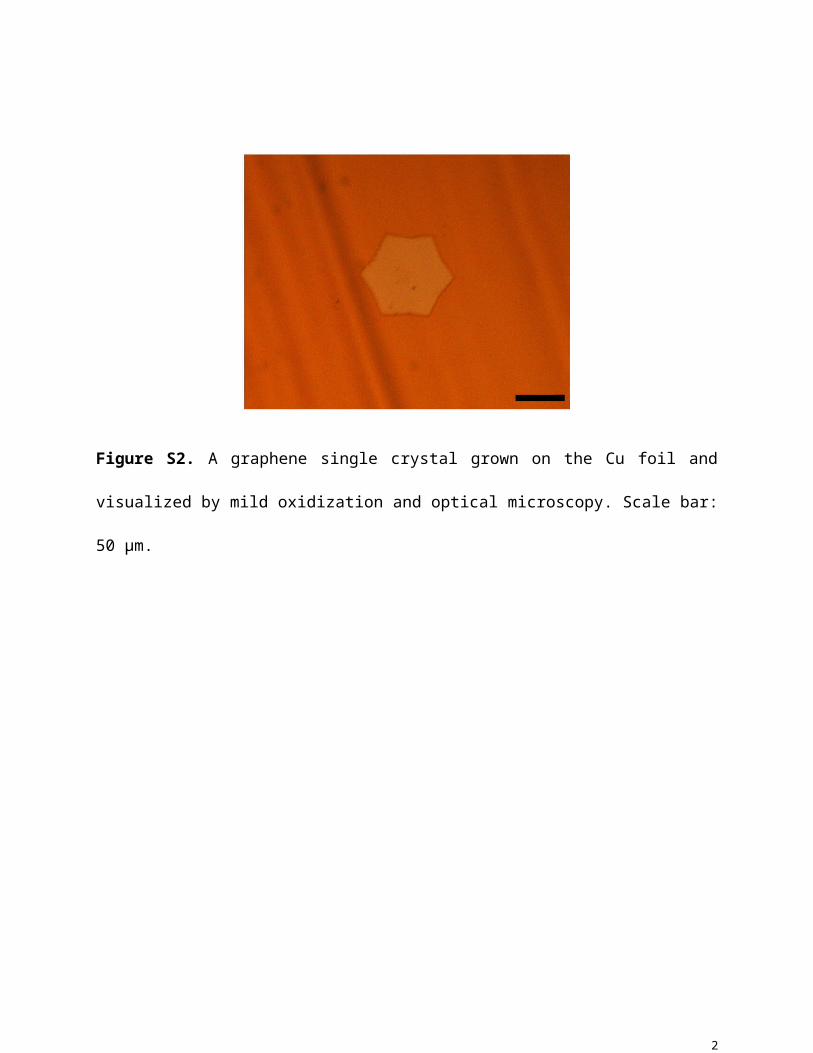
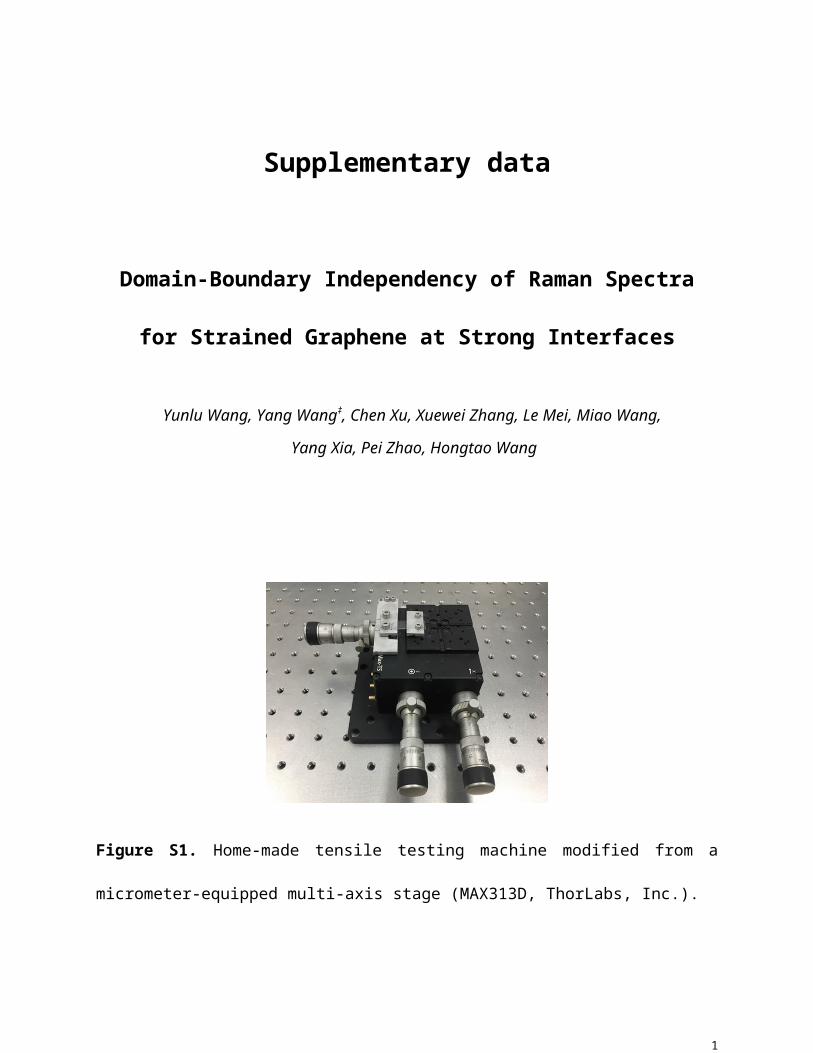
Figure S2. A graphene single crystal grown on the Cu foil and visualized by mild oxidization
and optical microscopy. Scale bar: 50 μm.
Figure S3. Raman spectra of graphene/formvar/PDMS and graphene/SiO2 demonstrates an ideal
Raman platform for detecting both the G and 2D peaks from graphene.
.
2
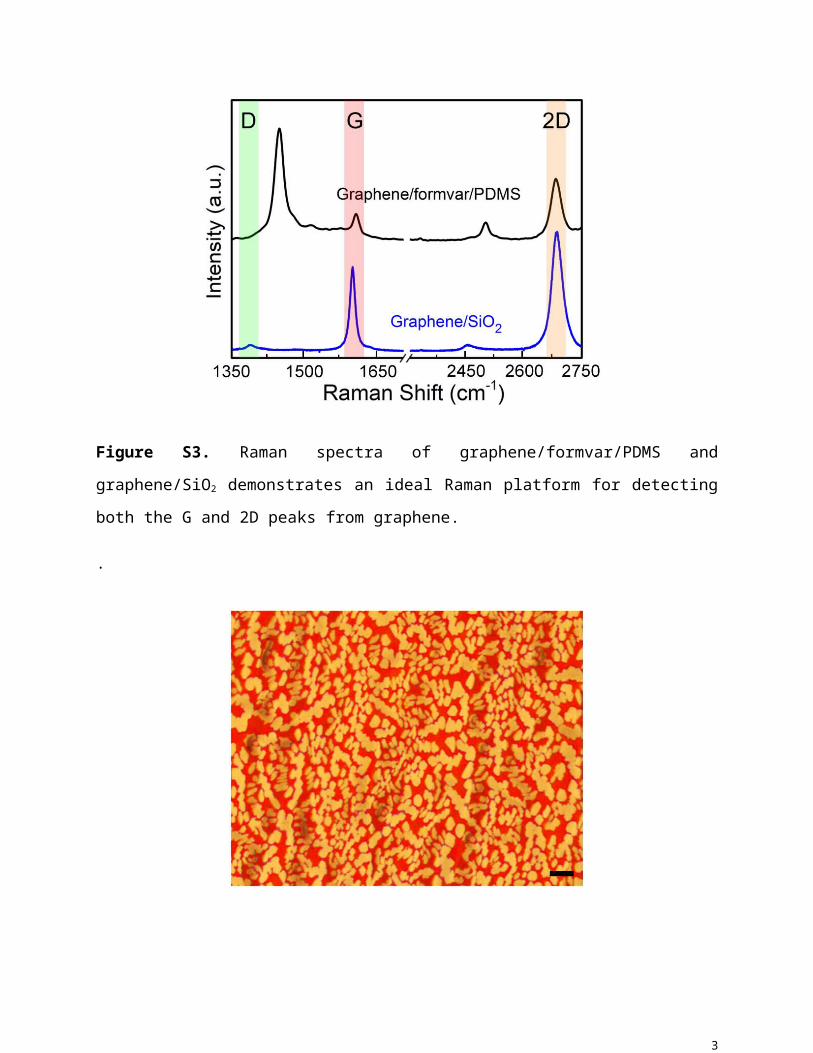
Figure S4. Domain size characterization of polycrystalline graphene before the domain
coalescence. The average size of the domains is ~5 μm. Scale bar: 20 μm.
Figure S5. The G band peak of p-SGR at 1.05%, fitted by one or two Lorentzian curves.
3