Embed Size (px)
Citation preview

Recalculating GHG emissions saving of palm oil biodiesel
Gernot Pehnelt • Christoph Vietze
Received: 26 June 2012 / Accepted: 25 August 2012 / Published online: 6 October 2012� The Author(s) 2012. This article is published with open access at Springerlink.com
Abstract In 2010, the Renewable Energy Directive (RED) came into force in the EU and
establishes a framework for achieving legally binding greenhouse gas (GHG) emission
reductions. Only sustainable biofuels can be counted towards Member State targets. The
aim of this paper is to calculate realistic and transparent scenario-based CO2-emission
values for the GHG emissions savings of palm oil fuel compared with fossil fuel. Using the
calculation scheme proposed by the RED, we derive a more realistic overall GHG emis-
sions saving value for palm oil diesel by using current input and output data of biofuel
production (e.g. in South-East Asia). We calculate different scenarios in which reliable
data on the production conditions (and the regarding emission values during the production
chain) of palm oil diesel are used. Our results indicate values for the GHG emissions
savings potential of palm oil biodiesel not only above the 19 % default and 36 % typical
value published in RED but also above the 35 % sustainable threshold. Our findings
conclude the more accurate GHG emissions saving value for palm oil feedstock for
electricity generation to be 52 %, and for transportation biodiesel between 38.5 and 41 %,
depending on the fossil fuel comparator. Our results confirm the findings by other studies
and challenge the official typical and default values published in RED. As a result, the
reliability of the Directive to support the EU’s low-carbon ambitions is being undermined,
exposing the EU and commission to charges of trade discrimination and limiting the ability
of Member States to achieve their legally binding GHG emission reductions.
Keywords Biofuel � Palm oil � Biodiesel � Renewable energy directive � Typical values �Default values � GHG emissions
G. PehneltIndependent Research Institute GlobEcon, Johann-Friedrich-Str. 25, 07745 Jena, Germanye-mail: [email protected]
G. Pehnelt � C. Vietze (&)Department of Economics, Friedrich-Schiller-University of Jena,Carl-Zeiss-Strasse 3, 07743 Jena, Germanye-mail: [email protected]
C. VietzeEconEcolDev, Dornburger Str. 135, 07743 Jena, Germany
123
Environ Dev Sustain (2013) 15:429–479DOI 10.1007/s10668-012-9387-z

JEL classification F14 � F18 � O13 � Q01 � Q15 � Q27 � Q56 � Q57
1 Introduction
The European Union (EU) introduced an ambitious renewable energy policy in 2003,
which has been further elaborated since then. The main document of this policy is the
Renewable Energy Directive (RED). The Directive emphasises the EU’s commitment to
cut emissions by at least 20 % of 1990 levels by 2020. Proposed measures include
improvements in energy efficiency as well as a binding target to increase the share of
renewable energy by 2020 with 20 % renewable energy sources in total EU energy con-
sumption. The share of renewable sources in EU road transport (i.e. biofuels) is required to
reach at least 10 % by 2020.
The EU introduced certain sustainability criteria for the production and use of biofuels.
One requirement of the EU Renewable Energy Directive for sustainable biofuels is that
‘‘there should be no damages to sensitive or important ecosystems while cultivating energy
feedstocks’’ (EU 2009). This includes the absence of conversion of land with high bio-
diversity value and the conversion of land with high carbon stock. Another critical criterion
refers to the greenhouse gas (GHG) emissions saving potential of biofuels. The Directive
requires that the greenhouse gas emissions associated with production and use of biofuels
are at least 35 % lower than those associated with production and use of conventional
fuels. This threshold will rise to 50 % by 2017 and will increase further to 60 % in 2018. In
order to calculate these GHG emissions saving ratios, the RED requires that the whole
production chain from cultivation of the feedstock up to use of the biofuels is considered.
The most comprehensive approach to consider all stages of the production and use of
biofuels and to evaluate the ecological impact of biofuels would be a detailed and well-
founded life cycle assessment (LCA). LCA analyses the environmental flows related to a
product or a service during all life cycle stages, from the extraction of raw materials to the
end of life. Despite the growing interest in such studies, there are still relatively few LCA
studies on biofuels and most of them focus on products and conditions in the EU or North
America. One reason for that is the high uncertainty regarding the very methodology and
data quality. Since it is an integral part of any comprehensive LCA to take into account the
various co-products and side-effects of the activities associated with the production,
transportation, commercialisation and consumption of the product under consideration, it
has to be decided what exactly should be integrated into the analysis and how it should be
measured with respect to the long-term (side-) effects over the full life cycle of the very
product. The more co-products, allocation and distribution effects, environmental, eco-
nomic and social issues one tries to consider in the course of LCA, the more complex the
whole process becomes. With every single issue integrated into the analysis the variability
regarding the assumptions, model structure and data quality, and—not least—the more
blurred the results get. That is why it is neither possible to take into account every single
effect a product or service might have over its full life cycle, nor is it appropriate with
respect to the transparency and explanatory power of the models and results.
That is why it necessary to somehow limit the complexity of the underlying model by
setting a clear cut system boundary and concentrate on the main inputs and outputs
associated with the production and consumption of the very product. In the case of the
biofuels, this includes the energy balance of the full process covering residuals and co-
products. So-called well-to-wheel (WTW) studies are an appropriate and accepted way to
430 G. Pehnelt, C. Vietze
123
analyse the energy balance and carbon footprint of biofuels. In order to compare fossil and
alternative fuels, they have to include the direct emissions of gasoline or diesel during the
use phase in the motor combustion (tank-to-wheel/TTW) as well as indirect emissions
associated with the production and transportation of the respective fuel (well-to-tank/
WTT).1
Although the full process within the system boundary of production and consumption of
many biofuels is basically well-known, reports on biofuels using LCA-like methods usually
show a serious lack in transparency with respect to methodological details and assumptions
such as specific yields, conversion technologies, inputs and outputs as well as the treatment of
co-products and the respective allocation method (Menichetti and Otto 2009). Consequently,
due to serious measurement problems, methodological differences, the lack of transparency
and other uncertainties related with LCA, the results of published studies regarding the
environmental effects—for example, the carbon footprint—of biofuels are far from con-
clusive and show tremendous differences, both quantitatively and qualitatively.
For instance, there is a remarkable difference between the calculation of carbon
reduction performance of palm oil–based biofuel by the EU and a range of scientific
studies. In calculations by the EU, the default GHG emissions reduction by palm oil–based
biofuels fail the given threshold of 35 per cent under certain assumptions whereas quite a
few studies yield very different results. Among other issues, this has been documented and
discussed in a previous paper by Pehnelt and Vietze (2009). Given the noteworthy results
of this previous study, we recalculate the GHG emissions saving value for palm oil as a
source for biodiesel in order to further assess the carbon footprint of palm oil and to
overcome the lack in transparency in existing publications on the very issue.2
2 Production process
2.1 Cultivation of oil palm/plantation
The oil palm (Elaeis guineensis) is a perennial crop with a height of approximately 10
metres but can grow up to 20 m tall. Oil palms have a (productive) lifetime of more than
30 years. Harvesting the palm oil fruits/fresh fruit bunches (FFB) usually starts in the
second or third year after planting the tree (Corley and Tinker 2003; Singh 2006). The
palms are productive from the age of 2–3 years up to the age of 25–30 years after planting
while giving the highest yields in the first third to the middle of the life cycle. Corley and
Tinker (2003) estimate an average age of palms when replanting at 25 years after planting.
Azman and Noor (2002) calculate the optimal age of re-planting to be 25–26 years while
Yusoff and Hansen (2007) estimate the age of palms when re-planting up to 30 years. In
our estimation, we conservatively consider 25 years.
Oil palm cultivation implies several field work processes using fossil fuel such as
planting of new palms, sowing of crop cover, fertiliser and pesticide application, harvesting
and transportation to the oil mill nearby and finally after 25 years clearing and preparing
the field for replanting (Schmidt 2007).
1 The results of such analyses are can be expressed as the relation between the total GHG emissions and theenergy content of different types of fuel, usually measured in carbon dioxide equivalents per megajoule (gCO2 eq/MJ).2 The authors of the study sought to include data from the Joint Research Center that were used to developthe current values in the Directive. Requests for data were not returned.
Recalculating GHG emissions saving of palm oil biodiesel 431
123

The oil palm fruits are attached to bunches (FFB—fresh fruit bunches) of around 25 kg.
Each FFB carries 1,500–2,000 single fruits (for oil palms 10–15 years old) and contains
around 20 % oil, 25 % nuts (5 % kernels, 13 % fibre and 7 % shell) and 23 % empty fruit
bunches. The kernels yield around 55 % oil and 8 % protein (Corley and Tinker 2003;
Møller et al. 2000).
The palms are harvested year-round; each time only one FFB per oil palm is harvested.
Harvesting is done manually, and the FFB are collected with a truck. Young palms are
harvested with a chisel whereas old and tall palms are harvested with a long-handled
sickle. As they are harvested only by manual labour, there is no fossil energy input to
harvesting (Pleanjai et al. 2007). The fruit bunches are generally transported to the mill on
the day of harvesting. When the palms are getting too unproductive, the palms are felled
and usually replaced by new palms (Schmidt 2007).
2.2 Milling process
Although the specific milling process differs according to the products one wants to obtain,
basically, the following steps are done in the oil mill. First, the sterilisation of the FFB is
done batchwise in an autoclave with an internal temperature inside of about 120–130 �C to
ensure the FFB is completely cooked. The steam condensate is the wastewater generated at
this step. Second, the FFB are striped to separate the sterilised fruits from bunch stalks.
This processing step generates the empty fruit bunches (EFB) that are put into the digester
where they are mashed under steam-heated conditions. Often, the EFB is used as mulch in
the oil palm plantation (Corley and Tinker 2003).3 In a third step, the crude palm oil
extraction, the homogenous oil mash from the digester, is pushed through a screw press
and later passes through a vibrating screen, a hydrocyclone and decanters to remove fine
solids and water. Centrifugal and vacuum driers are used to further purify the oil before
sending it to a storage tank and later sold as CPO. The fibre and nuts from the screw press
are usually separated in a cyclone. The fibre that passes out of the bottom of the cyclone
can be used as boiler fuel from which ash (fertiliser) is produced after combustion. The
nuts are cracked in a centrifugal cracker. After the cracking process, the entire palm
kernels and shells are separated (e.g. by clay suspension). The separated shells from the
kernels are used as boiler fuel. The kernels are further processed in order to extract the
palm kernel oil (PKO).
The main environmental impact related to methane emissions from production of palm
oil in the palm oil mill relates to the technology for treating palm oil mill effluent (POME).
There are three main sources of POME in the palm oil mill: clarification waste water (60 %
of total POME), steriliser condensate (36 % of total POME) and hydro cyclone waste
water from nut and fibre separation (4 % of total POME) (Department of Environment
1999; Schmidt 2007). The most common treatment of POME is still an open anaerobic and
aerobic ponds and later the use as land application and fertiliser (Lim et al. 1999). The
alternative technology is the installing of digester tanks for biogas capturing and sub-
sequent utilisation of biogas for electricity production. At the palm oil mill selected for his
study, Schmidt (2007) describes how POME is digested anaerobically to yield biogas
which is used in modified diesel engine with a 90-kW induction motor.
3 EFB can also be used as substrate for mushroom cultivation and for the production of particle board(Pleanjai et al. 2007).
432 G. Pehnelt, C. Vietze
123
2.3 Refining process
The refining process includes neutralisation, bleaching and deodorisation of the oil. The
output from the refinery is then refined palm oil (RefPO). In these steps of the production
processes, some losses of oil take place.
The purpose of neutralisation (including degumming) is to remove lecithin and free
fatty acids. The lecithin is removed by applying phosphoric acid (0.25 kg/t RefPO, UPRD
2004) in the degumming process. In the following, the content of free fatty acids is
removed by applying sodium hydroxide (2.9 kg/t RefPO, UPRD 2004). When the sodium
hydroxide reacts with the free fatty acids, the outcome is soap-water. Next, the mix of oil
and soap-water is centrifuged in order to separate out the soap which is sold. The soap is
sent through the soap stock splitting process were the outcomes are free fatty acids (used as
fodder) and soap (sold to soap manufacturing) (Hansen 2006).
The bleaching process is applied in order to remove undesired coloured particles. In the
bleaching process, the oil is brought in contact with Fuller’s earth (bentonite), the most
common used agent for filtering the oil, which absorbs the undesired particles (Schmidt
2007). In the bleaching process, oil is lost due to oil content of approximately 30 % oil in
the used Fuller’s earth (Singh 2006).
Finally, the oil is sent through the deodorisation process to remove undesired odorif-
erous or flavouring compounds. In the deodorisation process, minor amounts of different
ancillaries are applied, for example, citric acid. Since these ancillaries constitute in-sig-
nificant amounts (just a few gram per ton of RefPO), they are omitted in this study. About
0.1 % of the oil is lost in the deodorisation process (Hansen 2006).
2.4 Transport
The refined palm oil is then transported to final consumption for (co-generated) electricity
production in Europe or further processing to FAME/biodiesel. The transportation stage
includes the transport from the refinery to the port in the country of origin and the shipment
of the refined palm oil to the EU.4
2.5 Esterification process
In order to convert refined palm oil into biodiesel (fatty acid methyl ester/FAME), which
can be used by almost all conventional diesel engines in cars, usually a transesterification
reaction comes into play. This process usually requires two to three stages with subsequent
washing, drying and polishing of the reaction product. The refined, bleached and de-
odorised palm oil is thoroughly mixed with methanol and sodium hydroxide as a catalyst.
The mixture is heated to the reaction temperature and fed to a reactor where the esterifi-
cation reaction takes place. Glycerol formed in the reaction is separated from the methyl
ester phase. Further conversion of the methyl ester takes place in a second and sometimes
third reactor.
Once the reaction is complete, the major co-products, biodiesel and glycerin, are sep-
arated into two layers. The methanol is typically removed after the biodiesel and glycerin
have been separated, to prevent the reaction from reversing itself. The methanol is cleaned
and recycled back to the beginning of the process. Once separated from the glycerin, the
4 Note that not just ready refined palm oil is exported but also significant amounts of crude palm oil (CPO).
Recalculating GHG emissions saving of palm oil biodiesel 433
123

biodiesel goes through a clean-up or purification process to remove excess alcohol, residual
catalyst and soaps.
Although a few facilities for esterification/biodiesel production have been established in
the countries of origin in South-East Asia, the process of esterification usually takes place
in facilities in the importing countries. The following Table 1 shows the 10 major pro-
ducers of biodiesel sorted by output in 2009. Note that the first country that grows oil palms
in a significant manner, Thailand, ranks 6th, far behind countries in Europe and America.
The actual biodiesel production of Malaysia, as the second largest producer of crude palm
oil in the world, significantly falls behind those on top of the list. Indonesia, the world’s
largest palm oil producer, does not even appear on this list.
Given the fact that the final stage of palm oil–based biodiesel is still usually done in the
target country, the actual system boundary of production in the country of origin (e.g.
South-East Asia) can be considered as the refinery or even the oil mill stage.
In order to do so, the very producer of FAME has to provide insights into the technology
applied in the esterification process. As a matter of fact, adding artificial penalising factors5
to the esterification process to get a default value is nonsense, even if the very FAME is
produced in the country of origin. One should definitely refer to the current common
technologies. Furthermore, new technologies available have dramatically reduced the
energy intensity of the transformation process of vegetable oils into FAME, not to mention
Next Generation Biomass-to-Liquid (NExBTL-biodiesel) and Hydrotreating. This has to
be considered from case to case while assessing the GHG emissions of the very biofuel
produced.
3 Methodology
In order to calculate the GHG impact of palm oil, a life cycle analysis including all
activities associated with the production, transformation, transport and use of the
Table 1 Top 10 producers of biodiesel
Country Biodiesel production (thousand barrels per day)
2005 2006 2007 2008 2009
Germany 39.0 70.4 78.3 61.7 51.2
France 8.4 11.6 18.7 34.4 41.1
United States 5.9 16.3 32.0 44.1 32.9
Brazil 0.0 1.2 7.0 20.1 27.7
Italy 7.7 11.6 9.2 13.1 13.1
Thailand 0.4 0.4 1.2 7.7 10.5
China 0.8 4.0 6.0 8.0 8.0
Malaysia 0.0 1.1 2.5 4.5 5.7
South Korea 0.2 0.9 1.7 3.2 5.0
Lithuania 0.1 0.2 0.5 1.3 1.9
World 77.2 142.0 202.9 270.9 308.2
Source US Energy Information Administration (2011)
5 The European Union (EU) (2009) Directive calculates with an average penalising factor of 1.4.
434 G. Pehnelt, C. Vietze
123

respective biofuel has to be conducted. The methodology of the calculation scheme is laid
down in part C Annex V of the Directive 2009/28/EC and in Annex IV.C of Directive
2009/30/EC (land use chance). As in the EU-Directive (European Union (EU) 2009)
Annex V(C), GHG emissions reductions are calculated as follows:
SAVING ¼ ðEF � EBÞ=EF;
where EB is the total emission from the respective biofuel and EF is the total emissions
from fossil biodiesel. Greenhouse gas emissions from the production and transport of fuels,
biofuels and bioliquids shall be calculated as:
EB ¼ eec þ el þ ep þ etd þ eu þ esca þ eccs þ eccr þ eee
where EB, total emissions from the use of the fuel; eec, emissions from the extraction or
cultivation of raw materials; el, annualised emissions from carbon stock changes caused by
direct land use change; ep, emissions from processing; etd, emissions from transport and
distribution; eu, emissions from the fuel in use; esca, emission saving from soil carbon
accumulation via improved agricultural management; eccs, emission saving from carbon
capture and geological storage; eccr, emission saving from carbon capture and replacement;
and eee, emission saving from excess electricity from cogeneration.
The aim of this paper is to calculate realistic and transparent scenario-based CO2-
emission values for the GHG emission savings of palm oil fuel compared with fuel from
crude oil. Using the same basic calculation scheme, we derive a more realistic overall GHG
emissions saving value for palm oil diesel by using current input and output data of biofuel
production (e.g. in South-East Asia) documenting every single step in detail. We calculate
different scenarios in which reliable data on the production conditions (and the regarding
emissions values during the production chain) of palm oil diesel are used.
As shown in the previous chapter, the production of palm oil is divided into five stages:
agricultural stage, oil mill stage, re-finery stage, transport stage and esterification stage.
The transport stage only includes transport of oil from the refinery to final use which is
assumed to be in Europe represented by Port Rotterdam. Other transport processes are
included in the other life cycle stages.
Overhead (operation of buildings, administration, marketing, etc.) and capital goods
(building, machinery and means of transportation) are not considered in our LCA, as—
according to the EU-Directive (EU 2009, Annex V, C Methodology)—emissions from the
manufacture of machinery and equipment shall not be taken into account.
The determination of the system boundaries of the oil mill stage and refinery stage is
based on the methodology presented in Schmidt and Weidema (2008), and the determi-
nation of the system boundaries relating the agricultural stage is based on the methodology
presented in Schmidt (2008).
We use a conservative baseline model to calculate GHG emissions for every step of the
palm diesel production chain based on the background data provided by the latest available
version of the JEC database (see Appendix, Table 8).6 Furthermore, for the very inputs and
outputs of the production process, we use also conservative values based on the average of
the values found in reliable scientific studies.
We use the calculation tool provided by IFEU (2010) based on the Intelligent Energy
Europe (IEE) project BioGrace (2010). This tool is engineered to produce greenhouse gas
(GHG) calculations using the methodology as given in the Directives 2009/28/EC
6 Background data are taken from the JEC (2011) E3-database (version 31-7-2008).
Recalculating GHG emissions saving of palm oil biodiesel 435
123

(Renewable Energy Directive) and 2009/30/EC (Fuel Quality Directive). In contrast to the
EU-Directive (European Union (EU) 2009) as well as all other studies, we do not use
unaudited assumptions but rely only on exact measured and proven primary data instead.
All data are well documented in our study. Thus, we provide a full transparency by
indicating all input and output data, assumptions and background data.
There is some evidence that a considerable share of the oil palm expansion has and is
taking place on land released from other crops (Corley and Tinker 2003; Henson 2004;
Teoh 2000). In the past, oil palm in Malaysia has largely been planted on land released
from rubber, coconut and cocoa (Henson 2004). This could be confirmed with data
obtained from FAOSTAT (2006) for Malaysia where the planted area of rubber, cocoa and
coconuts has been decreasing from around the year 1990 to the year 2005 while the planted
area of oil palm has been increasing at the same rate during the same period of time.
However, looking at Malaysia and Indonesia in sum, there is a general increase in the
cultivated area of rubber and coconut, and only a small decrease in the cultivated area of
cocoa is identified from 1994 to 1999 (FAOSTAT 2006). Thus, it seems that there is no
large-scale displacement of other crops by oil palm plantations (indirect land use change)
but obviously a transformation of nonagricultural land into oil palm cultivation instead.
To asses the emissions related to direct land use change, the question then is what kind
of land is transformed. Most NGO’s claim that land transformation towards oil palms is
related to clearing of primary forest, see for example, Casson (2003), Frese et al. (2006)
and Wakker (2004). However, oil palm plantations are ‘‘almost always established on
already disturbed land’’ (Schmidt 2007, based on studies of Bek-Nielsen 2006; Glastra
et al. 2002; ProForest 2003).
Disturbed land may be either cleared forest (alang–alang grassland), secondary forest,
or abandoned agricultural land. Schmidt (2007) states that it is not possible to estimate the
composition of land types transformed into oil palm exactly. However, he assumes that
50 % takes place by transformation of degraded/secondary forest and the other 50 % of oil
palm expansions takes place by transformation of grassland. If oil palm is planted directly
on transformed primary forest, the transformation from primary to degraded forest is
related to logging in the fist instance since change in demand for timber is the main driving
force of logging (Schmidt 2007). Analysing data from FAO (2005), FAOSTAT (2006), and
Pagiola (2000), Schmidt (2007) concludes that the annual deforestation in Malaysia and
Indonesia is significantly larger than the increase in agricultural area, also when looking at
degradation of primary forest only.
This comparison suggests that it is unlikely that oil palm is the main driver of logging
primary forest. Pehnelt and Vietze (2009) consider that land might have been initially
deforested for other reasons and then finally be planted with oil palm. Using these formerly
degraded and abandoned agricultural lands to grow native perennials like oil palms for
biofuel production is economically and ecologically efficient as this could spare the
destruction of native ecosystems. Moreover, this measure reduces GHG emissions as
carbon being stored in the soil and the growing palm (Fargione et al. 2008; Field et al.
2008; Tilman et al. 2006). According to the German Advisory Council on Global Change
(2008), in such a situation a major climate change mitigation effect can be achieved at very
low cost.
Because of these uncertainties regarding the reasons and effects of land use change, we
do not consider this problem explicitly in the current paper. As our aim is a realistic,
reliable and scientifically founded approach, we focus our research on GHG emissions
related to plantation, processing and transport of palm biodiesel, as only these steps are
considered to calculate the EU typical and default value. Furthermore, the issue of land use
436 G. Pehnelt, C. Vietze
123
change (as well as biodiversity) is addressed by the other criteria given by RED and is
considered separately from the very GHG emissions saving potential.7
3.1 Plantation stage
As further explained in Sect. 2.1, we conservatively consider an oil palm life cycle of
25 years in our estimation.
Our data are based on data on cultivation practices in Malaysia, currently the second
largest producer of palm oil. Since oil palm is a perennial, three different stages must be
considered: (i) nursery, (ii) immature plantation and (iii) mature plantation. The inter-
ventions from oil palm cultivation are applied as a weighted average of the immature and
mature plantation. Schmidt (2007) regarded the seed production and nursery as insignifi-
cant for oil palm cultivation due to the lifetime of oil palms of 25 years. The immature
stage is regarded as the first 2 years after planting. After that, the palms are supposed to
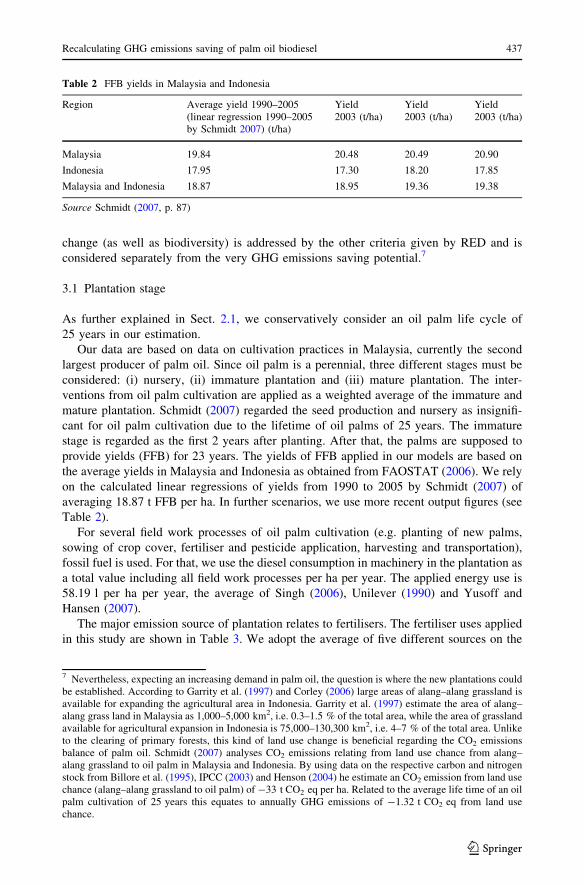
provide yields (FFB) for 23 years. The yields of FFB applied in our models are based on
the average yields in Malaysia and Indonesia as obtained from FAOSTAT (2006). We rely
on the calculated linear regressions of yields from 1990 to 2005 by Schmidt (2007) of
averaging 18.87 t FFB per ha. In further scenarios, we use more recent output figures (see
Table 2).
For several field work processes of oil palm cultivation (e.g. planting of new palms,
sowing of crop cover, fertiliser and pesticide application, harvesting and transportation),
fossil fuel is used. For that, we use the diesel consumption in machinery in the plantation as
a total value including all field work processes per ha per year. The applied energy use is
58.19 l per ha per year, the average of Singh (2006), Unilever (1990) and Yusoff and
Hansen (2007).
The major emission source of plantation relates to fertilisers. The fertiliser uses applied
in this study are shown in Table 3. We adopt the average of five different sources on the
7 Nevertheless, expecting an increasing demand in palm oil, the question is where the new plantations couldbe established. According to Garrity et al. (1997) and Corley (2006) large areas of alang–alang grassland isavailable for expanding the agricultural area in Indonesia. Garrity et al. (1997) estimate the area of alang–alang grass land in Malaysia as 1,000–5,000 km2, i.e. 0.3–1.5 % of the total area, while the area of grasslandavailable for agricultural expansion in Indonesia is 75,000–130,300 km2, i.e. 4–7 % of the total area. Unliketo the clearing of primary forests, this kind of land use change is beneficial regarding the CO2 emissionsbalance of palm oil. Schmidt (2007) analyses CO2 emissions relating from land use chance from alang–alang grassland to oil palm in Malaysia and Indonesia. By using data on the respective carbon and nitrogenstock from Billore et al. (1995), IPCC (2003) and Henson (2004) he estimate an CO2 emission from land usechance (alang–alang grassland to oil palm) of -33 t CO2 eq per ha. Related to the average life time of an oilpalm cultivation of 25 years this equates to annually GHG emissions of -1.32 t CO2 eq from land usechance.
Table 2 FFB yields in Malaysia and Indonesia
Region Average yield 1990–2005(linear regression 1990–2005by Schmidt 2007) (t/ha)
Yield2003 (t/ha)
Yield2003 (t/ha)
Yield2003 (t/ha)
Malaysia 19.84 20.48 20.49 20.90
Indonesia 17.95 17.30 18.20 17.85
Malaysia and Indonesia 18.87 18.95 19.36 19.38
Source Schmidt (2007, p. 87)
Recalculating GHG emissions saving of palm oil biodiesel 437
123

fertiliser use in mature oil palm plantations (FAO 2004; IFA et al. 2002, p. 13; Subra-
namiam 2006a; United Plantations Berhad (UPB) 2006, p. 110, 123, 129; Yusoff and
Hansen 2007) and one data source for immature oil palms (Henson 2004, p. 36) in
Malaysia. According to the oil palm life cycle, the total amounts of applied nutrients in
fertiliser in oil palm plantations are calculated as the average of 2 years immature and 23
years mature palms.
Thus, the applied uses are 105 kg N/ha, 31 kg P/ha (70 kg P2O5/ha), 170 kg K/ha
(204 kg K2O/ha) and 21 kg Mg/ha (35 kg MgO/ha). We use the same calculation meth-
odology as in RED (European Union (EU) 2009) and—therefore—the RED values for N2O
field emissions (8,264.84 gCO2 eq per kg N-fertiliser). Hence, the direct N2O field
emissions of the plantation of N-fertilisers are included in the emission calculation related
to the input of N-fertiliser. It is important to note that the nutrient demand for oil palm is
the total demand that may be met by inputs of artificial fertilisers, biomass residuals
(pruned fronds, EFB and POME), decomposition from the atmosphere and possible
decrease in the soil nitrogen pool. Therefore, the nutrient demand cannot be expected as a
stand alone guideline for the application of artificial fertiliser (Schmidt 2007).
For the use of pesticides, we obtain data by Singh (2006). The applied active ingredient
(a.i.) of pesticides is 2.7 kg per ha per year (2.4 kg a.i. glyphosate/ha, 0.31 kg a.i. cy-
permethrin/ha, 0.013 kg a.i. fungicides/ha and 0.00021 kg a.i. warfarin/ha), the average of
2 years immature and 23 years mature oil palm. Often, the use of pesticides is reduced by
an integrated pest management programme. That includes the planting of beneficial
flowering plants that attract parasites and predators of the common pests of the oil palm
Table 3 Fertiliser use oil palm plantation
Fertiliser N(kg N/ha)
P(kg P2O5/ha)
K (kgK2O/ha)
Ca (kgCaO/ha)
Source
Applied fertiliser in oil palm plantations
United Plantations 2005 136 77 297 0 United PlantationsBerhad (2006)
Malaysia, average 96 28 172 0 Yusoff and Hansen (2007)
Malaysia, costal soils 124 128 256 0 Subranamiam (2006a)
Malaysia, average 2001 100 45 205 0 IFA et al. (2002)
Malaysia, average 2002 76 86 119 0 FAO (2004)
Malaysia, immature 90 35 140 0 Henson (2004)
Average value (mature) 106 73 210 0 Average of 1, 2, 3, 4 and 5
Average value (immature) 90 35 140 0 The value given in 6
Applied value (2 yearsimmature; 23 yearsmature)
105 70 204 0 Average value
Theoretical figures
Recommended application(by MPOB)
128 144 200 – FAO (2004)
Nutrient demand,10-year-old palms
114 32 180 – Corley and Tinker (2003)
Nutrient demand,15-year-old palms
182 56 315 – Corley and Tinker (2003)
Source Schmidt (2007, p. 91)
438 G. Pehnelt, C. Vietze
123

(Arulandoo 2006; Fee and Sharma 1999). Rats, another serious pest, which damage the
seedlings in the nursery, immature palms and eat the fruits, are controlled by barn owls that
are attracted by setting up nesting boxes (Fee and Sharma 1999).
3.2 Oil mill stage
The values for the production process of the oil mill stage are mainly based on Singh
(2006), Subranamiam (2006a) and general literature on oil palm processing: Department of
Environment (1999), Schmidt (2007) and Singh et al. (1999).
In our estimation scenarios, the entire palm kernels are treated with the specific heating
value as by-product. Alternatively, we consider in another baseline scenario that the output
of entire palm kernels in the milling stage is further processed in the oil mill to palm kernel
oil (PKO) and palm kernel meal (PKM). We account for the electricity needed addition-
ally. Although the values for the GHG savings are smaller (as we count only the heating
value of by-products), two high value co-products would be produced. Cold-pressed PKO
is used as a high quality edible oil and palm kernel meal as food for livestock.
It appears from the description of the production process that the palm oil mill has
several product outputs. The production of crude palm oil (CPO) of 199.8 kg per t FFB and
kernel of 53.2 kg per t FFB is determined as the Malaysian average in 2003–2005 given in
MPOB (2005) and MPOB (2006). We apply values according Malaysian national figures
as the average of 1996 (Singh 1999) and 2002 (Ma et al. 2004) figures on the product flows
of fibre (130.0 kg/t FFB), shell (70.0 kg/t FFB), EFB (225.0 kg/t FFB) and POME
(672.5 kg/t FFB) per tonne of processed FFB.
The main environmental impact related to the production of palm oil in the palm oil mill
regards to the technology for treating palm oil mill effluent (POME). There are three main
sources of POME in the palm oil mill: clarification waste water (60 % of total POME),
steriliser condensate (36 % of total POME), and hydro cyclone waste water from nut and
fibre separation (4 % of total POME) (Department of Environment 1999; Schmidt 2007).
The most common technology for treating POME is open anaerobic and aerobic ponds and
later the use as land application and fertiliser (Lim et al. 1999). Therefore, this treatment is
applied in our baseline scenario. However, this causes high emission levels of the green
house gas methane. The alternative technology is the installing of digester tanks for biogas
capturing and subsequent utilisation of biogas for electricity production. As value for the
methane emissions from POME, we apply 1,093.59 g CO2 eq per kg CPO. We calculate
this value according to average POME output of 672.5 g POME per kg FFB (Ma et al.
2004; Singh 1999) and CH4 emissions of 13.0 g per kg POME (Ma et al. 2004; Yacob et al.
2006).8 The converted value is calculated from production yield of 0.1998 t CPO per t FFB
and the methane emissions of POME of 8.74 g per kg FFB and the methane GWP of 25
CO2 eq.
The energy supply to the oil mill includes electricity and steam. Most, if not all, palm oil
mills are self-sufficient in electricity and heat (Henson 2004, p. 30). Normally, fibre and
shells are burned for energy purposes (Department of Environment 1999; Henson 2004;
Subranamiam et al. 2005; Weng 1999). Schmidt (2007) analyses the required input data of
8 The methane content of biogas is 65 % (Ma et al. 2004). Thus, the methane emission could be calculatedas 18.2 m3 per t POME. With a density of methane at 0.717 g per litre (Andersen et al. 1981, p. 119), theCH4 emission is 13.0 kg per t POME. Yacob et al. (2006) have measured the methane emission from a pondsystem over a period of 12 months. The average methane emission is 13.1 kg CH4/t POME. This is in goodaccordance with the figures provided in Ma et al. (2004).
Recalculating GHG emissions saving of palm oil biodiesel 439
123

energy (steam and electricity) and heating values of fibre and shell of Chavalparit et al.
(2006), Husain et al. (2003), Singh and Thorairaj (2006), Subranamiam et al. (2005), and
Weng (1999). He concludes that all of the fibre and shell are used as boiler fuel. Thus,
130.0 kg fibre and 70.0 kg shell are burned per tonne of FFB input. Fibre and shell have
calorific values 19.1 MJ per kg and 20.1 MJ per kg (dry matter basis), respectively (Su-
branamiam et al. 2004). With average moisture content of fibre (40 %) and shell (10 %)
(values given in Ma et al. 2004; Singh 1999; Yusoff 2006; Yusof and Weng 2004), the
calorific value of the fuel composition of 65 % fibre and 35 % shell can be determined as
13.8 MJ per kg. Hence, the theoretical energy input is 2,763 MJ per t FFB.
Husain et al. (2003) surveyed seven palm oil mills where utilisation factors averaging at
65.6 %. The average heat to power ratio is 17.9 %. Thus, the total heat and power pro-
duction per t FFB is 1,811 MJ distributed on 1,708 MJ steam and 104 MJ electricity. The
figures on steam and electricity production per t FFB could be confirmed by Singh and
Thorairaj (2006). According to Singh and Thorairaj (2006) and Subranamiam et al. (2005),
the steam requirement for processing of 1 tonne FFB is 1,691 MJ or 469.7 kWh. It is usual
that excess steam is released to the atmosphere (Kandiah et al. 1992; Subranamiam 2006a).
Therefore, we assume that the difference between the required steam (469.7 kWh) and the
produced steam (474.4 kWh) is released to the atmosphere.
The electricity recovered from the turbine, that is, 104 MJ/t FFB or 28.9 kWh per t FFB,
exceeds the requirement for processing the FFB. The required electricity for processing 1 t
FFB varies between 14.5 kWh (Chavalparit et al. 2006) through 17.7 kWh (Yusoff and
Hansen 2007) to 18–22 kWh (Singh and Thorairaj 2006) and 20 kWh (Ma et al. 2004).
We assume an average requirement of 20 kWh per t FFB. Thus, there is approximately
30 % electricity in excess, that is, 8.9 kWh per t FFB. If palm oil mills are not connected to
the national grid, the excess electricity displaces electricity from the grid indirectly, as it is
used locally on the estate in administration and residence buildings for the workers and
there families and sometimes in a refinery if the estate has its own refinery plant. Since
these buildings are connected to the national grid or to local generators, the excess elec-
tricity displaces electricity delivered from the grid directly. In addition to the input of fibre
and shell, the power central uses fossil fuel for start-ups of the boiler in the power central.
According to Subranamiam et al. (2005), oil mills use 0.37 litre of diesel per t FFB.
Palm kernel oil and palm kernel cake are extracted from the kernels in a mechanical
pressing process to produce high valued edible palm oil (MPOB 2006; Singh 2006).
According to Subranamiam (2006a), mechanical pressing in Malaysia is done using a
double pressing method without pre-heating.
The inventory is mainly provided by Subranamiam (2006a, b). The palm kernel oil mill
processes the kernels from the palm oil mill into palm kernel oil (PKO) and palm kernel
meal (PKM). The product flow (Bockisch 1998) of PKO, PKC and processed entire kernels
is based on average figures from 2002/2003 to 2003/2004 given in Oil World (2005). To
produce 1 t PKO and 1.161 t PKM, 2.228 t entire palm kernels are processed.
In this analysis, we apply an energy use of 267.2 kWh per t PKO in Malaysian palm
kernel oil mills given in Subranamiam (2006b). This is allocated with the excess electricity
of the CPO milling stage in our calculations. All input values of PKO milling are converted
to the input of 10,000 t FFB in the CPO milling stage according the respective output of
entire palm kernels in the different scenarios.
Transport of FFB to the oil mill is included in our values of diesel use in the plantation
stage. All transports of FFB takes place in the plantation since oil mills are situated in or
very close to the plantation (Schmidt 2007).
440 G. Pehnelt, C. Vietze
123
3.3 Refinery stage
In the refining process (e.g. neutralisation, bleaching and deodorisation) of palm oil, nearly
non additional chemicals are used. As (the small amounts of) phosphoric acid and sodium
hydroxide are only used in the production of the by-products animal food and soap,
according to IFEU (2010), we neglect these chemicals as input factors. In the steps of the
production processes to refined palm oil (RefPO), some losses of oil take place. The loss in
the neutralisation process mainly includes the separated free fatty acids. Corresponding to
Kang (2006), CPO has free fatty acid content of between 3 % and 5 %. Thus, Schmidt
(2007) assumes that CPO sent to refining has free fatty acid content at 4.2 % and the loss in
the neutralisation process is calculated at 4.2 % similarly. Since the use of bleaching earth
is 4.53 kg per t RefPO (UPRD 2004), the loss of oil in the bleaching process can be
calculated at about 0.2 %.
The used energy for all production steps of the refinery stage is calculated by Schmidt
(2007). He assumes a use of 35 kWh per t RefPO electricity from the grid and heat input of
328 MJ per t RefPO which is provided by burning 9 litres of diesel per t RefPO.
3.4 Transportation stage
The refined palm oil produced in South-East Asia is supposed to be transported in a diesel
operated truck for about 200 km on average to a port (Schmidt 2007). From there, it is
transported in an oceanic tanker operated with HFO. The average distance between major
ports in South-East Asia and Europe has been conservatively calculated to be 14,975 km
(PortWorld Distances 2011).9
In alternative scenarios, we calculate with the EU default value of 135 g CO2eg per kg
RefPO provided by JEC (2011) E3-database (version 31-7-2008).
3.5 Esterification
Based on the standard methodology proposed by the EU (2009) (Directives 2009/28/EC
and 2009/30/EC), we have calculated the GHG emissions that can be expected in the
transesterification process in which methanol is combined with the refined palm oil in order
to derive palm oil methylester. During this process, glycerol evolves as a by-product. This
by-product can for instance to be used to produce soap or other materials. Although the
economic value of glycerol might be higher than its calorific value, we only consider the
energy content of this by-product in calculating the GHG emissions of the whole process.10
In the calculations documented in the following Table 4 we, again, use conservative
values on the efficiency of the esterification process based on common technologies using
values for energy consumption and chemical inputs on the upper end of the range that can
be found in recent publications.
Taking the energy content of the by-product glycerol into account, we end up with a
total net GHG emission of about 10.29 g CO2 eq/MJ FAME.
Alternatively, we use a second scenario of the esterification process in some of our cal-
culations. The GHG emissions of more sophisticated current technologies are supposed to be
9 The distance represents the distance from Port Kelang in Malaysia to the port in Rotterdam (TheNetherlands).10 The by-product glycerol provides a GHG emissions credit.
Recalculating GHG emissions saving of palm oil biodiesel 441
123

far below the overall emissions of older procedures.11 This is the case for both this esterifi-
cation process and the production of methanol which accounts for most of the overall GHG
emissions associated with the whole process. New technologies include bio-methanol, synth-
ethanol as well as lower temperatures and lower energy input in the very esterification
process.12 A reliable and reasonable figure for GHG emissions of current technologies in
vegetable oil esterification can be found in Weindorf (2008). Although the GHG emissions
credit of the by-product glycerol—which reduces the total GHG emissions value—supposed
in Weindorf (2008) is quite small (1.2 g CO2 eq/MJ) and well below the calculations shown
in the table above, we use the value of 7.1 g CO2/MJ FAME in our alternative scenarios.
3.6 Reference value
The reference value for the GHG emission savings, the average CO2 emission resulting
from the combust of fossil diesel, is problematic, since the CO2 emissions from the
Table 4 Esterification process—background data GHG emissions calculations
Value Unit
Yield
FAME 0.9965 MJ FAME/MJ RefPO
By-product refined glycerol 105.00 kg/t FAME
GHG emissions
Value Unit
Energy consumption
Electricity 0.0041 MJ/MJ FAME 0.5213 g CO2 eq/MJ FAME
Steam (from NG boiler) 0.0760 MJ/MJ FAME
NG Boiler
CH4 and N2O emissions from NG boiler 0.0304 g CO2 eq/MJ FAME
Natural gas input/MJ steam 1.1111 MJ/MJ Steam
Natural gas 0.0844 MJ/MJ FAME 5.7408 g CO2 eq/MJ FAME
Electricity input/MJ steam 0.0200 MJ/MJ Steam
Electricity 0.0014 MJ/MJ FAME 0.1949 g CO2 eq/MJ FAME
Chemicals
Phosphoric acid (H3PO4) 0.05000 g/MJ FAME 0.1515 g CO2 eq/MJ FAME
Hydrochloric acid (HCl) 0.55000 g/MJ FAME 0.4142 g CO2 eq/MJ FAME
Sodium carbonate (Na2CO3) 0.06800 g/MJ FAME 0.0818 g CO2 eq/MJ FAME
Sodium hydroxide (NaOH) 0.18500 g/MJ FAME 0.0872 g CO2 eq/MJ FAME
Methanol 0.05900 MJ/MJ FAME 5.9087 g CO2 eq/MJ FAME
Total gross GHG emissions 13.1309 g CO2 eq/MJ FAME
By-Product Glycerol 2.8452 g CO2 eq/MJ FAME
Total net GHG emissions 10.2857 g CO2 eq/MJ FAME
11 For some technical details of the esterification and purification process see Chongkhong et al. (2007) andSuppalakpanya et al. (2010).12 Note that we do not take into account even more sophisticated technologies such as ethyl transesterifi-cation, co-processing or hydrogenisation which offer much lower GHG emissions than current methylesterification practices.
442 G. Pehnelt, C. Vietze
123

extraction of these fuels have to be taken into account and these emissions vary depending
on the very process. The European Union (EU) (2009) sets the reference value for GHG
emissions from fossil fuel at 83.8 g CO2 eq/MJ.
Table 5 summarises the emissions generated in the production phase of European
diesel, as calculated by recent studies.
Given these figures, the total emissions in the life cycle of fossil diesel vary between
83.3 and 87.3 g CO2 eq/MJ (73.1 g CO2 eq/MJ for direct combustion). The EU reference
value for GHG emissions is close to the lower bound of this range and therefore rather
underestimating the carbon savings of biofuels (Pehnelt and Vietze 2009). That is why we
are using two different reference values in our models.
It should be noticed that the values given above do not take into account the
exhaustibility of crude oil reserves. Future extraction of fossil oil is likely to cause sub-
stantially higher GHG emissions than the EU reference value. For example, the extraction
of oil from bituminous sands, widely spread especially in Canada, requires large quantities
of steam, and the fuel produced using these resources is expected to cause about 50 %
more GHG emissions compared with the extraction and use of conventional crude oil.
Similarly, with almost a third of the coal’s chemical energy loss in terms of waste heat in
the conversion process, the coal-to-liquid process technology, which is seen as an alter-
native to conventional oil resources, is also less efficient (Pehnelt and Vietze 2009).
Furthermore, the future extraction and use of the remaining conventional oil reserves will
produce higher GHG emissions than today, owing to the smaller size and geographic
inaccessibility of the remaining productive fields (Cockerill and Martin 2008).
Additionally, in all scenarios, we refer to a third reference value for palm oil used for
electricity production. We use the value of 91 g CO2 eq/MJ for electricity production from
fossil oil regarding and the ‘Guidance on Sustainable Biomass Production’ (Biokraft-
NachV) published by the German Federal Agency for Food and Agriculture (BLE 2009)
and the EU-Directive 2009/28/EC (European Union (EU) 2009). As the generation of
electricity operates with refined plant oil (without transesterification), we calculate the CO2
emissions savings of electricity production after the refinery stage.
3.7 Allocation of by-products
Like many other production processes, biofuel production is a multi-input/multi-output
product system. Therefore, to correctly evaluate the impacts of biofuels, co-products need
to be taken into account as well. Allocation of by-products is the method by which input
energy and material flows as well as output emissions are distributed among the product
and co-products. There are quite a few methodologies of integrating the allocation of co-
products into LCA, among others mass allocation, economic allocation, energy or exergy
allocation and substation method. The very method applied may have considerable impacts
on the final results and is also an area of extensive debates and discrepancies among
different LCA studies (Menichetti and Otto 2009).13
Table 5 GHG emission from production, transport and distribution of fossil diesel (without direct emis-sions from combustion)
Source Silva et al. (2006) CONCAWE et al. (2006) GM et al. (2002)
g CO2 eq/MJ diesel 14.2 14.2 10.2
13 See for instance Weidema (2001).
Recalculating GHG emissions saving of palm oil biodiesel 443
123

In order to assess the effects of by-products, one could choose a mass-based allocation
scheme, methods that take the energy content into account or an economic allocation. The
latter, economic allocation, takes the actual economic value of the co-products into account
and therefore provides an (potential) income perspective. Such an assessment seems to be
the preferable one for LCA since it reflects the actual market conditions more properly than
other methods. However, because prices may fluctuate quite rapidly, economic allocation
methods significantly increase the volatility of results and therefore their uncertainty.
Ideally, this approach would require analysts to re-conduct an LCA study several times and
adjust the results accordingly. However, this is very difficult for regulatory implementation
purposes (Menichetti and Otto 2009). This is likely the reason that most LCA studies on
biofuels focus instead on other allocation methods. The most common allocation method is
the energy allocation which takes the energy content of the by-products into account. This
is indeed a pragmatic approach since the calorific value of certain by-products can be
measured relatively easily, with the results usually within a very narrow range. However, a
combination of energy content allocation and economic allocation still seems to be more
appropriate to assess the overall impact of biofuels over their lifetime.14
Because we want to be as close as much to the current methods of calculating GHG
emissions saving potentials used for regulatory purposes, for example, the methods applied
by the European Union (EU) (2009), we also use—according to IFEU (2010) and BioGrace
(2010)—an allocation scheme based on the energy content of the by-products. This allo-
cation method is indeed not very generous to palm oil–based biodiesel, especially if high
value by-products such as palm kernel oil are part of the production chain.
4 Results
By using the above mentioned values, we ran estimations on the GHG emissions saving
potential of palm biodiesel in different scenarios. In all scenarios, we derive the GHG
emissions of every step of the palm biodiesel production chain. Moreover, we present three
values for the overall GHG emissions saving potential regarding the respective fossil fuel
comparator.
The first value shows the GHG emissions savings of palm oil used for electricity
production regarding RED (EU 2009) and the ‘Guidance on Sustainable Biomass Pro-
duction’ (Biokraft-NachV) published by the German Federal Agency for Food and Agri-
culture (BLE) and is the technical aspect of chapter IX ‘Concrete calculation of greenhouse
gas reductions’ (BLE 2009). The second value displays the saving potential compared with
the value of fossil oil as stated by the EU-Directive (EU 2009). Additionally we estimate
the GHG emissions saving compared with current LCA of fossil fuel emissions as applied
by CONCAWE et al. (2006), and Silva et al. (2006).
Figure 1 shows the GHG emissions of every single step of the production of refined
palm oil (g CO2 eq/MJ RefPO), namely plantation, oil mill, refinery and transport from
South-East Asia to Europe.15
14 Note that mass allocation turns out to be much more generous to biofuels than other methods (Menichettiand Otto 2009). Furthermore, using economic allocation methods, the results are more in favour of palm oilbiodiesel than for other oil seeds such as rapeseed.15 Note that the transportation of FFB and other pre-products in the country of origin is considered in theplantation step in most scenarios. See the detailed tables in the Appendix.
444 G. Pehnelt, C. Vietze
123

The GHG emissions in connection with the cultivation process (plantation) account for
about 9.7–12.2 g CO2 eq per MJ refined palm oil, dependent on the very conditions such as
fertiliser use, etc.16 The implementation of specification of land use or land use change
might significantly affect these calculations, ranging from huge GHG credits in the case of
formerly degraded or marginal land to moderate GHG credits or GHG emissions close to
zero in the case of formerly agricultural area in use to moderate additional GHG emissions
in the case of secondary rainforest and an initial carbon debt in the case of primary
rainforest on peat land.
However, as explained in the previous chapters, we do not cover land use change
explicitly in our calculations since this issue is subject to separate criteria in the Renewable
Energy Directive (European Union (EU) 2009).
GHG emissions associated with the refinery process are marginal. The GHG emissions
of the transport of the refined palm oil to the importing country (EU) are also comparably
small even when very conservative figures are applied higher than the JEC standard value.
If the methane emissions in the milling process are not captured (scenarios 1–7), the oil
mill process accounts for the highest GHG emissions because of the highly GHG relevant
emissions of methane in POME. The results clearly indicate that methane capture is the
most desirable technology since GHG emissions could be dramatically reduced if a full
methane capture in the milling process is applied. However, in most small-scale oil mills,
this technology is not available yet and investments in this technology might be too
expensive for small operators. However, efforts to introduce this technology sector wide
are already under way (see Sect. 2.1).
GHG Emissions of Palm Oil Production per Stage (g CO2 eq/MJ RefPO)
43.9 43.941.3 41.3 40.0 40.0
45.1
13.4
-5
55g
CO
2 eq
/MJ
Ref
PO
transport (to EU)
refinery
oil mill
plantation 12.23 12.23 9.73 9.73 9.73 9.73 10.56 9.73
total GHG emissions
4.95 4.95 4.95 4.95 3.65 3.65 4.95 3.65
0.93 0.93 0.93 0.93 0.93 0.93 0.93 0.93
25.77 25.77 25.68 25.68 25.68 25.68 28.61 -0.89
43.88 43.88 41.30 41.30 40.00 40.00 45.05 13.43
Scenario 1 Scenario 2 Scenario 3 Scenario 4 Scenario 5 Scenario 6 Scenario 7 Scenario 8
Fig. 1 GHG emissions of palm oil production per stage
16 We calculate the GHG emissions of every single step per MJ refined palm oil. The efficiency of themilling and refining process indeed has an impact on the very output and therefore the figures calculated forpre-processing steps. In order to reduce the range of our results, we are using a rather narrow and con-servative bandwidth of the efficiency of the full production process.
Recalculating GHG emissions saving of palm oil biodiesel 445
123

Overall, the GHG emissions of the production of refined palm oil are supposed to range
from about 40 g CO2 eq per megajoule (scenario 5 and 6) to about 45 g CO2 eq per
megajoule (scenario 7).
For all of our scenarios, we calculate the GHG emission saving potentials of refined
palm oil as an input in power plants (electricity production) as well as the GHG emissions
saving potentials of palm oil–based biodiesel (FAME) produced by using common but not
highly sophisticated esterification technologies. All relevant data and results are docu-
mented in detail in the Appendix of the paper.
In scenario 1 (see Table 6), we use the average of the range of values that can be found
in studies on palm oil (see again the paragraphs on the methodology in this paper). In
scenario 1, the energy content of entire palm kernels is considered as a co-product,
regardless of the further processing of these palm kernels which usually provides high
value products.17 For esterification, the value on GHG emission (Weindorf 2008) is applied
in scenario 1.
The results of scenario 1 (for an overview of the scenario assumptions see Table 7)
indicate GHG emissions savings of palm oil biodiesel clearly beyond the EU’s 35 %
threshold. Namely, the GHG emission saving potential of refined palm oil used for elec-
tricity production in power plants is 52 % compared with fossil electricity production (see
Fig. 2).
The GHG emissions saving potential of biodiesel used in vehicle engines compared
with fossil fuel ranges between 38.5 and 41.0 %, dependent on the very fossil comparator
used (see the two charts of Fig. 3).
In scenario 2 (Table 9), we apply a value for GHG emissions in the esterification
process conducted by calculations based on conservative values. The same data for
plantation, oil mill, refinery and transport as in Scenario 1 are used. Because of the higher
GHG emissions of the esterification process in this scenario, the GHG saving values are
slightly inferior to scenario 1.
Only in the worst case scenario with the low fossil fuel comparator I, the GHG emission
saving fails to reach the 35 % threshold by just a few tenths of a percentage point (see two
charts of Fig. 3).
An estimation of the most current data on the production process of palm biodiesel is
used in scenario 3 (Table 10). In general, an increase in the output and a decrease in the
input figures because of improvements in the entire production chain have been observed
in recent years. Current comments and data indicate that the output per hectare might be
even higher with new varieties of oil palm and current cultivation technologies. How-
ever, since the information could not be verified through the published sources, we do
not use these figures in our scenarios. In order to get closer to current production
patterns, we use the most current values on plantation (fertiliser and pesticide input,
output of FFB), the oil mill stage (output, achievements in POME treatment), and
esterification (energy input) available in reliable sources in scenario 3. For the refinery
and transport stage, we could not verify values other then those used in our baseline
scenario. The emission saving values reflect the observed improvements along the pro-
duction chain: With 55.0 % saving compared with conventional energy production and
41.6 % (comparator I) and 44.0 % (comparator II) saving compared with fossil diesel,
the EU target is easily reached.
17 It shall be mentioned again that an economic or mass allocation of by-products would produce resultsmore beneficial to palm oil biodiesel than the energy content allocation method used here.
446 G. Pehnelt, C. Vietze
123

Table 6 Scenario 1—Entire PK, esterification latest values
Value Unit Source
Plantation
Output
Yield FFB per ha 18,870 kg FFB per ha per year FAOSTAT (2006)
Input
N-fertiliser 105 kg N per ha per year Yusoff and Hansen (2007),Subranamiam (2006a), UPB(2006), FAO (2004), Henson(2004), IFA et al. (2002)
P2O5-fertiliser 70 kg P2O5 per ha per year Yusoff and Hansen (2007),Subranamiam (2006a), UPB(2006), FAO (2004), Henson(2004), IFA et al. (2002)
K2O-fertiliser 204 kg K2O per ha per year Yusoff and Hansen (2007),Subranamiam (2006a), UPB(2006), FAO (2004), Henson(2004), IFA et al. (2002)
CaO-fertiliser 0 kg CaO per ha per year Yusoff and Hansen (2007),Subranamiam (2006a), UPB(2006), FAO (2004), Henson(2004), IFA et al. (2002)
Pesticides 2.73 kg active ingredient perha per year
Singh (2006)
Diesel (for all activitiesand transport)
58.2 l per ha per year Singh (2006), Yusoff and Hansen(2007), Unilever (1990)
GHG emissions of andafter plantation
100.22 g CO2 eq per kg FFB Note: Entire palm kernels not usedfor CPO but higher valuedproducts. Energy content of EPKconsidered, but not the highereconomic value of PKOproduced via cold pressing
GHG emissions of andafter plantation
452.35 g CO2 eq per kg RefPO
GHG emissions of andafter plantation
12.23 g CO2 eq per MJ RefPO
Oil mill
Main output
Produced CPO 199.8 t CPO per 1,000 t FFB peryear
Malaysian average 2003–2005given in MPOB (2005) andMPOB (2006)
Palm kernel oil(by-product)
0 t PKO per 1,000 t FFBper year
Palm kernel meal(by-product)
0 t PKM per 1,000 t FFBper year
Entire palm kernels(by-product)
53.2 t EPK per 1,000 t FFB peryear
Malaysian average 2003–2005given in MPOB (2005) andMPOB (2006)
Input/POME
n-Hexane 0 t per 1,000 t FFB per year Schmidt (2007)
CH4 emissions fromPOME
1,093.6 g CO2 eq per kg CPO Calculations based on Yacob et al.(2006), Ma et al. (2004), Singh(1999), Andersen et al. (1981)
Energy consumption
Fuel oil 370 l per 1,000 t FFB per year Subranamiam et al. (2005)
Recalculating GHG emissions saving of palm oil biodiesel 447
123

Table 6 continued
Value Unit Source
Natural gas 0 kWh per 1,000 t FFB peryear
Subranamiam et al. (2005), Henson(2004), Department ofEnvironment (1999)
Electricity (external) 0 kWh per 1,000 t FFB peryear
Subranamiam et al. (2005), Henson(2004), Department ofEnvironment (1999)
Surplus electricity(output)
8,900.0 kWh per 1,000 t FFB peryear
Schmidt (2007), Husain et al.(2003), Singh and Thorairaj(2006), Chavalparit et al. (20060
Surplus steam (output) 0 kWh per 1,000 t FFB peryear
Subranamiam (2006a)
Allocation factor after by-products
0.863
Transport
Average distanceplantation/oil mill
– Note: Diesel use for transportalready covered in the cultivationstage
GHG emissions after oilmill
1,345.32 g CO2 eq per kg CPO
GHG emissions of oilmill
953.51 g CO2 eq per kg RefPO
GHG emissions of oilmill
25.77 g CO2 eq per MJ RefPO
Refinery
Output
Produced RefPO 957 t RefPO per 1,000 t CPOper year
Schmidt (2007), Singh (2006),Kang (2006), UPRD (2004)
Input
Fuller’s earth 4.3 t per 1,000 t CPO per year UPRD (2004)
Energy consumption
Natural gas 0 kWh per 1,000 t CPO peryear
Fuel oil 8,612 l per 1,000 t CPO per year Schmidt (2007)
Electricity (external) 33,493 kWh per 1,000 t CPO peryear
Schmidt (2007)
Electricity mix Malaysia(highvalue)
JEC E3-database, version 31-7-2008
GHG emission afterrefinery
1,440.44 g CO2 eq per kg RefPO
GHG emissions ofrefinery
34.58 g CO2 eq per kg RefPO
GHG emissions ofrefinery
0.93 g CO2 eq per MJ RefPO
Transport (to Europe)
Transport (overland)
Average distance oilmill/refinery/port
200 km Schmidt (2007)
448 G. Pehnelt, C. Vietze
123

Even if we rely on the inferior values for esterification (WTT Appendix v3) but using
the same figures for plantation, milling, refinery, and transport as in scenario 3, the results
exceed the 35 % threshold (all comparators (see scenario 4 in Table 11, with emission
savings of 55.0 % (electricity) 37.8 % (fuel I) and 40.3 % (fuel II)).
Table 6 continued
Value Unit Source
Vehicle usedtransporting RefPO
Truck forliquids(Diesel)
Schmidt (2007)
Used fuel for vehicle Diesel Schmidt (2007)
Transport (ship)
Average distance Asia-Europe
14,975 km PortWorld Distances (2011)
Vehicle usedtransporting RefPO
Ship/tanker50kt (Fueloil)
Schmidt (2007)
Used fuel for vehicle HFO Schmidt (2007)
GHG emissions aftertransport
1,623.59 g CO2 eq per kg RefPO
GHG emissions oftransport
183.15 g CO2 eq per kg RefPO
GHG emissions oftransport
4.95 g CO2 eq per MJ RefPO
Total GHG emissionsRefPO
1,623.59 g CO2 eq per kg RefPO
43.88 g CO2 eq per MJ RefPO
GHG emission savingsRefPO compared withfossil comparator(electricity production)
52.0 % 91 g CO2 eq/MJ (RED2009/28/EC)
Esterification
CO2 emissions afterEsterification
1,896.49 g CO2 eq per kg FAME
CO2 emissions ofesterification
264.12 g CO2 eq per kg FAME Weindorf (2008)
CO2 emissions ofesterification
7.10 g CO2 eq per MJ FAME Weindorf (2008)
Total CO2 emissionsFAME
1,896.49 g CO2 eq per kg FAME
Total CO2 emissionsFAME
51.53 g CO2 eq per MJ FAME
Fossil comparator
GHG emission savings comparedwith fossil comparator I (fuel diesel)
38.5 % 83.8 g CO2 eq/MJ (RED 2009/28/EC)
GHG emission savings comparedwith fossil comparator II (fuel diesel)
41.0 % 87.3 g CO2 eq/MJ (Silva et al. 2006;CONCAWE et al. 2006)
Recalculating GHG emissions saving of palm oil biodiesel 449
123

In scenario 5 (Table 12) and 6 (Table 13), respectively, we run the same estimation as
in scenarios 3 (esterification according Weindorf 2008) and 4 (esterification according
CONCAWE et al. 2006), but using the JEC (2011) default value on transport stage of
135 g CO2 eq per kg RefPO (see JEC E3-database (version 31-7-2008)). As this default
value is lower than our conservative transport figures, higher GHG emissions saving values
[56.0 % (electricity), 43.2 % (fuel I), 45.5 % (fuel II) for scenario 5 and 56.0 % (elec-
tricity), 39.3 % (fuel I), 41.8 % (fuel II) for scenario 6]—all above the EU emission target
of 35 %—could be estimated.
Even if we analyse the production chain of palm biodiesel under consideration of a
further processing (and the supplemental energy input) of the entire palm kernels to palm
kernel oil and palm kernel meal (scenario 7, Table 14), we could derive emission saving
figures (50.0 % (electricity), 37.1 % (fuel I), 39.6 % (fuel II)) well exceeding the EU
target.
Again, we use the latest values on input and output figures as in scenario 3. It is
important to note that only the caloric heating value of these by-products is considered in
our estimation. However, these products are high valued stocks with an economic value
Table 7 Overview scenario assumptions
Scenario Main assumptions
Scenario 1 Average values plantation, oil mill, refinery, transport; current values esterification
Scenario 2 Average values plantation, oil mill, refinery, transport; conservative valuesesterification
Scenario 3 Current values plantation, oil mill, refinery, transport, esterification
Scenario 4 Current values plantation, oil mill, refinery, transport; conservative valuesesterification
Scenario 5 Current values plantation, oil mill, refinery; transport according JEC; current valuesesterification
Scenario 6 Current values plantation, oil mill, refinery; transport according JEC; conservativevalues esterification
Scenario 7 Palm kernel oil as additional by-product; current values plantation, oil mill, refinery,transport, esterification
Scenario 8 Methane capturing in oil mill; current values plantation, oil mill, refinery; transportaccording JEC; current values esterification
GHG Emissions Savings Refined Palm Oil vs. Reference Value (electricity production)
52% 52% 55% 55% 56% 56%50%
85%
0%
25%
50%
75%
100%p
erce
nt
refe
ren
ce v
alu
e (e
lect
rici
ty p
rod
uct
ion
)
GHG emissions savings 52% 52% 55% 55% 56% 56% 50% 85%
Scenario 1 Scenario 2 Scenario 3 Scenario 4 Scenario 5 Scenario 6 Scenario 7 Scenario 8
Fig. 2 GHG emissions savings of refined palm oil used in oil fired power plants
450 G. Pehnelt, C. Vietze
123

considerably exceeding the caloric value. Palm kernel oil is used as edible oil in food
production, while palm kernel meal is sold as fodder for livestock, replacing the use of
soybean meal. That is why the pure energy content allocation does not reflect the real
allocation pattern. Basically, we suggest to alternatively considering the economic allo-
cation in LCA which better reflects the economic and social impact of the whole pro-
duction chain. However, in this study, we refrain from doing so because we want to be as
close as possible to the current methodology used by the European Union (EU) (2009).
In the last scenario (scenario 8, Table 15), we apply a technology not yet commonly
used but not unusual either, namely methane capturing (and using as bio gas) of POME
emissions in the palm oil mill. As in scenario 5, we use the latest values with the transport
default value according to JEC (2011). The emission savings values figure with 85.0 %
compared with conventional electricity production, and 75.4 % (EU 2009) respective
76.4 % (CONCAWE et al. 2006; Silva et al. 2006) compared with fossil diesel. These
saving values are not only way beyond the RED’s thresholds but also far higher than the
GHG emissions savings calculated by the Directive typical (62 %) and default (56 %)
values given in the case of palm oil with methane capture.
GHG Emissions Savings FAME vs. Reference Value I
38.5%34.7%
41.6%37.8%
43.2%39.3% 37.1%
75.4%
0%
25%
50%
75%
per
cen
t re
fere
nce
val
ue
I (F
AM
E b
iod
iese
l)
GHG emissions savings
RED threshold
GHG Emissions Savings FAME vs. Reference Value II
41.0%37.3%
44.0%40.3%
45.5%41.8% 39.6%
76.4%
0%
25%
50%
75%
per
cen
t re
fere
nce
val
ue
II (F
AM
E b
iod
iese
l)
GHG emissions savings
RED threshold
38.5% 34.7% 41.6% 37.8% 43.2% 39.3% 37.1% 75.4%
35% 35% 35% 35% 35% 35% 35% 35%
Scenario 1 Scenario 2 Scenario 3 Scenario 4 Scenario 5 Scenario 6 Scenario 7 Scenario 8
Scenario 1 Scenario 2 Scenario 3 Scenario 4 Scenario 5 Scenario 6 Scenario 7 Scenario 8
41.0% 37.3% 44.0% 40.3% 45.5% 41.8% 39.6% 76.4%
35% 35% 35% 35% 35% 35% 35% 35%
Fig. 3 GHG emissions savings of palm oil–based biofuel
Recalculating GHG emissions saving of palm oil biodiesel 451
123

Overall, our conservative calculations based on JEC (2011) background data and current
publications on palm oil production result in GHG emissions saving potentials of palm oil–
based biodiesel fairly above the 35 % threshold. We could not reproduce the EU’s GHG
saving values for palm oil. Our results rather confirm the higher values obtained by other
studies mentioned in our last paper (Pehnelt and Vietze 2009) and elsewhere in this study.
5 Summary and conclusion
The purpose of this review was to gain a comprehensive understanding of the metrics
considered in developing the GHG emissions saving values (typical and default) in the
Directive, utilising palm oil—one of the more controversial biofuel sources—as a case
study of this process. Unfortunately, the conclusions of this analysis demonstrate that the
methodology employed by the JRC lacks credibility, and subsequent efforts to gain further
clarity from the JRC were not successful. As a result, the authors of this report support the
efforts by environmental NGOs to gain further clarity on the European Commission’s and
EU’s calculations and deliberations on the assessment of biofuels, and institute greater
transparency in the process.
Based on the standard calculation scheme proposed by the Renewable Energy Directive
(European Union (EU) 2009) and using current data of palm oil biodiesel production
published in various reliable sources, we cannot reproduce the GHG emissions saving
values for palm oil biodiesel given in the annex of the RED. In contrast, our results indicate
emissions saving values for the GHG emissions savings potential of palm oil biodiesel not
only far above the 19 per cent default and 36 per cent typical value published in RED but
also beyond the 35 per cent threshold. Our results confirm the findings by other studies and
challenge the official typical and default values published in RED.
These findings and concerns surrounding the trade implications of the Directive give
cause for serious concern within the EU community regarding the viability of the system to
effectively deliver the GHG emissions savings that are required in the legislation. While
limiting imports of inefficient and environmentally damaging biofuel sources should be
supported, distorting technical parameters in legislation to limit entry into the European
market would be costly for consumers and businesses while exposing the EU to unnec-
essary trade disputes and possible retaliation.
The EU has been a leader in the promotion of low-carbon solutions to energy needs and
the development of technologies that will spur a new age of energy generation and
transportation. Unfortunately, since the EU began to pursue this goal, the debate has
increasingly turned to how these efforts can be increasingly limited, through introduction
of new, untested sustainability criteria and trade barriers to limit competition from third
countries. Not only will these measures undermine confidence in Europe’s low-carbon
ambitions, however, they will also harm the global cooperation that is a key to achieving
these goals.
Open Access This article is distributed under the terms of the Creative Commons Attribution Licensewhich permits any use, distribution, and reproduction in any medium, provided the original author(s) and thesource are credited.
Appendix
See Tables 8, 9, 10, 11, 12, 13, 14, 15.
452 G. Pehnelt, C. Vietze
123

Ta
ble
8B
ack
gro
un
dd
ata
Glo
bal
war
min
gp
ote
nti
als
(GW
P’s
)g
CO
2-e
q/g
CO
21
.00
CH
42
5.0
0
N2O
29
8.0
0
Ag
roin
pu
tsG
HG
emis
sio
nco
effi
cien
tF
oss
ilen
erg
yin
pu
t
gC
O2/k
gg
CH
4/k
gg
N2O
/kg
gC
O2-e
q/k
gM
Jfo
ssil
/kg
N-f
erti
lise
r(k
gN
)2
,82
7.0
05
8.6
79
9.6
42
5,9
17
.23
14
8.9
9
P2O
5-f
erti
lise
r(k
gP
2O
5)
96
4.8
87
1.3
31
0.0
52
1,0
13
.50
91
5.2
3
K2O
-fer
tili
ser
(kg
K2O
)5
36
.31
11
.57
10
.01
25
79
.24
99
.68
CaO
-fer
tili
ser
(kg
CaO
)1
19
.11
60
.21
60
.01
81
29
.96
71
.97
Pes
tici
des
9,8
86
.50
22
5.5
27
1.6
81
11
,02
5.7
37
26
8.4
0
GH
Gem
issi
on
coef
fici
ent
Fo
ssil
ener
gy
inp
ut/
hea
tin
pu
tra
te(L
HV
)
gC
O2/M
Jg
CH
4/M
Jg
N2O
/MJ
gC
O2-e
q/M
JM
Jfo
ssil
/MJ
MJ/
kg
Fu
els
(gas
)
Nat
ura
lg
as(4
,00
0k
m,
Ru
ssia
nN
Gq
ual
ity
)6
1.5
75
0.1
98
0.0
00
66
.59
51
.12
8
Nat
ura
lg
as(4
,00
0k
m,
EU
Mix
qu
alit
y)
62
.96
40
.19
80
.00
06
7.9
84
1.1
28
Met
han
e5
0.0
0
Fu
els:
liq
uid
s(a
lso
con
ver
sio
nin
pu
ts)
Die
sel
87
.64
0.0
00
.00
87
.64
1.1
64
3.1
0
Gas
oli
ne
––
––
43
.20
HF
O8
4.9
80
.00
0.0
08
4.9
81
.09
40
.50
HF
Ofo
rm
arit
ime
tran
spo
rt8
7.2
00
.00
0.0
08
7.2
01
.09
40
.50
Eth
ano
l–
––
–2
6.8
1
Met
han
ol
92
.80
0.2
90
.00
10
0.1
51
.66
19
.90
Recalculating GHG emissions saving of palm oil biodiesel 453
123

Ta
ble
8co
nti
nu
ed
GH
Gem
issi
on
coef
fici
ent
Fo
ssil
ener
gy
inp
ut/
hea
tin
pu
tra
te(L
HV
)
gC
O2/M
Jg
CH
4/M
Jg
N2O
/MJ
gC
O2-e
q/M
JM
Jfo
ssil
/MJ
MJ/
kg
FA
ME
––
––
37
.20
Sy
nd
iese
l(B
tL)
––
––
44
.00
HV
O–
––
–4
4.0
0
PV
O–
––
–3
6.0
0
Fu
els/
feed
sto
ck/b
yp
rod
uct
s—so
lid
sL
HV
MJ/
kg
FF
B2
4.0
0
Bio
Oil
(by
pro
du
ctF
AM
Efr
om
was
teo
il)
21
.80
Gly
cero
l1
6.0
0
Pal
mk
ern
elm
eal
17
.00
Pal
mo
il3
7.0
0
Ele
ctri
city
GH
Gem
issi
on
coef
fici
ent
Fo
ssil
ener
gy
inp
ut
gC
O2/M
Jg
CH
4/M
Jg
N2O
/MJ
gC
O2-e
q/M
JM
Jfo
ssil
/MJ
Ele
ctri
city
EU
mix
MV
11
9.3
60
.29
0.0
11
28
.25
2.7
0
Ele
ctri
city
EU
mix
LV
12
0.7
90
.29
0.0
11
29
.79
2.7
3
Co
nv
ersi
on
inp
uts
GH
Gem
issi
on
coef
fici
ent
Fo
ssil
ener
gy
inp
ut
LH
V
gC
O2/M
Jg
CH
4/M
Jg
N2O
/MJ
gC
O2-e
q/M
JM
Jfo
ssil
/MJ
MJ/
kg
n-H
exan
e8
0.0
80
.01
0.0
08
0.5
30
.32
45
.11
gC
O2/k
gg
CH
4/k
gg
N2O
/kg
gC
O2-e
q/k
gM
J/k
g
Ph
osp
ho
ric
acid
(H3P
O4)
2,7
76
.00
8.9
30
.10
3,0
29
.80
28
.57
Fu
ller
’sea
rth
19
7.0
00
.04
0.0
11
99
.81
2.5
4
454 G. Pehnelt, C. Vietze
123
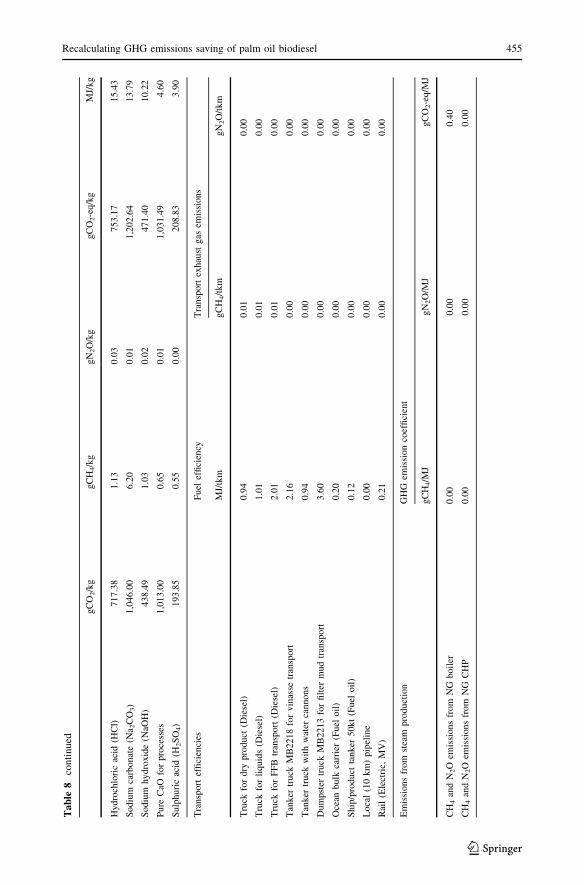
Ta
ble
8co
nti
nu
ed
gC
O2/k
gg
CH
4/k
gg
N2O
/kg
gC
O2-e
q/k
gM
J/k
g
Hy
dro
chlo
ric
acid
(HC
l)7
17
.38
1.1
30
.03
75
3.1
71
5.4
3
So
diu
mca
rbo
nat
e(N
a 2C
O3)
1,0
46
.00
6.2
00
.01
1,2
02
.64
13
.79
So
diu
mh
yd
rox
ide
(NaO
H)
43
8.4
91
.03
0.0
24
71
.40
10
.22
Pu
reC
aOfo
rp
roce
sses
1,0
13
.00
0.6
50
.01
1,0
31
.49
4.6
0
Su
lph
uri
cac
id(H
2S
O4)
19
3.8
50
.55
0.0
02
08
.83
3.9
0
Tra
nsp
ort
effi
cien
cies
Fu
elef
fici
ency
Tra
nsp
ort
exh
aust
gas
emis
sio
ns
MJ/
tkm
gC
H4/t
km
gN
2O
/tk
m
Tru
ckfo
rd
ryp
rod
uct
(Die
sel)
0.9
40
.01
0.0
0
Tru
ckfo
rli
qu
ids
(Die
sel)
1.0
10
.01
0.0
0
Tru
ckfo
rF
FB
tran
spo
rt(D
iese
l)2
.01
0.0
10
.00
Tan
ker
tru
ckM
B2
21
8fo
rv
inas
setr
ansp
ort
2.1
60
.00
0.0
0
Tan
ker
tru
ckw
ith
wat
erca
nn
on
s0
.94
0.0
00
.00
Du
mp
ster
tru
ckM
B2
21
3fo
rfi
lter
mu
dtr
ansp
ort
3.6
00
.00
0.0
0
Oce
anb
ulk
carr
ier
(Fu
elo
il)
0.2
00
.00
0.0
0
Sh
ip/p
rod
uct
tan
ker
50
kt
(Fu
elo
il)
0.1
20
.00
0.0
0
Lo
cal
(10
km
)p
ipel
ine
0.0
00
.00
0.0
0
Rai
l(E
lect
ric,
MV
)0
.21
0.0
00
.00
Em
issi
on
sfr
om
stea
mp
rod
uct
ion
GH
Gem
issi
on
coef
fici
ent
gC
H4/M
Jg
N2O
/MJ
gC
O2-e
q/M
J
CH
4an
dN
2O
emis
sio
ns
fro
mN
Gb
oil
er0
.00
0.0
00
.40
CH
4an
dN
2O
emis
sio
ns
fro
mN
GC
HP
0.0
00
.00
0.0
0
Recalculating GHG emissions saving of palm oil biodiesel 455
123

Ta
ble
8co
nti
nu
ed
Ele
ctri
city
pro
du
ctio
nG
HG
emis
sio
nco
effi
cien
tF
oss
ilen
erg
yin
pu
t
gC
O2/M
Jg
CH
4/M
Jg
N2O
/MJ
gC
O2-e
q/M
JM
Jfo
ssil
/MJ
Ele
ctri
city
(NG
CC
GT
)1
14
.48
0.3
70
.00
10
.68
2.0
5
Ele
ctri
city
(Lig
nit
eS
T)
28
4.7
70
.03
0.0
12
.96
2.4
8
Ele
ctri
city
(Str
awS
T)
5.5
60
.00
0.0
00
.16
0.0
8
Oth
erG
HG
-rel
ated
val
ues
LH
V
MJ/
kg
Pal
mk
ern
els
22
.00
Pal
mk
ern
elo
il3
5.5
0
GH
Gem
issi
on
coef
fici
ent
gC
H4/k
gC
PO
gC
O2-e
q/k
gC
PO
PO
ME
emis
sio
ns
(JE
CE
3-d
atab
ase,
ver
sio
n3
1-7
-20
08
)4
8.9
01
,22
2.6
2
PO
ME
emis
sio
ns
(Sin
gh
19
99
/Ma
etal
.2
00
4/A
nd
erse
net
al.
19
81
/Yac
ob
etal
.2
00
6)
43
.74
1,0
93
.59
PO
ME
emis
sio
ns
(Ma
etal
.2
00
4/Y
aco
bet
al.
20
06
)4
3.5
51
,08
8.7
1
gC
O2-e
q/M
J
Nat
ura
lg
asin
stea
mb
oil
er7
0.6
6
Ele
ctri
city
Gh
ana
14
6.5
6
Ele
ctri
city
Ind
on
esia
27
9.4
7
Ele
ctri
city
Ken
ya
91
.53
Ele
ctri
city
Mal
aysi
a2
52
.71
Ele
ctri
city
Th
aila
nd
23
5.8
9
So
urc
e:JE
CE
3-d
atab
ase
(ver
sio
n3
1-7
-20
08
)
456 G. Pehnelt, C. Vietze
123

Table 9 Scenario 2—entire PK, esterification WTT (CONCAWE et al. 2006) standard
Value Unit Source
Plantation
Output
Yield FFB per ha 18,870 kg FFB per ha per year FAOSTAT (2006)
Input
N-fertiliser 105 kg N per ha per year Yusoff and Hansen (2007),Subranamiam (2006a), UPB(2006), FAO (2004), Henson(2004), IFA et al. (2002)
P2O5-fertiliser 70 kg P2O5 per ha per year Yusoff and Hansen (2007),Subranamiam (2006a), UPB(2006), FAO (2004), Henson(2004), IFA et al. (2002)
K2O-fertiliser 204 kg K2O per ha per year Yusoff and Hansen (2007),Subranamiam (2006a), UPB(2006), FAO (2004), Henson(2004), IFA et al. (2002)
CaO-fertiliser 0 kg CaO per ha per year Yusoff and Hansen (2007),Subranamiam (2006a), UPB(2006), FAO (2004), Henson(2004), IFA et al. (2002)
Pesticides 2.73 kg active ingredient perha per year
Singh (2006)
Diesel (for all activitiesand transport)
58.2 l per ha per year Singh (2006), Yusoff and Hansen(2007), Unilever (1990)
GHG emissions of andafter plantation
100.22 g CO2 eq per kg FFB Note: Entire Palm kernels not usedfor CPO but higher valuedproducts. Energy content of EPKconsidered, but not the highereconomic value of PKOproduced via cold pressing
GHG emissions of andafter plantation
452.35 g CO2 eq per kg RefPO
GHG emissions of andafter plantation
12.23 g CO2 eq per MJ RefPO
Oil mill
Main output
Produced CPO 199.8 t CPO per 1,000 t FFB peryear
Malaysian average 2003–2005given in MPOB (2005) andMPOB (2006)
Palm kernel oil(by-product)
0 t PKO per 1,000 t FFBper year
Palm kernel meal(by-product)
0 t PKM per 1,000 t FFBper year
Entire palm kernels(by-product)
53.2 t EPK per 1,000 t FFB peryear
Malaysian average 2003–2005given in MPOB (2005) andMPOB (2006)
Input/POME
n-Hexane 0 t per 1,000 t FFB per year Schmidt (2007)
CH4 emissions fromPOME
1,093.6 g CO2 eq per kg CPO Calculations based on Yacob et al.(2006), Ma et al. (2004), Singh(1999), Andersen et al. (1981)
Recalculating GHG emissions saving of palm oil biodiesel 457
123
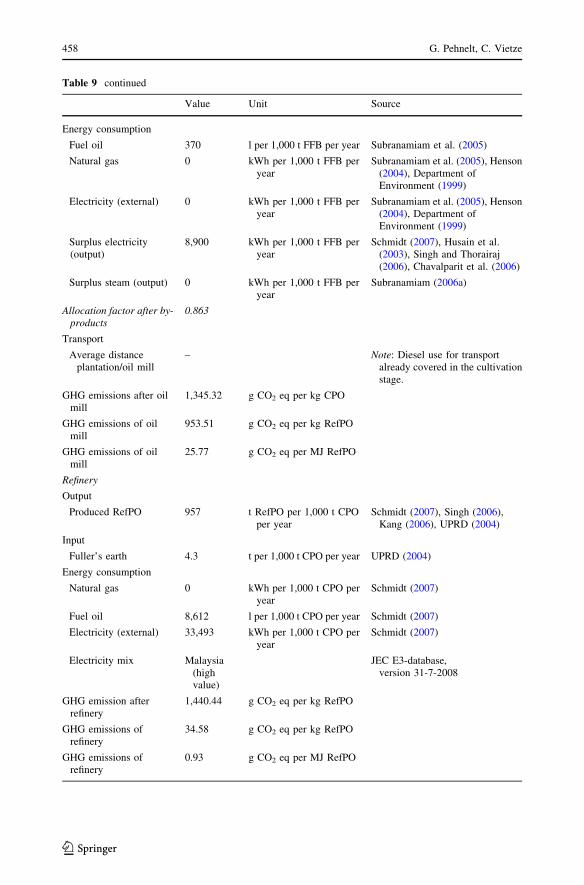
Table 9 continued
Value Unit Source
Energy consumption
Fuel oil 370 l per 1,000 t FFB per year Subranamiam et al. (2005)
Natural gas 0 kWh per 1,000 t FFB peryear
Subranamiam et al. (2005), Henson(2004), Department ofEnvironment (1999)
Electricity (external) 0 kWh per 1,000 t FFB peryear
Subranamiam et al. (2005), Henson(2004), Department ofEnvironment (1999)
Surplus electricity(output)
8,900 kWh per 1,000 t FFB peryear
Schmidt (2007), Husain et al.(2003), Singh and Thorairaj(2006), Chavalparit et al. (2006)
Surplus steam (output) 0 kWh per 1,000 t FFB peryear
Subranamiam (2006a)
Allocation factor after by-products
0.863
Transport
Average distanceplantation/oil mill
– Note: Diesel use for transportalready covered in the cultivationstage.
GHG emissions after oilmill
1,345.32 g CO2 eq per kg CPO
GHG emissions of oilmill
953.51 g CO2 eq per kg RefPO
GHG emissions of oilmill
25.77 g CO2 eq per MJ RefPO
Refinery
Output
Produced RefPO 957 t RefPO per 1,000 t CPOper year
Schmidt (2007), Singh (2006),Kang (2006), UPRD (2004)
Input
Fuller’s earth 4.3 t per 1,000 t CPO per year UPRD (2004)
Energy consumption
Natural gas 0 kWh per 1,000 t CPO peryear
Schmidt (2007)
Fuel oil 8,612 l per 1,000 t CPO per year Schmidt (2007)
Electricity (external) 33,493 kWh per 1,000 t CPO peryear
Schmidt (2007)
Electricity mix Malaysia(highvalue)
JEC E3-database,version 31-7-2008
GHG emission afterrefinery
1,440.44 g CO2 eq per kg RefPO
GHG emissions ofrefinery
34.58 g CO2 eq per kg RefPO
GHG emissions ofrefinery
0.93 g CO2 eq per MJ RefPO
458 G. Pehnelt, C. Vietze
123

Table 9 continued
Value Unit Source
Transport (to Europe)
Transport (overland)
Average distance oilmill/refinery/port
200 km Schmidt (2007)
Vehicle usedtransporting RefPO
Truck forliquids(Diesel)
Schmidt (2007)
Used fuel for vehicle Diesel Schmidt (2007)
Transport (ship)
Average distance Asia-Europe
14,975 km PortWorld Distances (2011)
Vehicle usedtransporting RefPO
Ship/tanker50kt (Fueloil)
Schmidt (2007)
Used fuel for vehicle HFO Schmidt (2007)
GHG emissions aftertransport
1,623.59 g CO2 eq per kg RefPO
GHG emissions oftransport
183.15 g CO2 eq per kg RefPO
GHG emissions oftransport
4.95 g CO2 eq per MJ RefPO
Total GHG emissionsRefPO
1,623.59 g CO2 eq per kg RefPO
43.88 g CO2 eq per MJ RefPO
GHG emission savingsRefPO compared withfossil comparator(electricity production)
52.0 % 91 g CO2 eq/MJ (RED2009/28/EC)
Esterification
CO2 emissions afteresterification
2,015.15 g CO2 eq per kg FAME
CO2 emissions ofesterification
382.79 g CO2 eq per kg FAME Calculations based on WTTAppendix (v3)
CO2 emissions ofesterification
10.29 g CO2 eq per MJ FAME Calculations based on WTTAppendix (v3)
Total CO2 emissionsFAME
2,015.15 g CO2 eq per kg FAME
Total CO2 emissionsFAME
54.76 g CO2 eq per MJ FAME
Fossil comparator
GHG emission savings comparedwith fossil comparator I (fuel diesel)
34.7 % 83.8 g CO2 eq/MJ (RED 2009/28/EC)
GHG emission savings comparedwith fossil comparator II (fuel diesel)
37.3 % 87.3 g CO2 eq/MJ (Silva et al. 2006;CONCAWE et al. 2006)
Recalculating GHG emissions saving of palm oil biodiesel 459
123

Table 10 Scenario 3—Entire PK, latest values
Value Unit Source
Plantation
Output
Yield FFB per ha 20,900 kg FFB per ha per year FAOSTAT (2006)
Input
N-fertiliser 95.52 kg N per ha per year Average of Yusoff and Hansen(2007), Henson (2004)
P2O5-fertiliser 28.56 kg P2O5 per ha per year Average of Yusoff and Hansen(2007), Henson (2004)
K2O-fertiliser 169.44 kg K2O per ha per year Average of Yusoff and Hansen(2007), Henson (2004)
CaO-fertiliser 0 kg CaO per ha per year Average of Yusoff and Hansen(2007), Henson (2004)
Pesticides 2.73 kg active ingredient perha per year
Singh (2006)
Diesel (for all activitiesand transport)
53.6 l per ha per year Singh (2006)
GHG emissions of andafter plantation
80.40 g CO2 eq per kg FFB Note: Entire palm kernels not usedfor CPO but higher valuedproducts. Energy content of EPKconsidered, but not the highereconomic value of PKOproduced via cold pressing
GHG emissions of andafter plantation
360.04 g CO2 eq per kg RefPO
GHG emissions of andafter plantation
9.73 g CO2 eq per MJ RefPO
Oil mill
Main output
Produced CPO 201.5 t CPO per 1,000 t FFB peryear
Malaysian average in 2005 given inMPOB (2006)
Palm kernel oil (by-product)
0 t PKO per 1,000 t FFBper year
Palm kernel meal (by-product)
0 t PKM per 1,000 t FFBper year
Entire palm kernels (by-product)
53.4 t EPK per 1,000 t FFB peryear
Malaysian average in 2005 given inMPOB (2006)
Input/POME
n-Hexane 0 t per 1,000 t FFB per year
CH4 emissions fromPOME
1088.7 g CO2 eq per kg CPO Calculations based on Yacob et al.(2006), Ma et al. (2004),Andersen et al. (1981)
Energy consumption
Fuel oil 370 l per 1,000 t FFB per year Subranamiam et al. (2005)
Natural gas 0 kWh per 1,000 t FFB peryear
Subranamiam et al. (2005), Henson(2004), Department ofEnvironment (1999)
Electricity (external) 0 kWh per 1,000 t FFB peryear
Subranamiam et al. (2005), Henson(2004), Department ofEnvironment (1999)
Surplus electricity(output)
8,900 kWh per 1,000 t FFB peryear
Schmidt (2007), Husain et al.(2003), Singh and Thorairaj(2006), Chavalparit et al. (2006)
460 G. Pehnelt, C. Vietze
123

Table 10 continued
Value Unit Source
Surplus steam (output) 0 kWh per 1,000 t FFB peryear
Subranamiam (2006a)
Allocation factor after by-products
0.864
Transport
Average distanceplantation/oil mill
– Note: Diesel use for transportalready covered in the cultivationstage
GHG emissions after OilMill
1,253.85 g CO2 eq per kg CPO
GHG emissions of OilMill
950.22 g CO2 eq per kg RefPO
GHG emissions of OilMill
25.68 g CO2 eq per MJ RefPO
Refinery
Output
Produced RefPO 957 t RefPO per 1,000 t CPOper year
Schmidt (2007), Singh (2006),Kang (2006), UPRD (2004)
Input
Fuller’s earth 4.3 t per 1,000 t CPO per year UPRD (2004)
Energy consumption
Natural gas 0 kWh per 1,000 t CPO peryear
Schmidt (2007)
Fuel oil 8,612 l per 1,000 t CPO per year Schmidt (2007)
Electricity (external) 33,493 kWh per 1,000 t CPO peryear
Schmidt (2007)
Electricity mix Malaysia(highvalue)
JEC E3-database, version 31-7-2008
GHG emission afterrefinery
1,344.85 g CO2 eq per kg RefPO
GHG emissions ofrefinery
34.58 g CO2 eq per kg RefPO
GHG emissions ofrefinery
0.93 g CO2 eq per MJ RefPO
Transport (to Europe)
Transport (overland)
Average distance oilmill/refinery/port
200 km Schmidt (2007)
Vehicle usedtransporting RefPO
Truck forliquids(Diesel)
Schmidt (2007)
Used fuel for vehicle Diesel Schmidt (2007)
Transport (ship)
Average distance Asia-Europe
14,975 km PortWorld Distances (2011)
Recalculating GHG emissions saving of palm oil biodiesel 461
123

Table 10 continued
Value Unit Source
Vehicle usedtransporting RefPO
Ship/tanker50kt (Fueloil)
Schmidt (2007)
Used fuel for vehicle HFO Schmidt (2007)
GHG emissions afterTransport
1,527.99 g CO2 eq per kg RefPO
GHG emissions ofTransport
183.15 g CO2 eq per kg RefPO
GHG emissions ofTransport
4.95 g CO2 eq per MJ RefPO
Total GHG emissionsRefPO
1,527.99 g CO2 eq per kg RefPO
41.30 g CO2 eq per MJ RefPO
GHG emission savingsRefPO compared withfossil comparator(electricity production)
55.0 % 91 g CO2 eq/MJ (RED2009/28/EC)
Esterification
CO2 emissions afterEsterification
1,800.37 g CO2 eq per kg FAME
CO2 emissions ofEsterification
264.12 g CO2 eq per kg FAME Weindorf (2008)
CO2 emissions ofEsterification
7.10 g CO2 eq per MJ FAME Weindorf (2008)
Total CO2 emissionsFAME
1,800.37 g CO2 eq per kg FAME
Total CO2 emissionsFAME
48.92 g CO2 eq per MJ FAME
Fossil comparator
GHG emission savings comparedwith fossil comparator I (fuel diesel)
41.6 % 83.8 g CO2 eq/MJ (RED 2009/28/EC)
GHG emission savings comparedwith fossil comparator II (fuel diesel)
44.0 % 87.3 g CO2 eq/MJ (Silva et al. 2006,CONCAWE et al. 2006)
Table 11 Scenario 4—Entire PK, latest values, esterification WTT (CONCAWE et al. 2006) standard
Value Unit Source
Plantation
Output
Yield FFB per ha 20,900 kg FFB per ha per year FAOSTAT (2006)
Input
N-fertiliser 95.52 kg N per ha per year Average of Yusoff and Hansen(2007), Henson (2004)
P2O5-fertiliser 28.56 kg P2O5 per ha per year Average of Yusoff and Hansen(2007), Henson (2004)
462 G. Pehnelt, C. Vietze
123

Table 11 continued
Value Unit Source
K2O-fertiliser 169.44 kg K2O per ha per year Average of Yusoff and Hansen(2007), Henson (2004)
CaO-fertiliser 0 kg CaO per ha per year Average of Yusoff and Hansen(2007), Henson (2004)
Pesticides 2.73 kg active ingredient perha per year
Singh (2006)
Diesel (for all activitiesand transport)
53.6 l per ha per year Singh (2006)
GHG emissions of andafter plantation
80.40 g CO2eq per kg FFB Note: Entire palm kernels notused for CPO but highervalued products. Energycontent of EPK considered,but not the higher economicvalue of PKO produced viacold pressing
GHG emissions of andafter plantation
360.04 g CO2 eq per kg RefPO
GHG emissions of andafter plantation
9.73 g CO2 eq per MJ RefPO
Oil mill
Main output
Produced CPO 201.5 t CPO per 1,000 t FFB peryear
Malaysian average in 2005given in MPOB (2006)
Palm kernel oil (by-product)
0 t PKO per 1,000 t FFBper year
Palm kernel meal (by-product)
0 t PKM per 1,000 t FFBper year
Entire palm kernels (by-product)
53.4 t EPK per 1,000 t FFB peryear
Malaysian average in 2005given in MPOB (2006)
Input/POME
n-Hexane 0 t per 1,000 t FFB per year
CH4 emissions fromPOME
1,088.7 g CO2 eq per kg CPO Calculations based on Yacobet al. (2006), Ma et al. (2004),Andersen et al. (1981)
Energy consumption
Fuel oil 370 l per 1,000 t FFB per year Subranamiam et al. (2005)
Natural gas 0 kWh per 1,000 t FFB peryear
Subranamiam et al. (2005),Henson (2004), Departmentof Environment (1999)
Electricity (external) 0 kWh per 1,000 t FFB peryear
Subranamiam et al. (2005),Henson (2004), Departmentof Environment (1999)
Surplus electricity(output)
8,900 kWh per 1,000 t FFB peryear
Schmidt (2007), Husain et al.(2003), Singh and Thorairaj(2006), Chavalparit et al.(2006)
Surplus steam (output) 0 KWh per 1,000 t FFB peryear
Subranamiam (2006a)
Allocation factor after by-products
0.864
Transport
Average distanceplantation/oil mill
– Note: Diesel use for transportalready covered in thecultivation stage
Recalculating GHG emissions saving of palm oil biodiesel 463
123

Table 11 continued
Value Unit Source
GHG emissions after OilMill
1,253.85 g CO2 eq per kg CPO
GHG emissions of OilMill
950.22 g CO2 eq per kg RefPO
GHG emissions of OilMill
25.68 g CO2 eq per MJ RefPO
Refinery
Output
Produced RefPO 957 T RefPO per 1,000 t CPOper year
Schmidt (2007), Singh (2006),Kang (2006), UPRD (2004)
Input
Fuller’s earth 4.3 t per 1,000 t CPO per year UPRD (2004)
Energy consumption
Natural gas 0 kWh per 1,000 t CPO peryear
Schmidt (2007)
Fuel oil 8,612 l per 1,000 t CPO per year Schmidt (2007)
Electricity (external) 33,493 kWh per 1,000 t CPO peryear
Schmidt (2007)
Electricity mix Malaysia (highvalue)
JEC E3-database, version 31-7-2008
GHG emission afterrefinery
1,344.85 g CO2 eq per kg RefPO
GHG emissions ofrefinery
34.58 g CO2 eq per kg RefPO
GHG emissions ofrefinery
0.93 g CO2 eq per MJ RefPO
Transport (to Europe)
Transport (overland)
Average distance oilmill/refinery/port
200 km Schmidt (2007)
Vehicle usedtransporting RefPO
Truck forliquids(Diesel)
Schmidt (2007)
Used fuel for vehicle Diesel Schmidt (2007)
Transport (ship)
Average distance Asia-Europe
14,975 km PortWorld Distances (2011)
Vehicle usedtransporting RefPO
Ship/tanker50 kt (fueloil)
Schmidt (2007)
Used fuel for vehicle HFO Schmidt (2007)
GHG emissions aftertransport
1,527.99 g CO2 eq per kg RefPO
GHG emissions oftransport
183.15 g CO2 eq per kg RefPO
GHG emissions oftransport
4.95 g CO2 eq per MJ RefPO
464 G. Pehnelt, C. Vietze
123
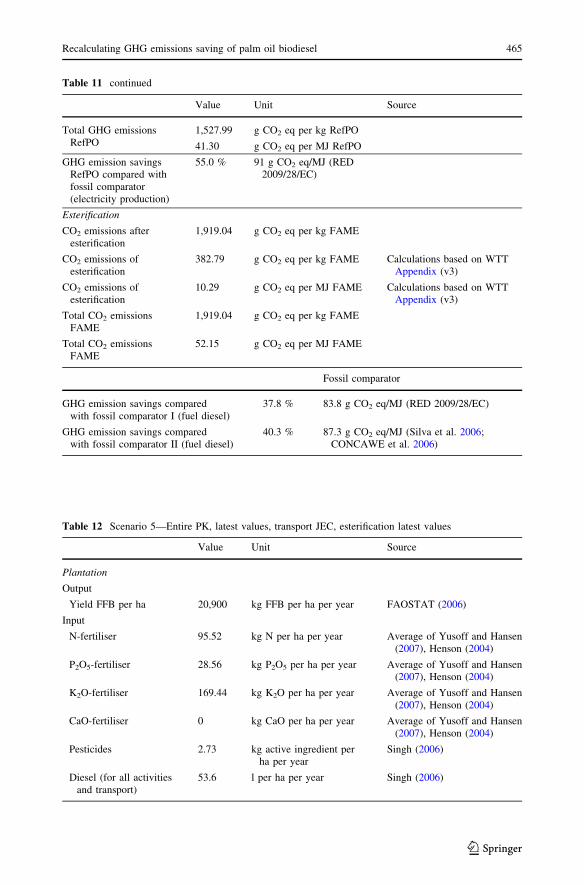
Table 11 continued
Value Unit Source
Total GHG emissionsRefPO
1,527.99 g CO2 eq per kg RefPO
41.30 g CO2 eq per MJ RefPO
GHG emission savingsRefPO compared withfossil comparator(electricity production)
55.0 % 91 g CO2 eq/MJ (RED2009/28/EC)
Esterification
CO2 emissions afteresterification
1,919.04 g CO2 eq per kg FAME
CO2 emissions ofesterification
382.79 g CO2 eq per kg FAME Calculations based on WTTAppendix (v3)
CO2 emissions ofesterification
10.29 g CO2 eq per MJ FAME Calculations based on WTTAppendix (v3)
Total CO2 emissionsFAME
1,919.04 g CO2 eq per kg FAME
Total CO2 emissionsFAME
52.15 g CO2 eq per MJ FAME
Fossil comparator
GHG emission savings comparedwith fossil comparator I (fuel diesel)
37.8 % 83.8 g CO2 eq/MJ (RED 2009/28/EC)
GHG emission savings comparedwith fossil comparator II (fuel diesel)
40.3 % 87.3 g CO2 eq/MJ (Silva et al. 2006;CONCAWE et al. 2006)
Table 12 Scenario 5—Entire PK, latest values, transport JEC, esterification latest values
Value Unit Source
Plantation
Output
Yield FFB per ha 20,900 kg FFB per ha per year FAOSTAT (2006)
Input
N-fertiliser 95.52 kg N per ha per year Average of Yusoff and Hansen(2007), Henson (2004)
P2O5-fertiliser 28.56 kg P2O5 per ha per year Average of Yusoff and Hansen(2007), Henson (2004)
K2O-fertiliser 169.44 kg K2O per ha per year Average of Yusoff and Hansen(2007), Henson (2004)
CaO-fertiliser 0 kg CaO per ha per year Average of Yusoff and Hansen(2007), Henson (2004)
Pesticides 2.73 kg active ingredient perha per year
Singh (2006)
Diesel (for all activitiesand transport)
53.6 l per ha per year Singh (2006)
Recalculating GHG emissions saving of palm oil biodiesel 465
123
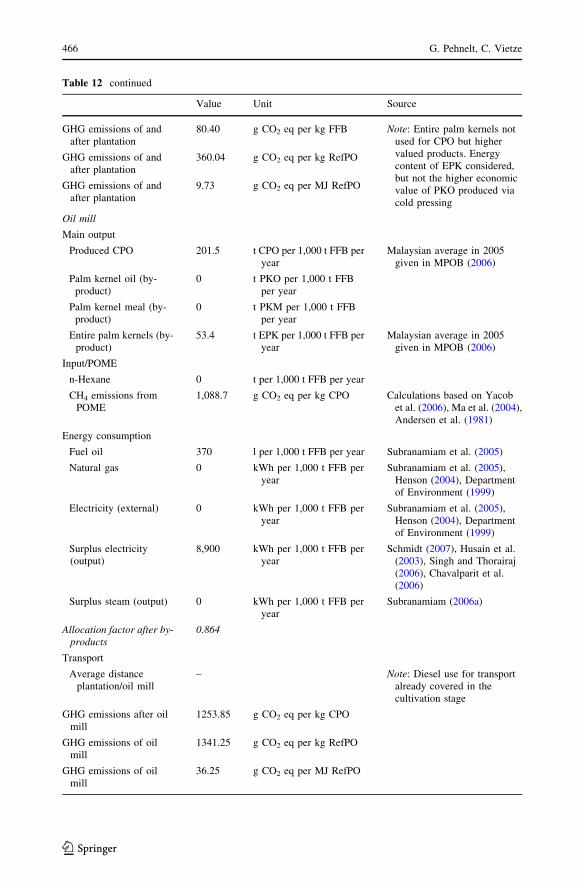
Table 12 continued
Value Unit Source
GHG emissions of andafter plantation
80.40 g CO2 eq per kg FFB Note: Entire palm kernels notused for CPO but highervalued products. Energycontent of EPK considered,but not the higher economicvalue of PKO produced viacold pressing
GHG emissions of andafter plantation
360.04 g CO2 eq per kg RefPO
GHG emissions of andafter plantation
9.73 g CO2 eq per MJ RefPO
Oil mill
Main output
Produced CPO 201.5 t CPO per 1,000 t FFB peryear
Malaysian average in 2005given in MPOB (2006)
Palm kernel oil (by-product)
0 t PKO per 1,000 t FFBper year
Palm kernel meal (by-product)
0 t PKM per 1,000 t FFBper year
Entire palm kernels (by-product)
53.4 t EPK per 1,000 t FFB peryear
Malaysian average in 2005given in MPOB (2006)
Input/POME
n-Hexane 0 t per 1,000 t FFB per year
CH4 emissions fromPOME
1,088.7 g CO2 eq per kg CPO Calculations based on Yacobet al. (2006), Ma et al. (2004),Andersen et al. (1981)
Energy consumption
Fuel oil 370 l per 1,000 t FFB per year Subranamiam et al. (2005)
Natural gas 0 kWh per 1,000 t FFB peryear
Subranamiam et al. (2005),Henson (2004), Departmentof Environment (1999)
Electricity (external) 0 kWh per 1,000 t FFB peryear
Subranamiam et al. (2005),Henson (2004), Departmentof Environment (1999)
Surplus electricity(output)
8,900 kWh per 1,000 t FFB peryear
Schmidt (2007), Husain et al.(2003), Singh and Thorairaj(2006), Chavalparit et al.(2006)
Surplus steam (output) 0 kWh per 1,000 t FFB peryear
Subranamiam (2006a)
Allocation factor after by-products
0.864
Transport
Average distanceplantation/oil mill
– Note: Diesel use for transportalready covered in thecultivation stage
GHG emissions after oilmill
1253.85 g CO2 eq per kg CPO
GHG emissions of oilmill
1341.25 g CO2 eq per kg RefPO
GHG emissions of oilmill
36.25 g CO2 eq per MJ RefPO
466 G. Pehnelt, C. Vietze
123

Table 12 continued
Value Unit Source
Refinery
Output
Produced RefPO 957 T RefPO per 1,000 t CPOper year
Schmidt (2007), Singh (2006),Kang (2006), UPRD (2004)
Input
Fuller’s earth 4.3 t per 1,000 t CPO per year UPRD (2004)
Energy consumption
Natural gas 0 kWh per 1,000 t CPO peryear
Schmidt (2007)
Fuel oil 8,612 l per 1,000 t CPO per year Schmidt (2007)
Electricity (external) 33,493 kWh per 1,000 t CPO peryear
Schmidt (2007)
Electricity mix Malaysia (highvalue)
JEC E3-database, version 31-7-2008
GHG emission afterrefinery
1,344.85 g CO2 eq per kg RefPO
GHG emissions ofrefinery
34.58 g CO2 eq per kg RefPO
GHG emissions ofrefinery
0.93 g CO2 eq per MJ RefPO
Transport (to Europe)
Transport (overland)
RED-default valuetransport
135 g CO2 eq per kg RefPO JEC E3-database, version 31-7-2008
GHG emissions aftertransport
1,479.85 g CO2 eq per kg RefPO
GHG emissions oftransport
135.00 g CO2 eq per kg RefPO
GHG emissions oftransport
3.65 g CO2 eq per MJ RefPO
Total GHG emissionsRefPO
1,479.85 g CO2 eq per kg RefPO
40.00 g CO2 eq per MJ RefPO
GHG emission savingsRefPO compared withfossil comparator(electricity production)
56.0 % 91 g CO2 eq/MJ (RED2009/28/EC)
Esterification
CO2 emissions afterEsterification
1,751.97 g CO2 eq per kg FAME
CO2 emissions ofEsterification
264.12 g CO2 eq per kg FAME Weindorf (2008)
CO2 emissions ofEsterification
7.10 g CO2 eq per MJ FAME Weindorf (2008)
Total CO2 emissionsFAME
1,751.97 g CO2 eq per kg FAME
Total CO2 emissionsFAME
47.61 g CO2 eq per MJ FAME
Recalculating GHG emissions saving of palm oil biodiesel 467
123
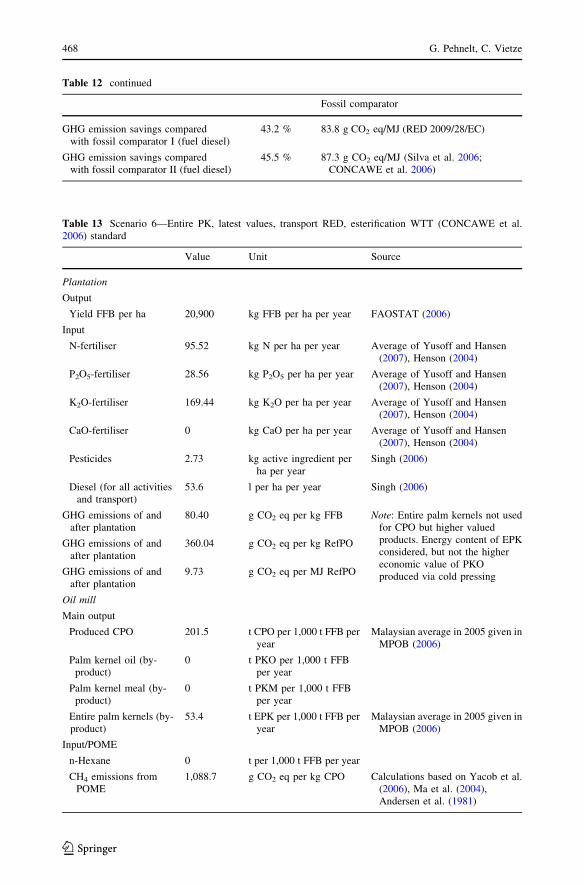
Table 12 continued
Fossil comparator
GHG emission savings comparedwith fossil comparator I (fuel diesel)
43.2 % 83.8 g CO2 eq/MJ (RED 2009/28/EC)
GHG emission savings comparedwith fossil comparator II (fuel diesel)
45.5 % 87.3 g CO2 eq/MJ (Silva et al. 2006;CONCAWE et al. 2006)
Table 13 Scenario 6—Entire PK, latest values, transport RED, esterification WTT (CONCAWE et al.2006) standard
Value Unit Source
Plantation
Output
Yield FFB per ha 20,900 kg FFB per ha per year FAOSTAT (2006)
Input
N-fertiliser 95.52 kg N per ha per year Average of Yusoff and Hansen(2007), Henson (2004)
P2O5-fertiliser 28.56 kg P2O5 per ha per year Average of Yusoff and Hansen(2007), Henson (2004)
K2O-fertiliser 169.44 kg K2O per ha per year Average of Yusoff and Hansen(2007), Henson (2004)
CaO-fertiliser 0 kg CaO per ha per year Average of Yusoff and Hansen(2007), Henson (2004)
Pesticides 2.73 kg active ingredient perha per year
Singh (2006)
Diesel (for all activitiesand transport)
53.6 l per ha per year Singh (2006)
GHG emissions of andafter plantation
80.40 g CO2 eq per kg FFB Note: Entire palm kernels not usedfor CPO but higher valuedproducts. Energy content of EPKconsidered, but not the highereconomic value of PKOproduced via cold pressing
GHG emissions of andafter plantation
360.04 g CO2 eq per kg RefPO
GHG emissions of andafter plantation
9.73 g CO2 eq per MJ RefPO
Oil mill
Main output
Produced CPO 201.5 t CPO per 1,000 t FFB peryear
Malaysian average in 2005 given inMPOB (2006)
Palm kernel oil (by-product)
0 t PKO per 1,000 t FFBper year
Palm kernel meal (by-product)
0 t PKM per 1,000 t FFBper year
Entire palm kernels (by-product)
53.4 t EPK per 1,000 t FFB peryear
Malaysian average in 2005 given inMPOB (2006)
Input/POME
n-Hexane 0 t per 1,000 t FFB per year
CH4 emissions fromPOME
1,088.7 g CO2 eq per kg CPO Calculations based on Yacob et al.(2006), Ma et al. (2004),Andersen et al. (1981)
468 G. Pehnelt, C. Vietze
123
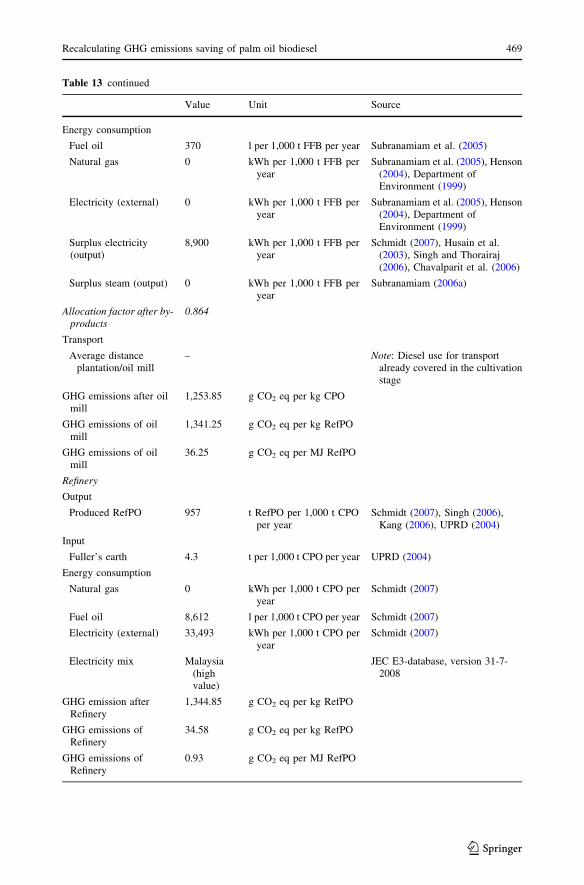
Table 13 continued
Value Unit Source
Energy consumption
Fuel oil 370 l per 1,000 t FFB per year Subranamiam et al. (2005)
Natural gas 0 kWh per 1,000 t FFB peryear
Subranamiam et al. (2005), Henson(2004), Department ofEnvironment (1999)
Electricity (external) 0 kWh per 1,000 t FFB peryear
Subranamiam et al. (2005), Henson(2004), Department ofEnvironment (1999)
Surplus electricity(output)
8,900 kWh per 1,000 t FFB peryear
Schmidt (2007), Husain et al.(2003), Singh and Thorairaj(2006), Chavalparit et al. (2006)
Surplus steam (output) 0 kWh per 1,000 t FFB peryear
Subranamiam (2006a)
Allocation factor after by-products
0.864
Transport
Average distanceplantation/oil mill
– Note: Diesel use for transportalready covered in the cultivationstage
GHG emissions after oilmill
1,253.85 g CO2 eq per kg CPO
GHG emissions of oilmill
1,341.25 g CO2 eq per kg RefPO
GHG emissions of oilmill
36.25 g CO2 eq per MJ RefPO
Refinery
Output
Produced RefPO 957 t RefPO per 1,000 t CPOper year
Schmidt (2007), Singh (2006),Kang (2006), UPRD (2004)
Input
Fuller’s earth 4.3 t per 1,000 t CPO per year UPRD (2004)
Energy consumption
Natural gas 0 kWh per 1,000 t CPO peryear
Schmidt (2007)
Fuel oil 8,612 l per 1,000 t CPO per year Schmidt (2007)
Electricity (external) 33,493 kWh per 1,000 t CPO peryear
Schmidt (2007)
Electricity mix Malaysia(highvalue)
JEC E3-database, version 31-7-2008
GHG emission afterRefinery
1,344.85 g CO2 eq per kg RefPO
GHG emissions ofRefinery
34.58 g CO2 eq per kg RefPO
GHG emissions ofRefinery
0.93 g CO2 eq per MJ RefPO
Recalculating GHG emissions saving of palm oil biodiesel 469
123

Table 13 continued
Value Unit Source
Transport (to Europe)
Transport (total)
RED-default valuetransport
135 g CO2 eq per kg RefPO RED (2009/28/EC)
GHG emissions aftertransport
1,479.85 g CO2 eq per kg RefPO
GHG emissions oftransport
135.00 g CO2 eq per kg RefPO
GHG emissions oftransport
3.65 g CO2 eq per MJ RefPO
Total GHG emissionsRefPO
1,479.85 g CO2 eq per kg RefPO
40.00 g CO2 eq per MJ RefPO
GHG emission savingsRefPO compared withfossil comparator(electricity production)
56.0 % 91 g CO2 eq/MJ (RED2009/28/EC)
Esterification
CO2 emissions afteresterification
1,870.63 g CO2 eq per kg FAME
CO2 emissions ofesterification
382.79 g CO2 eq per kg FAME Weindorf (2008)
CO2 emissions ofesterification
10.29 g CO2 eq per MJ FAME Weindorf (2008)
Total CO2 emissionsFAME
1,870.63 g CO2 eq per kg FAME
Total CO2 emissionsFAME
50.83 g CO2 eq per MJ FAME
Fossil comparator
GHG emission savings comparedwith fossil comparator I (fuel diesel)
39.3 % 83.8 g CO2 eq/MJ (RED 2009/28/EC)
GHG emission savings comparedwith fossil comparator II (fuel diesel)
41.8 % 87.3 g CO2 eq/MJ (Silva et al. 2006;CONCAWE et al. 2006)
Table 14 Scenario 7—PKO latest values
Value Unit Source
Plantation
Output
Yield FFB per ha 20,900 kg FFB per ha per year FAOSTAT (2006)
Input
N-fertiliser 95.52 kg N per ha per year Average of Yusoff and Hansen(2007), Henson (2004)
P2O5-fertiliser 28.56 kg P2O5 per ha per year Average of Yusoff and Hansen(2007), Henson (2004)
K2O-fertiliser 169.44 kg K2O per ha per year Average of Yusoff and Hansen(2007), Henson (2004)
470 G. Pehnelt, C. Vietze
123

Table 14 continued
Value Unit Source
CaO-fertiliser 0 kg CaO per ha per year Average of Yusoff and Hansen(2007), Henson (2004)
Pesticides 2.73 kg active ingredient perha per year
Singh (2006)
Diesel (for all activitiesand transport)
53.6 l per ha per year Singh (2006)
GHG emissions of andafter plantation
80.40 g CO2 eq per kg FFB Note: Only calorific value of PKOconsidered and not the highereconomic value of PKOproduced via cold pressing (noeconomic allocation)
GHG emissions of andafter plantation
390.72 g CO2 eq per kg RefPO
GHG emissions of andafter plantation
10.56 g CO2 eq per MJ RefPO
Oil mill
Main output
Produced CPO 201.5 t CPO per 1,000 t FFB peryear
Malaysian average in 2005 given inMPOB (2006)
Palm kernel oil (by-product)
23.97 t PKO per 1,000 t FFBper year
Malaysian average values 2004according to Oil World (2005)
Palm kernel meal (by-product)
27.83 t PKM per 1,000 t FFBper year
Malaysian average values 2004according to Oil World (2005)
Entire palm kernels (by-product)
0 t EPK per 1,000 t FFB peryear
Input/POME
n-Hexane 0 t per 1,000 t FFB per year
CH4 emissions fromPOME
1,088.7 g CO2 eq per kg CPO Calculations based on Yacob et al.(2006), Ma et al. (2004),Andersen et al. (1981)
Energy consumption
Fuel oil 370 l per 1,000 t FFB per year Subranamiam et al. (2005)
Natural gas 0 kWh per 1,000 t FFB peryear
Subranamiam et al. (2005), Henson(2004), Department ofEnvironment (1999)
Electricity (external) 6,404.7 kWh per 1,000 t FFB peryear
Only PCO production,Subranamiam (2006b)
Surplus electricity(output)
8,900 kWh per 1,000 t FFB peryear
Schmidt (2007); Husain et al.(2003); Singh and Thorairaj(2006); Chavalparit et al. (2006)
Surplus steam (output) 0 kWh per 1000 t FFB peryear
Subranamiam (2006a)
Allocation factorafter by-products
0.937
Transport
Average distanceplantation/oil mill
– Note: Diesel use for transportalready covered in the cultivationstage
GHG emissions after oilmill
1,386.86 g CO2 eq per kg CPO
GHG emissions of oilmill
1,058.55 g CO2 eq per kg RefPO
Recalculating GHG emissions saving of palm oil biodiesel 471
123

Table 14 continued
Value Unit Source
GHG emissions of oilmill
28.61 g CO2 eq per MJ RefPO
Refinery
Output
Produced RefPO 957 t RefPO per 1,000 t CPOper year
Schmidt (2007), Singh (2006),Kang (2006), UPRD (2004)
Input
Fuller’s earth 4.3 t per 1,000 t CPO per year UPRD (2004)
Energy consumption
Natural gas 0 kWh per 1,000 t CPO peryear
Schmidt (2007)
Fuel oil 8,612 l per 1,000 t CPO per year Schmidt (2007)
Electricity (external) 33,493 kWh per 1,000 t CPO peryear
Schmidt (2007)
Electricity mix Malaysia(highvalue)
JEC E3-database, version 31-7-2008
GHG emission afterrefinery
1,483.85 g CO2 eq per kg RefPO
GHG emissions ofrefinery
34.58 g CO2 eq per kg RefPO
GHG emissions ofrefinery
0.93 g CO2 eq per MJ RefPO
Transport (to Europe)
Transport (overland)
Average distance oilmill/refinery/port
200 km Schmidt (2007)
Vehicle usedtransporting RefPO
Truck forliquids(Diesel)
Schmidt (2007)
Used fuel for vehicle Diesel Schmidt (2007)
Transport (ship)
Average distance Asia-Europe
14,975 km PortWorld distances (2011)
Vehicle usedtransporting RefPO
Ship/tanker50kt (fueloil)
Schmidt (2007)
Used fuel for vehicle HFO Schmidt (2007)
GHG emissions aftertransport
1,667.00 g CO2 eq per kg RefPO
GHG emissions oftransport
183.15 g CO2 eq per kg RefPO
GHG emissions oftransport
4.95 g CO2 eq per MJ RefPO
Total GHG emissionsRefPO
1,667.00 g CO2 eq per kg RefPO
45.05 g CO2 eq per MJ RefPO
472 G. Pehnelt, C. Vietze
123

Table 14 continued
Value Unit Source
GHG emission savingsRefPO compared withfossil comparator(electricity production)
50.0 % 91 g CO2 eq/MJ (RED2009/28/EC)
Esterification
CO2 emissions afteresterification
1,940.13 g CO2 eq per kg FAME
CO2 emissions ofesterification
264.12 g CO2 eq per kg FAME Weindorf (2008)
CO2 emissions ofesterification
7.10 g CO2 eq per MJ FAME Weindorf (2008)
Total CO2 emissionsFAME
1,940.13 g CO2 eq per kg FAME
Total CO2 emissionsFAME
52.72 g CO2 eq per MJ FAME
Fossil comparator
GHG emission savings comparedwith fossil comparator I (fuel diesel)
37.1 % 83.8 g CO2 eq/MJ (RED 2009/28/EC)
GHG emission savings comparedwith fossil comparator II (fuel diesel)
39.6 % 87.3 g CO2 eq/MJ (Silva et al. 2006;CONCAWE et al. 2006)
Table 15 Scenario 8—Entire PK latest values, transport RED, methane capture
Value Unit Source
Plantation
Output
Yield FFB per ha 20,900 kg FFB per ha per year FAOSTAT (2006)
Input
N-fertiliser 95.52 kg N per ha per year Average of Yusoff and Hansen
(2007), Henson (2004)
P2O5-fertiliser 28.56 kg P2O5 per ha per year Average of Yusoff and Hansen
(2007), Henson (2004)
K2O-fertiliser 169.44 kg K2O per ha per year Average of Yusoff and Hansen
(2007), Henson (2004)
CaO-fertiliser 0 kg CaO per ha per year Average of Yusoff and Hansen
(2007), Henson (2004)
Pesticides 2.73 kg active ingredient per ha
per year
Singh (2006)
Diesel (for all activities
and transport)
53.6 l per ha per year Singh (2006)
GHG emissions of and after
plantation
80.40 g CO2 eq per kg FFB Note: Entire palm kernels not
used for CPO but higher valued
products. Energy content of
EPK considered, but not the
higher economic value of PKO
produced via cold pressing
Recalculating GHG emissions saving of palm oil biodiesel 473
123
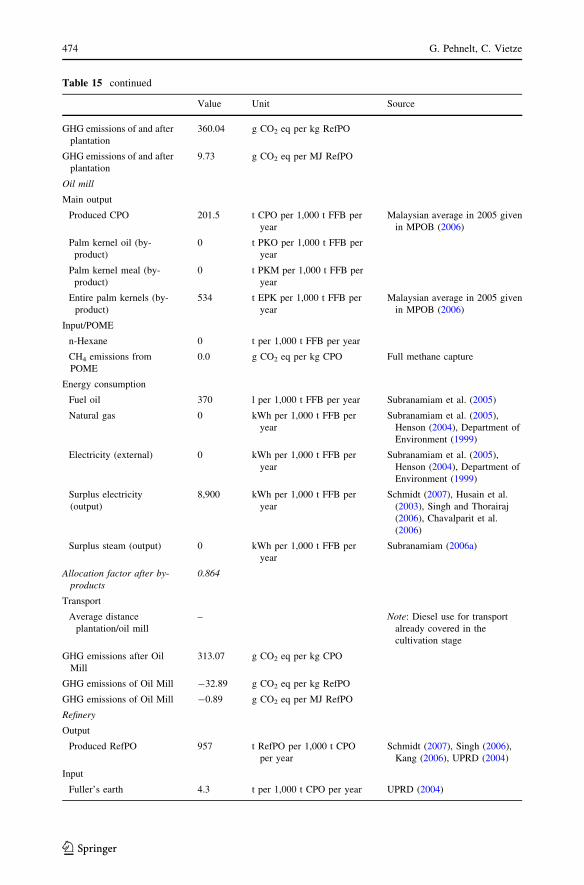
Table 15 continued
Value Unit Source
GHG emissions of and after
plantation
360.04 g CO2 eq per kg RefPO
GHG emissions of and after
plantation
9.73 g CO2 eq per MJ RefPO
Oil mill
Main output
Produced CPO 201.5 t CPO per 1,000 t FFB per
year
Malaysian average in 2005 given
in MPOB (2006)
Palm kernel oil (by-
product)
0 t PKO per 1,000 t FFB per
year
Palm kernel meal (by-
product)
0 t PKM per 1,000 t FFB per
year
Entire palm kernels (by-
product)
534 t EPK per 1,000 t FFB per
year
Malaysian average in 2005 given
in MPOB (2006)
Input/POME
n-Hexane 0 t per 1,000 t FFB per year
CH4 emissions from
POME
0.0 g CO2 eq per kg CPO Full methane capture
Energy consumption
Fuel oil 370 l per 1,000 t FFB per year Subranamiam et al. (2005)
Natural gas 0 kWh per 1,000 t FFB per
year
Subranamiam et al. (2005),
Henson (2004), Department of
Environment (1999)
Electricity (external) 0 kWh per 1,000 t FFB per
year
Subranamiam et al. (2005),
Henson (2004), Department of
Environment (1999)
Surplus electricity
(output)
8,900 kWh per 1,000 t FFB per
year
Schmidt (2007), Husain et al.
(2003), Singh and Thorairaj
(2006), Chavalparit et al.
(2006)
Surplus steam (output) 0 kWh per 1,000 t FFB per
year
Subranamiam (2006a)
Allocation factor after by-
products0.864
Transport
Average distance
plantation/oil mill
– Note: Diesel use for transport
already covered in the
cultivation stage
GHG emissions after Oil
Mill
313.07 g CO2 eq per kg CPO
GHG emissions of Oil Mill -32.89 g CO2 eq per kg RefPO
GHG emissions of Oil Mill -0.89 g CO2 eq per MJ RefPO
Refinery
Output
Produced RefPO 957 t RefPO per 1,000 t CPO
per year
Schmidt (2007), Singh (2006),
Kang (2006), UPRD (2004)
Input
Fuller’s earth 4.3 t per 1,000 t CPO per year UPRD (2004)
474 G. Pehnelt, C. Vietze
123

Table 15 continued
Value Unit Source
Energy consumption
Natural gas 0 kWh per 1,000 t CPO per
year
Schmidt (2007)
Fuel oil 8,612 l per 1,000 t CPO per year Schmidt (2007)
Electricity (external) 33,493 kWh per 1,000 t CPO per
year
Schmidt (2007)
Electricity mix Malaysia (high
value)
JEC E3-database, version 31-7-
2008
GHG emission after
Refinery
361.74 g CO2 eq per kg RefPO
GHG emissions of Refinery 34.58 g CO2 eq per kg RefPO
GHG emissions of Refinery 0.93 g CO2 eq per MJ RefPO
Transport (to Europe)
Transport (total)
RED-default value
transport
135 g CO2 eq per kg RefPO JEC E3-database, version 31-7-
2008
GHG emissions after
transport
496.74 g CO2 eq per kg RefPO
GHG emissions of
transport
135.00 g CO2 eq per kg RefPO
GHG emissions of
transport
3.65 g CO2 eq per MJ RefPO
Total GHG emissions
RefPO
496.74 g CO2 eq per kg RefPO
13.43 g CO2 eq per MJ RefPO
GHG emission savings
RefPO compared with
fossil comparator
(electricity production)
85.0 % 91g CO2 eq/MJ (RED
2009/28/EC)
Esterification
CO2 emissions after
esterification
763.54 g CO2 eq per kg FAME
CO2 emissions of
esterification
264.12 g CO2 eq per kg FAME Weindorf (2008)
CO2 emissions of
esterification
7.10 g CO2 eq per MJ FAME Weindorf (2008)
Total CO2 emissions
FAME
763.54 g CO2 eq per kg FAME
Total CO2 emissions
FAME
20.64 g CO2 eq per MJ FAME
Fossil comparator
GHG emission savings compared
with fossil comparator I (fuel diesel)
75.4 % 83.8 g CO2 eq/MJ (RED 2009/28/EC)
GHG emission savings compared
with fossil comparator II (fuel diesel)
76.4 % 87.3 g CO2 eq/MJ (Silva et al. 2006;
CONCAWE et al. 2006)
Recalculating GHG emissions saving of palm oil biodiesel 475
123

References
Andersen, E. S., Jespersgaard, P., & Østergaard, O. G. (1981). Databog, fysik, kemi (English: Data book,physics, chemistry). Copenhagen: F&K forlaget.
Arulandoo, X. (2006). Personal communication with researcher xavier arulandoo, United Plantations Ber-had, Research Department, Jendarata Estate, Teluk Intan, Malaysia. In J. H. Schmidt (2007). Lifeassessment of rapeseed oil and palm oil. Ph.D. thesis, part 3: Life cycle inventory of rapeseed oil andpalm oil. Diss. Department of Development and Planning, Aalborg University.
Azman, I., & Noor, M. M. (2002). The optimal age of oil palm replanting. Oil Palm Industry EconomicJournal, 2(1), 11–18.
Bek-Nielsen, C. (2006). Personal communication with Carl Bek-Nielsen, Executive Director, UnitedPlantations Berhan, Teluk Intan, Malaysia. In J. H. Schmidt (2007). Life assessment of rapeseed oil andpalm oil. Ph.D. thesis, part 3: Life cycle inventory of rapeseed oil and palm oil. Diss. Department ofDevelopment and Planning, Aalborg University.
Billore, S. K., Ohsawa, M., Numata, M., & Okano, S. (1995). Microbial biomass nitrogen pool in soils froma warm temperate grassland, and from deciduous and evergreen forests in Chiba, central Japan. Biologyand Fertility of Soils, 19, 124–128.
BioGrace. (2010). Harmonised calculations of biofuel greenhouse gas emissions in Europe, Bio-Grace_GHG_calculations_-_version_3_-_Public.xls. BioGrace, Utrecht, The Netherlands et al.
Bockisch, M. (1998). Fats and oils—Handbook. Illinois: AOCS Press.Bundesanstalt fur Landwirtschaft und Ernahrung (BLE). (2009). Verordnung uber anforderungen an eine
nachhaltige Herstellung von Biokraftstoffen (Biokraftstoff-Nachhaltigkeitsverordnung—Biokraft-NachV). Bonn: BLE.
Casson, A. (2003). Oil palm, soybeans & critical habitatloss. Zurich: WWF Switzerland.Chavalparit, O., Rulkens, W. H., Mol, A. P. J., & Khaodhair, S. (2006). Options for environmental sus-
tainability of the crude palm oil industry in Thailand through enhancement of industrial ecosystems.Environment, Development and Sustainability, 8, 271–287.
Chongkhong, S., Tongurai, C., Chetpattananondh, P., & Bunyakan, C. (2007). Biodiesel production byesterification of palm fatty acid distillate. Biomass and Bioenergy, 31(8), 563–568.
Cockerill, S., & Martin, C. (2008). Are biofuels sustainable? The EU perspective. Biotechnology for Bio-fuels, 2008, 1–9.
CONCAWE, EUCAR, & JRC. (2006). Well-to-wheels analysis of future automotive fuels and powertrainsin the European context. Well-to-tank report version 2b. European Commission, Brussels.
Corley, R. H. V. (2006). Ten steps towards sustainability of palm oil production. Announcement within theround table on sustainable palm oil initiative. http://www.rspo.org/PDF/Main%20page/Ten%20steps%20towards%20increased%20sustainability.pdf. Accessed January 2007.
Corley, R. H. V., & Tinker, P. B. (2003). The oil palm (4th ed.). Oxford: Blackwell Publishing.Department of Environment. (1999). Industrial processes & the environment (Handbook No. 3). Crude Palm
Oil Industry. Department of Environment, Malaysia.European Union (EU). (2009). Directive 2009/28/EC of the European Parliament and of the council of 23
April 2009 on the promotion of the use of energy from renewable sources and amending and subse-quently repealing directives 2001/77/EC and 2003/30/EC. Official Journal of the European Union,L140, 16–61.
FAO. (2004). Fertilizer use by crop in Malaysia. Food and Agriculture Organization of the United Nations(FAO), Rome. http://www.fao.org/docrep/007/y5797e/y5797e00.htm. Accessed December 2006.
FAO. (2005). State of the world’s forests 2005, Food and Agriculture Organization of the United Nations(FAO). Rome: FAO.
FAOSTAT. (2006). FAOSTAT agriculture data. Food and Agriculture Organisation of the United Nations(FAO). http://apps.fao.org. Accessed December 2006.
Fargione, J., Hill, J., Tilman, D., Polasky, S., & Hawthorne, P. (2008). Land clearing and the biofuel carbondebt. Science, 319, 1235–1238.
Fee, C. G., & Sharma, M. (2002). Integrated pest and disease management and associated impact ofpesticides. In G. Singh, L. K. Huan, T. Leng, & D. L. Kow (1999). Oil palm and the environment – AMalaysian perspective. Malaysian Oil Palm Growers Council, Kuala Lumpur.
Field, C. B., Campbell, J. E., & Lobell, D. B. (2008). Biomass energy: the scale of the potential resource.Trends in Ecology & Evolution, 23, 65.
Frese, S. D., Ibsen, S. R., Bang, J. K., & Andersen, J. (2006). Madens globale fodaftryk (English: Globalfootprint of food). Copenhagen: WWF Denmark.
476 G. Pehnelt, C. Vietze
123

Garrity, D. P., Soekardi, M., van Noordwijk, M., de la Cruz, R., Pathak, P. S., Gunasena, H. P. M., et al.(1997). The Imperata grasslands of tropical Asia: area, distribution, and topology. Agroforestry Sys-tems, 36, 3–29.
German Advisory Council on Global Change (WBGU). (2008). World in transition, future bioenergy andsustainable land use, summary for policy-makers. Berlin: WBGU.
Glastra, R., Wakker, E., & Richert, W. (2002). Oil palm plantations and deforestation in Indonesia. WhatRole Do Europe and Germany Play?. WWF Switzerland, Zurich.
GM, LBST, BP, ExxonMobil, Shell, TotalFinaElf. (2002). Well-to-wheel analysis of energy use andgreenhouse gas emissions of advanced fuel/vehicle systems—A European Study. L-B SystemtechnikGmbH, Ottobrunn, Germany.
Hansen, A. K. (2006). Personal communication with Anders Kromand Hansen, engineer, AarhusKarlshamnDenmark, Aarhus. In J. H. Schmidt (2007). Life assessment of rapeseed oil and palm oil. Ph.D. thesis,part 3: Life cycle inventory of rapeseed oil and palm oil. Diss. Department of Development andPlanning, Aalborg University.
Henson, I. E. (2004). Modelling carbon sequestration and emissions related to oil palm cultivation andassociated land use change in Malaysia. MPOB Technology No. 27, December 2004. Kajang,Malaysia.
Husain, Z., Zainal, Z. A., & Abdullah, M. Z. (2003). Analysis of biomass-residue-based cogeneration systemin palm oil mills. Biomass and Bioenergy, 24, 117–124.
IFA, IFDC, IPI, PPI, FAO. (2002). Fertilizer use by crop. www.fertilizer.org/ifa/statistics/crops/fubc5ed.pdf. Accessed July 2002.
Institut fur Energie- und Umweltforschung Heidelberg GmbH (IFEU). (2010). Sustainable biomass, palm oilGHG calculator IFEU 09-10 vs1.xls. Heidelberg, Germany.
IPCC. (2003). Good practice guidance for land use, land-use change and forestry. Geneva: Intergovern-mental Panel on Climate Change (IPCC).
JEC. (2011). Database. http://ies.jrc.ec.europa.eu/jec-research-collaboration/downloads-jec.html. AccessedMay 2011.
Kandiah, S., Hasan, M., & Yaacob, M. (1992). Overview of automation in a palm oil mill-the sterilisationprocess. Computing and Control Engineering Journal, 3(1), 45–52.
Kang, L. J. (2006). Refinery of palm oil. Webpage. ASTS Fellow, Pusat Pengajian Kejuruteraan Kimia diUniversiti Sains Malaysia, Kuala Lumpur. http://www.andrew.cmu.edu/user/jitkangl/Index.htm.Accessed December 2006.
Lim, C. H., Singh, G., & Lim, K. H. (1999). Production of organic fertilisers and soil conditioners. In G.Singh, L. K. Huan, T. Leng, & D. L. Kow (1999). Oil palm and the environment—A Malaysianperspective. Malaysian Oil Palm Growers Council, Kuala Lumpur.
Ma, A. N., Choo, Y. M., Toh, T. S., & Chua, N. S. (2004). Renewable energy from palm oil industry. Notpublished. Updated version of chapter 17. In G. Singh, L. K. Huan, T. Leng, & D. L. Kow (1999). Oilpalm and the environment—A Malaysian perspective. Malaysian Oil Palm Growers Council, KualaLumpur.
Menichetti, E., & Otto, M. (2009). Energy balance and greenhouse gas emissions of biofuels from a life-cycle perspective. Biofuels: Environmental Consequences and Interactions with Changing Land Use.In Proceedings of the Scientific Committee on Problems of the Environment (SCOPE) (2009).International Biofuels Project Rapid Assessment, Gummersbach, pp. 81–109.
Møller, J., Thøgersen, R., Kjeldsen, A. M., Weisberg, M. R., Soegaard, K., Hvelplund, T., et al. (2000).Fodermiddeltabel—Sammen-sætning og foderværdi af fodermidler til kvæg (English: Feeding com-ponent table—Composition and feeding value of feeding components for cattle), Rapport nr 91. Fo-ulum, Denmark: Landsudvalget for Kvæg.
MPOB. (2005). Review of the Malaysian Oil Palm Industry 2004. Economics and Industry DevelopmentDivision, Malaysian Palm Oil Board, Kelana Jaya.
MPOB. (2006). Review of the Malaysian oil palm industry 2005. Economics and Industry DevelopmentDivision, Malaysian Palm Oil Board, Kelana Jaya.
Oil World. (2005). Oil world annual 2005. www.oilworld.biz. Accessed December 2005.Pagiola, S. (2000). Land use change in Indonesia. Washington, DC: World Bank Environment Department.Pehnelt, G., & Vietze, C. (2009). European policies towards palm oil—sorting out some facts. Jena Eco-
nomic Research Paper, 2009(086), 1–30.Pleanjai, S., Gheewala, S. H., & Garivait, S. (2007). Environmental evaluation of biodiesel production from
palm oil in a life cycle perspective. Asian Journal of Energy and Environment, 8, 15–32.PortWorld Distances. (2011). Distance calculation. http://www.portworld.com/map. Accessed May 2011.ProForest. (2003). Palm oil forests and sustainability—Discussion paper for the round table on sustainable
palm oil. ProForest, Oxford, United Kingdom.
Recalculating GHG emissions saving of palm oil biodiesel 477
123

Schmidt, J. H. (2007). Life assessment of rapeseed oil and palm oil. Ph.D. thesis, part 3: Life cycle inventoryof rapeseed oil and palm oil. Diss. Department of Development and Planning, Aalborg University.
Schmidt, J. H. (2008). System delimitation in agricultural consequential LCA, outline of methodology andillustrative case study of wheat in Denmark. International Journal of Life Cycle Assessment, 13(4),350–364.
Schmidt, J. H., & Weidema, B. P. (2008). Shift in the marginal supply of vegetable oil. InternationalJournal of Life Cycle Assessment, 13(3), 235–239.
Silva, C. M., Goncalves, G. A., Farias, T. L., & Mendes-Lopes, J. M. C. (2006). A tank-to-wheel analysistool for energy and emissions studies in road vehicles. Science of the Total Environment, 367, 441–447.
Singh, G. (1999). The Malaysian oil palm industry: Progress towards zero waste and environment excel-lence. Bioresources Technology for Sustainable Agriculture, 99, 318–341.
Singh, G. (2006). Personal communication with director of research gurmit singh, United PlantationsBerhad, Research Department, Jendarata Estate, Teluk Intan, Malaysia. In J. H. Schmidt (2007). Lifeassessment of rapeseed oil and palm oil. Ph.D. thesis, part 3: Life cycle inventory of rapeseed oil andpalm oil. Diss. Department of Development and Planning, Aalborg University.
Singh, G., Kow, D. L., Lee, K. H., Lim, K. C., & Loong, S. G. (1999). Empty fruit bunches as mulch. In G.Singh, L. K. Huan, T. Leng, D. L. Kow (1999) Oil palm and the environment—A Malaysian per-spective. Malaysian Oil Palm Growers Council, Kuala Lumpur.
Singh, G., & Thorairaj, I. N. P. (2006) Data on energy use in the oil mill. Data provided by research directorGurmit Singh and process engineer Ir. NP Thorairaj, United Plantations Research Department, TelukIntan, Malaysia. In J. H. Schmidt (2007). Life assessment of rapeseed oil and palm oil. Ph.D. thesis,part 3: Life cycle inventory of rapeseed oil and palm oil. Diss. Department of Development andPlanning, Aalborg University.
Subranamiam, V. (2006a). Personal communication with Vijaya Subramaniam, Energy and EnvironmentUnit, Malaysian Palm Oil Board (MPOB), Kajang. In J. H. Schmidt (2007). Life assessment ofrapeseed oil and palm oil. Ph.D. thesis, part 3: Life cycle inventory of rapeseed oil and palm oil. Diss.Department of Development and Planning, Aalborg University.
Subranamiam, V. (2006b). Life cycle inventory for palm kernel crushing. Unpublished data by researchofficer Vijaya Subramaniam, Energy and Environment Unit, Malaysian Palm Oil Board (MPOB),Kajang. In J. H. Schmidt (2007). Life assessment of rapeseed oil and palm oil. Ph.D. thesis, part 3: Lifecycle inventory of rapeseed oil and palm oil. Diss. Department of Development and Planning, AalborgUniversity.
Subranamiam, V., Chow, M. C., & Ma, A. N. (2004). Energy database of the oil palm. Palm oil engineeringbulletin, Volume EB70. Malaysian Palm Oil Board (MPOB), Kajang.
Subranamiam, V., Ma, A. N., & Choo, Y. M. (2005). Life cycle inventory of the production of CPO. Posterpresentation at PIPOC 2005, 25–29 September, Kuala Lumpur.
Suppalakpanya, K., Ratanawilai, S. B., & Tongurai, C. (2010). Production of ethyl ester from esterifiedcrude palm oil by microwave with dry washing by bleaching earth. Applied Energy, 87, 2356–2359.
Teoh, C. H. (2000). Land use and the oil palm industry in Malaysia: Report of WWF Malaysia. Selangor,Malaysia: WWF Malaysia.
Tilman, D., Hill, J., & Lehman, C. (2006). Carbon-negative biofuels from low-input high-diversity grass-land. Biomass Science, 314, 1598–1600.
Unilever. (1990). LCI datasheets for palm oil, palm kernel oil and coconut oil. Provided by Peter Shonfield2004, Unilever (not published). In J. H. Schmidt (2007). Life assessment of rapeseed oil and palm oil.Ph.D. thesis, part 3: Life cycle inventory of rapeseed oil and palm oil. Diss. Department of Devel-opment and Planning, Aalborg University.
United Plantations Berhad (UPB). (2006). Annual report 2005. Teluk Intan, Malaysia: United PlantationsBerhad.
UPRD. (2004). Environmental impact assessment of oil palm cultivation and processing in united planta-tions berhad. Teluk Intan, Malaysia: United Plantations Research Department, United PlantationsBerhad.
U.S. Energy Information Administration. (2011). International energy statistics, biofuels production.http://tonto.eia.gov/cfapps/ipdbproject/IEDIndex3.cfm?tid=79&pid=79&aid=1. Accessed May 2011.
Wakker, E. (2004). Greasy palms—The social and ecological impacts of large-scale oil palm plantationdevelopment in Southeast Asia. London: Friends of the Earth United Kingdom.
Weidema, B. (2001). Avoiding co-product allocation in life-cycle assessment. Journal of Industrial Ecology,4(3), 11–33.
Weindorf, W. (2008). Vergleichende betrachtung der Herstellung von Biodiesel und im Co-Processinghydrierten Pflanzenolen. Ottobrunn, Germany: Ludwig-Bolkow-Systemtechnik GmbH.
478 G. Pehnelt, C. Vietze
123

Weng, C. K. (1999). Biomass production in the oil palm industry. In G. Singh, L. K. Huan, T. Leng, D.L. Kow (1999) Oil palm and the environment—A Malaysian perspective. Malaysian Oil Palm GrowersCouncil, Kuala Lumpur.
Yacob, S., Hassan, M. A., Shirai, Y., Wakisaka, M., & Subash, S. (2006). Baseline study of methaneemission from anaerobic ponds of palm oil mill effluent treatment. Science of the Total Environment,366, 187–196.
Yusof, B., & Weng, C. K. (2004). The oil palm and its sustainability. Journal of Palm Oil Research, 16(1),1–10.
Yusoff, S. (2006). Renewable energy from palm oil—innovation on effective utilization of waste. Journal ofCleaner Production, 14, 87–93.
Yusoff, S., & Hansen, S. B. (2007). Feasibility study of performing a life cycle assessment on crude palm oilproduction in Malaysia. International Journal of Life Cycle Assessment, 12(1), 50–58.
Recalculating GHG emissions saving of palm oil biodiesel 479
123


![Fisher#$%&’()*+,--./012 · 书!" Fisher#$%&’()*+,--./012———!"#$%&’() *+,1,- .1,/001,1232 (1.!"#$%&’()$*,+,!" 450001;2.+,-./012,+,!" 450002) 34 [45]6789](https://img.pdfslide.net/doc/110x75/5f6e2d4ba9949b038256b3e4/fishera-fishera-012aaaa.jpg)