Embed Size (px)
Citation preview
7/27/2019 Art Co
http://slidepdf.com/reader/full/art-co 1/26
A New Indicator of Technological Capabilities
for Developed and Developing Countries (ArCo)
DANIELE ARCHIBUGILondon School of Economics and Political Science, UK Italian National Research Council, CNR, Rome, Italy
and
ALBERTO COCO *Bank of Italy, Rome, Italy
Universite Catholique de Louvain la Neuve, Belgium
Summary. — This paper devises a new indicator (ArCo) of technological capabilities that aims ataccounting for developed and developing countries. Building on similar attempts as those devisedby UN Agencies, including the UNDP Human Development Report’s Technology AchievementIndex (TAI) and UNIDO’s Industrial Performance Scoreboard, this index takes into account anumber of other variables associated with technological change. Three main components areconsidered: the creation of technology, the technological infrastructures and the development of human skills. Eight subcategories have also been included. ArCo also allows for comparisonsbetween countries over time. A preliminary attempt to correlate ArCo to GDP is also presented.Ó 2004 Elsevier Ltd. All rights reserved.
Key words — technology creation, infrastructures, human skills, development index
1. INTRODUCTION: SCOPE, RELEVANCEAND ASSUMPTIONS
Technological capabilities have always beena fundamental component of economic growthand welfare. One of their key characteristics isthat they are far from being uniformly distri-buted across countries, regions and firms.Knowledge production is largely concentrated
in a few highly industrialized countries. Theaccess to new and old knowledge, in spite of international trade, communications, foreigndirect investment, public policies promotingscientific cooperation and many other channelsof technology transfer, is a long way awayfrom being geographically homogenous. A fewcountries constantly upgrade their knowledge-base while the majority of them lag behind andhave many difficulties absorbing capabilitiesthat are already considered obsolete in otherparts of the world.
The determinants of the generation, trans-mission and diffusion of technological inno-vation have been studied both from the
theoretical and empirical viewpoint in a largebody of literature (Pietrobelli, 2000). But the
www.elsevier.com/locate/worlddev
World Development Vol. 32, No. 4, pp. 629–654, 2004Ó 2004 Elsevier Ltd. All rights reserved
Printed in Great Britain0305-750X/$ - see front matter
doi:10.1016/j.worlddev.2003.10.008
*Preliminary versions of this paper were presented at
the Workshop on Economic Impact of Innovation and
Globalization, Turin, 13 June 2002, at the Master in
Science, Technology and Society, University of Buenos
Aires Quilmes, October, 8 2002, at the Doctoral Pro-
gram on Economics and Management of TechnologicalChange, University of Madrid Complutense, January
28, 2003, at the ECA Knowledge Economy Unit, the
World Bank, Washington, DC, May 8, 2003. We also
wish to thank Kim Bizzarri, Liliana Herrera Enriquez,
Francesco Lissoni, Richard Nelson, Mario Pianta, Carlo
Pietrobelli, Giuseppe Zampaglione and two anonymous
referees for detailed comments to previous versions. We
also wish to thank a large number of national statistical
experts who provided information, statistics, and com-
ments to complete and/or corroborate the ArCo data-
base. Financial support from MIUR Project 2001, on
Technological innovation and economic performance,
No. 2001133591, University of Urbino, is gratefully
acknowledged. Final revision accepted: 7 October 2003.
629
7/27/2019 Art Co
http://slidepdf.com/reader/full/art-co 2/26
current understanding of the devices of tech-nology creation and transfer is still inadequate,in part due to the lack of detailed indicators of technological change. This paper presents anew index of technological capabilities, ArCo,
for a large number of countries. It builds onmany lessons learned of the nature of techno-logical change and on other previous attemptsto measure it, including the latest TechnologyAchievement Index (TAI) presented by theUN’s Human Development Report (UNDP,2001) and the UN Industrial PerformanceScoreboard (UNIDO, 2003).
Among the lessons learned on the measure-ment of technological capabilities, we wish torecall the following:
––The technological capabilities of a country
are composed of a variety of sources of knowledge and of innovation. A comprehen-sive measure should be able to account forthe activities that are codified as well as forthose that are tacit (Lundvall, 1992). Someof the capabilities are disembodied, such asnew ideas and inventions. Others are embod-ied in equipment, machinery and infrastruc-tures, while still others are embodied inhuman skills (Evangelista, 1999; Pianta,1995; Smith, 1997).
––Technological capabilities are composed
of clusters of innovations associated withdifferent waves of industrial development(Freeman & Louta, 2001).
––The integration of new technology sys-tems requires the mastering of previous tech-nologies, allowing economic agents to buildcompetencies in a cumulative manner (Bell& Pavitt, 1997; Pavitt, 1988a). Often newsystems make previous ones obsolete (Juma& Konde, 2002). As Schumpeter remarked,‘‘add as many mail-coaches as you please,you will never get a railroad by doing so.’’
––The various sources of technological cap-ability are more likely to be complementaryrather than interchangeable. First rate infra-structures devoid of a sufficiently qualifiedlabor force will be useless and vice versa (Ab-ramovitz, 1989, Maddison, 1991). Moreover,successful integration among the variouswaves of innovations has the effect of multi-plying its economic and social impact (Anto-nelli, 1999; Amable & Petit, 2001).
––The creation and improvement of techno-logical capabilities involve a crucial element
of technological ‘‘effort.’’ Access to ad-vanced technology is a necessary condition,but it needs to be accompanied by substan-
tial and purposeful investments for it to beabsorbed, adopted and learned (Pietrobelli,1994; Lall, 2001a).
––Since the differences across countries’technological capabilities are colossal, a
measure to account for them meaningfullyshould consider the components that arespecific to both developed and developingcountries (Lall, 2001a).
Our work has been inspired by a variety of attempts to generate measures of technologicalcapabilities. Even when we departed fromprevious statistical exercises, we benefitedfrom their methodology. In particular, wewish to mention, besides the already citedTechnology Achievement Index (UNDP,2001) and the Industrial Development Score-
board (Lall & Albaladejo, 2001; UNIDO,2003), also the Technology Index of the WorldEconomic Forum’s Global CompetitivenessReport (WEF, 2002), and the critical analysisby Lall (2001b). Throughout the paper, wespecify when we have followed these approa-ches and when, and why, we have opted foralternative paths. 1
It should be noted that statistics of techno-logical activities for the restricted group of the30 most developed countries could be muchmore sophisticated in terms of coverage and
significance. For this group of leading coun-tries, many more indicators are available (andthe quality of the data is much more satisfac-tory than for other countries). If we were tolimit our analysis to this restricted number of countries, we would have used different indi-cators and methodology (for a discussion of the various attempts to measure scientific andtechnological capabilities of advanced coun-tries see Archibugi & Pianta, 1992; Patel &Pavitt, 1995). It is hardly surprising that datafor the selected number of countries that con-
centrate the bulk of inventive and innovativeactivities are much richer. The attempt here isto provide measures for a much larger group of countries which, as a whole, have a much morelimited level of technological capabilities.Monitoring the existing capabilities will permit,to identify of the nature and intensity of thetechnology gap and the appropriate strategiesto bridge it.
This analysis is based upon a number of assumptions. First, we assume that a compar-ative analysis across countries is meaningful
(Sirilli, 1997). In spite of the enormous differ-ence across countries (how can one describe ina single number the technology gap between
WORLD DEVELOPMENT630
7/27/2019 Art Co
http://slidepdf.com/reader/full/art-co 3/26
Switzerland and Somalia?), countries can becompared. But we also assume that a battery of indicators could provide a more comprehensivepicture of the differences than a single indicatorwould. The statistics produced achieve greater
significance when considering homogeneousgroups of countries and allow comparisonsbetween countries geographically, culturallyand economically close to each other, (such as,for example, Switzerland and Germany,Somalia and Ethiopia. For a discussion, seePietrobelli, 1994).
Second, we assume that a country-levelanalysis still proves useful despite the enormousdifferences found within countries. Syntheticindicators for countries as large as China orIndia inevitably overestimate the technological
capabilities of certain areas and underestimatethe capabilities of others. This also appliesto countries with much higher technologicalcapabilities such as, for example, the UnitedStates and Japan. Moreover, recent research ontechnological agglomerations (Cantwell &Iammarino, 2003) showed that technologicalactivities tend to cluster in a few hubs even inthe most technologically advanced countries.Still, the notion of national systems of inno-vation (see Andersen, Lundvall, & Sorrn-Friese, 2002; Edquist, 1997; Freeman, 1997;
Lundvall, 1992; Nelson, 1993) indicates that itmakes sense to analyze the technologicalcapabilities of territorial states, since theseprovide one of the main institutional settingsfor know-how generation and diffusion Thesame analysis has already been successfullyapplied to developing countries (see Cassiolato& Lastres, 1999, and Sutz, 1997, for LatinAmerica; Hobday, 1995, for Asia; Lall &Pietrobelli, 2002 for Africa).
Third, although we measured technologicalcapabilities with a variety of indicators, we
made an attempt to provide a syntheticindicator. Other exercises made an effort toestimate countries’ technological capabilitiesby aggregating data at the firm level. Unfor-tunately, this approach has not yet been ableto generate data for larger groups of coun-tries. Our measure is typically a macro-eco-nomic one and, at the country level, it iscomposed of a selected number of indicators.In spite of the limitations of a syntheticindicator, we share with the UNDP, UNIDOand WEF the belief that the various compo-
nents singled out could be added up in orderto provide a more comprehensive measure of technological activities.
2. CHANGES COMPARED TO PREVIOUSANALYSES
We built upon the TAI attempt developed byUNDP (Desai, Fukuda-Parr, Johansson, &
Sagasti, 2001; UNDP, 2001), and the Indus-trial Development Scoreboard developed byUNIDO (Lall & Albaladejo, 2001; UNIDO,2003). The TAI takes into account many indi-cators, by classifying them in four categories:the creation of technology, the diffusion of newtechnology, the diffusion of old technology, andhuman skills. We considered this a more effec-tive starting point than the index suggestedby the WEF (2002). The UNIDO IndustrialDevelopment Scoreboard divides a battery of indicators into two broad groups: the first
deals with competitive industrial performance(including manufacturing value-added percapita, manufactured exports per capita, shareof medium- and high-tech industries in manu-facturing value-added and share of medium-and high-tech in manufactured exports); thesecond concerns industrial capabilities (includ-ing foreign direct investment per capita, foreignroyalty payments per capita, tertiary techni-cal enrolments, enterprise financed R&D percapita, and the infrastructure as measured bytelephone main lines). The main modifications
we introduced to these two indexes are thefollowing.
(a) Enlarge the number of countries examined
In order to enlarge the number of countriesexamined, without losing data and sourcecoherence, we focused on indicators whosecoverage was more satisfactory. We took intoaccount both the availability of data and thedimension of population: we neglected coun-
tries with less than 500,000 inhabitants, exceptfor those countries (Luxembourg, Malta,Cyprus and Suriname) for which we retainedsufficient data. For those countries for whichdata proved analytically insufficient (as formost African countries), missing values wereestimated on the basis of national sources,interviews with country experts, and perfor-mance in comparatively similar countries andindicators. In extreme cases, minimum valueswere taken for groups of comparable countries(often equivalent to zero, due to the conditions
of extreme poverty of some of the countriesanalyzed). Our pool is comprised of 162 coun-tries in total.
A NEW INDICATOR OF TECHNOLOGICAL CAPABILITIES 631
7/27/2019 Art Co
http://slidepdf.com/reader/full/art-co 4/26
(b) Allowing comparisons over time
In addition to crosscountry comparisons, weattempted time-series comparisons. The pur-pose of the TAI was not to compare countries
at different time points but to perform cross-country comparisons at particular time points.Standardized indicators from 0 to 1 were builtaccording to the following formula:
Observed valueÀMinimum observed value
Maximum observed valueÀMinimum observed value:
In TAI, all observed values referred to the sametime period. Since maximum and minimumobserved values are subject to change overtime, time comparisons are impossible. Inaddition, the Industrial Development Score-
board presents a time-series comparison for1985–98.
In order to allow for time-series compari-sons, a maximum and a minimum value werefixed for ArCo, so that both would resultidentical for both the time points considered (acurrent period which oscillates from 1997 to2000 and a past period from 1987 to 1990).Given that during the two time points consid-ered the majority of countries under observa-tion experienced progress of some kind, theminimum observed value was taken from thepast period, while the maximum observed valuewas taken from the most current one. Conse-quently, homogeneous indicators for all timeperiods were devised with the certainty that nocountry would express a passed minimum valuehigher than the more recent one. In otherwords, no index in the past could ever over-come the value of 1. The formula for this newindicator can be summarized as:
I x ¼Obspresent À Minpast
Maxpresent À Minpast
Since the literacy rate indicator is known tooscillate between the values of 0% and 100%,these were taken automatically as the minimumand maximum goalposts (therefore eliminatingthe need for minimum and maximum observedvalues for this indicator).
3. THE ARCO TECHNOLOGY INDEX
Three main dimensions of technologicalcapabilities were considered:
––the creation of technology; ––the technological infrastructures; ––the development of human skills.
The choice was based on the assumption thatthe three components play a comparative rolein the making of a country’s technologicalcapabilities. Thus, the overall TechnologyIndex (ArCo) has been built upon the equal
weighting of the three mentioned categories(each of which is indexed). 2 The ArCo indexformula can therefore be sketched as:
ArCoTI ¼X3
i¼1
ki I i;
where I i represents the three indexes (technol-ogy creation, actual technology infrastructuresand actual human skills) for each country andki are the constants of 1/3.
The index of each category is calculated by
the same procedure used for the overall index,that is, through the simple mean of certainsubindicators. In total we considered eightbasic indicators: two for the first category andthree for the second and the third. The eightsubindexes are the following:
(a1) patents;(a2) scientific articles;(b1) Internet penetration;(b2) telephone penetration;(b3) electricity consumption;(c1) tertiary science and engineering enrol-
ment;(c2) mean years of schooling;(c3) literacy rate.
The following is a detailed explanation of each indicator:
(a) Creation of technology
(i) (a1) PatentsPatents are one measure of accounting for
the technological innovations generated forcommercial purposes. They represent a form
of codified knowledge generated by profit-seeking firms and organizations. Among thevarious patent sources (for surveys on patentsas internationally comparable indicators, seeArchibugi, 1992; Pavitt, 1988b), we consideredpatents granted in the United States. Since thelatter is the largest and technologically moredeveloped market of the world, it is reasonableto assume that important inventions andinnovations are legally protected in the USmarket. The TAI considers those patents thatare taken out by individuals in their home
country. Such data were not used here sincecountries exhibit significant legal differences–– for example, the very high number of patented
WORLD DEVELOPMENT632
7/27/2019 Art Co
http://slidepdf.com/reader/full/art-co 5/26
inventions registered by Japanese and Koreaninventors at their national patent offices is alsoassociated with the legal practice that requiresinventors to file an application for each claim.
The patent index is based on utility patents
(that is, invention patents) registered at the USPatent and Trademark Office (USPTO, 2002).Patents taken out in the United States by theinventor’s country of residence were consid-ered. The USPTO receives a greater number of foreign patent applications than any otherpatent office. Despite the fact that manyinventions are never patented, especially indeveloping countries, patents represent never-theless a good proxy for commercially exploit-able and proprietary technological inventions.
The propensity of US inventors to register
inventions in their own national patent office ishigher than that of foreign inventors. To elim-inate the bias toward US domestic patents, wereplaced the effective number of domestic pat-ents with our own estimation. The latter isbased on a comparison between the Japaneseand the US patents registered at the EuropeanPatent Office (EPO), which represents a foreigninstitution both for Japanese and Americaninventors. We used the following estimation:
Estimated US domestic patents
¼ ðJAPUSA Â USAEPOÞ=JAPEPO;
where JAPUSA is the effective number of patentsgranted to Japanese inventors in the UnitedStates, and USAEPO and JAPEPO are the effectivenumber of patents granted to US and Japaneseinventors at the European Patent Office. Pro-portions for patents granted in Japan to Euro-pean inventors were also estimated andappeared not to exhibit any major differences.
The number of patents for each country wasnormalized by dividing it for the country’s
respective population (the number of patentswas expressed for a million people). In order toaccount for the effects that yearly fluctuationsmight have on the results obtained from small-and medium-sized countries, a four-year mov-ing average for 1987–90 and 1997–2000 wasconsidered.
The goal posts were set as the maximum andthe minimum observed value for 1997–2000(230 for the maximum value––corresponding toJapanese patents for a million people––andzero for the minimum value) and the stan-
dardized patent activity index was constructedby application of the general formula, withvalues oscillating between zero and one. As
explained above, in order to allow for com-parisons to be made across time as much asacross geographical borders, the same goal-posts were kept for the previous years, so that acomparable index for 1987–90 could be calcu-
lated while allowing us to evaluate each coun-try’s growth rate during the two points in time.
(ii) (a2) Scientific articlesScientific literature is another important
source of codified knowledge. It represents theknowledge generated in the public sector, andmost notably in universities and other publiclyfunded research centres, although researchersworking in the business sector also publish asignificant share of scientific articles.
There is no single source of information
concerning all the scientific literature publishedin the world. We were forced to rely on theavailable, if limited, sources. Among them, themost comprehensive and validated is the Sci-ence Citation Index generated by the Institutefor Scientific Information. The index reportsinformation concerning the scientific and tech-nical articles published in a sample of about8,000 journals selected among the most presti-gious in the world. The fields covered are:physics, biology, chemistry, mathematics, clin-ical medicine, biomedical research, engineering
and technology, and earth and space sciences.It is often argued that the journals in this
sample are biased toward English-speakingcountries. Although there is some evidencesupporting this claim, it might be more accu-rate to state that journals reflect the most visi-ble part of the scientific literature, while theyignore other important components in bothdeveloped and developing countries––thoughwe believe the data source do not discriminateheavily against developing countries. It iscertainly significant that late industrializing
countries have begun to be active in both pat-enting and scientific publications (see Amsden& Mourshed, 1997).
Data were taken from the US NationalScience Foundation’s most recent publications(NSF, 2000, 2002) and the World Bank’sdatabase. 3 Article counting was based onfractional assignments: for example, an articlewritten by two authors in two different coun-tries was counted as one-half article to eachcountry. 4 Switzerland scored the highestnumber of articles for 1997–99 with 977 annual
articles per million people, while the minimumgoal post was zero for many countries with nopublished scientific articles.
A NEW INDICATOR OF TECHNOLOGICAL CAPABILITIES 633
7/27/2019 Art Co
http://slidepdf.com/reader/full/art-co 6/26
Data on R&D would have nicely comple-mented the measure of national technologicalcreation, especially since they document devel-oping countries’ learning effort for acquiringscientific and technological expertise. This
source however, was not employed due to alack of available data for all countries (seeUNESCO, 2002; World Bank, 2003, Table5.12). UNIDO (2003) reported these data for87 countries only, and for 16 of them the valuesprove negligible. Moreover, some developingcountries tend to include some activities inR&D statistics that do not fit the standardOECD Frascati Manual definitions (OECD,2002). The advantage of using patents andscientific articles consists of both sets of databeing validated by external sources as much as
by national ones (the US Patent Office in thefirst case, and the academic journals monitoredby the Institute for Scientific Information inthe second). This guarantees that individualobservations are collected according to stan-dard criteria. A rank correlation was calculatedbetween the hierarchy of countries according toUS patents per million population and theenterprise financed R&D per capita (employedin UNIDO, 2003). The result for the 61 coun-tries with available data proved very high, witha value of 0.92 (Archibugi & Coco, 2004),
demonstrating that a combination of patentsand scientific articles provide a robust measureof national technological efforts also compris-ing R&D inputs.
(b) Technological infrastructures
We considered three different indicators of technological infrastructures: Internet, tele-phony and electricity. They correspond to threemajor industrial revolutions of the 20th century(Freeman & Louta, 2001). They are basic
infrastructures for economic and social life.Although they are not necessarily connected toindustrial capabilities, production knowledge isstrongly associated to their availability anddiffusion.
(i) (b1) Internet penetrationThe Internet is a vital infrastructure not only
for business purposes, but also for access toknowledge. Internet users access a worldwidenetwork. They differ from Internet hosts, whichare computers with active Internet Protocol
(IP) addresses connected to the Internet. Thedata on users, when available, are preferable tothose on hosts for two reasons: first, they give a
more precise idea about the diffusion of Inter-net among the population; second, some hostsdo not have a country code identification andin statistics are assumed to be located withinthe United States, therefore causing a bias. The
source here used was the World Bank (see alsoWorld Bank, 2003, Table 5.11), which extractedthe data from ITU (2001) (the same data areemployed in UNDP, 2001).
In order to compare the penetration of theInternet among the different countries we divi-ded the number of users by population. Themaximum goal post is 540 per 1,000 people,value belonging to Iceland, while the minimumis zero, observed both in the recent and in thepast period for some very poor countries. Theinternet is a new technology that has quickly
become the keystone of the Information andCommunication Technology, but it was not yetcommercially available in 1989–90. For thisreason, we postponed the past period to 1994so that data referred to a time interval of fiveinstead of 10 years.
(ii) (b2) Telephone penetrationTelephony, besides its civilian component, is
also a fundamental infrastructure for businesspurposes, and it allows tracing populationswith human skills and acquiring technical
information. Telephone mainlines are tele-phone lines connecting a customer’s equipmentto the public switched telephone network. Theyare another fundamental infrastructure foreconomic and social life. Data are presentedper 1,000 people for the entire country (formore information, see World Bank, 2003,Table 5.10) both by World Bank database andUNDP (2001), which both collected the datafrom ITU (2001). To main lines, we addedmobile phones per 1,000 people, since theyrepresent the natural evolution of telecommu-
nication. An equal weight was assigned to olderand newer telephonic component since theyshare the same function despite incorporatingdifferent degrees of technology.
As telephony represents a definitivelyacquired form of technology for a large numberof countries (the developed ones), we expressedthe sums between fixed and mobile lines innatural logarithms. This ensures that, as thelevel of telephony increases (therefore as wemove toward the more developed countries),the difference between the new and the old
(lower) value expressed in logarithms decreases,consequently reducing the gap among coun-tries, for the exception of those countries with
WORLD DEVELOPMENT634
7/27/2019 Art Co
http://slidepdf.com/reader/full/art-co 7/26
very low initial values. In other words, the useof log creates a threshold above which thetechnological capacity of a country is no longerenriched by the use of telephones.
Furthermore, since many countries can said
to have reached the desired level of telephonypenetration, the chosen goal value for the cal-culus of the index was not taken as the maxi-mum observed value, but the OECD average(960 telephones for 1,000 people). This not onlyincreases the index for all countries, but alsoallows to eliminate useless differences among allthose countries whose telephony share is supe-rior to the mean one (they all get the value one).Therefore, as the minimum observed value iszero (transformed to one due to the use of logarithms), the formula becomes:
Ln ðobserved valueÞ
Ln ðOECD averageÞ:
(iii) (b3) Electricity consumptionElectric power consumption (kilowatt per
hour per capita) measures the production of power plants and combined heat and powerplants, less distribution losses, and own use byheat and power plants (for more information,see World Bank, 2003, Table 5.10). This indi-
cator accounts for the oldest technologicalinfrastructure. Electricity consumption is also aproxy measure for the use of machinery andequipment, since most of it is generated byelectric power. Although we are aware that thisis likely to be larger for capital-intensiveindustries than for services, we believe that theuse of logs provides values that respond to thereal use of machinery and equipment. Othervaluable measures of industrial capacity devel-oped, for example, by Lall and his colleagues(see Lall & Albaladejo, 2001; UNIDO, 2003)
are available for a smaller number of countriesonly.
The observations on the telephony index overthe use of logarithms and the adoption of theOECD average as the maximum goalpost,apply a fortiori for the electricity consumptionindex. The OECD average corresponded to8,384 kwh per capita, whilst Ethiopia (1989–90)produced the minimum value of 17 kwh percapita. For those other low-income countrieswhose data were not available a minimumestimate was calculated.
Data on high technology production andtrade were not included. Although varioussources provide this kind of data (UNDP, 2001;
UNIDO, 2003; World Bank, 2003), someproblems emerge. Concerning high-tech pro-duction, data for many countries are missing.Moreover, available data are not always reli-able, especially concerning production, since
they are derived from national sources, whichoften apply different criteria for defining high-tech sectors. Concerning high-tech trade, highexports can simply imply high imports (as inthe case of Singapore and Hong Kong).Moreover trade, including high-tech, is stronglyassociated to the size of a country’s economy:large countries have a lower propensity to tradethan small ones do, and vice versa. It was notpossible to produce an index able to accountfor intraindustry trade and size, however acomparison of ArCo with high-tech imports
data is attempted in Section 7.Measures of capital equipment and ma-
chinery were not included either, despite theserepresenting a key component of embodiedtechnological capacity vital both for developedand developing countries (Evangelista, 1999;Pianta, 1995; Scott, 1989). The closest substi-tute would be gross fixed capital formation,which is also available for a large number of countries in the World Bank data base (WorldBank, 2003, Table 4.9). This measure, however,was not accounted for either since: (i) it is not
possible to separate the component of grosscapital formation devoted to investment incapital equipment and machinery from otherforms of investment; and (ii) the indicator isexpressed in monetary values, which wouldmake it difficult to link ArCo to other currency-based economic variables.
(c) The development of human skills
Technological capabilities are strongly asso-ciated with human skills. Disembodied knowl-
edge (as measured by patents and scientificliterature) and technological infrastructures (asmeasured by the Internet, telephony and elec-tricity) have little value unless used by experi-enced people. To complement our index, wetook into account three different measures of human skills.
(i) (c1) Tertiary science and engineering enrolment
The indicator considered the share of uni-versity students enrolled in science and engi-
neering related subjects in the population of that age group. This indicator provides anestimate of the science and technology human
A NEW INDICATOR OF TECHNOLOGICAL CAPABILITIES 635
7/27/2019 Art Co
http://slidepdf.com/reader/full/art-co 8/26
capital, through the creation of a skilled humanbase. It is obtained by multiplying two per-centages, which are gross tertiary enrolmentratio and percentage of tertiary students inscience and engineering.
The gross tertiary enrolment ratio is the ratioof total enrolment at the tertiary level, regard-less of age, to the population of the age groupthat officially corresponds to the level of edu-cation considered. Tertiary education, whetheror not to an advanced research qualification,normally requires, as a minimum condition foradmission, the successful completion of educa-tion at the secondary level (for more informa-tion, see World Bank, 2003, Table 2.12). Datawere gathered from the World Bank data set–– originally produced by UNESCO (2002).
Science and engineering students includestudents at the tertiary level in the followingfields: engineering, natural science, mathemat-ics and computers, and social and behavioralscience. By multiplying the two percentages, weobtained the desired indicator. The maximumvalue was scored by Finland in 1998 with avalue of 32.6%, while the minimum valuescored was zero for more than one country.This indicator rests on an implicit assumption,namely that the quality of education pro-vided across countries is comparable. On the
contrary, we are aware that the quality of education, and the successful completion of education, is subject to great variation acrosscountries. The capability of developing coun-tries is probably overestimated in our analysis,while the capability of developed countriesis probably subject to underestimation. Thecompletion of courses is not accounted forsince it is assumed that enrolment in science-and engineering-related subjects contributes tothe technological capability of a country inde-pendently as to whether courses are completed.
(ii) (c2) Mean years of schooling They represent the average number of years
of school completed in the population over14. Although this indicator does not considerdifferences in the quality of schooling, it givesan indication of the human skill level (the‘‘stock’’). The sources are the UNDP (2001),which collected an elaboration by Barro andLee (2001), 5 and World Bank (2003, Table2.13). The maximum goalpost is 12 and corre-sponds to United States’ mean years of
schooling, while the minimum value ð0; 7Þ wasobserved in Mali (zero index was extended toother poor countries without available data).
Even for this indicator we had to implicitlyassume the level of education to be comparableacross countries.
(iii) (c3) Literacy rate
Literacy rate represents the percentage of people over 14 who can, with understanding,read and write a short, simple statement abouttheir everyday life. Data were collected fromWorld Bank (2003) and UNDP (2001) (formore information, see World Bank, 2003, Table2.14). This indicator allows performing a betterdistinction between the less-developed coun-tries. We considered the literacy rate as a nec-essary condition for the development of humanability. In this case the index oscillates betweenzero and 100%, which consequently represent
the minimum and the maximum goalpost.
A final note about population, which is thebase for the calculus of the pro capita indexes. Itis based on the de facto definition of population,which counts all residents regardless of legalstatus or citizenship, except for refugees notpermanently settled in the country of asylum,who are generally considered part of the popu-lation of their country of origin (for moreinformation, see World Bank, 2003, Tables 1.1& 2.1).
An interesting feature of the indicator heredevised is that none of the eight individualcomponents is based, directly or indirectly, onmonetary values. This means that it could bematched by indicators expressed in monetaryvalue without any risk of collinearity. Forinstance, it could be compared to indicatorssuch as international trade (including trade inhigh-tech products), value added per employee(which is often used as a measure for produc-tivity), gross capital formation (a measure of investment, including investment in capital
goods), and, of course, GDP and its growth. Thefull database can be freely downloaded at http://www.danielearchibugi.org/pdf/Theory_Measure-ment_Techn_Change/ArCo_Index.xls .
4. THE RESULTS AT THE COUNTRYLEVEL
Results do not differ in a revolutionarymanner from other similar studies, but a num-ber of fresh considerations can be made. First of
all, we tried, as in the TAI case, to group the 162examined countries in different blocks, by clas-sifying them along with the level of the overall
WORLD DEVELOPMENT636
7/27/2019 Art Co
http://slidepdf.com/reader/full/art-co 9/26
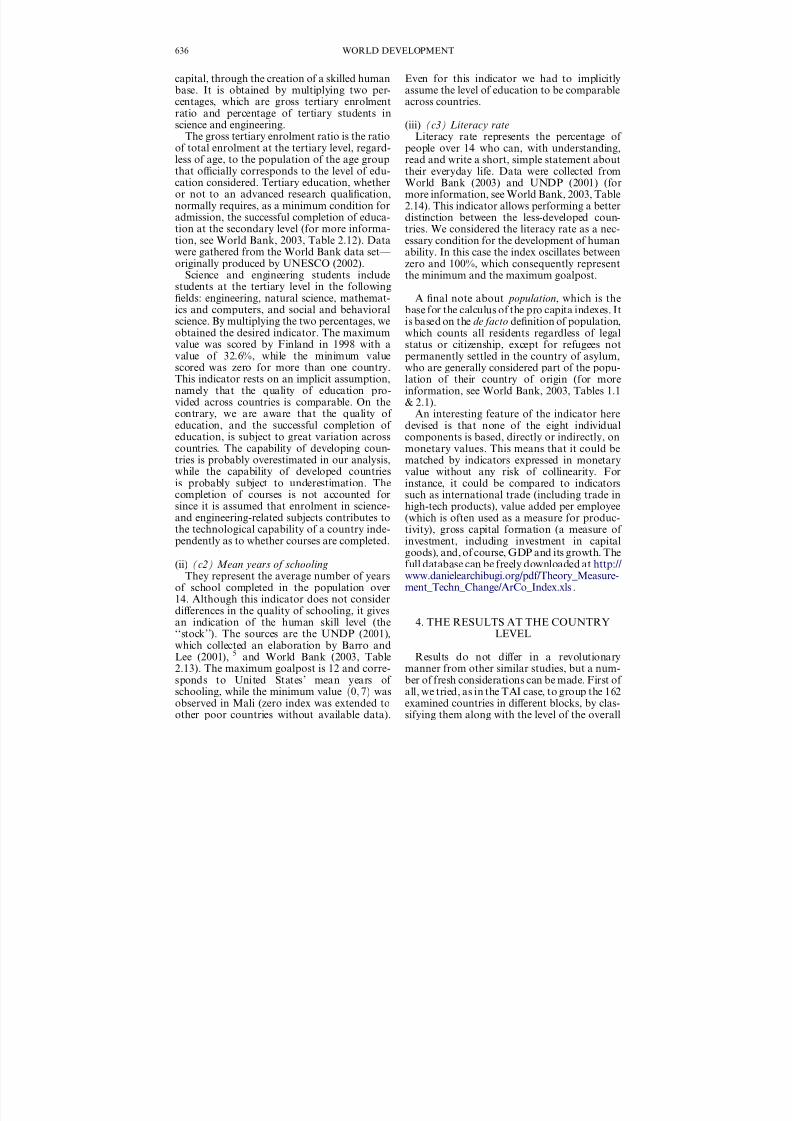
Table 1. A composite index of technological capabilities across countries (ArCo), 1990–2000
Actual
ranking
Current ArCo
Technology Index
Past ArCo
Technology Index
Past
ranking
Growth rate from the
last decade (%)
1 Sweden 0.867 0.681 2 27.2
2 Finland 0.831 0.614 6 35.23 Switzerland 0.799 0.735 1 8.7
4 Israel 0.751 0.669 4 12.2
5 United States 0.747 0.663 5 12.6
6 Canada 0.742 0.678 3 9.4
7 Norway 0.724 0.581 9 24.6
8 Japan 0.721 0.569 12 26.8
9 Denmark 0.704 0.584 8 20.6
10 Australia 0.684 0.561 14 21.9
11 Netherlands 0.683 0.571 10 19.7
12 Germany 0.682 0.593 7 15.0
13 United Kingdom 0.673 0.562 13 19.8
14 Iceland 0.666 0.484 18 37.8
15 Taiwan 0.665 0.436 22 52.6
16 New Zealand 0.645 0.570 11 13.3
17 Belgium 0.642 0.523 15 22.7
18 Austria 0.619 0.502 16 23.4
19 Korea, Rep. 0.607 0.415 31 46.3
20 France 0.604 0.499 17 21.0
21 Singapore 0.573 0.397 37 44.5
22 Hong Kong, China 0.569 0.435 24 30.8
23 Ireland 0.567 0.450 20 26.0
24 Italy 0.526 0.444 21 18.5
25 Spain 0.516 0.410 34 25.8
26 Slovenia 0.507 0.412 33 23.127 Greece 0.489 0.416 30 17.5
28 Luxembourg 0.486 0.426 27 13.9
29 Slovak Republic 0.481 0.428 26 12.3
30 Russian Federation 0.480 0.464 19 3.4
31 Czech Republic 0.475 0.432 25 9.9
32 Estonia 0.472 0.413 32 14.4
33 Hungary 0.469 0.402 36 16.8
34 Poland 0.465 0.393 39 18.3
35 Portugal 0.450 0.346 53 30.0
36 Bulgaria 0.449 0.435 23 3.2
37 Cyprus 0.440 0.384 41 14.4
38 Latvia 0.439 0.423 29 3.7
39 Belarus 0.431 0.403 35 6.8
40 Argentina 0.426 0.379 45 12.5
41 Chile 0.424 0.336 57 26.2
42 Ukraine 0.417 0.426 28 )2.2
43 Uruguay 0.417 0.348 52 19.9
44 Croatia 0.414 0.376 46 10.3
45 Bahrain 0.410 0.355 49 15.4
46 Lithuania 0.408 0.380 43 7.4
47 Kuwait 0.405 0.380 44 6.7
48 Moldova 0.395 0.394 38 0.2
49 United Arab Emirates 0.394 0.321 63 23.1
50 Romania 0.393 0.383 42 2.5
51 Panama 0.382 0.337 56 13.3(continued next page)
A NEW INDICATOR OF TECHNOLOGICAL CAPABILITIES 637
7/27/2019 Art Co
http://slidepdf.com/reader/full/art-co 10/26
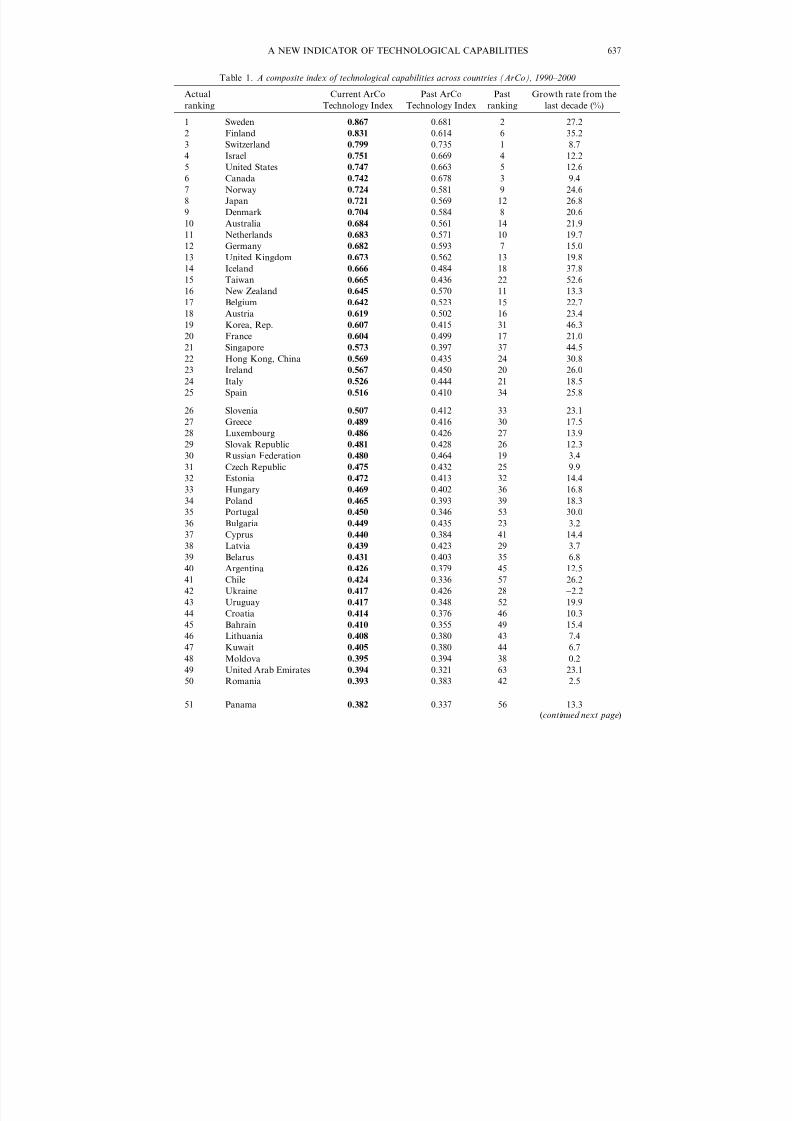
Table 1—(continued )
Actual
ranking
Current ArCo
Technology Index
Past ArCo
Technology Index
Past
ranking
Growth rate from the
last decade (%)
52 Kazakhstan 0.381 0.393 40 )2.8
53 Trinidad and Tobago 0.380 0.348 51 9.354 Qatar 0.380 0.353 50 7.6
55 Georgia 0.379 0.371 47 2.3
56 South Africa 0.372 0.334 58 11.1
57 Lebanon 0.370 0.292 72 26.5
58 Malaysia 0.369 0.295 69 25.2
59 Venezuela, RB 0.369 0.328 60 12.4
60 Costa Rica 0.361 0.322 62 12.2
61 Malta 0.361 0.325 61 10.9
62 Yugoslavia, Fed. Rep. 0.358 0.334 59 7.2
63 Mexico 0.358 0.320 64 11.8
64 Tajikistan 0.356 0.369 48 )3.6
65 Turkey 0.347 0.286 75 21.4
66 Jamaica 0.346 0.264 85 30.8
67 Peru 0.345 0.292 74 18.2
68 Thailand 0.342 0.278 80 23.3
69 Jordan 0.341 0.300 67 13.6
70 Azerbaijan 0.337 0.342 54 )1.4
71 Colombia 0.331 0.286 76 15.6
72 Brazil 0.330 0.280 77 17.6
73 Armenia 0.326 0.339 55 )3.6
74 Puerto Rico 0.326 0.293 71 11.4
75 Saudi Arabia 0.326 0.280 78 16.4
76 Paraguay 0.323 0.269 84 20.0
77 Philippines 0.322 0.277 81 16.4
78 Cuba 0.322 0.313 65 2.879 Ecuador 0.319 0.294 70 8.3
80 Uzbekistan 0.319 0.313 66 1.9
81 Iran, Islamic Rep. 0.313 0.241 90 29.9
82 Libya 0.312 0.274 83 13.7
83 El Salvador 0.311 0.236 93 31.9
84 Dominican Republic 0.308 0.258 86 19.4
85 China 0.306 0.227 97 34.7
86 Kyrgyz Republic 0.306 0.300 68 1.9
87 Bolivia 0.305 0.254 88 19.8
88 Fiji 0.304 0.278 79 9.1
89 Oman 0.300 0.238 91 26.0
90 Macedonia, FYR 0.300 0.276 82 8.591 Turkmenistan 0.289 0.292 73 )1.2
92 Tunisia 0.288 0.227 98 26.8
93 Mauritius 0.285 0.231 95 23.6
94 Syrian Arab Republic 0.282 0.256 87 10.2
95 Sri Lanka 0.280 0.227 96 23.0
96 Zimbabwe 0.279 0.248 89 12.2
97 Algeria 0.277 0.221 100 25.1
98 Guyana 0.271 0.226 99 20.0
99 Egypt, Arab Rep. 0.269 0.219 101 22.6
100 Indonesia 0.265 0.190 108 39.7
101 Suriname 0.264 0.219 102 20.1
102 Honduras 0.258 0.218 103 18.3103 Botswana 0.255 0.189 109 34.8
104 Albania 0.251 0.231 94 8.5
WORLD DEVELOPMENT638
7/27/2019 Art Co
http://slidepdf.com/reader/full/art-co 11/26
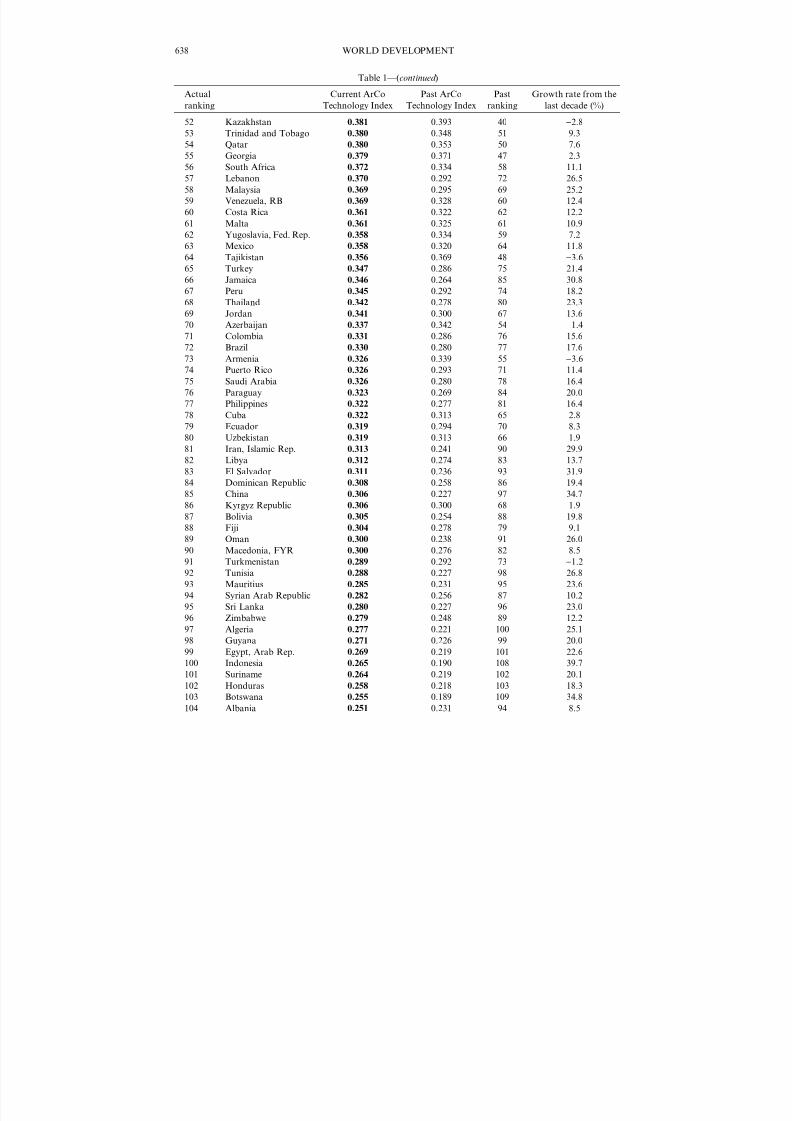
Table 1—(continued )
Actual
ranking
Current ArCo
Technology Index
Past ArCo
Technology Index
Past
ranking
Growth rate from the
last decade (%)
105 Iraq 0.246 0.238 92 3.4
106 Zambia 0.240 0.213 104 12.3107 Vietnam 0.239 0.164 118 45.5
108 Nicaragua 0.238 0.202 106 17.8
109 Guatemala 0.234 0.187 110 25.2
110 Gabon 0.231 0.204 105 13.1
111 India 0.225 0.169 116 32.9
112 Swaziland 0.222 0.184 111 20.4
113 Morocco 0.217 0.169 117 28.5
114 Namibia 0.217 0.184 112 17.6
115 Congo, Rep. 0.207 0.195 107 6.4
116 Kenya 0.204 0.177 114 15.1
117 Ghana 0.203 0.163 119 24.3
118 Mongolia 0.197 0.176 115 11.6119 Cameroon 0.192 0.163 120 18.0
120 Pakistan 0.191 0.158 121 20.9
121 Korea, Dem. Rep. 0.187 0.179 113 4.9
122 Myanmar 0.179 0.135 123 32.2
123 Lesotho 0.178 0.154 122 15.4
124 Tanzania 0.155 0.126 124 23.2
125 Senegal 0.151 0.109 130 38.1
126 Papua New Guinea 0.146 0.119 125 22.4
127 Togo 0.145 0.097 133 48.8
128 Nigeria 0.141 0.114 127 23.6
129 Sudan 0.140 0.096 136 46.3
130 Yemen, Rep. 0.140 0.112 128 24.2131 Cote d’Ivoire 0.136 0.080 141 69.8
132 Malawi 0.134 0.106 131 26.4
133 Uganda 0.133 0.097 134 37.6
134 Haiti 0.129 0.117 126 10.4
135 Congo, Dem. Rep. 0.125 0.110 129 13.6
136 Gambia 0.123 0.070 146 76.1
137 Bangladesh 0.123 0.086 138 43.2
138 Djibouti 0.122 0.099 132 22.3
139 Nepal 0.121 0.070 145 72.9
140 Madagascar 0.116 0.096 135 20.8
141 Benin 0.114 0.078 143 46.3
142 Rwanda 0.113 0.081 140 39.5
143 Mauritania 0.111 0.077 144 43.6
144 Central African
Republic
0.110 0.081 139 36.1
145 Angola 0.107 0.088 137 21.7
146 Bhutan 0.103 0.063 148 65.2
147 Lao PDR 0.098 0.057 151 73.6
148 Mozambique 0.098 0.069 147 41.6
149 Cambodia 0.096 0.047 156 103.3
150 Liberia 0.095 0.079 142 20.5
151 Eritrea 0.093 0.048 154 92.8
152 Guinea 0.079 0.045 158 73.9
153 Burundi 0.078 0.057 152 38.2
154 Guinea-Bissau 0.076 0.061 149 26.2
155 Sierra Leone 0.075 0.060 150 24.4(continued next page)
A NEW INDICATOR OF TECHNOLOGICAL CAPABILITIES 639
7/27/2019 Art Co
http://slidepdf.com/reader/full/art-co 12/26
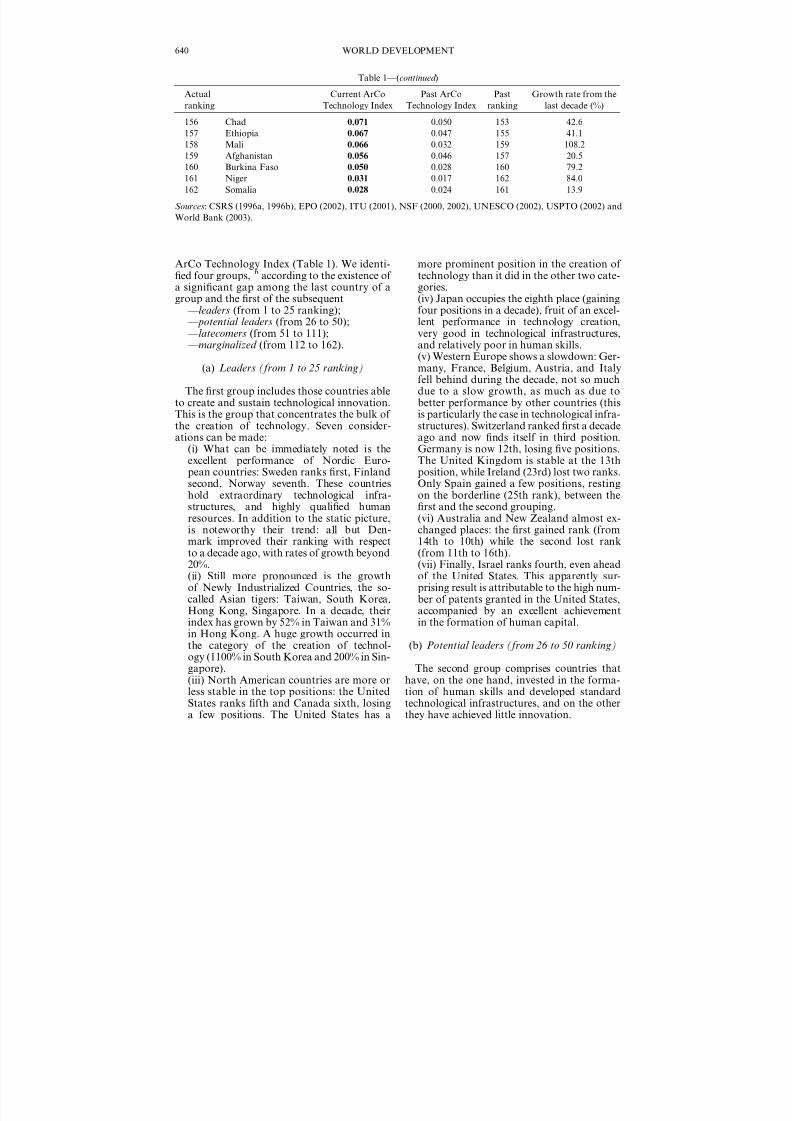
ArCo Technology Index (Table 1). We identi-
fied four groups,6
according to the existence of a significant gap among the last country of agroup and the first of the subsequent
–– leaders (from 1 to 25 ranking); –– potential leaders (from 26 to 50); –– latecomers (from 51 to 111); –– marginalized (from 112 to 162).
(a) Leaders (from 1 to 25 ranking)
The first group includes those countries ableto create and sustain technological innovation.
This is the group that concentrates the bulk of the creation of technology. Seven consider-ations can be made:
(i) What can be immediately noted is theexcellent performance of Nordic Euro-pean countries: Sweden ranks first, Finlandsecond, Norway seventh. These countrieshold extraordinary technological infra-structures, and highly qualified humanresources. In addition to the static picture,is noteworthy their trend: all but Den-mark improved their ranking with respect
to a decade ago, with rates of growth beyond20%.(ii) Still more pronounced is the growthof Newly Industrialized Countries, the so-called Asian tigers: Taiwan, South Korea,Hong Kong, Singapore. In a decade, theirindex has grown by 52% in Taiwan and 31%in Hong Kong. A huge growth occurred inthe category of the creation of technol-ogy (1100% in South Korea and 200% in Sin-gapore).(iii) North American countries are more or
less stable in the top positions: the UnitedStates ranks fifth and Canada sixth, losinga few positions. The United States has a
more prominent position in the creation of
technology than it did in the other two cate-gories.(iv) Japan occupies the eighth place (gainingfour positions in a decade), fruit of an excel-lent performance in technology creation,very good in technological infrastructures,and relatively poor in human skills.(v) Western Europe shows a slowdown: Ger-many, France, Belgium, Austria, and Italyfell behind during the decade, not so muchdue to a slow growth, as much as due tobetter performance by other countries (this
is particularly the case in technological infra-structures). Switzerland ranked first a decadeago and now finds itself in third position.Germany is now 12th, losing five positions.The United Kingdom is stable at the 13thposition, while Ireland (23rd) lost two ranks.Only Spain gained a few positions, restingon the borderline (25th rank), between thefirst and the second grouping.(vi) Australia and New Zealand almost ex-changed places: the first gained rank (from14th to 10th) while the second lost rank
(from 11th to 16th).(vii) Finally, Israel ranks fourth, even aheadof the United States. This apparently sur-prising result is attributable to the high num-ber of patents granted in the United States,accompanied by an excellent achievementin the formation of human capital.
(b) Potential leaders (from 26 to 50 ranking)
The second group comprises countries thathave, on the one hand, invested in the forma-
tion of human skills and developed standardtechnological infrastructures, and on the otherthey have achieved little innovation.
Table 1—(continued )
Actual
ranking
Current ArCo
Technology Index
Past ArCo
Technology Index
Past
ranking
Growth rate from the
last decade (%)
156 Chad 0.071 0.050 153 42.6
157 Ethiopia 0.067 0.047 155 41.1158 Mali 0.066 0.032 159 108.2
159 Afghanistan 0.056 0.046 157 20.5
160 Burkina Faso 0.050 0.028 160 79.2
161 Niger 0.031 0.017 162 84.0
162 Somalia 0.028 0.024 161 13.9
Sources: CSRS (1996a, 1996b), EPO (2002), ITU (2001), NSF (2000, 2002), UNESCO (2002), USPTO (2002) and
World Bank (2003).
WORLD DEVELOPMENT640
7/27/2019 Art Co
http://slidepdf.com/reader/full/art-co 13/26
(i) The largest number of countries in thisgroup comes from the former Socialist East-ern European countries. Predictions here areparticularly risky, especially since the eco-nomic and social conditions of these coun-
tries have been particularly turbulent. Dataand trends for the ex-Soviet or ex-Yugosla-vian new states are not entirely reliable. Inspite of turmoil, these countries show a goodperformance in human skills. Russia lostposition considerably in the last decade inall three categories as a consequence of thetransition to a market economy. Bulgariaand Romania lost meaningful positionstoo, while Hungary and Poland have gaineda few positions.Greece and Portugal, the countries to have
always lagged behind in technological cap-abilities within the European Union, areslowly bridging the gap. The latter, with agrowth rate of 30%, climbed from the53rd up to the 35th rank. Greece gaineda few positions by reaching the 27th posi-tion.(ii) Some South American countries havealso gained positions during the decade:Argentina, Uruguay and especially Chilehad a grow rate of 26%, with Argentinareaching 40th.
(iii) Within the Arab countries the perfor-mance of United Arab Emirates is noteable:thanks to a good availability of infrastruc-tures it gained 14 positions and almostreached Kuwait, which remains the leaderof the Arabic countries for technologicalprogress at the 47th place.
(c) Latecomers (from 51 to 111 ranking)
The third group, the largest, is composed of countries which, in one way or another, try to
stimulate their technology growth parallel totheir development efforts: technological infra-structure and formation of human skills.
(i) Central and South American countriesdeserve a special comment since none of them, with the exception of Cuba, haveshown a downgrading trend compared to adecade ago (Panama, Venezuela, CostaRica, Mexico, Jamaica, Peru, Colombia,Brazil, Paraguay and Bolivia). These coun-tries have developed particularly good tech-nological infrastructure (growth rates
around 20%), though human skills havenot grown as effectively (not superior to10%).
(ii) A similar trend can be observed amongAsian countries, where Malaysia and Thai-land (both with a growth rate beyond 20%)are in the top positions, followed by the Phil-ippines (growth rate of 16%). Although
placed at the bottom of this list (100th),Indonesia shows the highest growth ratesince the previous decade (40%).(iii) In Asia, China and India deserve a sepa-rate comment: China has shown an extraor-dinary growth rate of technologicalinfrastructures (71%) but has remained al-most stable in human skills wise. Overall, ithas shown one of the highest growth ratesin the last 10 years (35%, second only to Indo-nesia), by gaining 12 positions (from 97th to85th).
(iv) India closes the third grouping by rank-ing at 111th. This may seem unfair but,apart from some African countries and Viet-nam––which do not have reliable data relat-ing to the past––India is the country thatshows the highest growth rate (33%), driven,like China, by the development of techno-logical infrastructure.(v) In the Middle East, Lebanon climbed tothe 57th position (growth rate of 26%), plac-ing behind Qatar (54th) and ahead of Jordan(69th), while Saudi Arabia increased its rank
to the 75th position.(vi) Finally, a restricted set of Africancountries showed signs of catching up,with South Africa (56th) in the lead andNorth African countries Tunisia (92nd),Algeria (97th) and Egypt (99th) justbehind. These countries show a delay inthe development of technology infrastruc-tures, but are growing in terms of humanskills.
(d) Marginalized (from 112 to 162 ranking)
The fourth and last group is composed of marginalized countries, which do not havelarge access even to the oldest technologies,such as electricity and telephony. In this group,relative position is not particularly meaningful,due mainly to the lack of available data. Evenhigh growth rates can simply be due to the verylow values in both periods. These countries arepractically lacking the first category––creationof technology––and have poor technologicalinfrastructures and human skills. Many African
countries fall within this grouping where thelow technological level is associated to the verylow income levels.
A NEW INDICATOR OF TECHNOLOGICAL CAPABILITIES 641
7/27/2019 Art Co
http://slidepdf.com/reader/full/art-co 14/26
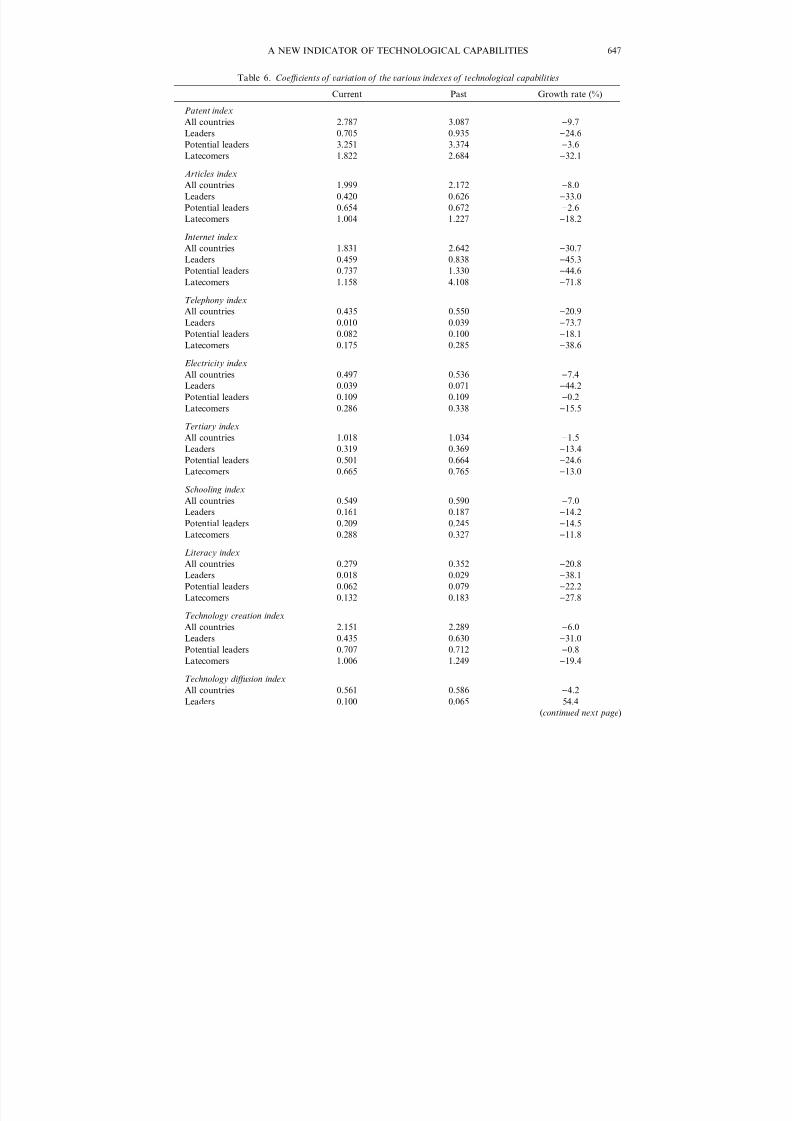
5. SOME STATISTICS ON THEINDICATORS
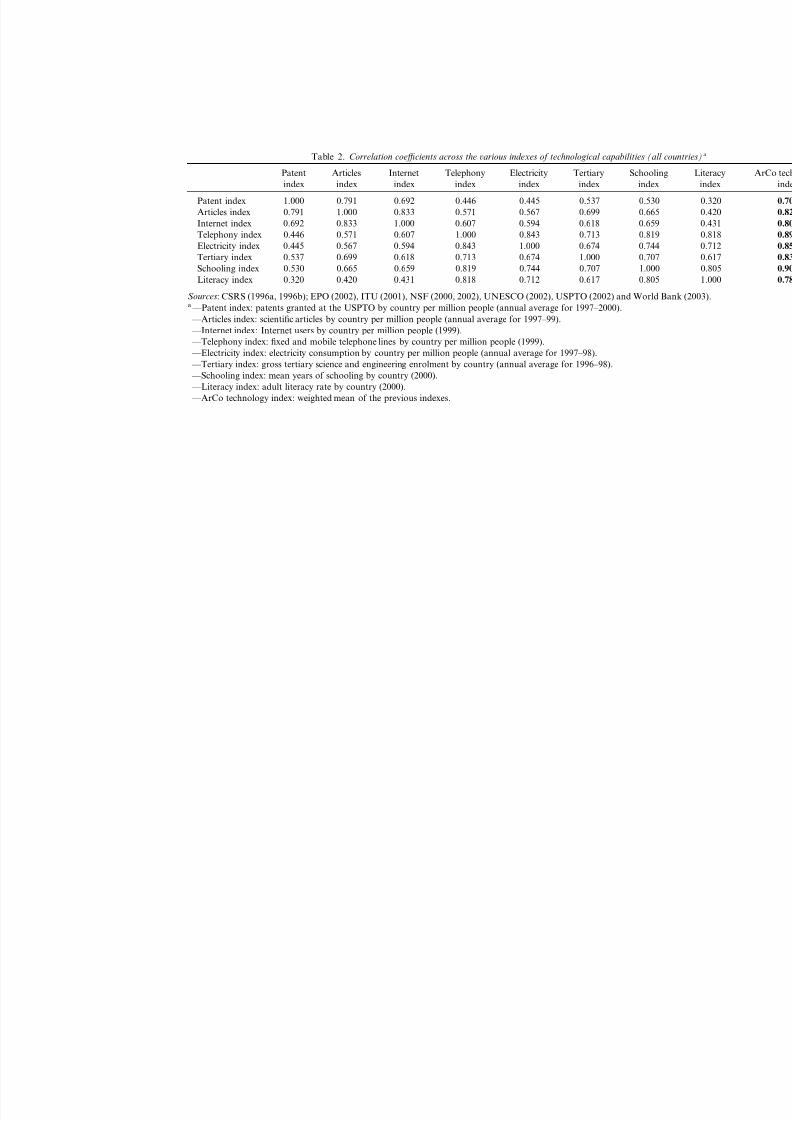
After having commented the results at thecountry level, we wish to report some simple
statistics about the indicators. In Table 2 wecalculated the correlation matrix across theeight indicators presented. As expected, allcorrelation coefficients are positive. The valuesare different, however, indicating that the var-ious indicators taken into account highlightdifferent aspects of technological capabilities.
As predictable, the correlation is greateracross indicators belonging to the same cate-gory of technology (creation, infrastructures orhuman skills), but with some exceptions. Forexample, the correlation between Internet users
and scientific publications is high. At the sametime the Internet is less correlated with thetraditional infrastructures (telephony and elec-tricity). The latter are more highly correlatedwith literacy rate and years of schooling. So itwould appear that more traditional forms of technology remain closer to each other: theindices of technology creation (patents, scien-tific articles) have little correlation with literacyrate, telephony and electricity.
It is also interesting to note the degree towhich each indicator is correlated with the final
ArCo Technology Index. Since the ArCoTechnology Index represents the mean of theeight components, it is natural to expect a highcorrelation between them. This is indeed thecase, although patents show the weakest cor-relation and schooling the strongest.
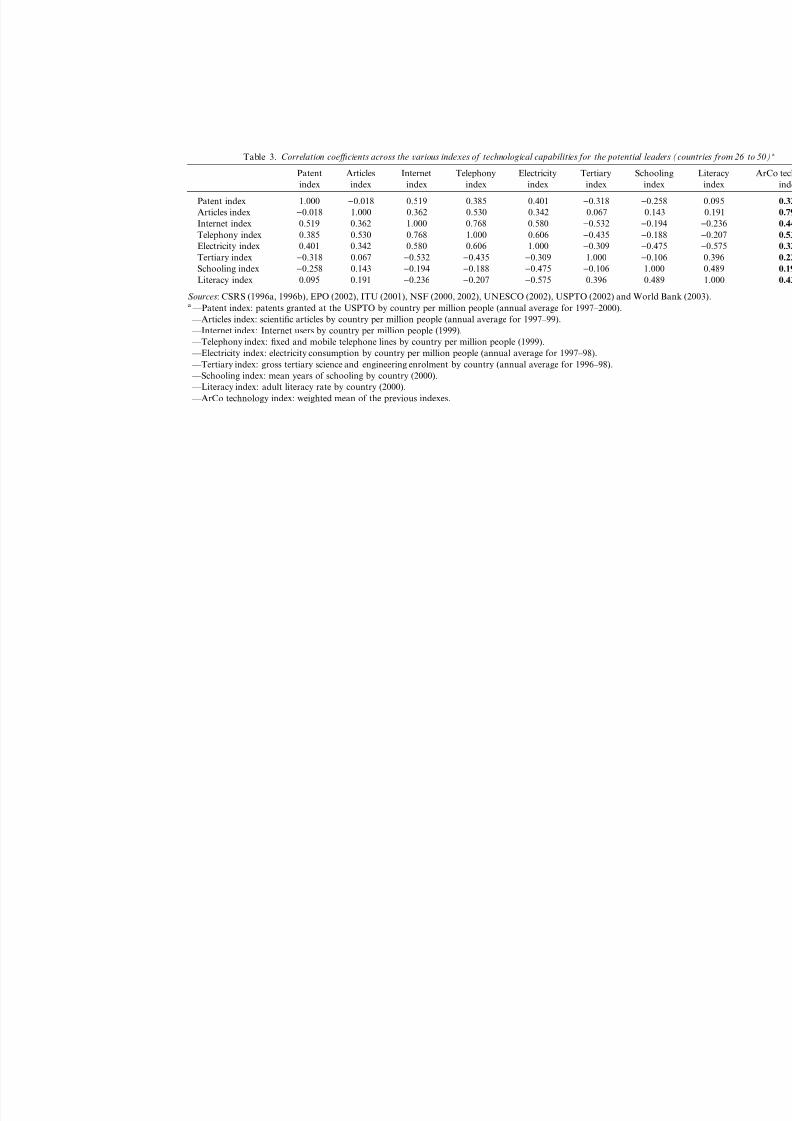
Different results emerge if we consider thecorrelation within each group. In particular,differences emerged within the group of poten-tial leaders (Table 3): composed mainly of EastEuropean countries, it shows a negative corre-lation (although very weak) between indicators
of human skills and those of technologicalinfrastructure. In this group of countries thereis no correlation between education perfor-mance on the one hand, and infrastructures andpatenting activity on the other. Moreover, thereis no connection between scientific articles andpatents, confirming that the sources of codifiedknowledge creation from the business sectorand the academic community are not neces-sarily complementary.
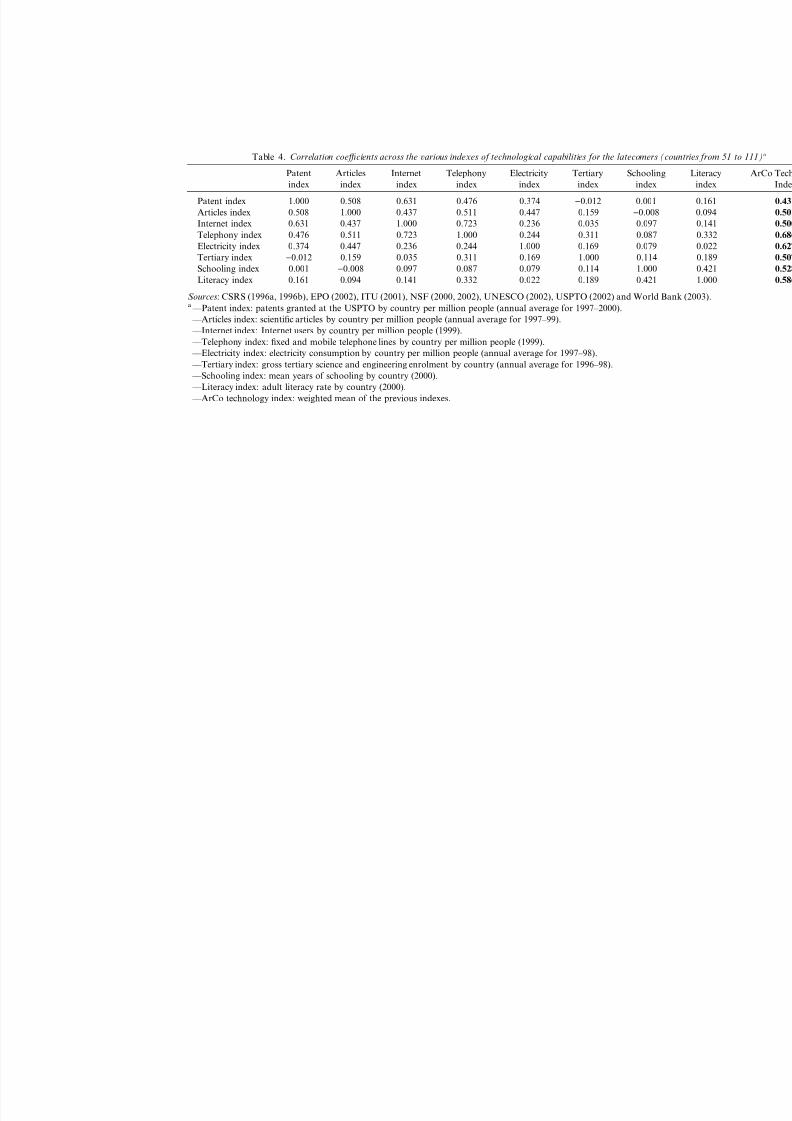
Table 4 reports the correlation matrix for thelatecomers, which signals a practical indepen-
dence between indicators of human skills andindicators of creation of technology. Theformer also exhibit little correlation with the
technological infrastructures, although a posi-tive correlation is found between indicators of creation and indicators of technology infra-structure. Correlation within the leaders groupor within the marginalized group was not
reported. While for the latter group data can-not be considered sufficiently reliable, countrieswithin the group of leaders have alreadyreached the maximum level for more than oneindicator. The linear correlation coefficientswould therefore prove less informative.
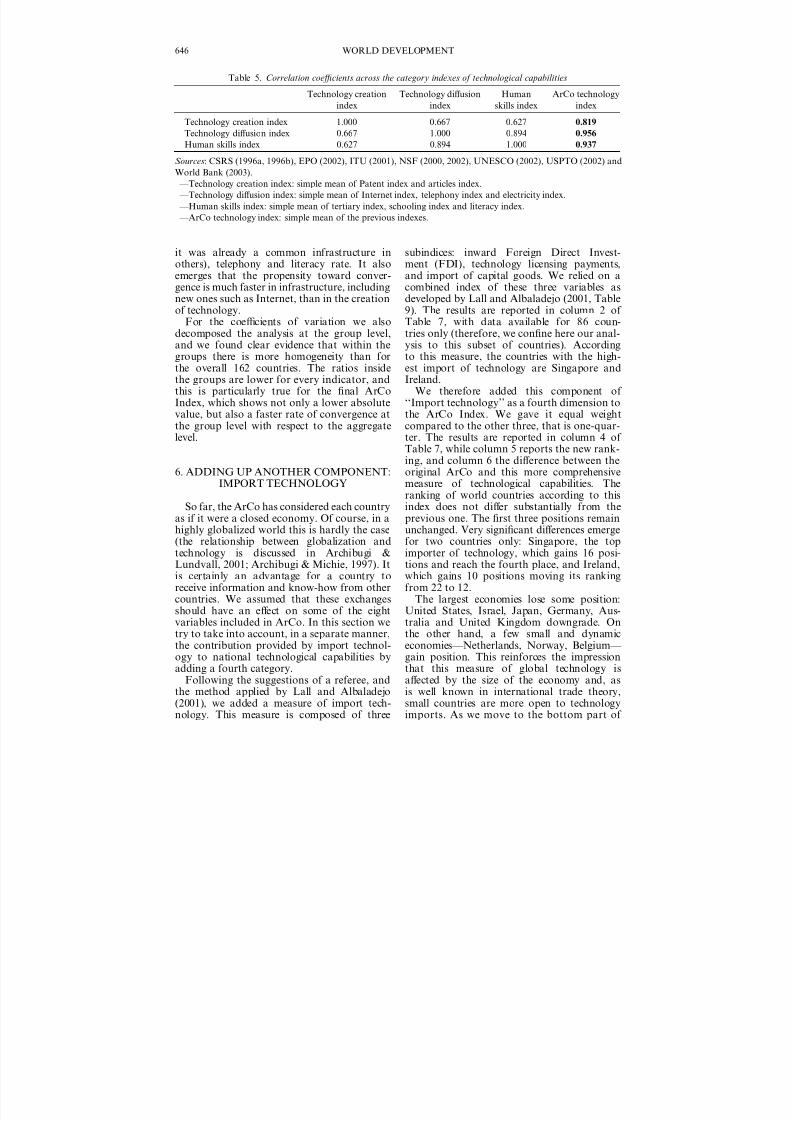
Table 5 reports the correlation matrix for thethree category indexes. The category of tech-nology creation is a little less correlated withthe other two as well as with the final ArCoindex. The intragroup analysis does not revealany new information, though it is interesting to
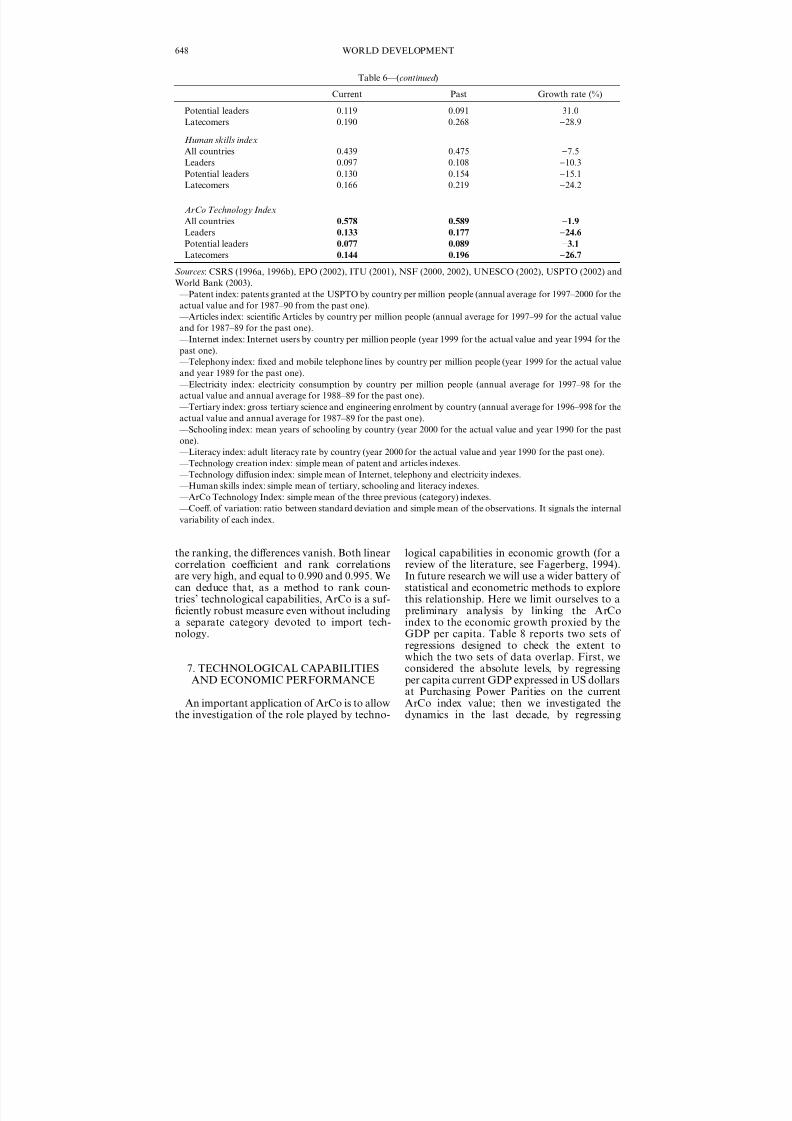
look at the indicators’ coefficients of variation(Table 6), which signal different levels of polarization of technological capabilities acrossthe 162 countries. As expected, the most sig-nificant dispersion occurs in the case of thegeneration of technology, which is very highlyconcentrated in a small cluster of countries. Inaddition, Internet users and, to a lesser extent,the scientific tertiary formation, are concen-trated in just a small number of countries.Concerning infrastructures, we note that theolder the technology is, the less its utilization is
polarized. Literacy is the least dispersed indi-cator.
Historians who have taken into account thegeographical location of inventions over 3,000years would not be surprised that the genera-tion of inventions and innovations is stronglyconcentrated in certain areas. They have in factshown that in the past inventive activity wasconcentrated in what now we would call‘‘hubs’’ such as the Greek cities, the ItalianRenaissance republics and Britain during theindustrial revolution (see Smithsonian Visual
Timeline of Inventions, 1994). Today some-thing similar is happening in Silicon Valley aswell as in the Balgalore district. What mightappear surprising to an historian is the geo-graphical diffusion of contemporary innovationcompared to its concentration in the past.
A comparison of the variation coefficientsacross the two periods allows also to testwhether the 162 countries are somehow con-verging or diverging in their technologicalcapabilities. All the indicators show a certainconvergence from the past (that is, a reduction
of the divergence signalled by the coefficients),especially with regard to Internet (many coun-tries in the past did not possess it at all, while
WORLD DEVELOPMENT642
7/27/2019 Art Co
http://slidepdf.com/reader/full/art-co 15/26
Table 2. Correlation coefficients across the various indexes of technological capabilities (all co
Patent
index
Articles
index
Internet
index
Telephony
index
Electricity
index
Tertiary
index
Schooling
index
Patent index 1.000 0.791 0.692 0.446 0.445 0.537 0.530
Articles index 0.791 1.000 0.833 0.571 0.567 0.699 0.665
Internet index 0.692 0.833 1.000 0.607 0.594 0.618 0.659
Telephony index 0.446 0.571 0.607 1.000 0.843 0.713 0.819
Electricity index 0.445 0.567 0.594 0.843 1.000 0.674 0.744
Tertiary index 0.537 0.699 0.618 0.713 0.674 1.000 0.707
Schooling index 0.530 0.665 0.659 0.819 0.744 0.707 1.000
Literacy index 0.320 0.420 0.431 0.818 0.712 0.617 0.805
Sources: CSRS (1996a, 1996b); EPO (2002), ITU (2001), NSF (2000, 2002), UNESCO (2002), USPTO (2002) and World Bana ––Patent index: patents granted at the USPTO by country per million people (annual average for 1997–2000).
––Articles index: scientific articles by country per million people (annual average for 1997–99).
––Internet index: Internet users by country per million people (1999).
––Telephony index: fixed and mobile telephone lines by country per million people (1999).
––Electricity index: electricity consumption by country per million people (annual average for 1997–98).
––Tertiary index: gross tertiary science and engineering enrolment by country (annual average for 1996–98).
––Schooling index: mean years of schooling by country (2000).
––Literacy index: adult literacy rate by country (2000).
––ArCo technology index: weighted mean of the previous indexes.
7/27/2019 Art Co
http://slidepdf.com/reader/full/art-co 16/26
Table 3. Correlation coefficients across the various indexes of technological capabilities for the potential leaders
Patent
index
Articles
index
Internet
index
Telephony
index
Electricity
index
Tertiary
index
Schooling
index
Patent index 1.000 )0.018 0.519 0.385 0.401 )0.318 )0.258
Articles index )0.018 1.000 0.362 0.530 0.342 0.067 0.143
Internet index 0.519 0.362 1.000 0.768 0.580 )0.532 )0.194
Telephony index 0.385 0.530 0.768 1.000 0.606 )0.435 )0.188
Electricity index 0.401 0.342 0.580 0.606 1.000 )0.309 )0.475
Tertiary index )0.318 0.067 )0.532 )0.435 )0.309 1.000 )0.106
Schooling index )0.258 0.143 )0.194 )0.188 )0.475 )0.106 1.000
Literacy index 0.095 0.191 )0.236 )0.207 )0.575 0.396 0.489
Sources: CSRS (1996a, 1996b), EPO (2002), ITU (2001), NSF (2000, 2002), UNESCO (2002), USPTO (2002) and World Bana ––Patent index: patents granted at the USPTO by country per million people (annual average for 1997–2000).
––Articles index: scientific articles by country per million people (annual average for 1997–99).
––Internet index: Internet users by country per million people (1999).
––Telephony index: fixed and mobile telephone lines by country per million people (1999).
––Electricity index: electricity consumption by country per million people (annual average for 1997–98).
––Tertiary index: gross tertiary science and engineering enrolment by country (annual average for 1996–98).
––Schooling index: mean years of schooling by country (2000).
––Literacy index: adult literacy rate by country (2000).
––ArCo technology index: weighted mean of the previous indexes.
7/27/2019 Art Co
http://slidepdf.com/reader/full/art-co 17/26
Table 4. Correlation coefficients across the various indexes of technological capabilities for the latecomers (co
Patent
index
Articles
index
Internet
index
Telephony
index
Electricity
index
Tertiary
index
Schooling
index
Patent index 1.000 0.508 0.631 0.476 0.374 )0.012 0.001
Articles index 0.508 1.000 0.437 0.511 0.447 0.159 )0.008
Internet index 0.631 0.437 1.000 0.723 0.236 0.035 0.097
Telephony index 0.476 0.511 0.723 1.000 0.244 0.311 0.087
Electricity index 0.374 0.447 0.236 0.244 1.000 0.169 0.079
Tertiary index )0.012 0.159 0.035 0.311 0.169 1.000 0.114
Schooling index 0.001 )0.008 0.097 0.087 0.079 0.114 1.000
Literacy index 0.161 0.094 0.141 0.332 0.022 0.189 0.421
Sources: CSRS (1996a, 1996b), EPO (2002), ITU (2001), NSF (2000, 2002), UNESCO (2002), USPTO (2002) and World Bana ––Patent index: patents granted at the USPTO by country per million people (annual average for 1997–2000).
––Articles index: scientific articles by country per million people (annual average for 1997–99).
––Internet index: Internet users by country per million people (1999).
––Telephony index: fixed and mobile telephone lines by country per million people (1999).
––Electricity index: electricity consumption by country per million people (annual average for 1997–98).
––Tertiary index: gross tertiary science and engineering enrolment by country (annual average for 1996–98).
––Schooling index: mean years of schooling by country (2000).
––Literacy index: adult literacy rate by country (2000).
––ArCo technology index: weighted mean of the previous indexes.
7/27/2019 Art Co
http://slidepdf.com/reader/full/art-co 18/26
it was already a common infrastructure inothers), telephony and literacy rate. It also
emerges that the propensity toward conver-gence is much faster in infrastructure, includingnew ones such as Internet, than in the creationof technology.
For the coefficients of variation we alsodecomposed the analysis at the group level,and we found clear evidence that within thegroups there is more homogeneity than forthe overall 162 countries. The ratios insidethe groups are lower for every indicator, andthis is particularly true for the final ArCoIndex, which shows not only a lower absolute
value, but also a faster rate of convergence atthe group level with respect to the aggregatelevel.
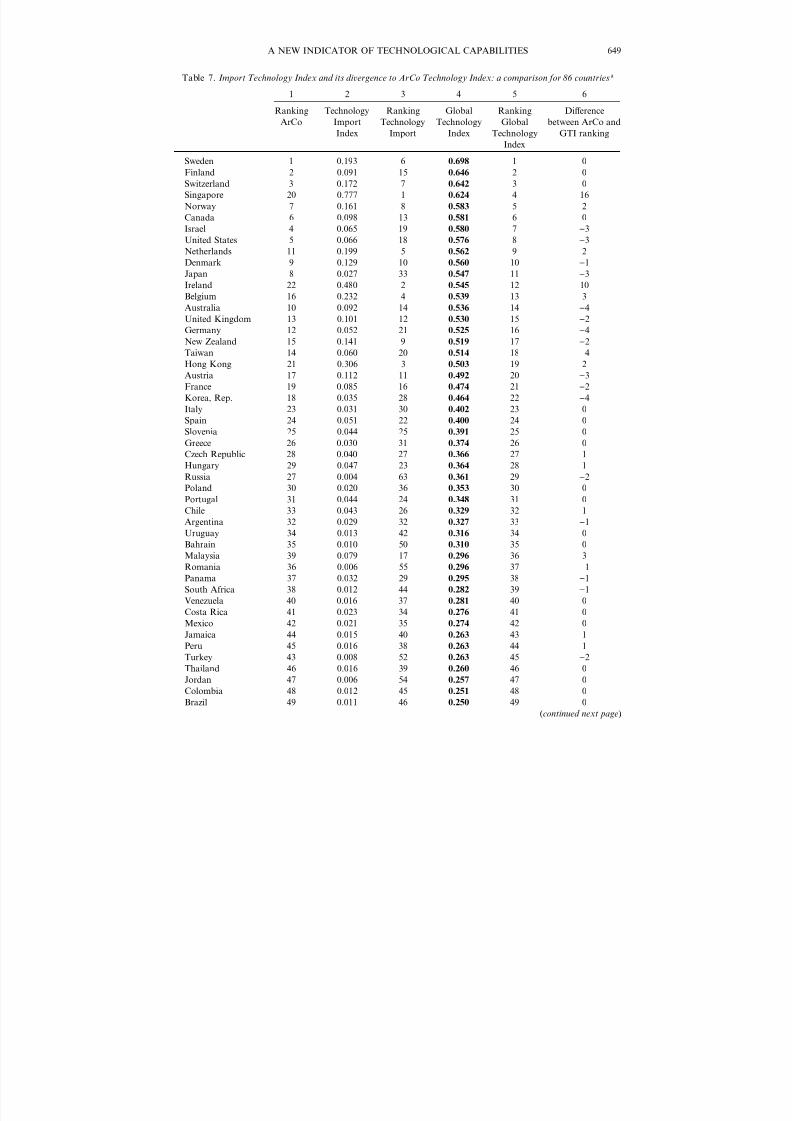
6. ADDING UP ANOTHER COMPONENT:IMPORT TECHNOLOGY
So far, the ArCo has considered each countryas if it were a closed economy. Of course, in ahighly globalized world this is hardly the case(the relationship between globalization and
technology is discussed in Archibugi &Lundvall, 2001; Archibugi & Michie, 1997). Itis certainly an advantage for a country toreceive information and know-how from othercountries. We assumed that these exchangesshould have an effect on some of the eightvariables included in ArCo. In this section wetry to take into account, in a separate manner,the contribution provided by import technol-ogy to national technological capabilities byadding a fourth category.
Following the suggestions of a referee, and
the method applied by Lall and Albaladejo(2001), we added a measure of import tech-nology. This measure is composed of three
subindices: inward Foreign Direct Invest-ment (FDI), technology licensing payments,
and import of capital goods. We relied on acombined index of these three variables asdeveloped by Lall and Albaladejo (2001, Table9). The results are reported in column 2 of Table 7, with data available for 86 coun-tries only (therefore, we confine here our anal-ysis to this subset of countries). Accordingto this measure, the countries with the high-est import of technology are Singapore andIreland.
We therefore added this component of ‘‘Import technology’’ as a fourth dimension to
the ArCo Index. We gave it equal weightcompared to the other three, that is one-quar-ter. The results are reported in column 4 of Table 7, while column 5 reports the new rank-ing, and column 6 the difference between theoriginal ArCo and this more comprehensivemeasure of technological capabilities. Theranking of world countries according to thisindex does not differ substantially from theprevious one. The first three positions remainunchanged. Very significant differences emergefor two countries only: Singapore, the top
importer of technology, which gains 16 posi-tions and reach the fourth place, and Ireland,which gains 10 positions moving its rankingfrom 22 to 12.
The largest economies lose some position:United States, Israel, Japan, Germany, Aus-tralia and United Kingdom downgrade. Onthe other hand, a few small and dynamiceconomies––Netherlands, Norway, Belgium–– gain position. This reinforces the impressionthat this measure of global technology isaffected by the size of the economy and, as
is well known in international trade theory,small countries are more open to technologyimports. As we move to the bottom part of
Table 5. Correlation coefficients across the category indexes of technological capabilities
Technology creation
index
Technology diffusion
index
Human
skills index
ArCo technology
index
Technology creation index 1.000 0.667 0.627 0.819
Technology diffusion index 0.667 1.000 0.894 0.956Human skills index 0.627 0.894 1.000 0.937
Sources: CSRS (1996a, 1996b), EPO (2002), ITU (2001), NSF (2000, 2002), UNESCO (2002), USPTO (2002) and
World Bank (2003).
––Technology creation index: simple mean of Patent index and articles index.
––Technology diffusion index: simple mean of Internet index, telephony index and electricity index.
––Human skills index: simple mean of tertiary index, schooling index and literacy index.
––ArCo technology index: simple mean of the previous indexes.
WORLD DEVELOPMENT646
7/27/2019 Art Co
http://slidepdf.com/reader/full/art-co 19/26
Table 6. Coefficients of variation of the various indexes of technological capabilities
Current Past Growth rate (%)
Patent index
All countries 2.787 3.087 )9.7
Leaders 0.705 0.935)
24.6Potential leaders 3.251 3.374 )3.6
Latecomers 1.822 2.684 )32.1
Articles index
All countries 1.999 2.172 )8.0
Leaders 0.420 0.626 )33.0
Potential leaders 0.654 0.672 )2.6
Latecomers 1.004 1.227 )18.2
Internet index
All countries 1.831 2.642 )30.7
Leaders 0.459 0.838 )45.3
Potential leaders 0.737 1.330)
44.6Latecomers 1.158 4.108 )71.8
Telephony index
All countries 0.435 0.550 )20.9
Leaders 0.010 0.039 )73.7
Potential leaders 0.082 0.100 )18.1
Latecomers 0.175 0.285 )38.6
Electricity index
All countries 0.497 0.536 )7.4
Leaders 0.039 0.071 )44.2
Potential leaders 0.109 0.109 )0.2
Latecomers 0.286 0.338 )15.5
Tertiary index
All countries 1.018 1.034 )1.5
Leaders 0.319 0.369 )13.4
Potential leaders 0.501 0.664 )24.6
Latecomers 0.665 0.765 )13.0
Schooling index
All countries 0.549 0.590 )7.0
Leaders 0.161 0.187 )14.2
Potential leaders 0.209 0.245 )14.5
Latecomers 0.288 0.327 )11.8
Literacy indexAll countries 0.279 0.352 )20.8
Leaders 0.018 0.029 )38.1
Potential leaders 0.062 0.079 )22.2
Latecomers 0.132 0.183 )27.8
Technology creation index
All countries 2.151 2.289 )6.0
Leaders 0.435 0.630 )31.0
Potential leaders 0.707 0.712 )0.8
Latecomers 1.006 1.249 )19.4
Technology diffusion index
All countries 0.561 0.586)
4.2Leaders 0.100 0.065 54.4
(continued next page)
A NEW INDICATOR OF TECHNOLOGICAL CAPABILITIES 647
7/27/2019 Art Co
http://slidepdf.com/reader/full/art-co 20/26
7/27/2019 Art Co
http://slidepdf.com/reader/full/art-co 21/26
Table 7. Import Technology Index and its divergence to ArCo Technology Index: a comparison for 86 countriesa
1 2 3 4 5 6
Ranking
ArCo
Technology
Import
Index
Ranking
Technology
Import
Global
Technology
Index
Ranking
Global
TechnologyIndex
Difference
between ArCo and
GTI ranking
Sweden 1 0.193 6 0.698 1 0
Finland 2 0.091 15 0.646 2 0
Switzerland 3 0.172 7 0.642 3 0
Singapore 20 0.777 1 0.624 4 16
Norway 7 0.161 8 0.583 5 2
Canada 6 0.098 13 0.581 6 0
Israel 4 0.065 19 0.580 7 )3
United States 5 0.066 18 0.576 8 )3
Netherlands 11 0.199 5 0.562 9 2
Denmark 9 0.129 10 0.560 10 )1
Japan 8 0.027 33 0.547 11)
3Ireland 22 0.480 2 0.545 12 10
Belgium 16 0.232 4 0.539 13 3
Australia 10 0.092 14 0.536 14 )4
United Kingdom 13 0.101 12 0.530 15 )2
Germany 12 0.052 21 0.525 16 )4
New Zealand 15 0.141 9 0.519 17 )2
Taiwan 14 0.060 20 0.514 18 )4
Hong Kong 21 0.306 3 0.503 19 2
Austria 17 0.112 11 0.492 20 )3
France 19 0.085 16 0.474 21 )2
Korea, Rep. 18 0.035 28 0.464 22 )4
Italy 23 0.031 30 0.402 23 0Spain 24 0.051 22 0.400 24 0
Slovenia 25 0.044 25 0.391 25 0
Greece 26 0.030 31 0.374 26 0
Czech Republic 28 0.040 27 0.366 27 1
Hungary 29 0.047 23 0.364 28 1
Russia 27 0.004 63 0.361 29 )2
Poland 30 0.020 36 0.353 30 0
Portugal 31 0.044 24 0.348 31 0
Chile 33 0.043 26 0.329 32 1
Argentina 32 0.029 32 0.327 33 )1
Uruguay 34 0.013 42 0.316 34 0
Bahrain 35 0.010 50 0.310 35 0
Malaysia 39 0.079 17 0.296 36 3
Romania 36 0.006 55 0.296 37 )1
Panama 37 0.032 29 0.295 38 )1
South Africa 38 0.012 44 0.282 39 )1
Venezuela 40 0.016 37 0.281 40 0
Costa Rica 41 0.023 34 0.276 41 0
Mexico 42 0.021 35 0.274 42 0
Jamaica 44 0.015 40 0.263 43 1
Peru 45 0.016 38 0.263 44 1
Turkey 43 0.008 52 0.263 45 )2
Thailand 46 0.016 39 0.260 46 0
Jordan 47 0.006 54 0.257 47 0
Colombia 48 0.012 45 0.251 48 0Brazil 49 0.011 46 0.250 49 0
(continued next page)
A NEW INDICATOR OF TECHNOLOGICAL CAPABILITIES 649
7/27/2019 Art Co
http://slidepdf.com/reader/full/art-co 22/26
7/27/2019 Art Co
http://slidepdf.com/reader/full/art-co 23/26
7/27/2019 Art Co
http://slidepdf.com/reader/full/art-co 24/26
number of countries we considered: on the onehand, we hope that electricity consumption canbe a good proxy for capital machinery andequipment; on the other hand, this allowed usto keep ArCo entirely independent from any
indicator expressed in monetary value. Finally,as regards human resources, an ideal indica-tor would have been the job qualifications,allowing us to capture learning-by-doing andlearning-by-using in the working process (Ar-chibugi & Lundvall, 2001). But, again, thesedata are available for a much more restrictednumber of countries and they are hardly com-parable.
We are aware of the limitations of each of theindicators employed, but we believe that theyprovide a faithful picture of the capabilities of
each country. Overall, the results achievedconfirm expectations. A great deal can be donein order to improve the quality of the data andto refine the index. We hope that this attemptwill be a further incentive to promote the pro-duction of statistics on science and technology,especially from those institutions, such asUNDP, UNCTAD, UNIDO, UNESCO, theWorld Bank and others, that pioneered andgenerated data in the field. In future research,we will test the similarities and differencesbetween the measure here presented and other
comparable technological indicators. Thedatabase will also allow mapping countriesaccording to their technological characteristics(besides their aggregate technological level),and this will hopefully help science and tech-nology policy analysis for development.
The creation of a database is a preliminarycondition to study the determinants and theimpact of technological change. We know that
technological capabilities are multifarious, andthat aggregate and macroeconomic measuresdo not provide a faithful account. But thisdatabase might help test a few hypotheses oftendiscussed in the literature.
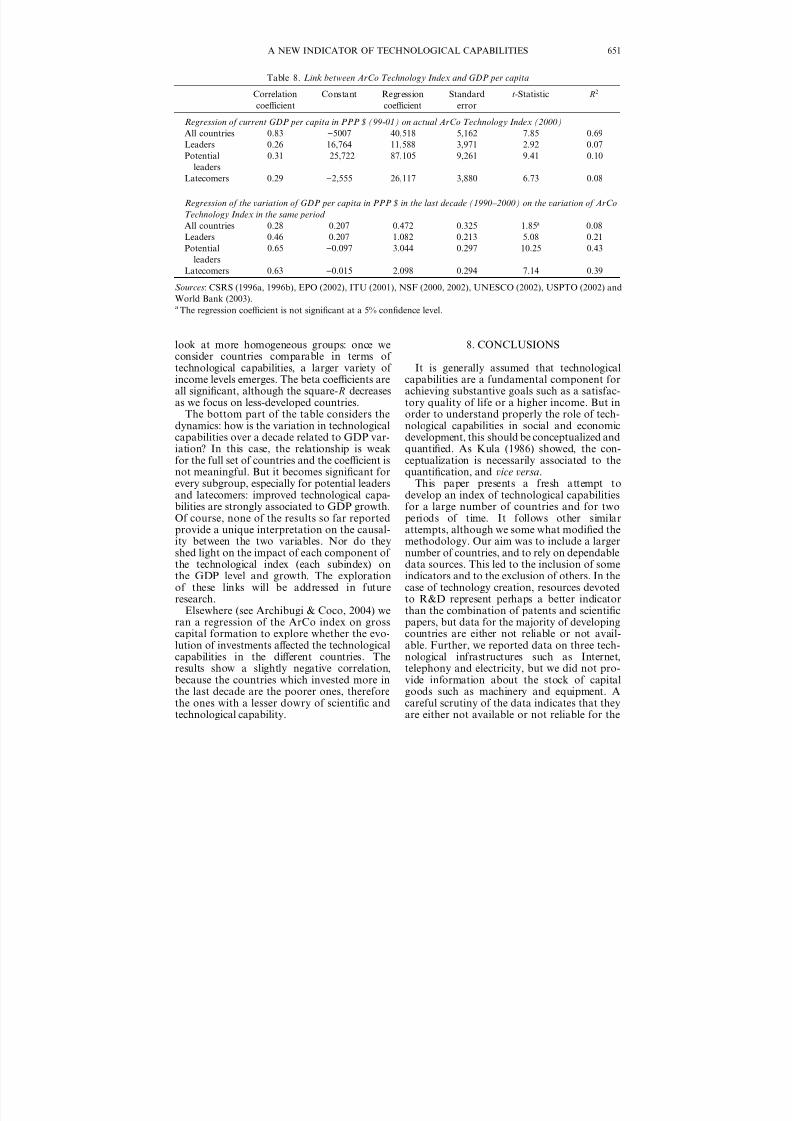
First, it might contribute to the vast literatureon how technological capabilities are associatedto economic growth. A large number of hypotheses discussed in the literature (see thereview by Fagerberg, 1994) can be tested, andours is but a preliminary attempt. It is widelydebated whether the technological capabilitiesare a determinant or an effect of economicgrowth. As with the chicken and the eggdilemma, it is difficult to determine with a singleanswer. We expect the various sources of tech-nological capability to have a different impact on
economic growth, and this will also depend onthe income level achieved by each country.Certainly the same component will have a dif-ferent impact across countries with such a largedifferences in income level.
Second, it might be possible to relate thisindicator to economic aspects such as produc-tion and employment. Again, there will be nooverlap between the ArCo Technology Indexand measures for these economic activities. Theindex could also allow relate international tradeto technological capabilities since no trade
indicators are included. This should be under-stood in two ways: the first is to explore howeconomic and social openness helps the devel-opment of technological capabilities, the secondis how technological capabilities can be seenas a determinant of international competitive-ness.
NOTES
1. In a companion paper (Archibugi & Coco, 2004), we
explore the similarities and differences between ArCo
and these measures. In order to carry out these compar-
isons, we had to restrict the number of countries in the
sample. While the overall ranking of countries is broadly
comparable, a few significant differences emerge. This is
associated to both the statistical method and indicators
used and to the slightly different purposes of the various
approaches.
2. In principle, this implies that the three categories canbe perfect substitutes: a reduction in the level of
technology creation, for example, independently from
the starting level, can be perfectly compensated by an
equal increase in the level of human skills. The
arithmetic mean does not take into account the dis-
persion of the three subindexes. If we wanted to consider
this aspect, we could use the geometric mean, which
assumes as much higher values as closer the three
subindexes are. Anyway we maintained the aggrega-
tion criteria of arithmetic mean used by other estab-
lished indicators (including the Human Development
Index), even because the geometric one results are too
sensitive to code values, often caused by an incomplete-ness of data for some indicator and for the poorest
countries.
WORLD DEVELOPMENT652
7/27/2019 Art Co
http://slidepdf.com/reader/full/art-co 25/26
3. See World Bank (2003). Data are reported in greater
detail in the World Bank web site. In this paper, we will
refer to the World Bank Report, although some of the
information used is reported in the web site only.
4. The former USSR is the combination of the formerrepublics. In 1986–88 we assigned articles to the ex-
Soviet Republics according to their shares of the 1995–
97 period; the same is true for Croatia, Slovenia, and
Macedonia inside the ex-Yugoslavia and for Czech
Republic and Slovakia inside the ex-Czechoslovakia.
German data are combined for all years.
5. The data were obtained by multiplying in each
country the proportion of the population over 14 who
completed the primary, secondary and tertiary education
by the duration of the respective education’s levels. Notall the countries could be analyzed due to a shortage of
data; we proceeded to estimate the data for Russia, by
using Unesco data and the data made available by
Russian Centre for Science Research and Statistics
(CSRS, 1996a, 1996b). In Russia, three years of primary
school, seven years of secondary school and from 6 to 9
years of higher education are contemplated. We used the
gross enrolment ratio to the secondary level (93%) as a
proxy of the proportion of the population who com-
pleted the primary school, and the enrolment to the
tertiary level (58%) as a proxy of the population who
completed the secondary school; finally we calculated
the average between the proportion of graduated over
the population and the proportion of enrolled atUniversity in the population (1.2%). With these data
we estimated the mean years of schooling for Russia
according to the following expression:
MS ¼ 3 Â 0:93þ 7 Â 0:58 þ 9 Â 0:012 ¼ 6:96:
In a similar manner, we estimated the other missing val-
ues, for some African, Asian and ex-USSR countries.
6. The classification of countries according to the
ArCo values is, of course, arbitrary. But since this is the
first presentation of our index, we show the rankingproduced by this measure. In future research, we plan to
take into account aggregations according to other
criteria (regions, high, medium and low income, high-
medium- and low-human development, etc.). We also
plan to relate the technological position of countries, as
measured by ArCo, with other measures of technological
activity (Archibugi & Coco, 2004) as well as with other
social and economic indicators.
REFERENCES
Abramovitz, M. (1989). Thinking about growth. Cam-bridge: Cambridge University Press.
Amable, B. & Petit, P. (2001). The diversity of socialsystems of innovation and production during the1990s. Paper Presented for the Second Conference of the Centre Saint-Gobain, Paris: La Defense.
Amsden, A. H., & Mourshed, M. (1997). Scientificpublications, patents and technological capabili-ties in late-industrializing countries. TechnologyAnalysis and Strategic Management, 9(3), 343– 359.
Andersen, E. S., Lundvall, B.-A., & Sorrn-Friese, H.
(Eds.). (2002). Innovation systems. Special Issue of Research Policy, 31(2), 185–302.Antonelli, C. (1999). The microdynamics of technological
change. London: Routledge.Archibugi, D. (1992). Patents as indicator of technolog-
ical innovation. Science and Public Policy, 17 , 357– 368.
Archibugi, D., & Coco, A. (2004). Measuring technolo- gical capabilities at the country level: a comparisonamong different approaches. Rome: Italian NationalResearch Council.
Archibugi, D.& Lundvall, B.-A. (Eds.). (2001). The globalising learning economy. Oxford: Oxford Uni-versity Press.
Archibugi, D.& Michie, M. (Eds.). (1997). Technology, globalization and economic performanace. Cam-bridge: Cambridge University Press.
Archibugi, D., & Pianta, M. (1992). The technologi-cal specialization of advanced countries. A reportto the EEC on international science and technol-ogy activities. Dordrecht: Kluwer Academic Publish-ers.
Barro, R., & Lee, J.-W. (2001). International data oneducational attainment: updates and implications.Oxford Economic Papers, 53(3), 541–563.
Bell, M., & Pavitt, K. (1997). Technological accumula-tion and industrial growth: contrasts between devel-oped and developing countries. In D. Archibugi &J. Michie (Eds.), Technology, globalisation and eco-
nomic performance (pp. 83–137). Cambridge: Cam-bridge University Press.Cantwell, J., & Iammarino, S. (2003). Multinational
enterprises and European regional systems of innova-tion. London: Routledge.
Cassiolato, J. E.& Lastres, H. (Eds.). (1999). Global-izac
z~ao & innovac
z~ao localizada. Experi encias de sist-
emas locais no mercosul . Brasilia: IBICT.CSRS (Centre for Science Research and Statis-
tics) (1996). Higher education in Russia. Moscow:CSRS.
CSRS (Centre for Science Research and Statistics)(1996). Science and technology indicators in the CIS .Moscow: CSRS.
Desai, M., Fukuda-Parr, S., Johansson, C., & Sagasti, F.(2001). How well Are people participating in thebenefits of technological progress? Technological
A NEW INDICATOR OF TECHNOLOGICAL CAPABILITIES 653
7/27/2019 Art Co
http://slidepdf.com/reader/full/art-co 26/26