Embed Size (px)
DESCRIPTION
jurnal ilmiah
Citation preview
Rodrigues et al. International Journal of Retina and Vitreous (2015) 1:4 DOI 10.1186/s40942-015-0001-z
ORIGINAL ARTICLE Open Access
Diabetes induces changes in neuroretina beforeretinal vessels: a spectral-domain opticalcoherence tomography studyEduardo Büchele Rodrigues*, Müller Gonçalves Urias, Fernando Marcondes Penha, Emmerson Badaró,Eduardo Novais, Rodrigo Meirelles and Michel Eid Farah
Abstract
Purpose: To investigate retinal changes prior to vascular signs in patients with type 2 diabetes without diabeticretinopathy or with mild non proliferative diabetic retinopathy.
Methods: A cross-sectional study was performed in three groups: patients without diabetes, patients with type 2diabetes without diabetic retinopathy, and patients with diabetes with mild diabetic retinopathy. Analysis of retinallayers was performed objectively with the Cirrus Review Software 6.0 (Carl Zeiss Meditec, Dublin, CA, USA). Macularcube scans were analyzed with regard to: the ganglion cell layer + inner plexiform layer analysis, retinal nerve fiberlayer thickness, central subfoveal retinal thickness and average macular thickness.
Results: In total, 102 patients were included in this study, of which 28 (27.4%) were classified into control group,46 (45.0%) classified as diabetic patients with no diabetic retinopathy and 28 (27.4%) classified as mild diabeticretinopathy. Quantitative analysis with the Cirrus software showed that the mean ganglion cell layer and meanretinal nerve fiber layer were thinner in diabetes without diabetic retinopathy group when compared to controls.ANOVA with Bonferroni post test indicated a statistically significant reduction in average retinal thickness in milddiabetic retinopathy group (P = 0.032) compared to control and reduction in ganglion cell layer in diabetes withno diabetic retinopathy (P = 0.039) and mild diabetic retinopathy (P = 0.003). Also indicated reduction in retinalnerve fiber layer in diabetic without diabetic retinopathy and eyes with mild diabetic retinopathy (P < 0.001),compared to controls.
Conclusions: Our study found reduction in thickness of ganglion cell layer and retinal nerve fiber layer in patientswith diabetes without diabetic retinopathy, which suggests neuroretinal changes before vascular signs of diabeticretinopathy.
Keywords: Diabetes mellitus, Diabetic retinopathy, OCT, Optical coherence tomography, Macula, Retina, Neuronal,Neurodegeneration
BackgroundDiabetic retinopathy (DR) is considered one of the maincauses of blindness in patients between 30 and 60 years oldin the Western world. Despite recent progress, currenttreatment with pharmacologic and laser treatment may notbe enough in some patients to prevent blindness. DR hasbeen considered mostly a vascular disease, but recent inves-tigations have demonstrated degenerative and neuronal
* Correspondence: [email protected] of Ophthalmology, Federal University of São Paulo, R. Botucatu820, 04023-062, SP São Paulo, Brazil
© 2015 Rodrigues et al.; licensee BioMed CentCommons Attribution License (http://creativecreproduction in any medium, provided the orDedication waiver (http://creativecommons.orunless otherwise stated.
alterations before the appearance of microvascular changesin patients with diabetes mellitus (DM) [1,2]. Animal andhuman studies support the presence of neuronal alterationsincluding apoptosis in early stages of diabetes [3-6].Optical coherence tomography (OCT) enables deep
comprehension of a variety of eye diseases [7,8]. Newergeneration spectral domain OCT allows detailed examin-ation of retinal cells and vessels, thereby facilitating thestudy of disease pathogenesis. Clinically, different authorshave reported decrease in total central retinal or singlecellular layer thickness in diabetic eyes with or without
ral. This is an Open Access article distributed under the terms of the Creativeommons.org/licenses/by/4.0), which permits unrestricted use, distribution, andiginal work is properly credited. The Creative Commons Public Domaing/publicdomain/zero/1.0/) applies to the data made available in this article,
Rodrigues et al. International Journal of Retina and Vitreous (2015) 1:4 Page 2 of 8
clinical signs of DR compared to control groups (subjectswith no DM) [1,2]. Others have shown reduction in theinner retinal thickness in the macula in diabetics with mildDR, which may represent initial ganglion cell loss in thepericentral areas followed by retinal nerve fiber layer (RNFL)thinning in the peripheral macula [5,6,9].The goal of this study was to investigate retinal changes
prior to vascular signs in patients with type 2 diabeteswithout diabetic retinopathy or with mild non proliferativediabetic retinopathy.
MethodsA cross-sectional study was performed with enrollment ofthree groups: (A) control patients without diabetes; (B) pa-tients with type 2 diabetes with no clinical or angiographic-ally diagnosed DR, and (C) patients with type 2 diabetesmellitus with mild DR. Patients were examined in the De-partment of Ophthalmology at the Federal University of SãoPaulo after IRB approval, and signed informed consent tocomply with voluntary participation in this research project.The institution “Comitê de Ética da Universidade Federal deSão Paulo” approved this research project. Experiments wereconducted according to Declaration of Helsinki.Control subjects did not have a diagnosis of diabetes, any
ocular disease, or any other systemic disease. These subjectswere randomly recruited from individuals accompanying pa-tients visiting the Department of Ophthalmology.The inclusion criteria was individuals with type 2 DM and
above the age of 40 years. The choice of type 2 diabetes wasdue to its prevalence and importance of future projection.Mild DR was considered as the presence of at least onemicroaneurysm in the retina, but no other diabetic lesions -according to the classification of the international clinicaldiabetic retinopathy disease severity scale [9]. Patients wereexcluded from the study if they presented with a best cor-rected visual acuity less than 20/25, when OCT imageswere of inadequate quality (sinal strength below 7), if DRequal or worse than moderate, lens opacity and other visionimpairing diseases such as glaucoma, cataract, uveitis, ormacular degeneration.All patients underwent clinical examination with review
of medical history. The following variables were collected:
Table 1 Demographics of the subjects in different groups
Patient demographics
Parameter Controls(N = 28)
DM(N =
Age, years* 54 ± 10 59 ±
Gender, male:female 14:14 17:2
Glycemia, mg/dL* 92.50 ± 9.19 167
HbA1c, % - 7.55
Duration of DM, years - 12 ±
The values are mean SD for all subjects in each group. “-”: not done. *Statistically si
time of diabetes, last glucose, last glycosylated hemoglobin(HbA1c), systemic hypertension (yes or no), nephropathy(yes or no), best corrected visual acuity. Patients were evalu-ated with respect to best corrected visual acuity using theSnellen chart. The patients had pupil dilation by tropicamideand evaluation through digital color fundus photography,fluorescein angiography (FA) and spectral-domain opticalcoherence tomography (SD-OCT) (Cirrus ™ HD-OCT 4000,Carl Zeiss Meditec, Dublin, CA, USA). FA and SD-OCTwere performed in the mornings.FA examination was used as a screening to verify angiog-
raphy criteria and was performed by a different examinerfrom the OCT images. Retina specialists who analyzed OCTimages neither took part in the screening, nor they wereaware details about individuals of the screening.Only SD-OCT analysis of right eye was performed,
centered on the fovea and repeated three times by theexaminer. Only scans with signal strengths ≥7 and withoutartifact were included in the study. The acquisition proto-cols were as follows: macular cube 200 × 200; HD 5 lineraster/5 raster line; and HD one line. The raw OCT data-sets were exported to a personal computer for analysis.Analysis of retinal layers of the right eye was performed
using specific software, Cirrus HD-OCT Review Software6.0 (Carl Zeiss Meditec, Dublin, CA, USA). The software,patented by Carl Zeiss Meditec, measured the various ret-inal layers in order to produce data for further analysis.Two types of measurements were performed: automatedand subjective (by software caliper).Macular cube scan generated the following automated
data: ganglion cell layer + inner plexiform layer (GCL +IPL) thickness, RNFL thickness, central subfoveal retinalthickness (CS), and average retinal thickness (RT). Aver-age thicknesses of eight areas were examined for eachscan, determined by ETDRS grid: nasal, superior, tem-poral, inferior, nasal superior, nasal inferior, temporal su-perior and temporal inferior.Line scans were performed in order to proceed the sub-
jective analysis, only. Line scans used were centered onfovea, with a 0° angle. The subjective analysis was performedby two independent retina specialists, who have not takenpart in the screening. They used Cirrus HD-OCT Review
with no DR46)
Mild DR(N = 28)
p
10 62 ± 11 0.01
9 11:17 0.53
.33 ± 134.44 148.81 ± 70.72 0.01
± 1.57 7.16 ± 1.22 0.10
7 12 ± 9 0.98
gnificant difference between mild DR and controls (P <0.05).
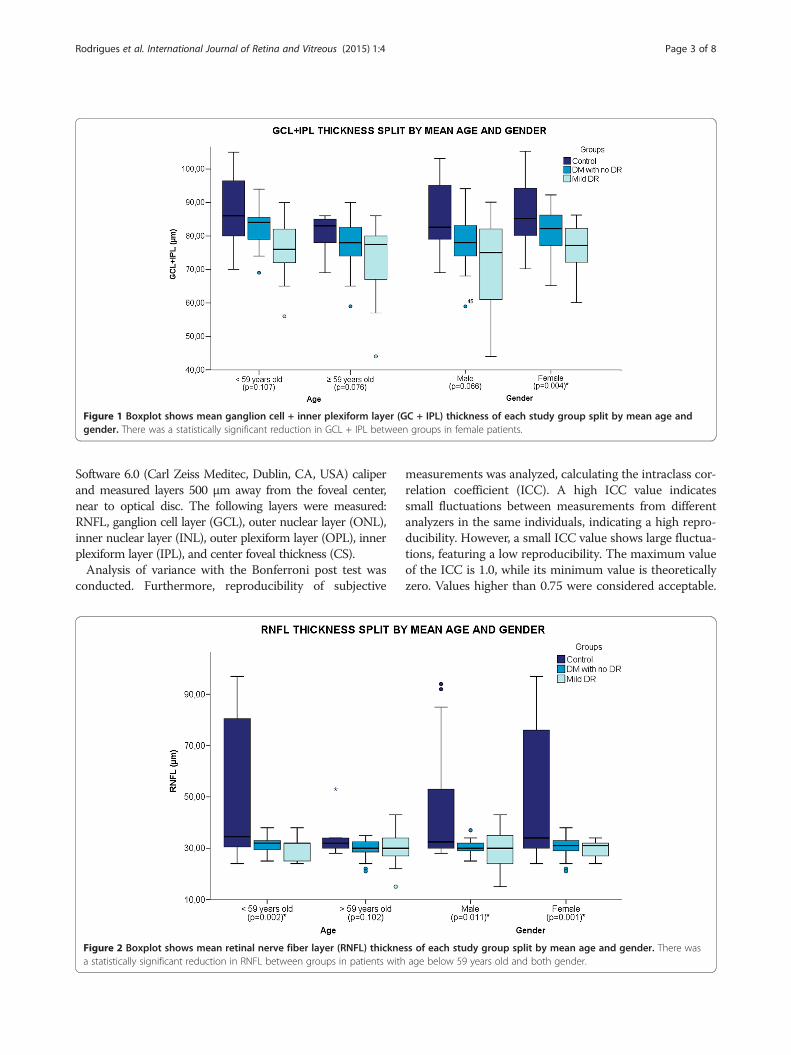
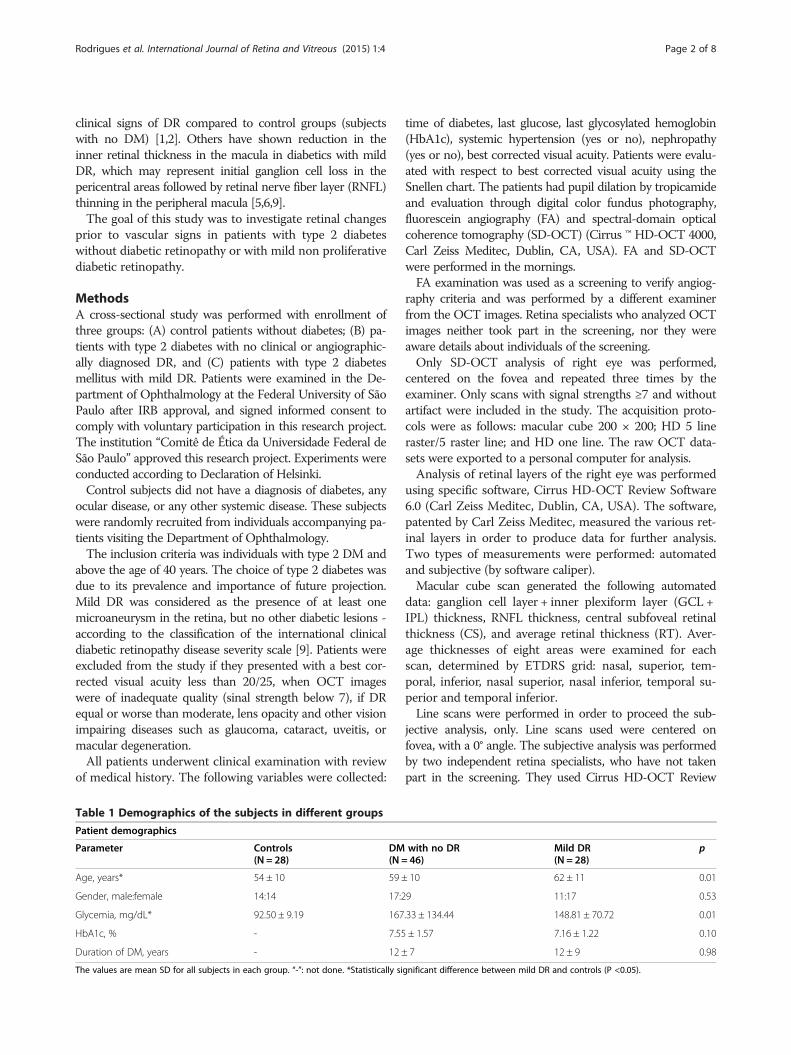
Figure 1 Boxplot shows mean ganglion cell + inner plexiform layer (GC + IPL) thickness of each study group split by mean age andgender. There was a statistically significant reduction in GCL + IPL between groups in female patients.
Rodrigues et al. International Journal of Retina and Vitreous (2015) 1:4 Page 3 of 8
Software 6.0 (Carl Zeiss Meditec, Dublin, CA, USA) caliperand measured layers 500 μm away from the foveal center,near to optical disc. The following layers were measured:RNFL, ganglion cell layer (GCL), outer nuclear layer (ONL),inner nuclear layer (INL), outer plexiform layer (OPL), innerplexiform layer (IPL), and center foveal thickness (CS).Analysis of variance with the Bonferroni post test was
conducted. Furthermore, reproducibility of subjective
Figure 2 Boxplot shows mean retinal nerve fiber layer (RNFL) thicknea statistically significant reduction in RNFL between groups in patients with
measurements was analyzed, calculating the intraclass cor-relation coefficient (ICC). A high ICC value indicatessmall fluctuations between measurements from differentanalyzers in the same individuals, indicating a high repro-ducibility. However, a small ICC value shows large fluctua-tions, featuring a low reproducibility. The maximum valueof the ICC is 1.0, while its minimum value is theoreticallyzero. Values higher than 0.75 were considered acceptable.
ss of each study group split by mean age and gender. There wasage below 59 years old and both gender.
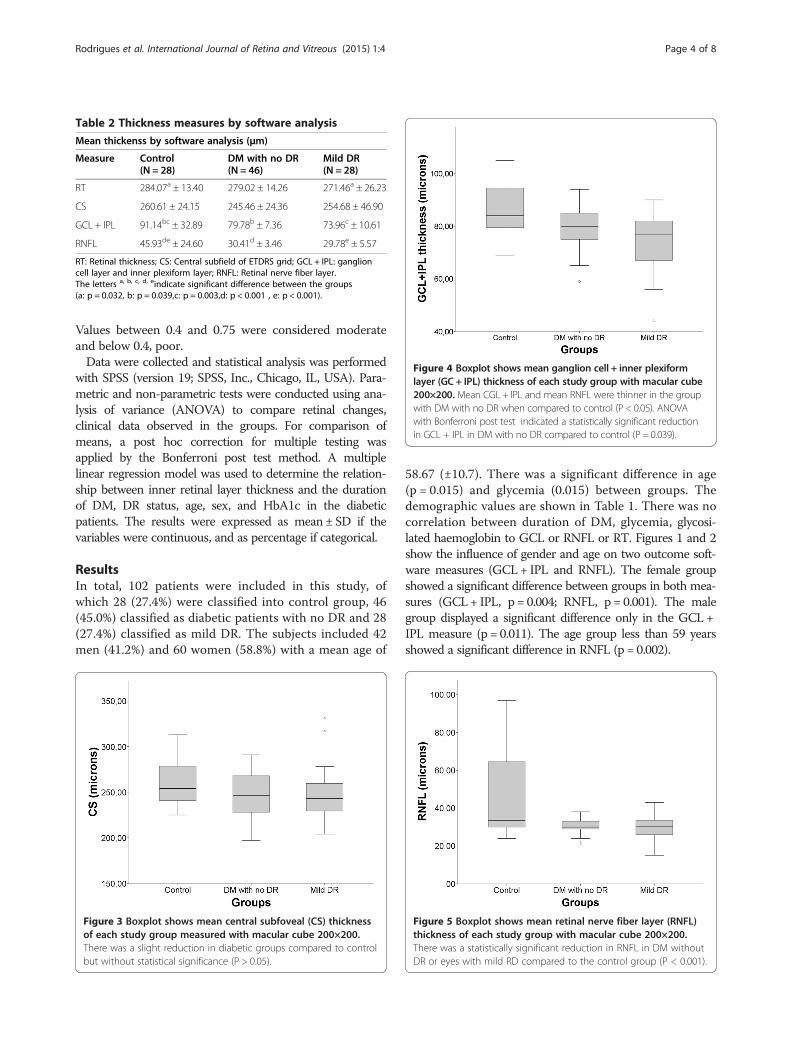
Table 2 Thickness measures by software analysis
Mean thickenss by software analysis (μm)
Measure Control(N = 28)
DM with no DR(N = 46)
Mild DR(N = 28)
RT 284.07a ± 13.40 279.02 ± 14.26 271.46a ± 26.23
CS 260.61 ± 24.15 245.46 ± 24.36 254.68 ± 46.90
GCL + IPL 91.14bc ± 32.89 79.78b ± 7.36 73.96c ± 10.61
RNFL 45.93de ± 24.60 30.41d ± 3.46 29.78e ± 5.57
RT: Retinal thickness; CS: Central subfield of ETDRS grid; GCL + IPL: ganglioncell layer and inner plexiform layer; RNFL: Retinal nerve fiber layer.The letters a, b, c, d, eindicate significant difference between the groups(a: p = 0.032, b: p = 0.039,c: p = 0.003,d: p < 0.001 , e: p < 0.001).
Figure 4 Boxplot shows mean ganglion cell + inner plexiformlayer (GC + IPL) thickness of each study group with macular cube200×200. Mean CGL+ IPL and mean RNFL were thinner in the groupwith DM with no DR when compared to control (P < 0.05). ANOVAwith Bonferroni post test indicated a statistically significant reductionin GCL + IPL in DM with no DR compared to control (P = 0.039).
Rodrigues et al. International Journal of Retina and Vitreous (2015) 1:4 Page 4 of 8
Values between 0.4 and 0.75 were considered moderateand below 0.4, poor.Data were collected and statistical analysis was performed
with SPSS (version 19; SPSS, Inc., Chicago, IL, USA). Para-metric and non-parametric tests were conducted using ana-lysis of variance (ANOVA) to compare retinal changes,clinical data observed in the groups. For comparison ofmeans, a post hoc correction for multiple testing wasapplied by the Bonferroni post test method. A multiplelinear regression model was used to determine the relation-ship between inner retinal layer thickness and the durationof DM, DR status, age, sex, and HbA1c in the diabeticpatients. The results were expressed as mean ± SD if thevariables were continuous, and as percentage if categorical.
ResultsIn total, 102 patients were included in this study, ofwhich 28 (27.4%) were classified into control group, 46(45.0%) classified as diabetic patients with no DR and 28(27.4%) classified as mild DR. The subjects included 42men (41.2%) and 60 women (58.8%) with a mean age of
Figure 3 Boxplot shows mean central subfoveal (CS) thicknessof each study group measured with macular cube 200×200.There was a slight reduction in diabetic groups compared to controlbut without statistical significance (P > 0.05).
58.67 (±10.7). There was a significant difference in age(p = 0.015) and glycemia (0.015) between groups. Thedemographic values are shown in Table 1. There was nocorrelation between duration of DM, glycemia, glycosi-lated haemoglobin to GCL or RNFL or RT. Figures 1 and 2show the influence of gender and age on two outcome soft-ware measures (GCL+ IPL and RNFL). The female groupshowed a significant difference between groups in both mea-sures (GCL+ IPL, p = 0.004; RNFL, p = 0.001). The malegroup displayed a significant difference only in the GCL +IPL measure (p = 0.011). The age group less than 59 yearsshowed a significant difference in RNFL (p = 0.002).
Figure 5 Boxplot shows mean retinal nerve fiber layer (RNFL)thickness of each study group with macular cube 200×200.There was a statistically significant reduction in RNFL in DM withoutDR or eyes with mild RD compared to the control group (P < 0.001).
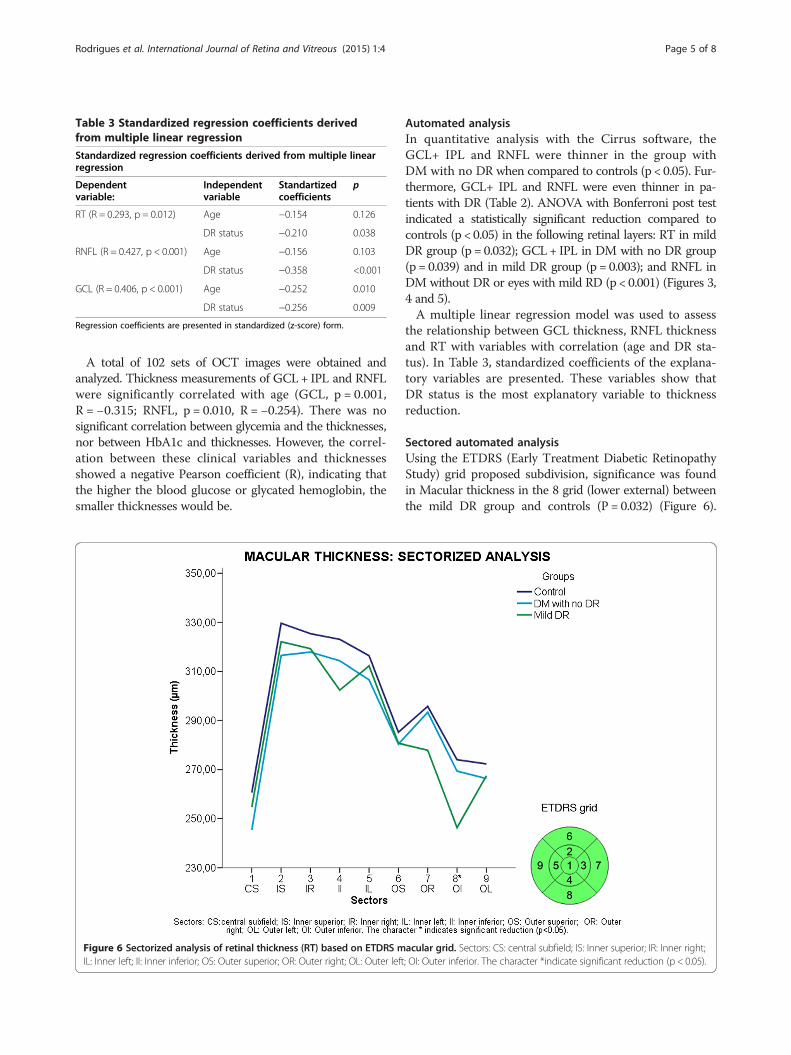
Table 3 Standardized regression coefficients derivedfrom multiple linear regression
Standardized regression coefficients derived from multiple linearregression
Dependentvariable:
Independentvariable
Standartizedcoefficients
p
RT (R = 0.293, p = 0.012) Age −0.154 0.126
DR status −0.210 0.038
RNFL (R = 0.427, p < 0.001) Age −0.156 0.103
DR status −0.358 <0.001
GCL (R = 0.406, p < 0.001) Age −0.252 0.010
DR status −0.256 0.009
Regression coefficients are presented in standardized (z-score) form.
Rodrigues et al. International Journal of Retina and Vitreous (2015) 1:4 Page 5 of 8
A total of 102 sets of OCT images were obtained andanalyzed. Thickness measurements of GCL+ IPL and RNFLwere significantly correlated with age (GCL, p = 0.001,R = −0.315; RNFL, p = 0.010, R = −0.254). There was nosignificant correlation between glycemia and the thicknesses,nor between HbA1c and thicknesses. However, the correl-ation between these clinical variables and thicknessesshowed a negative Pearson coefficient (R), indicating thatthe higher the blood glucose or glycated hemoglobin, thesmaller thicknesses would be.
Figure 6 Sectorized analysis of retinal thickness (RT) based on ETDRS mIL: Inner left; II: Inner inferior; OS: Outer superior; OR: Outer right; OL: Outer left
Automated analysisIn quantitative analysis with the Cirrus software, theGCL+ IPL and RNFL were thinner in the group withDM with no DR when compared to controls (p < 0.05). Fur-thermore, GCL+ IPL and RNFL were even thinner in pa-tients with DR (Table 2). ANOVA with Bonferroni post testindicated a statistically significant reduction compared tocontrols (p < 0.05) in the following retinal layers: RT in mildDR group (p = 0.032); GCL+ IPL in DM with no DR group(p = 0.039) and in mild DR group (p = 0.003); and RNFL inDM without DR or eyes with mild RD (p < 0.001) (Figures 3,4 and 5).A multiple linear regression model was used to assess
the relationship between GCL thickness, RNFL thicknessand RT with variables with correlation (age and DR sta-tus). In Table 3, standardized coefficients of the explana-tory variables are presented. These variables show thatDR status is the most explanatory variable to thicknessreduction.
Sectored automated analysisUsing the ETDRS (Early Treatment Diabetic RetinopathyStudy) grid proposed subdivision, significance was foundin Macular thickness in the 8 grid (lower external) betweenthe mild DR group and controls (P = 0.032) (Figure 6).
acular grid. Sectors: CS: central subfield; IS: Inner superior; IR: Inner right;; OI: Outer inferior. The character *indicate significant reduction (p < 0.05).
Rodrigues et al. International Journal of Retina and Vitreous (2015) 1:4 Page 6 of 8
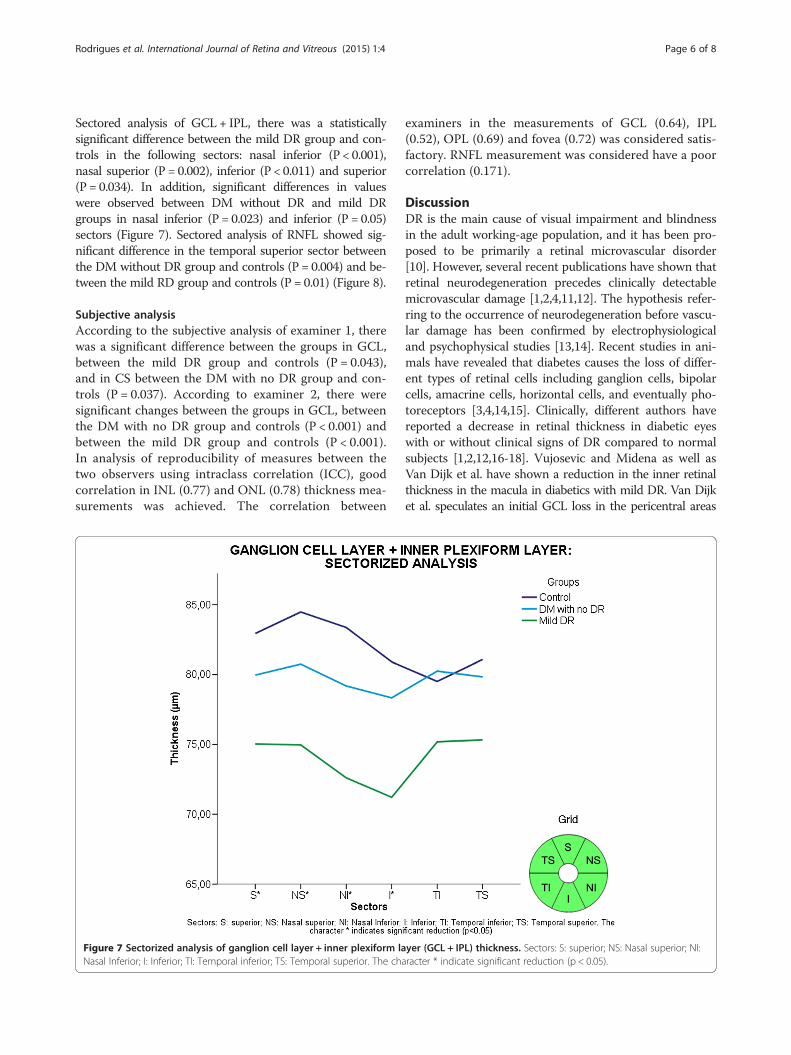
Sectored analysis of GCL + IPL, there was a statisticallysignificant difference between the mild DR group and con-trols in the following sectors: nasal inferior (P < 0.001),nasal superior (P = 0.002), inferior (P < 0.011) and superior(P = 0.034). In addition, significant differences in valueswere observed between DM without DR and mild DRgroups in nasal inferior (P = 0.023) and inferior (P = 0.05)sectors (Figure 7). Sectored analysis of RNFL showed sig-nificant difference in the temporal superior sector betweenthe DM without DR group and controls (P = 0.004) and be-tween the mild RD group and controls (P = 0.01) (Figure 8).
Subjective analysisAccording to the subjective analysis of examiner 1, therewas a significant difference between the groups in GCL,between the mild DR group and controls (P = 0.043),and in CS between the DM with no DR group and con-trols (P = 0.037). According to examiner 2, there weresignificant changes between the groups in GCL, betweenthe DM with no DR group and controls (P < 0.001) andbetween the mild DR group and controls (P < 0.001).In analysis of reproducibility of measures between thetwo observers using intraclass correlation (ICC), goodcorrelation in INL (0.77) and ONL (0.78) thickness mea-surements was achieved. The correlation between
Figure 7 Sectorized analysis of ganglion cell layer + inner plexiform laNasal Inferior; I: Inferior; TI: Temporal inferior; TS: Temporal superior. The cha
examiners in the measurements of GCL (0.64), IPL(0.52), OPL (0.69) and fovea (0.72) was considered satis-factory. RNFL measurement was considered have a poorcorrelation (0.171).
DiscussionDR is the main cause of visual impairment and blindnessin the adult working-age population, and it has been pro-posed to be primarily a retinal microvascular disorder[10]. However, several recent publications have shown thatretinal neurodegeneration precedes clinically detectablemicrovascular damage [1,2,4,11,12]. The hypothesis refer-ring to the occurrence of neurodegeneration before vascu-lar damage has been confirmed by electrophysiologicaland psychophysical studies [13,14]. Recent studies in ani-mals have revealed that diabetes causes the loss of differ-ent types of retinal cells including ganglion cells, bipolarcells, amacrine cells, horizontal cells, and eventually pho-toreceptors [3,4,14,15]. Clinically, different authors havereported a decrease in retinal thickness in diabetic eyeswith or without clinical signs of DR compared to normalsubjects [1,2,12,16-18]. Vujosevic and Midena as well asVan Dijk et al. have shown a reduction in the inner retinalthickness in the macula in diabetics with mild DR. Van Dijket al. speculates an initial GCL loss in the pericentral areas
yer (GCL + IPL) thickness. Sectors: S: superior; NS: Nasal superior; NI:racter * indicate significant reduction (p < 0.05).
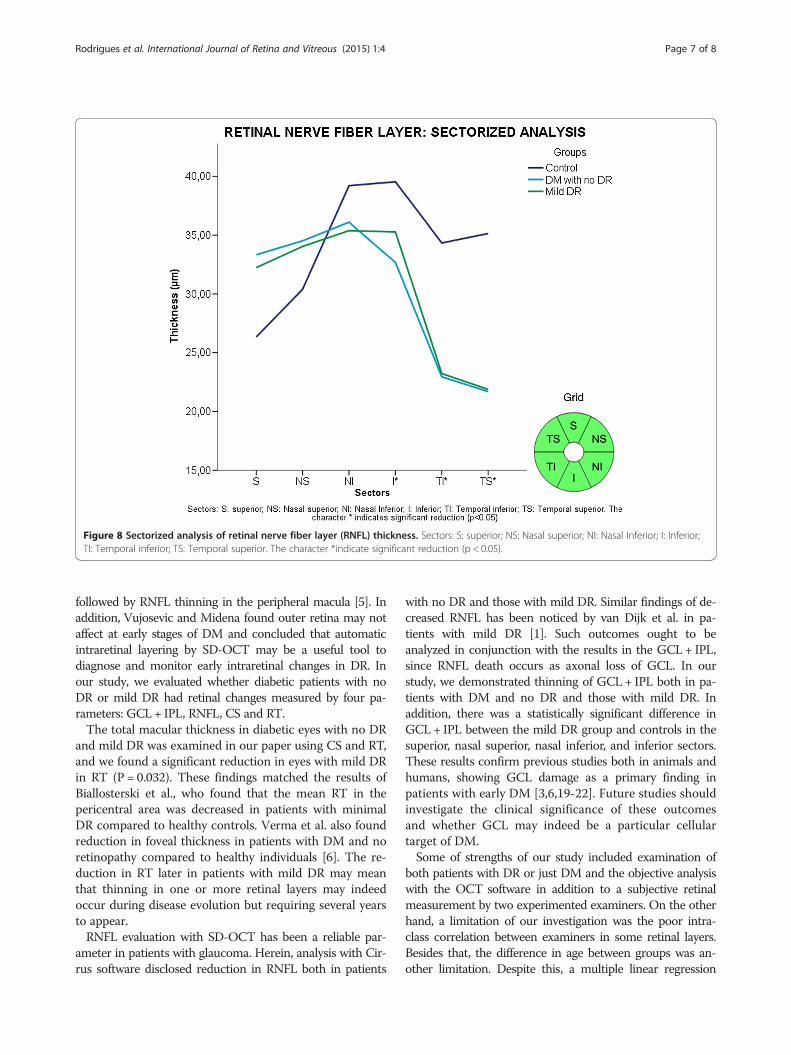
Figure 8 Sectorized analysis of retinal nerve fiber layer (RNFL) thickness. Sectors: S: superior; NS: Nasal superior; NI: Nasal Inferior; I: Inferior;TI: Temporal inferior; TS: Temporal superior. The character *indicate significant reduction (p < 0.05).
Rodrigues et al. International Journal of Retina and Vitreous (2015) 1:4 Page 7 of 8
followed by RNFL thinning in the peripheral macula [5]. Inaddition, Vujosevic and Midena found outer retina may notaffect at early stages of DM and concluded that automaticintraretinal layering by SD-OCT may be a useful tool todiagnose and monitor early intraretinal changes in DR. Inour study, we evaluated whether diabetic patients with noDR or mild DR had retinal changes measured by four pa-rameters: GCL + IPL, RNFL, CS and RT.The total macular thickness in diabetic eyes with no DR
and mild DR was examined in our paper using CS and RT,and we found a significant reduction in eyes with mild DRin RT (P = 0.032). These findings matched the results ofBiallosterski et al., who found that the mean RT in thepericentral area was decreased in patients with minimalDR compared to healthy controls. Verma et al. also foundreduction in foveal thickness in patients with DM and noretinopathy compared to healthy individuals [6]. The re-duction in RT later in patients with mild DR may meanthat thinning in one or more retinal layers may indeedoccur during disease evolution but requiring several yearsto appear.RNFL evaluation with SD-OCT has been a reliable par-
ameter in patients with glaucoma. Herein, analysis with Cir-rus software disclosed reduction in RNFL both in patients
with no DR and those with mild DR. Similar findings of de-creased RNFL has been noticed by van Dijk et al. in pa-tients with mild DR [1]. Such outcomes ought to beanalyzed in conjunction with the results in the GCL + IPL,since RNFL death occurs as axonal loss of GCL. In ourstudy, we demonstrated thinning of GCL + IPL both in pa-tients with DM and no DR and those with mild DR. Inaddition, there was a statistically significant difference inGCL + IPL between the mild DR group and controls in thesuperior, nasal superior, nasal inferior, and inferior sectors.These results confirm previous studies both in animals andhumans, showing GCL damage as a primary finding inpatients with early DM [3,6,19-22]. Future studies shouldinvestigate the clinical significance of these outcomesand whether GCL may indeed be a particular cellulartarget of DM.Some of strengths of our study included examination of
both patients with DR or just DM and the objective analysiswith the OCT software in addition to a subjective retinalmeasurement by two experimented examiners. On the otherhand, a limitation of our investigation was the poor intra-class correlation between examiners in some retinal layers.Besides that, the difference in age between groups was an-other limitation. Despite this, a multiple linear regression
Rodrigues et al. International Journal of Retina and Vitreous (2015) 1:4 Page 8 of 8
model was used to assess the relationship between GCLthickness, RNFL thickness and RT with variables with cor-relation (age and DR status), which showed that DR statuswas the most explanatory variable. Other drawback of ourinvestigation was the uncertain onset of the DM, as type 2DM patients may have the disease for some time before theyrecognize the condition, but this fact would only underesti-mate the findings.
ConclusionsOur paper reports early signs of neuroretinal changes by de-tecting a significant thinning of different inner cell layersand central retina in patients with early DR compared tonormal eyes. The investigation encountered thinning inthickness of GCL and RFNL in patients with DM withoutDR, which suggests neuroretinal changes before vascularsigns. Future studies should compare functional testing withelectrophysiology and microperimetry with OCT findings.
AbbreviationsDM: Diabetes mellitus; DR: Diabetic retinopathy; GCL: The ganglion cell layer+ inner plexiform layer; RNFL thickness: Retinal nerve fiber layer; CS retinalthickness: Central subfoveal; RT thickness: Average macular thickness andtotal retinal; ANOVA: Analysis of Variance; OCT: Optical coherencetomography; HbA1c: Last glycosylated hemoglobin; FA: Fluoresceinangiography; SD-OCT: Spectral-domain optical coherence tomography;ICC: Intraclass correlation coefficient; ETDRS: Early Treatment DiabeticRetinopathy Study; ICC: Intraclass correlation.
Competing interestsThe authors received research grants from Carl Zeiss Meditec.
Authors’ contributionsEBR conceived of the study, and participated in its designs and coordinationand helped to draft the manuscript. MGU, EB, RM, EN, FP participated in thedesign, conducted the examinations and interpretation, and prepared themanuscript. MEF participated in the conception, design, preparation of themanuscript. All authors read and approved the final manuscript.
AcknowledgmentsEBR, FMP, and MEF acknowledge research grants from Carl Zeiss Meditecthrough the Federal University of Sao Paulo. EBR acknowledges a grantawarded by Conselho Nacional de Desenvolvimento Científico eTecnológico (CNPq) - Projeto 470657/2011-1. MGU and MEF acknowledge agrant from Fundação de Amparo à Pesquisa do Estado de São Paulo(FAPESP) - Projeto 2011/12482-4.
Received: 15 November 2014 Accepted: 16 January 2015
References1. van Dijk HW, Kok PH, Garvin M, Sonka M, Devries JH, Michels RP, et al.
Selective loss of inner retinal layer thickness in type 1 diabetic patients withminimal diabetic retinopathy. Invest Ophthalmol Vis Sci. 2009;50:3404–9.
2. Biallosterski C, van Velthoven ME, Michels RP, Schlingemann RO, DeVries JH,Verbraak FD. Decreased optical coherence tomography-measuredpericentral retinal thickness in patients with diabetes mellitus type 1 withminimal diabetic retinopathy. Br J Ophthalmol. 2007;2007(91):1135–8.
3. Abu El-Asrar AM, Dralands L, Missotten L, Geboes K. Expression ofantiapoptotic and proapoptotic molecules in diabetic retinas.Eye (Lond). 2007;21:238–45.
4. Yang JH, Kwak HW, Kim TG, Han J, Moon SW, Yu SY. RetinalNeurodegeneration in Type II Diabetic Otsuka Long-Evans Tokushima FattyRats. Invest Ophthalmol Vis Sci. 2013;54:3844–51.
5. van Dijk HW, Verbraak FD, Kok PH, Garvin MK, Sonka M, Lee K, et al.Decreased retinal ganglion cell layer thickness in patients with type 1diabetes. Invest Ophthalmol Vis Sci. 2010;51:3660–5.
6. Verma A, Raman R, Vaitheeswaran K, Pal SS, Laxmi G, Gupta M, et al. Doesneuronal damage precede vascular damage in subjects with type 2diabetes mellitus and having no clinical diabetic retinopathy?Ophthalmic Res. 2012;47:202–7.
7. Koh VT, Tham YC, Cheung CY, Wong WL, Baskaran M, Saw SM, et al.Determinants of ganglion cell-inner plexiform layer thickness measured byhigh-definition optical coherence tomography. Invest Ophthalmol Vis Sci.2012;53:5853–9.
8. Mwanza JC, Durbin MK, Budenz DL, Girkin CA, Leung CK, Liebmann JM,et al. Profile and predictors of normal ganglion cell-inner plexiform layerthickness measured with frequency-domain optical coherence tomography.Invest Ophthalmol Vis Sci. 2011;52:7872–9.
9. Wilkinson CP, Ferris 3rd FL, Klein RE, Lee PP, Agardh CD, Davis M, et al.Proposed international clinical diabetic retinopathy and diabetic macularedema disease severity scales. Ophthalmology. 2003;110:1677–82.
10. Antonetti DA, Klein R, Gardner TW. Diabetic retinopathy. N Engl J Med.2012;366:1227–39.
11. Simó R, European Consortium for the Early Treatment of DiabeticRetinopathy (EUROCONDOR), Hernández C. Neurodegeneration is an earlyevent in diabetic retinopathy: therapeutic implications. Br J Ophthalmol.2012;96:1285–90.
12. Vujosevic S, Midena E. Retinal layers changes in human preclinical and earlyclinical diabetic retinopathy support early retinal neuronal and Muller cellsalterations. J Diabetes Res. 2013;2013:905058.
13. Nilsson M, von Wendt G, Brautaset R, Wanger P, Martin L. Macular structureand function and the development of retinopathy in diabetes. Clin ExpOptom. 2012;95:306–10.
14. Nilsson M, von Wendt G, Wanger P, Martin L. Early detection of macularchanges in patients with diabetes using Rarebit Fovea Test and opticalcoherence tomography. Br J Ophthalmol. 2007;91:1596–8.
15. Valverde AM, Miranda S, García-Ramírez M, González-Rodriguez Á,Hernández C, Simó R. Proapoptotic and survival signaling in the neuroretinaat early stages of diabetic retinopathy. Mol Vis. 2013;19:47–53.
16. Stem MS, Gardner TW. Neurodegeneration in the pathogenesis of diabeticretinopathy: molecular mechanisms and therapeutic implications. Curr MedChem. 2013;20:3241–50.
17. Barber AJ, Gardner TW, Abcouwer SF. The significance of vascular andneural apoptosis to the pathology of diabetic retinopathy. InvestOphthalmol Vis Sci. 2011;52:1156–63.
18. Gardner TW, Abcouwer SF, Barber AJ, Jackson GR. An integrated approachto diabetic retinopathy research. Arch Ophthalmol. 2011;129:230–5.
19. Gastinger MJ, Kunselman AR, Conboy EE, Bronson SK, Barber AJ. Dendriteremodeling and other abnormalities in the retinal ganglion cells of Ins2Akita diabetic mice. Invest Ophthalmol Vis Sci. 2008;49:2635–42.
20. Hardy KJ, Lipton J, Scase MO, Scarpello JH, Foster DH. Diabetes and retinalfunction. Br J Ophthalmol. 1991;75:191–2.
21. Lieth E, Gardner TW, Barber AJ, Penn State Retina Research Group, AntonettiDA. Retinal neurodegeneration: early pathology in diabetes. Clin ExperimentOphthalmol. 2000;28:3–8.
22. Oshitari T, Hanawa K, Adachi-Usami E. Changes of macular and RNFLthicknesses measured by Stratus OCT in patients with early stage diabetes.Eye (Lond). 2009;23:884–9.
Submit your next manuscript to BioMed Centraland take full advantage of:
• Convenient online submission
• Thorough peer review
• No space constraints or color figure charges
• Immediate publication on acceptance
• Inclusion in PubMed, CAS, Scopus and Google Scholar
• Research which is freely available for redistribution
Submit your manuscript at www.biomedcentral.com/submit