Embed Size (px)
Citation preview
Journal of Volcanology and Geothermal Research xxx (2009) xxx–xxx
VOLGEO-04288; No of Pages 15
Contents lists available at ScienceDirect
Journal of Volcanology and Geothermal Research
j ourna l homepage: www.e lsev ie r.com/ locate / jvo lgeores
ARTICLE IN PRESS
Volcano topography, structure and intrinsic attenuation: Their relative influences ona simulated 3D visco-elastic wavefield
Gareth S. O'Brien ⁎, Christopher J. BeanSchool of Geological Sciences, University College Dublin, Belfield, Dublin 4, IrelandComplex and Adaptive Systems Lab, University College Dublin, Belfield, Dublin 4, Ireland
⁎ Corresponding author. School of Geological SciencBelfield, Dublin 4, Ireland.
E-mail address: [email protected] (G.S. O'Brien).
0377-0273/$ – see front matter © 2009 Elsevier B.V. Adoi:10.1016/j.jvolgeores.2009.03.004
Please cite this article as: O'Brien, G.S., Besimulated 3D visco-elastic wavefield, J. Vol
a b s t r a c t
a r t i c l e i n f oArticle history:Received 24 November 2008Accepted 12 March 2009Available online xxxx
Keywords:diffusive wavefieldintrinsic attenuationvolcano structure topographynumerical simulations
The seismic wavefield recorded on volcanoes can be significantly influenced by path effects. Scattering fromthe topography and internal volcanic structure can play a dominant role in the recorded seismograms.Intrinsic attenuation is also thought to play an important role in the characteristics of volcano seismic signals.We use 3D numerical modelling of wave propagation in elastic and visco-elastic media including complexvelocity models and topography to investigate the scattering and attenuation characteristics of syntheticseismograms. We generate 5 distinct volcano models and simulate wave propagation through these modelsusing shallow and deep double-couple broadband sources. We then analyse 129 synthetic seismogramscalculated on the free surface. The synthetic seismograms resemble VT-A and VT-B events. The scatteringeffect of the topography alone is capable of producing complex seismograms. The introduction of an internalvelocity structure increases the duration of these seismograms while the introduction of intrinsic attenuationdecreases the duration but not the complexity. We fitted our synthetic seismograms to the diffusion in a half-space model to quantify the scattering and attenuation coefficients. The scattering quality factor measured onall 129 stations for all 5 volcano models was similar. Therefore, we deduce that the topography appears to bethe dominant scatterer. The intrinsic attenuation quality factor for each of the specific models cannot beaccurately recovered using the diffusion in a half-space model. The measured quality factor is not onlysensitive to the attenuation properties but also to the structural properties. In all cases the scattering is moredominant than the intrinsic attenuation.
© 2009 Elsevier B.V. All rights reserved.
1. Introduction
Several potential source mechanisms are thought to generateseismicity on active and/or restless volcanoes. These source mechan-isms include brittle rock failure, fluid transport, gas slug ascent,choked flow, magmatic activity and the interaction of hot magmawithhydrothermal fluids, (see Chouet, 2003 and McNutt, 2005 for reviewsof volcano seismology). Seismicity may also be generated by surfaceevents, e.g. rockfall, pyroclastic falls and lahars, (Jolly et al., 2002 andLavigne et al., 2000). This richness in the potential source mechanismis mirrored in the variety of classes of signals observed on active orrestless volcanoes. These signals span a continuum from ultra-longperiod events with dominate periods of 100 s of seconds throughvery-long period events to long-period (LP) events and in additionvolcano-tectonic signals (McNutt, 2005). Volcano-tectonic signals
es, University College Dublin,
ll rights reserved.
an, C.J., Volcano topography,canol. Geotherm. Res. (2009
consist of shear or tensile failure of brittle rock and the spectralcharacteristics of the waveforms are indistinguishable from localtectonic earthquakes. Interpreting the signals in volcanic environ-ments presents some difficult challenges in seismology. The complex-ity arises in a volcanic setting because (1) thewavefield is significantlydistorted by the complex topography, (2) the volcanic stratigraphy canfurther distort the wavefield and (3) the presence of magmatic fluids(gas, magma and hydrothermal water) may generate large intrinsicattenuation. Adding to this complexity, the near-field seismicwavefield cannot be ignored, the wavelengths can be large relativeto the source–receiver distance and hence the P- and S-wave phasescan be intertwined. Also, the signals may have emergent wave-trainsdue to both source and path effects so separate phase arrivals oftencannot be clearly distinguished. The combination of these processescan lead to a diffusive wavefield. Thus, a key question in volcanoseismology is what are the relative effects of topography, structureand attenuation on the wavefield and how are they quantifiable?
Numerical simulations of seismic wave propagation on Merapi,Indonesia show that a complex, heterogeneous wavefield can emergedue to the presence of steep topography and that strong surfacewavesare generated and dominate the coda wavefield (Ripperger et al.,
structure and intrinsic attenuation: Their relative influences on a), doi:10.1016/j.jvolgeores.2009.03.004

Table 1Different volcano models used to generate the synthetic seismograms. Fig. 1 shows thehomogenous and velocity profiles along with the location of the synthetic sensors. Thevisco-elastic attenuation is shown in Fig. 2 where the curve is calculated using Eq. (1).
Velocity model Source depth Qp Qs
(km) (5 Hz) (5 Hz)
Model 1 Homogeneous velocity 1.3 ∞ ∞Model 2 Homogeneous velocity 1.3 80 40Model 3 Fractal with low velocity layer 1.3 ∞ ∞Model 4 Fractal with low velocity layer 1.3 80 40Model 5 Fractal with low velocity layer 1.3 40 20
Fig. 2. A standard linear solid or Zener body is used to model visco-elastic wavepropagation. The P-wave and S-wave quality factors used in our simulations and theirdependence on the frequency are shown. The curves are calculated from Eq. (1).
2 G.S. O'Brien, C.J. Bean / Journal of Volcanology and Geothermal Research xxx (2009) xxx–xxx
ARTICLE IN PRESS
2003). Neuberg and Pointer (2000) show that for broadband wave-forms, the angle of incidence as well as the back-azimuth is affected byan inclined free surface.
On volcanoes strong lithologically controlled seismic impedancecontrasts can occur at layer interfaces depending on the eruptivehistory. Measurements on rock samples from the Trecase boreholeclose to Mt Vesuvius show that the mean unfractured P-wave velocityin the top 300 m is less than 2500 m/s, (Bruno et al., 1998). Surfacewave dispersion analyses reveal similar results for Vesuvius (De Lucaet al., 1997), Stromboli (Chouet et al., 1998), Arenal, Costa Rica (Mora
Fig. 1. Synthetic volcanomodel used in this study to investigate the role of topography, internal structure and intrinsic attenuation in distorting the seismic wavefield. 129 sensors aredistributed in a 1 km square array across the surface (red dots). The black triangles show the location of a smaller linear array. The P-wave velocity, S-wave velocity and density areshown in the lower panel. See text for a description of the velocitymodel. (For interpretation of the references to color in this figure legend, the reader is referred to theweb version ofthis article.)
Please cite this article as: O'Brien, G.S., Bean, C.J., Volcano topography, structure and intrinsic attenuation: Their relative influences on asimulated 3D visco-elastic wavefield, J. Volcanol. Geotherm. Res. (2009), doi:10.1016/j.jvolgeores.2009.03.004

Fig. 3. Vertical displacement on the surface of the volcano for four different times. The amplitude in all subplots has been normalised to the maximum of the upper left hand plot withthe deepest red having a normalised displacement of +1 and the deepest blue having a normalised displacement of−1. The solid lines represent topographic contours and the blacktriangles show the linear seismic array. In the upper left plot the P- and S-waves are clearly seen. (For interpretation of the references to color in this figure legend, the reader isreferred to the web version of this article.)
3G.S. O'Brien, C.J. Bean / Journal of Volcanology and Geothermal Research xxx (2009) xxx–xxx
ARTICLE IN PRESS
et al., 2006) and Masaya, Nicaragua (Metaxian et al., 1997). Usingarray analysis of tremor wavefields, Saccorotti et al. (2003) alsodetermined low velocity shallow structures at Kilauea. Hence it seemsthat near-surface (few hundred metres) low velocities are common involcanic environments and can play a significant role in distorting thewavefield. For example, Bean et al. (2008) have shown that thepresence of a shallow low velocity layer can significantly effect themoment tensor calculated from an inversion of long-period events onMt Etna even though the smallest wavelength is approximately4 times longer than the layer thickness.
In addition to the shallow low velocity zone borehole logs haveshown variations in velocities and density throughout the volcanicedifice. In particular, borehole sonic logs reveal that exceptionallystrong acoustic impedance contrasts can occur at lithologicalboundaries between tuff, ash and competent basalt (Dolan et al.,1998). As well as these structural heterogeneities, subsurface interfacescattering can also play a significant role in distorting the wavefield(Martini and Bean, 2002).
Seismic attenuation has been studied on numerous volcanoes. Forexample, Del Pezzo et al. (2006) measured the attenuation on MtVesuvius using energy envelopes and different diffusive wavefieldmodels. They found the total quality factor Qi varies from approxi-mately a minimum of 10 at 2 Hz to over a 1000 for frequencies over10 Hz. De Gori et al. (2005) produced a tomography model of Mt Etna
Please cite this article as: O'Brien, G.S., Bean, C.J., Volcano topography,simulated 3D visco-elastic wavefield, J. Volcanol. Geotherm. Res. (2009
revealing a large low P-wave quality factor (QP-wave) region with avalue ranging from approximately 30–80 located under the summitand extending in a cylindrical like manner with a radius of 4 km to adepth of 4 km. As with low velocity layers and a variable velocitydistribution, attenuation appears to be important on volcanoes.
We have performed full wavefield 3D numerical modelling in thepresence of complex topography, complex velocity models andintrinsic attenuation. No analytical solutions can account for thiscomplexity hence numerical methods must be used to model seismicwave propagation in volcanic settings. The output from thesesimulations is then used to quantify the effect of topography, velocityvariations and intrinsic attenuation on synthetic seismograms. Aprimary aim of this study is to determine the relative contribution ofthese contributing factors on the wavefield distortion. The numericalscheme and volcanomodel is discussed in Sections 2 and 3we presentthe results of our numerical simulations. The seismograms are thenanalysed in terms of their scattering parameters in Section 4 and wedraw our conclusions in Section 5.
2. Modelling
We use a discrete particle method to model seismic wavepropagation in a 3D visco-elastic medium, (O'Brien, 2008). Othermethods can be equally used to model seismic wave propagation at
structure and intrinsic attenuation: Their relative influences on a), doi:10.1016/j.jvolgeores.2009.03.004

Fig. 4. Nine synthetic vertical component displacement seismograms frommodel 3 are shown. Their location is shown in Figs. 1 and 3 as black triangles. The distance to the source isindicated on the right of the seismic traces. The source function is shown in the bottom of the figure (dashed line). All the traces are normalised and the amplitudes are indicated onthe left side of the seismogram.
4 G.S. O'Brien, C.J. Bean / Journal of Volcanology and Geothermal Research xxx (2009) xxx–xxx
ARTICLE IN PRESS
volcanoes, e.g. boundary elements (Neuberg and Pointer 2000) andfinite differences methods (Jousset et al., 2004 and Ohminato andChouet, 1997). The 3D visco-elastic lattice method for the simulationof seismic waves consists of particles arranged on a cubic latticewhich interact through a central force term and a bond-bending forcealong with dashpots for the attenuation. Particle disturbances arefollowed through space by numerically solving their equations ofmotion. The method is computationally equivalent in time andmemory to a 4th order finite-difference method. For a detaileddescription of discrete particle methods and their application toseismic wave propagation see Monette and Anderson, (1994),Toomey and Bean, (2000) and O'Brien et al. (in press). We use aZener body (also called a standard linear solid) which consists of adashpot with viscosity η and spring with stiffness K1 in parallel withanother spring with constant Ko as our rheological model. The detailsof our underlying intrinsic Q model is not of concern in this work,what is important is an assessment of our ability to recover theunderlying intrinsic Q. For a discussion of an appropriate medium
Please cite this article as: O'Brien, G.S., Bean, C.J., Volcano topographysimulated 3D visco-elastic wavefield, J. Volcanol. Geotherm. Res. (2009
rheology in volcanic regions see Jousset et al. (2004). The Q curve isgiven by
Q ωð Þ = 1 + ω2τeτσω τe − τσð Þ ð1Þ
where ω is the angular frequency and
τσ =ηK1
τe =ηKo
+ηK1
ð2Þ
and τσ is the stress relaxation time and τξ the strain relaxation time(Carcione, 2007). The topography boundary condition is implementedas in O'Brien and Bean (2004). We have implemented absorbingboundaries using an exponential tapering of the wavefield on theedges and bottom of the model to mimic an infinite elastic or visco-elastic half-space. The introduction of absorbing boundaries meansthat energy is removed from the system. The attenuation of the
, structure and intrinsic attenuation: Their relative influences on a), doi:10.1016/j.jvolgeores.2009.03.004

Fig. 5. A synthetic displacement seismogram frommodel 3 recorded 4299m from the source is shown. The individual components are given a static displacement shift for the sake ofclarity. The initial P-wave onset is visible at 2.5 s but no S-wave or surface wave arrivals are evident. The seismogram has the distinct cigar like shape which is indicative of a diffusivewavefield. The right-hand plots show the particle motion for three different timewindows as indicated on the seismic trace. The location of the source is shown as the black dot underthe crater summit.
5G.S. O'Brien, C.J. Bean / Journal of Volcanology and Geothermal Research xxx (2009) xxx–xxx
ARTICLE IN PRESS
wavefield by the absorbing boundaries is frequency dependent withhigh frequencies being preferentially damped. We ran a testsimulation in a homogeneous infinite elastic medium to check theefficiency of our absorbing boundaries by comparing the numericalsolution with the analytical solution. We found that the unwantedreflections from the numerical boundaries were sufficiently dampedwith the amplitude of the reflected waves 20 grid points from theboundary being less than 2% of the direct arrival.
Table 1 lists the five models used in this work. One of the volcanomodels (model 3) used in this study is shown in Fig. 1. The topographyis taken from a real digital elevationmap (Ubinas, Peru) and is used asa generic surface for all models, (the depth is measured against sealevel). The location of two seismic arrays is shown in Fig. 1A. The firstarray is linear with 9 sensors running from south-east to north-westacross the summit, black triangles. The second larger array (red dots inFig. 1A) covers the surface of the volcano with 129 sensors equallyspaced 1 km apart in a square geometry. The surface of one quadrangleis removed to show the vertical and horizontal slices of the P-wavevelocity structure. The P-wave velocity has a low velocity layer at thesurface (2000 m/s) which linearly increases to 3500 m/s over 800 m.The P-wave velocity was then given a fractal distribution with a Hurstexponent of 0.3 with a maximum deviation of 7%, Fig. 1B. Thecorrelation length was set to five times the maximummodel length inthe North and East directions and twice themaximummodel length inthe vertical direction. This effectively gives an infinite correlationlength over the model dimensions and mimics stratigraphic layeringinside the volcano. We imposed a Poisson's ratio of 0.25 and a density
Please cite this article as: O'Brien, G.S., Bean, C.J., Volcano topography,simulated 3D visco-elastic wavefield, J. Volcanol. Geotherm. Res. (2009
ρwhich is related to the velocity through Gardner's equation (Gardneret al., 1974).
ρ = 1700 + 0:2vp ð3Þ
As discussed above the intrinsic attenuation inside volcanoes isvery variable so to reduce the parameter space of our model wechoose a simple homogeneous Zener body. The frequency dependenceof Q is shown in Fig. 2 with QP-wave and QS-wave set to 80 and 40 at 5 Hzrespectively.
We will use our generic volcano models to examine the distortionof the wavefield generated by shallow volcano-tectonic sources. Fromthese events we will measure the contribution of the individualcomponents, namely the topography, structure and attenuation. Toachieve this we have run several simulations using variations of thevolcano model described above, see Table 1. In all cases the sourcefunction is a Gaussian pulse with a half-width of 0.075 s input as aforce. We filter the resultant seismograms with a band pass filter from0.033 Hz to 9 Hz. This was to remove numerical artefacts of unphysicalreflections from the finite numerical grid of very large wavelengthsand numerical dispersion of small wavelengths. Unless otherwisestated, the source mechanism was a double-couple source located1.3 km below the summit of the volcano. The moment tensorcomponentMxy=209 N m is the only non-zero component. In reality,small magnitude double-couple events will not radiate at a frequencyrange covered by our broadband spectrum, however, we use thisbroadband source to study the scattering characteristics of a relatively
structure and intrinsic attenuation: Their relative influences on a), doi:10.1016/j.jvolgeores.2009.03.004

Fig. 6. Time–frequency representation (spectrograms) of the vertical component displacement seismograms shown in Fig. 4. The seismograms are generated in an elastic model(model 3).
6 G.S. O'Brien, C.J. Bean / Journal of Volcanology and Geothermal Research xxx (2009) xxx–xxx
ARTICLE IN PRESS
large frequency band. This approach is justified as we are employingpower-law (fractal) velocity models to represent our heterogeneityscaling. These models are justified based on borehole log observations(Dolan et al., 1998). As these models contain heterogeneity at all scalesizes, they allow us to study the scattering process, independent of theseismic frequency used in our simulations. As mentioned throughoutthis section we are using a volcano model which represents somefeatures observed on volcanoes. In reality the velocity and attenuationwould be far more complex at all spatial scales and in terms of therelaxation mechanisms. The goal is to investigate the effect of some ofthese features on the scattered wavefield not to propose these modelsas a true representation of an actual volcano.
3. Results
The vertical component of the seismic wavefield moving acrossthe surface of the volcano is displayed in Fig. 3 for four different timesfor model 3 which has infinite intrinsic QP-wave and QS-wave value. At0.9 s the initial vertical radiation pattern from the double-couplesource is clearly seen in a spherical pattern on the surface. At 2.7 s the
Please cite this article as: O'Brien, G.S., Bean, C.J., Volcano topographysimulated 3D visco-elastic wavefield, J. Volcanol. Geotherm. Res. (2009
initial P-wave hasmoved to the edge of the numerical domainwhile aclear S-wave front is difficult to identify and strong coda wavegeneration can be clearly seen trailing behind the body waves. After5.4 s the wavefield on the entire surface clearly appears incoherentwith no distinct phases visible. The temporal snapshots illustrate thecomplex nature of the wavefield.
The vertical displacement seismograms across the linear array areshown in Fig. 4 for model 3. The vertical components across the arrayshow no clear phase arrivals save for the initial P-wave onset whichcan be identified on some of the traces. The amplitude of this initial P-wave onset is small (relative to the full waveform) and could be easilyunrecognizable if the signal-to-noise ratio was not zero. The radiationpattern might influence this result, for example if the linear array wasplaced along a nodal plane of the double-couple source. However, byvisually examining all 129 synthetic stations we determine that thisbehaviour is a common feature and is not merely a radiation effect. Forcomparison the source function is plotted in the bottom of the figureand demonstrates the increase in length of the signal due to multiplereflections from the topography and scattering from the internalstructure. The particle motions of the seismograms reveals little
, structure and intrinsic attenuation: Their relative influences on a), doi:10.1016/j.jvolgeores.2009.03.004

Fig. 7. Vertical synthetic displacement seismograms calculated for velocity model 3. All four seismograms were recorded at the same location, 5780 m North-East from the summit.A) The seismogram calculated for the double-couple source located at a depth of 1.3 km below the summit. B) A seismogram calculated for the double-couple source located at adepth of 2.9 km below the summit. C) The seismogram recorded for an isotropic source located at a depth of 1.3 km below the summit. D) The seismogram recorded for an isotropicsource located at a depth of 2.9 km below the summit.
7G.S. O'Brien, C.J. Bean / Journal of Volcanology and Geothermal Research xxx (2009) xxx–xxx
ARTICLE IN PRESS
information following the initial onset as P-waves, S-waves andsurface waves are all mixed (Fig. 5). This situation is more complexnearer to the source where the near-field terms cannot be ignored. Ingeneral the amplitude falls off with increasing distance as expectedbut there are some local site effects where the amplitude is strongerthan expected, e.g. traces 8 and 9 in Fig. 4. The wavefield becomesincoherent soon after the initial P-wave arrival, as is shown in Fig. 5,where the 3 components of the seismogram located 4299 m from thesource are plotted. After approximately 3 s the components areuncorrelated and this is borne out when looking at the particlemotions along the trace for different time windows.
The time–frequency representation of the seismograms in Fig. 4shows a general trend of increasing mean frequency with increasingtime, Fig. 6. The longer wavelengths are less sensitive to thetopography and structure and therefore are less prone to beingtrapped by these structures while the smaller wavelengths remaintrapped for longer times. This leads to a dominance of higherfrequencies at later times. The time–frequency plots highlight thevariable nature of the wavefield with different frequencies arriving atvariable times with variable power. The synthetic seismogramsresemble real seismograms recorded on active volcanoes, forexamples see Wegler and Luhr (2001), Sherburn et al. (1998) andMcNutt (2005). Considering all 129 synthetic 3 component signals,they can be generally described as an emergent wavefield with a cigarshaped envelope. This behaviour changes with a different sourcemechanism and source location. If we increase the depth of the sourceto 3 km below the summit, the P-wave onset becomes morepronounced and we begin to see the development of an S-wavephase arrival. We can distinguish the P-wave and S-wave as we have
Please cite this article as: O'Brien, G.S., Bean, C.J., Volcano topography,simulated 3D visco-elastic wavefield, J. Volcanol. Geotherm. Res. (2009
an infinite signal-to-noise ratio and know the expected arrival times.The emergence of distinct phases for deeper events is well known andthese events have been traditionally classified as VT-A events whilethe shallow source signals are classified as VT-B events. If the shallowsource mechanism is changed from a double-couple mechanism to anexplosive source, then the initial P-wave onset is much morepronounced and clearly seen across the linear array. This is becausethe source only generates P-waves and thus there is no largeamplitude S-wave source term. Fig. 7 shows four examples ofseismograms where the source and depth have been changed usingvelocity model 3.
When we introduce Q into the model (models 2, 4 and 5) wedecrease the length of the signals as thewaves are damped and, givenour attenuation model, we preferentially damp higher frequencywaves. The vertical component seismograms from the linear array formodel 4 are shown in Fig. 8. They clearly show the influence of theattenuation as described above when compared with the elasticmodel, see Fig. 4. The P-wave ballistic arrival increases in amplituderelative to the remaining seismogram as QP-wave is twice QS-wave sothe S-waves and hence the coda are preferentially damped. The codarapidly becomes dominated by S-waves due to wave conversions,(Aki, 1992). The spectrum of the signals in Fig. 8 shows spectral peaksand attenuation of the higher frequencies which is more pronouncedwith increasing time. This is a direct result of the attenuation model.As in model 3, the amplitude falls off with increasing distance withsome exceptions where local site effects influence the amplitude.However, this effect is less apparent in the visco-elastic case as thewaves are damped by the presence of intrinsic Q. When the source isdeeper with an explosive mechanism the resultant seismograms
structure and intrinsic attenuation: Their relative influences on a), doi:10.1016/j.jvolgeores.2009.03.004

Fig. 8. Nine synthetic vertical component displacement seismograms frommodel 4 are shown. Their location is shown in Fig. 1 as black triangles. The source function is shown in thebottom of the figure (dashed line). Model 4 has a QP-wave and QS-wave of 80 and 40 respectively. The distance to the source is indicated on the right of the seismic traces. All the tracesare normalised and the amplitudes are indicated on the left side of the seismogram.
8 G.S. O'Brien, C.J. Bean / Journal of Volcanology and Geothermal Research xxx (2009) xxx–xxx
ARTICLE IN PRESS
exhibit the same changes as observed in the elastic case. Thedominant effect of including intrinsic attenuation is to change thelength of the signals and the frequency content. The temporaldependence of the frequency also changes from attenuation of lowfrequencies in the elastic case to attenuation of high frequencies inthe visco-elastic case. The introduction of Q does not remove thecomplexity observed in the seismograms but shortens the duration ofthe signals. Fig. 9 shows a comparison of the vertical seismogram andspectrogram from a station located 4299 m from the source formodels 1–5. The most striking differences are the length of thesignals and frequency content. Models 1 and 3 highlight thedifference of including a more ‘realistic’ internal structure. Thewave-train persists for much longer and the higher frequencies aretrapped inside the structure for longer. The influence of QP-wave andQS-wave is to change the attenuation characteristics and shorten thesignal length. Model 5, which has a low QP-wave and QS-wave, isinteresting in that the seismograms appear to resemble a long-periodevent. Given this resemblance, we investigated whether a morerealistic long-period event or hybrid event would emerge from abroadband like source function. We found that while we couldreplicate LP like signals with low Q values we could not readily
Please cite this article as: O'Brien, G.S., Bean, C.J., Volcano topographysimulated 3D visco-elastic wavefield, J. Volcanol. Geotherm. Res. (2009
replicate hybrid events without specifically designing a source timefunction or a velocity and attenuation structure. The spectra of twostations located 1479 m and 4590 m from the source are shown inFig. 10 for all 5 models. As expected the far-field stations in the visco-elastic models are relatively poorer in higher frequencies than thenear-field stations given that they propagate further through thevisco-elastic medium. For this far-field location and for all models weonly find the development of narrow spectral peaks at highfrequencies. Whilst the seismograms for model 5 appear LP like,the spectrum shows a low frequency broad spectrum as opposed tothe observed narrow spectral peaks associated with LP events. Atother far-field locations, for the same setup as shown in Fig. 10, we doobserve narrow spectral peaks at low frequencies. Also, when weintroduced a deeper source the long frequency broadband pulse wasreplaced by narrower spectral peaks. This also occurred when thevelocity structure was changed to discrete layers as opposed to agradient and fractal velocity.
The overall picture is that with a shallow double-couple source wesee extremely variable behaviour for an elastic homogenousmodel, anelastic heterogeneous model, a visco-elastic homogenous and a visco-elastic heterogeneous model. In all cases the seismograms consist of
, structure and intrinsic attenuation: Their relative influences on a), doi:10.1016/j.jvolgeores.2009.03.004
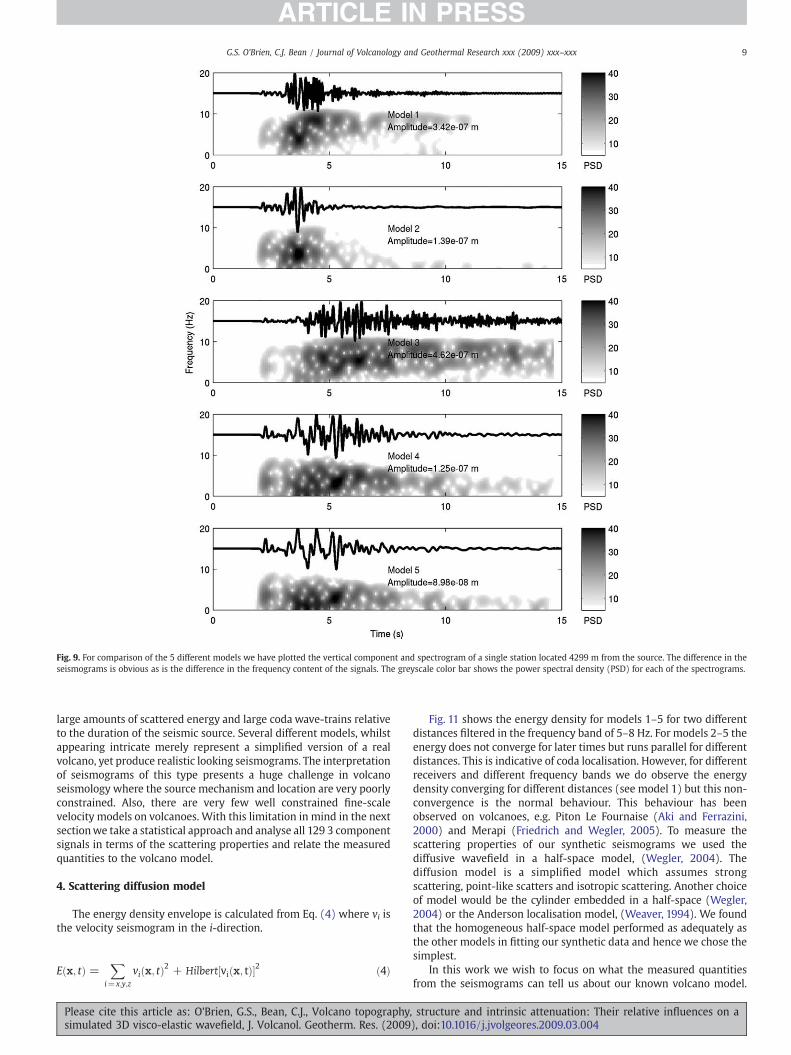
Fig. 9. For comparison of the 5 different models we have plotted the vertical component and spectrogram of a single station located 4299 m from the source. The difference in theseismograms is obvious as is the difference in the frequency content of the signals. The greyscale color bar shows the power spectral density (PSD) for each of the spectrograms.
9G.S. O'Brien, C.J. Bean / Journal of Volcanology and Geothermal Research xxx (2009) xxx–xxx
ARTICLE IN PRESS
large amounts of scattered energy and large coda wave-trains relativeto the duration of the seismic source. Several different models, whilstappearing intricate merely represent a simplified version of a realvolcano, yet produce realistic looking seismograms. The interpretationof seismograms of this type presents a huge challenge in volcanoseismology where the source mechanism and location are very poorlyconstrained. Also, there are very few well constrained fine-scalevelocity models on volcanoes. With this limitation in mind in the nextsectionwe take a statistical approach and analyse all 129 3 componentsignals in terms of the scattering properties and relate the measuredquantities to the volcano model.
4. Scattering diffusion model
The energy density envelope is calculated from Eq. (4) where vi isthe velocity seismogram in the i-direction.
E x; tð Þ =X
i=x;y;z
vi x; tð Þ2 + Hilbert vi x; tð Þ½ �2 ð4Þ
Please cite this article as: O'Brien, G.S., Bean, C.J., Volcano topography,simulated 3D visco-elastic wavefield, J. Volcanol. Geotherm. Res. (2009
Fig. 11 shows the energy density for models 1–5 for two differentdistances filtered in the frequency band of 5–8 Hz. For models 2–5 theenergy does not converge for later times but runs parallel for differentdistances. This is indicative of coda localisation. However, for differentreceivers and different frequency bands we do observe the energydensity converging for different distances (see model 1) but this non-convergence is the normal behaviour. This behaviour has beenobserved on volcanoes, e.g. Piton Le Fournaise (Aki and Ferrazini,2000) and Merapi (Friedrich and Wegler, 2005). To measure thescattering properties of our synthetic seismograms we used thediffusive wavefield in a half-space model, (Wegler, 2004). Thediffusion model is a simplified model which assumes strongscattering, point-like scatters and isotropic scattering. Another choiceof model would be the cylinder embedded in a half-space (Wegler,2004) or the Anderson localisation model, (Weaver, 1994). We foundthat the homogeneous half-space model performed as adequately asthe other models in fitting our synthetic data and hence we chose thesimplest.
In this work we wish to focus on what the measured quantitiesfrom the seismograms can tell us about our known volcano model.
structure and intrinsic attenuation: Their relative influences on a), doi:10.1016/j.jvolgeores.2009.03.004

Fig.10. For each of our 5models the spectrum of the vertical component from two stations is shown. The dashed lines are stations located 1479m from the sourcewhile the solid linesare stations located 4590m from the source. The near-field stations in the visco-elastic medium are richer in higher frequencies. For these locations we do not see the development ofnarrow spectral peaks at low frequencies. The broadband nature of the source has been retained.
10 G.S. O'Brien, C.J. Bean / Journal of Volcanology and Geothermal Research xxx (2009) xxx–xxx
ARTICLE IN PRESS
Eq. (5) describes the distribution in space x and time t of the energydensity using the half-space diffusion model.
E x; tð Þ = 2Eo4πð Þ3=2
1d3=2
1t3=2
exp −bt − jx j4dt
2� �ð5Þ
Eq. (5) is for body waves and b is the coefficient of intrinsicattenuation in Hz, d is the diffusivity in m2 s−1, Eo is the source energyand x is the spatial position. Rewriting Eq. (5) as
ln E x; tð Þ½ � = ln2E0
4πdtð Þ3=2" #
− bt − jx j24dt
ð6Þ
We fit our synthetic energy density data (calculated using Eq. (4))to Eq. (6) solving for b and d and Eo using a least squares regressionfor each of the 129 seismograms. The inversion procedure isperformed for 8 different frequency bands centred on [1, 2, 3, 4, 5, 6,
Please cite this article as: O'Brien, G.S., Bean, C.J., Volcano topographysimulated 3D visco-elastic wavefield, J. Volcanol. Geotherm. Res. (2009
7, 8] Hz with a bandwidth of 0.5 Hz. The coefficient of scatteringattenuation ηs (in m−1) and coefficient of intrinsic attenuation ηi (inm−1) are calculated from
ηs =vs3d
ð7Þ
ηi =bvs
ð8Þ
where vs is the S-wave velocity. We use the homogeneous S-wavevelocity of 2000 m/s in all calculations. In reality, we do not havedetailed access to the S-wave velocity structure so we use a singlevalue as is commonly done with real data.
The dependence of the attenuation coefficients on frequency anddistance from the source for model 3 (infinite Q) and model 4(finite Q) are shown in Fig. 12. Even though model 3 has an infinite Qwe find a finite Q using this inversion procedure. This is no surprise asthe inversion is providing the best fit without any a priori knowledgeof the attenuation or structure and fits all the models with a finite
, structure and intrinsic attenuation: Their relative influences on a), doi:10.1016/j.jvolgeores.2009.03.004

Fig. 11. Energy density of two seismograms recorded at 2049 m (solid line) and 4299 m (dashed line) from the source for the 5 different models. The seismograms were band passedfiltered between 5 and 8 Hz. The energy density is calculated using Eq. (4). For late times, the energy density does not converge to the same value but runs parallel for models 2, 3, 4,and 5. This behaviour is indicative of coda localisation.
11G.S. O'Brien, C.J. Bean / Journal of Volcanology and Geothermal Research xxx (2009) xxx–xxx
ARTICLE IN PRESS
scattering and attenuation coefficient. The scattering coefficient ηsdecreases with distancewhile the intrinsic attenuation is independentof the distance but is highly spread. The scattering and attenuationcoefficients appear to be independent of the frequency but again alarge variation in values is observed. The only discernable differencebetween model 3 and model 4 is that the coefficient of intrinsicattenuation is higher for model 4 and less scattered for all distancesand for all frequencies. This is expected as model 3 has no intrinsicattenuation. As the topography and structure are the same for bothmodels we expect no difference between the scattering coefficients.Relating the attenuation coefficients to our quality factor model weuse the equations below to determine the dimensionless scatteringquality factor Qs and intrinsic quality factor Qi.
Qs =ωvsηs
=3ωdv2s
ð9Þ
Qi =ωvsηi
=ωb
ð10Þ
Please cite this article as: O'Brien, G.S., Bean, C.J., Volcano topography,simulated 3D visco-elastic wavefield, J. Volcanol. Geotherm. Res. (2009
Examining Qs for models 1–4 we see the same pattern for eachmodel, Figs. 13 and 14. Qs increases with increasing distance for all 4models with lower frequencies increasing less than higher frequen-cies. Comparing models 1 and 3 and models 2 and 4, which differonly in terms of introducing the internal structure, we can postulatethat the topography is the dominant factor in determining Qs in thevolcano. In Figs. 13 and 14 there are some clear outliers from somestations for some frequency bands. On inspectionwe found that theyare due to a poor fit with the diffusion model. Qs increases withincreasing frequency indicating the preferential generation and‘trapping’ of higher frequency waves through multiple scattering.This scattering effect dominates our intrinsic attenuation model,which preferential strips out high frequencies. Therefore, Qs appearsto be measuring the length of time the frequencies remain inside themodel and not the specific scattering attenuation. From Figs. 13and 14 we see that Qi is independent of the distance but is morescattered for models with no attenuation. We cannot recover QS-wave
from Qi, for both models 2 and 4, the average value of Qi for allfrequencies is less than 40 where we have introduced intrinsic
structure and intrinsic attenuation: Their relative influences on a), doi:10.1016/j.jvolgeores.2009.03.004

Fig. 12. Dependence of the attenuation coefficients on frequency and distance from the source for model 3 and model 4 are shown. The coefficients were calculated by fitting all 129synthetic energy densities seismograms to Eq. (5) and using Eqs. (7) and (8) to find η. The scattering and attenuation coefficients are independent of the frequency but a largevariation in values is observed.
12 G.S. O'Brien, C.J. Bean / Journal of Volcanology and Geothermal Research xxx (2009) xxx–xxx
ARTICLE IN PRESS
attenuation. We also cannot recover the curve shown in Fig. 2. In factthe measured Q profile increases with increasing frequency in directopposition to our Q profile in Fig. 2. It is also worth noting that evenwhen there is no intrinsic attenuation we measure low values of Qi
for low frequencies. Model 5 showed the same behaviour as model 4save for a lower value of Qi. Using all 129 sensors we investigated ifthe scattering coefficients had any spatial correlation with thetopography but we found no clear correlation. Since Qs clearlyincreases with distance we did not investigate if there was any linkwith the topography. To investigate how the energy is distributed intime we have plotted the energy density function (Eq. (5)) usingthe best fit values for b and d in Fig. 15. The panels (a) and (b) show E(x,t) for every seismogram filtered around 6 Hz for models 3 and 4.Panels (c) and (d) show the arrival time of the maximum of theenergy curve for all stations for different frequency bands. For bothmodels the energy arrives at a constant velocity which is higher formodel 4. This is easily accounted for as model 4 is visco-elastic andtherefore the energy is damped, hence the decrease in the arrivaltime of the energy maximum. The half-width of the energy curve fordifferent frequencies is shown in panels (e) and (f). The width of theenergy distribution is independent of the distance and of thefrequency. However, model 3 shows a lot more variation in the half-width for different frequencies. This is borne out in the plot of thehistograms of the half-width for all stations and at all frequencies,Fig. 15 g and h.
Please cite this article as: O'Brien, G.S., Bean, C.J., Volcano topographysimulated 3D visco-elastic wavefield, J. Volcanol. Geotherm. Res. (2009
5. Discussions and conclusions
We have generated a sweep of synthetic seismograms usingseveral different volcano models where we have included someprominent seismological features. These seismograms were thenanalysed to investigate the scattering and attenuation characteristics.We confirmed, as expected, that the introduction of complextopography significantly distorts the seismic wavefield. The introduc-tion of a heterogeneous velocity structure further distorts thiswavefield. The identification of distinct wave phases depends on thesource mechanism and source location with information about directarrivals being difficult to recover for a shallow double-couple source.These synthetic events correspond in character to the well known VT-B events. The inclusion of intrinsic attenuation decreases the length ofthe seismograms but does not significantly reduce the complexity ofthe simulated signals. For low Q values (QS-wave~20) we can see theappearance of long period like signals generated from shallowbroadband frequency events. Also, the introduction of intrinsicattenuation changes the frequency characteristics of the signalsfrom preferential attenuation of low frequencies to attenuation ofthe higher frequencies. This is strongly influenced by the character-istics of the visco-elastic body chosen which in this study is a Zenerbody. Assuming a diffusive wavefield we fitted our synthetic energydensity traces calculated from our velocity seismograms using Eq. (4)to the diffusive wavefield in a half-space model. This allowed us to
, structure and intrinsic attenuation: Their relative influences on a), doi:10.1016/j.jvolgeores.2009.03.004

Fig. 13. Quality factors for models 1 and 2 (homogeneous velocity) are shown. The scattering factor behaves in a similar manner for both the elastic and visco-elastic model. Theintrinsic attenuation factor has the same amplitude for both models for different frequencies but is much more coherent for the visco-elastic model. For the subplots of Q versusdistance only the results for 1 Hz (dots), 3 Hz (pluses), 5 Hz (crosses) and 8 Hz (circles) are shown for the sake of clarity. The remaining frequency bands follow the same trends.
13G.S. O'Brien, C.J. Bean / Journal of Volcanology and Geothermal Research xxx (2009) xxx–xxx
ARTICLE IN PRESS
measure the scattering and attenuation coefficients and to relate themto our specific volcano models.
Using the diffusive wavefield model we find that the scatteringquality factor is smaller than the intrinsic Q implying that the scatteringis more important than the intrinsic attenuation. The scattering qualityfactor was similar for all models indicating that the volcano topographyis playing a large role in determining the scattering coefficient. This isborne out by the difference observed between the homogeneous andheterogeneous velocity models. It is not surprising that the topographyappears to be the dominant scatterer as it has the largest impedancecontrast (a perfect reflector in our numerical scheme). It isworth notingthat the topography is one of the few variables which can be readilymeasured in a volcanic region and hence we can potentially usenumerical simulations to remove the topographic effects on thewavefield.
With infinite Qi, we still observe low values for low frequencies,but with the introduction of attenuation we observe low Qi valuesfor all frequencies at all distances from the source. We cannotaccurately reproduce the correct attenuation values or frequencydependence. The recovered Qi as measured from our outputseismograms is not merely measuring the model Qi but is alsoinfluenced by frequency dependent scattering enrichment caused by
Please cite this article as: O'Brien, G.S., Bean, C.J., Volcano topography,simulated 3D visco-elastic wavefield, J. Volcanol. Geotherm. Res. (2009
the structural properties (primarily the topography). We recoveredan intrinsic Q model which preferentially attenuates high frequen-cies as opposed to the Zener model used in the simulations. Thisinterpretation of our synthetic data (the scattering Q dominating theintrinsic Q along with preferentially attenuating high frequencies)has been observed in Mt. Vesuvius (Del Pezzo et al., 2006). Whilstthe interpretation of Qi is not consistent with our model we candetermine the presence of intrinsic attenuation. When Qi is presentthe measured Qi follows a definite trend and is not widely scatteredas in the infinite Qi case.
In summary, virtual models of volcanoes can reproduce complex,diffusive wavefields. By using such simulations in conjunction withreal data we can constrain the measured attenuation and scatteringproperties of the seismic wavefield. This in turn may aid ourunderstanding of the role of source versus path effects.
Acknowledgements
The authors wish to acknowledge that this work was carried outin part by the GSI Griffith Research Award and by the 6th frameworkEU project VOLUME. The SFI/HEA Irish Centre for High-End Com-puting (ICHEC) is acknowledged for the provision of computational
structure and intrinsic attenuation: Their relative influences on a), doi:10.1016/j.jvolgeores.2009.03.004
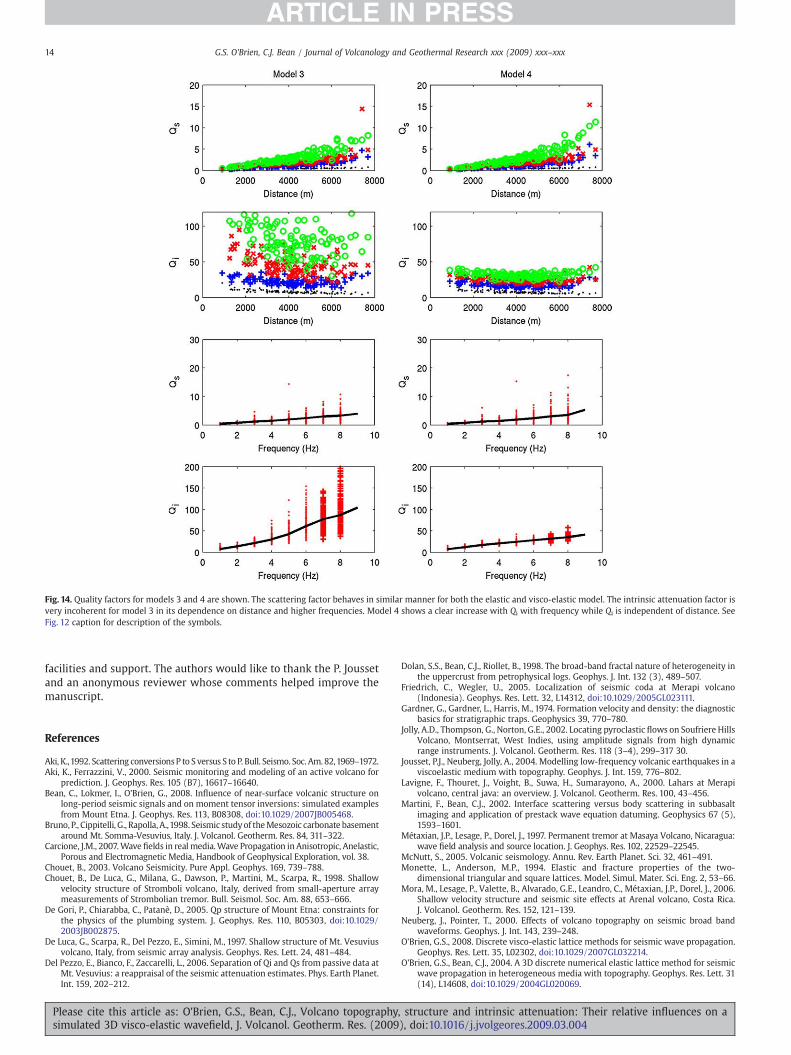
Fig. 14. Quality factors for models 3 and 4 are shown. The scattering factor behaves in similar manner for both the elastic and visco-elastic model. The intrinsic attenuation factor isvery incoherent for model 3 in its dependence on distance and higher frequencies. Model 4 shows a clear increase with Qi with frequency while Qi is independent of distance. SeeFig. 12 caption for description of the symbols.
14 G.S. O'Brien, C.J. Bean / Journal of Volcanology and Geothermal Research xxx (2009) xxx–xxx
ARTICLE IN PRESS
facilities and support. The authors would like to thank the P. Joussetand an anonymous reviewer whose comments helped improve themanuscript.
References
Aki, K.,1992. Scattering conversionsP to S versus S to P. Bull. Seismo. Soc. Am. 82,1969–1972.Aki, K., Ferrazzini, V., 2000. Seismic monitoring and modeling of an active volcano for
prediction. J. Geophys. Res. 105 (B7), 16617–16640.Bean, C., Lokmer, I., O'Brien, G., 2008. Influence of near-surface volcanic structure on
long-period seismic signals and on moment tensor inversions: simulated examplesfrom Mount Etna. J. Geophys. Res. 113, B08308, doi:10.1029/2007JB005468.
Bruno, P., Cippitelli, G., Rapolla, A.,1998. Seismic studyof theMesozoic carbonate basementaround Mt. Somma-Vesuvius, Italy. J. Volcanol. Geotherm. Res. 84, 311–322.
Carcione, J.M., 2007.Wave fields in real media.Wave Propagation in Anisotropic, Anelastic,Porous and Electromagnetic Media, Handbook of Geophysical Exploration, vol. 38.
Chouet, B., 2003. Volcano Seismicity. Pure Appl. Geophys. 169, 739–788.Chouet, B., De Luca, G., Milana, G., Dawson, P., Martini, M., Scarpa, R., 1998. Shallow
velocity structure of Stromboli volcano, Italy, derived from small-aperture arraymeasurements of Strombolian tremor. Bull. Seismol. Soc. Am. 88, 653–666.
De Gori, P., Chiarabba, C., Patanè, D., 2005. Qp structure of Mount Etna: constraints forthe physics of the plumbing system. J. Geophys. Res. 110, B05303, doi:10.1029/2003JB002875.
De Luca, G., Scarpa, R., Del Pezzo, E., Simini, M., 1997. Shallow structure of Mt. Vesuviusvolcano, Italy, from seismic array analysis. Geophys. Res. Lett. 24, 481–484.
Del Pezzo, E., Bianco, F., Zaccarelli, L., 2006. Separation of Qi and Qs from passive data atMt. Vesuvius: a reappraisal of the seismic attenuation estimates. Phys. Earth Planet.Int. 159, 202–212.
Please cite this article as: O'Brien, G.S., Bean, C.J., Volcano topographysimulated 3D visco-elastic wavefield, J. Volcanol. Geotherm. Res. (2009
Dolan, S.S., Bean, C.J., Riollet, B., 1998. The broad-band fractal nature of heterogeneity inthe uppercrust from petrophysical logs. Geophys. J. Int. 132 (3), 489–507.
Friedrich, C., Wegler, U., 2005. Localization of seismic coda at Merapi volcano(Indonesia). Geophys. Res. Lett. 32, L14312, doi:10.1029/2005GL023111.
Gardner, G., Gardner, L., Harris, M., 1974. Formation velocity and density: the diagnosticbasics for stratigraphic traps. Geophysics 39, 770–780.
Jolly, A.D., Thompson, G., Norton, G.E., 2002. Locating pyroclastic flows on Soufriere HillsVolcano, Montserrat, West Indies, using amplitude signals from high dynamicrange instruments. J. Volcanol. Geotherm. Res. 118 (3–4), 299–317 30.
Jousset, P.J., Neuberg, Jolly, A., 2004. Modelling low-frequency volcanic earthquakes in aviscoelastic medium with topography. Geophys. J. Int. 159, 776–802.
Lavigne, F., Thouret, J., Voight, B., Suwa, H., Sumarayono, A., 2000. Lahars at Merapivolcano, central java: an overview. J. Volcanol. Geotherm. Res. 100, 43–456.
Martini, F., Bean, C.J., 2002. Interface scattering versus body scattering in subbasaltimaging and application of prestack wave equation datuming. Geophysics 67 (5),1593–1601.
Métaxian, J.P., Lesage, P., Dorel, J., 1997. Permanent tremor at Masaya Volcano, Nicaragua:wave field analysis and source location. J. Geophys. Res. 102, 22529–22545.
McNutt, S., 2005. Volcanic seismology. Annu. Rev. Earth Planet. Sci. 32, 461–491.Monette, L., Anderson, M.P., 1994. Elastic and fracture properties of the two-
dimensional triangular and square lattices. Model. Simul. Mater. Sci. Eng. 2, 53–66.Mora, M., Lesage, P., Valette, B., Alvarado, G.E., Leandro, C., Métaxian, J.P., Dorel, J., 2006.
Shallow velocity structure and seismic site effects at Arenal volcano, Costa Rica.J. Volcanol. Geotherm. Res. 152, 121–139.
Neuberg, J., Pointer, T., 2000. Effects of volcano topography on seismic broad bandwaveforms. Geophys. J. Int. 143, 239–248.
O'Brien, G.S., 2008. Discrete visco-elastic lattice methods for seismic wave propagation.Geophys. Res. Lett. 35, L02302, doi:10.1029/2007GL032214.
O'Brien, G.S., Bean, C.J., 2004. A 3D discrete numerical elastic lattice method for seismicwave propagation in heterogeneous media with topography. Geophys. Res. Lett. 31(14), L14608, doi:10.1029/2004GL020069.
, structure and intrinsic attenuation: Their relative influences on a), doi:10.1016/j.jvolgeores.2009.03.004

Fig. 15. Energy density fits to our synthetic data for models 3 and 4 for all sensors and frequency bands. Tenergy represents the time of arrival of the maximum energy. Δt1/2 is the half-width of the energy density curve. The bottom panels show the histogram of values of Δt1/2. The different symbols represent different frequency bands with 1 Hz being dots, 3 Hzbeing pluses, 5 Hz being crosses and 8 Hz represented by circles.
15G.S. O'Brien, C.J. Bean / Journal of Volcanology and Geothermal Research xxx (2009) xxx–xxx
ARTICLE IN PRESS
O'Brien, G.S., Bean, C.J. Tapamo, H., in press. Dispersion analysis and computationalefficiency of Elastic Lattice methods for seismic wave propagation, Computers &Geosciences, doi:10.1016/j.cageo.2008.12.004.
Ohminato, T., Chouet, B.A., 1997. A free surface boundary condition for including 3Dtopography in finite-difference method. Bull. Seismol. Soc. Am. 87, 494–515.
Ripperger, J., Igel, H., Wasserman, J., 2003. Seismic wave simulation in the presence ofreal volcano topography. J. Volcanol. Geotherm. Res. 128, 31–44.
Saccorotti, G., Chouet, B., Dawson, P., 2003. Shallow-velocity models at the KilaueaVolcano, Hawaii, determined from array analyses of tremor wavefields. Geophys.J. Int. 152, 633–648.
Sherburn, S., Bradley, J.S.Y., Nishi, Sugihara, Mituhiko, 1998. Seismicity at White Islandvolcano, New Zealand: a revised classification and inferences about sourcemechanism. J. Volcanol. Geotherm. Res. 83 (3–4), 287–312.
Please cite this article as: O'Brien, G.S., Bean, C.J., Volcano topography,simulated 3D visco-elastic wavefield, J. Volcanol. Geotherm. Res. (2009
Toomey, A., Bean, C.J., 2000. Numerical simulation of seismic waves using a discreteparticle scheme. Geophys. J. Int. 141, 595–604.
Weaver, R.L., 1994. Anderson localization in the time domain: numerical studies ofwaves in two-dimensional disordered media. Phys. Rev. B 49, 9.
Wegler, U., 2004. Diffusion of seismic waves in a thick layer: theory and application toVesuvius volcano. J. Geophys. Res. 109, B07303, doi:10.1029/2004JB003048.
Wegler, U., Lühr, G., 2001. Scattering behaviour at Merapi volcano (Java) revealed froman active seismic experiment. Geophys. J. Int. 145 (3), 579–592, doi:10.1046/j.1365-246x.2001.01390.x.
structure and intrinsic attenuation: Their relative influences on a), doi:10.1016/j.jvolgeores.2009.03.004