Embed Size (px)
Citation preview
Infection, Genetics and Evolution xxx (2016) xxx–xxx
MEEGID-02774; No of Pages 11
Contents lists available at ScienceDirect
Infection, Genetics and Evolution
j ourna l homepage: www.e lsev ie r .com/ locate /meeg id
Research paper
The global spread of HIV-1 subtype B epidemic
Gkikas Magiorkinis a,⁎, Konstantinos Angelis b, Ioannis Mamais b, Aris Katzourakis a, Angelos Hatzakis b,Jan Albert c, Glenn Lawyer d, Osamah Hamouda e, Daniel Struck f, Jurgen Vercauteren g, Annemarie Wensing h,Ivailo Alexiev i, Birgitta Åsjö j, Claudia Balotta k, Perpétua Gomes l, Ricardo J. Camacho g, Suzie Coughlan m,Algirdas Griskevicius n, Zehava Grossman o, Anders Horban p, Leondios G. Kostrikis q, Snjezana J. Lepej r,Kirsi Liitsola s, Marek Linka t, Claus Nielsen u, Dan Otelea v, Roger Paredes w, Mario Poljak x,Elizabeth Puchhammer-Stöckl y, Jean Claude Schmit f, Anders Sönnerborg z,aa, Danica Staneková ab,Maja Stanojevic ac, Dora C. Stylianou q, Charles A.B. Boucher ad, on behalf of the SPREAD program,Georgios Nikolopoulos b, Tetyana Vasylyeva a, Samuel R. Friedman ae, David van de Vijver af,Gioacchino Angarano ag, Marie-Laure Chaix ah, Andrea de Luca ai, Klaus Korn aj, Clive Loveday ak,Vincent Soriano al, Sabine Yerly am, Mauricio Zazzi an, Anne-Mieke Vandamme g, Dimitrios Paraskevis b,⁎a Department of Zoology, University of Oxford, United Kingdomb Department of Hygiene, Epidemiology and Medical Statistics, Medical School, National and Kapodistrian University of Athens, Greecec Department of Microbiology, Tumor and Cell Biology, Karolinska Institutet, Stockholm, Swedend Department of Computational Biology, Max Planck Institute for Informatics, Saarbrücken, Germanye Robert Koch-Institute, Berlin, Germanyf Centre de Recherche Public de la Sante, Luxembourg, Luxembourgg Clinical and Epidemiological Virology, Rega Institute for Medical Research, Department of Microbiology and Immunology, KU Leuven, Leuven, Belgiumh Department of Virology, University Medical Center, Utrecht, The Netherlandsi National Center of Infectious and Parasitic Diseases, Sofia, Bulgariaj University of Bergen, Bergen, Norwayk University of Milan, Milan, Italyl Molecular Biology Lab, LMCBM, SPC, HEM, Centro Hospitalar de Lisboa Ocidental, Lisbon, Portugalm University College Dublin, Dublin, Irelandn Lithuanian AIDS Center, Vilnius, Lithuaniao Tel Aviv University, Tel Aviv, Israelp Hospital of Infectious Diseases, Warsaw, Polandq University of Cyprus, Nicosia, Cyprusr Department of Molecular Diagnostics and Flow Cytometry, University Hospital for Infectious Diseases “Dr. F. Mihaljevic”, Zagreb, Croatias National Institute of Health and Welfare, Helsinki, Finlandt National Reference Laboratory of AIDS, National Institute of Health, Prague, Czech Republicu Statens Serum Institute, Copenhagen, Denmarkv National Institute for Infectious Diseases “Prof. Dr. Matei Bals”, Bucharest, Romaniaw IrsiCaixa Foundation, Badalona, Spainx Slovenian HIV/AIDS Reference Centre, University of Ljubljana, Faculty of Medicine, Ljubljana, Sloveniay University of Vienna, Vienna, Austriaz Department of Clinical Microbiology, Karolinska University Hospital, Stockholm, Swedenaa Divisions of Infectious Diseases and Clinical Virology, Karolinska Institute, Stockholm, Swedenab Slovak Medical University, Bratislava, Slovakiaac University of Belgrade Faculty of Medicine, Belgrade, Serbiaad Erasmus MC, University Medical Center, Rotterdam, The Netherlandsae Institute of Infectious Diseases Research, National Development and Research Institutes, Inc., New York, USAaf Eijkman Winkler Institute, Department of Virology, University Medical Center Utrecht, Utrecht, The Netherlandsag University of Foggia, Foggia, Italyah Laboratoire de Virology, Hôpital Necker Paris, Franceai Institute of Clinical Infectious Diseases, Catholic university, Rome, Italyaj University of Erlangen, Erlangen, Germanyak International Clinical Virology Centre, Buckinghamshire, England, United Kingdomal Hospital Carlos III, Madrid, Spainam Geneva University Hospital, Geneva, Switzerlandan University of Siena, Siena, Italy
⁎ Correspondence to: G. Magiorkinis, Department of Zoology, University of Oxford, United Kingdom, and D. Paraskevis, Department of Hygiene, Epidemiology and Medical Statistics,Medical School, National and Kapodistrian University of Athens, Greece.
E-mail addresses: [email protected] (G. Magiorkinis), [email protected] (D. Paraskevis).
http://dx.doi.org/10.1016/j.meegid.2016.05.0411567-1348/© 2016 The Authors. Published by Elsevier B.V. This is an open access article under the CC BY license (http://creativecommons.org/licenses/by/4.0/).
Please cite this article as: Magiorkinis, G., et al., The global spread of HIV-1 subtype B epidemic, Infection, Genetics and Evolution (2016), http://dx.doi.org/10.1016/j.meegid.2016.05.041
2 G. Magiorkinis et al. / Infection, Genetics and Evolution xxx (2016) xxx–xxx
Please cite this article as: Magiorkinis, G., etdx.doi.org/10.1016/j.meegid.2016.05.041
a b s t r a c t
a r t i c l e i n f oArticle history:Received 29 February 2016Received in revised form 25 May 2016Accepted 31 May 2016Available online xxxx
Human immunodeficiency virus type 1 (HIV-1) was discovered in the early 1980s when the virus had alreadyestablished a pandemic. For at least three decades the epidemic in the Western World has been dominated bysubtype B infections, as part of a sub-epidemic that traveled from Africa through Haiti to United States. However,the pattern of the subsequent spread still remains poorly understood. Herewe analyze a large dataset of globallyrepresentative HIV-1 subtype B strains to map their spread around the world over the last 50 years and describesignificant spread patterns.We show that subtype B travelled fromNorth America toWestern Europe in differentoccasions, while Central/Eastern Europe remained isolated for the most part of the early epidemic. Looking withmore detail in European countries we see that the United Kingdom, France and Switzerland exchanged viral iso-lates with non-European countries thanwith European ones. The observed pattern is likely tomirror geopoliticallandmarks in the post-World War II era, namely the rise and the fall of the Iron Curtain and the European colo-nialism. In conclusion, HIV-1 spread through specificmigration routeswhich are consistent with geopolitical fac-tors that affected human activities during the last 50 years, such as migration, tourism and trade. Our findingssupport the argument that epidemic control policies should be global and incorporate political and socioeconom-ic factors.
© 2016 The Authors. Published by Elsevier B.V. This is an open access article under the CC BY license (http://creativecommons.org/licenses/by/4.0/).
Keywords:HIV-1Subtype BPhylogeographyMigration patternMigration
1. Introduction
Human immunodeficiency virus (HIV) was discovered in the early1980s (Barre-Sinoussi et al., 1983) when the virus had alreadyestablished a pandemic. For at least three decades the epidemic in theWestern World has been dominated by subtype B infections, as part ofa sub-epidemic that traveled from Africa to United States throughHaiti, and then to the rest of the world (Gilbert et al., 2007). ArchivalHIV sequences from the earliest known Haitian AIDS patients havehelped science to understand early events in the spread of HIV(Gilbert et al., 2007). Genetic analysis of the epidemiologically homoge-nous epidemic in the UnitedKingdom(UK) amongmenhaving sexwithmen (MSM) has revealed multiple introductions of the virus to thecountry and distinct subepidemics (Hue et al., 2005). Within Europe ithas been previously indicated that major tourist destinations haveserved as transmission outwards (Paraskevis et al., 2009), and also, asexpected, neighboring countries are more likely to exchange viralstrains than distant countries (Frentz et al., 2013). However, with theexception of local country-specific outbreaks and studies tracking thespread of the virus on a local scale, the global flow of subtype B duringthe last 30 years still remains to be charted.
With 0.3 mutations per genome per replication cycle in vitro(Mansky and Temin, 1995) and almost 40 mutations per genome perreplication cycle in vivo (Cuevas et al., 2015) HIV-1 is among the fastestevolving humanpathogens. Since the humanhost evolvesmuch slower,pathogen-host evolutionary conflicts have not, yet visibly affected thehost. HIV-1 has been infecting humans for less than 100 years, andmathematical models of the effect of HIV on human gene frequency in-dicate that it is unlikely to have shaped our evolution on these time-scales (Cromer et al., 2010). On the other hand, large-scale humanactivity should be reflected in the global spread and evolutionary pat-terns of the virus (host-to-parasite) as it has been documented forother pathogens (Paraskevis et al., 2013). Available molecular se-quences of the virus are an invaluable archive of the history of the epi-demic. Quantifying the viral flows generates hypotheses to be testedand assessed on the potential effects of international public healthmeasures.
HIV-1 has been extensively sequenced within part of the pol gene(protease, reverse transcriptase and integrase) mostly because this re-gion harbors resistance mutations against the most commonly usedantiretrovirals (protease, reverse transcriptase and integrase inhibitors)(Panel on Antiretroviral Guidelines for Adults and Adolescents, 2014;Rhee et al., 2003; Society, E.A.C., 2012; Vandamme et al., 2011). Despitethe abundance of available viral sequences there is no large-scale sys-tematicmolecular surveillance of HIV-1 spread becausemost sequencesare produced as part of routine clinical care and never published or de-posited in public sequence databases.We thus set out to build a globally
al., The global spread of HIV-1
representative HIV-1 subtype B dataset of pol gene sequences from pre-vious studies after a systematic search of the literature. Our aim is toclarify the global routes of the epidemic and understand how thesewere influenced by human activities over the last 50 years.
2. Materials and methods
2.1. Systematic collection of molecular sequences
2.1.1. Non-European datasetWe collected non-European HIV-1 subtype B sequences, through a
systematic bibliographic search in PubMed searching for molecular ep-idemiology or antiretroviral resistance studies for each country. Weused the following keywords for the bibliographic search: “HIV-1”, “mo-lecular epidemiology”, “resistance”, “subtype B” and “pol” in differentcombinations. We subsequently selected subtype B sequences fromthe retrieved studies to maximise representativeness and geographiccoverage both globally and within each country. More details on thebibliographic search, collection and selection of sequences are availablein Supplementary Information (SI).
2.1.2. European datasetThe European dataset included sequences from two different
sources: the Combined Analysis of Resistance Transmission over Timeof Chronically and Acute InfectedHIV Patients (CATCH) and the SPREAD(Strategy to Control SPREAD of HIV Drug Resistance) collaboration. TheCATCH study included 2208 antiretroviral naïve individuals from 18 Eu-ropean countries and Israel during 1996–2002 (Wensing et al., 2005).Of those, 1601 were newly diagnosed cases and 607 were chronicallyinfected patients, included in a retrospective setting. The prevalence ofsubtype B was 70% among the CATCH population (Wensing et al.,2005). Notably, although these data for 1996–2002 were retrospective-ly selected and pooled, they were originally collected as part of nationalsurveillance studies of the transmission of drug resistance or as part ofthe standard clinical practice of baseline sequencing for all newly diag-nosed cases in each participating center (Wensing et al., 2005). TheSPREAD study included 4480 newly diagnosed patients sampled during9/2002–12/2007 from 20 European countries and Israel. In the prospec-tive setting a standardised sampling strategy was designed to includerepresentative sampling from all countries (Vercauteren et al., 2009;Wensing et al., 2008). For the purpose of this study we included onlythose classified as subtype B from both the CATCH and the SPREADstudies.
In both studies all patients were older than 18 years and had not re-ceived antiretroviral therapy. More details on the sampling strategieshave been published previously (Vercauteren et al., 2009; Wensing etal., 2005, 2008). The sampling countries and the number of sequences
subtype B epidemic, Infection, Genetics and Evolution (2016), http://
3G. Magiorkinis et al. / Infection, Genetics and Evolution xxx (2016) xxx–xxx
per country after down-sampling are described in Table S1 in the sup-plemental material.
2.2. Details of the phylogeographic analyses
2.2.1. Multiple sequence alignments and phylogenetic analysisWe aligned the HIV-1 sequences using ClustalW (version 1.82) and
then manually corrected the alignment according to the encoded read-ing frame using MEGA5 (Hall, 2013). To avoid potential biases to ouranalysis resulting from convergent evolution due to selection of resis-tant isolates by antiretroviral treatment, we discarded codon positionsknown to confer antiretroviral resistance (PR: 30, 32, 33, 46, 47, 48,50, 54, 76, 82, 84, 88, 90, and RT: 41, 62, 65, 67, 69, 70, 74, 75, 77, 100,103, 106,108, 115, 116, 151, 181, 184, 188, 190, 210, 215, 219, 225,236) (Lewis et al., 2008). The final alignment consisted of 222 codonsand covers positions 2283–3191 of the HXB2 strain.
We estimated a phylogenetic tree from the nucleotide sequencealignment using ML under the general time-reversible (GTR) model ofnucleotide substitution, including a G distributed rate of heterogeneityamong sites as implemented in RAxML (Stamatakis, 2006; Stamatakiset al., 2008). We also estimated ML trees on 250 bootstrapped align-ments to use on our subsequent phylogeographic analysis. We didn'tuse a higher number of bootstrap replicates because the calculationswould be computationally expensive. Trees were rooted at themidpoint.
2.2.2. Phylogeographic analysesWe used the bootstrap trees to estimate HIV-1 migration events
among geographic regions with the parsimony approach described bySlatkin and Maddison, as implemented in PAUP* 4.0 (Slatkin andMaddison, 1989). Specifically, we assigned the tips of the inferredtrees with a character according to the geographic origin of the patient(e.g. 0, 1, 2 for Austria, Belgium, Denmark, respectively, etc.). The viralmigration events between different areas were estimated by DELTRANoptimization using only unambiguously reconstructed ancestral states.We provide more details in SI.
We were not able to implement a method that combines molecularclock and phylogeography such as the one used in BEAST; the largenumber of geographic regions along with the higher number of se-quences make the analysis to be extremely computationally intensive(Lemey et al., 2009) and the sampling of the Bayesian Markov Chainsdid not converge (data not shown). On the other hand, a significant pro-portion of the sequences do not have isolation date, thus for a combinedmolecular clock-phylogeographic analysis we would have to discard asignificant amount of our dataset reducing the representativeness ofour sampling. Consequently, given that previous comparisons betweenparsimony and Bayesian analyses showed that a parsimony-based ap-proach provides reasonably similar scenarios of geographic migration(Lemey et al., 2009) and have been widely used for similar analyses(Angelis et al., 2015; Paraskevis et al., 2009; Wallace et al., 2007), wechose the parsimony approach because it is feasible and provides rea-sonably accurate results by taking advantage of themost representativedataset.
2.2.3. Steps of analysisWe performed the following phylogeographic analyses to identify
viral transmission pathways:
1) Viral migration between large geographic areas. We grouped theviral strains in geographic areas, namely North America, Europe,Central & South America, Caribbean, Africa, Asia and Oceania. Sincesubtype B has a very low prevalence in many non-Western coun-tries, the geographical regions of Africa, Asia and Oceania could notbe further subdivided due to a lack of available sequences. Weshould note that in terms of the global HIV-1 epidemiology itwould make sense to further split some geographic regions
Please cite this article as: Magiorkinis, G., et al., The global spread of HIV-1dx.doi.org/10.1016/j.meegid.2016.05.041
(similarly to North and South America), for example Africa couldbe split into North and sub-Saharan regions. However, subtype Bhas very low prevalence in non-Western countries resulting intolow availability of sequences from these areas. Thus, we did not seg-regate further these regions, as it would then diminish statisticalpower. We provide detailed geographic sampling of the sequencesin Table S1 and we pinpoint that spread inferences in low-preva-lence geographic regions should be interpreted with caution not togeneralize the result over the full geographic region, but to think ofthem as proxies of the global viral flow around the world (SI).
2) We repeated the above analysis by dividing Europe into Westernand Central/Eastern Europe (WHO criteria) (see SI).
3) Viralmigration between geographic areas (North America, Central &South America, Caribbean, Africa, Asia, Oceania) and Europeancountries.
4) Viral migration within Europe. Only the European viral strains wereused to infer migration routes among the European countries.
2.2.4. Statistical phylogeography: taking into account sources of uncertain-ty in inferring migration events
We estimated which migration pathways were significantly differ-ent from the expected pathways under the null hypothesis of fullgeographic mixing (panmixis) of HIV-1 sequences. Thus, significancebecomes independent from prevalence, and countries with a largernumber of migration events can have non-significant migration if theyhave a high prevalence. Significance was established when the distribu-tion of the migration events inferred from the 250 bootstrap trees wasstatistically different from the distribution of the events inferred fromthe same set of trees (N = 250) in each pathway after randomlyreshuffling taxa at the tips as described previously (Angelis et al.,2015; Paraskevis et al., 2009). In a full geographicmixing case, an infect-ed individual would have the same probability to transmit the HIV-1 toany other healthy individual, and all individuals are just as likely toshare closely related viruses. Thus, a random reshuffling of taxa at thetips would simulate a tree inferred from such a population. Thereshuffling was performed in the Mesquite program (Maddison andMaddison, 2015).We assessed equality of means between the observedand the expected migration events by means of one-sided Mann–Whitney test and adjusted the level of significance according toBonferroni correction for multiple comparisons (for 32 localities wehave 992 possible pathways/comparisons). We finally estimated theratio between the observed and the expected value under the panmixishypothesis (referred to as observed/expected ratio), which provides aquantitativemetric of the relative spread of the virus between countriescorrecting for potential sampling bias due to unequal number of strainsper country. Higher ratios suggest higher levels of viral exchange amonglocations.We randomly down-sampled (datasets I and II, see SI) and re-peated all analyses (1) - (4) twice to assess robustness of the results.Only results from the first run are reported.
2.2.5. Force of migration: a summary migration indexWe summarize the exporting and importingmigration for each geo-
graphic region using a newmetricwhichwe call Force ofMigration (FM)and is defined as:
FM ¼ ME � EMI � I
;
where E is the number of significantly exporting pathways that a regionhas, ME is the total number of migration events from these exportingpathways, I is the number of significantly importing pathways that theregion has and MI is the total number of migration events from thoseimporting pathways.
To create null distribution of migration indexes we have generatedphylogeographic matrices from the randomly reshuffled (panmictic)phylogenies as described above (randomly-generated matrices). These
subtype B epidemic, Infection, Genetics and Evolution (2016), http://
4 G. Magiorkinis et al. / Infection, Genetics and Evolution xxx (2016) xxx–xxx
panmictic matrices represent the case where the sequences included inthe phylogenies do not come from a geographic structure, thus the ob-served migration can be simply explained by free randommove withinthe same locality. To estimate the distribution of FMwe compare each ofthe bootstrap-generated migration matrices with one randomly select-edmatrix from the set of the randomly-generatedmatrices. If a cell (mi-gration counts) of the bootstrap-generated matrix contains moremigration events than the respective cell of the randomly-generatedmatrix we consider it to be significant and include it in the calculationof the FM. We thus obtain 250 FM values (for each geographic region),which correspond to the distribution of the observed FM. To generate anull distribution of FM values we compare each one of randomly-gener-ated matrices against a randomly chosen matrix from the rest of therandomly-generated matrices. We thus obtain 250 FM values (for eachgeographic region), which correspond to the null (expected) distribu-tion of FM. We test if the observed values of FM differ significantlyfrom the expected distribution of FM by means of the Mann–Whitneytest taking into account multiple comparisons (Bonferroni correction).We use this metric to classify whether a geographical unit is activelyspreading (“outward”) or passively receiving (“inward”) the subtype Bepidemic.
2.2.6. Non-European connectivity indexTo estimate if a Western European country is more connected with
non-European regions than expected we calculate for each WesternEuropean country an out-of-Europe export index as follows:
Cn ¼ total number of significant migration events to non‐European targetsð Þtotal number of significant migration events to European targetsð Þ
We calculate this index for the observed and the expected(bootstrapped) phylogeographies and then we statistically test using aMann–Whitney test if the observed index is higher than the expected(this being equivalent to testing whether the ratio of the observed/ex-pected is higher than 1). For simplicity we summarized the propensityto export more by producing the ratio of the observed Cn versus the ex-pected Cn (Fig. S4 in the supplemental material); ratio higher than 1means the country exportsmore to non-European regions than to Euro-peans than randomly expected.
2.3. Molecular clock analysis
We estimated the time to Most Recent Common Ancestor (tMRCA)for five clusters of sequences from Central and Eastern Europe includingreference sequenceswith known sampling dates.We focused onmono-phyletic clusters from C.E. European countries were geographicallydefined phylogenetic clusters including ≥75%of sequences fromC.E. Eu-rope. These clusters were selected in order to estimate the tMRCA of theregional epidemics spreading in this area. To increase the samplingwin-dow of sequences from C.E. Europe, we included 9 sequences sampledfrom North America, Europe and Asia (sampling period between 1983and 2004).We used a Bayesian approach as implemented in BEAST ver-sion 1.8.0 (Drummond and Rambaut, 2007) with a GTR + G model ofnucleotide substitution. We used the uncorrelated lognormal relaxedclock model (Drummond et al., 2006) with TipDates and a non-para-metric coalescent approach (Bayesian skyline) (Drummond andRambaut, 2007). Markov chain Monte Carlo (MCMC) was run 2 timesfor each cluster for 30× 106 generationswith a burn in of 30 × 105 sam-pling every 1000 iterations. For the largest cluster (n=230 sequences)MCMCwas run for 90× 106 generationswith a burn in of 20× 106, sam-pling every 1000 generations. Convergence was assessed using Tracerv1.5 (Rambaut et al., 2013-12-11) and an Estimated Sample Size (ESS)larger than 200. The consensus tree for each run was estimated by theTreeAnnotator program (Drummond and Rambaut, 2007).
Please cite this article as: Magiorkinis, G., et al., The global spread of HIV-1dx.doi.org/10.1016/j.meegid.2016.05.041
3. Results
Wefirst use thenucleotide alignment to reconstruct thephylogenet-ic relationships among viral strains. We take into account phylogeneticuncertainty by estimating several phylogenetic trees viamaximum like-lihood (ML) method using bootstrap resampling. We then assign geo-graphic sampling information at the tips of the bootstrap trees andreconstruct the pastmovement of the viral strains across the geographicregions by estimating the number and direction of viral migrationevents using parsimony (Slatkin and Maddison, 1989). We then usethis information to identify viral migration routes and test for their sta-tistical significance. Different geographical grouping strategies of theviral strains are used in order to track the viral spread in different spatialscales and to assess robustness of the inferred transmission patterns.We also introduce new metrics to classify specific geographic regionsinto “outward” (regions where HIV mostly departed from), “inward”(regions that mostly received HIV) or “isolated” (regions where HIV ex-change with other regions was much lower) and explore viral connec-tivity links among particular areas. Finally we test our results forepidemiological consistency and date sampling bias.
3.1. Source of data
We pooled HIV-1 pol gene sequences from three sources, two Euro-pean cohort sequence databases (see European dataset inMaterials andmethods) and a dataset with publicly available sequences, whichwe se-lected through a systematic search of the literature (see Non-Europeandataset inMaterials andmethods) (Vercauteren et al., 2009;Wensing etal., 2005, 2008). In total we collected 10,078 sequences from 78 coun-tries representing the vast majority of countries that are affected bythe subtype B global pandemic (Table S4).
3.2. Patterns of regional clustering inferred by phylogenetic analysis
We used our subtype B alignment (Dataset I, Table S1) to estimate aML phylogenetic tree and we colored its viral clades in different colorsaccording to sampling location in order to infer phylogenetic relation-ships among viral strains from different sampling locations. The globalcolored phylogeographic trees show that European strains tend to clus-ter together, whereas North American strains are very dispersed amongthe global genetic diversity (Fig. 1A). More specifically, 1787 HIV-1 se-quences, that is 44% of the total European sampled population (N =4020) (Fig. 1C), were included in a single clade; 71% of the sequencesin this large clade were sampled from Western Europe (N = 1274)(Fig. 1A, Subcluster 1). We also detected another mainly Europeanclade, which included strains from both Western and Central/EasternEurope (Fig. 1A, Subcluster 2). Asian and Caribbean sequences showedclustering patterns and formed several clades in away similar to Europe(Fig. 1A). In contrast, North and Central & SouthAmerican lineageswerewidely distributed across the global phylogeny suggesting that HIV-1spread is higher between these areas and the rest of the world. NorthAmerican strains tend to be closer to the root than groups of sequencesfound in multiple other areas (i.e. shown in white and red color inFig. 1A and B, respectively). In the phylogeographic tree (Fig. 1C) withisolates categorized in European and non-European groups we seethat European specific clades seem to be nested within non-Europeanfounders.
A phylogeographic treemight only be suggestive of globalmigrationpatterns and can provide only limited quantitative information of viralspread among countries. Crucially, statistical support of clades withbootstrap values in these trees is expected to be low due to the highnumber of closely related sequences included in the analyses(Sanderson and Wojciechowski, 2000), which does not allow for infer-ence of source-sink patterns. Thus, in order to evaluate viral spread weuse a statistical phylogeography approach, which provides a formal
subtype B epidemic, Infection, Genetics and Evolution (2016), http://
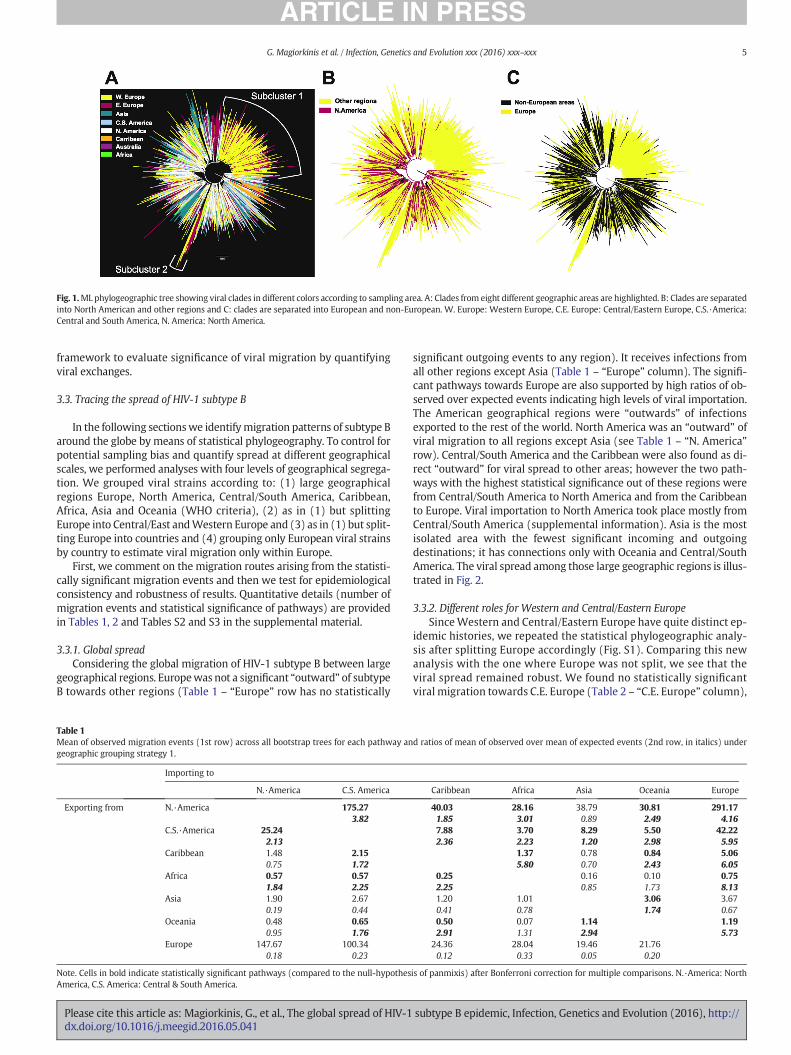
Fig. 1.ML phylogeographic tree showing viral clades in different colors according to sampling area. A: Clades from eight different geographic areas are highlighted. B: Clades are separatedinto North American and other regions and C: clades are separated into European and non-European. W. Europe: Western Europe, C.E. Europe: Central/Eastern Europe, C.S.·America:Central and South America, N. America: North America.
5G. Magiorkinis et al. / Infection, Genetics and Evolution xxx (2016) xxx–xxx
framework to evaluate significance of viral migration by quantifyingviral exchanges.
3.3. Tracing the spread of HIV-1 subtype B
In the following sectionswe identifymigration patterns of subtype Baround the globe bymeans of statistical phylogeography. To control forpotential sampling bias and quantify spread at different geographicalscales, we performed analyses with four levels of geographical segrega-tion. We grouped viral strains according to: (1) large geographicalregions Europe, North America, Central/South America, Caribbean,Africa, Asia and Oceania (WHO criteria), (2) as in (1) but splittingEurope into Central/East andWestern Europe and (3) as in (1) but split-ting Europe into countries and (4) grouping only European viral strainsby country to estimate viral migration only within Europe.
First, we comment on the migration routes arising from the statisti-cally significant migration events and then we test for epidemiologicalconsistency and robustness of results. Quantitative details (number ofmigration events and statistical significance of pathways) are providedin Tables 1, 2 and Tables S2 and S3 in the supplemental material.
3.3.1. Global spreadConsidering the global migration of HIV-1 subtype B between large
geographical regions. Europewas not a significant “outward” of subtypeB towards other regions (Table 1 – “Europe” row has no statistically
Table 1Mean of observed migration events (1st row) across all bootstrap trees for each pathway angeographic grouping strategy 1.
Importing to
N.·America C.S. America
Exporting from N.·America 175.273.82
C.S.·America 25.242.13
Caribbean 1.48 2.150.75 1.72
Africa 0.57 0.571.84 2.25
Asia 1.90 2.670.19 0.44
Oceania 0.48 0.650.95 1.76
Europe 147.67 100.340.18 0.23
Note. Cells in bold indicate statistically significant pathways (compared to the null-hypothesAmerica, C.S. America: Central & South America.
Please cite this article as: Magiorkinis, G., et al., The global spread of HIV-1dx.doi.org/10.1016/j.meegid.2016.05.041
significant outgoing events to any region). It receives infections fromall other regions except Asia (Table 1 – “Europe” column). The signifi-cant pathways towards Europe are also supported by high ratios of ob-served over expected events indicating high levels of viral importation.The American geographical regions were “outwards” of infectionsexported to the rest of the world. North America was an “outward” ofviral migration to all regions except Asia (see Table 1 – “N. America”row). Central/South America and the Caribbean were also found as di-rect “outward” for viral spread to other areas; however the two path-ways with the highest statistical significance out of these regions werefrom Central/South America to North America and from the Caribbeanto Europe. Viral importation to North America took place mostly fromCentral/South America (supplemental information). Asia is the mostisolated area with the fewest significant incoming and outgoingdestinations; it has connections only with Oceania and Central/SouthAmerica. The viral spread among those large geographic regions is illus-trated in Fig. 2.
3.3.2. Different roles for Western and Central/Eastern EuropeSinceWestern and Central/Eastern Europe have quite distinct ep-
idemic histories, we repeated the statistical phylogeographic analy-sis after splitting Europe accordingly (Fig. S1). Comparing this newanalysis with the one where Europe was not split, we see that theviral spread remained robust. We found no statistically significantviral migration towards C.E. Europe (Table 2 – “C.E. Europe” column),
d ratios of mean of observed over mean of expected events (2nd row, in italics) under
Caribbean Africa Asia Oceania Europe
40.03 28.16 38.79 30.81 291.171.85 3.01 0.89 2.49 4.167.88 3.70 8.29 5.50 42.222.36 2.23 1.20 2.98 5.95
1.37 0.78 0.84 5.065.80 0.70 2.43 6.05
0.25 0.16 0.10 0.752.25 0.85 1.73 8.131.20 1.01 3.06 3.670.41 0.78 1.74 0.670.50 0.07 1.14 1.192.91 1.31 2.94 5.73
24.36 28.04 19.46 21.760.12 0.33 0.05 0.20
is of panmixis) after Bonferroni correction for multiple comparisons. N.·America: North
subtype B epidemic, Infection, Genetics and Evolution (2016), http://
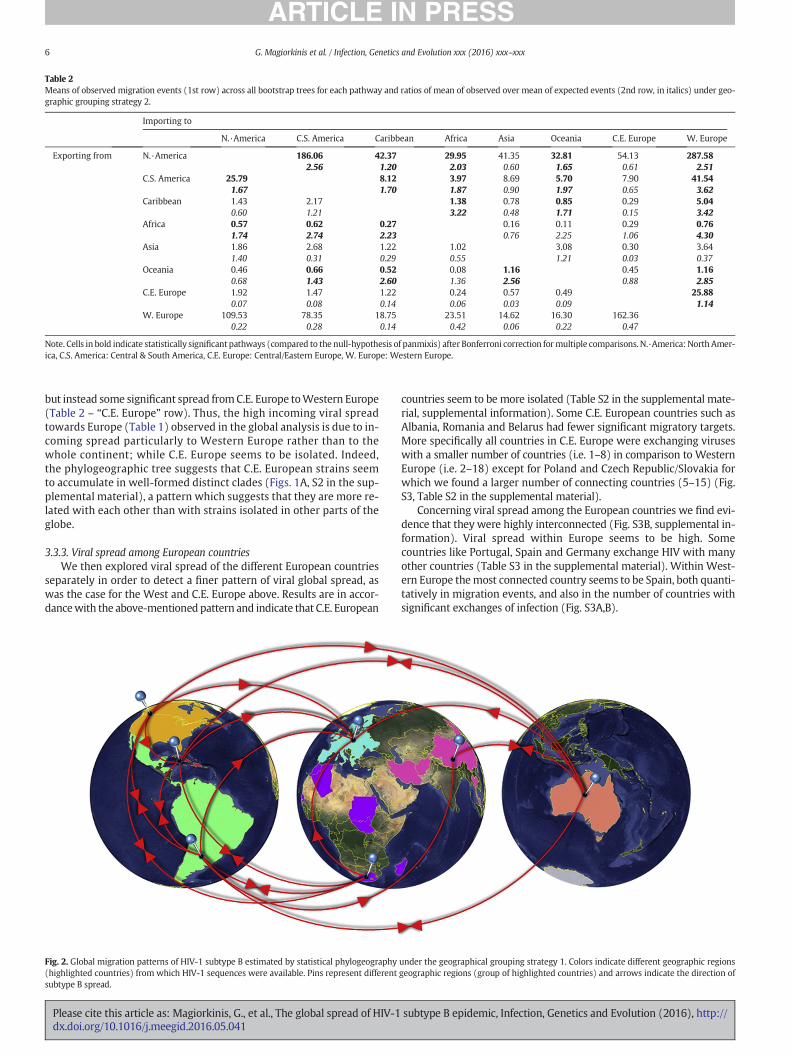
Table 2Means of observed migration events (1st row) across all bootstrap trees for each pathway and ratios of mean of observed over mean of expected events (2nd row, in italics) under geo-graphic grouping strategy 2.
Importing to
N.·America C.S. America Caribbean Africa Asia Oceania C.E. Europe W. Europe
Exporting from N.·America 186.06 42.37 29.95 41.35 32.81 54.13 287.582.56 1.20 2.03 0.60 1.65 0.61 2.51
C.S. America 25.79 8.12 3.97 8.69 5.70 7.90 41.541.67 1.70 1.87 0.90 1.97 0.65 3.62
Caribbean 1.43 2.17 1.38 0.78 0.85 0.29 5.040.60 1.21 3.22 0.48 1.71 0.15 3.42
Africa 0.57 0.62 0.27 0.16 0.11 0.29 0.761.74 2.74 2.23 0.76 2.25 1.06 4.30
Asia 1.86 2.68 1.22 1.02 3.08 0.30 3.641.40 0.31 0.29 0.55 1.21 0.03 0.37
Oceania 0.46 0.66 0.52 0.08 1.16 0.45 1.160.68 1.43 2.60 1.36 2.56 0.88 2.85
C.E. Europe 1.92 1.47 1.22 0.24 0.57 0.49 25.880.07 0.08 0.14 0.06 0.03 0.09 1.14
W. Europe 109.53 78.35 18.75 23.51 14.62 16.30 162.360.22 0.28 0.14 0.42 0.06 0.22 0.47
Note. Cells in bold indicate statistically significant pathways (compared to the null-hypothesis of panmixis) after Bonferroni correction formultiple comparisons. N.·America: North Amer-ica, C.S. America: Central & South America, C.E. Europe: Central/Eastern Europe, W. Europe: Western Europe.
6 G. Magiorkinis et al. / Infection, Genetics and Evolution xxx (2016) xxx–xxx
but instead some significant spread fromC.E. Europe toWestern Europe(Table 2 – “C.E. Europe” row). Thus, the high incoming viral spreadtowards Europe (Table 1) observed in the global analysis is due to in-coming spread particularly to Western Europe rather than to thewhole continent; while C.E. Europe seems to be isolated. Indeed,the phylogeographic tree suggests that C.E. European strains seemto accumulate in well-formed distinct clades (Figs. 1A, S2 in the sup-plemental material), a pattern which suggests that they are more re-lated with each other than with strains isolated in other parts of theglobe.
3.3.3. Viral spread among European countriesWe then explored viral spread of the different European countries
separately in order to detect a finer pattern of viral global spread, aswas the case for the West and C.E. Europe above. Results are in accor-dancewith the above-mentioned pattern and indicate that C.E. European
Fig. 2. Global migration patterns of HIV-1 subtype B estimated by statistical phylogeography(highlighted countries) from which HIV-1 sequences were available. Pins represent differentsubtype B spread.
Please cite this article as: Magiorkinis, G., et al., The global spread of HIV-1dx.doi.org/10.1016/j.meegid.2016.05.041
countries seem to be more isolated (Table S2 in the supplemental mate-rial, supplemental information). Some C.E. European countries such asAlbania, Romania and Belarus had fewer significant migratory targets.More specifically all countries in C.E. Europe were exchanging viruseswith a smaller number of countries (i.e. 1–8) in comparison to WesternEurope (i.e. 2–18) except for Poland and Czech Republic/Slovakia forwhich we found a larger number of connecting countries (5–15) (Fig.S3, Table S2 in the supplemental material).
Concerning viral spread among the European countries we find evi-dence that they were highly interconnected (Fig. S3B, supplemental in-formation). Viral spread within Europe seems to be high. Somecountries like Portugal, Spain and Germany exchange HIV with manyother countries (Table S3 in the supplemental material). Within West-ern Europe themost connected country seems to be Spain, both quanti-tatively in migration events, and also in the number of countries withsignificant exchanges of infection (Fig. S3A,B).
under the geographical grouping strategy 1. Colors indicate different geographic regionsgeographic regions (group of highlighted countries) and arrows indicate the direction of
subtype B epidemic, Infection, Genetics and Evolution (2016), http://
7G. Magiorkinis et al. / Infection, Genetics and Evolution xxx (2016) xxx–xxx
3.3.4. Quantification of viral migration: “outwards”, “inwards” and “isolated”regions
We introduced a simple metric (Force of Migration or FM, seeMaterials and methods) to quantify if a geographical unit (whether itis a region or a country) is actively spreading or passively receivingviral migrations. FM is larger for geographic units that have moreexporting targets and associated exportingmigration events, and small-er for geographic units that havemore importing targets and associatedmigration events. We test the statistical significance (corrected formultiple comparisons with the Bonferroni formula) of FM for eachgeographic unit against a simulated distribution assuming randomexporting and importing events. We categorize a geographical unit asan “outward” if it spreads viral strains more than expected, “inward” ifit receives viral strains more than expected and “isolated” if it isexchanging viral strains with other regions less than expected. Wecomment on the most striking findings of FM from each of the above-mentioned geographic segregations.
In the analysis wherewe considered Europe to be a single geograph-ic region, N. America had (median) FM = 61.59 which is 113 timeshigher than what expected by chance (expected FM = 0.543,p b 0.001), so it is an “outward” of viral migration, Europe is a sinkFM = 0 much less than the expected value FM = 26.54, p b 0.001.When we separate Europe into West and Central/East, N. America stillremains an “outward” (FM=58.67, 45 timeshigher, p b 0.001),WesternEurope remains a sink (FM=0, expected FM=12.62, p b 0.001), but C.E.Europe is “isolated”with no significant exporting or importing viral mi-gration. We note that FM cannot be determined for “isolated” regionsdue to zeros in both nominator and denominator, but the statistical sig-nificance for being “isolated” can be estimated by comparing the distri-bution of the non-significant events in the observed against thesimulated trees. We found that 247 out of 250 trees showed no signifi-cant migrations in the observed dataset (i.e. the phylogenetic trees ofthe bootstrapped alignment), while only 19 out of 250 simulated treeshad no significant events (p b 0.001, significant for multiple testing).
To address whether the above pattern for N. America is biased byearlier sampling dates for N. American strains, we repeated the sameanalysis (with Europe as a single region) on a dataset where we ran-domly subsampled sequences to keep the ratio of European to N. Amer-ican isolates at 2:1 for each sampling year (i.e. to keep roughly the sameoverall ratio as in the large dataset). The N. American FM was smallerthan when we do not account for sampling date, but still much higherthan expected (28 times, p b 0.001); same for the European FM = 0(again much lower than expected, p b 0.001). Thus, the observedpattern of N. America being an outward and Europe being an inwardis robust with respect to sampling date.
3.4. Exceptions to the Western European “sink”
Since Western Europe was found to be a sink, we analysed whetherthere are any countries within Western Europe deviated from this pat-tern i.e. are more connected to non-European countries. We made anindex that is equal to the ratio of the observed total migration events(importing and exporting) to non-European divided by the total migra-tion events to European regions. This ratio if larger than 1 indicatesthat a country ismore connected to non-European countries than to Eu-ropean ones and can be tested for its statistical significance against theratio expected by chance with a standard non-parametric test (Mann–Whitney test to compare observed against expected). Three countrieswere found to have a large significant ratio, more specifically the UnitedKingdom (ratio = 1.8), Switzerland (ratio = 1.6) and France (ratio =1.5) (all having p b 0.001, significant formultiple comparisons) (Fig. S4).
3.5. Dating the establishment of epidemics in the C.E. European “isolation”
Even though C.E. Europe was found to be “isolated” it must havebeen seededwith subtype B at some point in time. We, thus, performed
Please cite this article as: Magiorkinis, G., et al., The global spread of HIV-1dx.doi.org/10.1016/j.meegid.2016.05.041
phylodynamic analysis in fivemajormonophyletic clusters from this re-gion. These clusters consisted of 10, 21, 38, 67 and 230 sequences fromSlovenia (cluster I), Slovenia/Bulgaria (cluster II), Slovenia (cluster III),Romania (cluster IV), and Poland/Bulgaria/Ukraine (cluster V), respec-tively. The estimated time of the most recent common ancestor(tMRCA) corresponding approximately to the time of the origin ofHIV-1 epidemic in these areas ranged between 1987 and 2001 (medianestimates). Cluster I was estimated to be the most recent, with estimat-ed tMRCA in 2001 (median value, 95% Higher Posterior Density HPD:1999–2003). For clusters II and III tMRCA was estimated in 1989 (95%HPD: 1984–1993) and 1996 (95% HPD: 1992–1999), respectively. Forthe largest one (cluster V) including HIV-1 sequences from Poland,Bulgaria and Ukraine the tMRCA was in 1987 (95% HPD: 1982–1990).Finally for cluster IV fromRomania the date of themost recent commonancestor was previously estimated in 1991 (95%HPD: 1983–1999)(Stanojevic et al., 2012).
3.6. Viral migration is epidemiologically consistent
As a final step of our analyses we wished to evaluate whether viralmigration, as we quantified it with statistical phylogeography, is consis-tent with known epidemiologic surveillance. Standard mathematicalmodels predict that transmission is higher in populationswithmore in-fected individuals suggesting that countries with higher number of in-fected persons should drive viral migration to other countries or, inother words, be more prone to a spillover effect (Anderson and May,1991; Grassly and Fraser, 2008; Keeling and Rohani, 2008). Thus, wewould expect countries with higher number of prevalent cases to bemore likely to provide spillovers to other countries. To examine wheth-er our analyses is consistent with this expectation, we estimated thecountry-specific number of HIV subtype B infections by multiplyingthe total number of people living with HIV-1 per country until 2011,based on the UNAIDS figures (www.unaids.org), by the percentage ofsubtype B in each country (Abecasis et al., 2013; Avi et al., 2009;Balode et al., 2012; Ciccozzi et al., 2005; Ivanov et al., 2013; Saad et al.,2006; Stanojevic et al., 2012; Ustina et al., 2001). We then examinedthe association between the number of HIV subtype B infections percountry/region and the number of countries that each country/regionexported viral strains in analysis (4) by running a regression analysis.We log-transformed the number of subtype B infections per country/re-gion because its distribution among countries/regions is skewed; 6 outof 24 countries/regions with the most HIV-1 subtype B prevalent cases(these are UK, France, Italy/Ireland, Spain, Ukraine, Germany) accountfor more than 80% of the subtype B infections in Europe as a typicallong-tail distribution.
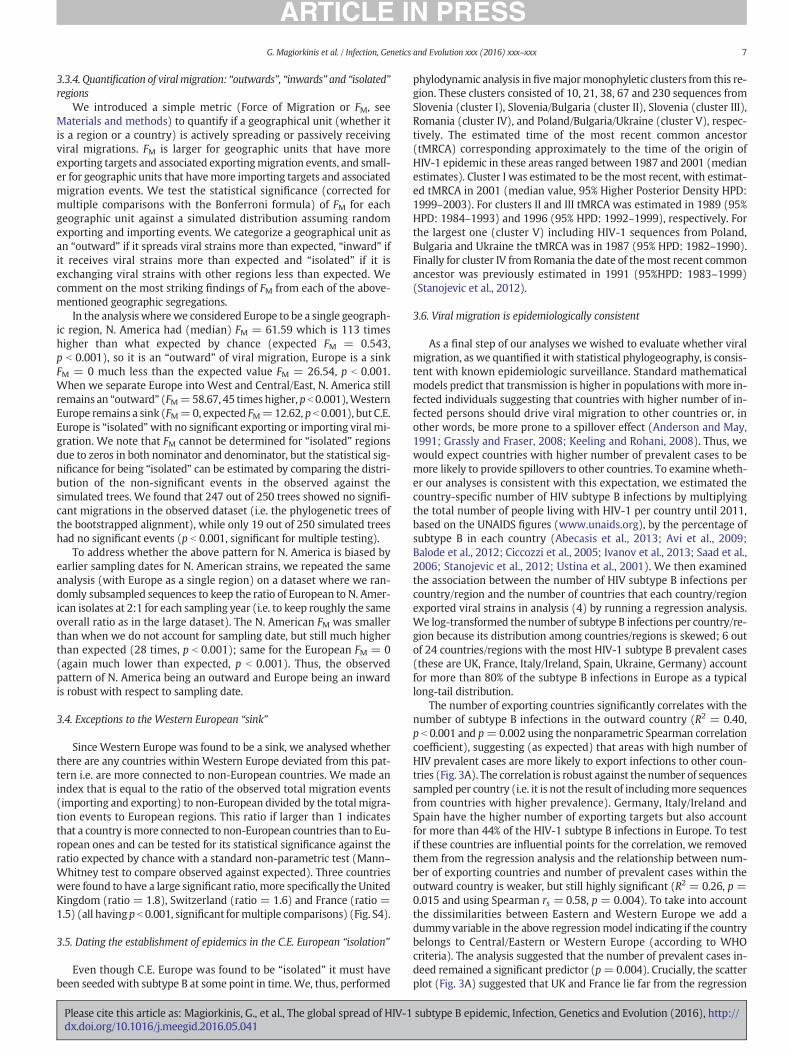
The number of exporting countries significantly correlates with thenumber of subtype B infections in the outward country (R2 = 0.40,p b 0.001 and p=0.002 using the nonparametric Spearman correlationcoefficient), suggesting (as expected) that areas with high number ofHIV prevalent cases are more likely to export infections to other coun-tries (Fig. 3A). The correlation is robust against the number of sequencessampled per country (i.e. it is not the result of includingmore sequencesfrom countries with higher prevalence). Germany, Italy/Ireland andSpain have the higher number of exporting targets but also accountfor more than 44% of the HIV-1 subtype B infections in Europe. To testif these countries are influential points for the correlation, we removedthem from the regression analysis and the relationship between num-ber of exporting countries and number of prevalent cases within theoutward country is weaker, but still highly significant (R2 = 0.26, p =0.015 and using Spearman rs = 0.58, p = 0.004). To take into accountthe dissimilarities between Eastern and Western Europe we add adummy variable in the above regressionmodel indicating if the countrybelongs to Central/Eastern or Western Europe (according to WHOcriteria). The analysis suggested that the number of prevalent cases in-deed remained a significant predictor (p=0.004). Crucially, the scatterplot (Fig. 3A) suggested that UK and France lie far from the regression
subtype B epidemic, Infection, Genetics and Evolution (2016), http://
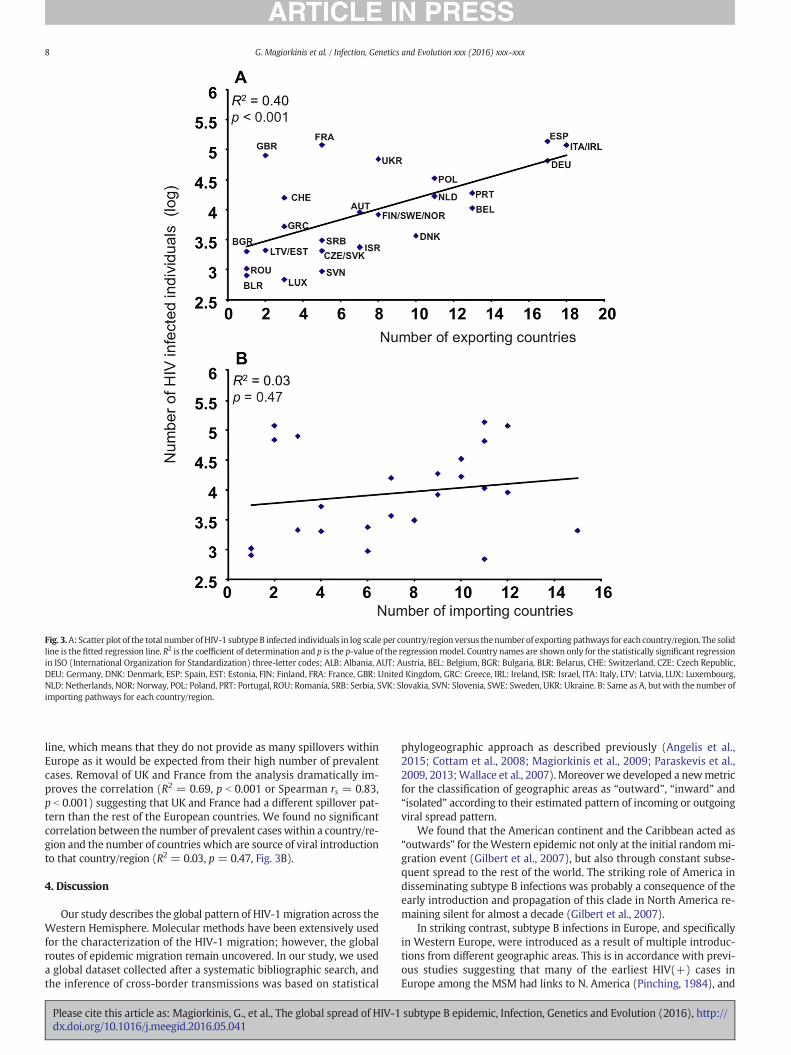
Fig. 3.A: Scatter plot of the total number ofHIV-1 subtype B infected individuals in log scale per country/region versus thenumber of exporting pathways for each country/region. The solidline is the fitted regression line. R2 is the coefficient of determination and p is the p-value of the regressionmodel. Country names are shown only for the statistically significant regressionin ISO (International Organization for Standardization) three-letter codes; ALB: Albania, AUT: Austria, BEL: Belgium, BGR: Bulgaria, BLR: Belarus, CHE: Switzerland, CZE: Czech Republic,DEU: Germany, DNK: Denmark, ESP: Spain, EST: Estonia, FIN: Finland, FRA: France, GBR: United Kingdom, GRC: Greece, IRL: Ireland, ISR: Israel, ITA: Italy, LTV: Latvia, LUX: Luxembourg,NLD: Netherlands, NOR: Norway, POL: Poland, PRT: Portugal, ROU: Romania, SRB: Serbia, SVK: Slovakia, SVN: Slovenia, SWE: Sweden, UKR: Ukraine. B: Same as A, but with the number ofimporting pathways for each country/region.
8 G. Magiorkinis et al. / Infection, Genetics and Evolution xxx (2016) xxx–xxx
line, which means that they do not provide as many spillovers withinEurope as it would be expected from their high number of prevalentcases. Removal of UK and France from the analysis dramatically im-proves the correlation (R2 = 0.69, p b 0.001 or Spearman rs = 0.83,p b 0.001) suggesting that UK and France had a different spillover pat-tern than the rest of the European countries. We found no significantcorrelation between the number of prevalent caseswithin a country/re-gion and the number of countries which are source of viral introductionto that country/region (R2 = 0.03, p = 0.47, Fig. 3B).
4. Discussion
Our study describes the global pattern of HIV-1 migration across theWestern Hemisphere. Molecular methods have been extensively usedfor the characterization of the HIV-1 migration; however, the globalroutes of epidemic migration remain uncovered. In our study, we useda global dataset collected after a systematic bibliographic search, andthe inference of cross-border transmissions was based on statistical
Please cite this article as: Magiorkinis, G., et al., The global spread of HIV-1dx.doi.org/10.1016/j.meegid.2016.05.041
phylogeographic approach as described previously (Angelis et al.,2015; Cottam et al., 2008; Magiorkinis et al., 2009; Paraskevis et al.,2009, 2013;Wallace et al., 2007).Moreoverwe developed a newmetricfor the classification of geographic areas as “outward”, “inward” and“isolated” according to their estimated pattern of incoming or outgoingviral spread pattern.
We found that the American continent and the Caribbean acted as“outwards” for theWestern epidemic not only at the initial randommi-gration event (Gilbert et al., 2007), but also through constant subse-quent spread to the rest of the world. The striking role of America indisseminating subtype B infections was probably a consequence of theearly introduction and propagation of this clade in North America re-maining silent for almost a decade (Gilbert et al., 2007).
In striking contrast, subtype B infections in Europe, and specificallyin Western Europe, were introduced as a result of multiple introduc-tions from different geographic areas. This is in accordance with previ-ous studies suggesting that many of the earliest HIV(+) cases inEurope among the MSM had links to N. America (Pinching, 1984), and
subtype B epidemic, Infection, Genetics and Evolution (2016), http://
9G. Magiorkinis et al. / Infection, Genetics and Evolution xxx (2016) xxx–xxx
also that independent introductions from N. America to Europe oc-curred among MSM in the UK (Hue et al., 2005) and in injecting drugusers in Northern Europe (Lukashov et al., 1996). Our study adds apiece in the puzzle with regard to the HIV-1 global migration patterns.The HIV-1 epidemic was documented first among theMSM in the Unit-ed States, in early eighties, as the result of an early introduction from theHaiti (Gilbert et al., 2007). Subsequently, the epidemic spread to Europeand other areas in the Western Hemisphere, however until now thequestion with regard to the patterns of cross-continental transmissionsof the currently circulating strains remains unanswered. Our studydescribes the distinct role of different geographic areas in driving theWestern epidemic, highlighting that the role of Europe for thissubepidemic with respect to the rest of the globe was secondary andthe incoming infections spreadmainly among regional populations. Ad-ditionally we show that viral spread to Northern America occurredmostly from Central/South America; Asia on the other hand, was themost isolated area. The former can be explained by cross-border move-ments of people across the American continent, while the “isolated”nature of subtype B epidemic in Asia, previously described as themono-phyletic clade “B′”, is probably due to the local spread of this cladeamong the intravenous drugs users (IDU) and former plasma donors(FPDs) in Asia (Li et al., 2010).
After separating Europe we show that C.E. Europe did not importmore than expected fromWestern Europe even thoughWestern Europehad historically higher levels of subtype B infection which might be ex-plained due to the historically low population mobility among these re-gions of Europe. We estimated the date of this clear phylogeographicsegregation of West and C.E. European strains by means of molecularclock analysis to be roughly between late 80s and late 90s, which isaround the separation of the post-Soviet countries. With regard to C.E.Europe, the viral spread pattern can be characterized as “isolated”. Asimilar pattern has also been detected for the subtype A spreadingamong the local IDU population (AFSU) in Easter Europe (Bobkov et al.,1998; Thomson et al., 2009), showing almost no links with other geo-graphic areas. The similarity in the “isolated” pattern of viral migrationin Eastern Europe for both subtypes A and B, although that they havespread through different routes (parenteral and sexual transmissions),strongly suggest that factors like limited population mobility and highrisk behavior of drug injectors have played a significant role in shapingthe characteristics of HIV-1 epidemic spread in Eastern Europe that re-mains isolated.We also see that C.E Europe provided sources of viralmi-gration towards Western Europe; specifically Poland and the CzechRepublic showed more connectivity to Western European countries,than the rest of the C.E. European countries (Figs. S5 and S6 in the sup-plemental material). Poland was the first country that loosened its tiesfrom the Eastern European block, which could probably explain its clos-er tieswithWestern Europe than the other former communist countriesin C.E. Europe. Similarly Czech Republic had always been in closer con-nection to Western Europe in comparison to other Eastern Europeancountries mainly due to its central position in Europe.We, thus, suggestthat the viral migration pattern between Western and C.E. Europe canbe also explained as a result of the separation of these two parts ofEurope from the end of World War II in 1947 till the end of Cold Warin 1989 (Hansen, 2002). Soon after the split of the Soviet Unionhumanmigrations from Eastern European countries toWestern Europewas notable, and this is mirrored by the recent introduction of EasternEuropean isolates in Western European Countries.
It is noteworthy that the highest spread between any Europeancountry and non-European regions was observed for UK, Switzerlandand France (Fig. S4 in the supplemental material). UK and Franceshow similar patterns with connections to Americas and Africa and wehave also found that for the correlation between number of prevalentcases and number of significant migratory routes, UK and France had astriking deviation. This is in accordance with our findings that boththese countries provide major sources of viral spread from outsideEurope (North, Central & South America and Caribbean), suggesting
Please cite this article as: Magiorkinis, G., et al., The global spread of HIV-1dx.doi.org/10.1016/j.meegid.2016.05.041
the distinct nature of these countries with regards to epidemic spreadin Europe. UK and France are two of the largest countries in Europewith significant social and economic links across the globe that may ex-plain their central role as epidemic importers.
Switzerland had also high connectivity with non-European coun-tries, but shows a different pattern than UK and France. It did not devi-ate as strikingly as UK and France from the regression line between thenumber of prevalent cases and the number of significant migratoryroutes within Europe (Fig. 3A). Our findings are in accordance with aprevious study suggesting that sequences from MSM clustered withinlocal transmission networks at low proportions, suggestingmultiple in-troductions from abroad (Kouyos et al., 2010).
Considering HIV spread among European countries, the seeminglymost influential (both as exporter and importer) in accordance withprevious studies (Paraskevis et al., 2009) is Spain (Fig. S3) havingmany significant viral exchange routes with other European countries.Several factorsmight have contributed to this,first Spain has the highestnumber of HIV-1 subtype B infections, thus ismore likely to spill-over toother countries. Its high connectivity might be connected with the factthat within the last part of the 20th century, although the unemploy-ment rate has been continuously high, Spain experienced a rapidmigra-tion turnover from a traditional exporter to a significant immigrationdestination (Bentolila et al., 1990). Being also among the most populartourist destinations is likely to have contributed to the observed pattern(Paraskevis et al., 2009).
Notably, we found that the exporting viral spread, as measured bythe number of exporting countries within Europe, correlates with thenumber of infections due to subtype B in the source country. We, thus,suggest that in general higher prevalent countries are more likely toact as sources for cross-border infections within Europe.
Since our study is retrospective, it is unlikely to provide strong evi-dence for causality in viral migration. Based on the inferred global pat-tern of HIV-1 subtype B viral spread, we may hypothesize that theoutgoing viral spread for N. America and the Caribbean was probablydue to cross-border transmissions occurred at the early stage of the ep-idemicwhen itwas silent; a hypothesis further supported by thefindingthat viral lineages from N. America branched close to root of the tree.Central & South America show themost extensive network for outgoingspread probably due to immigration originated from these areas. Insticking contrast, Europewas an inward over the course of the epidemic,suggesting significant domestic migration for this subepidemic. Finally,Asiawas themost isolated due to specificwayofHIV-1 subtype Bmigra-tion among the local networks of IDU and FPDs. Therefore the globalspread of subtype B was not random but differs significantly acrossthe continents.
Many mathematical models can predict the potential of patho-gens to successfully establish an epidemic based on transmission pa-rameters (Anderson and May, 1991; Grassly and Fraser, 2008;Keeling and Rohani, 2008). Theory suggests that epidemics duringtheir early stages are sensitive to stochastic effects due to the smallnumber of infected individuals (Bailey, 1953); presumably theroute taken by the initial migration of HIV-1 from Africa to the USis the initial less predictable stochastic event. As pathogens becomemore prevalent (i.e. infect a larger proportion of the population) theoverall dynamics operate in approximately deterministic way(Whittle, 1955); accordingly we show that European countries withhigher HIV subtype B burden are more likely to spill infections overother countries. We, thus, show that the global viral phylogeographyof HIV subtype B was not random and suggest that, since major land-marks of the last part of the 20th century influence human (hencevirus) mobility, the virus spread around the globe is largely the resultof natural virus-host ecological dynamics. Thus, our study providesworking hypotheses as to how socio-economic circumstances influencethe human-virus ecological dynamics and advocates in support of scal-ing-up collaboration of health system for preventing the spread ofchronic viral infections.
subtype B epidemic, Infection, Genetics and Evolution (2016), http://
10 G. Magiorkinis et al. / Infection, Genetics and Evolution xxx (2016) xxx–xxx
5. Limitations
One major limitation of our study is that the collection of the sam-ples/molecular sequences has not been performed under a commonframework, which might make our analyses prone to sampling bias.To the best of our knowledge this drawback is present in all the phylo-geographic studies published for HIV-1 up to date, as a systematic col-lection of sequences on large geographic areas has not been performed.
However, here for the first time we have systematically approachedthe sampling bias problem in multiple levels including our design andanalyses by: 1) using sequences collected within well-defined cohortsallowing for uniformity of inclusion criteria at least within Europe, 2)collecting sequences with a meta-analyses approach rather than se-quence database download for the non-European datasets, againallowing for more uniformity of inclusion criteria, and 3) analysing 2sub-datasets to show robustness of results against potential samplingbias. We find no evidence of sampling bias in our analysis and weargue that includes the most representative and systematically com-posed sequence dataset that has been used for phylogeography studiesof HIV-1 up to date.
Supplementary data to this article can be found online at http://dx.doi.org/10.1016/j.meegid.2016.05.041.
Funding information
This work was supported by the European Community's SeventhFramework Programme (FP7/2007–2013, under the project Collabora-tive HIV and Anti-HIV Drug Resistance Network; project number:223131), the Medical Research Council (to G. M.; grant nr MR/K010565/1), the National Institute of Health (to S.R.) [grant nrDP1DA034989] and theAIDS Reference Laboratory of Leuven (which re-ceives support from the Belgian Ministry of Social Affairs through theFonds voor Wetenschappelijk Onderzoek–Flanders to K. T. [grant nrPDO/11 and G069214N]).
Potential conflicts of interest
All authors declare that they have no conflicts of interest.
Acknowledgments
We wish to acknowledge D. Kapothanasi, A. Flampouris, E. Kostaki,M. Altzerinakou, I. Doulis, M. Kikeri and G. Markozanes for their contri-bution to the current study.
References
Abecasis, A.B., Wensing, A.M., Paraskevis, D., Vercauteren, J., Theys, K., Van de Vijver, D.A.,Albert, J., Asjo, B., Balotta, C., Beshkov, D., Camacho, R.J., Clotet, B., De Gascun, C.,Griskevicius, A., Grossman, Z., Hamouda, O., Horban, A., Kolupajeva, T., Korn, K.,Kostrikis, L.G., Kucherer, C., Liitsola, K., Linka, M., Nielsen, C., Otelea, D., Paredes, R.,Poljak, M., Puchhammer-Stockl, E., Schmit, J.C., Sonnerborg, A., Stanekova, D.,Stanojevic, M., Struck, D., Boucher, C.A., Vandamme, A.M., 2013. HIV-1 subtype distri-bution and its demographic determinants in newly diagnosed patients in Europe sug-gest highly compartmentalized epidemics. Retrovirology 10, 7.
Anderson, R.M., May, R.M., 1991. Infectious Diseases of Humans: Dynamics and Control.Oxford University Press, Oxford.
Angelis, K., Albert, J., Mamais, I., Magiorkinis, G., Hatzakis, A., Hamouda, O., Struck, D.,Vercauteren, J., Wensing, A.M., Alexiev, I., Asjo, B., Balotta, C., Camacho, R.J.,Coughlan, S., Griskevicius, A., Grossman, Z., Horban, A., Kostrikis, L.G., Lepej, S.,Liitsola, K., Linka, M., Nielsen, C., Otelea, D., Paredes, R., Poljak, M., Puchhammer-Stockl, E., Schmit, J.C., Sonnerborg, A., Stanekova, D., Stanojevic, M., Boucher, C.A.,Kaplan, L., Vandamme, A.M., Paraskevis, D., 2015. Global dispersal pattern of HIVtype 1 subtype CRF01_AE: a genetic trace of human mobility related to heterosexualsexual activities centralized in Southeast Asia. J. Infect. Dis. 211, 1735–1744.
Avi, R., Huik, K., Sadam, M., Karki, T., Krispin, T., Ainsalu, K., Paap, P., Schmidt, J., Nikitina,N., Lutsar, I., 2009. Absence of genotypic drug resistance and presence of several nat-urally occurring polymorphisms of human immunodeficiency virus-1 CRF06_cpx intreatment-naive patients in Estonia. J. Med. Virol. 81, 953–958.
Bailey, N.T.J., 1953. The total size of a general stochastic epidemic. Biometrika 40,177–185.
Please cite this article as: Magiorkinis, G., et al., The global spread of HIV-1dx.doi.org/10.1016/j.meegid.2016.05.041
Balode, D., Skar, H., Mild, M., Kolupajeva, T., Ferdats, A., Rozentale, B., Leitner, T., Albert, J.,2012. Phylogenetic analysis of the Latvian HIV-1 epidemic. AIDS Res. Hum. Retrovir.28, 928–932.
Barre-Sinoussi, F., Chermann, J.C., Rey, F., Nugeyre, M.T., Chamaret, S., Gruest, J., Dauguet,C., Axler-Blin, C., Vezinet-Brun, F., Rouzioux, C., Rozenbaum, W., Montagnier, L., 1983.Isolation of a T-lymphotropic retrovirus from a patient at risk for acquired immunedeficiency syndrome (AIDS). Science 220, 868–871.
Bentolila, S., Blanchard, O.J., Calmfors, L., Dehesa, G.d.l., Layard, R., 1990. Spanish unem-ployment. Econ. Policy 5, 233–281.
Bobkov, A., Kazennova, E., Selimova, L., Bobkova, M., Khanina, T., Ladnaya, N., Kravchenko,A., Pokrovsky, V., Cheingsong-Popov, R., Weber, J., 1998. A sudden epidemic of HIVtype 1 among injecting drug users in the former Soviet Union: identification of sub-type A, subtype B, and novel gagA/envB recombinants. AIDS Res. Hum. Retrovir. 14,669–676.
Ciccozzi, M., Gori, C., Boros, S., Ruiz-Alvarez, M.J., Harxhi, A., Dervishi, M., Qyra, S., Schinaia,N., D'Arrigo, R., Ceccherini-Silberstein, F., Bino, S., Perno, C.F., Rezza, G., 2005. Molec-ular diversity of HIV in Albania. J. Infect. Dis. 192, 475–479.
Cottam, E.M., Thebaud, G., Wadsworth, J., Gloster, J., Mansley, L., Paton, D.J., King, D.P.,Haydon, D.T., 2008. Integrating genetic and epidemiological data to determine trans-mission pathways of foot-and-mouth disease virus. Proc. Biol. Sci. 275, 887–895.
Cromer, D., Wolinsky, S.M., McLean, A.R., 2010. How fast could HIV change gene frequen-cies in the human population? Proc. R. Soc. B Biol. Sci. 277, 1981–1989.
Cuevas, J.M., Geller, R., Garijo, R., Lopez-Aldeguer, J., Sanjuan, R., 2015. Extremely highmu-tation rate of HIV-1 in vivo. PLoS Biol. 13, e1002251.
Drummond, A.J., Rambaut, A., 2007. BEAST: Bayesian evolutionary analysis by samplingtrees. BMC Evol. Biol. 7, 214.
Drummond, A.J., Ho, S.Y., Phillips, M.J., Rambaut, A., 2006. Relaxed phylogenetics and dat-ing with confidence. PLoS Biol. 4, e88.
Frentz, D., Wensing, A.M., Albert, J., Paraskevis, D., Abecasis, A.B., Hamouda, O., Jorgensen,L.B., Kucherer, C., Struck, D., Schmit, J.C., Asjo, B., Balotta, C., Beshkov, D., Camacho, R.J.,Clotet, B., Coughlan, S., De Wit, S., Griskevicius, A., Grossman, Z., Horban, A.,Kolupajeva, T., Korn, K., Kostrikis, L.G., Liitsola, K., Linka, M., Nielsen, C., Otelea, D.,Paredes, R., Poljak, M., Puchhammer-Stockl, E., Sonnerborg, A., Stanekova, D.,Stanojevic, M., Vandamme, A.M., Boucher, C.A., Van de Vijver, D.A., SpreadProgramme, 2013. Limited cross-border infections in patients newly diagnosedwith HIV in Europe. Retrovirology 10, 36.
Gilbert, M.T., Rambaut, A., Wlasiuk, G., Spira, T.J., Pitchenik, A.E., Worobey, M., 2007. Theemergence of HIV/AIDS in the Americas and beyond. Proc. Natl. Acad. Sci. U. S. A.104, 18566–18570.
Grassly, N.C., Fraser, C., 2008. Mathematical models of infectious disease transmission.Nat. Rev. Microbiol. 6, 477–487.
Hall, B.G., 2013. Building phylogenetic trees from molecular data with MEGA. Mol. Biol.Evol. 30, 1229–1235.
Hansen, R., 2002. Migration to Europe since 1945: its history and its lessons. Polit. Q.25–38.
Hue, S., Pillay, D., Clewley, J.P., Pybus, O.G., 2005. Genetic analysis reveals the complexstructure of HIV-1 transmission within defined risk groups. Proc. Natl. Acad. Sci. U.S. A. 102, 4425–4429.
Ivanov, I.A., Beshkov, D., Shankar, A., Hanson, D.L., Paraskevis, D., Georgieva, V.,Karamacheva, L., Taskov, H., Varleva, T., Elenkov, I., Stoicheva, M., Nikolova, D.,Switzer, W.M., 2013. Detailed molecular epidemiologic characterization of HIV-1 in-fection in Bulgaria reveals broad diversity and evolving phylodynamics. PLoS One 8,e59666.
Keeling, M.J., Rohani, P., 2008. Modeling Infectious Diseases in Humans and Animals.Princeton University Press, Princeton.
Kouyos, R.D., von Wyl, V., Yerly, S., Boni, J., Taffe, P., Shah, C., Burgisser, P., Klimkait, T.,Weber, R., Hirschel, B., Cavassini, M., Furrer, H., Battegay, M., Vernazza, P.L.,Bernasconi, E., Rickenbach, M., Ledergerber, B., Bonhoeffer, S., Gunthard, H.F., 2010.Molecular epidemiology reveals long-term changes in HIV type 1 subtype B transmis-sion in Switzerland. J. Infect. Dis. 201, 1488–1497.
Lemey, P., Rambaut, A., Drummond, A.J., Suchard, M.A., 2009. Bayesian phylogeographyfinds its roots. PLoS Comput. Biol. 5, e1000520.
Lewis, F., Hughes, G.J., Rambaut, A., Pozniak, A., Leigh Brown, A.J., 2008. Episodic sexualtransmission of HIV revealed by molecular phylodynamics. PLoS Med. 5, e50.
Li, Y., Uenishi, R., Hase, S., Liao, H., Li, X.J., Tsuchiura, T., Tee, K.K., Pybus, O.G., Takebe, Y.,2010. Explosive HIV-1 subtype B′ epidemics in Asia driven by geographic and riskgroup founder events. Virology 402, 223–227.
Lukashov, V.V., Kuiken, C.L., Vlahov, D., Coutinho, R.A., Goudsmit, J., 1996. Evidence for HIVtype 1 strains of U.S. intravenous drug users as founders of AIDS epidemic among in-travenous drug users in northern Europe. AIDS Res. Hum. Retrovir. 12, 1179–1183.
Maddison, W.P., Maddison, D.R., 2015. Mesquite: A Modular System for EvolutionaryAnalysis (Version 3.03).
Magiorkinis, G., Magiorkinis, E., Paraskevis, D., Ho, S.Y., Shapiro, B., Pybus, O.G., Allain, J.P.,Hatzakis, A., 2009. The global spread of hepatitis C virus 1a and 1b: a phylodynamicand phylogeographic analysis. PLoS Med. 6, e1000198.
Mansky, L.M., Temin, H.M., 1995. Lower in vivomutation rate of human immunodeficien-cy virus type 1 than that predicted from the fidelity of purified reverse transcriptase.J. Virol. 69, 5087–5094.
Panel on Antiretroviral Guidelines for Adults and Adolescents, 2014n. Guidelines for theUse of Antiretroviral Agents in HIV-1-infected Adults and Adolescents. Departmentof Health and Human Services.
Paraskevis, D., Magiorkinis, G., Magiorkinis, E., Ho, S.Y., Belshaw, R., Allain, J.P., Hatzakis, A.,2013. Dating the origin and dispersal of hepatitis B virus infection in humans and pri-mates. Hepatology 57, 908–916.
Paraskevis, D., Pybus, O., Magiorkinis, G., Hatzakis, A., Wensing, A.M., van de Vijver, D.A.,Albert, J., Angarano, G., Asjo, B., Balotta, C., Boeri, E., Camacho, R., Chaix, M.L.,
subtype B epidemic, Infection, Genetics and Evolution (2016), http://
11G. Magiorkinis et al. / Infection, Genetics and Evolution xxx (2016) xxx–xxx
Coughlan, S., Costagliola, D., De Luca, A., de Mendoza, C., Derdelinckx, I., Grossman, Z.,Hamouda, O., Hoepelman, I., Horban, A., Korn, K., Kucherer, C., Leitner, T., Loveday, C.,Macrae, E., Maljkovic-Berry, I., Meyer, L., Nielsen, C., Op de Coul, E.L., Ormaasen, V.,Perrin, L., Puchhammer-Stockl, E., Ruiz, L., Salminen, M.O., Schmit, J.C., Schuurman,R., Soriano, V., Stanczak, J., Stanojevic, M., Struck, D., Van Laethem, K., Violin, M.,Yerly, S., Zazzi, M., Boucher, C.A., Vandamme, A.M., Spread Programme, 2009. Tracingthe HIV-1 subtype B mobility in Europe: a phylogeographic approach. Retrovirology6, 49.
Pinching, A.J., 1984. The acquired immune deficiency syndrome. Clin. Exp. Immunol. 56,1–13.
Rambaut, A., Suchard, M., Drummond, A., 2013-12-11. Molecular Evolution, Phylogeneticsand Epidemiology.
Rhee, S.Y., Gonzales, M.J., Kantor, R., Betts, B.J., Ravela, J., Shafer, R.W., 2003. Human immu-nodeficiency virus reverse transcriptase and protease sequence database. NucleicAcids Res. 31, 298–303.
Saad, M.D., Shcherbinskaya, A.M., Nadai, Y., Kruglov, Y.V., Antonenko, S.V., Lyullchuk,M.G.,Kravchenko, O.N., Earhart, K.C., Sanchez, J.L., Birx, D.L., Carr, J.K., 2006. Molecular epi-demiology of HIV type 1 in Ukraine: birthplace of an epidemic. AIDS Res. Hum.Retrovir. 22, 709–714.
Sanderson, M.J., Wojciechowski, M.F., 2000. Improved bootstrap confidence limits inlarge-scale phylogenies, with an example from Neo-Astragalus (Leguminosae). Syst.Biol. 49, 671–685.
Slatkin, M., Maddison, W.P., 1989. A cladistic measure of gene flow inferred from the phy-logenies of alleles. Genetics 123, 603–613.
Society, E.A.C., 2012. Guidelines Version 6.1 - November 2012.Stamatakis, A., 2006. RAxML-VI-HPC: maximum likelihood-based phylogenetic analyses
with thousands of taxa and mixed models. Bioinformatics 22, 2688–2690.Stamatakis, A., Hoover, P., Rougemont, J., 2008. A rapid bootstrap algorithm for the RAxML
web servers. Syst. Biol. 57, 758–771.Stanojevic, M., Alexiev, I., Beshkov, D., Gokengin, D., Mezei, M., Minarovits, J., Otelea, D.,
Paraschiv, S., Poljak, M., Zidovec-Lepej, S., Paraskevis, D., 2012. HIV-1 molecular epi-demiology in the Balkans - a melting pot for high genetic diversity. AIDS Rev. 14,28–36.
Thomson, M.M., Vinogradova, A., Delgado, E., Rakhmanova, A., Yakovlev, A., Cuevas, M.T.,Munoz, M., Pinilla, M., Vega, Y., Perez-Alvarez, L., Osmanov, S., Najera, R., 2009.Molec-ular epidemiology of HIV-1 in St Petersburg, Russia: predominance of subtype A,
Please cite this article as: Magiorkinis, G., et al., The global spread of HIV-1dx.doi.org/10.1016/j.meegid.2016.05.041
former Soviet Union variant, and identification of intrasubtype subclusters.J. Acquir. Immune Defic. Syndr. 51, 332–339.
Ustina, V., Zilmer, K., Tammai, L., Raukas, M., Andersson, A., Lilja, E., Albert, J., 2001. Epide-miology of HIV in Estonia. AIDS Res. Hum. Retrovir. 17, 81–85.
Vandamme, A.M., Camacho, R.J., Ceccherini-Silberstein, F., de Luca, A., Palmisano, L.,Paraskevis, D., Paredes, R., Poljak, M., Schmit, J.C., Soriano, V., Walter, H.,Sonnerborg, A., Guide, E.H.D.R., 2011. European recommendations for the clinicaluse of HIV drug resistance testing: 2011 update. AIDS Rev. 13, 77–108.
Vercauteren, J., Wensing, A.M.J., van de Vijver, D.A.M.C., Albert, J., Balotta, C., Hamouda, O.,Kucherer, C., Struck, D., Schmit, J.C., Asjo, B., Bruckova, M., Camacho, R.J., Clotet, B.,Coughlan, S., Grossman, Z., Horban, A., Korn, K., Kostrikis, L., Nielsen, C., Paraskevis,D., Poljak, M., Puchhammer-Stockl, E., Riva, C., Ruiz, L., Salminen, M., Schuurman, R.,Sonnerborg, A., Stanekova, D., Stanojevic, M., Vandamme, A.M., Boucher, C.A.B.,Spread Programme, 2009. Transmission of drug-resistant HIV-1 is stabilizing inEurope. J. Infect. Dis. 200, 1503–1508.
Wallace, R.G., Hodac, H., Lathrop, R.H., Fitch, W.M., 2007. A statistical phylogeography ofinfluenza A H5N1. Proc. Natl. Acad. Sci. U. S. A. 104, 4473–4478.
Wensing, A.M., van de Vijver, D.A., Angarano, G., Asjo, B., Balotta, C., Boeri, E., Camacho, R.,Chaix, M.L., Costagliola, D., De Luca, A., Derdelinckx, I., Grossman, Z., Hamouda, O.,Hatzakis, A., Hemmer, R., Hoepelman, A., Horban, A., Korn, K., Kucherer, C., Leitner,T., Loveday, C., MacRae, E., Maljkovic, I., de Mendoza, C., Meyer, L., Nielsen, C., Op deCoul, E.L., Ormaasen, V., Paraskevis, D., Perrin, L., Puchhammer-Stockl, E., Ruiz, L.,Salminen, M., Schmit, J.C., Schneider, F., Schuurman, R., Soriano, V., Stanczak, G.,Stanojevic, M., Vandamme, A.M., Van Laethem, K., Violin, M., Wilbe, K., Yerly, S.,Zazzi, M., Boucher, C.A., Spread Programme, 2005. Prevalence of drug-resistant HIV-1 variants in untreated individuals in Europe: implications for clinical management.J. Infect. Dis. 192, 958–966.
Wensing, A.M.J., Vercauteren, J., van de Vijver, D.A., Albert, J., Asjo, B., Balotta, C., Camacho,R., Coughlan, S., Grossman, Z., Horban, A., Kucherer, C., Nielsen, C., Paraskevis, D., Loke,W.C., Poggensee, G., Puchhammer-Stockl, E., Riva, C., Ruiz, L., Schmit, J.C., Schuurman,R., Salminen, M., Sonnerborg, A., Stanojevic, M., Struck, D., Vandamme, A.M., Boucher,C.A.B., Spread Programme, 2008. Transmission of drug-resistant HIV-1 in Europe re-mains limited to single classes. AIDS 22, 625–635.
Whittle, P., 1955. The outcome of a stochastic epidemic. Biometrika 42, 116–122.
subtype B epidemic, Infection, Genetics and Evolution (2016), http://