Embed Size (px)
Citation preview
NATURE | VOL 405 | 8 JUNE 2000 | www.nature.com 647
articles
Crystal structure of the calcium pumpof sarcoplasmic reticulumat 2.6 AÊ resolutionChikashi Toyoshima*², Masayoshi Nakasako*²³, Hiromi Nomura* & Haruo Ogawa*
* Institute of Molecular and Cellular Biosciences, The University of Tokyo, Bunkyo-ku, Tokyo 113-0032, Japan² The Harima Institute, The Institute of Physical and Chemical Research, Sayo-gun, Hyo-go 679-5143, Japan³ PRESTO, Japan Science and Technology Corporation, Kawaguchi 332-0012, Japan............................................................................................................................................................................................................................................................................
Calcium ATPase is a member of the P-type ATPases that transport ions across the membrane against a concentration gradient.Here we have solved the crystal structure of the calcium ATPase of skeletal muscle sarcoplasmic reticulum (SERCA1a) at 2.6 AÊresolution with two calcium ions bound in the transmembrane domain, which comprises ten a-helices. The two calcium ions arelocated side by side and are surrounded by four transmembrane helices, two of which are unwound for ef®cient coordinationgeometry. The cytoplasmic region consists of three well separated domains, with the phosphorylation site in the central catalyticdomain and the adenosine-binding site on another domain. The phosphorylation domain has the same fold as haloaciddehalogenase. Comparison with a low-resolution electron density map of the enzyme in the absence of calcium and withbiochemical data suggests that large domain movements take place during active transport.
The calcium pump of sarcoplasmic reticulum was ®rst identi®ed inthe `relaxing factor' of muscle contraction and gave rise to thecalcium theory1 that Ca2+ is a fundamental and ubiquitous factor inthe regulation of intracellular processes. It is an integral membraneprotein of relative molecular mass 110,000 (Mr 110K) and pumpsCa2+ released in muscle cells during contraction back into thesarcoplasmic reticulum using the chemical energy of ATP, therebyrelaxing muscle cells. This pump is therefore an ATPase and arepresentative member of a group of enzymes called P-type ATPases;the name came from the fact that they are autophosphorylated (atAsp 351 with Ca2+-ATPase) during the reaction cycle (for recentreviews, see refs 2±4). P-type ATPases are all ion pumps of crucialimportance, for example Na+K+-ATPase and gastric H+K+-ATPase.
The amino-acid sequences of P-type ATPases have been knownfor some time, and secondary-structure prediction has proposedmodels with ten transmembrane helices (M1±M10)5. Extensivemutational studies have been carried out to identify the amino-acid residues that are critical for ion transport (for example, seeref. 3). Negatively charged residues on four putative transmembranehelices (M4±M6 and M8) have been postulated to form high-af®nity binding sites6. The evolutionary connections with otherenzyme families have been a long-standing issue, because P-typeATPases lack the P-loop commonly found in other ATPases andGTPases7. Nevertheless, marked homology with L-2-haloaciddehalogenase has been pointed out for the catalytic core of thecytoplasmic domain8.
Direct structural information has so far been limited because thecrystals that had been obtained were useful only for electronmicroscopy. Two types of crystal have been obtained for sarcoplas-mic reticulum Ca2+-ATPase: tubular crystals formed in the absenceof Ca2+ and the presence of decavanadate9; and three-dimensionalmicrocrystals formed in the presence of millimolar Ca2+ (refs 10,11). From electron microscopy of these crystals, it is clear that theenzyme has a large cytoplasmic `headpiece' connected to thetransmembrane region by a short stalk segment12,13, and that theheadpiece appears to split on Ca2+ binding to the membranedomain14.
Here we have improved the crystallization conditions and suc-ceeded in growing crystals suitable for X-ray crystallography. Wedescribe the structure of the sarcoplasmic reticulum calcium pump
with two Ca2+ ions in the transmembrane binding sites at 2.6 AÊ
resolution. The atomic model explains the 8 AÊ resolution mapobtained from tubular crystals13, suggesting that large concerteddomain motions take place during active transport.
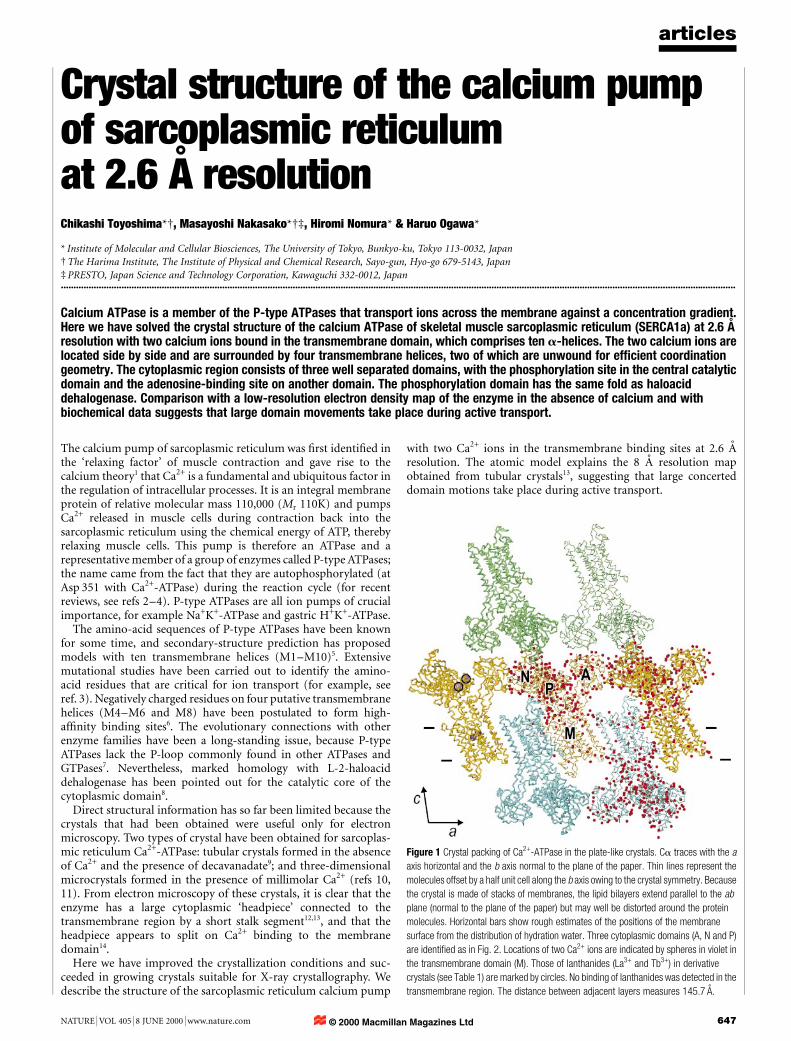
Figure 1 Crystal packing of Ca2+-ATPase in the plate-like crystals. Ca traces with the a
axis horizontal and the b axis normal to the plane of the paper. Thin lines represent the
molecules offset by a half unit cell along the b axis owing to the crystal symmetry. Because
the crystal is made of stacks of membranes, the lipid bilayers extend parallel to the ab
plane (normal to the plane of the paper) but may well be distorted around the protein
molecules. Horizontal bars show rough estimates of the positions of the membrane
surface from the distribution of hydration water. Three cytoplasmic domains (A, N and P)
are identi®ed as in Fig. 2. Locations of two Ca2+ ions are indicated by spheres in violet in
the transmembrane domain (M). Those of lanthanides (La3+ and Tb3+) in derivative
crystals (see Table 1) are marked by circles. No binding of lanthanides was detected in the
transmembrane region. The distance between adjacent layers measures 145.7 AÊ .
© 2000 Macmillan Magazines Ltd
articles
648 NATURE | VOL 405 | 8 JUNE 2000 | www.nature.com
Table 1 Summary of crystallographic analysis
Data set* Concentration(mM)
Resolution (AÊ ) Completeness(%)
Rmerge² (%) Redundancy I/j Riso³ (%) No. of sites Phasing power§
...................................................................................................................................................................................................................................................................................................................................................................
Native (eight crystals) 2.60 99.9 6.6(25.9)#
27.2 29.3(4.3)#
PIP 1 3.20 98.0 6.1(17.8)
3.4 23.7(7.7)
10.2 1 0.40
K2Pt(NO2)4 2 2.80 99.5 6.0(21.5)
3.3 24.7(6.7)
12.6 4 1.01
0.4 3.10 99.8 6.9(20.1)
3.8 25.6(5.4)
8.7 4 1.02
Pt(NH3)4(NO3)2 1 3.10 99.8 6.8(20.7)
3.6 16.8(5.0)
5.9 2 0.45
K2Pt(CN)6 2 3.20 94.5 4.0(13.3)
3.4 11.3(5.6)
11.0 3 0.34
Tb(NO3)3 2 3.15 98.2 5.6(18.1)
3.4 10.3(4.2)
11.5 2 1.00
(soaked 90 h) 1 3.00 99.9 6.0(18.2)
2.7 9.2(4.7)
8.0 2 0.85
La(NO3)3 2 3.20 98.0 4.0(13.0)
3.5 15.1(6.0)
6.9 2 0.82
TNP-AMP 0.5 4.00 94.7 10.8(18.1)
2.8 6.0(4.1)
9.9
...................................................................................................................................................................................................................................................................................................................................................................
Re®nement statisticsResolution range No. of
re¯ectionsNo. of protein
atomsNo. of watermolecules
No. of Ca2+
atomsRcrystII (%) Rfree¶ (%) R.m.s. bond
lengths (AÊ )R.m.s. bond
angle (8)15±2.6 AÊ 48,373
(92.5%)7,673 276 2 25.0 30.7 0.008 1.4
...................................................................................................................................................................................................................................................................................................................................................................
* Diffraction data were collected at SPring-8 (beamline BL41XU (l = 0.800 AÊ ) and BL44B2 (l = 0.890 AÊ and 1.000 AÊ ) for native crystals and BL44B2 (l = 0.890 AÊ ) for derivatives).² Rmerge � ShklSi j Ii�hkl�2 hI�hkl�i j =ShklSi Ii�hkl�.³ Riso � Shkl j j Fderiv�hkl� j 2 j Fnative�hkl� j j =Shkl j Fnative�hkl�j.§ De®ned as the ratio of the r.m.s. value of the heavy atom structure factor amplitudes and the r.m.s. value of the lack-of-closure error.kRcryst � Shkl j Fobs�hkl�2 Fcalc�hkl� j =ShklFobs�hkl�.¶ Same as Rcryst, but calculated with 10% of data set aside for re®nement.# The numbers in the parentheses refer to those in the last resolution shell (2.68±2.60 AÊ for the native data set).
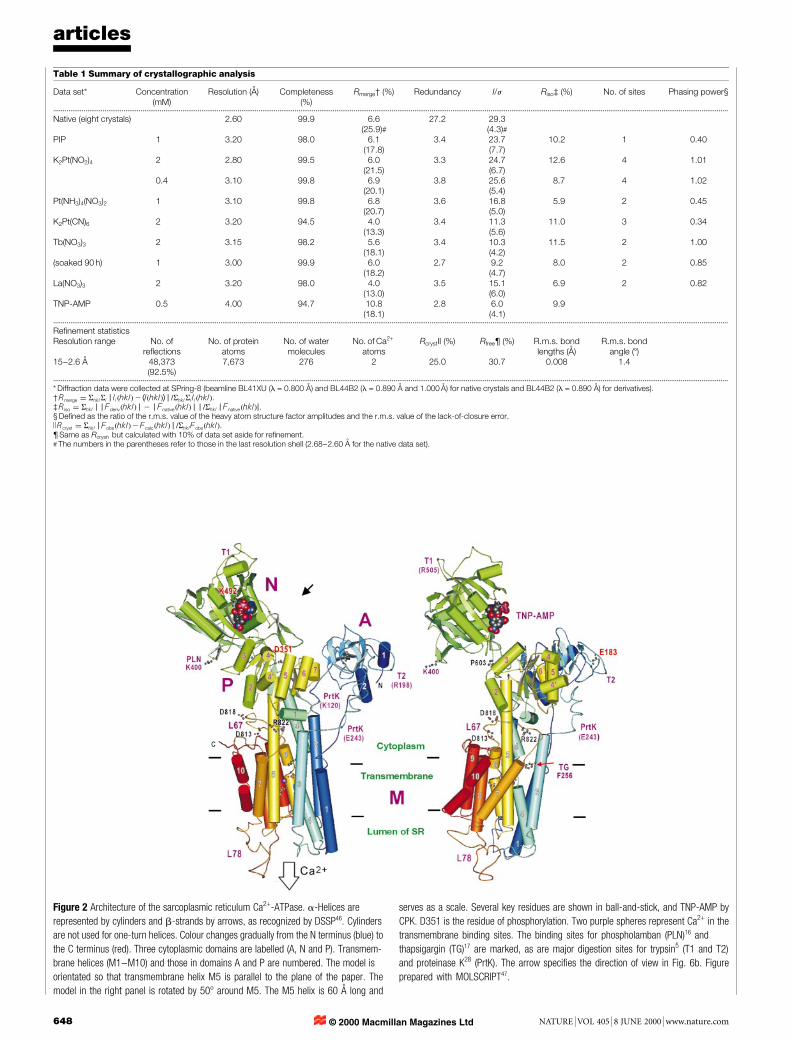
Figure 2 Architecture of the sarcoplasmic reticulum Ca2+-ATPase. a-Helices are
represented by cylinders and b-strands by arrows, as recognized by DSSP46. Cylinders
are not used for one-turn helices. Colour changes gradually from the N terminus (blue) to
the C terminus (red). Three cytoplasmic domains are labelled (A, N and P). Transmem-
brane helices (M1±M10) and those in domains A and P are numbered. The model is
orientated so that transmembrane helix M5 is parallel to the plane of the paper. The
model in the right panel is rotated by 508 around M5. The M5 helix is 60 AÊ long and
serves as a scale. Several key residues are shown in ball-and-stick, and TNP-AMP by
CPK. D351 is the residue of phosphorylation. Two purple spheres represent Ca2+ in the
transmembrane binding sites. The binding sites for phospholamban (PLN)16 and
thapsigargin (TG)17 are marked, as are major digestion sites for trypsin5 (T1 and T2)
and proteinase K28 (PrtK). The arrow speci®es the direction of view in Fig. 6b. Figure
prepared with MOLSCRIPT47.
© 2000 Macmillan Magazines Ltd
Structure determinationThe crystals were grown at pH 6.1 in the presence of 10 mM CaCl2
and exogenous lipid. Electron microscopy of these crystals showedthat the protein molecules were indeed embedded in lipid bilayers(data not shown). They were very thin (typically , 20 mm); buteach of them allowed a full data set to be collected at SPring-8. Thestructure was solved by standard multiple isomorphous replace-ment (MIRAS) methods and re®ned to 2.6 AÊ resolution. The qualityof the diffraction data and the re®nement statistics are given inTable 1. The atomic model included about 250 water moleculesin the cytoplasmic and the lumenal regions and about 30 inthe transmembrane region. The distribution of hydration watermolecules indicated approximately the position of the membraneboundary, which was roughly parallel to the a axis (Fig. 1).
Architecture of the sarcoplasmic reticulum Ca2+-ATPaseThe overall architecture of the sarcoplasmic reticulum Ca2+-ATPasewith bound Ca2+ is shown in Fig. 2. All 994 amino acid residues15
were identi®ed in the electron-density maps (see Fig. 3a, b for theinitial maps). The molecule ®ts in a box of 100 AÊ ´ 80 AÊ ´ 140 AÊ .The cytoplasmic headpiece has a split appearance consisting of threewell separated domains (designated as A, Nand P). The phosphorylation
site, Asp 351, is located in domain P, and, as described below, theadenosine moiety of nucleotide (here we used 29,39-O-(2,4,6-trinitrophenyl)-AMP (TNP-AMP)) is bound to domain N.
The transmembrane region (M) comprises ten a-helices (M1±M10), the arrangement of which is shown in Fig. 3a. There is a clearsegregation between M1±M6 and M7±M10, consistent with thelack of M7±M10 helices in bacterial type I P-type ATPases (forexample, ref. 2). The lengths of helices and the inclination to themembrane vary substantially (Fig. 2). Some of them (M2 and M5)are very long (,60 AÊ ) and fairly straight, but some are unwound(M4 and M6) or kinked (M10) at the middle of the membrane. Thehelices that have been presumed to form Ca2+-binding sites (M4±6,M8) show very different folding patterns, although similarityamong them was expected from mutation studies3. M5 is locatedin the centre of the molecule and extends from the lumenal surfaceof the membrane to the centre of the cytosolic domain P, lookinglike the `centre mast' of the enzyme. M2 and M3 are long helices thatare rather isolated. The implication of this feature is discussedbelow. These long helices are continuous across the membranesurface and therefore treated as single helices, including the regionpreviously assigned to `stalk helices'5. Lumenal loops are shortexcept for the one connecting M7 and M8 (L78, ,35 residues). In
articles
NATURE | VOL 405 | 8 JUNE 2000 | www.nature.com 649
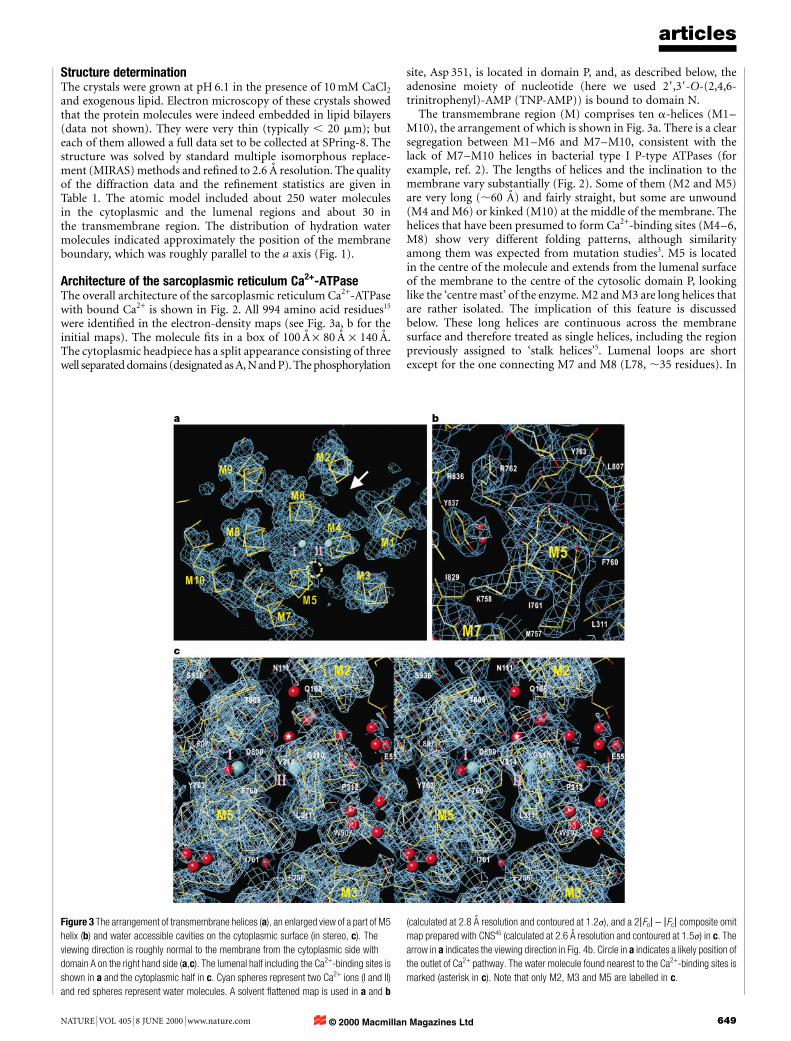
Figure 3 The arrangement of transmembrane helices (a), an enlarged view of a part of M5
helix (b) and water accessible cavities on the cytoplasmic surface (in stereo, c). The
viewing direction is roughly normal to the membrane from the cytoplasmic side with
domain A on the right hand side (a,c). The lumenal half including the Ca2+-binding sites is
shown in a and the cytoplasmic half in c. Cyan spheres represent two Ca2+ ions (I and II)
and red spheres represent water molecules. A solvent ¯attened map is used in a and b
(calculated at 2.8 AÊ resolution and contoured at 1.2j), and a 2jFoj - jFcj composite omit
map prepared with CNS45 (calculated at 2.6 AÊ resolution and contoured at 1.5j) in c. The
arrow in a indicates the viewing direction in Fig. 4b. Circle in a indicates a likely position of
the outlet of Ca2+ pathway. The water molecule found nearest to the Ca2+-binding sites is
marked (asterisk in c). Note that only M2, M3 and M5 are labelled in c.
© 2000 Macmillan Magazines Ltd
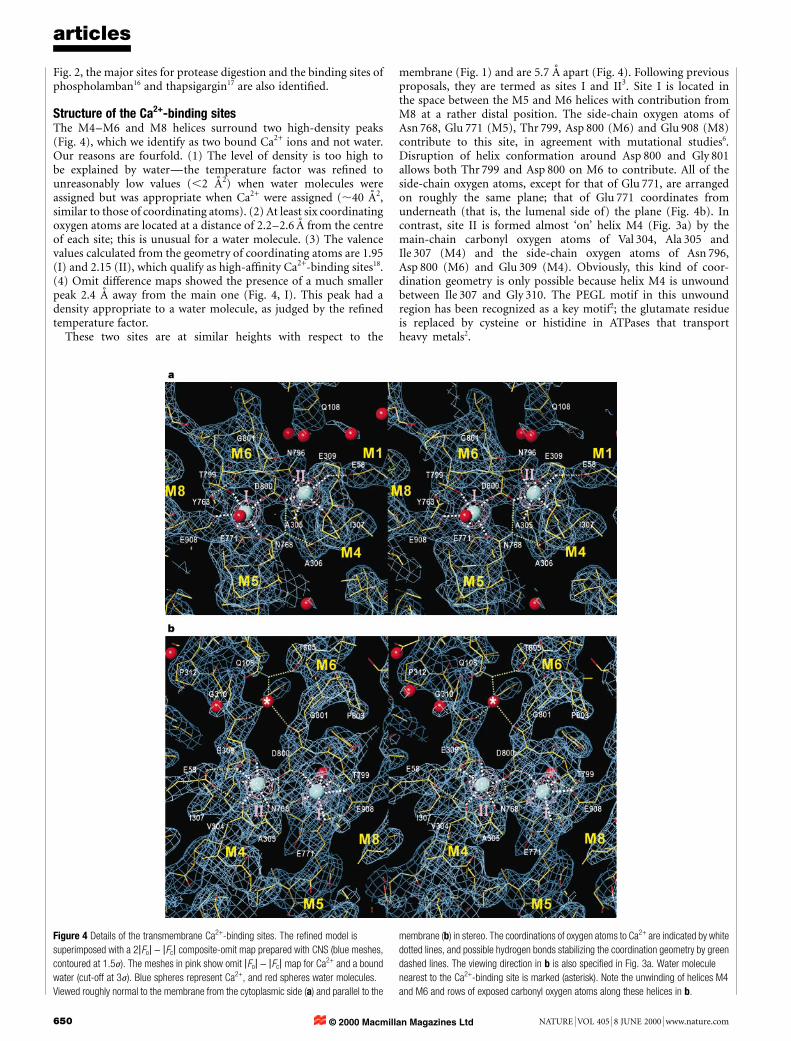
Fig. 2, the major sites for protease digestion and the binding sites ofphospholamban16 and thapsigargin17 are also identi®ed.
Structure of the Ca2+-binding sitesThe M4±M6 and M8 helices surround two high-density peaks(Fig. 4), which we identify as two bound Ca2+ ions and not water.Our reasons are fourfold. (1) The level of density is too high tobe explained by waterÐthe temperature factor was re®ned tounreasonably low values (,2 AÊ 2) when water molecules wereassigned but was appropriate when Ca2+ were assigned (,40 AÊ 2,similar to those of coordinating atoms). (2) At least six coordinatingoxygen atoms are located at a distance of 2.2±2.6 AÊ from the centreof each site; this is unusual for a water molecule. (3) The valencevalues calculated from the geometry of coordinating atoms are 1.95(I) and 2.15 (II), which qualify as high-af®nity Ca2+-binding sites18.(4) Omit difference maps showed the presence of a much smallerpeak 2.4 AÊ away from the main one (Fig. 4, I). This peak had adensity appropriate to a water molecule, as judged by the re®nedtemperature factor.
These two sites are at similar heights with respect to the
membrane (Fig. 1) and are 5.7 AÊ apart (Fig. 4). Following previousproposals, they are termed as sites I and II3. Site I is located inthe space between the M5 and M6 helices with contribution fromM8 at a rather distal position. The side-chain oxygen atoms ofAsn 768, Glu 771 (M5), Thr 799, Asp 800 (M6) and Glu 908 (M8)contribute to this site, in agreement with mutational studies6.Disruption of helix conformation around Asp 800 and Gly 801allows both Thr 799 and Asp 800 on M6 to contribute. All of theside-chain oxygen atoms, except for that of Glu 771, are arrangedon roughly the same plane; that of Glu 771 coordinates fromunderneath (that is, the lumenal side of) the plane (Fig. 4b). Incontrast, site II is formed almost `on' helix M4 (Fig. 3a) by themain-chain carbonyl oxygen atoms of Val 304, Ala 305 andIle 307 (M4) and the side-chain oxygen atoms of Asn 796,Asp 800 (M6) and Glu 309 (M4). Obviously, this kind of coor-dination geometry is only possible because helix M4 is unwoundbetween Ile 307 and Gly 310. The PEGL motif in this unwoundregion has been recognized as a key motif2; the glutamate residueis replaced by cysteine or histidine in ATPases that transportheavy metals2.
articles
650 NATURE | VOL 405 | 8 JUNE 2000 | www.nature.com
Figure 4 Details of the transmembrane Ca2+-binding sites. The re®ned model is
superimposed with a 2jFoj - jFcj composite-omit map prepared with CNS (blue meshes,
contoured at 1.5j). The meshes in pink show omit jFoj - jFcj map for Ca2+ and a bound
water (cut-off at 3j). Blue spheres represent Ca2+, and red spheres water molecules.
Viewed roughly normal to the membrane from the cytoplasmic side (a) and parallel to the
membrane (b) in stereo. The coordinations of oxygen atoms to Ca2+ are indicated by white
dotted lines, and possible hydrogen bonds stabilizing the coordination geometry by green
dashed lines. The viewing direction in b is also speci®ed in Fig. 3a. Water molecule
nearest to the Ca2+-binding site is marked (asterisk). Note the unwinding of helices M4
and M6 and rows of exposed carbonyl oxygen atoms along these helices in b.
© 2000 Macmillan Magazines Ltd
These two sites are stabilized by hydrogen-bond networksbetween the coordinating residues (for example, between Ala 306and Asn 768) and between residues on other helices (for example,between Val 304 and Glu 309 on M4 and Glu 58 on M1, see Fig. 4).These hydrogen-bond networks must be important for thecooperative binding of two Ca2+ ions (ref. 19). As Asp 800 iscoordinated to both Ca2+ atoms, the correct positioning of thisresidue must be very important. Furthermore, this residue is locatedin the unwound region between two helices (that is, the lumenal andcytoplasmic halves of M6) and the carbonyl oxygen atom is highlyexposed (Fig. 4b), implying that the position of this key residue isunder the control of other residues. This unwound conformationagrees well with an NMR study of isolated M6 polypeptide indetergent micelle20.
An important question is: how do Ca2+ ions reach the transmem-brane binding sites? Owing to the lack of large vestibules similar tothose found in ion channels21, our structure does not provide ade®nite answer. One candidate for Ca2+ entry is the area surroundedby M2, M4 and M6 (Fig. 3c). It is a cavity with a rather wide openingand is clearly water accessible (seven water molecules are seen inFig. 3c). In the upper part of this cavity are located Gln 108 andAsn 111, a critical residue for ATPase activity22. Particularly inter-esting are the rows of exposed oxygen atoms formed by theunwound part of M4 (Pro 312 to Glu 309) and of M6 (Gly 801and Asp 800). These rows of main-chain carbonyl oxygen atomspoint towards the cytoplasm (Fig. 4b), providing a hydrophilicpathway leading to the Ca2+-binding sites. The rows constrict nearthe Ca2+-binding sites, trapping a water molecule (Figs 3c and 4b,asterisk); here, the oxygen atoms are arranged so that nearly idealhydrogen-bonding geometry is provided for this water molecule.Such a geometry must be required for displacing water molecules21
that are bound to Ca2+ much more tightly than to monovalentcations. The outlet of Ca2+ is likely to be located in the areasurrounded by M3±M5 (Fig. 3a, circle); here too, a ring of oxygenatoms with bound water molecules is formed.
Thus, the unwinding of transmembrane helices appears to berequired for two purposes: ®rst, to realize ef®cient coordinationgeometry; and second, to provide rows of oxygen atoms for guidingCa2+ to the binding site and removing water molecules at the sametime.
Function and structure of three cytoplasmic domainsAs described above, the cytoplasmic headpiece consists of three wellseparated domains. The central part is occupied by domain P, whichcontains the residue of phosphorylation (Asp 351). This domain iscomposed of two parts widely separated in the amino-acidsequence. The N-terminal part (roughly between Asn 330 andAsn 359) is connected to M4 and the C-terminal part (roughlyLys 605 to Asp 737) to M5. These two parts are assembled into aseven-stranded parallel b-sheet with eight short associated helices,together forming a typical Rossman fold (Fig. 5a). The residue ofphosphorylation, Asp 351, is situated in the C-terminal end of thecentral b-strand (Fig. 5a), as is usually the case with nucleotide-binding proteins with a Rossman fold. Around this, the residuescritical for ATP hydrolysis are clustered (Fig. 5a; see refs 2 and 4 forreviews) and form a highly negatively charged surface that isaccessible to solvent (Fig. 6b).
In our structure, the folding pattern and the locations of thecritical amino acids are essentially identical to those of the coredomain of L-2-haloacid dehalogenase23 (HAD; Fig. 5b), as predictedby sequence homology8. Using this homology, we can propose rolesto some extent for the critical amino acids.
Domain N is the largest of the three cytoplasmic domains and hasMr < 27K. This domain is formed by the residues inserted (roughlyGln 360±Arg 604) between the two regions constituting domain Pand corresponds to the sub-domain in HAD. It comprises a seven-stranded antiparallel b-sheet with two helix bundles sandwiching it(Fig. 2; see also Fig. 7b for a top view). A function of this domainbecame clear when we directly visualized bound nucleotide. To dothis, we soaked the crystals in 0.5 mM TNP-AMP solution andidenti®ed the nucleotide's position by difference Fourier methods(Table 1). In the difference Fourier map (Fig. 6a), TNP-AMP islocated unambiguously near Phe 487, which has been identi®ed as acritical residue for ATP binding24. Well characterized residues suchas Lys 515 and Lys 492 are located nearby (Fig. 6a). Lys 515, thoughtfor a long time to be at the `mouth' of the ATP-binding pocket25,is actually located in the depth of the binding pocket (Fig. 6b).The close proximity of Lys 515 to the adenosine moiety (,5AÊ ,Fig. 6a) explains the inhibition of high-af®nity ATP binding bychemical modi®cation of this residue with ¯uoresceinisothiocyanate25. Lys 492, labelled with 8-azido-TNP-AMP/ATP26
articles
NATURE | VOL 405 | 8 JUNE 2000 | www.nature.com 651
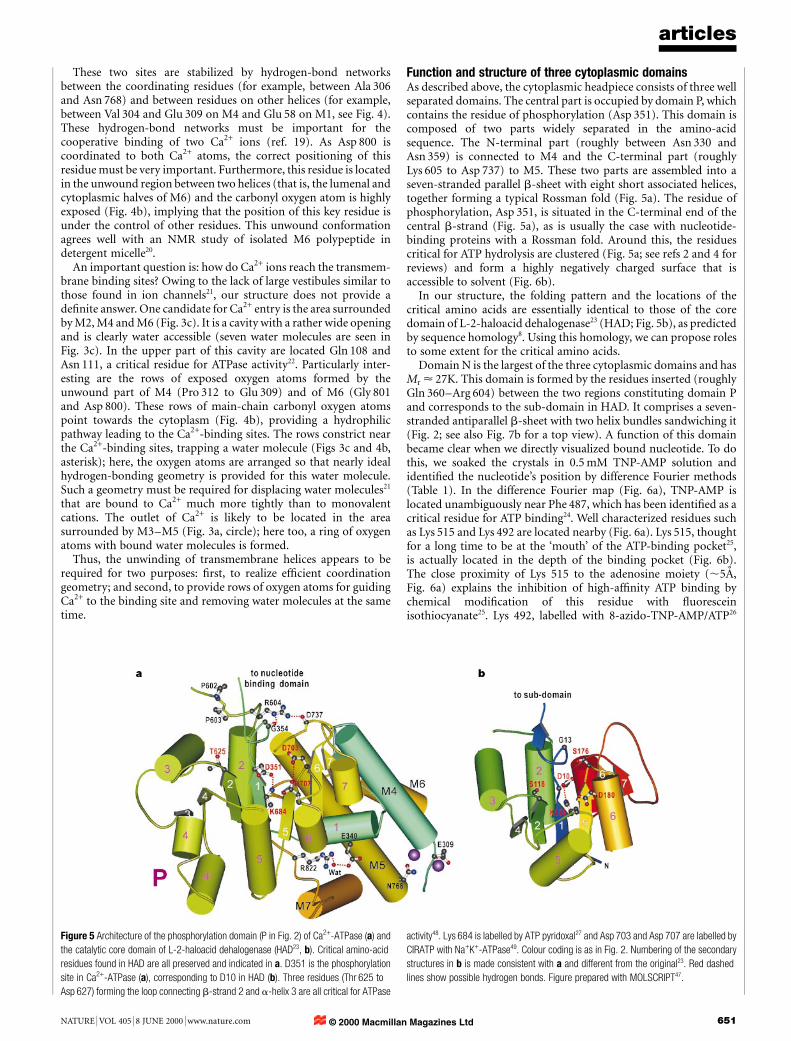
Figure 5 Architecture of the phosphorylation domain (P in Fig. 2) of Ca2+-ATPase (a) and
the catalytic core domain of L-2-haloacid dehalogenase (HAD23, b). Critical amino-acid
residues found in HAD are all preserved and indicated in a. D351 is the phosphorylation
site in Ca2+-ATPase (a), corresponding to D10 in HAD (b). Three residues (Thr 625 to
Asp 627) forming the loop connecting b-strand 2 and a-helix 3 are all critical for ATPase
activity48. Lys 684 is labelled by ATP pyridoxal27 and Asp 703 and Asp 707 are labelled by
CIRATP with Na+K+-ATPase49. Colour coding is as in Fig. 2. Numbering of the secondary
structures in b is made consistent with a and different from the original23. Red dashed
lines show possible hydrogen bonds. Figure prepared with MOLSCRIPT47.
© 2000 Macmillan Magazines Ltd
and other ATP-derivatives27 is located in a short loop connecting theb-strands (Lys 492 is marked in Fig. 2; also see Fig. 7b for a topview). This binding pocket is positively charged, in marked contrastto the region around the phosphorylation site (Fig. 6b).
Domain A is the smallest of the three domains and has Mr < 16K.It comprises roughly the 110 residues between M2 and M3(previously called the transduction domain5 or b-strand domain),which form a distorted jelly roll structure, and the 40 residues of theN-terminal part of the enzyme, which form two short helices. Thisdomain is connected to the transmembrane region by long loopsand is nearly isolated. The susceptibility of the loops to proteinase Kattack is affected by Ca2+ (ref. 28). The well conserved TGES motif(starting at Thr 181) is located at an edge of this domain (E183 isshown in Fig. 2). Arg 198, trypsin digestion at which is enhanced byCa2+ and blocked by phosphorylation29, is located at the outermostloop (T2 in Fig. 2). All these biochemical data suggest that thisdomain moves substantially during active transport.
Expected structure in the absence of Ca2+
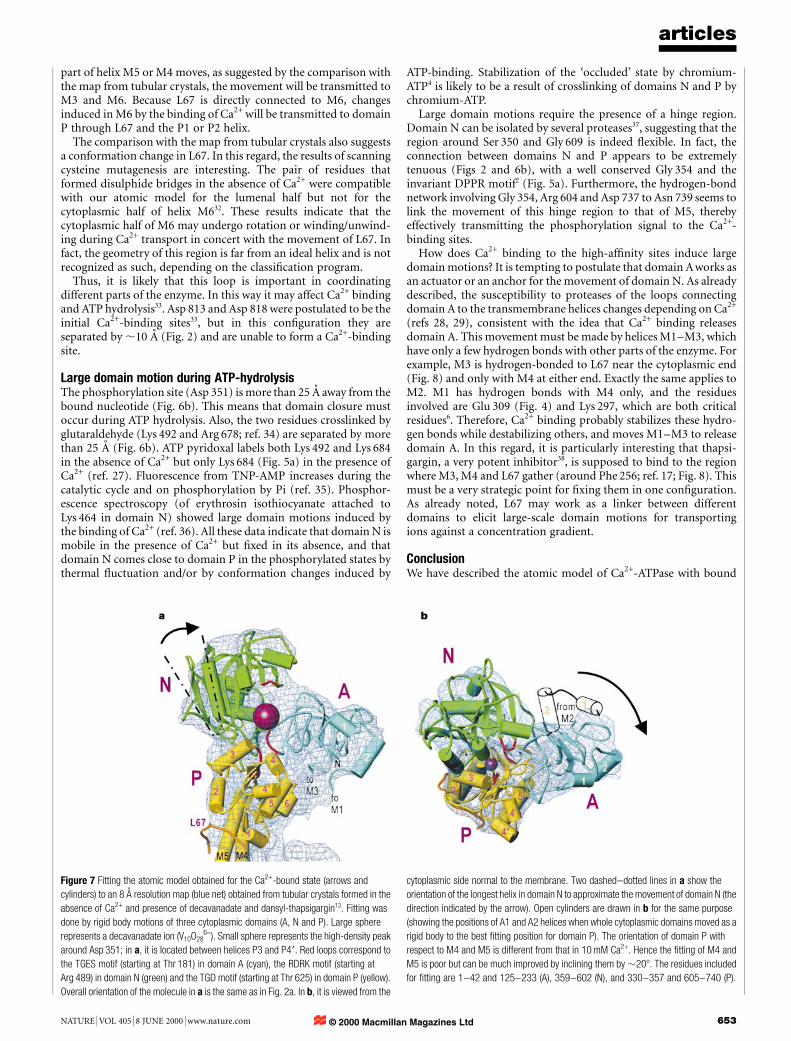
As mentioned above, the cytoplasmic headpiece has a compactappearance in the maps derived from tubular crystals12,13. The mostlikely reason for this difference from the present structure is thecrystallization conditions: the tubular crystals are formed in theabsence of Ca2+ and in the presence of decavanadate, whereas ourthree-dimensional crystals are formed in the presence of 10 mMCa2+. To examine whether the difference could be explained bydomain motions, we ®tted the atomic model to a low-resolutionmap (8 AÊ ) from tubular crystals13. This was done ®rst by cutting outthe cytoplasmic domains (A, N and P) and then by searching for thebest matching positions individually (Fig. 7). The ridges of allsurface helices match the density map (blue net) very well. Further-more, a high-density peak (small sphere in Fig. 7), probably avanadate oligomer, is found in close proximity to Asp 351. Closerexamination shows that a few hydrogen bonds can be readily madeat the domain interface.
The ®tting of these three cytoplasmic domains leaves onespherical lobe of high density (Fig. 7a, large sphere) unidenti®ed.Its density and size indicate that it is probably decavanadate(V10O28
6-). This lobe is located at the side of the highly positively
charged groove formed by domains N and P (Fig. 6b). The groove isnarrower than in the present structure (by ,208) and decavanadate®ts in the lobe (Fig. 7a), like a ball in jaws preventing the jaws fromclosing. Arg 489, Lys 492 (in the red loop in domain N in Fig. 7) andArg 678 (see Fig. 6b) are expected to participate in the binding ofthis large anion. This location of decavanadate will explain itsinhibitory effect on ATPase activity.
To realize this arrangement, all the cytoplasmic domains have tomove with respect to the M4 and M5 helices, which do not ®t thedensity map in Fig. 7 and need to be inclined by ,208. Domain Aundergoes the largest movement of the three (nearly a 908 rotation).The TGES loop starting at Thr 181 (Fig. 7, red loop in domain A)meets the TGD motif starting at Thr 625 (Fig. 7, red loop in domainP; see also Fig. 5a). The critical importance of these two motifs hasbeen well documented2. The counterpart of Thr 625 in HAD isSer 118 (Fig. 5b), which is thought to be the binding residue of thesubstrate carboxyl group30. The gathering of these loops in the E2 orE2P state has been demonstrated with Na+K+-ATPase31.
The large movement of domain A requires changes in theorientations of the M1±M3 helices, consistent with the changes insensitivity to proteases as mentioned previously28. Domain N haschanged its orientation by ,208 with respect to domain P, resultingin a similar orientationÐwhen projected along the b axisÐtothat observed with three-dimensional microcrystals by electronmicroscopy14. Despite the poor agreement of helices M4 and M5,the loop connecting helices M6 and M7 (L67) ®ts well with the densitymap (Fig. 7a), indicating that it follows domain P. But its position withrespect to the membrane helices is different, being much higher abovethe membrane surface than in the presence of Ca2+. This featuresuggests that L67 is important for concerted domain motions.
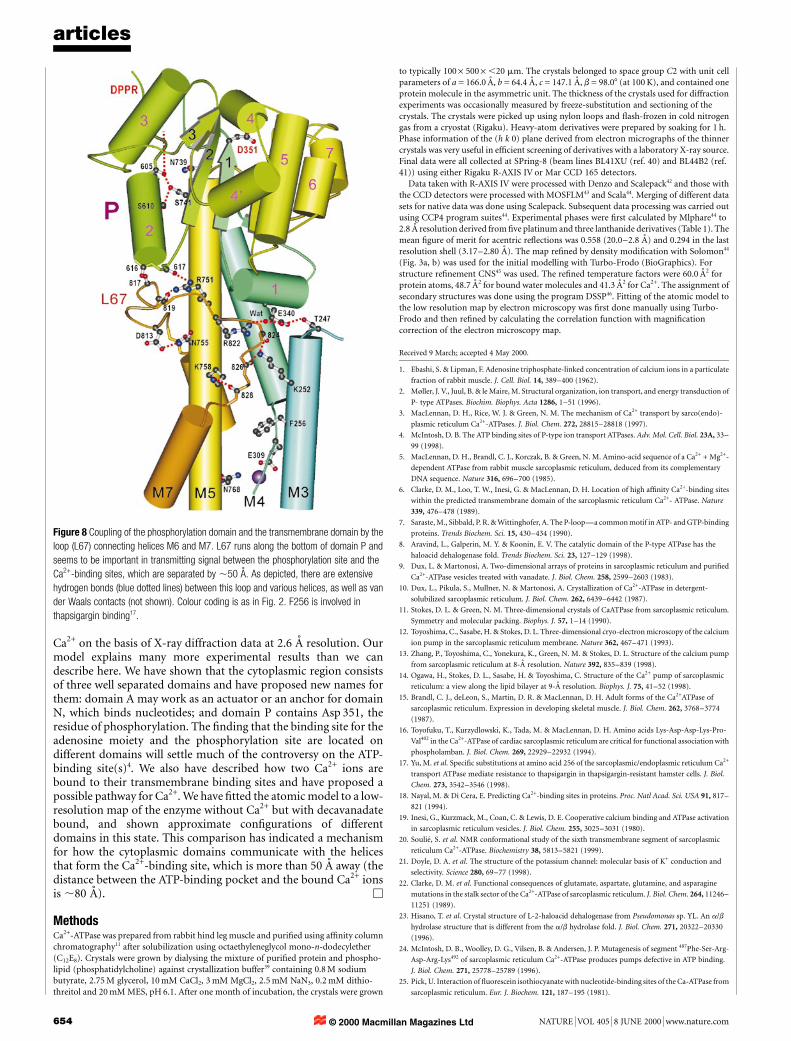
Role of the loop connecting helices M6 and M7This loop (L67) runs along the bottom of domain P and in aposition that can mediate interactions of domain P and thetransmembrane domain (Fig. 8). The P2 helix will link the move-ments of M5 and the DPPR region, and the P1 helix will couplethose of M4 and the central b-strand on which Asp 351 is located(also see Fig. 5a). Thus, this loop interacts directly or indirectly withmost of the key parts of the enzyme. If domain P moves or the upper
articles
652 NATURE | VOL 405 | 8 JUNE 2000 | www.nature.com
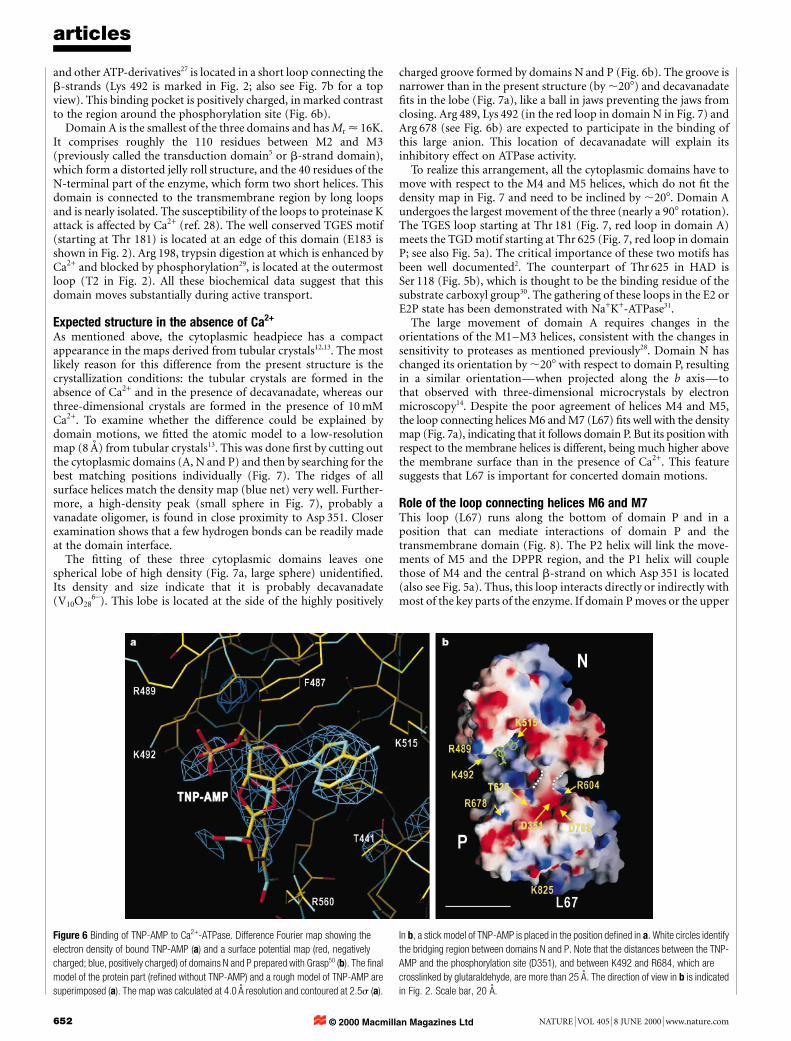
Figure 6 Binding of TNP-AMP to Ca2+-ATPase. Difference Fourier map showing the
electron density of bound TNP-AMP (a) and a surface potential map (red, negatively
charged; blue, positively charged) of domains N and P prepared with Grasp50 (b). The ®nal
model of the protein part (re®ned without TNP-AMP) and a rough model of TNP-AMP are
superimposed (a). The map was calculated at 4.0 AÊ resolution and contoured at 2.5s (a).
In b, a stick model of TNP-AMP is placed in the position de®ned in a. White circles identify
the bridging region between domains N and P. Note that the distances between the TNP-
AMP and the phosphorylation site (D351), and between K492 and R684, which are
crosslinked by glutaraldehyde, are more than 25 AÊ . The direction of view in b is indicated
in Fig. 2. Scale bar, 20 AÊ .
© 2000 Macmillan Magazines Ltd
part of helix M5 or M4 moves, as suggested by the comparison withthe map from tubular crystals, the movement will be transmitted toM3 and M6. Because L67 is directly connected to M6, changesinduced in M6 by the binding of Ca2+ will be transmitted to domainP through L67 and the P1 or P2 helix.
The comparison with the map from tubular crystals also suggestsa conformation change in L67. In this regard, the results of scanningcysteine mutagenesis are interesting. The pair of residues thatformed disulphide bridges in the absence of Ca2+ were compatiblewith our atomic model for the lumenal half but not for thecytoplasmic half of helix M632. These results indicate that thecytoplasmic half of M6 may undergo rotation or winding/unwind-ing during Ca2+ transport in concert with the movement of L67. Infact, the geometry of this region is far from an ideal helix and is notrecognized as such, depending on the classi®cation program.
Thus, it is likely that this loop is important in coordinatingdifferent parts of the enzyme. In this way it may affect Ca2+ bindingand ATP hydrolysis33. Asp 813 and Asp 818 were postulated to be theinitial Ca2+-binding sites33, but in this con®guration they areseparated by ,10 AÊ (Fig. 2) and are unable to form a Ca2+-bindingsite.
Large domain motion during ATP-hydrolysisThe phosphorylation site (Asp 351) is more than 25 AÊ away from thebound nucleotide (Fig. 6b). This means that domain closure mustoccur during ATP hydrolysis. Also, the two residues crosslinked byglutaraldehyde (Lys 492 and Arg 678; ref. 34) are separated by morethan 25 AÊ (Fig. 6b). ATP pyridoxal labels both Lys 492 and Lys 684in the absence of Ca2+ but only Lys 684 (Fig. 5a) in the presence ofCa2+ (ref. 27). Fluorescence from TNP-AMP increases during thecatalytic cycle and on phosphorylation by Pi (ref. 35). Phosphor-escence spectroscopy (of erythrosin isothiocyanate attached toLys 464 in domain N) showed large domain motions induced bythe binding of Ca2+ (ref. 36). All these data indicate that domain N ismobile in the presence of Ca2+ but ®xed in its absence, and thatdomain N comes close to domain P in the phosphorylated states bythermal ¯uctuation and/or by conformation changes induced by
ATP-binding. Stabilization of the `occluded' state by chromium-ATP4 is likely to be a result of crosslinking of domains N and P bychromium-ATP.
Large domain motions require the presence of a hinge region.Domain N can be isolated by several proteases37, suggesting that theregion around Ser 350 and Gly 609 is indeed ¯exible. In fact, theconnection between domains N and P appears to be extremelytenuous (Figs 2 and 6b), with a well conserved Gly 354 and theinvariant DPPR motif2 (Fig. 5a). Furthermore, the hydrogen-bondnetwork involving Gly 354, Arg 604 and Asp 737 to Asn 739 seems tolink the movement of this hinge region to that of M5, therebyeffectively transmitting the phosphorylation signal to the Ca2+-binding sites.
How does Ca2+ binding to the high-af®nity sites induce largedomain motions? It is tempting to postulate that domain A works asan actuator or an anchor for the movement of domain N. As alreadydescribed, the susceptibility to proteases of the loops connectingdomain A to the transmembrane helices changes depending on Ca2+
(refs 28, 29), consistent with the idea that Ca2+ binding releasesdomain A. This movement must be made by helices M1±M3, whichhave only a few hydrogen bonds with other parts of the enzyme. Forexample, M3 is hydrogen-bonded to L67 near the cytoplasmic end(Fig. 8) and only with M4 at either end. Exactly the same applies toM2. M1 has hydrogen bonds with M4 only, and the residuesinvolved are Glu 309 (Fig. 4) and Lys 297, which are both criticalresidues6. Therefore, Ca2+ binding probably stabilizes these hydro-gen bonds while destabilizing others, and moves M1±M3 to releasedomain A. In this regard, it is particularly interesting that thapsi-gargin, a very potent inhibitor38, is supposed to bind to the regionwhere M3, M4 and L67 gather (around Phe 256; ref. 17; Fig. 8). Thismust be a very strategic point for ®xing them in one con®guration.As already noted, L67 may work as a linker between differentdomains to elicit large-scale domain motions for transportingions against a concentration gradient.
ConclusionWe have described the atomic model of Ca2+-ATPase with bound
articles
NATURE | VOL 405 | 8 JUNE 2000 | www.nature.com 653
Figure 7 Fitting the atomic model obtained for the Ca2+-bound state (arrows and
cylinders) to an 8 AÊ resolution map (blue net) obtained from tubular crystals formed in the
absence of Ca2+ and presence of decavanadate and dansyl-thapsigargin13. Fitting was
done by rigid body motions of three cytoplasmic domains (A, N and P). Large sphere
represents a decavanadate ion (V10O286-). Small sphere represents the high-density peak
around Asp 351; in a, it is located between helices P3 and P49. Red loops correspond to
the TGES motif (starting at Thr 181) in domain A (cyan), the RDRK motif (starting at
Arg 489) in domain N (green) and the TGD motif (starting at Thr 625) in domain P (yellow).
Overall orientation of the molecule in a is the same as in Fig. 2a. In b, it is viewed from the
cytoplasmic side normal to the membrane. Two dashed±dotted lines in a show the
orientation of the longest helix in domain N to approximate the movement of domain N (the
direction indicated by the arrow). Open cylinders are drawn in b for the same purpose
(showing the positions of A1 and A2 helices when whole cytoplasmic domains moved as a
rigid body to the best ®tting position for domain P). The orientation of domain P with
respect to M4 and M5 is different from that in 10 mM Ca2+. Hence the ®tting of M4 and
M5 is poor but can be much improved by inclining them by ,208. The residues included
for ®tting are 1±42 and 125±233 (A), 359±602 (N), and 330±357 and 605±740 (P).
© 2000 Macmillan Magazines Ltd
Ca2+ on the basis of X-ray diffraction data at 2.6 AÊ resolution. Ourmodel explains many more experimental results than we candescribe here. We have shown that the cytoplasmic region consistsof three well separated domains and have proposed new names forthem: domain A may work as an actuator or an anchor for domainN, which binds nucleotides; and domain P contains Asp 351, theresidue of phosphorylation. The ®nding that the binding site for theadenosine moiety and the phosphorylation site are located ondifferent domains will settle much of the controversy on the ATP-binding site(s)4. We also have described how two Ca2+ ions arebound to their transmembrane binding sites and have proposed apossible pathway for Ca2+. We have ®tted the atomic model to a low-resolution map of the enzyme without Ca2+ but with decavanadatebound, and shown approximate con®gurations of differentdomains in this state. This comparison has indicated a mechanismfor how the cytoplasmic domains communicate with the helicesthat form the Ca2+-binding site, which is more than 50 AÊ away (thedistance between the ATP-binding pocket and the bound Ca2+ ionsis ,80 AÊ ). M
MethodsCa2+-ATPase was prepared from rabbit hind leg muscle and puri®ed using af®nity columnchromatography11 after solubilization using octaethyleneglycol mono-n-dodecylether(C12E8). Crystals were grown by dialysing the mixture of puri®ed protein and phospho-lipid (phosphatidylcholine) against crystallization buffer39 containing 0.8 M sodiumbutyrate, 2.75 M glycerol, 10 mM CaCl2, 3 mM MgCl2, 2.5 mM NaN3, 0.2 mM dithio-threitol and 20 mM MES, pH 6.1. After one month of incubation, the crystals were grown
to typically 100 ´ 500 ´ ,20 mm. The crystals belonged to space group C2 with unit cellparameters of a = 166.0 AÊ , b = 64.4 AÊ , c = 147.1 AÊ , b = 98.08 (at 100 K), and contained oneprotein molecule in the asymmetric unit. The thickness of the crystals used for diffractionexperiments was occasionally measured by freeze-substitution and sectioning of thecrystals. The crystals were picked up using nylon loops and ¯ash-frozen in cold nitrogengas from a cryostat (Rigaku). Heavy-atom derivatives were prepared by soaking for 1 h.Phase information of the (h k 0) plane derived from electron micrographs of the thinnercrystals was very useful in ef®cient screening of derivatives with a laboratory X-ray source.Final data were all collected at SPring-8 (beam lines BL41XU (ref. 40) and BL44B2 (ref.41)) using either Rigaku R-AXIS IV or Mar CCD 165 detectors.
Data taken with R-AXIS IV were processed with Denzo and Scalepack42 and those withthe CCD detectors were processed with MOSFLM43 and Scala44. Merging of different datasets for native data was done using Scalepack. Subsequent data processing was carried outusing CCP4 program suites44. Experimental phases were ®rst calculated by Mlphare44 to2.8 AÊ resolution derived from ®ve platinum and three lanthanide derivatives (Table 1). Themean ®gure of merit for acentric re¯ections was 0.558 (20.0±2.8 AÊ ) and 0.294 in the lastresolution shell (3.17±2.80 AÊ ). The map re®ned by density modi®cation with Solomon44
(Fig. 3a, b) was used for the initial modelling with Turbo-Frodo (BioGraphics). Forstructure re®nement CNS45 was used. The re®ned temperature factors were 60.0 AÊ 2 forprotein atoms, 48.7 AÊ 2 for bound water molecules and 41.3 AÊ 2 for Ca2+. The assignment ofsecondary structures was done using the program DSSP46. Fitting of the atomic model tothe low resolution map by electron microscopy was ®rst done manually using Turbo-Frodo and then re®ned by calculating the correlation function with magni®cationcorrection of the electron microscopy map.
Received 9 March; accepted 4 May 2000.
1. Ebashi, S. & Lipman, F. Adenosine triphosphate-linked concentration of calcium ions in a particulate
fraction of rabbit muscle. J. Cell. Biol. 14, 389±400 (1962).
2. Mùller, J. V., Juul, B. & le Maire, M. Structural organization, ion transport, and energy transduction of
P- type ATPases. Biochim. Biophys. Acta 1286, 1±51 (1996).
3. MacLennan, D. H., Rice, W. J. & Green, N. M. The mechanism of Ca2+ transport by sarco(endo)-
plasmic reticulum Ca2+-ATPases. J. Biol. Chem. 272, 28815±28818 (1997).
4. McIntosh, D. B. The ATP binding sites of P-type ion transport ATPases. Adv. Mol. Cell. Biol. 23A, 33±
99 (1998).
5. MacLennan, D. H., Brandl, C. J., Korczak, B. & Green, N. M. Amino-acid sequence of a Ca2+ + Mg2+-
dependent ATPase from rabbit muscle sarcoplasmic reticulum, deduced from its complementary
DNA sequence. Nature 316, 696±700 (1985).
6. Clarke, D. M., Loo, T. W., Inesi, G. & MacLennan, D. H. Location of high af®nity Ca2+-binding sites
within the predicted transmembrane domain of the sarcoplasmic reticulum Ca2+- ATPase. Nature
339, 476±478 (1989).
7. Saraste, M., Sibbald, P. R. & Wittinghofer, A. The P-loopÐa common motif in ATP- and GTP-binding
proteins. Trends Biochem. Sci. 15, 430±434 (1990).
8. Aravind, L., Galperin, M. Y. & Koonin, E. V. The catalytic domain of the P-type ATPase has the
haloacid dehalogenase fold. Trends Biochem. Sci. 23, 127±129 (1998).
9. Dux, L. & Martonosi, A. Two-dimensional arrays of proteins in sarcoplasmic reticulum and puri®ed
Ca2+-ATPase vesicles treated with vanadate. J. Biol. Chem. 258, 2599±2603 (1983).
10. Dux, L., Pikula, S., Mullner, N. & Martonosi, A. Crystallization of Ca2+-ATPase in detergent-
solubilized sarcoplasmic reticulum. J. Biol. Chem. 262, 6439±6442 (1987).
11. Stokes, D. L. & Green, N. M. Three-dimensional crystals of CaATPase from sarcoplasmic reticulum.
Symmetry and molecular packing. Biophys. J. 57, 1±14 (1990).
12. Toyoshima, C., Sasabe, H. & Stokes, D. L. Three-dimensional cryo-electron microscopy of the calcium
ion pump in the sarcoplasmic reticulum membrane. Nature 362, 467±471 (1993).
13. Zhang, P., Toyoshima, C., Yonekura, K., Green, N. M. & Stokes, D. L. Structure of the calcium pump
from sarcoplasmic reticulum at 8-AÊ resolution. Nature 392, 835±839 (1998).
14. Ogawa, H., Stokes, D. L., Sasabe, H. & Toyoshima, C. Structure of the Ca2+ pump of sarcoplasmic
reticulum: a view along the lipid bilayer at 9-AÊ resolution. Biophys. J. 75, 41±52 (1998).
15. Brandl, C. J., deLeon, S., Martin, D. R. & MacLennan, D. H. Adult forms of the Ca2+ATPase of
sarcoplasmic reticulum. Expression in developing skeletal muscle. J. Biol. Chem. 262, 3768±3774
(1987).
16. Toyofuku, T., Kurzydlowski, K., Tada, M. & MacLennan, D. H. Amino acids Lys-Asp-Asp-Lys-Pro-
Val402 in the Ca2+-ATPase of cardiac sarcoplasmic reticulum are critical for functional association with
phospholamban. J. Biol. Chem. 269, 22929±22932 (1994).
17. Yu, M. et al. Speci®c substitutions at amino acid 256 of the sarcoplasmic/endoplasmic reticulum Ca2+
transport ATPase mediate resistance to thapsigargin in thapsigargin-resistant hamster cells. J. Biol.
Chem. 273, 3542±3546 (1998).
18. Nayal, M. & Di Cera, E. Predicting Ca2+-binding sites in proteins. Proc. Natl Acad. Sci. USA 91, 817±
821 (1994).
19. Inesi, G., Kurzmack, M., Coan, C. & Lewis, D. E. Cooperative calcium binding and ATPase activation
in sarcoplasmic reticulum vesicles. J. Biol. Chem. 255, 3025±3031 (1980).
20. SoulieÂ, S. et al. NMR conformational study of the sixth transmembrane segment of sarcoplasmic
reticulum Ca2+-ATPase. Biochemistry 38, 5813±5821 (1999).
21. Doyle, D. A. et al. The structure of the potassium channel: molecular basis of K+ conduction and
selectivity. Science 280, 69±77 (1998).
22. Clarke, D. M. et al. Functional consequences of glutamate, aspartate, glutamine, and asparagine
mutations in the stalk sector of the Ca2+-ATPase of sarcoplasmic reticulum. J. Biol. Chem. 264, 11246±
11251 (1989).
23. Hisano, T. et al. Crystal structure of L-2-haloacid dehalogenase from Pseudomonas sp. YL. An a/b
hydrolase structure that is different from the a/b hydrolase fold. J. Biol. Chem. 271, 20322±20330
(1996).
24. McIntosh, D. B., Woolley, D. G., Vilsen, B. & Andersen, J. P. Mutagenesis of segment 487Phe-Ser-Arg-
Asp-Arg-Lys492 of sarcoplasmic reticulum Ca2+-ATPase produces pumps defective in ATP binding.
J. Biol. Chem. 271, 25778±25789 (1996).
25. Pick, U. Interaction of ¯uorescein isothiocyanate with nucleotide-binding sites of the Ca-ATPase from
sarcoplasmic reticulum. Eur. J. Biochem. 121, 187±195 (1981).
articles
654 NATURE | VOL 405 | 8 JUNE 2000 | www.nature.com
Figure 8 Coupling of the phosphorylation domain and the transmembrane domain by the
loop (L67) connecting helices M6 and M7. L67 runs along the bottom of domain P and
seems to be important in transmitting signal between the phosphorylation site and the
Ca2+-binding sites, which are separated by ,50 AÊ . As depicted, there are extensive
hydrogen bonds (blue dotted lines) between this loop and various helices, as well as van
der Waals contacts (not shown). Colour coding is as in Fig. 2. F256 is involved in
thapsigargin binding17.
© 2000 Macmillan Magazines Ltd
26. McIntosh, D. B., Woolley, D. G. & Berman, M. C. 29,39-O-(2,4,6-trinitrophenyl)-8-azido-AMP and-
ATP photolabel Lys-492 at the active site of sarcoplasmic reticulum Ca2+-ATPase. J. Biol. Chem. 267,
5301±5309 (1992).
27. Yamamoto, H., Imamura, Y., Tagaya, M., Fukui, T. & Kawakita, M. Ca2+-dependent conformational
change of the ATP-binding site of Ca2+-transporting ATPase of sarcoplasmic reticulum as revealed by
an alteration of the target-site speci®city of adenosine triphosphopyridoxal. J. Biochem. (Tokyo) 106,
1121±1125 (1989).
28. Juul, B. et al. Do transmembrane segments in proteolyzed sarcoplasmic reticulum Ca2+- ATPase retain
their functional Ca2+ binding properties after removal of cytoplasmic fragments by proteinase K?
J. Biol. Chem. 270, 20123±20134 (1995).
29. Andersen, J. P., Vilsen, B., Collins, J. H. & Jùrgensen, P. L. Localization of E1±E2 conformational
transitions of sarcoplasmic reticulum Ca-ATPase by tryptic cleavage and hydrophobic labeling.
J. Membr. Biol. 93, 85±92 (1986).
30. Li, Y. F. et al. Crystal structures of reaction intermediates of L-2-haloacid dehalogenase and
implications for the reaction mechanism. J. Biol. Chem. 273, 15035±15044 (1998).
31. Goldshleger, R. & Karlish, S. J. D. Fe-catalyzed cleavage of the alpha subunit of Na/K-ATPase: evidence
for conformation-sensitive interactions between cytoplasmic domains. Proc. Natl Acad. Sci. USA 94,
9596-9601 (1997).
32. Rice, W. J., Green, N. M. & MacLennan, D. H. Site-directed disul®de mapping of helices M4 and M6 in
the Ca2+ binding domain of SERCA1a, the Ca2+ ATPase of fast twitch skeletal muscle sarcoplasmic
reticulum. J. Biol. Chem. 272, 31412±31419 (1997).
33. Falson, P. et al. The cytoplasmic loop between putative transmembrane segments 6 and 7 in
sarcoplasmic reticulum Ca2+-ATPase binds Ca2+ and is functionally important. J. Biol. Chem. 272,
17258±17262 (1997).
34. McIntosh, D. B. Glutaraldehyde cross-links Lys-492 and Arg-678 at the active site of sarcoplasmic
reticulum Ca2+-ATPase. J. Biol. Chem. 267, 22328±22335 (1992).
35. Nakamoto, R. K. & Inesi, G. Studies of the interactions of 29,39-O-(2,4,6- trinitrocyclohexyldieny-
lidine)adenosine nucleotides with the sarcoplasmic reticulum (Ca2+ + Mg2+)-ATPase active site.
J. Biol. Chem. 259, 2961±2970 (1984).
36. Huang, S. & Squier, T. C. Enhanced rotational dynamics of the phosphorylation domain of the Ca-
ATPase upon calcium activation. Biochemistry 37, 18064±18073 (1998).
37. Champeil, P. et al. Characterization of a protease-resistant domain of the cytosolic portion of
sarcoplasmic reticulum Ca2+-ATPase. J. Biol. Chem. 273, 6619±6631 (1998).
38. Sagara, Y. & Inesi, G. Inhibition of the sarcoplasmic reticulum Ca2+ transport ATPase by thapsigargin
at subnanomolar concentrations. J. Biol. Chem. 266, 13503±13506 (1991).
39. Misra, M., Taylor, D., Oliver, T. & Taylor, K. Effect of organic anions on the crystallization of the Ca2+-
ATPase of muscle sarcoplasmic reticulum. Biochim. Biophys. Acta 1077, 107±118 (1991).
40. Kamiya, N. et al. Design of the high energy undulator pilot beamline for macromolecular crystal-
lography at the SPring-8. Rev. Sci. Instrum. 66, 1703±1705 (1995).
41. Adachi, S., Oguchi, T. & Ueki, T. Present status of RIKEN beamline II (BL44B2) for structural biology.
SPring-8 Annual Report 1, 239±240 (1996).
42. Otwinowski, Z. & Minor, W. Processing of X-ray diffraction data collected in oscillation mode.
Methods Enzymol. 276, 307±325 (1997).
43. Leslie, A. G. W. MOSFLM- recent changes and future developments. CCP4 Newsletter on Protein
Crystallography 35, 18±19 (1998).
44. Collaborative Computational project, No. 4. The CCP4 suite: programs for protein crystallography.
Acta Crystallogr. D 50, 760±763 (1994).
45. BruÈnger, A. T. et al. Crystallography & NMR system: A new software suite for macromolecular
structure determination. Acta Crystallogr. D 54, 905±921 (1998).
46. Kabsch, W. & Sander, C. Dictionary of protein secondary structure: pattern recognition of hydrogen-
bonded and geometrical features. Biopolymers 22, 2577±2637 (1983).
47. Kraulis, P. J. MOLSCRIPT: a program to produce both detailed and schematic plots of protein
structures. J. Appl. Crystallogr. 24, 946±950 (1991).
48. Clarke, D. M., Loo, T. W. & MacLennan, D. H. Functional consequences of alterations to amino acids
located in the nucleotide binding domain of the Ca2+-ATPase of sarcoplasmic reticulum. J. Biol. Chem.
265, 22223±22227 (1990).
49. Ovchinnikov, Y. et al. Af®nity modi®cation of E1-form of Na+, K+-ATPase revealed Asp-710 in the
catalytic site. FEBS Lett. 217, 111±116 (1987).
50. Nicholls, A., Sharp, K. A. & Honig, B. Protein folding and association: insights from the interfacial and
thermodynamic properties of hydrocarbons. Proteins Struct. Funct. Genet. 11, 281±296 (1991).
Acknowledgements
We thank S. Adachi, N. Kamiya (Riken) and M. Kawamoto (JASRI) for their help in datataking at SPring-8, and K. Tani for computations. We acknowledge that very ®rst crystalsfor X-ray were made by H. Mukai. This work was supported in part by grants-in-aid fromthe Ministry of Culture, Education, Science and Sports of Japan and from CRESTO (toC.T. and M.N.) and also by Toray Science Foundation (C.T.). This paper is dedicated toS. Ebashi, a founder of Ca2+-ATPase ®eld and the father of the calcium theory.
Correspondence and requests for materials should be addressed to C.T. (e-mail:[email protected]). The atomic coordinates have been deposited in the PDB(accession code 1EUL).
articles
NATURE | VOL 405 | 8 JUNE 2000 | www.nature.com 655© 2000 Macmillan Magazines Ltd