Embed Size (px)
Citation preview
Biotechnology and Bioprocess Engineering 25: 895-930 (2020)
DOI 10.1007/s12257-020-0049-ypISSN 1226-8372
eISSN 1976-3816
Artificial Intelligence in Drug Discovery: A Comprehensive Review
of Data-driven and Machine Learning Approaches
Hyunho Kim, Eunyoung Kim, Ingoo Lee, Bongsung Bae, Minsu Park, and Hojung Nam
Received: 13 February 2020 / Revised: 27 May 2020 / Accepted: 3 June 2020
© The Korean Society for Biotechnology and Bioengineering and Springer 2020
Abstract As expenditure on drug development increases
exponentially, the overall drug discovery process requires a
sustainable revolution. Since artificial intelligence (AI) is
leading the fourth industrial revolution, AI can be considered
as a viable solution for unstable drug research and
development. Generally, AI is applied to fields with
sufficient data such as computer vision and natural language
processing, but there are many efforts to revolutionize the
existing drug discovery process by applying AI. This review
provides a comprehensive, organized summary of the
recent research trends in AI-guided drug discovery process
including target identification, hit identification, ADMET
prediction, lead optimization, and drug repositioning. The
main data sources in each field are also summarized in this
review. In addition, an in-depth analysis of the remaining
challenges and limitations will be provided, and proposals
for promising future directions in each of the aforementioned
areas.
Keywords: drug discovery, artificial intelligence, data-
driven, machine learning
1. Introduction
Small molecule drug research and development (R&D)
spending, in the pharmaceutical industry, has grown
exponentially over the past decades, with total R&D costs
per approved drug recently being about $2.6 billion [1].
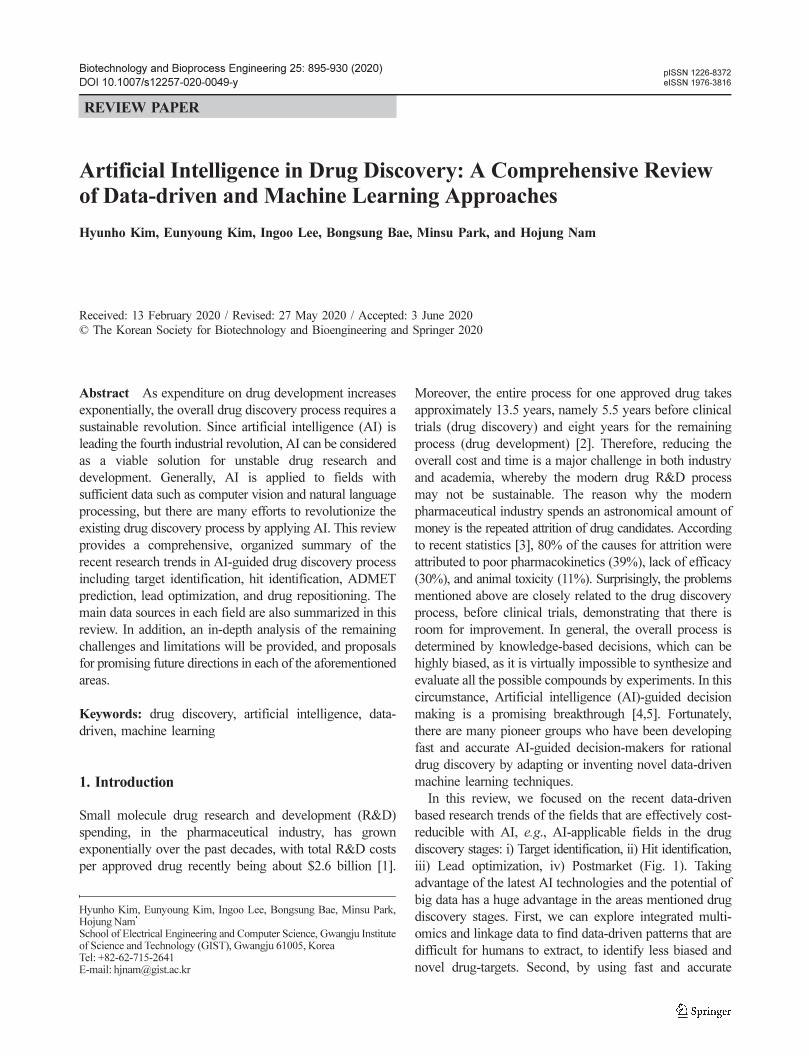
Moreover, the entire process for one approved drug takes
approximately 13.5 years, namely 5.5 years before clinical
trials (drug discovery) and eight years for the remaining
process (drug development) [2]. Therefore, reducing the
overall cost and time is a major challenge in both industry
and academia, whereby the modern drug R&D process
may not be sustainable. The reason why the modern
pharmaceutical industry spends an astronomical amount of
money is the repeated attrition of drug candidates. According
to recent statistics [3], 80% of the causes for attrition were
attributed to poor pharmacokinetics (39%), lack of efficacy
(30%), and animal toxicity (11%). Surprisingly, the problems
mentioned above are closely related to the drug discovery
process, before clinical trials, demonstrating that there is
room for improvement. In general, the overall process is
determined by knowledge-based decisions, which can be
highly biased, as it is virtually impossible to synthesize and
evaluate all the possible compounds by experiments. In this
circumstance, Artificial intelligence (AI)-guided decision
making is a promising breakthrough [4,5]. Fortunately,
there are many pioneer groups who have been developing
fast and accurate AI-guided decision-makers for rational
drug discovery by adapting or inventing novel data-driven
machine learning techniques.
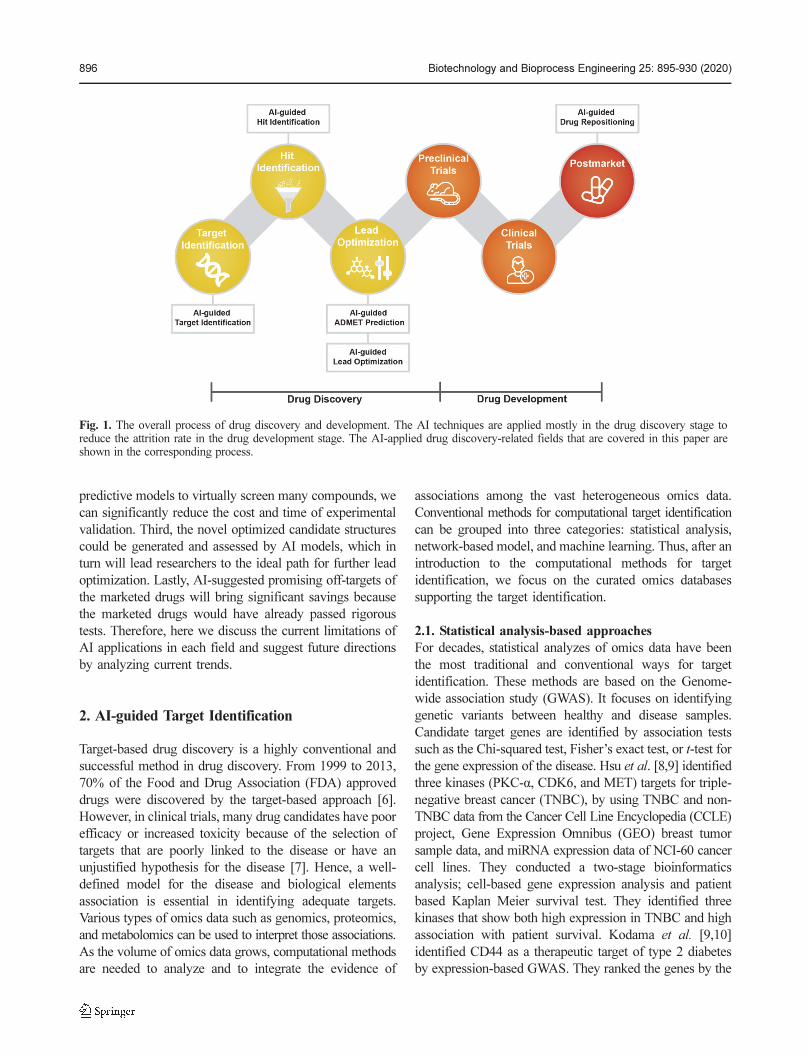
In this review, we focused on the recent data-driven
based research trends of the fields that are effectively cost-
reducible with AI, e.g., AI-applicable fields in the drug
discovery stages: i) Target identification, ii) Hit identification,
iii) Lead optimization, iv) Postmarket (Fig. 1). Taking
advantage of the latest AI technologies and the potential of
big data has a huge advantage in the areas mentioned drug
discovery stages. First, we can explore integrated multi-
omics and linkage data to find data-driven patterns that are
difficult for humans to extract, to identify less biased and
novel drug-targets. Second, by using fast and accurate
Hyunho Kim, Eunyoung Kim, Ingoo Lee, Bongsung Bae, Minsu Park,Hojung Nam*
School of Electrical Engineering and Computer Science, Gwangju Instituteof Science and Technology (GIST), Gwangju 61005, KoreaTel: +82-62-715-2641E-mail: [email protected]
REVIEW PAPER
896 Biotechnology and Bioprocess Engineering 25: 895-930 (2020)
predictive models to virtually screen many compounds, we
can significantly reduce the cost and time of experimental
validation. Third, the novel optimized candidate structures
could be generated and assessed by AI models, which in
turn will lead researchers to the ideal path for further lead
optimization. Lastly, AI-suggested promising off-targets of
the marketed drugs will bring significant savings because
the marketed drugs would have already passed rigorous
tests. Therefore, here we discuss the current limitations of
AI applications in each field and suggest future directions
by analyzing current trends.
2. AI-guided Target Identification
Target-based drug discovery is a highly conventional and
successful method in drug discovery. From 1999 to 2013,
70% of the Food and Drug Association (FDA) approved
drugs were discovered by the target-based approach [6].
However, in clinical trials, many drug candidates have poor
efficacy or increased toxicity because of the selection of
targets that are poorly linked to the disease or have an
unjustified hypothesis for the disease [7]. Hence, a well-
defined model for the disease and biological elements
association is essential in identifying adequate targets.
Various types of omics data such as genomics, proteomics,
and metabolomics can be used to interpret those associations.
As the volume of omics data grows, computational methods
are needed to analyze and to integrate the evidence of
associations among the vast heterogeneous omics data.
Conventional methods for computational target identification
can be grouped into three categories: statistical analysis,
network-based model, and machine learning. Thus, after an
introduction to the computational methods for target
identification, we focus on the curated omics databases
supporting the target identification.
2.1. Statistical analysis-based approaches
For decades, statistical analyzes of omics data have been
the most traditional and conventional ways for target
identification. These methods are based on the Genome-
wide association study (GWAS). It focuses on identifying
genetic variants between healthy and disease samples.
Candidate target genes are identified by association tests
such as the Chi-squared test, Fisher’s exact test, or t-test for
the gene expression of the disease. Hsu et al. [8,9] identified
three kinases (PKC-α, CDK6, and MET) targets for triple-
negative breast cancer (TNBC), by using TNBC and non-
TNBC data from the Cancer Cell Line Encyclopedia (CCLE)
project, Gene Expression Omnibus (GEO) breast tumor
sample data, and miRNA expression data of NCI-60 cancer
cell lines. They conducted a two-stage bioinformatics
analysis; cell-based gene expression analysis and patient
based Kaplan Meier survival test. They identified three
kinases that show both high expression in TNBC and high
association with patient survival. Kodama et al. [9,10]
identified CD44 as a therapeutic target of type 2 diabetes
by expression-based GWAS. They ranked the genes by the
Fig. 1. The overall process of drug discovery and development. The AI techniques are applied mostly in the drug discovery stage toreduce the attrition rate in the drug development stage. The AI-applied drug discovery-related fields that are covered in this paper areshown in the corresponding process.
A Review of Artificial Intelligence in Drug Discovery 897
probability of differential expression in 130 microarray
experiments. For the top candidate CD44, they validated
by diabetic mouse experiments. GWAS can identify the
associated genetic variants for the disease. However, it is
difficult to determine the effect on the gene by the selected
genetic variants. To address this issue, Zhu et al. [11]
proposed a method named SMR (Summary data based
Mendelian Randomization) to identify genes associated
with a human complex trait. They defined a pleiotropic
association considering pleiotropy or causality between
gene and a trait to make improved MR analysis. By using
SMR, they integrated the GWAS trait summary and eQTL
(expression quantitative trait locus) data and analyzed the
association between a complex trait and gene expression.
2.2. Network-based approaches
Network-based methods have been widely used to represent
the complex connections among the various biological
elements. Networks comprise nodes that represent biological
elements, and edges that represent the interaction among
the nodes. Furthermore, this approach can manage the
multiple types of omics data by the heterogeneous network.
Hence, many studies use a network-based approach for
target identification.
Conventionally, networks are constructed based on the
similarity between the targets or disease. For gene-disease
association, gene co-expression networks, represented by a
gene-gene similarity matrix has been used. This network
captures genes with similar biological process activity [12]
and helps to find the gene sets associated with disease-
pathways. Petyuk et al. [13] used network analysis to
identify a late-onset Alzheimer’s target. They constructed a
co-expression network with peptides and transcripts data to
identify the gene-protein expression relationship profiles.
Moreover, they constructed causal predictive networks to
give ordering or direction to the network edges. Lee et al.
[14] performed network analyzes to identify targets for
liver disease. They constructed gene co-expression networks
for 46 human tissues to represent the functional interaction
of genes. Moreover, they constructed liver regulatory
networks and liver protein-protein interaction networks to
investigate the physical interactions of genes.
Network-based approaches for miRNA-disease associ-
ations have also increased. It is based on the theory that
miRNA can regulate gene expression and has some role in
some diseases [15]. Chen et al. [16] proposed a miRNA-
disease association prediction model named BNPMDA
based on the assumption that similar miRNA correlates to
a similar disease. They integrated three disease similarity
and miRNA similarity models with biased ratings based on
the known miRNA-disease associations. A bipartite reco-
mmendation algorithm was used to predict the associations
based on biased ratings. Ding et al. [17] proposed an
algorithm for miRNA-disease and gene-disease association
predictions. They built the heterogenous disease-gene-
miRNA association network and predicted the disease-gene
or miRNA association by their novel algorithm named
DMHM. The main rationale of DMHM is to make smooth
functions on data manifolds by graph-based regularization.
Recently, the knowledge graph has also been used for
target identification. Knowledge graphs represent entities,
relations, and semantic information as a graph that can be
easily interpreted for a machine. Mohamed et al. [18]
proposed a knowledge graph embedding model named
TriModel. They constructed a drug-target interaction
knowledge graph from KEGG, DrugBank, InterPRo, and
UniPRot. The entity and relationship of a knowledge graph
are embedded into three embedding vectors, based on
tensor factorization, and updated in iterative learning by
minimizing false fact and maximizing true fact. Richardson
et al. [19] suggested a potential COVID-19 target and
treatment. They used BenevoletAI’s knowledge graph,
which is a repository of structured biomedical information
from machine curated relationships between over 20 types
of biomedical entities like diseases, genes, and drugs [20].
They supposed that the 2019-nCoV receptor would be ACE2
and found AAK1, which is one of the ACE2 endocytosis
regulators in the knowledge graph. In the AAK1 inhibitors
in the knowledge graph, baricitinib showed high-affinity
and binding affinity to another regulator of endocytosis.
2.3. Machine learning-based approaches
As the mechanism of disease is complex, extracting
generalized patterns of disease targets using a data-driven
approach is a challenging task. Along with this difficulty,
several pioneer studies have shown the potential power of
using machine learning techniques in drug-target identification
and can learn patterns of disease targets without prior
biological dependency information. Ferrero et al. [21]
constructed classifiers that predict whether the gene is a
drug-target or non-target. They constructed four classifiers:
Random Forest (RF), Support vector machine (SVM),
Neural Net, and Gradient Boosting Machine (GBM) with
gene-disease association data from the Open Targets platform.
They used five data types (pathway, animal model, genetic
association, RNA expression, and mutation) as input features
and assessed the feature importance for target identification.
They found four classifiers showed similar performances
of ≈ 70% accuracy with 0.75 AUC. Mamoshina et al. [22]
constructed age prediction with five regression models by
using gene expression data from GEO and ArrayExpress.
They performed feature importance analysis to identify the
most associated genes for age prediction, with the top 20
genes included five known drug-targets.
898 Biotechnology and Bioprocess Engineering 25: 895-930 (2020)
2.4. Curated databases/platforms for target identification
Large volumes of omics data and computational methods
lead to an increase in the performance of target identification.
However, problems with managing the heterogeneous
omics data still exist. First, the experimental conditions for
generating data and the formats or annotations for recording
the data are often not identical for each omics data [23].
Second, databases or publications for human diseases are
biased to specific topics [24]. To tackle these problems,
many efforts have been made to provide integrated or
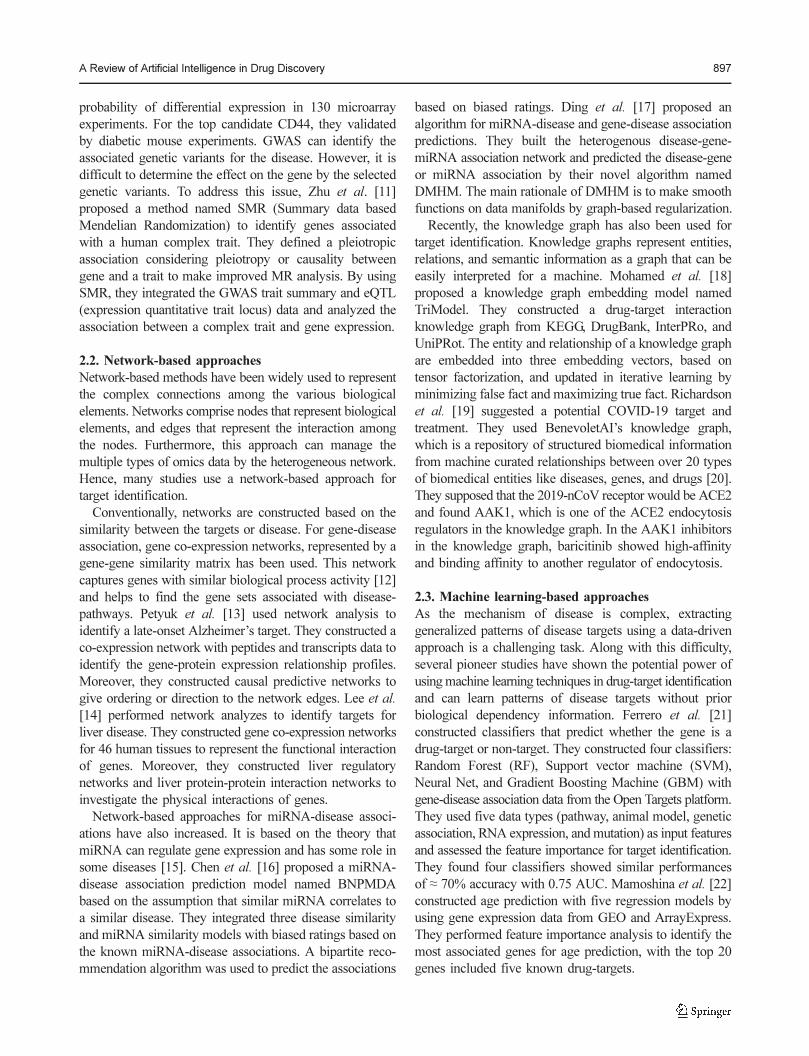
curated databases for target identification. Table 1 describes
the databases reviewed.
2.4.1. DisGeNET
DisGeNET collects disease-associated genes and variants
from various repositories, GWAS catalogs, animal models,
and publications; to overcome the heterogeneity, availability,
and fragmentation of genetic information [25]. It contains
628,685 gene-disease associations (GDA) and 210,498
variant-disease associations (VDA). All data in DisGeNET
are homogeneously annotated by using community-driven
vocabularies and ontologies. DisGeNET uses association
scores to define GDAs and VDAs according to the number
of supporting data or publications for the association. In
addition, DisGeNET provides Cytoscape APP and disgenet2r
R packages to support the visualization or analysis of the
association data. All data in DisGeNET are available as
TSV, SQLite, and RDF dump files.
2.4.2. Comparative toxicogenomics database
A comparative toxicogenomics database (CTD) provides a
comprehensive database for understanding environmental
effects on human health [26]. It curates associations among
genes, chemicals, diseases, phenotypes, and environmental
exposures in 10 public resources including KEGG, GO,
PubMed, etc. In the latest update, in 2019, the content
volume and identifiers were updated; there are 27,054,182
curated and inferred GDAs. Approximately 40,000 GDAs
are curated, and the others are inferred from the chemical-
gene or chemical-disease associations in the CTD data.
Inference scores in CTD are defined according to the
connectivity of chemical-gene-disease association networks
of CTD data. All CTD associations, interactions, and
vocabularies data are available as CSV, TSV, and XML files.
2.4.3. LinkedOmics
LinkedOmics aims to provide a comprehensive and
analytical portal for a large amount of cancer molecular
properties and clinical data [27]. It collects multi-omics
data of 32 TCGA cancer types and clinical data of 11,158
patients in the TCGA project. Multi-omics data include
genomic, epigenomic, transcriptomic data of TCGA cancer,
and clinical data including information like survival time,
age, and tumor status. It also collects mass-spectrometry-
based proteomics data of the selected TCGA tumor samples
of the Clinical Proteomic Tumor Analysis Consortium
(CPTAC). LinkedOmics provides three data analysis web
modules to support the analysis of the collected data. First,
the LinkFinder module supports identifying the association
for the query attributes to others in the database. It uses
statistical tests such as Pearson’s correlation test and
Spearman’s rank correlation to rank the associations among
the attributes. Second, the LinkCompare module compares
the association results from LinkFinder with different
Table 1. Quantity and description of curated databases for target identification
Database Description Quantity
DisGeNET [25] A discovery platform of human-disease associated genes and variants with homogeneous annotation
628 K gene-disease associations,17 K genes, 24 K diseases,210 K variant-disease associations
Comparative toxicogenomics database (CTD) [26]
Comprehensive database for environmental effects on human health. It curates associations among chemical, gene, disease, phenotype, and exposure.
27 M gene-disease association
LinkedOmics [27] Comprehensive database for molecular properties and clinical data of cancer. It collects multi-omics, clinical and Mass-spectrometry proteomics data of TCGA cancer.
13 K TCGA cancer samples
Open-Target platform [28] A comprehensive database for target-disease association. It collects genetic and chemical data to aid target identification.
6.3 M association data with 27 K targets and 13 K diseases
DepMap portal [31] A web portal providing cancer analytical and visualization tools. It contains genetic information and sensitivity of cancer cell lines.
Genetic characters of over 1 K cell lines
HMDD [30] A database that collects miRNA-disease associations based on experimental evidence from PubMed papers
35 K miRNA-disease associations from 19 K papers
STRING [38] A database of physical and functional protein-protein interactions Total 3.1 B protein interactions
Therapeutic Target Database (TTD) [39]
A database of known therapeutic proteins, nucleic acids and targeted disease with related drugs.
3.4 K Targets and 37 K Drugs information
A Review of Artificial Intelligence in Drug Discovery 899
queries. Finally, the LinkInterpreter module provides a
biological interpretation of the association from LinkFinder.
It uses pathway or network analysis to interpret the
associations. All data is available as a matrix file or external
link to the data source.
2.4.4. Open-Target platform
The Open-Target platform curates 20 public databases to
support target identification, validation, and prioritization
[28]. The types of data sources are genetic associations,
somatic mutations, drugs, pathways, RNA expression, text
mining, and animal models. It has 6,336,307 data associations
with 27,069 targets and 13,579 diseases. The Open-Target
platform prioritizes targets by the association scores to the
disease. The association scores are based on the number or
strength of evidence such as p-value and sample size.
Moreover, it provides a target tractability analysis to assist
target prioritization. This process is based on a study for
the target suitability assessment method [29]; it provides
druggability information like whether the target has ligands
or binding sites for small molecules. The association and
evidence data can be available as a JSON file and target-
disease lists are available as JSON and CSV files.
2.4.5. The human microRNA disease database
The Human microRNA Disease Database (HMDD) curates
the miRNA-disease associations based on the experimental
evidence of the literatures [30]. The datasets are collected
from miRNA related PubMed papers by using ‘microRNA’,
‘miRNA’, ‘miR’ keywords, then miRNA-disease associations
are extracted from the abstract of the selected papers. There
exist 35,547 miRNA-disease associations from 19,280
papers. In HMDD, miRNA-disease associations are repre-
sented as the supporting evidence of genetics, epigenetics,
tissue expression, miRNA-target, and circulation assay. It
also provides visualized miRNA-gene regulation networks.
In the latest update HMDD v3.2, causality annotation
which represents the positive/negative miRNA-disease
associations were added. All data are available as text or
excel files.
2.4.6. DepMap portal
The Dependency Map (DepMap) Portal supports researchers
identifying genetic and molecular dependencies of cancers
by providing datasets and tools that are used in the Cancer
Dependency Map project at the Broad Institute [31]. The
datasets included in the DepMap portal are divided into
three parts: Genetic dependency, Cellular models, and Drug
Sensitivity. First, Genetic dependency identifies genetic
vulnerabilities of human cancers by project Achilles. Project
Achilles analyzes the genetic dependency of cancer by the
genome-wide RNAi function screens [32,33]. Second,
cellular models show the genetic and pharmacological
diversity of human cancers by the CCLE project. CCLE
databases contain expression, gene copy number, mutation,
and RNAseq based fusion for cancer cell lines [34-36].
Finally, Drug Sensitivity contains the small molecule viability
of diverse cancer cell lines by the Profiling Relative
Inhibition Simultaneously in Mixtures (PRISM) approach
which shows high-throughput for cancer cell line screening
[37]. All data in the DepMap portal are available as a CSV
file.
2.4.7. STRING
The STRING (Search Tool for Retrieval of Interacting
Genes/Proteins) database provides physical and functional
interactions between proteins [38]. It contains 3,123,056,667
protein interactions of 24,528,628 proteins from 5,090
organisms. There are five categories for association evidence:
genomic context prediction, experiments data, text mining,
co-expression, and prior knowledge in databases. In the
STRING database, ‘normal’ and ‘transferred’ scores exist.
The normal score represents the evidence from the organism
itself and transferred represents the evidence transferred
from other homolog organisms. The score ranks 0-1, and
as the score increases, confidence increases. All interaction
data in the STRING database is available in a web service.
2.4.8. Therapeutic target database
The TTD (Therapeutic Target Database) provides information
about known therapeutic protein and nucleic acid, disease,
pathway, and the corresponding drugs of targets in literature
[39], with 3,419 targets and 37,316 drugs. The database in
TTD is categorized into five groups; Advanced search,
Target group, Drug group, Patient data, and Model &
Study; they can be browsed in the TTD web service. In the
latest update in 2020, the new information about target
regulators, target interacting protein, patented agents, and
targets were expanded. All data in TTD are available and
can be downloaded via the web service.
2.5. Limitations and future directions
As mentioned in section 2.4, there are problems when
using databases from different sources. These issues may
be avoided by using curated databases. However, there are
limitations for the curated databases.
The major limitation in data curation is the absence of
validation or benchmarks for the target-disease association
scores. As seen above, for Open Targets and DisGeNET, the
target-disease association scores are based on the number
of publications or databases with supporting evidence.
However, the number of supporting evidence in data
sources does not directly correlate with the efficacy of
target modification. Hence, the scores need to be validated
900 Biotechnology and Bioprocess Engineering 25: 895-930 (2020)
by experiments, or benchmark studies. Another limitation
of data curation is the lack of target druggability information.
Most databases present only the supporting evidence or
number of supporting evidence from the data sources. For
drug discovery, besides the target’s efficacy or effect on the
disease, the possibility for target modification by a drug is
also needed. The Open-Target platform provides target
tractability, which shows whether the target has a ligand or
binding site for small molecules. Pearson et al. [40] proposed
a target druggability software named TractaViewer which
provides molecular ligand abilities or potential risks.
Finally, the utilization of curated databases needs to be
increased. Most of the curated databases mentioned in
section 2.4 have been activated later than the traditional
databases, and reference for using these curated databases
are not widely distributed. In addition, curated databases
are lack of programmatic accessibility. Like the disgenet2r
package of DisGeNET, a programmatic accessible package
may activate the usage of curated databases.
3. AI-guided Hit Identification
Identifying drug-target interactions is one of the crucial
steps in preclinical drug discovery. Desired effects of the
drugs depend on the interaction between the drug and
selected target, while the possibility of side effects and drug
repositioning can also come from interactions between
proteins that are not targeted during drug development
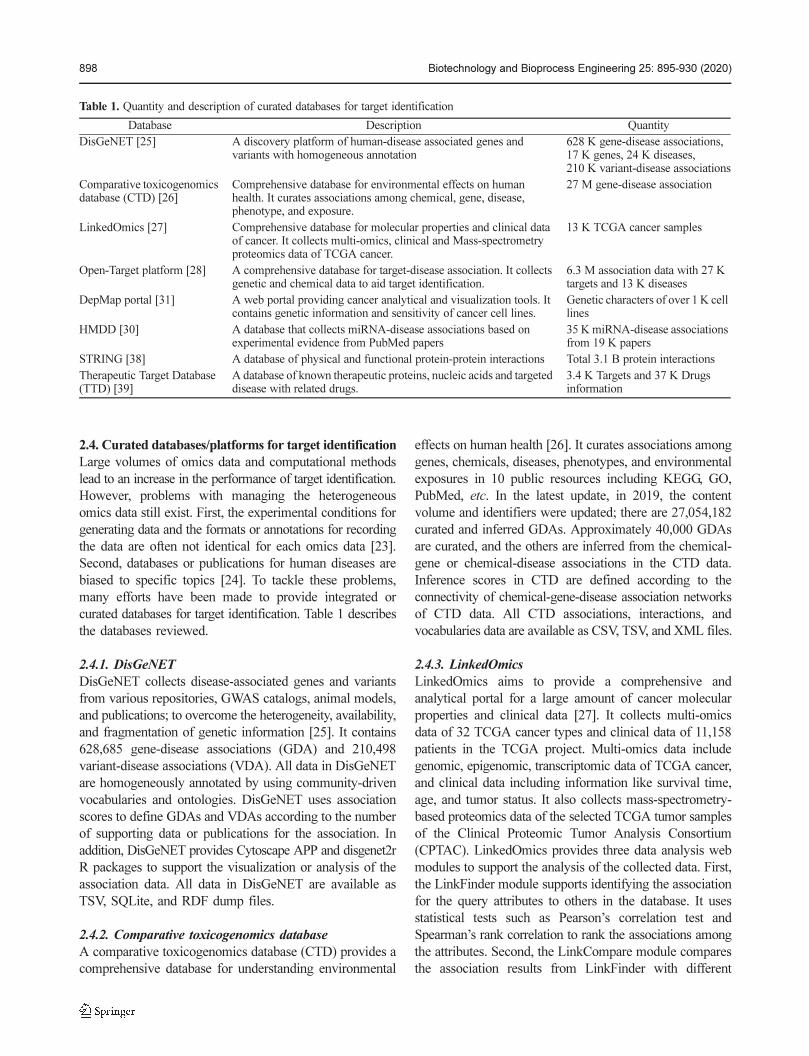
[41]. However, it is difficult to search the entire chemical
space of compounds for druggable target proteins by
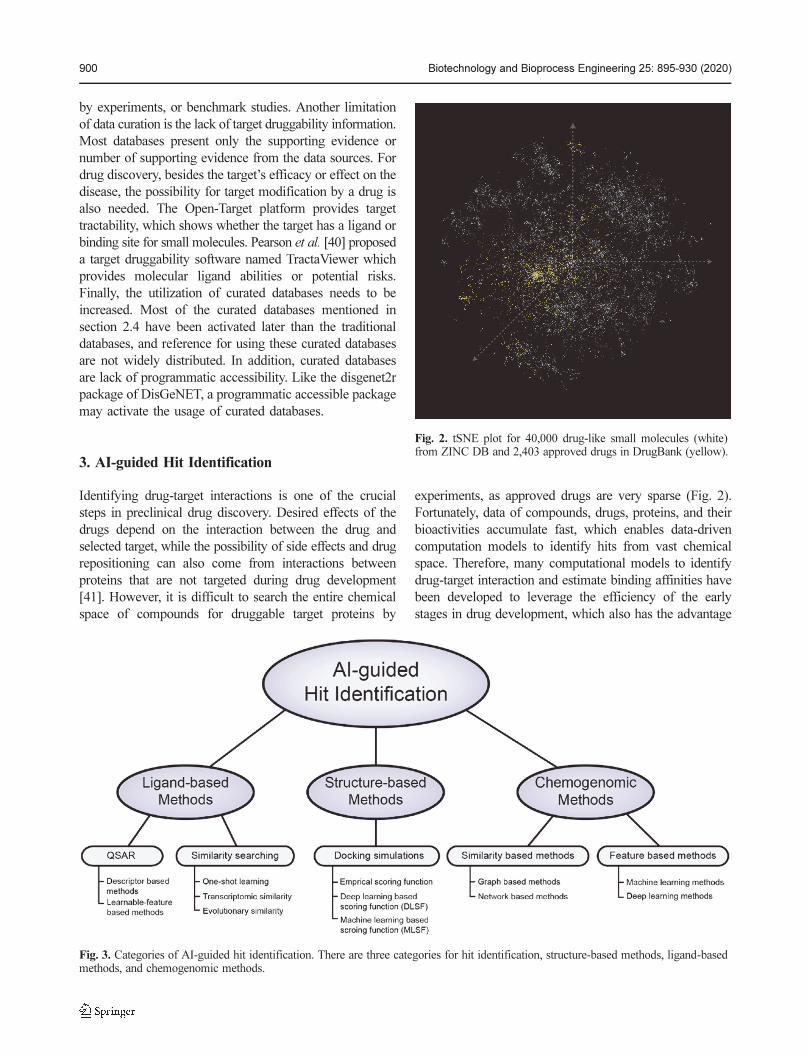
experiments, as approved drugs are very sparse (Fig. 2).
Fortunately, data of compounds, drugs, proteins, and their
bioactivities accumulate fast, which enables data-driven
computation models to identify hits from vast chemical
space. Therefore, many computational models to identify
drug-target interaction and estimate binding affinities have
been developed to leverage the efficiency of the early
stages in drug development, which also has the advantage
Fig. 2. tSNE plot for 40,000 drug-like small molecules (white)from ZINC DB and 2,403 approved drugs in DrugBank (yellow).
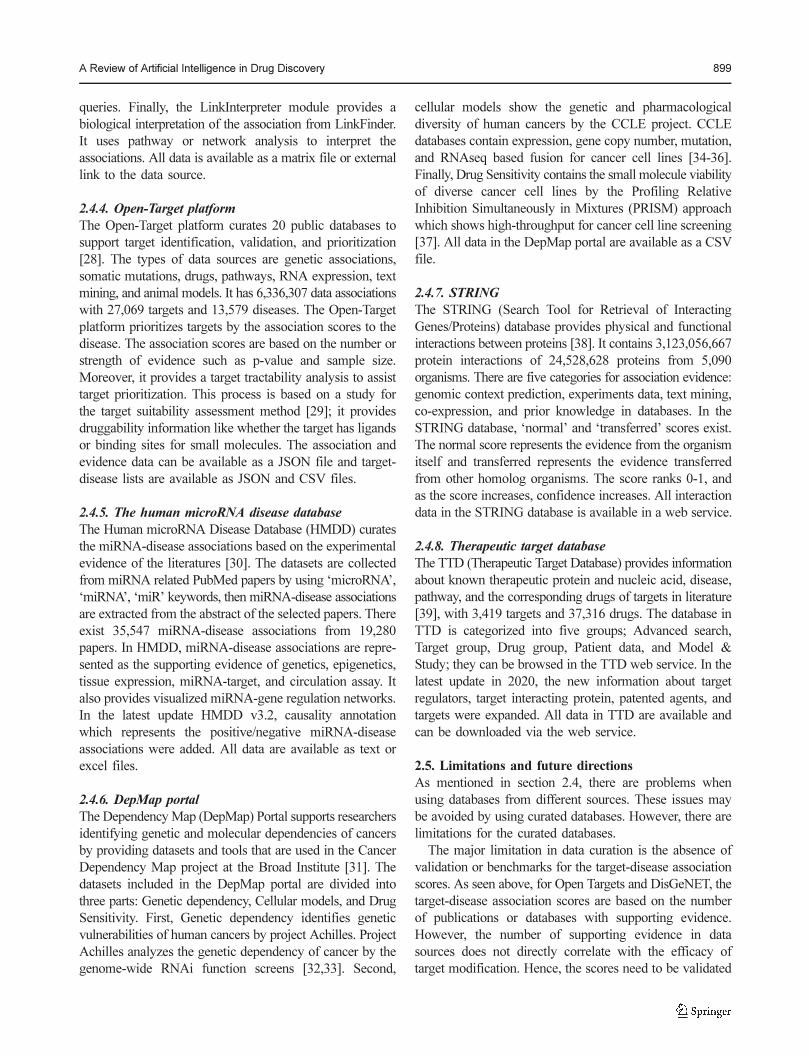
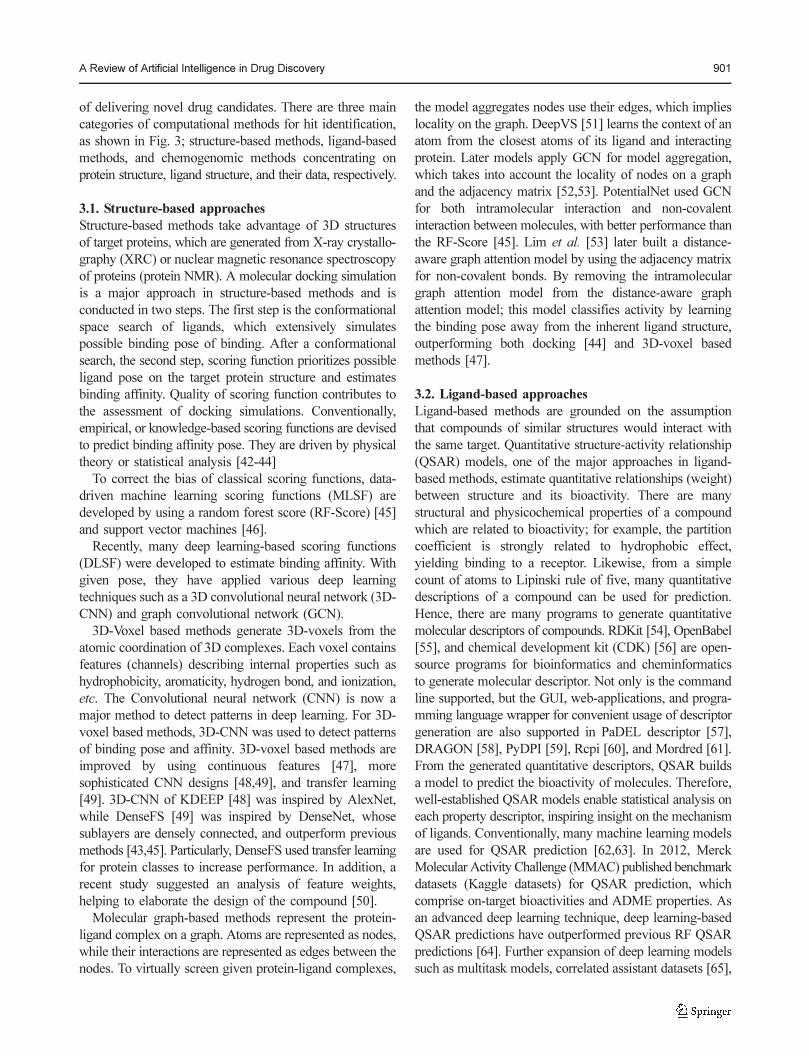
Fig. 3. Categories of AI-guided hit identification. There are three categories for hit identification, structure-based methods, ligand-basedmethods, and chemogenomic methods.
A Review of Artificial Intelligence in Drug Discovery 901
of delivering novel drug candidates. There are three main
categories of computational methods for hit identification,
as shown in Fig. 3; structure-based methods, ligand-based
methods, and chemogenomic methods concentrating on
protein structure, ligand structure, and their data, respectively.
3.1. Structure-based approaches
Structure-based methods take advantage of 3D structures
of target proteins, which are generated from X-ray crystallo-
graphy (XRC) or nuclear magnetic resonance spectroscopy
of proteins (protein NMR). A molecular docking simulation
is a major approach in structure-based methods and is
conducted in two steps. The first step is the conformational
space search of ligands, which extensively simulates
possible binding pose of binding. After a conformational
search, the second step, scoring function prioritizes possible
ligand pose on the target protein structure and estimates
binding affinity. Quality of scoring function contributes to
the assessment of docking simulations. Conventionally,
empirical, or knowledge-based scoring functions are devised
to predict binding affinity pose. They are driven by physical
theory or statistical analysis [42-44]
To correct the bias of classical scoring functions, data-
driven machine learning scoring functions (MLSF) are
developed by using a random forest score (RF-Score) [45]
and support vector machines [46].
Recently, many deep learning-based scoring functions
(DLSF) were developed to estimate binding affinity. With
given pose, they have applied various deep learning
techniques such as a 3D convolutional neural network (3D-
CNN) and graph convolutional network (GCN).
3D-Voxel based methods generate 3D-voxels from the
atomic coordination of 3D complexes. Each voxel contains
features (channels) describing internal properties such as
hydrophobicity, aromaticity, hydrogen bond, and ionization,
etc. The Convolutional neural network (CNN) is now a
major method to detect patterns in deep learning. For 3D-
voxel based methods, 3D-CNN was used to detect patterns
of binding pose and affinity. 3D-voxel based methods are
improved by using continuous features [47], more
sophisticated CNN designs [48,49], and transfer learning
[49]. 3D-CNN of KDEEP [48] was inspired by AlexNet,
while DenseFS [49] was inspired by DenseNet, whose
sublayers are densely connected, and outperform previous
methods [43,45]. Particularly, DenseFS used transfer learning
for protein classes to increase performance. In addition, a
recent study suggested an analysis of feature weights,
helping to elaborate the design of the compound [50].
Molecular graph-based methods represent the protein-
ligand complex on a graph. Atoms are represented as nodes,
while their interactions are represented as edges between the
nodes. To virtually screen given protein-ligand complexes,
the model aggregates nodes use their edges, which implies
locality on the graph. DeepVS [51] learns the context of an
atom from the closest atoms of its ligand and interacting
protein. Later models apply GCN for model aggregation,
which takes into account the locality of nodes on a graph
and the adjacency matrix [52,53]. PotentialNet used GCN
for both intramolecular interaction and non-covalent
interaction between molecules, with better performance than
the RF-Score [45]. Lim et al. [53] later built a distance-
aware graph attention model by using the adjacency matrix
for non-covalent bonds. By removing the intramolecular
graph attention model from the distance-aware graph
attention model; this model classifies activity by learning
the binding pose away from the inherent ligand structure,
outperforming both docking [44] and 3D-voxel based
methods [47].
3.2. Ligand-based approaches
Ligand-based methods are grounded on the assumption
that compounds of similar structures would interact with
the same target. Quantitative structure-activity relationship
(QSAR) models, one of the major approaches in ligand-
based methods, estimate quantitative relationships (weight)
between structure and its bioactivity. There are many
structural and physicochemical properties of a compound
which are related to bioactivity; for example, the partition
coefficient is strongly related to hydrophobic effect,
yielding binding to a receptor. Likewise, from a simple
count of atoms to Lipinski rule of five, many quantitative
descriptions of a compound can be used for prediction.
Hence, there are many programs to generate quantitative
molecular descriptors of compounds. RDKit [54], OpenBabel
[55], and chemical development kit (CDK) [56] are open-
source programs for bioinformatics and cheminformatics
to generate molecular descriptor. Not only is the command
line supported, but the GUI, web-applications, and progra-
mming language wrapper for convenient usage of descriptor
generation are also supported in PaDEL descriptor [57],
DRAGON [58], PyDPI [59], Rcpi [60], and Mordred [61].
From the generated quantitative descriptors, QSAR builds
a model to predict the bioactivity of molecules. Therefore,
well-established QSAR models enable statistical analysis on
each property descriptor, inspiring insight on the mechanism
of ligands. Conventionally, many machine learning models
are used for QSAR prediction [62,63]. In 2012, Merck
Molecular Activity Challenge (MMAC) published benchmark
datasets (Kaggle datasets) for QSAR prediction, which
comprise on-target bioactivities and ADME properties. As
an advanced deep learning technique, deep learning-based
QSAR predictions have outperformed previous RF QSAR
predictions [64]. Further expansion of deep learning models
such as multitask models, correlated assistant datasets [65],
902 Biotechnology and Bioprocess Engineering 25: 895-930 (2020)
and deep belief networks (DBN) [66] have been developed
to increase performance.
Still, limitations of descriptors have been reported [67];
molecular fingerprints are sparse, and there is a possibility
for collisions in hashing. To overcome these limitations,
many learnable feature-based methods have been developed,
where the model learns local patterns and orders in raw
data itself. Lusci et al. [68] proposed the model that takes
a graph structure of a compound whose nodes are compound
atoms. To generate a feature of a compound, they built
recurrent neural networks (RNN) on every node in a
compound by building a directed acyclic graph and
summed up RNN results to generate features. Neural graph
fingerprints [69] mimicked Morgan algorithms [70], bringing
atom features in radius, while neural graph fingerprints
yielded continuous features of hidden layers to solve sparsity
of Morgan fingerprints. Mol2vec [71] generates compound
features that can be used to predict bioactivities by applying
the Word2vec algorithm on a compound’s molecular graph.
Simplified molecular-input line-entry system (SMILES) is
a well-defined representation of chemical compounds,
converting the molecular graph to a sequence of atoms and
bonds. To deal with the sequential representation of
SMILES, LSTM deals with sequential data which have
ordered in a series of data points. Chakravarti et al. applied
LSTM on established SMILES to predict bioactivities [72].
In contrast, Winter et al. translated the International Union
of Pure and Applied Chemistry (IUPAC) representation of
compounds into SMILES and InChI, which provides
comprehensive latent representation [73]. This model
comprises an encoder and a decoder. The encoder provides
a latent representation of input characters while the decoder
uses them as input to generate output SMILES or InChI.
Hence, intermediate latent variables are trained to predict
bioactivities. SMILES-BERT [74] applied a model and
training scheme of BERT [75] on SMILES string. BERT
model was pre-trained to recover masked SMILES tokens
from the rest of SMILES string with the assumption that it
can learn the relationships among atoms by multi-head
attention. Especially, representation token is attached to
original SMILES, which are trained during fine-tuning,
entailing relative importance on a specific molecular property.
While many QSAR studies have been developed, similarity-
based ligand screening models have been improved. One-
shot learning models [76], which are designed for over-
coming a small set of data, iteratively update prediction
models for test data according to similarities between the
pretrained representation of the compound. Compounds
are embedded using GCN while the contexts of training
data are considered by bi-directional LSTM. Embeddings
of samples in the test dataset are updated using attention-
LSTM, in which attention is calculated by the similarity
between training samples. Unfortunately, in the virtual
screening benchmark [77], RF outperforms a one-shot
learning model. Besides target protein bioactivity, similarities
in transcriptomic expressions can also screen for active
compounds (ReSimNet) [78]. ReSimNet takes two
compounds with identical extended-connectivity circular
fingerprints (ECFPs) [70] as input to predict CMap score,
which is a standardized measurement that indicates
expression similarity between compound pairs regarding
the reference gene set [79]. Each compound is fed into
Multi-Layer Perceptron (MLP) and cosine similarity
between their latent representation is translated to a
Connectivity Map (CMap) score. Therefore, ReSimNet
gives a better performance than the conventional machine
learning model of ECFP and Mol2Vec [71]. Conversely,
the ensemble model of the hierarchical evolutionary
chemical binding similarity (ECBS) tree builds more
reliable screening results [80]. While the QSAR model
concentrates on compounds of a specific target, the ECBS
model takes advantage of the evolutionary features of
targets. It takes two compounds; a known compound of the
target and a compound to predict. ECBS label compound
pairs with hierarchical evolution relationship. For example,
if compound C1 and C2 have targets in the same family,
they have a positive relationship between family-ECBS. By
integrating models of compound pairs, they provided
candidate compounds for serine/arginine protein kinases 1
and 2.
3.3. Chemogenomic approaches
Chemogenomic methods use the information of both target
proteins and compounds. The exponential increase of
protein, compound, and drug-target interaction (DTI) data
leverages the quality and diversity of chemogenomic
methods [81]. Chemogenomic methods are conventionally
classified in two categories, similarity methods and feature-
based methods [82].
3.3.1. Similarity-based approaches
Similarity-based methods concentrate on similarities between
gathered proteins and compounds to predict DTIs. Well-
designed similarity metrics between proteins and compounds
can be generated by various means including topological
similarity in graphs and networks, normalized Smith-
Waterman scores, Tanimoto coefficient, and hamming
distance between protein domains. One remarkable research
using the graph-based method is the bipartite local model
(BLM) [83]. BLM builds a bipartite graph between drugs
and targets and predicts interactions from two sides, the
target and drug sides, resulting in a final prediction by
aggregating both. Similarity matrices from targets and
compounds are taken as a kernel of SVM, building
A Review of Artificial Intelligence in Drug Discovery 903
interaction classification hyperplanes for the interacting
partners. Successful performances of similarity-based methods
come from well-defined similarity metrics and well-studied
kernel methods [82]. To increase the performance, many
regularization techniques on the graph of BLM, such as
Laplacian regularized least square (LapRLS) [84], Gaussian
interaction profiles (GIP) [85], and Kronecker regularized
least square (kronRLS) are applied [86]. Furthermore,
credible negative interactions are sampled from unlabeled
interactions to build clear discriminative hyperplanes in the
pharmacological space (Self-BLM) [87].
Network-based methods build heterogeneous networks
from proteins, drugs, diseases, side effects, and their interac-
tions. By diversifying from the known target and compound,
it prioritizes interacting partners which have an opportunity
as a candidate (NRWRH) [88]. In addition, recent studies
integrated diverse networks of drugs and proteins to low
dimensional informative feature vectors to predict DTIs
(DTINet) [89]. DTINet learns a low dimensional represen-
tation of graph topology using the DCA algorithm [90] from
the heterogeneous network. DTINet trains the projection
matrix from known DTIs, which translates drug represen-
tations into protein representations.
3.3.2. Feature-based approaches
Feature-based methods take feature vectors of targets and
compounds, which is the fixed length of a vector that
describes important physicochemical properties. They
concatenate vectors of drug and target pairs and train
machine learning models to classify DTIs with given feature
vectors of interaction and their labels. The previous model
usually took chemical fingerprints [70,91] as compound
features, and many physicochemical properties as protein
features [92,93]. On constructed features, RF and SVM are
trained to classify DTI [94]. To increase prediction perfor-
mance, a drug-target feature can be weighted by networks
of protein-protein interaction and drug-drug interaction
[95,96]. To expand on deep learning models, many studies
were suggested to apply a deep learning model on feature-
based methods. A Restricted Boltzmann machine, stack of
restricted Boltzmann machine, and DBN are applied for
the reliable abstraction of features [97,98]. Likewise, a
sparse autoencoder was used to build deep representation
[99]. Deep representation of original features builds clearer
hyperplanes while they are fed into a deeper layer, outper-
forming previous machine learning methods [51]. However,
feature-based methods have many limitations, including
the loss of information during feature engineering. Fixed
length of feature vectors usually describes global physico-
chemical properties, losing informative local information
while features are aggregated [92].
3.3.3. Learnable feature-based approaches
One of the many advantages of deep learning is that it can
deal with any data structure. For example, the CNN works
well for image data with a locality, while RNN is a suitable
model for sequential data. In addition, deep learning can
entail connectivity in a graph, aggregating locality, which is
called graph convolution. Therefore, deep learning models
can extract informative local features and their dependency,
outperforming previous feature-based methods.
DeepDTA [100] applied CNN on protein amino acid
sequences and compound SMILES, which captures local
patterns in raw data. Therefore, DeepDTA performed better
than the previous similarity-based [86] and feature-based
methods [101]. Tsubaki et al. [102] suggested a model
applying CNN on protein sequence and GCN on compounds
and to aggregate compound-protein pairs, applied an
attention mechanism that gives high weights on interaction
sites in proteins; showing better performance than previous
similarity-based [83,85,103] and structure-based methods
[43,44,47]. DeepConv-DTI [104] used multiple-size kernels
of CNN on the protein sequence. DeepConv-DTI demon-
strated that detection of a binding region on protein by
CNN could be statistically validated and detected regions
featurize proteins. DeepConv-DTI performs better than
previous deep learning methods [51,98-100]. DeepAffinity
[105] first represented proteins as a structural property
sequence (SPS) and embedded SPS and compounds with
the Seq2Seq model. They applied attention mechanisms
and 1D-CNN embedded proteins and compounds to
predict the affinity of binding pairs. DeepAffinity proved
target selectivity of drugs for many protein classes and
predicted binding sites on proteins.
3.4. Limitations and future directions
The most representative limitation of the structure-based
approach is an insufficient number of 3D-structure datasets
and the difficulty in assessing the accuracy of the 3D-
structure. Likewise, the lack of activity data relative to the
complexity of the model is also a problem for the deep
learning model [67]. Inevitably, overfitting in deep learning
models is induced by a small data size [67]. For example,
it is reported that ML-based scoring functions are not
suitable for comparative assessment of scoring functions
(CASF) [106]. Besides the problem of overfitting, biases in
datasets are reported in the Directory of Useful Decoys-
Enhanced (DUD-E) and Maximum Unbiased Validation
(MUV) [107,108]. Recently developed chemogenomic
models are built and evaluated with different datasets.
Consequently, extensive external validation is needed for
fair comparison over bias in training. For chemogenomic
models, there are many deep learning protein models,
904 Biotechnology and Bioprocess Engineering 25: 895-930 (2020)
entailing inherent protein characteristics, that are not used
in previous models [109,110]. Featurization by using those
models will improve performance.
3.5. Public databases for hit identification
Currently, many compounds, target proteins, and bioactivities
are deposited in a public database. The number of compounds,
drugs, target proteins, their interactions, and bioactivities
increases exponentially [81]. 3D structures are also quickly
accumulating annually in the Protein Data Bank (PDB)
[111], enabling data-driven scoring functions. Besides an
increase of screening data, the organization of data for a
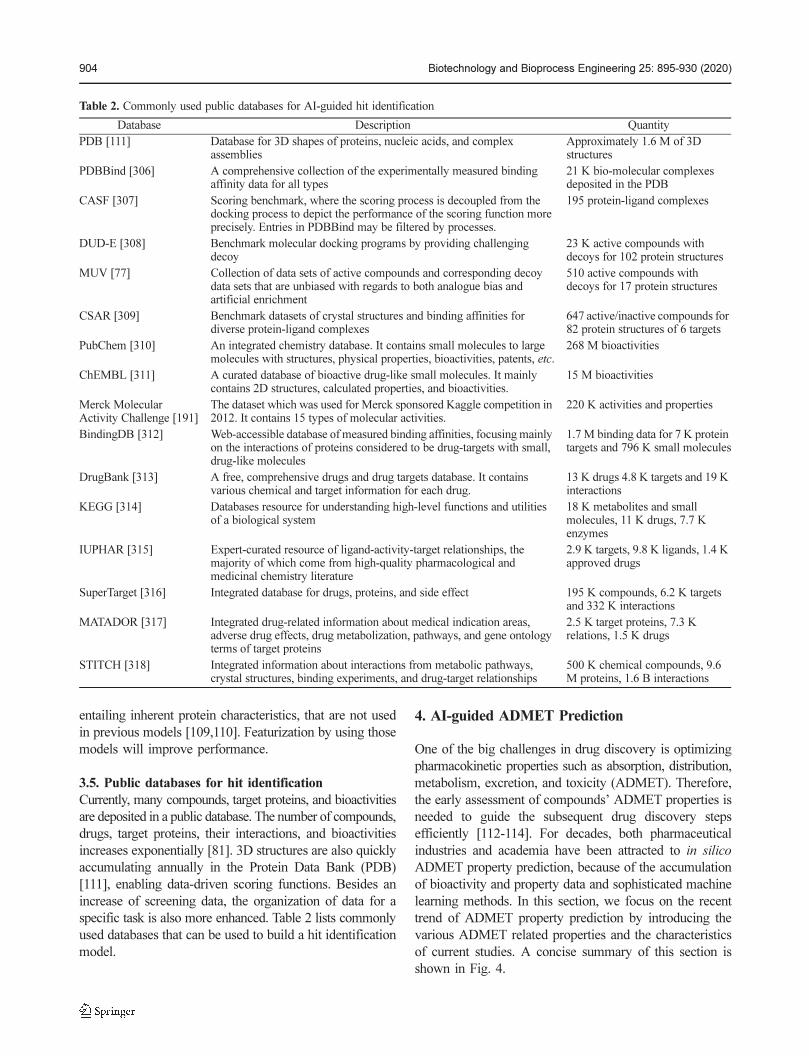
specific task is also more enhanced. Table 2 lists commonly
used databases that can be used to build a hit identification
model.
4. AI-guided ADMET Prediction
One of the big challenges in drug discovery is optimizing
pharmacokinetic properties such as absorption, distribution,
metabolism, excretion, and toxicity (ADMET). Therefore,
the early assessment of compounds’ ADMET properties is
needed to guide the subsequent drug discovery steps
efficiently [112-114]. For decades, both pharmaceutical
industries and academia have been attracted to in silico
ADMET property prediction, because of the accumulation
of bioactivity and property data and sophisticated machine
learning methods. In this section, we focus on the recent
trend of ADMET property prediction by introducing the
various ADMET related properties and the characteristics
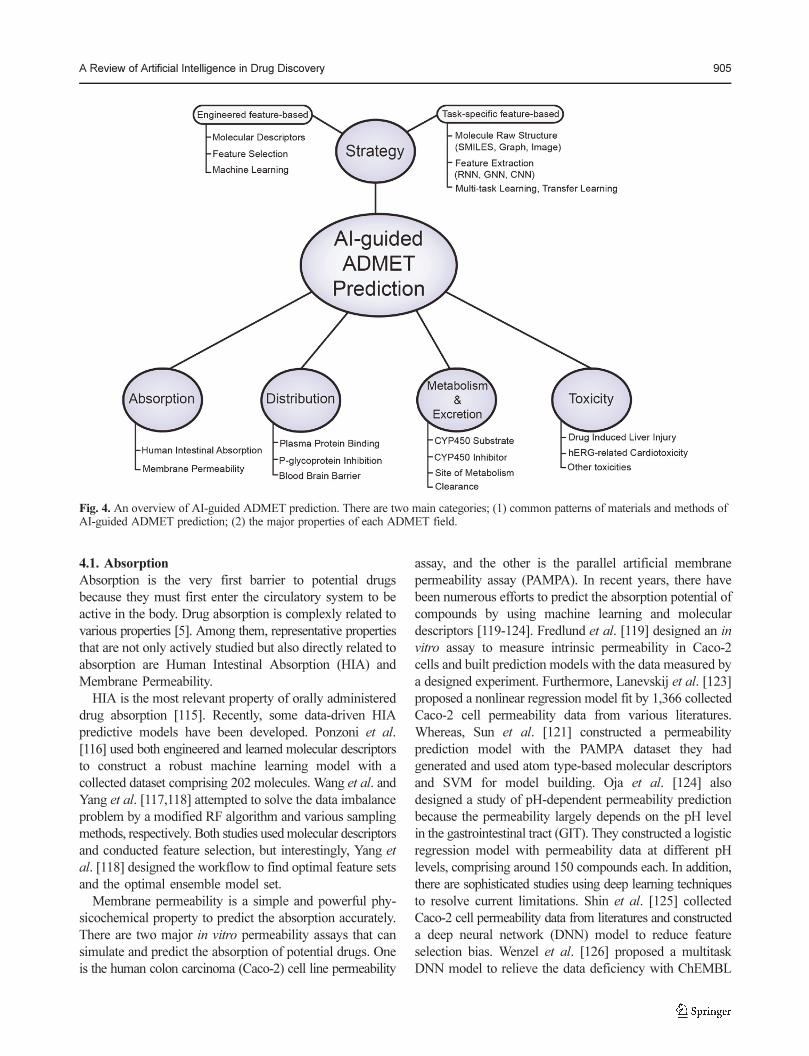
of current studies. A concise summary of this section is
shown in Fig. 4.
Table 2. Commonly used public databases for AI-guided hit identification
Database Description Quantity
PDB [111] Database for 3D shapes of proteins, nucleic acids, and complex assemblies
Approximately 1.6 M of 3D structures
PDBBind [306] A comprehensive collection of the experimentally measured binding affinity data for all types
21 K bio-molecular complexes deposited in the PDB
CASF [307] Scoring benchmark, where the scoring process is decoupled from the docking process to depict the performance of the scoring function more precisely. Entries in PDBBind may be filtered by processes.
195 protein-ligand complexes
DUD-E [308] Benchmark molecular docking programs by providing challenging decoy
23 K active compounds with decoys for 102 protein structures
MUV [77] Collection of data sets of active compounds and corresponding decoy data sets that are unbiased with regards to both analogue bias and artificial enrichment
510 active compounds with decoys for 17 protein structures
CSAR [309] Benchmark datasets of crystal structures and binding affinities for diverse protein-ligand complexes
647 active/inactive compounds for 82 protein structures of 6 targets
PubChem [310] An integrated chemistry database. It contains small molecules to large molecules with structures, physical properties, bioactivities, patents, etc.
268 M bioactivities
ChEMBL [311] A curated database of bioactive drug-like small molecules. It mainly contains 2D structures, calculated properties, and bioactivities.
15 M bioactivities
Merck Molecular Activity Challenge [191]
The dataset which was used for Merck sponsored Kaggle competition in 2012. It contains 15 types of molecular activities.
220 K activities and properties
BindingDB [312] Web-accessible database of measured binding affinities, focusing mainly on the interactions of proteins considered to be drug-targets with small, drug-like molecules
1.7 M binding data for 7 K protein targets and 796 K small molecules
DrugBank [313] A free, comprehensive drugs and drug targets database. It contains various chemical and target information for each drug.
13 K drugs 4.8 K targets and 19 K interactions
KEGG [314] Databases resource for understanding high-level functions and utilities of a biological system
18 K metabolites and small molecules, 11 K drugs, 7.7 K enzymes
IUPHAR [315] Expert-curated resource of ligand-activity-target relationships, the majority of which come from high-quality pharmacological and medicinal chemistry literature
2.9 K targets, 9.8 K ligands, 1.4 K approved drugs
SuperTarget [316] Integrated database for drugs, proteins, and side effect 195 K compounds, 6.2 K targets and 332 K interactions
MATADOR [317] Integrated drug-related information about medical indication areas, adverse drug effects, drug metabolization, pathways, and gene ontology terms of target proteins
2.5 K target proteins, 7.3 K relations, 1.5 K drugs
STITCH [318] Integrated information about interactions from metabolic pathways, crystal structures, binding experiments, and drug-target relationships
500 K chemical compounds, 9.6 M proteins, 1.6 B interactions
A Review of Artificial Intelligence in Drug Discovery 905
4.1. Absorption
Absorption is the very first barrier to potential drugs
because they must first enter the circulatory system to be
active in the body. Drug absorption is complexly related to
various properties [5]. Among them, representative properties
that are not only actively studied but also directly related to
absorption are Human Intestinal Absorption (HIA) and
Membrane Permeability.
HIA is the most relevant property of orally administered
drug absorption [115]. Recently, some data-driven HIA
predictive models have been developed. Ponzoni et al.
[116] used both engineered and learned molecular descriptors
to construct a robust machine learning model with a
collected dataset comprising 202 molecules. Wang et al. and
Yang et al. [117,118] attempted to solve the data imbalance
problem by a modified RF algorithm and various sampling
methods, respectively. Both studies used molecular descriptors
and conducted feature selection, but interestingly, Yang et
al. [118] designed the workflow to find optimal feature sets
and the optimal ensemble model set.
Membrane permeability is a simple and powerful phy-
sicochemical property to predict the absorption accurately.
There are two major in vitro permeability assays that can
simulate and predict the absorption of potential drugs. One
is the human colon carcinoma (Caco-2) cell line permeability
assay, and the other is the parallel artificial membrane
permeability assay (PAMPA). In recent years, there have
been numerous efforts to predict the absorption potential of
compounds by using machine learning and molecular
descriptors [119-124]. Fredlund et al. [119] designed an in
vitro assay to measure intrinsic permeability in Caco-2
cells and built prediction models with the data measured by
a designed experiment. Furthermore, Lanevskij et al. [123]
proposed a nonlinear regression model fit by 1,366 collected
Caco-2 cell permeability data from various literatures.
Whereas, Sun et al. [121] constructed a permeability
prediction model with the PAMPA dataset they had
generated and used atom type-based molecular descriptors
and SVM for model building. Oja et al. [124] also
designed a study of pH-dependent permeability prediction
because the permeability largely depends on the pH level
in the gastrointestinal tract (GIT). They constructed a logistic
regression model with permeability data at different pH
levels, comprising around 150 compounds each. In addition,
there are sophisticated studies using deep learning techniques
to resolve current limitations. Shin et al. [125] collected
Caco-2 cell permeability data from literatures and constructed
a deep neural network (DNN) model to reduce feature
selection bias. Wenzel et al. [126] proposed a multitask
DNN model to relieve the data deficiency with ChEMBL
Fig. 4. An overview of AI-guided ADMET prediction. There are two main categories; (1) common patterns of materials and methods ofAI-guided ADMET prediction; (2) the major properties of each ADMET field.
906 Biotechnology and Bioprocess Engineering 25: 895-930 (2020)
dataset which contains Caco-2 cell permeability and micro-
somal clearances.
4.2. Distribution
When a drug is administered or absorbed into the
bloodstream, it needs to be transported to the desired site of
action to be effective. This feature of the drug is called
distribution. The distribution of a drug is a complex function
of diverse properties; therefore, significant efforts are made
by many researchers to predict the distribution rate of
potential drugs. In this section, we surveyed representative
distribution-related property prediction research, plasma
protein binding (PPB) rate, P-glycoprotein (P-gp) inhibition,
and blood-brain barrier (BBB) permeability.
PPB rate is the percentage of the molecules that bind to
plasma proteins such as human serum albumin, lipoprotein,
and alpha-acid glycoprotein, among others. The binding
rate of drugs to the plasma protein is an important property
to predict distribution because the drug molecules have no
pharmacological effect when they form the protein-ligand
complex, although they have reached the target tissues
[127]. With the in vivo or in vitro measured data, the in
silico PPB predictive models are still actively studied [128-
132]. Wang et al. [129] collected a comprehensive PPB
dataset from various literatures and the DrugBank database
and constructed a prediction model with the optimized
feature set and the ensemble of various machine learning
models. Sun et al. [130] integrated three data sources from
literature and public databases to build a robust prediction
model. For modeling, engineered molecular descriptors
and various machine learning models are used. Toma et al.
[131] collected in vivo data for PPB prediction modeling.
They calculated molecular 2D descriptors and SMILES-
based features and trained the RF model. Zhuyifan et al.
[132] proposed multitask DNN architecture to predict few
ADME properties such as PPB rate, half-life, etc.
Interestingly, the model was pretrained with the molecular
property benchmark dataset from DeepChem to estimate
the vast chemical space.
P-gp is the membrane transporter, which is also well
known as multi-drug resistance protein 1 (MDR1). The
role of P-gp is to actively transport foreign substances out
of cells. Thus, the inhibition of P-gp is directly related to
the concentration of drug in the target tissue. Recently,
several machine learning-based P-gp inhibitor prediction
models were developed [133-135], all of which constructed
the prediction models with various machine learning
algorithms and engineered molecular descriptors as features
such as molecular fingerprints [134], 2D or 3D descriptors
[135], and SMILES-based features [133]. Notably, Kumar
et al. [135] used 3D-RISM-KH based solvation free energy
descriptors to increase performance. Meanwhile, Shi et al.
[136] used CNN to extract a task-specific feature of the
molecule and predicted its four ADMET properties from
the 2D structure image. The dataset contains CYP1A2
inhibitors, P-gp inhibitors, BBB penetrating agents, and
Ames mutagens.
BBB permeability is a major hurdle for developing central
nervous system targeted drugs because BBB protects the
brain from foreign substances in the blood. At present,
many researchers are attempting to make accurate prediction
models and find structural patterns. Both machine learning-
based [137-139] and deep learning-based models [136,140]
for BBB prediction appear currently. While Toropov et al.
[137] built a model with SMILES-based features generated
by CORAL software and 291 substances, Wang et al. [138]
and Yuan et al. [139] used conventional 2D molecular
descriptors and fingerprints as features and fit the model
with a relatively large dataset containing 2,358 and 3,538
compounds, respectively. Recently, Miao et al. [140]
published an interesting study of deep learning-based BBB
prediction. The author designed a unique drug-phenotype
feature derived from the SIDER database and the Medical
Dictionary for Regulatory Activities. The proposed feature
and DNN combination outperformed other conventional
machine learning-based models.
4.3. Metabolism & excretion
Metabolism is a biotransformation process that is mediated
by various metabolic enzymes. The drug can be transformed
into other compounds that can be excreted or activated
[127], or can affect the metabolic process which controls
the activation or excretion of other drugs. Excretion is the
process of eliminating the foreign compound from the
body. This is an important feature of a drug because the
dose of a drug is determined by the excretion factor. In fact,
drug excretion is a complex function of both chemical and
physiological features and also managed by the drug
metabolic process in direct or indirect ways. Therefore,
there are only a few recent studies that directly predict the
excretion-related properties. Thus, in this subsection, we
combined two categories: metabolism and excretion, and
focused on both general metabolic properties and excretion-
related properties.
The most active research field of drug metabolism is
Cytochrome P450 (CYP450) enzyme-related prediction.
There are two major streams of CYP450 related prediction,
predicting CYP450 substrates and predicting CYP450
inhibitors. Predicting the CYP450 substrate is important
because it can affect drug efficacy, excretion, and toxicity.
Likewise, predicting the CYP450 inhibitor is also crucial
because it is directly related to drug-drug interactions and
consequent toxicities. In recent years, some research
groups published CYP450 substrate prediction studies
A Review of Artificial Intelligence in Drug Discovery 907
[141-143]. Hunt et al. [141] proposed the multiclass
prediction model for finding the CYP450 isoform that
metabolizes the query molecule. With 633 compound-
isoform pairs of data, they constructed the multiclass RF
model with conventional molecular descriptors. Tian et al.
[142] developed the prediction tool ‘CypReact’ with 1,632
collected compounds, including 679 CYP450 reactants. They
used physicochemical descriptors and various fingerprints
as a feature and employed a novel technique called Learning
base model; a cost-sensitive meta-learning technique which
seeks the best classifier and optimal feature sets that
minimize the defined cost. Shan et al. [143] proposed a
multi-label classification model with 1,299 compound-
isoform pairs of data. They used a network-based label
space division learning technique to make a multi-label
prediction model; which enables making a multi-label
model with multiple binary classifiers. Thus, it partitions
label space and trains the base classifier to classify each
subspace separately. Besides the aforementioned substrate
prediction studies, other remarkable CYP450 inhibitor
prediction studies have been published [136,144-146]. Pang
et al. [145] collected data from BindingDB and ChEMBL
and constructed a CYP450 3A4 isoform inhibitor prediction
model. This group also validated the prediction result by in
vitro experiments to prove the model’s prediction power.
Wu et al. used large-scale data (17,143 compounds) from
Li et al. [144] which was originally collected from the
PubChem bioassay database for five CYP450 isoforms.
They constructed a precise XGBoost model with fingerprint
and descriptor combinations. Unlike the conventional
aforementioned studies, Li et al. used a multitask DNN to
well-train the neural network model by weight sharing.
The proposed model learned to predict five CYP450
isoform inhibitors.
Another area of in silico drug metabolism research
studies is on the site of metabolism (SoM) prediction. The
ability to predict SoM can guide the next stage of drug
discovery, since knowing the site of metabolism is essential
in the drug optimization process. Many research groups
attempt to construct robust SoM prediction models. He et
al. [147] proposed the prediction model of SoM by
oxidoreductases, collecting the data from the BKM-react
database, comprising 28,042 unique biochemical reactions
and constructed the classifiers with various machine
learning algorithms and chemical bond descriptors. ‘FAME
2’ [148], the machine learning tool of SoM prediction by
CYP450 was also published. The author collected data and
trained the RF with various combinations of descriptors.
The dataset contains approximately 200-600 molecules for
each CYP isoform. Finkelmann et al. [149] proposed the
tool called ‘MetScore’ which can predict the SoM by
various metabolism enzymes including CYP isoforms.
They collected data from the BIOVIA Metabolite Database
to construct a comprehensive prediction model. Cai et al.
[150] developed a prediction model of SoM for UDP-
glucuronosyltransferase-catalyzed reactions. This group
retrieved data from the “Handbook of Metabolic Pathways
of Xenobiotics” [151] and reviewed the literature for
validation; they used atom environment fingerprint and
decision tree-based machine learning models such as RF
and Adaboost.
Assessing drug’s susceptibility to biotransformation is
another principal issue in drug discovery. This feature of
the drug, which is called metabolic stability, is explained
by the pharmacokinetic properties such as intrinsic clearance
and half-life. Therefore, there are attempts to predict the
intrinsic clearance and half-life by in silico method to
reduce the cost of experiments. Podlewska et al. [152]
proposed the tool, called ‘MetStabOn’ stands for an online
platform for metabolic stability prediction. They first
collected the various datasets from ChEMBL contains
approximately 60-2,500 molecules in different species like
human, rat, and mouse. They built both regression and
classification models with molecular 2D descriptors, the
former is trained to predict the half-life and clearance
values directly and the latter is trained to predict the level
of the values. Esaki et al. [153] showed the positive effect
of data curation by constructing an intrinsic clearance
prediction model with curated and non-curated datasets.
They initially collected the dataset from ChEMBL, and
manually curated the dataset using several rules. They
constructed conventional machine learning models such as
RF, Adaboost, and SVM. Recently, deep learning-based
studies [126,132,154] were conducted for clearance and
half-life prediction. Liu et al. [154] published interesting
work that used graph convolution on a molecular graph to
featurize and construct a multitask model to predict human
microsomal clearance, CYP450 inhibition, and other
physicochemical properties.
Although the excretion property studies are relatively
fewer than metabolism-related studies, there are some
meaningful studies that focused on predicting non-liver
clearance such as renal and plasma. Zhivkova et al. [155]
designed a study for predicting drug plasma clearance. They
built a linear regression model with optimally selected
descriptors using a genetic algorithm of relevant data
comprising 659 drugs. Wakayama et al. [156] proposed a
prediction model that predicts the several major clearance
pathways of drugs. They used 249 drugs with nine major
clearance pathways’ information such as renal, OATP, and
CYP450 related pathways. They constructed two-step SVM
with chemical descriptors. The first step is predicting the
pre-defined group of clearance pathways and the second
step is predicting the exact pathway of the compound.
908 Biotechnology and Bioprocess Engineering 25: 895-930 (2020)
Watanabe et al. [157] developed in silico renal excretion
and clearance prediction models with manually collected
411 and 401 compounds, respectively. They constructed the
models by using conventional machine learning methods
with chemical 2D descriptors and fingerprints. Chen et al.
[158] developed both global and local models for predicting
human renal clearance of compounds with a combination
of molecular descriptors and conventional machine learning
methods. They collected the clearance data from various
literatures and U.S. FDA Drugs Database, containing 636
compounds. Notably, the model showed less reliable
performance in a global model but showed reasonable
performances in local models which are constructed with
specific subsets of compounds such as ionization-based
and elimination route-based subsets.
4.4. Toxicity
Undesired adverse effects, namely drug toxicity, may cause
high costs if it is not investigated carefully during the drug
development process. Since drug toxicity is the most
crucial aspect during the drug discovery process, in silico
toxicity prediction has been actively studied to reduce the
late-stage failure rate. Numerous toxicity prediction studies
exist, but drug-induced liver injury (DILI) and human
ether-à-go-go related gene (hERG)-related cardiotoxicity
prediction are studied mainly because many marketed
drugs are withdrawn for these toxicities. Therefore, we
categorized the numerous toxicities into DILI, hERG, and
several others in this section.
DILI is one of the main reasons for the withdrawal of
marketed drugs. Therefore, there have been many in silico
research studies to make precise predictive models and find
the patterns of hepatotoxic compounds [159-165]. Kotsam-
pasakou et al. [161] highlighted the importance of data
curation by curating 1,547 compounds from various sources
and testing the performance of machine learning-based
prediction models. In addition, our group recently proposed
a precise DILI prediction model by developing a novel
Bayesian weighted fingerprint for a molecule [160]. The
frequent substructures of DILI positive compounds are
reflected in a molecular fingerprint to improve the perfor-
mance and interpretability. The author collected data from
various sources; LTKB-BD, DrugBank, and literatures to
construct and validate the model. Hammann et al. [163]
constructed a DILI prediction model based on DILI
annotated drugs by using physicochemical descriptors and
machine learning methods. Furthermore, they analyzed the
interactions of hepatotoxic compounds with bioentities
such as carriers, transporters, and metabolizing enzymes.
They also found the relationship of defined daily doses
with hepatotoxicity. Williams et al. [165] proposed an
interpretable Bayesian regression model with both physico-
chemical properties and related bioactivities which they
measured through in vitro assay.
Inhibition of the hERG channel is another major issue
leading to the withdrawal of marketed drugs. The hERG
channel is the voltage-gated potassium ion channel (Kv11.1)
which regulates cardiac action potential to make a constant
period of QT interval. Thus, when the drug inhibits the
hERG channel, it causes severe cardiac arrhythmia by drug-
induced QT prolongation. Recently, it also has been actively
studied for data-driven in silico hERG-related toxicity
prediction by many researchers [166-173]. Siramshetty et
al. [167] collected and preprocessed 5,804 compounds
from the ChEMBL database for training and validated the
model with literature-derived data. Various molecular
fingerprints and machine learning models were used. There
is currently no standard cutoff potency of hERG blockers,
therefore, the authors compared the models that were
trained with multiple cutoffs. Ogura et al. [172] proposed
the hERG blocker classification model constructed with
the hERG integrated database from their previous work
[174]. The database comprises 9,890 hERG blockers and
281,329 hERG non-blockers. They selected the optimal
descriptors with a genetic algorithm and built an SVM
model for classification. Cai et al. [168] and Zhang et al.
[173] are the pioneers who applied deep learning in this
field. Zhang et al. collected data from the literatures
comprising 697 molecules. The author observed that the
three-layered DNN with molecular 2D descriptors had the
best performance. Cai et al. proposed a multitask DNN that
learns from applied data with different half maximal
inhibitory concentration (IC50) cutoffs. The authors used
the Mol2Vec feature and molecular descriptor for the
feature, and the data was collected from ChEMBL and
other literatures. Kim et al. proposed the interpretable deep
learning model for hERG blocker prediction, called
‘hERG-Att’. By employing a self-attention mechanism, the
model learns to not only classify the hERG blockers but
also capture the data-specific important substructures from
molecular circular fingerprints. The authors confirmed that
some of the captured substructures of predicted hERG
blockers are related to known hERG-related substructures
[175].
Apart from the above major toxicities, many other
toxicities have been studied for developing prediction
models [72,176-183]. The Lei et al. research group recently
published respiratory toxicity and urinary tract toxicity pre-
diction studies [176,177]. Both studies used the ChemIDplus
database and MOE software to collect and featurize the
toxic compounds. Furthermore, they constructed both
regression and classification models for generality. Liu et
al. [178] proposed the 35 target organ toxicity prediction
model. For the compound feature, they used the structural
A Review of Artificial Intelligence in Drug Discovery 909
feature and the in vitro bioactivities of a compound. They
constructed each prediction model with various machine
learning algorithms, for example, SVM, RF, and k-nearest
neighbors. They curated data from ToxCast and ToxRefDB
databases. Zheng et al. [183] developed a hemolytic toxicity
prediction model with molecular fingerprint and machine
learning methods. Interestingly, they found the optimal
virtual fingerprint of the toxic compound with a genetic
algorithm and searched for other possible toxic compounds
using similarity searching. Furthermore, few deep learning-
based methods have also been developed. Xu et al. [179]
proposed a novel architecture, called molecular graph
encoding-convolutional neural network (MGE-CNN). It
automatically extracts the task-specific features and predicts
the toxicity from the raw molecular graph. Chakravarti et
al. [72] proposed attention-based LSTM networks, where
the raw SMILES is fed into the model directly. They bench-
marked three bioactivities: Ames mutagenicity, Inhibition
of Hepatitis C virus, and Inhibition of Plasmodium falciparum
Dd2 which were from PubChem and other public sources.
They identified the structural alerts of toxic compounds
from the model by analyzing attention coefficients.
Unlike other ADMET properties, toxicity data is relatively
well-known to the public because of the Tox21 challenge
in 2014. Therefore, methodology-based studies have recently
emerged, and benchmarked against major toxicity datasets
including the Tox21 dataset [76,184-187]. All of the
studies proposed deep learning-based novel architectures to
predict the compound toxic-related properties. Altae-Tran
et al. [76] used a one-shot learning technique to relieve the
data deficiency and consequently proposed iterative
refinement LSTM networks combined with GCN. It
showed a remarkable performance of small data with three
benchmark datasets Tox21, SIDER, and MUV. Abbasi et
al. [185] proposed a novel transferable deep learning
architecture that used GCN and an adversarial domain
adaptation network; they also deeply benchmarked their
model with various physiology and biophysics datasets,
such as Tox21, ToxCast, and SIDER.
4.5. Limitations and future direction
Here, we address the limitations of current research trends
and suggest future research directions.
First, the quality and quantity of the data is a huge hurdle
in ADMET property prediction fields. Specifically, most
predictive models comprise hundreds to thousands of small
chemistry datasets that cannot cover enough chemical
space [76,118,188]. Moreover, the data is usually dispersed
to many literatures [117,118,122,124,125,128-130,134-
144,150,155,159-169,173,176,179,183], is unbalanced, and
has cutoff ambiguity challenges [118,167]. Furthermore,
the bioactivity assay data is strongly biased to its platform,
and has an intrinsic experimental error which disrupts
accurate prediction [189]. Acquiring more data is practically
very difficult and even impossible, therefore, multitask
learning and transfer learning concepts may resolve these
data problems [65,76,126,132,144,185,187]. Besides, a
comprehensive well-curated database or benchmark [190,191]
could help researchers reduce the data collecting and
processing time and produce fair comparisons [65-67,192].
Remarkably, Wu et al. [190] proposed the comprehensive
benchmark called ‘MoleculeNet’. They offered the data of
various properties of over 700,000 compounds to compare
the algorithms fairly. Furthermore, they offered large-scale
data, standard metrics, basic models, and common featurizers.
Second, most of the studies used engineered molecular
descriptors to train the conventional machine learning
models, but there are feature-intrinsic biases and a model-
inherent low interpretability [72]. To address these problems,
a novel data-driven feature generation [71,73] or target-
specific feature learning from raw data offer good solutions
[76,136,154,179,184,185]. However, having interpretability
in the conventional machine learning and deep learning
model is still challenging. Therefore interpretable and end-
to-end molecular property prediction is definitely a
fascinating and promising research field [72,193,194].
Last, a challenge in ligand-based property prediction, is
the activity cliff [195]. The activity cliff is the concept of
circumstance where compounds, which have similar
structures, have different properties. This concept breaks
down the primary assumption of QSAR, therefore, it is the
most difficult problem in this field. To solve this problem,
we must use the information beyond the compound structure.
Remarkably, some novel strategies attempt to find the toxic
compounds beyond the QSAR assumption by using
machine learning techniques and using toxicogenomics data
containing both compound structure and gene expression
profiles [196-198].
4.6. Public Databases for ADMET properties
Until now, most data-driven ADMET prediction research
relies on literature-derived data. However, there have been
numerous efforts that pursue constructing a freely accessible,
integrated database that satisfies both quantity and quality
by curating the published literatures. Here, we summarize
the large-scale, integrated public databases which contain
enough molecular activities or properties. The databases
with simple descriptions are summarized in Table 3.
5. AI-guided Lead Optimization
Finding a molecule that has the desired pharmacological
properties or has activity against biological targets can be
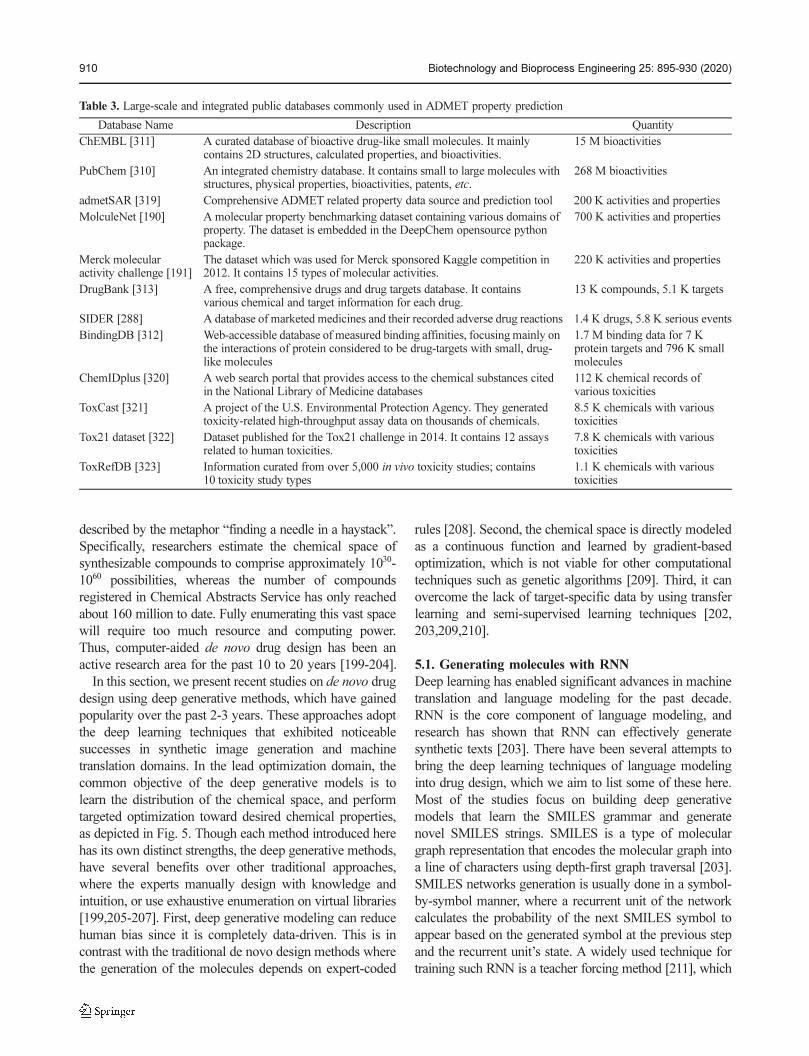
910 Biotechnology and Bioprocess Engineering 25: 895-930 (2020)
described by the metaphor “finding a needle in a haystack”.
Specifically, researchers estimate the chemical space of
synthesizable compounds to comprise approximately 1030-
1060 possibilities, whereas the number of compounds
registered in Chemical Abstracts Service has only reached
about 160 million to date. Fully enumerating this vast space
will require too much resource and computing power.
Thus, computer-aided de novo drug design has been an
active research area for the past 10 to 20 years [199-204].
In this section, we present recent studies on de novo drug
design using deep generative methods, which have gained
popularity over the past 2-3 years. These approaches adopt
the deep learning techniques that exhibited noticeable
successes in synthetic image generation and machine
translation domains. In the lead optimization domain, the
common objective of the deep generative models is to
learn the distribution of the chemical space, and perform
targeted optimization toward desired chemical properties,
as depicted in Fig. 5. Though each method introduced here
has its own distinct strengths, the deep generative methods,
have several benefits over other traditional approaches,
where the experts manually design with knowledge and
intuition, or use exhaustive enumeration on virtual libraries
[199,205-207]. First, deep generative modeling can reduce
human bias since it is completely data-driven. This is in
contrast with the traditional de novo design methods where
the generation of the molecules depends on expert-coded
rules [208]. Second, the chemical space is directly modeled
as a continuous function and learned by gradient-based
optimization, which is not viable for other computational
techniques such as genetic algorithms [209]. Third, it can
overcome the lack of target-specific data by using transfer
learning and semi-supervised learning techniques [202,
203,209,210].
5.1. Generating molecules with RNN
Deep learning has enabled significant advances in machine
translation and language modeling for the past decade.
RNN is the core component of language modeling, and
research has shown that RNN can effectively generate
synthetic texts [203]. There have been several attempts to
bring the deep learning techniques of language modeling
into drug design, which we aim to list some of these here.
Most of the studies focus on building deep generative
models that learn the SMILES grammar and generate
novel SMILES strings. SMILES is a type of molecular
graph representation that encodes the molecular graph into
a line of characters using depth-first graph traversal [203].
SMILES networks generation is usually done in a symbol-
by-symbol manner, where a recurrent unit of the network
calculates the probability of the next SMILES symbol to
appear based on the generated symbol at the previous step
and the recurrent unit’s state. A widely used technique for
training such RNN is a teacher forcing method [211], which
Table 3. Large-scale and integrated public databases commonly used in ADMET property prediction
Database Name Description Quantity
ChEMBL [311] A curated database of bioactive drug-like small molecules. It mainly contains 2D structures, calculated properties, and bioactivities.
15 M bioactivities
PubChem [310] An integrated chemistry database. It contains small to large molecules with structures, physical properties, bioactivities, patents, etc.
268 M bioactivities
admetSAR [319] Comprehensive ADMET related property data source and prediction tool 200 K activities and properties
MolculeNet [190] A molecular property benchmarking dataset containing various domains of property. The dataset is embedded in the DeepChem opensource python package.
700 K activities and properties
Merck molecular activity challenge [191]
The dataset which was used for Merck sponsored Kaggle competition in 2012. It contains 15 types of molecular activities.
220 K activities and properties
DrugBank [313] A free, comprehensive drugs and drug targets database. It contains various chemical and target information for each drug.
13 K compounds, 5.1 K targets
SIDER [288] A database of marketed medicines and their recorded adverse drug reactions 1.4 K drugs, 5.8 K serious events
BindingDB [312] Web-accessible database of measured binding affinities, focusing mainly on the interactions of protein considered to be drug-targets with small, drug-like molecules
1.7 M binding data for 7 K protein targets and 796 K small molecules
ChemIDplus [320] A web search portal that provides access to the chemical substances cited in the National Library of Medicine databases
112 K chemical records of various toxicities
ToxCast [321] A project of the U.S. Environmental Protection Agency. They generated toxicity-related high-throughput assay data on thousands of chemicals.
8.5 K chemicals with various toxicities
Tox21 dataset [322] Dataset published for the Tox21 challenge in 2014. It contains 12 assays related to human toxicities.
7.8 K chemicals with various toxicities
ToxRefDB [323] Information curated from over 5,000 in vivo toxicity studies; contains 10 toxicity study types
1.1 K chemicals with various toxicities
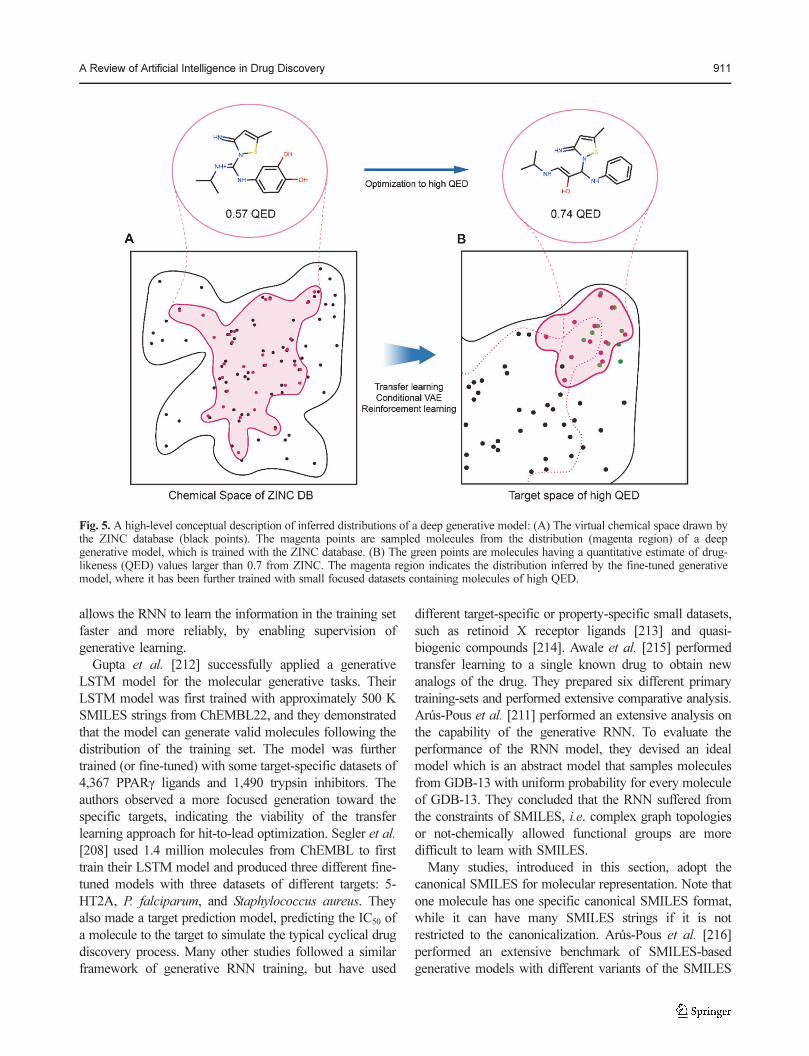
A Review of Artificial Intelligence in Drug Discovery 911
allows the RNN to learn the information in the training set
faster and more reliably, by enabling supervision of
generative learning.
Gupta et al. [212] successfully applied a generative
LSTM model for the molecular generative tasks. Their
LSTM model was first trained with approximately 500 K
SMILES strings from ChEMBL22, and they demonstrated
that the model can generate valid molecules following the
distribution of the training set. The model was further
trained (or fine-tuned) with some target-specific datasets of
4,367 PPARγ ligands and 1,490 trypsin inhibitors. The
authors observed a more focused generation toward the
specific targets, indicating the viability of the transfer
learning approach for hit-to-lead optimization. Segler et al.
[208] used 1.4 million molecules from ChEMBL to first
train their LSTM model and produced three different fine-
tuned models with three datasets of different targets: 5-
HT2A, P. falciparum, and Staphylococcus aureus. They
also made a target prediction model, predicting the IC50 of
a molecule to the target to simulate the typical cyclical drug
discovery process. Many other studies followed a similar
framework of generative RNN training, but have used
different target-specific or property-specific small datasets,
such as retinoid X receptor ligands [213] and quasi-
biogenic compounds [214]. Awale et al. [215] performed
transfer learning to a single known drug to obtain new
analogs of the drug. They prepared six different primary
training-sets and performed extensive comparative analysis.
Arús-Pous et al. [211] performed an extensive analysis on
the capability of the generative RNN. To evaluate the
performance of the RNN model, they devised an ideal
model which is an abstract model that samples molecules
from GDB-13 with uniform probability for every molecule
of GDB-13. They concluded that the RNN suffered from
the constraints of SMILES, i.e. complex graph topologies
or not-chemically allowed functional groups are more
difficult to learn with SMILES.
Many studies, introduced in this section, adopt the
canonical SMILES for molecular representation. Note that
one molecule has one specific canonical SMILES format,
while it can have many SMILES strings if it is not
restricted to the canonicalization. Arús-Pous et al. [216]
performed an extensive benchmark of SMILES-based
generative models with different variants of the SMILES
Fig. 5. A high-level conceptual description of inferred distributions of a deep generative model: (A) The virtual chemical space drawn bythe ZINC database (black points). The magenta points are sampled molecules from the distribution (magenta region) of a deepgenerative model, which is trained with the ZINC database. (B) The green points are molecules having a quantitative estimate of drug-likeness (QED) values larger than 0.7 from ZINC. The magenta region indicates the distribution inferred by the fine-tuned generativemodel, where it has been further trained with small focused datasets containing molecules of high QED.
912 Biotechnology and Bioprocess Engineering 25: 895-930 (2020)
syntax, comparing canonical, randomized, and DeepSMILES
notations. They demonstrated that randomized SMILES
substantially improve the quality of the generated chemical
space. Pogány et al. [217] explored the applicability of
using Reduced Graph (RG) representation as input to the
generative RNN, though the output is still the translated
SMILES string from the RG. Although RNN is most suited
to sequential data like text sentences, there was a study
using RNN with non-textual representations. Li et al. [218]
proposed a de novo molecular design framework based on
a type of sequential graph generators that do not use symbol-
level recurrent units. Their model learns the parameterized
decoding policy that specifies the probability value for
each graph transition, where the graph transitions include
appending a new atom and connecting to atoms with a new
bond.
RNN language models in de novo design have produced
promising results, but the majority has only shown transfer
learning approaches in terms of a targeted generation with
the property objective. Because of this architectural limitation,
it is hard to enforce a sentence-level (compound-level)
property condition. Unless introducing some additional
modules for the network architecture to incorporate the
chemical property information [218]. The following
autoencoder-based network and reinforcement learning-
based tuning can embed the condition more naturally.
5.2. Generative Autoencoder
The goal of chemical autoencoders is to learn a mapping
from raw compound data to a latent vector as a compressed
representation. The training enables the autoencoder (AE)
to learn the latent space where each compound is
continuously located at the more chemically relevant
position. The main idea in generative autoencoders is to
sample a compound vector from the latent space. Auto-
encoders are widely used in various domains of deep
learning applications for representation learning and dimen-
sionality reduction. The autoencoders in generative models
enable training with conditional properties, by simple joint
learning or more sophisticated disentanglement and enta-
nglement of dependencies [209,219]. This subsection is
dedicated to introducing studies about de novo deep gene-
rative molecular design using autoencoder-based methods,
such as variational autoencoders (VAE) and adversarial
autoencoders.
VAEs have been widely studied in the image generation
domain [203]. Its mathematical foundation is based on the
theory of variational inference. VAE introduces probabilistic
latent space with noise, and regularization of the latent space
learning with a predefined prior, so that the generative
steps are conducted by sampling from the latent prior.
Gómez-Bombarelli et al. [209] pioneered the application of
VAE for exploring chemical space. They used generative
gated recurrent unit (GRU) for the decoder of the AE and
found that CNN performed well for the encoder. They used
two VAE models, trained on QM9 and ZINC, and compared
these models with the genetic algorithm baseline. Then,
they performed joint training for property prediction, by
attaching a separate feedforward network to predict the
molecule’s property. Lim et al. [220] proposed a molecular
design strategy based on conditional VAE. The conditional
VAE has the condition property vector directly embedded
into the latent space and used as an additional input for the
encoder. Kang et al. [210] presented a conditional molecular
design method using a semi-supervised variational auto-
encoder (SSVAE). The SSVAE has three separate modules:
encoder, predictor, and decoder networks. The predictor
network gets the SMILES input and predicts a property
value. An interesting concept of the network design is to
assume the Gaussian distribution on the property; this
concept enabled semi-supervised learning for the VAE.
Harel et al. [221] presented a deep molecular generative
model called prototype-driven diversity networks, which
uses VAE architecture where the encoder receives molecular
prototypes as input.
The studies mentioned thus far all focus on using the
SMILES representation with VAE. Still, there are ongoing
studies in this field venturing toward more diverse repre-
sentations. Skalic et al. [222] devised a deep generative
pipeline that generates new molecules from 3D volumetric
representations. The pipeline comprises two modules: shape
autoencoder, which is a VAE that learns the latent space of
the 3D molecular representation, and shape captioning
network, which is a CNN-LSTM network that translates
the given 3D representation into a SMILES string. The
work by Lim et al. [223] suggests the graph generative
VAE model in which the generation process starts with a
latent vector of an initial scaffold. In the learning phase, the
encoder encodes a “whole-molecule” graph to a latent
vector (scaffold), and the decoder uses the latent vector and
the given desired properties to reconstruct the original
whole-molecule.
Instead of variational inference, an adversarial training
approach can also be used for regularized learning of latent
space. Introducing adversarial networks in generative
modeling has been a key technical advancement in various
fields adopting AI algorithms [203]. The first inception of
adversarial learning was the generative adversarial network
(GAN), where the generator network’s output is discrimi-
nated by a separate discriminator network. There was a
promising attempt to bring this adversarial training scheme
into the autoencoder-based latent representation learning,
called adversarial autoencoder (AAE). In AAE, which is a
variant of generative autoencoder, the latent space regulari-
A Review of Artificial Intelligence in Drug Discovery 913
zation is conducted with the adversarial training by using a
separate discriminator network that distinguishes whether
the latent vector is from the encoder network or from the
prior distribution. Polykovskiy et al. [219] devised an
entangled conditional AAE, which is an improvement on a
simple supervised AAE architecture. In their work, they
theoretically discussed the disentanglement problem in the
generative autoencoder schemes. Considering the issue,
they designed a novel entangled model that addresses the
dependence between the latent code and the property
values. Kadurin et al. [224] trained the VAE and AAE
models to generate a 166-bit Molecular ACCess System
(MACCS) chemical fingerprints and performed a compa-
rison of the two models on the reconstruction quality and
sampling coverage. Blaschke et al. [225] explored four
different generative AE architectures on the SMILES
generation task: VAEs using teacher forcing or not, and
AAEs where the encoder is trained to follow Gaussian or
Uniform distribution. Prykhdoko et al. [226] proposed a
new molecule de novo design method, by combining a
SMILES heteroencoder and a GAN. After the heteroencoder
is pretrained, the output from the encoder, the latent code,
is used as a true input for the discriminator of the GAN.
GAN generator’s output produced from random uniform
noise is used as a fake input for the GAN training. For the
generation phase, the generator produces a synthetic latent
code, and the code is fed to the decoder to generate a
SMILES string.
Although the introduction of guiding conditional properties
in the AE architecture seems to lead to better latent space
formation, it has been observed that these approaches
generate valid molecules less frequently than others [203].
This implies there is room for improvement in the quality
of learned latent space. Using some manual prior design
could help, but it would be challenging to devise appropriate
prior to the latent representation considering the complexity
of the global chemical space.
5.3. Reinforcement Learning
The alternative approach in conditional molecule generation
is using reinforcement learning (RL). The main idea
behind adopting RL is to construct strategies directly or
indirectly for exploring the constrained chemical space.
Many researches demonstrated the applicability of RL as a
fine-tuning process, where it comes after the pre-training
process with a general-purpose database; though, some
researchers recently pioneered the possibility of a pure-RL
approach [227]. In this subsection, we introduce studies
that used RL as a part of their de novo molecular design
with deep generative modeling. Most works introduced
here have formalized the molecular generation of targeted
property as maximization of the expected return, which is
the accumulated reward throughout one episode [203,228].
In the RL formalization, the current state of the environment
is the SMILES sequence which has been generated
symbol-by-symbol at each step. Action to be taken at a
certain time step, is adding one symbol or deleting an
existing symbol. RL, can be broken into two categories,
value learning and policy learning; the works listed below
adopt different approaches with their own reasoning.
Reward function design is the most important component
of building an RL system, yet it is still a challenging
opportunity for future research to discover the best
rewarding scheme to effectively learn the chemical space.
Olivecrona et al. [228] introduced a deep generative
RNN method for SMILES generation task where, through
RL, the RNN can also learn to generate structures with
certain specified desirable properties. They first trained the
RNN prior network on the training set of 1.5 million
structures from ChEMBL. After they framed the fine-
tuning task within an RL frame, where sampling SMILES
symbols from RNN ends with an EOS token, and the
return is defined by their proposed objective function,
which showed better results than other traditional scorings.
A similar approach was taken by Popova et al. [229],
however, they used a classic policy gradient algorithm
called REINFORCE, and used Stack-RNN as a generator
to address long-term dependencies effectively. Putin et al.
published two studies on deep generative de novo design
using the GAN concept and RL policy gradient [230,231].
In their study on Reinforced Adversarial Neural Computer
(RANC) [230], they adopted a special generator architecture,
called Differentiable Neural Computer (DNC), for tackling
the problem posed by using LSTM under the adversarial
training scheme. For the RL fine-tuning phase, the discri-
minator network was used for evaluation of the reward for
the generator, which is estimated as the likelihood of
fooling the discriminator. In their other work, Adversarial
Threshold Neural Computer (ATNC) [231], the overall
scheme was like the RANC, but it introduces a new block
called adversarial threshold (AT). AT is a copy of the
discriminator, lagging behind the original discriminator for
a certain number of epochs. Liu et al. [232] introduced an
exploration strategy on the RL training phase. Their training
process uses two networks, the exploitation network and
exploration network. Each symbol generation to be
measured is conducted by random selection between the
two networks.
Many different RL learning objectives other than policy
gradients also exist. Ståhl et al. [233] presented a fragment-
based RL approach based on the actor-critic model, where
the policy network (actor) and value function network
(critic) are trained in parallel. They suggested an alternative
way of representing molecules, where molecules are split
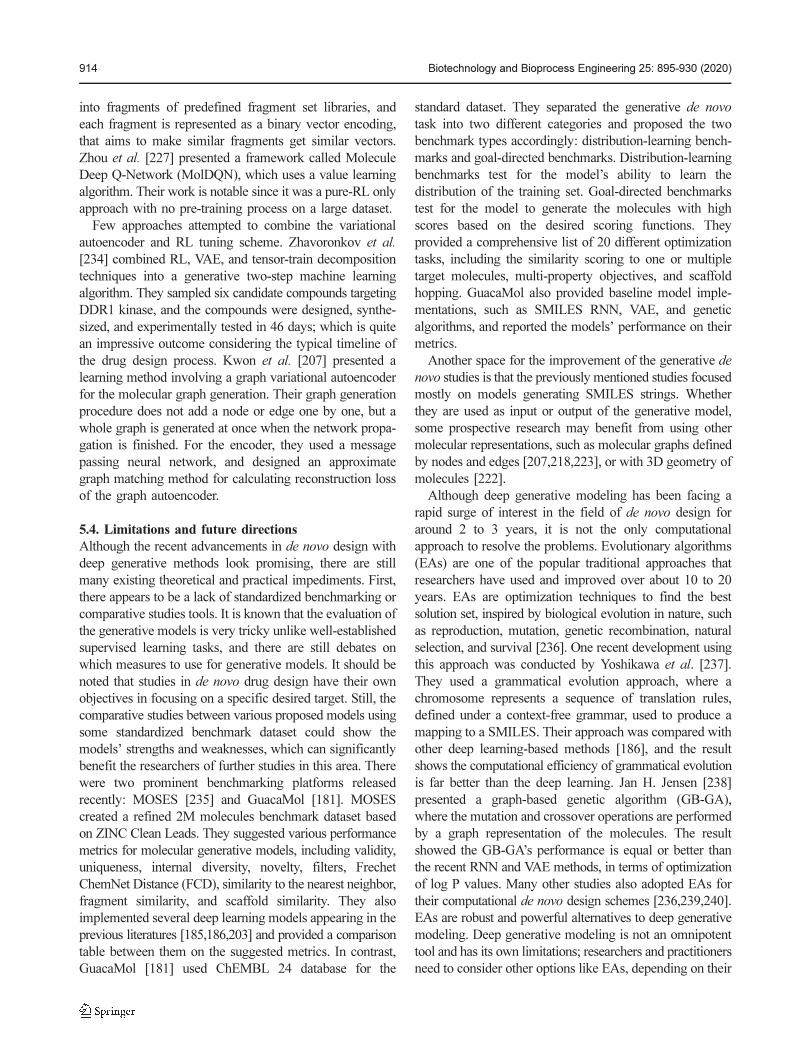
914 Biotechnology and Bioprocess Engineering 25: 895-930 (2020)
into fragments of predefined fragment set libraries, and
each fragment is represented as a binary vector encoding,
that aims to make similar fragments get similar vectors.
Zhou et al. [227] presented a framework called Molecule
Deep Q-Network (MolDQN), which uses a value learning
algorithm. Their work is notable since it was a pure-RL only
approach with no pre-training process on a large dataset.
Few approaches attempted to combine the variational
autoencoder and RL tuning scheme. Zhavoronkov et al.
[234] combined RL, VAE, and tensor-train decomposition
techniques into a generative two-step machine learning
algorithm. They sampled six candidate compounds targeting
DDR1 kinase, and the compounds were designed, synthe-
sized, and experimentally tested in 46 days; which is quite
an impressive outcome considering the typical timeline of
the drug design process. Kwon et al. [207] presented a
learning method involving a graph variational autoencoder
for the molecular graph generation. Their graph generation
procedure does not add a node or edge one by one, but a
whole graph is generated at once when the network propa-
gation is finished. For the encoder, they used a message
passing neural network, and designed an approximate
graph matching method for calculating reconstruction loss
of the graph autoencoder.
5.4. Limitations and future directions
Although the recent advancements in de novo design with
deep generative methods look promising, there are still
many existing theoretical and practical impediments. First,
there appears to be a lack of standardized benchmarking or
comparative studies tools. It is known that the evaluation of
the generative models is very tricky unlike well-established
supervised learning tasks, and there are still debates on
which measures to use for generative models. It should be
noted that studies in de novo drug design have their own
objectives in focusing on a specific desired target. Still, the
comparative studies between various proposed models using
some standardized benchmark dataset could show the
models’ strengths and weaknesses, which can significantly
benefit the researchers of further studies in this area. There
were two prominent benchmarking platforms released
recently: MOSES [235] and GuacaMol [181]. MOSES
created a refined 2M molecules benchmark dataset based
on ZINC Clean Leads. They suggested various performance
metrics for molecular generative models, including validity,
uniqueness, internal diversity, novelty, filters, Frechet
ChemNet Distance (FCD), similarity to the nearest neighbor,
fragment similarity, and scaffold similarity. They also
implemented several deep learning models appearing in the
previous literatures [185,186,203] and provided a comparison
table between them on the suggested metrics. In contrast,
GuacaMol [181] used ChEMBL 24 database for the
standard dataset. They separated the generative de novo
task into two different categories and proposed the two
benchmark types accordingly: distribution-learning bench-
marks and goal-directed benchmarks. Distribution-learning
benchmarks test for the model’s ability to learn the
distribution of the training set. Goal-directed benchmarks
test for the model to generate the molecules with high
scores based on the desired scoring functions. They
provided a comprehensive list of 20 different optimization
tasks, including the similarity scoring to one or multiple
target molecules, multi-property objectives, and scaffold
hopping. GuacaMol also provided baseline model imple-
mentations, such as SMILES RNN, VAE, and genetic
algorithms, and reported the models’ performance on their
metrics.
Another space for the improvement of the generative de
novo studies is that the previously mentioned studies focused
mostly on models generating SMILES strings. Whether
they are used as input or output of the generative model,
some prospective research may benefit from using other
molecular representations, such as molecular graphs defined
by nodes and edges [207,218,223], or with 3D geometry of
molecules [222].
Although deep generative modeling has been facing a
rapid surge of interest in the field of de novo design for
around 2 to 3 years, it is not the only computational
approach to resolve the problems. Evolutionary algorithms
(EAs) are one of the popular traditional approaches that
researchers have used and improved over about 10 to 20
years. EAs are optimization techniques to find the best
solution set, inspired by biological evolution in nature, such
as reproduction, mutation, genetic recombination, natural
selection, and survival [236]. One recent development using
this approach was conducted by Yoshikawa et al. [237].
They used a grammatical evolution approach, where a
chromosome represents a sequence of translation rules,
defined under a context-free grammar, used to produce a
mapping to a SMILES. Their approach was compared with
other deep learning-based methods [186], and the result
shows the computational efficiency of grammatical evolution
is far better than the deep learning. Jan H. Jensen [238]
presented a graph-based genetic algorithm (GB-GA),
where the mutation and crossover operations are performed
by a graph representation of the molecules. The result
showed the GB-GA’s performance is equal or better than
the recent RNN and VAE methods, in terms of optimization
of log P values. Many other studies also adopted EAs for
their computational de novo design schemes [236,239,240].
EAs are robust and powerful alternatives to deep generative
modeling. Deep generative modeling is not an omnipotent
tool and has its own limitations; researchers and practitioners
need to consider other options like EAs, depending on their
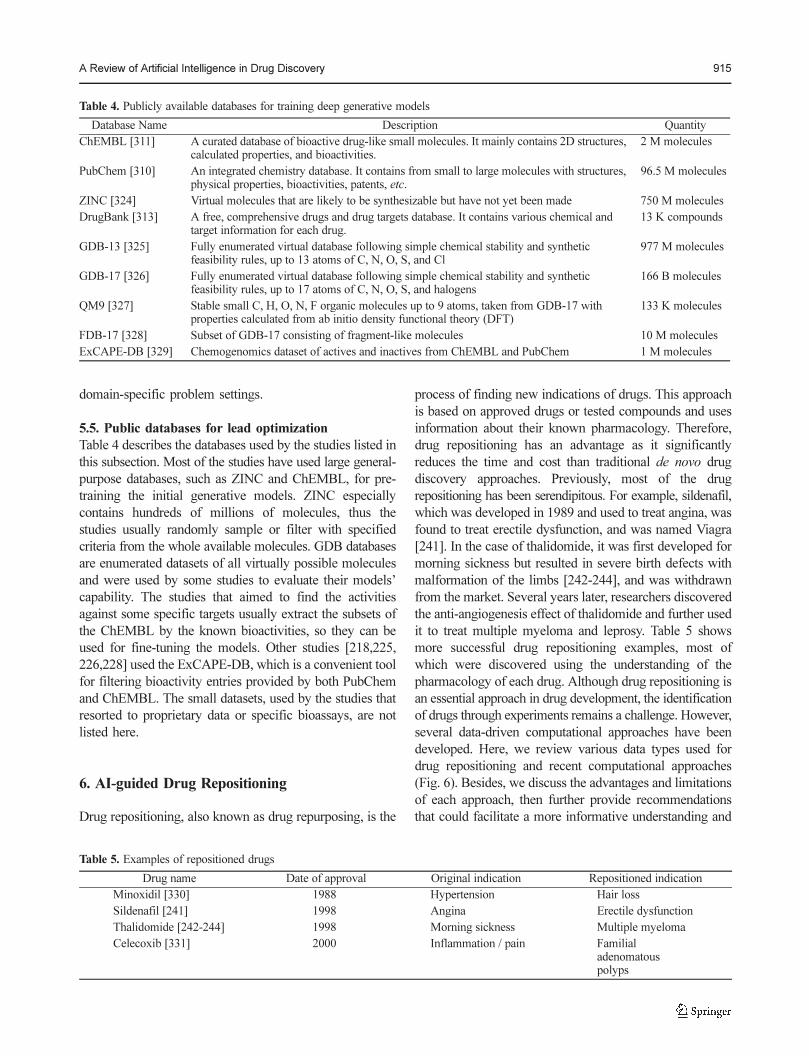
A Review of Artificial Intelligence in Drug Discovery 915
domain-specific problem settings.
5.5. Public databases for lead optimization
Table 4 describes the databases used by the studies listed in
this subsection. Most of the studies have used large general-
purpose databases, such as ZINC and ChEMBL, for pre-
training the initial generative models. ZINC especially
contains hundreds of millions of molecules, thus the
studies usually randomly sample or filter with specified
criteria from the whole available molecules. GDB databases
are enumerated datasets of all virtually possible molecules
and were used by some studies to evaluate their models’
capability. The studies that aimed to find the activities
against some specific targets usually extract the subsets of
the ChEMBL by the known bioactivities, so they can be
used for fine-tuning the models. Other studies [218,225,
226,228] used the ExCAPE-DB, which is a convenient tool
for filtering bioactivity entries provided by both PubChem
and ChEMBL. The small datasets, used by the studies that
resorted to proprietary data or specific bioassays, are not
listed here.
6. AI-guided Drug Repositioning
Drug repositioning, also known as drug repurposing, is the
process of finding new indications of drugs. This approach
is based on approved drugs or tested compounds and uses
information about their known pharmacology. Therefore,
drug repositioning has an advantage as it significantly
reduces the time and cost than traditional de novo drug
discovery approaches. Previously, most of the drug
repositioning has been serendipitous. For example, sildenafil,
which was developed in 1989 and used to treat angina, was
found to treat erectile dysfunction, and was named Viagra
[241]. In the case of thalidomide, it was first developed for
morning sickness but resulted in severe birth defects with
malformation of the limbs [242-244], and was withdrawn
from the market. Several years later, researchers discovered
the anti-angiogenesis effect of thalidomide and further used
it to treat multiple myeloma and leprosy. Table 5 shows
more successful drug repositioning examples, most of
which were discovered using the understanding of the
pharmacology of each drug. Although drug repositioning is
an essential approach in drug development, the identification
of drugs through experiments remains a challenge. However,
several data-driven computational approaches have been
developed. Here, we review various data types used for
drug repositioning and recent computational approaches
(Fig. 6). Besides, we discuss the advantages and limitations
of each approach, then further provide recommendations
that could facilitate a more informative understanding and
Table 4. Publicly available databases for training deep generative models
Database Name Description Quantity
ChEMBL [311] A curated database of bioactive drug-like small molecules. It mainly contains 2D structures, calculated properties, and bioactivities.
2 M molecules
PubChem [310] An integrated chemistry database. It contains from small to large molecules with structures, physical properties, bioactivities, patents, etc.
96.5 M molecules
ZINC [324] Virtual molecules that are likely to be synthesizable but have not yet been made 750 M molecules
DrugBank [313] A free, comprehensive drugs and drug targets database. It contains various chemical and target information for each drug.
13 K compounds
GDB-13 [325] Fully enumerated virtual database following simple chemical stability and synthetic feasibility rules, up to 13 atoms of C, N, O, S, and Cl
977 M molecules
GDB-17 [326] Fully enumerated virtual database following simple chemical stability and synthetic feasibility rules, up to 17 atoms of C, N, O, S, and halogens
166 B molecules
QM9 [327] Stable small C, H, O, N, F organic molecules up to 9 atoms, taken from GDB-17 with properties calculated from ab initio density functional theory (DFT)
133 K molecules
FDB-17 [328] Subset of GDB-17 consisting of fragment-like molecules 10 M molecules
ExCAPE-DB [329] Chemogenomics dataset of actives and inactives from ChEMBL and PubChem 1 M molecules
Table 5. Examples of repositioned drugs
Drug name Date of approval Original indication Repositioned indication
Minoxidil [330] 1988 Hypertension Hair loss
Sildenafil [241] 1998 Angina Erectile dysfunction
Thalidomide [242-244] 1998 Morning sickness Multiple myeloma
Celecoxib [331] 2000 Inflammation / pain Familialadenomatouspolyps
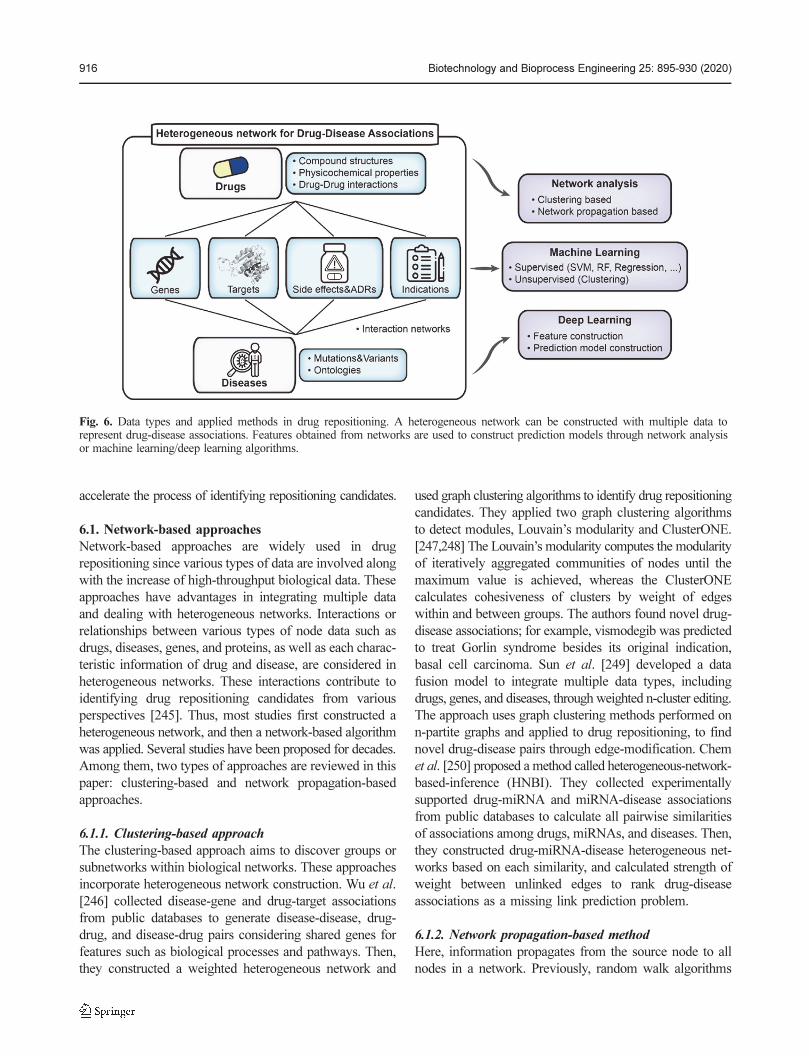
916 Biotechnology and Bioprocess Engineering 25: 895-930 (2020)
accelerate the process of identifying repositioning candidates.
6.1. Network-based approaches
Network-based approaches are widely used in drug
repositioning since various types of data are involved along
with the increase of high-throughput biological data. These
approaches have advantages in integrating multiple data
and dealing with heterogeneous networks. Interactions or
relationships between various types of node data such as
drugs, diseases, genes, and proteins, as well as each charac-
teristic information of drug and disease, are considered in
heterogeneous networks. These interactions contribute to
identifying drug repositioning candidates from various
perspectives [245]. Thus, most studies first constructed a
heterogeneous network, and then a network-based algorithm
was applied. Several studies have been proposed for decades.
Among them, two types of approaches are reviewed in this
paper: clustering-based and network propagation-based
approaches.
6.1.1. Clustering-based approach
The clustering-based approach aims to discover groups or
subnetworks within biological networks. These approaches
incorporate heterogeneous network construction. Wu et al.
[246] collected disease-gene and drug-target associations
from public databases to generate disease-disease, drug-
drug, and disease-drug pairs considering shared genes for
features such as biological processes and pathways. Then,
they constructed a weighted heterogeneous network and
used graph clustering algorithms to identify drug repositioning
candidates. They applied two graph clustering algorithms
to detect modules, Louvain’s modularity and ClusterONE.
[247,248] The Louvain’s modularity computes the modularity
of iteratively aggregated communities of nodes until the
maximum value is achieved, whereas the ClusterONE
calculates cohesiveness of clusters by weight of edges
within and between groups. The authors found novel drug-
disease associations; for example, vismodegib was predicted
to treat Gorlin syndrome besides its original indication,
basal cell carcinoma. Sun et al. [249] developed a data
fusion model to integrate multiple data types, including
drugs, genes, and diseases, through weighted n-cluster editing.
The approach uses graph clustering methods performed on
n-partite graphs and applied to drug repositioning, to find
novel drug-disease pairs through edge-modification. Chem
et al. [250] proposed a method called heterogeneous-network-
based-inference (HNBI). They collected experimentally
supported drug-miRNA and miRNA-disease associations
from public databases to calculate all pairwise similarities
of associations among drugs, miRNAs, and diseases. Then,
they constructed drug-miRNA-disease heterogeneous net-
works based on each similarity, and calculated strength of
weight between unlinked edges to rank drug-disease
associations as a missing link prediction problem.
6.1.2. Network propagation-based method
Here, information propagates from the source node to all
nodes in a network. Previously, random walk algorithms
Fig. 6. Data types and applied methods in drug repositioning. A heterogeneous network can be constructed with multiple data torepresent drug-disease associations. Features obtained from networks are used to construct prediction models through network analysisor machine learning/deep learning algorithms.
A Review of Artificial Intelligence in Drug Discovery 917
were used on a heterogeneous network constructed with
multiple features. Martínez et al. [251] proposed a
network-based method for drug-disease and disease-drug
prioritization based on ProphNet, that implemented a
propagation flow algorithm [252]. They retrieved information
on drugs, proteins, diseases, and associations among them,
and calculated similarities of each pair. The propagation
process flows from query to target networks with query
nodes through a path, including propagation within and
between networks. Vectors of the query and target were
obtained to calculate similarity scores between them.
Because of this query-target propagation step, it enables
both drug-disease and disease-drug prioritization, meaning
that drugs can be queried for new indications and diseases
can be queried for effective medications. Luo et al. [253]
presented a prediction method named MBiRW that applied
a bi-random walk algorithm on the two-layer drug-disease
heterogeneous network constructed by similarity measures,
calculated based on each property. Each random walk
process was conducted for both drug and disease networks,
respectively. Outputs of both walks were averaged to
represent the probability that a drug associates with a
disease. They found novel disease-drug relationships such
as Alzheimer’s and levodopa. Luo et al. [254] constructed
a heterogeneous network of six subnetworks containing
information of drug, disease, target, and each relation
between them. Here, they additionally used target protein
information of which similarities were calculated based on
amino acid sequences. The random walk process was
conducted on the heterogeneous network with multiple
transition matrices, considering a transition from one type
of network to the other, to prioritize candidate drugs for
diseases. Lastly, based on multiple similarities, Yan et al.
introduced similarity selection by information entropy [255].
They analyzed correlations between drug and disease
similarities after calculating similarity fusion through
information entropy of each similarity measure. The final
similarity matrix was calculated after adjusting similarity
values, considering the range of values; they used this to
construct the heterogeneous network. A bi-random walk
algorithm was applied on heterogeneous networks to predict
new drug-disease pairs.
6.2. Machine learning approaches
Machine learning (ML) techniques have been applied for
drug repositioning, giving reliable performance. ML helps
to discover repositioning candidates by learning patterns in
drug-disease associations. There are also various ML
algorithms that are evolving rapidly. Similarities between
drugs and diseases are also commonly combined as features.
Gottlieb et al. [256] conducted multiple drug-drug and
disease-disease similarity measures to construct features
that discriminate and represent drug-disease associations.
They then constructed a classification model named
PREDICT using a logistic regression algorithm. Napolitano
et al. [257] focused on drug-centered repositioning by
predicting therapeutic drug classes. They used gene
expression signatures collected from CMap that show the
use of transcriptomic data in drug repositioning, drug
structures, and target proteins to calculate similarities of
drugs. Then they combined drug similarities to train multi-
class SVM model for drug-disease association prediction.
There is also another SVM based model, constructed with
drug structures, that targets and side effects information.
[258] Kim et al. [259] constructed a drug-disease association
prediction model with five ML algorithms considering
both linear and nonlinear algorithms, using similarities as
features representing drug-disease pairs. Besides supervised
models, there are also studies using unsupervised algorithms
[245]. Hameed et al. used four clustering algorithms on a
drug network to predict drug ATC classes.
Moreover, feature construction using heterogeneous
networks has been conducted for more informative features.
Zhang et al. [260] proposed the network topological
similarity-based inference method to predict new drug-
disease associations by using a novel representation of drugs
and diseases processed from the drug-disease bipartite
network. Three ML algorithms, MLP, SVM, and RF, were
adopted to classify the associations. Le et al. [261] presented
a semi-supervised model using an integrated drug-target-
disease network to overcome the limitation of supervised
models because of uncertain negative associations. They
integrated each similarity network and a bipartite network
of drug-disease associations and then adopted a regularized
least square algorithm. Moreover, matrix factorization
methods were applied to drug-disease association matrices
to find novel associations. Luo et al. [254] proposed a drug
repositioning recommendation system through a hetero-
geneous drug-disease network, and a matrix completion
algorithm was introduced to fill a drug-disease association
matrix and identify potential treatments for diseases. Xuan
[262] presented DisDrugPred using a method based on
non-negative matrix factorization. The method integrates
prior knowledge of drugs and diseases, which were repre-
sented by similarity measures with association information,
then constructed a drug-disease association matrix to predict
novel associations.
6.3. Deep learning approaches
Deep learning (DL), one of the ML approaches, has shown
dramatic performance in various fields. In drug repositioning,
the feature extraction process is needed because of the size
of the feature dimension resulting from large datasets.
However, DL does not require a feature extraction step,
918 Biotechnology and Bioprocess Engineering 25: 895-930 (2020)
and has the advantage of discovering latent features in
complex drug-disease networks. DL can be used to construct
either features or prediction models. When constructing
features, DL approaches can be used by embedding
information into latent representations, having the advantage
of low dimension and heterogeneity.
Wei et al. [263] adopted a network embedding algorithm
to learn latent representations from several biomedical
resources. Previously well-studied network embedding
models were applied to reduce the noise and high dimension
caused by adjacency matrices. Then, the SVM model was
trained with constructed features to predict drug-disease
associations. In contrast, Moridi et al. [264] focused on the
construction of efficient representation of drugs by using
various DNN architectures for each feature type. They
used drug structures, targets, related enzymes, and gene
expression profiles for drug features obtained from
DrugBank, PubChem, and CMap. They applied variational
autoencoder [209] and stacked autoencoders [265] on drug
structures, gene expression data, and ProtVec [266] on protein
and enzyme sequences to embed drug-related features.
Donner et al. [267] also proposed a deep embedding
method using LINCS [268] gene expression data. They
used standardized expression values of landmark genes as
input and constructed for various prediction tasks, including
drug repositioning with multiple hidden layers. This study
shows the application of transcriptomic data and DL
approach improved the prediction model performance.
Besides feature processing, recent papers constructed
DNN models for predicting drug-disease associations. You
et al. [269] combined the LASSO model with the DNN
model, each used for feature extraction and prediction of
drug-target interactions. They applied the constructed
model to predict drug repositioning for breast cancer by
identifying drugs that target risk genes of breast cancer.
Aliper et al. [270] constructed a DNN model on large
transcriptional datasets to classify drug therapeutic classes
based on transcriptional profiles. They collected gene
expression data from LINCS focusing on three cell lines
and processed them for pathway level analysis and landmark
gene-level analysis. Compared to an SVM model, the DNN
model outperformed on a multiclass classification problem.
Zeng et al. [271] proposed a method named deepDR that
learns high-level features from a heterogeneous network
generated by integrating 10 networks via a multi-model
deep autoencoder. Learned features were then decoded to
predict repositioning candidates. Xuan et al. [272] presented
a novel model that was based on CNN to capture local
representation from feature matrices and GRU, to learn
path representation from drug-disease paths. The model
outperformed other previous studies.
6.4. Limitations and future directions
A major limitation in in silico drug repositioning is the
quality and quantity of data. The known repositioned drugs
and related information are limited. Most of the research
relied on a relatively small dataset. Moreover, using
heterogeneous data can cause small datasets because not all
drugs or diseases may have information of interest. This
lack of data can induce limited predictions because only
drug-disease associations related to data used for training
can be predicted, especially when using network-based
approaches. For DL approaches, the small data size can
cause an overfitting problem. Therefore, qualitatively and
quantitatively improved multi-omics data are needed for
broader coverage and better model applicability [255,273].
Moreover, multiple network types of data such as signaling
networks and interaction networks need to be provided
[274,275]. To overcome the limitation of available data,
there has been another approach in drug repositioning
using Electronic Health Records (EHR) or patient history,
PubMed abstracts, and ClinicalTrials.gov by using text
mining algorithms [276-279]. Recent DL techniques can
be applied to drug repositioning to discover underlying
drug-disease associations in complex networks [280].
Despite the fast growth of DL, there are few studies
applied elaborate DNN architectures to extract meaningful
results. There have been many efforts in dealing with graph
structures with DNN, and these may help identify novel
drug-disease associations.
6.5. Public databases for drug repositioning
Drug repositioning studies involve a variety of data to
represent drugs and diseases, as do computational approaches
used in drug discovery including genome, proteome, interac-
tome, gene expression, chemical structures, and properties.
To predict novel drug-disease associations efficiently, it is
necessary to represent compounds, diseases, and their
interactions. There are several databases available for drug
repositioning. As drugs and diseases can be represented by
various data types, we categorized databases into two
groups: drug-centric and disease-centric databases. Detailed
data sources are described below and in Table 6.
6.5.1. Drug-centric databases
In computational drug discovery, the similar property
principle is commonly assumed, which means that similar
drugs bind similar proteins and further show similar
biological activities. Under this hypothesis, structural
information is the most used data to represent compounds.
To represent compounds, SMILES string and various
molecular fingerprints are used, indicating substructural
information. Molecular fingerprints are generated by
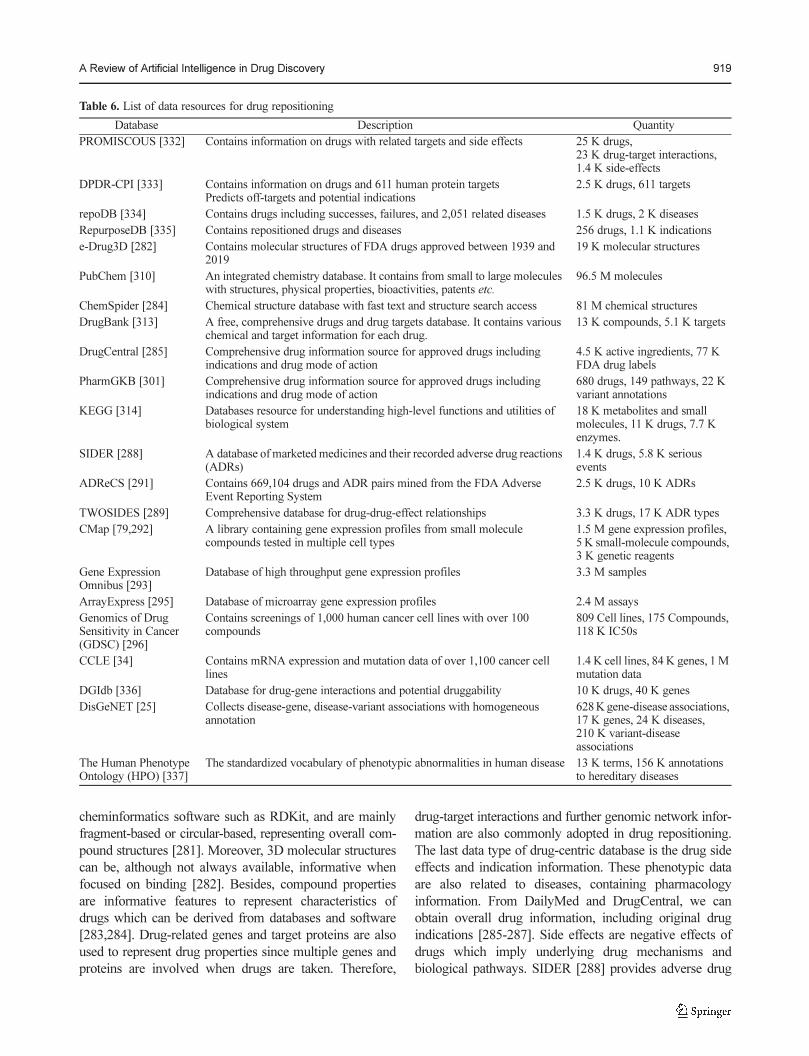
A Review of Artificial Intelligence in Drug Discovery 919
cheminformatics software such as RDKit, and are mainly
fragment-based or circular-based, representing overall com-
pound structures [281]. Moreover, 3D molecular structures
can be, although not always available, informative when
focused on binding [282]. Besides, compound properties
are informative features to represent characteristics of
drugs which can be derived from databases and software
[283,284]. Drug-related genes and target proteins are also
used to represent drug properties since multiple genes and
proteins are involved when drugs are taken. Therefore,
drug-target interactions and further genomic network infor-
mation are also commonly adopted in drug repositioning.
The last data type of drug-centric database is the drug side
effects and indication information. These phenotypic data
are also related to diseases, containing pharmacology
information. From DailyMed and DrugCentral, we can
obtain overall drug information, including original drug
indications [285-287]. Side effects are negative effects of
drugs which imply underlying drug mechanisms and
biological pathways. SIDER [288] provides adverse drug
Table 6. List of data resources for drug repositioning
Database Description Quantity
PROMISCOUS [332] Contains information on drugs with related targets and side effects 25 K drugs,23 K drug-target interactions,1.4 K side-effects
DPDR-CPI [333] Contains information on drugs and 611 human protein targetsPredicts off-targets and potential indications
2.5 K drugs, 611 targets
repoDB [334] Contains drugs including successes, failures, and 2,051 related diseases 1.5 K drugs, 2 K diseases
RepurposeDB [335] Contains repositioned drugs and diseases 256 drugs, 1.1 K indications
e-Drug3D [282] Contains molecular structures of FDA drugs approved between 1939 and 2019
19 K molecular structures
PubChem [310] An integrated chemistry database. It contains from small to large molecules with structures, physical properties, bioactivities, patents etc.
96.5 M molecules
ChemSpider [284] Chemical structure database with fast text and structure search access 81 M chemical structures
DrugBank [313] A free, comprehensive drugs and drug targets database. It contains various chemical and target information for each drug.
13 K compounds, 5.1 K targets
DrugCentral [285] Comprehensive drug information source for approved drugs including indications and drug mode of action
4.5 K active ingredients, 77 K FDA drug labels
PharmGKB [301] Comprehensive drug information source for approved drugs including indications and drug mode of action
680 drugs, 149 pathways, 22 K variant annotations
KEGG [314] Databases resource for understanding high-level functions and utilities of biological system
18 K metabolites and small molecules, 11 K drugs, 7.7 K enzymes.
SIDER [288] A database of marketed medicines and their recorded adverse drug reactions (ADRs)
1.4 K drugs, 5.8 K serious events
ADReCS [291] Contains 669,104 drugs and ADR pairs mined from the FDA Adverse Event Reporting System
2.5 K drugs, 10 K ADRs
TWOSIDES [289] Comprehensive database for drug-drug-effect relationships 3.3 K drugs, 17 K ADR types
CMap [79,292] A library containing gene expression profiles from small molecule compounds tested in multiple cell types
1.5 M gene expression profiles, 5 K small-molecule compounds, 3 K genetic reagents
Gene Expression Omnibus [293]
Database of high throughput gene expression profiles 3.3 M samples
ArrayExpress [295] Database of microarray gene expression profiles 2.4 M assays
Genomics of Drug Sensitivity in Cancer (GDSC) [296]
Contains screenings of 1,000 human cancer cell lines with over 100 compounds
809 Cell lines, 175 Compounds, 118 K IC50s
CCLE [34] Contains mRNA expression and mutation data of over 1,100 cancer cell lines
1.4 K cell lines, 84 K genes, 1 M mutation data
DGIdb [336] Database for drug-gene interactions and potential druggability 10 K drugs, 40 K genes
DisGeNET [25] Collects disease-gene, disease-variant associations with homogeneous annotation
628 K gene-disease associations, 17 K genes, 24 K diseases, 210 K variant-disease associations
The Human Phenotype Ontology (HPO) [337]
The standardized vocabulary of phenotypic abnormalities in human disease 13 K terms, 156 K annotations to hereditary diseases
920 Biotechnology and Bioprocess Engineering 25: 895-930 (2020)
reactions (ADRs) of marketed drugs, while OFFSIDES
and TWOSIDES [289] provides information on side
effects not listed on the official FDA labels and negative
drug-drug interactions constructed by preprocessing the
FDA Adverse Event Reporting System (FAERS) [290].
There is also another database of ADRs recently updated
by integrating public medical repositories [291].
6.5.2. Disease-centric databases
Drug-GDA are important in drug repositioning because the
repositioning can be conducted by finding novel targets in
terms of both drugs and diseases. Transcriptional signatures
can be used to represent and link drug-disease associations.
The Connectivity Map (CMap) provides gene expression
profiles of over 5,000 small molecule compounds tested on
multiple cell lines [79,292]. CMap data presents drug
effects on various disease conditions. Moreover, the GEO
from NCBI [293,294] and ArrayExpress from EBI [295]
provide gene expression data yielded from hundreds of
disease conditions in various species. These raw expression
data can be processed for disease signatures. Moreover, the
Cancer Cell Line Encyclopedia (CCLE) [34] and Genomics
of Drug Sensitivity in Cancer (GDSC) [296] can be adopted
to drug repositioning studies in cancer. To represent diseases,
Unified Medical Language System (UMLS) IDs [297],
Medical Subject Headings (MeSH) terms [298] or ontologies
are used, and further applied to discriminate between them.
Disease-gene relation data are important to connect drug-
disease associations as with drug-gene relations. DisGeNet
provides information on disease-gene and disease-variant
associations [23,25,299]. Since targeted genes or proteins
interact with other genes and proteins, their interactions are
important. Protein-protein interactions, gene-gene interactions,
and further related pathways carry information on the
biological activities between drugs and diseases [38,300,
301]. Finally, gene mutations and variants can be enlisted,
particularly when studying disease-centric drug repositioning.
COSMIC provides somatic mutations in human cancer,
which can describe cancer-specific disease characteristics
[302]. Other resources dbGAP, dbSNP, and dbVar from
NCBI contain information on human genetic variations
[303-305].
7. Conclusion
AI technology can be applied to a wide range of applications.
The widely used AI algorithms, particularly deep learning-
based algorithms, were primarily developed in the fields of
computer vision, natural language processing, and acoustic
signal processing. However, because of the reasons here,
applying fancy AI techniques to the drug discovery process
is quite challenging. First, the drug discovery process is
very complicated and it involves specialized knowledge in
a variety of fields (biology, chemistry, and medicine; among
others.). Second, the drug discovery process requires
compelling evidence for decision making because it directly
affects public health and the pharmaceutical industry’s net
profits. Nevertheless, many researchers proved the fact that
the future of drug discovery with AI technology is obviously
promising by their tremendous efforts that are covered in
this review. Still, the discrepancy between the two domains
is a big hurdle. Therefore, AI experts and other domain
experts will need to collaborate closely to develop ‘drug-
discovery-specific’ AI technology for real advances in the
current drug discovery. AI experts will need to understand
the characteristics of drug discovery data and make an
effort to develop appropriate and interpretable algorithms
that can explain the modes of action, to provide evidence
for further decision making. Other domain experts will
need to generate biological and chemical data with
minimal experimental errors and store them in unified
platforms for further improvements to the AI systems.
However, the most important thing for both groups is to be
open to working together and actively communicating to
construct a concrete framework for a new revolution in
drug discovery. We hope this review provides a good starting
point for closing this gap.
Acknowledgments
This work was supported by the National Research
Foundation of Korea (NRF) grant funded by the Korea
government (NRF-2020R1A2C2004628), and was supported
by the Bio-Synergy Research Project (NRF-2017M3A9C
4092978) of the Ministry of Science, ICT.
The authors declare no conflict of interest.
Neither ethical approval nor informed consent was required
for this study.
References
1. DiMasi, J. A., H. G. Grabowski, and R. W. Hansen (2016)Innovation in the pharmaceutical industry: New estimates ofR&D costs. J. Health Econ. 47: 20-33.
2. Paul, S. M., D. S. Mytelka, C. T. Dunwiddie, C. C. Persinger, B.H. Munos, S. R. Lindborg, and A. L. Schacht (2010) How toimprove R&D productivity: the pharmaceutical industry’sgrand challenge. Nat. Rev. Drug Discov. 9: 203-214.
3. van de Waterbeemd, H. and E. Gifford (2003) ADMET in silicomodelling: towards prediction paradise? Nat. Rev. Drug Discov.2: 192-204.
4. Mak, K. K. and M. R. Pichika (2019) Artificial intelligence indrug development: present status and future prospects. Drug
A Review of Artificial Intelligence in Drug Discovery 921
Discov. Today. 24: 773-780.5. Yang, X., Y. Wang, R. Byrne, G. Schneider, and S. Yang (2019)
Concepts of artificial intelligence for computer-assisted drugdiscovery. Chem. Rev. 119: 10520-10594.
6. Eder, J., R. Sedrani, and C. Wiesmann (2014) The discovery offirst-in-class drugs: origins and evolution. Nat. Rev. Drug Discov.13: 577-587.
7. Brown, D. (2007) Unfinished business: target-based drugdiscovery. Drug Discov. Today 12: 1007-1012.
8. Hsu, Y. H., J. Yao, L. C. Chan, T. J. Wu, J. L. Hsu, Y. F. Fang, Y.Wei, Y. Wu, W. C. Huang, C. L. Liu, Y. C. Chang, M. Y. Wang,C. W. Li, J. Shen, M. K. Chen, A. A. Sahin, A. Sood, G. B.Mills, D. Yu, G. N. Hortobagyi, and M. C. Hung (2014)Definition of PKC-α, CDK6, and MET as therapeutic targets intriple-negative breast cancer. Cancer Res. 74: 4822-4835.
9. Chen, B. and A. Butte (2016) Leveraging big data to transformtarget selection and drug discovery. Clin. Pharmacol. Ther.99: 285-297.
10. Kodama, K., M. Horikoshi, K. Toda, S. Yamada, K. Hara, J.Irie, M. Sirota, A. A. Morgan, R. Chen, H. Ohtsu, S. Maeda, T.Kadowaki, and A. J. Butte (2012) Expression-based genome-wide association study links the receptor CD44 in adipose tissuewith type 2 diabetes. Proc. Natl. Acad. Sci. USA. 109: 7049-7054.
11. Zhu, Z., F. Zhang, H. Hu, A. Bakshi, M. R. Robinson, J. E.Powell, G. W. Montgomery, M. E. Goddard, N. R. Wray, P. M.Visscher, and J. Yang (2016) Integration of summary data fromGWAS and eQTL studies predicts complex trait gene targets.Nat. Genet. 48: 481-487.
12. van Dam, S., U. Võsa, A. van der Graaf, L. Franke, and J. P. deMagalhães (2018) Gene co-expression analysis for functionalclassification and gene-disease predictions. Brief. Bioinform.19: 575-592.
13. Petyuk, V. A., R. Chang, M. Ramirez-Restrepo, N. D. Beckmann,M. Y. R. Henrion, P. D. Piehowski, K. Zhu, S. Wang, J. Clarke,M. J. Huentelman, F. Xie, V. Andreev, A. Engel, T. Guettoche,L. Navarro, P. De Jager, J. A. Schneider, C. M. Morris, I. G.McKeith, R. H. Perry, S. Lovestone, R. L. Woltjer, T. G. Beach,L. I. Sue, G. E. Serrano, A. P. Lieberman, R. L. Albin, I. Ferrer,D. C. Mash, C. M. Hulette, J. F. Ervin, E. M. Reiman, J. A.Hardy, D. A. Bennett, E. Schadt, R. D. Smith, and A. J. Myers(2018) The human brainome: network analysis identifies HSPA2as a novel Alzheimer’s disease target. Brain. 141: 2721-2739.
14. Lee, S., C. Zhang, Z. Liu, M. Klevstig, B. Mukhopadhyay, M.Bergentall, R. Cinar, M. Ståhlman, N. Sikanic, J. K. Park, S.Deshmukh, A. M. Harzandi, T. Kuijpers, M. Grøtli, S. J.Elsässer, B. D. Piening, M. Snyder, U. Smith, J. Nielsen, F.Bäckhed, G. Kunos, M. Uhlen, J. Boren, and A. Mardinoglu(2017) Network analyses identify liver-specific targets fortreating liver diseases. Mol. Syst. Biol. 13: 938.
15. Zou, Q., J. Li, L. Song, X. Zeng, and G. Wang (2016) Similaritycomputation strategies in the microRNA-disease network: asurvey. Brief. Funct. Genomics. 15: 55-64.
16. Chen, X., D. Xie, L. Wang, Q. Zhao, Z. H. You, and H. Liu(2018) BNPMDA: Bipartite Network Projection for MiRNA-Disease Association prediction. Bioinformatics. 34: 3178-3186.
17. Ding, P., J. Luo, C. Liang, Q. Xiao, and B. Cao (2018) Humandisease MiRNA inference by combining target informationbased on heterogeneous manifolds. J. Biomed. Inform. 80: 26-36.
18. Mohamed, S. K., V. Nováček, and A. Nounu (2020) Discoveringprotein drug targets using knowledge graph embeddings.Bioinformatics. 36: 603-610.
19. Richardson, P., I. Griffin, C. Tucker, D. Smith, O. Oechsle, A.Phelan, M. Rawling, E. Savory, and J. Stebbing (2020) Baricitinibas potential treatment for 2019-nCoV acute respiratory disease.Lancet. 395: e30-e31.
20. Segler, M. H. S., M. Preuss, and M. P. Waller (2018) Planning
chemical syntheses with deep neural networks and symbolic AI.Nature. 555: 604-610.
21. Ferrero, E., I. Dunham, and P. Sanseau (2017) In silico predictionof novel therapeutic targets using gene-disease association data.J. Transl. Med. 15: 182.
22. Mamoshina, P., M. Volosnikova, I. V. Ozerov, E. Putin, E.Skibina, F. Cortese, and A. Zhavoronkov (2018) Machinelearning on human muscle transcriptomic data for biomarkerdiscovery and tissue-specific drug target identification. Front.Genet. 9: 242.
23. Piñero, J., Á. Bravo, N. Queralt-Rosinach, A. Gutiérrez-Sacristán, J. Deu-Pons, E. Centeno, J. García-García, F. Sanz,and L. I. Furlong (2017) DisGeNET: A comprehensive platformintegrating information on human disease-associated genes andvariants. Nucleic Acids Res. 45: D833-D839.
24. Stoeger, T., M. Gerlach, R. I. Morimoto, and L. A. NunesAmaral (2018) Large-scale investigation of the reasons whypotentially important genes are ignored. PLoS Biol. 16: e2006643.
25. Piñero, J., J. M. Ramírez-Anguita, J. Saüch-Pitarch, F. Ronzano,E. Centeno, F. Sanz, and L. I. Furlong (2020) The DisGeNETknowledge platform for disease genomics: 2019 update. NucleicAcids Res. 48: D845-D855.
26. Davis, A. P., C. J. Grondin, R. J. Johnson, D. Sciaky, R.McMorran, J. Wiegers, T. C. Wiegers, and C. J. Mattingly(2019) The Comparative Toxicogenomics Database: update2019. Nucleic Acids Res. 47: D948-D954.
27. Vasaikar, S. V., P. Straub, J. Wang, and B. Zhang (2018)LinkedOmics: analyzing multi-omics data within and across 32cancer types. Nucleic Acids Res. 46: D956-D963.
28. Carvalho-Silva, D., A. Pierleoni, M. Pignatelli, C. Ong, L.Fumis, N. Karamanis, M. Carmona, A. Faulconbridge, A.Hercules, E. McAuley, A. Miranda, G. Peat, M. Spitzer, J.Barrett, D. G. Hulcoop, E. Papa, G. Koscielny, and I. Dunham(2019) Open Targets Platform: new developments and updatestwo years on. Nucleic Acids Res. 47: D1056-D1065.
29. Brown, K. K., M. M. Hann, A. S. Lakdawala, R. Santos, P. J.Thomas, and K. Todd (2018) Approaches to target tractabilityassessment - a practical perspective. Medchemcomm. 9: 606-613.
30. Huang, Z., J. Shi, Y. Gao, C. Cui, S. Zhang, J. Li, Y. Zhou, andQ. Cui (2019) HMDD v3.0: a database for experimentallysupported human microRNA-disease associations. NucleicAcids Res. 47: D1013-D1017.
31. DepMap portal. https://depmap.org/portal/. 32. Meyers, R. M., J. G. Bryan, J. M. McFarland, B. A. Weir, A. E.
Sizemore, H. Xu, N. V. Dharia, P. G. Montgomery, G. S.Cowley, S. Pantel, A. Goodale, Y. Lee, L. D. Ali, G. Jiang, R.Lubonja, W. F. Harrington, M. Strickland, T. Wu, D. C. Hawes,V. A. Zhivich, M. R. Wyatt, Z. Kalani, J. J. Chang, M.Okamoto, K. Stegmaier, T. R. Golub, J. S. Boehm, F. Vazquez,D. E. Root, W. C. Hahn, and A. Tsherniak (2017) Computationalcorrection of copy number effect improves specificity ofCRISPR-Cas9 essentiality screens in cancer cells. Nat. Genet.49: 1779-1784.
33. Tsherniak, A., F. Vazquez, P. G. Montgomery, B. A. Weir, G.Kryukov, G. S. Cowley, S. Gill, W. F. Harrington, S. Pantel, J.M. Krill-Burger, R. M. Meyers, L. Ali, A. Goodale, Y. Lee, G.Jiang, J. Hsiao, W. F. J. Gerath, S. Howell, E. Merkel, M.Ghandi, L. A. Garraway, D. E. Root, T. R. Golub, J. S. Boehm,and W. C. Hahn (2017) Defining a cancer dependency map.Cell. 170: 564-576.e16.
34. Barretina, J., G. Caponigro, N. Stransky, K. Venkatesan, A. A.Margolin, S. Kim, C. J. Wilson, J. Lehár, G. V. Kryukov, D.Sonkin, A. Reddy, M. Liu, L. Murray, M. F. Berger, J. E.Monahan, P. Morais, J. Meltzer, A. Korejwa, J. Jané-Valbuena,F. A. Mapa, J. Thibault, E. Bric-Furlong, P. Raman, A. Shipway,I. H. Engels, J. Cheng, G. K. Yu, J. Yu, P. Aspesi, M. de Silva, K.
922 Biotechnology and Bioprocess Engineering 25: 895-930 (2020)
Jagtap, M. D. Jones, L. Wang, C. Hatton, E. Palescandolo, S.Gupta, S. Mahan, C. Sougnez, R. C. Onofrio, T. Liefeld, L.MacConaill, W. Winckler, M. Reich, N. Li, J. P. Mesirov, S. B.Gabriel, G. Getz, K. Ardlie, V. Chan, V. E. Myer, B. L. Weber, J.Porter, M. Warmuth, P. Finan, J. L. Harris, M. Meyerson, T. R.Golub, M. P. Morrissey, W. R. Sellers, R. Schlegel, and L. A.Garraway (2012) The Cancer Cell Line Encyclopedia enablespredictive modelling of anticancer drug sensitivity. Nature. 483:603-607.
35. Stransky, N., M. Ghandi, G. V. Kryukov, L. A. Garraway, J.Lehár, M. Liu, D. Sonkin, A. Kauffmann, K. Venkatesan, E. J.Edelman, M. Riester, J. Barretina, G. Caponigro, R. Schlegel,W. R. Sellers, F. Stegmeier, M. Morrissey, A. Amzallag, I.Pruteanu-Malinici, D. A. Haber, S. Ramaswamy, C. H. Benes,M. P. Menden, F. Iorio, M. R. Stratton, U. McDermott, M. J.Garnett, and J. Saez-Rodriguez (2015) Pharmacogenomicagreement between two cancer cell line data sets. Nature. 528:84-87.
36. Ghandi, M., F. W. Huang, J. Jané-Valbuena, G. V. Kryukov, C.C. Lo, E. R. McDonald, J. Barretina, E. T. Gelfand, C. M.Bielski, H. Li, K. Hu, A. Y. Andreev-Drakhlin, J. Kim, J. M.Hess, B. J. Haas, F. Aguet, B. A. Weir, M. V. Rothberg, B. R.Paolella, M. S. Lawrence, R. Akbani, Y. Lu, H. L. Tiv, P. C.Gokhale, A. de Weck, A. A. Mansour, C. Oh, J. Shih, K. Hadi,Y. Rosen, J. Bistline, K. Venkatesan, A. Reddy, D. Sonkin, M.Liu, J. Lehar, J. M. Korn, D. A. Porter, M. D. Jones, J. Golji, G.Caponigro, J. E. Taylor, C. M. Dunning, A. L. Creech, A. C.Warren, J. M. McFarland, M. Zamanighomi, A. Kauffmann, N.Stransky, M. Imielinski, Y. E. Maruvka, A. D. Cherniack, A.Tsherniak, F. Vazquez, J. D. Jaffe, A. A. Lane, D. M. Weinstock,C. M. Johannessen, M. P. Morrissey, F. Stegmeier, R. Schlegel,W. C. Hahn, G. Getz, G. B. Mills, J. S. Boehm, T. R. Golub, L.A. Garraway, and W. R. Sellers (2019) Next-generationcharacterization of the Cancer Cell Line Encyclopedia. Nature.569: 503-508.
37. Yu, C., A. M. Mannan, G. M. Yvone, K. N. Ross, Y. L. Zhang,M. A. Marton, B. R. Taylor, A. Crenshaw, J. Z. Gould, P.Tamayo, B. A. Weir, A. Tsherniak, B. Wong, L. A. Garraway,A. F. Shamji, M. A. Palmer, M. A. Foley, W. Winckler, S. L.Schreiber, A. L. Kung, and T. R. Golub (2016) High-throughputidentification of genotype-specific cancer vulnerabilities inmixtures of barcoded tumor cell lines. Nat. Biotechnol. 34: 419-423.
38. Szklarczyk, D., A. L. Gable, D. Lyon, A. Junge, S. Wyder, J.Huerta-Cepas, M. Simonovic, N. T. Doncheva, J. H. Morris, P.Bork, L. J. Jensen, and C. V. Mering (2019) STRING v11:protein-protein association networks with increased coverage,supporting functional discovery in genome-wide experimentaldatasets. Nucleic Acids Res. 47: D607-D613.
39. Wang, Y., S. Zhang, F. Li, Y. Zhou, Y. Zhang, Z. Wang, R.Zhang, J. Zhu, Y. Ren, Y. Tan, C. Qin, Y. Li, X. Li, Y. Chen, andF. Zhu (2020) Therapeutic target database 2020: enrichedresource for facilitating research and early development oftargeted therapeutics. Nucleic Acids Res. 48: D1031-D1041.
40. Pearson, N., K. Malki, D. Evans, L. Vidler, C. Ruble, J.Scherschel, B. Eastwood, and D. A. Collier (2019) TractaViewer:a genome-wide tool for preliminary assessment of therapeutictarget druggability. Bioinformatics. 35: 4509-4510.
41. Keiser, M. J., V. Setola, J. J. Irwin, C. Laggner, A. I. Abbas, S. J.Hufeisen, N. H. Jensen, M. B. Kuijer, R. C. Matos, T. B. Tran,R. Whaley, R. A. Glennon, J. Hert, K. L. H. Thomas, D. D.Edwards, B. K. Shoichet, and B. L. Roth (2009) Predicting newmolecular targets for known drugs. Nature. 462: 175-181.
42. Morris, G. M., R. Huey, W. Lindstrom, M. F. Sanner, R. K.Belew, D. S. Goodsell, and A. J. Olson (2009) AutoDock4 andAutoDockTools4: Automated docking with selective Receptor
flexibility. J. Comput. Chem. 30: 2785-2791.43. Trott, O. and A. J. Olson (2010) AutoDock Vina: improving the
speed and accuracy of docking with a new scoring function,efficient optimization, and multithreading. J. Comput. Chem.31: 455-461.
44. Koes, D. R., M. P. Baumgartner, and C. J. Camacho (2013)Lessons learned in empirical scoring with smina from theCSAR 2011 benchmarking exercise. J. Chem. Inf. Model. 53:1893-1904.
45. Ballester, P. J. and J. B. O. Mitchell (2010) A machine learningapproach to predicting protein-ligand binding affinity withapplications to molecular docking. Bioinformatics. 26: 1169-1175.
46. Li, L., B. Wang, and S. O. Meroueh (2011) Support vectorregression scoring of receptor-ligand complexes for rank-ordering and virtual screening of chemical libraries. J. Chem.Inf. Model. 51: 2132-2138.
47. Ragoza, M., J. Hochuli, E. Idrobo, J. Sunseri, and D. R. Koes(2017) Protein-ligand scoring with convolutional neuralnetworks. J. Chem. Inf. Model. 57: 942-957.
48. Jimenez, J., M. Skalic, G. Martinez-Rosell, and G. De Fabritiis(2018) KDEEP: Protein-ligand absolute binding affinity predictionvia 3D-convolutional neural networks. J. Chem. Inf. Model. 58:287-296.
49. Imrie, F., A. R. Bradley, M. van der Schaar, and C. M. Deane(2018) Protein family-specific models using deep neuralnetworks and transfer learning improve virtual screening andhighlight the need for more data. J. Chem. Inf. Model. 58: 2319-2330.
50. Stepniewska-Dziubinska, M. M., P. Zielenkiewicz, and P.Siedlecki (2018) Development and evaluation of a deeplearning model for protein-ligand binding affinity prediction.Bioinformatics. 34: 3666-3674.
51. Tian, K., M. Shao, Y. Wang, J. Guan, and S. Zhou (2016)Boosting compound-protein interaction prediction by deeplearning. Methods. 110: 64-72.
52. Feinberg, E. N., D. Sur, Z. Wu, B. E. Husic, H. Mai, Y. Li, S.Sun, J. Yang, B. Ramsundar, and V. S. Pande (2018) PotentialNetfor molecular property prediction. ACS Cent. Sci. 4: 1520-1530.
53. Lim, J., S. Ryu, K. Park, Y. J. Choe, J. Ham, and W. Y. Kim(2019) Predicting drug–target interaction using a novel graphneural network with 3D structure-embedded graph representation.J. Chem. Inf. Model. 59: 3981-3988.
54. Landrum, G., B. Kelley, P. Tosco, sriniker, gedeck,NadineSchneider, R. Vianello, A. Dalke, AlexanderSavelyev, S.Turk, B. Cole, M. Swain, A. Vaucher, M. Wójcikowski, A. Pahl,JP, strets123, JLVarjo, P. Fuller, DoliathGavid, N. O'Boyle, P. P.Zarrinkar, G. Sforna, M. Nowotka, pzc, J. van Santen, J. H.Jensen, J. Domański, D. Hall, and P. Avery (2018) rdkit/rdkit:2018_03_1 (Q1 2018) Release. Zenodo. http://doi.org/10.5281/zenodo.1222070.
55. O’Boyle, N. M., M. Banck, C. A. James, C. Morley, T.Vandermeersch, and G. R. Hutchison (2011) Open Babel: Anopen chemical toolbox. J. Cheminform. 3: 33.
56. Willighagen, E. L., J. W. Mayfield, J. Alvarsson, A. Berg, L.Carlsson, N. Jeliazkova, S. Kuhn, T. Pluskal, M. Rojas-Cherto,O. Spjuth, G. Torrance, C. T. Evelo, R. Guha, and C. Steinbeck(2017) Erratum to: The Chemistry Development Kit (CDK)v2.0: atom typing, depiction, molecular formulas, and substructuresearching. J. Cheminform. 9: 53.
57. Yap, C. W. (2011) PaDEL-descriptor: an open source softwareto calculate molecular descriptors and fingerprints. J. Comput.Chem. 32: 1466-1474.
58. Mauri, A., V. Consonni, M. Pavan, and R. Todeschini (2006)Dragon software: An easy approach to molecular descriptorcalculations. Match-Commun. Math. Comput. Chem. 56: 237-248.
A Review of Artificial Intelligence in Drug Discovery 923
59. Cao, D. S., Y. Z. Liang, J. Yan, G. S. Tan, Q. S. Xu, and S. Liu(2013) PyDPI: freely available python package forchemoinformatics, bioinformatics, and chemogenomics studies.J. Chem. Inf. Model. 53: 3086-3096.
60. Cao, D. S., N. Xiao, Q. S. Xu, and A. F. Chen (2015) Rcpi: R/Bioconductor package to generate various descriptors of proteins,compounds and their interactions. Bioinformatics. 31: 279-281.
61. Moriwaki, H., Y. S. Tian, N. Kawashita, and T. Takagi (2018)Mordred: a molecular descriptor calculator. J. Cheminform. 10: 4.
62. Burden, F. R. (2001) Quantitative structure-Activity relationshipstudies using gaussian processes. J. Chem. Inf. Comput Sci.41: 830-835.
63. Svetnik, V., A. Liaw, C. Tong, J. C. Culberson, R. P. Sheridan,and B. P. Feuston (2003) Random forest: a classification andregression tool for compound classification and QSAR modeling.J. Chem. Inf. Comput. Sci. 43: 1947-1958.
64. Ma, J., R. P. Sheridan, A. Liaw, G. E. Dahl, and V. Svetnik(2015) Deep neural nets as a method for quantitative structure–activity relationships. J. Chem. Inf. Model. 55: 263-274.
65. Xu, Y., J. Ma, A. Liaw, R. P. Sheridan, and V. Svetnik (2017)Demystifying Multitask Deep neural networks for quantitativestructure-activity relationships. J. Chem. Inf. Model. 57: 2490-2504.
66. Ghasemi, F., A. Mehridehnavi, A. Fassihi, and H. Prez-Snchez(2018) Deep neural network in QSAR studies using deep beliefnetwork. Appl. Soft Comput.62: 251-258.
67. Kato, Y., S. Hamada, and H. Goto (2020) Validation Study ofQSAR/DNN models using the competition datasets. Mol. Inf.39: 1900154.
68. Lusci, A., G. Pollastri, and P. Baldi (2013) Deep architecturesand deep learning in chemoinformatics: the prediction ofaqueous solubility for drug-like molecules. J. Chem. Inf. Model.53: 1563-1575.
69. Duvenaud, D., D. Maclaurin, J. Aguilera-Iparraguirre, R.Gómez-Bombarelli, T. Hirzel, A. Aspuru-Guzik, and R. P.Adams (2015) Convolutional networks on graphs for learningmolecular fingerprints. arXiv. 1509.09292.
70. Rogers, D. and M. Hahn (2010) Extended-connectivityfingerprints. J. Chem. Inf. Model. 50: 742-754.
71. Jaeger, S., S. Fulle, and S. Turk (2018) Mol2vec: Unsupervisedmachine learning approach with chemical intuition. J. Chem.Inf. Model. 58: 27-35.
72. Chakravarti, S. K. and S. R. M. Alla (2019) Descriptor FreeQSAR modeling using deep learning with long short-termmemory neural networks. Front. Artif. Intell. 2: 17.
73. Winter, R., F. Montanari, F. Noé, and D. A. Clevert (2019)Learning continuous and data-driven molecular descriptors bytranslating equivalent chemical representations. Chem. Sci. 10:1692-1701.
74. Honda, S., S. Shi, and H. R. Ueda (2019) SMILES transformer:pre-trained molecular fingerprint for low data drug discovery.arXiv. 1911.04738.
75. Devlin, J., M. W. Chang, K. Lee, and K. Toutanova (2018)BERT: pre-training of deep bidirectional transformers forlanguage understanding. arXiv. 1810.04805.
76. Altae-Tran, H., B. Ramsundar, A. S. Pappu, and V. Pande(2017) Low data drug discovery with one-shot learning. ACSCent. Sci. 3: 283-293.
77. Rohrer, S. G. and K. Baumann (2009) Maximum unbiasedvalidation (MUV) data sets for virtual screening based onPubChem bioactivity data. J. Chem. Inf. Model. 49: 169-184.
78. Jeon, M., D. Park, J. Lee, H. Jeon, M. Ko, S. Kim, Y. Choi, A.C. Tan, and J. Kang (2019) ReSimNet: drug response similarityprediction using siamese neural networks. Bioinformatics. 35:5249-5256.
79. Lamb, J., E. D. Crawford, D. Peck, J. W. Modell, I. C. Blat, M.
J. Wrobel, J. Lerner, J. P. Brunet, A. Subramanian, K. N. Ross,M. Reich, H. Hieronymus, G. Wei, S. A. Armstrong, S. J.Haggarty, P. A. Clemons, R. Wei, S. A. Carr, E. S. Lander, andT. R. Golub (2006) The Connectivity Map: using gene-expressionsignatures to connect small molecules, genes, and disease.Science. 313: 1929-1935.
80. Park, K., Y. J. Ko, P. Durai, and C. H. Pan (2019) Machinelearning-based chemical binding similarity using evolutionaryrelationships of target genes. Nucleic Acids Res. 47: e128.
81. Cheng, T., M. Hao, T. Takeda, S. H. Bryant, and Y. Wang(2017) Large-scale prediction of drug-target interaction: a data-centric review. AAPS J. 19: 1264-1275.
82. Ding, H., I. Takigawa, H. Mamitsuka, and S. Zhu (2014)Similarity-based machine learning methods for predicting drug-target interactions: a brief review. Brief Bioinform. 15: 734-747.
83. Bleakley, K. and Y. Yamanishi (2009) Supervised prediction ofdrug-target interactions using bipartite local models. Bioinformatics.25: 2397-2403.
84. Xia, Z., L. Y. Wu, X. Zhou, and S. T. C. Wong (2010) Semi-supervised drug-protein interaction prediction from heterogeneousbiological spaces. BMC Syst. Biol. 4 Suppl 2: S6.
85. van Laarhoven, T., S. B. Nabuurs, and E. Marchiori (2011)Gaussian interaction profile kernels for predicting drug-targetinteraction. Bioinformatics. 27: 3036-3043.
86. Pahikkala, T., A. Airola, S. Pietila, S. Shakyawar, A. Szwajda, J.Tang, and T. Aittokallio (2015) Toward more realistic drug-target interaction predictions. Brief. Bioinform. 16: 325-337.
87. Keum, J. and H. Nam (2017) SELF-BLM: Prediction of drug-target interactions via self-training SVM. PLoS One. 12: e0171839.
88. Chen, X., M. X. Liu, and G. Y. Yan (2012) Drug-targetinteraction prediction by random walk on the heterogeneousnetwork. Mol. Biosyst. 8: 1970-1978.
89. Luo, Y., X. Zhao, J. Zhou, J. Yang, Y. Zhang, W. Kuang, J.Peng, L. Chen, and J. Zeng (2017) A network integrationapproach for drug-target interaction prediction and computationaldrug repositioning from heterogeneous information. Nat. Commun.8: 573.
90. Wang, S., H. Cho, C. Zhai, B. Berger, and J. Peng (2015)Exploiting ontology graph for predicting sparsely annotatedgene function. Bioinformatics. 31: i357-i364.
91. Ewing, T., J. C. Baber, and M. Feher (2006) Novel 2Dfingerprints for ligand-based virtual screening. J. Chem. Inf.Model. 46: 2423-2431.
92. Dubchak, I., I. Muchnik, S. R. Holbrook, and S. H. Kim (1995)Prediction of protein folding class using global description ofamino acid sequence. Proc. Natl. Acad. Sci. USA. 92: 8700-8704.
93. Zhang, P., L. Tao, X. Zeng, C. Qin, S. Chen, F. Zhu, Z. Li, Y.Jiang, W. Chen, and Y. Z. Chen (2017) A protein networkdescriptor server and its use in studying protein, disease,metabolic and drug targeted networks. Brief. Bioinform. 18:1057-1070.
94. Yu, H., J. Chen, X. Xu, Y. Li, H. Zhao, Y. Fang, X. Li, W. Zhou,W. Wang, and Y. Wang (2012) A systematic prediction ofmultiple drug-target interactions from chemical, genomic, andpharmacological data. PLoS One. 7: e37608.
95. Li, Z. C., M. H. Huang, W. Q. Zhong, Z. Q. Liu, Y. Xie, Z. Dai,and X. Y. Zou (2016) Identification of drug-target interactionfrom interactome network with ‘guilt-by-association’ principleand topology features. Bioinformatics. 32: 1057-1064.
96. Lee, I. and H. Nam (2018) Identification of drug-target interactionby a random walk with restart method on an interactomenetwork. BMC Bioinformatics. 19: 208.
97. Wang, Y. and J. Zeng (2013) Predicting drug-target interactionsusing restricted Boltzmann machines. Bioinformatics. 29: i126-i134.
98. Wen, M., Z. Zhang, S. Niu, H. Sha, R. Yang, Y. Yun, and H. Lu
924 Biotechnology and Bioprocess Engineering 25: 895-930 (2020)
(2017) Deep-learning-based drug-target interaction prediction.J. Proteome Res. 16: 1401-1409.
99. Hu, P. W., K. C. C. Chan, and Z. H. You (2016) Large-scaleprediction of drug-target interactions from deep representations.2016 International Joint Conference on Neural Networks(IJCNN). July 24-29. Vancouver, BC, Canada.
100. Ozturk, H., A. Ozgur, and E. Ozkirimli (2018) DeepDTA: deepdrug-target binding affinity prediction. Bioinformatics. 34: i821-i829.
101. He, T., M. Heidemeyer, F. Ban, A. Cherkasov, and M. Ester(2017) SimBoost: a read-across approach for predicting drug-target binding affinities using gradient boosting machines. J.Cheminform. 9: 24.
102. Tsubaki, M., K. Tomii, and J. Sese (2019) Compound-proteininteraction prediction with end-to-end learning of neural networksfor graphs and sequences. Bioinformatics. 35: 309-318.
103. Gonen, M. (2012) Predicting drug-target interactions fromchemical and genomic kernels using Bayesian matrix factorization.Bioinformatics. 28: 2304-2310.
104. Lee, I., J. Keum, and H. Nam (2019) DeepConv-DTI: Predictionof drug-target interactions via deep learning with convolutionon protein sequences. PLoS Comput. Biol. 15: e1007129.
105. Karimi, M., D. Wu, Z. Wang, and Y. Shen (2019) DeepAffinity:interpretable deep learning of compound-protein affinitythrough unified recurrent and convolutional neural networks.Bioinformatics. 35: 3329-3338.
106. Shen, C., J. Ding, Z. Wang, D. Cao, X. Ding, and T. Hou (2020)From machine learning to deep learning: Advances in scoringfunctions for protein–ligand docking. WIREs Comput. Mol. Sci.10: e1429.
107. Sieg, J., F. Flachsenberg, and M. Rarey (2019) In need of biascontrol: evaluating chemical data for machine learning instructure-based virtual screening. J. Chem. Inf. Model. 59: 947-961.
108. Chen, L., A. Cruz, S. Ramsey, C. J. Dickson, J. S. Duca, V.Hornak, D. R. Koes, and T. Kurtzman (2019) Hidden bias in theDUD-E dataset leads to misleading performance of deeplearning in structure-based virtual screening. PLoS One. 14:e0220113.
109. Hanson, J., K. K. Paliwal, T. Litfin, Y. Yang, and Y. Zhou (2020)Getting to know your neighbor: protein structure predictioncomes of age with contextual machine learning. J. Comput.Biol. 27: 796-814.
110. Shi, Q., W. Chen, S. Huang, Y. Wang, and Z. Xue (2019) Deeplearning for mining protein data. Brief. Bioinform. bbz156.
111. Goodsell, D. S., C. Zardecki, L. Di Costanzo, J. M. Duarte, B. P.Hudson, I. Persikova, J. Segura, C. Shao, M. Voigt, J. D.Westbrook, J. Y. Young, and S. K. Burley (2020) RCSB ProteinData Bank: Enabling biomedical research and drug discovery.Protein Sci. 29: 52-65.
112. Gola, J., O. Obrezanova, E. Champness, and M. Segall (2006)ADMET property prediction: The state of the art and currentchallenges. QSAR Comb. Sci. 25: 1172-1180.
113. Moroy, G., V. Y. Martiny, P. Vayer, B. O. Villoutreix, and M. A.Miteva (2012) Toward in silico structure-based ADMETprediction in drug discovery. Drug Discov. Today. 17: 44-55.
114. Tian, S., J. Wang, Y. Li, D. Li, L. Xu, and T. Hou (2015) Theapplication of in silico drug-likeness predictions in pharmaceuticalresearch. Adv. Drug Deliv. Rev. 86: 2-10.
115. Zhao, Y. H., J. Le, M. H. Abraham, A. Hersey, P. J. Eddershaw,C. N. Luscombe, D. Boutina, G. Beck, B. Sherborne, I. Cooper,and J. A. Platts (2001) Evaluation of human intestinal absorptiondata and subsequent derivation of a quantitative structure-Activity relationship (QSAR) with the Abraham descriptors. J.Pharm. Sci. 90: 749-784.
116. Ponzoni, I., V. Sebastin-Prez, C. Requena-Triguero, C. Roca, M.
J. Martnez, F. Cravero, M. F. Daz, J. A. Pez, R. G. Arrays, J.Adrio, and N. E. Campillo (2017) Hybridizing feature selectionand feature learning approaches in QSAR modeling for drugdiscovery. Sci. Rep. 7: 2403.
117. Wang, N. N., C. Huang, J. Dong, Z. J. Yao, M. F. Zhu, Z. K.Deng, B. Lv, A. P. Lu, A. F. Chen, and D. S. Cao (2017)Predicting human intestinal absorption with modified randomforest approach: a comprehensive evaluation of molecularrepresentation, unbalanced data, and applicability domainissues. RSC Adv. 7: 19007-19018.
118. Yang, M., J. Chen, L. Xu, X. Shi, X. Zhou, Z. Xi, R. An, and X.Wang (2018) A novel adaptive ensemble classification frameworkfor ADME prediction. RSC Adv. 8: 11661-11683.
119. Fredlund, L., S. Winiwarter, and C. Hilgendorf (2017) In vitrointrinsic permeability: a transporter-independent measure ofCaco-2 cell permeability in drug design and development. Mol.Pharm. 14: 1601-1609.
120. Patel, R. D., S. P. Kumar, C. N. Patel, S. S. Shankar, H. A.Pandya, and H. A. Solanki (2017) Parallel screening of drug-like natural compounds using Caco-2 cell permeability QSARmodel with applicability domain, lipophilic ligand efficiencyindex and shape property: A case study of HIV-1 reversetranscriptase inhibitors. J. Mol. Struct. 1146: 80-95.
121. Sun, H., K. Nguyen, E. Kerns, Z. Yan, K. R. Yu, P. Shah, A.Jadhav, and X. Xu (2017) Highly predictive and interpretablemodels for PAMPA permeability. Bioorg. Med. Chem. 25:1266-1276.
122. Chi, C. T., M. H. Lee, C. F. Weng, and M. K. Leong (2019) Insilico prediction of PAMPA effective permeability using a two-QSAR approach. Int. J. Mol. Sci. 20: 3170.
123. Lanevskij, K. and R. Didziapetris (2019) PhysicochemicalQSAR analysis of passive permeability across Caco-2 monolayers.J. Pharm. Sci. 108: 78-86.
124. Oja, M., S. Sild, and U. Maran (2019) Logistic classificationmodels for pH-permeability profile: predicting permeabilityclasses for the biopharmaceutical classification system. J. Chem.Inf. Model. 59: 2442-2455.
125. Shin, M., D. Jang, H. Nam, K. H. Lee, and D. Lee (2018)Predicting the absorption potential of chemical compoundsthrough a deep learning approach. IEEE/ACM Trans. Comput.Biol. Bioinform. 15: 432-440.
126. Wenzel, J., H. Matter, and F. Schmidt (2019) Predictivemultitask deep neural network models for ADME-Tox properties:learning from large data sets. J. Chem. Inf. Model. 59: 1253-1268.
127. Gooch, E. (2004) Medicinal chemistry - an introduction;fundamentals of medicinal chemistry (Gareth Thomas). J.Chem. Educ. 81: 1271.
128. Kumar, R., A. Sharma, M. H. Siddiqui, and R. K. Tiwari (2017)Prediction of drug-plasma protein binding using artificialintelligence based algorithms. Comb. Chem. High ThroughputScreen. 21: 57-64.
129. Wang, N. N., Z. K. Deng, C. Huang, J. Dong, M. F. Zhu, Z. J.Yao, A. F. Chen, A. P. Lu, Q. Mi, and D. S. Cao (2017) ADMEproperties evaluation in drug discovery: Prediction of plasmaprotein binding using NSGA-II combining PLS and consensusmodeling. Chemometr. Intell. Lab. Syst. 170: 84-95.
130. Sun, L., H. Yang, J. Li, T. Wang, W. Li, G. Liu, and Y. Tang(2018) In silico prediction of compounds binding to humanplasma proteins by QSAR models. ChemMedChem. 13: 572-581.
131. Toma, C., D. Gadaleta, A. Roncaglioni, A. Toropov, A. Toropova,M. Marzo, and E. Benfenati (2019) QSAR development forplasma protein binding: influence of the ionization state. Pharm.Res. 36: 28.
132. Ye, Z., Y. Yang, X. Li, D. Cao, and D. Ouyang (2019) AnIntegrated transfer learning and multitask learning approach forpharmacokinetic parameter prediction. Mol. Pharm. 16: 533-541.
A Review of Artificial Intelligence in Drug Discovery 925
133. Prachayasittikul, V., A. Worachartcheewan, A. P. Toropova, A.A. Toropov, N. Schaduangrat, V. Prachayasittikul, and C.Nantasenamat (2017) Large-scale classification of P-glycoproteininhibitors using SMILES-based descriptors. SAR QSAR Environ.Res. 28: 1-16.
134. Gonzalo, C. G. and N. García-Pedrajas (2018) Boosted featureselectors: a case study on prediction P-gp inhibitors andsubstrates. J. Comput. Aided Mol. Des. 32: 1273-1294.
135. Hinge, V. K., D. Roy, and A. Kovalenko (2019) Prediction of P-glycoprotein inhibitors with machine learning classificationmodels and 3D-RISM-KH theory based solvation energydescriptors. J. Comput. Aided Mol. Des. 33: 965-971.
136. Shi, T., Y. Yang, S. Huang, L. Chen, Z. Kuang, Y. Heng, and H.Mei (2019) Molecular image-based convolutional neuralnetwork for the prediction of ADMET properties. Chemometr.Intell. Lab. Syst. 194: 103853.
137. Toropov, A. A., A. P. Toropova, M. Beeg, M. Gobbi, and M.Salmona (2017) QSAR model for blood-brain barrier permeation.J. Pharmacol. Toxicol. Methods. 88: 7-18.
138. Wang, Z., H. Yang, Z. Wu, T. Wang, W. Li, Y. Tang, and G. Liu(2018) In silico prediction of blood–brain barrier permeabilityof compounds by machine learning and resampling methods.ChemMedChem. 13: 2189-2201.
139. Yuan, Y., F. Zheng, and C. G. Zhan (2018) Improved predictionof blood-brain barrier permeability through machine learningwith combined use of molecular property-based descriptors andfingerprints. AAPS J. 20: 54.
140. Miao, R., L. Y. Xia, H. H. Chen, H. H. Huang, and Y. Liang(2019) Improved classification of blood-brain-barrier drugsusing deep learning. Sci. Rep. 9: 8802.
141. Hunt, P. A., M. D. Segall, and J. D. Tyzack (2018) WhichP450:a multi-class categorical model to predict the major metabolisingCYP450 isoform for a compound. J. Comput. Aided Mol. Des.32: 537-546.
142. Tian, S., Y. Djoumbou-Feunang, R. Greiner, and D. S. Wishart(2018) CypReact: A software tool for in silico reactant predictionfor human cytochrome P450 enzymes. J. Chem. Inf. Model. 58:1282-1291.
143. Shan, X., X. Wang, C. D. Li, Y. Chu, Y. Zhang, Y. Xiong, andD. Q. Wei (2019) Prediction of CYP450 enzyme-substrateselectivity based on the network-based label space divisionmethod. J. Chem. Inf. Model. 59: 4577-4586.
144. Li, X., Y. Xu, L. Lai, and J. Pei (2018) Prediction of humancytochrome P450 inhibition using a multitask deep autoencoderneural network. Mol. Pharm. 15: 4336-4345.
145. Pang, X., B. Zhang, G. Mu, J. Xia, Q. Xiang, X. Zhao, A. Liu, G.Du, and Y. Cui (2018) Screening of cytochrome P450 3A4inhibitors via in silico and in vitro approaches. RSC Adv.8: 34783-34792.
146. Wu, Z., T. Lei, C. Shen, Z. Wang, D. Cao, and T. Hou (2019)ADMET evaluation in drug discovery. 19. Reliable predictionof human cytochrome P450 inhibition using artificial intelligenceapproaches. J. Chem. Inf. Model. 59: 4587-4601.
147. He, S., M. Li, X. Ye, H. Wang, W. Yu, W. He, Y. Wang, and Y.Qiao (2017) Site of metabolism prediction for oxidationreactions mediated by oxidoreductases based on chemical bond.Bioinformatics. 33: 363-372.
148. Šícho, M., C. De Bruyn Kops, C. Stork, D. Svozil, and J.Kirchmair (2017) FAME 2: simple and effective machinelearning model of cytochrome P450 regioselectivity. J. Chem.Inf. Model. 57: 1832-1846.
149. Finkelmann, A. R., D. D. Goldmann, G. Schneider, and A. H.Goller (2018) MetScore: Site of metabolism prediction beyondcytochrome P450 enzymes. ChemMedChem. 13: 2281-2289.
150. Cai, Y., H. Yang, W. Li, G. Liu, P. W. Lee, and Y. Tang (2019)Computational prediction of site of metabolism for UGT-
catalyzed reactions. J. Chem. Inf. Model. 59: 1085-1095.151. Lee, P. W. (2014) Handbook of Metabolic Pathways of
Xenobiotics. John Wiley & Sons, 152. Podlewska, S. and R. Kafel (2018) MetStabOn-online platform
for metabolic stability predictions. Int. J. Mol. Sci. 19: 1040.153. Esaki, T., R. Watanabe, H. Kawashima, R. Ohashi, Y. Natsume-
Kitatani, C. Nagao, and K. Mizuguchi (2019) Data curation canimprove the prediction accuracy of metabolic intrinsic clearance.Mol. Inform. 38: e1800086.
154. Liu, K., X. Sun, L. Jia, J. Ma, H. Xing, J. Wu, H. Gao, Y. Sun, F.Boulnois, and J. Fan (2019) Chemi-net: A molecular graphconvolutional network for accurate drug property prediction.Int. J. Mol. Sci. 20: 3389.
155. Zhivkova, Z. D. (2017) Quantitative structure - pharmacokineticrelationships for plasma clearance of basic drugs withconsideration of the major elimination pathway. J. Pharm.Pharm. Sci. 20: 135-147.
156. Wakayama, N., K. Toshimoto, K. Maeda, S. Hotta, T. Ishida, Y.Akiyama, and Y. Sugiyama (2018) In silico prediction of majorclearance pathways of drugs among 9 routes with two-stepsupport vector machines. Pharm. Res. 35: 197.
157. Watanabe, R., R. Ohashi, T. Esaki, H. Kawashima, Y. Natsume-Kitatani, C. Nagao, and K. Mizuguchi (2019) Development ofan in silico prediction system of human renal excretion andclearance from chemical structure information incorporatingfraction unbound in plasma as a descriptor. Sci. Rep. 9: 18782.
158. Chen, J., H. Yang, L. Zhu, Z. Wu, W. Li, Y. Tang, and G. Liu(2020) In silico prediction of human renal clearance of compoundsusing quantitative structure-pharmacokinetic relationship models.Chem. Res. Toxicol. 33: 640-650.
159. Hong, H., S. Thakkar, M. Chen, and W. Tong (2017) Developmentof decision forest models for prediction of drug-induced liverinjury in humans using a large set of FDA-approved drugs. Sci.Rep. 7: 17311.
160. Kim, E. and H. Nam (2017) Prediction models for drug-inducedhepatotoxicity by using weighted molecular fingerprints. BMCBioinformatics. 18: 227.
161. Kotsampasakou, E., F. Montanari, and G. F. Ecker (2017)Predicting drug-induced liver injury: The importance of datacuration. Toxicology. 389: 139-145.
162. Ai, H., W. Chen, L. Zhang, L. Huang, Z. Yin, H. Hu, Q. Zhao, J.Zhao, and H. Liu (2018) Predicting drug-induced liver injuryusing ensemble learning methods and molecular fingerprints.Toxicol. Sci. 165: 100-107.
163. Hammann, F., V. Schning, and J. Drewe (2019) Prediction ofclinically relevant drug-induced liver injury from structureusing machine learning. J. Appl. Toxicol. 39: 412-419.
164. He, S., T. Ye, R. Wang, C. Zhang, X. Zhang, G. Sun, and X. Sun(2019) An in silico model for predicting drug-inducedhepatotoxicity. Int. J. Mol. Sci. 20: 1897.
165. Williams, D. P., S. E. Lazic, A. J. Foster, E. Semenova, and P.Morgan (2019) Predicting drug-induced liver injury withBayesian machine learning. Chem. Res. Toxicol. 33: 239-248.
166. Munawar, S., M. J. Windley, E. G. Tse, M. H. Todd, A. P. Hill, J.I. Vandenberg, and I. Jabeen (2018) Experimentally validatedpharmacoinformatics approach to predict hERG inhibitionpotential of new chemical entities. Front. Pharmacol. 9: 1035.
167. Siramshetty, V. B., Q. Chen, P. Devarakonda, and R. Preissner(2018) The catch-22 of predicting hERG blockade usingpublicly accessible bioactivity data. J. Chem. Inf. Model. 58:1224-1233.
168. Cai, C., P. Guo, Y. Zhou, J. Zhou, Q. Wang, F. Zhang, J. Fang,and F. Cheng (2019) Deep learning-based prediction of drug-induced cardiotoxicity. J. Chem. Inf. Model. 59: 1073-1084.
169. Konda, L. S. K., S. K. Praba, and R. Kristam (2019) hERGliability classification models using machine learning techniques.
926 Biotechnology and Bioprocess Engineering 25: 895-930 (2020)
Comput. Toxicol. 12: 100089.170. Lee, A. A., Q. Yang, A. Bassyouni, C. R. Butler, X. Hou, S.
Jenkinson, and D. A. Price (2019) Ligand biological activitypredicted by cleaning positive and negative chemical correlations.Proc. Natl. Acad. Sci. USA. 116: 3373-3378.
171. Lee, H. M., M. S. Yu, S. R. Kazmi, S. Y. Oh, K. H. Rhee, M. A.Bae, B. H. Lee, D. S. Shin, K. S. Oh, H. Ceong, D. Lee, and D.Na (2019) Computational determination of hERG-relatedcardiotoxicity of drug candidates. BMC Bioinformatics. 20: 250.
172. Ogura, K., T. Sato, H. Yuki, and T. Honma (2019) Supportvector machine model for hERG inhibitory activities based onthe integrated hERG database using descriptor selection byNSGA-II. Sci. Rep. 9: 12220.
173. Zhang, Y., J. Zhao, Y. Wang, Y. Fan, L. Zhu, Y. Yang, X. Chen,T. Lu, Y. Chen, and H. Liu (2019) Prediction of hERG K+channel blockage using deep neural networks. Chem. Biol.Drug Des. 94: 1973-1985.
174. Sato, T., H. Yuki, K. Ogura, and T. Honma (2018) Constructionof an integrated database for hERG blocking small molecules.PLoS One. 13: e0199348.
175. Kim, H. and H. Nam (2020) hERG-Att: Self-attention-baseddeep neural network for predicting hERG blockers. Comput.Biol. Chem. 87: 107286.
176. Lei, T., F. Chen, H. Liu, H. Sun, Y. Kang, D. Li, Y. Li, and T.Hou (2017) ADMET evaluation in drug discovery. Part 17:development of quantitative and qualitative prediction modelsfor chemical-induced respiratory toxicity. Mol. Pharm. 14:2407-2421.
177. Lei, T., H. Sun, Y. Kang, F. Zhu, H. Liu, W. Zhou, Z. Wang, D.Li, Y. Li, and T. Hou (2017) ADMET evaluation in drugdiscovery. 18. reliable prediction of chemical-induced urinarytract toxicity by boosting machine learning approaches. Mol.Pharm. 14: 3935-3953.
178. Liu, J., G. Patlewicz, A. J. Williams, R. S. Thomas, and I. Shah(2017) Predicting organ toxicity using in vitro bioactivity dataand chemical structure. Chem. Res. Toxicol. 30: 2046-2059.
179. Xu, Y., J. Pei, and L. Lai (2017) Deep learning based regressionand multiclass models for acute oral toxicity prediction withautomatic chemical feature extraction. J. Chem. Inf. Model. 57:2672-2685.
180. Zhang, H., P. Yu, J. X. Ren, X. B. Li, H. L. Wang, L. Ding, andW. B. Kong (2017) Development of novel prediction model fordrug-induced mitochondrial toxicity by using naive Bayesclassifier method. Food Chem. Toxicol. 110: 122-129.
181. Fan, D., H. Yang, F. Li, L. Sun, P. Di, W. Li, Y. Tang, and G. Liu(2018) In silico prediction of chemical genotoxicity usingmachine learning methods and structural alerts. Toxicol. Res.7: 211-220.
182. Jiang, C., H. Yang, P. Di, W. Li, Y. Tang, and G. Liu (2019) Insilico prediction of chemical reproductive toxicity usingmachine learning. J. Appl. Toxicol. 39: 844-854.
183. Zheng, S., Y. Wang, W. Liu, W. Chang, G. Liang, Y. Xu, and F.Lin (2019) In silico prediction of hemolytic toxicity on thehuman erythrocytes for small molecules by machine-learningand genetic algorithm. J. Med. Chem. 12: 6499-6512.
184. Fernandez, M., F. Ban, G. Woo, M. Hsing, T. Yamazaki, E.Leblanc, P. S. Rennie, W. J. Welch, and A. Cherkasov (2018)Toxic colors: the use of deep learning for predicting toxicity ofcompounds merely from their graphic images. J. Chem. Inf.Model. 58: 1533-1543.
185. Abbasi, K., A. Poso, J. Ghasemi, M. Amanlou, and A. Masoudi-Nejad (2019) Deep transferable compound representationacross domains and tasks for low data drug discovery. J. Chem.Inf. Model. 59: 4528-4539.
186. Karim, A., A. Mishra, M. A. H. Newton, and A. Sattar (2019)Efficient toxicity prediction via simple features using shallow
neural networks and decision trees. ACS Omega. 4: 1874-1888.187. Zakharov, A. V., T. Zhao, D. T. Nguyen, T. Peryea, T. Sheils, A.
Yasgar, R. Huang, N. Southall, and A. Simeonov (2019) Novelconsensus architecture to improve performance of large-scalemultitask deep learning QSAR models. J. Chem. Inf. Model.59: 4613-4624.
188. Wang, J. and T. Hou (2015) Advances in computationallymodeling human oral bioavailability. Adv. Drug Deliv. Rev.86: 11-16.
189. Hutter, M. C. (2018) The current limits in virtual screening andproperty prediction. Future Med. Chem. 10: 1623-1635.
190. Wu, Z., B. Ramsundar, E. N. Feinberg, J. Gomes, C. Geniesse,A. S. Pappu, K. Leswing, and V. Pande (2018) MoleculeNet: abenchmark for molecular machine learning. Chem. Sci. 9: 513-530.
191. Merck Molecular Activity Challenge (2012) https://www.kaggle.com/c/MerckActivity.
192. Winkler, D. A. and T. C. Le (2017) Performance of deep andshallow neural networks, the universal approximation theorem,activity cliffs, and QSAR. Mol. Inform. 36: 1600118.
193. Ryu, S., Y. Kwon, and W. Y. Kim (2019) A Bayesian graphconvolutional network for reliable prediction of molecularproperties with uncertainty quantification. Chem. Sci. 10: 8438-8446.
194. Xiong, Z., D. Wang, X. Liu, F. Zhong, X. Wan, X. Li, Z. Li, X.Luo, K. Chen, H. Jiang, and M. Zheng (2019) Pushing theboundaries of molecular representation for drug discovery withthe graph attention mechanism. J. Med. Chem. 63: 8749-8760.
195. Maggiora, G. M. (2006) On outliers and activity cliffs-WhyQSAR often disappoints. J. Chem. Inf. Model. 46: 1535.
196. Kohonen, P., J. A. Parkkinen, E. L. Willighagen, R. Ceder,K. Wennerberg, S. Kaski, and R. C. Grafstrm (2017) Atranscriptomics data-driven gene space accurately predicts livercytopathology and drug-induced liver injury. Nat. Commun.8: 15932.
197. Rueda-Zrate, H. A., I. Imaz-Rosshandler, R. A. Crdenas-Ovando, J. E. Castillo-Fernndez, J. Noguez-Monroy, and C.Rangel-Escareo (2017) A computational toxicogenomics approachidentifies a list of highly hepatotoxic compounds from a largemicroarray database. PLoS One. 12: e0176284.
198. Su, R., H. Wu, B. Xu, X. Liu, and L. Wei (2019) Developing amulti-dose computational model for drug-induced hepatotoxicityprediction based on toxicogenomics data. IEEE/ACM Trans.Comput. Biol. Bioinform. 16: 1231-1239.
199. Schneider, G. and U. Fechner (2005) Computer-based de novodesign of drug-like molecules. Nat. Rev. Drug Discov. 4: 649-663.
200. Walters, W. P. (2019) Virtual chemical libraries. J. Med. Chem.62: 1116-1124.
201. Reymond, J. L., L. Ruddigkeit, L. Blum, and R. van Deursen(2012) The enumeration of chemical space. WIREs Comput.Mol. Sci. 2: 717-733.
202. Sanchez-Lengeling, B. and A. Aspuru-Guzik (2018) Inversemolecular design using machine learning: Generative modelsfor matter engineering. Science. 361: 360-365.
203. Elton, D. C., Z. Boukouvalas, M. D. Fuge, and P. W. Chung(2019) Deep learning for molecular design—a review of thestate of the art. Mol. Syst. Des. Eng. 4: 828-849.
204. Brown, N., M. Fiscato, M. H. S. Segler, and A. C. Vaucher(2019) GuacaMol: Benchmarking models for de novo moleculardesign. J. Chem. Inf. Model. 59: 1096-1108.
205. Huc, I. and J. M. Lehn (1997) Virtual combinatorial libraries:dynamic generation of molecular and supramolecular diversityby self-assembly. Proc. Natl. Acad. Sci. USA. 94: 2106-2110.
206. Lehn, J. M. (1999) Dynamic combinatorial chemistry andvirtual combinatorial libraries. Chem. Eur. J. 5: 2455-2463.
207. Kwon, Y., J. Yoo, Y. S. Choi, W. J. Son, D. Lee, and S. Kang(2019) Efficient learning of non-autoregressive graph variational
A Review of Artificial Intelligence in Drug Discovery 927
autoencoders for molecular graph generation. J. Cheminform.11: 70.
208. Segler, M. H. S., T. Kogej, C. Tyrchan, and M. P. Waller (2018)Generating focused molecule libraries for drug discovery withrecurrent neural networks. ACS Cent. Sci. 4: 120-131.
209. Gómez-Bombarelli, R., J. N. Wei, D. Duvenaud, J. M.Hernández-Lobato, B. Sánchez-Lengeling, D. Sheberla, J.Aguilera-Iparraguirre, T. D. Hirzel, R. P. Adams, and A.Aspuru-Guzik (2018) Automatic chemical design using a data-driven continuous representation of molecules. ACS Cent. Sci.4: 268-276.
210. Kang, S. and K. Cho (2019) Conditional molecular design withdeep generative models. J. Chem. Inf. Model. 59: 43-52.
211. Arús-Pous, J., S. V. Johansson, O. Prykhodko, E. J. Bjerrum, C.Tyrchan, J. L. Reymond, H. Chen, and O. Engkvist (2019)Randomized SMILES strings improve the quality of moleculargenerative models. J. Cheminform. 11: 71.
212. Gupta, A., A. T. Müller, B. J. H. Huisman, J. A. Fuchs, P.Schneider, and G. Schneider (2018) Generative recurrentnetworks for de novo drug design. Mol. Inform. 37: 1700111.
213. Merk, D., F. Grisoni, L. Friedrich, and G. Schneider (2018)Tuning artificial intelligence on the de novo design of natural-product-inspired retinoid X receptor modulators. Commun.Chem. 1: 68.
214. Zheng, S., X. Yan, Q. Gu, Y. Yang, Y. Du, Y. Lu, and J. Xu(2019) QBMG: quasi-biogenic molecule generator with deeprecurrent neural network. J. Cheminform. 11: 5.
215. Awale, M., F. Sirockin, N. Stiefl, and J. L. Reymond (2019)Drug analogs from fragment-based long short-term memorygenerative neural networks. J. Chem. Inf. Model. 59: 1347-1356.
216. Arús-Pous, J., T. Blaschke, S. Ulander, J. L. Reymond, H. Chen,and O. Engkvist (2019) Exploring the GDB-13 chemical spaceusing deep generative models. J. Cheminform. 11: 20.
217. Pogány, P., N. Arad, S. Genway, and S. D. Pickett (2019) Denovo molecule design by translating from reduced graphs toSMILES. J. Chem. Inf. Model. 59: 1136-1146.
218. Li, Y., L. Zhang, and Z. Liu (2018) Multi-objective de novo drugdesign with conditional graph generative model. J. Cheminform.10: 33.
219. Polykovskiy, D., A. Zhebrak, D. Vetrov, Y. Ivanenkov, V.Aladinskiy, P. Mamoshina, M. Bozdaganyan, A. Aliper, A.Zhavoronkov, and A. Kadurin (2018) Entangled conditionaladversarial autoencoder for de novo drug discovery. Mol.Pharm. 15: 4398-4405.
220. Lim, J., S. Ryu, J. W. Kim, and W. Y. Kim (2018) Moleculargenerative model based on conditional variational autoencoderfor de novo molecular design. J. Cheminform. 10: 31.
221. Harel, S. and K. Radinsky (2018) Prototype-based compounddiscovery using deep generative models. Mol. Pharmaceutics.15: 4406-4416.
222. Skalic, M., J. Jiménez, D. Sabbadin, and G. De Fabritiis (2019)Shape-based generative modeling for de novo drug design. J.Chem. Inf. Model. 59: 1205-1214.
223. Lim, J., S. Y. Hwang, S. Moon, S. Kim, and W. Y. Kim (2020)Scaffold-based molecular design with a graph generativemodel. Chem. Sci. 11: 1153-1164.
224. Kadurin, A., S. Nikolenko, K. Khrabrov, A. Aliper, and A.Zhavoronkov (2017) druGAN: An advanced generativeadversarial autoencoder model for de novo generation of newmolecules with desired molecular properties in silico. Mol.Pharmaceutics. 14: 3098-3104.
225. Blaschke, T., M. Olivecrona, O. Engkvist, J. Bajorath, and H.Chen (2018) Application of generative autoencoder in de novomolecular design. Mol. Inform. 37: 1700123.
226. Prykhodko, O., S. V. Johansson, P. C. Kotsias, J. Arús-Pous, E.J. Bjerrum, O. Engkvist, and H. Chen (2019) A de novo
molecular generation method using latent vector basedgenerative adversarial network. J. Cheminform. 11: 74.
227. Zhou, Z., S. Kearnes, L. Li, R. N. Zare, and P. Riley (2019)Optimization of molecules via deep reinforcement learning. Sci.Rep. 9: 10752.
228. Olivecrona, M., T. Blaschke, O. Engkvist, and H. Chen (2017)Molecular de-novo design through deep reinforcement learning.J. Cheminform. 9: 48.
229. Popova, M., O. Isayev, and A. Tropsha (2018) Deep reinforcementlearning for de novo drug design. Sci. Adv. 4: eaap7885.
230. Putin, E., A. Asadulaev, Y. Ivanenkov, V. Aladinskiy, B.Sanchez-Lengeling, A. Aspuru-Guzik, and A. Zhavoronkov(2018) Reinforced adversarial neural computer for de novomolecular design. J. Chem. Inf. Model. 58: 1194-1204.
231. Putin, E., A. Asadulaev, Q. Vanhaelen, Y. Ivanenkov, A. V.Aladinskaya, A. Aliper, and A. Zhavoronkov (2018) Adversarialthreshold neural computer for molecular de novo design. Mol.Pharmaceutics. 15: 4386-4397.
232. Liu, X., K. Ye, H. W. T. van Vlijmen, A. P. Ijzerman, and G. J. P.van Westen (2019) An exploration strategy improves thediversity of de novo ligands using deep reinforcement learning:a case for the adenosine A2A receptor. J. Cheminform. 11: 35.
233. Ståhl, N., G. Falkman, A. Karlsson, G. Mathiason, and J. Boström(2019) Deep reinforcement learning for multiparameter optimizationin de novo drug design. J. Chem. Inf. Model. 59: 3166-3176.
234. Zhavoronkov, A., Y. A. Ivanenkov, A. Aliper, M. S. Veselov, V.A. Aladinskiy, A. V. Aladinskaya, V. A. Terentiev, D. A.Polykovskiy, M. D. Kuznetsov, A. Asadulaev, Y. Volkov, A.Zholus, R. R. Shayakhmetov, A. Zhebrak, L. I. Minaeva, B. A.Zagribelnyy, L. H. Lee, R. Soll, D. Madge, L. Xing, T. Guo, andA. Aspuru-Guzik (2019) Deep learning enables rapid identificationof potent DDR1 kinase inhibitors. Nat. Biotechnol. 37: 1038-1040.
235. Polykovskiy, D., A. Zhebrak, B. Sanchez-Lengeling, S. Golovanov,O. Tatanov, S. Belyaev, R. Kurbanov, A. Artamonov, V.Aladinskiy, M. Veselov, A. Kadurin, S. Johansson, H. Chen, S.Nikolenko, A. Aspuru-Guzik, and A. Zhavoronkov (2018)Molecular Sets (MOSES): A benchmarking platform formolecular generation models. ArXiv. 1811.12823.
236. Kawai, K., Y. Karuo, A. Tarui, K. Sato, and M. Omote (2020)Effect of structural descriptors on the design of cyclindependent kinase inhibitors using similarity-based molecularevolution. Mol. Inform. 39: 1900126.
237. Yoshikawa, N., K. Terayama, M. Sumita, T. Homma, K. Oono,and K. Tsuda (2018) Population-based de novo moleculegeneration, using grammatical evolution. Chem. Lett. 47: 1431-1434.
238. Jensen, J. H. (2019) A graph-based genetic algorithm andgenerative model/Monte Carlo tree search for the exploration ofchemical space. Chem. Sci. 10: 3567-3572.
239. Herring, R. H. and M. R. Eden (2015) Evolutionary algorithmfor de novo molecular design with multi-dimensional constraints.Comput. Chem Eng. 83: 267-277.
240. Rupakheti, C., A. Virshup, W. Yang, and D. N. Beratan (2015)Strategy to discover diverse optimal molecules in the smallmolecule universe. J. Chem. Inf. Model. 55: 529-537.
241. Boolell, M., M. J. Allen, S. A. Ballard, S. Gepi-Attee, G. J.Muirhead, A. M. Naylor, I. H. Osterloh, and C. Gingell (1996)Sildenafil: an orally active type 5 cyclic GMP-specificphosphodiesterase inhibitor for the treatment of penile erectiledysfunction. Int. J. Impot Res. 8: 47-52.
242. Ning, Y. M., J. L. Gulley, P. M. Arlen, S. Woo, S. M. Steinberg,J. J. Wright, H. L. Parnes, J. B. Trepel, M. J. Lee, Y. S. Kim, H.Sun, R. A. Madan, L. Latham, E. Jones, C. C. Chen, W. D. Figg,and W. L. Dahut (2010) Phase II trial of bevacizumab,thalidomide, docetaxel, and prednisone in patients with
928 Biotechnology and Bioprocess Engineering 25: 895-930 (2020)
metastatic castration-resistant prostate cancer. J. Clin. Oncol.28: 2070-2076.
243. Singhal, S., J. Mehta, R. Desikan, D. Ayers, P. Roberson, P.Eddlemon, N. Munshi, E. Anaissie, C. Wilson, M. Dhodapkar,J. Zeldis, and B. Barlogie (1999) Antitumor activity of thalidomidein refractory multiple myeloma. N. Engl. J. Med. 341: 1565-1571.
244. D’Amato, R. J., M. S. Loughnan, E. Flynn, and J. Folkman(1994) Thalidomide is an inhibitor of angiogenesis. Proc. Natl.Acad. Sci. USA. 91: 4082-4085.
245. Hameed, P. N., K. Verspoor, S. Kusljic, and S. Halgamuge(2018) A two-tiered unsupervised clustering approach for drugrepositioning through heterogeneous data integration. BMCBioinformatics. 19: 129.
246. Wu, C., R. C. Gudivada, B. J. Aronow, and A. G. Jegga (2013)Computational drug repositioning through heterogeneousnetwork clustering. BMC Syst. Biol. 7: S6.
247. Blondel, V. D., J. L. Guillaume, R. Lambiotte, and E. Lefebvre(2008) Fast unfolding of communities in large networks. J. Stat.Mech. 2008: P10008.
248. Nepusz, T., H. Yu, and A. Paccanaro (2012) Detectingoverlapping protein complexes in protein-protein interactionnetworks. Nat. Methods. 9: 471-472.
249. Sun, P., J. Guo, R. Winnenburg, and J. Baumbach (2017) Drugrepurposing by integrated literature mining and drug-gene-disease triangulation. Drug Discov. Today. 22: 615-619.
250. Chen, H. and Z. Zhang (2018) Prediction of drug-diseaseassociations for drug repositioning through drug-miRNA-disease heterogeneous network. IEEE Access. 6: 45281-45287.
251. Martinez, V., C. Navarro, C. Cano, W. Fajardo, and A. Blanco(2015) DrugNet: network-based drug-disease prioritization byintegrating heterogeneous data. Artif. Intell. Med. 63: 41-49.
252. Martinez, V., C. Cano, and A. Blanco (2014) ProphNet: ageneric prioritization method through propagation of information.BMC Bioinformatics. 15: S5.
253. Luo, H., J. Wang, M. Li, J. Luo, X. Peng, F. X. Wu, and Y. Pan(2016) Drug repositioning based on comprehensive similaritymeasures and Bi-Random walk algorithm. Bioinformatics. 32:2664-2671.
254. Luo, H., M. Li, S. Wang, Q. Liu, Y. Li, and J. Wang (2018)Computational drug repositioning using low-rank matrixapproximation and randomized algorithms. Bioinformatics. 34:1904-1912.
255. Yan, C. K., W. X. Wang, G. Zhang, J. L. Wang, and A. Patel(2019) BiRWDDA: A novel drug repositioning method basedon multisimilarity fusion. J. Comput. Biol. 26: 1230-1242.
256. Gottlieb, A., G. Y. Stein, E. Ruppin, and R. Sharan (2011)PREDICT: A method for inferring novel drug indications withapplication to personalized medicine. Mol. Syst. Biol. 7: 496.
257. Napolitano, F., Y. Zhao, V. M. Moreira, R. Tagliaferri, J. Kere,M. D’Amato, and D. Greco (2013) Drug repositioning: A machine-learning approach through data integration. J. Cheminform. 5: 30.
258. Wang, Y., S. Chen, N. Deng, and Y. Wang (2013) Drugrepositioning by kernel-based integration of molecular structure,molecular activity, and phenotype data. PLoS One. 8: e78518.
259. Kim, E., A. S. Choi, and H. Nam (2019) Drug repositioning ofherbal compounds via a machine-learning approach. BMCBioinformatics. 20: 247.
260. Zhang, W., X. Yue, F. Huang, R. Liu, Y. Chen, and C. Ruan(2018) Predicting drug-disease associations and their therapeuticfunction based on the drug-disease association bipartite network.Methods. 145: 51-59.
261. Le, D. H. and D. Nguyen-Ngoc (2018) Drug repositioning byintegrating known disease-gene and drug-target associations ina semi-supervised learning model. Acta Biotheor. 66: 315-331.
262. Xuan, P., Y. Cao, T. Zhang, X. Wang, S. Pan, and T. Shen (2019)Drug repositioning through integration of prior knowledge and
projections of drugs and diseases. Bioinformatics. 35: 4108-4119.263. Wei, X., Y. Zhang, Y. Huang, and Y. Fang (2019) Predicting
drug–disease associations by network embedding and biomedicaldata integration. Data Technol. Appl. 53: 217-229.
264. Moridi, M., M. Ghadirinia, A. Sharifi-Zarchi, and F. Zare-Mirakabad (2019) The assessment of efficient representation ofdrug features using deep learning for drug repositioning. BMCBioinformatics. 20: 577.
265. Abdolhosseini, F., B. Azarkhalili, A. Maazallahi, A. Kamal, S.A. Motahari, A. Sharifi-Zarchi, and H. Chitsaz (2019) Cellidentity codes: understanding cell identity from gene expressionprofiles using deep neural networks. Sci. Rep. 9: 2342.
266. Asgari, E. and M. R. K. Mofrad (2015) Continuous distributedrepresentation of biological sequences for deep proteomics andgenomics. PLoS One. 10: e0141287.
267. Donner, Y., S. Kazmierczak, and K. Fortney (2018) DrugRepurposing using deep embeddings of gene expressionprofiles. Mol. Pharm. 15: 4314-4325.
268. Stathias, V., J. Turner, A. Koleti, D. Vidovic, D. Cooper, M.Fazel-Najafabadi, M. Pilarczyk, R. Terryn, C. Chung, A.Umeano, D. J. B. Clarke, A. Lachmann, J. E. Evangelista, A.Ma'ayan, M. Medvedovic, and S. C. Schurer (2020) LINCSData Portal 2.0: next generation access point for perturbation-response signatures. Nucleic Acids Res. 48: D431-D439.
269. You, J., R. D. McLeod, and P. Hu (2019) Predicting drug-targetinteraction network using deep learning model. Comput. Biol.Chem. 80: 90-101.
270. Aliper, A., S. Plis, A. Artemov, A. Ulloa, P. Mamoshina, and A.Zhavoronkov (2016) Deep learning applications for predictingpharmacological properties of drugs and drug repurposing usingtranscriptomic data. Mol. Pharm. 13: 2524-2530.
271. Zeng, X., S. Zhu, X. Liu, Y. Zhou, R. Nussinov, and F. Cheng(2019) deepDR: a network-based deep learning approach to insilico drug repositioning. Bioinformatics. 35: 5191-5198.
272. Xuan, P., L. Zhao, T. Zhang, Y. Ye, and Y. Zhang (2019)Inferring drug-related diseases based on convolutional neuralnetwork and gated recurrent unit. Molecules. 24: 2712.
273. Masoudi-Sobhanzadeh, Y., Y. Omidi, M. Amanlou, and A.Masoudi-Nejad (2019) Drug databases and their contributionsto drug repurposing. Genomics. 112: 1087-1095.
274. Cheng, F. (2019) In silico oncology drug repositioning andpolypharmacology. Methods Mol. Biol. 1878: 243-261.
275. March-Vila, E., L. Pinzi, N. Sturm, A. Tinivella, O. Engkvist, H.Chen, and G. Rastelli (2017) On the integration of in silico drugdesign methods for drug repurposing. Front. Pharmacol. 8: 298.
276. Fleuren, W. W. M. and W. Alkema (2015) Application of textmining in the biomedical domain. Methods. 74: 97-106.
277. Nugent, T., V. Plachouras, and J. L. Leidner (2016) Computationaldrug repositioning based on side-effects mined from socialmedia. PeerJ. Computer Science. 2: e46.
278. Rastegar-Mojarad, M., R. K. Elayavilli, D. Li, R. Prasad, and H.Liu (2015) A new method for prioritizing drug repositioningcandidates extracted by literature-based discovery. Proceedingsof 2015 IEEE International Conference on Bioinformatics andBiomedicine, BIBM 2015. November 9-12. Washington, DC, USA.
279. Su, E. W. and T. M. Sanger (2017) Systematic drug repositioningthrough mining adverse event data in ClinicalTrials.gov. PeerJ.5: e3154.
280. Park, K. (2019) A review of computational drug repurposing.Transl. Clin. Pharmacol. 27: 59-63.
281. RDKit. http://www.rdkit.org/. 282. Douguet, D. (2018) Data sets representative of the structures
and experimental properties of FDA-approved drugs. ACS Med.Chem. Lett. 9: 204-209.
283. Kim, S., P. A. Thiessen, E. E. Bolton, J. Chen, G. Fu, A.Gindulyte, L. Han, J. He, S. He, B. A. Shoemaker, J. Wang, B.
A Review of Artificial Intelligence in Drug Discovery 929
Yu, J. Zhang, and S. H. Bryant (2016) PubChem substance andcompound databases. Nucleic Acids Res. 44: D1202-D1213.
284. Williams, A. J. (2008) Internet-based tools for communicationand collaboration in chemistry. Drug Discovery Today. 13: 502-506.
285. Ursu, O., J. Holmes, C. G. Bologa, J. J. Yang, S. L. Mathias, V.Stathias, D. T. Nguyen, S. Schurer, and T. Oprea (2019)DrugCentral 2018: an update. Nucleic Acids Res. 47: D963-D970.
286. Ursu, O., J. Holmes, J. Knockel, C. G. Bologa, J. J. Yang, S. L.Mathias, S. J. Nelson, and T. I. Oprea (2017) DrugCentral:online drug compendium. Nucleic Acids Res. 45: D932-D939.
287. DailyMed. https://dailymed.nlm.nih.gov/dailymed/. 288. Kuhn, M., I. Letunic, L. J. Jensen, and P. Bork (2016) The
SIDER database of drugs and side effects. Nucleic Acids Res.44: D1075-D1079.
289. Tatonetti, N. P., P. P. Ye, R. Daneshjou, and R. B. Altman (2012)Data-driven prediction of drug effects and interactions. Sci.Transl. Med. 4: 125ra31.
290. Fang, H., Z. Su, Y. Wang, A. Miller, Z. Liu, P. C. Howard, W.Tong, and S. M. Lin (2014) Exploring the FDA adverse eventreporting system to generate hypotheses for monitoring ofdisease characteristics. Clin. Pharmacol. Ther. 95: 496-498.
291. Cai, M. C., Q. Xu, Y. J. Pan, W. Pan, N. Ji, Y. B. Li, H. J. Jin, K.Liu, and Z. L. Ji (2015) ADReCS: An ontology database foraiding standardization and hierarchical classification of adversedrug reaction terms. Nucleic Acids Res. 43: D907-D913.
292. Subramanian, A., R. Narayan, S. M. Corsello, D. D. Peck, T. E.Natoli, X. Lu, J. Gould, J. F. Davis, A. A. Tubelli, J. K. Asiedu,D. L. Lahr, J. E. Hirschman, Z. Liu, M. Donahue, B. Julian, M.Khan, D. Wadden, I. C. Smith, D. Lam, A. Liberzon, C. Toder,M. Bagul, M. Orzechowski, O. M. Enache, F. Piccioni, S. A.Johnson, N. J. Lyons, A. H. Berger, A. F. Shamji, A. N. Brooks,A. Vrcic, C. Flynn, J. Rosains, D. Y. Takeda, R. Hu, D. Davison,J. Lamb, K. Ardlie, L. Hogstrom, P. Greenside, N. S. Gray, P. A.Clemons, S. Silver, X. Wu, W. N. Zhao, W. Read-Button, X.Wu, S. J. Haggarty, L. V. Ronco, J. S. Boehm, S. L. Schreiber, J.G. Doench, J. A. Bittker, D. E. Root, B. Wong, and T. R. Golub(2017) A next generation Connectivity Map: L1000 platformand the first 1,000,000 profiles. Cell. 171: 1437-1452.e17.
293. Barrett, T., D. B. Troup, S. E. Wilhite, P. Ledoux, D. Rudnev, C.Evangelista, I. F. Kim, A. Soboleva, M. Tomashevsky, and R.Edgar (2007) NCBI GEO: Mining tens of millions of expressionprofiles - Database and tools update. Nucleic Acids Res. 35:D760-D765.
294. Barrett, T., T. O. Suzek, D. B. Troup, S. E. Wilhite, W. C. Ngau,P. Ledoux, D. Rudnev, A. E. Lash, W. Fujibuchi, and R. Edgar(2005) NCBI GEO: Mining millions of expression profiles -Database and tools. Nucleic Acids Res. 33: D562-D566.
295. Parkinson, H., M. Kapushesky, M. Shojatalab, N. Abeygunawardena,R. Coulson, A. Farne, E. Holloway, N. Kolesnykov, P. Lilja, M.Lukk, R. Mani, T. Rayner, A. Sharma, E. William, U. Sarkans,and A. Brazma (2007) ArrayExpress - A public database ofmicroarray experiments and gene expression profiles. NucleicAcids Res. 35: D747-750.
296. Yang, W., J. Soares, P. Greninger, E. J. Edelman, H. Lightfoot,S. Forbes, N. Bindal, D. Beare, J. A. Smith, I. R. Thompson, S.Ramaswamy, P. A. Futreal, D. A. Haber, M. R. Stratton, C.Benes, U. McDermott, and M. J. Garnett (2013) Genomics ofDrug Sensitivity in Cancer (GDSC): A resource for therapeuticbiomarker discovery in cancer cells. Nucleic Acids Res. 41:D955-D961.
297. Bodenreider, O. (2004) The Unified Medical Language System(UMLS): integrating biomedical terminology. Nucleic AcidsRes. 32: D267-D270.
298. Rogers, F. B. (1963) Medical subject headings. Bull. Med. Libr.
Assoc. 51: 114-116.299. Piñero, J., N. Queralt-Rosinach, À. Bravo, J. Deu-Pons, A.
Bauer-Mehren, M. Baron, F. Sanz, and L. I. Furlong (2015)DisGeNET: A discovery platform for the dynamical explorationof human diseases and their genes. Database. 2015: bav028.
300. Ogata, H., S. Goto, K. Sato, W. Fujibuchi, H. Bono, and M.Kanehisa (1999) KEGG: Kyoto Encyclopedia of Genes andGenomes. Nucleic Acids Res. 27: 29-34.
301. Hewett, M., D. E. Oliver, D. L. Rubin, K. L. Easton, J. M.Stuart, R. B. Altman, and T. E. Klein (2002) PharmGKB: thepharmacogenetics knowledge base. Nucleic Acids Res. 30: 163-165.
302. Tate, J. G., S. Bamford, H. C. Jubb, Z. Sondka, D. M. Beare, N.Bindal, H. Boutselakis, C. G. Cole, C. Creatore, E. Dawson, P.Fish, B. Harsha, C. Hathaway, S. C. Jupe, C. Y. Kok, K. Noble,L. Ponting, C. C. Ramshaw, C. E. Rye, H. E. Speedy, R.Stefancsik, S. L. Thompson, S. Wang, S. Ward, P. J. Campbell,and S. A. Forbes (2019) COSMIC: the Catalogue Of SomaticMutations In Cancer. Nucleic Acids Res. 47: D941-D947.
303. Lappalainen, I., J. Lopez, L. Skipper, T. Hefferon, J. D.Spalding, J. Garner, C. Chen, M. Maguire, M. Corbett, G. Zhou,J. Paschall, V. Ananiev, P. Flicek, and D. M. Church (2013)DbVar and DGVa: public archives for genomic structuralvariation. Nucleic Acids Res. 41: D936-D941.
304. Mailman, M. D., M. Feolo, Y. Jin, M. Kimura, K. Tryka, R.Bagoutdinov, L. Hao, A. Kiang, J. Paschall, L. Phan, N.Popova, S. Pretel, L. Ziyabari, M. Lee, Y. Shao, Z. Y. Wang, K.Sirotkin, M. Ward, M. Kholodov, K. Zbicz, J. Beck, M.Kimelman, S. Shevelev, D. Preuss, E. Yaschenko, A. Graeff, J.Ostell, and S. T. Sherry (2007) The NCBI dbGaP database ofgenotypes and phenotypes. Nat. Genet. 39: 1181-1186.
305. Smigielski, E. M., K. Sirotkin, M. Ward, and S. T. Sherry (2000)dbSNP: a database of single nucleotide polymorphisms. NucleicAcids Res. 28: 352-355.
306. Liu, Z., M. Su, L. Han, J. Liu, Q. Yang, Y. Li, and R. Wang(2017) Forging the basis for developing protein-ligand interactionscoring functions. Acc. Chem. Res. 50: 302-309.
307. Su, M., Q. Yang, Y. Du, G. Feng, Z. Liu, Y. Li, and R. Wang(2019) Comparative assessment of scoring functions: TheCASF-2016 update. J. Chem. Inf. Model. 59: 895-913.
308. Mysinger, M. M., M. Carchia, J. J. Irwin, and B. K. Shoichet(2012) Directory of useful decoys, enhanced (DUD-E): betterligands and decoys for better benchmarking. J. Med. Chem.55: 6582-6594.
309. Carlson, H. A., R. D. Smith, K. L. Damm-Ganamet, J. A.Stuckey, A. Ahmed, M. A. Convery, D. O. Somers, M. Kranz, P.A. Elkins, G. Cui, C. E. Peishoff, M. H. Lambert, and J. B.Dunbar Jr. (2016) CSAR 2014: A benchmark exercise usingunpublished data from pharma. J. Chem. Inf. Model. 56: 1063-1077.
310. Kim, S., J. Chen, T. Cheng, A. Gindulyte, J. He, S. He, Q. Li, B.A. Shoemaker, P. A. Thiessen, B. Yu, L. Zaslavsky, J. Zhang,and E. E. Bolton (2019) PubChem 2019 update: improvedaccess to chemical data. Nucleic Acids Res. 47: D1102-D1109.
311. Mendez, D., A. Gaulton, A. P. Bento, J. Chambers, M. De Veij,E. Felix, M. P. Magarinos, J. F. Mosquera, P. Mutowo, M.Nowotka, M. Gordillo-Maranon, F. Hunter, L. Junco, G.Mugumbate, M. Rodriguez-Lopez, F. Atkinson, N. Bosc, C. J.Radoux, A. Segura-Cabrera, A. Hersey, and A. R. Leach (2019)ChEMBL: towards direct deposition of bioassay data. NucleicAcids Res. 47: D930-D940.
312. Gilson, M. K., T. Liu, M. Baitaluk, G. Nicola, L. Hwang, and J.Chong (2016) BindingDB in 2015: A public database formedicinal chemistry, computational chemistry and systemspharmacology. Nucleic Acids Res. 44: D1045-1053.
313. Wishart, D. S., Y. D. Feunang, A. C. Guo, E. J. Lo, A. Marcu, J.
930 Biotechnology and Bioprocess Engineering 25: 895-930 (2020)
R. Grant, T. Sajed, D. Johnson, C. Li, Z. Sayeeda, N. Assempour,I. Iynkkaran, Y. Liu, A. Maciejewski, N. Gale, A. Wilson, L.Chin, R. Cummings, D. Le, A. Pon, C. Knox, and M. Wilson(2018) DrugBank 5.0: a major update to the DrugBank databasefor 2018. Nucleic Acids Res. 46: D1074-D1082.
314. Kanehisa, M., M. Furumichi, M. Tanabe, Y. Sato, and K.Morishima (2017) KEGG: new perspectives on genomes,pathways, diseases and drugs. Nucleic Acids Res. 45: D353-D361.
315. Alexander, S. P. H., H. E. Benson, E. Faccenda, A. J. Pawson, J.L. Sharman, J. C. McGrath, W. A. Catterall, M. Spedding, J. A.Peters, A. J. Harmar, and CGTP Collaborators (2013) Theconcise guide to PHARMACOLOGY 2013/14: overview. Br. J.Pharmacol. 170: 1449-1458.
316. Hecker, N., J. Ahmed, J. von Eichborn, M. Dunkel, K. Macha,A. Eckert, M. K. Gilson, P. E. Bourne, and R. Preissner (2012)SuperTarget goes quantitative: update on drug-target interactions.Nucleic Acids Res. 40: D1113-D1117.
317. Gunther, S., M. Kuhn, M. Dunkel, M. Campillos, C. Senger, E.Petsalaki, J. Ahmed, E. G. Urdiales, A. Gewiess, L. J. Jensen, R.Schneider, R. Skoblo, R. B. Russell, P. E. Bourne, P. Bork, andR. Preissner (2008) SuperTarget and Matador: resources forexploring drug-target relationships. Nucleic Acids Res. 36:D919-D922.
318. Kuhn, M., C. von Mering, M. Campillos, L. J. Jensen, and P.Bork (2008) STITCH: interaction networks of chemicals andproteins. Nucleic Acids Res. 36: D684-D688.
319. Yang, H., C. Lou, L. Sun, J. Li, Y. Cai, Z. Wang, W. Li, G. Liu,and Y. Tang (2019) admetSAR 2.0: web-service for predictionand optimization of chemical ADMET properties. Bioinformatics.35: 1067-1069.
320. Tomasulo, P. (2002) ChemIDplus-super source for chemicaland drug information. Med. Ref. Serv Q. 21: 53-59.
321. Richard, A. M., R. S. Judson, K. A. Houck, C. M. Grulke, P.Volarath, I. Thillainadarajah, C. Yang, J. Rathman, M. T.Martin, J. F. Wambaugh, T. B. Knudsen, J. Kancherla, K.Mansouri, G. Patlewicz, A. J. Williams, S. B. Little, K. M.Crofton, and R. S. Thomas (2016) ToxCast chemical landscape:Paving the road to 21st century toxicology. Chem. Res. Toxicol.29: 1225-1251.
322. Tox21 Challenge. https://tripod.nih.gov/tox21/challenge/. 323. Watford, S., L. Ly Pham, J. Wignall, R. Shin, M. T. Martin, and
K. P. Friedman (2019) ToxRefDB version 2.0: Improved utilityfor predictive and retrospective toxicology analyses. Reprod.Toxicol. 89: 145-158.
324. Sterling, T. and J. J. Irwin (2015) ZINC 15 – ligand discoveryfor everyone. J. Chem. Inf. Model. 55: 2324-2337.
325. Blum, L. C. and J. L. Reymond (2009) 970 million druglikesmall molecules for virtual screening in the chemical universedatabase GDB-13. J. Am. Chem. Soc.131: 8732-8733.
326. Ruddigkeit, L., R. van Deursen, L. C. Blum, and J. L. Reymond(2012) Enumeration of 166 billion organic small molecules inthe chemical universe database GDB-17. J. Chem. Inf. Model.52: 2864-2875.
327. Ramakrishnan, R., P. O. Dral, M. Rupp, and O. A. vonLilienfeld (2014) Quantum chemistry structures and propertiesof 134 kilo molecules. Sci. Data. 1: 140022.
328. Visini, R., M. Awale, and J. L. Reymond (2017) Fragmentdatabase FDB-17. J. Chem. Inf. Model. 57: 700-709.
329. Sun, J., N. Jeliazkova, V. Chupakin, J. F. Golib-Dzib, O.Engkvist, L. Carlsson, J. Wegner, H. Ceulemans, I. Georgiev, V.Jeliazkov, N. Kochev, T. J. Ashby, and H. Chen (2017)ExCAPE-DB: an integrated large scale dataset facilitating BigData analysis in chemogenomics. J. Cheminform. 9: 17.
330. Messenger, A. G. and J. Rundegren (2004) Minoxidil: Mechanismsof action on hair growth. Br. J. Dermatol. 150: 186-194.
331. Steinbach, G., P. M. Lynch, R. K. Phillips, M. H. Wallace, E.Hawk, G. B. Gordon, N. Wakabayashi, B. Saunders, Y. Shen, T.Fujimura, L. K. Su, B. Levin, L. Godio, S. Patterson, M. A.Rodriguez-Bigas, S. L. Jester, K. L. King, M. Schumacher, J.Abbruzzese, R. N. DuBois, W. N. Hittelman, S. Zimmerman, J.W. Sherman, and G. Kelloff (2000) The effect of celecoxib, acyclooxygenase-2 inhibitor, in familial adenomatous polyposis.N. Engl. J. Med. 342: 1946-1952.
332. Von Eichborn, J., M. S. Murgueitio, M. Dunkel, S. Koerner, P.E. Bourne, and R. Preissner (2011) PROMISCUOUS: Adatabase for network-based drug-repositioning. Nucleic AcidsRes. 39: D1060- D1066.
333. Luo, H., P. Zhang, X. H. Cao, D. Du, H. Ye, H. Huang, C. Li, S.Qin, C. Wan, L. Shi, L. He, and L. Yang (2016) DPDR-CPI, aserver that predicts drug positioning and drug repositioning viachemical-protein interactome. Sci. Rep. 6: 35996.
334. Brown, A. S. and C. J. Patel (2017) A standard database fordrug repositioning. Sci. Data. 4: 170029.
335. Shameer, K., B. S. Glicksberg, R. Hodos, K. W. Johnson, M. A.Badgeley, B. Readhead, M. S. Tomlinson, T. O'Connor, R.Miotto, B. A. Kidd, R. Chen, A. Ma'ayan, and J. T. Dudley(2018) Systematic analyses of drugs and disease indications inRepurposeDB reveal pharmacological, biological and epide-miological factors influencing drug repositioning. Brief Bioinform.19: 656-678.
336. Cotto, K. C., A. H. Wagner, Y. Y. Feng, S. Kiwala, A. C.Coffman, G. Spies, A. Wollam, N. C. Spies, O. L. Griffith, andM. Griffith (2018) DGIdb 3.0: A redesign and expansion of thedrug-gene interaction database. Nucleic Acids Res. 46: D1068-D1073.
337. Kohler, S., L. Carmody, N. Vasilevsky, J. O. B. Jacobsen, D. Danis,J. P. Gourdine, M. Gargano, N. L. Harris, N. Matentzoglu, J. A.McMurry, D. Osumi-Sutherland, V. Cipriani, J. P. Balhoff, T.Conlin, H. Blau, G. Baynam, R. Palmer, D. Gratian, H.Dawkins, M. Segal, A. C. Jansen, A. Muaz, W. H. Chang, J.Bergerson, S. J. F. Laulederkind, Z. Yuksel, S. Beltran, A. F.Freeman, P. I. Sergouniotis, D. Durkin, A. L. Storm, M.Hanauer, M. Brudno, S. M. Bello, M. Sincan, K. Rageth, M. T.Wheeler, R. Oegema, H. Lourghi, M. G. Della Rocca, R.Thompson, F. Castellanos, J. Priest, C. Cunningham-Rundles,A. Hegde, R. C. Lovering, C. Hajek, A. Olry, L. Notarangelo,M. Similuk, X. A. Zhang, D. Gomez-Andres, H. Lochmuller, H.Dollfus, S. Rosenzweig, S. Marwaha, A. Rath, K. Sullivan, C.Smith, J. D. Milner, D. Leroux, C. F. Boerkoel, A. Klion, M. C.Carter, T. Groza, D. Smedley, M. A. Haendel, C. Mungall, andP. N. Robinson (2019) Expansion of the Human PhenotypeOntology (HPO) knowledge base and resources. Nucleic AcidsRes. 47: D1018-D1027.
Publisher’s Note Springer Nature remains neutral with regard tojurisdictional claims in published maps and institutional affiliations.