Embed Size (px)
Citation preview

NASA/TM--2002-211811
Artificial Neural Networks Applications:
From Aircraft Design Optimization to Orbiting
Spacecraft On-Board Environment Monitoring
Kenol Jules
Glenn Research Center, Cleve.l.and, Ohio
Paul R Lin
Clevela:nd State University, C].eveland, Ohio
August 2002

The NASA STI Program Office... in Profile
Since its founding, NASA has been dedicated to
the advancement of aeronautics and spacescience. Tile NASA Scientific and Technical
Information (STI) Program Office plays a key part
in helping NASA maintain this important role.
Tile NASA STI Program Office is operated by
Langley Research Center, the Lead Center forNASA's scientific and technical information. The
NASA STI Program Office provides access to the
NASA STI Database, the largest collection of
aeronautical and space science STI in file world.
The Program Office is also NASA's institutional
medlanism for disseminating the results of its
researd3 and development acti vities. These results
are published by NASA in the NASA STI Report
Series, which includes the following report types:
TECHNICAL PUBHCATION. Reports of
completed :research or a major significant
phase of research that present the results of
NASA programs and include extensive data
or theoretical analysis. Includes compilations
of significant scientific and technical data and
information deemed to be of continuing
reference value. NASA's counterpart of peer-
reviewed formal professional papers but
has less stringent limitations on manuscript
lengfl3 and extent of graphic presentations.
TECHNICAL MEMORANDUM. Scientific
and tedmical findings that are pre, liminary or
of specialized interest, e.g., quick release
reports, working papers, and bibliographiesthat contain minimal annotation. Does not
contain extensive analysis.
CONTRACTOR REPORT. Scientific and
technical findings by NASA-sponsored
contractors and grantees.
CONFERENCE PUBLICATION. Collected
papers from scientific and technical
conferences, symposia, seminars, or other
meetings sponsored or cosponsored byNASA.
SPECIAL PUBLICATION. Scientific,
technical, or historical information from
NASA programs, projects, and missions,
often concerned with subjects having
substantial public interest.
TECHNICAL TRANSLATION. English-
language translations of foreign scientific
and technical material pertinent to NASA'smission.
Specialized services that complement the STI
Program Office's diverse offerings include
creating custom thesauri, building customized
data bases, organizing and publishing research
results.., even providing videos.
For more information about the NASA STI
Program Office, see the following:
® Access the NASASTI Program Home Page
at http:lhuww.sti.nasa.gov
® E-mail your question via the Intemet to
* Fax your question to the NASA Access
Help Desk at 301-621-0134
* Telephone the NASA Access Help Desk at301-621-0390
Write to:
NASA Access Help Desk
NASA Center for AeroSpace Information7121 Standard Drive
Hanover, MD 21076

NASA/TM--2002-211811
Artificial Neural Networks Applications:
From Aircraft Design Optimization to Orbiting
Spacecraft On-Board Environment Monitoring
Kenol Jules
Glenn Research Center, Cleve.l.and, Ohio
Paul R Lin
Clevela:nd State University, C].eveland, Ohio
Prepared for the
2001. Advanced Study hlstitute on Neural Networks for Instrumentation, Measurement,
and Related Industrial Applications
sponsored by the North Atlantic _Deaty Organization (NATO)
Crenla, Italy, October 9-20, 2001.
National Aeronautics and
Spa ce Ad.minis tration
Glelm Research Center
August 2002

NASA Center for Aerospace Information71121Standard Drive
Hanover, MD 211076
Available frorn
National Technical Information Service
5285 Port Royal RoadSpringfield, VA 22100
Available electronically at http://gltrs.zrc.nasa.gov

Artificial Neural Networks Applications: From Aircraft Design Optimization to
Orbiting Spacecraft On-board Environment Monitoring
Kenol Jules
National Aeronautics and Space Administration
Glenn Research Center
Cleveland, Ohio 44135
Paul P. Lin
Cleveland State University
Cleveland, Ohio 44115
Abstract -- This paper reviews some of the recent applications ofartificial neural networks taken from various works performed by
the authors over the last four years at the NASA Glenn ResearchCenter. This paper focuses mainly on two areas. 1)Artificial neural
networks application in design and optimization of aircraft�enginepropulsion systems to shorten the overall design cycle. Out of that
specific application, a generic design tool was developed, which canbe used for most design optimization process. 2) Artificial neural
networks application in monitoring the microgravity quality on-board the International Space Station, using on-board
accelerometers for data acquisition. These two differentapplications are reviewed in this paper to show the broad
applicability of artificial intelligence in various disciplines. Theintent of this paper is not to give in-depth details of these two
applications, but to show the need to combine different artificialintelligence techniques or algorithms in order to design an
optimized or versatile system.
I. INTRODUCTION
Over the last ten years, multidisciplinary design
optimization has developed into a field of its own. The
primary objective of Multidisciplinary Design Optimization
(MDO) is to improve design tools in order to rapidly and
efficiently explore high-order design spaces with the aim of
increasing significantly system performance and reducing
end-product cost substantially by cutting system design cycle
time by half. With that in mind, a few years ago the NASA
Glenn Propulsion System Analysis Office (PSAO) undertook
a review of all its system analysis tools to assess how some of
them can be integrated into one unit and at the same time cut
drastically the time required to perform the daily aircraft
propulsion analysis task by taking advantages of emerging
analysis techniques and faster CPUs. The motivation for that
review was to minimize the time required to assess
technology impact on current and future aircraft / engine
design by both analysts and managers. Based on the outcome
of that review, the decision was made to develop a
simulation-based analysis tool using soft computing
techniques. Section II of this paper reviews and discusses the
pertinent results obtained using such system.
The second area, though drastically different from the
design optimization one, is the field of data acquisition and
system monitoring. In this specific case, artificial neural
networks were used to monitor the International Space
Station (ISS) microgravity environment quality using on-
board accelerometers for data acquisition. The objective of
this work was to monitor in near real time the microgravity
environment of the station so that Principal Investigators (PI)
performing research on the station can know at any momentwhat the environment is. Artificial neural networks were used
to design such a system. The system is used to monitor the
operating machinery as well as crew activities. Operating
machines and mechanical systems generate vibration.
Measurement of these signals (vibration) yields information,
which is used for monitoring. For example, data about how a
signal varies with time can be used to assess defective and
worn parts, design attributes and other problems. Operation
of pumps, fans, compressor, generator, engines and most
mechanical systems involves periodic motion due to rotation
of interacting components. The motion of fans, coils,
bearings and shafts generates vibration, which can be related
to the machine running speed. Based on that knowledge, a
robust monitoring system using artificial neural networks can
be developed for use in many fields. Section V of this paper
reviews and discusses such a monitoring system for the case
of acceleration data acquisition for environment monitoring.
II. NEURAL NETWORKS APPLICATION FOR DESIGN
AND OPTIMIZATION
The main objective of this work was to develop a fast
optimizing multidisciplinary system design, which could
perform both analysis/design and optimization of aircraft and
their propulsion systems, such as engine cycle analysis,
aircraft sizing, aircraft / engine mission analysis, aircraft
noise and emission, engine economics analysis and system
weight prediction (Fig. 1). To design such system [1-2],
Taguchi techniques, fuzzy logic and neural networks were
used. Neural Networks [3-6] were used in this work to
provide mappings for fast analysis and design. The use of
neural networks was very important in this work because it
added both capability and flexibility to analyze the impact of
new technologies on engine and aircraft systems and greatly
reduces the turnaround time for analysis and design. The
result obtained using such approach showed that it yields
significant performance improvement in optimizing the
design objectives as well as in predicting the system output in
NASA/TM--2002-211811 1
near real time for both single and multiple design objectiveseven when conflict exists among the design objectives (whichis usually the case in design optimization). The use of NeuralNetworks enables the design analysis tool to simulate a verycomplex system in near real time (since it is simulation-basedinstead of being an iterative search) within acceptableaccuracy (less than 5% error).
III. DISCUSSION
The optimum solutions obtained using the combinedTaguchi Neural Networks and fuzzy logic techniques tomaximize thrust, minimize fuel consumption, emission andjet velocity are listed in Tables I- III. As a design constraint,every case starts with the same Mach number and altitude.All other input parameters were free to vary within their pre-specified ranges. The results show that the optimum designsolutions can be easily found using the combined techniques;especially in resolving the conflict among design objectives.
To test the generalization of the trained network, 26unseen cases were used. Each case contains 14 inputvariables and 4 (out of 11) output variables. Table IV showsthe generalization test results in terms of root-mean-square(RMS) error percentage. The error percentages listed in thattable are less than 5 %, and are generally acceptable. But,we feel that emission could be further improved by carefullyadding more trained input patterns cases. The main reasonwhy emission shows a higher error percentage is because theratio of the maximum to the minimum input value of thetrained patterns is very high, approximately 6.7.
From the result obtained, one can infer that the
combination of Taguchi, Fuzzy logic and Neural Networksshows excellent prospect in the MDO field.
IV. DEVELOPMENT OF A GENERIC DESIGN TOOL
The successful result obtained using the neural networksfor aircraft and propulsion systems design/analysis andoptimization, led to the development of a generic
multidisciplinary design optimization tool using the sameapproach [7]. The objective of the generic design tool was to
automate the multidisciplinary system design optimization sothat any user can mount his/her application program on top of
the generic tool to optimize the design objectives withouthaving to do all the tedious work required in performingMDO. As was the case in the previous work discussedabove, neural networks were used to generate the instantinput-output mapping. That allows the user to instantly
evaluate the optimization performance; to place weights ondifferent objectives or fine-tune the optimum solution. In
summary, the use of artificial neural networks helps greatly inaccomplishing the following:
1. Greatly reduces turnaround time for technologyimpact assessment
2. Quick data availability for project advocacy
3. Identification of high payoff investment for lessR&D funding
4. Save time, money and resources5. Keep and increase corporate knowledge6. Incremental and/or global analysis capability7. Excellent learning and training tool for new
employeesThe generic design tool presented here (figs. 2 and 3)
combines Taguchi techniques, fuzzy logic and neuralnetworks for system optimization. Figure 2 shows thescheme for the case when the user does not have a database,while fig. 3 shows the scheme when such a database isavailable to the user. More specifically,1. Taguchi techniques are used to generate the parameter
significance index2. Fuzzy logic is used to resolve the conflicts among
different objectives3. Neural networks are used to generate instant input-output
mapping. Such a capability allows the user to instantlyevaluate the optimization performance, particularly inplacing the preference weights and fine-tuning theoptimum solution.
4. Combination of Taguchi techniques and fuzzy logicproved to be a powerful tool for performingmultidisciplinary system optimization
The combination of the three techniques is better thanmost traditional search-based optimization techniques in threeaspects:1. In seeking the optimum solution, this approach never
diverges2. The optimum solution is obtained in near real time
because this approach is simulation-based, which doesnot rely on an iterative search
3. As a result of Taguchi analysis, the parametersignificance index gives the user a good guidance to fine-tune the optimum solution.
This tool is generic in the sense that it can take virtuallyany type of data set, such as ASCII file or spreadsheet. It isflexible enough to allow the user to easily switch betweensingle and multiple objective optimizations, and betweenlocal and global optimizations, at any time. Furthermore, theuser can place preference weights on each objective, and alsohas a chance to fine-tune the optimum solution. Mostimportantly, the system optimum solution can be obtained innear real time.
V. NEURAL NETWORKS APPLICATION FOR SYSTEMMONITORING
The residual acceleration environment of an orbitingspacecraft in a low earth orbit is a very complexphenomenon. It is subject to quasi-steady acceleration, higherfrequency acceleration, and transient disturbances. Manyfactors [8], such as experiment operation, life-supportsystems, equipment operation, crew activities, aerodynamicdrag, gravity gradient, rotational effects as well as the vehiclestructural resonance frequencies (structural modes) contribute
NASA/TM--2002-211811 2

to form the overall reducedgravity environment.Weightlessnessisanidealstate,whichcannotbeachievedinpracticebecauseof thevarioussourcesof accelerationpresentinanorbitingspacecraft.Asaresult,theenvironmentin whichexperimentsareconductedis not zero gravity;therefore, experiments can be affected by the residualacceleration because of their dependency on accelerationmagnitude, frequency, orientation and duration. Therefore,experimenters must know what the environment was whentheir experiments were performed in order to analyze andcorrectly interpret the result of their experimental data. In aterrestrial laboratory, researchers are expected to know andrecord certain parameters such as pressure, temperature,humidity level and so on in their laboratory prior to, andpossibly throughout their experiment. The same holds true inspace, except that acceleration effects emerge as an importantconsideration. In order to aid the researchers assessing theimpact of the space environment on their experimentsremotely, a monitoring system tool development wasdeveloped using artificial neural networks. A briefdescription of the work is given below.
The main focus of this work [9-11], using soft computingtechniques to monitor the microgravity environment on-boardthe ISS, was to develop an artificial intelligence monitoringsystem to help Principal Investigator (PI) teams identify theprimary vibratory disturbance sources that are active, at anymoment of time, on-board the ISS, which might impact themicrogravity environment their experiments are exposed to.Such information is made available to PIs via the world wide
web (WWW) in near real time, where they can graphicallysee which event(s) is/are active, such as crew activities,pumps, fans, centrifuges, compressor, crew exercise, etc.., inorder to decide whether or not to run their experiments basedon the magnitude of the acceleration associated with aspecific event. This monitoring system detects primarily thevibratory disturbance sources. The system has built-incapability to detect both known and unknown vibratorydisturbance sources. A known pattern is defined as thenominal values of the previously measured (learned data set)frequency and acceleration of an existing disturbance source.To design such a complex system, the following artificialneural networks techniques were used: Kohonen's Self-Organizing Feature Map (SOFM) [12], Learning VectorQuantization (LVQ) [13-15], Backpropagation NeuralNetworks (BPNN) [16]. In addition, Fuzzy logic [17-18] wasused to deal with some of the decision making process.
For the acceleration data acquisition, two accelerometerswere flown to ISS, April 19, 2001, on the Space Shuttle flightSTS-100. One accelerometer, Microgravity AccelerationMeasurement System (MAMS), is a low frequencyacceleration measurement system, which measuresacceleration levels up to 100 Hz. The other, SpaceAcceleration Measurement System (SAMS), is a high
frequency measurement system, which measures accelerationfrom 0.01 to 300 Hz on the ISS. Both of these accelerometers
are tri-axial sensors. Acceleration data are currently being
received in real time at our Telescience Center (TSC) atNASA Glenn for the on-board microgravity environmentmonitoring of the ISS.
In the course of developing the monitoring system manytechnical challenges were encountered. Chief among themwas unknown patterns recognition. SOFM has no ability todo so, nor can LVQ. Unknown patterns recognition was acrucial feature of the monitoring system if it were to succeedat doing what it was supposed to because many of thefundamental frequencies of the events on ISS are not yetknown, and since the ISS is being built in increments, they
will, without doubt, change to some degrees from incrementto increment until assembly complete. Therefore, to
overcome that problem we had to come up with a modifiedapproach to pattern classification and recognition. The modelwe proposed and used throughout this work combines SOFM,BPNN and LVQ, which is referred to as Adaptive PatternRecognition and Classification (APRC) (Fig. 4). In theproposed model, BPNN is inserted in between SOFM andLVQ to help recognize the unknown patterns, while SOFMand LVQ are used to classify the known patterns. Also, in theproposed model, BPNN is used to keep SOFM in check in
order to prevent it from misclassifying patterns since one ofthe shortcomings of SOFM is the potential for misclassifyingpatterns that fall on the boundary between two clusters due tothe fact that SOFM relies solely on Euclidean distance toassign patterns to respective clusters.
In summary, the proposed APRC model used throughout
this work is very innovative in the following aspects:1. Can recognize unknown patterns2. Can avoid patterns misclassification3. Take into account multi-dimensional ranges of
neighboring clusters
VI. DISCUSSION
This section presents some preliminary results obtainedusing the artificial neural networks, which assess the ISSmicrogravity environment, in order to share with themicrogravity scientific community what is currently beingseen in terms of disturbances aboard the ISS. It must be
pointed out that the ISS microgravity environmentcharacterization is at an early stage, therefore, not too much isknown with certainty. The results presented here are,therefore, VERY preliminary since we are in the early stageof receiving, processing, analyzing, digesting and comparingthe data. There are more questions, at this stage, thananswers. With that in mind, let's discuss the content oftable 4.
Table 4 shows both acceleration levels and frequencies(after Fourier Transform was performed) for differentactivities recorded by MAMS-HiRAP aboard the ISS over a10-day period. The table shows activities, which are presentonly on the X and Z axes of the MAMS-HiRAP, respectively,and then, activities present only on two axes. This is very
important information for experiments, which have
NASA/TM--2002-211811 3

directional and/or frequency sensitivities. It is very important
to note that these data are presented in the MAMS-HiRAP
on-orbit coordinate systems. The table provides information 1.
such as the nature of the disturbance detected (narrow or
broadband). In the case of the broadband, the frequency range
(low and high end) is provided; also, the median acceleration
level is provided along with the lowest and the highest level 2.
of acceleration detected for that specific activity over the 10-
day period. Finally, a column, which lists some comments,
provides some speculations on what that specific activity
might be. We have reasons to believe that most of them are
correct, but since this is a preliminary look at the data, we 3.
will call them "speculation" at this point, until more in-depth
analysis is performed. The result obtained, thus far, using 4.
actual data showed that the monitoring system correctlydetected the disturbance sources activation. The result
showed a high success rate in classifying and recognizing the 5.
detected events correctly. The total elapsed time from
detection of an event on the ISS to pattern classification and
recognition and actual display of the events on the world 6.wide web (WWW) for PIs viewing takes approximately 12
seconds for all three axes using a PC with a 500 MHz clock
speed. 7.
This monitoring system has demonstrated its capability to
automatically detect the vibratory disturbance sources and to
correctly classify and recognize them. The Adaptive Pattern
Recognition and Classification (APRC) approach presented 8.
here has the ability to classify the known patterns, prevent
possible misclassification, and also recognize the unknown
patterns. Fuzzy logic was used to exploit the tolerance for
imprecision, uncertainty and partial truth, along with the 9.
experience of the human experts (by means of fuzzy logic
rules), to make intelligent decisions as to what vibrating
sources are more relevant to a specific sensor.
VII. OVERALL CONCLUSION 10.
In this paper two major applications of artificial neural
networks were presented: a non-linear input-output mapping
for system optimization, and pattern classification and
recognition for system monitoring. In the former,11.
backpropagation networks, a supervised learning algorithm,
were used, while in the latter, Kohonen's Self-Organizing
Feature Map, unsupervised learning, was used in conjunction
with Learning Vector Quantization (supervised learning). It
was shown that supervised learning and unsupervised 12.
learning compliment each other very well.
Although neural networks alone can provide very accurate13.
input-output mapping, it cannot deal with data imprecision,
fuzziness and uncertainty. In contrast, fuzzy logic is well
suited for that. Therefore, the combination of these two
techniques, known as soft computing techniques, is a 14.
powerful tool for design, analysis and systems monitoring,
where neural networks provide precision, while fuzzy logic
provides intelligence to the system. The works discussed in
this paper clearly demonstrated that.
REFERENCES
Lin, P.P. and Jules, K., "Optimized Multidisciplinary System
Design for Aircraft and Propulsion Systems," AIAA 98-3265,34 th AIAA/ASME/SAE/ASEE Joint Propulsion Conference &
Exhibit, 1998.
Jules, K., and Lin, P.P., "Multidisciplinary System Design
Optimization Using Taguchi Techniques, Fuzzy Logic andNeural Networks," AIAA-2000-0688, 38 thAerospace Sciences
Meeting & Exhibit, 2000.
Hagan, M.T., Demuth H.B., and Beale, M., Neural Network
Design, PWS Publishing Company, 1996.
Lin, C.T., and Lee, G.C.S., Neural Fuzzy Systems, PrenticeHall, Inc., 1996.
Freeman, J.A., and Skapura, D.M., "Neural Network:
Algorithms, Applications, and Programming Techniques,Addison-Wesley Publishing Company, Inc., 1991.
Haykin, Simon., Neural Networks:A ComprehensiveFoundation, Prentice Hall, Inc., 1994.
Lin, P.P. and Jules, K., "A Simulation-Based Generic Tool for
Multidisciplinary Design Optimization," 8'h AIAA/NASA/
USAF/ISSMO Symposium on Multidisciplinary Analysis andOptimization, September 2000, Long Beach, CA.
Hamacher, H., "Low-Frequency Residual Acceleration,"
Journal of Spacecraft and Rockets, Vol. 32, No. 2, pp. 324-327, 1995.
Jules, K. and Lin, P.P., "Monitoring the Microgravity
Environment Quality On-board the International Space Station
Using Soft Computing Techniques--Part I: System Design,"
51 _ International Astronautical Congress, October 2000, Rio deJaneiro, Brazil.
Jules, K. and Lin, P.P., "Monitoring the MicrogravityEnvironment Quality On-board the International Space Station
Using Soft Computing Techniques----Part II: PreliminarySystem Performance Results," 52 "a International Astronautical
Congress, October 2001, Toulouse, France.
Lin, P.P. and Jules, K., "An Intelligent System for Monitoring
the Microgravity Environment Quality On-board the
International Space Station," IEEE Instrumentation andMeasurement Technology Conference, May 2001, Budapest.
Kohonen, T., Self-Organization and Associative Memory, 3rd
Edition, New York, Berlin: Springer-Verlag, 1988.
Kohonen, T., "Leaming Vector Quantization for Pattem
Recognition," Technical Report TKK-F-A601, Helsinki
University of technology, Finland, 1986.
Kohonen, T., "Improved Versions of Learning Vector
Quantization," International Joint Conference on NeuralNetworks, V. 1, pp. 545-550, San Diego, CA, 1990.
NASA/TM--2002-211811 4

15. Kohonen, T., "Learning Vector Quantization for Pattern
Recognition," Technical Report TKK-F-A601, Helsinki
University of technology, Finland, 1986.
16. Lippmann, R.P., "Pattern Classification Using Neural
Networks," IEEE Communication Magazine, 27, pp. 47_54,
1989.
17. Jang, J.S., and Gulley, N., Application of Fuzzy
Control Design, Technical Brief, Mathworks Inc., 1996.
18. Matlab Fuzzy Logic Toolbox User's Guide, Version 2, Math
Inc., 1998
DI SCIPLINA RY A PPLI CA TION _ODUL_S
NEPP: Engine Cycle Ailalysis Program
WATE: Engine Weight Prediction Program
FLOPS: Mission Ailalysis Code
ANOPP: Aircraft Noise Prediction Program
FOOTPR: Engine Noise Prediction Program
COMPEAT: Engine Cost Prediction Program
CSPAN.: Axial Compressor Design Program
TURBAN: Tltrbine Design Program
MAPGEN: Components Map Design Program
FUTURE MODULE: Socket for Furore Programs
Fig. 1 Multidisciplinary Analysis/Design Structure
NASA/TM--2002-211811 5
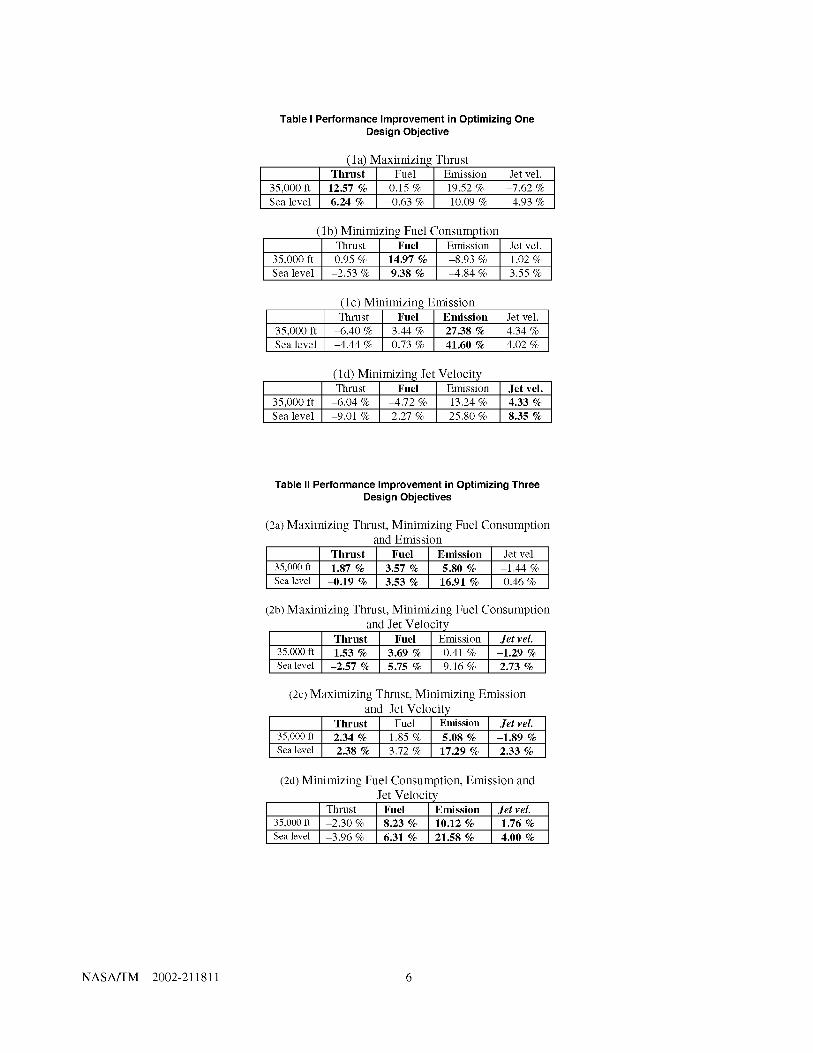
Table I Performance Improvement in Optimizing OneDesign Objective
Jet vel.
35,000 ft -7.62 %
(la) Maximizing ThrustThrust Fuel Emission
12.57 % 0.15 % 19.52 %
6.24 % -0.63 % -10.09 %Sea level -4.93 %
(lb) Minimizing Fuel Consumption
Thrust Fuel Emission
35,000 ft 0.95 % 14.97 % -8.93 %
Sea level -2.53 % 9.38 % -4.84 %
Jet vel.
1.02 %
3.55 %
35,000 ftSea level
(lc) Minimizing EmissionThrust Fuel Emission Jet vel.
-6.40 % 3.44 % 27.38 % 4.34 %
-4.44 % 0.73 % 41.60 % 4.02 %
(ld) Minimizing Jet VelocityThrust Fuel Emission Jet vel.
35,000 ft -6.04 % -4.72 %
Sea level -9.01% 2.27 %
13.24 % 4.33 %
25.80 % 8.35 %
Table II Performance Improvement in Optimizing ThreeDesign Objectives
(2a) Maximizing Thrust, Minimizing Fuel Consumption
and Emission
Thrust Fuel Emission Jet vel.
35,000 ft 1.87 % 3.57 % 5.80 % -1.44 %
Sea level -0.19 % 3.53 % 16.91% 0.46 %
(2b) Maximizing Thrust, Minimizing Fuel Consumption
and Jet Velocity
Thrust Fuel Emission Jet vel.
35,000 ft 1.53 % 3.69 % 0.41% -1.29 %
Sealevel -2.57 % 5.75 % 9.16 % 2.73 %
(2c) Maximizing Thrust, Minimizing Emission
and Jet VelocityThrust Fuel Emission Jet vel.
35,000 ft 2.34 % 1.85 % 5.08 % -1.89 %
Sea level -2.38 % 3.72 % 17.29 % 2.33 %
(2d) Minimizing Fuel Consumption, Emission and
Jet VelocityThrust Fuel Emission Jet vel.
35,000 ft -2.30 % 8.23 % 10.12 % 1.76 %
Sea level -3.96 % 6.31% 21.58 % 4.00 %
NASA/TM--2002-211811 6

Table III Performance Improvement in Optimizing Four Design
Objectives
Thrust Fuel
35,000 ft 1.28 % 3.48 %
Sealevel -1.87 % 4.12 %
Emission Jet vel.
5.43 % -1.14 %
15.60 % 1.96 %
Table IV Generalization Test Results
D_Sign ObjeCtive i Outpu_ I RMS E_ro_
Output 1: Thrust 1.719 %
Output 2: FuelConsumption 1.617 %
Output 3: Emission 3.727 %Output 4: Jet Velocity 1.242 %
An L81 Taguchi TaNe isgenerated
ATable of 8f cases 1o
run the defined
User generates objective
function outputs for the81 cases
i i i i I'Beselinedesigniiiiiiiiiiiiii_, S e Ie ct io n of o bje ct ive
iiiiiiiiiiiiii_ funsti°nIs)[
_I Teguchi global analysisis performed
Optimized parameter setis delivered to user
"_btains
optimized set i_ ii_i_i_i_i_i_i_i_i_i_i_i_i_i_i_i_i_i_i_i_iiiiiiiiiiiiiiiiiiiiiiiiiiiii
Fuzzy logic is used for I
conflict handling for
multiple objectives
f' ....................',i',i',i',i',i',i',i',i',i',::::::::::::::1Parameters settina &
iiiiiiiiiiiiiil normalization are"
_[ Yeguchi global analysis
analysis [_1
Fig. 2 Generic Single Discipline Optimization with Multiple Objective Functions Architecture I
NASA/TM--2002-211811 7

li I_" Number of Parameters
Range of ParameteraA database based on tiredefined parameters
Neural networks rnap isgenerated using user'sdatabase
I I Anl"81TeguchiTableis t Igenerated
::;l::f:f;INeural networks map is :::::::::::::::::::::i#_i_I usedteebtai...... f#i#:@::::::|:p:i:um solution set r::::::::::::::::
from database for the Parameters setting &defined parameters normalization are
performed
Th Inetwork p...... .... I ] Taguchi global analysis
is used to find the I I is transformed to localobjective functions output analysis
®Baseline design Taguchi global m
• selection of objective analysis is performed Jfunction(s) w/inner & outer arrays
Fig. 3 Generic Single Discipline Optimization with Multiple Objective Functions Architecture II
UNPUT OUTPUTVECTOR VECTOR
Fig. 4 Adaptive Pattern Recognition and Classification (APRC)
NASA/TM--2002-211811 8

Table V Frequencies and Accelerations Identification of the Neural Networks System for ISS Increment-2 over a 10-day period
MAMS-HiRAP: X-axis onlyNominal Frequency (Hz) Low end (Hz)
1.8311
3.7842
4.6387
11.597
13.672
14.404
15.137
15.991
16.602
18.677
Huh end(Hz)
18.818 19.531
MAMS-HiRAP: Z-axis onlyNominal Frequency (Hz) Low end (Hz) High end (Hz)
5.9814 5.8594 6.2256
7.5684
MAMS-HiRAP: X and Z-axesNominal Frequency (Hz) Low end (Hz) High end (Hz)
0.97656 (x)
0.97656 (z)
39.185 (x)
39.185 (z) 38.82 41.75
MAMS-HiRAP: Y and Z-axes
Nominal Frequency (Hz) Low end (Hz) High end (Hz)
9.5215 (y) 9.1553 9.887
9.5215 (z) 9.2773 9.644
15.625 (y) 15.259 15.99
15.625 (z) 15.015 15.99
83.984 (y)
83.984 (z)
Band type Median Level (btg) Low end (btg) High end (btg) Excitation level (btg)Narrow 27 8.4121 88.892
Narrow 65 6.9859 121.09 188.93
Narrow 50 21.582 111.43
Narrow 20 7.1607 48.046
Narrow 30 5.0939 69.260
Narrow 51 17.729 84.30
Narrow 59 16.879 84.536
Narrow 28 15.855 72.29 162.14
Narrow 30 5.9014 62.211
Broadband 21 8.8645 37.908
Comment
Structural
Structural
Structural
Band type Median Level (btg) Low end (btg) High end (btg) Excitation level (btg) Coinment
Broadband 16 10.398 17.775 185.04 Structural
Narrow 8 5.2704 12.047 171.64 Structural
Band type Median Level (btg) Low end (btg) High end (btg) Excitation level (btg) Comment
Narrow 14.8 4.8229 43.306 Structural
Narrow 33 8.0831 65.824 Structural
Narrow 9.0 5.7623 15.071
Broadband 5.0 3.2659 10.555
Excitation level (btg)Low end (_g)3.2905
4.6486
High end (_g)54.391
87.878
19 7.3364 46.698
36 8.9874 74.023
30 7.5534 34.195
25 21.413 34.03
Band type Median Level (btg)Broadband 17
Broadband 30
Broadband
Broadband
Narrow
Narrow
Comment
EXPPCS
EXPPCS
NASA/TM--2002-211811 9

Form ApprovedREPORT DOCUMENTATION PAGEOMB No. 0704-0188
Public reporting burden for this collection of information is estimated to average 1 hour per response, including the time for reviewing instructions, searching existing data sources,
gathering and maintaining the data needed, and completing and review#lg the collection of information. Send corrlments regarding this burden estimate or any other aspect of this
collection of information, including suggestions for reducing this burden, to Washington Headquarters Services. Dhectorate for Information Operations and Reports, 1215 Jefferson
Davis Highway, Suite 1204, Arlington, VA 22202-4302, and to the Office of Management and Budget Paperwork Reduction Project (0704-.0188), Washington, DC 20503.
1. AGENCY USE ONLY (Leave blank) 2. REPORT DATE 3, REPORT TYPE AND DATES COVERED
August 2002 Technical Memorandum
5. FUNDING NUMBERS4. TITLE AND SUBTITLE
Artificial Neural Networks Applications: From AircrNt Design Optimization to
Orbiting Spacecraft On-Board Environment Monitoring
& AUTHOR(S)
Kenol Jules and Paul P. [,in
7. PERFORMING ORGANIZATION NAME(S) AND ADDRESS(ES)
National Aeronautics and Space Administration
John H. Glenn Research Center at Lewis Field
Cleveland, Ohio 44135 - 3191
WU-400-35-4C-00
8. PERFORMING ORGANIZATIONREPORT NUMBER
E.---13505
9. SPONSORING/MONITORING AGENCY NAME(S) AND ADDRESS(ES) 10. SPONSORING/MONITORINGAGENCY REPORT NUMBER
National Aeronautics and Space Administration
Washington, DC 20546-0(101 NASA TM------2002-211811
11. SUPPLEMENTARY NOTES
Prepared for the 2001 Advanced Study Institute on Nem'al Networks fbr Instrumentation, Measurement, and Related
Industrial Applications sponsored by the North Atlantic Treaty Orgm_ization NAT()), Crema, Italy, October 9-2(I, 2(101.
Kenol Jules, NAS A Glenn Research Center, and Paul P. I Jn, Cleveland S tale University, Cleveland, Ohio 44115-2425.
Responsible person, Kenol Jules, organization code 6727, 216-977-7016.
12a, DISTRIBUTION/AVAILABILITY STATEMENT
Unclassified - Unlimited
Subject Categories: 19 and 35 Distribution: Nonstandard
Available electronicaJly at bttp://glt:.-s._rc.nasa.aov
"l-his publication is available from the NASA Center for AeroSpace Im%rmadon, 301-621-0390.
12b. DISTRNBUTION CODE
13. ABSTRACT (Maximum 200 words)
This paper reviews some of the recent applications of artilicial neural networks taken from w_rious works performed by
tile authors over the last four years at tile NASA Glenn Research Center. This paper focuses mainly on two areas. First,
artificial neural networks application in design and optimization of aircraft/engine propulsion systems to shorten the
overall design cycle. Out of that specific application, a generic design tool was developed, which can be used for n-lost
design optimization process. Second, artificial neural networks application in monitoring the microgravity quality on-
board the International Space Station, using on-board acceleroiimters for data acquisition. These two different applica-
tions are reviewed in this paper to show tile broad applicability of artificial intelligence in w_rious disciplines. The inmnt
of this paper is not to give in-depth details of these two applications, but to show the need to combine different artificial
intelligence techniques or algorithms in order to design an optimized or versatile system.
14. SUBJECT TERMS
Multidisciplinury design optimization; Taguchi techniques; Fuzzy logic
17. SECURITY CLASSIFICATIONOF REPORT
Unclassified
NSN 7540-01-280-5500
15. NUMBER OF PAGES
1516. PRICE CODE
18, SECURITY CLASSiFiCATiON 19. SECURITY CLASSiFiCATiON 20. LiMiTATiON OF ABSTRACTOF THIS PAGE OF ABSTRACT
Unclassified Uncl assifi ed
Standard Form 298 (Rev. 2-89)
Prescribed by ANSI Std. Z39-18298-102