Embed Size (px)
Citation preview

Arts Funding in NSW
Briefing Paper No 11/2010
by Lenny Roth and Todd Buttsworth
ACKNOWLEDGEMENT
The authors wish to thank Hannah Blyth for her research assistance.
ISSN 1325-5142
ISBN 978-0-7313-1872-8
November 2010
© 2010
Except to the extent of the uses permitted under the Copyright Act 1968, no part of this document may be reproduced or transmitted in any form or by any means including information storage and retrieval systems, without the prior written consent from the Manager of the New South Wales Parliamentary Library Research Service, other than by Members of the New South
Wales Parliament in the course of their official duties.
Arts Funding in NSW
by
Lenny Roth and Todd Buttsworth

NSW PARLIAMENTARY LIBRARY RESEARCH SERVICE
Gareth Griffith (BSc (Econ) (Hons), LLB (Hons), PhD), Manager, Politics & Government/Law .......................................... (02) 9230 2356 Lenny Roth (BCom, LLB), Acting Senior Research Officer, Law ............................................ (02) 9230 3085 Todd Buttsworth (BMedia), Research Officer, Social Issues/Law ............................................ (02) 9230 2798 Talina Drabsch (BA, LLB (Hons)), Research Officer, Social Issues/Law ........................................... (02) 9230 2484 Daniel Montoya (BEnvSc (Hons), PhD), Research Officer, Environment/Planning ..................................... (02) 9230 2003 John Wilkinson (MA, PhD), Research Officer, Economics ........... (02) 9230 2006
Should Members or their staff require further information about this publication please contact the author.
Information about Research Publications can be found on the Internet at:
http://www.parliament.nsw.gov.au/prod/parlment/publications.nsf/V3LIstRPSubject
Advice on legislation or legal policy issues contained in this paper is provided for use in parliamentary debate and for related parliamentary purposes. This paper is not professional legal opinion.

CONTENTS
Summary ............................................................................................................ i
1. Introduction ................................................................................................. 1
2. NSW government: funding streams ........................................................... 2
2.1 Overview of funding streams .................................................................... 2
2.2 Funding of key institutions ........................................................................ 2
2.3 Grants awarded by Arts NSW ................................................................... 3
2.4 Managed properties ................................................................................. 5
2.5 Incentives for major screen projects ......................................................... 6
3. NSW government: total funding and categories ....................................... 6
3.1 Preliminary note ........................................................................................ 6
3.2 Funding in 2008/09 ................................................................................... 6
3.3 Funding trends .......................................................................................... 6
4. Comparisons with other state governments .............................................. 8
4.1 Preliminary note ........................................................................................ 8
4.2 Total arts funding ...................................................................................... 8
4.3 Per capita arts funding ............................................................................ 10
5. Australian Government: funding streams ................................................ 11
5.1 Overview of funding streams .................................................................. 11
5.2 Funding of key arts organisations ........................................................... 11
5.3 Australia Council Grants ......................................................................... 11
5.4 The Department's funding programs ....................................................... 13
5.5 The Australian Screen Production Incentive ........................................... 13

6. Australian Government: total funding and categories ............................ 13
6.1 Preliminary note ...................................................................................... 13
6.2 Funding 2008/09 ..................................................................................... 14
6.3 Funding trends ........................................................................................ 14
7. Comparisons with other countries ........................................................... 15
7.1 Difficulties in making comparisons .......................................................... 15
7.2 Reports containing comparisons ............................................................. 15
7.3 Public arts funding in Canada ................................................................. 16
7.4 Public arts funding in the UK ................................................................... 18
8. Private sector funding of the arts ............................................................. 18
8.1 Levels of private sector funding .............................................................. 18
8.2 National measures to promote private support ....................................... 20
8.3 Arts Partnership Funds in other States ................................................... 21
9. Conclusion .................................................................................................. 21

i
SUMMARY This paper provides an overview of arts funding in NSW. Definition of the arts It is important to define what the arts include for the purposes of this analysis. This paper largely adopts the classification system used by the Australian Bureau of Statistics in its Cultural Funding by Government publication. The ABS classifies 'cultural activities' into two major groups: 'the arts' and 'heritage'. For our definition, we have included all of the ABS 'arts' categories except for 'radio and television services'; and we have excluded all of the ABS 'heritage' categories except for 'art museums'. The excluded 'heritage' categories are: 'other museums', 'environmental heritage', 'libraries', and 'archives'. NSW Government: funding streams [2] The arts are funded through a number of different funding streams. First, annual allocations are made to three statutory arts institutions, which form part of the eight 'State cultural institutions': the Sydney Opera House, the Art Gallery of NSW and Screen NSW. Second, Arts NSW makes grants to organisations and individuals, primarily under the Arts Funding Program. Third, funds are provided for maintaining and upgrading state-owned properties that are occupied or used by arts organisations. Fourth, the NSW Government provides incentives to attract major screen projects to NSW. NSW Government: total funding and categories [3] In 2008/09, the NSW Government contributed a total of $155 million to the arts. Performing arts venues received the largest share of this funding ($46 million), followed by art museums ($34 million). The various performing arts received $26 million, with about half of this being allocated to music performance. Since 2000/01 there have been significant fluctuations in government funding of the arts over some years. Notably, there was a large decrease in arts funding from 2007/08 to 2008/09. The fluctuations have primarily been due to changes in funding in two categories: art museums and performing arts venues. Comparisons with other State Governments [4] In 2008/09, both Victoria and Queensland had higher arts funding levels than NSW: Victoria by $70 million and Queensland by $62 million. However, in three of the last five years, NSW has had the highest levels of arts funding of all States. In 2008/09, the NSW had the lowest per capita arts funding ($22 per person). South Australia had the highest ($64), followed by Western Australia ($62), Queensland ($50), and Victoria ($42). Over the past five years, NSW has ranked no better than fourth out of all six States in per capita arts funding. One category where most States have had higher per capita funding than NSW over the last five years is film and video production and distribution. Australian Government: funding streams [5] Federally, the arts are funded through a number of different funding streams. Annual funding allocations are made to the two key arts funding bodies - the Australia Council for the Arts and Screen Australia – as well as to other national arts organisations. In addition, the Department of Prime Minister and Cabinet
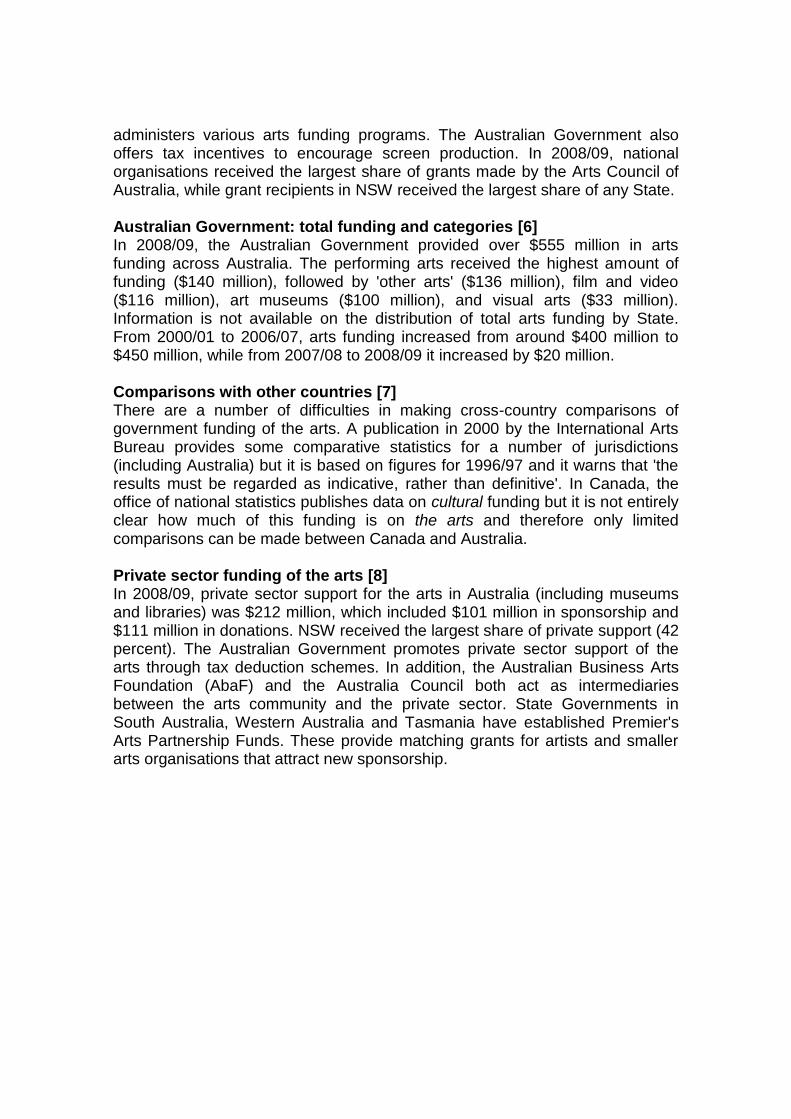
administers various arts funding programs. The Australian Government also offers tax incentives to encourage screen production. In 2008/09, national organisations received the largest share of grants made by the Arts Council of Australia, while grant recipients in NSW received the largest share of any State. Australian Government: total funding and categories [6] In 2008/09, the Australian Government provided over $555 million in arts funding across Australia. The performing arts received the highest amount of funding ($140 million), followed by 'other arts' ($136 million), film and video ($116 million), art museums ($100 million), and visual arts ($33 million). Information is not available on the distribution of total arts funding by State. From 2000/01 to 2006/07, arts funding increased from around $400 million to $450 million, while from 2007/08 to 2008/09 it increased by $20 million. Comparisons with other countries [7] There are a number of difficulties in making cross-country comparisons of government funding of the arts. A publication in 2000 by the International Arts Bureau provides some comparative statistics for a number of jurisdictions (including Australia) but it is based on figures for 1996/97 and it warns that 'the results must be regarded as indicative, rather than definitive'. In Canada, the office of national statistics publishes data on cultural funding but it is not entirely clear how much of this funding is on the arts and therefore only limited comparisons can be made between Canada and Australia. Private sector funding of the arts [8] In 2008/09, private sector support for the arts in Australia (including museums and libraries) was $212 million, which included $101 million in sponsorship and $111 million in donations. NSW received the largest share of private support (42 percent). The Australian Government promotes private sector support of the arts through tax deduction schemes. In addition, the Australian Business Arts Foundation (AbaF) and the Australia Council both act as intermediaries between the arts community and the private sector. State Governments in South Australia, Western Australia and Tasmania have established Premier's Arts Partnership Funds. These provide matching grants for artists and smaller arts organisations that attract new sponsorship.

Arts Funding in NSW
1
1. INTRODUCTION
Just as the arts lend constant support to community life, the debate about the appropriate level of arts funding is ongoing. While this debate may not occupy the centre stage of political life, it is nonetheless a debate that is deeply felt in many and varied parts of the community. The importance of arts funding in areas outside the Sydney CBD was recognised in a recent report of the Legislative Assembly's Standing Committee on Public Works.1 Another recent contribution to the debate is a discussion paper by Arts Queensland which identifies the need to develop new funding models to support individual artists and creative work.2
Rather than engaging in the wider debate, this paper intends simply to provide an overview of arts funding in NSW, including trends over the years. It outlines the funding streams of both the NSW and Federal Governments, presents data on total levels of funding and support for the main art forms, and it provides some interstate comparisons. Information is also presented on levels of public arts funding in other countries. Finally, the paper looks at levels of private support for the arts and Government measures to increase private support.
It is important to define what 'the arts' includes for the purposes of this analysis, and also to acknowledge that there will be different opinions on what should be included. While it is clear that any definition of the arts should incorporate art-forms such as music, literature and visual arts, more problematic are other areas such as television, libraries and art galleries. As Throsby notes, 'in any definitional exercise involving the arts, there are going to be difficult decisions as to inclusion or exclusion, and that no boundary line around the arts is ever going to be watertight'.3
Subject to two exceptions, this paper adopts the classification system used by the Australian Bureau of Statistics in its publication Cultural Funding by Government. The ABS classifies 'cultural activities' into two major groups: 'the arts' and 'heritage'. In our definition of the arts, we have included all of the ABS 'arts' categories except for 'radio and television services'; and we have excluded all of the ABS 'heritage' categories except for 'art museums'. The 'heritage' categories that have been excluded are: 'other museums', 'environmental heritage', 'libraries', and 'archives'.
Funding of the arts by local government is not discussed in this paper as there is limited information available. It is, however, a major funding source. In 2008/09, local government in NSW contributed $29 million for art museums, $37 million for
1 Legislative Assembly, Standing Committee on Public Works, Report on The Development of
Arts and Cultural Infrastructure Outside the Sydney CBD, NSW Parliament, June 2010.
2 Arts Queensland and the Centre for Social Impact, Arts Plus: New Models, New Money: A
Foundation for the Artist, Queensland Government, 2010.
3 D Throsby, Public Funding of the Arts in Australia – 1900 to 2000, in Australian Bureau of
Statistics, Year Book Australia, 2001.

NSW Parliamentary Library Research Service
2
performing arts, and $67 million for 'cultural or arts services'.4 By way of comparison, in the same year the NSW Government spent $34 million on art museums and $72 million on performing arts and their venues. 2. NSW GOVERNMENT: FUNDING STREAMS 2.1 Overview of funding streams Funding of the arts is primarily administered by Arts NSW, which is now a division of Communities NSW.5 The arts are funded through a number of different funding streams. First, annual allocations are made to three statutory arts institutions, which form part of the eight 'State cultural institutions'. Second, Arts NSW makes grants to organisations and individuals, primarily under the Arts Funding Program. Third, funds are provided for maintaining and upgrading state-owned properties that are occupied or used by arts organisations. Fourth, the NSW Government provides incentives to attract major screen projects to NSW. 2.2 Funding of key institutions The three statutory arts institutions that receive annual allocations from the NSW Government are: the Sydney Opera House, the Art Gallery of NSW and Screen NSW (formerly known as the NSW Film and Television Office). In 2008/09, these institutions received total funding of $81 million: $45 million for the Sydney Opera House, $28 million for the Art Gallery of NSW, and $9 million for Screen NSW. Sydney Opera House: Over the past nine years, total contributions to the Opera House by the NSW Government have fluctuated, mainly as a result of changes in capital grants. Operating grants have remained fairly constant over the years, although it is worth noting that operating grants for the past three years have been at least $1 million lower than the operating grant made in 2000/01 (which, in real terms, represents a decline in operating grants). In 2008/09, the operating grant of $14.4 million represented 18 percent of revenue in that year.6 Table 1: Sydney Opera House funding, 2000/01 to 2008/09 ($million)7
00/01 01/02 02/03 03/04 04/05 05/06 06/07 07/08 08/09
Operating grants 15.6 15.8 17.9 21.7 14.1 15.6 13.1 14.4 14.4
Capital grants 13.1 49.3 13.7 31.5 37.5 52.7 50.5 6.9 30.4
Total grants 28.7 59.2 31.5 53.2 51.6 68.3 63.7 21.4 44.8
4 ABS, Cultural Funding by Government, 2008-09, Table 5. Note that the ABS warns that the
local government estimates 'should be interpreted with caution'.
5 From 2006 to 2009 Arts NSW was part of the Department of the Arts, Sports and Recreation.
6 Sydney Opera House, 2008/09 Annual Report, p37.
7 Sydney Opera House Annual Reports: 2008/09, p53; 2007/2008, p47; 2006/07, p44;
2004/05, p43; 2002/03, p37;41, 2000/01, p53.
Arts Funding in NSW
3
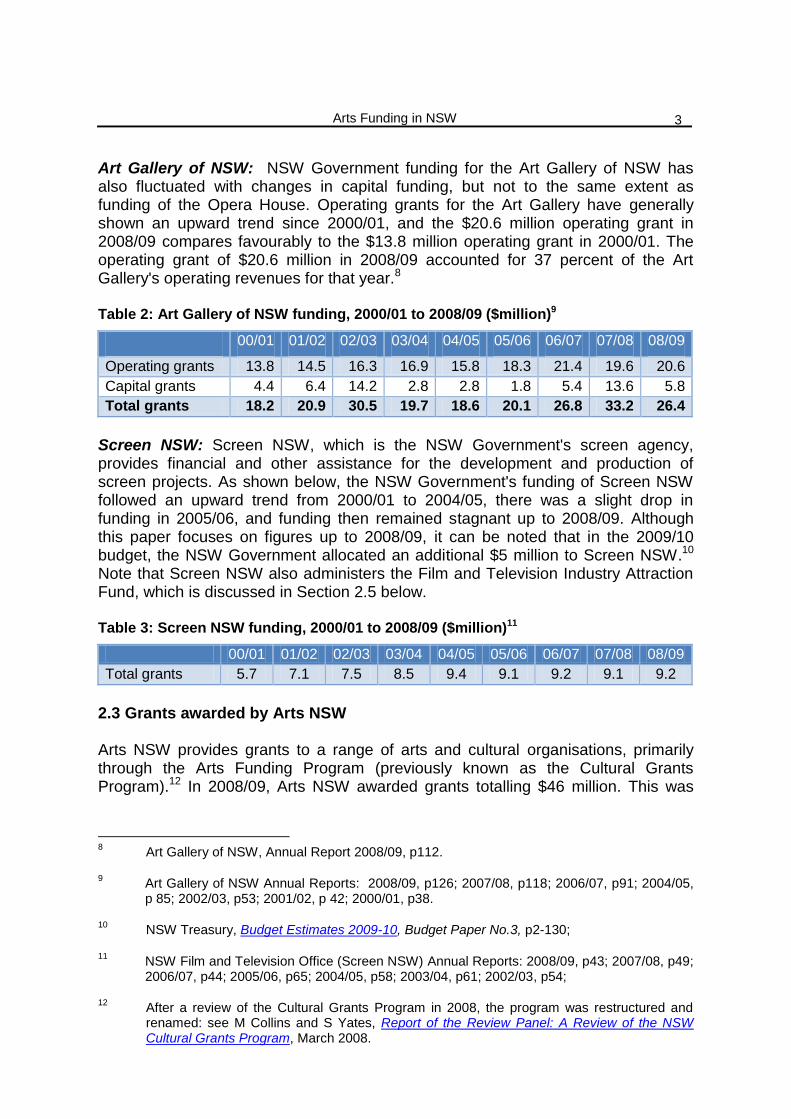
Art Gallery of NSW: NSW Government funding for the Art Gallery of NSW has also fluctuated with changes in capital funding, but not to the same extent as funding of the Opera House. Operating grants for the Art Gallery have generally shown an upward trend since 2000/01, and the $20.6 million operating grant in 2008/09 compares favourably to the $13.8 million operating grant in 2000/01. The operating grant of $20.6 million in 2008/09 accounted for 37 percent of the Art Gallery's operating revenues for that year.8 Table 2: Art Gallery of NSW funding, 2000/01 to 2008/09 ($million)9
00/01 01/02 02/03 03/04 04/05 05/06 06/07 07/08 08/09
Operating grants 13.8 14.5 16.3 16.9 15.8 18.3 21.4 19.6 20.6
Capital grants 4.4 6.4 14.2 2.8 2.8 1.8 5.4 13.6 5.8
Total grants 18.2 20.9 30.5 19.7 18.6 20.1 26.8 33.2 26.4
Screen NSW: Screen NSW, which is the NSW Government's screen agency, provides financial and other assistance for the development and production of screen projects. As shown below, the NSW Government's funding of Screen NSW followed an upward trend from 2000/01 to 2004/05, there was a slight drop in funding in 2005/06, and funding then remained stagnant up to 2008/09. Although this paper focuses on figures up to 2008/09, it can be noted that in the 2009/10 budget, the NSW Government allocated an additional $5 million to Screen NSW.10 Note that Screen NSW also administers the Film and Television Industry Attraction Fund, which is discussed in Section 2.5 below. Table 3: Screen NSW funding, 2000/01 to 2008/09 ($million)11
00/01 01/02 02/03 03/04 04/05 05/06 06/07 07/08 08/09
Total grants 5.7 7.1 7.5 8.5 9.4 9.1 9.2 9.1 9.2
2.3 Grants awarded by Arts NSW Arts NSW provides grants to a range of arts and cultural organisations, primarily through the Arts Funding Program (previously known as the Cultural Grants Program).12 In 2008/09, Arts NSW awarded grants totalling $46 million. This was
8 Art Gallery of NSW, Annual Report 2008/09, p112.
9 Art Gallery of NSW Annual Reports: 2008/09, p126; 2007/08, p118; 2006/07, p91; 2004/05,
p 85; 2002/03, p53; 2001/02, p 42; 2000/01, p38.
10 NSW Treasury, Budget Estimates 2009-10, Budget Paper No.3, p2-130;
11 NSW Film and Television Office (Screen NSW) Annual Reports: 2008/09, p43; 2007/08, p49;
2006/07, p44; 2005/06, p65; 2004/05, p58; 2003/04, p61; 2002/03, p54;
12 After a review of the Cultural Grants Program in 2008, the program was restructured and
renamed: see M Collins and S Yates, Report of the Review Panel: A Review of the NSW Cultural Grants Program, March 2008.

NSW Parliamentary Library Research Service
4
slightly lower than the figure for 2007/08 ($48 million), but higher than total grants awarded in 2006/07 ($39 million) and 2005/06 ($35 million). In 2008/09, the total figure was made up of $35.1 million for the Arts Funding Program, $6.4 million for 'arts development initiatives' and $4.3 million for the Sydney Festival. The table below shows a breakdown of the $45.9 million in funding by type of grant. The top three grant types are explained below.13 Table 4: Arts NSW funding by type of grant, 2008/0914
Type Amount ($000) % of Grants
Negotiated 27,913 60.8
Program 12,482 27.2
Project 4,146 9.0
ConnectEd 567 1.2
Premier's Literary Awards 290 0.6
Fellowships and Scholarships 212 0.5
Indigenous Initiatives 195 0.4
Premier's History Awards 75 0.2
Total 45,881 100
Negotiated funding is available to the large established arts organisations, usually as triennial or quadrennial funding. These organisations do not need to apply for funding on a competitive basis. In 2008/09, the Sydney Festival was the largest recipient of negotiated funding ($4.3 million for the 2009 festival).15 Other major recipients included the Museum of Contemporary Art ($3.5 million), the Sydney Symphony Orchestra ($3 million), and Opera Australia ($2.2 million). Program funding on a triennial basis is available to organisations that are considered to be central to the cultural life of NSW. Program funding on an annual basis is available to all other organisations, as a contribution to the organisation's costs of delivering its main program of arts and cultural activities. In 2008/09, major recipients of program funding included CarriageWorks ($1 million), Performance Space ($0.8 million) and Penrith Performing and Visual Arts ($0.7 million).16 Project funding is available to organisations and individuals for one-off or time limited projects, and for a range of purposes including capital infrastructure, creation and presentation of arts and cultural work, performing arts touring, and strategic industry development. In 2008/09, some of the major recipients were the National
13
These explanations are sourced from Arts NSW, Arts Funding Program Guidelines, [Online]
14 Department of the Arts, Sports and Recreation, Annual Report 2008/09, p142-153
15 Department of the Arts, Sports and Recreation, Annual Report 2008/09, p144-145.
16 Department of the Arts, Sports and Recreation, Annual Report 2008/09, p146ff.

Arts Funding in NSW
5
Aboriginal Islander Skills Development Association ($370,000), The Bell Shakespeare Company ($350,000) and the Biennale of Sydney ($150,000).17 As shown in the Table below, in 2008/09, arts funding for regional NSW amounted to almost $7 million, which represented about 15% of total funds awarded in that year.18 This included $1.8 million for Regional Arts NSW and the State's 13 Regional Arts Boards; and $200,000 for the Country Arts Support Program, which is a small grants program. It is worth noting here that a recent NSW Parliamentary Committee report recommended that 'arts and cultural funding outside the Sydney CBD and in particular in regional areas be substantially increased'.19 Table 5: Funds awarded to certain regions and groups, 2008/0920
Region/Group Amount ($000)
Regional Arts Funding 6,968
Funding for Western Sydney 3,479
Funding for culturally and linguistically diverse groups 3,140
Funding for Indigenous arts 1,190
Funding for child and youth arts 532
The NSW Government's new Aboriginal Arts and Culture Strategy 2010 proposes to increase funding for indigenous arts. The Strategy recognises that ' Aboriginal organisations have had limited success in accessing Arts NSW’s funding in recent years'; and it states that 'Arts NSW will aim to deliver increased funding to Aboriginal arts and cultural programs and projects by 2014'. 2.4 Managed properties The NSW Government owns a number of properties that are used to accommodate arts organisations. The Government allocates funds every year for maintaining and upgrading these properties. In 2008/09, the NSW budget provided around $7.5 million for this purpose, including almost $3 million for capital expenditure.21 Some of the properties currently managed by the NSW Government include:
The Gunnery in Woolloomooloo, which has a number of studios for visual artists and houses Artspace, the Biennale of Sydney and others;
Wharf 4/5 in Walsh Bay, which accommodates the Sydney Theatre Company, Bangarra Dance Theatre and others); and
17
Department of the Arts, Sports and Recreation, Annual Report 2008/09, p151ff.
18 Department of the Arts, Sports and Recreation, Annual Report 2008/09, p33.
19 Standing Committee on Public Works, n1, p36 (Rec7)
20 Department of the Arts, Sports and Recreation, Annual Report 2008/09, p33
21 NSW Treasury, Budget Estimates 2008/09, Budget Paper No.3, p17-59.
NSW Parliamentary Library Research Service
6
CarriageWorks at Eveleigh, which is a multi-venue centre that has a number of resident organisations including PerformanceSpace.
2.5 Incentives for major screen projects The NSW Government offers tax and other incentives to attract major screen projects to NSW. The incentives, which are available under the Film and Television Industry Attraction Fund, are to be determined on a case-by-case basis but could include payroll tax rebates, rebates of post-production digital effects expenditure, and discretionary or in kind assistance. In June 2010, the Government announced that an additional $20 million would be allocated to these incentives.22
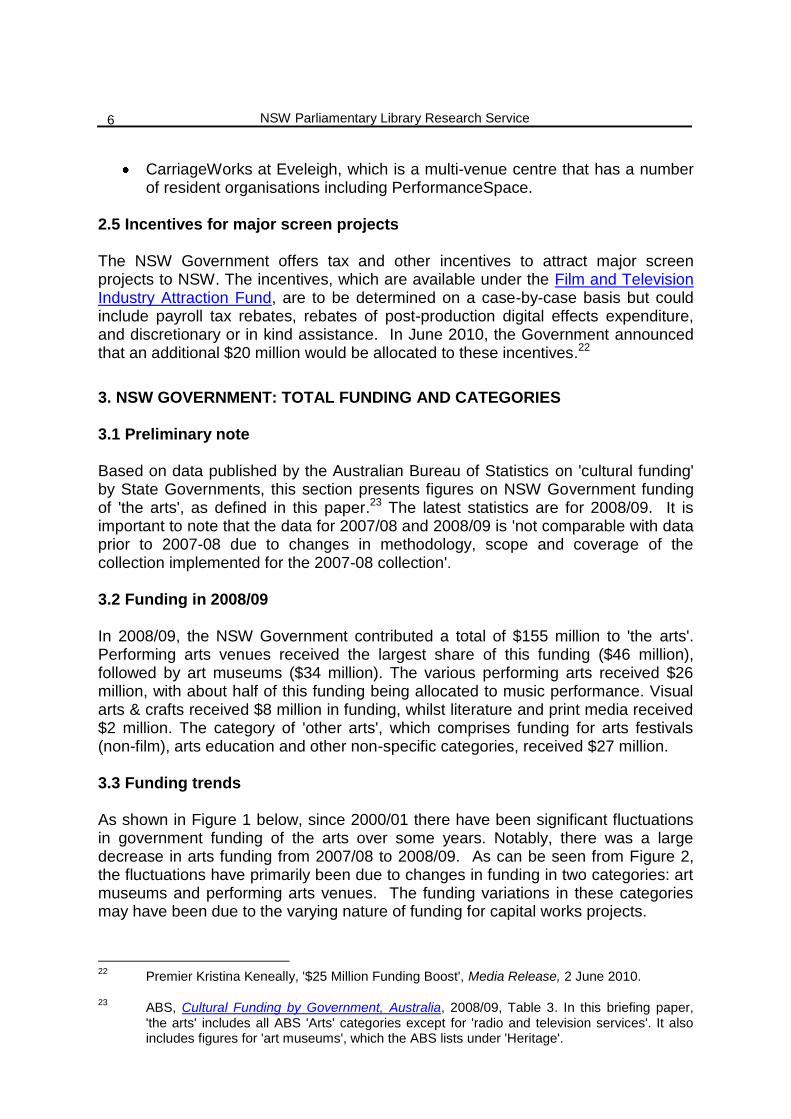
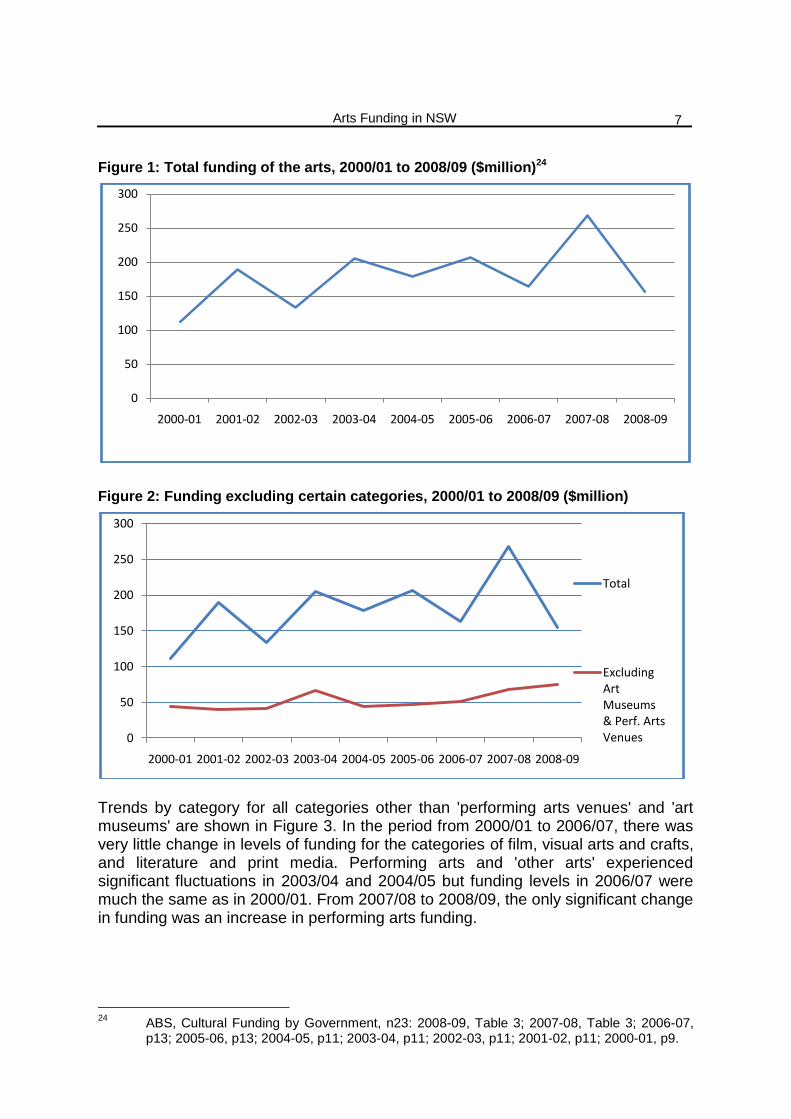
3. NSW GOVERNMENT: TOTAL FUNDING AND CATEGORIES 3.1 Preliminary note Based on data published by the Australian Bureau of Statistics on 'cultural funding' by State Governments, this section presents figures on NSW Government funding of 'the arts', as defined in this paper.23 The latest statistics are for 2008/09. It is important to note that the data for 2007/08 and 2008/09 is 'not comparable with data prior to 2007-08 due to changes in methodology, scope and coverage of the collection implemented for the 2007-08 collection'. 3.2 Funding in 2008/09 In 2008/09, the NSW Government contributed a total of $155 million to 'the arts'. Performing arts venues received the largest share of this funding ($46 million), followed by art museums ($34 million). The various performing arts received $26 million, with about half of this funding being allocated to music performance. Visual arts & crafts received $8 million in funding, whilst literature and print media received $2 million. The category of 'other arts', which comprises funding for arts festivals (non-film), arts education and other non-specific categories, received $27 million. 3.3 Funding trends As shown in Figure 1 below, since 2000/01 there have been significant fluctuations in government funding of the arts over some years. Notably, there was a large decrease in arts funding from 2007/08 to 2008/09. As can be seen from Figure 2, the fluctuations have primarily been due to changes in funding in two categories: art museums and performing arts venues. The funding variations in these categories may have been due to the varying nature of funding for capital works projects.
22
Premier Kristina Keneally, '$25 Million Funding Boost', Media Release, 2 June 2010.
23 ABS, Cultural Funding by Government, Australia, 2008/09, Table 3. In this briefing paper,
'the arts' includes all ABS 'Arts' categories except for 'radio and television services'. It also includes figures for 'art museums', which the ABS lists under 'Heritage'.
Arts Funding in NSW
7
Figure 1: Total funding of the arts, 2000/01 to 2008/09 ($million)24
Figure 2: Funding excluding certain categories, 2000/01 to 2008/09 ($million)
Trends by category for all categories other than 'performing arts venues' and 'art museums' are shown in Figure 3. In the period from 2000/01 to 2006/07, there was very little change in levels of funding for the categories of film, visual arts and crafts, and literature and print media. Performing arts and 'other arts' experienced significant fluctuations in 2003/04 and 2004/05 but funding levels in 2006/07 were much the same as in 2000/01. From 2007/08 to 2008/09, the only significant change in funding was an increase in performing arts funding.
24
ABS, Cultural Funding by Government, n23: 2008-09, Table 3; 2007-08, Table 3; 2006-07, p13; 2005-06, p13; 2004-05, p11; 2003-04, p11; 2002-03, p11; 2001-02, p11; 2000-01, p9.
0
50
100
150
200
250
300
2000-01 2001-02 2002-03 2003-04 2004-05 2005-06 2006-07 2007-08 2008-09
0
50
100
150
200
250
300
2000-01 2001-02 2002-03 2003-04 2004-05 2005-06 2006-07 2007-08 2008-09
Total
Excluding Art Museums & Perf. Arts Venues

NSW Parliamentary Library Research Service
8
Figure 3: Funding by selected categories, 2000/01 to 2008/09 ($million)25
4. COMPARISONS WITH OTHER STATE GOVERNMENTS
4.1 Preliminary note Based on data published by the Australian Bureau of Statistics on 'cultural funding' by State Governments, this section presents comparisons of State Government funding of 'the arts'.26 It is important to note that comparisons are only provided in relation to 'arts funding' as defined in this paper. Comparisons are not provided in relation to the broader area of 'cultural funding', which includes funding of libraries, museums, environmental heritage, and archives.27 The latest statistics are for 2008/09. As noted above, the figures for 2007/08 and 2008/09 are not comparable with earlier years. In addition, the ABS explanatory notes state that:
Care should be taken when comparing values between states and territories for some categories of funding as the funding provided by state and territory governments may vary according to the administrative arrangements existing in the respective states and territories.
4.2 Total arts funding As shown below, of all States, the NSW Government has had the highest levels of arts funding in three of the last five years. In 2006/07, the Victorian Government made a larger contribution to the arts than the NSW Government (by $46 million),
25
ABS, Cultural Funding by Government, n24.
26 ABS, Cultural Funding by Government, Australia, 2008/09. In this briefing paper, 'the arts'
includes all ABS 'Arts' categories except for 'radio and television services'. It also includes figures for 'art museums', which the ABS lists under 'Heritage'.
27 For the recent debate on this distinction, see NSWPD, 20 October 2010.
0
5
10
15
20
25
30
2000-01 2001-02 2002-03 2003-04 2004-05 2005-06 2006-07 2007-08 2008-09
Literature & Print Media
Performing Arts
Visual Arts & Crafts
Film
Other
Arts Funding in NSW
9
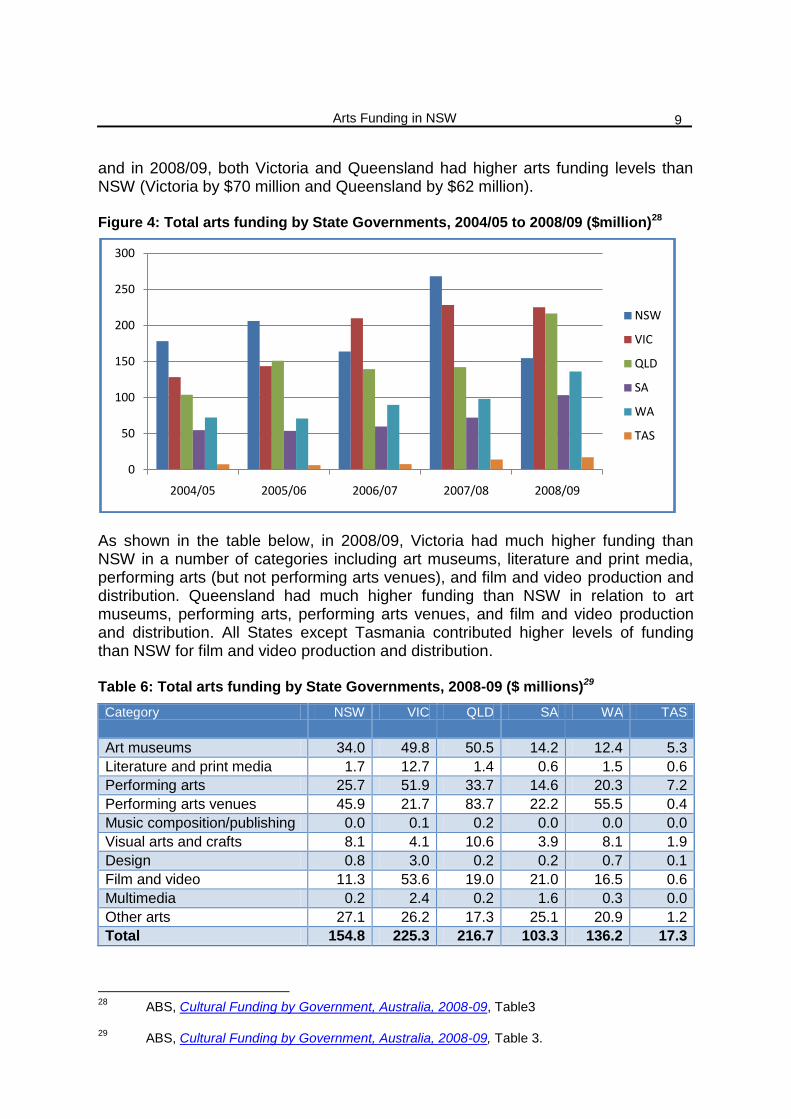
and in 2008/09, both Victoria and Queensland had higher arts funding levels than NSW (Victoria by $70 million and Queensland by $62 million). Figure 4: Total arts funding by State Governments, 2004/05 to 2008/09 ($million)28
As shown in the table below, in 2008/09, Victoria had much higher funding than NSW in a number of categories including art museums, literature and print media, performing arts (but not performing arts venues), and film and video production and distribution. Queensland had much higher funding than NSW in relation to art museums, performing arts, performing arts venues, and film and video production and distribution. All States except Tasmania contributed higher levels of funding than NSW for film and video production and distribution. Table 6: Total arts funding by State Governments, 2008-09 ($ millions)29
Category NSW VIC QLD SA WA TAS
Art museums 34.0 49.8 50.5 14.2 12.4 5.3
Literature and print media 1.7 12.7 1.4 0.6 1.5 0.6
Performing arts 25.7 51.9 33.7 14.6 20.3 7.2
Performing arts venues 45.9 21.7 83.7 22.2 55.5 0.4
Music composition/publishing 0.0 0.1 0.2 0.0 0.0 0.0
Visual arts and crafts 8.1 4.1 10.6 3.9 8.1 1.9
Design 0.8 3.0 0.2 0.2 0.7 0.1
Film and video 11.3 53.6 19.0 21.0 16.5 0.6
Multimedia 0.2 2.4 0.2 1.6 0.3 0.0
Other arts 27.1 26.2 17.3 25.1 20.9 1.2
Total 154.8 225.3 216.7 103.3 136.2 17.3
28
ABS, Cultural Funding by Government, Australia, 2008-09, Table3
29 ABS, Cultural Funding by Government, Australia, 2008-09, Table 3.
0
50
100
150
200
250
300
2004/05 2005/06 2006/07 2007/08 2008/09
NSW
VIC
QLD
SA
WA
TAS
NSW Parliamentary Library Research Service
10
4.3 Per capita arts funding
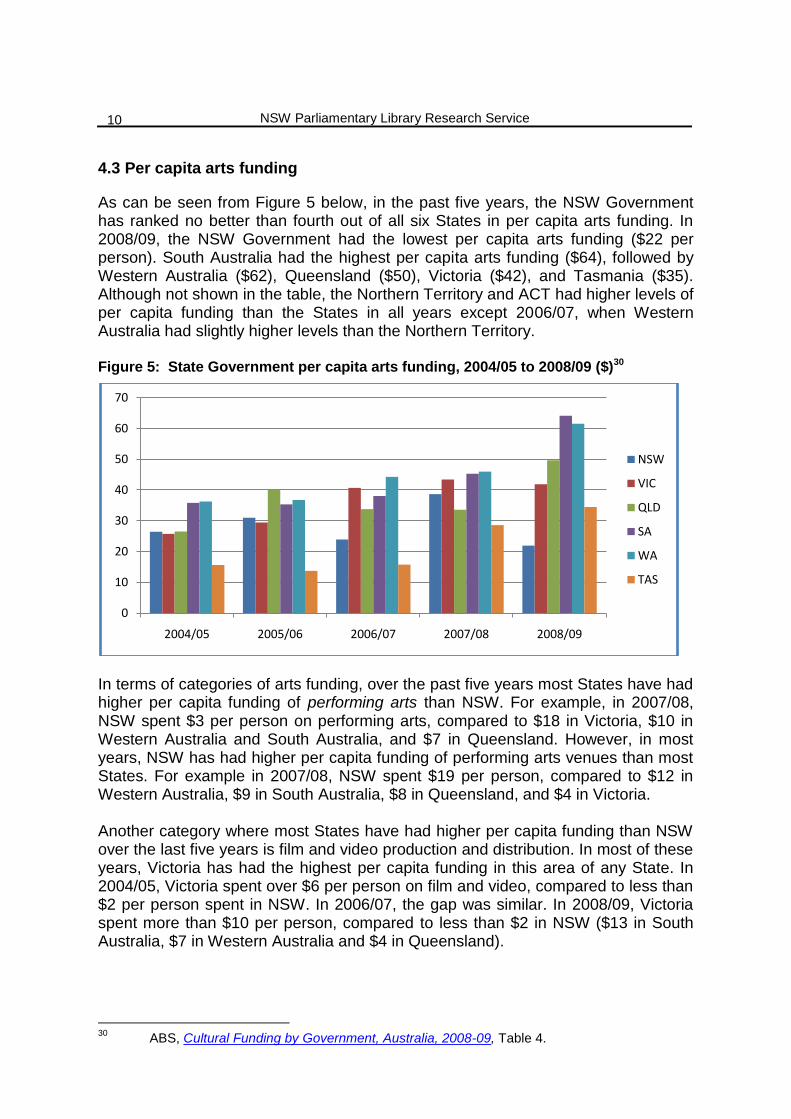
As can be seen from Figure 5 below, in the past five years, the NSW Government has ranked no better than fourth out of all six States in per capita arts funding. In 2008/09, the NSW Government had the lowest per capita arts funding ($22 per person). South Australia had the highest per capita arts funding ($64), followed by Western Australia ($62), Queensland ($50), Victoria ($42), and Tasmania ($35). Although not shown in the table, the Northern Territory and ACT had higher levels of per capita funding than the States in all years except 2006/07, when Western Australia had slightly higher levels than the Northern Territory. Figure 5: State Government per capita arts funding, 2004/05 to 2008/09 ($)30
In terms of categories of arts funding, over the past five years most States have had higher per capita funding of performing arts than NSW. For example, in 2007/08, NSW spent $3 per person on performing arts, compared to $18 in Victoria, $10 in Western Australia and South Australia, and $7 in Queensland. However, in most years, NSW has had higher per capita funding of performing arts venues than most States. For example in 2007/08, NSW spent $19 per person, compared to $12 in Western Australia, $9 in South Australia, $8 in Queensland, and $4 in Victoria. Another category where most States have had higher per capita funding than NSW over the last five years is film and video production and distribution. In most of these years, Victoria has had the highest per capita funding in this area of any State. In 2004/05, Victoria spent over $6 per person on film and video, compared to less than $2 per person spent in NSW. In 2006/07, the gap was similar. In 2008/09, Victoria spent more than $10 per person, compared to less than $2 in NSW ($13 in South Australia, $7 in Western Australia and $4 in Queensland).
30
ABS, Cultural Funding by Government, Australia, 2008-09, Table 4.
0
10
20
30
40
50
60
70
2004/05 2005/06 2006/07 2007/08 2008/09
NSW
VIC
QLD
SA
WA
TAS

Arts Funding in NSW
11
5. AUSTRALIAN GOVERNMENT: FUNDING STREAMS 5.1 Overview of funding streams At the federal level, the Department of the Prime Minister and Cabinet has responsibility for the arts.31 The arts are funded through a number of different funding streams. Annual funding allocations are made to the two key arts funding bodies - the Australia Council for the Arts and Screen Australia – as well as to other national arts organisations. In addition, the Department of Prime Minister and Cabinet administers various arts funding programs. The Government also offers tax incentives to encourage screen production in Australia. 5.2 Funding of key arts organisations In 2008/09, the annual allocations to the two key arts funding bodies and other key national arts organisations were as follows:
The Australia Council for the Arts received funding of $173 million;
Screen Australia received $103 million;
The National Gallery of Australia received $78 million, including $33 million for a building extension project;
The National Film and Sound Archive received $25 million; and
The Australian Film, Television and Radio School received $23 million.32 5.3 Australia Council Grants The Australia Council for the Arts provides funding through a number of regular grant categories, as well as by means of one-off, or time-limited, initiatives. In addition to its own initiatives, the Australia Council administers funding for some Australian Government initiatives, which receive an allocation in the federal budget. The Australia Council has seven boards which assess applications for grants and initiatives. The board titles are: Major Performing Arts; Dance; Literature; Music; Theatre; Visual Arts; and Aboriginal and Torres Strait Islander Arts. In 2008/09, the Australia Council provided funding of $175 million to organisations and individuals across Australia.33 More than half of the total funding ($95 million) was provided to the 28 major performing arts companies (some of these are national and others are state-based). The balance of funding included other board
31
Prior to 2010, the Arts had been the responsibility of different departments, most recently the Department of the Environment, Water, Heritage and the Arts.
32 Australia Council for the Arts, Annual Report 2008/09, p86; Screen Australia, Annual Report
2008/09, p133; National Gallery of Australia, Annual Report 2008/09, title page and p99; National Film and Sound Archive, Annual Report 2008/09, p145; Australian Film, Television and Radio School, Annual Report 2008/09, p82.
33 Australia Council for the Arts, Annual Report 2008-09, p13
NSW Parliamentary Library Research Service
12
grants ($33 million), grants to 'key arts organisations' ($21 million), Australian Government initiatives ($17 million) and Australia Council initiatives ($9 million).34
The performing arts received the vast majority of total funding. Of this funding, music received the highest amount ($82.5 million), which included $47 million for orchestras and $24 million for opera; while dance received $22 million and theatre received $20 million. Of other art-forms, visual arts received $16 million and literature received $8 million. Inter-arts, which involves the development of creative work through inter-disciplinary collaborations, received $17 million.
Of total funding, $42.5 million went to national organisations (e.g. Opera Australia). Organisations and individuals in NSW received a total of $41 million, which was the largest share of all States.35 The categories of NSW funding are shown below. Table 7: Australia Council funding in NSW by category, 2008/09
Category Amount ($million)
Music 12.7
Dance 8.8
Theatre 6.1
Visual Arts 4.9
Cross-art form 4.7
Literature 2.2
General 1.7
NSW has consistently received the largest amount of Australia Council funding. As shown in the Table below, in the first half of the decade, NSW received around 20 percent of total funding. After the Australia Council restructured in 2006, NSW began to receive a larger proportion of the funding, with 36 percent in 2006/07 and 39 percent in 2007/08. In 2008/09, the NSW share fell back to 23 percent. Table 8: Australia Council funding awarded in NSW, 2000/01 to 2008/09 ($million)36
00/01 01/02 02/03 03/04 04/05 05/06 06/07 07/08 08/09
NSW 16.8 23.4 23 27.8 25.9 34.8 56.19 57.5 41
Share 21% 20% 18% 21% 21% 24% 36% 39% 23%
34
Australia Council for the Arts, Annual Report 2008-09, p88. Note that there are 140 small to medium 'key organisations' funded on a multi-year basis by the art form boards.
35 Australia Council for the Arts, Annual Report 2008-09, p15
36 Australia Council for the Arts Annual Reports: 2008-09, p15; 2007-08, p25; 2006-07, p24;
2005-06, p84-85; 2004-2005, p68-69; 2003-04, p58-59; 2002-03, p50-51; 2001-02, p124; 2000-01, p138-139.
Arts Funding in NSW
13
5.4 The Department's funding programs The Department of Prime Minister and Cabinet is responsible for a number of different arts and cultural funding programs.37 For example, in 2008/09, $24 million in funding was provided for indigenous arts and culture; and $56 million was spent on the Cultural Development Programme, which included funding for:
Seven national performing arts training organisations including the Australian Ballet School and National Institute of Dramatic Art;
Touring programs including the Contemporary Music Touring Program, Playing Australia (a touring program for performing arts), and Visions of
Australia (a touring program for Australian cultural material);
The Festivals Australia program, which funds regional and community festivals to present a new or special cultural activity;
The Regional Arts Fund, which supports cultural development in communities across regional and remote areas.38
5.5 The Australian Screen Production Incentive While this paper focuses on direct funding of the arts, it is noted that the Australian Government offers significant tax incentives in relation to screen production in Australia. The Australian Screen Production Incentive has three streams:
The Producer Offset, to encourage production of Australian film projects;
The Location Offset, a 15 percent rebate which supports the production of large-budget film and television projects shot in Australia; and
The PDV Offset, a 15 percent rebate which supports work on post, digital and visual effects production, regardless of where a project is shot.
6. AUSTRALIAN GOVERNMENT: TOTAL FUNDING AND CATEGORIES 6.1 Preliminary note Based on data published by the Australian Bureau of Statistics on 'cultural funding' by governments, this section presents figures on the Australian Government's funding of 'the arts', as defined in this paper.39 The latest statistics are for 2008/09. As noted earlier, the ABS warns that data for 2007/08 and 2008/09 is 'not comparable with data prior to 2007-08 due to changes in methodology, scope and coverage of the collection implemented for the 2007-08 collection'.
37
Department of Prime Minister and Cabinet, Arts and Culture – Grants and Funding,[Online]
38 Department of the Environment, Water, Heritage and the Arts, Annual Report 2008-09, p192-
196, p314-315, p326.
39 In this paper, 'the arts' includes all ABS 'Arts' categories except for 'radio and television
services'. It also includes figures for 'art museums', which the ABS lists under 'Heritage'.
NSW Parliamentary Library Research Service
14
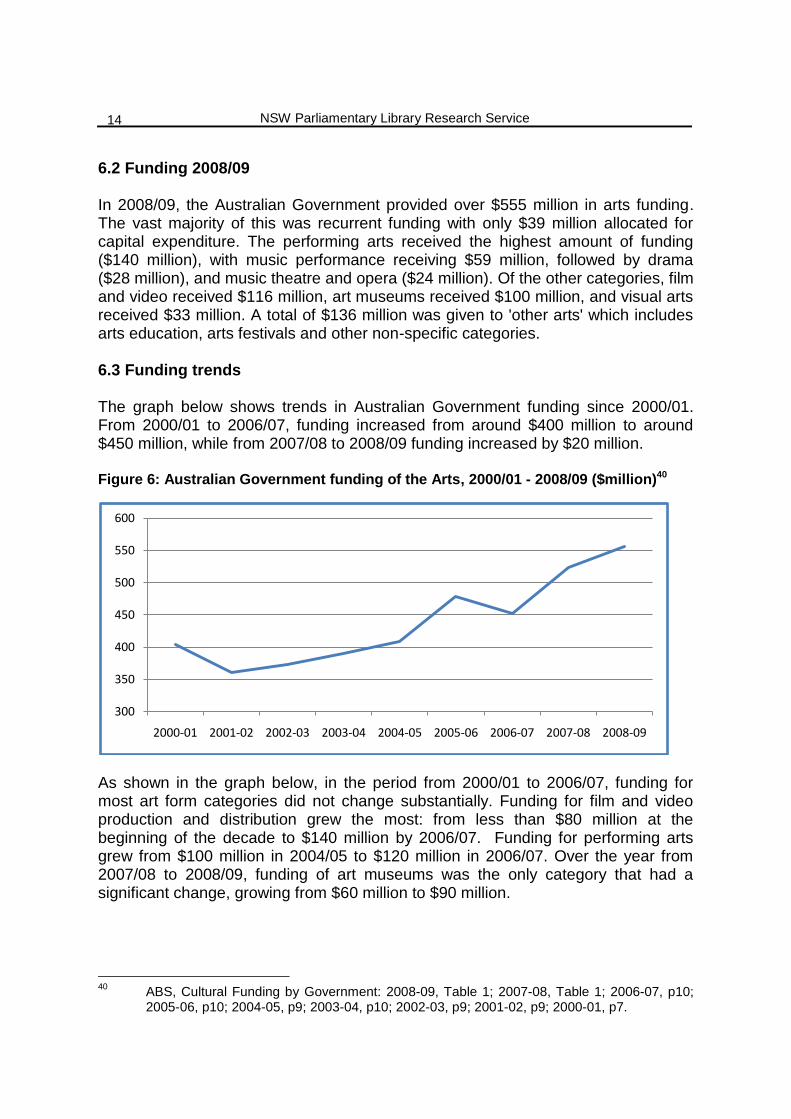
6.2 Funding 2008/09 In 2008/09, the Australian Government provided over $555 million in arts funding. The vast majority of this was recurrent funding with only $39 million allocated for capital expenditure. The performing arts received the highest amount of funding ($140 million), with music performance receiving $59 million, followed by drama ($28 million), and music theatre and opera ($24 million). Of the other categories, film and video received $116 million, art museums received $100 million, and visual arts received $33 million. A total of $136 million was given to 'other arts' which includes arts education, arts festivals and other non-specific categories. 6.3 Funding trends The graph below shows trends in Australian Government funding since 2000/01. From 2000/01 to 2006/07, funding increased from around $400 million to around $450 million, while from 2007/08 to 2008/09 funding increased by $20 million. Figure 6: Australian Government funding of the Arts, 2000/01 - 2008/09 ($million)40
As shown in the graph below, in the period from 2000/01 to 2006/07, funding for most art form categories did not change substantially. Funding for film and video production and distribution grew the most: from less than $80 million at the beginning of the decade to $140 million by 2006/07. Funding for performing arts grew from $100 million in 2004/05 to $120 million in 2006/07. Over the year from 2007/08 to 2008/09, funding of art museums was the only category that had a significant change, growing from $60 million to $90 million.
40
ABS, Cultural Funding by Government: 2008-09, Table 1; 2007-08, Table 1; 2006-07, p10; 2005-06, p10; 2004-05, p9; 2003-04, p10; 2002-03, p9; 2001-02, p9; 2000-01, p7.
300
350
400
450
500
550
600
2000-01 2001-02 2002-03 2003-04 2004-05 2005-06 2006-07 2007-08 2008-09

Arts Funding in NSW
15
Figure 7: Trends in funding by category, 2000/01-2008/09 ($million)41
7. COMPARISONS WITH OTHER COUNTRIES 7.1 Difficulties in making comparisons There are a number of difficulties in making cross-country comparisons of government funding of the arts. A 2004 paper by the Australia Council for the Arts discussed these difficulties and stated in summary:
Despite significant advances in the production of cultural statistics, our ability to make intercountry comparisons of cultural data is still limited. Data are generated in different ways and for different reasons. Differences in social and institutional environments between countries are difficult or impossible to account for. Structural differences between countries can significantly bias data. Many of these problems are present even in cross-country data that are generated from the same survey.42
The paper referred in particular to comments by academics about the dangers of relying upon league tables in this area: i.e. tables that rank countries by some chosen variable such as per capita government arts expenditure.43 7.2 Reports containing comparisons As a follow up to an earlier study, in 2000 the International Arts Bureau published a report for the Arts Council Ireland entitled A comparative study of levels of arts expenditure in selected countries and regions. The study examined public
41
ABS, Cultural Funding by Government, n40.
42 Australia Council for the Arts, Making Cross-country Comparisons of Cultural Statistics:
Problems and Solutions, Working Paper 2, October 2004, p11.
43 Australia Council for the Arts, n42, p8.
0
20
40
60
80
100
120
140
160
2000/012001/022002/032003/042004/052005/062006/072007/082008/09
Art Museums
Literature & Print Media
Performing Arts
Visual Arts & Crafts
Film & Video
Other Arts
NSW Parliamentary Library Research Service
16
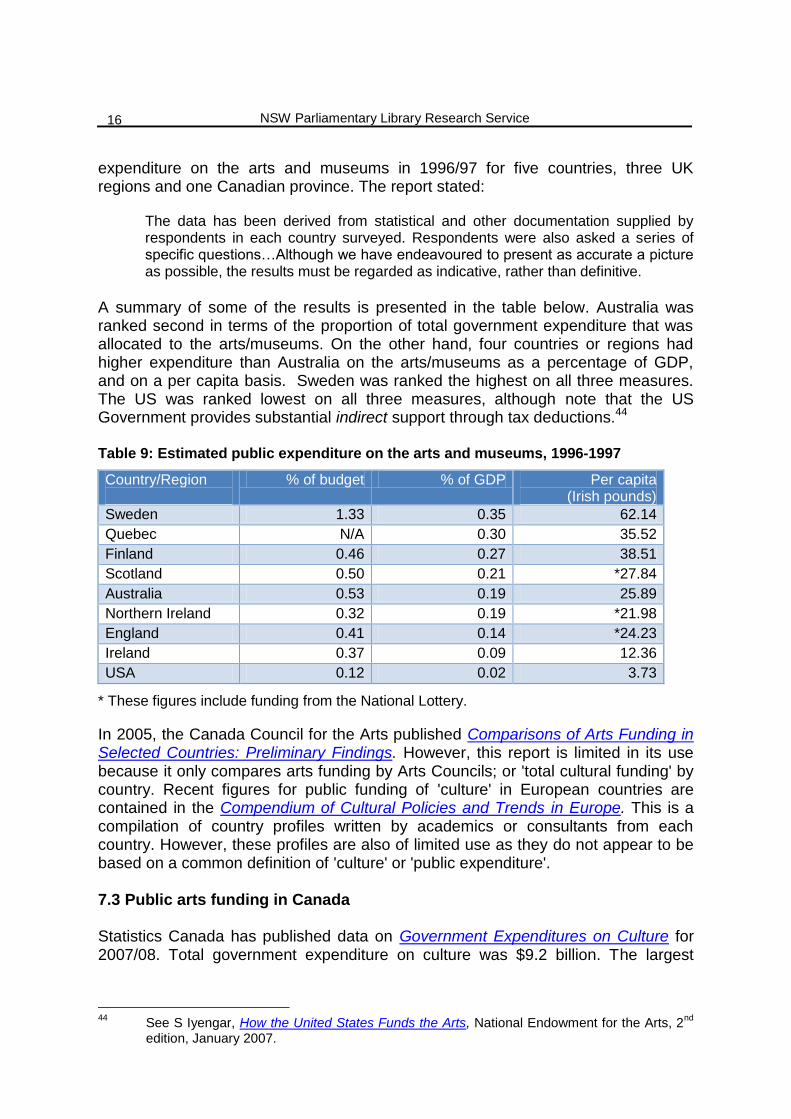
expenditure on the arts and museums in 1996/97 for five countries, three UK regions and one Canadian province. The report stated:
The data has been derived from statistical and other documentation supplied by respondents in each country surveyed. Respondents were also asked a series of specific questions…Although we have endeavoured to present as accurate a picture as possible, the results must be regarded as indicative, rather than definitive.
A summary of some of the results is presented in the table below. Australia was ranked second in terms of the proportion of total government expenditure that was allocated to the arts/museums. On the other hand, four countries or regions had higher expenditure than Australia on the arts/museums as a percentage of GDP, and on a per capita basis. Sweden was ranked the highest on all three measures. The US was ranked lowest on all three measures, although note that the US Government provides substantial indirect support through tax deductions.44 Table 9: Estimated public expenditure on the arts and museums, 1996-1997
Country/Region
% of budget % of GDP Per capita (Irish pounds)
Sweden 1.33 0.35 62.14
Quebec N/A 0.30 35.52
Finland 0.46 0.27 38.51
Scotland 0.50 0.21 *27.84
Australia 0.53 0.19 25.89
Northern Ireland 0.32 0.19 *21.98
England 0.41 0.14 *24.23
Ireland 0.37 0.09 12.36
USA 0.12 0.02 3.73
* These figures include funding from the National Lottery.
In 2005, the Canada Council for the Arts published Comparisons of Arts Funding in Selected Countries: Preliminary Findings. However, this report is limited in its use because it only compares arts funding by Arts Councils; or 'total cultural funding' by country. Recent figures for public funding of 'culture' in European countries are contained in the Compendium of Cultural Policies and Trends in Europe. This is a compilation of country profiles written by academics or consultants from each country. However, these profiles are also of limited use as they do not appear to be based on a common definition of 'culture' or 'public expenditure'. 7.3 Public arts funding in Canada Statistics Canada has published data on Government Expenditures on Culture for 2007/08. Total government expenditure on culture was $9.2 billion. The largest
44
See S Iyengar, How the United States Funds the Arts, National Endowment for the Arts, 2nd
edition, January 2007.

Arts Funding in NSW
17
component of this (41%) came from the Federal Government ($3.7 billion). Provincial and territory governments contributed $2.8 billion (31%), and municipal governments spent $2.6 billion (28%). The largest three categories of cultural funding were libraries (30%), heritage resources (22%), and broadcasting (21%). How much of this is arts-related expenditure? A number of categories reported on in the statistics are entirely arts-related and these are shown in the Table below. It can be seen that combined government expenditure in these areas amounted to $1.39 billion. The majority (56%) of this funding came from the Federal Government ($779 million), with the provincial and territory governments contributing $566 million (41%), and municipal governments spending $47 million (3%). Table 10: Total government expenditure, by art categories in 2007/0845
Category
Total funding ($m) Share of funding (%)
Performing arts 510 37
Film and video 447 32
Literary arts 158 11
Arts education 147 11
Visual arts and crafts 99 7
Sound recording 32 2
Total 1,393 100
It is important to note that government expenditure on art museums/galleries is not included in the figures in this Table. This expenditure is counted in 'museums' (an item in 'heritage resources') but there are no separate figures for art museums: total public spending on museums was $923 million. The Table also does not show government expenditure on 'multidisciplinary and other activities' ($1 billion).
Without enough information about arts-specific funding in Canada, it is difficult to make comparisons between Canada and Australia in terms of overall arts funding. It is, however, possible to make some comparisons in relation to certain arts categories. Of course, even in these cases, inter-country differences in compiling data may mean that comparisons are not accurate.
By way of example, in Australia in 2007/08, total government funding of 'performing arts' and 'performing arts venues' was $587 million.46 In Canada, which has a higher population (now around 34 million), total government spending on 'performing arts' was CA$510 million (AU$524 million).47 Similar comparisons can be made between the NSW and provincial governments. Quebec may be a good reference point
45
Statistics Canada, Government Expenditures on Culture: 2007/08, Table 3.
46 Australian Bureau of Statistics, Cultural Funding by Government, Australia, 2007/08, Table 1.
47 Statistics Canada, Government Expenditures on Culture, Table 3.
NSW Parliamentary Library Research Service
18
because it has a similar population to NSW, and it appears to have high levels of public arts funding (see Table 9 above). In 2007/08, the NSW Government spent $149 million on performing arts and their venues, while the Quebec Government contributed CA$133 million for 'performing arts' (AU$137 million). 48 7.4 Public arts funding in the UK The UK Office of National Statistics does not publish data on public funding of the arts and it is therefore difficult to make any comparisons with Australia. Instead a unique feature of UK arts funding is noted: National Lottery Funding. By way of context, the UK Government is responsible for funding arts and culture in England while each of the devolved administrations (the Scottish Government, the Northern Ireland Executive, and the Welsh Assembly Government) is responsible for funding in their regions. In each region, funding of the arts (other than funding of art galleries) has primarily been distributed through Arts Councils, as well as through the UK Film Council and Screen Agencies in each region. The various Arts Councils, and the UK Film Council, are non-departmental public bodies. In addition to receiving annual government grants, the Arts Councils in each of the UK regions, and the UK Film Council, are responsible for making grants out of money raised through the National Lottery. Currently, three 'good causes', namely sports, arts, and heritage, each receive a 16.66 percent share of the Lottery proceeds (there is a proposal to increase these shares to 20 percent).49 In 2008/09, the total amount allocated from the National Lottery Fund to all of the Arts Councils, and to the UK Film Council, was over £200 million.50
8. PRIVATE SECTOR FUNDING OF THE ARTS 8.1 Levels of private sector funding The Australian Business Arts Foundation (AbaF) conducts an annual survey of private sector support for the arts in Australia. This survey adopts a broader definition of 'the arts' than used in this paper: it includes museums, libraries, and television and radio. The latest survey results are for 'the 2008/09 financial and 2009 calendar years'.51 AbaF received responses from 241 participating arts
48
Australian Bureau of Statistics, Cultural Funding by Government, Australia, 2007/08, Table 3; and Statistics Canada, Government Expenditures on Culture, Table 13. Note that in 2008/09, NSW Government funding of performing arts was much lower than in 2007/08: $72 million.
49 Department for Culture, Media and Sport, Consultation on the National Lottery Shares, 2010.
50 This is based on figures shown in the Annual Reviews for each of the Arts Councils, and the
UK Film Council, for 2008/09.
51 AbaF Survey of Private Sector Support, Measuring private sector support for the Arts in
2008/09: Preliminary findings, June 2010

Arts Funding in NSW
19
organisations and it used these to estimate a figure for the whole not-for-profit arts and cultural sector.52 Gifts of property and artworks were not included in the survey. In 2008/09, overall private sector support for the arts in Australia was $212 million, which comprised $101 million in sponsorship and $111 million in donations. Of the States, NSW received the largest share of private sector support ($90 million or 42 percent), followed by Victoria ($61 million or 29 percent). As shown in the Table below, the performing arts received the largest share of private support in NSW (36 percent), followed by art galleries (28 percent) and then arts festivals (19 percent). Of the performing arts, music secured the greatest level of support (35 percent of total support for performing arts), followed by performance arts venues (21 percent), theatre (19 percent), dance (13 percent) and opera (11 percent). Table 11: Private Support in Australia by art category, 2008/0953
Private Support $million % of total
Performing Arts 77 36
Art Galleries 59 28
Arts Festivals 40 19
Museums & Heritage 16 8
Libraries 6 3
Film, TV, Radio & Digital Media 6 3
Community Organisations 3 2
Literature & Print Media 1 <1
Visual Arts, Craft & Design 2 <1
Indigenous Arts 1 <1
Multi-Arts 1 <1
As shown in the Table below, private support for the arts has consistently increased each year since 2001. Over the period from 2001/02 to 2008/09, private support for the arts increased by 90 percent from $112 million to $212 million, which represented an average annual growth rate of 13 percent. Over this period, donations have increased by a larger amount than sponsorship and in three of the last four years the level of donations has exceeded the level of sponsorship. Table 12: Private Support for the Arts, 2001/02 to 2008/09 ($million)54
$ Million 01/02 02/03 03/04 04/05 05/06 06/07 07/08 08/09
Donations 47 57 51 63 87 87 105 111
Sponsorship 64 64 76 75 82 92 99 101
Total 111 121 127 138 169 179 204 212
52
ABaF, 'AbaF survey: Sponsorships and donations healthy despite downturn, Media Release.
53 AbaF Survey, n51, p7.
54 AbaF Survey, n51, p4.
NSW Parliamentary Library Research Service
20
8.2 National measures to promote private support The Australian Government encourages private sector support for the arts through tax deduction schemes. These include:
Register of Cultural Organisations:55 Organisations whose main purpose is the promotion of a cultural activity are eligible for listing on the Register of Cultural Organisations. Tax deductible donations can be made to registered organisations to assist them with a wide range of activities, such as the creation of a new theatrical work, or the building of a community arts centre.
Cultural Gifts Program:56 The Cultural Gifts Program was set up to promote the giving of culturally significant works to public libraries, museums and art galleries. The market value of a culturally significant gift is fully tax deductible. Since its inception in 1978, over $608 million worth of items have been donated under the Cultural Gifts Program
The Australian Government also established the Australian Business Arts Foundation (AbaF) to promote private support for the arts. AbaF is funded by the Australian Government ($1.6 million in 2008/09).57 It acts as an intermediary between businesses and the arts community, to facilitate sponsorships, donations, and business volunteering. In relation to donations, AbaF administers the Australia Cultural Fund, which allows donors to make tax deductible donations to an art organisation or artist registered with AbaF. In 2008/09, AbaF added more than $5 million to the arts sector, including new arts partnerships valued at $2.7 million and over $1 million in donations to the Australia Cultural Fund.58 The Australia Council has set up a similar initiative to grow cultural philanthropy, which is known as Artsupport Australia. Artsupport Australia advises the cultural sector on philanthropy, it works with philanthropists, and it provides guidance to the corporate sector about including arts in their donations programs.59 In 2008/09, Artsupport facilitated $7 million in donations to artists and art organisations, and over six years it has facilitated $35 million in donations.60
55
Department of Prime Minister and Cabinet, Register of Cultural Organisations, [Online]
56 Department of Prime Minister and Cabinet, Cultural Gifts Program, [Online]
57 AbaF, Financial Statements for the year ended 30 June 2009, p22. Note that AbaF also
received grants from some State Government arts organisations and from other sources.
58 AbaF, n57, p3.
59 Australia Council for the Arts, Artsupport Australia, [Online].
60 Australia Council for the Arts, Annual Report 2008-09, p54.
Arts Funding in NSW
21
8.3 Arts Partnership Funds in other States Three States, South Australia, Tasmania and Western Australia, have each established a Premier's Arts Partnership Fund, which is a partnership between government, a corporate sponsor, and AbaF. Artists and smaller arts organisations that attract new sponsorship from a small business can achieve a matching grant from the Fund. For artists, the matching grants are limited to $5,000 in any year, while for organisations the limit is $10,000. In Western Australia, the Government and the corporate sponsor have committed $300,000 to the Fund over three years. A recent NSW Parliamentary Committee report on arts funding in regional areas recommended establishing a similar fund in NSW.61
9. CONCLUSION
This paper began by noting the importance of the arts, and by extension their funding, to the community. The level at which the arts should be funded and the balance between public and private funding is the subject of continued debate. There are big issues here, for example about the funding of 'elite' arts as against local arts, which defy easy resolution. Such broader concerns have not been addressed in this paper. Rather, the emphasis has been on setting out, as clearly as possible, the amounts of public funding received by the arts in NSW. An important, if negative, finding of the paper concerns the difficulties involved in identifying long-term trends in funding, and in making meaningful comparisons across jurisdictions, particularly with other countries. On the other hand, the trends and comparisons outlined will help to provide some context for further debate in this area.
61
Standing Committee on Public Works, n1, p36 (Rec9).