Embed Size (px)
Citation preview
Working Paper WP/18-01
ASEAN+3 Macroeconomic Research Office
March 2018
Disclaimer: The findings, interpretations, and conclusions expressed in this material represent the views
of the author(s) and are not necessarily those of the ASEAN+3 Macroeconomic Research Office (AMRO) or its member authorities. Neither AMRO nor its member authorities shall be held responsible for any consequence of the use of the information contained therein.
Asia and the CMIM in the Evolving International Monetary System
Yoichi Kadogawa, Vanne Khut, Li Lian Ong, Chaipat Poonpatpibul, Junko Shimizu
and Hongbo Wang

[This page is intentionally left blank]
Asia and the CMIM in the Evolving International Monetary System
Prepared by Yoichi Kadogawa, Vanne Khut, Li Lian Ong, Chaipat Poonpatpibul, Junko
Shimizu and Hongbo Wang1 2
Approved by Hoe Ee Khor (Chief Economist)
March 2018
Abstract
Concerted reforms following the Asian Financial Crisis and strong accumulation of
foreign exchange reserves fortified the region against the headwinds from the Global
Financial Crisis. However, with the international financial system set to grow in size and
complexity, financial crises will undoubtedly recur in the future. A pragmatic approach to
global crisis management is to address spillovers by further strengthening the Global
Financial Safety Net. For the ASEAN+3 members, buffers at the regional level are
sizable, in the form of foreign exchange reserves and Bilateral Swap Arrangements.
However, the support available to some of the smaller members is still quite thin across
the various facilities. With the Chiang Mai Initiative Multilateralization as the center of
the Regional Financial Safety Net, the effectiveness of the regional mechanism could
be enhanced. This paper analyzes why the CMIM should be strengthened to support
macroeconomic and financial stability in Asia.
JEL classification: F15, F32, F33, G01
Keywords: Financial crisis; Chiang Mai Initiative Multilateralization; Global
Financial Safety Net; International Monetary System; financial
networks; Regional Financing Arrangement; swaps
1 Authors’ e-mails: [email protected]; [email protected]; [email protected]; [email protected]; [email protected]; [email protected]. Vanne Khut is an Associate at AMRO (seconded from the Cambodia Ministry of Economy and Finance); Li Lian Ong is Financial Advisor at AMRO (Asian Development Bank Consultant); Junko Shimizu is inaugural Scholar, AMRO Collaborative Research Program and Professor at the Faculty of Economics, Gakushuin University, Tokyo.
2 The authors would like to thank Paolo Hernando, Xianguo Huang, Ruperto Majuca, Thi Kim Cuc Nguyen and Jade Vichyanond for their contributions to the paper; Junhong Chang, Hoe Ee Khor and Yasuto Watanabe for their invaluable advice; Beomhee Han, Sumio Ishikawa, Jae Young Lee, Ika Mustika Sari, participants at the 2017 ASEAN+3 Financial Forum held in Asahikawa, Japan on 11 December 2017, and staff at Bank Negara Malaysia and the State Bank of Vietnam for their useful comments. All remaining mistakes are the responsibility of the authors.
2
Glossary
ADB Asian Development Bank
AE Advanced economy
AFC Asian Financial Crisis
AMF Arab Monetary Fund
ASA ASEAN Swap Arrangement
ASEAN Association of South-East Asian Nations
BI Bank Indonesia
BIS Bank for International Settlements
BNM Bank Negara Malaysia
BoC Bank of Canada
BoP Balance of Payments
BRICS Brazil, Russia, India, China and South Africa
BSA Bilateral Swap Arrangement
CDIS Coordinated Direct Investment Survey
CLMV Cambodia, Lao PDR, Myanmar and Vietnam
CMI Chiang Mai Initiative
CMIM Chiang Mai Initiative Multilateralization
CPIS Coordinated Portfolio Investment Survey
CRA Contingent Reserve Arrangement
DoTS Direction of Trade Statistics
ECF Extended Credit Facility
EFSD Eurasian Fund for Stabilization and Development
EFSF European Financial Stability Facility
EME Emerging market economy
ESCAP Economic and Social Commission for Asia and the Pacific
ESDC European Sovereign Debt Crisis
ESM European Stability Mechanism
FCL Flexible Credit Line
FDI Foreign direct investment
FLAR Fondo Latinoamericano de Reservas
FX Foreign exchange
GFC Global Financial Crisis
GFSN Global Financial Safety Net
IFI International financial institution
IFS International Financial Statistics
IMF International Monetary Fund
IMS International Monetary System
JMoF Japan Ministry of Finance
NPLs Non-performing loans
PBoC People’s Bank of China
PL Precautionary Line
PRGT Poverty Reduction and Growth Trust
RBA Reserve Bank of Australia
RFA Regional Financing Arrangement
RFSN Regional Financial Safety Net
SBA Stand-by Arrangement
SDR Special Drawing Right
SF Stability Facility
WEO World Economic Outlook
3
Contents
I. Introduction .................................................................................................................... 6
II. Risks to the IMS and Asia ............................................................................................ 10
A. Spillovers ............................................................................................................ 10
B. Asia and the Financial Crises .............................................................................. 17
III. The Role of RFAs and the CMIM ................................................................................. 21
A. RFAs in the IMS .................................................................................................. 21
B. Readiness of the CMI and CMIM ........................................................................ 26
C. Regional Buffers ................................................................................................. 27
D. Use of Regional Currencies ................................................................................ 36
IV. Concluding Remarks ................................................................................................... 44
Appendix I. Projections of Growth in Credit to the Private Non-Financial Sector in AEs and
EMEs....................................................................................................................... 45
Appendix II. Share of Global Trade and Finance ................................................................. 47
Appendix III. Asia’s Role in Global Trade and Finance ........................................................ 49
Appendix IV. Global Risks ................................................................................................... 53
References ......................................................................................................................... 54
Annex. Survey Results: The Market’s Views on a Financial Safety Net for Asia .................. 59
A. Introduction ......................................................................................................... 59
B. Survey Responses .............................................................................................. 59
C. Summary and Conclusion ................................................................................... 66
Survey Questionnaire .............................................................................................. 67
Boxes
Box 1. Indonesia and Malaysia: Different Paths from Crisis to Recovery............................. 18
Box 2. ASEAN+3: Bilateral Swap Arrangements ................................................................. 30
Box 3. Financial Support for the CLMV ............................................................................... 32
Box 4. Asia: Trade and Settlements in Local Currencies ..................................................... 37
Figures
Figure 1. The Changing Nature of Economic and Financial Crises........................................ 7
Figure 2. Exchange Rate Arrangements and Currency Crises .............................................. 7
Figure 3. ASEAN+3: Foreign Exchange Reserves ................................................................ 8
Figure 4. Government Debt and Sovereign Debt Crises ........................................................ 8
Figure 5. Financial Deepening and Banking Crises ............................................................... 9
Figure 6. International Credit Activity ................................................................................... 11
Figure 7. External Financial Openness ............................................................................... 11
Figure 8. Financial Market Structure: ASEAN+3, North America, Europe, Latin America and
Other Major EMEs ................................................................................................... 12
Figure 9. World Trade Volume ............................................................................................ 13
Figure 10. External Trade Openness .................................................................................. 13
Figure 11. Major AEs and EMEs: Trade Network, as of October 2017 ................................ 14
Figure 12. Major AEs and EMEs: Network of Bank Claims, as of September 2017 ............. 15
4
Figure 13. AEs and EMEs: Share of Total Credit ................................................................ 16
Figure 14. ASEAN+3: FX Reserves Coverage, as of September 2017 ............................... 20
Figure 15. Composition of the GFSN .................................................................................. 23
Figure 16. Capital Flows to Emerging Markets .................................................................... 23
Figure 17. Financial Crises: Sources of Bailout ................................................................... 24
Figure 18. FX Reserves by Region, as of December 2017 .................................................. 31
Figure 19. OTC Foreign Exchange Turnover by Currency .................................................. 40
Figure 20. OTC Foreign Exchange Turnover by Country .................................................... 41
Figure 21. Local Currency Contributions to the CMIM ......................................................... 42
Figure 22. World FX Reserves by Currency, as of September 2017 ................................... 43
Box Figure 1. Japanese Banks: Cross-Border Lending to Asia-Pacific Emerging Market and
Developing Economies ............................................................................................ 31
Box Figure 2. CLMV: Credit Growth and NPL Ratios .......................................................... 32
Box Figure 3. ASEAN-4: Current Account Balance ............................................................. 33
Box Figure 4. ASEAN-4: External Debt ............................................................................... 33
Box Figure 5. ASEAN-4: Fiscal Balance.............................................................................. 33
Box Figure 6. ASEAN-4: Government Debt ......................................................................... 33
Box Figure 7. CLMV: Total Economic Damage in the Year of Disaster Occurring. .............. 34
Box Figure 8. Japan: Currency Share of Trade within Asia ................................................. 38
Box Figure 9. Renminbi: Settlements under the Current Account ........................................ 39
Box Figure 10. Renminbi: Distribution of Cross-Border Receipts and Payments, 2016 ....... 39
Appendix Figure 1. Regression Results: Credit and Wealth ................................................ 46
Appendix Figure 2. Share of Global Trade by Region ......................................................... 47
Appendix Figure 3. ASEAN+3: Share of Global Finance ..................................................... 48
Appendix Figure 4. ASEAN+3: Size of Global Trade and Finance ...................................... 49
Appendix Figure 5. ASEAN+3: Exposures to Global Trade and Finance ............................. 51
Appendix Figure 6. AMRO: Global Risk Map for the ASEAN+3 Countries .......................... 53
Annex Figure 1. AMRO Survey Results: Work Sector of Respondents ............................... 60
Annex Figure 2. AMRO Survey Results: Country Coverage of Respondents. ..................... 60
Annex Figure 3. AMRO Survey Results: Perceived Risks to Capital Flows ......................... 61
Annex Figure 4. AMRO Survey Results: Familiarity with Existing Sources of Financial
Support .................................................................................................................... 62
Annex Figure 5. AMRO Survey Results: AMRO as an Anchor for Regional Financial Stability
................................................................................................................................ 62
Annex Figure 6. AMRO Survey Results: Usefulness of Financing Facilities by Type........... 64
Annex Figure 7. AMRO Survey Results: Usefulness of a Central Coordinating Body .......... 65
Annex Figure 8. AMRO Survey Results: Denomination of Financial Safety Net Currencies ....
................................................................................................................................ 65
Tables
Table 1. Summary of RFAs ................................................................................................. 22
Table 2. Comparisons across RFSNs ................................................................................. 25
Table 3. ASEAN+3: Comparison of Financing Sources ....................................................... 29

5
Box Table 1. ASEAN+3: BSAs in the Region ...................................................................... 30
Box Table 2. CLMV: Selected Eligible Financing Arrangements and Lending Terms .......... 34
Box Table 3. CLMV: Projected FX Reserves in 2020, Including Lending Facilities .............. 35
Box Table 4. Thailand: Structure of Export and Import Receipts from ASEAN by Currency ....
................................................................................................................................ 38
6
“No one that encounters prosperity does not also encounter danger.”
~ Heraclitus of Ephesus (535–475 B.C.)
I. Introduction
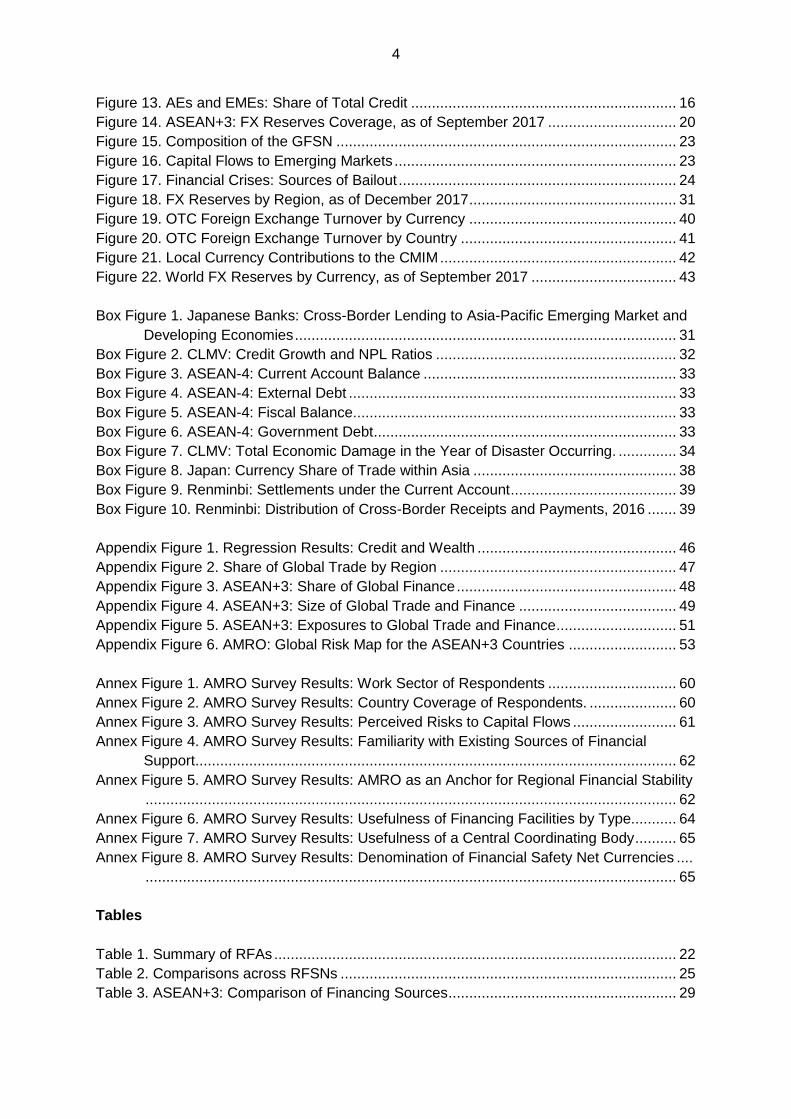
The Chiang Mai Initiative Multilateralization (CMIM) has a very important role to play in a
constantly changing International Monetary System (IMS). Since the 1970s, numerous
countries have been hit by economic and financial crises and many have had to rely on the
International Monetary Fund (IMF) for financial and technical support. The number of crises
peaked in the early 1980s, and then again in the second-half of the 1990s, culminating more
recently in the Global Financial Crisis (GFC) (Figure 1). The Chiang Mai Initiative (CMI) was
introduced in the wake of the Asian Financial Crisis (AFC) to support the region and was
subsequently expanded to become the CMIM in 2010, during the GFC. Members reaffirmed
their commitment in Yokohama in May 2017 to further strengthen the CMIM as a center of the
Regional Financial Safety Net (RFSN) (ASEAN+3, 2017).
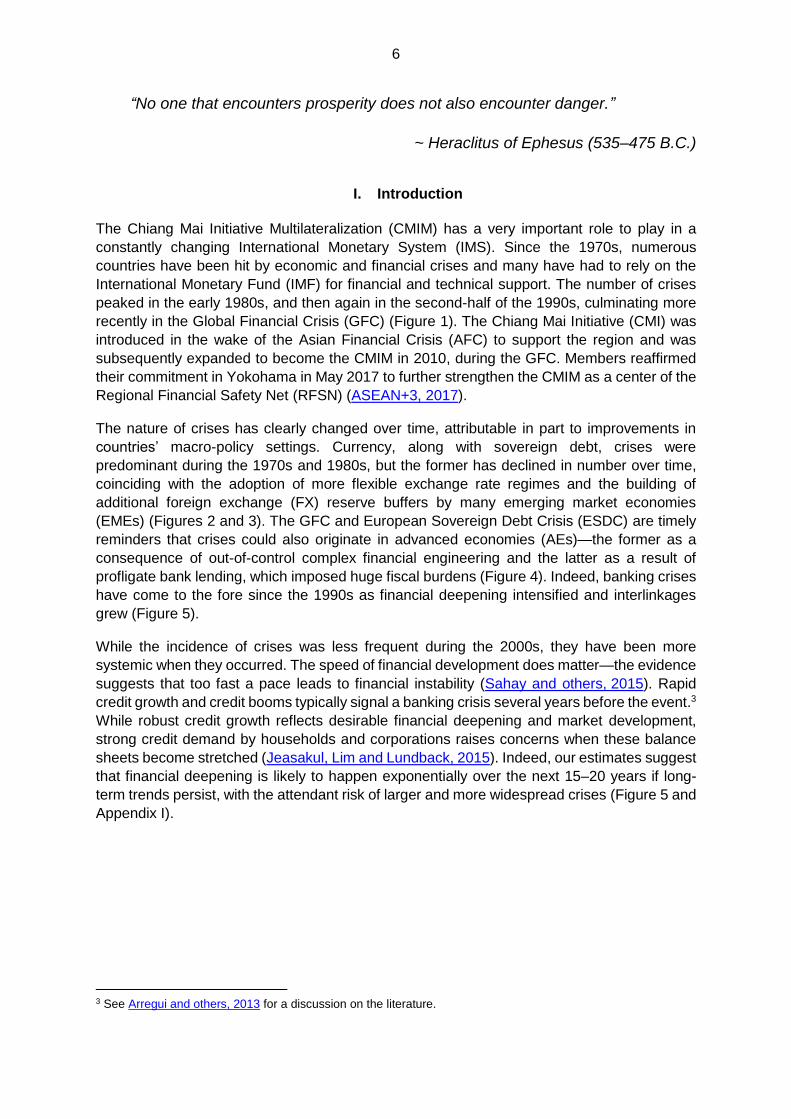
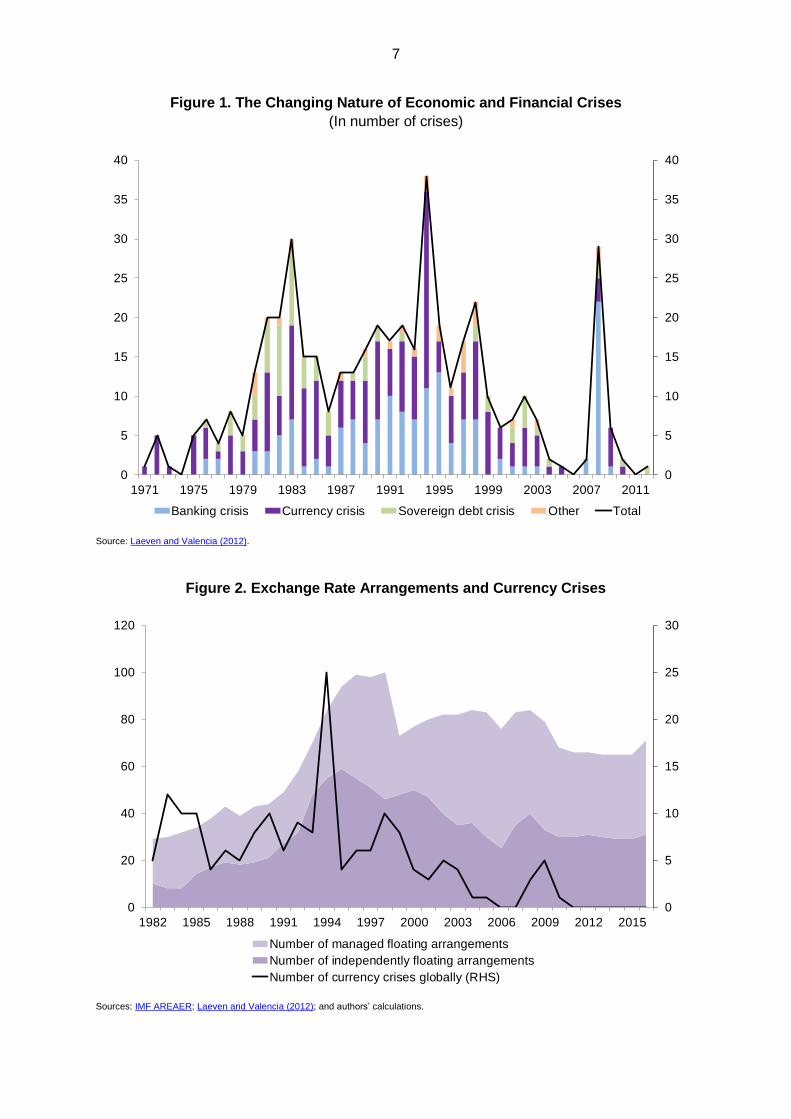
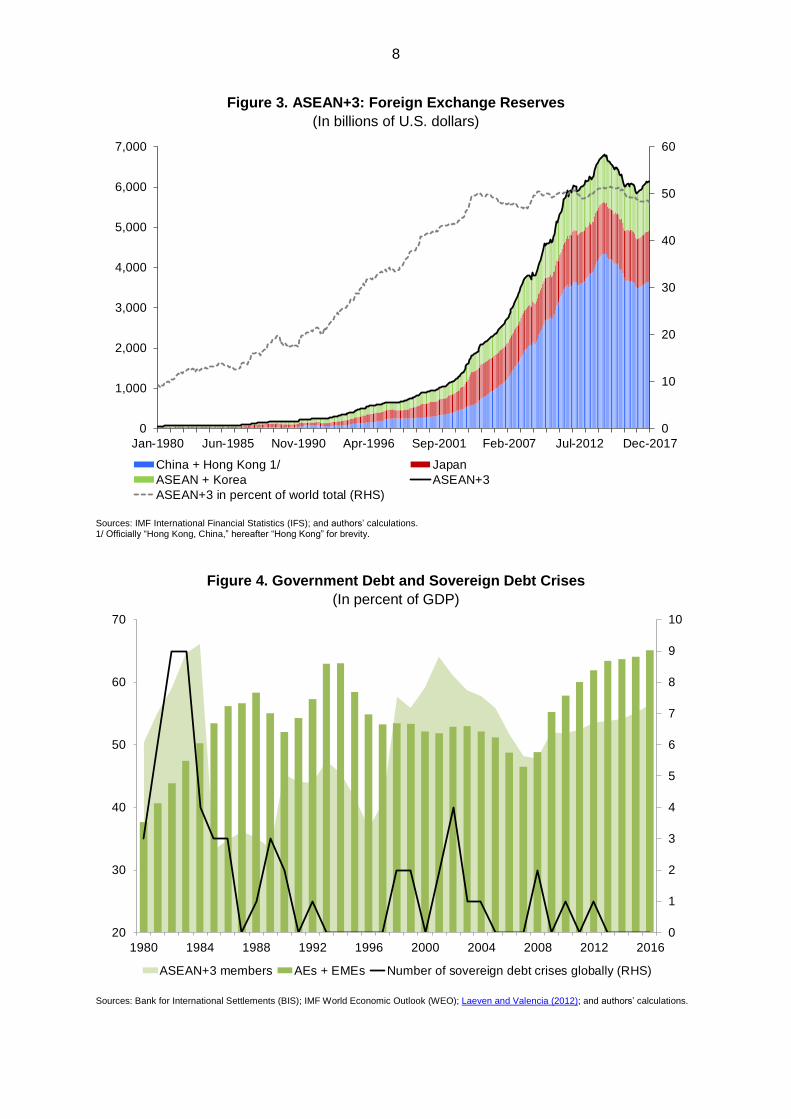
The nature of crises has clearly changed over time, attributable in part to improvements in
countries’ macro-policy settings. Currency, along with sovereign debt, crises were
predominant during the 1970s and 1980s, but the former has declined in number over time,
coinciding with the adoption of more flexible exchange rate regimes and the building of
additional foreign exchange (FX) reserve buffers by many emerging market economies
(EMEs) (Figures 2 and 3). The GFC and European Sovereign Debt Crisis (ESDC) are timely
reminders that crises could also originate in advanced economies (AEs)—the former as a
consequence of out-of-control complex financial engineering and the latter as a result of
profligate bank lending, which imposed huge fiscal burdens (Figure 4). Indeed, banking crises
have come to the fore since the 1990s as financial deepening intensified and interlinkages
grew (Figure 5).
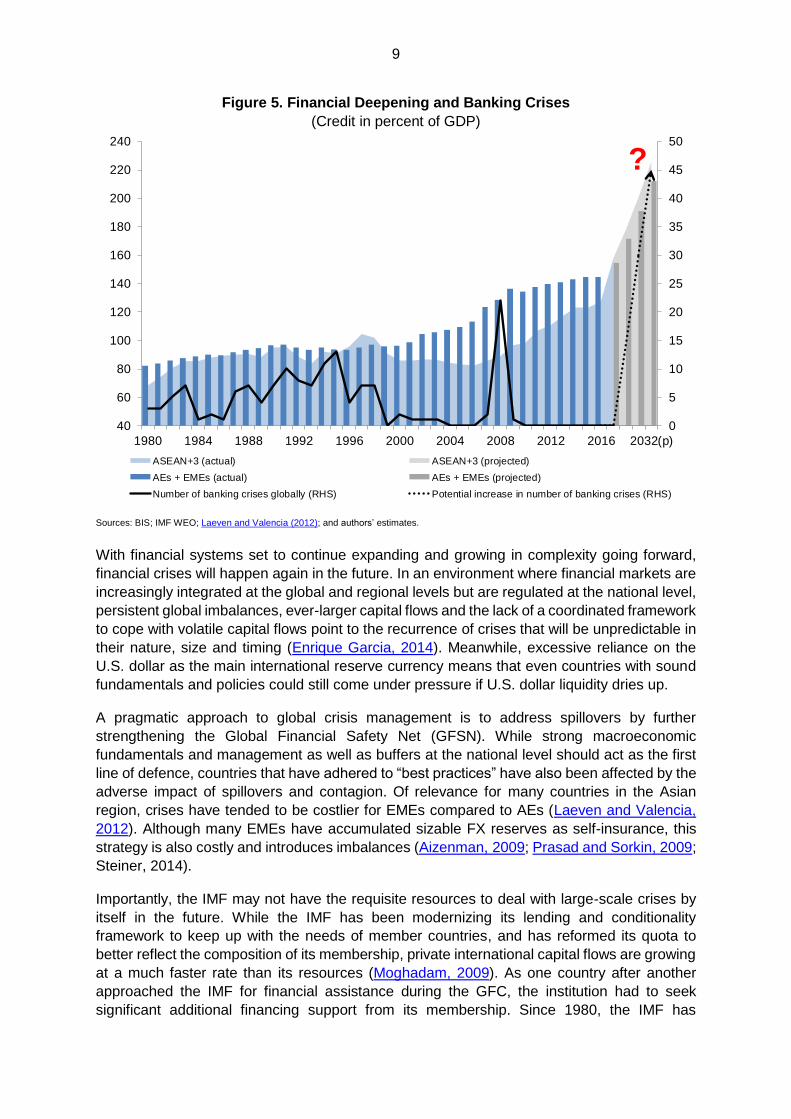
While the incidence of crises was less frequent during the 2000s, they have been more
systemic when they occurred. The speed of financial development does matter—the evidence
suggests that too fast a pace leads to financial instability (Sahay and others, 2015). Rapid
credit growth and credit booms typically signal a banking crisis several years before the event.3
While robust credit growth reflects desirable financial deepening and market development,
strong credit demand by households and corporations raises concerns when these balance
sheets become stretched (Jeasakul, Lim and Lundback, 2015). Indeed, our estimates suggest
that financial deepening is likely to happen exponentially over the next 15–20 years if long-
term trends persist, with the attendant risk of larger and more widespread crises (Figure 5 and
Appendix I).
3 See Arregui and others, 2013 for a discussion on the literature.
7
Figure 1. The Changing Nature of Economic and Financial Crises
(In number of crises)
Source: Laeven and Valencia (2012).
Figure 2. Exchange Rate Arrangements and Currency Crises
Sources: IMF AREAER; Laeven and Valencia (2012); and authors’ calculations.
0
5
10
15
20
25
30
35
40
0
5
10
15
20
25
30
35
40
1971 1975 1979 1983 1987 1991 1995 1999 2003 2007 2011
Banking crisis Currency crisis Sovereign debt crisis Other Total
0
5
10
15
20
25
30
0
20
40
60
80
100
120
1982 1985 1988 1991 1994 1997 2000 2003 2006 2009 2012 2015
Number of managed floating arrangements
Number of independently floating arrangements
Number of currency crises globally (RHS)
8
Figure 3. ASEAN+3: Foreign Exchange Reserves
(In billions of U.S. dollars)
Sources: IMF International Financial Statistics (IFS); and authors’ calculations. 1/ Officially “Hong Kong, China,” hereafter “Hong Kong” for brevity.
Figure 4. Government Debt and Sovereign Debt Crises
(In percent of GDP)
Sources: Bank for International Settlements (BIS); IMF World Economic Outlook (WEO); Laeven and Valencia (2012); and authors’ calculations.
0
10
20
30
40
50
60
0
1,000
2,000
3,000
4,000
5,000
6,000
7,000
Jan-1980 Jun-1985 Nov-1990 Apr-1996 Sep-2001 Feb-2007 Jul-2012 Dec-2017
China + Hong Kong 1/ Japan
ASEAN + Korea ASEAN+3
ASEAN+3 in percent of world total (RHS)
0
1
2
3
4
5
6
7
8
9
10
20
30
40
50
60
70
1980 1984 1988 1992 1996 2000 2004 2008 2012 2016
ASEAN+3 members AEs + EMEs Number of sovereign debt crises globally (RHS)
9
Figure 5. Financial Deepening and Banking Crises
(Credit in percent of GDP)
Sources: BIS; IMF WEO; Laeven and Valencia (2012); and authors’ estimates.
With financial systems set to continue expanding and growing in complexity going forward,
financial crises will happen again in the future. In an environment where financial markets are
increasingly integrated at the global and regional levels but are regulated at the national level,
persistent global imbalances, ever-larger capital flows and the lack of a coordinated framework
to cope with volatile capital flows point to the recurrence of crises that will be unpredictable in
their nature, size and timing (Enrique Garcia, 2014). Meanwhile, excessive reliance on the
U.S. dollar as the main international reserve currency means that even countries with sound
fundamentals and policies could still come under pressure if U.S. dollar liquidity dries up.
A pragmatic approach to global crisis management is to address spillovers by further
strengthening the Global Financial Safety Net (GFSN). While strong macroeconomic
fundamentals and management as well as buffers at the national level should act as the first
line of defence, countries that have adhered to “best practices” have also been affected by the
adverse impact of spillovers and contagion. Of relevance for many countries in the Asian
region, crises have tended to be costlier for EMEs compared to AEs (Laeven and Valencia,
2012). Although many EMEs have accumulated sizable FX reserves as self-insurance, this
strategy is also costly and introduces imbalances (Aizenman, 2009; Prasad and Sorkin, 2009;
Steiner, 2014).
Importantly, the IMF may not have the requisite resources to deal with large-scale crises by
itself in the future. While the IMF has been modernizing its lending and conditionality
framework to keep up with the needs of member countries, and has reformed its quota to
better reflect the composition of its membership, private international capital flows are growing
at a much faster rate than its resources (Moghadam, 2009). As one country after another
approached the IMF for financial assistance during the GFC, the institution had to seek
significant additional financing support from its membership. Since 1980, the IMF has
0
5
10
15
20
25
30
35
40
45
50
40
60
80
100
120
140
160
180
200
220
240
1980 1984 1988 1992 1996 2000 2004 2008 2012 2016 2032(p)
ASEAN+3 (actual) ASEAN+3 (projected)
AEs + EMEs (actual) AEs + EMEs (projected)
Number of banking crises globally (RHS) Potential increase in number of banking crises (RHS)
?
10
committed an average of about 20 percent of its available resources to assisting countries but
at the peak of the GFC alone, it committed about 70 percent of its available quota resources
(Malpass, 2017).
Clearly, Regional Financing Arrangements (RFAs) have an important role to play in the GFSN.
RFAs have been around for a very long time and, not surprisingly, they were introduced during
or in the aftermath of regional or global financial crises. For example, the CMI was introduced
in the wake of the AFC and evolved to become the CMIM in 2010 during the GFC, while the
European Financial Stability Facility (EFSF) was introduced in 2010 during the GFC, and the
European Stability Mechanism (ESM) in 2012 at the height of the ESDC. International policy
coordination, such as that by the G-20, to mitigate spillovers will be further fostered by
members; however, there is skepticism that significant progress would be made given their
prioritization of domestic policies (Obstfeld and Rogoff, 2002; Coeure, 2015).
This paper examines Asia’s role in the IMS and explores why the CMIM should be enhanced
in an increasingly integrated international trade and financial environment. It is structured as
follows: Section II analyses the risks to the IMS focusing, in particular, on the Asian region and
more specifically, on the ASEAN+3 countries. Section III provides an overview of the CMIM in
the context of existing RFAs and explores its potential as well as its shortcomings. Section IV
concludes. The results of AMRO staff’s market survey on the risks to regional financial stability
and the market’s perception of the importance of having a RFSN are summarized in the
Annex.
II. Risks to the IMS and Asia
A. Spillovers
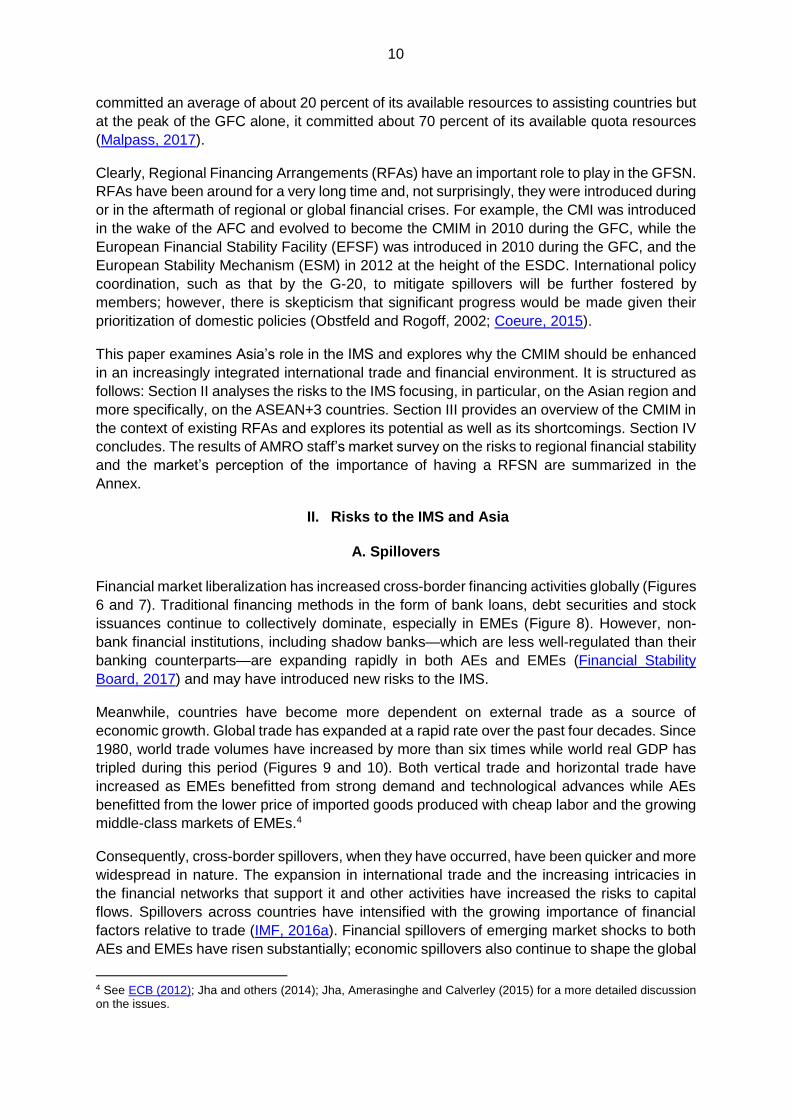
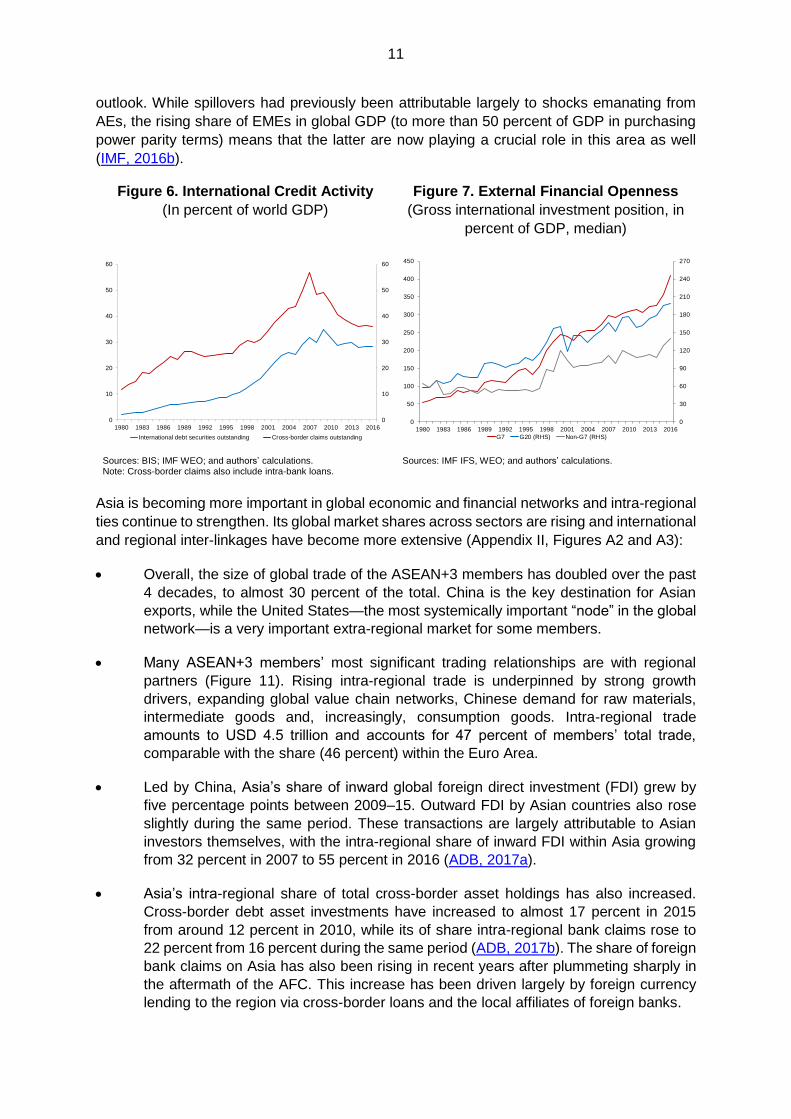
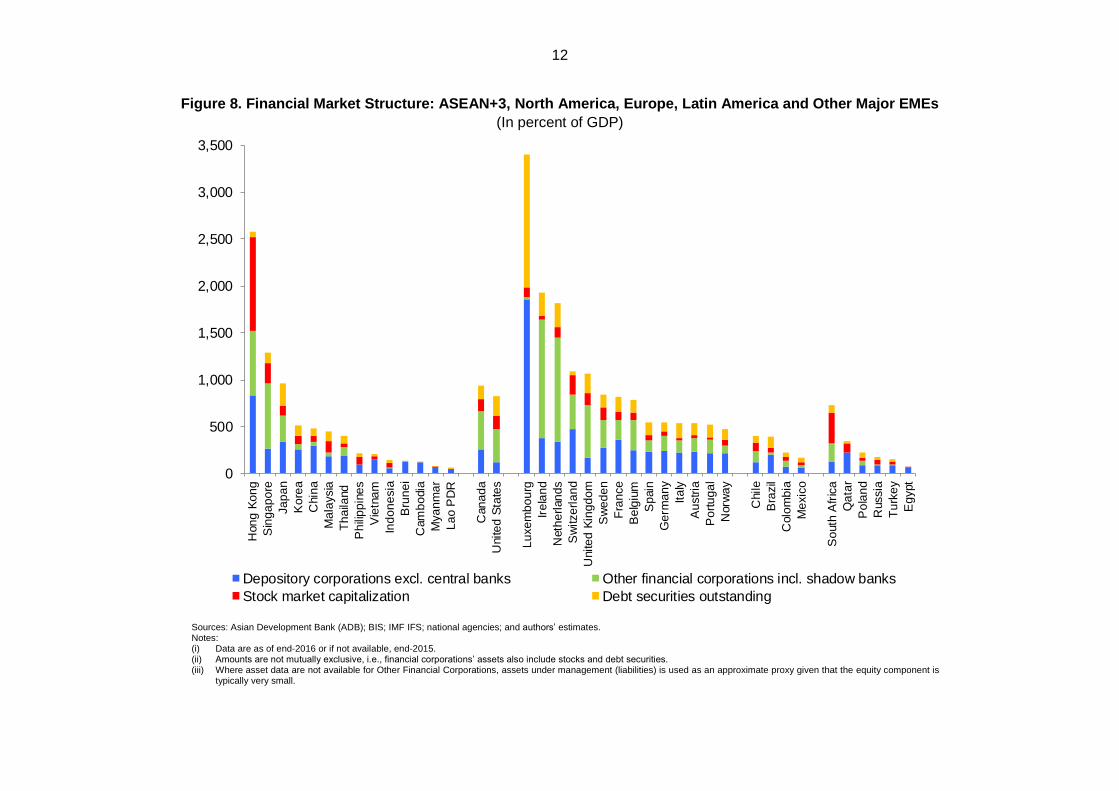
Financial market liberalization has increased cross-border financing activities globally (Figures
6 and 7). Traditional financing methods in the form of bank loans, debt securities and stock
issuances continue to collectively dominate, especially in EMEs (Figure 8). However, non-
bank financial institutions, including shadow banks—which are less well-regulated than their
banking counterparts—are expanding rapidly in both AEs and EMEs (Financial Stability
Board, 2017) and may have introduced new risks to the IMS.
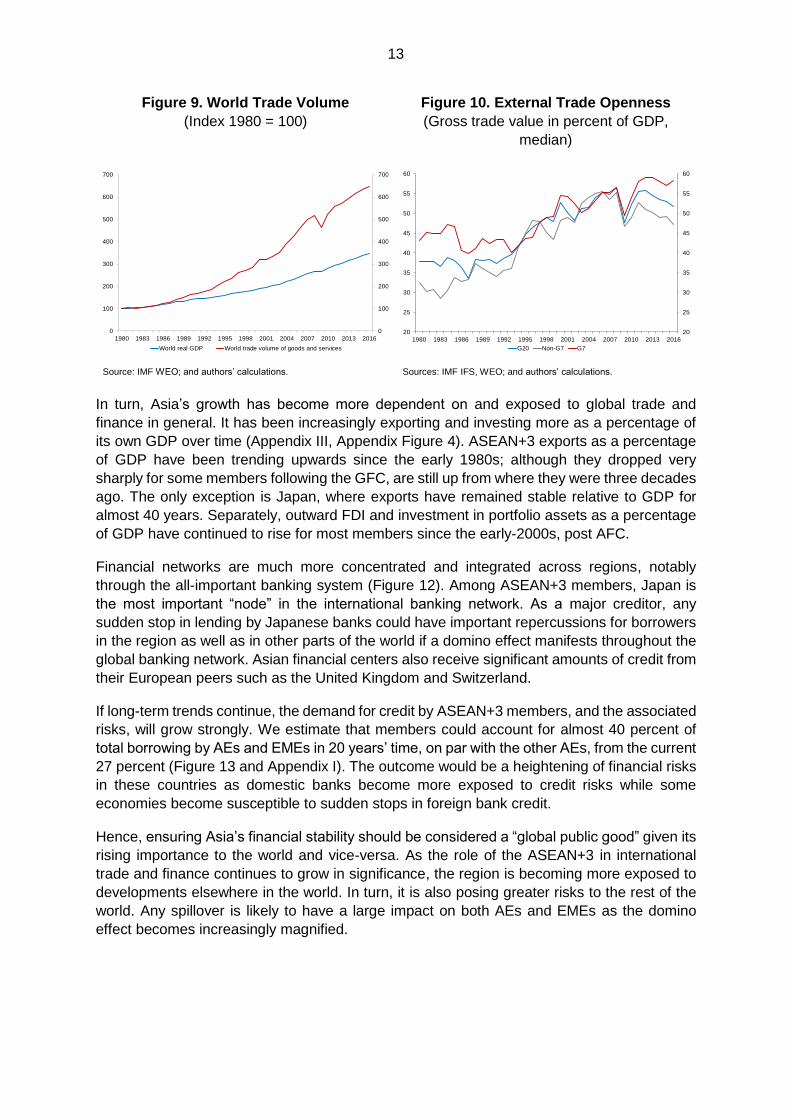
Meanwhile, countries have become more dependent on external trade as a source of
economic growth. Global trade has expanded at a rapid rate over the past four decades. Since
1980, world trade volumes have increased by more than six times while world real GDP has
tripled during this period (Figures 9 and 10). Both vertical trade and horizontal trade have
increased as EMEs benefitted from strong demand and technological advances while AEs
benefitted from the lower price of imported goods produced with cheap labor and the growing
middle-class markets of EMEs.4
Consequently, cross-border spillovers, when they have occurred, have been quicker and more
widespread in nature. The expansion in international trade and the increasing intricacies in
the financial networks that support it and other activities have increased the risks to capital
flows. Spillovers across countries have intensified with the growing importance of financial
factors relative to trade (IMF, 2016a). Financial spillovers of emerging market shocks to both
AEs and EMEs have risen substantially; economic spillovers also continue to shape the global
4 See ECB (2012); Jha and others (2014); Jha, Amerasinghe and Calverley (2015) for a more detailed discussion on the issues.
11
outlook. While spillovers had previously been attributable largely to shocks emanating from
AEs, the rising share of EMEs in global GDP (to more than 50 percent of GDP in purchasing
power parity terms) means that the latter are now playing a crucial role in this area as well
(IMF, 2016b).
Figure 6. International Credit Activity
(In percent of world GDP)
Figure 7. External Financial Openness
(Gross international investment position, in
percent of GDP, median)
Sources: BIS; IMF WEO; and authors’ calculations. Note: Cross-border claims also include intra-bank loans.
Sources: IMF IFS, WEO; and authors’ calculations.
Asia is becoming more important in global economic and financial networks and intra-regional
ties continue to strengthen. Its global market shares across sectors are rising and international
and regional inter-linkages have become more extensive (Appendix II, Figures A2 and A3):
Overall, the size of global trade of the ASEAN+3 members has doubled over the past
4 decades, to almost 30 percent of the total. China is the key destination for Asian
exports, while the United States—the most systemically important “node” in the global
network—is a very important extra-regional market for some members.
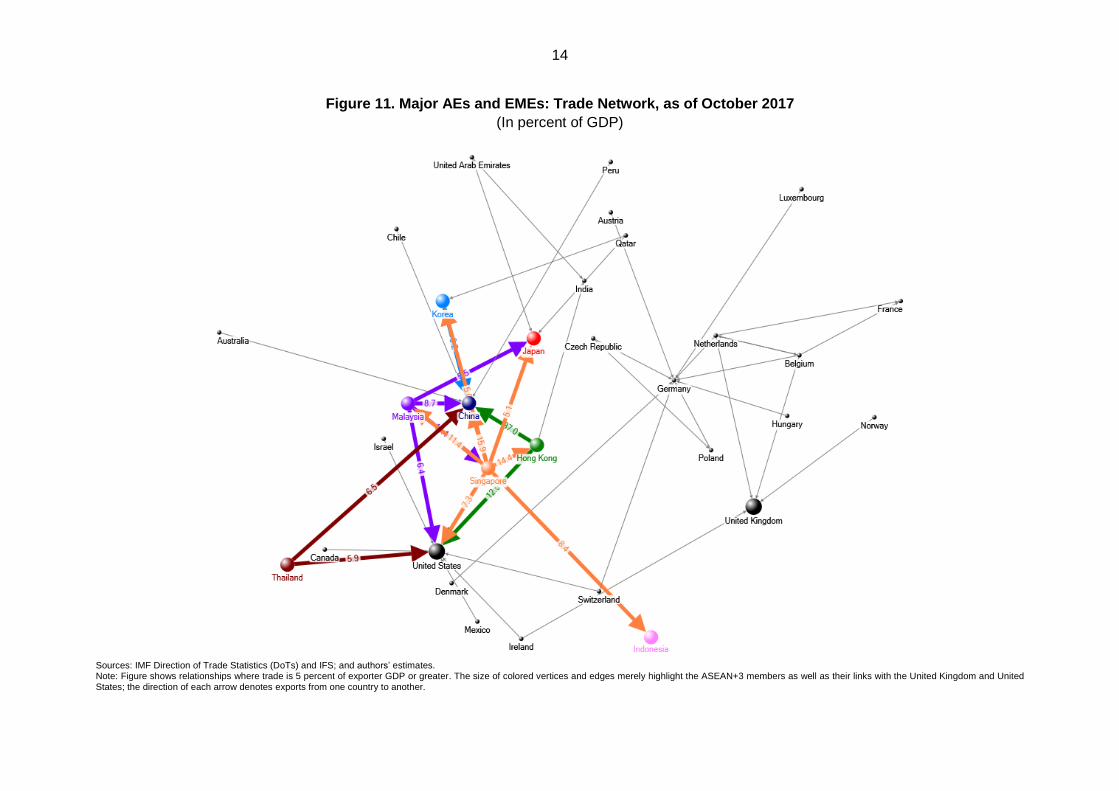
Many ASEAN+3 members’ most significant trading relationships are with regional
partners (Figure 11). Rising intra-regional trade is underpinned by strong growth
drivers, expanding global value chain networks, Chinese demand for raw materials,
intermediate goods and, increasingly, consumption goods. Intra-regional trade
amounts to USD 4.5 trillion and accounts for 47 percent of members’ total trade,
comparable with the share (46 percent) within the Euro Area.
Led by China, Asia’s share of inward global foreign direct investment (FDI) grew by
five percentage points between 2009–15. Outward FDI by Asian countries also rose
slightly during the same period. These transactions are largely attributable to Asian
investors themselves, with the intra-regional share of inward FDI within Asia growing
from 32 percent in 2007 to 55 percent in 2016 (ADB, 2017a).
Asia’s intra-regional share of total cross-border asset holdings has also increased.
Cross-border debt asset investments have increased to almost 17 percent in 2015
from around 12 percent in 2010, while its of share intra-regional bank claims rose to
22 percent from 16 percent during the same period (ADB, 2017b). The share of foreign
bank claims on Asia has also been rising in recent years after plummeting sharply in
the aftermath of the AFC. This increase has been driven largely by foreign currency
lending to the region via cross-border loans and the local affiliates of foreign banks.
0
10
20
30
40
50
60
0
10
20
30
40
50
60
1980 1983 1986 1989 1992 1995 1998 2001 2004 2007 2010 2013 2016
International debt securities outstanding Cross-border claims outstanding
0
30
60
90
120
150
180
210
240
270
0
50
100
150
200
250
300
350
400
450
1980 1983 1986 1989 1992 1995 1998 2001 2004 2007 2010 2013 2016
G7 G20 (RHS) Non-G7 (RHS)
12
Figure 8. Financial Market Structure: ASEAN+3, North America, Europe, Latin America and Other Major EMEs
(In percent of GDP)
Sources: Asian Development Bank (ADB); BIS; IMF IFS; national agencies; and authors’ estimates. Notes: (i) Data are as of end-2016 or if not available, end-2015. (ii) Amounts are not mutually exclusive, i.e., financial corporations’ assets also include stocks and debt securities. (iii) Where asset data are not available for Other Financial Corporations, assets under management (liabilities) is used as an approximate proxy given that the equity component is
typically very small.
0
500
1,000
1,500
2,000
2,500
3,000
3,500
Hon
g K
on
g
Sin
ga
po
re
Ja
pa
n
Ko
rea
Chin
a
Ma
laysia
Th
aila
nd
Ph
ilip
pin
es
Vie
tna
m
Ind
on
esia
Bru
ne
i
Cam
bo
dia
Mya
nm
ar
La
o P
DR
Can
ad
a
Unite
d S
tate
s
Lu
xe
mb
ou
rg
Ire
lan
d
Neth
erl
an
ds
Sw
itze
rla
nd
Unite
d K
ing
do
m
Sw
ed
en
Fra
nce
Be
lgiu
m
Sp
ain
Ge
rma
ny
Ita
ly
Au
str
ia
Po
rtu
ga
l
Norw
ay
Chile
Bra
zil
Colo
mb
ia
Me
xic
o
So
uth
Afr
ica
Qa
tar
Po
lan
d
Russia
Tu
rke
y
Eg
ypt
Depository corporations excl. central banks Other financial corporations incl. shadow banks
Stock market capitalization Debt securities outstanding
13
Figure 9. World Trade Volume
(Index 1980 = 100)
Figure 10. External Trade Openness
(Gross trade value in percent of GDP,
median)
Source: IMF WEO; and authors’ calculations. Sources: IMF IFS, WEO; and authors’ calculations.
In turn, Asia’s growth has become more dependent on and exposed to global trade and
finance in general. It has been increasingly exporting and investing more as a percentage of
its own GDP over time (Appendix III, Appendix Figure 4). ASEAN+3 exports as a percentage
of GDP have been trending upwards since the early 1980s; although they dropped very
sharply for some members following the GFC, are still up from where they were three decades
ago. The only exception is Japan, where exports have remained stable relative to GDP for
almost 40 years. Separately, outward FDI and investment in portfolio assets as a percentage
of GDP have continued to rise for most members since the early-2000s, post AFC.
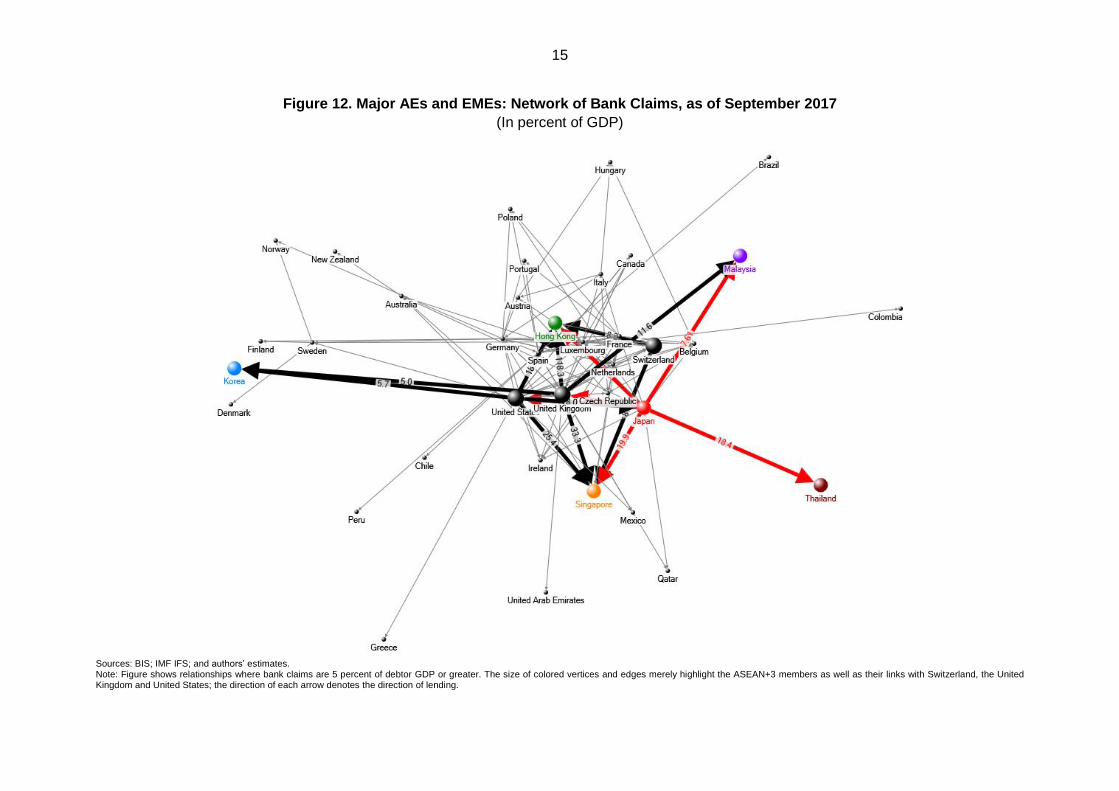
Financial networks are much more concentrated and integrated across regions, notably
through the all-important banking system (Figure 12). Among ASEAN+3 members, Japan is
the most important “node” in the international banking network. As a major creditor, any
sudden stop in lending by Japanese banks could have important repercussions for borrowers
in the region as well as in other parts of the world if a domino effect manifests throughout the
global banking network. Asian financial centers also receive significant amounts of credit from
their European peers such as the United Kingdom and Switzerland.
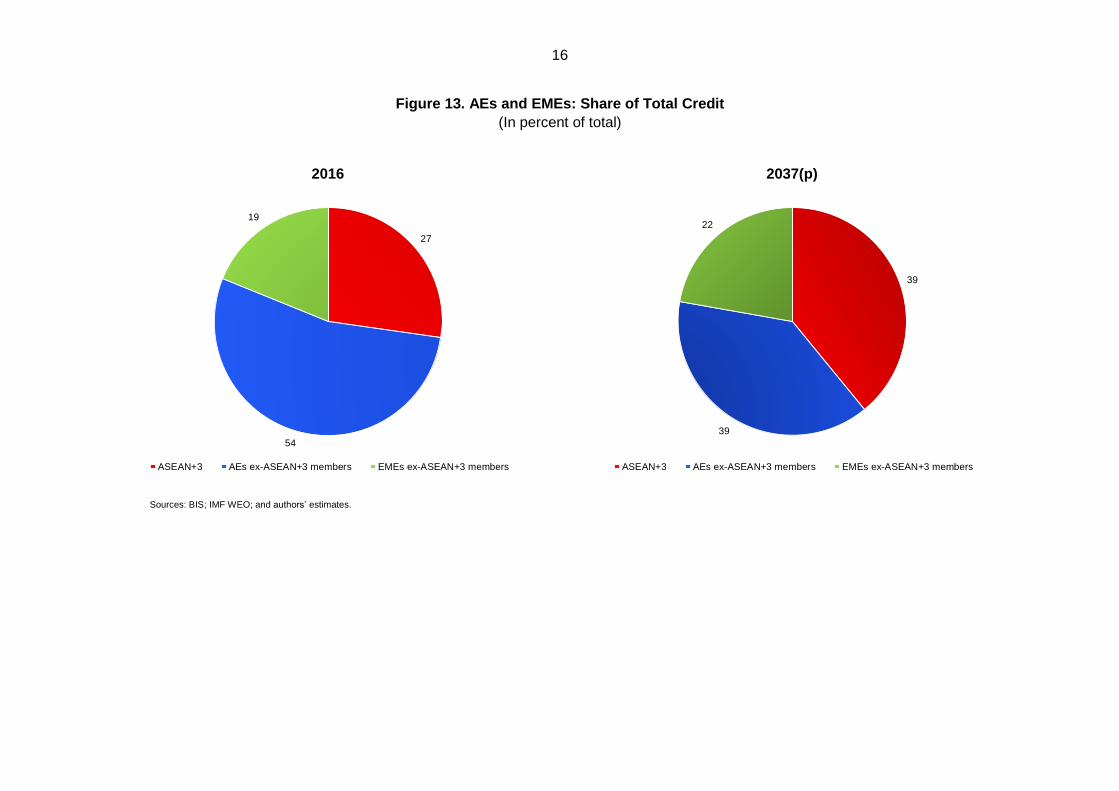
If long-term trends continue, the demand for credit by ASEAN+3 members, and the associated
risks, will grow strongly. We estimate that members could account for almost 40 percent of
total borrowing by AEs and EMEs in 20 years’ time, on par with the other AEs, from the current
27 percent (Figure 13 and Appendix I). The outcome would be a heightening of financial risks
in these countries as domestic banks become more exposed to credit risks while some
economies become susceptible to sudden stops in foreign bank credit.
Hence, ensuring Asia’s financial stability should be considered a “global public good” given its
rising importance to the world and vice-versa. As the role of the ASEAN+3 in international
trade and finance continues to grow in significance, the region is becoming more exposed to
developments elsewhere in the world. In turn, it is also posing greater risks to the rest of the
world. Any spillover is likely to have a large impact on both AEs and EMEs as the domino
effect becomes increasingly magnified.
0
100
200
300
400
500
600
700
0
100
200
300
400
500
600
700
1980 1983 1986 1989 1992 1995 1998 2001 2004 2007 2010 2013 2016
World real GDP World trade volume of goods and services
20
25
30
35
40
45
50
55
60
20
25
30
35
40
45
50
55
60
1980 1983 1986 1989 1992 1995 1998 2001 2004 2007 2010 2013 2016
G20 Non-G7 G7
14
Figure 11. Major AEs and EMEs: Trade Network, as of October 2017
(In percent of GDP)
Sources: IMF Direction of Trade Statistics (DoTs) and IFS; and authors’ estimates. Note: Figure shows relationships where trade is 5 percent of exporter GDP or greater. The size of colored vertices and edges merely highlight the ASEAN+3 members as well as their links with the United Kingdom and United States; the direction of each arrow denotes exports from one country to another.
15
Figure 12. Major AEs and EMEs: Network of Bank Claims, as of September 2017
(In percent of GDP)
Sources: BIS; IMF IFS; and authors’ estimates. Note: Figure shows relationships where bank claims are 5 percent of debtor GDP or greater. The size of colored vertices and edges merely highlight the ASEAN+3 members as well as their links with Switzerland, the United Kingdom and United States; the direction of each arrow denotes the direction of lending.
16
Figure 13. AEs and EMEs: Share of Total Credit
(In percent of total)
2016 2037(p)
Sources: BIS; IMF WEO; and authors’ estimates.
27
54
19
ASEAN+3 AEs ex-ASEAN+3 members EMEs ex-ASEAN+3 members
39
39
22
ASEAN+3 AEs ex-ASEAN+3 members EMEs ex-ASEAN+3 members
17
B. Asia and the Financial Crises
The AFC affected both the real and financial sectors. A build-up in economic imbalances
triggered a loss of investor confidence in the financial sector: portfolio investors pulled out and
foreign banks stopped rolling over their loans. Even though government budgets were largely
balanced at the time and inflation rates were modest, widening current account deficits in
some countries, strong private capital inflows and investments in non-productive assets,
notably real estate, became unsustainable. The appreciation of the U.S. dollar, to which the
currencies of the economies were either formally or informally pegged, exposed weak risk
management practices in the financial and corporate sectors. The broad similarities in
vulnerabilities across countries caused investors to “lump” the countries together, resulting in
regional contagion.
In the decade following the AFC, Asian countries implemented concerted financial and
structural reforms to rebuild their economies.5 Stricter financial regulations were introduced,
supervision and risk management were strengthened, and financial institutions were either
closed down or recapitalized (see Box 1 on Indonesia and Malaysia). In the private sector,
banks and non-financial corporations deleveraged and repaired their balance sheets and
eventually returned to profitability. In both areas—supervision and commerce—governance
and transparency were improved; growth resumed and investors returned to these markets.
The wide-ranging measures also lowered Asia’s external and financial vulnerabilities and the
region was consequently less affected by the GFC than elsewhere.
However, Asia’s underlying economic fundamentals and financial conditions weakened
somewhat in the years following the GFC. This time, regulators were more vigilant against the
potential risks from massive capital flows and implemented macroprudential measures to
contain their build-up. Nonetheless, concerns grew over the rapid credit growth and elevated
asset prices in some countries, increased leverage in the private non-financial sector and, in
some cases, weakening external positions. While no single factor dominated, the emerging
market stress events in 2013-14 underscored the market’s focus on countries’ external
financing needs, especially short-term ones, financial sector vulnerabilities, and weak growth
prospects coupled with wider fiscal deficits and rising inflation (Jeasakul, Lim and Lundback,
2015). Indeed, these concerns resulted in the identification by markets of the “Fragile Five”
countries during that period.6
Since then, improvements in global growth and trade, supported by firming domestic demand,
have contributed to robust economic expansion in the Asian region, although risks continue to
lurk. Going forward, AMRO’s key concerns surrounding capital flows to the ASEAN+3 are
largely external, namely, faster-than-expected tightening in global financial conditions and an
escalation in U.S. trade protectionism in the near term (Appendix IV), both of which are
consistent with the market’s views (see Annex). For the medium-term, AMRO assesses the
possibility of a sharp slowdown in and capital flight from China as low-likelihood tail-risk
events. Other perennial risks that may result in large and unpredictable shocks to the region
include geopolitical events, natural disasters (in some cases from climate change) and cyber-
attacks.
5 See AMRO (2017) and IMF (2015) for detailed analyses on ASEAN+3 economic and policy developments following the AFC.
6 Brazil, India, Indonesia, South Africa and Turkey.
18
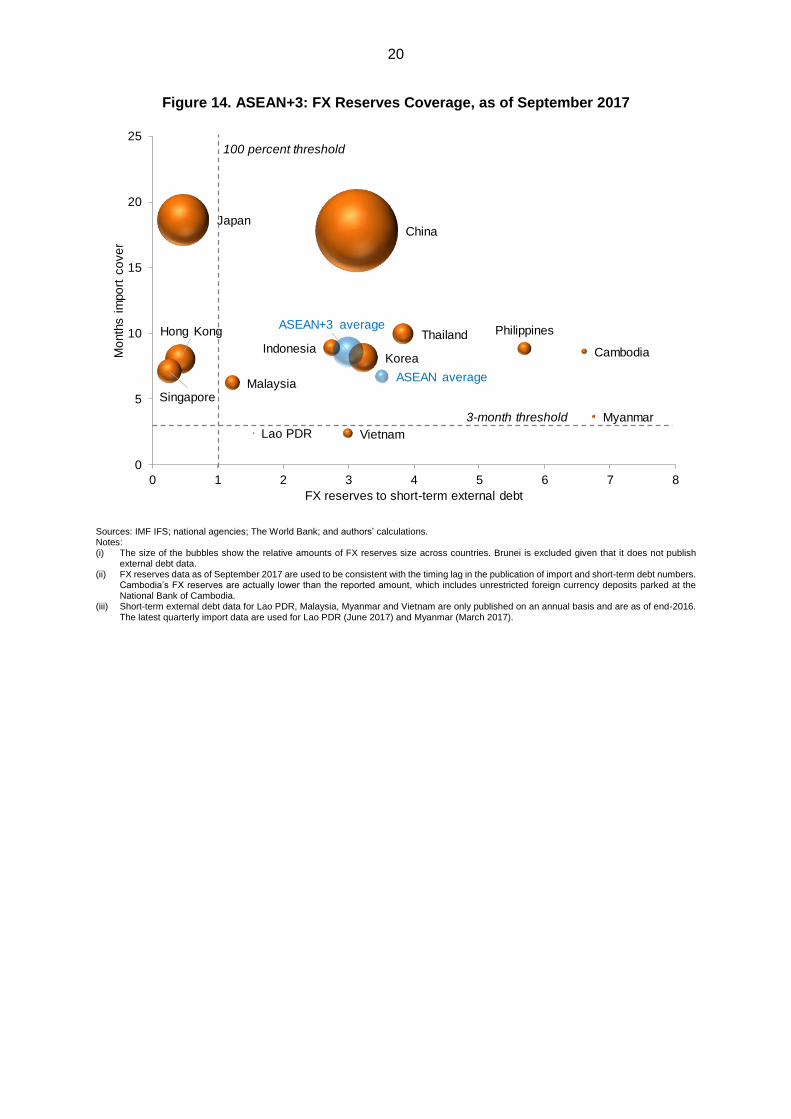
While Asian countries have continued to build “insurance” against capital outflows, the
accumulated FX reserves may still be insufficient if key risks were to materialize. The buffers
appear very comfortable during “peacetime” but may come under significant pressure in the
event of sharp and sustained capital outflows amid the region’s growing trade and financial
positions (Figure 14). It is especially pertinent for the members with low import coverage and
for those whose foreign portfolio liabilities and foreign bank borrowings are substantially
greater than their FX reserves (Appendix III, Appendix Figure A4). These countries could
struggle to defend against large, protracted outflows occurring simultaneously on some or all
fronts.
Box 1. Indonesia and Malaysia: Different Paths from Crisis to Recovery
Struck by the crisis that first engulfed Thailand in July 1997, Indonesia and Malaysia took separate
routes to recovery and reform following the AFC. While Indonesia entered into an IMF program in
October 1997, Malaysia chose to implement more unconventional measures after initial efforts to
adhere to standard IMF prescriptions of tight monetary policy and fiscal prudence appeared to amplify
the effects of the crisis. Notwithstanding the different approaches, both countries emerged stronger
from the AFC although their respective experiences in terms of crisis impact, length of recovery,
policy choices and remaining challenges were very different.
The AFC was characterized by the collapse of the currencies of the affected Asian countries which
unmasked problems in their banking and external sectors. Up until then, countries had implicitly or
explicitly pegged their currencies to the U.S. dollar, instilling a false sense of security in borrowers
who saw little need in managing their FX exposures. The globalization of financial markets and the
attractiveness of the region’s high growth and relatively stable currencies contributed to the rapid
inflows of portfolio money and bank debt. In the wake of the crisis, Indonesia adopted a floating
exchange rate regime that allows the rupiah to act as a “shock absorber” while incentivizing better
risk management among those with FX exposures. In contrast, Malaysia fixed its exchange rate and
imposed tough capital controls to quickly stanch the large outflows and restore stability to the ringgit,
while implementing countercyclical fiscal policy to stimulate demand. However, concerns over those
capital control measures kept foreign investors away from the Malaysian market for some time.
A key step to the recovery from the AFC was to reverse the credit crunch and restore credit
intermediation. In Indonesia, the rupiah’s steep depreciation exposed the private sector’s high (and
unhedged) foreign currency borrowings that resulted in a raft of non-bank corporate bankruptcies.
They led to the forced liquidation of a number of domestic banks, which wreaked significant damage
to the country’s financial intermediation, resulting in a slower recovery in credit. In contrast, Malaysia
took a more systematic approach to resolving its banking problems, in setting up an asset
management company, Danaharta, to take non-performing loans (NPLs) off the books of the banks
and then consolidating and recapitalizing the banking sector via its recapitalization fund, Danamodal.
Post-AFC, the respective focus on developing the financial sector differed markedly. Malaysia
executed a comprehensive strategy to strengthen its capital markets and financial sector by
introducing the Capital Market Master Plan I and the Financial Sector Master Plan in 2001. The aim
was to build a deep, diversified and resilient sector, including the development a domestic corporate
bond market (which eventually became the largest in South-East Asia) to move away from relying
solely on bank credit. These policies were supplemented with a step-by-step relaxation of capital
flows measures. Indonesia’s government also implemented policies to develop its local currency
bond market in a bid to address the currency mismatch risks experienced during AFC. The bond
market has expanded significantly for the past two decades, but is largely limited to the sovereign
sector and is relatively illiquid owing to small issuances across different types of instruments and the
smaller domestic investor base compared to regional peers. Foreign holdings of Indonesia’s
19
government bonds are highest in the region at almost 40 percent of total (Malaysia is next highest at
around 27 percent.
New macro-policy frameworks were introduced and deposit insurance was institutionalized in both
countries. In Indonesia, fiscal rules were adopted in 2003 to limit the budget deficit to 3 percent of
GDP and the debt-to-GDP ratio to 60 percent, as proof of the government’s commitment to fiscal
soundness. Bank Indonesia (BI) adopted inflation targeting in 2005, establishing inflation as the main
nominal anchor for monetary policy, to which it has adhered in the face of domestic and external
shocks. Meanwhile, the adoption of the Central Bank of Malaysia Act in 2009 formalized the
autonomy and independence of Bank Negara Malaysia (BNM) in formulating monetary policy. BNM
has also been empowered as the financial stability authority, imbued with the capability to provide
liquidity assistance to or resolve systemically important financial institutions to prevent spillovers. On
the banking front, the Indonesia Deposit Insurance Corporation was tasked with providing limited
guarantees for bank deposits, while Malaysia passed the Deposit Insurance Act and established a
government agency, Perbadanan Insurans Deposit Malaysia, to administer the deposit insurance
system, both in 2005.
Macroprudential policy has assumed a greater role in the financial stability toolkit in the aftermath of
the GFC. Unconventional monetary policies adopted by the United States and other AEs have
resulted in the surge of capital flows into EMEs as investors search for yield, leaving the latter
vulnerable to reversals of flows (such as those seen during the taper tantrum), credit booms and
surges in property prices. To counter this development, countries such as Malaysia and Indonesia
have more actively employed macroprudential measures to curb strong growth in the property sector,
typically via rules on the loan-to-value ratio, and in Malaysia’s case, additional measures such as
real property gains taxes, floor prices on foreign purchasers and maximum mortgage terms.
Contributed by: Ruperto Majuca and Jade Vichyanond.
20
Figure 14. ASEAN+3: FX Reserves Coverage, as of September 2017
Sources: IMF IFS; national agencies; The World Bank; and authors’ calculations. Notes: (i) The size of the bubbles show the relative amounts of FX reserves size across countries. Brunei is excluded given that it does not publish
external debt data. (ii) FX reserves data as of September 2017 are used to be consistent with the timing lag in the publication of import and short-term debt numbers.
Cambodia’s FX reserves are actually lower than the reported amount, which includes unrestricted foreign currency deposits parked at the National Bank of Cambodia.
(iii) Short-term external debt data for Lao PDR, Malaysia, Myanmar and Vietnam are only published on an annual basis and are as of end-2016. The latest quarterly import data are used for Lao PDR (June 2017) and Myanmar (March 2017).
China
Hong Kong
Japan
KoreaIndonesia
Malaysia
Philippines
Singapore
Thailand
Cambodia
Lao PDR
Myanmar
Vietnam
ASEAN average
ASEAN+3 average
0
5
10
15
20
25
0 1 2 3 4 5 6 7 8
Mo
nth
s i
mpo
rt c
ove
r
FX reserves to short-term external debt
100 percent threshold
3-month threshold
21
III. The Role of RFAs and the CMIM
A. RFAs in the IMS
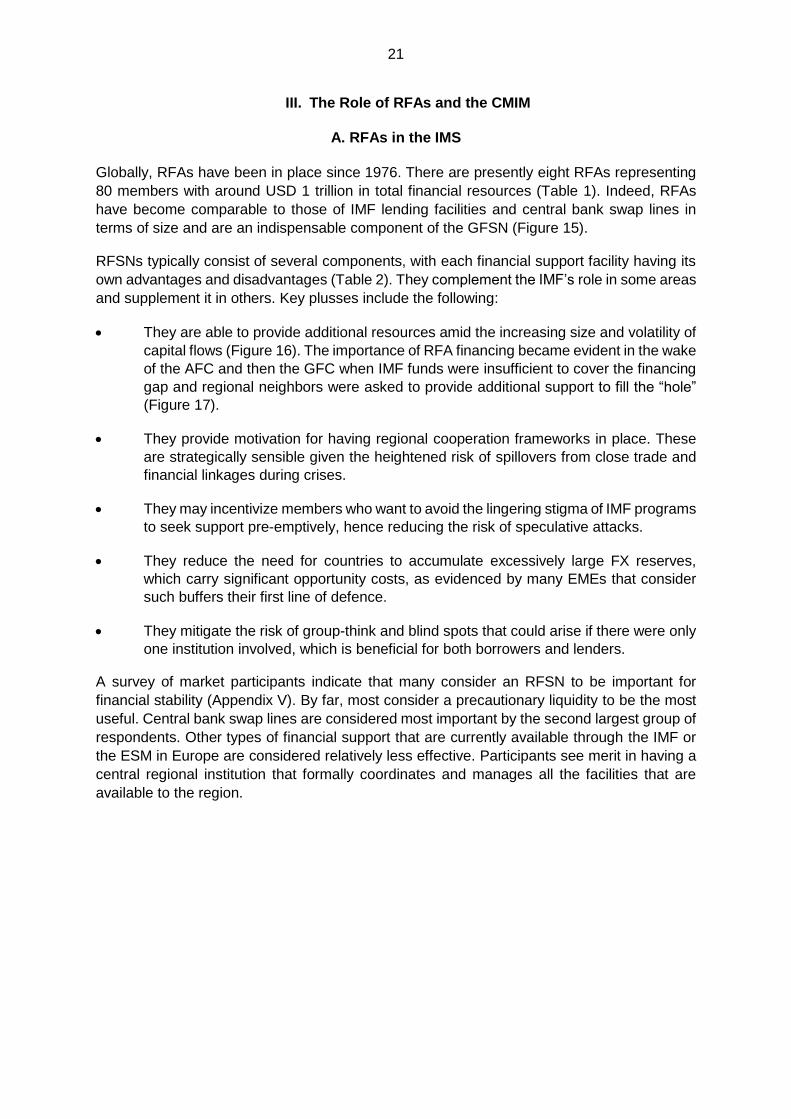
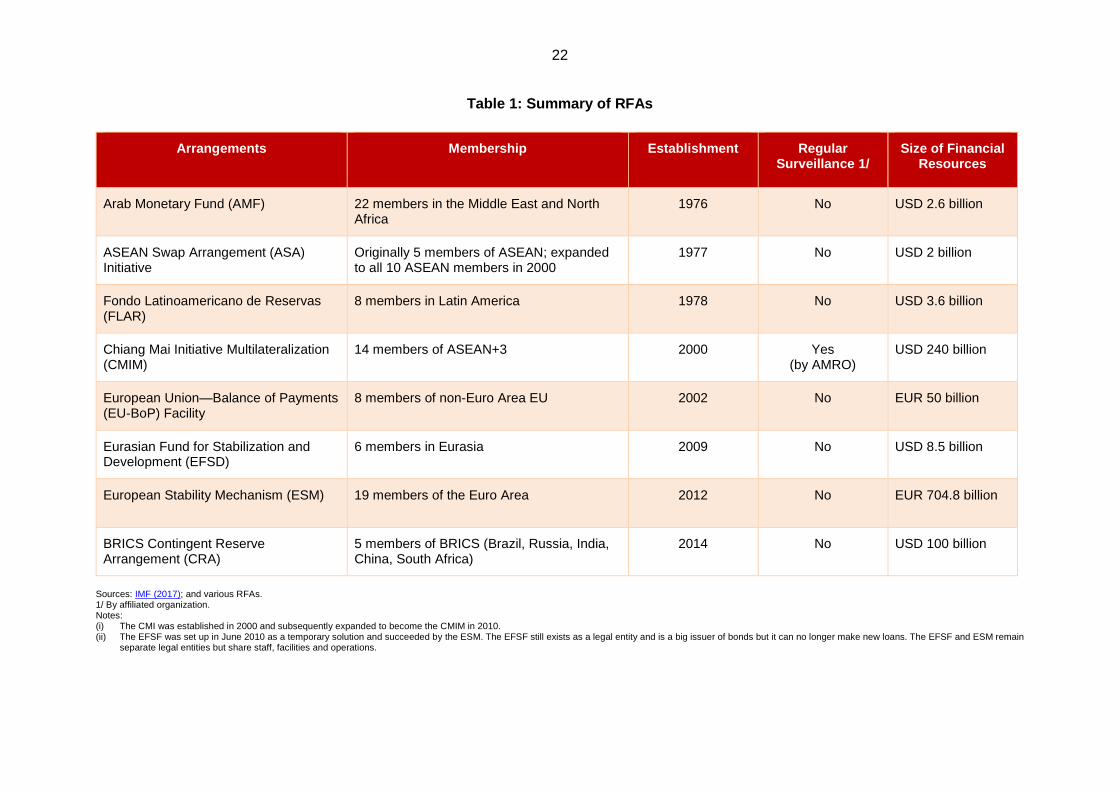
Globally, RFAs have been in place since 1976. There are presently eight RFAs representing
80 members with around USD 1 trillion in total financial resources (Table 1). Indeed, RFAs
have become comparable to those of IMF lending facilities and central bank swap lines in
terms of size and are an indispensable component of the GFSN (Figure 15).
RFSNs typically consist of several components, with each financial support facility having its
own advantages and disadvantages (Table 2). They complement the IMF’s role in some areas
and supplement it in others. Key plusses include the following:
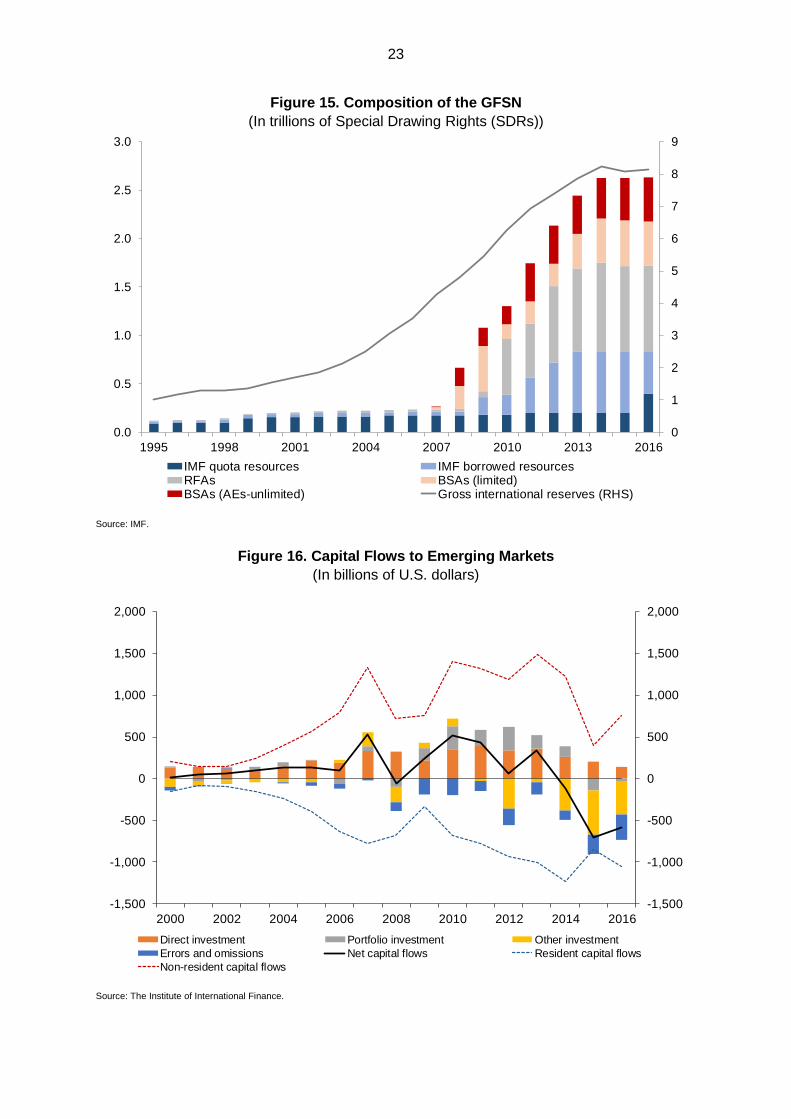
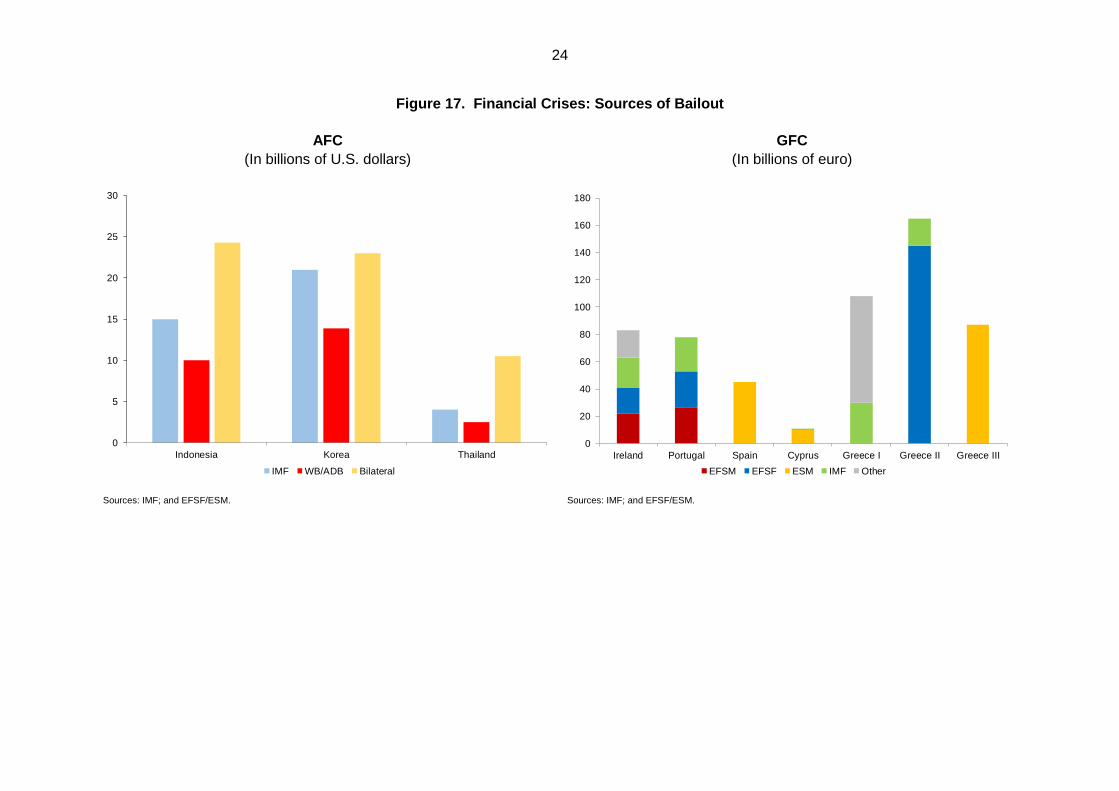
They are able to provide additional resources amid the increasing size and volatility of
capital flows (Figure 16). The importance of RFA financing became evident in the wake
of the AFC and then the GFC when IMF funds were insufficient to cover the financing
gap and regional neighbors were asked to provide additional support to fill the “hole”
(Figure 17).
They provide motivation for having regional cooperation frameworks in place. These
are strategically sensible given the heightened risk of spillovers from close trade and
financial linkages during crises.
They may incentivize members who want to avoid the lingering stigma of IMF programs
to seek support pre-emptively, hence reducing the risk of speculative attacks.
They reduce the need for countries to accumulate excessively large FX reserves,
which carry significant opportunity costs, as evidenced by many EMEs that consider
such buffers their first line of defence.
They mitigate the risk of group-think and blind spots that could arise if there were only
one institution involved, which is beneficial for both borrowers and lenders.
A survey of market participants indicate that many consider an RFSN to be important for
financial stability (Appendix V). By far, most consider a precautionary liquidity to be the most
useful. Central bank swap lines are considered most important by the second largest group of
respondents. Other types of financial support that are currently available through the IMF or
the ESM in Europe are considered relatively less effective. Participants see merit in having a
central regional institution that formally coordinates and manages all the facilities that are
available to the region.
22
Table 1: Summary of RFAs
Arrangements Membership Establishment Regular Surveillance 1/
Size of Financial Resources
Arab Monetary Fund (AMF) 22 members in the Middle East and North Africa
1976 No USD 2.6 billion
ASEAN Swap Arrangement (ASA) Initiative
Originally 5 members of ASEAN; expanded to all 10 ASEAN members in 2000
1977 No USD 2 billion
Fondo Latinoamericano de Reservas (FLAR)
8 members in Latin America 1978 No USD 3.6 billion
Chiang Mai Initiative Multilateralization (CMIM)
14 members of ASEAN+3 2000 Yes (by AMRO)
USD 240 billion
European Union—Balance of Payments (EU-BoP) Facility
8 members of non-Euro Area EU 2002 No EUR 50 billion
Eurasian Fund for Stabilization and Development (EFSD)
6 members in Eurasia 2009 No USD 8.5 billion
European Stability Mechanism (ESM) 19 members of the Euro Area 2012 No EUR 704.8 billion
BRICS Contingent Reserve Arrangement (CRA)
5 members of BRICS (Brazil, Russia, India, China, South Africa)
2014 No USD 100 billion
Sources: IMF (2017); and various RFAs. 1/ By affiliated organization. Notes: (i) The CMI was established in 2000 and subsequently expanded to become the CMIM in 2010. (ii) The EFSF was set up in June 2010 as a temporary solution and succeeded by the ESM. The EFSF still exists as a legal entity and is a big issuer of bonds but it can no longer make new loans. The EFSF and ESM remain
separate legal entities but share staff, facilities and operations.
23
Figure 15. Composition of the GFSN
(In trillions of Special Drawing Rights (SDRs))
Source: IMF.
Figure 16. Capital Flows to Emerging Markets
(In billions of U.S. dollars)
Source: The Institute of International Finance.
0
1
2
3
4
5
6
7
8
9
0.0
0.5
1.0
1.5
2.0
2.5
3.0
1995 1998 2001 2004 2007 2010 2013 2016
IMF quota resources IMF borrowed resourcesRFAs BSAs (limited)BSAs (AEs-unlimited) Gross international reserves (RHS)
-1,500
-1,000
-500
0
500
1,000
1,500
2,000
-1,500
-1,000
-500
0
500
1,000
1,500
2,000
2000 2002 2004 2006 2008 2010 2012 2014 2016
Tho
usa
nds
Direct investment Portfolio investment Other investment
Errors and omissions Net capital flows Resident capital flows
Non-resident capital flows
24
Figure 17. Financial Crises: Sources of Bailout
AFC
(In billions of U.S. dollars)
GFC
(In billions of euro)
Sources: IMF; and EFSF/ESM. Sources: IMF; and EFSF/ESM.
0
5
10
15
20
25
30
Indonesia Korea Thailand
IMF WB/ADB Bilateral
0
20
40
60
80
100
120
140
160
180
Ireland Portugal Spain Cyprus Greece I Greece II Greece III
EFSM EFSF ESM IMF Other
25
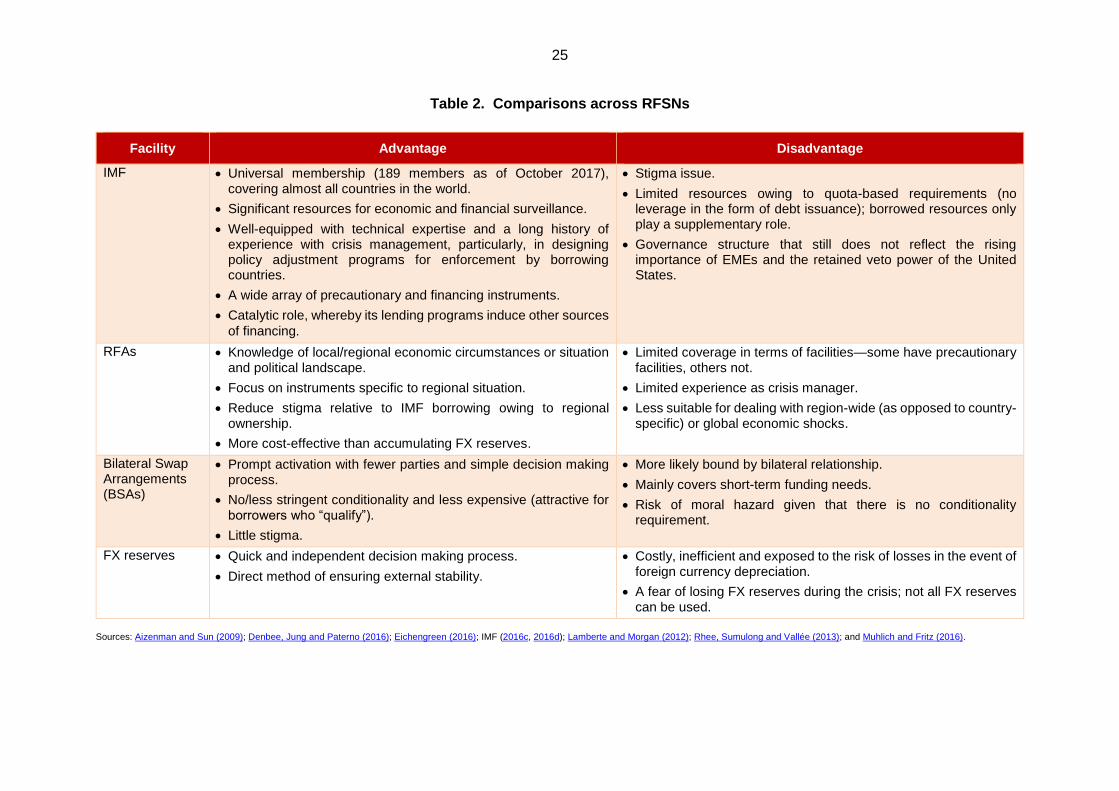
Table 2. Comparisons across RFSNs
Facility Advantage Disadvantage
IMF Universal membership (189 members as of October 2017), covering almost all countries in the world.
Significant resources for economic and financial surveillance.
Well-equipped with technical expertise and a long history of experience with crisis management, particularly, in designing policy adjustment programs for enforcement by borrowing countries.
A wide array of precautionary and financing instruments.
Catalytic role, whereby its lending programs induce other sources
of financing.
Stigma issue.
Limited resources owing to quota-based requirements (no leverage in the form of debt issuance); borrowed resources only play a supplementary role.
Governance structure that still does not reflect the rising importance of EMEs and the retained veto power of the United States.
RFAs Knowledge of local/regional economic circumstances or situation and political landscape.
Focus on instruments specific to regional situation.
Reduce stigma relative to IMF borrowing owing to regional ownership.
More cost-effective than accumulating FX reserves.
Limited coverage in terms of facilities—some have precautionary facilities, others not.
Limited experience as crisis manager.
Less suitable for dealing with region-wide (as opposed to country-specific) or global economic shocks.
Bilateral Swap Arrangements (BSAs)
Prompt activation with fewer parties and simple decision making process.
No/less stringent conditionality and less expensive (attractive for borrowers who “qualify”).
Little stigma.
More likely bound by bilateral relationship.
Mainly covers short-term funding needs.
Risk of moral hazard given that there is no conditionality requirement.
FX reserves Quick and independent decision making process.
Direct method of ensuring external stability.
Costly, inefficient and exposed to the risk of losses in the event of foreign currency depreciation.
A fear of losing FX reserves during the crisis; not all FX reserves can be used.
Sources: Aizenman and Sun (2009); Denbee, Jung and Paterno (2016); Eichengreen (2016); IMF (2016c, 2016d); Lamberte and Morgan (2012); Rhee, Sumulong and Vallée (2013); and Muhlich and Fritz (2016).
26
B. Readiness of the CMI and CMIM
The CMI was introduced in the aftermath of the AFC in response to countries’ dissatisfaction
with the perceived heavy-handedness and undue harshness of IMF programs in the region.
Japan’s proposal to set up the Asian Monetary Fund soon after Thailand approached the IMF
for support in July 1997 eventually led to the establishment of the “Manila Framework” in
November 1999, which was aimed at promoting regional peer surveillance.7 The ASEAN+3
Finance Ministers’ Meeting in May 2000 subsequently noted the “need to establish a regional
financing arrangement to supplement the existing international facilities” (ASEAN+3, 2000).
The CMI features BSAs that are underpinned by the FX reserves of the ASEAN+3; it was
expanded and multilaterized to become the CMIM in 2010 after the GFC.
However, the CMI was not called upon during the GFC with some countries opting instead to
use other facilities. Korea, Singapore and Indonesia requested BSAs: Korea approached the
United States (October 2008), China (December 2008) and Japan (December 2008) to
maintain liquidity and support confidence in its markets; Singapore established a bilateral
swap with the United States and Japan. Indonesia secured USD 5.5 billion of funding from the
World Bank, the ADB, Australia and Japan.
So why did countries eschew the CMI during the GFC and the CMIM during the 2013 “taper
tantrum”? In the wake of the AFC, Asian countries implemented reforms and adopted policies
that strengthened their economic fundamentals and financial systems, which subsequently
increased their resilience against the impact of the GFC. For members who came under
liquidity pressure, their reluctance to use the CMI facility has been attributed to several factors:
“IMF stigma” of the CMI and CMIM. The high IMF-linked portion of the CMI/CMIM
evoked the possibility of eventual IMF involvement, which raised concerns about the
stigma of an IMF program for Asian countries (Eichengreen, 2016; Grimes, 2011;
Lamberte and Morgan, 2012; Kawai, 2015). The conditionality requirement of the
CMIM further added to the negative association with IMF programs during the AFC.
Lack of operational readiness of an untested CMIM. At the time of the taper tantrum,
technical operational guidelines had not been put in place nor had test runs been
conducted. Also, bilateral local currency accounts had not been established.
Limited size of the CMI. The CMI facility was too small to be effective (West, 2017). In
May 2008, members reached an in-principle agreement on a self-managed reserve
pooling arrangement, the total size of which was about USD 80 billion. As of end-2008,
the then-CMI amounted to USD 83 billion on a bilateral basis.8
Lack of precautionary liquidity facility. The CMIM only had a stability facility for actual
funding needs at that time but no precautionary liquidity facility (Kawai, 2015).
Lack of conditionality and strong surveillance. There was neither a surveillance unit to
support the CMI/CMIM (Rana, 2011) nor a conditionality framework to support a
program (Siregar and Chabchitrchaidol, 2013). Consequently, potential borrowers
7 The Manila Framework was terminated in 2004.
8 Korea’s share was USD 23 billion under CMI as of end-2008, which was equivalent to 2 percent of GDP at the time; Singapore was entitled to USD 3 billion or 1.7 percent of its 2008 GDP.
27
were concerned that members would be reluctant to lend without any assurance of
repayment in the face of moral hazard considerations.
The CMIM remains at an early stage although progress has been made towards addressing
some of the initial concerns:
In March 2010, the CMIM Agreement came into effect with a facility for USD 120 billion;
the size was doubled to USD 240 billion in July 2014.
In July 2014, a precautionary facility was introduced, the IMF de-linked portion was
raised to 30 percent and the maturity of the CMIM facilities was extended.
AMRO was established in April 2011 as the surveillance unit of the CMIM and
upgraded to International Organization status in February 2016.
More recently, the effectiveness of the CMIM has been reviewed through test runs,
peacetime preparations and periodic reviews in the context of the enhanced GFSN.
The capacity of AMRO has been improved in terms of surveillance, supporting the
implementation of the CMIM, and providing technical assistance to members
(Nemoto, 2015a, 2015b).
Nonetheless, areas such as operational readiness, surveillance capacity, facility design and
uncertainties around the evolving GFSN remain works-in-progress.
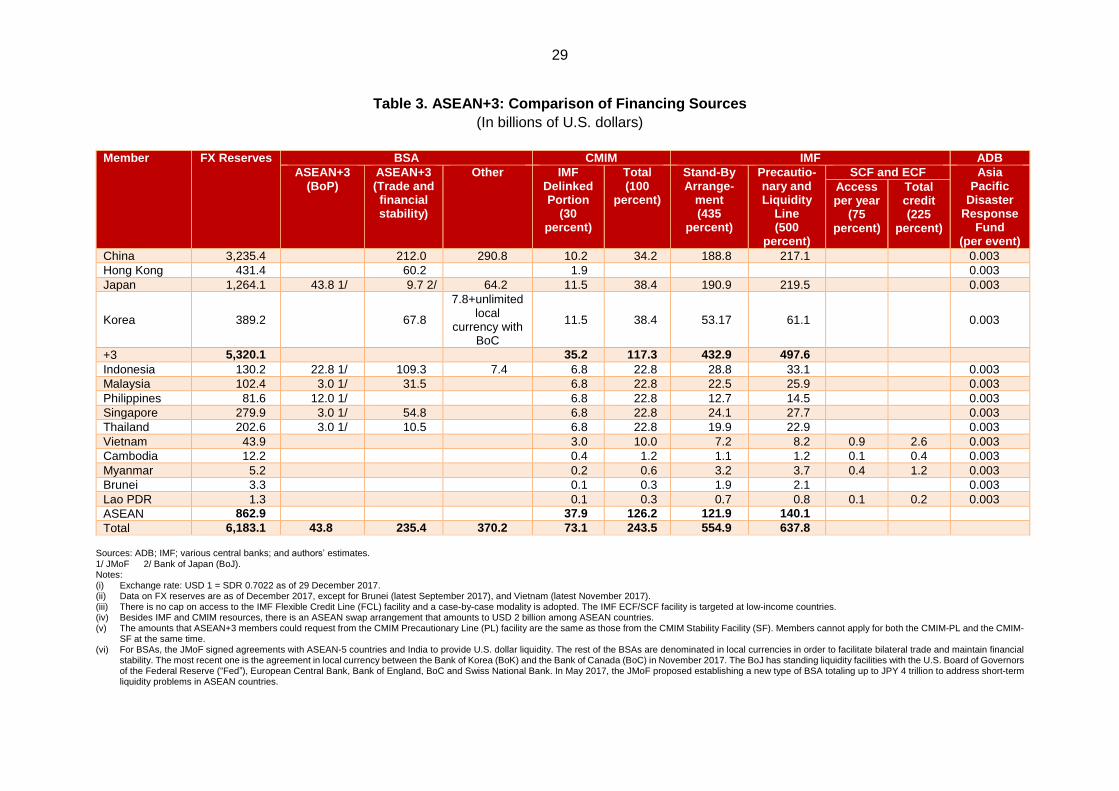
C. Regional Buffers The ASEAN+3 countries have several options in the event that financing is needed. A
comparison of financing sources reveals that there is no one best option for all countries, with
some facilities able to provide more support for some countries relative to others (Table 3):
FX reserves represent the most sizable buffer for the ASEAN+3 economies (Figure
15). The FX reserves (defined here as “international reserves including gold”) of the
ASEAN+3 countries account for almost half of the world total of USD 12.8 trillion as of
end-2017, with those of the Middle-East and North Africa group of countries a distant
second at 8.1 percent of the total (Figure 18). In absolute terms, China holds the largest
amount at USD 3.2 trillion while Japan accounts for USD 1.3 trillion. ASEAN countries
plus Korea make up the remainder. However, adequacy differs among the +3 and
bigger ASEAN economies compared to Lao PDR, Myanmar and Vietnam (Figure 14).
The major ASEAN countries have accumulated a considerable amount of FX reserves
since the AFC: The FX reserves of Indonesia, Thailand and the Philippines are able to
cover around nine months of imports and are at least twice their respective accessible
amounts at the CMIM or IMF. On the other hand, the FX reserves in Lao PDR,
Myanmar and Vietnam are below or only just at the borderline of the conventional
three-month import threshold.
For some ASEAN countries, namely, Indonesia, Singapore and Malaysia, the size of
BSAs significantly exceeds the maximum amount of the CMIM swap and IMF
arrangement (Box 2). The combined size of BSAs in the ASEAN+3 region is over USD
290 billion; the majority of BSAs are denominated in local currencies, with China and
Japan the biggest contributors in the region. The objective of the majority of regional
BSAs is to promote bilateral trade and investment and maintain bilateral financial
28
stability. However, those of the Japan Ministry of Finance (JMoF) have short-term U.S.
dollar liquidity and BoP objectives and are linked to the CMIM and to IMF arrangements.
For some ASEAN members, the maximum amounts that CMIM facilities are able to
provide are comparable to or larger than those from the IMF. Different purchasing
multiples were designed for ASEAN members during the CMI multilateralization
process to improve support.
It is clear that Cambodia, Lao PDR, Myanmar and Vietnam (CLMV) are disadvantaged in
terms of financial safety nets. Their FX reserves buffers are weak; they do not have any BSA
arrangement with regional members; and they are only able to access relatively small amounts
of financing from both the CMIM and IMF (Box 3). While the IMF has established concessional
facilities for low-income countries, such as the Extended Credit Facility (ECF), Standby Credit
Facility (SCF) and Rapid Credit Facility (RCF) under the Poverty Reduction and Growth Trust
(PRGT), these amounts are also limited.
29
Table 3. ASEAN+3: Comparison of Financing Sources
(In billions of U.S. dollars)
Member FX Reserves
BSA CMIM IMF ADB
ASEAN+3 (BoP)
ASEAN+3 (Trade and financial stability)
Other IMF Delinked Portion
(30 percent)
Total (100
percent)
Stand-By Arrange-
ment (435
percent)
Precautio-nary and Liquidity
Line (500
percent)
SCF and ECF Asia Pacific
Disaster Response
Fund (per event)
Access per year
(75 percent)
Total credit (225
percent)
China 3,235.4 212.0 290.8 10.2 34.2 188.8 217.1 0.003
Hong Kong 431.4 60.2 1.9 0.003
Japan 1,264.1 43.8 1/ 9.7 2/ 64.2 11.5 38.4 190.9 219.5 0.003
Korea 389.2 67.8
7.8+unlimited local
currency with BoC
11.5 38.4 53.17 61.1 0.003
+3 5,320.1 35.2 117.3 432.9 497.6
Indonesia 130.2 22.8 1/ 109.3 7.4 6.8 22.8 28.8 33.1 0.003
Malaysia 102.4 3.0 1/ 31.5 6.8 22.8 22.5 25.9 0.003
Philippines 81.6 12.0 1/ 6.8 22.8 12.7 14.5 0.003
Singapore 279.9 3.0 1/ 54.8 6.8 22.8 24.1 27.7 0.003
Thailand 202.6 3.0 1/ 10.5 6.8 22.8 19.9 22.9 0.003
Vietnam 43.9 3.0 10.0 7.2 8.2 0.9 2.6 0.003
Cambodia 12.2 0.4 1.2 1.1 1.2 0.1 0.4 0.003
Myanmar 5.2 0.2 0.6 3.2 3.7 0.4 1.2 0.003
Brunei 3.3 0.1 0.3 1.9 2.1 0.003
Lao PDR 1.3 0.1 0.3 0.7 0.8 0.1 0.2 0.003
ASEAN 862.9 37.9 126.2 121.9 140.1
Total 6,183.1 43.8 235.4 370.2 73.1 243.5 554.9 637.8 Sources: ADB; IMF; various central banks; and authors’ estimates. 1/ JMoF 2/ Bank of Japan (BoJ). Notes: (i) Exchange rate: USD 1 = SDR 0.7022 as of 29 December 2017. (ii) Data on FX reserves are as of December 2017, except for Brunei (latest September 2017), and Vietnam (latest November 2017). (iii) There is no cap on access to the IMF Flexible Credit Line (FCL) facility and a case-by-case modality is adopted. The IMF ECF/SCF facility is targeted at low-income countries. (iv) Besides IMF and CMIM resources, there is an ASEAN swap arrangement that amounts to USD 2 billion among ASEAN countries. (v) The amounts that ASEAN+3 members could request from the CMIM Precautionary Line (PL) facility are the same as those from the CMIM Stability Facility (SF). Members cannot apply for both the CMIM-PL and the CMIM-
SF at the same time. (vi) For BSAs, the JMoF signed agreements with ASEAN-5 countries and India to provide U.S. dollar liquidity. The rest of the BSAs are denominated in local currencies in order to facilitate bilateral trade and maintain financial
stability. The most recent one is the agreement in local currency between the Bank of Korea (BoK) and the Bank of Canada (BoC) in November 2017. The BoJ has standing liquidity facilities with the U.S. Board of Governors of the Federal Reserve (“Fed”), European Central Bank, Bank of England, BoC and Swiss National Bank. In May 2017, the JMoF proposed establishing a new type of BSA totaling up to JPY 4 trillion to address short-term liquidity problems in ASEAN countries.
30
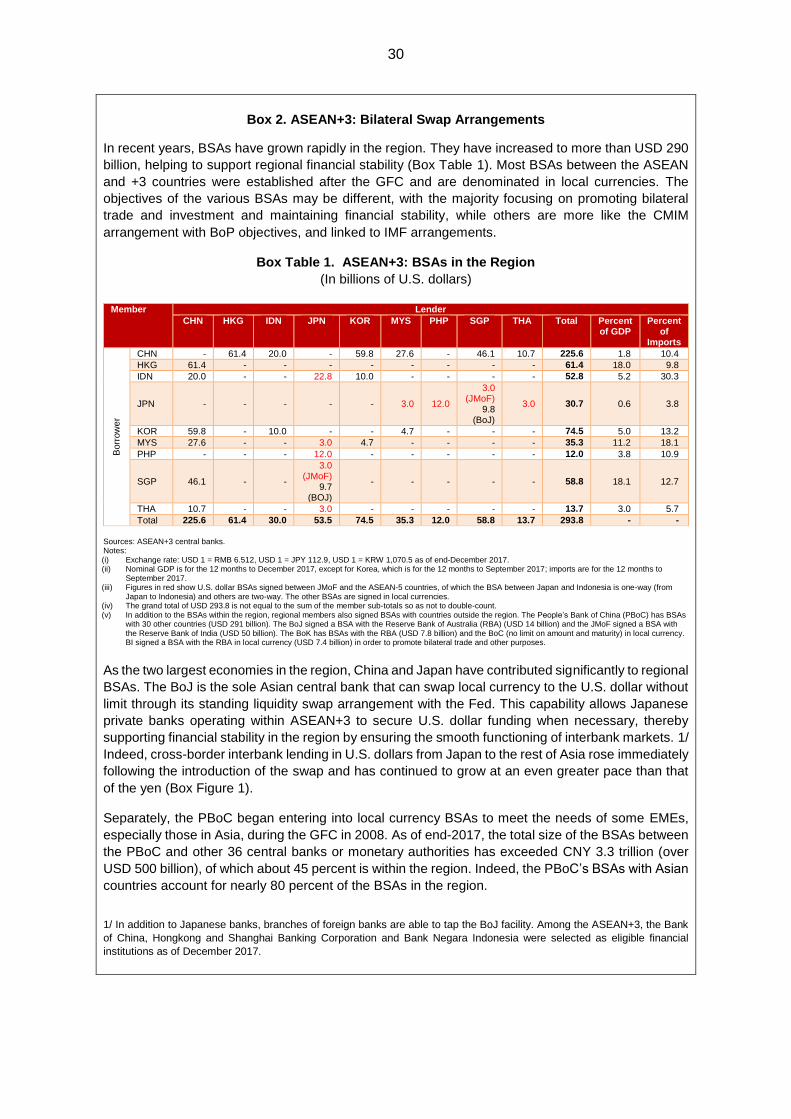
Box 2. ASEAN+3: Bilateral Swap Arrangements
In recent years, BSAs have grown rapidly in the region. They have increased to more than USD 290
billion, helping to support regional financial stability (Box Table 1). Most BSAs between the ASEAN
and +3 countries were established after the GFC and are denominated in local currencies. The
objectives of the various BSAs may be different, with the majority focusing on promoting bilateral
trade and investment and maintaining financial stability, while others are more like the CMIM
arrangement with BoP objectives, and linked to IMF arrangements.
Box Table 1. ASEAN+3: BSAs in the Region
(In billions of U.S. dollars)
Member Lender
CHN HKG IDN JPN KOR MYS PHP SGP THA Total Percent of GDP
Percent of
Imports
Borr
ow
er
CHN - 61.4 20.0 - 59.8 27.6 - 46.1 10.7 225.6 1.8 10.4
HKG 61.4 - - - - - - - - 61.4 18.0 9.8
IDN 20.0 - - 22.8 10.0 - - - - 52.8 5.2 30.3
JPN - - - - - 3.0 12.0
3.0 (JMoF)
9.8 (BoJ)
3.0 30.7 0.6 3.8
KOR 59.8 - 10.0 - - 4.7 - - - 74.5 5.0 13.2
MYS 27.6 - - 3.0 4.7 - - - - 35.3 11.2 18.1
PHP - - - 12.0 - - - - - 12.0 3.8 10.9
SGP 46.1 - -
3.0 (JMoF)
9.7 (BOJ)
- - - - - 58.8 18.1 12.7
THA 10.7 - - 3.0 - - - - - 13.7 3.0 5.7
Total 225.6 61.4 30.0 53.5 74.5 35.3 12.0 58.8 13.7 293.8 - -
Sources: ASEAN+3 central banks. Notes: (i) Exchange rate: USD 1 = RMB 6.512, USD 1 = JPY 112.9, USD 1 = KRW 1,070.5 as of end-December 2017. (ii) Nominal GDP is for the 12 months to December 2017, except for Korea, which is for the 12 months to September 2017; imports are for the 12 months to
September 2017. (iii) Figures in red show U.S. dollar BSAs signed between JMoF and the ASEAN-5 countries, of which the BSA between Japan and Indonesia is one-way (from
Japan to Indonesia) and others are two-way. The other BSAs are signed in local currencies. (iv) The grand total of USD 293.8 is not equal to the sum of the member sub-totals so as not to double-count. (v) In addition to the BSAs within the region, regional members also signed BSAs with countries outside the region. The People’s Bank of China (PBoC) has BSAs
with 30 other countries (USD 291 billion). The BoJ signed a BSA with the Reserve Bank of Australia (RBA) (USD 14 billion) and the JMoF signed a BSA with the Reserve Bank of India (USD 50 billion). The BoK has BSAs with the RBA (USD 7.8 billion) and the BoC (no limit on amount and maturity) in local currency. BI signed a BSA with the RBA in local currency (USD 7.4 billion) in order to promote bilateral trade and other purposes.
As the two largest economies in the region, China and Japan have contributed significantly to regional
BSAs. The BoJ is the sole Asian central bank that can swap local currency to the U.S. dollar without
limit through its standing liquidity swap arrangement with the Fed. This capability allows Japanese
private banks operating within ASEAN+3 to secure U.S. dollar funding when necessary, thereby
supporting financial stability in the region by ensuring the smooth functioning of interbank markets. 1/
Indeed, cross-border interbank lending in U.S. dollars from Japan to the rest of Asia rose immediately
following the introduction of the swap and has continued to grow at an even greater pace than that
of the yen (Box Figure 1).
Separately, the PBoC began entering into local currency BSAs to meet the needs of some EMEs,
especially those in Asia, during the GFC in 2008. As of end-2017, the total size of the BSAs between
the PBoC and other 36 central banks or monetary authorities has exceeded CNY 3.3 trillion (over
USD 500 billion), of which about 45 percent is within the region. Indeed, the PBoC’s BSAs with Asian
countries account for nearly 80 percent of the BSAs in the region.
1/ In addition to Japanese banks, branches of foreign banks are able to tap the BoJ facility. Among the ASEAN+3, the Bank
of China, Hongkong and Shanghai Banking Corporation and Bank Negara Indonesia were selected as eligible financial
institutions as of December 2017.
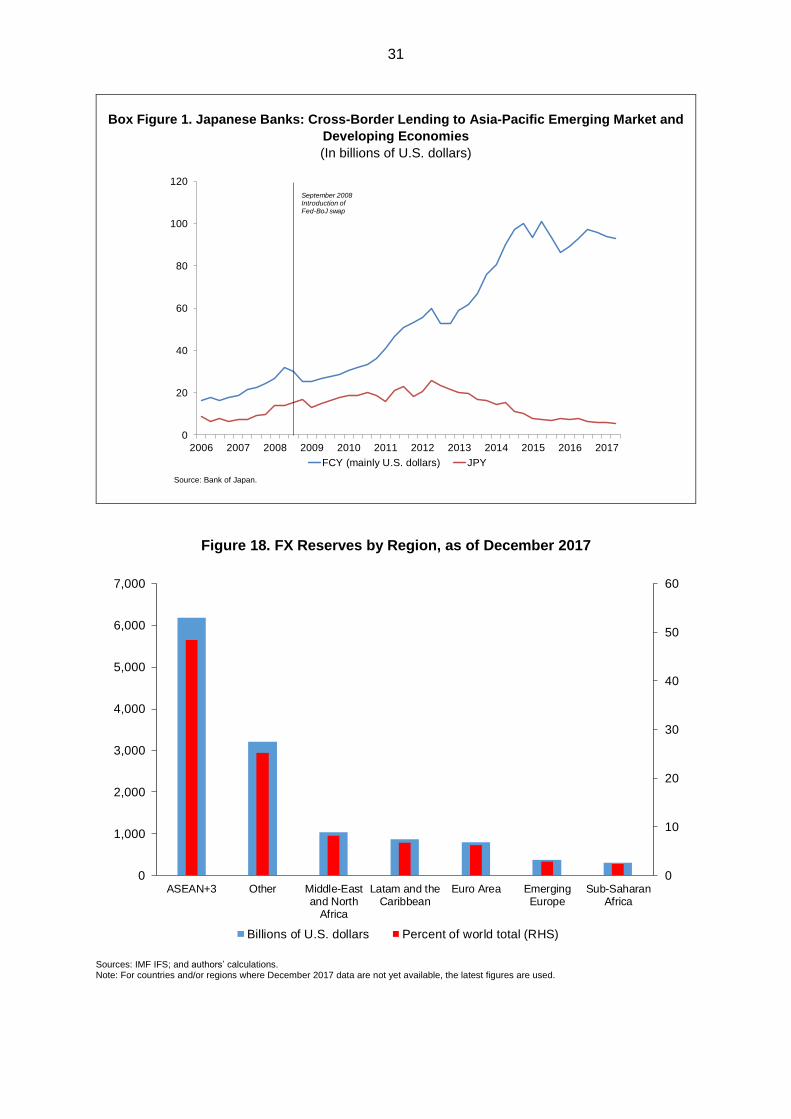
31
Box Figure 1. Japanese Banks: Cross-Border Lending to Asia-Pacific Emerging Market and
Developing Economies
(In billions of U.S. dollars)
Source: Bank of Japan.
Figure 18. FX Reserves by Region, as of December 2017
Sources: IMF IFS; and authors’ calculations. Note: For countries and/or regions where December 2017 data are not yet available, the latest figures are used.
0
20
40
60
80
100
120
2006 2007 2008 2009 2010 2011 2012 2013 2014 2015 2016 2017
FCY (mainly U.S. dollars) JPY
September 2008Introduction of Fed-BoJ swap
0
10
20
30
40
50
60
0
1,000
2,000
3,000
4,000
5,000
6,000
7,000
ASEAN+3 Other Middle-Eastand North
Africa
Latam and theCaribbean
Euro Area EmergingEurope
Sub-SaharanAfrica
Billions of U.S. dollars Percent of world total (RHS)
32
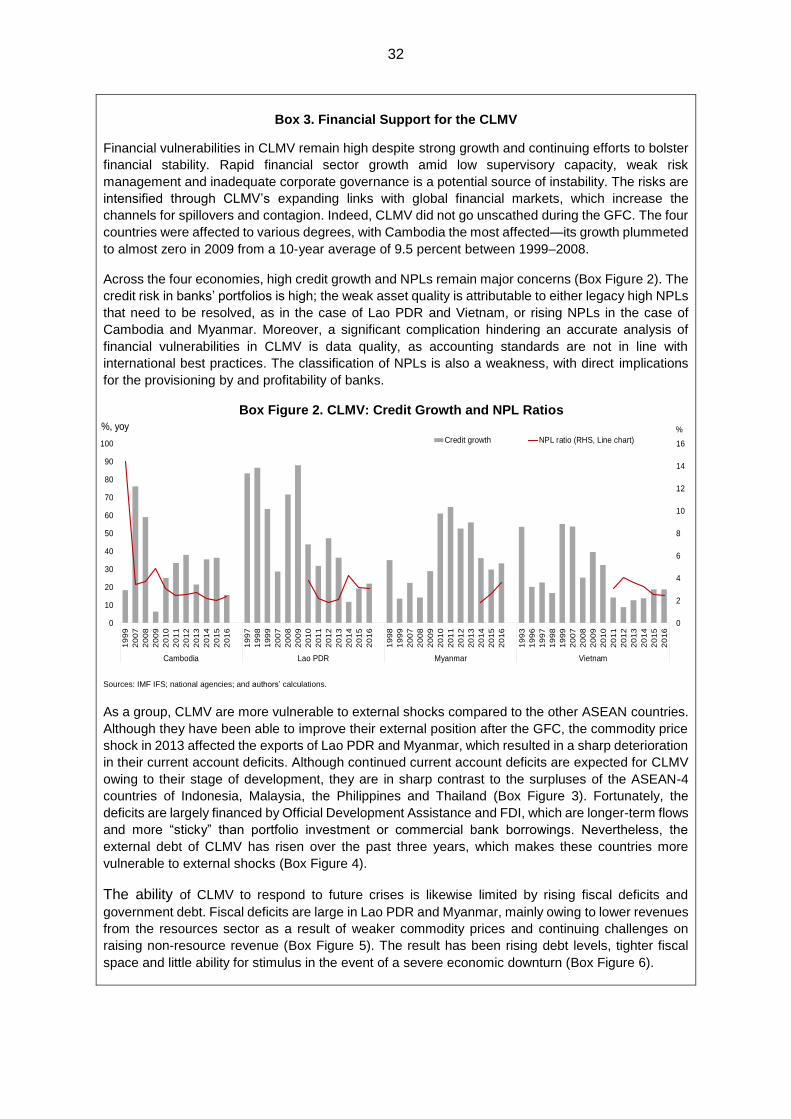
Box 3. Financial Support for the CLMV
Financial vulnerabilities in CLMV remain high despite strong growth and continuing efforts to bolster
financial stability. Rapid financial sector growth amid low supervisory capacity, weak risk
management and inadequate corporate governance is a potential source of instability. The risks are
intensified through CLMV’s expanding links with global financial markets, which increase the
channels for spillovers and contagion. Indeed, CLMV did not go unscathed during the GFC. The four
countries were affected to various degrees, with Cambodia the most affected—its growth plummeted
to almost zero in 2009 from a 10-year average of 9.5 percent between 1999–2008.
Across the four economies, high credit growth and NPLs remain major concerns (Box Figure 2). The
credit risk in banks’ portfolios is high; the weak asset quality is attributable to either legacy high NPLs
that need to be resolved, as in the case of Lao PDR and Vietnam, or rising NPLs in the case of
Cambodia and Myanmar. Moreover, a significant complication hindering an accurate analysis of
financial vulnerabilities in CLMV is data quality, as accounting standards are not in line with
international best practices. The classification of NPLs is also a weakness, with direct implications
for the provisioning by and profitability of banks.
Box Figure 2. CLMV: Credit Growth and NPL Ratios
Sources: IMF IFS; national agencies; and authors’ calculations.
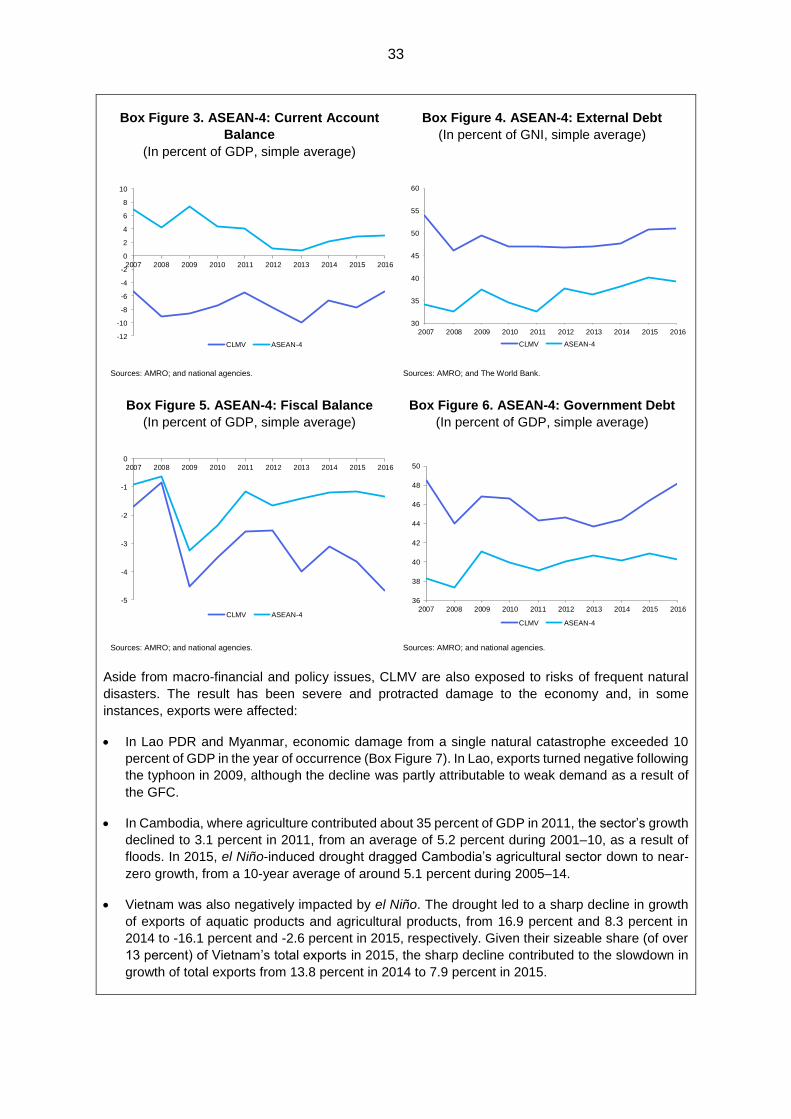
As a group, CLMV are more vulnerable to external shocks compared to the other ASEAN countries.
Although they have been able to improve their external position after the GFC, the commodity price
shock in 2013 affected the exports of Lao PDR and Myanmar, which resulted in a sharp deterioration
in their current account deficits. Although continued current account deficits are expected for CLMV
owing to their stage of development, they are in sharp contrast to the surpluses of the ASEAN-4
countries of Indonesia, Malaysia, the Philippines and Thailand (Box Figure 3). Fortunately, the
deficits are largely financed by Official Development Assistance and FDI, which are longer-term flows
and more “sticky” than portfolio investment or commercial bank borrowings. Nevertheless, the
external debt of CLMV has risen over the past three years, which makes these countries more
vulnerable to external shocks (Box Figure 4).
The ability of CLMV to respond to future crises is likewise limited by rising fiscal deficits and
government debt. Fiscal deficits are large in Lao PDR and Myanmar, mainly owing to lower revenues
from the resources sector as a result of weaker commodity prices and continuing challenges on
raising non-resource revenue (Box Figure 5). The result has been rising debt levels, tighter fiscal
space and little ability for stimulus in the event of a severe economic downturn (Box Figure 6).
0
2
4
6
8
10
12
14
16
0
10
20
30
40
50
60
70
80
90
100
19
99
20
07
20
08
20
09
20
10
20
11
20
12
20
13
20
14
20
15
20
16
19
97
19
98
19
99
20
07
20
08
20
09
20
10
20
11
20
12
20
13
20
14
20
15
20
16
19
98
19
99
20
07
20
08
20
09
20
10
20
11
20
12
20
13
20
14
20
15
20
16
19
93
19
96
19
97
19
98
19
99
20
07
20
08
20
09
20
10
20
11
20
12
20
13
20
14
20
15
20
16
Cambodia Lao PDR Myanmar Vietnam
%, yoy
Credit growth NPL ratio (RHS, Line chart)
%
33
Box Figure 3. ASEAN-4: Current Account
Balance
(In percent of GDP, simple average)
Box Figure 4. ASEAN-4: External Debt
(In percent of GNI, simple average)
Sources: AMRO; and national agencies. Sources: AMRO; and The World Bank.
Box Figure 5. ASEAN-4: Fiscal Balance
(In percent of GDP, simple average)
Box Figure 6. ASEAN-4: Government Debt
(In percent of GDP, simple average)
Sources: AMRO; and national agencies. Sources: AMRO; and national agencies.
Aside from macro-financial and policy issues, CLMV are also exposed to risks of frequent natural
disasters. The result has been severe and protracted damage to the economy and, in some
instances, exports were affected:
In Lao PDR and Myanmar, economic damage from a single natural catastrophe exceeded 10
percent of GDP in the year of occurrence (Box Figure 7). In Lao, exports turned negative following
the typhoon in 2009, although the decline was partly attributable to weak demand as a result of
the GFC.
In Cambodia, where agriculture contributed about 35 percent of GDP in 2011, the sector’s growth
declined to 3.1 percent in 2011, from an average of 5.2 percent during 2001–10, as a result of
floods. In 2015, el Niño-induced drought dragged Cambodia’s agricultural sector down to near-
zero growth, from a 10-year average of around 5.1 percent during 2005–14.
Vietnam was also negatively impacted by el Niño. The drought led to a sharp decline in growth
of exports of aquatic products and agricultural products, from 16.9 percent and 8.3 percent in
2014 to -16.1 percent and -2.6 percent in 2015, respectively. Given their sizeable share (of over
13 percent) of Vietnam’s total exports in 2015, the sharp decline contributed to the slowdown in
growth of total exports from 13.8 percent in 2014 to 7.9 percent in 2015.
-12
-10
-8
-6
-4
-2
0
2
4
6
8
10
2007 2008 2009 2010 2011 2012 2013 2014 2015 2016
CLMV ASEAN-4
30
35
40
45
50
55
60
2007 2008 2009 2010 2011 2012 2013 2014 2015 2016
CLMV ASEAN-4
-5
-4
-3
-2
-1
0
2007 2008 2009 2010 2011 2012 2013 2014 2015 2016
CLMV ASEAN-4
36
38
40
42
44
46
48
50
2007 2008 2009 2010 2011 2012 2013 2014 2015 2016
CLMV ASEAN-4
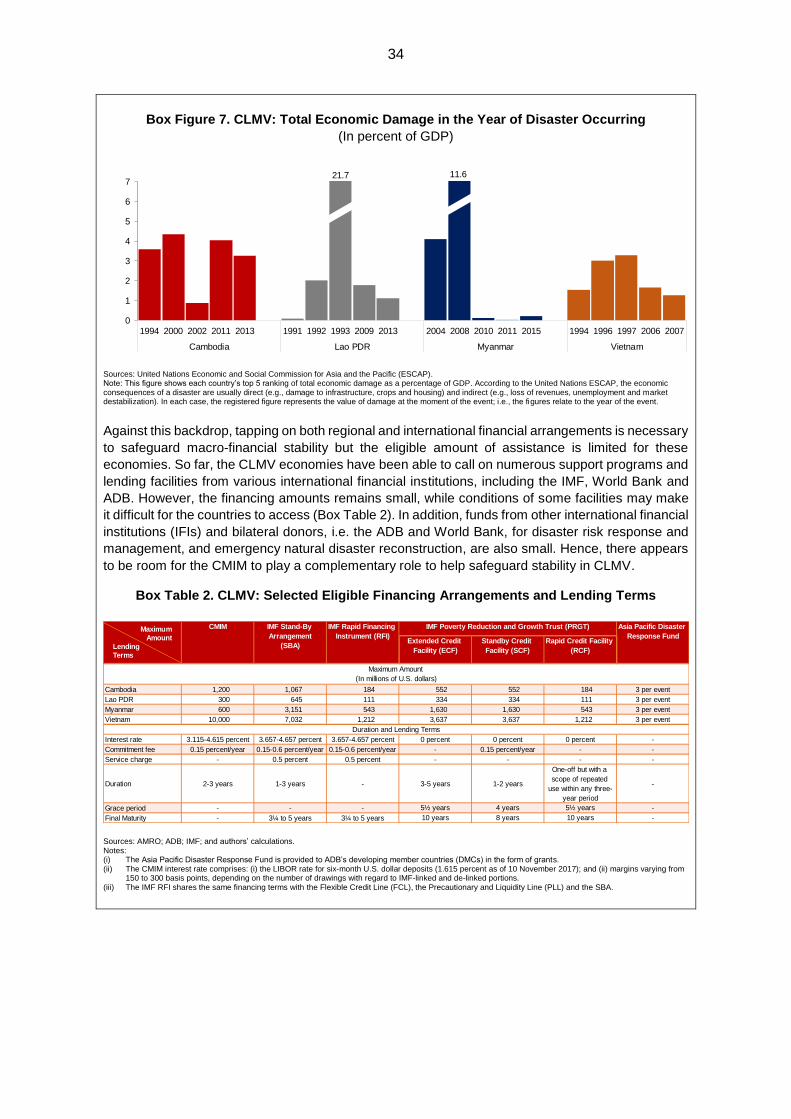
34
Box Figure 7. CLMV: Total Economic Damage in the Year of Disaster Occurring
(In percent of GDP)
Sources: United Nations Economic and Social Commission for Asia and the Pacific (ESCAP). Note: This figure shows each country’s top 5 ranking of total economic damage as a percentage of GDP. According to the United Nations ESCAP, the economic consequences of a disaster are usually direct (e.g., damage to infrastructure, crops and housing) and indirect (e.g., loss of revenues, unemployment and market destabilization). In each case, the registered figure represents the value of damage at the moment of the event; i.e., the figures relate to the year of the event.
Against this backdrop, tapping on both regional and international financial arrangements is necessary
to safeguard macro-financial stability but the eligible amount of assistance is limited for these
economies. So far, the CLMV economies have been able to call on numerous support programs and
lending facilities from various international financial institutions, including the IMF, World Bank and
ADB. However, the financing amounts remains small, while conditions of some facilities may make
it difficult for the countries to access (Box Table 2). In addition, funds from other international financial
institutions (IFIs) and bilateral donors, i.e. the ADB and World Bank, for disaster risk response and
management, and emergency natural disaster reconstruction, are also small. Hence, there appears
to be room for the CMIM to play a complementary role to help safeguard stability in CLMV.
Box Table 2. CLMV: Selected Eligible Financing Arrangements and Lending Terms
Sources: AMRO; ADB; IMF; and authors’ calculations. Notes: (i) The Asia Pacific Disaster Response Fund is provided to ADB’s developing member countries (DMCs) in the form of grants. (ii) The CMIM interest rate comprises: (i) the LIBOR rate for six-month U.S. dollar deposits (1.615 percent as of 10 November 2017); and (ii) margins varying from
150 to 300 basis points, depending on the number of drawings with regard to IMF-linked and de-linked portions. (iii) The IMF RFI shares the same financing terms with the Flexible Credit Line (FCL), the Precautionary and Liquidity Line (PLL) and the SBA.
0
1
2
3
4
5
6
7
1994 2000 2002 2011 2013 1991 1992 1993 2009 2013 2004 2008 2010 2011 2015 1994 1996 1997 2006 2007
Cambodia Lao PDR Myanmar Vietnam
21.7 11.6
Extended Credit
Facility (ECF)
Standby Credit
Facility (SCF)
Rapid Credit Facility
(RCF)
Cambodia 1,200 1,067 184 552 552 184 3 per event
Lao PDR 300 645 111 334 334 111 3 per event
Myanmar 600 3,151 543 1,630 1,630 543 3 per event
Vietnam 10,000 7,032 1,212 3,637 3,637 1,212 3 per event
Interest rate 3.115-4.615 percent 3.657-4.657 percent 3.657-4.657 percent 0 percent 0 percent 0 percent -
Commitment fee 0.15 percent/year 0.15-0.6 percent/year 0.15-0.6 percent/year - 0.15 percent/year - -
Service charge - 0.5 percent 0.5 percent - - - -
Duration 2-3 years 1-3 years - 3-5 years 1-2 years
One-off but with a
scope of repeated
use within any three-
year period
-
Grace period - - - 5½ years 4 years 5½ years -
Final Maturity - 3¼ to 5 years 3¼ to 5 years 10 years 8 years 10 years -
Maximum Amount
(In millions of U.S. dollars)
Duration and Lending Terms
IMF Stand-By
Arrangement
(SBA)
CMIM IMF Poverty Reduction and Growth Trust (PRGT)IMF Rapid Financing
Instrument (RFI)
Asia Pacific Disaster
Response FundMaximum
Amount
Lending
Terms
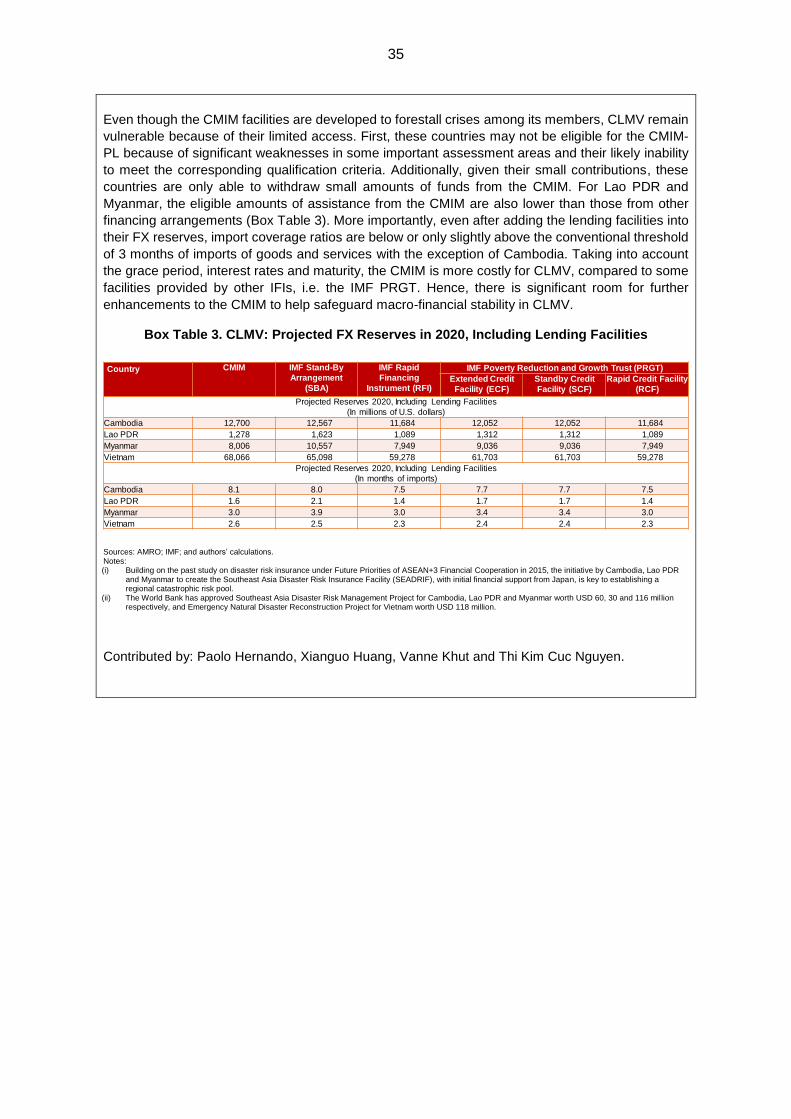
35
Even though the CMIM facilities are developed to forestall crises among its members, CLMV remain
vulnerable because of their limited access. First, these countries may not be eligible for the CMIM-
PL because of significant weaknesses in some important assessment areas and their likely inability
to meet the corresponding qualification criteria. Additionally, given their small contributions, these
countries are only able to withdraw small amounts of funds from the CMIM. For Lao PDR and
Myanmar, the eligible amounts of assistance from the CMIM are also lower than those from other
financing arrangements (Box Table 3). More importantly, even after adding the lending facilities into
their FX reserves, import coverage ratios are below or only slightly above the conventional threshold
of 3 months of imports of goods and services with the exception of Cambodia. Taking into account
the grace period, interest rates and maturity, the CMIM is more costly for CLMV, compared to some
facilities provided by other IFIs, i.e. the IMF PRGT. Hence, there is significant room for further
enhancements to the CMIM to help safeguard macro-financial stability in CLMV.
Box Table 3. CLMV: Projected FX Reserves in 2020, Including Lending Facilities
Sources: AMRO; IMF; and authors’ calculations. Notes: (i) Building on the past study on disaster risk insurance under Future Priorities of ASEAN+3 Financial Cooperation in 2015, the initiative by Cambodia, Lao PDR
and Myanmar to create the Southeast Asia Disaster Risk Insurance Facility (SEADRIF), with initial financial support from Japan, is key to establishing a regional catastrophic risk pool.
(ii) The World Bank has approved Southeast Asia Disaster Risk Management Project for Cambodia, Lao PDR and Myanmar worth USD 60, 30 and 116 million respectively, and Emergency Natural Disaster Reconstruction Project for Vietnam worth USD 118 million.
Contributed by: Paolo Hernando, Xianguo Huang, Vanne Khut and Thi Kim Cuc Nguyen.
Country CMIM IMF Stand-By
Arrangement
(SBA)
IMF Rapid
Financing
Instrument (RFI)
IMF Poverty Reduction and Growth Trust (PRGT)
Extended Credit
Facility (ECF)
Standby Credit
Facility (SCF)
Rapid Credit Facility
(RCF)
Projected Reserves 2020, Including Lending Facilities
(In millions of U.S. dollars)
Cambodia 12,700 12,567 11,684 12,052 12,052 11,684
Lao PDR 1,278 1,623 1,089 1,312 1,312 1,089
Myanmar 8,006 10,557 7,949 9,036 9,036 7,949
Vietnam 68,066 65,098 59,278 61,703 61,703 59,278
Projected Reserves 2020, Including Lending Facilities
(In months of imports)
Cambodia 8.1 8.0 7.5 7.7 7.7 7.5
Lao PDR 1.6 2.1 1.4 1.7 1.7 1.4
Myanmar 3.0 3.9 3.0 3.4 3.4 3.0
Vietnam 2.6 2.5 2.3 2.4 2.4 2.3
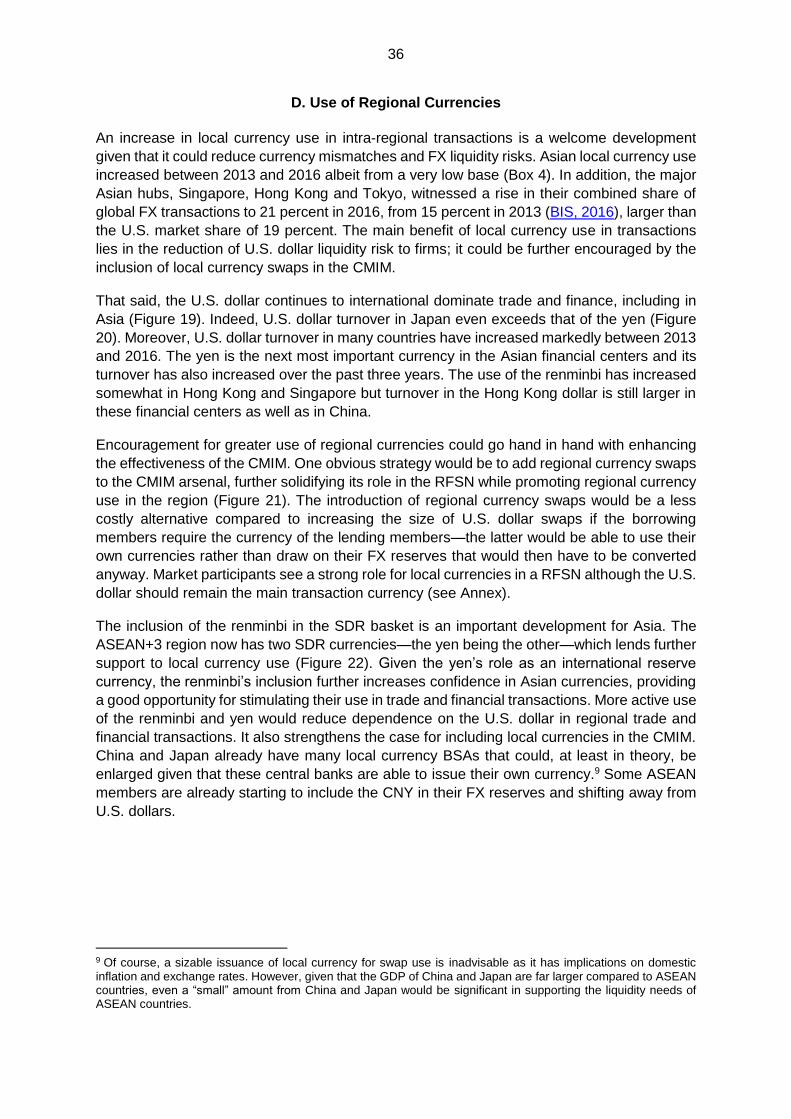
36
D. Use of Regional Currencies
An increase in local currency use in intra-regional transactions is a welcome development
given that it could reduce currency mismatches and FX liquidity risks. Asian local currency use
increased between 2013 and 2016 albeit from a very low base (Box 4). In addition, the major
Asian hubs, Singapore, Hong Kong and Tokyo, witnessed a rise in their combined share of
global FX transactions to 21 percent in 2016, from 15 percent in 2013 (BIS, 2016), larger than
the U.S. market share of 19 percent. The main benefit of local currency use in transactions
lies in the reduction of U.S. dollar liquidity risk to firms; it could be further encouraged by the
inclusion of local currency swaps in the CMIM.
That said, the U.S. dollar continues to international dominate trade and finance, including in
Asia (Figure 19). Indeed, U.S. dollar turnover in Japan even exceeds that of the yen (Figure
20). Moreover, U.S. dollar turnover in many countries have increased markedly between 2013
and 2016. The yen is the next most important currency in the Asian financial centers and its
turnover has also increased over the past three years. The use of the renminbi has increased
somewhat in Hong Kong and Singapore but turnover in the Hong Kong dollar is still larger in
these financial centers as well as in China.
Encouragement for greater use of regional currencies could go hand in hand with enhancing
the effectiveness of the CMIM. One obvious strategy would be to add regional currency swaps
to the CMIM arsenal, further solidifying its role in the RFSN while promoting regional currency
use in the region (Figure 21). The introduction of regional currency swaps would be a less
costly alternative compared to increasing the size of U.S. dollar swaps if the borrowing
members require the currency of the lending members—the latter would be able to use their
own currencies rather than draw on their FX reserves that would then have to be converted
anyway. Market participants see a strong role for local currencies in a RFSN although the U.S.
dollar should remain the main transaction currency (see Annex).
The inclusion of the renminbi in the SDR basket is an important development for Asia. The
ASEAN+3 region now has two SDR currencies—the yen being the other—which lends further
support to local currency use (Figure 22). Given the yen’s role as an international reserve
currency, the renminbi’s inclusion further increases confidence in Asian currencies, providing
a good opportunity for stimulating their use in trade and financial transactions. More active use
of the renminbi and yen would reduce dependence on the U.S. dollar in regional trade and
financial transactions. It also strengthens the case for including local currencies in the CMIM.
China and Japan already have many local currency BSAs that could, at least in theory, be
enlarged given that these central banks are able to issue their own currency.9 Some ASEAN
members are already starting to include the CNY in their FX reserves and shifting away from
U.S. dollars.
9 Of course, a sizable issuance of local currency for swap use is inadvisable as it has implications on domestic inflation and exchange rates. However, given that the GDP of China and Japan are far larger compared to ASEAN countries, even a “small” amount from China and Japan would be significant in supporting the liquidity needs of ASEAN countries.
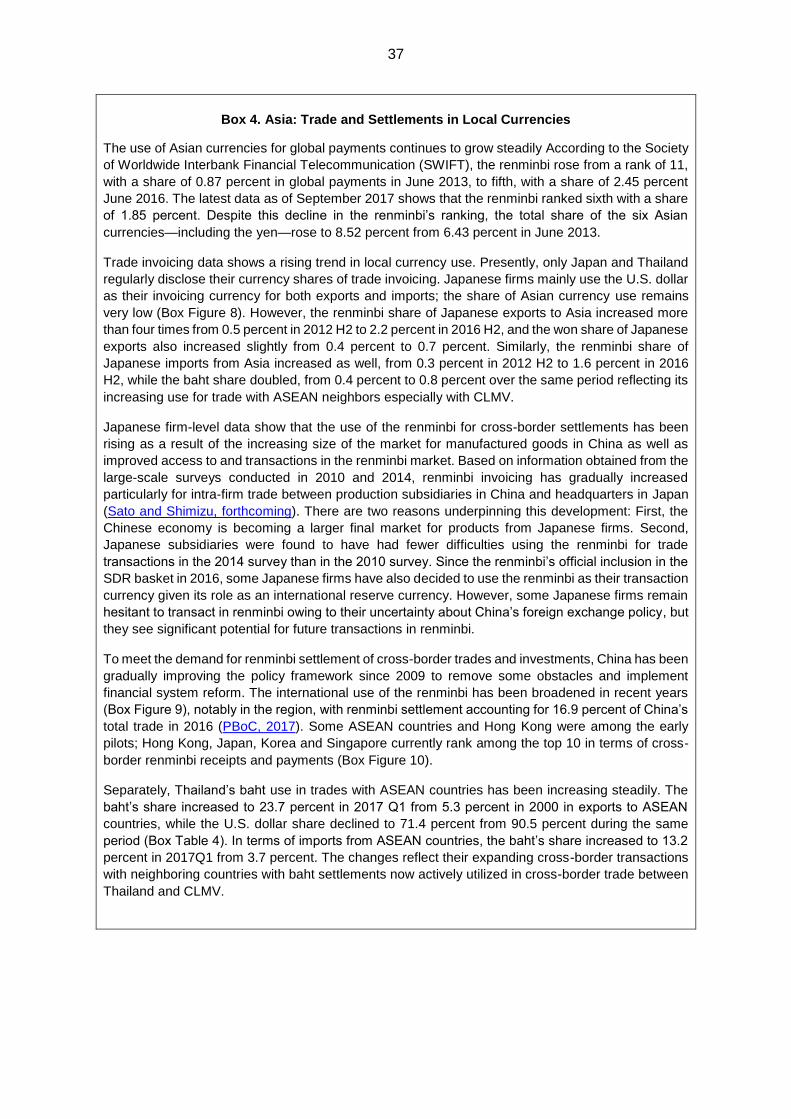
37
Box 4. Asia: Trade and Settlements in Local Currencies
The use of Asian currencies for global payments continues to grow steadily According to the Society
of Worldwide Interbank Financial Telecommunication (SWIFT), the renminbi rose from a rank of 11,
with a share of 0.87 percent in global payments in June 2013, to fifth, with a share of 2.45 percent
June 2016. The latest data as of September 2017 shows that the renminbi ranked sixth with a share
of 1.85 percent. Despite this decline in the renminbi’s ranking, the total share of the six Asian
currencies—including the yen—rose to 8.52 percent from 6.43 percent in June 2013.
Trade invoicing data shows a rising trend in local currency use. Presently, only Japan and Thailand
regularly disclose their currency shares of trade invoicing. Japanese firms mainly use the U.S. dollar
as their invoicing currency for both exports and imports; the share of Asian currency use remains
very low (Box Figure 8). However, the renminbi share of Japanese exports to Asia increased more
than four times from 0.5 percent in 2012 H2 to 2.2 percent in 2016 H2, and the won share of Japanese
exports also increased slightly from 0.4 percent to 0.7 percent. Similarly, the renminbi share of
Japanese imports from Asia increased as well, from 0.3 percent in 2012 H2 to 1.6 percent in 2016
H2, while the baht share doubled, from 0.4 percent to 0.8 percent over the same period reflecting its
increasing use for trade with ASEAN neighbors especially with CLMV.
Japanese firm-level data show that the use of the renminbi for cross-border settlements has been
rising as a result of the increasing size of the market for manufactured goods in China as well as
improved access to and transactions in the renminbi market. Based on information obtained from the
large-scale surveys conducted in 2010 and 2014, renminbi invoicing has gradually increased
particularly for intra-firm trade between production subsidiaries in China and headquarters in Japan
(Sato and Shimizu, forthcoming). There are two reasons underpinning this development: First, the
Chinese economy is becoming a larger final market for products from Japanese firms. Second,
Japanese subsidiaries were found to have had fewer difficulties using the renminbi for trade
transactions in the 2014 survey than in the 2010 survey. Since the renminbi’s official inclusion in the
SDR basket in 2016, some Japanese firms have also decided to use the renminbi as their transaction
currency given its role as an international reserve currency. However, some Japanese firms remain
hesitant to transact in renminbi owing to their uncertainty about China’s foreign exchange policy, but
they see significant potential for future transactions in renminbi.
To meet the demand for renminbi settlement of cross-border trades and investments, China has been
gradually improving the policy framework since 2009 to remove some obstacles and implement
financial system reform. The international use of the renminbi has been broadened in recent years
(Box Figure 9), notably in the region, with renminbi settlement accounting for 16.9 percent of China’s
total trade in 2016 (PBoC, 2017). Some ASEAN countries and Hong Kong were among the early
pilots; Hong Kong, Japan, Korea and Singapore currently rank among the top 10 in terms of cross-
border renminbi receipts and payments (Box Figure 10).
Separately, Thailand’s baht use in trades with ASEAN countries has been increasing steadily. The
baht’s share increased to 23.7 percent in 2017 Q1 from 5.3 percent in 2000 in exports to ASEAN
countries, while the U.S. dollar share declined to 71.4 percent from 90.5 percent during the same
period (Box Table 4). In terms of imports from ASEAN countries, the baht’s share increased to 13.2
percent in 2017Q1 from 3.7 percent. The changes reflect their expanding cross-border transactions
with neighboring countries with baht settlements now actively utilized in cross-border trade between
Thailand and CLMV.
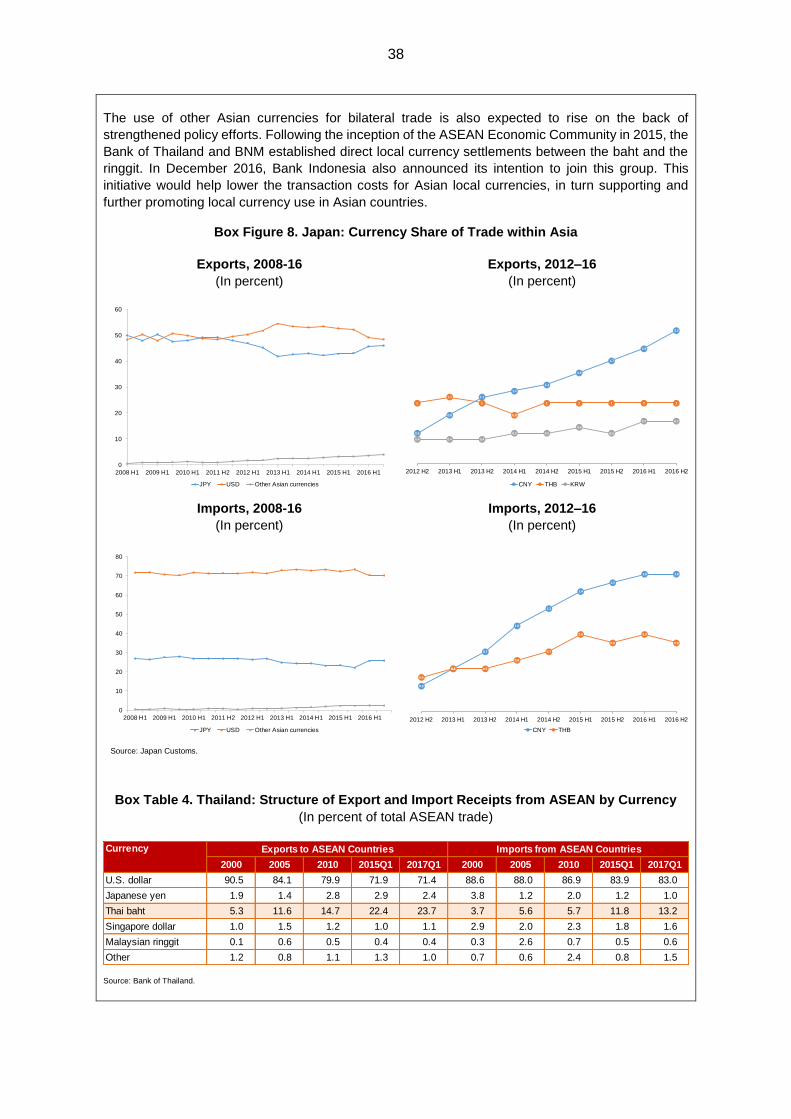
38
The use of other Asian currencies for bilateral trade is also expected to rise on the back of
strengthened policy efforts. Following the inception of the ASEAN Economic Community in 2015, the
Bank of Thailand and BNM established direct local currency settlements between the baht and the
ringgit. In December 2016, Bank Indonesia also announced its intention to join this group. This
initiative would help lower the transaction costs for Asian local currencies, in turn supporting and
further promoting local currency use in Asian countries.
Box Figure 8. Japan: Currency Share of Trade within Asia
Exports, 2008-16
(In percent)
Exports, 2012–16
(In percent)
Imports, 2008-16
(In percent)
Imports, 2012–16
(In percent)
Source: Japan Customs.
Box Table 4. Thailand: Structure of Export and Import Receipts from ASEAN by Currency
(In percent of total ASEAN trade)
Source: Bank of Thailand.
0
10
20
30
40
50
60
2008 H1 2009 H1 2010 H1 2011 H2 2012 H1 2013 H1 2014 H1 2015 H1 2016 H1
JPY USD Other Asian currencies
0.5
0.8
1.1
1.2
1.3
1.5
1.7
1.9
2.2
1
1.1
1
0.8
1 1 1 1 1
0.4 0.4 0.4
0.5 0.5
0.6
0.5
0.7 0.7
2012 H2 2013 H1 2013 H2 2014 H1 2014 H2 2015 H1 2015 H2 2016 H1 2016 H2
CNY THB KRW
0
10
20
30
40
50
60
70
80
2008 H1 2009 H1 2010 H1 2011 H2 2012 H1 2013 H1 2014 H1 2015 H1 2016 H1
JPY USD Other Asian currencies
0.3
0.5
0.7
1.0
1.2
1.4
1.5
1.6 1.6
0.4
0.5 0.5
0.6
0.7
0.9
0.8
0.9
0.8
2012 H2 2013 H1 2013 H2 2014 H1 2014 H2 2015 H1 2015 H2 2016 H1 2016 H2
CNY THB
2000 2005 2010 2015Q1 2017Q1 2000 2005 2010 2015Q1 2017Q1
U.S. dollar 90.5 84.1 79.9 71.9 71.4 88.6 88.0 86.9 83.9 83.0
Japanese yen 1.9 1.4 2.8 2.9 2.4 3.8 1.2 2.0 1.2 1.0
Thai baht 5.3 11.6 14.7 22.4 23.7 3.7 5.6 5.7 11.8 13.2
Singapore dollar 1.0 1.5 1.2 1.0 1.1 2.9 2.0 2.3 1.8 1.6
Malaysian ringgit 0.1 0.6 0.5 0.4 0.4 0.3 2.6 0.7 0.5 0.6
Other 1.2 0.8 1.1 1.3 1.0 0.7 0.6 2.4 0.8 1.5
Exports to ASEAN Countries Imports from ASEAN CountriesCurrency
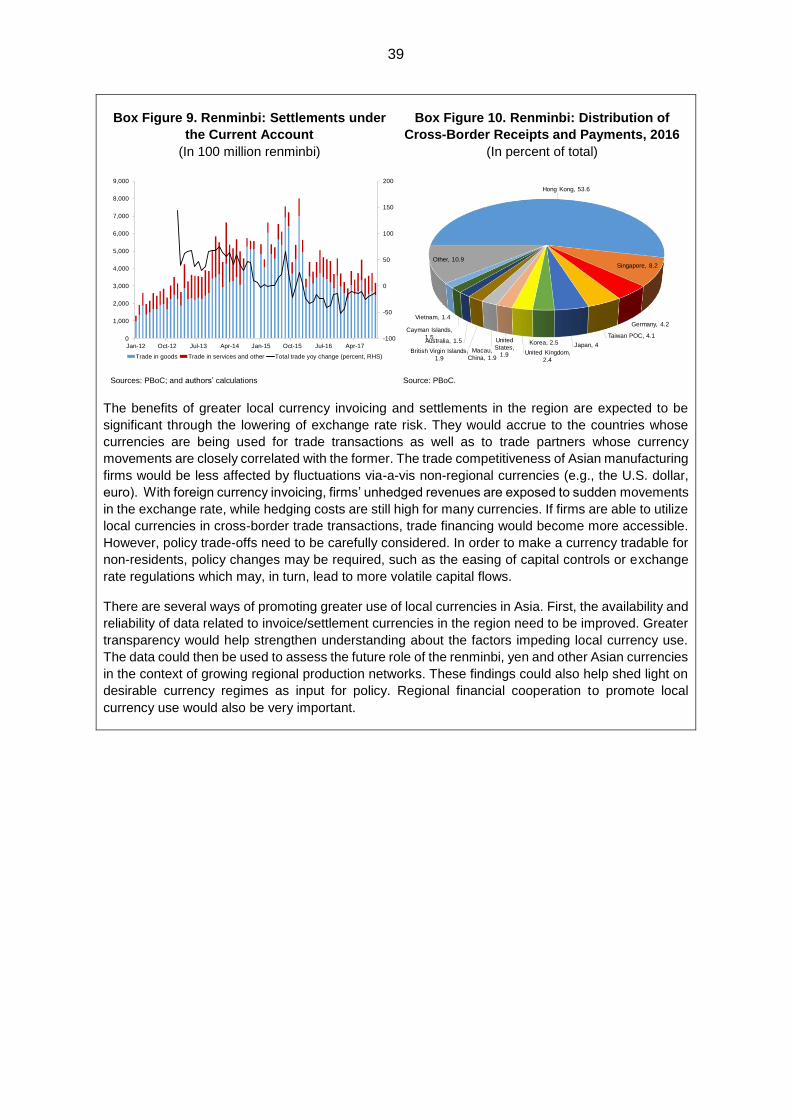
39
Box Figure 9. Renminbi: Settlements under
the Current Account
(In 100 million renminbi)
Box Figure 10. Renminbi: Distribution of
Cross-Border Receipts and Payments, 2016
(In percent of total)
Sources: PBoC; and authors’ calculations Source: PBoC.
The benefits of greater local currency invoicing and settlements in the region are expected to be
significant through the lowering of exchange rate risk. They would accrue to the countries whose
currencies are being used for trade transactions as well as to trade partners whose currency
movements are closely correlated with the former. The trade competitiveness of Asian manufacturing
firms would be less affected by fluctuations via-a-vis non-regional currencies (e.g., the U.S. dollar,
euro). With foreign currency invoicing, firms’ unhedged revenues are exposed to sudden movements
in the exchange rate, while hedging costs are still high for many currencies. If firms are able to utilize
local currencies in cross-border trade transactions, trade financing would become more accessible.
However, policy trade-offs need to be carefully considered. In order to make a currency tradable for
non-residents, policy changes may be required, such as the easing of capital controls or exchange
rate regulations which may, in turn, lead to more volatile capital flows.
There are several ways of promoting greater use of local currencies in Asia. First, the availability and
reliability of data related to invoice/settlement currencies in the region need to be improved. Greater
transparency would help strengthen understanding about the factors impeding local currency use.
The data could then be used to assess the future role of the renminbi, yen and other Asian currencies
in the context of growing regional production networks. These findings could also help shed light on
desirable currency regimes as input for policy. Regional financial cooperation to promote local
currency use would also be very important.
-100
-50
0
50
100
150
200
0
1,000
2,000
3,000
4,000
5,000
6,000
7,000
8,000
9,000
Jan-12 Oct-12 Jul-13 Apr-14 Jan-15 Oct-15 Jul-16 Apr-17
Trade in goods Trade in services and other Total trade yoy change (percent, RHS)
Hong Kong, 53.6
Singapore, 8.2
Germany, 4.2
Taiwan POC, 4.1
Japan, 4Korea, 2.5
United Kingdom,
2.4
United
States, 1.9
Macau,
China, 1.9British Virgin Islands,
1.9
Australia, 1.5
Cayman Islands,
1.5
Vietnam, 1.4
Other, 10.9
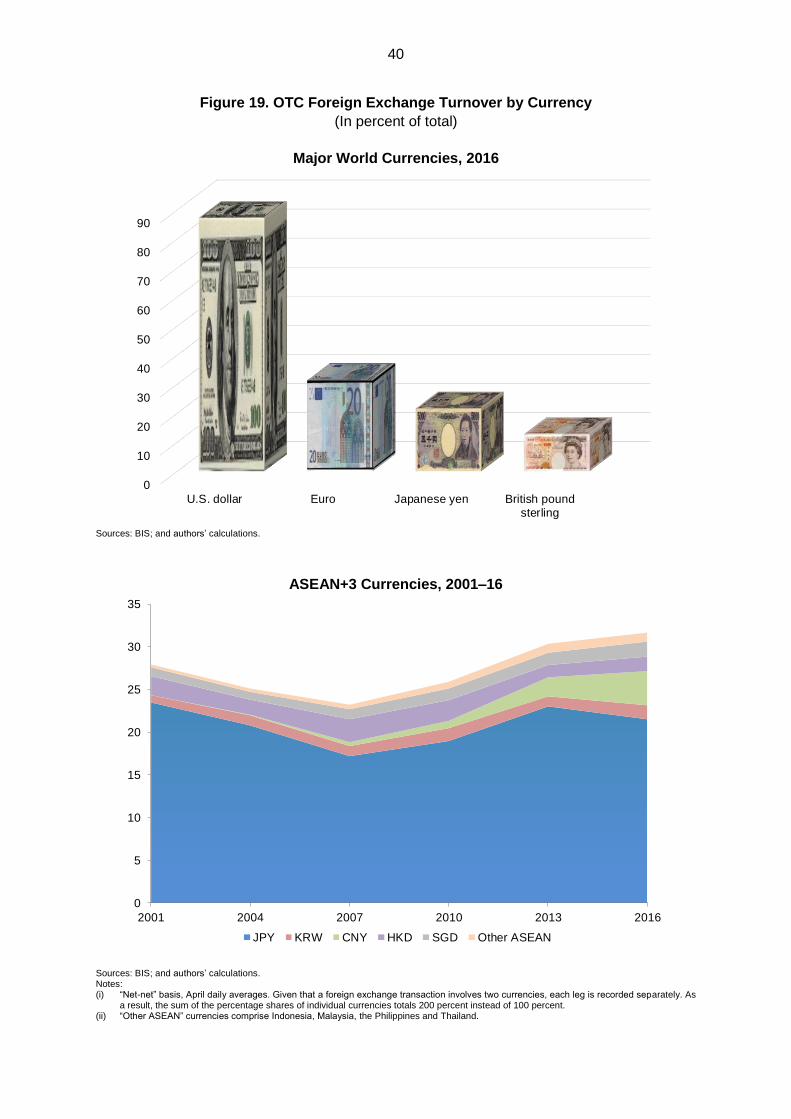
40
Figure 19. OTC Foreign Exchange Turnover by Currency
(In percent of total)
Major World Currencies, 2016
Sources: BIS; and authors’ calculations.
ASEAN+3 Currencies, 2001–16
Sources: BIS; and authors’ calculations. Notes: (i) “Net-net” basis, April daily averages. Given that a foreign exchange transaction involves two currencies, each leg is recorded separately. As
a result, the sum of the percentage shares of individual currencies totals 200 percent instead of 100 percent. (ii) “Other ASEAN” currencies comprise Indonesia, Malaysia, the Philippines and Thailand.
0
10
20
30
40
50
60
70
80
90
U.S. dollar Euro Japanese yen British poundsterling
0
5
10
15
20
25
30
35
2001 2004 2007 2010 2013 2016
JPY KRW CNY HKD SGD Other ASEAN
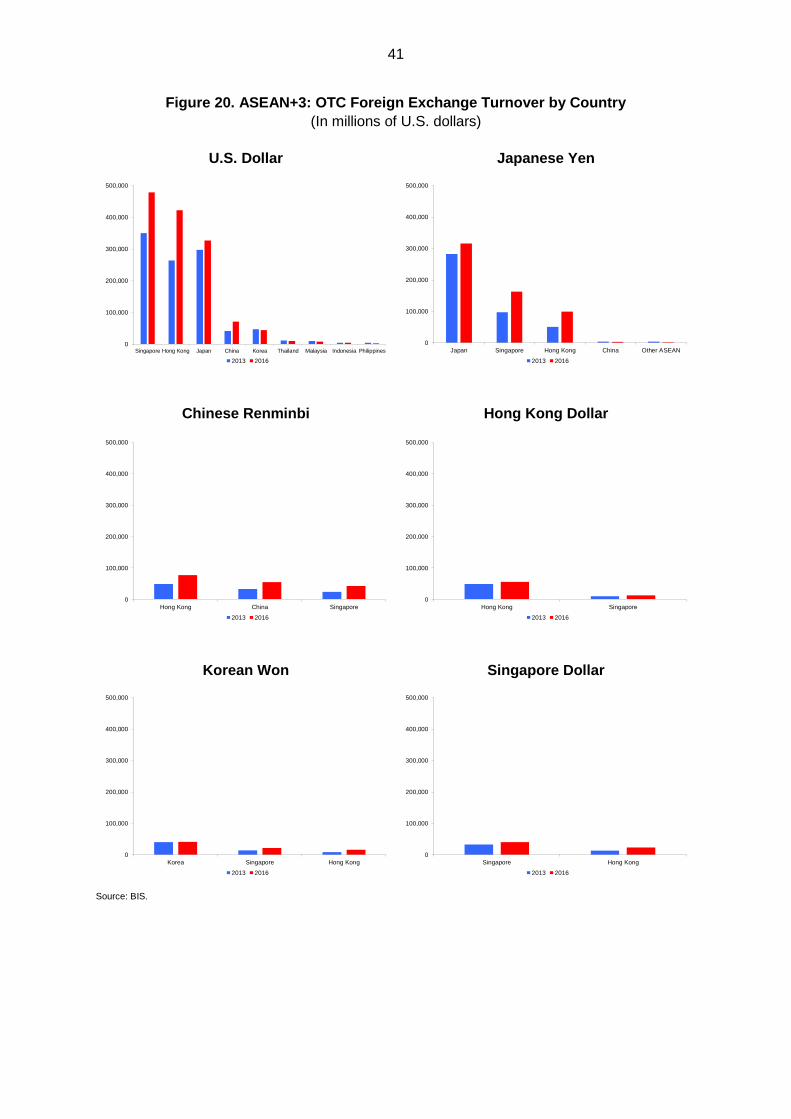
41
Figure 20. ASEAN+3: OTC Foreign Exchange Turnover by Country
(In millions of U.S. dollars)
U.S. Dollar
Japanese Yen
Chinese Renminbi
Hong Kong Dollar
Korean Won
Singapore Dollar
Source: BIS.
0
100,000
200,000
300,000
400,000
500,000
Singapore Hong Kong Japan China Korea Thailand Malaysia Indonesia Philippines
2013 2016
0
100,000
200,000
300,000
400,000
500,000
Japan Singapore Hong Kong China Other ASEAN
2013 2016
0
100,000
200,000
300,000
400,000
500,000
Hong Kong China Singapore
2013 2016
0
100,000
200,000
300,000
400,000
500,000
Hong Kong Singapore
2013 2016
0
100,000
200,000
300,000
400,000
500,000
Korea Singapore Hong Kong
2013 2016
0
100,000
200,000
300,000
400,000
500,000
Singapore Hong Kong
2013 2016
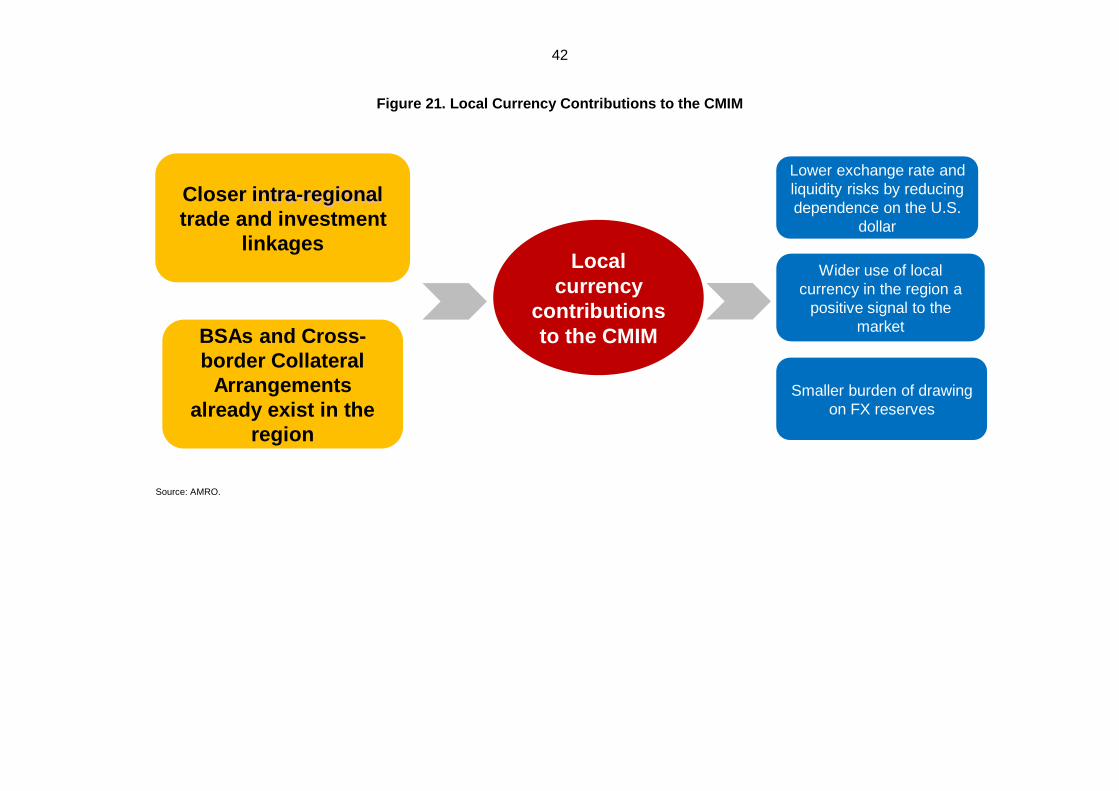
42
Figure 21. Local Currency Contributions to the CMIM
Source: AMRO.
6
7. LCY Contribution to CMIM
Moving forward, making CMIM Contributions in Local Currencies is now
considered, in order to enhance regional financial stability.
China, with increasing trade and investment with the region and RMB’s
inclusion in SDR basket, will play a greater role in the future.
Closer intra-regional
trade and investment
linkages
BSAs and Cross-
border Collateral
Arrangements
already exist in the
region
Local
currency
contributions
to the CMIM
Lower exchange rate and
liquidity risks by reducing
dependence on the U.S.
dollar
Wider use of local
currency in the region a
positive signal to the
market
Smaller burden of drawing
on FX reserves
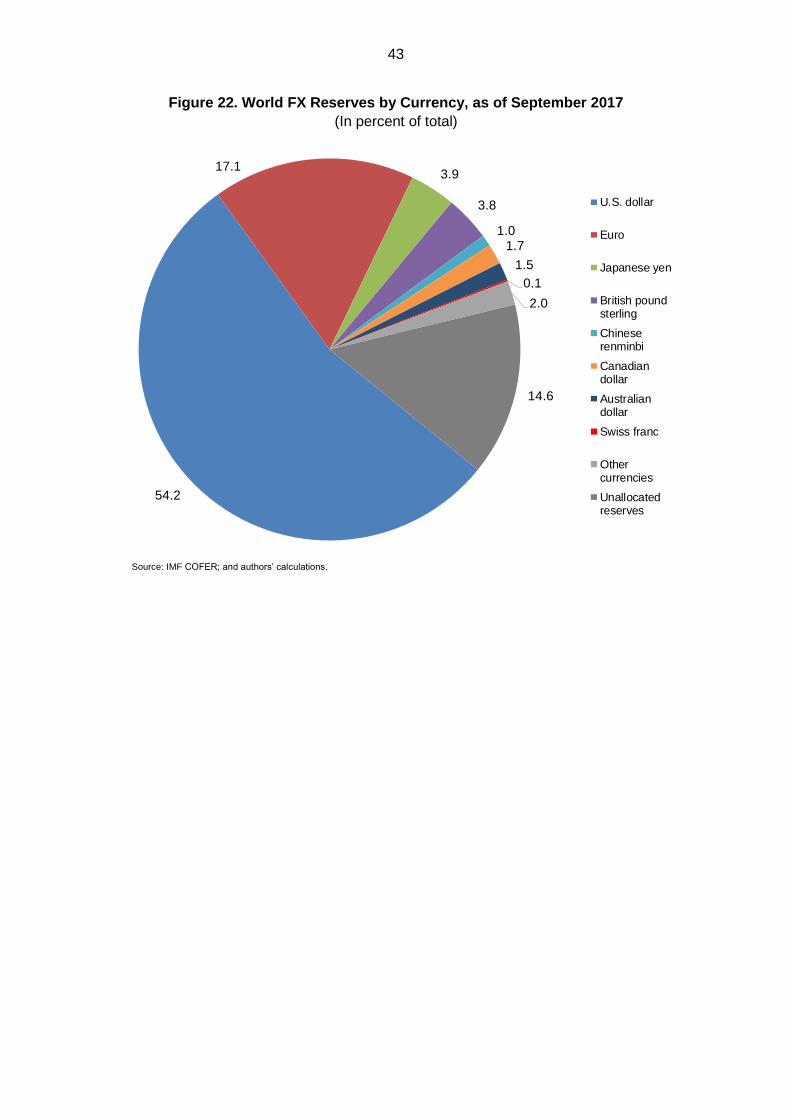
43
Figure 22. World FX Reserves by Currency, as of September 2017
(In percent of total)
Source: IMF COFER; and authors’ calculations.
54.2
17.13.9
3.8
1.01.7
1.5
0.1
2.0
14.6
U.S. dollar
Euro
Japanese yen
British poundsterling
Chineserenminbi
Canadiandollar
Australiandollar
Swiss franc
Othercurrencies
Unallocatedreserves
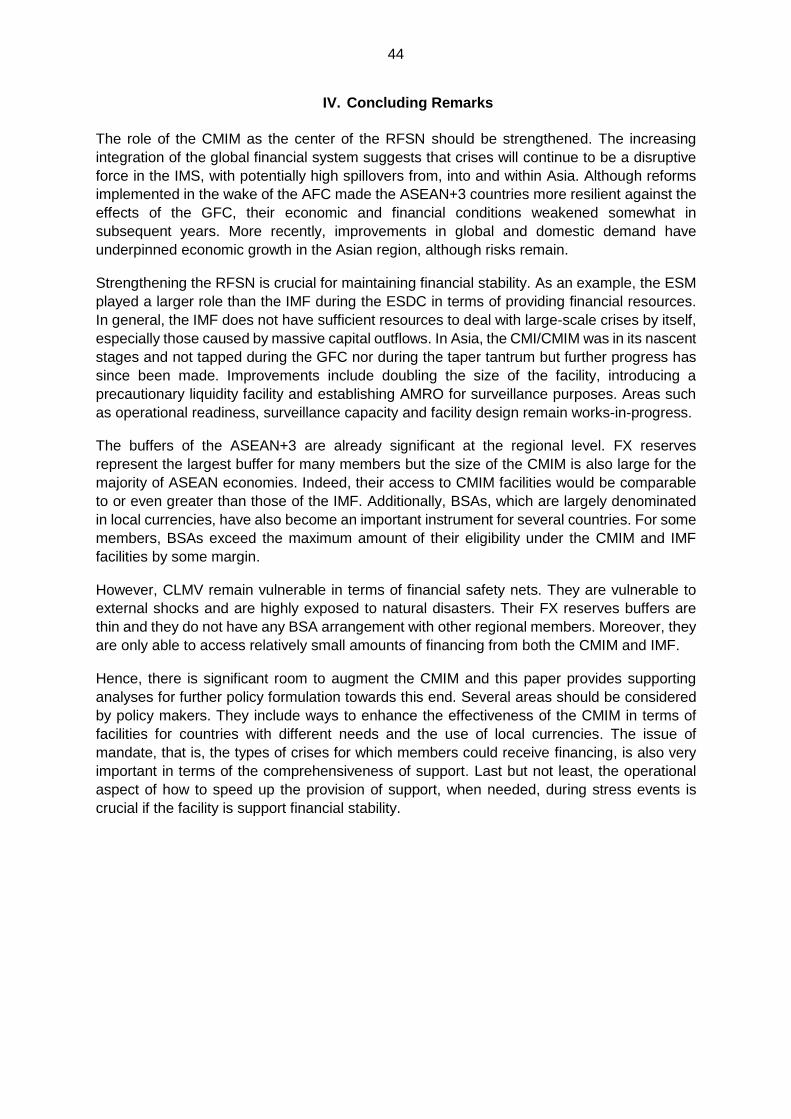
44
IV. Concluding Remarks
The role of the CMIM as the center of the RFSN should be strengthened. The increasing
integration of the global financial system suggests that crises will continue to be a disruptive
force in the IMS, with potentially high spillovers from, into and within Asia. Although reforms
implemented in the wake of the AFC made the ASEAN+3 countries more resilient against the
effects of the GFC, their economic and financial conditions weakened somewhat in
subsequent years. More recently, improvements in global and domestic demand have
underpinned economic growth in the Asian region, although risks remain.
Strengthening the RFSN is crucial for maintaining financial stability. As an example, the ESM
played a larger role than the IMF during the ESDC in terms of providing financial resources.
In general, the IMF does not have sufficient resources to deal with large-scale crises by itself,
especially those caused by massive capital outflows. In Asia, the CMI/CMIM was in its nascent
stages and not tapped during the GFC nor during the taper tantrum but further progress has
since been made. Improvements include doubling the size of the facility, introducing a
precautionary liquidity facility and establishing AMRO for surveillance purposes. Areas such
as operational readiness, surveillance capacity and facility design remain works-in-progress.
The buffers of the ASEAN+3 are already significant at the regional level. FX reserves
represent the largest buffer for many members but the size of the CMIM is also large for the
majority of ASEAN economies. Indeed, their access to CMIM facilities would be comparable
to or even greater than those of the IMF. Additionally, BSAs, which are largely denominated
in local currencies, have also become an important instrument for several countries. For some
members, BSAs exceed the maximum amount of their eligibility under the CMIM and IMF
facilities by some margin.
However, CLMV remain vulnerable in terms of financial safety nets. They are vulnerable to
external shocks and are highly exposed to natural disasters. Their FX reserves buffers are
thin and they do not have any BSA arrangement with other regional members. Moreover, they
are only able to access relatively small amounts of financing from both the CMIM and IMF.
Hence, there is significant room to augment the CMIM and this paper provides supporting
analyses for further policy formulation towards this end. Several areas should be considered
by policy makers. They include ways to enhance the effectiveness of the CMIM in terms of
facilities for countries with different needs and the use of local currencies. The issue of
mandate, that is, the types of crises for which members could receive financing, is also very
important in terms of the comprehensiveness of support. Last but not least, the operational
aspect of how to speed up the provision of support, when needed, during stress events is
crucial if the facility is support financial stability.
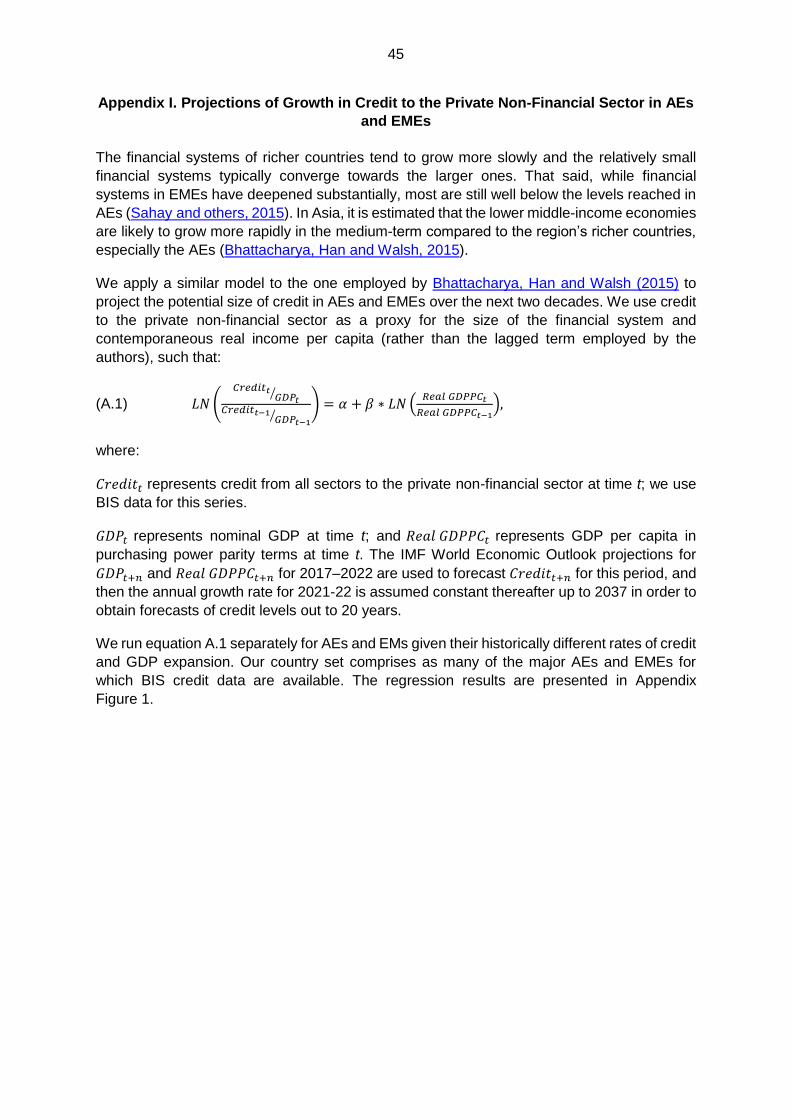
45
Appendix I. Projections of Growth in Credit to the Private Non-Financial Sector in AEs
and EMEs
The financial systems of richer countries tend to grow more slowly and the relatively small
financial systems typically converge towards the larger ones. That said, while financial
systems in EMEs have deepened substantially, most are still well below the levels reached in
AEs (Sahay and others, 2015). In Asia, it is estimated that the lower middle-income economies
are likely to grow more rapidly in the medium-term compared to the region’s richer countries,
especially the AEs (Bhattacharya, Han and Walsh, 2015).
We apply a similar model to the one employed by Bhattacharya, Han and Walsh (2015) to
project the potential size of credit in AEs and EMEs over the next two decades. We use credit
to the private non-financial sector as a proxy for the size of the financial system and
contemporaneous real income per capita (rather than the lagged term employed by the
authors), such that:
(A.1) 𝐿𝑁 (𝐶𝑟𝑒𝑑𝑖𝑡𝑡
𝐺𝐷𝑃𝑡⁄
𝐶𝑟𝑒𝑑𝑖𝑡𝑡−1𝐺𝐷𝑃𝑡−1
⁄) = 𝛼 + 𝛽 ∗ 𝐿𝑁 (
𝑅𝑒𝑎𝑙 𝐺𝐷𝑃𝑃𝐶𝑡
𝑅𝑒𝑎𝑙 𝐺𝐷𝑃𝑃𝐶𝑡−1),
where:
𝐶𝑟𝑒𝑑𝑖𝑡𝑡 represents credit from all sectors to the private non-financial sector at time t; we use
BIS data for this series.
𝐺𝐷𝑃𝑡 represents nominal GDP at time t; and 𝑅𝑒𝑎𝑙 𝐺𝐷𝑃𝑃𝐶𝑡 represents GDP per capita in
purchasing power parity terms at time t. The IMF World Economic Outlook projections for
𝐺𝐷𝑃𝑡+𝑛 and 𝑅𝑒𝑎𝑙 𝐺𝐷𝑃𝑃𝐶𝑡+𝑛 for 2017–2022 are used to forecast 𝐶𝑟𝑒𝑑𝑖𝑡𝑡+𝑛 for this period, and
then the annual growth rate for 2021-22 is assumed constant thereafter up to 2037 in order to
obtain forecasts of credit levels out to 20 years.
We run equation A.1 separately for AEs and EMs given their historically different rates of credit
and GDP expansion. Our country set comprises as many of the major AEs and EMEs for
which BIS credit data are available. The regression results are presented in Appendix
Figure 1.
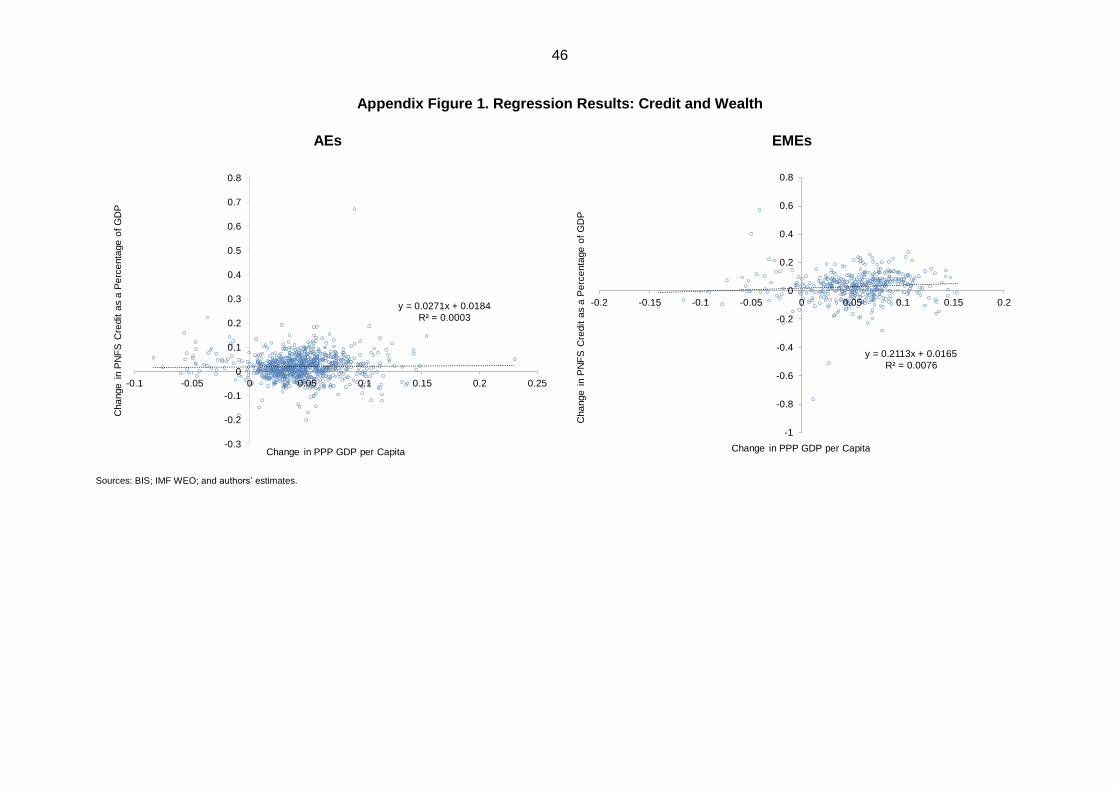
46
Appendix Figure 1. Regression Results: Credit and Wealth
AEs
EMEs
Sources: BIS; IMF WEO; and authors’ estimates.
y = 0.0271x + 0.0184
R² = 0.0003
-0.3
-0.2
-0.1
0
0.1
0.2
0.3
0.4
0.5
0.6
0.7
0.8
-0.1 -0.05 0 0.05 0.1 0.15 0.2 0.25
Cha
nge
in P
NF
S C
redit a
s a
Pe
rce
nta
ge
of
GD
P
Change in PPP GDP per Capita
y = 0.2113x + 0.0165
R² = 0.0076
-1
-0.8
-0.6
-0.4
-0.2
0
0.2
0.4
0.6
0.8
-0.2 -0.15 -0.1 -0.05 0 0.05 0.1 0.15 0.2
Cha
nge
in P
NF
S C
redit a
s a
Pe
rce
nta
ge
of
GD
P
Change in PPP GDP per Capita
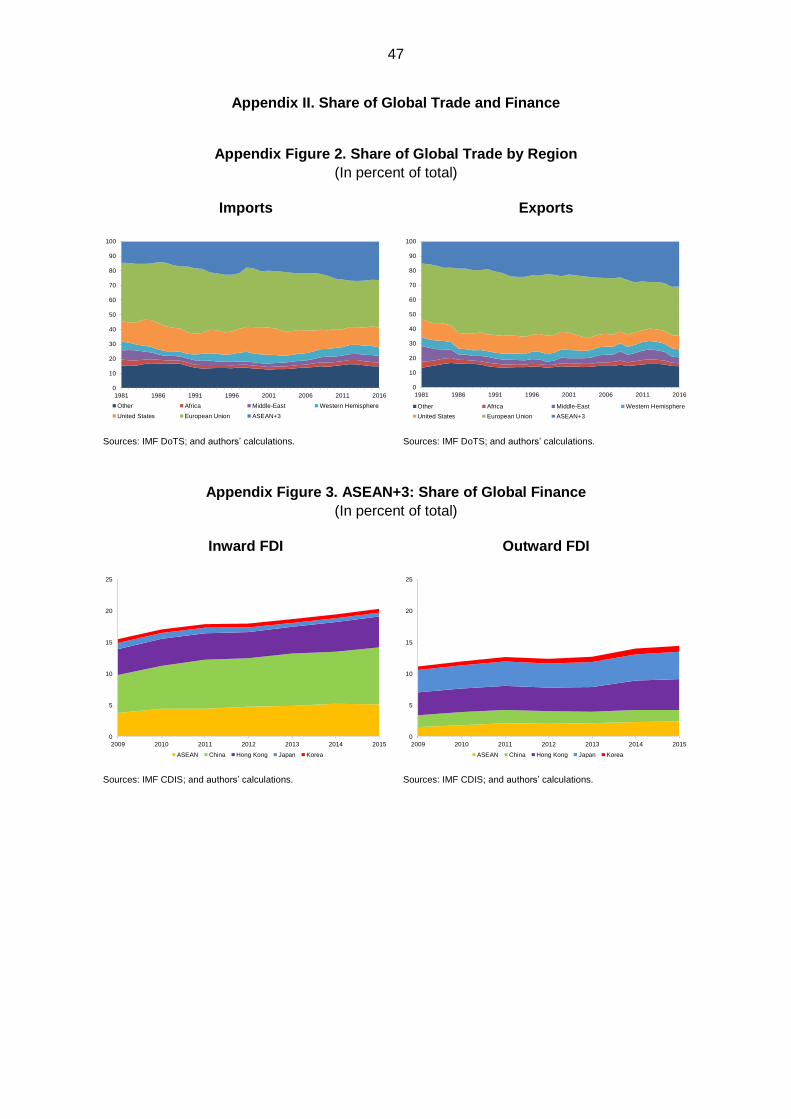
47
Appendix II. Share of Global Trade and Finance
Appendix Figure 2. Share of Global Trade by Region
(In percent of total)
Imports
Exports
Sources: IMF DoTS; and authors’ calculations. Sources: IMF DoTS; and authors’ calculations.
Appendix Figure 3. ASEAN+3: Share of Global Finance
(In percent of total)
Inward FDI
Outward FDI
Sources: IMF CDIS; and authors’ calculations. Sources: IMF CDIS; and authors’ calculations.
0
10
20
30
40
50
60
70
80
90
100
1981 1986 1991 1996 2001 2006 2011 2016
Other Africa Middle-East Western Hemisphere
United States European Union ASEAN+3
0
10
20
30
40
50
60
70
80
90
100
1981 1986 1991 1996 2001 2006 2011 2016
Other Africa Middle-East Western Hemisphere
United States European Union ASEAN+3
0
5
10
15
20
25
2009 2010 2011 2012 2013 2014 2015
ASEAN China Hong Kong Japan Korea
0
5
10
15
20
25
2009 2010 2011 2012 2013 2014 2015
ASEAN China Hong Kong Japan Korea
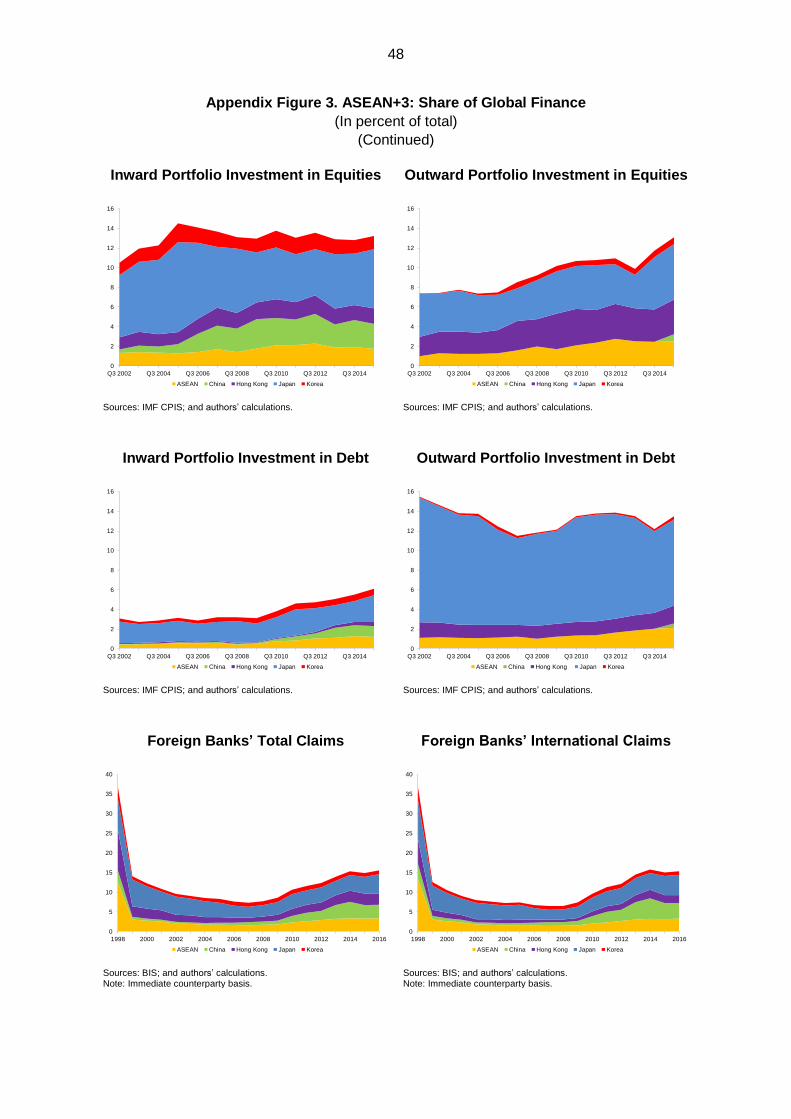
48
Appendix Figure 3. ASEAN+3: Share of Global Finance
(In percent of total)
(Continued)
Inward Portfolio Investment in Equities
Outward Portfolio Investment in Equities
Sources: IMF CPIS; and authors’ calculations. Sources: IMF CPIS; and authors’ calculations.
Inward Portfolio Investment in Debt
Outward Portfolio Investment in Debt
Sources: IMF CPIS; and authors’ calculations. Sources: IMF CPIS; and authors’ calculations.
Foreign Banks’ Total Claims
Foreign Banks’ International Claims
Sources: BIS; and authors’ calculations. Note: Immediate counterparty basis.
Sources: BIS; and authors’ calculations. Note: Immediate counterparty basis.
0
2
4
6
8
10
12
14
16
Q3 2002 Q3 2004 Q3 2006 Q3 2008 Q3 2010 Q3 2012 Q3 2014
ASEAN China Hong Kong Japan Korea
0
2
4
6
8
10
12
14
16
Q3 2002 Q3 2004 Q3 2006 Q3 2008 Q3 2010 Q3 2012 Q3 2014
ASEAN China Hong Kong Japan Korea
0
2
4
6
8
10
12
14
16
Q3 2002 Q3 2004 Q3 2006 Q3 2008 Q3 2010 Q3 2012 Q3 2014
ASEAN China Hong Kong Japan Korea
0
2
4
6
8
10
12
14
16
Q3 2002 Q3 2004 Q3 2006 Q3 2008 Q3 2010 Q3 2012 Q3 2014
ASEAN China Hong Kong Japan Korea
0
5
10
15
20
25
30
35
40
1998 2000 2002 2004 2006 2008 2010 2012 2014 2016
ASEAN China Hong Kong Japan Korea
0
5
10
15
20
25
30
35
40
1998 2000 2002 2004 2006 2008 2010 2012 2014 2016
ASEAN China Hong Kong Japan Korea
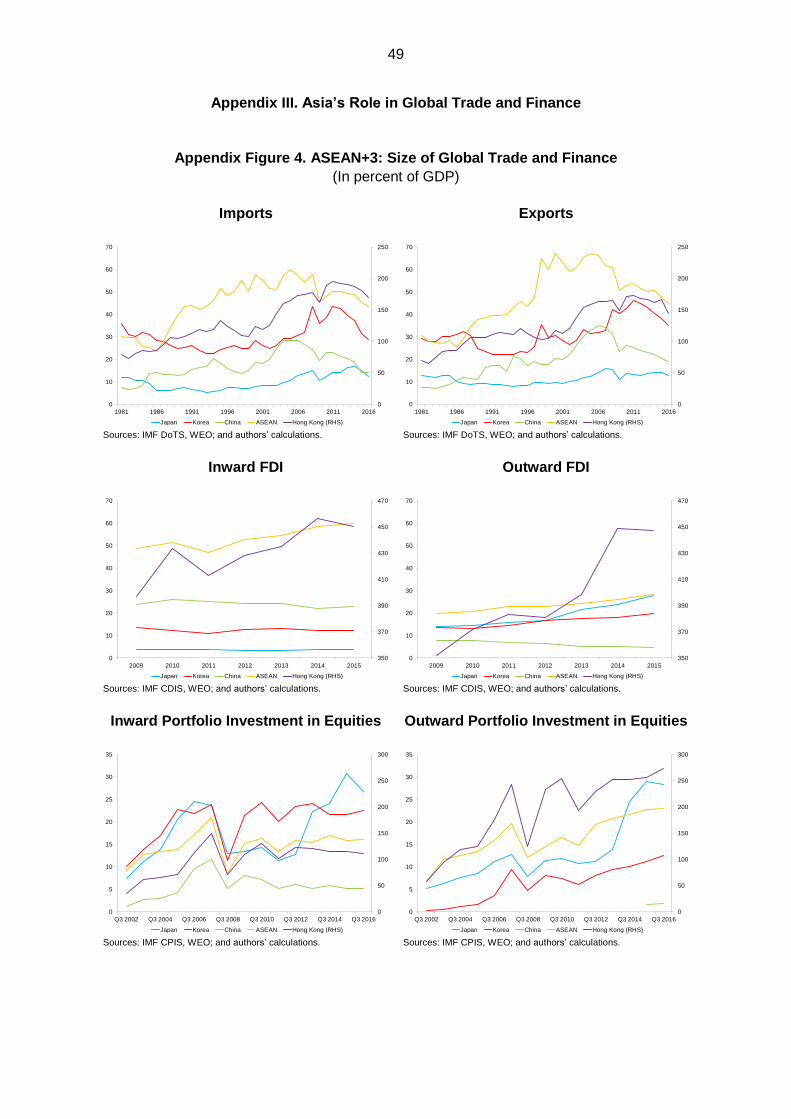
49
Appendix III. Asia’s Role in Global Trade and Finance
Appendix Figure 4. ASEAN+3: Size of Global Trade and Finance
(In percent of GDP)
Imports
Exports
Sources: IMF DoTS, WEO; and authors’ calculations. Sources: IMF DoTS, WEO; and authors’ calculations.
Inward FDI
Outward FDI
Sources: IMF CDIS, WEO; and authors’ calculations. Sources: IMF CDIS, WEO; and authors’ calculations.
Inward Portfolio Investment in Equities
Outward Portfolio Investment in Equities
Sources: IMF CPIS, WEO; and authors’ calculations. Sources: IMF CPIS, WEO; and authors’ calculations.
0
50
100
150
200
250
0
10
20
30
40
50
60
70
1981 1986 1991 1996 2001 2006 2011 2016
Japan Korea China ASEAN Hong Kong (RHS)
0
50
100
150
200
250
0
10
20
30
40
50
60
70
1981 1986 1991 1996 2001 2006 2011 2016
Japan Korea China ASEAN Hong Kong (RHS)
350
370
390
410
430
450
470
0
10
20
30
40
50
60
70
2009 2010 2011 2012 2013 2014 2015
Japan Korea China ASEAN Hong Kong (RHS)
350
370
390
410
430
450
470
0
10
20
30
40
50
60
70
2009 2010 2011 2012 2013 2014 2015
Japan Korea China ASEAN Hong Kong (RHS)
0
50
100
150
200
250
300
0
5
10
15
20
25
30
35
Q3 2002 Q3 2004 Q3 2006 Q3 2008 Q3 2010 Q3 2012 Q3 2014 Q3 2016
Japan Korea China ASEAN Hong Kong (RHS)
0
50
100
150
200
250
300
0
5
10
15
20
25
30
35
Q3 2002 Q3 2004 Q3 2006 Q3 2008 Q3 2010 Q3 2012 Q3 2014 Q3 2016
Japan Korea China ASEAN Hong Kong (RHS)
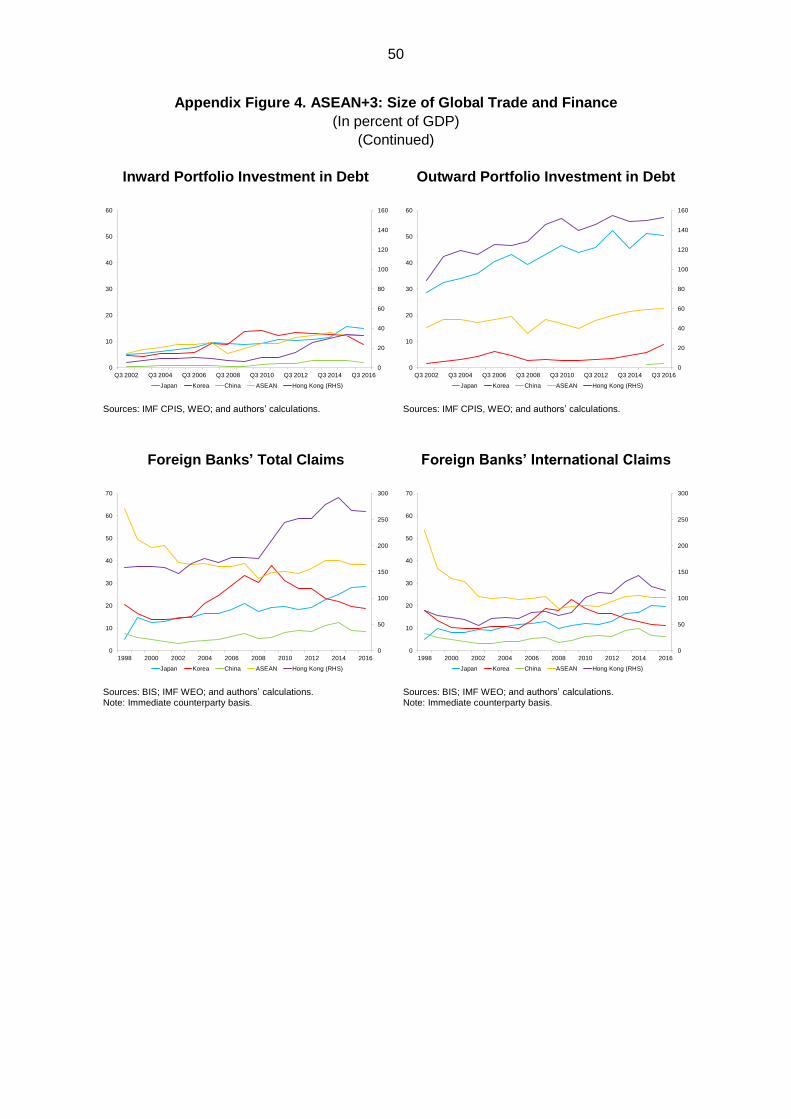
50
Appendix Figure 4. ASEAN+3: Size of Global Trade and Finance
(In percent of GDP)
(Continued)
Inward Portfolio Investment in Debt
Outward Portfolio Investment in Debt
Sources: IMF CPIS, WEO; and authors’ calculations. Sources: IMF CPIS, WEO; and authors’ calculations.
Foreign Banks’ Total Claims
Foreign Banks’ International Claims
Sources: BIS; IMF WEO; and authors’ calculations. Note: Immediate counterparty basis.
Sources: BIS; IMF WEO; and authors’ calculations. Note: Immediate counterparty basis.
0
20
40
60
80
100
120
140
160
0
10
20
30
40
50
60
Q3 2002 Q3 2004 Q3 2006 Q3 2008 Q3 2010 Q3 2012 Q3 2014 Q3 2016
Japan Korea China ASEAN Hong Kong (RHS)
0
20
40
60
80
100
120
140
160
0
10
20
30
40
50
60
Q3 2002 Q3 2004 Q3 2006 Q3 2008 Q3 2010 Q3 2012 Q3 2014 Q3 2016
Japan Korea China ASEAN Hong Kong (RHS)
0
50
100
150
200
250
300
0
10
20
30
40
50
60
70
1998 2000 2002 2004 2006 2008 2010 2012 2014 2016
Japan Korea China ASEAN Hong Kong (RHS)
0
50
100
150
200
250
300
0
10
20
30
40
50
60
70
1998 2000 2002 2004 2006 2008 2010 2012 2014 2016
Japan Korea China ASEAN Hong Kong (RHS)
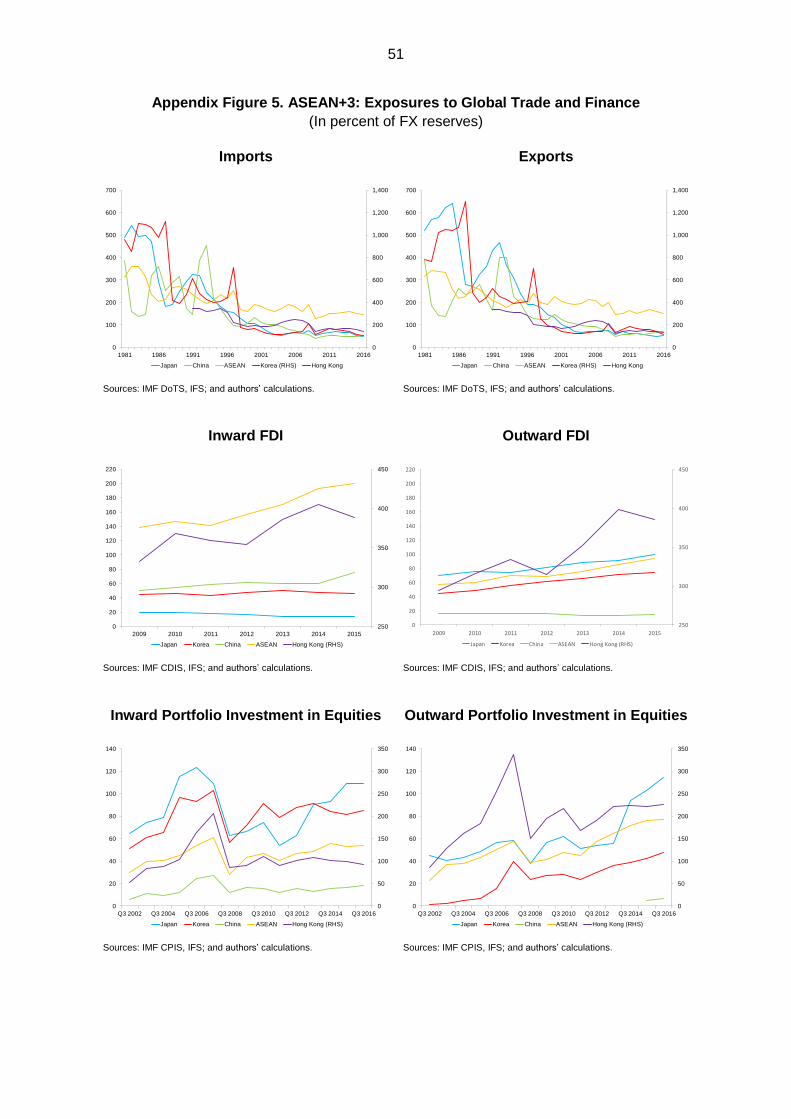
51
Appendix Figure 5. ASEAN+3: Exposures to Global Trade and Finance
(In percent of FX reserves)
Imports
Exports
Sources: IMF DoTS, IFS; and authors’ calculations. Sources: IMF DoTS, IFS; and authors’ calculations.
Inward FDI
Outward FDI
Sources: IMF CDIS, IFS; and authors’ calculations. Sources: IMF CDIS, IFS; and authors’ calculations.
Inward Portfolio Investment in Equities
Outward Portfolio Investment in Equities
Sources: IMF CPIS, IFS; and authors’ calculations. Sources: IMF CPIS, IFS; and authors’ calculations.
0
200
400
600
800
1,000
1,200
1,400
0
100
200
300
400
500
600
700
1981 1986 1991 1996 2001 2006 2011 2016
Japan China ASEAN Korea (RHS) Hong Kong
0
200
400
600
800
1,000
1,200
1,400
0
100
200
300
400
500
600
700
1981 1986 1991 1996 2001 2006 2011 2016
Japan China ASEAN Korea (RHS) Hong Kong
250
300
350
400
450
0
20
40
60
80
100
120
140
160
180
200
220
2009 2010 2011 2012 2013 2014 2015
Japan Korea China ASEAN Hong Kong (RHS)
250
300
350
400
450
0
20
40
60
80
100
120
140
160
180
200
220
2009 2010 2011 2012 2013 2014 2015
Japan Korea China ASEAN Hong Kong (RHS)
0
50
100
150
200
250
300
350
0
20
40
60
80
100
120
140
Q3 2002 Q3 2004 Q3 2006 Q3 2008 Q3 2010 Q3 2012 Q3 2014 Q3 2016
Japan Korea China ASEAN Hong Kong (RHS)
0
50
100
150
200
250
300
350
0
20
40
60
80
100
120
140
Q3 2002 Q3 2004 Q3 2006 Q3 2008 Q3 2010 Q3 2012 Q3 2014 Q3 2016
Japan Korea China ASEAN Hong Kong (RHS)
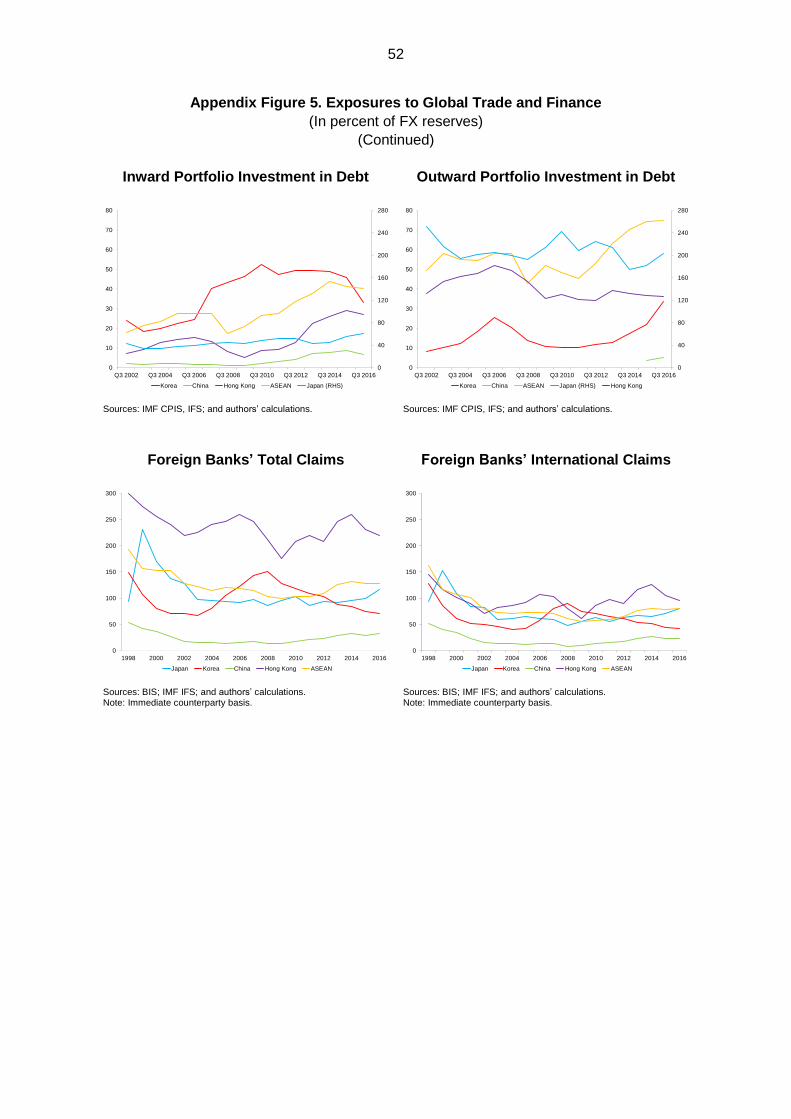
52
Appendix Figure 5. Exposures to Global Trade and Finance
(In percent of FX reserves)
(Continued)
Inward Portfolio Investment in Debt
Outward Portfolio Investment in Debt
Sources: IMF CPIS, IFS; and authors’ calculations. Sources: IMF CPIS, IFS; and authors’ calculations.
Foreign Banks’ Total Claims
Foreign Banks’ International Claims
Sources: BIS; IMF IFS; and authors’ calculations. Note: Immediate counterparty basis.
Sources: BIS; IMF IFS; and authors’ calculations. Note: Immediate counterparty basis.
0
40
80
120
160
200
240
280
0
10
20
30
40
50
60
70
80
Q3 2002 Q3 2004 Q3 2006 Q3 2008 Q3 2010 Q3 2012 Q3 2014 Q3 2016
Korea China Hong Kong ASEAN Japan (RHS)
0
40
80
120
160
200
240
280
0
10
20
30
40
50
60
70
80
Q3 2002 Q3 2004 Q3 2006 Q3 2008 Q3 2010 Q3 2012 Q3 2014 Q3 2016
Korea China ASEAN Japan (RHS) Hong Kong
0
50
100
150
200
250
300
1998 2000 2002 2004 2006 2008 2010 2012 2014 2016
Japan Korea China Hong Kong ASEAN
0
50
100
150
200
250
300
1998 2000 2002 2004 2006 2008 2010 2012 2014 2016
Japan Korea China Hong Kong ASEAN
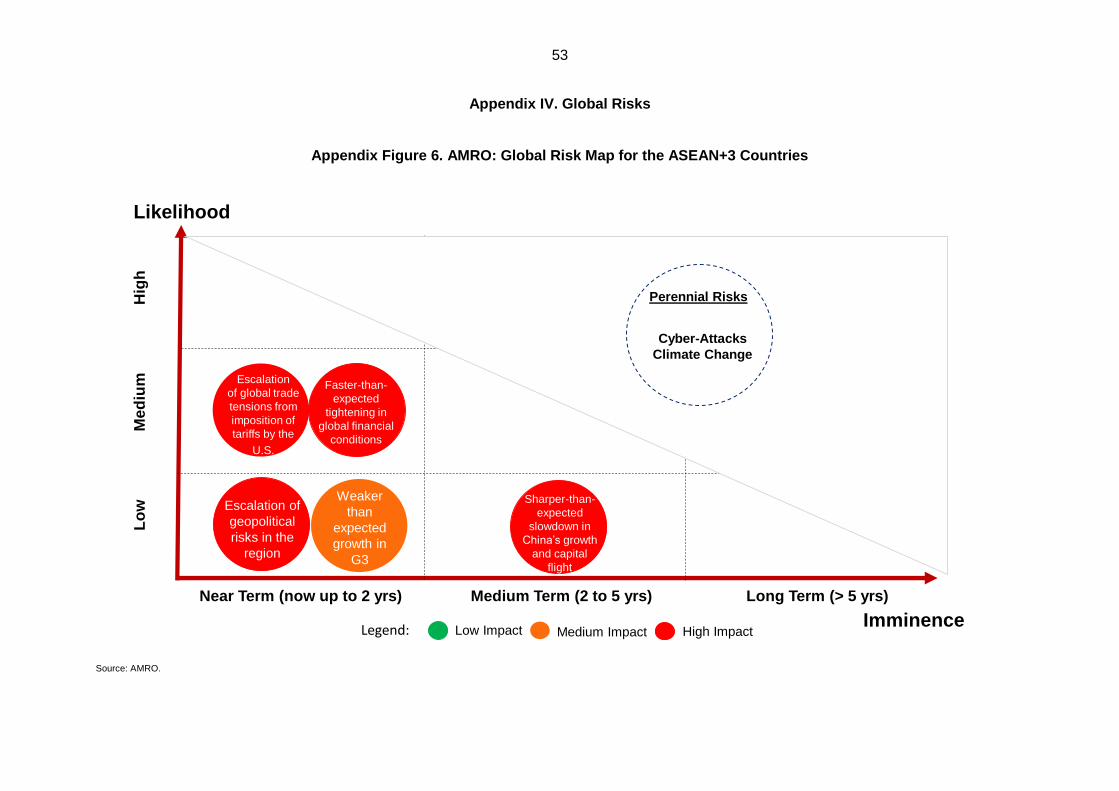
53
Appendix IV. Global Risks
Appendix Figure 6. AMRO: Global Risk Map for the ASEAN+3 Countries
Source: AMRO.
Likelihood
Imminence
Lo
w
Med
ium
H
igh
Near Term (now up to 2 yrs) Medium Term (2 to 5 yrs) Long Term (> 5 yrs)
Legend: Low Impact Medium Impact High Impact
Perennial Risks
Cyber-Attacks
Climate Change
Escalation
of global trade
tensions from
imposition of
tariffs by the
U.S.
Faster-than-
expected
tightening in
global financial
conditions
Weaker
than
expected
growth in
G3
Sharper-than-
expected
slowdown in
China’s growth
and capital
flight
Escalation of
geopolitical
risks in the
region
54
References
Aizenman, Joshua. 2009. “Alternatives to Sizeable Hoarding of International Reserves:
Lessons from the Global Liquidity Crisis.” VoxEU.org, November 30.
http://voxeu.org/article/hoarding-international-reserves-lessons-crisis.
Aizenman, Joshua and Yi Sun. 2009. “The Financial Crisis and Sizable International Reserves
Depletion: From ‘Fear of Floating’ to the ‘Fear of Losing International Reserves?” NBER
Working Paper No. 15308, National Bureau of Economic Research, Cambridge,
Massachusetts.
http://www.nber.org/papers/w15308.
Arregui, Nicolas, Jaromír Beneš, Ivo Krznar, Srobona Mitra, and Andre Oliveira Santos. 2013.
“Evaluating the Net Benefits of Macroprudential Policy: A Cookboo.,” IMF Working Paper
13/167, International Monetary Fund, Washington, DC.
https://www.imf.org/en/Publications/WP/Issues/2016/12/31/Evaluating-the-Net-
Benefits-of-Macroprudential-Policy-A-Cookbook-40790.
ASEAN+3. 2000. “The Joint Ministerial Statement of the ASEAN+3 Finance Ministers Meeting.”
Chiang Mai, 6 May.
http://www.mof.go.jp/english/international_policy/convention/asean_plus_3/20000506.
htm.
ASEAN+3. 2017. “The Joint Statement of the 20th ASEAN+3 Finance Ministers’ and Central
Bank Governors’ Meeting.” Yokohama, 5 May.
http://www.amro-asia.org/the-joint-statement-of-the-20th-asean3-finance-ministers-
and-central-bank-governors-meeting-may-5-2017-yokohama-japan/.
ASEAN+3 Macroeconomic Research Office. 2017. “Theme: ASEAN+3 Region 20 Years After
the Asian Financial Crisis.” ASEAN+3 Regional Economic Outlook. Singapore, May.
http://www.amro-asia.org/asean3-regional-economic-outlook-areo-2017/.
Asian Development Bank. 2017a. “Cross-Border Investment.” Chapter 3 of the Asian
Economic Integration Report. Manila, October.
https://www.adb.org/publications/asian-economic-integration-report-2017.
Asian Development Bank. 2017b. “Cross-Border Investment.” Chapter 3 of the Asian
Economic Integration Report. Manila, October.
https://www.adb.org/publications/asian-economic-integration-report-2017.
Bank for International Settlements. 2016. “Triennial Central Bank Survey of Foreign Exchange
and OTC Markets in 2016.” Basel, 11 December.
https://www.bis.org/publ/rpfx16.htm.
Bhattacharya, Rina, Fei Han and James P. Walsh. 2015. “The Future of Asia’s Financial
Sector.” In The Future of Asian Finance, edited by Ratna Sahay, Jerald Schiff, Cheng
Hoon Lim, Chikahisa Sumi and James P. Walsh. Washington, DC: International
Monetary Fund.
https://www.imf.org/en/Publications/Books/Issues/2016/12/31/The-Future-of-Asian-
Finance-42582.
55
Coeure, Benoit. 2015. “Policy Coordination in a Multipolar World.” In Bretton Woods: The
Next 70 Years, edited by Marc Uzan. Reinventing Bretton Woods Committee, Ankara, 4
September.
https://eml.berkeley.edu/~eichengr/Bretton-Woods-next-70.pdf
Denbee, Edd, Carsten Jung and Francesco Paternò. 2016. “Stitching Together the Global
Financial Safety Net.” Financial Stability Paper No. 36, Bank of England, London.
http://www.bankofengland.co.uk/financialstability/Pages/fpc/fspapers/fs_paper36.aspx.
Eichengreen, Barry. 2016. “Global Monetary Order.” The International Financial Architecture,
ECB Annual Research Conference, Sintra, 28–29 June.
https://2016.ecbforum.eu/8f85517967795eeef66c225f7883bdcb&ff=YmluX3BhcGVyX3
BkZg==&fd=dGl0dWxvX2Vu&tid=YXJ0aWdvcw==&pf=UEFQRVJf.pdf.
European Central Bank. 2012. “Has the Crisis Left a Lasting Mark on Global Trade?” Quarterly
Report on the Euro Area 11 (2), Frankfurt, July.
http://ec.europa.eu/economy_finance/publications/qr_euro_area/2012/pdf/qrea2_sectio
n_1_en.pdf.
Financial Stability Board. 2017. “Global Shadow Banking Monitoring Report 2016.” Basel, May.
http://www.fsb.org/2017/05/global-shadow-banking-monitoring-report-2016/#footnote-
ref-1.
International Monetary Fund. 2015. The Future of Asian Finance, edited by Ratna Sahay,
Jerald Schiff, Cheng Hoon Lim, Chikahisa Sumi and James P. Walsh. Washington, DC:
International Monetary Fund.
https://www.imf.org/en/Publications/Books/Issues/2016/12/31/The-Future-of-Asian-
Finance-42582.
International Monetary Fund. 2016a. “The Growing Importance of Financial Spillovers from
Emerging Market Economies.” Chapter 2 of the Global Financial Stability Report.
Washington, DC, April.
http://www.imf.org/en/Publications/GFSR/Issues/2016/12/31/Potent-Policies-for-a-
Successful-Normalization.
International Monetary Fund. 2016b. “Spillovers from China’s Transition and from Migration.”
Chapter 4 of the World Economic Outlook. Washington, DC, April.
http://www.imf.org/en/publications/weo/issues/2016/12/31/too-slow-for-too-long.
International Monetary Fund. 2016c. “Strengthening the International Monetary System—A
Stocktaking.” IMF Policy Paper, Washington DC, March.
https://www.imf.org/en/Publications/Policy-Papers/Issues/2016/12/31/Strengthening-
the-International-Monetary-System-A-Stocktaking-PP5023.
International Monetary Fund. 2016d. “Adequacy of the Global Financial Safety Net.” IMF
Policy Paper, Washington, DC, March.
http://www.imf.org/en/publications/policy-papers/issues/2016/12/31/adequacy-of-the-
global-financial-safety-net-pp5025.
56
International Monetary Fund. 2017. “Collaboration between Regional Financing Arrangements
and the IMF.” IMF Policy Paper, Washington, DC, July.
https://www.imf.org/en/Publications/Policy-Papers/Issues/2017/07/31/pp073117-
collaboration-between-regional-financing-arrangements-and-the-imf.
Jeasakul, Phakawa, Cheng Hoon Lim and Erik Lundback. 2015. “Is Asia Still Resilient?” In
The Future of Asian Finance, edited by Ratna Sahay, Jerald Schiff, Cheng Hoon Lim,
Chikahisa Sumi and James P. Walsh. Washington, DC: International Monetary Fund.
https://www.imf.org/en/Publications/Books/Issues/2016/12/31/The-Future-of-Asian-
Finance-42582.
Jha, Madhur, Samantha Amerasinghe and John Calverley. 2015. “Global Supply Chains: New
Directions.” Standard Chartered Bank Special Report, London, May.
Jha, Madhur, Samantha Amerasinghe, Chidu Narayan, John Calverley and Achilleas
Chrysostomou. 2014. “Global Trade Unbundled.” Standard Chartered Bank Special
Report, London, April.
Laeven, Luc and Fabian Valencia. 2012. “Systemic Banking Crises Database: An Update.”
IMF Working Paper 12/163, International Monetary Fund, Washington, DC.
https://www.imf.org/en/Publications/WP/Issues/2016/12/31/Systemic-Banking-Crises-
Database-An-Update-26015.
Enrique Garcia, L. 2015. “Strengthening Lines of Defense to Prevent Future Financial Crises.”
In Bretton Woods: The Next 70 Years, edited by Marc Uzan. Reinventing Bretton Woods
Committee, Ankara, 4 September.
https://eml.berkeley.edu/~eichengr/Bretton-Woods-next-70.pdf.
Grimes, William W. 2011. “The Asian Monetary Fund Reborn? Implications of Chiang Mai
Initiative Multilateralization.” Asia Policy 11 (January).
http://www.nbr.org/publications/element.aspx?id=484.
Kawai, Masahiro. 2015. “From the Chiang Mai Initiative to an Asian Monetary Fund.” ADB
Institute Working Paper No. 527, Asian Development Bank, Manila.
https://www.adb.org/publications/chiang-mai-initiative-asian-monetary-fund.
Lamberte, Mario B. and Peter J. Morgan. 2012. “Regional and Global Monetary Cooperation.”
ADB Institute Working Paper No. 346, Asian Development Bank, Manila.
https://www.adb.org/publications/regional-and-global-monetary-cooperation.
Lamberte, Mario B. and Peter J. Morgan. 2014. “Regional and Global Monetary Cooperation.”
In Reform of the International Monetary System: An Asian Perspective, edited by
Masahiro Kawai, Mario B. Lamberte and Peter J. Morgan. Manila: Asian Development
Bank.
https://www.adb.org/publications/reform-international-monetary-system-asian-
perspective.
Malpass, David R. 2017. “Statement to the Subcommittee on Monetary Policy and Trade
House Financial Services Committee.” U.S. Department of Treasury, Washington, DC,
8 November.
https://www.treasury.gov/press-center/press-releases/Pages/sm0211.aspx.
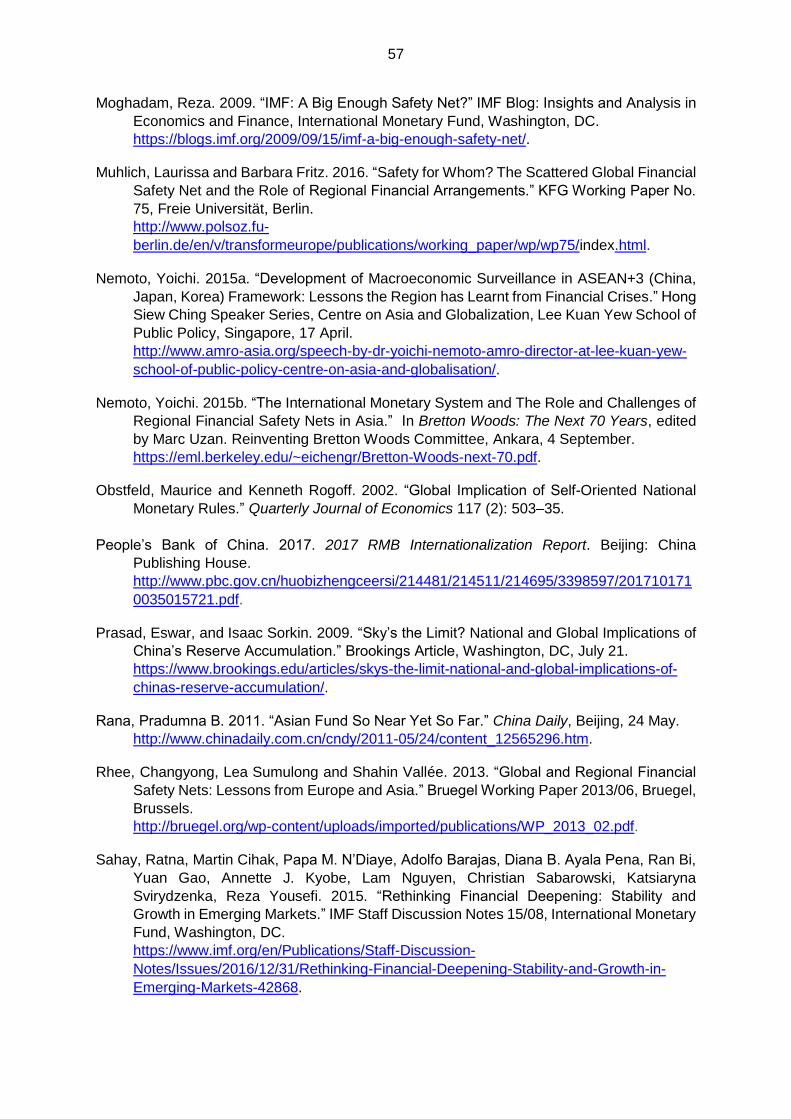
57
Moghadam, Reza. 2009. “IMF: A Big Enough Safety Net?” IMF Blog: Insights and Analysis in
Economics and Finance, International Monetary Fund, Washington, DC.
https://blogs.imf.org/2009/09/15/imf-a-big-enough-safety-net/.
Muhlich, Laurissa and Barbara Fritz. 2016. “Safety for Whom? The Scattered Global Financial
Safety Net and the Role of Regional Financial Arrangements.” KFG Working Paper No.
75, Freie Universität, Berlin.
http://www.polsoz.fu-
berlin.de/en/v/transformeurope/publications/working_paper/wp/wp75/index.html.
Nemoto, Yoichi. 2015a. “Development of Macroeconomic Surveillance in ASEAN+3 (China,
Japan, Korea) Framework: Lessons the Region has Learnt from Financial Crises.” Hong
Siew Ching Speaker Series, Centre on Asia and Globalization, Lee Kuan Yew School of
Public Policy, Singapore, 17 April.
http://www.amro-asia.org/speech-by-dr-yoichi-nemoto-amro-director-at-lee-kuan-yew-
school-of-public-policy-centre-on-asia-and-globalisation/.
Nemoto, Yoichi. 2015b. “The International Monetary System and The Role and Challenges of
Regional Financial Safety Nets in Asia.” In Bretton Woods: The Next 70 Years, edited
by Marc Uzan. Reinventing Bretton Woods Committee, Ankara, 4 September.
https://eml.berkeley.edu/~eichengr/Bretton-Woods-next-70.pdf.
Obstfeld, Maurice and Kenneth Rogoff. 2002. “Global Implication of Self-Oriented National
Monetary Rules.” Quarterly Journal of Economics 117 (2): 503–35.
People’s Bank of China. 2017. 2017 RMB Internationalization Report. Beijing: China
Publishing House.
http://www.pbc.gov.cn/huobizhengceersi/214481/214511/214695/3398597/201710171
0035015721.pdf.
Prasad, Eswar, and Isaac Sorkin. 2009. “Sky’s the Limit? National and Global Implications of
China’s Reserve Accumulation.” Brookings Article, Washington, DC, July 21.
https://www.brookings.edu/articles/skys-the-limit-national-and-global-implications-of-
chinas-reserve-accumulation/.
Rana, Pradumna B. 2011. “Asian Fund So Near Yet So Far.” China Daily, Beijing, 24 May.
http://www.chinadaily.com.cn/cndy/2011-05/24/content_12565296.htm.
Rhee, Changyong, Lea Sumulong and Shahin Vallée. 2013. “Global and Regional Financial
Safety Nets: Lessons from Europe and Asia.” Bruegel Working Paper 2013/06, Bruegel,
Brussels.
http://bruegel.org/wp-content/uploads/imported/publications/WP_2013_02.pdf.
Sahay, Ratna, Martin Cihak, Papa M. N’Diaye, Adolfo Barajas, Diana B. Ayala Pena, Ran Bi,
Yuan Gao, Annette J. Kyobe, Lam Nguyen, Christian Sabarowski, Katsiaryna
Svirydzenka, Reza Yousefi. 2015. “Rethinking Financial Deepening: Stability and
Growth in Emerging Markets.” IMF Staff Discussion Notes 15/08, International Monetary
Fund, Washington, DC.
https://www.imf.org/en/Publications/Staff-Discussion-
Notes/Issues/2016/12/31/Rethinking-Financial-Deepening-Stability-and-Growth-in-
Emerging-Markets-42868.
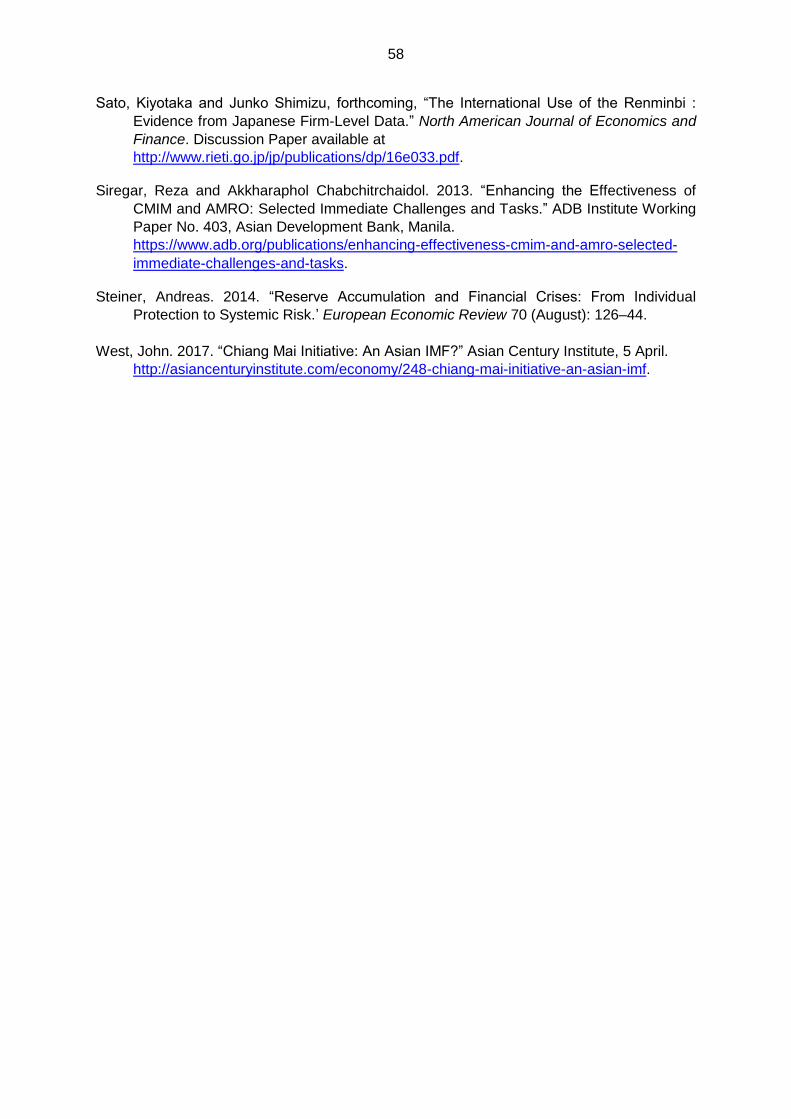
58
Sato, Kiyotaka and Junko Shimizu, forthcoming, “The International Use of the Renminbi :
Evidence from Japanese Firm-Level Data.” North American Journal of Economics and
Finance. Discussion Paper available at
http://www.rieti.go.jp/jp/publications/dp/16e033.pdf.
Siregar, Reza and Akkharaphol Chabchitrchaidol. 2013. “Enhancing the Effectiveness of
CMIM and AMRO: Selected Immediate Challenges and Tasks.” ADB Institute Working
Paper No. 403, Asian Development Bank, Manila.
https://www.adb.org/publications/enhancing-effectiveness-cmim-and-amro-selected-
immediate-challenges-and-tasks.
Steiner, Andreas. 2014. “Reserve Accumulation and Financial Crises: From Individual
Protection to Systemic Risk.’ European Economic Review 70 (August): 126–44.
West, John. 2017. “Chiang Mai Initiative: An Asian IMF?” Asian Century Institute, 5 April.
http://asiancenturyinstitute.com/economy/248-chiang-mai-initiative-an-asian-imf.
59
Annex. Survey Results: The Market’s Views on a Financial Safety Net for Asia
A. Introduction
The ASEAN+3 members (hereafter “members”) of the Chiang Mai Initiative Multilateralization
(CMIM) are continuously seeking to enhance and optimize its effectiveness within the Global
Financial Safety Net (GFSN). A number of Regional Financing Arrangements have been
introduced globally, against the backdrop of an evolving International Monetary System (IMS),
to deal with the rising incidence of financial crises and liquidity events. In Asia, the Chiang Mai
Initiative (CMI) was established in response to the Asian Financial Crisis (AFC) and
subsequently expanded to become the CMIM in 2010 after the Global Financial Crisis (GFC).
Market participants were surveyed by AMRO staff for their views on the importance of a
Regional Financial Safety Net for Asia’s financial stability. Their (anonymous) input provided
insights into how the CMIM could potentially be developed to help build and sustain market
confidence in Asia. An online questionnaire, “Short Survey of the Market’s Views on a
Financial Safety Net for Asia,” was sent out to about 150 individuals in the field of economics
and finance and responses were submitted by around a third of the recipients (see Survey
Questionnaire below).
This paper is organized as follows. Section B presents and analyzes respondents’ views on
the usefulness and possible alternatives to the design of the CMIM. Section C concludes.
B. Survey Responses
The distribution of survey respondents represents a comprehensive coverage of market
sectors (Annex Figure 1). Respondents largely work in the sell-side, buy side or independent
market research firms. Other respondents include risk managers, commercial bankers,
academics, ratings analysts.
The countries covered by respondents include all ASEAN+3 members (Annex Figure 2).
Some analysts cover the broader Asia-Pacific region including non-members, or even general
global developments, while others focus on specific countries. Many work for institutions that
have both regional and global offices.
Respondents, by far, consider U.S. monetary policy developments to be the biggest risk to the
capital flows of members (Annex Figure 3). This is consistent with AMRO staff’s assessment
that a faster than expected rise in U.S. policy rates poses a high impact risk to the region.
Geopolitical tensions are rated the most important risk by the next largest group of
respondents, followed by debt sustainability concerns. However, more respondents ranked
the latter as the second most important risk relative to the former. Overall, the domestic
macroeconomic policy settings of members are viewed as the second most important risk by
the biggest number of respondents, while banking system fragilities among members are not
a major concern at this stage. Other potential risks raised by respondent include trade
protectionism.
60
Annex Figure 1. AMRO Survey Results: Work Sector of Respondents
Sources: Survey respondents; and AMRO staff calculations.
Annex Figure 2. AMRO Survey Results: Country Coverage of Respondents
Sources: Survey respondents; and AMRO staff calculations.
Sell-side, 36
Other, 31
Independent
research firm, 18 Buy-side, 16
0
5
10
15
20
25
30
Ch
ina
Th
aila
nd
Ja
pa
n
Ko
rea
Ind
one
sia
Ma
laysia
Ph
ilip
pin
es
Sin
ga
po
re
Ho
ng
Ko
ng
CL
MV
Oth
er
Num
be
r o
f R
espo
nde
nts
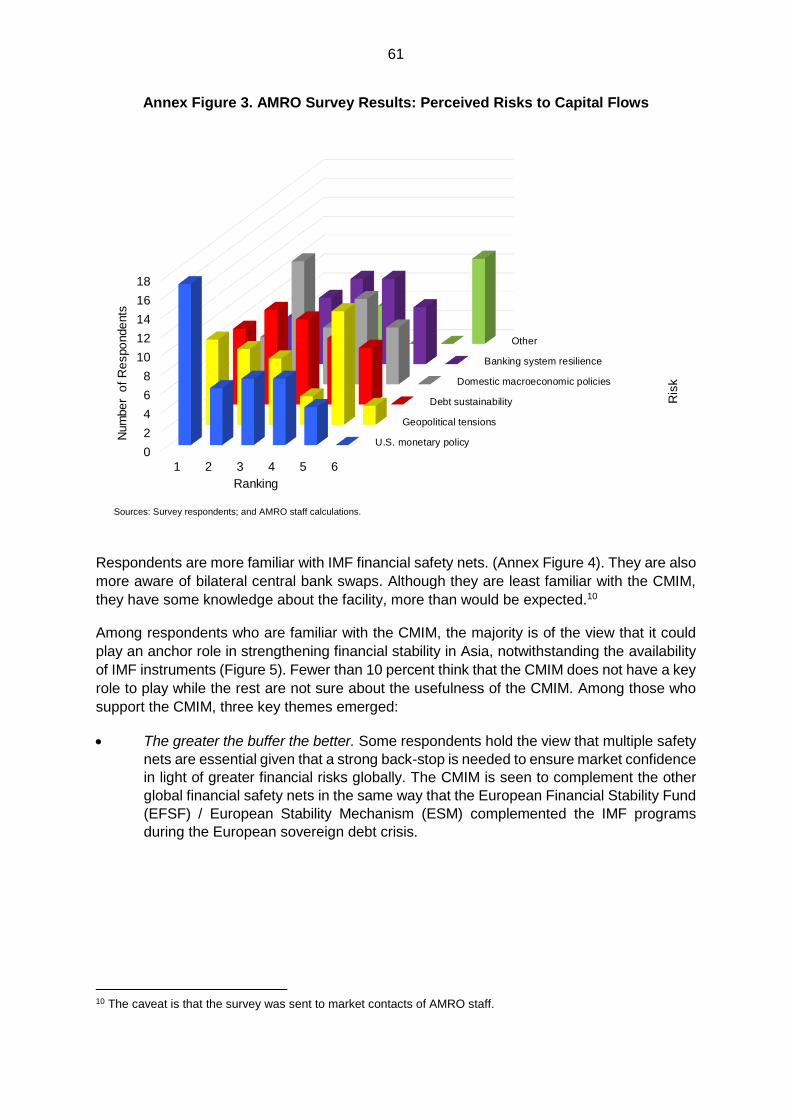
61
Annex Figure 3. AMRO Survey Results: Perceived Risks to Capital Flows
Sources: Survey respondents; and AMRO staff calculations.
Respondents are more familiar with IMF financial safety nets. (Annex Figure 4). They are also
more aware of bilateral central bank swaps. Although they are least familiar with the CMIM,
they have some knowledge about the facility, more than would be expected.10
Among respondents who are familiar with the CMIM, the majority is of the view that it could
play an anchor role in strengthening financial stability in Asia, notwithstanding the availability
of IMF instruments (Figure 5). Fewer than 10 percent think that the CMIM does not have a key
role to play while the rest are not sure about the usefulness of the CMIM. Among those who
support the CMIM, three key themes emerged:
The greater the buffer the better. Some respondents hold the view that multiple safety
nets are essential given that a strong back-stop is needed to ensure market confidence
in light of greater financial risks globally. The CMIM is seen to complement the other
global financial safety nets in the same way that the European Financial Stability Fund
(EFSF) / European Stability Mechanism (ESM) complemented the IMF programs
during the European sovereign debt crisis.
10 The caveat is that the survey was sent to market contacts of AMRO staff.
U.S. monetary policy
Geopolitical tensions
Debt sustainability
Domestic macroeconomic policies
Banking system resilience
Other
0
2
4
6
8
10
12
14
16
18
1 2 3 4 5 6
Ris
k
Num
be
r o
f R
espo
nde
nts
Ranking
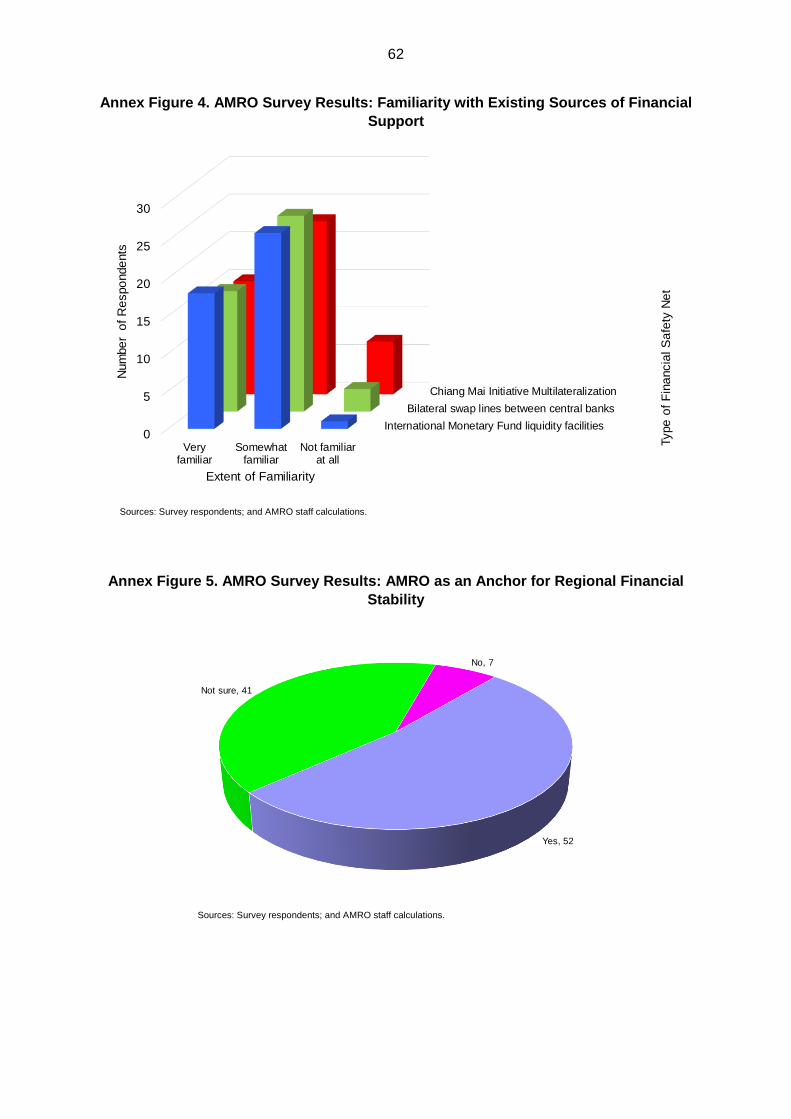
62
Annex Figure 4. AMRO Survey Results: Familiarity with Existing Sources of Financial
Support
Sources: Survey respondents; and AMRO staff calculations.
Annex Figure 5. AMRO Survey Results: AMRO as an Anchor for Regional Financial
Stability
Sources: Survey respondents; and AMRO staff calculations.
International Monetary Fund liquidity facilities
Bilateral swap lines between central banks
Chiang Mai Initiative Multilateralization
0
5
10
15
20
25
30
Veryfamiliar
Somewhatfamiliar
Not familiarat all
Type
of
Fin
ancia
l S
afe
ty N
et
Num
be
r o
f R
espo
nde
nts
Extent of Familiarity
Yes, 52
Not sure, 41
No, 7
63
An Asia-focused approach to financial stability is important. The general impression is
that the CMIM would be more sensitive to local conditions and have greater
understanding of political economy considerations. The CMIM’s familiarity with
regional dynamics and (perceived) closer cooperation across central banks would
allow more timely and appropriate interventions that are better suited to individual
situations. In this context, AMRO remains relatively unknown and could better promote
its role among international financial institutions within the region.
The IMF is too inflexible and dominated by the global superpowers. The institution is
seen to be too heavy-handed—overly strict with countries that request support, with
too many strings attached, and should only be considered as a last resort.
Meanwhile, several concerns were raised by those who are ambivalent about the role of the
CMIM or do not see use for the facility, notably:
The CMIM is untested. In contrast to the bilateral arrangements between regional
central banks and IMF support, there has been no precedent with the CMIM to date.
The operational modalities of the CMIM are still largely contingent on agreement with
IMF. The full scope of assistance from CMIM would still require adherence to some
form of IMF program.
The unavoidability of intra-regional politics. Some respondents are concerned that
policy tensions among the likely major liquidity providers may jeopardize the
effectiveness of the CMIM.
The need to strengthen surveillance capacity. Some respondents are concerned about
the lack of monitoring capability on behalf of the CMIM in the event that countries apply
to use the facility. The regional surveillance and research function is seen to require
strengthening.
Most respondents consider a regional precautionary liquidity facility to be the most or second
most important financial safety net (Annex Figure 6). By far, this instrument is seen to provide
much-needed reassurance to markets. Swap lines among regional central banks are ranked
most or second most effective by the next largest group. Other facilities that are currently
available through the IMF or the ESM in Europe are viewed as relatively less important for
supporting market confidence. There is also a suggestion for coordinated interventions by
central banks.
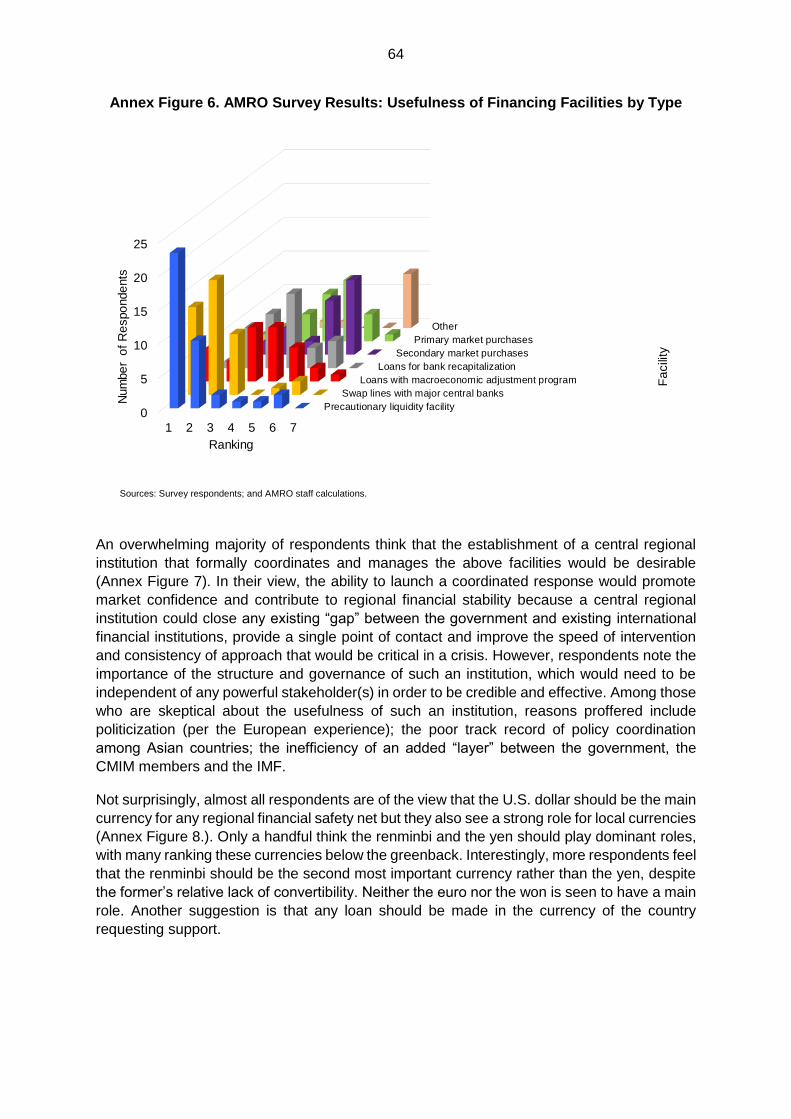
64
Annex Figure 6. AMRO Survey Results: Usefulness of Financing Facilities by Type
Sources: Survey respondents; and AMRO staff calculations.
An overwhelming majority of respondents think that the establishment of a central regional
institution that formally coordinates and manages the above facilities would be desirable
(Annex Figure 7). In their view, the ability to launch a coordinated response would promote
market confidence and contribute to regional financial stability because a central regional
institution could close any existing “gap” between the government and existing international
financial institutions, provide a single point of contact and improve the speed of intervention
and consistency of approach that would be critical in a crisis. However, respondents note the
importance of the structure and governance of such an institution, which would need to be
independent of any powerful stakeholder(s) in order to be credible and effective. Among those
who are skeptical about the usefulness of such an institution, reasons proffered include
politicization (per the European experience); the poor track record of policy coordination
among Asian countries; the inefficiency of an added “layer” between the government, the
CMIM members and the IMF.
Not surprisingly, almost all respondents are of the view that the U.S. dollar should be the main
currency for any regional financial safety net but they also see a strong role for local currencies
(Annex Figure 8.). Only a handful think the renminbi and the yen should play dominant roles,
with many ranking these currencies below the greenback. Interestingly, more respondents feel
that the renminbi should be the second most important currency rather than the yen, despite
the former’s relative lack of convertibility. Neither the euro nor the won is seen to have a main
role. Another suggestion is that any loan should be made in the currency of the country
requesting support.
Precautionary liquidity facility
Swap lines with major central banks
Loans with macroeconomic adjustment program
Loans for bank recapitalization
Secondary market purchases
Primary market purchases
Other
0
5
10
15
20
25
1 2 3 4 5 6 7
Fa
cili
ty
Num
be
r o
f R
espo
nde
nts
Ranking
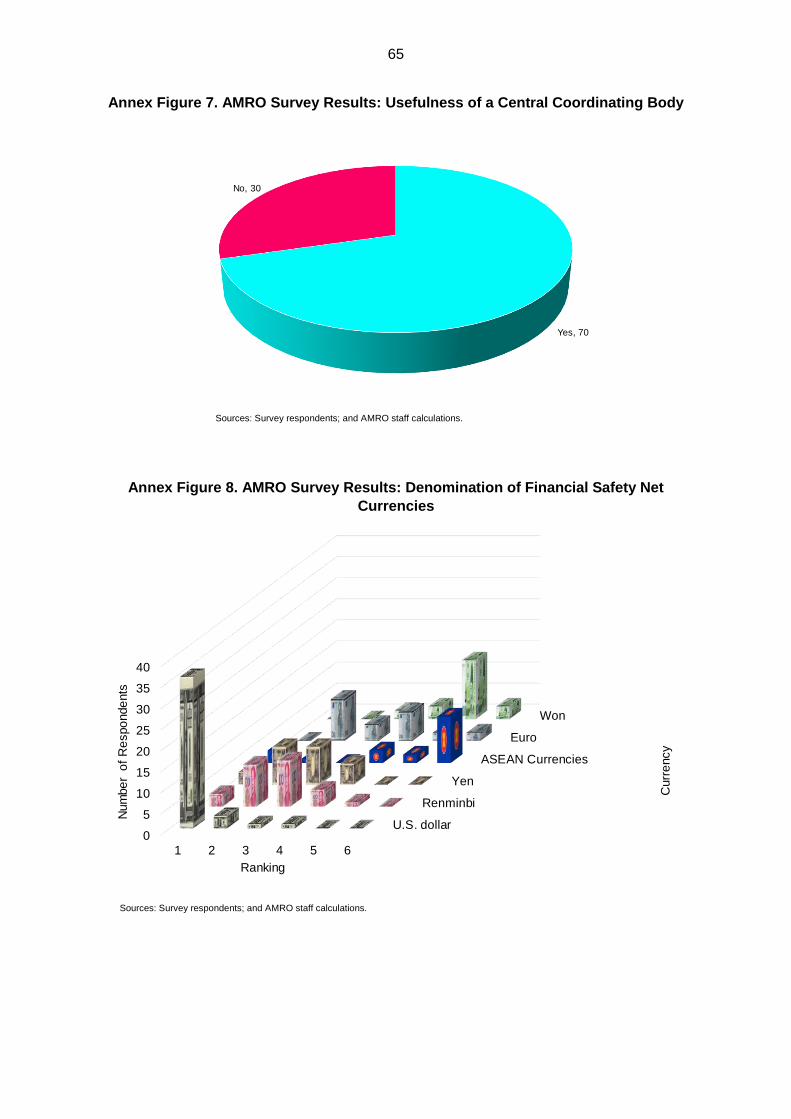
65
Annex Figure 7. AMRO Survey Results: Usefulness of a Central Coordinating Body
Sources: Survey respondents; and AMRO staff calculations.
Annex Figure 8. AMRO Survey Results: Denomination of Financial Safety Net
Currencies
Sources: Survey respondents; and AMRO staff calculations.
Yes, 70
No, 30
U.S. dollar
Renminbi
Yen
ASEAN Currencies
Euro
Won
0
5
10
15
20
25
30
35
40
1 2 3 4 5 6
Curr
ency
Num
be
r o
f R
espo
nde
nts
Ranking
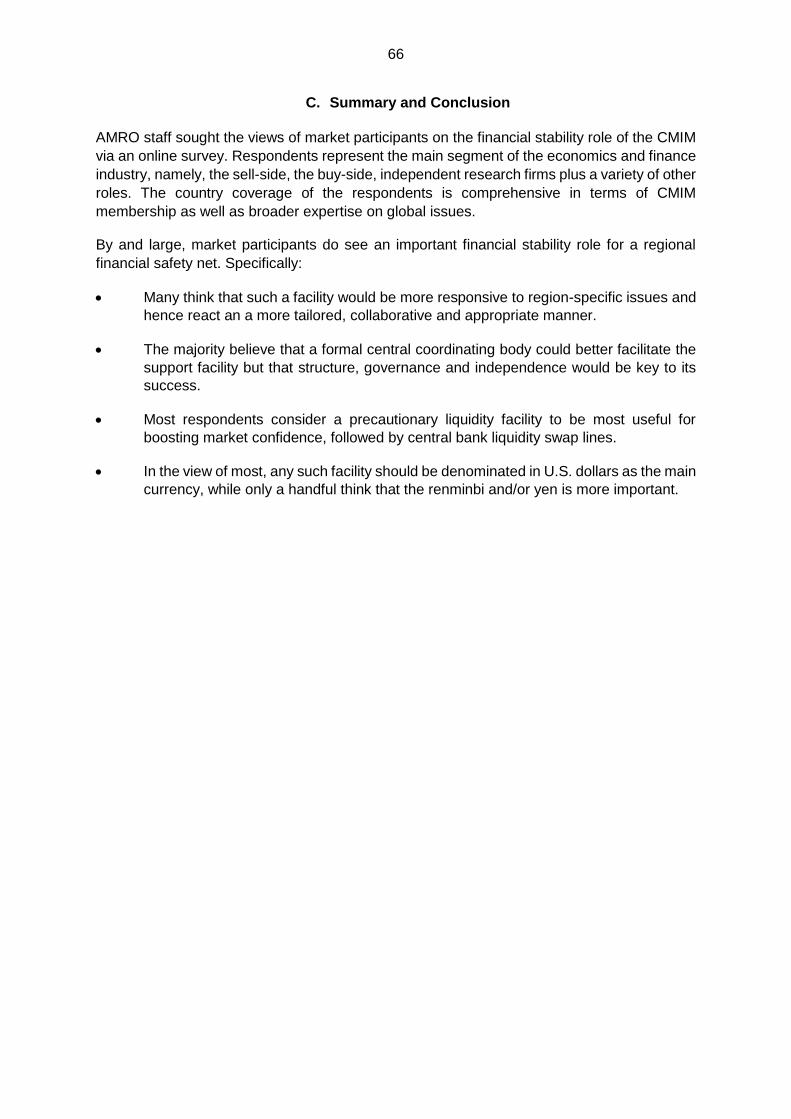
66
C. Summary and Conclusion
AMRO staff sought the views of market participants on the financial stability role of the CMIM
via an online survey. Respondents represent the main segment of the economics and finance
industry, namely, the sell-side, the buy-side, independent research firms plus a variety of other
roles. The country coverage of the respondents is comprehensive in terms of CMIM
membership as well as broader expertise on global issues.
By and large, market participants do see an important financial stability role for a regional
financial safety net. Specifically:
Many think that such a facility would be more responsive to region-specific issues and
hence react an a more tailored, collaborative and appropriate manner.
The majority believe that a formal central coordinating body could better facilitate the
support facility but that structure, governance and independence would be key to its
success.
Most respondents consider a precautionary liquidity facility to be most useful for
boosting market confidence, followed by central bank liquidity swap lines.
In the view of most, any such facility should be denominated in U.S. dollars as the main
currency, while only a handful think that the renminbi and/or yen is more important.
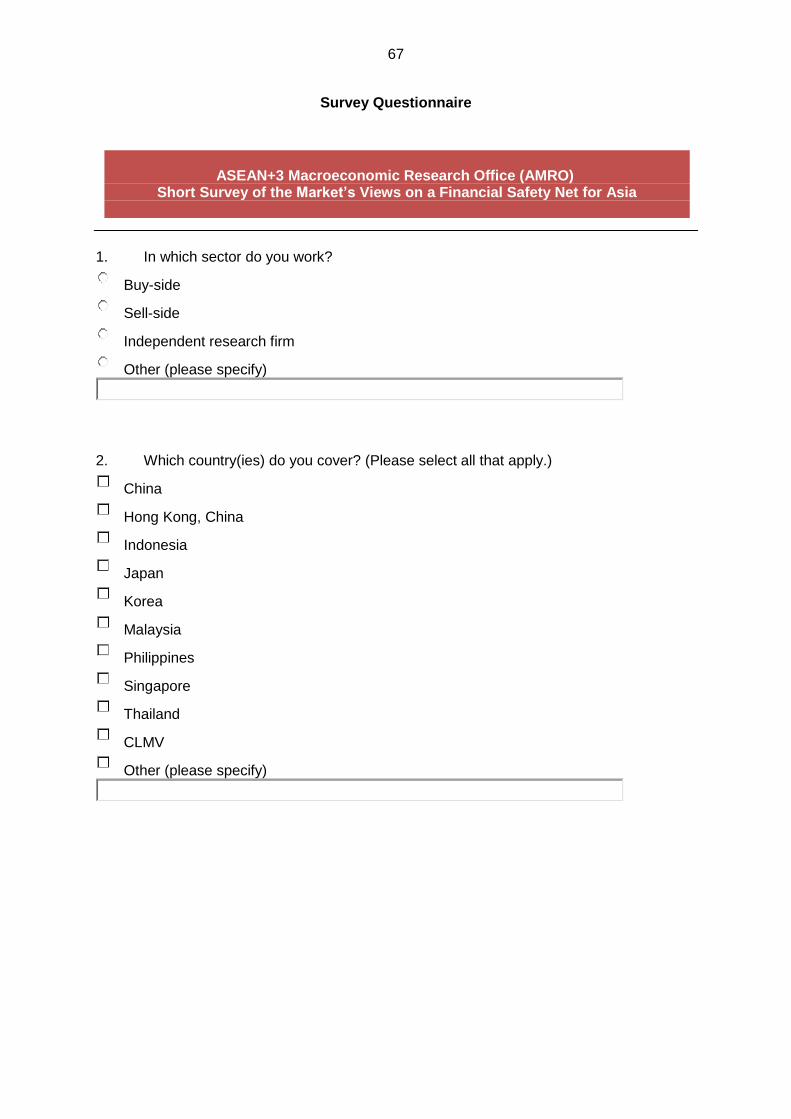
67
Survey Questionnaire
1. In which sector do you work?
Buy-side
Sell-side
Independent research firm
Other (please specify)
2. Which country(ies) do you cover? (Please select all that apply.)
China
Hong Kong, China
Indonesia
Japan
Korea
Malaysia
Philippines
Singapore
Thailand
CLMV
Other (please specify)
ASEAN+3 Macroeconomic Research Office (AMRO)
Short Survey of the Market’s Views on a Financial Safety Net for Asia
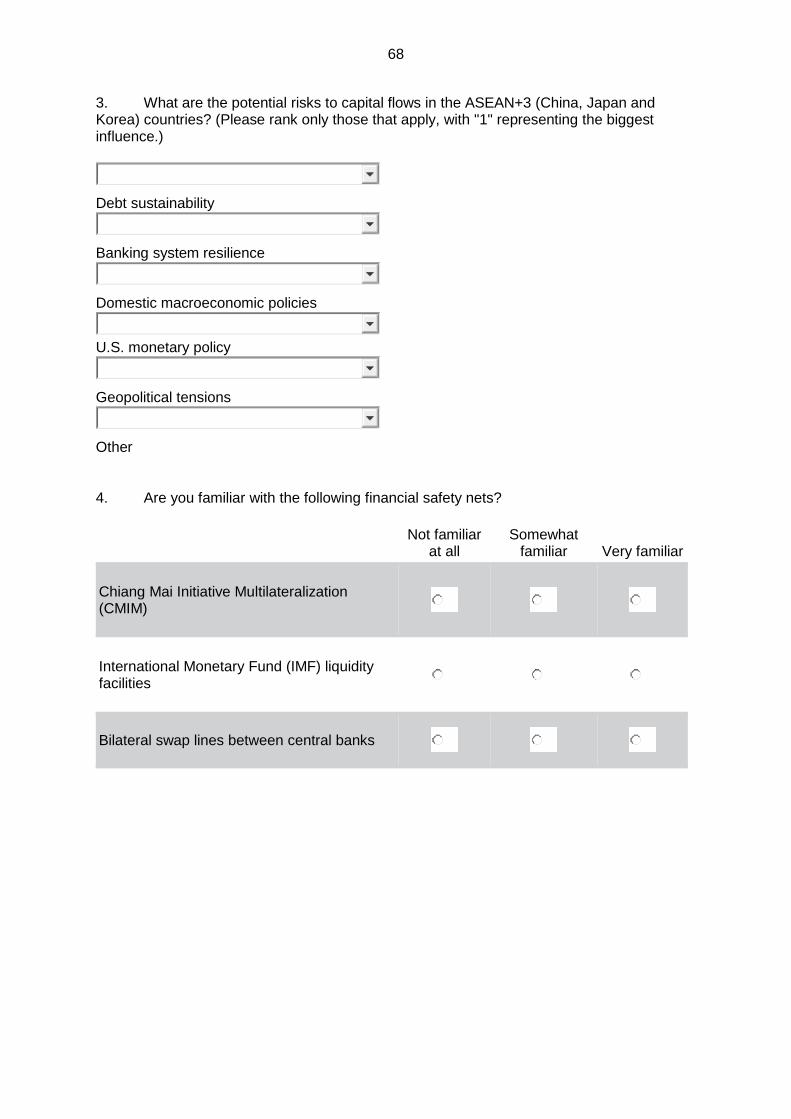
68
3. What are the potential risks to capital flows in the ASEAN+3 (China, Japan and Korea) countries? (Please rank only those that apply, with "1" representing the biggest influence.)
Debt sustainability
Banking system resilience
Domestic macroeconomic policies
U.S. monetary policy
Geopolitical tensions
Other
4. Are you familiar with the following financial safety nets?
Not familiar
at all Somewhat
familiar Very familiar
Chiang Mai Initiative Multilateralization (CMIM)
International Monetary Fund (IMF) liquidity facilities
Bilateral swap lines between central banks
69
5. If you have some familiarity with the CMIM, do you think that it could still play an anchor role in strengthening financial stability in Asia even though member countries are able to apply to the IMF for financial support anyway?
Yes...
No...
Not sure... ...because
6. What type(s) of regional financial safety net(s) would be most reassuring to Asian markets? (Please rank only those that apply, with "1" being the most effective.)
Precautionary liquidity facility (to help prevent liquidity difficulties for economies with sound
fundamentals and policies)
Swap lines with major central banks
Loans for bank recapitalization
Loans with macroeconomic adjustment program (to help maintain or regain market access)
Primary market purchases (to reduce the risk of a failed government bond auction)
Secondary market purchases (to help support liquidity in the government debt market)
Other
70
7. Would the establishment of a central regional institution that formally coordinates and manages any of the facility(ies) listed in Q6 promote market confidence in Asia and contribute to regional financial stability?
Yes...
No... ...because
8. In which currency(ies) should any regional financial safety net for Asia be denominated? (Please rank only those that apply, with "1" being the most important.)
U.S. dollar
Euro
Japanese yen
Chinese renminbi
Korean won
ASEAN currencies
9. Please share any additional views you may have on the topic, that are not covered by the questions above.