Embed Size (px)
Citation preview
Asian Development Bank6 ADB Avenue, Mandaluyong City1550 Metro Manila, Philippineswww.adb.org/waterPublication Stock No. 020206
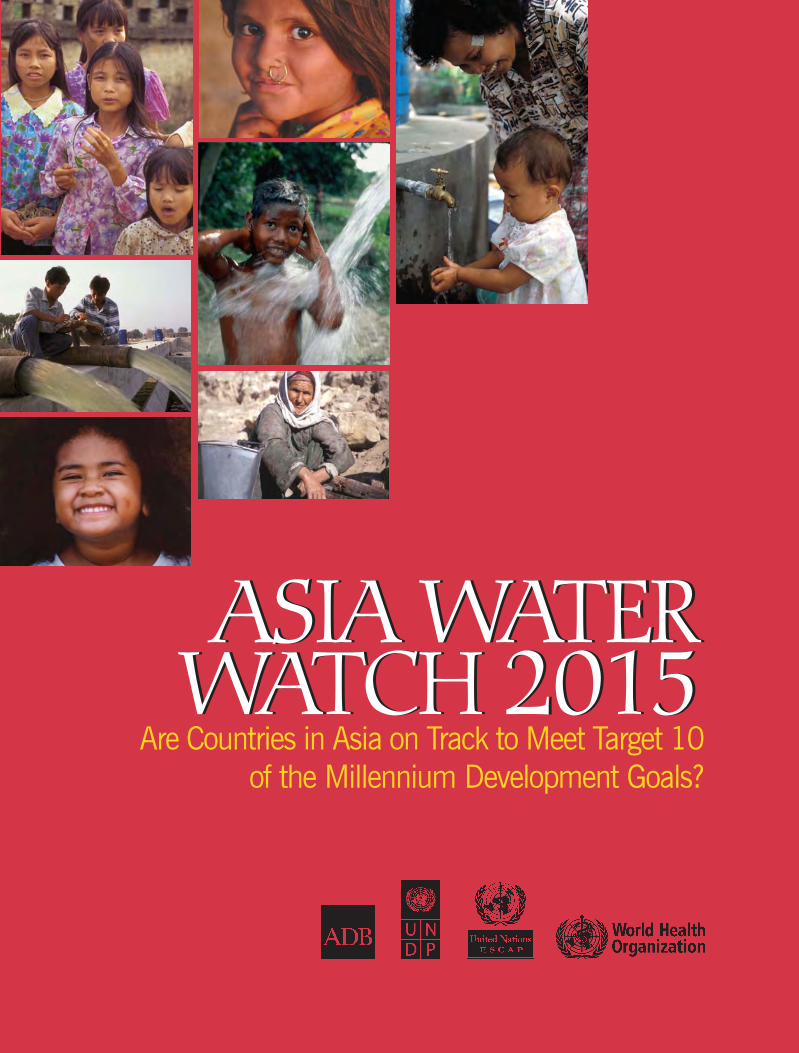
Asia Water Watch 2015
The Millennium Development Goals (MDGs), identified in the 2000 United Nations MillenniumDeclaration, reflect the commitment of the world community to work together and reduce globalpoverty. The MDGs’ Target 10 calls for the world to halve the proportion of people without sustain-able access to safe drinking water and improved sanitation by 2015. It presents a particularlyformidable challenge for Asia and the Pacific, where one in three persons does not have access tosafe, sustainable water supplies, and one in two to sanitation. This report assesses the region’sprospects of reaching Target 10. Important to the progress and prospects of the region is therationale that this report presents: it is not investing for water’s sake, but for poverty’s sake.
Printed in the Philippines
Are Countries in Asia on Track to Meet Target 10of the Millennium Development Goals?
ASIA WATERWATCH 2015ASIA WATER
WATCH 2015
Published jointly by the Asian Development Bank (ADB), United Nations Development Programme(UNDP), United Nations Economic and Social Commission for Asia and the Pacific (UNESCAP),and World Health Organization (WHO).
This publication was prepared by staff and consultants of ADB, in collaboration with UNDP,UNESCAP, and WHO.
© 2006 Asian Development Bank
All rights reserved. Published 2006.Printed in the Philippines.
Publication Stock No. 020206
The views expressed in this book are those of the authors and do not necessarily reflect the viewsand policies of the Asian Development Bank or its Board of Governors or the governments theyrepresent, the United Nations Development Programme, United Nations Economic and SocialCommission of Asia and the Pacific, and World Health Organization.
ADB, UNDP, UNESCAP, and WHO do not guarantee the accuracy of the data included in thispublication and accept no responsibility for any consequence of their use.
Use of the term “country” does not imply any judgment by the authors or ADB, UNDP, UNESCAP,and WHO as to the legal or other status of any territorial entity.
i
ASIA WATERWATCH 2015
Are Countries in Asia on Track to Meet Target 10of the Millennium Development Goals?
December 2005
ii
AbbreviationsADB Asian Development BankBRAC Bangladesh Rural Advancement CommitteeJMP WHO/UNICEF Joint Monitoring Programme
for Water Supply and SanitationMDGs Millennium Development GoalsNGO nongovernment organizationPEP Poverty Environment PartnershipPPWSA Phnom Penh Water Supply AuthorityPRSPs Poverty Reduction Strategy PapersSEWA Self-Employed Women’s AssociationUN United NationsUNDP United Nations Development ProgrammeUNESCAP United Nations Economic and Social Commission
for Asia and the PacificUNICEF United Nations Children’s FundWHO World Health OrganizationWSS water supply and sanitationWSSD World Summit on Sustainable Development
iii
Foreword
Kim Hak-SuUnited Nations Under-Secretary-General &Executive Secretary,United Nations Economicand Social Commissionfor Asia and the Pacific,Bangkok
Geert van der LindenVice PresidentAsian Development BankManila
Hafiz PashaUnited Nations AssistantSecretary General &UNDP Assistant Adminis-trator & Regional Direc-tor, Regional Bureau forAsia and the Pacific,New York
Susanne Weber-MosdorfAssistant Director GeneralSustainable Development andHealth Environments ClusterWorld Health Organization
Five years ago, the Millennium Development Goals(MDGs) unveiled a special horizon—one that the en-tire developing world has been tasked to arrive at by2015. At this horizon is a world half as afflictedwith poverty as the one we experience now. To ar-rive at this moment of achievement, though, we mustfirst cross the water barrier. We must strive to meetMDG Target 10: To halve, by 2015, the proportion ofpeople without sustainable access to safe drinkingwater and sanitation. The strong correlation betweenwater and poverty proves that when water is inac-cessible and unfit, it is a barrier. But when it is avail-able and clean, water is a bridge to even greatersecurity and prosperity for the poor.
For Asia and the Pacific, home to the majority ofthe world’s poor, MDG Target 10 is an especially am-bitious but critical goal. The number of people with-out improved water supplies in the People’s Republicof China alone is nearly as large as the number ofunderserved in the entire African continent.
Into the countdown to 2015, what progress doesthe Asia and Pacific region register in meeting MDGTarget 10? What more is required? How will meet-ing MDG Target 10 advance countries toward achiev-ing all eight MDGs?
This report offers answers to these questions.Prepared by the Asian Development Bank (ADB), theUnited Nations Economic and Social Commission forAsia and the Pacific (UNESCAP), the United Nations
Development Programme (UNDP), and World HealthOrganization (WHO), it uses the latest data avail-able to measure each country’s progress towardMDG Target 10 and analyzes whether it will beachieved. The results show a mixed picture. Somecountries have already met the target; others are ontrack; others are likely to miss it in 2015. Somecountries even show a decrease in coverage.
The analysis in this report figures the econom-ics of change—how much it will cost to ensure eachcountry in the region meets MDG Target 10. Con-sidering the economic returns of improved access towater on productivity and growth at both macroand micro levels, the paper argues that “it is theheight of economic irrationality to not invest in thesevital services.” The correlation between water andeach of the eight MDGs is explicitly drawn in thereport, showing water as a bridge to meeting allother MDGs. The report also defines the challengesthreatening the region’s chance of meeting MDGTarget 10 and assigns roles and responsibilities to betaken up by key stakeholders.
The regional picture this report presentsshould serve as a resource and representation ofthe progress and needs of the region’s 3.9 billionpeople. In this context, this report reminds us that2015 appears as a horizon today, but is actually,once arrived at, only a halfway marker toward apoverty-free world.
iv
AcknowledgementThis report was prepared under a partnership among four agencies: the Asian Devel-opment Bank (ADB), the United Nations Development Programme (UNDP), the UnitedNations Economic and Social Commission for Asia and the Pacific(UNESCAP), and theWorld Health Organization (WHO). It is designed to provide accurate and authorita-tive information on the progress, prospects, and price tag of meeting Target 10 of theMillennium Development Goals (MDGs): to halve, by 2015, the number of peoplewithout sustainable access to safe water supply and improved sanitation.
Kallidaikurichi Easwaran Seetharam, ADB; James Bartram, WHO; AnuradhaRajivan, UNDP; and Nanda Kraikiksh, UNESCAP, coordinated this publication on be-half of the respective agencies. John Soussan and Matthew Chadwick, of the StockholmEnvironment Institute, led the research and development of this publication.
Inputs and comments were provided by: (ADB) Melissa Alipalo, Wouter LincklaenArriens, Stephen Blaik, Mario Cabrera, Ma. Virginita Capulong, Shiladitya Chatterjee,Ma. Christina Dueñas, In-Ho Keum, Ellen Pascua, Bhanoji Rao, Fransisco Roble Jr.,and Grendel Saldevar; (UNESCAP) Rae Kwon Chung, Anatoly Kadushkin, LeHuu Ti,and Yuri Steklov; and (WHO) Houssain Abouzaid, Roger Aertgeerts, Laurence Haller,Han Heijnen, Jose Hueb, and Terrence Thompson.

v
ContentsChapter 1: Setting the Scene: Water, Poverty, and the MDGs 1
Chapter 2: Water Supply Coverage: Progress and Prospects 9
Chapter 3: Sanitation Coverage: Progress and Prospects 17
Chapter 4: Meeting Target 10: How Much Will It Cost? 23
Chapter 5: Maximizing Target 10: Reaping the Full Social and Economic Benefits 27
Chapter 6: Defining the Challenges: Where Change is Needed 37
Chapter 7: Meeting the Challenges: Who Should Do What? 41
Endnotes 46
Annexes 48
vi
Are Countries in Asia on Track to Meet Target 10 of the MDGs? 1
Setting the Scene:Water,1 Poverty, andthe MDGsTHE MILLENNIUM DEVELOPMENT GOALS (MDGs) reflect the commitment of theworld community to work together and reduce global poverty. The MDGs do not claimto capture all aspects of poverty reduction. They are, rather, a way of understandingwhat must be done if poverty is to be reduced. And momentum is building, along withthe hopes and concerns for those countries that seem on target and those that lagbehind.
The Asia and Pacific region plays a pivotalrole in the MDG commitment. The regionis home to the majority of the world’s poor.In the People’s Republic of China (PRC) alone,the number of people without access to cleanwater supply is nearly as large as all of theunderserved in Africa. The progress this re-gion makes will define the entire globalcommunity’s success in achieving the am-bitious targets the MDGs have set for 2015.
In the five years since the MDGs wereidentified in the 2000 UN Millennium Dec-laration, Asia and the Pacific have shownremarkable progress. The region has beenreducing poverty by attacking it on manyfronts—through sound economic policies,development strategies, and targeting spe-cific characteristics of poverty, such as hun-ger and disease. Water supply andsanitation improvements are proving to bekeys that unlock many aspects of poverty.
MDG Target 10 calls for the world tohalve, by 2015, the proportion of peoplewithout sustainable access to safe drink-ing water and improved sanitation. TheMDGs and associated targets are an oppor-tunity for prioritizing water on the basisof its ability to impact overall poverty andcontribute to significant socioeconomic andenvironmental gains.
Target 10 also presents a particularlyformidable challenge for Asia. Around twothirds of the world’s populationunderserved by water live in this region.One third of Asians do not have access tosafe, sustainable water supplies. Evenworse, one half do not have access to im-proved sanitation. Yet, it is in many partsof Asia that the greatest gains are beingposted. This progress reflects the relativelystrong institutional base in the region, vi-brant economic growth, a dynamic privatesector and civil society and, in many cases,the high priority being given to povertyreduction issues in national developmentplans. Many parts of Asia are increasingtheir coverage rates for clean, reliable wa-ter supplies. Strides toward improved sani-tation are slower, greatly because of thesteep climb from extremely low coveragerates to begin with.
This report assesses the region’s pros-pects of reaching Target 10 by 2015. It doesnot just consider the target’s literal call tohalve the number of underserved by 2015.True progress must be comprehensive andconsiderate of all who lack these vital ser-vices. For this reason, the report looks atthe rate of a country’s progress in improv-ing both urban and rural coverage.
1CHAPTER
MDG Target 10 callsfor the world tohalve, by 2015, theproportion ofpeople withoutsustainable accessto safe drinkingwater and sanita-tion.
2 Asia Water Watch 2015
The report utilizes coverage data fromthe WHO/UNICEF Joint MonitoringProgramme for Water Supply and Sanita-tion in assessing the progress and definingthe 2015 projections. It also utilized WHOdata2 on cost estimations for meeting Tar-get 10 specifically in Asia and the Pacific.This report estimates that meeting Target10 will cost as low as $8 billion annually.The higher the investment, though, thehigher the technology and assured qualityand quantity. Target 10 calls for the mostbasic technology. Equally important to theprogress and prospects of the region is therationale this report presents for investingin the water sector. It is not investing forwater’s sake, but for poverty’s sake.
Benefits of Water for PovertyReductionInvesting in the water sector is investing inall of the MDGs, not just Target 10. Andthe impact of water sector investments di-rectly targeted at poor consumers is any-thing but subtle. Safe water suppliesimmediately improve people’s health andsave them time, which they can use tostudy, or improve their livelihoods, so theycan earn more, eat more nutritiously, andenjoy more healthy lives. Improved sani-tation protects the poor from socially andphysically degrading surroundings, healthrisks and exposure to dangerous environ-mental conditions. Investments in betterwater resource management further ad-dress a host of concerns related to socio-economic and environmental dimensions,such as conflicts over water rights, con-tamination of water sources by animal/industrial waste and agricultural chemicals,and sustainability issues related to waterquantity in rural and urban areas.
The multiplier effect makes it easier tounderstand how $1 invested in the watersector turns into $6. All too often, though,the expectation and analysis of benefitsfrom water supply and sanitation projectsare limited to the most common intendedresult—better health. There are many otherbenefits from water sector investments,
such as increased agricultural outputs andincome when the rural poor gain access toirrigation. Water sector investments alsoimprove levels of gender equality and edu-cational attainment because the poor havethe time and good health to attend schooland participate in economic activities, andby doing so, prove their worth by becom-ing cash-earning members of their house-holds and communities.
By meeting Target 10, countries im-prove their likelihood of meeting the otherMDG targets and goals. ADB’s review ofsix water supply and sanitation schemes3
identified a range of social and livelihoodbenefits in addition to the health benefitsthat were the original rationale for theprojects (Box 1). The nongovernment or-ganization (NGO) WaterAid assessed theimpacts of water supply projects in a num-ber of countries and found a wide range ofimpacts on many aspects of life. Similarimpacts have been found by other organi-zations. The benefits and related researchprove the economic viability of water andsanitation investments to significantly re-duce poverty and increase productivity. Forthis reason alone, it is important for stake-holders to understand the water and pov-erty connection. This report makes a strongcase for valuing and prioritizing water sec-tor investments and reforms by advancingthe analysis beyond the domain of Target10 to consider water’s role in creating theconditions for meeting the other MDGs.
Water Sector Reforms andPoverty ReductionFor water supply and sanitation to dra-matically reduce poverty, a greater com-mitment of resources and political will areneeded, and urgently. They are the precon-ditions to building institutional capacities,improved governance and investmentflows, which are all a part of the largerreform work that must happen for watersupply and sanitation to play its role inreducing poverty.
Reform as a foundation for social andeconomic change cannot be underesti-
Investing in thewater sector is
investing in all ofthe MDGs.... Safe
water suppliesimmediately im-
prove people’shealth and save
them time, whichthey can use to
improve theirlivelihoods.
Are Countries in Asia on Track to Meet Target 10 of the MDGs? 3
mated. Recent studies4 conducted jointlyby the United Nations Economic and So-cial Commission for Asia and the Pacific(UNESCAP) and the Food and AgricultureOrganization (FAO) point out the need toformulate, implement and manage watersupply and sanitation programs in strate-gic approaches of socioeconomic develop-ment. This requires complex andmulti-dimensional reforms. There is grow-ing realization that the barriers to achiev-ing this are frequently political andinstitutional, rather than economic orphysical.
A number of agencies are collaborat-ing to help key stakeholders, particularlygovernments in their reform efforts, tounderstand the water-poverty relationship.ADB and the Poverty Environment Part-nership (PEP)5 (of which ADB and UN agen-cies are members) have collaborated in the
Water and Poverty Initiative and come upwith a framework for understanding thisrelationship. The report of the UN Mil-lennium Project Task Force on water andsanitation and the WHO/ UNICEF JMPMeeting the MDG Water and SanitationTarget: A Mid-Term Assessment ofProgress report6 also provide key insightsinto how water and sanitation relate topoverty. The analyses in these differentsources are consolidated here.
Four key dimensions of poverty areused in the PEP conceptual framework:
Enhanced livelihoods security. Theability of poor people to use their as-sets and capabilities to make a livingin conditions of greater security andsustainability. This analysis shouldaddress all aspects of their livelihoods,including the use of domestic watersupplies for productive activities.
A number ofagencies arecollaborating tohelp keystakeholders,particularlygovernments intheir reform efforts,to understand thewater-povertyrelationship.
Studies by the Asian Development Bank (ADB)and WaterAid on the impact of their projects onthe communities in different parts of the Asiaregion found that multiple benefits were thenorm, including many that had not been antici-pated or invested in. These benefits, which af-fected many aspects of life, included:
Time saved, along with reduced fatigue fromnot having to collect water from, on aver-age, 6 kilometers away: this was often thebenefit most valued by the community. Thesavings were usually directly translated intoproductive activities, especially by women.Health benefits, including lower medicalexpenditure and the reduction of the long-term debilitating effects of diseases such asendemic dysentery and worm infestations.Improved income opportunities from home-based livelihood activities that used the newwater supplies, such as vegetable and live-stock production, brick and pot making, and
operating food stalls.Multiplier effects throughout the localeconomy from increased incomes and newenterprises based on improved water supplies.Local organizations set up to build and runwater supplies were often the basis for widersocial mobilization, and led to the empower-ment of women and greater social cohesion.Savings and credit groups led to the devel-opment of wider access to credit among thecommunities and improved financial man-agement skills. In urban areas, poor house-holds also saved on the cost of water, asbefore they had to pay informal providershigh prices.The new skills, organizations and social co-hesion, along with increased economic mo-mentum, had impacts on the wider politicaland social system, including at times in-fluencing government policies and bring-ing about more balanced representation.
BOX 1: The Impact of Improved Water Supplies
Sources: ADB. 2003. The Impact of Water on the Poor. ADB Operations Department, Manila; and WaterAid. 2001.Looking back: The long-term impacts of water and sanitation projects. WaterAid, London.

4 Asia Water Watch 2015
Reduced health risks. The mitiga-tion of factors that put the poor andmost vulnerable (especially women,children and theimmunocompromised) at risk fromdifferent diseases, disabilities, poornutrition, and mortality. Many healthrisks are linked to water supply andsanitation, including killers such asdiarrhea, malaria and dysentery.Reduced vulnerability. The reduc-tion of threats from environmental,economic and political hazards (e.g.,resettlement, conflicts over waterrights, water quantity and quality,etc), including floods, droughts,storms, pollution, and other forms ofwater-related hazards that threatenthe livelihoods of the poor. Water qual-ity is a direct concern for providingsafe water supplies; improved sanita-tion is essential for maintaining en-vironmental integrity; and providingaccess to water and sanitation is a keypriority in response to serious disas-ters.Pro-poor economic growth. En-hanced economic growth is essentialfor poverty reduction, but the qual-ity of growth, particularly the extentof new opportunities created for thepoor, greatly matter. Investments inthe water sector (for both supply andsanitation) must utilize strategies thatdirectly, and even disproportionately,benefit the poor. To effectively targetthe poor, though, their needs and abili-ties to contribute must be understood,which requires their direct involve-ment as stakeholders in consultationand implementation processes. Beyondbeing just recipients of investments,the poor must be seriously and genu-inely valued for their multiple abili-ties as shareholders of knowledge,participants in implementation, andcaretakers of investment outputs—thevery systems they will use and de-pend on into the far future. Theirneeds vary within communities andlocations, requiring a more complete
understanding of the full range ofcosts and benefits associated with dif-ferent options for improving watersupplies and sanitation.
Water Management andPoverty ReductionIt is important for Asia and the Pacific tounderstand the links between water resourcemanagement, water supply and sanitation,and these wider development processes ifthe region is to meet its MDG aspirationsand obligations. Many parts of Asia andseveral Pacific Islands face critical andworsening problems in the availability, re-liability and quality of water and in envi-ronmental degradation and health risksfrom poor sanitation option that is avail-able to them. These problems are likely toworsen in the coming decade, despite (and,in some cases, partly because of) their oth-erwise positive development trajectory.
The Millennium Declaration and thepolicies and strategies of many organiza-tions like ADB, UNDP, UNESCAP, andWHO address the challenge of water re-source management and water supply.The Millennium Declaration calls for“sustainable water management strate-gies at the regional, national, and locallevels that promote both equitable accessand adequate supplies.” ADB’s waterpolicy7 sees water as a socially vital eco-nomic good that needs careful manage-ment to sustain equitable economicgrowth and reduce poverty. Similarly, theHuman Poverty Index8 developed by UNDPidentifies access to safe water as a keyindicator of poverty.
Underlying the issues and relationshipof water resources management and wa-ter supply is the view that water man-agement must have two attributes. First,it must be integrative: looking at all as-pects of water resources and their uses atdifferent institutional levels. Secondly, itmust be targeted: focused on specific ac-tions that provide for the needs of the poorin an equitable and effective manner. Inthis context, it may be noted that several
Are Countries in Asia on Track to Meet Target 10 of the MDGs? 5
countries and organizations in the regionhave been developing strategic approachesto integrated water resources manage-ment as recommended by the UN Gen-eral Assembly at its Nineteenth SpecialSession. In this connection, UNESCAP hasdeveloped a set of guidelines on strategicplanning and management of water re-sources9 in 2003 and applied it in pilotstudies on integrated water resourcesmanagement in 17 countries in the re-gion. ADB has also helped advance inte-grated water resource management(IWRM) in the region in two ways:through its Water for All Policy that giveshigh priority to fostering IWRM andthrough its initiation of the Network ofAsian River Basin Organizations.
The MDG Water Supply andSanitation TargetTarget 10: To halve, by 2015, the pro-portion of people without sustainable ac-cess to safe drinking water andsanitation, is actually defined by two in-dicators—one for safe drinking water andthe other for improved sanitation. Ulti-mately, a country must meet both indi-cators to qualify for achieving the entireTarget 10. This report looks at the region’sprogress and prospects toward each indi-cator and applies the indicator for mea-suring rural and urban coverage.Analyzing a country’s progress of Target10 can render a number of scenarios. Acountry may be on course to meeting oneof the indicators in rural areas but noturban areas. A country may be on coursetoward meeting one indicator and not theother. This report does not credit acountry with being on track towardachieving Target 10 or its indicatorsunless adequate progress is beingmade in both urban and rural areas.
The drinking water indicator was in-cluded as a high priority issue in the Mil-lennium Declaration, while the sanitationindicator was added after much debate inthe World Summit on Sustainable Devel-opment (WSSD) in Johannesburg in 2002.
The WSSD Plan of Implementation recog-nized that attaining improved sanitationto such a level as what Target 10 demandsentailed more than just constructing newfacilities for a given number of people. Itwould involve a number of social and fi-nancing activities for those facilities tobe sustainable and deliver the desired im-pact. The Plan of Implementation10 citedthe following examples of activities thatinvestments must support:
development and implementation ofefficient household sanitation systems;improvement of sanitation in public in-stitutions, especially schools;promotion of safe hygiene practices;promotion of education and outreachfocused on children as agents of be-havioral change;promotion of affordable and sociallyand culturally acceptable technologiesand practices; anddevelopment of innovative financingand partnership mechanisms.Target 10 presents formidable chal-
lenges to Asia and the Pacific. This reportprovides a detailed analysis of progresssince 1990, the reasons for good or poorprogress in the subregions, and the im-plications of the progress. The challengesare not confined to one aspect of life, can-not be addressed by one sectoral agency,and are found in all levels of society. TheUN Task Force Report captures the mul-tiple and multi-level character of thesechallenges well, emphasizing in particu-lar the institutional and political issuesthat are a focus of this report:
“In order to put forward effectiverecommendations for action tomeet the MDGs, it is first neces-sary to analyze what is holding usback. Understanding why two inevery ten people in the developingworld lack access to water supply,and five in ten lack access to sani-tation services, is fundamental toidentifying effective strategies formeeting Target 10. Clearly, the ex-planations vary across communi-
6 Asia Water Watch 2015
ties, countries, and regions, but acommon set of political, financial,institutional, and technical chal-lenges confronts most developingcountries in their quest to expandwater supply and sanitation ser-vices.”11
Effective and affordable strategies toaddress these different areas where actionis needed present major challenges in thepoorest countries of Asia, where institutionsare at their weakest and progress towardTarget 10 most distressing. Of the two,challenges around meeting the sanitationtarget are the greatest—coverage levels areonly half those of drinking water and therate of progress in working toward theMDG target is noticeably slower. Indeed,the WHO/ UNICEF report12 suggests thatfor most Asian countries, their prospectsare good for reaching the water supply in-dicator, but bleak for the sanitation indi-cator unless major changes are introducedwith urgency.
What is clear is that actions to achieveboth the water supply and the sanitationindicators of Target 10 must be imple-mented without delay. This presents a mi-lieu of challenges for countries andgovernments to manage. Ideally, watersupply and sanitation projects should beimplemented in as far advance of the2015 deadline as possible for their im-pacts to register on the other MDG tar-gets. Yet, the impact of these projects thatdeliver water supply and sanitation ser-vices are not likely to be sustainable ifthey are not accompanied by reforms thatbuild the capacity of institutions and en-hance investment flows. These reformtasks take time to work through and can-not be implemented too quickly, althoughthey are urgently needed. Governments,therefore, should immediately prioritizewater sector reforms to maximize theirongoing implementation of water supplyand sanitation projects.
What is clear is thatactions to achieve
both the water sup-ply and the sanita-
tion indicators ofTarget 10 must be
implemented with-out delay. This pre-
sents a milieu ofchallenges for
countries and gov-ernments to
manage.
Are Countries in Asia on Track to Meet Target 10 of the MDGs? 7
Source: Poverty Environment Partnership: Linking Poverty Reduction and Water Management
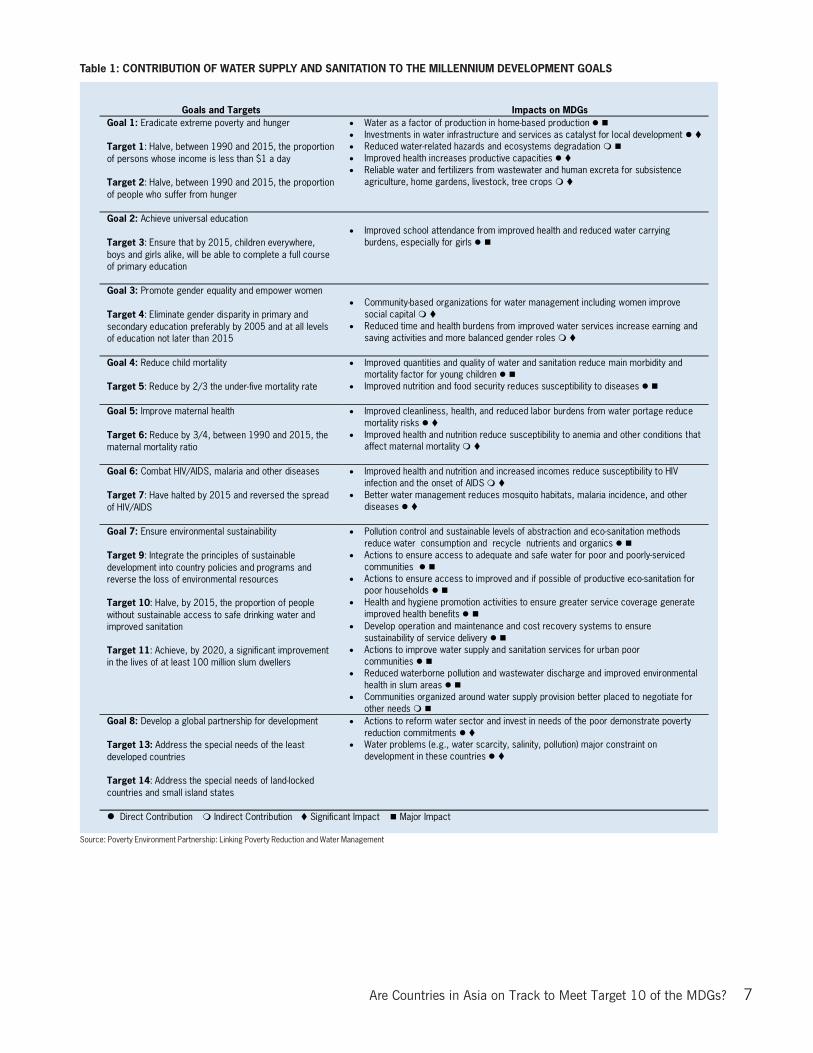
Goals and Targets Impacts on MDGs Goal 1: Eradicate extreme poverty and hunger Target 1: Halve, between 1990 and 2015, the proportion of persons whose income is less than $1 a day Target 2: Halve, between 1990 and 2015, the proportion of people who suffer from hunger
• Water as a factor of production in home-based production • Investments in water infrastructure and services as catalyst for local development • Reduced water-related hazards and ecosystems degradation • Improved health increases productive capacities • Reliable water and fertilizers from wastewater and human excreta for subsistence
agriculture, home gardens, livestock, tree crops
Goal 2: Achieve universal education Target 3: Ensure that by 2015, children everywhere, boys and girls alike, will be able to complete a full course of primary education
• Improved school attendance from improved health and reduced water carrying
burdens, especially for girls
Goal 3: Promote gender equality and empower women Target 4: Eliminate gender disparity in primary and secondary education preferably by 2005 and at all levels of education not later than 2015
• Community-based organizations for water management including women improve
social capital • Reduced time and health burdens from improved water services increase earning and
saving activities and more balanced gender roles
Goal 4: Reduce child mortality Target 5: Reduce by 2/3 the under-five mortality rate
• Improved quantities and quality of water and sanitation reduce main morbidity and mortality factor for young children
• Improved nutrition and food security reduces susceptibility to diseases
Goal 5: Improve maternal health Target 6: Reduce by 3/4, between 1990 and 2015, the maternal mortality ratio
• Improved cleanliness, health, and reduced labor burdens from water portage reduce mortality risks
• Improved health and nutrition reduce susceptibility to anemia and other conditions that affect maternal mortality
Goal 6: Combat HIV/AIDS, malaria and other diseases Target 7: Have halted by 2015 and reversed the spread of HIV/AIDS
• Improved health and nutrition and increased incomes reduce susceptibility to HIV infection and the onset of AIDS
• Better water management reduces mosquito habitats, malaria incidence, and other diseases
Goal 7: Ensure environmental sustainability Target 9: Integrate the principles of sustainable development into country policies and programs and reverse the loss of environmental resources Target 10: Halve, by 2015, the proportion of people without sustainable access to safe drinking water and improved sanitation Target 11: Achieve, by 2020, a significant improvement in the lives of at least 100 million slum dwellers
• Pollution control and sustainable levels of abstraction and eco-sanitation methods reduce water consumption and recycle nutrients and organics
• Actions to ensure access to adequate and safe water for poor and poorly-serviced communities
• Actions to ensure access to improved and if possible of productive eco-sanitation for poor households
• Health and hygiene promotion activities to ensure greater service coverage generate improved health benefits
• Develop operation and maintenance and cost recovery systems to ensure sustainability of service delivery
• Actions to improve water supply and sanitation services for urban poor communities
• Reduced waterborne pollution and wastewater discharge and improved environmental health in slum areas
• Communities organized around water supply provision better placed to negotiate for other needs
Goal 8: Develop a global partnership for development Target 13: Address the special needs of the least developed countries Target 14: Address the special needs of land-locked countries and small island states
• Actions to reform water sector and invest in needs of the poor demonstrate poverty reduction commitments
• Water problems (e.g., water scarcity, salinity, pollution) major constraint on development in these countries
Direct Contribution Indirect Contribution Significant Impact Major Impact
Table 1: CONTRIBUTION OF WATER SUPPLY AND SANITATION TO THE MILLENNIUM DEVELOPMENT GOALS
8 Asia Water Watch 2015
Are Countries in Asia on Track to Meet Target 10 of the MDGs? 9
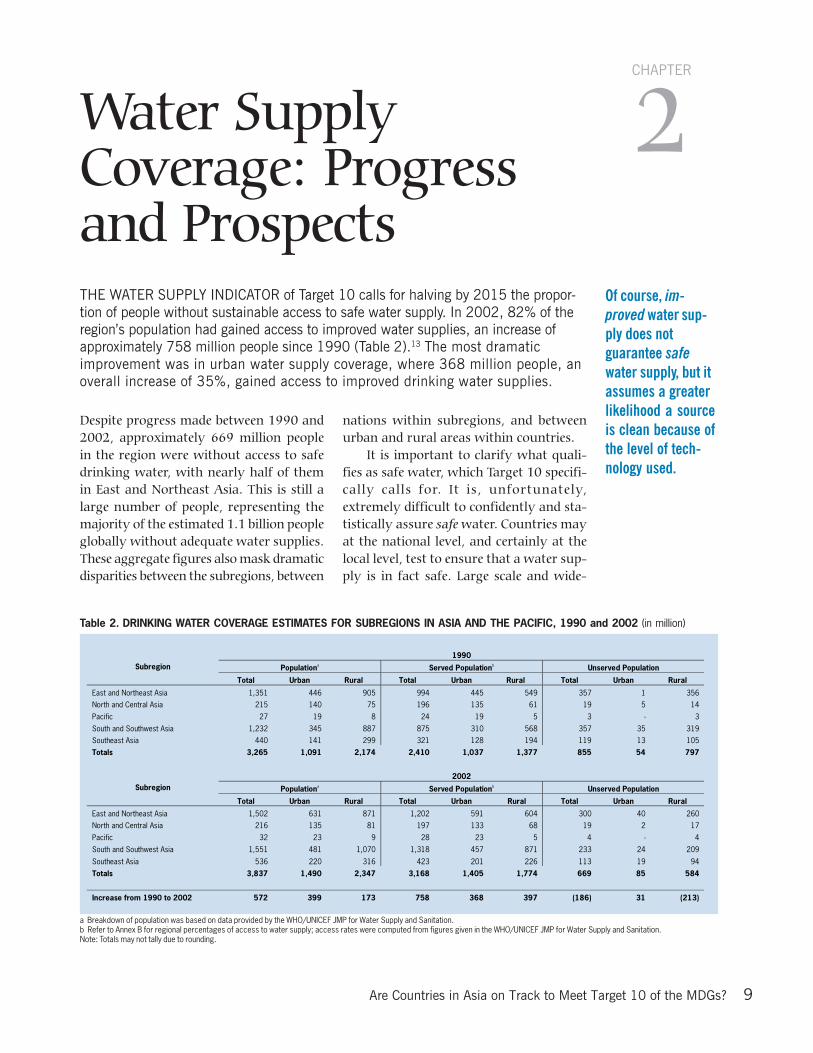
Water SupplyCoverage: Progressand ProspectsTHE WATER SUPPLY INDICATOR of Target 10 calls for halving by 2015 the propor-tion of people without sustainable access to safe water supply. In 2002, 82% of theregion’s population had gained access to improved water supplies, an increase ofapproximately 758 million people since 1990 (Table 2).13 The most dramaticimprovement was in urban water supply coverage, where 368 million people, anoverall increase of 35%, gained access to improved drinking water supplies.
Despite progress made between 1990 and2002, approximately 669 million peoplein the region were without access to safedrinking water, with nearly half of themin East and Northeast Asia. This is still alarge number of people, representing themajority of the estimated 1.1 billion peopleglobally without adequate water supplies.These aggregate figures also mask dramaticdisparities between the subregions, between
nations within subregions, and betweenurban and rural areas within countries.
It is important to clarify what quali-fies as safe water, which Target 10 specifi-cally calls for. It is, unfortunately,extremely difficult to confidently and sta-tistically assure safe water. Countries mayat the national level, and certainly at thelocal level, test to ensure that a water sup-ply is in fact safe. Large scale and wide-
2CHAPTER
Of course, im-proved water sup-ply does notguarantee safewater supply, but itassumes a greaterlikelihood a sourceis clean because ofthe level of tech-nology used.
Table 2. DRINKING WATER COVERAGE ESTIMATES FOR SUBREGIONS IN ASIA AND THE PACIFIC, 1990 and 2002 (in million)
a Breakdown of population was based on data provided by the WHO/UNICEF JMP for Water Supply and Sanitation.b Refer to Annex B for regional percentages of access to water supply; access rates were computed from figures given in the WHO/UNICEF JMP for Water Supply and Sanitation.Note: Totals may not tally due to rounding.
1990
Populationa Served Populationb Unserved Population Subregion
Total Urban Rural Total Urban Rural Total Urban Rural
East and Northeast Asia 1,351 446 905 994 445 549 357 1 356
North and Central Asia 215 140 75 196 135 61 19 5 14
Pacific 27 19 8 24 19 5 3 - 3
South and Southwest Asia 1,232 345 887 875 310 568 357 35 319
Southeast Asia 440 141 299 321 128 194 119 13 105
Totals 3,265 1,091 2,174 2,410 1,037 1,377 855 54 797
2002
Populationa Served Populationb Unserved Population Subregion
Total Urban Rural Total Urban Rural Total Urban Rural
East and Northeast Asia 1,502 631 871 1,202 591 604 300 40 260
North and Central Asia 216 135 81 197 133 68 19 2 17
Pacific 32 23 9 28 23 5 4 - 4
South and Southwest Asia 1,551 481 1,070 1,318 457 871 233 24 209
Southeast Asia 536 220 316 423 201 226 113 19 94
Totals 3,837 1,490 2,347 3,168 1,405 1,774 669 85 584
Increase from 1990 to 2002 572 399 173 758 368 397 (186) 31 (213)
10 Asia Water Watch 2015
spread analysis, such as what this reportattempts to gather, relies on specific typesof technology as the best means of mea-suring whether newly covered areas aremost likely delivering clean water. Box 2on page 13 discusses these types of tech-nology that greatly increase the likelihoodthat the water delivered from them is safe.For these reasons, this report prefers thelanguage of “improved” water supply anduses the WHO’s definition14 of improvedwater supply as being characterized by(i) a significant increased probability thatthe water is safe, (ii) that it is more ac-cessible, and (iii) some measures againstcontamination are being taken to protectthe water source (e.g., stand post, borehole,protected spring or well, or collected rain-water).
Of course, improved water supply doesnot guarantee safe water supply, but itassumes a greater likelihood that a sourceis clean because of the level of technology
used. Improved water supply is simply thebest measurable standard. Therefore, thecoverage and cost projections in this reportare based on standards of improved accessfor both water supply and sanitation. Thereare many places where water quality is aconcern, with the water available not meet-ing international guidelines for bacterial orchemical pollutants.15 Similarly, in urbanareas in particular, supplies are oftenrarely 24 hours a day. For example, inDelhi, only 1% of those people with wa-ter supply connections enjoy 24-hour ser-vice availability. In Karachi, Dhaka, andKathmandu, the figure is less than 1%.16
It is typically low-income areas that havethe most unreliable access, with the onlyalternative being to buy water from in-formal vendors at prices much higherthan those charged by utilities.
The WHO defines improved sanita-tion17 as generally involving better, privateaccess and safer disposal of excreta through
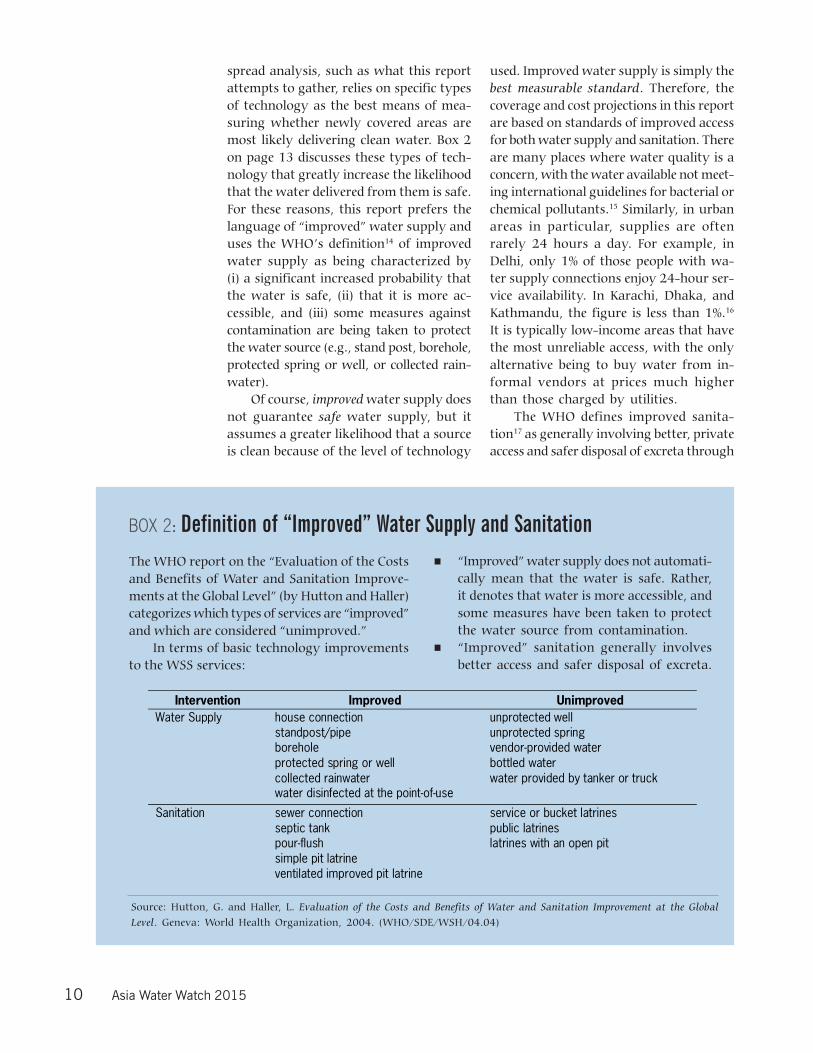
BOX 2: Definition of “Improved” Water Supply and Sanitation
Source: Hutton, G. and Haller, L. Evaluation of the Costs and Benefits of Water and Sanitation Improvement at the GlobalLevel. Geneva: World Health Organization, 2004. (WHO/SDE/WSH/04.04)
The WHO report on the “Evaluation of the Costsand Benefits of Water and Sanitation Improve-ments at the Global Level” (by Hutton and Haller)categorizes which types of services are “improved”and which are considered “unimproved.”
In terms of basic technology improvementsto the WSS services:
“Improved” water supply does not automati-cally mean that the water is safe. Rather,it denotes that water is more accessible, andsome measures have been taken to protectthe water source from contamination.“Improved” sanitation generally involvesbetter access and safer disposal of excreta.
Intervention Improved Unimproved Water Supply house connection
standpost/pipe borehole protected spring or well collected rainwater water disinfected at the point-of-use
unprotected well unprotected spring vendor-provided water bottled water water provided by tanker or truck
Sanitation sewer connection septic tank pour-flush simple pit latrine ventilated improved pit latrine
service or bucket latrines public latrines latrines with an open pit
Are Countries in Asia on Track to Meet Target 10 of the MDGs? 11
a septic tank, pour-flush, simple pit la-trine, small bore sewer, or ventilated im-proved pit latrine. The facilities used forboth improved water supply and sanita-tion are basic and low technology, butmust be properly constructed and prop-erly maintained.
The analysis done for this report isbased on the coverage rates for 1990 and2002, the most recent data for most coun-tries, and projected coverage rates for2015.18 Analysis is provided for total,urban, and rural rates of change. Not allcountries had baseline data in 1990, somost of the analysis is limited to the 34countries with baseline data. Countriesthat either lack baseline data or have al-ready achieved 100% coverage in 2002 aremost often excluded from the analysis.
The mixed picture of progress andprospects begins to appear as one takes acloser look at the trends in coverage ratesbetween Asia and the Pacific’s five subre-gions, the countries within those subre-gions and between urban and rural areas(See Tables 3A and B). Of the 34 countriesthat provided baseline data in 1990 forthe water supply indicator and did nothave 100% coverage in 2002, only 10countries will likely achieve or exceed thewater supply indicator of Target 10 forboth rural and urban coverage:Azerbaijan, India, Micronesia, Myanmar,Nepal, PRC, Russian Federation, Sri Lanka,Turkey, and Tuvalu. Of those 10 coun-tries, four countries are projected toachieve 100% improved water supply cov-erage in both urban and rural areas be-fore 2015: India, Micronesia, Myanmar,and Tuvalu. Based on data trends from1990 to 2002, more countries are likelyto meet the water supply indicator in ur-ban areas than in their rural areas.
Several countries are actually showinga decline in coverage rates (Annex C). Ofthe 34 baseline countries, five countries areregressing in urban coverage (Bangladesh,Cook Islands, Indonesia, Nepal, and PRC)and two countries are regressing in ruralcoverage (Northern Mariana Islands andPalau). Four countries are regressing in both
urban and rural coverage—Maldives,Marshall Islands, the Philippines, and Sa-moa. A regression in coverage should notbe mistaken as a case of a country notmaking any progress in expanding cover-age. Most likely, coverage rates are in-creasing but not at a rate that keeps pacewith population growth. In areas wherepopulations are rapidly swelling, particu-larly urban areas, coverage rates mustexpand at an even faster rate to maintaincourse for Target 10. Worth noting,though, is that coverage rates in the smallPacific island countries may be slightlyskewed because certain areas cannot beas definitively categorized as either ruralor urban.
Population wise, the PRC and Indiadominate their subregions and the wholeof the Asia and the Pacific region. Collec-tively, in 2002, they accounted for 60%of the region’s population and 38% of theglobal population. Both countries havemade remarkable progress in water sup-ply coverage during the 12-year period.Yet, the question remains whether this rateof progress is enough for these two coun-tries to meet Target 10 of the MDGs.
East and Northeast AsiaWith baseline data: CHINA, PEOPLE’S REP. OF • MONGOLIAWithout baseline data: CHINA, HONG KONG (SAR) • CHINA,MACAO (SAR) • JAPAN • KOREA, DEM. PEOPLE’S REP. OF •KOREA, REP. OF
This region is home to some of the moreprosperous Asian countries and territories,yet is also home to around 15% of theworld’s population who lack water. In2002, 300 million people in the subregionstill did not have access to improved watersupplies. When excluding those countrieswith 100% coverage or no baseline data,the regional analysis zeroes in on only twocountries, the PRC and Mongolia.
The PRC dominates this subregion ingeographic and population size, account-ing for 86% of the subregional popula-tion. Yet, a subregional analysis of thegrowth in water supply coverage is solelya reflection of the PRC; Mongolia has notimproved upon its 1990 numbers. At best,any expansion in coverage is only going

12 Asia Water Watch 2015
Table 3-A: COVERAGE AND PROJECTIONS for 2015 – URBAN WATER SUPPLY (in thousand)
Legend: = on track = off tracka Does not have complete baseline dataNotes: 1. Blanks indicate unavailability of data. 2. “On track” means that the country has either a) reached the target, b) exceeded the target, or c) is within 3–5% of the target.
Urban Population Served Urban Population Projections for 2015
Subregion/Country 1990 2002
1990 Served Pop.
1990 Coverage
(%)
2002 Served Pop.
2002 Coverage
(%)
Urban Pop.
Served Urban Pop.
Coverage (%)
Target 10 Achieve-
ment Prospects
East and Northeast Asia
China, People's Republic of 311,932 492,049 311,932 100 452,686 92 694,139 680,256 98
Korea, Dem. People’s Rep. of 11,574 13,750 11,574 100 13,750 100 15,571 15,571 100
Korea, Republic ofa 31,723 37,944 30,771 97 36,806 97 41,251 41,251 100
Mongolia 1,263 1,459 1,099 87 1,269 87 1,845 1,476 80
Japana 77,916 100,295 77,916 100 100,295 100 86,114 86,114 100
North and Central Asia
Armeniaa 2,375 1,997 2,351 99 1,977 99 1,926 1,907 99
Azerbaijan 3,884 4,149 3,107 80 3,941 95 4,874 4,874 100
Kazakhstan 9,581 8,663 9,198 96 8,316 96 8,905 8,548 96
Kyrgyz Republica 1,670 1,723 1,637 98 1,688 98 2,089 2,047 98
Russian Federation 108,253 105,180 105,006 97 104,128 99 99,116 99,116 100
Uzbekistan 8,206 9,511 7,960 97 9,226 97 11,359 10,791 95
Pacific
Australiaa 14,357 17,929 14,357 100 17,929 100 20,593 20,593 100
Cook Islands 10 12 10 99 12 98 14 14 100
French Polynesia 109 125 109 100 125 100 155 146 94
Guam 122 152 122 100 152 100 185 185 100
Kiribati 25 40 19 76 31 77 62 52 83
Marshall Islands 29 34 27 95 27 80 70 28 40
Micronesia, Fed. States of 25 31 23 93 30 95 35 35 100
New Zealanda 2,890 3,376 2,890 100 3,376.0 100 3,654 3,654.0 100
Niue 1 1 1 100 1 100 1 1 100
Northern Mariana Is. 39 71 38 98 70 98 94 94 100
Palau 11 14 7 71 11 79 14 14 100
Papua New Guinea 535 726 471 88 639 88 1,044 890 85
Samoa 34 39 33 99 35 91 49 38 76
Tonga 31 34 31 100 34 100 38 38 100
Tuvalu 4 5 3 92 5 94 7 7 100
Vanuatu 28 46 26 93 39 85 86 59 69
South and Southwest Asia
Bangladesh 21,880 34,514 18,161 83 28,302 82 53,694 45,766 85
India 220,069 293,874 193,660 88 282,119 96 401,341 401,341 100
Iran, Islamic Republic of 31,754 44,926 31,119 98 44,028 98 60,155 60,155 100
Maldives 56 87 56 100 86 99 141 138 98
Nepal 1,676 3,691 1,576 94 3,433 93 6,560 6,232 95
Pakistan 34,379 50,970 32,660 95 48,421 95 80,778 74,183 92
Sri Lanka 3,534 3,971 3,216 91 3,931 99 4,635 4,635 100
Turkey 33,980 46,410 31,261 92 44,553 96 59,030 59,030 100
Southeast Asia
Indonesia 56,456 95,538 51,940 92 85,028 89 144,731 124,469 86
Malaysia 8,923 15,098 8,566 96 14,494 96 21,016 21,016 100
Myanmar 10,127 14,167 7,392 73 13,459 95 20,981 20,981 100
Philippines 29,941 47,148 27,845 93 42,433 90 66,640 57,976 87
Singaporea 3,016 4,170 3,016 100 4,170 100 4,815 4,815 100
Thailand 15,773 19,902 13,722 87 18,907 95 25,543 25,543 100
Viet Nam 13,215 20,070 12,290 93 18,665 93 30,683 29,351 96
Are Countries in Asia on Track to Meet Target 10 of the MDGs? 13
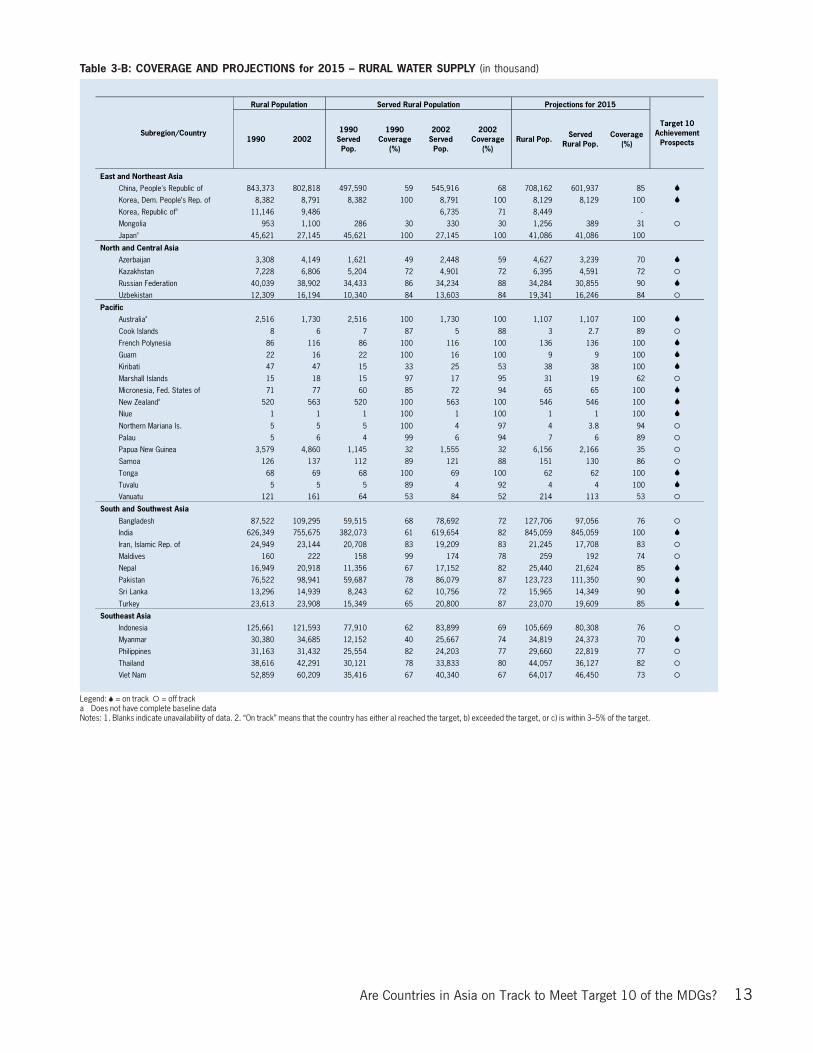
Table 3-B: COVERAGE AND PROJECTIONS for 2015 – RURAL WATER SUPPLY (in thousand)
Legend: = on track = off tracka Does not have complete baseline dataNotes: 1. Blanks indicate unavailability of data. 2. “On track” means that the country has either a) reached the target, b) exceeded the target, or c) is within 3–5% of the target.
Rural Population Served Rural Population Projections for 2015
Subregion/Country 1990 2002
1990 Served Pop.
1990 Coverage
(%)
2002 Served Pop.
2002 Coverage
(%) Rural Pop.
Served Rural Pop.
Coverage (%)
Target 10 Achievement
Prospects
East and Northeast Asia
China, People's Republic of 843,373 802,818 497,590 59 545,916 68 708,162 601,937 85
Korea, Dem. People’s Rep. of 8,382 8,791 8,382 100 8,791 100 8,129 8,129 100
Korea, Republic ofa 11,146 9,486 6,735 71 8,449 -
Mongolia 953 1,100 286 30 330 30 1,256 389 31
Japana 45,621 27,145 45,621 100 27,145 100 41,086 41,086 100
North and Central Asia
Azerbaijan 3,308 4,149 1,621 49 2,448 59 4,627 3,239 70
Kazakhstan 7,228 6,806 5,204 72 4,901 72 6,395 4,591 72
Russian Federation 40,039 38,902 34,433 86 34,234 88 34,284 30,855 90
Uzbekistan 12,309 16,194 10,340 84 13,603 84 19,341 16,246 84
Pacific
Australiaa 2,516 1,730 2,516 100 1,730 100 1,107 1,107 100
Cook Islands 8 6 7 87 5 88 3 2.7 89
French Polynesia 86 116 86 100 116 100 136 136 100
Guam 22 16 22 100 16 100 9 9 100
Kiribati 47 47 15 33 25 53 38 38 100
Marshall Islands 15 18 15 97 17 95 31 19 62
Micronesia, Fed. States of 71 77 60 85 72 94 65 65 100
New Zealanda 520 563 520 100 563 100 546 546 100
Niue 1 1 1 100 1 100 1 1 100
Northern Mariana Is. 5 5 5 100 4 97 4 3.8 94
Palau 5 6 4 99 6 94 7 6 89
Papua New Guinea 3,579 4,860 1,145 32 1,555 32 6,156 2,166 35
Samoa 126 137 112 89 121 88 151 130 86
Tonga 68 69 68 100 69 100 62 62 100
Tuvalu 5 5 5 89 4 92 4 4 100
Vanuatu 121 161 64 53 84 52 214 113 53
South and Southwest Asia
Bangladesh 87,522 109,295 59,515 68 78,692 72 127,706 97,056 76 India 626,349 755,675 382,073 61 619,654 82 845,059 845,059 100
Iran, Islamic Rep. of 24,949 23,144 20,708 83 19,209 83 21,245 17,708 83
Maldives 160 222 158 99 174 78 259 192 74
Nepal 16,949 20,918 11,356 67 17,152 82 25,440 21,624 85
Pakistan 76,522 98,941 59,687 78 86,079 87 123,723 111,350 90
Sri Lanka 13,296 14,939 8,243 62 10,756 72 15,965 14,349 90
Turkey 23,613 23,908 15,349 65 20,800 87 23,070 19,609 85
Southeast Asia
Indonesia 125,661 121,593 77,910 62 83,899 69 105,669 80,308 76
Myanmar 30,380 34,685 12,152 40 25,667 74 34,819 24,373 70
Philippines 31,163 31,432 25,554 82 24,203 77 29,660 22,819 77
Thailand 38,616 42,291 30,121 78 33,833 80 44,057 36,127 82
Viet Nam 52,859 60,209 35,416 67 40,340 67 64,017 46,450 73

14 Asia Water Watch 2015
as far as the population growth rate.Mongolia’s lack of progress, however, islikely related to its sparse population thatis largely spread out in rural areas.
The PRC extended access to total im-proved water supplies on an annual com-pounded rate of less than a percent—just0.8%, which still amounts to a 10% totalincrease in total supply coverage between1990 and 2002. The PRC’s urban cover-age has declined at an annual compoundedrate of 0.7% for a total regression of 8%over the 12-year period. Despite the de-clining coverage rate, the actual numberof served populace has actually increasedat an annual rate of over 3% between1990 and 2002. This translates to anadditional 141 million people gaining ac-cess to improved water supply in the 12-year period. Assuming this rate ismaintained in the next 12 years, urbancoverage in the PRC will reach approxi-mately 98% in 2015, a remarkable featgiven the rapid urbanization predicted forthe country over the next decade or so.
Progress in the PRC’s rural areas isthe result of over 1% compounded annualincrease, which has meant a 9% total in-crease in the past 12 years. Projectionsput the PRC’s rural coverage at 85% by2015 if past coverage rates continue.
Beyond the incredible percentagegrowth in the rural areas, the greatest gainsin real numbers were made in the cities.Specifically, over 141 million people in ur-ban areas received improved water supplyservices between 1990 and 2002, comparedto the 48 million people in the rural areas.
North and Central AsiaWith baseline data: AZERBAIJAN • KAZAKHSTAN • RUSSIANFEDERATION • UZBEKISTANWithout baseline data: ARMENIA • GEORGIA • KYRGYZREPUBLIC • KYRGYZSTAN • TAJIKISTAN • TURKMENISTAN
Historically, improved water supply cov-erage in North and Central Asia has alwaysbeen high and remains the highest in Asiaand the Pacific. The region also has someof the lowest disparities between urbanand rural coverage, and their respectiveaverage annual rates of increase.
No other country in the subregioncomes close to Azerbaijan’s performanceover the 12-year period in both urban andrural coverage expansion. Since 1990,Azerbaijan has increased its total cover-age by 16% at a compounded annual in-crease of over 1%. Urban water supplycoverage has increased annually at un-der 2% for a total increase of 17%, mak-ing it an early achiever of Target 10’swater supply indicator. Its rate of in-creased coverage in rural areas registeredan impressive 19% change since 1990.
Kazakhstan and Uzbekistan show nochange. The declining coverage in the othercountries within this subregion is char-acteristic of the overall economic declineand disruption of many service institu-tions in the former Soviet Union coun-tries during the early years ofindependence.
The PacificWith baseline data: COOK ISLANDS • FRENCH POLYNESIA •GUAM • KIRIBATI • MARSHALL ISLANDS • MICRONESIA,FED. STATES OF • NIUE • NORTHERN MARIANA ISLANDS •PALAU • PAPUA NEW GUINEA • SAMOA • SOLOMONISLANDS • TOKELAU • TONGA • TUVALU • VANUATUWithout baseline data: AMERICAN SAMOA • AUSTRALIA •FIJI ISLANDS • NAURU • NEW CALEDONIA • NEW ZEALAND
The Pacific subregion represents by far thesmallest population of the subregions, ac-counting for only 1% of the total regionalpopulation. It also hosts great disparitiesin coverage between countries and betweenurban and rural areas.
There has been a lack of any change incoverages of Papua New Guinea, the mostpopulous country in the subregion afterAustralia and New Zealand. Papua NewGuinea’s total coverage in 2002 was only39%, with 88% coverage in urban areas,but only 32% coverage in rural areas, oneof the lowest figures globally. Projectionsfor 2015 see little change in coverage ofPapua New Guinea.
The Marshall Islands has been expe-riencing an unusually substantial rever-sal. From already high coverage rates in1990, coverage rates are dramatically re-gressing. From 94% total water supplycoverage in 1990, Marshall Islands lost
Overall, the region’spicture of stymied
progress is areflection of
compoundingfactors—pollution,overexploitation of
ground water,dilapidated
systems, andinsufficient levels
of investment.
Are Countries in Asia on Track to Meet Target 10 of the MDGs? 15
coverage at an average 1% annually, to-taling a 12% decline. The country’s ur-ban coverage rates fell at an even fasterrate at 1.4% to imply a 17% decrease inurban rates, resting at just 80% cover-age. Fortunately, its rural rates showonly—yet still unacceptably—an annualregression of 0.2% for a total 2% drop from1990 figures, resting at 95% coverage.Several countries that once trailed thisformer leader in the subregion for watersupply coverage now surpass it. Samoaalso experienced regression in all catego-ries, but did not suffer as much of a set-back as the Marshall Islands.
Despite many disappointing cases ofperformance in this subregion, there areinstances of progress. Kiribati’s average an-nual growth rates put it on track to meetthe Target 10 indicator in rural areas, butis slow in cities. Kiribati is making inroadsin rural coverage, reaching 53% in 2002,which is still low but a noteworthy increasefrom 33% coverage in 1990. Kiribati’sprogress in urban coverage, however, is notexperiencing the same growth, up only 1%in 2002 to 77%. Micronesia is excelling inboth urban and rural coverage at rates thatmake it an early achiever of the Target 10water supply indicator. Tuvalu is on trackto meet the water supply indicator in bothurban and rural areas, but could easilyachieve 100% total coverage given its highrate of coverage in 1990 and moderate rateof increased coverage over the 12 years.
Overall, the region’s picture of sty-mied progress is a reflection of compound-ing factors—pollution, overexploitation ofground water, dilapidated systems, and in-sufficient levels of investment. The fail-ure to even come remotely close toachieving Target 10 weakens the Pacific’sdefense against overall poverty.
South and Southwest AsiaWith baseline data: BANGLADESH • INDIA • IRAN, ISLAMICREPUBLIC OF • MALDIVES • NEPAL • PAKISTAN • SRILANKAWithout baseline data: AFGHANISTAN • BHUTAN • TURKEY
South and Southwest Asia is the mostpopulous subregion. Similar to China’s,India’s geographic and population size
dominates in this subregion, accountingfor almost 70% of the region’s total popu-lation. India has made advances in bothits urban and rural water supply cover-age since 1990, when it posted one of thelowest coverage figures. By 2002, how-ever, India had made some of the greatestimprovements in the Asia and Pacific re-gion.
India’s total compounded annual rateof change is impressive at 2% annuallyand 24% total over the 12-year period.India’s urban coverage increased from88% to 96%, while over the same period,its rural coverage leapt from 61% to 82%—the result of under 3% average annual rateof increase, the most rapid rural cover-age growth rate in Asia and the Pacific.India’s progress in this 12-year periodbrought access to 88.5 million people inurban areas and a staggering 237 mil-lion people in rural areas. It is on track toprovide 100% coverage countrywide by2015.
Bangladesh is the only country in thesubregion projected to miss the Target 10water supply indicator for both urbanand rural water supply. Bangladesh wouldhave also shown dramatic improvements,from around 70% to over 90%, if ground-water sources in some areas had not beenidentified for arsenic contamination, lead-ing to the reclassification of many handpumps as being unsafe. Maldives has alsoexperienced an unfortunate severe down-turn in its nearly 100% coverage levelsin 1990. Its once respectable rural cover-age level of 99% in 1990 is just 78% in2002. Rural coverage in Maldives de-creased on an average 2% annually to atotal decrease of 24% in rural supply. Toa far lesser degree, its urban water sup-ply decreased by only 1%, yet the totaleffect of the country’s regression meantthat total water supply coverage decreasedby 16% over the 12 years.
All countries, except for Bangladesh,Iran, and Maldives, had increased ruralwater supply coverage in excess of 10%and ranging through to 34% (Annex C).Recent data for Nepal, however, shows re-
16 Asia Water Watch 2015
versing trends that threaten its chance ofmeeting the Target 10 water supply indi-cator. Between 2000 and 2002, Nepal’srate of increase for total coverage fellfrom 4% to less than 1%. Further threat-ening Nepal’s progress is a civil conflictthat began in the mid 1990s, which ledto restricted access to many parts of thecountry, particularly in the western re-gion.
Southeast AsiaWith baseline data: INDONESIA • MALAYSIA • MYANMAR •PHILIPPINES • THAILAND • VIET NAMWithout baseline data: BRUNEI DARUSSALAM • CAMBODIA• LAO PEOPLE’S DEM. REPUBLIC • SINGAPORE • TIMOR-LESTE
Countries in Southeast Asia are by farmore likely to achieve the water supplyindicator in their urban areas than rural
areas. Projections based on past coveragegrowth rates indicate that Malaysia andThailand are likely to either approach orreach 100% coverage in urban areas by2015, but their rural areas will elude Tar-get 10 achievement. No country in thissubregion is likely to meet the indicatorin rural areas. A further area of concernis that while Indonesia and the Philippinesboth had relatively high urban coveragein 1990, both regressed (although theiractual numbers of people with access mayhave increased). Both countries are alsoregressing in rural coverage levels. VietNam shows no change.
Countries in South-east Asia are by far
more likely toachieve the water
supply indicator intheir urban areasthan rural areas.

Are Countries in Asia on Track to Meet Target 10 of the MDGs? 17
Sanitation Coverage:Progress andProspectsAT FIRST GLANCE, the picture of progress for improved sanitation coverage in Asiaand the Pacific might appear to have changed little—stuck at irredeemably low levelsthat require difficult amounts of financing to launch momentous change by 2015. Formany, this impression would seem logical and the result of a historical oversight toimprove sanitation coverage despite linking them to water supplies programs andprojects. The focus of policy and investments has tended to be on improving watersupplies while sanitation coverage has fallen far behind. As of 2002, one third of Asiaand the Pacific lacked access to clean water, but one half of the region had no accessto the most basic sanitation facilities. A huge proportion of the population is living inconditions that pose high risks to their personal and environmental health.
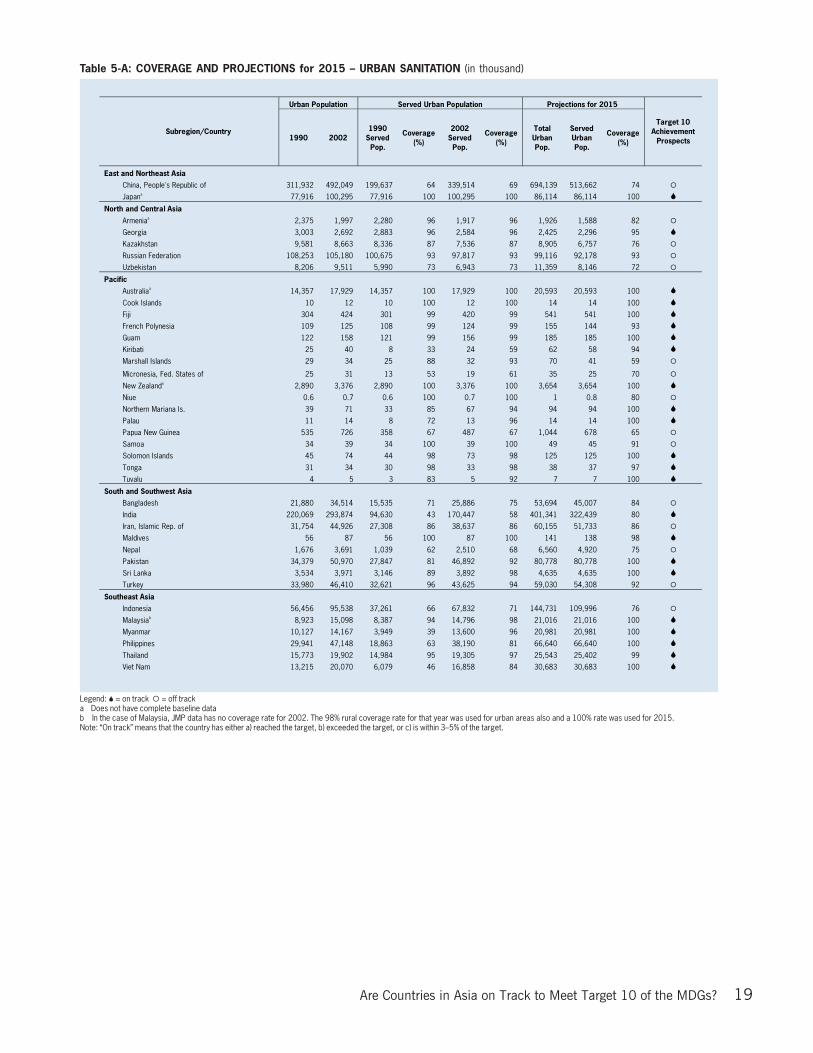
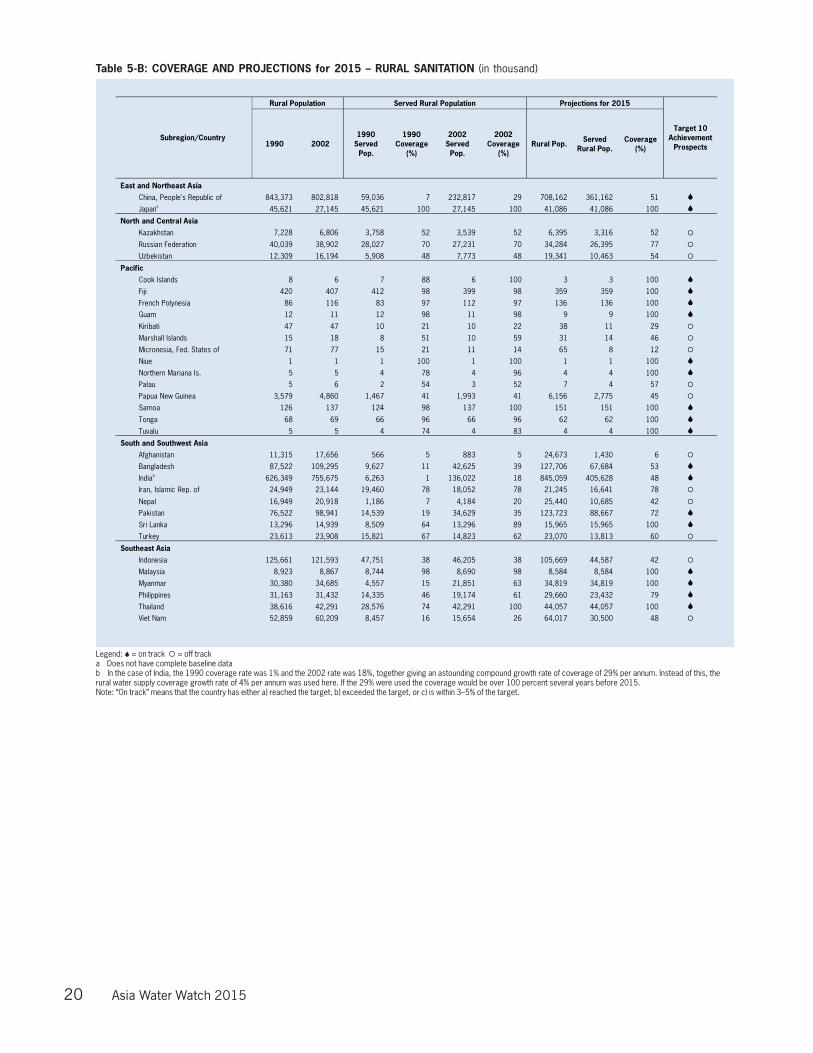
Taking a closer look, though, substantialchanges have been made in securing sani-tation coverage between 1990 and 2002.Coverage levels remain low in 2002, yetin many cases, they are respectable im-provements upon the 1990 figures (Table4). In fact, many countries are expandingaccess to improved sanitation at rates thatfar exceed their efforts in water supplycoverage. Compounded annual increasesin access have been as impressive as 27%.Assuming that trends continue and thatno major barriers to progress take placein the coming years up to 2015, major-ity of the countries with complete baselinedata will likely meet their respective lev-els to achieve the Target 10 indicator forimproved sanitation in at least their ur-ban or rural areas (Tables 5A and B).
Twelve countries show promise ofachieving their sanitation indicator level inboth urban and rural areas—Fiji, FrenchPolynesia, Guam, India, Malaysia,Myanmar, Northern Mariana Islands, Pa-kistan, Sri Lanka, Thailand, Tonga, andTuvalu. On the other hand, 10 countriesare at serious risk of missing their sanita-
tion indicator levels in both urban and ru-ral areas—Indonesia, Iran, Kazakhstan,Marshall Islands, Micronesia, Nepal, PapuaNew Guinea, Russian Federation, Turkey,and Uzbekistan.
Meeting the sanitation indicator is onlya milestone en route to truly respectableand widespread humanitarian change.MDG target levels by no means representacceptable levels of coverage. They do, how-ever, represent achievable levels if countriescommit the resources and power to accom-plish them. As of 2002, less than half ofthe region’s population had access to im-proved sanitation facilities—nearly 2 bil-lion of the 2.6 billion people unservedworldwide. This total sanitation figuremasks dramatic regional disparities be-tween rural and urban populations. In2002, urban sanitation coverage hadreached 76%, while in rural areas the fig-ure was a pitiful 32%. The rates of increaserange from 0.1% to 27% (Annex C). It isworth noting that the disproportionate at-tention urban areas receive for improvedsanitation is not without some justifica-tion. Urban dwellers face greater health
3CHAPTER
Many countries areexpanding accessto improved sanita-tion at rates thatfar exceed theirefforts in watersupply coverage.Compoundedannual increasesin access havebeen as impressiveas 27%.

18 Asia Water Watch 2015
risks from the combination of widespreadpollution from human waste and the ex-treme densities of many low-income ar-eas in major cities.
The analysis in this chapter follows thesame methods used for measuring progressand prospects for the water supply indica-tor (Endnote 18). In this case, improvedsanitation involves better access and saferdisposal of excreta through facilities suchas septic tanks, simple pit latrines or venti-lated improved pit latrines (Box 2).
East and Northeast AsiaWith baseline data: CHINA, PEOPLE’S REP. OFWithout baseline data: CHINA, HONG KONG (SAR) • CHINA,MACAO (SAR) • JAPAN • KOREA, DEM. PEOPLE’S REP. OF •KOREA, REP. OF • MONGOLIA
The PRC is the only country in this sub-region (without 100% coverage) to have1990 baseline data. Mongolia only hadbaseline data for its water supply cover-age, but only sanitation coverage in 2002.
By 2002, the PRC increased its totalsanitation access by 67%—the result of a6% compounded annual rate of expansion.In its urban areas, total coverage grew by8% (from 23% to 44%) over the 12-yearperiod. the PRC increased rural sanitationcoverage by a remarkable 150% from thelowly level of just 7% in 1990 to 29% in
2002. The percentages of increase repre-sent incredible amounts of people. Over-all, about 300 million people in the PRCgained access to improved sanitation fa-cilities during this period. Although amarkedly lower percentage than ruralgains, the 8% growth in urban sanitationcoverage is remarkable given the rapidrate of urbanization in the PRC. The 13%annual increase in rural sanitation trans-lates into nearly 174 million rural Chi-nese gaining access, yet sanitationcoverage in rural areas still only reached29% in 2002. Despite the progress, over725 million people in the PRC alone re-main without access to improved sanita-tion facilities—over a quarter of all thepeople without adequate sanitation glo-bally.
North and Central AsiaWith baseline data: KAZAKHSTAN • RUSSIAN FEDERATION •UZBEKISTANWithout baseline data: ARMENIA • AZERBAIJAN • GEORGIA• KYRGYZ REPUBLIC • TAJIKISTAN • TURKMENISTAN
As with drinking water supplies, Northand Central Asia has a long history of pro-viding access to improved sanitation fa-cilities. Unfortunately, this legacy appearsto have not continued during the periodbetween 1990 and 2002, with the subre-
Table 4. SANITATION COVERAGE ESTIMATES FOR SUBREGIONS IN ASIA AND THE PACIFIC, 1990 and 2002 (in million)
a Breakdown of population was based on data provided by the WHO/UNICEF JMP for Water Supply and Sanitationb Refer to Annex B for regional percentages of access to water supply; access rates were computed from figures given in the WHO/UNICEF JMP for Water Supply and SanitationNote: Totals may not tally due to rounding.
1990
Populationa Served Populationb Unserved Population Subregion
Total Urban Rural Total Urban Rural Total Urban Rural
East and Northeast Asia 1,351 446 905 432 318 106 919 128 799
North and Central Asia 215 140 75 176 128 48 39 12 27
Pacific 27 19 8 24 19 4 3 - 4
South and Southwest Asia 1,232 345 887 283 201 76 949 144 811
Southeast Asia 440 141 299 211 97 117 229 44 182
Totals 3,265 1,091 2,174 1,126 763 351 2,139 328 1,823
2002
Populationa Served Populationb Unserved Population Subregion
Total Urban Rural Total Urban Rural Total Urban Rural
East and Northeast Asia 1,502 631 871 751 468 273 751 163 588
North and Central Asia 216 135 81 172 123 50 44 12 32
Pacific 32 23 9 28 23 4 4 - 4
South and Southwest Asia 1,551 481 1,070 605 334 266 946 147 799
Southeast Asia 536 220 316 327 181 163 209 39 170
Totals 3,837 1,490 2,347 1,883 1,129 756 1,954 361 1,593
Increase from 1990 to 2002 572 399 173 757 366 405 (185) 33 (230)
Are Countries in Asia on Track to Meet Target 10 of the MDGs? 19
Table 5-A: COVERAGE AND PROJECTIONS for 2015 – URBAN SANITATION (in thousand)
Legend: = on track = off tracka Does not have complete baseline datab In the case of Malaysia, JMP data has no coverage rate for 2002. The 98% rural coverage rate for that year was used for urban areas also and a 100% rate was used for 2015.Note: “On track” means that the country has either a) reached the target, b) exceeded the target, or c) is within 3–5% of the target.
Urban Population Served Urban Population Projections for 2015
Subregion/Country 1990 2002
1990 Served Pop.
Coverage (%)
2002 Served Pop.
Coverage (%)
Total Urban Pop.
Served Urban Pop.
Coverage (%)
Target 10 Achievement
Prospects
East and Northeast Asia
China, People's Republic of 311,932 492,049 199,637 64 339,514 69 694,139 513,662 74
Japana 77,916 100,295 77,916 100 100,295 100 86,114 86,114 100
North and Central Asia
Armeniaa 2,375 1,997 2,280 96 1,917 96 1,926 1,588 82
Georgia 3,003 2,692 2,883 96 2,584 96 2,425 2,296 95
Kazakhstan 9,581 8,663 8,336 87 7,536 87 8,905 6,757 76
Russian Federation 108,253 105,180 100,675 93 97,817 93 99,116 92,178 93
Uzbekistan 8,206 9,511 5,990 73 6,943 73 11,359 8,146 72
Pacific
Australiaa 14,357 17,929 14,357 100 17,929 100 20,593 20,593 100
Cook Islands 10 12 10 100 12 100 14 14 100
Fiji 304 424 301 99 420 99 541 541 100
French Polynesia 109 125 108 99 124 99 155 144 93
Guam 122 158 121 99 156 99 185 185 100
Kiribati 25 40 8 33 24 59 62 58 94
Marshall Islands 29 34 25 88 32 93 70 41 59
Micronesia, Fed. States of 25 31 13 53 19 61 35 25 70
New Zealanda 2,890 3,376 2,890 100 3,376 100 3,654 3,654 100
Niue 0.6 0.7 0.6 100 0.7 100 1 0.8 80
Northern Mariana Is. 39 71 33 85 67 94 94 94 100
Palau 11 14 8 72 13 96 14 14 100
Papua New Guinea 535 726 358 67 487 67 1,044 678 65
Samoa 34 39 34 100 39 100 49 45 91
Solomon Islands 45 74 44 98 73 98 125 125 100
Tonga 31 34 30 98 33 98 38 37 97
Tuvalu 4 5 3 83 5 92 7 7 100
South and Southwest Asia
Bangladesh 21,880 34,514 15,535 71 25,886 75 53,694 45,007 84
India 220,069 293,874 94,630 43 170,447 58 401,341 322,439 80
Iran, Islamic Rep. of 31,754 44,926 27,308 86 38,637 86 60,155 51,733 86
Maldives 56 87 56 100 87 100 141 138 98
Nepal 1,676 3,691 1,039 62 2,510 68 6,560 4,920 75
Pakistan 34,379 50,970 27,847 81 46,892 92 80,778 80,778 100
Sri Lanka 3,534 3,971 3,146 89 3,892 98 4,635 4,635 100
Turkey 33,980 46,410 32,621 96 43,625 94 59,030 54,308 92
Southeast Asia
Indonesia 56,456 95,538 37,261 66 67,832 71 144,731 109,996 76
Malaysiab 8,923 15,098 8,387 94 14,796 98 21,016 21,016 100
Myanmar 10,127 14,167 3,949 39 13,600 96 20,981 20,981 100
Philippines 29,941 47,148 18,863 63 38,190 81 66,640 66,640 100
Thailand 15,773 19,902 14,984 95 19,305 97 25,543 25,402 99
Viet Nam 13,215 20,070 6,079 46 16,858 84 30,683 30,683 100
20 Asia Water Watch 2015
Table 5-B: COVERAGE AND PROJECTIONS for 2015 – RURAL SANITATION (in thousand)
Legend: = on track = off tracka Does not have complete baseline datab In the case of India, the 1990 coverage rate was 1% and the 2002 rate was 18%, together giving an astounding compound growth rate of coverage of 29% per annum. Instead of this, therural water supply coverage growth rate of 4% per annum was used here. If the 29% were used the coverage would be over 100 percent several years before 2015.Note: “On track” means that the country has either a) reached the target, b) exceeded the target, or c) is within 3–5% of the target.
Rural Population Served Rural Population Projections for 2015
Subregion/Country 1990 2002
1990 Served Pop.
1990 Coverage
(%)
2002 Served Pop.
2002 Coverage
(%) Rural Pop. Served
Rural Pop. Coverage
(%)
Target 10 Achievement
Prospects
East and Northeast Asia
China, People's Republic of 843,373 802,818 59,036 7 232,817 29 708,162 361,162 51
Japana 45,621 27,145 45,621 100 27,145 100 41,086 41,086 100
North and Central Asia Kazakhstan 7,228 6,806 3,758 52 3,539 52 6,395 3,316 52
Russian Federation 40,039 38,902 28,027 70 27,231 70 34,284 26,395 77
Uzbekistan 12,309 16,194 5,908 48 7,773 48 19,341 10,463 54
Pacific Cook Islands 8 6 7 88 6 100 3 3 100
Fiji 420 407 412 98 399 98 359 359 100
French Polynesia 86 116 83 97 112 97 136 136 100
Guam 12 11 12 98 11 98 9 9 100
Kiribati 47 47 10 21 10 22 38 11 29
Marshall Islands 15 18 8 51 10 59 31 14 46
Micronesia, Fed. States of 71 77 15 21 11 14 65 8 12
Niue 1 1 1 100 1 100 1 1 100
Northern Mariana Is. 5 5 4 78 4 96 4 4 100
Palau 5 6 2 54 3 52 7 4 57
Papua New Guinea 3,579 4,860 1,467 41 1,993 41 6,156 2,775 45
Samoa 126 137 124 98 137 100 151 151 100
Tonga 68 69 66 96 66 96 62 62 100
Tuvalu 5 5 4 74 4 83 4 4 100
South and Southwest Asia Afghanistan 11,315 17,656 566 5 883 5 24,673 1,430 6
Bangladesh 87,522 109,295 9,627 11 42,625 39 127,706 67,684 53
Indiab 626,349 755,675 6,263 1 136,022 18 845,059 405,628 48
Iran, Islamic Rep. of 24,949 23,144 19,460 78 18,052 78 21,245 16,641 78
Nepal 16,949 20,918 1,186 7 4,184 20 25,440 10,685 42
Pakistan 76,522 98,941 14,539 19 34,629 35 123,723 88,667 72
Sri Lanka 13,296 14,939 8,509 64 13,296 89 15,965 15,965 100
Turkey 23,613 23,908 15,821 67 14,823 62 23,070 13,813 60
Southeast Asia Indonesia 125,661 121,593 47,751 38 46,205 38 105,669 44,587 42
Malaysia 8,923 8,867 8,744 98 8,690 98 8,584 8,584 100
Myanmar 30,380 34,685 4,557 15 21,851 63 34,819 34,819 100
Philippines 31,163 31,432 14,335 46 19,174 61 29,660 23,432 79
Thailand 38,616 42,291 28,576 74 42,291 100 44,057 44,057 100
Viet Nam 52,859 60,209 8,457 16 15,654 26 64,017 30,500 48
Are Countries in Asia on Track to Meet Target 10 of the MDGs? 21
gion declining in access to total, urban,and rural improved sanitation facilities.
All countries in the subregion providedinformation on total, urban, and ruralsanitation coverage for 2002. In contrast,there are only three countries with com-plete baseline data—Kazakhstan, Russia,and Uzbekistan. Armenia and Georgia hadbaseline data but only for urban sanita-tion. Not one country with baseline data isprojected to meet the sanitation target. Infact, since 1990, no rate of change regis-ters for any of the baseline countries.
The PacificWith baseline data: COOK ISLANDS • FIJI ISLANDS •FRENCH POLYNESIA • GUAM • KIRIBATI • MARSHALLISLANDS • MICRONESIA, FED. STATES OF • NORTHERNMARIANA ISLANDS • PALAU • PAPUA NEW GUINEA • SAMOA• TONGA • TUVALUWithout baseline data: AMERICAN SAMOA • AUSTRALIA •NAURU • NEW CALEDONIA • NEW ZEALAND • NIUE •SOLOMON ISLANDS • TOKELAU • VANUATU
Despite some regression, the majority ofcountries in the subregion are increasingcoverage levels in both urban and ruralareas, with many on track to meet the Tar-get 10 sanitation indicator in at least theirurban or rural areas.
One of the more worrisome states inthe entire Asia and Pacific region, if notglobally, is Papua New Guinea, where to-tal sanitation coverage remains at only45%, with only 41% of the rural popula-tion having access to improved sanitationfacilities. By 2015, roughly half of PapuaNew Guinea will still be without improvedsanitation, according to data trends.
Northern Mariana and Tuvalu willmeet the indicator for total coverage if theycontinue at their past rates of expansion;Kiribati, Solomon Islands, and Palau havebeen expanding at a feasible rate in urbanareas to meet the indicator there, but agreater rate of increase is needed to meetthe sanitation indicator in rural areas.
Kiribati is a prime example of the Pa-cific experience with increasing access toimproved sanitation—low coverage levelsto build on, uneven progress between ur-ban and rural areas, incredible gains andrates of expansion, yet not at a rate to com-pletely achieve the Target 10 sanitation
indicator by 2015. Kiribati had some ofthe lowest baseline figures in 1990 in itssubregion, as well as the whole of Asia.Total sanitation coverage was just 25%in 1990, with urban coverage at 33% andrural coverage at 21%. Kiribati made fargreater progress in its urban areas thanrural areas. Urban coverage rose almost60% at a compounded rate of 5% annu-ally, while rural coverage rose just 5% at0.4% annually.
South and Southwest AsiaWith baseline data: BANGLADESH • INDIA • IRAN, ISLAMICREPUBLIC OF • NEPAL • PAKISTAN • SRI LANKA • TURKEYWithout baseline data: AFGHANISTAN • BHUTAN •MALDIVES
South and Southwest Asia has the lowestcoverage levels for improved sanitationthan any other subregion within Asia andPacific region. Its sanitation coverage levelis the same as Sub-Saharan Africa.
Of the countries with baseline data inSouth and Southwest Asia, five will achievethe Target 10 sanitation indicator in at leasturban or rural areas if they continue attheir current rate of growth. India, Paki-stan, and Sri Lanka will likely achieve theimproved sanitation indicator in both ur-ban and rural areas if they continue ex-panding access at their 1990-2002 rates.
In Pakistan, total coverage has risenfrom its 1990 level of 38% to 54% in 2002.In urban areas, it is projected to achieve100% access to improved sanitation. SriLanka is the only country in the subre-gion on course toward 100% total im-proved sanitation coverage by 2015.Bangladesh will likely achieve the sani-tation indicator only in rural areas, yetthis is a remarkable feat given that its6% average annual increase—if contin-ued—will more than double its coveragelevel by 2015. This means access will beprovided to more than 110 million peopleby the end of the MDG period.
Despite their high coverage rates, Iranand Turkey are not projected to halve theremaining proportion of their people with-out improved sanitation. Nepal, withlower coverage rates than others in its
Despite someregression, themajority ofcountries in the(Pacific) subregionare increasingcoverage levels inboth urban andrural areas....
22 Asia Water Watch 2015
subregion, will also not improve at ratesneeded to meet Target 10. Iran figuresshow no progress in coverage levels andTurkey has been regressing in all cover-age levels, which will leave approximately15 million people without improved sani-tation in 2015. Although projections arereserved for countries with baseline data,Afghanistan’s total sanitation coverage ofonly 8% deserves attention. In rural ar-eas of Afghanistan, only 5% of the popu-lation had access to improved sanitationin 2002. Few places in the world face suchscarce and alarming coverage levels.
Southeast AsiaWith baseline data: INDONESIA • PHILIPPINES • THAILAND• VIET NAMWithout baseline data: BRUNEI DARUSSALAM • CAMBODIA• LAO PEOPLE’S DEM. REPUBLIC • MALAYSIA • MYANMAR• SINGAPORE • TIMOR-LESTE
Southeast Asia has significantly expandedaccess to improved sanitation facilities inboth rural and urban areas since 1990.Most baseline countries in this subregionwill meet the sanitation indicator of Target10 in at least urban or rural areas, if theycontinue to meet their past annual rates ofincrease. Thailand is progressing at a ratethat could provide 100% improved sanita-tion coverage by 2015, as long as it main-tains the expansion rates achieved duringthe 12-year reporting period. If the Phil-ippines and Viet Nam continue at their1990-2002 expansion rates, they couldprovide 100% access to improved sanita-tion in urban areas.
Making the highest coverage increasesof any Southeast Asian country, Viet Namis quickly overcoming a total coveragelevel of just 22% in 1990 by posting over5% average annual rates of increase. Inrural areas, however, only 48% is expected
to have access to improved sanitation fa-cilities, despite the country’s likely in-creasing rural coverage at a rate of morethan 4% annually. Unlike its poor statusfor water supply access, the Philippineshas made considerable improvements andis on track to meet the Target 10 sanita-tion indicator in both urban and ruralareas, so long as it maintains its past av-erage rates of annual increase.
Indonesia is the only country withbaseline data not likely to achieve the Tar-get 10 sanitation indicator in either ruralor urban areas. There was some increasein urban coverage levels, but there was nochange for rural coverage levels. If Indo-nesia continues at the rate it has been go-ing since 1990, it will have one of thelowest rural coverage rates in all of Asiaand the Pacific, with just 42% of its ruralpopulation having access to improved sani-tation. Urban coverage rates are headedtoward the same conclusion, with only 76%of Indonesia’s urban dwellers having ac-cess to improved sanitation in 2015, whichis also one of the lowest projected sanita-tion coverage levels in all of Asia and thePacific.
Projections are not possible for Cam-bodia, Lao PDR, or Timor-Leste becausethey lack sufficient data. These low-incomecountries did have data in 2002, which arethe lowest coverage levels in all of Asia andthe Pacific. Cambodia had a 16% total cov-erage level, with urban coverage muchhigher than rural coverage—53% and 8%respectively. Lao PDR had 24% total im-proved sanitation coverage, with 61% ofits urban populations covered and 14% ofits rural populations covered. Timor-Lestehad total, urban, and rural coverage ratesat 33%, 65% and 30% respectively.
Are Countries in Asia on Track to Meet Target 10 of the MDGs? 23
Meeting Target 10:How Much Will It Cost?JUST WHAT IS THE COST OF MEETING TARGET 10 in Asia and the Pacific? Theprice tag is surprisingly affordable. A regional, recurrent investment of just $8 billiona year would ensure that Asia and the Pacific meets Target 10 and continues toexpand coverage beyond 2015 (Table 6). The greatest proportion of the bill belongsto the South and Southwest Asia subregion, followed by East and Northeast Asia,where the greatest numbers of unserved people are found in India and the PRC.And because Asia bears the majority of the world’s poor, this region achieving Target10 represents a significant achievement toward attaining the global target. Theachievability and affordability of meeting Target 10 in Asia and the Pacific raises aninteresting possibility: Political leaders can afford to confidently set more ambitioustargets than the MDGs and advance their countries toward greater levels of social andeconomic development. It is not a matter of possibility, but a matter of willingness.
The costs of providing access to safe waterand adequate sanitation vary from high,when high standards are applied and so-phisticated technology is used, to substan-tially lower costs, when simple technologythat demands low maintenance is used. Inthis analysis, improved water supply andsanitation refers to low technology im-provements, such as those discussed in pre-vious chapters, which would satisfy Target10. A WHO study19 on the costs and ben-efits of water and sanitation improvementsat the global level presented cost estima-tions on the following four interventions:
1. Intervention 1—Reaching Tar-get 10: Halving the proportion of peoplewithout sustainable access to both safewater supply and improved sanitation(water and sanitation MDG targets);
2. Intervention 2—ImprovedWater Supply and Sanitation for All:Sustainable access to safe water and im-proved sanitation for everyone;
3. Intervention 3—ImprovedWater Supply and Sanitation for All
Plus Disinfection: Providing disinfectionat point-of-use over and above increasingaccess to improved water supply and sani-tation20; and
4. Intervention 4—Piped WSS forAll Plus Primary Treatment: Providingregulated piped water supply in house andsewage connection with partial seweragefor everyone.21
According to the WHO report, thefunding or investment requirements forthese four interventions cover:
Investment costs: Planning and su-pervision, hardware, construction andhouse alteration, protection of watersources and education that accompanies aninvestment in hardware.
Recurrent costs: Operating mate-rials to provide a service, maintenance ofhardware and replacement of parts, emp-tying of septic tanks and latrines, regula-tion and control of water supply, ongoingprotection and monitoring of watersources, water treatment and distribution,and continuous education activities.
4CHAPTER
The achievabilityand affordability ofmeeting Target 10in Asia and thePacific... is not amatter of possibil-ity, but a matter ofwillingness.

24 Asia Water Watch 2015
The investment costs were annualizedand added to the recurrent costs to obtainfinal total costs per intervention per year,based on the life of the technology and adiscount rate of 3%.
Each intervention and its related costsand impact are discussed below. Table 6presents the cost estimations for each ofthe four interventions by subregion.
Intervention 1—$8 billion annually.The intervention that would satisfy Tar-get 10 requires the least amount of an-nual recurring investment at $8 billion.These cost figures reflect the definitionsof improved and safe water supply andsanitation given in the previous chapters,with adequate but not high cost technolo-gies that involve, for example chemicalwater supply treatment or primarywastewater treatment. There are manyexamples where lower cost technologies
can be used, with this particularly truefor rural areas, where family labor is of-ten used and where local entrepreneursmake materials and construct servicesthemselves. The cost estimates used in thisanalysis and elsewhere can be found inHutton and Haller (2004).22 The WHO re-port presents the annual costs of each typeof improved technology per personreached. Table 7 presents the figures forAsia. From Table 7, one can see that arange of options are available, but thatsanitation interventions are clearly morecostly, with the cheapest option of a smallpit latrine starting at almost $4. Most ofthe options for improved water supply arewell under $4, starting as low as $0.25.The investment levels for sanitation, how-ever, are still affordable. Yet, the compara-tive figures provide a good insight as towhy the rates of change for sanitation
For Asia and thePacific as a whole,
the levels of invest-ment needed to
achieve the MDGsare affordable.
Table 6: ANNUAL COSTS FOR WATER SUPPLY AND SANITATION DEVELOPMENT IN ASIA AND PACIFIC REGION, year 2000(in $ billion)
Source: Data derived from Hutton, G. and Haller, L. Evaluation of the Costs and Benefits of Water and Sanitation Improvement at the Global Level. Geneva: World Health Organization, 2004.(WHO/SDE/WSH/04.04)
MDG Target
Access for All
Access for All plus
Disinfection at Point of Use
Regulated, In-House
Piped WSS Connection
Subregion
Intervention 1 Intervention 2 Intervention 3 Intervention 4
East and Northeast Asia 2.99 5.99 6.38 24.55
North and Central Asia 0.20 0.39 0.49 4.12
Pacific 0.02 0.04 0.05 0.24
South and Southwest Asia 3.95 7.90 8.40 40.83
Southeast Asia 0.96 1.91 2.08 15.55
Total 8.11 16.24 17.40 85.28
Table 7: ANNUAL COSTS FOR IMPROVEMENTS ON A PER-PERSON-REACHED BASIS
Source: Hutton, G. Haller, L. Evaluation of the Costs and Benefits of Water and Sanitation Improvement at the Global Level. Geneva: World Health Organization, 2004. (WHO/SDE/WSH/04.04)
Target 10 Indicator
Type of Improved Technology Implemented Cost in $ (2000) per Person Reached
Standpost 4.95 Borehole 1.26 Dug well 1.63 Rain water 2.51 Disinfected 0.26 Regulated piped water in-house (hardware and software) 9.95
Improved water supply
Regulated piped water in-house (software only) 5.97 Improved sanitation Septic tank 9.10
VIP 5.70 Small pit latrine 3.92 Household sewer connection plus partial treatment of sewage (hardware and software)
11.95
Household sewer connection plus partial treatment of sewage (software only) 5.28

Are Countries in Asia on Track to Meet Target 10 of the MDGs? 25
coverage continue to lag behind watersupply coverage rates.
Intervention 2—$16 billion annually.To provide access to improved water andsanitation services for all the unservedpeople of Asia and the Pacific would costaround twice as much: $16 billion peryear until 2015. This is again a large butnot impossible figure that is achievablegiven the nature of economic developmentand social change in Asia and the Pacific.
Intervention 3—$17 billion annually.The third scenario, which involves pro-viding household water treatment usingchlorine and safe storage in addition toimproved water and sanitation servicesfor all, would cost an additional $1 bil-lion on top of improved water and sani-tation costs, taking the regional cost to$17 billion. This again is affordable formost parts of the region.
Intervention 4—$85 billion annually. Fi-nally, providing access to regulated pipedwater supply in house with quality moni-toring and sewerage connection with par-tial treatment of sewage for all householdswould require a total investment of $85 bil-lion per year. This higher level of investmentreflects the much higher levels of service pro-vided and, in consequence, the necessity ofinvesting for much greater numbers ofpeople, as many who presently have ac-cess to less sophisticated technologieswould need to be provided with the moreexpensive connections.
The key message from this is clear—for Asia and the Pacific as a whole, thelevels of investment needed to achieve theMDGs are affordable. The key is how tostimulate these investments from as widea range of sources as possible, includingconsumers themselves and the private sec-tor, as well as from governments and theinternational community. Indeed, it islikely that the actual levels of investmentmade in water supplies and sanitation inthe region will be far greater than this asmany people will reflect their new pros-perity in decisions to invest in far higherlevels of technology and service thanthose represented by the basic cost calcu-lations made here. Of course, that more
is spent does not mean that more peopleare reached and it is the poor, those whoare not in a position to choose expensivesolutions, whose needs are the greatestcause for concern. The majority of Asianscan and will look after themselves. Gov-ernments and the international commu-nity must focus their attention on thosesections of society who cannot provide fortheir own needs under existing servicedelivery systems.
The achievability of these investmentsraises the possibility of political leadersacross the region setting targets that aremore ambitious than those found in theMDG targets: remove forever the miseryand adverse economic consequences of in-adequate water and sanitation in the re-gion that contains the majority of theworld’s poor. Indeed, some governmentshave already set targets that are more am-bitious than the MDGs: for example, VietNam’s development goals aim to exceed theMDG targets by 2010 and provide safewater and improved sanitation for thewhole country by 2020.
In the international community, thecentral importance of improving access tosafe and adequate water supplies and im-proved sanitation for poverty reduction isrecognized, and, indeed, is one of the mostfrequently cited issues in the wider debateon poverty reduction. There are concerns,though, that this recognition of water’simportance is not being matched by in-creased commitments of funds for the sec-tor. Indeed, there is evidence of reversingtrend, with declining levels of funding sup-port from the international community.23
There are still other concerns that the sec-tor is neglected in the preparation of pov-erty reduction strategy papers, which setkey priorities in national poverty reduc-tion strategies and provide a frameworkfor donor support24. The following chap-ters build a case for investing in water bylooking at the sheer economic benefitswater brings to all major characteristicsof poverty. The analysis shows stronglythat reducing poverty increases economicproductivity, and at levels that far surpassthe initial investments.
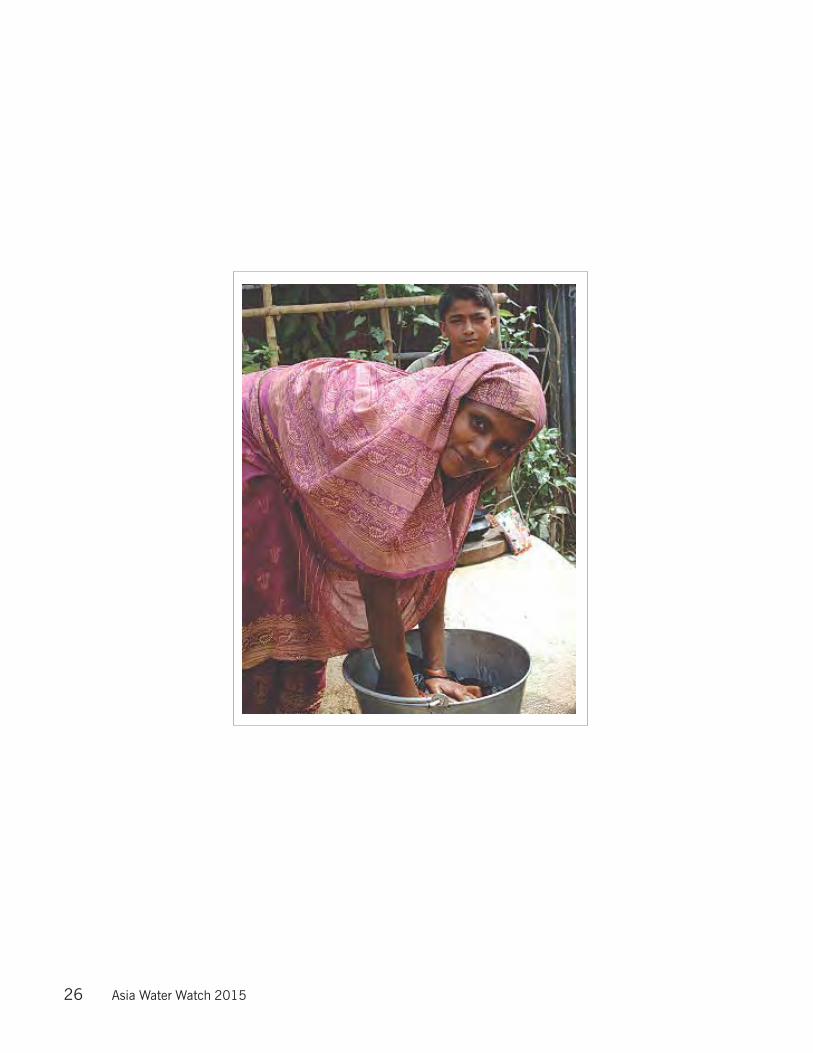
26 Asia Water Watch 2015
Are Countries in Asia on Track to Meet Target 10 of the MDGs? 27
Maximizing Target 10:Reaping the Full Socialand Economic BenefitsINVESTING IN WATER is investing in poverty reduction. In fact, $1 spent on improv-ing water supplies and sanitation buys the poor at least $6 in time and health sav-ings. The first chapter of this report discussed the purpose of prioritizing improvedwater supply and sanitation facilities—they are gateways to widespread povertyreduction. We have measured the progress of Asia and the Pacific and made projec-tions of who is on course to meet Target 10 and who is not. We know what it will costto ensure every country arrives at the target—$8 billion annually. Now why? Whyinvest so much in the water sector when there are other sectors demanding equal ormore resources? This chapter explains what investments in water will buy for thepeople of the regional economies. The hundreds of billions of dollars and millions ofproductive days that water offers are waiting to be realized. By building a rationale ofwater’s benefits on each MDG and providing a cost benefit analysis, this chapterpresents a strong case for investing in water. To not do so, the data argues, is theheight of economic irrationality. And, to not do so urgently is a waste of opportunity toreap the social and economic benefits of water. Improving water immediately bringsthe poor better health, more productive hours in a day, higher wages, more time inschool, and better educational attainment.
The first MDG target, to halve by 2015the proportion of the world’s people liv-ing on less than $1 a day, requires sus-tained economic growth in countriesacross Asia and the Pacific. The existingrecord on this is patchy, with some coun-tries facing considerable challenges inachieving such sustained progress. Oth-ers, however, most notably the PRC, In-dia, other South Asian countries, andmuch of Southeast Asia, are showing highand sustained levels of growth in recentyears, becoming the envy of many otherparts of the world.
Even in these rapidly growing econo-mies, though, growth alone is not auto-matically reducing poverty. Strategies forgrowth and its benefits must be engineeredto benefit the poor. We cannot expect acountry’s economic growth to trickle down
to the poor. Left to this strategy, the poorreceive disproportionately and insuffi-ciently less—their poverty being sustainedrather than alleviated. Growth should pro-vide opportunities, specifically for the poor,to improve their livelihoods, increase theirincomes, reduce their vulnerability to ill-ness, and rid their worries about food andthe misery of hunger. If growth is not eq-uitable, genuine sustainable developmentand poverty reduction is not possible. It islargely up to governments to ensure thepoor are not left behind as more prosper-ous classes, sectors, and geographicareas benefit from the wealth thatgrowth creates.
For growth to reach the poor, growthmust be directed to them—the sectors andplaces where the poor live and work. In-vestments in water are a vehicle for de-
5CHAPTER
To not (invest inwater) is the heightof economic irra-tionality. And, to notdo so urgently is awaste of opportu-nity to reap thesocial and eco-nomic benefits.

28 Asia Water Watch 2015
livering the benefits of growth to the poor,and when done effectively, to their verydoorstep. Investments in two key areas willgreatly advance countries toward reducingpoverty: Agricultural water supply anddomestic water supply. Investments in thesetwo areas will foremost improve theirhealth through food security and increasetheir opportunities for greater income-gen-erating livelihoods. Through these invest-ments, the poor can become moreproductive workers and become engines foroverall economic growth.
Agricultural water supply and ru-ral poverty. Technically, the scope of Tar-get 10 is limited to increasing access todrinking water. Yet, traditionally, the wa-ter supply subsector includes water for ir-rigation and agricultural uses, as well asdomestic use, as the context for monitor-ing access to drinking water. Improved ac-cess to agricultural water is also highlyeffective intervention for improving thepoor’s income, nutrition, and health. Inmost parts of Asia and the Pacific, the poorare heavily concentrated in rural areas, andnot where the capital intensive, high pro-ductivity agriculture is found. Yet, agricul-ture will continue to be a key sector wherethe rural poor work. Limited access to ru-ral water supply, particularly irrigatedfields, reduces the viability of agriculturalactivities for the rural poor. A wide varietyof water management strategies could beadopted to address these problems, such asimproving and expanding irrigation sys-tems across more farming land where pos-sible, improving rainwater harvesting andon-farm water management in rain-fedagriculture, crop diversification, and im-provements to crop strains.
By improving rural water supply, amajor determining characteristic of povertyis alleviated—hunger and food security forthe poor. The second MDG target calls forreducing by half, by 2015, the proportion ofthe world’s people who suffer from hunger.Food security, in part, depends on nationalproduction and distribution capabilities,including government famine relief sys-tems. This is critically important for af-
fordable food for both the rapidly grow-ing numbers of urban poor and ruralpopulations in times of hardship, such asdroughts and other disasters. Reliable wa-ter for subsistence agriculture, home gar-dens, livestock, fisheries, tree crops, andthe sustainable production of other foodsgathered in common property resourcesare potential options that can contributeto improving the food security of thosemost vulnerable to hunger. In rural ar-eas, food insecurity should primarily betackled at the local level, so that specificsections of the poor, such as landless fami-lies, female-headed households, rainfedfarmers, livestock herders, and other vul-nerable people, are targeted by interven-tions.
Domestic water. Both the rural andurban poor depend on small, home-basedenterprises where they, themselves, are theentrepreneurs. The poor have been indus-trious in using domestic water for a rangeof enterprises—vegetable gardens, plantand tree crops, livestock, aquaculture,handicrafts, pottery, brick making, andleather goods, and providing such servicesas hair salons, laundries, and eateries. Simi-larly, ecologically sustainable sanitationexperiences show many productive uses forwaste, whether from the recycling of nu-trients or the use of biogas as an energysource.
The scale, value, and importance ofdomestic water, sanitation, and micro-ir-rigation around homesteads to supportlivelihoods and thus reduce poverty are keypolicy issues for managing water in thedeveloping world. To maximize the prom-ise of domestic water to build livelihoodsfor entire poor communities, the follow-ing policy and program approaches shouldbe pursued:
Water supply systems designed toensure adequate water supply with thesupply points being in the right place;
Management and tariff structuresthat account for the economic gains madeby productive uses of water, increasing theirability to pay and demand for reliablewater supplies;
The annual value oftime savings (from
improved access towater and sanita-tion) for the Asia
and Pacific regionwould amount to
$54 billion forachieving Target 10and $109 billion to
improve watersupply and sanita-
tion for all.
Are Countries in Asia on Track to Meet Target 10 of the MDGs? 29
Transparent, agreed upon regulationof water uses across seasons;
Training of rural and urban waterusers in product diversification and mar-ket development of the products and ser-vices they offer, which allow the poor totake full advantage of the new livelihoodopportunities.
Home-based productive activities arecomplex and diverse, as well as infor-mally—and at times illegally—carried out,making it difficult to collect data and esti-mate—even broadly—their economic con-tribution. Initiatives to quantify thesewater-dependent home-based livelihoodactivities and include them in the calcula-tion of benefits of water supply and sani-tation investments are needed and shouldbe a focus of cooperation between govern-ments and national and international de-velopment partners.
Domestic water has traditionally beenwritten off as a nonproductive cost— some-thing used only for consumption purposes.So, analysis of the benefits attached to do-mestic water has typically been limited toimprovements in health and increases intime available and capacities for produc-tive activities. Not including the income-generating effect of domestic water supplylimits the analysis. Yet, the time and healthsavings on their own generally justify in-vestments in water and sanitation.
There is one main variable typicallyused to estimate the cost benefits of betteraccess to clean, reliable water supply andimproved sanitation— time savings. Thesetime savings are traditionally split into twomain types: gains related to lower mor-bidity and fewer deaths, and gains relatedto less distance and energy spent fetchingwater.
Time savings represents an additionalresource, which can be valued based onminimum wages. From this, it is estimatedthat the annual value of adult days gainedfrom meeting Target 10 would be $323million, rising to almost $647 million whenimproved water supply and sanitation areprovided for all (Annex D). Due to the con-siderable health impact from disinfecting
water at point-of-use (households), thevalue of productive days gained would beover $1.8 billion, and would reach $2.8billion when regulated piped water supplyin house and sewage connection with par-tial treatment for everyone is provided. Eastand Northeast Asia would benefit the mostin terms of the value of productive daysgained per year.
The second major benefit of improv-ing access to water and sanitation derivesfrom the time savings associated with closerlocation of the facilities. Time savings oc-cur from the relocation of a well or bore-hole to a site closer to user communities,the installation of piped water supply inhouses, and closer access to latrines. Theytranslate into increased production, higherschool attendance, and more leisure time.
The annual value of these time sav-ings, spread over the entire population ofthe Asia and Pacific region, would amountto $54 billion for achieving Target 10 and$109 billion to improve water supply andsanitation for all. When regulated pipedwater supply in house and sewage connec-tion with partial treatment is provided foreveryone, $241 billion are generated fromtime savings.
The economic and political significanceof these potential benefits are tremendous.Essentially, every dollar invested in meet-ing Target 10 generates $6 in economic re-turns—and that is just in terms of timesavings. As stated earlier, Target 10 requiresan annual investment of $8 billion. OnceTarget 10 is met, an economic benefit ofover $54 billion is returned annually. Pro-viding total coverage generates even greaterlevels of benefits.
It is the height of economic irrational-ity to not invest in these vital services—asthere are few other areas of investment thatwill generate as high a rate of return andthat are as effective at targeting the spe-cific needs and capabilities of the poor. Thebenefits of meeting Target 10 will dispro-portionately go to the poor since it is thepoor who usually do not have adequatecoverage now and whose time would besaved, and it is the poor who would ben-
Initiatives to quan-tify water-depen-dent home-basedlivelihood activitiesand include them inthe calculation ofbenefits of watersupply and sanita-tion investmentsare needed andshould be a focusof cooperationbetween govern-ments and nationaland internationaldevelopmentpartners.
30 Asia Water Watch 2015
efit from the new opportunities. As such,investments in water supply and sanita-tion are self-selecting to the poor and areof significance in terms of targeting invest-ments directly to poverty reduction. Thepoor themselves, who lack decent watersupplies and sanitation options, almost al-ways prioritize water when asked what aretheir needs.
Improving Health and HygieneOf all the social sectors, the water supplyand sanitation target—Target 10—obvi-ously affects the three health-related MDGsand their associated targets. By 2015, thethree health-related MDGs hope to:
Reduce by two thirds the death ratefor children under the age of 5 years
Reduce by three fourths the ma-ternal mortality ratio
Have halted and begun to reversethe spread of HIV/ AIDS, malaria, and othermajor diseases.
Assisting the poor in their fight againstdiseases and high mortality rates, water iscrucial to improving nutrition and foodsecurity. By making them healthier, thepoor reduce their chances of falling ill—andtoo often fatally—to a wide range of con-ditions and diseases. The greatest threatposed by waterborne and water-washeddiseases is infectious diarrhea—the biggestkiller of young children. Improved quanti-ties and quality of domestic water and sani-tation will directly reduce child deaths. Asthe WHO Director-General puts it:27
“Water and sanitation is one of theprimary drivers of public health. Ioften refer to it as ‘Health 101,’which means that once we can se-cure access to clean water and toadequate sanitation facilities for allpeople, irrespective of the differencein their living conditions, a hugebattle against all kinds of diseaseswill be won.”
His views are echoed by Secretary-Gen-eral of the United Nations Kofi Annan:
“We shall not finally defeat AIDS,tuberculosis, malaria, or any ofthe other infectious diseases thatplague the developing world untilwe have also won the battle forsafe drinking water, sanitation,and basic health care.”
Role of Awareness. Providing accessalone will not deliver on water’s promiseto dramatically improve the poor’s health.Behavior must change. Health and hygieneawareness campaigns must be waged inlocal communities to educate them on thedifferent health and hygienic practices thatshould go along with the new and im-proved water services and facilities theyreceive. Government officials and servicesproviders should not be excluded from thisprocess of awareness raising. They toomust understand, plan, and commit re-sources to the important role that aware-ness building plays in maximizing newservices introduced in communities. Thereare many examples of successful aware-ness-raising approaches in this area.
Role of local water, environmentalmanagement. As communities becomemore informed about personal health andhygiene, they also need to be educated onnew ways of managing their surroundings.Local water quality must be protected frompotentially hazardous environmental ele-ments, such as waste from livestock, pol-lution from farming and local industries,and potential habitats for parasites and dis-ease vectors, such as mosquitoes andworms. Protecting local water resourcesand surrounding environments at the lo-cal levels protects human health. Malariais a scourge that will only be successfullyaddressed through water management thatremoves their breeding habitat. Similarly,water management will reduce vulnerabil-ity to a range of other diseases such as tra-choma and schistosomiasis for whichwater is a vector.
Regional Prospects of Water’s Im-pact. The impact of improved water sup-ply and sanitation on the poor’s health willvary from one region to another, depend-

Are Countries in Asia on Track to Meet Target 10 of the MDGs? 31
ing on the existing levels of water supplyand sanitation access and the region-spe-cific levels of morbidity on Health MDGsand mortality due to diarrheal and otherdiseases. Health impacts will be greatest inregions with high numbers of unserved andsignificant cases of diarrheal disease. Esti-mates suggest that South and SouthwestAsia and East and Northeast Asia wouldbenefit the most in terms of reducing mostcases of diarrhea and the burden of water-related diseases for caregivers (Annex E). IfTarget 10 is met, almost 137 million casesof diarrhea will be averted per year in Southand Southwest Asia and more than 108million in East and Northeast Asia. Over-all, more than 275 million cases in Asiaand the Pacific would be averted per year.Providing basic water and sanitation forall—not just the half called for in Target10—would double these numbers andgreatly reduce infant and child mortality.
Cost savings benefit. Avoiding illnessnaturally saves time and money for boththe health sector and to patients themselves.The most significant source of cost savingscomes from the reduced number of treat-ments for diarrheal cases. Patients avoidcosts incurred by seeking treatment, whichincludes expenditures on care, drugs, trans-port and the costs of opportunity lost tothe time spent on seeking care. These costsavings were calculated by multiplying thecost of a health service unit by the numberof cases averted. Past studies do not includedata on the number of health visits per case,so it was assumed that 30% of the peoplewith a diarrheal case would visit a healthfacility.
Meeting Target 10 would save Asiaand the Pacific $2.5 billion per year. Anadditional $2.6 billion would be savedevery year if improved water supplies andsanitation were provided for all (AnnexF). To further note, these health care sav-ings would continue long after the bulkof investments have been made to meetTarget 10. That a significant proportionof these savings would go to poor people,who suffer most from the problems andwould save most from their removal, has
further implications for the poverty re-duction benefits of improved water sup-ply and sanitation.
Improving the Lives of SlumDwellersThe urban poor suffer from poor qualityand unreliable water services. In manymajor South Asian cities, only 1% or lessof those fortunate to even have connectionsreceive 24-hour water supplies. In worseconditions, slum dwellers without connec-tions regularly queue for long periods tocollect water from private vendors. Mostoften, they are paying the most—10 timesor more than what better off people withconnections to central utilities pay. Few ofthe urban poor have access to sanitation,and many areas where the poor live arevulnerable to floods and contaminationfrom polluted waters.
Providing reliable, affordable and ac-cessible water supplies, improved sanita-tion, and protection from floods andpollution is a direct contribution to theMDG of improving the lives of slum dwell-ers. To do this requires substantial invest-ments in infrastructure and reforms inurban governance.
In urban areas of Asia and the Pacific,between 1990 and 2002, nearly 384 millionpeople gained access to water and nearly 369million gained access to sanitation. Althoughthis is an impressive number of people, therate of increase has barely kept pace withthe growth of urban populations. In 1990,95% of urban residents had access to im-proved water supply. Twelve years later, in2002, 94% had access—although a reduc-tion of only 1%, this is an indication ofpopulation growth outpacing services.
Sanitation coverage increased from70% in 1990 to 75% in 2002. Meeting theurban sanitation challenge is particularlydaunting, as the disposal of contaminatedwastewater in densely populated areas isboth expensive and technically challeng-ing and the scope for sustainable revenueto pay for these services is limited. Thereare examples of successful actions to ad-
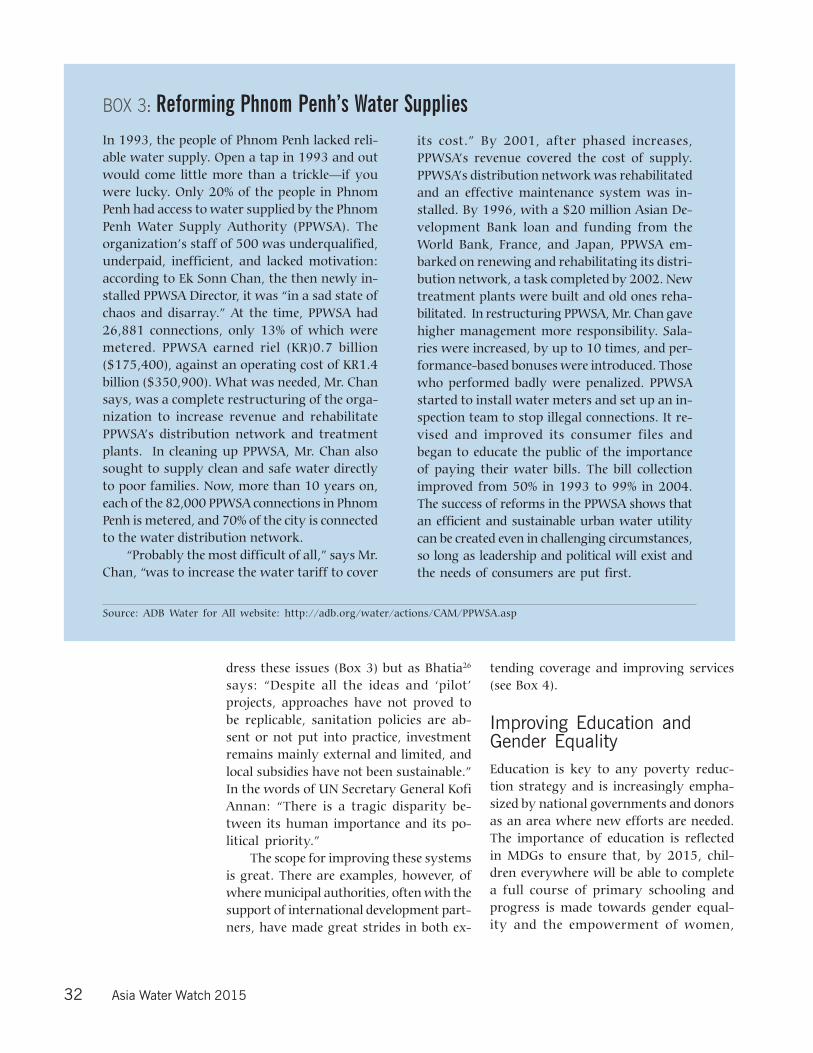
32 Asia Water Watch 2015
dress these issues (Box 3) but as Bhatia26
says: “Despite all the ideas and ‘pilot’projects, approaches have not proved tobe replicable, sanitation policies are ab-sent or not put into practice, investmentremains mainly external and limited, andlocal subsidies have not been sustainable.”In the words of UN Secretary General KofiAnnan: “There is a tragic disparity be-tween its human importance and its po-litical priority.”
The scope for improving these systemsis great. There are examples, however, ofwhere municipal authorities, often with thesupport of international development part-ners, have made great strides in both ex-
tending coverage and improving services(see Box 4).
Improving Education andGender EqualityEducation is key to any poverty reduc-tion strategy and is increasingly empha-sized by national governments and donorsas an area where new efforts are needed.The importance of education is reflectedin MDGs to ensure that, by 2015, chil-dren everywhere will be able to completea full course of primary schooling andprogress is made towards gender equal-ity and the empowerment of women,
In 1993, the people of Phnom Penh lacked reli-able water supply. Open a tap in 1993 and outwould come little more than a trickle—if youwere lucky. Only 20% of the people in PhnomPenh had access to water supplied by the PhnomPenh Water Supply Authority (PPWSA). Theorganization’s staff of 500 was underqualified,underpaid, inefficient, and lacked motivation:according to Ek Sonn Chan, the then newly in-stalled PPWSA Director, it was “in a sad state ofchaos and disarray.” At the time, PPWSA had26,881 connections, only 13% of which weremetered. PPWSA earned riel (KR)0.7 billion($175,400), against an operating cost of KR1.4billion ($350,900). What was needed, Mr. Chansays, was a complete restructuring of the orga-nization to increase revenue and rehabilitatePPWSA’s distribution network and treatmentplants. In cleaning up PPWSA, Mr. Chan alsosought to supply clean and safe water directlyto poor families. Now, more than 10 years on,each of the 82,000 PPWSA connections in PhnomPenh is metered, and 70% of the city is connectedto the water distribution network.
“Probably the most difficult of all,” says Mr.Chan, “was to increase the water tariff to cover
its cost.” By 2001, after phased increases,PPWSA’s revenue covered the cost of supply.PPWSA’s distribution network was rehabilitatedand an effective maintenance system was in-stalled. By 1996, with a $20 million Asian De-velopment Bank loan and funding from theWorld Bank, France, and Japan, PPWSA em-barked on renewing and rehabilitating its distri-bution network, a task completed by 2002. Newtreatment plants were built and old ones reha-bilitated. In restructuring PPWSA, Mr. Chan gavehigher management more responsibility. Sala-ries were increased, by up to 10 times, and per-formance-based bonuses were introduced. Thosewho performed badly were penalized. PPWSAstarted to install water meters and set up an in-spection team to stop illegal connections. It re-vised and improved its consumer files andbegan to educate the public of the importanceof paying their water bills. The bill collectionimproved from 50% in 1993 to 99% in 2004.The success of reforms in the PPWSA shows thatan efficient and sustainable urban water utilitycan be created even in challenging circumstances,so long as leadership and political will exist andthe needs of consumers are put first.
BOX 3: Reforming Phnom Penh’s Water Supplies
Source: ADB Water for All website: http://adb.org/water/actions/CAM/PPWSA.asp

Are Countries in Asia on Track to Meet Target 10 of the MDGs? 33
which is demonstrated by ensuring thatgirls and boys have equal access to pri-mary and secondary education.
Although water does not play a directrole in achieving this, improved health re-
sulting from clean water and improvedsanitation is key to improving attendanceand performance at school (see Box 5). Bet-ter health resulting from improved watersupply and sanitation will mean millions
The WaterAid-Bangladesh/DSK Urban Pro-gramme has been implemented since 1998 inapproximately 168 slums in the Dhaka met-ropolitan area and in Chittagong City Cor-poration. Around 25,000 households havegained access to one or more of the servicesoffered: connections to metropolitan waterauthority lines; tubewells; sanitation blockscombining water points and hygienic la-trines; community/cluster latrines with sep-tic tanks; household water-seal, pit latrines;footpaths; drainage improvements; solidwaste management; and hygiene education.All physical improvements are wholly orpartly paid for by local users.
BOX 4: Urban Sanitation: Islands of SuccessSulabh community toilet complexes in In-dia have succeeded in providing clean toi-lets and bathing facilities to urban poor atnominal charges. There are around 6,000community toilets providing toilet-cum-bath services to around 3 million people in625 towns on a pay-and-use basis.
The Orangi project in Karachi, Pakistan is alow-cost sanitation program which enableslow-income households to construct andmaintain modern sanitation (pour-flush la-trines in their own homes and undergroundsewerage pipelines in the lanes) with theirown funds and under their own manage-ment.
Source: Bhatia, R. Community-managed sanitation services for the urban poor in Asia, Africa and Latin America:Constraints to scaling-up of ‘islands of success’. 2004
take these habits into adulthood and pass themon to the next generation. WaterAid’s partnerorganization, ATprojects, has developed low cost‘ATloo’ that are easy to build and maintain, easyto clean, free of smell, and nice to look at. Com-munities are taught to operate and maintainthem and learn about good hygiene. Training inHIV/AIDS awareness and prevention educationis also being included as part of the project asHIV/AIDS is becoming a growing issue in PNG.The project reported a strong appreciation of thelatrines by the schools and WaterAid intends tocontinue to help other schools in PNG to buildimproved sanitation facilities.
BOX 5: WaterAid Australia Support to School Latrines in Papua New GuineaWaterAid Australia has completed its firstproject in Papua New Guinea (PNG) in conjunc-tion with Oxfam CAA, Oxfam NZ, andATprojects. The project has directly benefitedover 5000 schoolchildren and indirectly over13,000 local community members by helpingthem to build latrines. Funds from WaterAidAustralia have supported the building of 84latrines in 14 primary schools in the EasternHighlands province of the country. The projectworked with children as they are most affectedby, and most vulnerable to, hygiene-related ill-nesses. Establishing sound personal hygienehabits at a young age is vital so that children
Source: WaterAid Water for Life website: http://www.wateraid.org.uk/
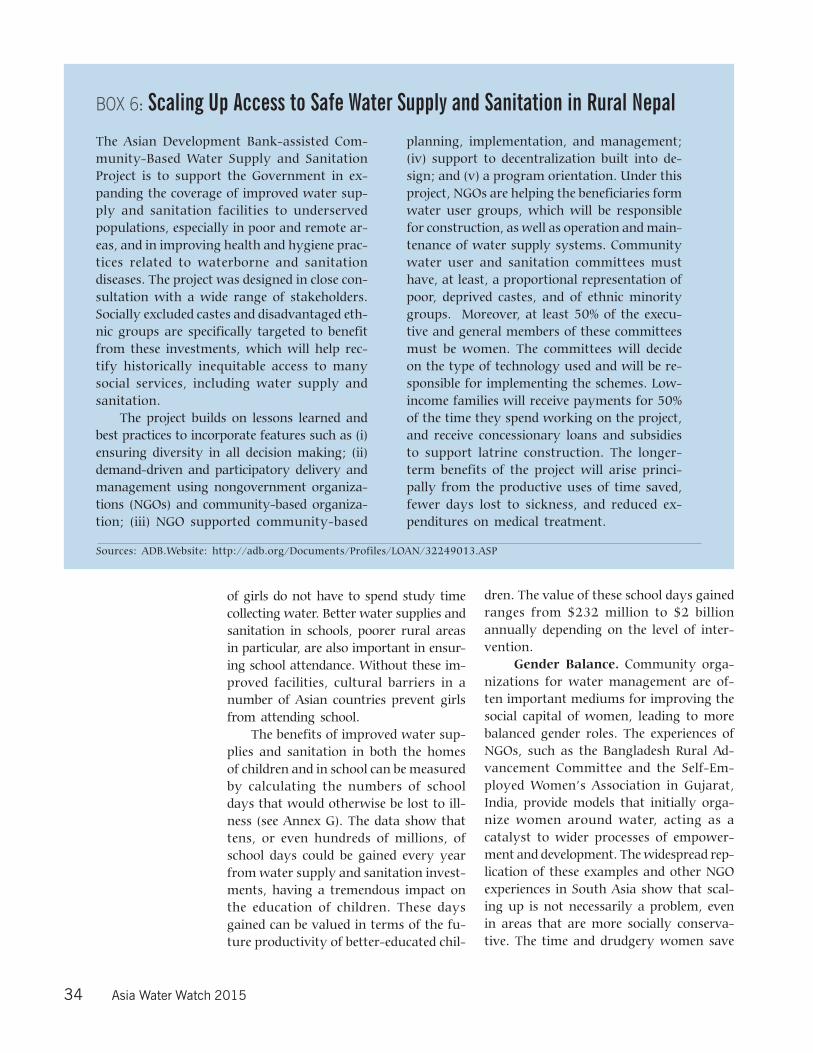
34 Asia Water Watch 2015
of girls do not have to spend study timecollecting water. Better water supplies andsanitation in schools, poorer rural areasin particular, are also important in ensur-ing school attendance. Without these im-proved facilities, cultural barriers in anumber of Asian countries prevent girlsfrom attending school.
The benefits of improved water sup-plies and sanitation in both the homesof children and in school can be measuredby calculating the numbers of schooldays that would otherwise be lost to ill-ness (see Annex G). The data show thattens, or even hundreds of millions, ofschool days could be gained every yearfrom water supply and sanitation invest-ments, having a tremendous impact onthe education of children. These daysgained can be valued in terms of the fu-ture productivity of better-educated chil-
dren. The value of these school days gainedranges from $232 million to $2 billionannually depending on the level of inter-vention.
Gender Balance. Community orga-nizations for water management are of-ten important mediums for improving thesocial capital of women, leading to morebalanced gender roles. The experiences ofNGOs, such as the Bangladesh Rural Ad-vancement Committee and the Self-Em-ployed Women’s Association in Gujarat,India, provide models that initially orga-nize women around water, acting as acatalyst to wider processes of empower-ment and development. The widespread rep-lication of these examples and other NGOexperiences in South Asia show that scal-ing up is not necessarily a problem, evenin areas that are more socially conserva-tive. The time and drudgery women save
The Asian Development Bank-assisted Com-munity-Based Water Supply and SanitationProject is to support the Government in ex-panding the coverage of improved water sup-ply and sanitation facilities to underservedpopulations, especially in poor and remote ar-eas, and in improving health and hygiene prac-tices related to waterborne and sanitationdiseases. The project was designed in close con-sultation with a wide range of stakeholders.Socially excluded castes and disadvantaged eth-nic groups are specifically targeted to benefitfrom these investments, which will help rec-tify historically inequitable access to manysocial services, including water supply andsanitation.
The project builds on lessons learned andbest practices to incorporate features such as (i)ensuring diversity in all decision making; (ii)demand-driven and participatory delivery andmanagement using nongovernment organiza-tions (NGOs) and community-based organiza-tion; (iii) NGO supported community-based
planning, implementation, and management;(iv) support to decentralization built into de-sign; and (v) a program orientation. Under thisproject, NGOs are helping the beneficiaries formwater user groups, which will be responsiblefor construction, as well as operation and main-tenance of water supply systems. Communitywater user and sanitation committees musthave, at least, a proportional representation ofpoor, deprived castes, and of ethnic minoritygroups. Moreover, at least 50% of the execu-tive and general members of these committeesmust be women. The committees will decideon the type of technology used and will be re-sponsible for implementing the schemes. Low-income families will receive payments for 50%of the time they spend working on the project,and receive concessionary loans and subsidiesto support latrine construction. The longer-term benefits of the project will arise princi-pally from the productive uses of time saved,fewer days lost to sickness, and reduced ex-penditures on medical treatment.
BOX 6: Scaling Up Access to Safe Water Supply and Sanitation in Rural Nepal
Sources: ADB.Website: http://adb.org/Documents/Profiles/LOAN/32249013.ASP
Are Countries in Asia on Track to Meet Target 10 of the MDGs? 35
from collecting water frees up time forproductive activities, giving them moreeconomic power and independence, orgreater time for leisure, study, and socialinteractions—all of which build their so-cial capital.
These gains can be measured in termsof time saved and productivity increased,as discussed above. Because of women’scentral role in collecting and using water,they are central actors in improving watersupplies and sanitation. They are the main
stakeholders and it is essential that theybe placed at the center of decision mak-ing when planning and implementing sys-tem improvements. It is understandablewhy women place such a high priorityon improving water supplies and sanita-tion facilities. They carry tremendous bur-dens to provide water and care for thehealth of their families. It should also beunderstandable then why improving wa-ter supplies and sanitation facilities is cen-tral to addressing gender issues.

36 Asia Water Watch 2015
Are Countries in Asia on Track to Meet Target 10 of the MDGs? 37
Defining theChallenges: WhereChange is NeededWE HAVE SEEN THAT in many parts of the Asia and Pacific region, and for theregion as a whole, the prospects for reaching at least the MDG target for watersupply are good. The situation for sanitation is less positive, though even here there area number of countries where it can be expected that the target will be achieved. Manyof the countries likely to reach all of Target 10 are ones where the situation is alreadyrelatively good and where the prospects for continued development and growth suggestthat the needed resources and institutions will ensure continuing progress. Several ofthese countries are large, including the big two—the PRC and India, implying that theirachievement will also push for the accomplishment of Target 10 at the global level.Attaining the MDG targets will be an important milestone in the process of socioeco-nomic and environmental development in these countries, but continuing commitmentwill be necessary to maintain the momentum of the achievement of the MDGs.
Achieving the MDG targets is still not theend of the story, including the end of theneed for significant investments in watersupply and sanitation. Even in countrieswhere Target 10 and the MDGs are met,there will often be communities and areasthat will still face problems. Target 10, likemost other targets, only aims to halve thenumber of people without access to waterand sanitation. In most countries, manymillions of people will not have their needsmet despite the MDG targets being achieved.Given that it is likely to be the poorestpeople, often living in the most challeng-ing locations and whose needs are unmet,the challenges of providing improved wa-ter supply and sanitation for all of thepeople of Asia and the Pacific will still besignificant. Other countries in the regionface a variety of challenges in reachingthe MDGs. As we have seen, for somecountries in Asia and the Pacific, the pros-pects of attaining Target 10 are remoteunless major changes are made in theways water supply and sanitation ser-
vices are delivered. This is particularlytrue for sanitation, where current trendssuggest that there is little or no prospectof the 2015 target being reached withoutthese changes.
What changes need to take place to ad-dress these challenges? Clearly and nowwidely accepted is the understanding thatthe principal challenges will not be tech-nological— the hardware of water suppliesand sanitation—but rather the soft issues:How can water supply and sanitation pro-grams be organized and financed? How canpeople be trained, organized, and motivatedto install, use, and maintain the facilities?How can institutions develop more andbetter incentives and make improvementsmore sustainable? These questions are notnew, and indeed have been recognized aspivotal since the Water Supply and Sanita-tion Decade in the 1980s. That they arefamiliar does not negate their relevance orimportance, for the challenges the ques-tions present are still to be met in manyparts of the Asia and Pacific region.
6CHAPTER
Target 10... onlyaims to halve thenumber of peoplewithout access towater and sanita-tion (and) the chal-lenges of providingimproved watersupply and sanita-tion for all of thepeople of Asia andthe Pacific will stillbe significant.
38 Asia Water Watch 2015
Priority Action AreasBox 7 sets out the 10 priority action ar-eas identified by the UN Water and Sani-tation Task Force in their final report forthe Millennium Project. These 10 recom-mendations provide a framework foradapting to the specific situations of dif-ferent countries and to identify their pri-orities for action. For Asia and the Pacific,the analysis of trends demonstrates thatthe first valid action for most countriesis to put sanitation on the top of theagenda. This includes the need to identifydifferent modalities for extending accessto sanitation services. The existing ten-dency to link sanitation provision to wa-ter supply, while attractive on a numberof levels, has meant that insufficient at-
tention has been paid to sanitation. Inparticular, the needs of the many millionswho do have adequate water but lack sani-tation tend to be neglected. Different ap-proaches are needed to address theproblems.
The remaining recommendations em-phasize institutional reforms andstrengthening at all levels, but with a par-ticular focus on decentralized governmentinstitutions, community organizations,and the private sector. The implicationsof these recommendations, along with ex-periences from other sources, are clear:the key is to provide people, including thepoor, with increased choices over whatinvestments to make, how they are orga-nized and paid for, and how services arerun once access to facilities is improved.
fund the maintenance and expansion of ser-vices – but they must also ensure that the needsof poor households are met.Action 7: Within the context of national MDG-based poverty reduction strategies, countriesshould elaborate coherent water resources de-velopment and management plans that will sup-port the achievement of the MDGs.Action 8: Governments and their civil societyand private sector partners must support a widerange of water and sanitation technologies andservice levels that are technically, socially, en-vironmentally, and financially appropriate.Action 9: Institutional, financial and techno-logical innovation must be promoted in strate-gic areas.Action 10: The United Nations system organi-zations and their Member States must ensurethat the UN system and its international part-ners provide strong and effective support forthe achievement of the water supply and sani-tation target and for water resources manage-ment and development.
BOX 7: UN Water Supply and Sanitation Task Force RecommendationsAction 1: Governments and other stakehold-ers need to move the sanitation crisis to thetop of the agenda.Action 2: Countries must ensure that policiesand institutions for water supply and sanita-tion service delivery, as well as for water re-sources management and development,respond equally to the different roles, needs,and priorities of women and men.Action 3: Governments and donor agenciesmust simultaneously pursue investment andreforms for improved water supply, sanitation,and water management.Action 4: A focus on sustainable service deliv-ery, rather than construction of facilities alone,must be at the center of efforts to reach Target10.Action 5: Governments and donor agenciesmust empower local authorities and commu-nities with the authority, resources, and pro-fessional capacity required to manage watersupply and sanitation service delivery.Action 6: Governments and utilities must en-sure that users who can pay do pay in order to
Source: United Nations. 2004. What will it take? Water, Sanitation, and the Millennium Develop-ment Goals. UN, New York.

Are Countries in Asia on Track to Meet Target 10 of the MDGs? 39
The focus on increasing choices forpeople as consumers of services implies adifferent role for governments. Instead ofseeing their main task as building morefacilities, government agencies shouldconcentrate on creating an effective policy,legal and regulatory environment inwhich all sections of the community, in-cluding local communities and the privatesector, can play an active role in improv-ing access to safe water and improved sani-tation.
In defining the trajectory of and pri-orities for change, decision makers needto address a range of issues in the follow-ing four core areas that reflect the keyconstraints identified in the UN MDGTask Force report:
1. Policy, legal, and regulatoryreform is an essential pre-condition forsustainable and effective change in Asiaand the Pacific. Governments are the cen-tral actors because they are responsiblefor defining the framework within whichwater supply and sanitation provisiontakes place. This framework houses theset of laws and regulations that determinethe responsibilities and rights of differ-ent sections of society to access these ser-vices, as well as determine the quality ofstandards these services must maintainto protect users and environments. Theselaws and regulations are further priori-tized by the policy framework for the sec-tor and for related sectors such as health,education, ecosystems conservation, andhousehold-based livelihood activities thatuse domestic water. Special attention todefining policies that target the specificneeds and opportunities of the poor forimproved access to water supply and sani-tation is needed. This is particularly truefor targeting government and donor re-sources for investments, awareness rais-ing and community mobilization.
2. Planning and technologychoices must ensure that the national le-gal and policy framework is put into prac-tice. Governments need to ensure that theplanning systems surrounding their pro-grams, including programs supported by
donors, reflect the policy priorities. Theydo this by having explicit poverty targetsand providing options that reflect the needsand capabilities of the poor. Above all, thegoal should be to make the full range oftechnology and management choicesavailable to poor people and to planners.This should include developing innovativeand, where possible, low cost technicalchoices that can be afforded and imple-mented by poor communities. For watersupply, this should include approachessuch as small piped networks for, in par-ticular, areas of urban fringes and denselysettled rural areas, as well as innovativetechnologies to ensure adequate waterquality. For sanitation, ideas for ap-proaches that accomplish both safe useof wastewater and excreta and ecologi-cally sustainable sanitation need to bescaled up to a level where they make areal impact at a national level.
3. Financing mechanisms26, in-cluding supportive investment environ-ments (especially ones that encouragesmall private sector investments) and ef-fective cost recovery mechanisms are ap-proaches that will address majorchallenges in many places. Two aspectsof this issue are particularly important:
a) The establishment of more effec-tive and diverse credit and financial man-agement systems that are accessible toand affordable by the poor. This is essen-tial to generate as high a level of cost re-covery as possible. In many cases, thepoor are willing to pay for better waterand sanitation. The appropriate financialmechanisms are needed to deliver theimproved access to them.
b) The development of a regulatoryregime in which investments by the pri-vate sector, and especially by local small-scale entrepreneurs, are encouraged. A keyaspect of this is the reform of governmentregulations in order to enable privatesector’s engagement in the water sector.This should be accompanied by the devel-opment of targeted programs to encour-age entrepreneurial development.

40 Asia Water Watch 2015
4. Institutional reform is needed tobuild capacity, introduce more appropri-ate management systems, and bring moreeffective coordination among governmentagencies. There is also the need to buildbetter links between government and civilsociety and to establish a supportive en-vironment for the further development ofprivate sector, civil society, and commu-nity level organizations. This issue coversa wide range of different aspects of insti-tutional processes, but, in many places,three critical gaps need to be addressed:
a) Strengthening decentralization pro-cesses and building the capacity of localgovernment agencies. These activities arecrucial to implementing key policies thatpromote water supply and sanitation de-velopment. This is true for both urbanareas (through the strengthening of mu-nicipal authorities) and for rural areas.
b) Supporting the development of lo-cal private sector providers. This is ac-complished by developing effective marketsystems, which should include the pro-duction and distribution of materials, theconstruction of appropriate facilities, andthe provision of services (which absolutelyrequires operation and maintenance ofthese facilities).
c) Reducing the fragmentation andclarifying the uncertainties over mandatesthat often characterize the water supplyand sanitation sector. It is not unusual formultiple government agencies to have re-sponsibilities that overlap and subsequentlycause gaps (especially for sanitation). Anurgent priority of government should beto ensure their operations are coherent forthem to be effective.
Are Countries in Asia on Track to Meet Target 10 of the MDGs? 41
Meeting theChallenges: WhoShould Do What?THE WORLD SUMMIT ON SUSTAINABLE DEVELOPMENT (WSSD) Plan of Imple-mentation recognized that achieving the MDG targets for water supply and sanitationwould necessitate the active collaboration of a wide range of stakeholders—not justgovernment agencies. This includes, specifically, local communities as the maindrivers of change, and the private sector as a potentially key collaborator in providingpoor people with affordable choices in a sustainable and efficient manner. The basisfor building such collaborations is the recognition that different types of organizationhave different capabilities and different roles to play. This perspective is reflected inthe WSSD principle of “common but differentiated responsibilities.”
The scale of investments needed to achievethe MDG targets in Asia and the Pacific is,as we have seen, considerable but achiev-able. Indeed, the current trends suggestthat many countries in the region willreach the water supply target in particu-lar. Those that do will do so because theyare able to draw on the capabilities andthe finances of all sections of society and,in particular, have systems where localcommunities invest their own resourcesin services that meet their needs. The es-timated levels of investments needed tomeet the targets, some $8 billion a year,are well within the capabilities of mostcountries in the region. But, we cannotrely on governments alone, even wherethe international community activelysupports them with money and other re-sources.
Time is of the essence. For increasedaccess to safe water supplies and sanita-tion services to have an effect on the otherMDGs, governments must act swiftly inprioritizing the water sector on its devel-opment and poverty reduction agenda. Atthe same time, governments cannot affordto proceed with poorly-informed plans.
Knowledge gained can mean time and in-vestment gains. The challenges associatedwith institutional change and capacitybuilding, and with creating new financ-ing mechanisms outlined above, do taketime to plan and implement. Govern-ments in the region should consider con-ducting national assessments to be usedas an informative basis for national wa-ter sector strategies. These should be ex-ecuted as joint exercises that involve theperspectives of different stakeholders inbuilding a consensus of what changes areneeded, what actions have priority, andwho should do what.
One key issue to this collaborative pro-cess is defining who should do what in thedevelopment of new partnerships and ap-proaches to cooperation in water supplyand sanitation development. The goal is tomake use of the advantages that differentstakeholders have in terms of their skills,resources, and perspectives on the sector.The new partnerships need to build theirstrategies on the key directions of the fol-lowing four main groupings of stakehold-ers: (i) people, communities, and civilsociety; (ii) governments, including policy
7CHAPTER
Governments...should considerconducting na-tional assessmentsas basis for na-tional water sectorstrategies... as jointexercises that in-volve the perspec-tives of differentstakeholders inbuilding a consen-sus of whatchanges areneeded, what ac-tions have prioritiy,and who should dowhat.
42 Asia Water Watch 2015
makers, central ministries, local govern-ment agencies, and the support given byinternational development partners; (iii) theprivate sector; and (iv) relevant interna-tional stakeholders.
People, communities, andcivil societyThis fundamental group of stakeholderscomprises the very families we are try-ing to extend access to safe and sufficientwater and improved sanitation, the orga-nizations that represent and involve themand organizations from the rest of soci-ety that support the poor. These commu-nities and organizations are central to anydevelopment of water supply and sanita-tion. In particular, working with localpeople provides
Knowledge of their real needs andpriorities, the condition and sustainabilityof local water resources, the many typesof long-standing and effective solutions totheir problems and the local traditions andcustoms that need to be understood ifawareness programs are to be effective.
Skills of many sorts, including thepractical skills of masonry and plumbingneeded to build and maintain water sup-ply and sanitation facilities, the skillsneeded to make home-based livelihood ac-tivities viable, and organizational skillsneeded to plan, construct and operate wa-ter supply and sanitation facilities.
Resources from the people them-selves, which experience in many parts ofthe region show that people are both will-ing and able to pay for water supplies andsanitation where the technology choicesand materials are appropriate and avail-able.
Augmentation of knowledge, skills,and resources of local people through theirwillingness to work with civil society,which are in turn effective at introduc-ing innovations that ensure these localassets can be used more effectively. Theyare also often important in assisting todevelop community-based organizationsthat are fair and representative, and can
play a key role in assisting local commu-nities to relate to government agencies andother external organizations.
The discussion about local communi-ties, and even the poor, does not mean togeneralize them as a homogeneous group.They are differentiated along gender, eco-nomic, and social lines. These differentgroups often have extremely different, evenconflicting, needs and interests. It is con-sequently essential to ensure that organi-zations that purport to represent the poorare indeed representative of all sections ofthe poor and not just some dominant in-terests. Where this is the case, the contri-bution of local communities to thesustainable and effective development ofwater supply and sanitation facilities willgo far in determining whether and whenthe MDG targets will be met.
GovernmentsKey government figures in advancing wa-ter supply and sanitation coverage shouldinclude policy makers, central ministries,and local government agencies. Collectively,they represent a variety of perspectives. Thefour points discussed under defining thechallenges above give many pointers to thekey role that different branches of govern-ment should play in ensuring that the in-vestments needed to meet the MDG targetsare made. International development part-ners can and do support governments inmany ways for each of the points listedbelow. The role of government agencies,together with donors, are consolidated as:
Establishing the policy, legal, andregulatory environment, as discussedabove. It is of utmost importance to clarifythe roles and responsibilities of differentstakeholders and remove restrictions andperverse incentives that prohibit privatesector investments and inhibit communityinitiatives to develop water supply andsanitation solutions. Particular attentionneeds to be paid to the regulatory and in-stitutional context for ensuring that ap-propriate financial mechanisms exist.
Are Countries in Asia on Track to Meet Target 10 of the MDGs? 43
Directly investing in water sup-ply and sanitation in key areas. This in-cludes (i) urgently investing in watersupply and sanitation facilities in schools,health care facilities, and other publicplaces; (ii) targeted programs of invest-ments that aim to reach places where pri-vate initiatives and the market are notlikely to provide solutions, including serv-ing and subsidizing the poorest of the poorand investing in areas such as large ruralsettlements, cities, and peri-urban areaswhere the only viable options are multi-household facilities. A key issue is thenature and effectiveness of cost recoverymechanisms if the investments are to last.
Providing financing and credit forinvestments made by others, whether com-munities, the private sector or other or-ganizations. This can take many forms,including the existing banking systems, di-rect credits to NGOs or other organiza-tions, and dedicated credit systemsestablished under projects and others.There is a need to make such systems flex-ible, appropriate to the needs of the poor(with issues such as collateral a particu-lar concern) and, above all, permanent.Far too many credit systems have beenset up under projects only to wither awayonce the project support is over.
Advocacy, education, and aware-ness connected with issues of health andhygiene promotion, ensuring environmen-tal sustainability, informing people of theirrights and responsibilities, and assistingcommunities to access government pro-grams and other resources. Ministries andagencies with responsibilities in the healthand education fields have a particularly im-portant role in this area.
Monitoring and enforcement ofregulations concerning key issues, such aswater quality and wastewater disposal,technical standards for facilities, any regu-lations to ensure fair financial conditionsfor investments and service provision, andthe registration and regulation of organi-zations that represent local communities(Endnote 15 on WHO Guidelines).
Supporting innovations throughboth research and development that gen-erate new options and, perhaps more im-portantly in the short term, establishconditions where good practices can bescaled up to a level where they make a realand sustainable impact on the ground. Lo-cal universities and other research institu-tions are of pivotal importance here.
Because the water sector and all itsvaried subsectors (supply, sanitation, irri-gation, drainage, resource management,etc.) are often divided between many dif-ferent government departments and agen-cies, reforms and the regular overseeing ofthese subsectors can be extremely frag-mented. Governments need to establishapex bodies that bring inter-governmentcoordination. In the area of investments,different tiers of government consequentlyhave a complex and pivotal role in ensur-ing that investments are made and otheraspects of water supply and sanitation de-velopment are implemented in ways thatare fair, sustainable, and efficient in eco-nomic, environmental, and social terms.Although governments do have an impor-tant role in the direct implementation ofsome types of investment, this is not theirprimary role, but one of many roles.
Private SectorThe private sector has increasingly beenrecognized as having a key role in watersupply and sanitation development. Theprivate sector takes different forms and canperform a variety of roles. The one thathas attracted the most attention (and criti-cism, whether justified or not) is wherelarge private corporations, including mul-tinationals, have taken over the manage-ment of water utilities in major cities. Theexperience in these ventures has beenmixed, but lessons are being learned andthere is scope for improving approaches forthe engagement of appropriate private sec-tor corporations in many rapidly growingurban areas.
This high-profile role of the privatesector is not, by a long way, the most im-
44 Asia Water Watch 2015
portant one in water supply and sanita-tion provision in Asia and the Pacific. Offar greater importance, whether judgedeconomically or by numbers of peopleserved, is the role of local, generally small,entrepreneurs in providing a wide rangeof services to support and make invest-ments in and the operation of water sup-ply and sanitation facilities. Small, localprivate sector entrepreneurs provide thefollowing range of services in water sup-ply and sanitation:
Manufacturing and distribution ofmaterials and equipment, including pipes,latrine pans, pumps, bricks, water tanks,and many others. The availability of thesematerials through local retail outlets is es-sential if people are to invest directly inaddressing their needs.
Constructing and maintaining fa-cilities, including drilling wells, layingpipes, building latrines, and all other as-pects of the work needed to turn invest-ments into facilities. These can becommunal or individual, but the existenceof the skills and equipment among localsmall businesses to build and look afterwater supply and sanitation facilities isessential for the sustainability of invest-ments.
Service providers in the form ofwater sellers, whether they are the opera-tors of small piped schemes or vendors whobring water to people’s homes. These areoften small and informal, and are often theonly reliable source of water in low-incomeurban areas. They can be efficient, but areoften extremely expensive. Despite this,they provide a service when no others areavailable.
Providing inputs and markets forthe goods and services produced in home-based livelihood activities that depend ondomestic water supplies. The viability ofthese livelihood activities depends on theavailability of the inputs and good accessto markets, which are most often local.
The scale of such small-scale privatesector involvement is extremely difficult toestimate, but in many countries appears tobe large, often larger than the services
provided by government agencies if mea-sured by number of people connected orserved. These local investments also tendto be economically efficient to provide fa-cilities at a lower unit cost than those pro-vided by government or through donorprojects and to be sustainable and respon-sive to consumer needs and demands.Such investments can also be importantin generating local economic developmentthrough the multiplier effects they gen-erate. The private sector, and especiallylocal entrepreneurs, has long been ne-glected in many government and donoractivities in the sector. It is essential thatthis is reversed, and the private sector berecognized as a key stakeholder in the sec-tor if the MDG targets and the needs ofthe poor are to be met efficiently andsustainably.
Relevant InternationalStakeholdersThe international community has beenplaying a major role in creating an envi-ronment conducive to partnerships, com-mitment, investment, and accountabilityin development. The important challengesdiscussed in the previous section also re-quire involvement of the relevant inter-national stakeholders to monitor,promote, and support the process of de-veloping the region’s water sector and ad-vancing it toward the MDGs andsustainable socioeconomic growth in theregion.
The title of this chapter asked, “Whoshould do what?” The discussion abovegives some answers to this question. Inmany ways, we need integrated approacheswhere different stakeholders work togetherand are driven from below. Indeed, thiscould apply to almost any sector and areconventional wisdoms of international de-velopment approaches. This familiaritydoes not invalidate them, however—theneed for these approaches has been recog-nized in principle but all too often not fol-lowed through into practice in acomprehensive manner. There are ele-
Are Countries in Asia on Track to Meet Target 10 of the MDGs? 45
ments of these approaches in almost allcountries. What is needed is for these el-ements to be drawn together into a co-herent national strategy. This will createthe conditions where the levels of invest-ments needed to achieve and surpass Tar-get 10 can be realized throughout Asiaand the Pacific. As it is, great progress isbeing made in the region. But more canbe done where governments, supported byinternational development partners, actto ensure that the capabilities and re-sources of all sections of society are uti-lized to their full potential for a sectorthat is one of the keys to the reducing thepoverty of hundreds of millions of peoplein the countries of Asia and the Pacific.
Next StepsThe immediate next steps of all four keystakeholder groups should be in the direc-tion of aggressive sanitation interventionsto meet Target 10, or at least come closerthan what the dismal projections warn. Ithas long been argued that sanitation
should be promoted as part of integratedrural development plans and programs,urban upgrading, or primary health care,or at least together with water supply andhygiene education (Cairncross, 1992).The belief was that by combining sanita-tion with water supply, it would preventit from being neglected. There is increas-ing concern, however, that this is not al-ways the case. There have been caseswhere the implementing agency has ap-propriate staff or structures for one com-ponent but not the sanitation element.Also, just because several interventionsare planned together does not mean theyprogress at the same speed. As Cairncrosspoints out, the pace of sanitation imple-mentation is set not by administrativeability to provide facilities but by con-sumer demand so that it rarely matchesthe progress of other measures.
Clearly, each case must be weighedon its own merits and an analysis of thelocal situation. There may also be practi-cal reasons for water supply and sanita-tion to be dealt with separately.
46 Asia Water Watch 2015
Endnotes1. The term “water” is also used to refer collectively to water supply and sanitation.
2. Hutton, G., and L. Haller. Evaluation of the Costs and Benefits of Water and Sani-tation Improvement at the Global Level. Geneva: World Health Organization, 2004.(WHO/SDE/WSH/04.04)
3. ADB. 2004. The Impact of Water on the Poor.ADB Operations Evaluation Depart-ment, Manila.
4. UNESCAP and FAO. 2004. From Vision to Action in Least-Developed Countries: ASynthesis of Experiences in South-East Asia. UNESCAP, Bangkok.
5. Soussan, J. et al. 2005. Poverty Reduction and Water Management: Joint AgencyPaper of the Poverty Environment Partnership. ADB, Manila (forthcoming).
6. WHO and UNICEF. 2004. Meeting the MDG drinking water and sanitation target: Amid-term assessment of progress. United Nations, New York.
7. ADB. 2001. Water for All: The Water Policy of the Asian Development Bank. ADB,Manila.
8. UNDP. 1997. Human Development Report. UNDP, New York.
9. UNESCAP. 2004. Guidelines on Strategic Planning and Management of Water Re-sources, ST/ESCAP/2346. United Nations, New York.
10. UN. 2002. WSSD Plan of Implementation, page 3.
11. UN Millennium Project Task Force on Water and Sanitation, Final Report, AbridgedEdition. New York, UN Millennium Project and Stockholm International Water Institute,2005.
12. WHO and UNICEF. 2004. Meeting the MDG drinking water and sanitation target: Amid-term assessment of progress. United Nations, New York, page 2.
13. Several countries did not report figures for 1990, only for 2002.
14. Hutton and Haller. p. 9.
15. For more information on drinking water guidelines, see: WHO, 2004. Guidelines forDrinking Water Quality 3rd Edition Volume 1: Recommendation.
Are Countries in Asia on Track to Meet Target 10 of the MDGs? 47
16. McIntosh, A. 2003. Asian Water Supplies: Reaching the Urban Poor. ADB andInternational Water Association, Manila.
17. Hutton and Haller. 2004.
18. The percentage of a country’s population with access to improved drinking watersupplies and improved sanitation facilities by 2015 is based on the indicators used byWHO and UNICEF in their report “Meeting the MDG Drinking Water and SanitationTarget: A Mid-Term assessment of Progress (2004).” Projections have been made only forthose surveyed countries that have estimates of population, improved drinking watercoverage percentages, and improved sanitation coverage percentages for urban andrural populations for both the baseline year of 1990 and 2002. Applying the coveragerates to the respective countries, the percent of the population covered has been fig-ured for 1990 and 2002, along with the estimated average annual compounded popu-lation growth rate. The same average annual compounded population growth rate isassumed for the future and used to project the percent of population covered in 2015.The 2015 coverage rate is estimated by dividing the projected served population for2015 by the projected population, which were derived from the UN World PopulationProspects 1950-2050: The 2002 Revision (Database, Department of Economics andSocial Affairs, Population Division, New York, 2003). The 2015 coverage estimateshave been figured separately for urban and rural areas. In the course of working onthe estimates and projections, a number of inconsistencies in the data have been no-ticed. It is probable that data definitions and methods of data collection may havechanged in the two years of data gathering (1990 and 2002) or differed by country. Insuch cases, additional analysis was done to arrive at conservative estimates.
19. Hutton and Haller. 2004.
20. See International Network to Promote Household Water Treatment and Safe Storagewebsite at http://www.who.int/household_water/en/index.html
21. Howard, G., and J. Bartram. Domestic Water Quantity, Service Level and Health.Geneva, WHO, 2003 (WHO/SDE/WSH/03.02); http://www.who.int/ water_sanitation_health/diseases/wsh0302/en
22. Hutton and Haller. 2004.
23. OECD DAC Secretariat. 2004. Aid for Water Supply and Sanitation.
24. Slaymaker & Newborne. 2004. Implementation of water supply and sanitationprograms under PRSPs; and ODI, London and Bojo & Reddy. 2002. Poverty ReductionStrategies and the Environment. World Bank Environmental Economics Series Paperno. 86.
25. Dr Lee Jong-Wook, Director-General, WHO, WHO Fact Sheets, www.who.org.
26. Bhatia, R. 2004. Community-managed sanitation services for the urban poor inAsia, Africa and Latin America: constraints to scaling-up of ‘islands of success’. An-nex to Hansen, S. and R. Bhatia, 2004. Water and poverty in a macro-economic con-text. Paper commissioned by the Royal Norwegian Ministry of Environment.
27. ADB’s new financing mechanisms were prepared in August 2005.
48 Asia Water Watch 2015
Annexes
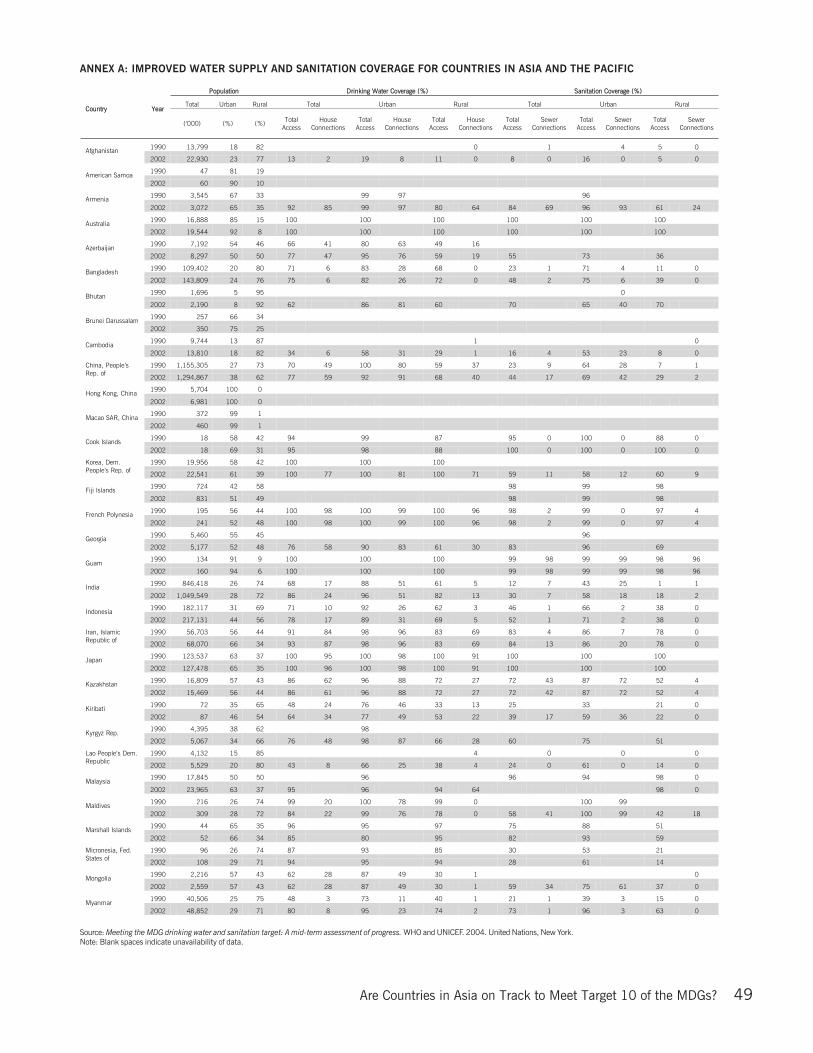
Are Countries in Asia on Track to Meet Target 10 of the MDGs? 49
ANNEX A: IMPROVED WATER SUPPLY AND SANITATION COVERAGE FOR COUNTRIES IN ASIA AND THE PACIFIC
Source: Meeting the MDG drinking water and sanitation target: A mid-term assessment of progress. WHO and UNICEF. 2004. United Nations, New York.Note: Blank spaces indicate unavailability of data.
Population Drinking Water Coverage (%) Sanitation Coverage (%)
Total Urban Rural Total Urban Rural Total Urban Rural Country Year
(‘000) (%) (%) Total Access
House Connections
Total Access
House Connections
Total Access
House Connections
Total Access
Sewer Connections
Total Access
Sewer Connections
Total Access
Sewer Connections
1990 13,799 18 82 0 1 4 5 0 Afghanistan 2002 22,930 23 77 13 2 19 8 11 0 8 0 16 0 5 0
1990 47 81 19 American Samoa
2002 60 90 10
1990 3,545 67 33 99 97 96 Armenia 2002 3,072 65 35 92 85 99 97 80 64 84 69 96 93 61 24
1990 16,888 85 15 100 100 100 100 100 100 Australia 2002 19,544 92 8 100 100 100 100 100 100
1990 7,192 54 46 66 41 80 63 49 16 Azerbaijan
2002 8,297 50 50 77 47 95 76 59 19 55 73 36
1990 109,402 20 80 71 6 83 28 68 0 23 1 71 4 11 0 Bangladesh 2002 143,809 24 76 75 6 82 26 72 0 48 2 75 6 39 0
1990 1,696 5 95 0 Bhutan 2002 2,190 8 92 62 86 81 60 70 65 40 70
1990 257 66 34 Brunei Darussalam 2002 350 75 25
1990 9,744 13 87 1 0 Cambodia
2002 13,810 18 82 34 6 58 31 29 1 16 4 53 23 8 0
1990 1,155,305 27 73 70 49 100 80 59 37 23 9 64 28 7 1 China, People’s Rep. of
2002 1,294,867 38 62 77 59 92 91 68 40 44 17 69 42 29 2
1990 5,704 100 0 Hong Kong, China
2002 6,981 100 0
1990 372 99 1 Macao SAR, China
2002 460 99 1
1990 18 58 42 94 99 87 95 0 100 0 88 0 Cook Islands 2002 18 69 31 95 98 88 100 0 100 0 100 0
1990 19,956 58 42 100 100 100 Korea, Dem. People’s Rep. of
2002 22,541 61 39 100 77 100 81 100 71 59 11 58 12 60 9
1990 724 42 58 98 99 98 Fiji Islands 2002 831 51 49 98 99 98
1990 195 56 44 100 98 100 99 100 96 98 2 99 0 97 4 French Polynesia 2002 241 52 48 100 98 100 99 100 96 98 2 99 0 97 4
1990 5,460 55 45 96 Georgia 2002 5,177 52 48 76 58 90 83 61 30 83 96 69
1990 134 91 9 100 100 100 99 98 99 99 98 96 Guam
2002 160 94 6 100 100 100 99 98 99 99 98 96
1990 846,418 26 74 68 17 88 51 61 5 12 7 43 25 1 1 India 2002 1,049,549 28 72 86 24 96 51 82 13 30 7 58 18 18 2
1990 182,117 31 69 71 10 92 26 62 3 46 1 66 2 38 0 Indonesia 2002 217,131 44 56 78 17 89 31 69 5 52 1 71 2 38 0
1990 56,703 56 44 91 84 98 96 83 69 83 4 86 7 78 0 Iran, Islamic Republic of
2002 68,070 66 34 93 87 98 96 83 69 84 13 86 20 78 0
1990 123,537 63 37 100 95 100 98 100 91 100 100 100 Japan 2002 127,478 65 35 100 96 100 98 100 91 100 100 100
1990 16,809 57 43 86 62 96 88 72 27 72 43 87 72 52 4 Kazakhstan 2002 15,469 56 44 86 61 96 88 72 27 72 42 87 72 52 4
1990 72 35 65 48 24 76 46 33 13 25 33 21 0 Kiribati 2002 87 46 54 64 34 77 49 53 22 39 17 59 36 22 0
1990 4,395 38 62 98 Kyrgyz Rep.
2002 5,067 34 66 76 48 98 87 66 28 60 75 51
1990 4,132 15 85 4 0 0 0 Lao People’s Dem. Republic
2002 5,529 20 80 43 8 66 25 38 4 24 0 61 0 14 0
1990 17,845 50 50 96 96 94 98 0 Malaysia
2002 23,965 63 37 95 96 94 64 98 0
1990 216 26 74 99 20 100 78 99 0 100 99 Maldives 2002 309 28 72 84 22 99 76 78 0 58 41 100 99 42 18
1990 44 65 35 96 95 97 75 88 51 Marshall Islands 2002 52 66 34 85 80 95 82 93 59
1990 96 26 74 87 93 85 30 53 21 Micronesia, Fed. States of
2002 108 29 71 94 95 94 28 61 14
1990 2,216 57 43 62 28 87 49 30 1 0 Mongolia
2002 2,559 57 43 62 28 87 49 30 1 59 34 75 61 37 0
1990 40,506 25 75 48 3 73 11 40 1 21 1 39 3 15 0 Myanmar
2002 48,852 29 71 80 8 95 23 74 2 73 1 96 3 63 0
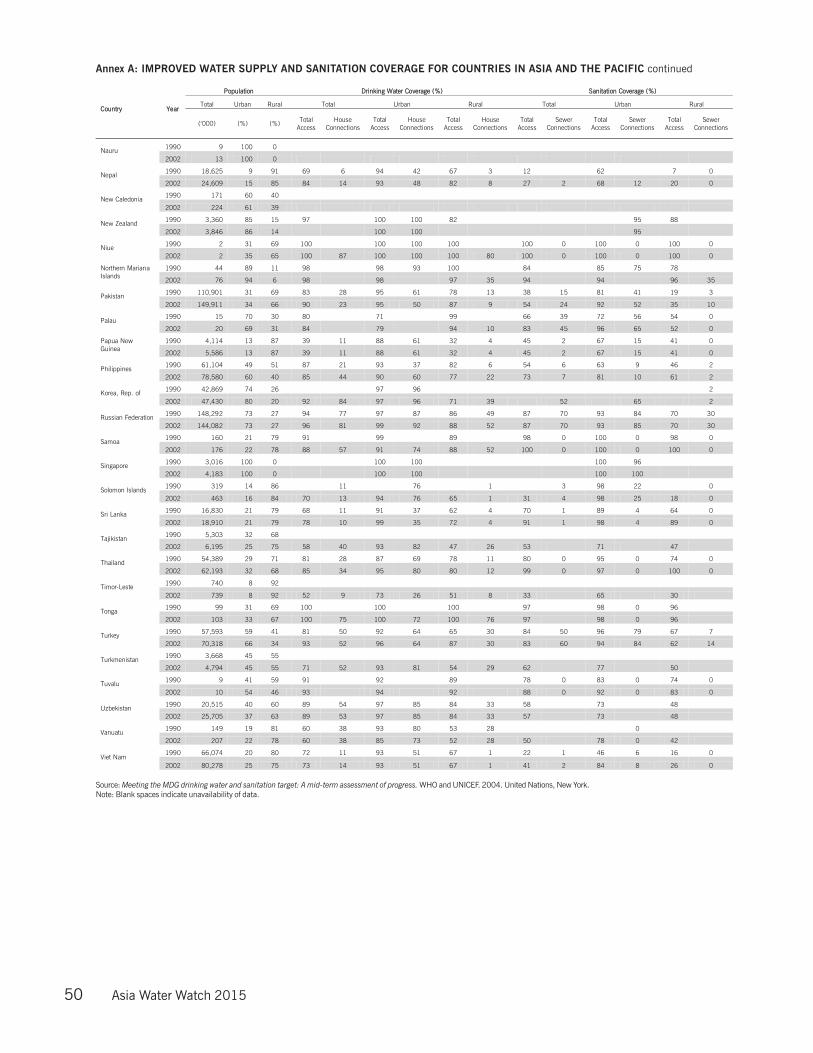
50 Asia Water Watch 2015
Annex A: IMPROVED WATER SUPPLY AND SANITATION COVERAGE FOR COUNTRIES IN ASIA AND THE PACIFIC continued
Source: Meeting the MDG drinking water and sanitation target: A mid-term assessment of progress. WHO and UNICEF. 2004. United Nations, New York.Note: Blank spaces indicate unavailability of data.
Population Drinking Water Coverage (%) Sanitation Coverage (%)
Total Urban Rural Total Urban Rural Total Urban Rural Country Year
(‘000) (%) (%) Total Access
House Connections
Total Access
House Connections
Total Access
House Connections
Total Access
Sewer Connections
Total Access
Sewer Connections
Total Access
Sewer Connections
1990 9 100 0 Nauru 2002 13 100 0
1990 18,625 9 91 69 6 94 42 67 3 12 62 7 0 Nepal 2002 24,609 15 85 84 14 93 48 82 8 27 2 68 12 20 0
1990 171 60 40 New Caledonia
2002 224 61 39
1990 3,360 85 15 97 100 100 82 95 88 New Zealand 2002 3,846 86 14 100 100 95
1990 2 31 69 100 100 100 100 100 0 100 0 100 0 Niue 2002 2 35 65 100 87 100 100 100 80 100 0 100 0 100 0
1990 44 89 11 98 98 93 100 84 85 75 78 Northern Mariana Islands
2002 76 94 6 98 98 97 35 94 94 96 35
1990 110,901 31 69 83 28 95 61 78 13 38 15 81 41 19 3 Pakistan 2002 149,911 34 66 90 23 95 50 87 9 54 24 92 52 35 10
1990 15 70 30 80 71 99 66 39 72 56 54 0 Palau
2002 20 69 31 84 79 94 10 83 45 96 65 52 0
1990 4,114 13 87 39 11 88 61 32 4 45 2 67 15 41 0 Papua New Guinea
2002 5,586 13 87 39 11 88 61 32 4 45 2 67 15 41 0
1990 61,104 49 51 87 21 93 37 82 6 54 6 63 9 46 2 Philippines
2002 78,580 60 40 85 44 90 60 77 22 73 7 81 10 61 2
1990 42,869 74 26 97 96 2 Korea, Rep. of 2002 47,430 80 20 92 84 97 96 71 39 52 65 2
1990 148,292 73 27 94 77 97 87 86 49 87 70 93 84 70 30 Russian Federation 2002 144,082 73 27 96 81 99 92 88 52 87 70 93 85 70 30
1990 160 21 79 91 99 89 98 0 100 0 98 0 Samoa
2002 176 22 78 88 57 91 74 88 52 100 0 100 0 100 0
1990 3,016 100 0 100 100 100 96 Singapore 2002 4,183 100 0 100 100 100 100
1990 319 14 86 11 76 1 3 98 22 0 Solomon Islands
2002 463 16 84 70 13 94 76 65 1 31 4 98 25 18 0
1990 16,830 21 79 68 11 91 37 62 4 70 1 89 4 64 0 Sri Lanka 2002 18,910 21 79 78 10 99 35 72 4 91 1 98 4 89 0
1990 5,303 32 68 Tajikistan 2002 6,195 25 75 58 40 93 82 47 26 53 71 47
1990 54,389 29 71 81 28 87 69 78 11 80 0 95 0 74 0 Thailand 2002 62,193 32 68 85 34 95 80 80 12 99 0 97 0 100 0
1990 740 8 92 Timor-Leste 2002 739 8 92 52 9 73 26 51 8 33 65 30
1990 99 31 69 100 100 100 97 98 0 96 Tonga
2002 103 33 67 100 75 100 72 100 76 97 98 0 96
1990 57,593 59 41 81 50 92 64 65 30 84 50 96 79 67 7 Turkey 2002 70,318 66 34 93 52 96 64 87 30 83 60 94 84 62 14
1990 3,668 45 55 Turkmenistan
2002 4,794 45 55 71 52 93 81 54 29 62 77 50
1990 9 41 59 91 92 89 78 0 83 0 74 0 Tuvalu 2002 10 54 46 93 94 92 88 0 92 0 83 0
1990 20,515 40 60 89 54 97 85 84 33 58 73 48 Uzbekistan 2002 25,705 37 63 89 53 97 85 84 33 57 73 48
1990 149 19 81 60 38 93 80 53 28 0 Vanuatu
2002 207 22 78 60 38 85 73 52 28 50 78 0 42
1990 66,074 20 80 72 11 93 51 67 1 22 1 46 6 16 0 Viet Nam
2002 80,278 25 75 73 14 93 51 67 1 41 2 84 8 26 0
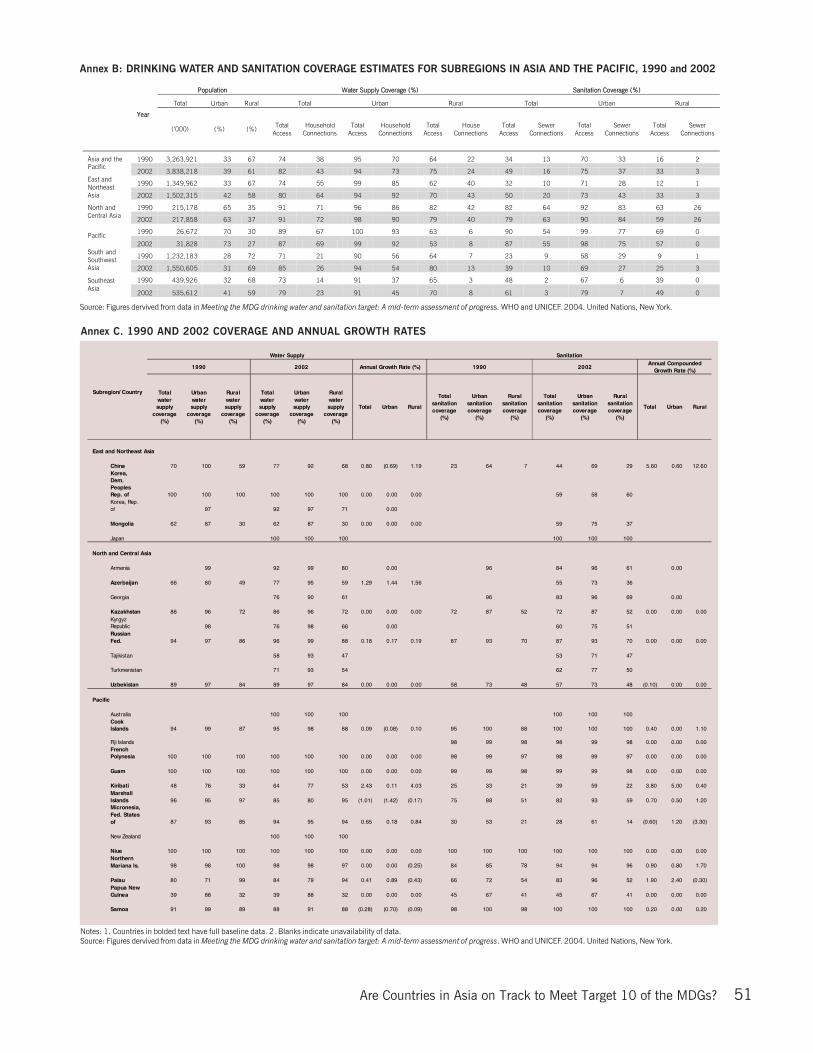
Are Countries in Asia on Track to Meet Target 10 of the MDGs? 51
Annex B: DRINKING WATER AND SANITATION COVERAGE ESTIMATES FOR SUBREGIONS IN ASIA AND THE PACIFIC, 1990 and 2002
Source: Figures dervived from data in Meeting the MDG drinking water and sanitation target: A mid-term assessment of progress. WHO and UNICEF. 2004. United Nations, New York.
Population Water Supply Coverage (%) Sanitation Coverage (%)
Total Urban Rural Total Urban Rural Total Urban Rural
Year
(’000) (%) (%) Total Access
Household Connections
Total Access
Household Connections
Total Access
House Connections
Total Access
Sewer Connections
Total Access
Sewer Connections
Total Access
Sewer Connections
1990 3,263,921 33 67 74 38 95 70 64 22 34 13 70 33 16 2 Asia and the Pacific
2002 3,838,218 39 61 82 43 94 73 75 24 49 16 75 37 33 3
1990 1,349,962 33 67 74 55 99 85 62 40 32 10 71 28 12 1 East and Northeast Asia 2002 1,502,315 42 58 80 64 94 92 70 43 50 20 73 43 33 3
1990 215,178 65 35 91 71 96 86 82 42 82 64 92 83 63 26 North and Central Asia
2002 217,858 63 37 91 72 98 90 79 40 79 63 90 84 59 26
1990 26,672 70 30 89 67 100 93 63 6 90 54 99 77 69 0 Pacific 2002 31,828 73 27 87 69 99 92 53 8 87 55 98 75 57 0
1990 1,232,183 28 72 71 21 90 56 64 7 23 9 58 29 9 1 South and Southwest Asia 2002 1,550,605 31 69 85 26 94 54 80 13 39 10 69 27 25 3
1990 439,926 32 68 73 14 91 37 65 3 48 2 67 6 39 0 Southeast Asia
2002 535,612 41 59 79 23 91 45 70 8 61 3 79 7 49 0
Annex C. 1990 AND 2002 COVERAGE AND ANNUAL GROWTH RATES
Notes: 1. Countries in bolded text have full baseline data. 2. Blanks indicate unavailability of data.Source: Figures dervived from data in Meeting the MDG drinking water and sanitation target: A mid-term assessment of progress. WHO and UNICEF. 2004. United Nations, New York.
Water Supply Sanitation
1990 2002 Annual Growth Rate (%) 1990 2002 Annual Compounded
Growth Rate (%)
Subregion/ Country Total water supply
coverage (%)
Urban water supply
coverage (%)
Rural water supply
coverage (%)
Total water supply
coverage (%)
Urban water supply
coverage (%)
Rural water supply
coverage (%)
Total Urban Rural
Total sanitation coverage
(%)
Urban sanitation coverage
(%)
Rural sanitation coverage
(%)
Total sanitation coverage
(%)
Urban sanitation coverage
(%)
Rural sanitation coverage
(%)
Total Urban Rural
East and Northeast Asia
China 70 100 59 77 92 68 0.80 (0.69) 1.19 23 64 7 44 69 29 5.60 0.60 12.60
Korea, Dem. Peoples Rep. of 100 100 100 100 100 100 0.00 0.00 0.00 59 58 60
Korea, Rep. of 97 92 97 71 0.00
Mongolia 62 87 30 62 87 30 0.00 0.00 0.00 59 75 37
Japan 100 100 100 100 100 100
North and Central Asia
Armenia 99 92 99 80 0.00 96 84 96 61 0.00
Azerbaijan 66 80 49 77 95 59 1.29 1.44 1.56 55 73 36
Georgia 76 90 61 96 83 96 69 0.00
Kazakhstan 86 96 72 86 96 72 0.00 0.00 0.00 72 87 52 72 87 52 0.00 0.00 0.00
Kyrgyz Republic 98 76 98 66 0.00 60 75 51
Russian Fed. 94 97 86 96 99 88 0.18 0.17 0.19 87 93 70 87 93 70 0.00 0.00 0.00
Tajikistan 58 93 47 53 71 47
Turkmenistan 71 93 54 62 77 50
Uzbekistan 89 97 84 89 97 84 0.00 0.00 0.00 58 73 48 57 73 48 (0.10) 0.00 0.00
Pacific
Australia 100 100 100 100 100 100
Cook Islands 94 99 87 95 98 88 0.09 (0.08) 0.10 95 100 88 100 100 100 0.40 0.00 1.10
Fiji Islands 98 99 98 98 99 98 0.00 0.00 0.00
French Polynesia 100 100 100 100 100 100 0.00 0.00 0.00 98 99 97 98 99 97 0.00 0.00 0.00
Guam 100 100 100 100 100 100 0.00 0.00 0.00 99 99 98 99 99 98 0.00 0.00 0.00
Kiribati 48 76 33 64 77 53 2.43 0.11 4.03 25 33 21 39 59 22 3.80 5.00 0.40
Marshall Islands 96 95 97 85 80 95 (1.01) (1.42) (0.17) 75 88 51 82 93 59 0.70 0.50 1.20
Micronesia, Fed. States of 87 93 85 94 95 94 0.65 0.18 0.84 30 53 21 28 61 14 (0.60) 1.20 (3.30)
New Zealand 100 100 100
Niue 100 100 100 100 100 100 0.00 0.00 0.00 100 100 100 100 100 100 0.00 0.00 0.00
Northern Mariana Is. 98 98 100 98 98 97 0.00 0.00 (0.25) 84 85 78 94 94 96 0.90 0.80 1.70
Palau 80 71 99 84 79 94 0.41 0.89 (0.43) 66 72 54 83 96 52 1.90 2.40 (0.30)
Papua New Guinea 39 88 32 39 88 32 0.00 0.00 0.00 45 67 41 45 67 41 0.00 0.00 0.00
Samoa 91 99 89 88 91 88 (0.28) (0.70) (0.09) 98 100 98 100 100 100 0.20 0.00 0.20
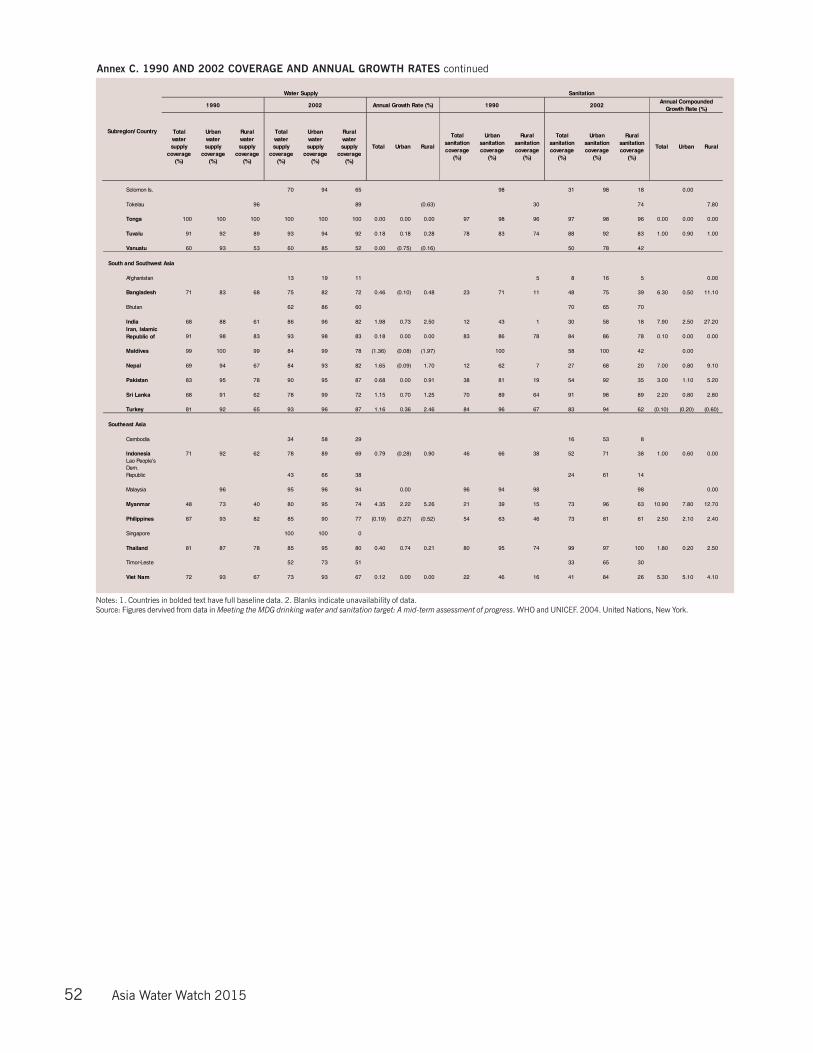
52 Asia Water Watch 2015
Annex C. 1990 AND 2002 COVERAGE AND ANNUAL GROWTH RATES continued
Notes: 1. Countries in bolded text have full baseline data. 2. Blanks indicate unavailability of data.Source: Figures dervived from data in Meeting the MDG drinking water and sanitation target: A mid-term assessment of progress. WHO and UNICEF. 2004. United Nations, New York.
Solomon Is. 70 94 65 98 31 98 18 0.00
Tokelau 96 89 (0.63) 30 74 7.80
Tonga 100 100 100 100 100 100 0.00 0.00 0.00 97 98 96 97 98 96 0.00 0.00 0.00
Tuvalu 91 92 89 93 94 92 0.18 0.18 0.28 78 83 74 88 92 83 1.00 0.90 1.00
Vanuatu 60 93 53 60 85 52 0.00 (0.75) (0.16) 50 78 42
South and Southwest Asia
Afghanistan 13 19 11 5 8 16 5 0.00
Bangladesh 71 83 68 75 82 72 0.46 (0.10) 0.48 23 71 11 48 75 39 6.30 0.50 11.10
Bhutan 62 86 60 70 65 70
India 68 88 61 86 96 82 1.98 0.73 2.50 12 43 1 30 58 18 7.90 2.50 27.20
Iran, Islamic Republic of 91 98 83 93 98 83 0.18 0.00 0.00 83 86 78 84 86 78 0.10 0.00 0.00
Maldives 99 100 99 84 99 78 (1.36) (0.08) (1.97) 100 58 100 42 0.00
Nepal 69 94 67 84 93 82 1.65 (0.09) 1.70 12 62 7 27 68 20 7.00 0.80 9.10
Pakistan 83 95 78 90 95 87 0.68 0.00 0.91 38 81 19 54 92 35 3.00 1.10 5.20
Sri Lanka 68 91 62 78 99 72 1.15 0.70 1.25 70 89 64 91 98 89 2.20 0.80 2.80
Turkey 81 92 65 93 96 87 1.16 0.36 2.46 84 96 67 83 94 62 (0.10) (0.20) (0.60)
Southeast Asia
Cambodia 34 58 29 16 53 8
Indonesia 71 92 62 78 89 69 0.79 (0.28) 0.90 46 66 38 52 71 38 1.00 0.60 0.00
Lao People’s Dem. Republic 43 66 38 24 61 14
Malaysia 96 95 96 94 0.00 96 94 98 98 0.00
Myanmar 48 73 40 80 95 74 4.35 2.22 5.26 21 39 15 73 96 63 10.90 7.80 12.70
Philippines 87 93 82 85 90 77 (0.19) (0.27) (0.52) 54 63 46 73 81 61 2.50 2.10 2.40
Singapore 100 100 0
Thailand 81 87 78 85 95 80 0.40 0.74 0.21 80 95 74 99 97 100 1.80 0.20 2.50
Timor-Leste 52 73 51 33 65 30
Viet Nam 72 93 67 73 93 67 0.12 0.00 0.00 22 46 16 41 84 26 5.30 5.10 4.10
Water Supply Sanitation
1990 2002 Annual Growth Rate (%) 1990 2002 Annual Compounded
Growth Rate (%)
Subregion/ Country Total water supply
coverage (%)
Urban water supply
coverage (%)
Rural water supply
coverage (%)
Total water supply
coverage (%)
Urban water supply
coverage (%)
Rural water supply
coverage (%)
Total Urban Rural
Total sanitation coverage
(%)
Urban sanitation coverage
(%)
Rural sanitation coverage
(%)
Total sanitation coverage
(%)
Urban sanitation coverage
(%)
Rural sanitation coverage
(%)
Total Urban Rural

Are Countries in Asia on Track to Meet Target 10 of the MDGs? 53
Annex E. NUMBER OF DIARRHEA CASES AVERTED PER YEAR, 2000 (in million)
Intervention 1 Intervention 2 Intervention 3 Intervention 4
East and Northeast Asia 108.4 216.8 557.5 836.2
North and Central Asia 3.9 7.9 30.7 49.4
Pacific 0.8 1.6 3.8 5.5
South and Southwest Asia 137.6 275.2 718.5 1,081.0
Southeast Asia 24.6 49.2 150.7 233.8
Total 275.4 550.7 1,461.1 2,205.9
Annex D. ECONOMIC VALUE OF TIME SAVINGS FROM IMPROVED WATER SUPPLY AND SANITATION, 2000 (amounts in $ million)
Source: Hutton, G. and L. Haller. Evaluation of the Costs and Benefits of Water and Sanitation Improvement at the Global Level. Geneva: World Health Organization, 2004. (WHO/SDE/WSH/4.04)Note: Figures may not add up due to rounding.
Value of Productive Days Gained due to Less Illness at Minimum Wage (15–60 age group)
Intervention 1 Intervention 2 Intervention 3 Intervention 4
East and Northeast Asia 205.9 412.0 1,113.9 1,688.3
North and Central Asia 4.5 9.0 32.8 52.3
Pacific 1.3 2.6 5.9 8.6
South and Southwest Asia 91.8 183.6 521.0 797.0
Southeast Asia 20.0 39.9 147.3 235.2
Total 323.5 646.9 1,820.9 2,781.5
Value of Time Gain per Year due to Closer Access to WSS Facilities
Intervention 1 Intervention 2 Intervention 3 Intervention 4
East and Northeast Asia 17,916.2 35,832.3 35,832.3 61,356.7
North and Central Asia 1,582.2 3,164.5 3,164.5 6,857.7
Pacific 345.9 691.9 691.9 1,716.3
South and Southwest Asia 27,525.4 55,050.8 55,050.8 119,244.0
Southeast Asia 6,884.8 13,769.6 13,769.6 52,254.8
Total 54,254.6 108,509.1 108,509.1 241,429.5
Source: Hutton, G. and L. Haller. Evaluation of the Costs and Benefits of Water and Sanitation Improvement at the Global Level. Geneva: World Health Organization, 2004. (WHO/SDE/WSH/4.04)Note: Figures may not add up due to rounding.
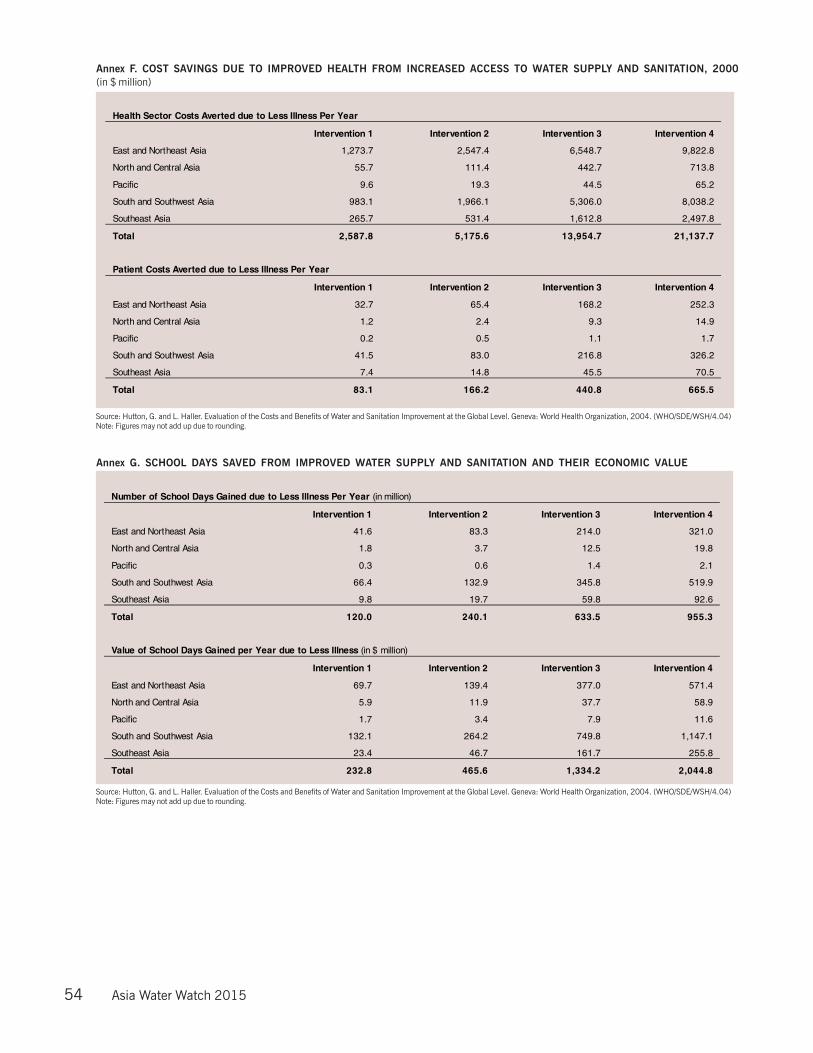
54 Asia Water Watch 2015
Annex G. SCHOOL DAYS SAVED FROM IMPROVED WATER SUPPLY AND SANITATION AND THEIR ECONOMIC VALUE
Number of School Days Gained due to Less Illness Per Year (in million)
Intervention 1 Intervention 2 Intervention 3 Intervention 4
East and Northeast Asia 41.6 83.3 214.0 321.0
North and Central Asia 1.8 3.7 12.5 19.8
Pacific 0.3 0.6 1.4 2.1
South and Southwest Asia 66.4 132.9 345.8 519.9
Southeast Asia 9.8 19.7 59.8 92.6
Total 120.0 240.1 633.5 955.3
Value of School Days Gained per Year due to Less Illness (in $ million)
Intervention 1 Intervention 2 Intervention 3 Intervention 4
East and Northeast Asia 69.7 139.4 377.0 571.4
North and Central Asia 5.9 11.9 37.7 58.9
Pacific 1.7 3.4 7.9 11.6
South and Southwest Asia 132.1 264.2 749.8 1,147.1
Southeast Asia 23.4 46.7 161.7 255.8
Total 232.8 465.6 1,334.2 2,044.8
Annex F. COST SAVINGS DUE TO IMPROVED HEALTH FROM INCREASED ACCESS TO WATER SUPPLY AND SANITATION, 2000(in $ million)
Health Sector Costs Averted due to Less Illness Per Year
Intervention 1 Intervention 2 Intervention 3 Intervention 4
East and Northeast Asia 1,273.7 2,547.4 6,548.7 9,822.8
North and Central Asia 55.7 111.4 442.7 713.8
Pacific 9.6 19.3 44.5 65.2
South and Southwest Asia 983.1 1,966.1 5,306.0 8,038.2
Southeast Asia 265.7 531.4 1,612.8 2,497.8
Total 2,587.8 5,175.6 13,954.7 21,137.7
Patient Costs Averted due to Less Illness Per Year
Intervention 1 Intervention 2 Intervention 3 Intervention 4
East and Northeast Asia 32.7 65.4 168.2 252.3
North and Central Asia 1.2 2.4 9.3 14.9
Pacific 0.2 0.5 1.1 1.7
South and Southwest Asia 41.5 83.0 216.8 326.2
Southeast Asia 7.4 14.8 45.5 70.5
Total 83.1 166.2 440.8 665.5
Source: Hutton, G. and L. Haller. Evaluation of the Costs and Benefits of Water and Sanitation Improvement at the Global Level. Geneva: World Health Organization, 2004. (WHO/SDE/WSH/4.04)Note: Figures may not add up due to rounding.
Source: Hutton, G. and L. Haller. Evaluation of the Costs and Benefits of Water and Sanitation Improvement at the Global Level. Geneva: World Health Organization, 2004. (WHO/SDE/WSH/4.04)Note: Figures may not add up due to rounding.