Embed Size (px)
Citation preview
ASIAN DEVELOPMENT BANK PCR: PHI 19178
PROJECT COMPLETION REPORT
ON THE
SECOND MANILA PORT PROJECT(Loan No. 875-PHI)
IN THE
PHILIPPINES
September 1997
P1.00$1.00 I
CAGRCPACSCEIRRFIRRIACSRRICBIDCMICTMISNHOGCCO&MPPAPPARROROSHTA
IDead Weight TonGross Registered TonTwenty-foot Equivalent Unit
DWTGRTTEU
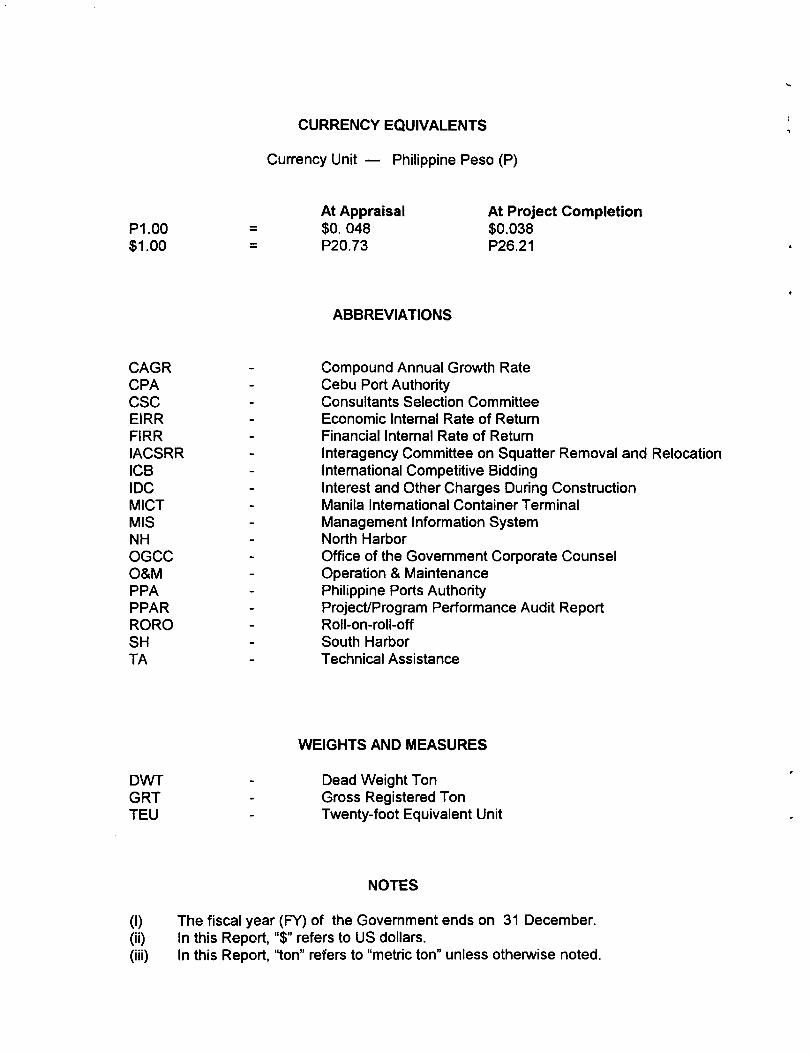
CURRENCY EQUIVALENTS
Currency Unit - Philippine Peso (P)
At Appraisal At Project Completion$0. 048 $0.038P20.73 P26.21
ABBREVIATIONS
Compound Annual Growth RateCebu Port AuthorityConsultants Selection CommitteeEconomic Internal Rate of ReturnFinancial Internal Rate of ReturnInteragency Committee on Squatter Removal and RelocationInternational Competitive BiddingInterest and Other Charges During ConstructionManila International Container TerminalManagement Information SystemNorth HarborOffice of the Government Corporate CounselOperation & MaintenancePhilippine Ports AuthorityProject/Program Performance Audit ReportRoll-on-roll-offSouth HarborTechnical Assistance
WEIGHTS AND MEASURES
NOTES
(I) The fiscal year (FY) of the Government ends on 31 December.(ii) In this Report, "$" refers to US dollars.(iii) In this Report, "ton" refers to "metric ton" unless otherwise noted.
CONTENTS
Page
BASIC DATA il-v
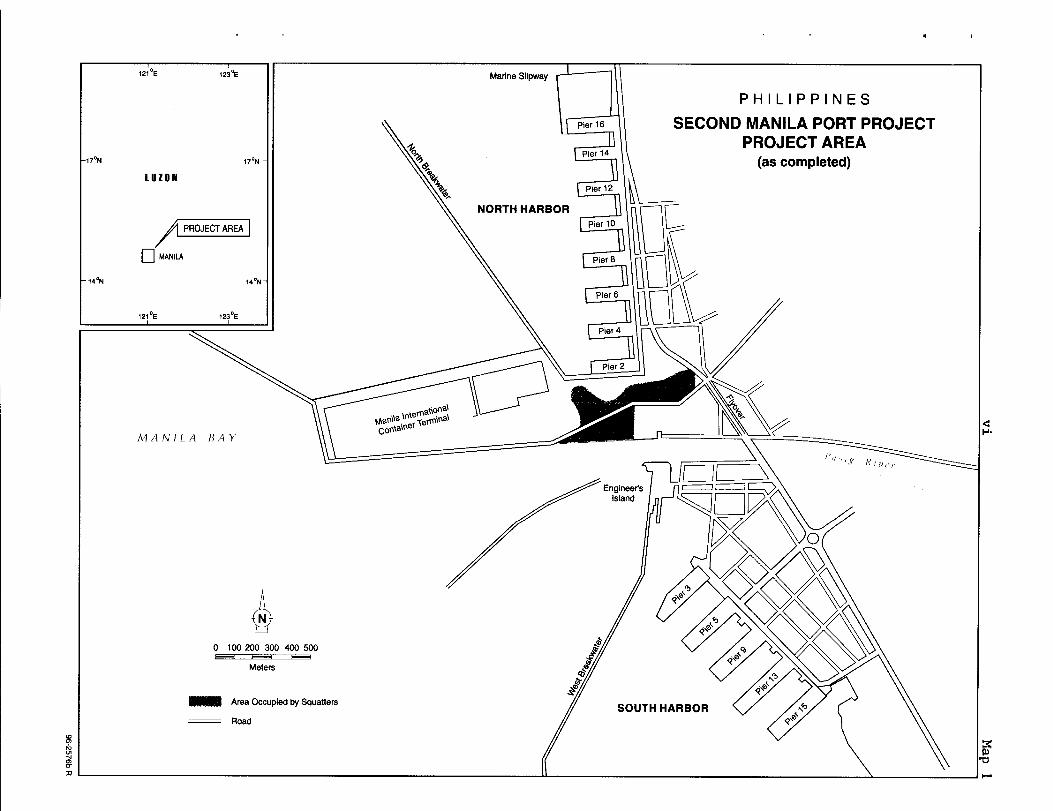
MAPS
Map 1 Project Area viMap 2 Manila North Harbor Rehabilitation viiMap 3 Manila South Harbor Rehabilitation viii
I. PROJECT DESCRIPTION 1
EVALUATION OF IMPLEMENTATION
A. Project Components 2B. Implementation Arrangements 3C. Project Costs 3D. Project Schedule 4E. Engagement of Consultants and Procurement of Goods and Services 5F. Performance of Consultants, Contractors, and Suppliers 5G. Conditions and Covenants 6H. Disbursements 6I. Environmental Impact 7J. Performance of the Borrower and the Executing Agency 7K. Performance of the Bank 9
Ill. EVALUATION OF INITIAL PERFORMANCE AND BENEFITS
A. Traffic Reevaluation 9B. Financial Performance of PPA 11C. Financial Reevaluation of the Project 120. Economic Reevaluation of the Project 13E. Attainment of Benefits 14
IV. CONCLUSIONS AND RECOMMENDATIONS
A. Conclusions 14B. Recommendations 15
APPENDIXES 17
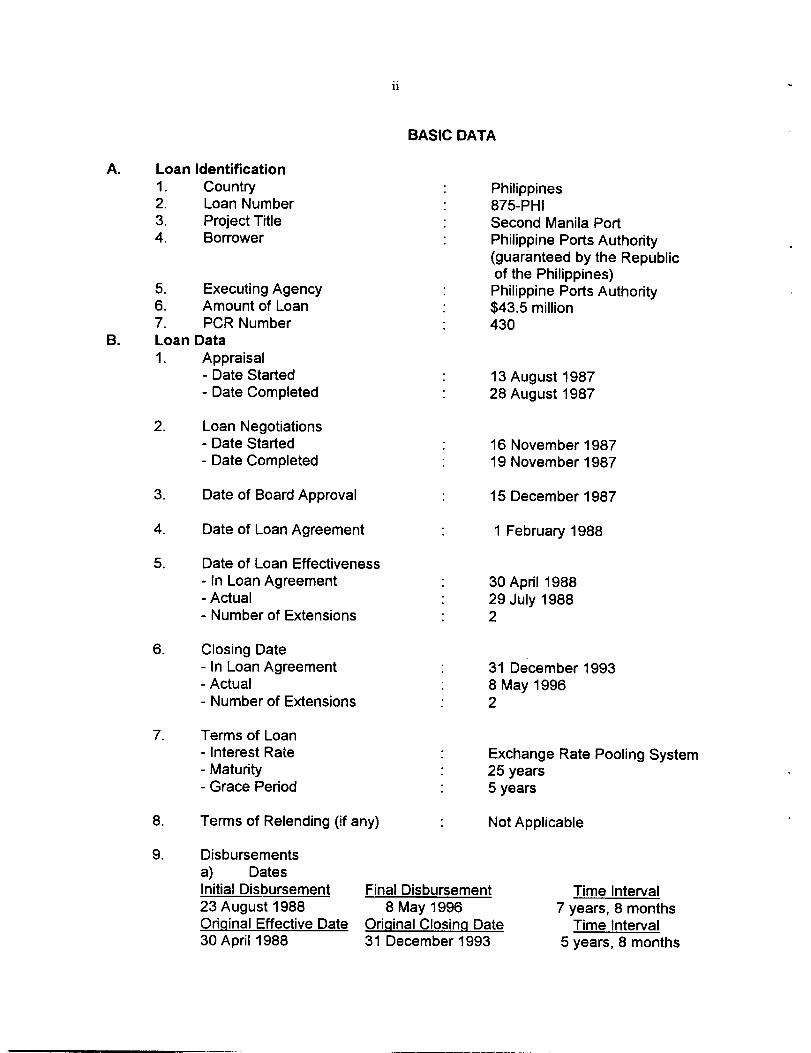
A. Loan Identification1. Country2. Loan Number3. Project Title4. Borrower
Philippines875-PHISecond Manila PortPhilippine Ports Authority(guaranteed by the Republicof the Philippines)
11
BASIC DATA
5. Executing Agency : Philippine Ports Authority6. Amount of Loan : $43.5 million7. PCR Number : 430
B. Loan Data1. Appraisal
- Date Started 13 August 1987- Date Completed : 28 August 1987
2. Loan Negotiations- Date Started : 16 November 1987- Date Completed : 19 November 1987
3. Date of Board Approval : 15 December 1987
4. Date of Loan Agreement : 1 February 1988
5. Date of Loan Effectiveness- In Loan Agreement : 30 April 1988- Actual : 29 July 1988- Number of Extensions : 2
6. Closing Date- In Loan Agreement : 31 December 1993-Actual : 8May 1996- Number of Extensions : 2
7. Terms of Loan- Interest Rate Exchange Rate Pooling System- Maturity 25 years- Grace Period : 5 years
8. Terms of Relending (if any) : Not Applicable
9. Disbursementsa) DatesInitial Disbursement Final Disbursement ___________23 August 1988 8 May 1996Orig inal Effective Date Ori ginal Closing Date ___________30 April 1988 31 December 1993
Time Interval7 years, 8 months
Time Interval5 years, 8 months
Total
41.7143.08
84.79
- 3,34
6.37 6.37
6.37 9.71
- 3.34- 6.37
- 9.71
111
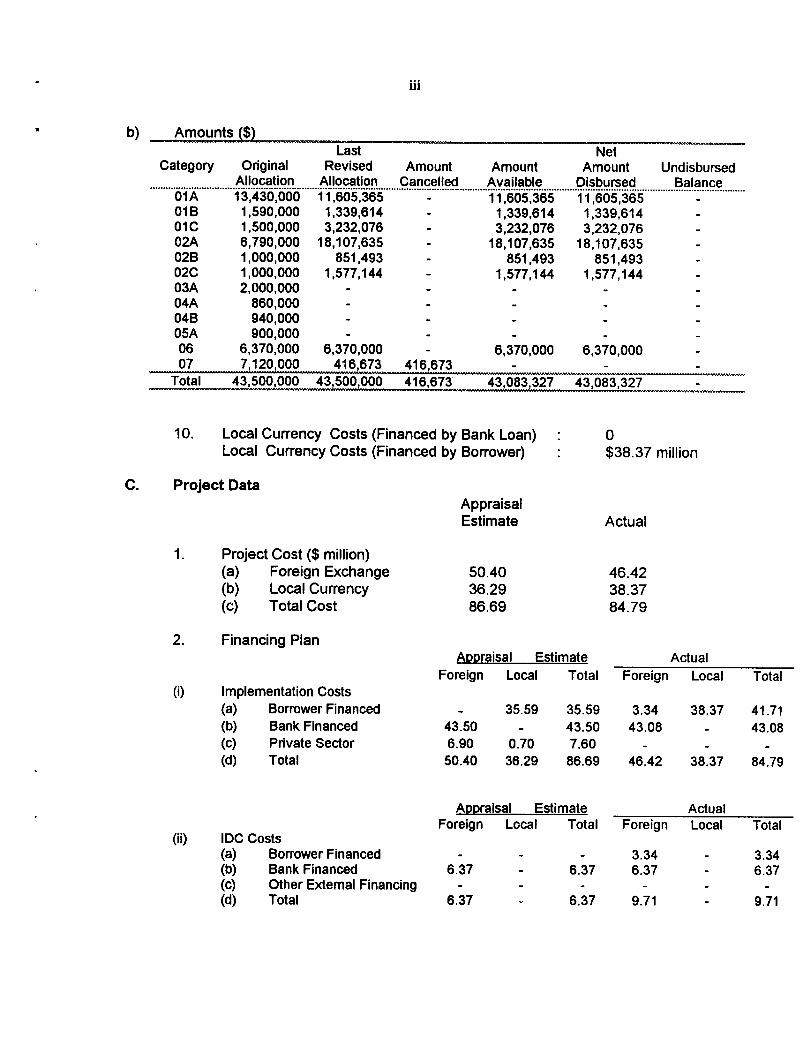
b) Amounts ($)Last Net
Category Original Revised Amount Amount Amount UndisbursedAllocation Allocation Cancelled Available Disbursed Balance
O1A 13,430,000 11,605,365 - 11,605,365 11,605,365 -OIB 1,590,000 1,339,614 - 1,339,614 1,339,614 -O1C 1,500,000 3,232,076 - 3,232,076 3,232,076 -02A 6,790,000 18,107,635 - 18,107,635 18,107,635 -02B 1,000,000 851,493 - 851,493 851,493 -02C 1,000,000 1,577,144 - 1,577,144 1,577,144 -03A 2,000,000 - - - - -04A 860,000 - - - - -04B 940,000 - - - - -05A 900,000 - - - - -06 6,370,000 6,370,000 - 6,370,000 6,370,000 -07 7,120,000 416,673 416,673 - - -
Total 43,500,000 43,500,000 416,673 43,083,327 43,083,327 -
10. Local Currency Costs (Financed by Bank Loan)Local Currency Costs (Financed by Borrower)
C. Project DataAppraisalEstimate
0$38.37 million
Actual
1. Project Cost ($ million)(a) Foreign Exchange
50.40
46.42(b) Local Currency
36.29
38.37(C) Total Cost
86.69
84.79
2. Financing PlanAøDraisal Estimate Actual
Foreign Local Total Foreign Local(i) Implementation Costs
(a) Borrower Financed - 35.59 35.59 3.34 38.37(b) Bank Financed
43.50 - 43.50 43.08 -(c) Private Sector
6.90 0.70 7.60 - -(d) Total
50.40 36,29 86.69 46.42 38.37
ADpraisal Estimate ActualForeign Local Total Foreign Local
(ii) IDC Costs(a) Borrower Financed - -(b) Bank Financed 6.37 -(C) Other External Financing - -(d) Total 6.37
Total
4
Project ScheduleAppraisalEstimate Actual
iv
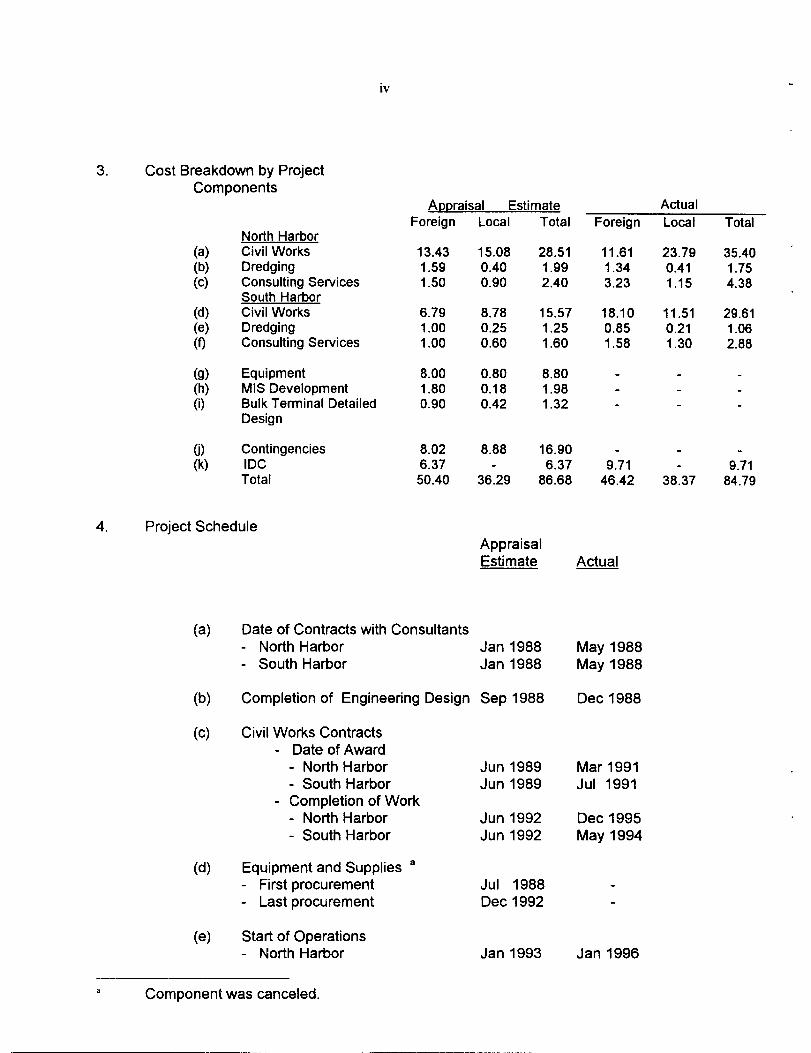
Cost Breakdown by ProjectComponents
North Harbor(a) Civil Works(b) Dredging(C) Consulting Services
South Harbor(d) Civil Works(e) Dredging(f) Consulting Services
(g) Equipment(h) MIS Development(i) Bulk Terminal Detailed
Design
(j) Contingencies(k) IDC
Total
Appraisal Estimate ActualForeign Local Total Foreign Local Total
13.43 15.08 28.51 11.61 23.79 35.40
1.59 0.40 1.99 1.34 0.41 1.75
1.50 0.90 2.40 3.23 1.15 4.38
6.79 8.78 15.57 18.10 11.51 29.61
1.00 0.25 1.25 0.85 0.21 1.06
1.00 0.60 1.60 1.58 1.30 2.88
8.00 0.80 8.80 - - -
1.80 0.18 1.98 - - -
0.90 0.42 1.32 - - -
8.02 8.88 16.90 - - -
6.37 - 6.37 9.71 - 9.71
50.40 36.29 86.68 46.42 38.37 84.79
(a) Date of Contracts with Consultants- North Harbor Jan 1988- South Harbor Jan 1988
(b) Completion of Engineering Design Sep 1988
(C) Civil Works Contracts- Date of Award
- North Harbor Jun 1989- South Harbor Jun 1989
- Completion of Work- North Harbor Jun 1992- South Harbor Jun 1992
(d) Equipment and Supplies a- First procurement Jul 1988- Last procurement Dec 1992
(e) Start of Operations- North Harbor Jan 1993
May 1988May 1988
Dec 1988
Mar 1991Jul 1991
Dec 1995May 1994
I
Jan 1996
a Component was canceled.
Type of Mission No. ofPersons
Person-days Specializationof Members a
Date
3
455
957
1122
162
142
62
8I
6I
21
42
6I
31
34
47
V
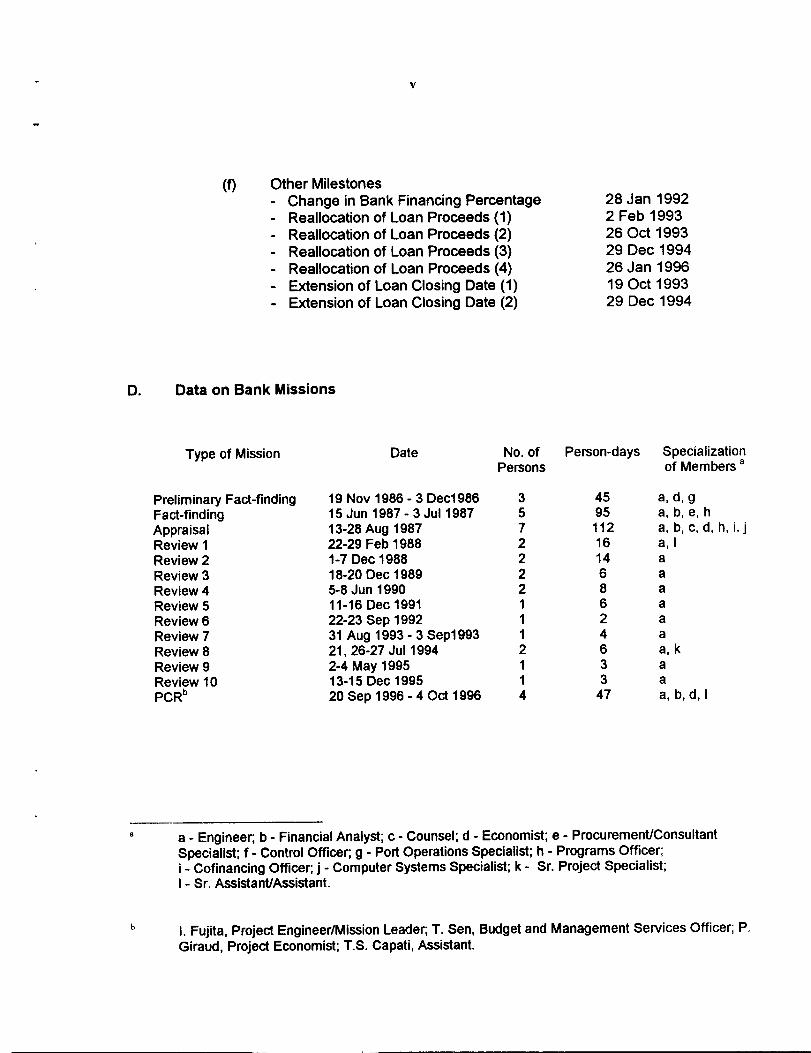
(f) Other Milestones- Change in Bank Financing Percentage- Reallocation of Loan Proceeds (1)- Reallocation of Loan Proceeds (2)- Reallocation of Loan Proceeds (3)- Reallocation of Loan Proceeds (4)- Extension of Loan Closing Date (I)- Extension of Loan Closing Date (2)
28 Jan 19922 Feb 199326 Oct 199329 Dec 199426 Jan 199619 Oct 199329 Dec 1994
D. Data on Bank Missions
Preliminary Fact-findingFact-findingAppraisalReview IReview 2Review 3Review 4Review 5Review 6Review 7Review 8Review 9Review 10PCRb
19 Nov 1986-3 Dec198615 Jun 1987-3Jul 198713-28 Aug 198722-29 Feb 19881-7 Dec 198818-20 Dec 19895-8 Jun 199011-16 Dec 199122-23 Sep 199231 Aug 1993-3 Sep199321, 26-27 Jut 19942-4 May 199513-15 Dec 199520 Sep 1996 - 4 Oct 1996
a, d, ga, b, e, ha, b, c, d, h, i.a, I
aaa, kaaa, b, d, I
a - Engineer; b - Financial Analyst; c - Counsel; d - Economist; e - Procurement/ConsultantSpecialist; f - Control Officer; g - Port Operations Specialist; h - Programs Officer;- Cofinancing Officer, j - Computer Systems Specialist; k - Sr. Project Specialist;- Sr. Assistant/Assistant.
I. Fujita, Project Engineer/Mission Leader; T. Sen. Budget and Management Services Officer; P.Giraud, Project Economist; T.S. Capati, Assistant.
123°C
17°N -I
LUZON
PROJECT AREA
[11 MANILA
-14°N
MANILA BAY
Io 100200300400500- - -
Meters
Area Occupied by Squatters
Road
11
C,a
/
/
SOUTH HARBOR
EngineeIsland
1g
Marine Slipway
PHILIPPINES
Pier 16 SECOND MANILA PORT PROJECTPROJECT AREA
Pier 14 1
\ (as completed)
pier 12
NORTH HARBOR pIer 10
Pier 8
pier6
er2
nati0afl1atnteTlnal
Conta I-I.
II
I/
/I
/I
I/
Depth-BOrn
(31-4C,
PHILIPPINES
SECOND MANILA PORT PROJECTMANILA NORTH HARBOR REHABILITATION
(as completed)
•1
\\ IManila International \ \ Depth /Container Terminal \ \ -6Om
J
PIER 2 PIER 4 PIER 6 PIER 8 PIER 10 PIER 12 PIER 14 ] _______________
____________ _____________________________________________________
____________
____LI__ __ __E 1 1
SLIP 3 ri SLIP 5 SLIP 7 SLIP 9 SLIP 11 SLIP 13 ______________
Ii 11 II 1b II ii
GATE 2_____________________________________________________ L__-- [iE
GATE1 ROAD 10
-i r
Ad.5r
New Facilities (Berth,Breaater)
Lull Container Slacking Yard
L New Road
[ Repavement0 100 200 300 400 500E•" Area Occupied by Squatters
Meters - - - - Bottom Contour
I-'I-'
0 100 200 300 400 500I_I
Meters
UII
PIER 9 PIER 5PIER15 I PIER 3 Rehabilitated Shed
Rehabilitation
Pavement
Trench Leveling
Demolished Shade
-J.
Ii
CONTAINERSTACKING YARD
(CV - 1)
ii
N)
0)
PHILIPPINESSECOND MANILA PORT PROJECT
MANILA SOUTH HARBOR REHABILITATION(as completed)
PIER 13
_Em 1[1(CY2) _L ___
CONTAINER
ISTACKINGYARD I
urn
(-))
I. PROJECT DESCRIPTION
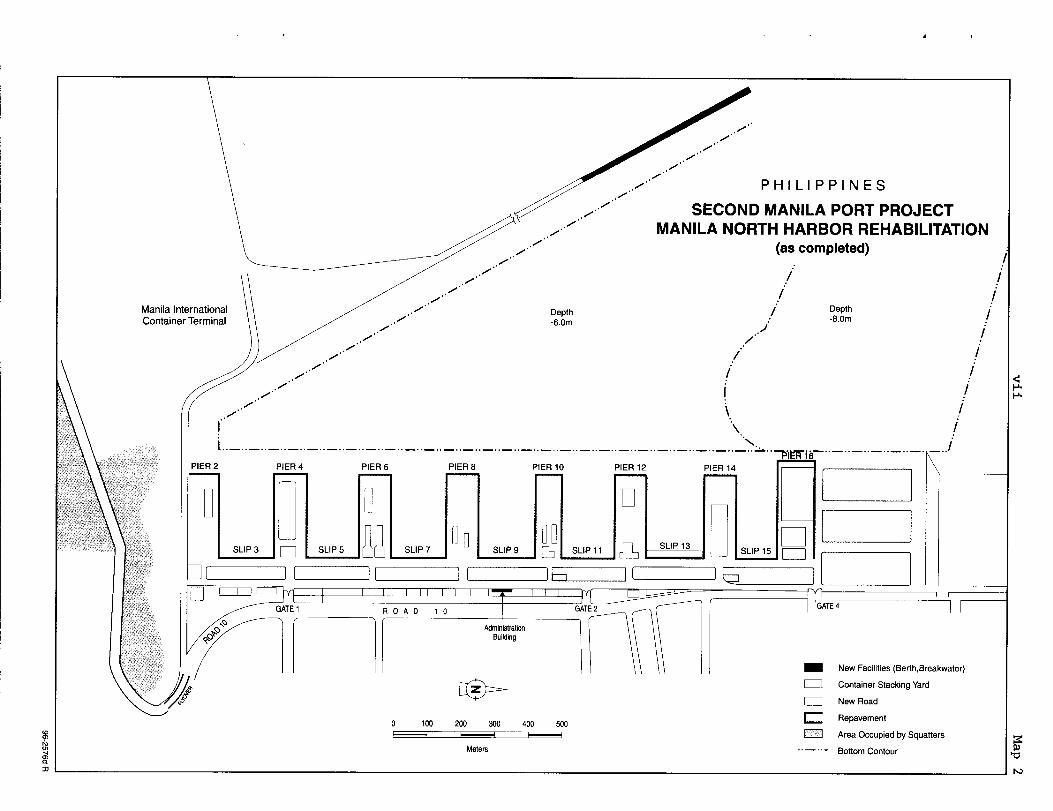
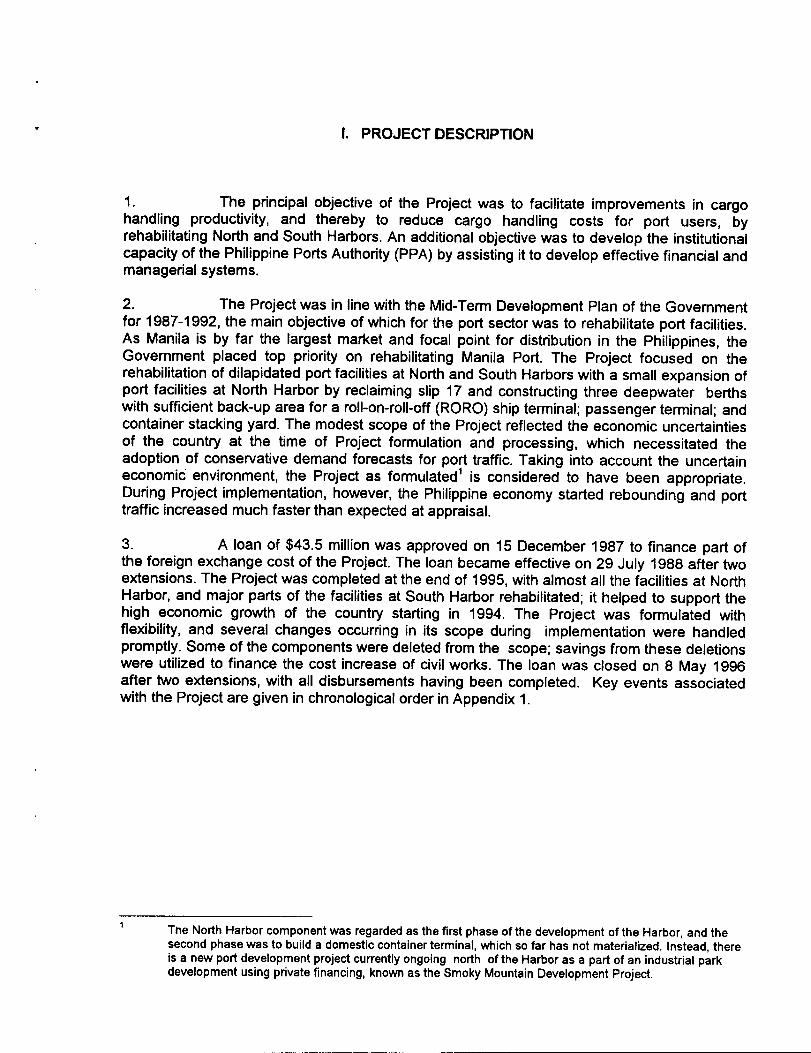
1. The principal objective of the Project was to facilitate improvements in cargohandling productivity, and thereby to reduce cargo handling costs for port users, byrehabilitating North and South Harbors. An additional objective was to develop the institutionalcapacity of the Philippine Ports Authority (PPA) by assisting it to develop effective financial andmanagerial systems.
2. The Project was in line with the Mid-Term Development Plan of the Governmentfor 1987-1992, the main objective of which for the port sector was to rehabilitate port facilities.As Manila is by far the largest market and focal point for distribution in the Philippines, theGovernment placed top priority on rehabilitating Manila Port. The Project focused on therehabilitation of dilapidated port facilities at North and South Harbors with a small expansion ofport facilities at North Harbor by reclaiming slip 17 and constructing three deepwater berthswith sufficient back-up area for a roll-on-roll-off (RORO) ship terminal; passenger terminal; andcontainer stacking yard. The modest scope of the Project reflected the economic uncertaintiesof the country at the time of Project formulation and processing, which necessitated theadoption of conservative demand forecasts for port traffic. Taking into account the uncertaineconomic environment, the Project as formulated 1 is considered to have been appropriate.During Project implementation, however, the Philippine economy started rebounding and porttraffic increased much faster than expected at appraisal.
3. A loan of $43.5 million was approved on 15 December 1987 to finance part ofthe foreign exchange cost of the Project. The loan became effective on 29 July 1988 after twoextensions. The Project was completed at the end of 1995, with almost all the facilities at NorthHarbor, and major parts of the facilities at South Harbor rehabilitated; it helped to support thehigh economic growth of the country starting in 1994. The Project was formulated withflexibility, and several changes occurring in its scope during implementation were handledpromptly. Some of the components were deleted from the scope; savings from these deletionswere utilized to finance the cost increase of civil works. The loan was closed on 8 May 1996after two extensions, with all disbursements having been completed. Key events associatedwith the Project are given in chronological order in Appendix 1.
The North Harbor component was regarded as the first phase of the development of the Harbor, and thesecond phase was to build a domestic container terminal, which so far has not materialized. Instead, thereis a new port development project currently ongoing north of the Harbor as a part of an industrial parkdevelopment using private financing, known as the Smoky Mountain Development Project.
2
II. EVALUATION OF IMPLEMENTATION
A. Project Components
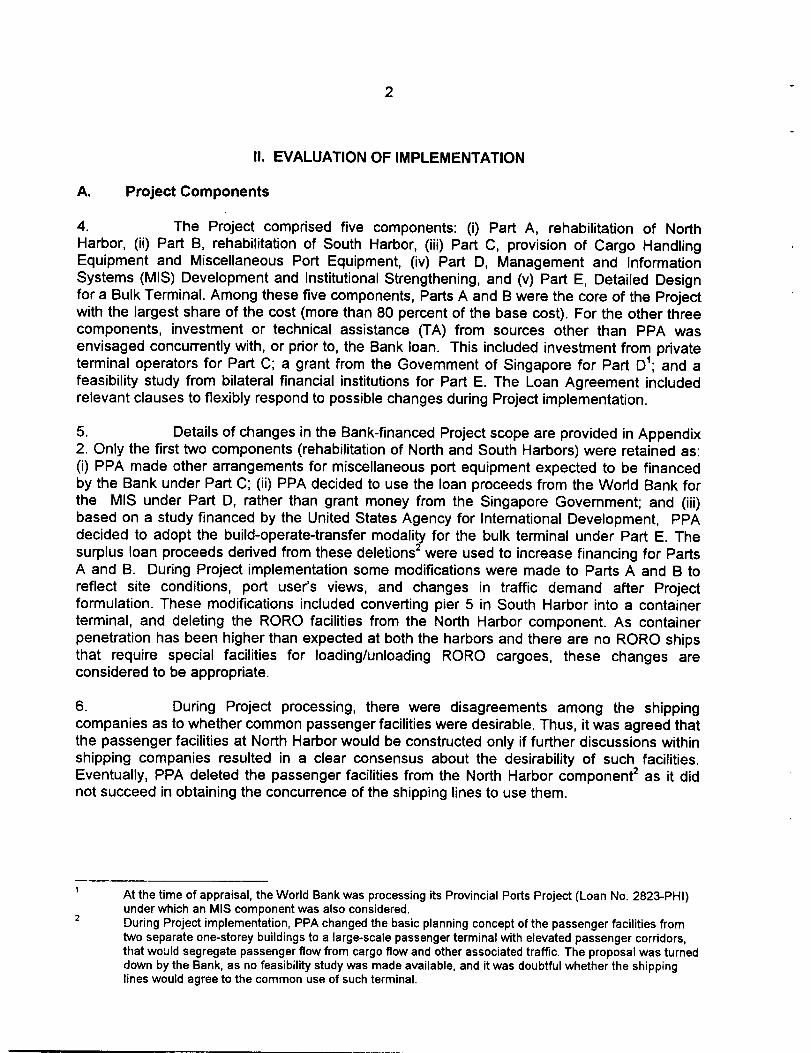
4. The Project comprised five components: (i) Part A, rehabilitation of NorthHarbor, (ii) Part B, rehabilitation of South Harbor, (iii) Part C, provision of Cargo HandlingEquipment and Miscellaneous Port Equipment, (iv) Part D, Management and InformationSystems (MIS) Development and Institutional Strengthening, and (v) Part E, Detailed Designfor a Bulk Terminal. Among these five components, Parts A and B were the core of the Projectwith the largest share of the cost (more than 80 percent of the base cost). For the other threecomponents, investment or technical assistance (TA) from sources other than PPA wasenvisaged concurrently with, or prior to, the Bank loan. This included investment from privateterminal operators for Part C; a grant from the Government of Singapore for Part D 1 ; and afeasibility study from bilateral financial institutions for Part E. The Loan Agreement includedrelevant clauses to flexibly respond to possible changes during Project implementation.
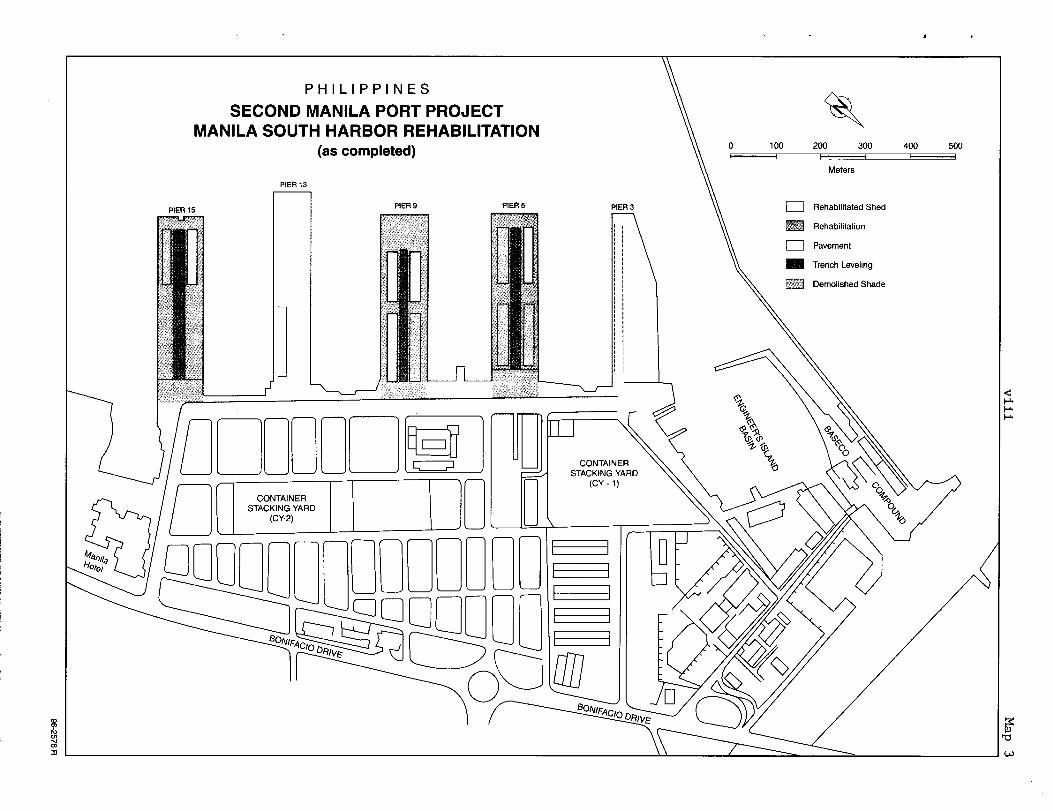
5. Details of changes in the Bank-financed Project scope are provided in Appendix2. Only the first two components (rehabilitation of North and South Harbors) were retained as:(i) PPA made other arrangements for miscellaneous port equipment expected to be financedby the Bank under Part C; (ii) PPA decided to use the loan proceeds from the World Bank forthe MIS under Part D, rather than grant money from the Singapore Government; and (iii)based on a study financed by the United States Agency for International Development, PPAdecided to adopt the build-operate-transfer modality for the bulk terminal under Part E. Thesurplus loan proceeds derived from these deletions2 were used to increase financing for PartsA and B. During Project implementation some modifications were made to Parts A and B toreflect site conditions, port user's views, and changes in traffic demand after Projectformulation. These modifications included converting pier 5 in South Harbor into a containerterminal, and deleting the RORO facilities from the North Harbor component. As containerpenetration has been higher than expected at both the harbors and there are no RORO shipsthat require special facilities for loading/unloading RORO cargoes, these changes areconsidered to be appropriate.
6. During Project processing, there were disagreements among the shippingcompanies as to whether common passenger facilities were desirable. Thus, it was agreed thatthe passenger facilities at North Harbor would be constructed only if further discussions withinshipping companies resulted in a clear consensus about the desirability of such facilities.Eventually, PPA deleted the passenger facilities from the North Harbor component 2 as it didnot succeed in obtaining the concurrence of the shipping lines to use them.
At the time of appraisal, the World Bank was processing its Provincial Ports Project (Loan No. 2823-PHI)under which an MIS component was also considered.During Project implementation, PPA changed the basic planning concept of the passenger facilities fromtwo separate one-storey buildings to a large-scale passenger terminal with elevated passenger corridors,that would segregate passenger flow from cargo flow and other associated traffic. The proposal was turneddown by the Bank, as no feasibility study was made available, and it was doubtful whether the shippinglines would agree to the common use of such terminal.
3
B. Implementation Arrangements
7. PPA was the Borrower and the Executing Agency for the loan, which wasguaranteed by the Government of the Philippines. During Project implementation, there wereno delays in the provision of counterpart funds, which had been a major problem duringimplementation of the first Manila Port Project (Loan No. 412-PHI). PPA established a ProjectOffice to supervise the day-to-day implementation and coordination of the Project. The ProjectOffice was headed by an experienced full-time Project Director under whom two ProjectManagers, one each for the South and North Harbors, were assigned. The Project Directorchanged twice during implementation, but this had little effect, as one of the two ProjectManagers succeeded to the position to maintain continuity. The Bank approved, in September1987, advance action and retroactive financing up to $1.6 million for dredging and forconsulting services which helped timely implementation of the Project.
8. Civil works, except dredging, were contracted through International CompetitiveBidding (ICB) under two separate contracts, one each for the North and South Harborscomponents. Dredging was undertaken by PPA through force account, as the dredgingquantity was not large enough to attract an international contractor, and PPA's dredgingequipment had proved to be sufficient to carry out dredging in a cost-effective manner (seepara. 17). Rehabilitation of pier 3 in South Harbor was deleted from the scope, as it wasfinanced by the private operator who had been awarded the operational franchise for 15 yearsin 1992. While the procurement of rubber fenders was originally included in the civil workscontracts, this was carried out separately to ensure the timely availability of the goods to thecontractors; this arrangement is considered to be appropriate.
C. Project Costs
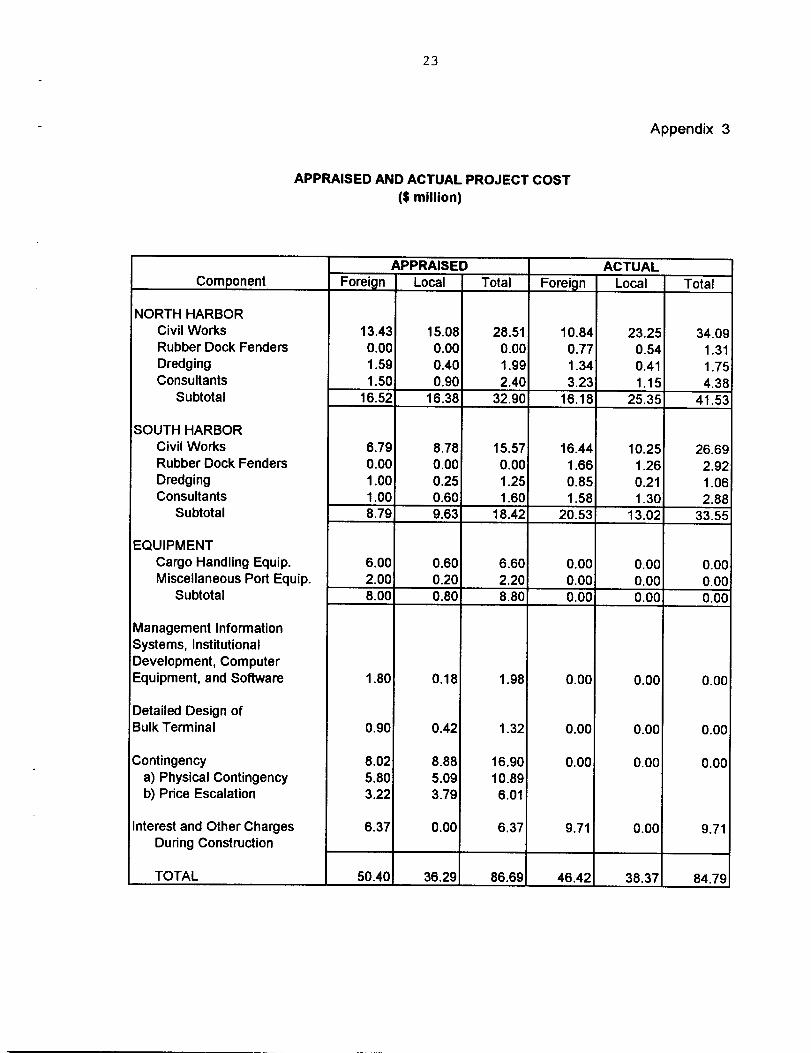
9. At appraisal, the total cost of the Project was estimated at $86.69 millionequivalent (inclusive of taxes and duties amounting to $2.8 million), of which $50.40 million, orabout 58 percent, was the foreign exchange cost, including $6.37 million of interest and othercharges during construction (IDC). Local currency costs were estimated at $36.29 millionequivalent, or about 42 percent. The cost estimates for North Harbor were based on theAppraisal Mission's review of the study financed by Bank TA, 1 while the costs for SouthHarbor were based on the Appraisal Mission's review of the findings of a feasibility studyfunded by Japan International Cooperation Agency. The cost estimates included a physicalcontingency allowance of 20 percent for the civil works, 10 percent for equipment, and 5percent for consulting services and price escalation. Because of uncertainty associated withthe nature of the works, particularly the lack of "as-built" drawings of the existing facilities, thephysical contingency allowance of 20 percent for civil works was considered to be appropriate,but even that proved to be inadequate (see para. 11).
10. Although the actual Project cost was $84.79 million ($46.42 million in foreignexchange and $38.37 million equivalent in local currency costs), about $2 million less than theappraisal estimate, the cost of rehabilitating the North and South Harbors increasedconsiderably except for dredging. The final civil works cost of the North Harbor component was$35.40 million against the appraisal estimate of $28.51 million; consulting services costs were$4.38 miflion against $2.40 million; and dredging was $1.75 million against $1.99 million. Thecivil works cost of the South Harbor rehabilitation component was $29.61 million against the
TA No. 842-PHI: Second Manila Port, for $75000, approved on 12 January 1987.
4
appraisal estimate of $15.57 million; consulting services costs were $2.88 million against $1.60million; and dredging was $1.06 million against $1.25 million (see Appendix 3).
11. The significant increase in the civil works cost of South Harbor (90 percent) wasattributable mainly to (i) conversion of pier 5 into a container wharf, which required majorstructural strengthening; (ii) more advanced detenoration of the facilities than expected atappraisal, which required more material and labor inputs (the most deteriorated pier 13 wasdeleted from the Project scope); and (iii) additional works (e.g., leveling the quay floor by fillingthe lower basin) identified during detailed design. Though lower than that in South Harbor, theoverrun in civil works costs for North Harbor of 24 percent over the appraisal estimateexceeded the physical contingencies of 20 percent. The significant increase in consultingservices cost reflects the longer than expected length of assignment (7.5 years against 5 yearsfor the North Harbor component, and 7 years against 5 years for the South Harborcomponent), and a major increase in the foreign exchange cost for the North Harborconsultants (the contract was awarded to a Japanese company payable in yen, whichappreciated significantly from $1=Y160 in 1989 to $1=Y100-110 from 1997 onward).
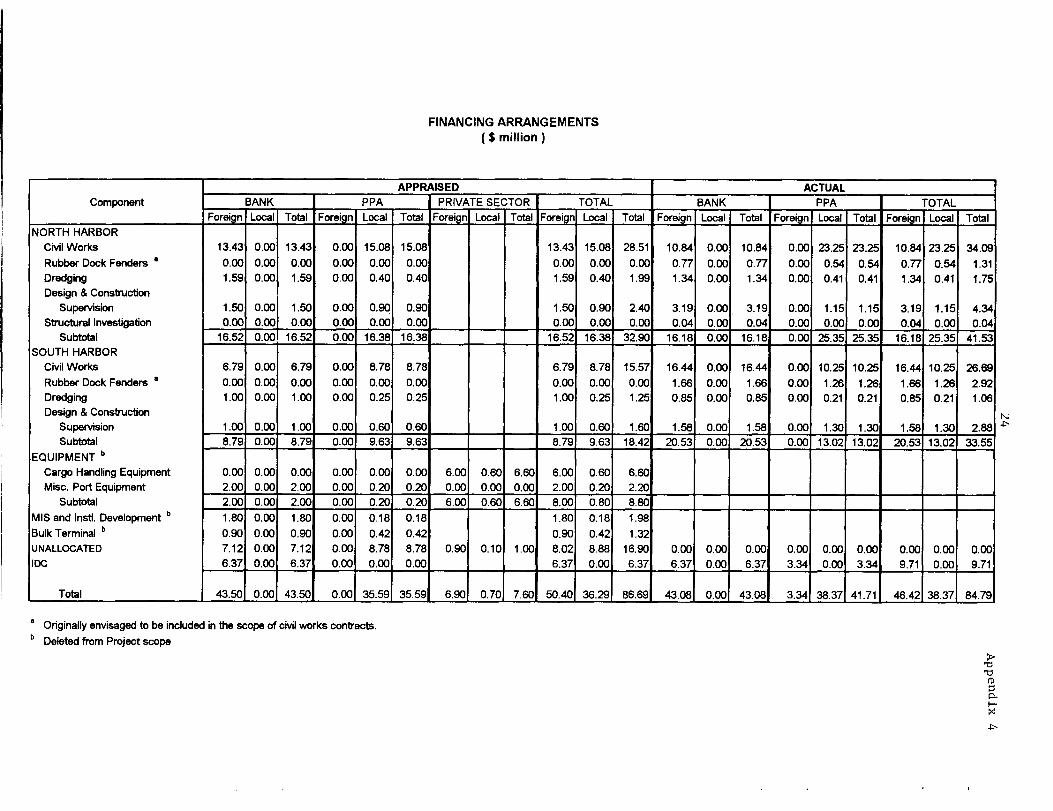
12. The final Project cost was, however, accommodated within the appraisalestimate by utilizing surplus loan proceeds from the deleted components and contingencies.The foreign exchange cost borne by PPA was the excess of IDC over the amount providedunder the loan. Actual Bank financing was $0.42 million less than the appraisal estimate.These loan savings were cancelled (see Appendix 4).
D. Project Schedule
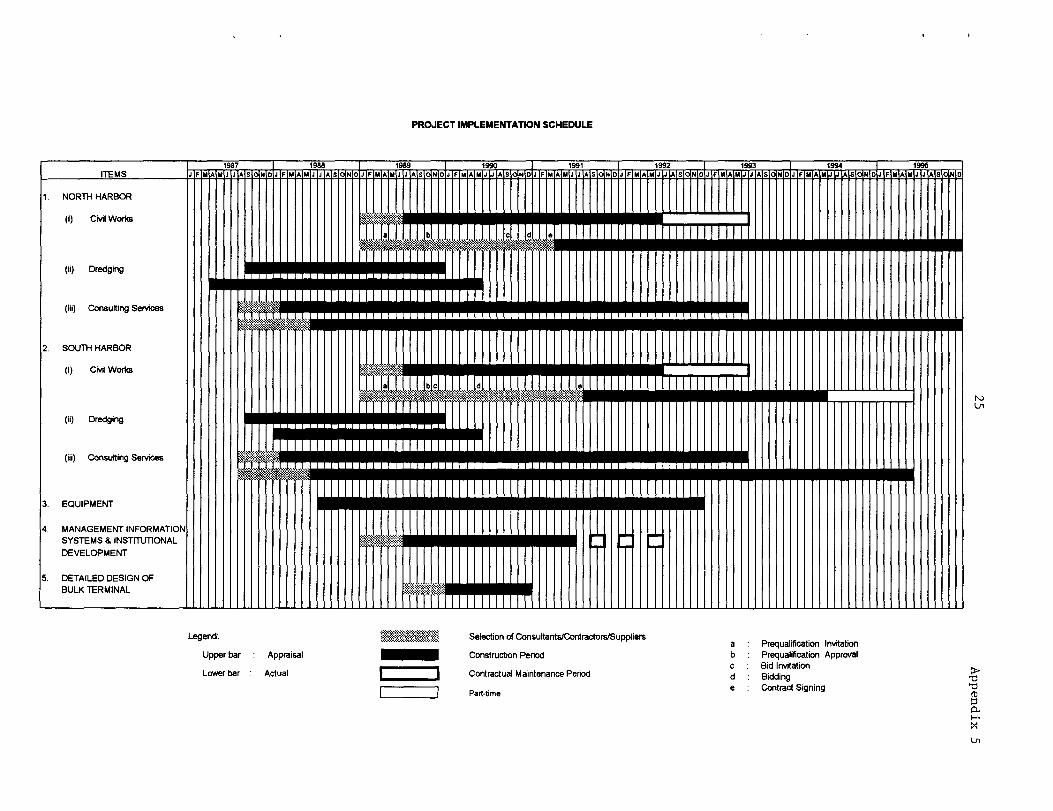
13. The Project was expected to be implemented over a five-and-half year period,including the warranty period, beginning in September 1987 when the dredging workscommenced. Civil works for the two harbors were expected to commence in July 1989.Project facilities were expected to become fully operational in late 1992, and the warrantyperiod was to end in mid-1993.
14. The Project schedules at appraisal and as actually implemented are shown inAppendix 5. The Project was delayed more than two years, mainly because of protractedprocedures within the Government to award civil works contracts. Prequalification proceduresprogressed smoothly starting in May 1989 and ending in November 1989. Bidding followedright after prequalification. While bids for the civil works contract for South Harbor wereopened in May 1990, the contract was awarded and signed only in July 1991. This delayoccurred because of a claim by one of the losing bidders 1 and a dispute between theGovernment and the winning bidder on the contract terms, which took one year to settle. Achange in the chairman of the Prequalification, Biddings and Awards Committee alsocontributed to the delay. For North Harbor, bid invitation was withheld for seven months due tothe Government's intention to introduce private financing for the Project. This wassubsequently abandoned, and the bids were called in September 1990. The contract for NorthHarbor was awarded in March 1991.
15. The Project encountered several engineering problems that delayedconstruction. At South Harbor, the state of deterioration of the port structures was worse than
The fourth lowest bidder offered a 15 percent discount (after discount, the bidder would have been thelowest bidder), but with a bond of only one day validity.
5
expected at appraisal. At North Harbor, extremely weak soil conditions at slip 17 and thecollapse of slip 13 (see para. 18) led to delays. The actual construction period for SouthHarbor was 2 years and 7 months (two piers were deleted from the Project scope, and onepier required extensive work to convert it into container berths). The North Harbor componentwas implemented in 4 years and 9 months. The appraisal schedule envisaged completion ofboth in three years. The loan was closed on 8 May 1996 after two extensions, about 2 yearsand 4 months later than the appraisal estimate.
E. Engagement of Consultants and Procurement of Goods and Services
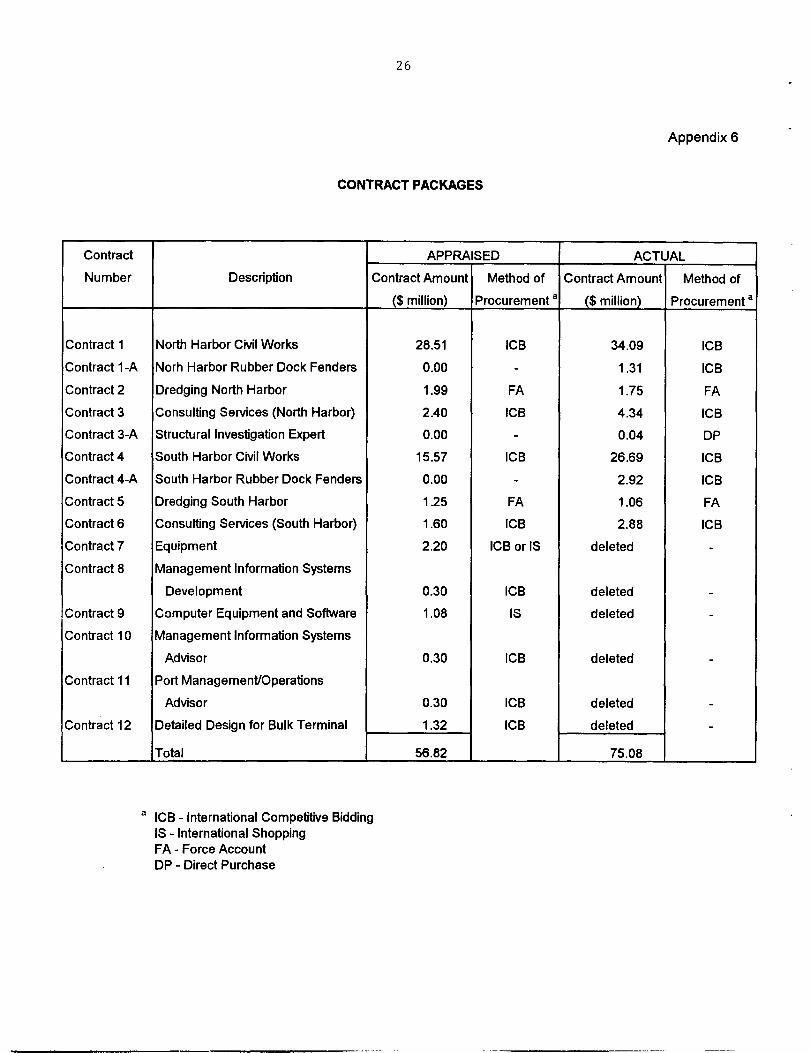
16. Details of the contract packages are provided in Appendix 6. There were threeadditional contracts, two for the procurement of rubber fenders through ICB (Contracts 1-A and4-A) and one for consulting services for structural investigation through direct appointment(Contract 3-A). Six contracts were deleted from the Project scope, because of the reasonsmentioned in para. 5, for the procurement of (i) miscellaneous equipment (Contract 7); (ii)computer equipment and software (Contract 9); and (iii) consulting services for design andimplementation of part of the computerized MIS (Contract 8); strengthening PPA's institutionalcapability to improve its MIS (Contract 10); providing advice on port management andoperations (Contract 11); and detailed design of the bulk terminal (Contract 12). The remainingcontracts were implemented as envisaged at appraisal.
17. Separating the procurement of rubber fenders from the civil works contracts($1.31 million for North Harbor and $2.92 million for South Harbor, both through ICB) wasappropriate to ensure timely provision of the goods to the contractors. The dredging of thebasins, slips, and approach channels at North and South Harbors was conducted under forceaccount because (i) the estimated cost of contracts of $1.99 million and $1.25 million was toosmall to attract international contractors due to mobilization costs; (ii) local contractors did nothave appropriate dredging equipment; and (iii) PPA had the appropriate equipment toundertake the dredging in a cost-effective manner, and such dredging was urgently required tofacilitate timely implementation of the Project. The actual dredging cost was around $1 percubic meter, which was comparable with the international price at the time. This arrangementwas appropriate.
F. Performance of Consultants, Contractors and Suppliers
18. The performance of the consultants, contractors and suppliers is evaluated asgenerally satisfactory. The consultants and the contractor engaged for North Harbor were notresponsible for the collapse of slip 13,1 as the results of the investigation conducted after theincident showed that (i) the method and quality of predesign investigation and design ofrehabilitation were satisfactory; (ii) the quality of civil works was satisfactory; (iii) slip 13 was theonly structure where tie-wires had been installed originally instead of tie-rods to hold backsheet piles, and the tie-wires had insufficient strength for the purpose; and (iv) it was notpossible to detect the deficiency beforehand. The failure of the pier was caused by fragilityresulting from the extensive deterioration of the original structure, triggered by the stacking ofheavy cargo.
19. As the Project was implemented while port operations were taking place, closecoordination of the construction with port operations was required. Because six operators were
There has recently been a second incidence of collapse, at pier 15 in South Harbor. ( see para. 30).
6
handling cargo in North Harbor, coordination with these operators was extremely complicatedand time consuming. The consultants and the contractor cooperated with PPA in coordinatingwith the cargo handlers, and well-planned construction methods were followed to minimizedisruptions to port operations.
G. Conditions and Covenants
20. As shown in Appendix 7, compliance by the Executing Agency with the loancovenants was generally satisfactory except for (i) timely acquisition of land for the Project,and (ii) the formation of the Cebu Port Authority (CPA) without prior consultation with the Bank.The major problem encountered during implementation of the first Manila Port Project hadbeen PPA's lack of access to counterpart funds. To avoid this problem, relevant clauses werestipulated in the Loan Agreement, and there were no delays in the provision of counterpartfunds. PPA maintained a good financial position: its operating ratio and self-financing ratiowere satisfactory during Project implementation (see para. 49). In line with the loan covenants,PPA also revalued its fixed assets and revised tariffs, both of which were essential to maintainthe financial viability of the Project (see paras. 46 and 50).
21. Relocation of 1,400 squatter families from slip 17 of North Harbor wassuccessfully carried out through joint efforts of Government agencies concerned (InteragencyCommittee on Squatter Removal and Relocation; IACSRR). The second step was phasedrelocation of 7,000 squatter families from the southern end of North Harbor. After completionof the relocation of about 100 families, a temporary restraining order was issued. DespiteIACSRR's efforts to resolve the issue, the relocation was suspended for a long period, and therelocation site was occupied by other squatters, which further complicated the issue.Consequently, two minor components -- the construction of a part of the container yard at Slip0 and the associated link road to the Manila International Container Terminal access road --were deleted from the Project scope (Appendix 2).
22. CPA was created by the Government in September 1992, and its operationsstarted in 1996 despite opposition by PPA. Although CPA's assets constituted about 18percent of PPA's total assets in 1995, its operations mainly concern domestic cargo andpassengers, which generate only modest revenues. The separation will not seriously affectPPA's financial performance (see paras. 51 and 52).
H. Disbursements
23. Disbursements amounted to $43.08 million out of the loan of $43.50 million, or99 percent. The remaining $0.42 million was canceled. There were three cancellations ofProject components: (i) Part C, $2 million to procure various items of equipment; (ii) Part D,$1.80 million to provide consulting services for MIS and institutional development; and (iii) PartE, $0.90 million to provide consulting services for detailed design of a bulk terminal. The totalsavings of $4.7 million, together with the unallocated amount of $6.37 million, were utilized tofinance the increased cost of civil works and consulting services under Parts A and B(rehabilitation of North and South Harbors). Disbursements were made over 7 years and 8months, starting in August 1988 and ending in May 1996. This compares with the 5 years and8 months estimated at appraisal. Submission of withdrawal applications was generally timely(see Appendix 8).
7
24. Terms of reference of the consultants engaged for the detailed design andconstruction supervision included a clause to review and update the Project cost estimate,including its breakdown into foreign exchange and local currency costs. As a result, it wasfound that the foreign exchange cost for South Harbor was higher than for North Harbor, andratios were adjusted for disbursement purposes for South Harbor from 40 percent 60 percent,and for North Harbor from 52 percent to 35 percent, without changing the total amount offoreign exchange costs.
I. Environmental Impact
25. There was no significant environmental impact due to the Project. Because ofconstruction of a container yard at North Harbor, containers are now stacked inside the portarea rather than on the roads, as was done in the past. Through the clean-up and realignmentof facilities as well as introduction of proper garbage collecting systems, the Project hascontributed to an improved working environment within the port. Drainage constructed as partof the Project has reduced flooding, thus contributing to the improvement.
26. Although the procurement of garbage collection equipment envisaged underPart C was dropped from the Project scope, in 1992 PPA entered into a new arrangement withthe municipality through which garbage was collected from inside the port area under contract.PPA is also an active member of a new joint program for the environmental protection ofManila Bay wherein the various agencies cooperate to clean and maintain the bay. 1 This is animportant step forward to improve the port's environment.
J. Performance of the Borrower and the Executing Agency
27. PPA was both the Borrower and the Executing Agency for t e Project. Theperformance of PPA was generally satisfactory: (i) there was no delay in 1 ie provision ofcounterpart funds; (ii) communications with the Bank were timely; (iii) implementationarrangements were well established and maintained; and (iv) the conditions and covenantsstipulated in the Loan Agreement were generally complied with.
28. During Project implementation, the Government introduced institutional andorganizational changes in the port sector, including (i) promoting private sector participation inport operations and investment (PPA extended the contract for terminal operations with theprivate operator from 3 years to 15 years, to make it more commensurate with the investmentby the private operator); (ii) coordinating development plans and works between the port andthe city; and (iii) streamlining PPA port systems. Item (i) is in line with the Loan Agreement, anditems (ii) and (iii) are in conformity with the key issues noted in the Bank's ProjectPerformance Audit Report (PPAR) for Loan No. 412-PHI: Manila Port Project.2
29. There were, however, some issues that needed careful monitoring and analysisby the Government and the Bank. One of these issues was the creation of CPA, despiteopposition by PPA. While this move was a part of the Government's decentralization policy,
Known as Manila Bay Clean-up Campaign." Agencies concerned include the Department of Environmentand Natural Resources as the lead agency, Philippine Coast Guard, PPA, City of Manila, and variousprivate organizations and individual volunteers.Circulated to the Board in September 1994.
8
no proper analysis of the implications was carried out, nor was the Bank consulted, althoughthe Loan Agreement required this.
30. Another issue was the failure of two of the rehabilitated facilities: slip 13 ofNorth Harbor and a part of pier 15 of South Harbor. A part of slip 13 collapsed in September1994, one year after rehabilitation. Although the failure was due to a deficiency in the originalwharf structure, the continuous stacking of unusually heavy container cargoes triggered thefailure. While PPA engineers were aware of the likely risks and requested the operational unitto take counter measures, there was a lack of proper communications between theengineering and operational units of PPA. After the incident, both units had intensivediscussions, and PPA introduced loading limitations on cargo handling operations, taking intoaccount the design strength of the structures. However, the collapse of a part of pier 15occurred in June 1997, three years after rehabilitation, casts some doubt on the effectivenessof enforcement of these limitations. The cause of the collapse is still under investigation at thetime of writing this Report. While it is most probable that stacking of heavy cargo (almost threetimes heavier than the design load of the pier) buckled the supporting steel monotube piles,some of the piles were found to be unrehabilitated and may not have been able to providetheir design capacity.
31. The MIS component was deleted from the Project because PPA decided to usepart of a World Bank loan for the purpose rather than the Singapore Government grant. Underthe World Bank financing, a master plan of the PPA computer systems was developed and,following the master plan, PPA and the private operators in Manila Port have graduallydeveloped a computerized MIS system through their own resources. The system has on-lineconnections to port traffic data collected by the South Harbor operator and the ManilaInternational Container Terminal (MICT) operator, which allows PPA to monitor and supervisethe operations and management of South Harbor and MICT. However, the system has noaccess to North Harbor and to ports other than Manila Port. To improve the efficient andeffective management of its operations, the MIS needs to be enhanced by PPA.
32. PPA maintained close consultation with private port operators and port users,which facilitated smooth implementation of the Project. The deletion of the common userpassenger terminal at North Harbor is considered appropriate; it was agreed during processingthat the passenger terminal would be built only if the operators wanted it. As no consensuswas reached during implementation, it was not built.
33. PPA, in cooperation with other Government agencies concerned, hasintroduced new traffic regulations in and around North Harbor. Jeepneys, taxis, and tricyclesare not allowed to enter the port area. Shanties along each side of R-101 have beendemolished, and there are now three lanes in each direction. This, coupled with theconstruction of the collector roads within the port, has improved port traffic flows dramatically,thus enhancing the efficiency of port operations.
The radial road running along the coastline of Manila Bay.
9
K. Performance of the Bank
34. During Project implementation, changes in Project scope and associatedmatters became necessary because of various reasons: (i) traffic demand surged after Projectformulation; (ii) conditions justifying some of the Project components did not materialize; and(iii) the Government decided to promote more private sector involvement in the port sector.Whenever the need for change arose, the Bank examined the matter and took appropriateaction. The Bank gave timely and relevant technical advice to PPA for the resolution ofproblems encountered during Project implementation.
III. EVALUATION OF INITIAL PERFORMANCE AND BENEFITS
A. Traffic Reevaluation
35. The Project has been reevaluated based on actual port traffic and revised trafficforecasts over the anticipated Project life. At appraisal, very conservative traffic forecasts weremade because (i) the economy of the country had experienced deep recession between 1982and 1985, which resulted in a decline of port traffic at Manila; and (ii) the Project wasprocessed immediately after the political events in 1986, a period of economic uncertainty.Actually, the economy of the country rebounded, showing strong growth particularly from 1994onward.
36. A comparison of the appraisal forecast with actual traffic from 1987 to 1995 indicates aclear divergence. Manila Port 1 traffic has increased much faster than expected during the pastnine years in terms of cargo, passengers, ship calls, and average cargo volume handled pership. Data have been compared on the same basis as at appraisal: (i) traffic handled over allof the piers at South Harbor, but excluding traffic at anchorage; and (ii) total traffic at NorthHarbor, at pier and anchorage. Comparison tables are provided in Appendix 9.
1. International Traffic
37. At appraisal, the international cargo traffic at Manila Port was expected toincrease from 5.7 million tons in 1987 to 7.8 million tons in 1995, equivalent to a 4.0 percentaverage annual growth rate. The traffic actually grew at an average rate of 9.8 percent perannum to reach 14.6 million tons in 1995, 87 percent higher than forecast at appraisal.
38. The international cargo traffic is handled at South Harbor and MId. In 1986,78.4 percent of total international cargo traffic was handled at South Harbor. At appraisal, itwas expected that this share would decrease to less than half in the 1990s (particularly, theshare of container traffic was anticipated to decrease sharply from about 60 percent to 15percent) due to the completion of Phase II of MICT. The actual share of international cargo atSouth Harbor did not decrease as expected and has stabilized at around 60 percent since1991. While there was no forecast provided at appraisal for international container traffic, thishas increased at an average annual growth rate of 13 percent to reach 1,080,000 twenty-footequivalent units (TEUs) in 1995, of which South Harbor handled around 30 percent.
For this analysis, Manila Port includes North Harbor, South Harbor, and MICT but excludes subports(Pasig Bank, private and municipal ports of Limay, Marivelles, Romblon, and Subic). During the last 10years, about 40 percent of the total cargo traffic and 5 percent of the total passenger traffic of Manila PortDistrict Office area have been handled through these subports.
10
39. The number of international ship calls increased from 2,232 in 1987 to 3,864 in1995. The average international ship size increased from about 8,400 gross registered tons(GRT) in 1987 to about 10,300 GRT in 1995, an increase of 23 percent over the period. Theaverage international cargo volume handled per ship also increased by 22 percent, fromaround 3,100 tons per ship call in 1987 to about 3,800 tons per ship call in 1995.
2. Domestic Traffic
40. Domestic cargo traffic through Manila Port is handled mainly at North Harbor.1At appraisal, domestic cargo was forecast to increase from 7.7 million tons in 1987 to 10.4million tons in 1995, equivalent to a 3.9 percent average annual growth rate. The domesticcargo traffic actually increased at an average of 6.8 percent per annum to reach 14.2 milliontons in 1995, 37 percent higher than forecast at appraisal.
41. At appraisal, domestic container traffic was projected to increase from 265,000TEUs in 1987 to 427,000 TEUs in 1995, equivalent to a 6.1 percent average annual growthrate. The domestic container traffic actually increased at an average growth rate of 9.7percent per annum to reach 611,000 TEUs in 1995, 43 percent more than expected atappraisal.
42. The number of domestic ship calls increased from 5,099 in 1987 to 6,538 in1995. The average ship size nearly doubled from 1,900 gross registered tons (GRT) in 1987to 3,600 GRT in 1995. However, the average domestic cargo volume handled per shipincreased by only 32 percent, from around 1,600 tons per ship call in 1987 to about 2,200 tonsper ship call in 1995. This shows a trend towards using bigger ships calling at severaldomestic ports rather than small ships making return trips between two ports.
3. Revised Traffic Forecast (1996-2015)
43. In 1996, traffic grew at about 16 percent over 1995 traffic at South Harbor (9percent for container traffic and 23 percent for noncontainerized cargo traffic). At NorthHarbor, traffic grew by about 8 percent (7 percent for containerized and 11 percent fornoncontainerized cargo). Revised traffic forecasts are based on the following assumptions:
(i) International Traffic. A 9 percent annual growth has been assumed forboth container and non containerized cargo traffic until 2000, after which thegrowth rate should progressively decrease to 5 percent, which is close to theaverage long-term international maritime traffic growth expected in the ASEANregion. Taking into account productivity improvements due to the Project and toadditional equipment investment made by the private sector, the capacity ofpiers 5, 9, and 15, which were the only ones rehabilitated under the Project, hasbeen estimated at about 5.3 million tons; this is expected to be reached in 1998.The traffic increase attributable to the Project has been limited to this level in theeconomic and financial analyses.
Over the past decade, about 1 percent of the total domestic cargo traffic of Manila Port has been handledat South Harbor and MICT.
11
(ii) Domestic Traffic. An 8 percent growth rate has been assumed fordomestic traffic (7 percent for container traffic and 11 percent for non-containerized cargo traffic). The capacity of piers 2-18, which were rehabilitatedunder the Project, has been estimated at about 24.8 million tons; this isexpected to be reached in 2003. Traffic handled at North Harbor has beenlimited to this level for the economic and financial analyses.
44. At appraisal, the average economic asset life of the Project was estimated at 20years from the start-up year, planned to be 1993. The project period considered for evaluationwas therefore 1988-2012. The same average economic asset life has been retained for theProject reevaluation. The Project was fully operational in January 1996, so the Project periodconsidered for reevaluation, including the implementation period, is 1988-2015.
45. The Project reevaluation is based on the total traffic at North Harbor, but only onthe traffic handled at piers 5, 9, and 15 of South Harbor, because piers 3 and 13 were deletedfrom the Project scope. It is assumed that no traffic has been directly generated by the Projectimprovements or put off by the increase in charges. The Project has allowed traffic growth totake place only in Manila, within the limits of its incremental capacity. The revised trafficforecasts are provided in Appendix 9, along with the traffic forecast at appraisal.
B. Financial Performance of PPA
46. PPA, in general, and both North and South Harbors at Manila Port, in particular,have experienced significant increases in revenues over the last several years that are wellabove the appraisal estimates. This is attributable to higher than expected traffic growth andtariff increases. The overall operating expenses of PPA have increased almost in proportion tothe revenue increases, primarily due to substantial increases in personnel costs and otheradministrative expenses. The increase in operating expenses at South Harbor has been lowerthan the overall rate of PPA, and the operating expenses at North Harbor have evendecreased (for details, see Appendix 10).
47. The overall financial performance has been better than that anticipated atappraisal. While PPA's operating ratios have not improved significantly, the profits and cashgeneration have been quite substantial. The operations of North and South Harbors andMICT have been very profitable and continue to subsidize the operations of several smallerports. Analysis of the financial statements indicates that the increased liquidity and soundfinancial position of PPA should enable it to meet all its financial obligations including debt-service requirements. Starting in 1994, PPA has been required to pay half of its net income ofthe previous year as a dividend to the Government. This will restrict PPA's cash build-up,which could severely affect its expansion plans and ability to finance such investments frominternally generated funds. PPA is requesting a reconsideration of the payment of dividends tothe Government. Comparative financial performance indicators are presented in Appendix 10.
48. While the financial reporting of PPA seems adequate at the aggregate level,costing by pier or Project component, or by cost center, is not available. This is aconsequence of the delay in implementing the computerized MIS system and the differentoperations not being linked to the main office by local area networks.
12
49. Based on the financial performance indicators, PPA has complied with thefinancial covenants agreed upon at appraisal. Operating ratios were maintained below thecovenanted maximum of 65 percent, while self-financing ratios (computed in accordance withthe appraisal method) were substantially higher than the minimum 30 percent required.
50. Asset revaluation was last carried out in June 1991 and led to a substantialupward valuation in land and other assets of PPA from 1992. As a result of asset revaluation,PPA was required to pay real estate taxes of P80 million in 1993, increasing to P155 million in1994 and 1995. No revaluation was undertaken in 1996 pending the outcome of PPA'sappeal against payment of real estate taxes and in anticipation that further upward adjustmentin asset values may lead to an additional real estate tax burden.
51. In 1992, the Government established CPA, which includes Cebu Port and someother minor ports in Cebu Island. Existing assets and related liabilities of the Port ManagementOffice at Cebu were transferred to CPA and separated from PPA in January 1996. Thetransfer of assets worth P4.5 billion was equivalent to about 18 percent of PPA's total assets in1995.
52. The creation of CPA may be viewed as a positive step in promoting regionaldevelopment in the province of Cebu and is expected to improve integration and coordinationof planning, development, and operation of ports within its territorial jurisdiction. Cebu Port'sshare of the country's cargo volume is about 10 percent against its asset share of 18 percent.The port has a distinct nature of being a domestic distribution center, domestic cargorepresenting about 90 percent of the total cargo volume (compared with less than 60 percentfor PPA). This indicates that the revenue contribution of the port to PPA would be much lessthan its asset share. Since this trend is likely to continue in the future, the financial implicationof the separation is not serious for PPA. The present deficit of CPA will continue until CPAincreases its tariffs for domestic cargo and attracts more international cargo.
C. Financial Reevaluation of the Project
53. The methodology of "with" and "without" the Project comparison used atappraisal has also been followed in recalculating the financial internal rate of return (FIRR).The underlying assumptions at appraisal have been verified and updated using the actualperformance of Manila Port (for details see Appendix 11).
(i) Without the Project. The vessel and cargo handling capacity ofboth North and South Harbors at the piers would gradually decline because offrequent repair and maintenance work. This would lead to a decline in revenue,while operation and maintenance (O&M) costs would continue to escalate. Witha reduced capacity, port users would incur higher costs arising from doublehandling of cargo associated with servicing vessels at anchorage.
ii) With the Project. The construction of three deepwater berths atNorth Harbor and the capacity of the facilities would be maintained or expandedbecause of conversion of pier 5, South Harbor, into a container terminal. While
13
there would be additional O&M costs estimated at 1.5 percent of the capitalcost, these would be significantly lower than the O&M costs in the "without" theProject case.
54. Incremental benefits and costs for South Harbor have been adjusted to reflectonly revenues and costs attributable to the Project piers (5, 9, and 15). Based on theseassumptions, the FIRRs recalculated separately for North and South Harbors and for theProject as whole are 5.7 percent, 15.2 percent, and 10.3 percent, respectively compared withthe appraisal estimates of 9.2 percent, 11.9 percent, and 10.4 percent, respectively.
D. Economic Reevaluation of the Project
55. The Project has been reevaluated on the basis of a "with" and "without" theProject comparison, using slightly different assumptions from those used at appraisal
(i) Without the Project. The uneven working surface of the piers and thevery poor condition of existing equipment would lead to worsening cargohandling operations and increasing ship turnaround times. Facilities at Northand South Harbors would continue to deteriorate, resulting in higher O&Mcosts. The limited container stacking capacity at North Harbor would require off-pier handling (at anchorage) at higher cost after the pier capacity is reached.
(ii) With the Project. The rehabilitated piers will allow better operatingconditions and will attract investment in new and replacement equipment byprivate operators, thus improving cargo handling productivity and reducing shipturnaround times. O&M costs at the rehabilitated structure will be reduced.Additional container yard area and better container handling efficiency willreduce the requirement for off-pier handling. Capacity will be reached in 1998at South Harbor and in 2003 at North Harbor, avoiding additional costs forexcess cargo, which would have been handled at anchorage from 1995 withoutthe Project. Although a reduction in the share of South Harbor cargo handled atanchorage could be expected with the Project before the piers reach capacity, ithas not been quantified as a benefit. The reduction in equipment O&M costsand the extension of the economic life of the equipment, which could beexpected from the improvement of pier working surfaces, has also not beenquantified as a benefit.
56. The economic costs and benefits in the "with" and "without" the Project caseshave been reevaluated for the Project as a whole, and for the North and South Harborcomponents separately. The economic internal rates of return (EIRRs) are estimated at 26.7percent for the whole Project, 29.2 percent for North Harbor, and 23.3 percent for SouthHarbor (see Appendix 12). These rates are higher than those estimated at appraisal (15.7percent, 15.4 percent, and 16.2 percent, respectively), due mainly to higher traffic growth thanexpected at appraisal.
14
E. Attainment of Benefits
57. Although the whole Project was completed only at the end of 1995, parts of itwere completed and put into operation before this date. South Harbor rehabilitation wascompleted by mid-1994, and rehabilitation of piers 2-16 at North Harbor was graduallycompleted from mid-1992 to the end of 1994. Private operators signed operation concessioncontracts in 1991 and immediately started to provide new cargo handling equipment. Based ondiscussions with the Manila Port District Office and Port Management Offices at South andNorth Harbors, and on analysis of port data and operational indicators, it is clear that some ofthe expected benefits were attained before the Project was fully completed:
(i) Before Project implementation, the average ship turnaround timewas about 124 hours at South Harbor and 78 hours at North Harbor. In 1995,the average turnaround time had been reduced to about 102 hours at SouthHarbor and 60 hours at North Harbor, an improvement of 22 and 18 hours,respectively, per ship call. The average waiting time stayed reasonably low at 4hours per call at South Harbor and less than 1 hour per call at North Harbor.
(ii) The consolidated profit and loss statements of Manila Port DistrictOffice in 1991 and 1995, that is, immediately before and after Projectimplementation, show a reduction of P23 million in repair and maintenanceexpenses for South and North Harbors combined.
(iii) The cargo volume handled at South Harbor (Piers 5, 9, and 15)was about 1.1 million tons in 1988, which increased to 3.8 million tons in 1995.Similarly, the cargo volume handled at North Harbor increased from 9.6 milliontons to 14.1 million tons over the same period. Sharp increases in cargovolumes were recorded in 1994, when the major Project facilities were put inoperation. This reflects the resumed economic growth of the country, which,without the restored and expanded port capacity under the Project, would havebeen diverted elsewhere.
IV. CONCLUSIONS AND RECOMMENDATIONS
A. Conclusions
58. After various changes in scope, the Project was completed successfully. BothNorth and South Harbors have been rehabilitated, which helped accommodate the rapidincrease of cargo volume starting in 1994. Without the Project, there would have been acontinuing series of wharf collapses, which would have hindered port operations, causing abottleneck of cargo movement.
59. Despite the rapid increase of cargo volume, traffic flows in and around the porthave been improved, particularly at North Harbor, because of construction of collector roads
15
within the port area, together with the proper introduction of traffic regulations. This has alsocontributed to improved port operations.
60. The changes in Project scope are considered appropriate. During Projectprocessing, there were stilt unknown factors and uncertainties, and, accordingly, possibilitiesfor changes in scope were envisaged, and allowed for in the loan documents. Because of thisflexibility, there were no significant delays resulting from such changes. While Parts C, D, andE were deleted from the Project scope, they were implemented, or are being implemented,under other schemes including investment by the private sector. The loan savings from thedeletions were utilized to finance the cost increase in the rehabilitation works under Part A andB.
61. Private sector participation in the port substantially increased during theimplementation period. The extension of the operational contract from 3 years to 15 yearsenabled the South Harbor operator to invest more in facilities and equipment, particularly forcontainers, thereby reducing PPA's financial burden. Moreover, this created competition withinthe port for international containers, thus promoting higher efficiency of the port.
62. PPA has proved itself to be a sound and sustainable organization. Thearrangement that made PPA both the Executing Agency and the Borrower worked well. Therewere no problems in the provision of local counterpart funds , which is often observed in otherprojects in the country, and delays in implementation were significantly reduced in comparisonwith the Manila Port Project. The initial operation of the facilities indicates that the benefitsexpected at appraisal have either been attained already or will be attained. The FIRR for theProject is estimated at 10.3 percent and the EIRR at 26.7 percent. The Project is, therefore,considered to be generally successful.
B. Recommendations
1. General
63. Experience with the Project confirms the difficulties associated withrehabilitating existing facilities as opposed to constructing new ones. Rehabilitation of oldstructures is usually associated with the non-availability of as-built drawings; difficulties inaccurately determining the structural condition; and accordingly, difficulties in determining theappropriate methods and scope of rehabilitation. Because of these factors, higher contingencyallowances should be provided for both costs and completion times for such projects ascompared with those for new ones.
2. Project- Related
64. PPA needs to remind the port operators continuously that the facilities havebeen rehabilitated to their original design strength only and cannot accommodate excess cargoweight. PPA also needs to improve enforcement of the load limitation determined by structuralinvestigation and analysis, with proper supervision and monitoring, so as to avoid any furthercollapse of the structures.
16
65. The squatter issue at Manila Port continues to be an obstacle for future portdevelopment and its management and operations, as well as an aesthetic concern to the maingateway of the country's capital city. This is a highly political issue and may need a long timeto resolve. While the scope of possible actions by PPA is limited, PPA, as the owner of theport, should prevent further sprawl of the squatter area.
66. The PPAR may be prepared in 1999 when the Project facilities at South Harborreach their capacity, and the newly constructed container terminal at North Harbor will be in fulloperation.
17
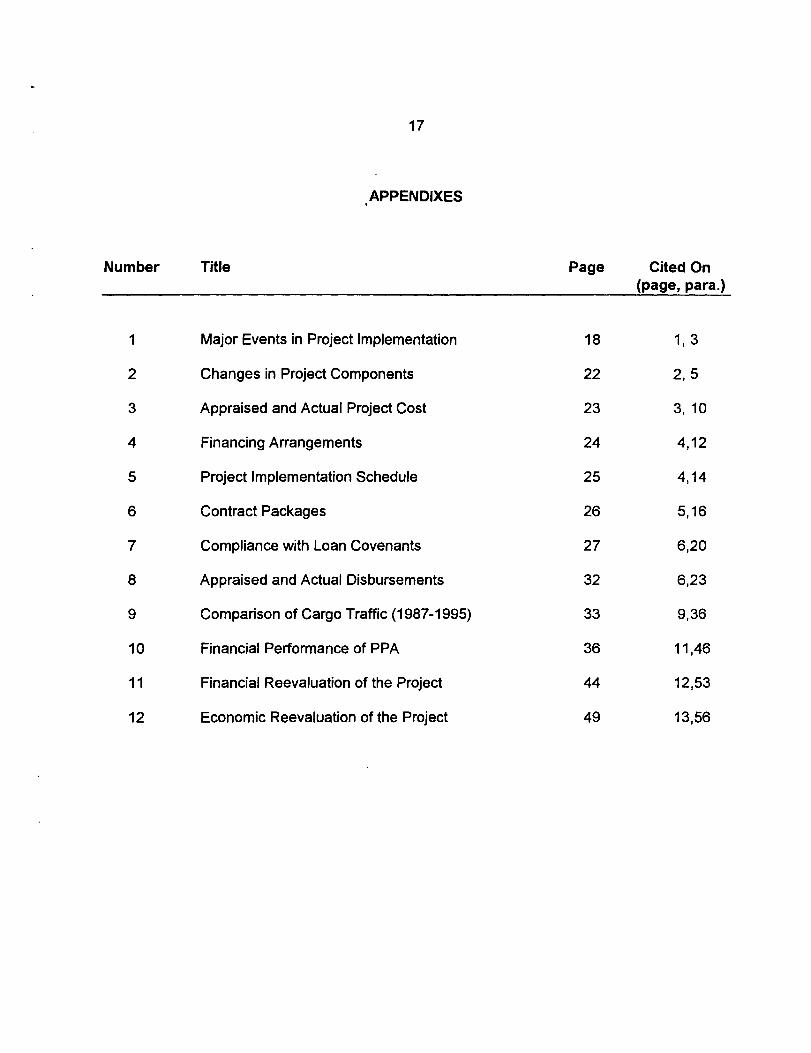
APPENDIXES
Number Title Page Cited On(page, para.)
1
2
3
4
5
6
7
8
9
10
11
12
Major Events in Project Implementation
Changes in Project Components
Appraised and Actual Project Cost
Financing Arrangements
Project Implementation Schedule
Contract Packages
CompJiance with Loan Covenants
Appraised and Actual Disbursements
Comparison of Cargo Traffic (1 987-1995)
Financial Performance of PPA
Financial Reevaluation of the Project
Economic Reevaluation of the Project
18
1,3
22
2, 5
23
3, 10
24
4,12
25
4,14
26
5,16
27
6,20
32
6,23
33
9,36
36
11,46
44
12,53
49
13,56
18
Appendix 1, page 1
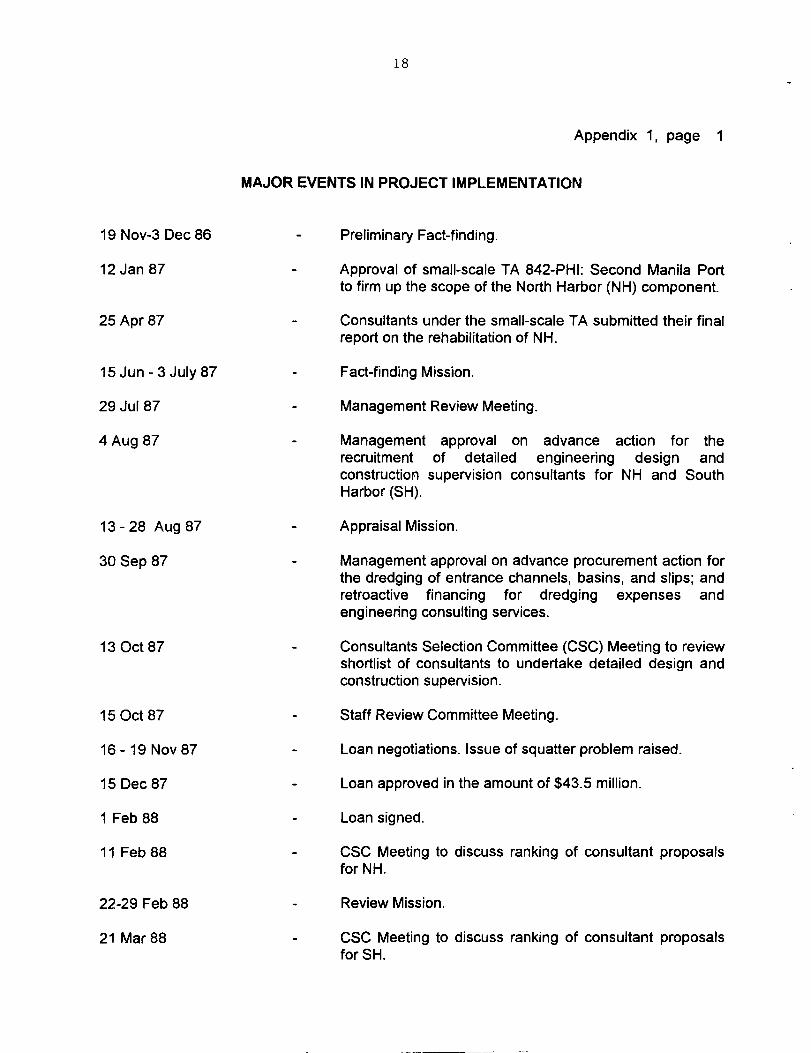
MAJOR EVENTS IN PROJECT IMPLEMENTATION
19 Nov-3 Dec86
12 Jan 87
25Apr87
l5Jun-3July87
29 Jul 87
4 Aug 87
13-28 Aug87
30 Sep 87
13 Oct87
15Oct87
16- 19 Nov87
15 Dec87
1 Feb 88
11 Feb88
22-29 Feb 88
21 Mar88
- Preliminary Fact-finding.
- Approval of small-scale TA 842-PHI: Second Manila Portto firm up the scope of the North Harbor (NH) component.
- Consultants under the small-scale TA submitted their finalreport on the rehabilitation of NH.
- Fact-finding Mission.
- Management Review Meeting.
- Management approval on advance action for therecruitment of detailed engineering design andconstruction supervision consultants for NH and SouthHarbor (SH).
- Appraisal Mission.
- Management approval on advance procurement action forthe dredging of entrance channels, basins, and slips; andretroactive financing for dredging expenses andengineering consulting services.
- Consultants Selection Committee (CSC) Meeting to reviewshortlist of consultants to undertake detailed design andconstruction supervision.
- Staff Review Committee Meeting.
- Loan negotiations. Issue of squatter problem raised.
- Loan approved in the amount of $43.5 million.
- Loan signed.
- CSC Meeting to discuss ranking of consultant proposalsfor NH.
- Review Mission.
- CSC Meeting to discuss ranking of consultant proposalsforSH.
19
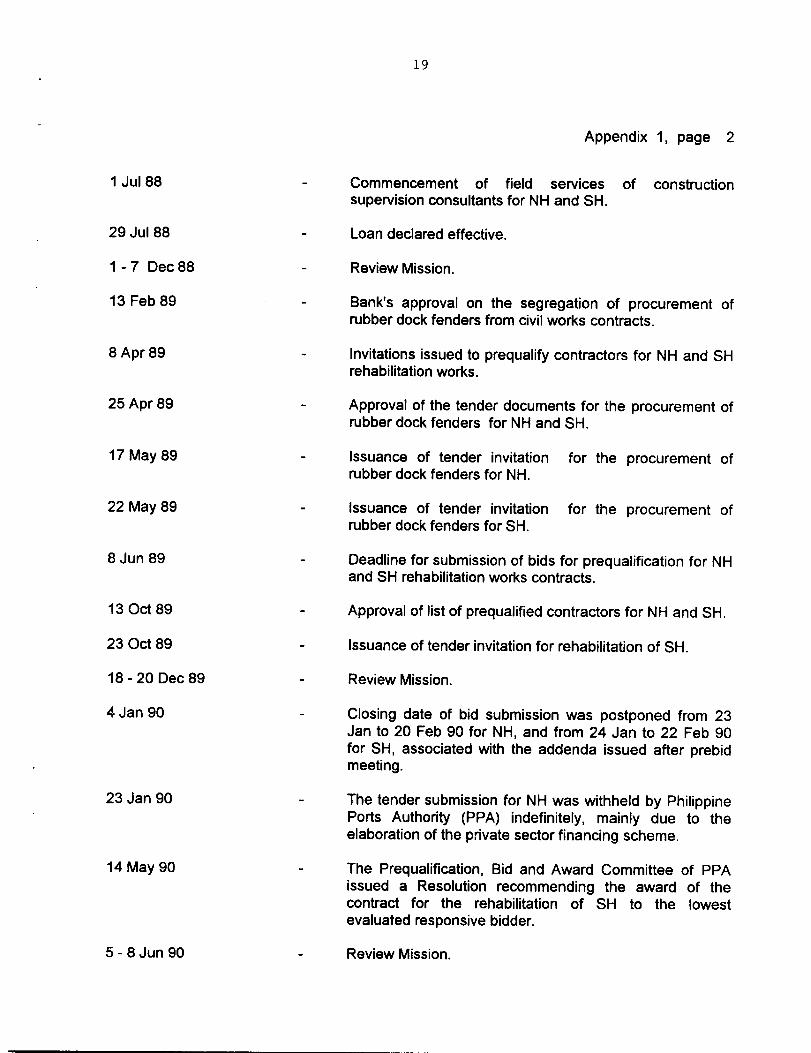
Appendix 1, page 2
1 Jul 88
29 Jul 88
1-7 Dec88
13 Feb 89
8Apr89
25Apr89
17 May89
22 May 89
8 Jun 89
13 Oct89
23 Oct 89
18-20 Dec89
4Jan90
23 Jan 90
14 May 90
5 - 8 Jun 90
- Commencement of field services of constructionsupervision consultants for NH and SH.
- Loan declared effective.
- Review Mission.
- Bank's approval on the segregation of procurement ofrubber dock fenders from civil works contracts.
- Invitations issued to prequalify contractors for NH and SHrehabilitation works.
- Approval of the tender documents for the procurement ofrubber dock fenders for NH and SH.
- Issuance of tender invitation for the procurement ofrubber dock fenders for NH.
- Issuance of tender invitation for the procurement ofrubber dock fenders for SH.
- Deadline for submission of bids for prequalification for NHand SH rehabilitation works contracts.
- Approval of list of prequalified contractors for NH and SH.
- Issuance of tender invitation for rehabilitation of SH.
- Review Mission.
- Closing date of bid submission was postponed from 23Jan to 20 Feb 90 for NH, and from 24 Jan to 22 Feb 90for SH, associated with the addenda issued after prebidmeeting.
- The tender submission for NH was withheld by PhilippinePorts Authority (PPA) indefinitely, mainly due to theelaboration of the private sector financing scheme.
- The Prequalification, Bid and Award Committee of PPAissued a Resolution recommending the award of thecontract for the rehabilitation of SH to the lowestevaluated responsive bidder.
- Review Mission.
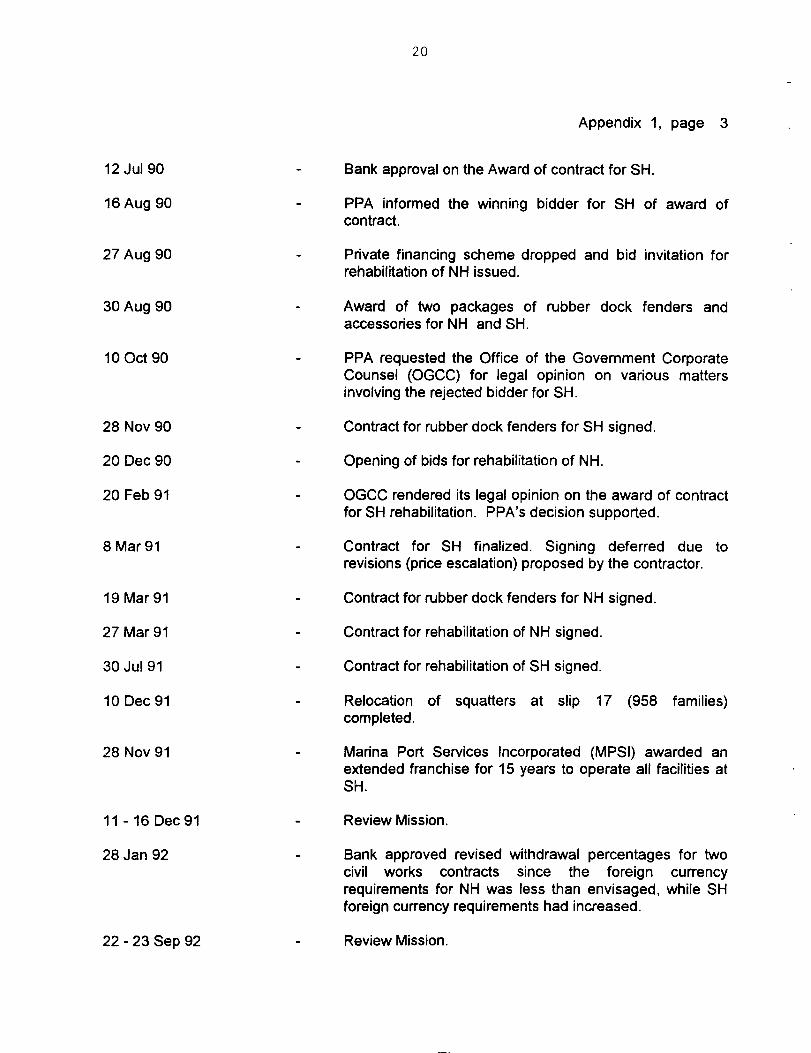
20
Appendix 1, page 3
12 Jul 90
16 Aug 90
27Aug90
30 Aug 90
10Oct90
28 Nov 90
20 Dec 90
20 Feb 91
8Mar91
19Mar91
27Mar91
30 Jul 91
10 Dec91
28 Nov 91
11- 16Dec91
28 Jan 92
22 - 23 Sep 92
- Bank approval on the Award of contract for SH.
- PPA informed the winning bidder for SH of award ofcontract.
- Private financing scheme dropped and bid invitation forrehabilitation of NH issued.
- Award of two packages of rubber dock fenders andaccessories for NH and SH.
- PPA requested the Office of the Government CorporateCounsel (OGCC) for legal opinion on various mattersinvolving the rejected bidder for SH.
- Contract for rubber dock fenders for SH signed.
- Opening of bids for rehabilitation of NH.
- OGCC rendered its legal opinion on the award of contractfor SH rehabilitation. PPA's decision supported.
- Contract for SH finalized. Signing deferred due torevisions (price escalation) proposed by the contractor.
- Contract for rubber dock fenders for NH signed.
- Contract for rehabilitation of NH signed.
- Contract for rehabilitation of SH signed.
- Relocation of squatters at slip 17 (958 families)completed.
- Marina Port Services Incorporated (MPSI) awarded anextended franchise for 15 years to operate all facilities atSH.
- Review Mission.
- Bank approved revised withdrawal percentages for twocivil works contracts since the foreign currencyrequirements for NH was less than envisaged, while SHforeign currency requirements had increased.
- Review Mission.
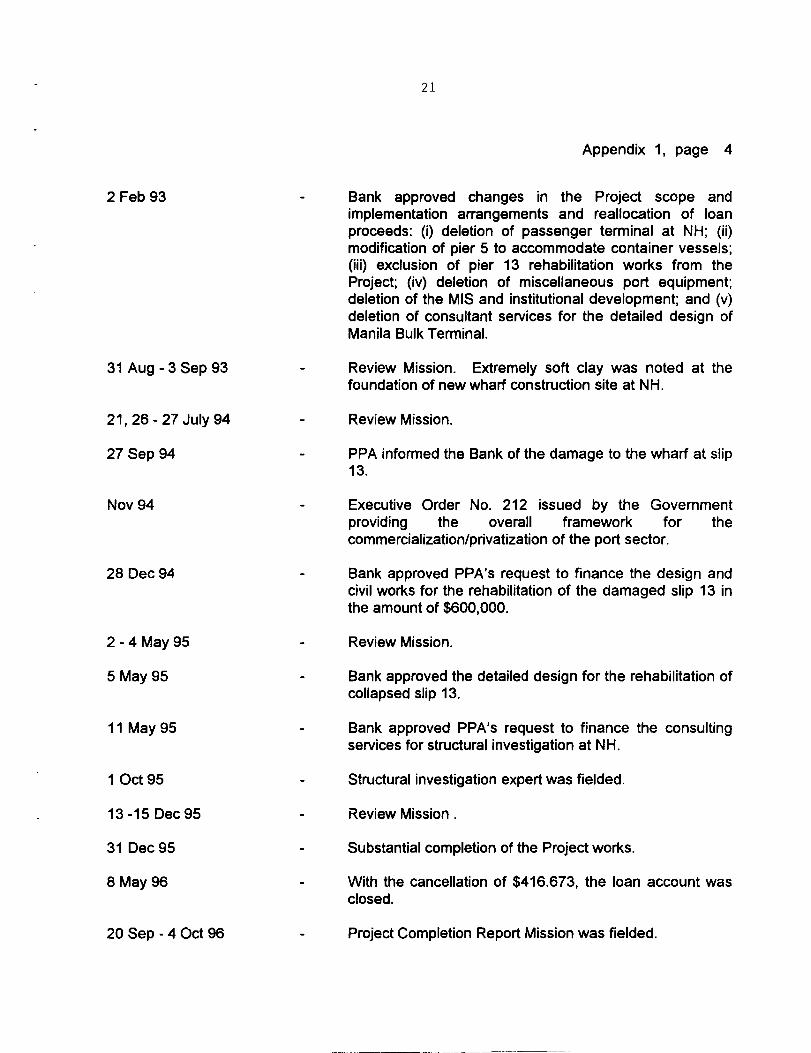
21
Appendix 1, page 4
2 Feb 93
31 Aug - 3 Sep 93
21,26- 27July94
27 Sep 94
Nov 94
28 Dec 94
2 - 4 May 95
5 May 95
11 May95
1Oct95
13-15 Dec95
31Dec95
8May96
20 Sep - 4 Oct 96
Bank approved changes in the Project scope andimplementation arrangements and reallocation of loanproceeds: (i) deletion of passenger terminal at NH; (ii)modification of pier 5 to accommodate container vessels;(iii) exclusion of pier 13 rehabilitation works from theProject; (iv) deletion of miscellaneous port equipment;deletion of the MIS and institutional development; and (v)deletion of consultant services for the detailed design ofManila Bulk Terminal.
Review Mission. Extremely soft clay was noted at thefoundation of new wharf construction site at NH.
Review Mission.
PPA informed the Bank of the damage to the wharf at slip13.
- Executive Order No. 212 issued by the Governmentproviding the overall framework for thecommercialization/pnvatization of the port sector.
- Bank approved PPA's request to finance the design andcivil works for the rehabilitation of the damaged slip 13 inthe amount of $600,000.
- Review Mission.
- Bank approved the detailed design for the rehabilitation ofcollapsed slip 13.
- Bank approved PPA's request to finance the consultingservices for structural investigation at NH.
- Structural investigation expert was fielded.
- Review Mission.
- Substantial completion of the Project works.
- With the cancellation of $416.673, the loan account wasclosed.
- Project Completion Report Mission was fielded.
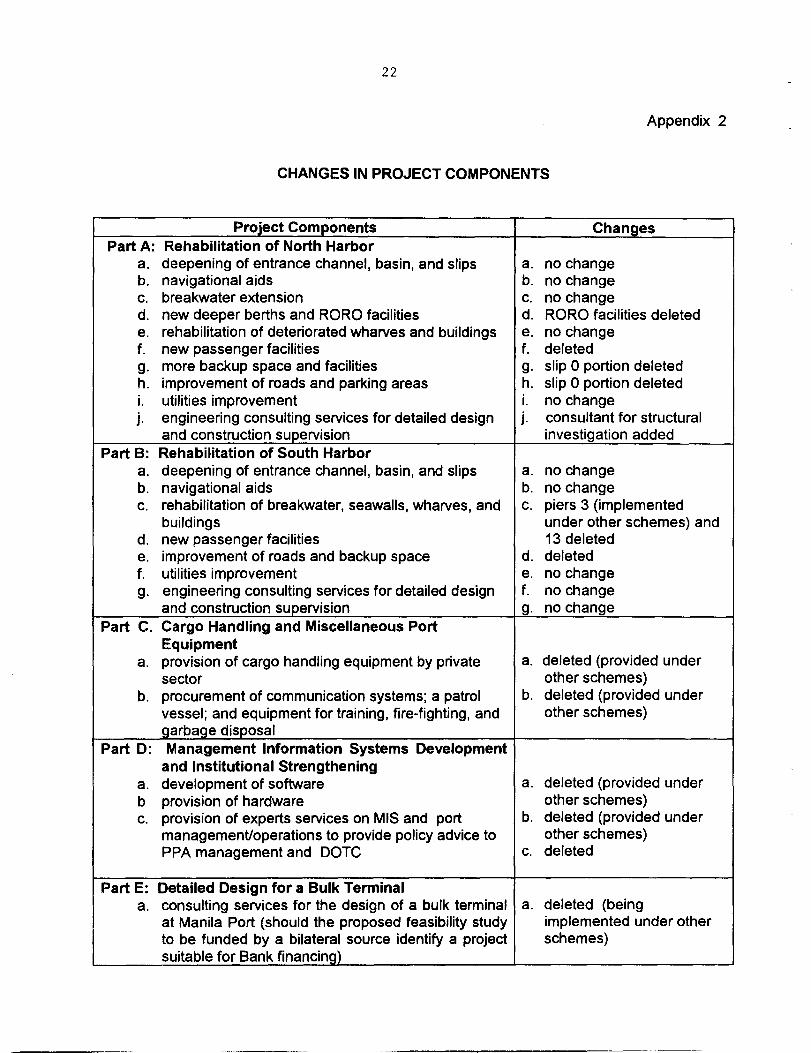
22
Appendix 2
CHANGES IN PROJECT COMPONENTS
Project Components ChangesPart A: Rehabilitation of North Harbor
a. deepening of entrance channel, basin, and slips a. no changeb. navigational aids b. no changec. breakwater extension c. no changed. new deeper berths and RORO facilities d. RORO facilities deletede. rehabilitation of deteriorated wharves and buildings e. no changef. new passenger facilities f. deletedg. more backup space and facilities g. slip 0 portion deletedh. improvement of roads and parking areas h. slip 0 portion deletedi. utilities improvement i. no changej. engineering consulting services for detailed design j . consultant for structural
and construction supervision investigation addedPart B: Rehabilitation of South Harbor
a. deepening of entrance channel, basin, and slips a. no changeb. navigational aids b. no changec. rehabilitation of breakwater, seawalls, wharves, and c. piers 3 (implemented
buildings under other schemes) andd. new passenger facilities 13 deletede. improvement of roads and backup space d. deletedf. utilities improvement e. no changeg. engineering consulting services for detailed design f. no change
and construction supervision g. no changePart C. Cargo Handling and Miscellaneous Port
Equipmenta. provision of cargo handling equipment by private a. deleted (provided under
sector other schemes)b. procurement of communication systems; a patrol b. deleted (provided under
vessel; and equipment for training, fire-fighting, and other schemes)
garbage_disposal ___________________________Part D: Management Information Systems Development
and Institutional Strengtheninga. development of software a. deleted (provided underb provision of hardware other schemes)c. provision of experts services on MIS and port b. deleted (provided under
management/operations to provide policy advice to other schemes)PPA management and DOTC c. deleted
Part E: Detailed Design for a Bulk Terminala. consulting services for the design of a bulk terminal a. deleted (being
at Manila Port (should the proposed feasibility study implemented under otherto be funded by a bilateral source identify a project schemes)suitablefor Bank financing) __________________________-
23
Appendix 3
APPRAISED AND ACTUAL PROJECT COST($ million)
______APPRAISED______ _______ ACTUAL _______Component Foreign Local Total Foreign Local Total
NORTH HARBORCivil Works 13.43 15.08 28.51 10.84 23.25 34.09Rubber Dock Fenders 0.00 0.00 0.00 0.77 0.54 1.31Dredging 1.59 0.40 1.99 1.34 0.41 1.75Consultants 1.50 0.90 2.40 3.23 1.15 4.38
Subtotal 16.52 16.38 32.90 16.18 25.35 41.53
SOUTH HARBORCivil Works 6.79 8.78 15.57 16.44 10.25 26.69Rubber Dock Fenders 0.00 0.00 0.00 1.66 1.26 2.92Dredging 1.00 0.25 1.25 0.85 0.21 1.06Consultants 1.00 0.60 1.60 1.58 1.30 2.88
Subtotal 8.79 9.63 18.42 20.53 13.02 33.55
EQUIPMENTCargo Handling Equip. 6.00 0.60 6.60 0.00 0.00 0.00Miscellaneous Port Equip. 2.00 0.20 2.20 0.00 0.00 0.00
Subtotal 8.00 0.80 8.80 0.00 0.00 0.00
Management InformationSystems, InstitutionalDevelopment, ComputerEquipment, and Software 1.80 0.18 1.98 0.00 0.00 0.00
Detailed Design ofBulklerminal 0.90 0.42 1.32 0.00 0.00 0.00
Contingency 8.02 8.88 16.90 0.00 0.00 0.00a) Physical Contingency 5.80 5.09 10.89b) Price Escalation 3.22 3.79 6.01
Interest and Other Charges 6.37 0.00 6.37 9.71 0.00 9.71DuringConstruction _________ ________ ________ _________
TOTAL 50.40 36.29 86.69 46.42 38.37 84.79
FINANCING ARRANGEMENTS
($ million)
_______________ APPRAISED _______________ ________________ ACTUAL _______________Component ____ BANK ____ PPA PRIVATE SECTOR TOTAL ____ BANK ____ PPA ____ TOTAL
___________________________ Foreign Local Total Foreign Local Total Local Total Local Total Foreign Local Total Foreign Local Total Foreign Local TotalNORTH HARBOR
CMI Works 13.43 0.00 13.43 0.00 15.08 15.08 13.43 15.08 28.51 10.84 0.00 10.84 0.00 23.25 23.25 10.84 23.25 34.09
Rubber Dock Fenders ' 0.00 0.00 0.00 0.00 0.00 0.00 0.00 0.00 0.00 0.77 0.00 0.77 0.00 0.54 0.54 0.77 0.54 1.31Dredging 1.59 0.00 1.59 0.00 0.40 0.40 1.59 0.40 1.99 1.34 0.00 1.34 0.00 0.41 0.41 1.34 0.41 1.75Design & Construction
Supervision 1.50 0.00 1.50 0.00 0.90 0.90 1.50 0.90 2.40 3.19 0.00 3.19 0.00 1.15 1.15 3.19 1.15 4.34Structural Investigation 0.00 0.00 0.00 0.00 0.00 0.00 0.00 0.00 0.00 0.04 0.00 0.04 0.00 0.00 0.00 0.04 0.00 0.04
Subtotal 16.52 0.00 16.52 0.00 16.38 16.38 16.52 16.38 32.90 16.18 0.00 16.18 0.00 25.35 25.35 16.18 25.35 41.53SOUTH HARBOR
Civil Works 6.79 0.00 6.79 0.00 8.78 8.78 6.79 8.78 15.57 16.44 0.00 16.44 0.00 10.25 10.25 16.44 10.25 26.69Rubber Dock Fenders ' 0.00 0.00 0.00 0.00 0.00 0.00 0.00 0.00 0.00 1.66 0.00 1.66 0.00 1.26 1.26 1.66 1.26 2.92Dredging 1.00 0.00 1.00 0.00 0.25 0.25 1.00 0.25 1.25 0.85 0.00 0.85 0.00 0.21 0.21 0.85 0.21 1.06Design & Construction
Supervision 1.00 0.00 1.00 0.00 0.60 0.60 1.00 0.60 1.60 1.58 0.00 1.58 0.00 1.30 1.30 1.58 1.30 2.88Subtotal 8.79 0.00 8.79 0.00 9.63 9.63 8.79 9.63 18.42 20.53 0.00 20.53 0.00 13.02 13.02 20.53 13.02 33.55
EQUIPMENT b
Cargo Handling Equipment 0.00 0.00 0.00 0.00 0.00 0.00 6.00 0.60 6.60 6.00 0.60 6.60Misc. Port Equipment 2.00 0.00 2.00 0.00 0.20 0.20 0.00 0.00 0.00 2.00 0.20 2.20 _____ _____ _____
Subtotal 2.00 0.00 2.00 0.00 0.20 0.20 6.00 0.60 6.60 8.00 0.80 8.80 _____ _____ _____
MIS and lnstl. Development b 1.80 0.00 1.80 0.00 0.18 0.18 1.80 0.18 1.98
Bulk Terminal b 0.90 0.00 0.90 0.00 0.42 0.42 0.90 0.42 1.32UNALLOCATED 7.12 0.00 7.12 0.00 8.78 8.78 0.90 0.10 1.00 8.02 8.88 16.90 0.00 0.00 0.00 0.00 0.00 0.00 0.00 0.00 0.00bC 6.37 0.00 6.37 0.00 0.00 0.00 6.37 0.00 6.37 6.37 0.00 6.37 3.34 0.00 3.34 9.71 0.00 9.71
Total 43.50 0.00 43.50 0.00 35.59 35.59 6.90 0.70 7.60 50.40 36.29 86.69 43.08 0.00 43.08 3.34 38.37 41.71 46.42 38.37 84.79
Originally envisaged to be included in the scope of civil works contracts.
Deleted from Project scope
-N
26
Appendix 6
CONTRACT PACKAGES
Contract APPRAISED ACTUAL
Number Description Contract Amount Method of Contract Amount Method of
_____________ ________________________________ ($ million) Procurement amillion) Procurement a
Contract 1 North Harbor Civil Works 28.51 ICB 34.09 ICB
Contract 1-A Norh Harbor Rubber Dock Fenders 0.00 - 1.31 ICB
Contract 2 Dredging North Harbor 1.99 FA 1.75 FA
Contract 3 Consulting Services (North Harbor) 2.40 1GB 4.34 ICB
Contract 3-A Structural Investigation Expert 0.00 - 0.04 DP
Contract 4 South Harbor CMI Works 15.57 ICB 26.69 ICB
Contract 4-A South Harbor Rubber Dock Fenders 0.00 - 2.92 ICB
Contract 5 Dredging South Harbor 1 .25 FA 1.06 FA
Contract 6 Consulting Services (South Harbor) 1.60 ICB 2.88 ICB
Contract 7 Equipment 2.20 ICB or IS deleted -
Contract 8 Management Information Systems
Development 0.30 ICB deleted -
Contract 9 Computer Equipment and Software 1.08 IS deleted -
Contract 10 Management Information Systems
Advisor 0.30 ICB deleted -
Contract 11 Port Management/Operations
Advisor 0.30 ICB deleted -
Contract 12 Detailed Design for Bulk Terminal 1.32 1GB deleted -
____________ Total 56.82 ___________ 75.08 ____________
a ICB - International Competitive BiddingIS - International ShoppingFA - Force AccountDP - Direct Purchase
Reference to
Status ofLoan Agreement
Compliance
Sch. 6, para. 1
Complied with
Sch. 6, para. 2
Complied with
Sch. 6, para. 3(a)
Complied with
27
Appendix 7, Page 1
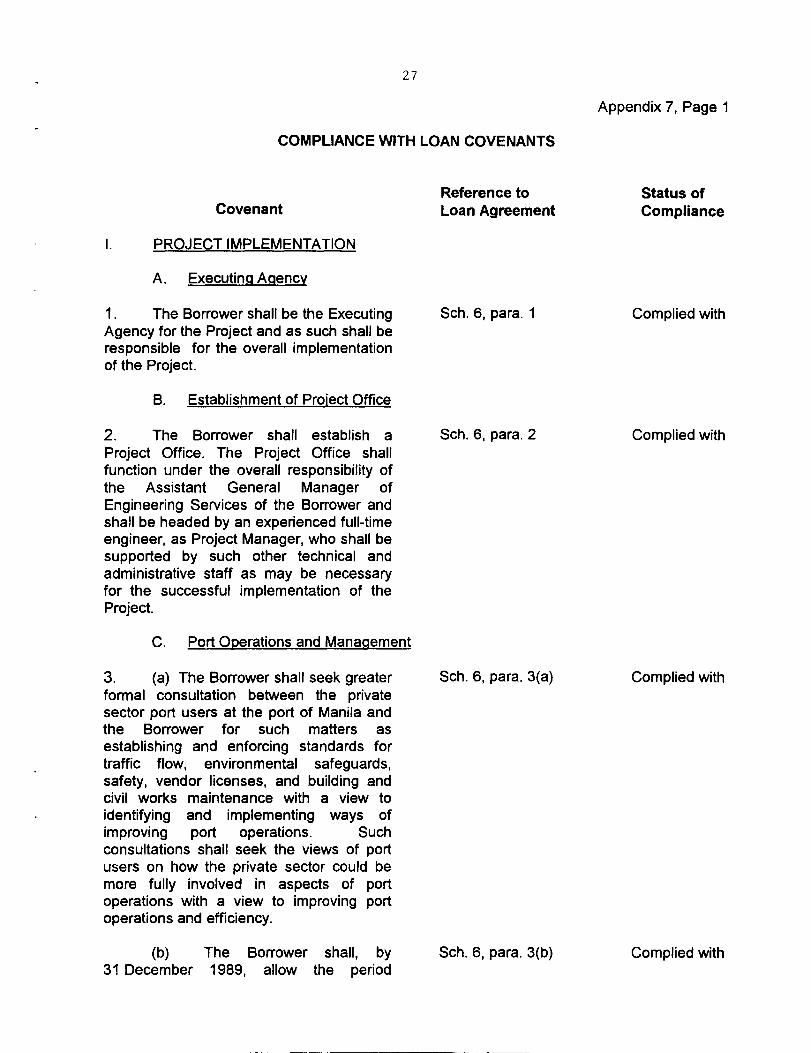
COMPLIANCE WITH LOAN COVENANTS
Covenant
PROJECT IMPLEMENTATION
A. Executing Agency
1. The Borrower shall be the ExecutingAgency for the Project and as such shall beresponsible for the overall implementationof the Project.
B. Establishment of Prolect Office
2. The Borrower shall establish aProject Office. The Project Office shallfunction under the overall responsibility ofthe Assistant General Manager ofEngineering Services of the Borrower andshall be headed by an experienced full-timeengineer, as Project Manager, who shall besupported by such other technical andadministrative staff as may be necessaryfor the successful implementation of theProject.
C. Port Operations and Management
3. (a) The Borrower shall seek greaterformal consultation between the privatesector port users at the port of Manila andthe Borrower for such matters asestablishing and enforcing standards fortraffic flow, environmental safeguards,safety, vendor licenses, and building andcivil works maintenance with a view toidentifying and implementing ways ofimproving port operations. Suchconsultations shall seek the views of portusers on how the private sector could bemore fully involved in aspects of portoperations with a view to improving portoperations and efficiency.
(b) The Borrower shall, by Sch. 6, para. 3(b) Complied with31 December 1989, allow the period
A. General
4. Except as the Bank and the Section 4.10Borrower shall otherwise agree, theBorrower shall not sell or otherwise disposeof any of its assets, except in the ordinarycourse of its business.
B. Revaluation of Fixed Assets
28
Appendix 7, Page 2
Reference to
Status ofCovenant
Loan Agreement
Compliance
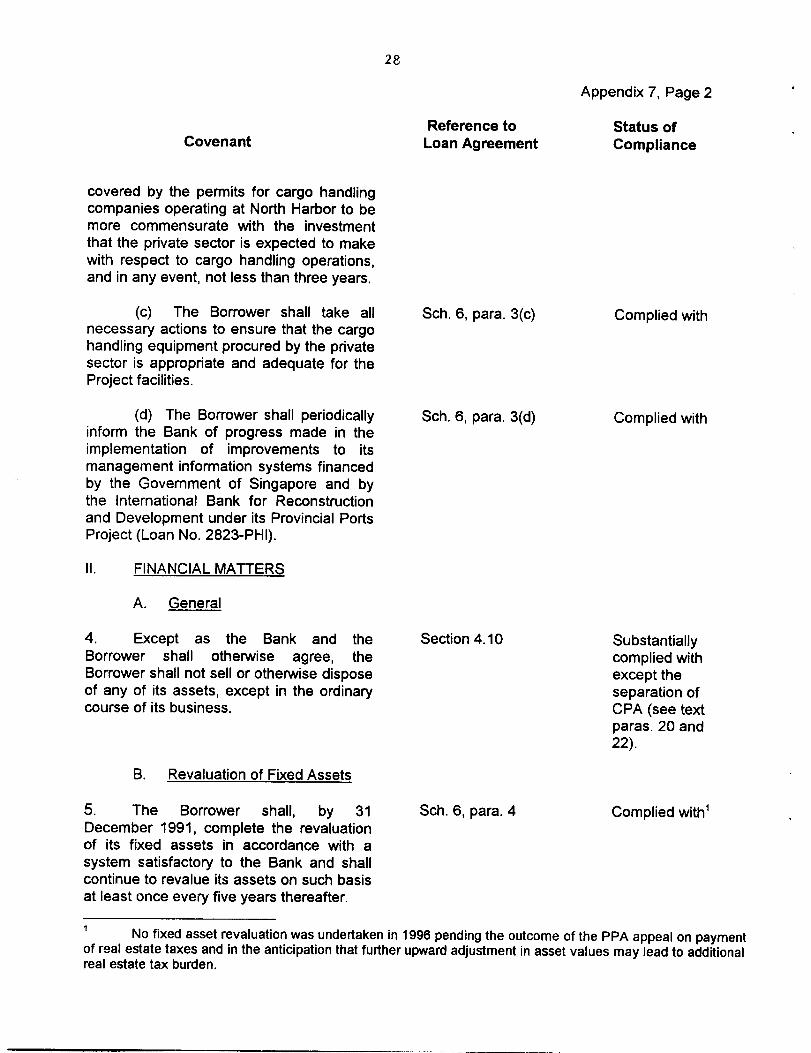
covered by the permits for cargo handlingcompanies operating at North Harbor to bemore commensurate with the investmentthat the private sector is expected to makewith respect to cargo handling operations,and in any event, not less than three years.
(c) The Borrower shall take all Sch. 6, para. 3(c)necessary actions to ensure that the cargohandling equipment procured by the privatesector is appropriate and adequate for theProject facilities.
Complied with
(d) The Borrower shall periodicallyinform the Bank of progress made in theimplementation of improvements to itsmanagement information systems financedby the Government of Singapore and bythe International Bank for Reconstructionand Development under its Provincial PortsProject (Loan No. 2823-PHI).
II. FINANCIAL MATTERS
5. The Borrower shall, by 31December 1991, complete the revaluationof its fixed assets in accordance with asystem satisfactory to the Bank and shallcontinue to revalue its assets on such basisat least once every five years thereafter.
Sch. 6, para. 3(d) Complied with
Substantiallycomplied withexcept theseparation ofCPA (see textparas. 20 and22).
Sch. 6, para. 4 Complied with1
No fixed asset revaluation was undertaken in 1996 pending the outcome of the PPA appeal on paymentof real estate taxes and in the anticipation that further upward adjustment in asset values may lead to additionalreal estate tax burden.
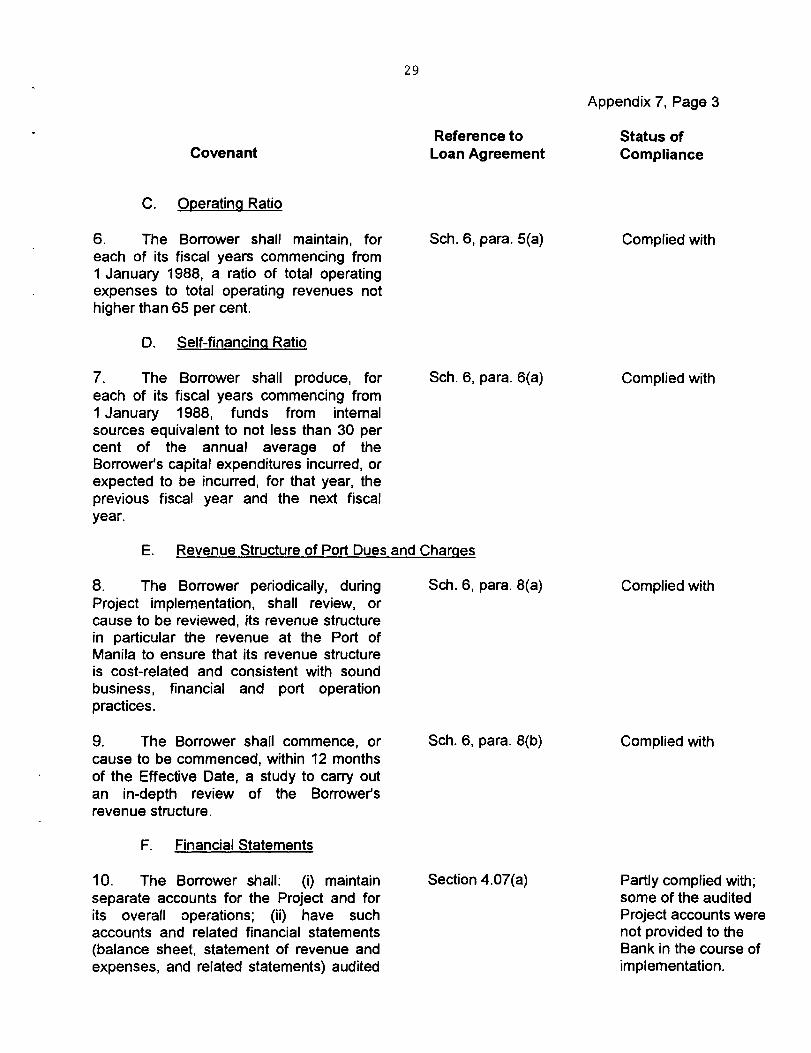
9. The Borrower shall commence, or Sch. 6, para. 8(b)cause to be commenced, within 12 monthsof the Effective Date, a study to carry outan in-depth review of the Borrower'srevenue structure.
F. Financial Statements
29
Appendix 7, Page 3
Reference to
Status ofCovenant
Loan Agreement
Compliance
C. Operating Ratio
6. The Borrower shall maintain, for Sch. 6, para. 5(a)each of its fiscal years commencing from1 January 1988, a ratio of total operatingexpenses to total operating revenues nothigher than 65 per cent.
0. Self-financing Ratio
Complied with
7. The Borrower shall produce, foreach of its fiscal years commencing from1 January 1988, funds from internalsources equivalent to not less than 30 percent of the annual average of theBorrower's capital expenditures incurred, orexpected to be incurred, for that year, theprevious fiscal year and the next fiscalyear.
Sch. 6, para. 6(a) Complied with
E. Revenue Structure of Port Dues and Charges
Sch. 6, para. 8(a)
Section 4.07(a)
8. The Borrower periodically, duringProject implementation, shall review, orcause to be reviewed, its revenue structurein particular the revenue at the Port ofManila to ensure that its revenue structureis cost-related and consistent with soundbusiness, financial and port operationpractices.
10. The Borrower shall: (i) maintainseparate accounts for the Project and forits overall operations; (ii) have suchaccounts and related financial statements(balance sheet, statement of revenue andexpenses, and related statements) audited
Complied with
Complied with
Partly complied with;some of the auditedProject accounts werenot provided to theBank in the course ofimplementation.
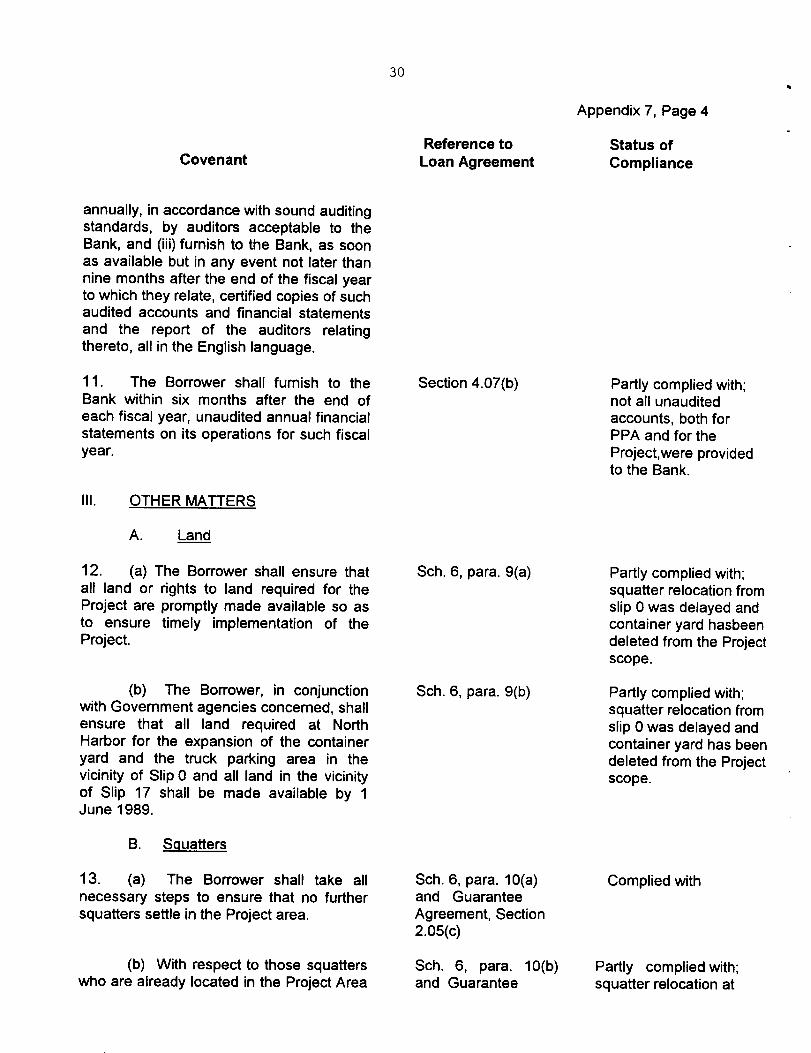
annually, in accordance with sound auditingstandards, by auditors acceptable to theBank, and (iii) furnish to the Bank, as soonas available but in any event not later thannine months after the end of the fiscal yearto which they relate, certified copies of suchaudited accounts and financial statementsand the report of the auditors relatingthereto, all in the English language.
11. The Borrower shall furnish to the Section 4.07(b)Bank within six months after the end ofeach fiscal year, unaudited annual financialstatements on its operations for such fiscalyear.
Ill. OTHER MATTERS
A. Land
12. (a) The Borrower shall ensure that Sch. 6, para. 9(a)all land or rights to land required for theProject are promptly made available so asto ensure timely implementation of theProject.
Partly complied with;not all unauditedaccounts, both forPPA and for theProject,were providedto the Bank.
Partly complied with;squatter relocation fromslip 0 was delayed andcontainer yard hasbeendeleted from the Projectscope.
30
Appendix 7, Page 4
Reference to
Status ofCovenant
Loan Agreement
Compliance
(b) The Borrower, in conjunctionwith Government agencies concerned, shallensure that all land required at NorthHarbor for the expansion of the containeryard and the truck parking area in thevicinity of Slip 0 and all land in the vicinityof Slip 17 shall be made available by 1June 1989.
B. Squatters
13. (a) The Borrower shall take allnecessary steps to ensure that no furthersquatters settle in the Project area.
Sch. 6, para. 9(b)
Sch. 6, para. 10(a)and GuaranteeAgreement, Section2.05(c)
Partly complied with;squatter relocation fromslip 0 was delayed andcontainer yard has beendeleted from the Projectscope.
Complied with
(b) With respect to those squatters Sch. 6, para. 10(b) Partly complied with;
who are already located in the Project Area and Guarantee squatter relocation at
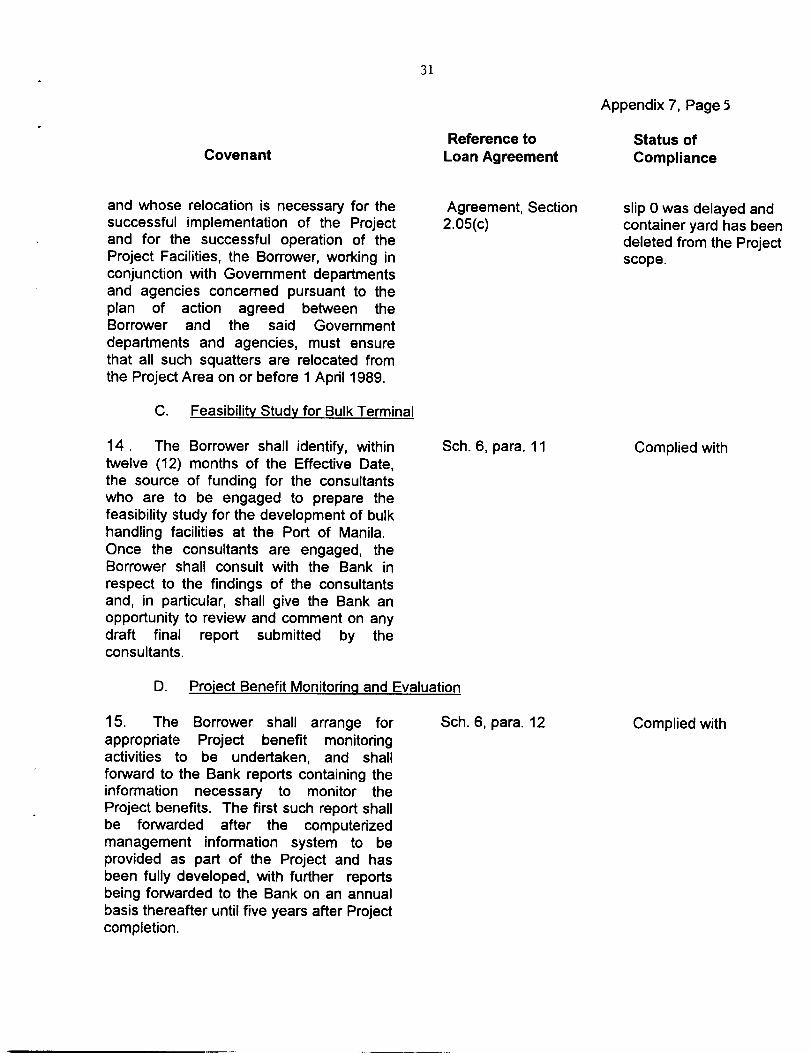
Status ofCompliance
slip 0 was delayed andcontainer yard has beendeleted from the Projectscope.
Complied with
31
Appendix 7, Page 5
Reference toLoan AgreementCovenant
and whose relocation is necessary for thesuccessful implementation of the Projectand for the successful operation of theProject Facilities, the Borrower, working inconjunction with Government departmentsand agencies concerned pursuant to theplan of action agreed between theBorrower and the said Governmentdepartments and agencies, must ensurethat all such squatters are relocated fromthe Project Area on or before 1 April 1989.
Agreement, Section2.05(c)
C. Feasibility Study for Bulk Terminal
14. The Borrower shall identify, withintwelve (12) months of the Effective Date,the source of funding for the consultantswho are to be engaged to prepare thefeasibility study for the development of bulkhandling facilities at the Port of Manila.Once the consultants are engaged, theBorrower shall consult with the Bank inrespect to the findings of the consultantsand, in particular, shall give the Bank anopportunity to review and comment on anydraft final report submitted by theconsultants.
Sch. 6, para. 11
D. Project Benefit Monitorinçj and Evaluation
15. The Borrower shall arrange forappropriate Project benefit monitoringactivities to be undertaken, and shallforward to the Bank reports containing theinformation necessary to monitor theProject benefits. The first such report shallbe forwarded after the computerizedmanagement information system to beprovided as part of the Project and hasbeen fully developed, with further reportsbeing forwarded to the Bank on an annualbasis thereafter until five years after Projectcompletion.
Sch. 6, para. 12 Complied with
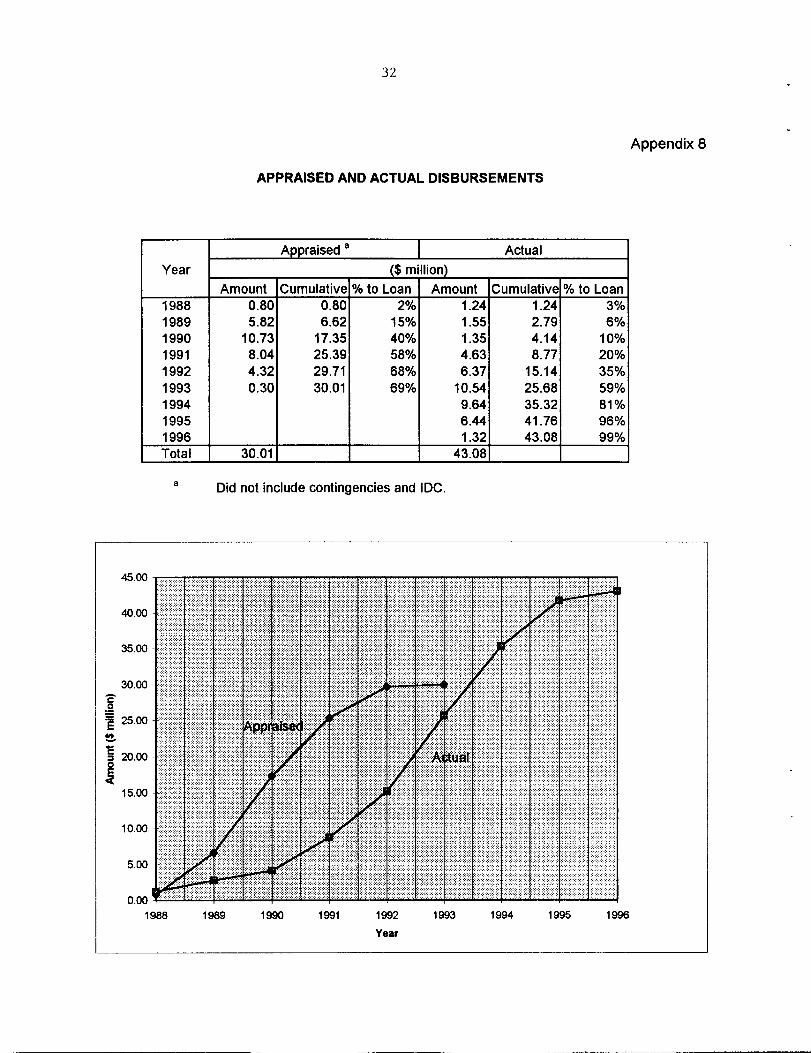
32
Appendix 8
APPRAISED AND ACTUAL DISBURSEMENTS
Appraised a Actual
Year_________ __________ ($ million) __________ _________
________ Amount Cumulative % to Loan Amount Cumulative % to Loan1988 0.80 0.80 2% 1.24 1.24 3%1989 5.82 6.62 15% 1.55 2.79 6%1990 10.73 17.35 40% 1.35 4.14 10%1991 8.04 25.39 58% 4.63 8.77 20%1992 4.32 29.71 68% 6.37 15.14 35%1993 0.30 30.01 69% 10.54 25.68 59%1994 9.64 35.32 81%1995 6.44 41.76 96%1996 _______ ________ _______ 1.32 43.08 99%Total30.01 _________ ________ 43.08 _________ ________
a Did not include contingencies and IDC.
45.00
40.00
35.00
30.00
C0
25.00
20.00
15.00
I1988 1989 1990 1991 1992 1993 1994 1995 1996
Year
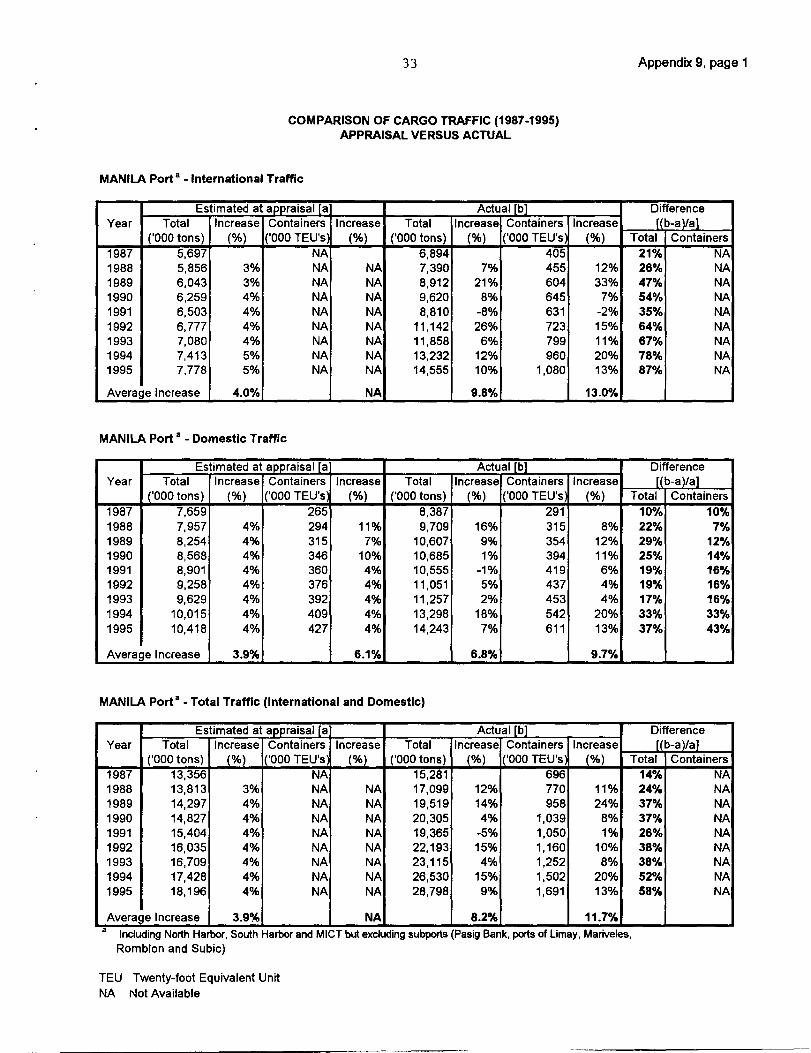
33
Appendix 9, page 1
COMPARISON OF CARGO TRAFFIC (1987-1995)APPRAISAL VERSUS ACTUAL
MANILA pOi t a - International Traffic
Estimated_at appraisal [a ________ __________ Actual [b] _______ DifferenceYear Total Increase Containers Increase Total Increase Containers Increase [(b-a)Ia]
_____ ('000 tons) (%) ('000 TEUs (%) ('000 tons) (%) ('000 TEU's (%) Total Containers1987 5,697 NA 6,894 405 21% NA1988 5856 3% NA NA 7,390 7% 455 12% 26% NA1989 6,043 3% NA NA 8,912 21% 604 33% 47% NA1990 6,259 4% NA NA 9,620 8% 645 7% 54% NA1991 6,503 4% NA NA 8,810 -8% 631 -2% 35% NA1992 6,777 4% NA NA 11,142 26% 723 15% 64% NA1993 7,080 4% NA NA 11,858 6% 799 11% 67% NA1994 7,413 5% NA NA 13,232 12% 960 20% 78% NA1995 7,778 5% NA NA 14,555 10% 1,080 13% 87% NA
AverageIncrease 4.0% _________ NA _________ 9.8% _________ 13.0% _____ _________
MANILA Port a - Domestic Traffic
Estimated_at appraisal [a ________ __________ Actual [b] _______ DifferenceYear Total Increase Containers Increase Total Increase Containers Increase [(b-a)/a]
_____ ('000 tons) (%) ('000 TEU's (%) ('000 tons) (%) ('000 TEU's (%) Total Containers1987 7,659 265 8,387 291 10% 10%1988 7,957 4% 294 11% 9709 16% 315 8% 22% 7%1989 8254 4% 315 7% 10607 9% 354 12% 29% 12%1990 8,568 4% 346 10% 10,685 1% 394 11% 25% 14%1991 8,901 4% 360 4% 10,555 -1% 419 6% 19% 16%1992 9,258 4% 376 4% 11,051 5% 437 4% 19% 16%1993 9,629 4% 392 4% 11,257 2% 453 4% 17% 16%1994 10,015 4% 409 4% 13,298 18% 542 20% 33% 33%1995 10,418 4% 427 4% 14,243 7% 611 13% 37% 43%
AverageIncrease 3.9% _________ 6.1% _________ 6.8% _________ 9.7% _____ _________
MANILA Port a - Total Traffic (International and Domestic)
Estimated_at appraisal [a ________ __________ Actual [b] _______ DifferenceYear Total Increase Containers Increase Total Increase Containers Increase [(b-a)Ia]
_____ ('000 tons) (%) ('000 TEU's (%) ('000 tons) (%) ('000 TEU's (%) Total Containers1987 13,356 NA 15,281 696 14% NA1988 13,813 3% NA NA 17,099 12% 770 11% 24% NA1989 14,297 4% NA NA 19,519 14% 958 24% 37% NA1990 14,827 4% NA NA 20,305 4% 1,039 8% 37% NA1991 15,404 4% NA NA 19,365 -5% 1,050 1% 26% NA1992 16,035 4% NA NA 22,193 15% 1,160 10% 38% NA1993 16,709 4% NA NA 23,115 4% 1,252 8% 38% NA1994 17,428 4% NA NA 26,530 15% 1,502 20% 52% NA1995 18,196 4% NA NA 28,798 9% 1,691 13% 58% NA
Average Increase 3.9% _________ NA _________ 8.2% _________ 11.7% _____ _________a Including North Hamor, South Harbor and MICT but excluding subports (Pasig Bank, ports of Limay, Mariveles,
Romblon and Subic)
TEU Twenty-foot Equivalent UnitNA Not Available
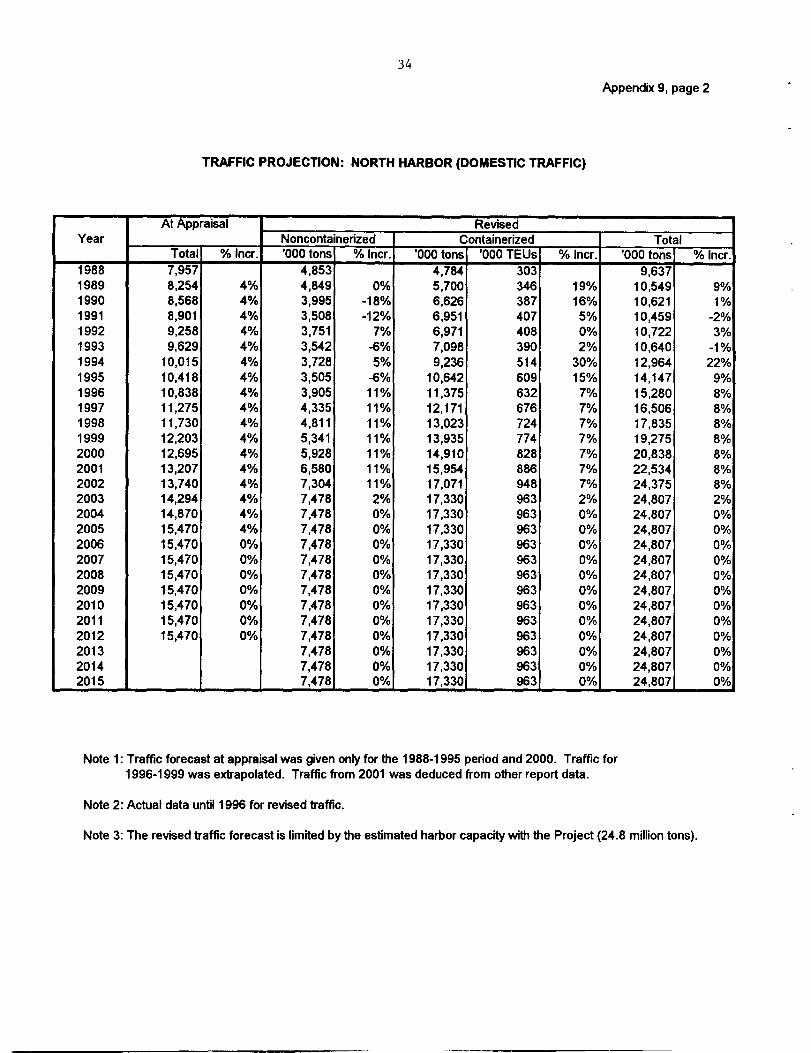
34
Appendix 9, page 2
TRAFFIC PROJECTION: NORTH HARBOR (DOMESTIC TRAFFIC)
AtAppraisal __________________ Revised __________________Year _________ ________ Noncontainerized Containerized ________ Total_______
__________ Total % lncr. '000 tons % Incr. '000 tons '000 TEUs % lncr. '000 tons % Incr.1988 7,957 4,853 4,784 303 9,6371989 8,254 4% 4,849 0% 5,700 346 19% 10,549 9%1990 8,568 4% 3,995 -18% 6,626 387 16% 10,621 1%1991 8,901 4% 3,508 -12% 6,951 407 5% 10,459 -2%1992 9,258 4% 3,751 7% 6,971 408 0% 10,722 3%1993 9,629 4% 3,542 -6% 7,098 390 2% 10,640 -1%1994 10,015 4% 3,728 5% 9,236 514 30% 12,964 22%1995 10,418 4% 3,505 -6% 10,642 609 15% 14,147 9%1996 10,838 4% 3,905 11% 11,375 632 7% 15,280 8%1997 11,275 4% 4,335 11% 12,171 676 7% 16,506 8%1998 11,730 4% 4,811 11% 13,023 724 7% 17,835 8%1999 12,203 4% 5,341 11% 13,935 774 7% 19,275 8%2000 12,695 4% 5,928 11% 14,910 828 7% 20,838 8%2001 13,207 4% 6,580 11% 15,954 886 7% 22,534 8%2002 13,740 4% 7,304 11% 17,071 948 7% 24,375 8%2003 14,294 4% 7,478 2% 17,330 963 2% 24,807 2%2004 14,870 4% 7,478 0% 17,330 963 0% 24,807 0%2005 15,470 4% 7,478 0% 17,330 963 0% 24,807 0%2006 15,470 0% 7,478 0% 17,330 963 0% 24,807 0%2007 15,470 0% 7,478 0% 17,330 963 0% 24,807 0%2008 15,470 0% 7,478 0% 17,330 963 0% 24,807 0%2009 15,470 0% 7,478 0% 17,330 963 0% 24,807 0%2010 15,470 0% 7,478 0% 17,330 963 0% 24,807 0%2011 15,470 0% 7,478 0% 17,330 963 0% 24,807 0%2012 15,470 0% 7,478 0% 17,330 963 0% 24,807 0%2013 7,478 0% 17,330 963 0% 24,807 0%2014 7,478 0% 17,330 963 0% 24,807 0%2015 _________ _______ 7,478 0% 17,330 963 0% 24,807 0%
Note 1: Traffic forecast at appraisal was given only for the 1988-1995 period and 2000. Traffic for1996-1999 was extrapolated. Traffic from 2001 was deduced from other report data.
Note 2: Actual data until 1996 for revised traffic.
Note 3: The revised traffic forecast is limited by the estimated harbor capacity with the Project (24.8 million tons).
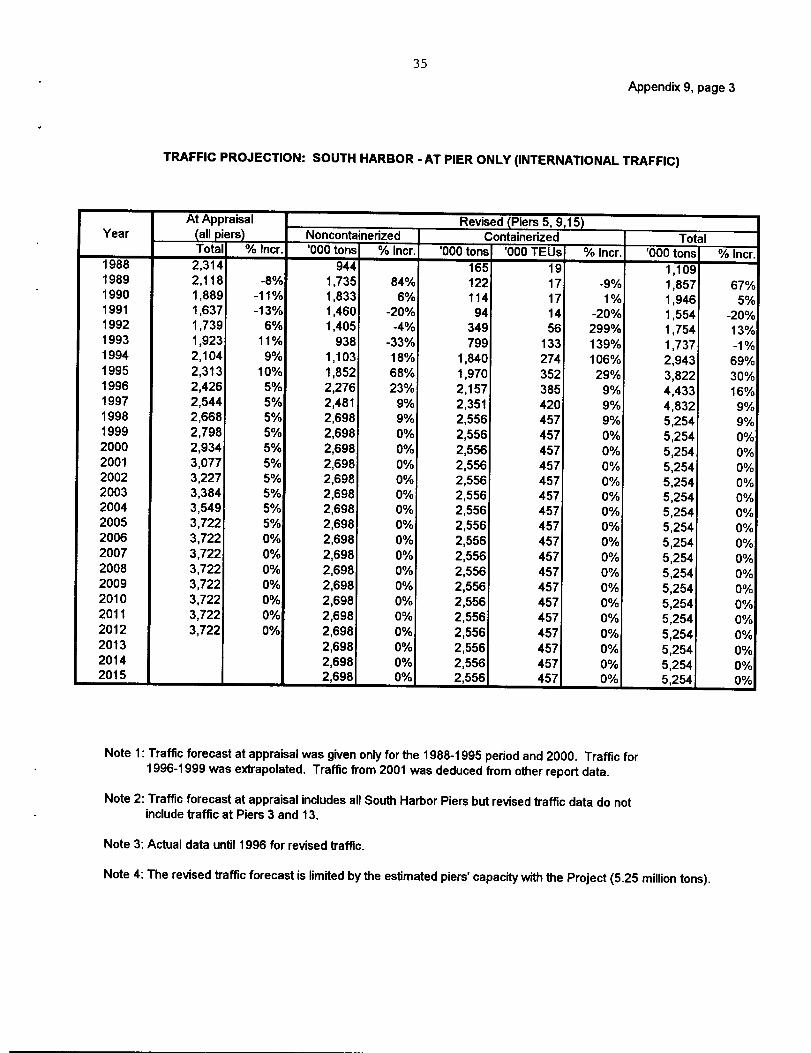
35
Appendix 9, page 3
TRAFFIC PROJECTION: SOUTH HARBOR - AT PIER ONLY (INTERNATIONAL TRAFFIC)
At Appraisal ___________________ Revised (Piers 5, 9,15) ____________________Year (all piers) Noncontainerjzed Containerized ________ Total
__________ Total % lncr. .000 tons % Incr. '000 tons '000 TEUs % lncr. '000 tons % Incr.1988 2,314 944 165 19 1,1091989 2,118 -8% 1,735 84% 122 17 -9% 1,857 67%1990 1,889 -11% 1,833 6% 114 17 1% 1,946 5%1991 1,637 -13% 1,460 -20% 94 14 -20% 1,554 -20%1992 1,739 6% 1,405 -4% 349 56 299% 1,754 13%1993 1,923 11% 938 -33% 799 133 139% 1,737 -1%1994 2,104 9% 1,103 18% 1,840 274 106% 2,943 69%1995 2,313 10% 1,852 68% 1,970 352 29% 3,822 30%1996 2,426 5% 2,276 23% 2,157 385 9% 4,433 16%1997 2,544 5% 2,481 9% 2,351 420 9% 4,832 9%1998 2,668 5% 2,698 9% 2,556 457 9% 5,254 9%1999 2,798 5% 2,698 0% 2,556 457 0% 5,254 0%2000 2,934 5% 2,698 0% 2,556 457 0% 5,254 0%2001 3,077 5% 2,698 0% 2,556 457 0% 5,254 0%2002 3,227 5% 2,698 0% 2,556 457 0% 5,254 0%2003 3,384 5% 2,698 0% 2,556 457 0% 5,254 0%2004 3,549 5% 2,698 0% 2,556 457 0% 5,254 0%2005 3,722 5% 2,698 0% 2,556 457 0% 5,254 0%2006 3,722 0% 2,698 0% 2,556 457 0% 5,254 0%2007 3,722 0% 2,698 0% 2,556 457 0% 5,254 0%2008 3,722 0% 2,698 0% 2,556 457 0% 5,254 0%2009 3,722 0% 2,698 0% 2,556 457 0% 5,254 0%2010 3,722 0% 2,698 0% 2,556 457 0% 5,254 0%2011 3,722 0% 2,698 0% 2,556 457 0% 5,254 0%2012 3,722 0% 2,698 0% 2,556 457 0% 5,254 0%2013 2,698 0% 2,556 457 0% 5,254 0%2014 2,698 0% 2,556 457 0% 5,254 0%2015 _________ _______ 2,698 0% 2,556 457 0% 5,254 0%
Note 1: Traffic forecast at appraisal was given only for the 1988-1995 period and 2000. Traffic for1996-1999 was extrapolated. Traffic from 2001 was deduced from other report data.
Note 2: Traffic forecast at appraisal includes all South Harbor Piers but revised traffic data do notinclude traffic at Piers 3 and 13.
Note 3: Actual data until 1996 for revised traffic.
Note 4: The revised traffic forecast is limited by the estimated piers' capacity with the Project (5.25 million tons).
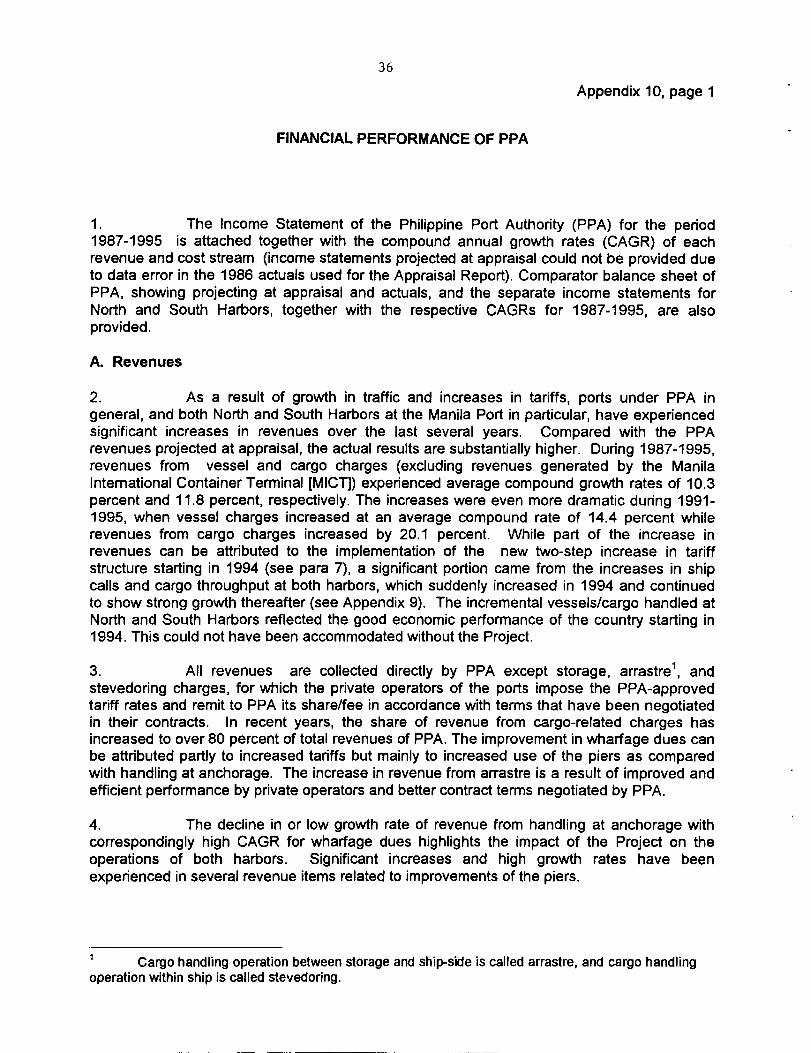
36
Appendix 10, page 1
FINANCIAL PERFORMANCE OF PPA
1. The Income Statement of the Philippine Port Authority (PPA) for the period1987-1995 is attached together with the compound annual growth rates (CAGR) of eachrevenue and cost stream (income statements projected at appraisal could not be provided dueto data error in the 1986 actuals used for the Appraisal Report). Comparator balance sheet ofPPA, showing projecting at appraisal and actuals, and the separate income statements forNorth and South Harbors, together with the respective CAGRs for 1987-1995, are alsoprovided.
A. Revenues
2. As a result of growth in traffic and increases in tariffs, ports under PPA ingeneral, and both North and South Harbors at the Manila Port in particular, have experiencedsignificant increases in revenues over the last several years. Compared with the PPArevenues projected at appraisal, the actual results are substantially higher. During 1987-1995,revenues from vessel and cargo charges (excluding revenues generated by the ManilaInternational Container Terminal [MICT)) experienced average compound growth rates of 10.3percent and 11.8 percent, respectively. The increases were even more dramatic during 1991-1995, when vessel charges increased at an average compound rate of 14.4 percent whilerevenues from cargo charges increased by 20.1 percent. While part of the increase inrevenues can be attributed to the implementation of the new two-step increase in tariffstructure starting in 1994 (see para 7), a significant portion came from the increases in shipcalls and cargo throughput at both harbors, which suddenly increased in 1994 and continuedto show strong growth thereafter (see Appendix 9). The incremental vessels/cargo handled atNorth and South Harbors reflected the good economic performance of the country starting in1994. This could not have been accommodated without the Project.
3. All revenues are collected directly by PPA except storage, arrastre 1 , andstevedoring charges, for which the private operators of the ports impose the PPA-approvedtariff rates and remit to PPA its share/fee in accordance with terms that have been negotiatedin their contracts. In recent years, the share of revenue from cargo-related charges hasincreased to over 80 percent of total revenues of PPA. The improvement in wharfage dues canbe attributed partly to increased tariffs but mainly to increased use of the piers as comparedwith handling at anchorage. The increase in revenue from arrastre is a result of improved andefficient performance by private operators and better contract terms negotiated by PPA.
4. The decline in or low growth rate of revenue from handling at anchorage withcorrespondingly high CAGR for wharfage dues highlights the impact of the Project on theoperations of both harbors. Significant increases and high growth rates have beenexperienced in several revenue items related to improvements of the piers.
1 Cargo handling operation between storage and ship-side is called arrastre, and cargo handlingoperation within ship is called stevedoring.
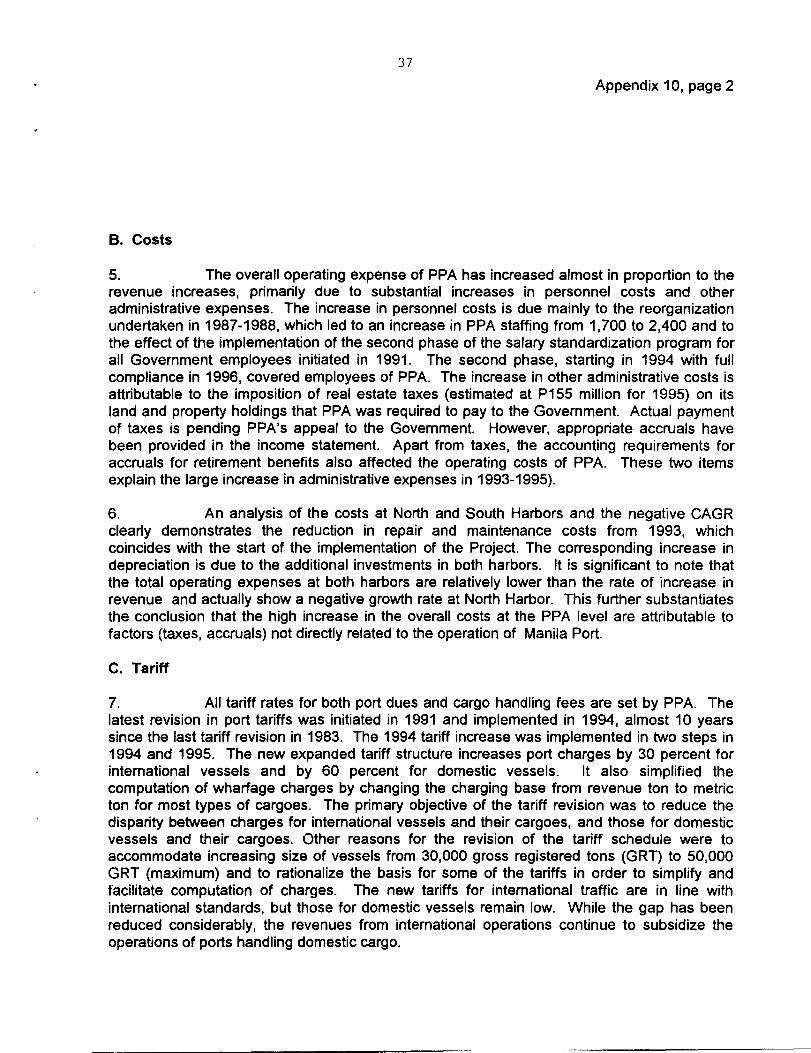
37
Appendix 10, page 2
B. Costs
5. The overall operating expense of PPA has increased almost in proportion to therevenue increases, primarily due to substantial increases in personnel costs and otheradministrative expenses. The increase in personnel costs is due mainly to the reorganizationundertaken in 1987-1988, which led to an increase in PPA staffing from 1,700 to 2,400 and tothe effect of the implementation of the second phase of the salary standardization program forall Government employees initiated in 1991. The second phase, starting in 1994 with fullcompliance in 1996, covered employees of PPA. The increase in other administrative costs isattributable to the imposition of real estate taxes (estimated at P155 million for 1995) on itsland and property holdings that PPA was required to pay to the Government. Actual paymentof taxes is pending PPA's appeal to the Government. However, appropriate accruals havebeen provided in the income statement. Apart from taxes, the accounting requirements foraccruals for retirement benefits also affected the operating costs of PPA. These two itemsexplain the large increase in administrative expenses in 1993-1995).
6. An analysis of the costs at North and South Harbors and the negative CAGRclearly demonstrates the reduction in repair and maintenance costs from 1993, whichcoincides with the start of the implementation of the Project. The corresponding increase indepreciation is due to the additional investments in both harbors. it is significant to note thatthe total operating expenses at both harbors are relatively lower than the rate of increase inrevenue and actually show a negative growth rate at North Harbor. This further substantiatesthe conclusion that the high increase in the overall costs at the PPA level are attributable tofactors (taxes, accruals) not directly related to the operation of Manila Port.
C. Tariff
7. All tariff rates for both port dues and cargo handling fees are set by PPA. Thelatest revision in port tariffs was initiated in 1991 and implemented in 1994, almost 10 yearssince the last tariff revision in 1983. The 1994 tariff increase was implemented in two steps in1994 and 1995. The new expanded tariff structure increases port charges by 30 percent forinternational vessels and by 60 percent for domestic vessels. It also simplified thecomputation of wharfage charges by changing the charging base from revenue ton to metricton for most types of cargoes. The primary objective of the tariff revision was to reduce thedisparity between charges for international vessels and their cargoes, and those for domesticvessels and their cargoes. Other reasons for the revision of the tariff schedule were toaccommodate increasing size of vessels from 30,000 gross registered tons (GRT) to 50,000GRT (maximum) and to rationalize the basis for some of the tariffs in order to simplify andfacilitate computation of charges. The new tariffs for international traffic are in line withinternational standards, but those for domestic vessels remain low. While the gap has beenreduced considerably, the revenues from international operations continue to subsidize theoperations of ports handling domestic cargo.
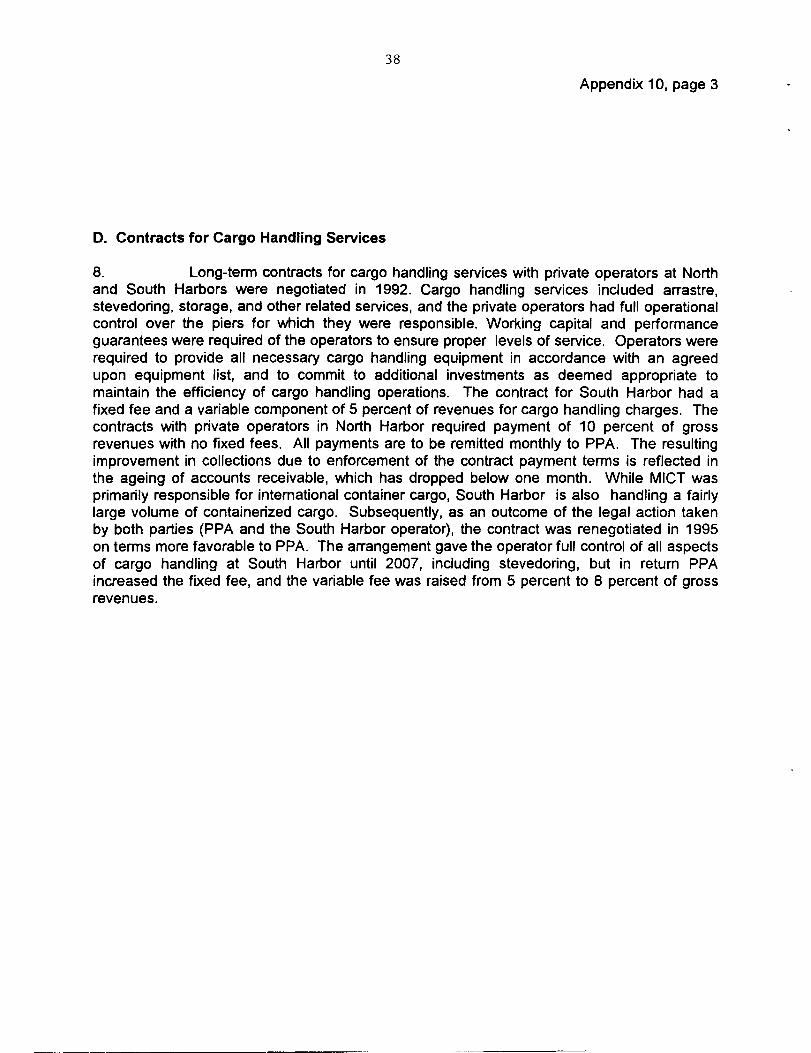
38
Appendix 10, page 3
D. Contracts for Cargo Handling Services
8. Long-term contracts for cargo handling services with private operators at Northand South Harbors were negotiated in 1992. Cargo handling services included arrastre,stevedonng, storage, and other related services, and the private operators had full operationalcontrol over the piers for which they were responsible. Working capital and performanceguarantees were required of the operators to ensure proper levels of service. Operators wererequired to provide all necessary cargo handling equipment in accordance with an agreedupon equipment list, and to commit to additional investments as deemed appropriate tomaintain the efficiency of cargo handling operations. The contract for South Harbor had afixed fee and a variable component of 5 percent of revenues for cargo handling charges. Thecontracts with private operators in North Harbor required payment of 10 percent of grossrevenues with no fixed fees. All payments are to be remitted monthly to PPA. The resultingimprovement in collections due to enforcement of the contract payment terms is reflected inthe ageing of accounts receivable, which has dropped below one month. While MICT wasprimarily responsible for international container cargo, South Harbor is also handling a fairlylarge volume of containerized cargo. Subsequently, as an outcome of the legal action takenby both parties (PPA and the South Harbor operator), the contract was renegotiated in 1995on terms more favorable to PPA. The arrangement gave the operator full control of all aspectsof cargo handling at South Harbor until 2007, including stevedoring, but in return PPAincreased the fixed fee, and the variable fee was raised from 5 percent to 8 percent of grossrevenues.
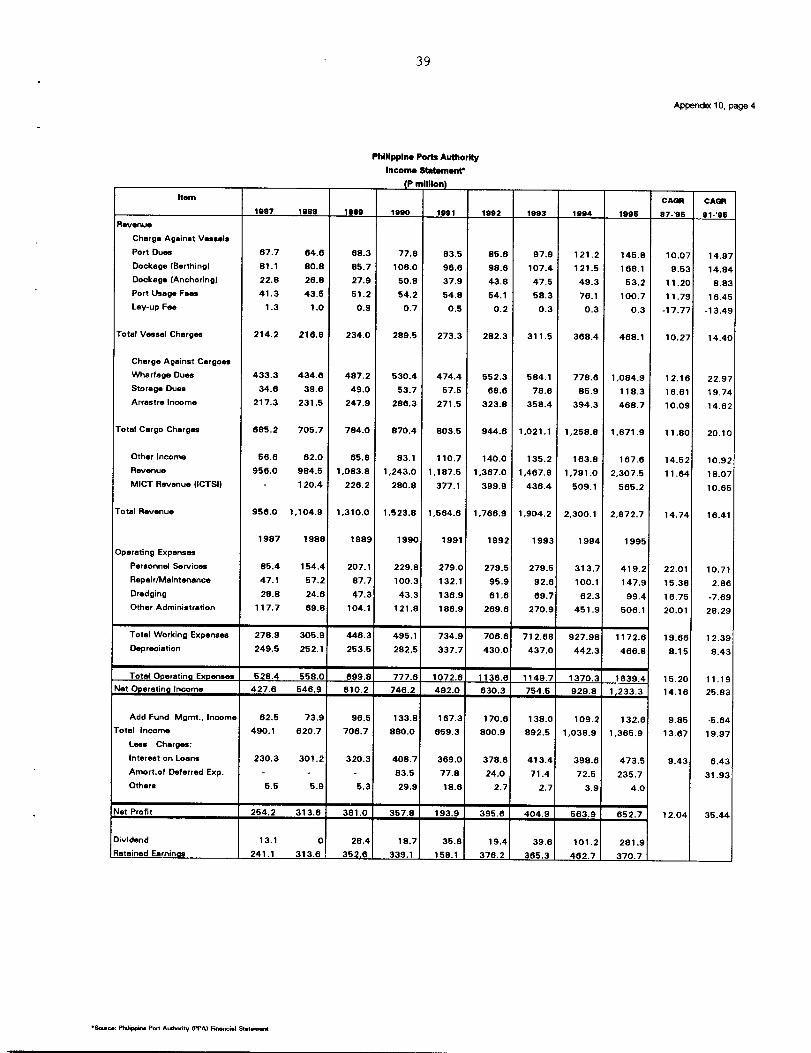
39
Appendix 10, page 4
Philippine Ports Authority
income statem.nr
_______________________ _______________ _______ (P million) _______ _______ _______ _______ _______ _______
Item CA CA______________________ 1987 1988 1989 1990 1991 1992 1993 1994 1996 87-96 91-96Revenue
Charge Against Vessels
PortDues 87.7 84.6 68.3 77.8 83.5 85.8 97.9 121.2 145.8 10.07 14.97Dockage (Berthing) 81.1 80.8 85.7 106.0 96.6 98.6 107.4 121.5 168.1 9.53 14.84Dockage (Anchoring) 22.8 28.8 27.9 50.8 37.9 43.8 47.5 49.3 53.2 11.20 8.83PoriUsageFees 41.3 43.5 51.2 54.2 54.8 54.1 58.3 76.1 100.7 11.79 16.451ev-up Fe. 1.3 1.0 0.9 0.7 0.5 0.2 0.3 0.3 0.3 -17.77 -13.49
Total Vessel Charges 214.2 216.8 234.0 289.5 273.3 282.3 311.5 368.4 488.1 10.27 14.40
Charge Against Cargoes
Wharfageflues 433.3 434.8 487.2 530.4 474.4 552.3 584.1 778.6 1,084.9 12.16 22.97StorageDuee 34.6 39.6 49.0 53.7 57.5 68.6 78.6 85.9 118.3 16.61 19.74Arrastreincome 217.3 231.5 247.9 286.3 271.5 323.8 358.4 394.3 468.7 10.09 14.82
Total Cargo Charges 685.2 705.7 784.0 870.4 803.5 944.6 1,021.1 1,258.8 1,671.9 11.80 20.10
Otherincome 56.8 62.0 65.8 83.1 110.7 140.0 135.2 183.8 167.6 14.52 10.92Revenue 956.0 984.5 1,083.8 1,243.0 1,187.5 1,367.0 1,467.8 1,791.0 2,307.5 11.84 18.07MICT Revenue (ICTSi) - 120.4 228.2 280.8 377.1 399.9 436.4 509.1 565.2 10.65
Total Revenue 958.0 1,104.9 1,310.0 1,523.8 1,564.6 1,766.9 1,904.2 2,300.1 2,872.7 14.74 16.41
1987 1988 1989 1990 1991 1992 1993 1994 1995Operating Expenses
Personnel Services 85.4 154.4 207.1 229.8 279.0 279.5 279.5 313.7 419.2 22.01 10.71Repair/Maintenance 47.1 57.2 87.7 100.3 132.1 95.9 92.6 100.1 147.9 15.38 2.86Dredging 28.8 24.6 47.3 43.3 136.9 81.8 69.7 62.3 99.4 16.75 -7.69OtherAdmirrjstratjon 117.7 69.8 104.1 121.8 188.9 289.6 270.9 451.9 506.1 20.01 28.29
Total Working Expenses 278.9 305.9 446.3 495.1 734.9 706.6 712.68 927.98 1172.6 19.66 12.39Depreciation 249.5 252.1 253.5 282.5 337.7 430.0 437.0 442.3 466.8 8.15 8.43
Total Operating Expenses 528.4 558.0 899.8 777.6 1072.8 1136.6 1149.7 1370.3 1839.4 15.20 11.19Net Operating Income 427.8 546.9 610.2 746.2 492.0 830.3 754.5 929.8 1,233.3 14.16 25.83
Add Fund Mgmt., Income 62.5 73.9 96.5 133.8 167.3 170.6 138.0 109.2 132.6 9.85 -5.84Total Income 490.1 620.7 706.7 880.0 659.3 800.9 892.5 1,038.9 1,365.9 13.67 19.97
Less Charges: -
interest on loans 230.3 301.2 320.3 408.7 369.0 378.8 413.4 398.6 473.5 9.43 6.43Amort.of Deferred Exp. - - - 83.5 77.8 24.0 71.4 72.5 235.7 31.93Others 5.5 5.9 5.3 29.9 18.6 2.7 2.7 3.9 4.0
Net Profit 254.2 313.6 381.0 357.8 193.9 395.8 404.9 563.9 652.7 12.04 3544
Dividend 13.1 0 28.4 18.7 35.8 19.4 39.8 101.2 281.9Retained Earnings 241.1 313.6 352.6 339.1 158.1 378.2 365.3 462.7 370.7 _______ ______
So,.c.: PtIiç,çAn. Po,t A5ty S'PAl Finnc.I St.t.nw.
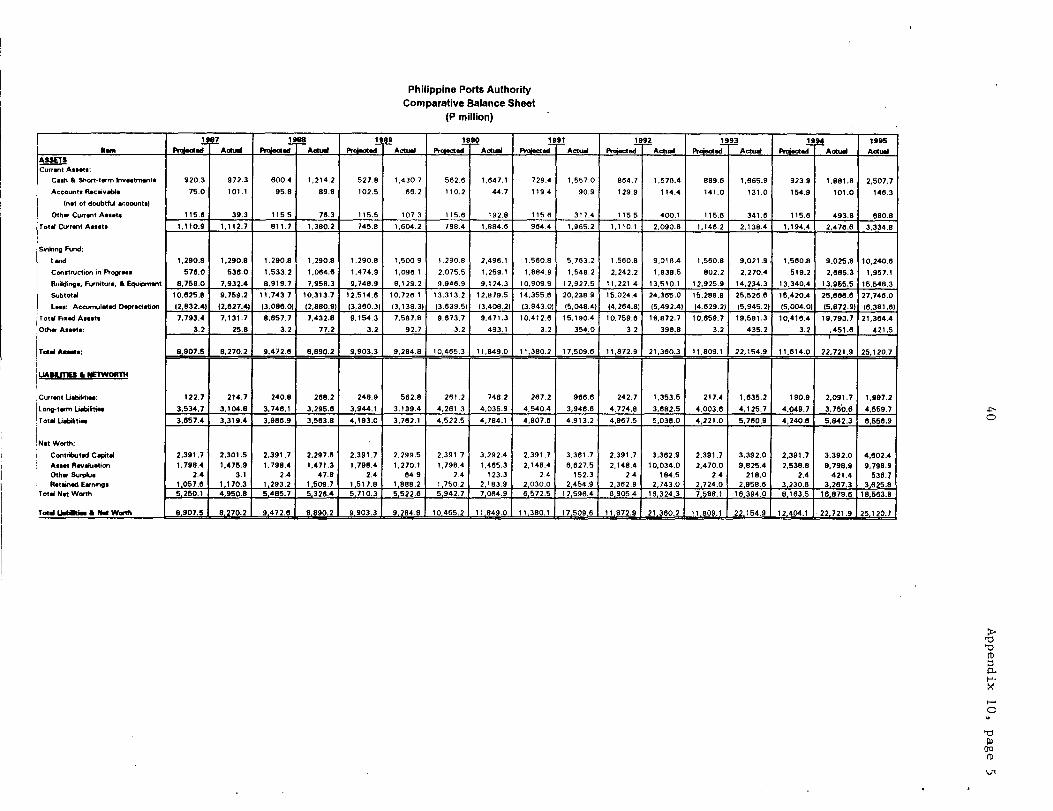
Philippine Ports AuthorityComparative Balance Sheet
(P million)
1995
Curr.nt Anita:
Cuss & Sl,ortt.n,sIrws.tm.nts 920.3 972.3 600.4 1,214.2 5278 1,430.7 562.6 1647.1 729.4 1,557.0 864.7 1,576.4 889.6 1865.9 923.9 1,881.8 2507.7
AcoonttR.c..vab1s 75.0 101.1 95.8 89.8 102.5 68.2 110.2 44.7 119.4 90.9 129.9 114.4 141.0 131.0 154.9 101.0 146.3
(nit of doubtful accounts)
Oth.r Curr.nt Ansi. 115.8 39.3 115.5 78.3 115.5 107.3 1 5.6 1 92.8 115.6 311.4 115.5 400.1 115.6 341.6 115.6 493.8 680.8
l'otalCurrsnlAssets 1,110.9 1,112.7 811.7 1,380.2 745.8 1,604.2 788.4 1,884.6 964.4 1,965.2 1,110.1 2,090.8 1,148.2 2,138.4 1,194.4 2,478.8 3,334.8
Snkn9 Fond:
Land 1,290.8 1290.8 1,290.8 1,290.8 1,290.8 1,5009 1290.8 2,496.1 1,580.8 5,763.2 1,560.8 9,016.4 1,580.8 9,021.9. 1,560.8 9,025.8 10240.6
Coovtruction in PtoQrua 579.0 536.0 1,533.2 1,084.6 1,474.9 1,096.1 2,075.5 1,259.1 1,884.9 1,548.2 2,242.2 1,838.5 802.2 2,270.4 519.2 2,885.3 1,957.1
Building.. Furnitur.. & Equ.pnssnt 8,759.0 7,932.4 8,919.7 7,958.3 9,748.9 8,1 29.2 9,946.9 9,124.3 10,909.9 12,927.5 11,221.4 13,510.1 12,925.9 14234.3 13.340,4 13,955.5 15548,3
Sobtot 10,825.8 9,759.2 11.743,7 10,313.7 12,514.6 10,726.1 13,313.2 12,879,5 14,355.8 20,238.9 15,024.4 24,365.0 ¶5,288.9 25,528.8 15,420.4 25,869.6 27,749.0
L.a.: Accun,ul.t.d Dspc.ciation 2,832.41 (2,627.41 (3.086.0' (2,880.91 (3.360.31 13,138.31 (3,639,51 13,408.21 (3,943.01 (5,048.41 (4,264.81 15,492.41 (4.629.2) 5,945.2) (5.004.0) (5.672.9) (6,391.6
1'ot Fi..d Ansi, 7,793.4 7,131.7 8.657,7 7,432.8 9,154.3 7,587.8 9,873.7 9,471.3 10,412.6 15,190.4 10,759.6 18,872.7 ¶0.659.7 19,581.3 10,416.4 19,793.7 21,384.4
Oths. As,.ts: 3.2 25.8 3.2 77.2 3.2 92.7 3.2 493.1 3.2 354.0 3.2 396.8 3.2 435.2 3.2 451.6 4.21.5
1' Au.: 8,907.5 8,270.2 9,472.6 8,890.2 9,903.3 9,284,8 10,465.3 11,849.0 11,380.2 17,509.6 11,872.9 21,380.3 11,809.1 22,154.9 11,614.0 22,721.9 25.120,7
Currant Liabili?i..:
Long.ts.m Li.bi8ti..
total lisbibtisi
Nit Worth:
Contnbut.d C.pital
Ass.t R.va&ustionOth.r SurplusR.t.sn.d Earnings
Total Nit Worth
Taid U.liItls. & N.6 Worth
122.7 214.7 240,8 288.2 248.9 582.8 261.2 748.2 267.2 968.6 242.7 1,353.5 217.4 1,835.2 190.9 2,091.7 1,997.2
534.7 3,104.8 3,746,1 3,295.9 3,944.1 3.199,4 4,261.3 4.035,9 4.540,4 3,946.6 4,724.8 3,682.5 4,003.8 4.125,7 4,049.7 3,750.6 4,559.7
657.4 3,319.4 3,986.9 3,563.8 4,193.0 3,782.1 4.522,5 4.784,1 4,807.6 4.913,2 4,067.5 5,036.0 4,221.0 5.760,9 4,240.6 5.842,3 6,556.9
2,391.7 2,301.5 2,391.7 2,297.5 2,391.7 2,299.5 2,391.7 3,292.4 2.391,7 3,361.7 2,391.7 3,382.9 2,391.7 3,392.0 2,391.7 3,392.0 4,602.4
1,798,4 1,475.9 1,708.4 1,471.3 1,798.4 1.270,1 1,798.4 1,485.3 2.148,4 6,627.5 2,148.4 10,034.0 2,470.0 9,825.4 2,538.8 9,798.0 9,798.9
2.4 3.1 2.4 41.9 2.4 84.9 2.4 123.3 2.4 152.3 2.4 184.5 2.4 218.0 2.4 421.4 538.7
(5
(5..H-)1<
I-
5)SQ(S
Li'
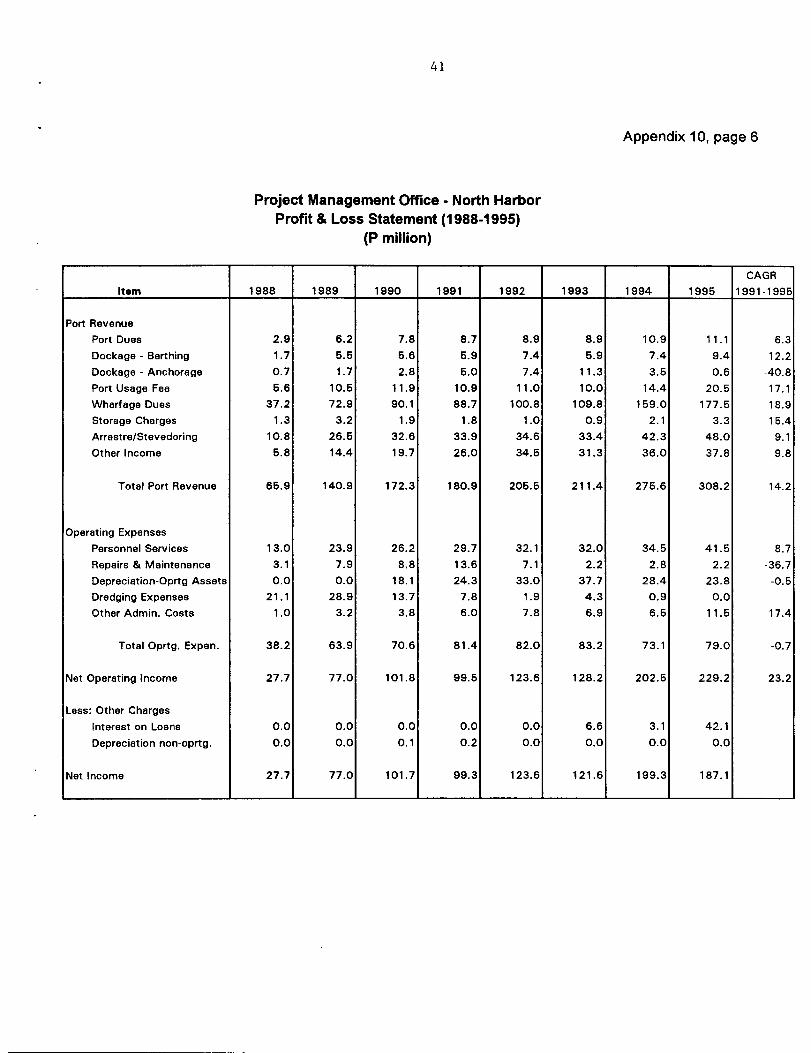
41
Appendix 10, page 6
Project Management Office - North HarborProfit & Loss Statement (1 988-1 995)
(P million)
CAGR
Item 1988 1989 1990 1991 1992 1993 1994 1995 1991-1995
Port Revenue
Port Duos 2.9 6.2 7.8 8.7 8.9 8.9 10.9 1 1.1 6.3
Dockage - Berthing 1.7 5.6 5.6 5.9 7.4 5.9 7.4 9.4 12.2
Dockage - Anchorage 0.7 1.7 2.8 5.0 7.4 11.3 3.5 0.6 -40.8
Port Usage Fee 5.6 10.5 11.9 10.9 11.0 10.0 14.4 20.5 17.1
Wharfage Dues 37.2 72.9 90.1 88.7 100.8 109.8 159.0 177.5 18.9
Storage Charges 1.3 3.2 1.9 1.8 1.0 0.9 2.1 3.3 15.4
Arrastre/Stevedoring 10.8 26.5 32.6 33.9 34.6 33.4 42.3 48.0 9.1
Other Income 5.8 14.4 19.7 26.0 34.5 31.3 36.0 37.8 9.8
Total Port Revenue 65.9 140.9 172.3 180.9 205.5 211.4 275.6 308.2 14.2
Operating Expenses
Personnel Services 13.0 23.9 26.2 29.7 32.1 32.0 34.5 41.5 8.7
Repairs & Maintenance 3.1 7.9 8.8 13.6 7.1 2.2 2.8 2.2 -36.7
Depreciation-Oprtg Assets 0.0 0.0 18.1 24.3 33.0 37.7 28.4 23.8 -0.5
Dredging Expenses 21.1 28.9 13.7 7.8 1.9 4.3 0.9 0.0
Other Admin. Costs 1.0 3.2 3.8 6.0 7.8 6.9 6.5 11.5 17.4
Total Oprtg. Expen. 38.2 63.9 70.6 81.4 82.0 83.2 73.1 79.0 -0.7
Net Operating Income 27.7 77.0 101.8 99.5 123.6 128.2 202.6 229.2 23.2
Less: Other Charges
Interest on Loans 0.0 0.0 0.0 0.0 0.0 6.6 3.1 42.1
Depreciation non-oprtg. 0.0 0.0 0.1 0.2 0.0 0.0 0.0 0.0
Net Income 27.7 77.0 101.7 99.3 123.6 121.6 199.3 187.1
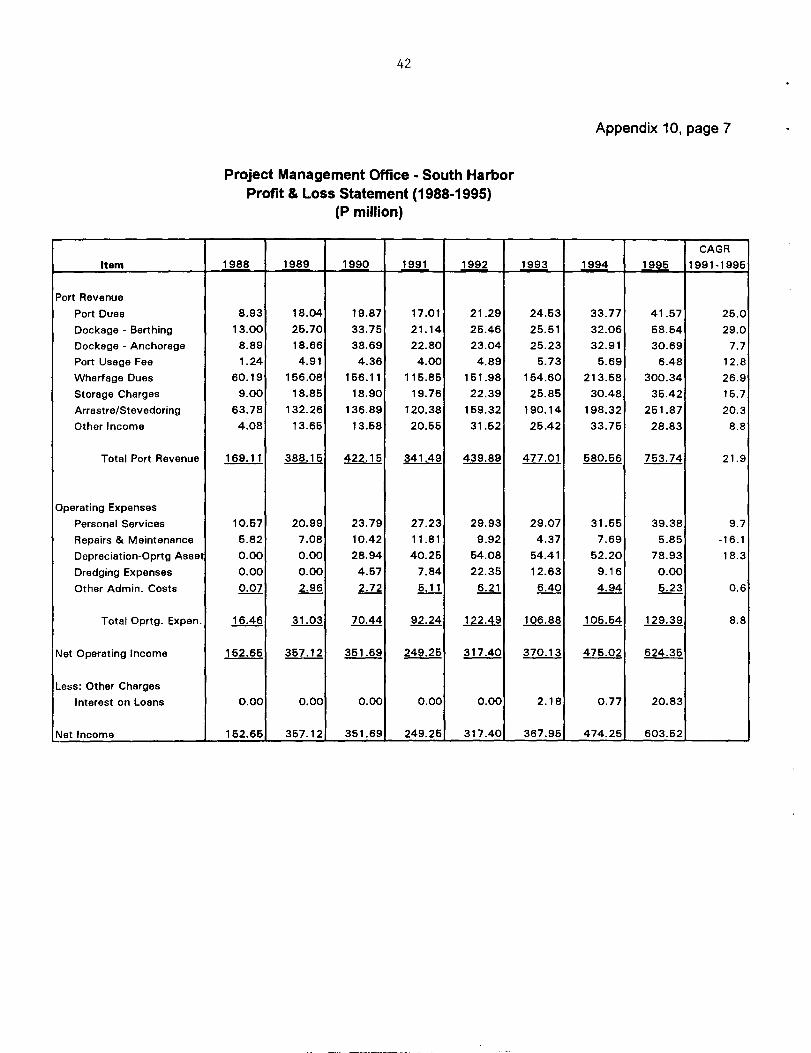
42
Appendix 10, page 7
Project Management Office - South HarborProfit & Loss Statement (1988-1 995)
(P million)
CAGR
Item 1988 1989 1990 1991 1992 1993 1994 1995 1991-1995
Port Revenue
Port Dues 8.93 18.04 19.87 17.01 21.29 24.53 33.77 41.57 25.0
Dockage - Berthing 13.00 25.70 33.75 21.14 25.46 25.51 32.06 58.54 29.0
Dockage - Anchorage 8.89 18.66 38.69 22.80 23.04 25.23 32.91 30.69 7.7
Port Usage Fee 1.24 4.91 4.36 4.00 4.89 5.73 5.69 6.48 12.8
Wharfage Dues 60.19 156.08 156.11 115.85 151.98 154.60 213.58 300.34 26.9
Storage Charges 9.00 18.85 18.90 19.76 22.39 25.85 30.48 35.42 15.7
Arrastre/Stevedoring 63.78 132.26 136.89 120.38 159.32 190.14 198.32 251.87 20.3
Other Income 4.08 13.65 13.58 20.55 31.52 25.42 33.75 28.83 8.8
Total Port Revenue 169.11 388.15 422.15 341.49 439.89 477.01 580.56 753.74 21.9
Operating Expenses
Personal Services 10.57 20.99 23.79 27.23 29.93 29.07 31.55 39.38 9.7
Repairs & Maintenance 5.82 7.08 10.42 11.81 9.92 4.37 7.69 5.85 -16.1
Depreciation-Oprtg Asset 0.00 0.00 28.94 40.25 54.08 54.41 52.20 78.93 18.3
Dredging Expenses 0.00 0.00 4.57 7.84 22.35 12.63 9.16 0.00
Other Admin. Costs 0.07 2.96 2.72 5.11 6.21 6.40 4.94 5.23 0.6
Total Oprtg. Expen. 16.46 31.03 70.44 92.24 122.49 106.88 105.54 129.39 8.8
Net Operating Income 152.65 357.12 351.69 249.25 317.40 370.13 475.02 624.35
Less: Other Charges
Interest on Loans 0.00 0.00 0.00 0.00 0.00 2.18 0.77 20.83
Net Income 152.65 357.12 351.69 249.25 317.40 367.95 474.25 603.52 ________
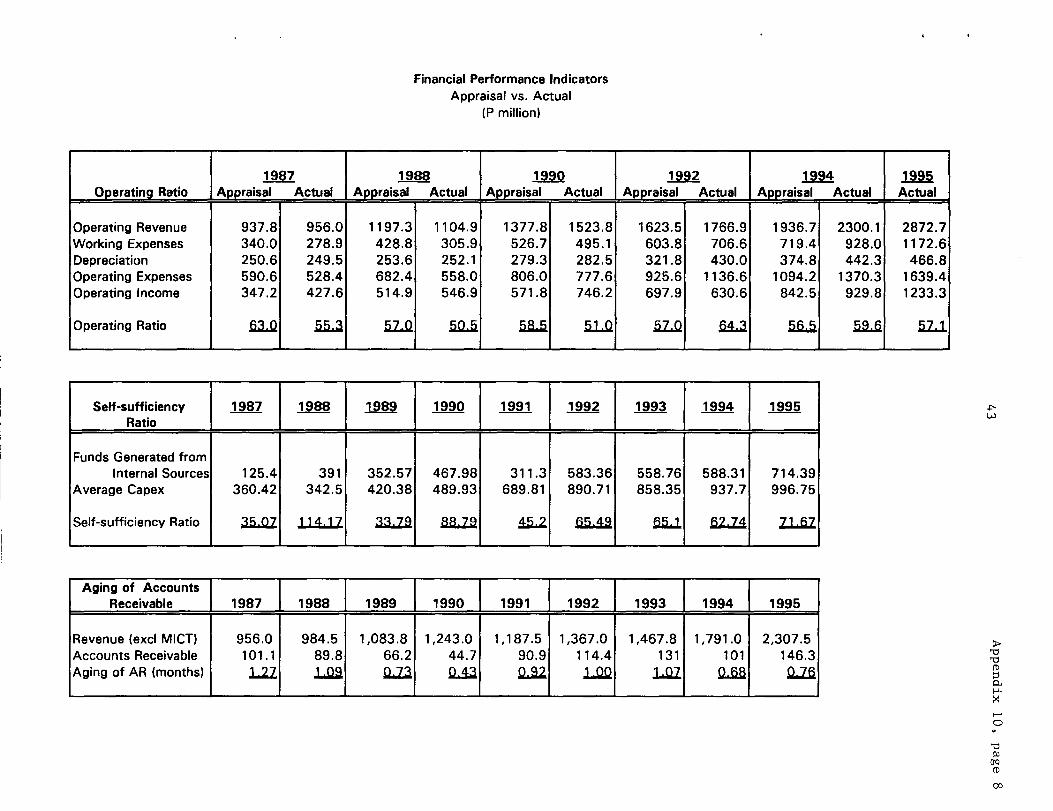
Financial Performance IndicatorsAppraisal vs. Actual
(P million)
1987 1988 1990 1992 1994 1995- Operating Ratio Appraisal Actual Appraisal Actual Appraisal Actual Appraisal Actual Appraisal Actual Actual
Operating Revenue 937.8 956.0 1197.3 1104.9 1377.8 1523.8 1623.5 1766.9 1936.7 2300.1 2872.7Working Expenses 340.0 278.9 428.8 305.9 526.7 495.1 603.8 706.6 719.4 928.0 1172.6Depreciation 250.6 249.5 253.6 252.1 279.3 282.5 321.8 430.0 374.8 442.3 466.8Operating Expenses 590.6 528.4 682.4 558.0 806.0 777.6 925.6 1136.6 1094.2 1370.3 1639.4Operating Income 347.2 427.6 514.9 546.9 571.8 746.2 697.9 630.6 842.5 929.8 1233.3
Operating Ratio b.LQ .LQ .LJ.
Self-sufficiency 1987 1988 1989 1990 1991 1992 1993 1994 1995Ratio_________ _________ _________ ________ _________ ________ _________ ________ I _________
Funds Generated fromInternal Sources 125.4 391 352.57 467.98 311.3 583.36 558.76 588.31 714.39
Average Capex 360.42 342.5 420.38 489.93 689.81 890.71 858.35 937.7 996.75
Self-sufficiencyRatio 35.07 114.17 33.79 88.79 65.49 J. 62.74 71.67
Aging of AccountsReceivable 1987 1988 1989 1990 1991 1992 1993 1994 1995
Revenue (excl MICT) 956.0 984.5 1,083.8 1,243.0 1,187.5 1,367.0 1,467.8 1,791.0 2,307.5AccountsReceivable 101.1 89.8 66.2 44.7 90.9 114.4 131 101 146.3Aging of AR (months) Q.La.Z LQ
Ct,
to
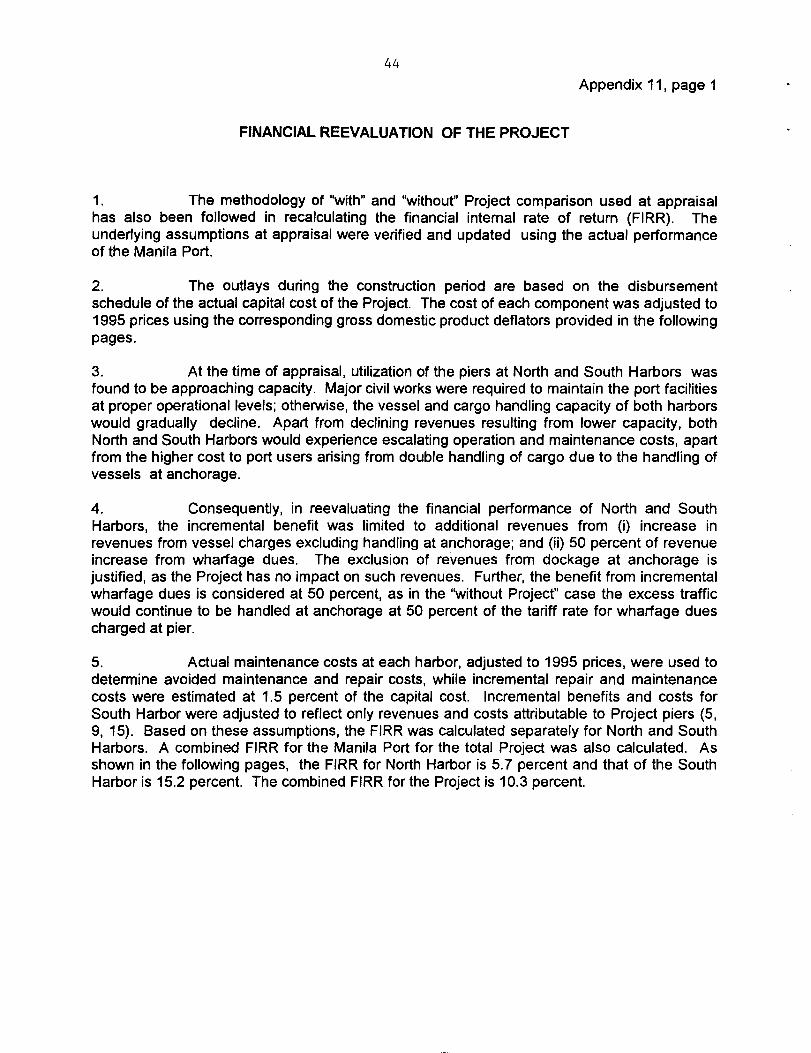
44
Appendix 11, page 1
FINANCIAL REEVALUATION OF THE PROJECT
1. The methodology of "with" and "without" Project comparison used at appraisalhas also been followed in recalculating the financial internal rate of return (FIRR). Theunderlying assumptions at appraisal were verified and updated using the actual performanceof the Manila Port.
2. The outlays during the construction period are based on the disbursementschedule of the actual capital cost of the Project. The cost of each component was adjusted to1995 prices using the corresponding gross domestic product deflators provided in the followingpages.
3. At the time of appraisal, utilization of the piers at North and South Harbors wasfound to be approaching capacity. Major civil works were required to maintain the port facilitiesat proper operational levels; otherwise, the vessel and cargo handling capacity of both harborswould gradually decline. Apart from declining revenues resulting from lower capacity, bothNorth and South Harbors would experience escalating operation and maintenance costs, apartfrom the higher cost to port users arising from double handling of cargo due to the handling ofvessels at anchorage.
4. Consequently, in reevaluating the financial performance of North and SouthHarbors, the incremental benefit was limited to additional revenues from (i) increase inrevenues from vessel charges excluding handling at anchorage; and (ii) 50 percent of revenueincrease from wharfage dues. The exclusion of revenues from dockage at anchorage isjustified, as the Project has no impact on such revenues. Further, the benefit from incrementalwharfage dues is considered at 50 percent, as in the "without Project" case the excess trafficwould continue to be handled at anchorage at 50 percent of the tariff rate for wharfage duescharged at pier.
5. Actual maintenance costs at each harbor, adjusted to 1995 prices, were used todetermine avoided maintenance and repair costs, white incremental repair and maintenancecosts were estimated at 1.5 percent of the capital cost. Incremental benefits and costs forSouth Harbor were adjusted to reflect only revenues and costs attributable to Project piers (5,9, 15). Based on these assumptions, the FIRR was calculated separately for North and SouthHarbors. A combined FIRR for the Manila Port for the total Project was also calculated. Asshown in the following pages, the FIRR for North Harbor is 5.7 percent and that of the SouthHarbor is 15.2 percent. The combined FIRR for the Project is 10.3 percent.
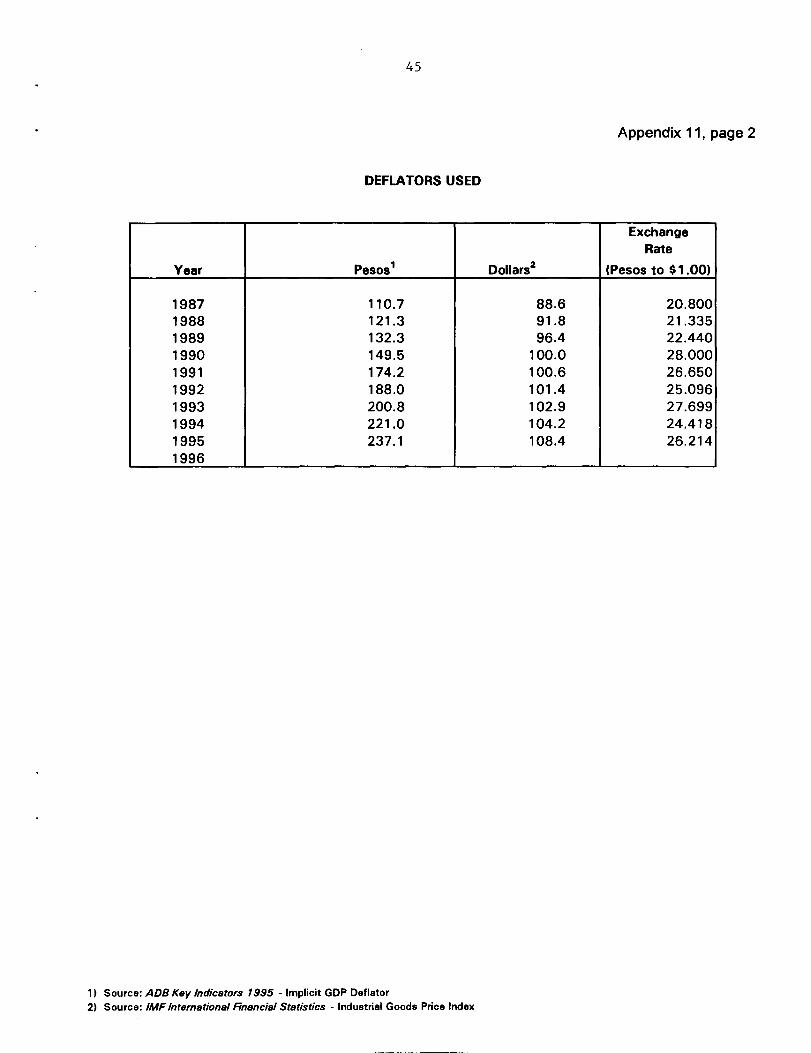
45
Appendix 11, page 2
DEFLATORS USED
ExchangeRate
Year Pesos1 Dollars2 (Pesos to $1 .00)
1987 110.7 88.6 20.8001988 121.3 91.8 21.3351989 132.3 96.4 22.4401990 149.5 100.0 28.0001991 174.2 100.6 26.6501992 188.0 101.4 25.0961993 200.8 102.9 27.6991994 221.0 104.2 24.4181995 237.1 108.4 26.2141996 _______________________ ________________ ____________
1) Source: ADB Key Indicators 1995 - Implicit GDP Deflator2) Source: IMF International Financial Statistics - Industrial Goods Price Index
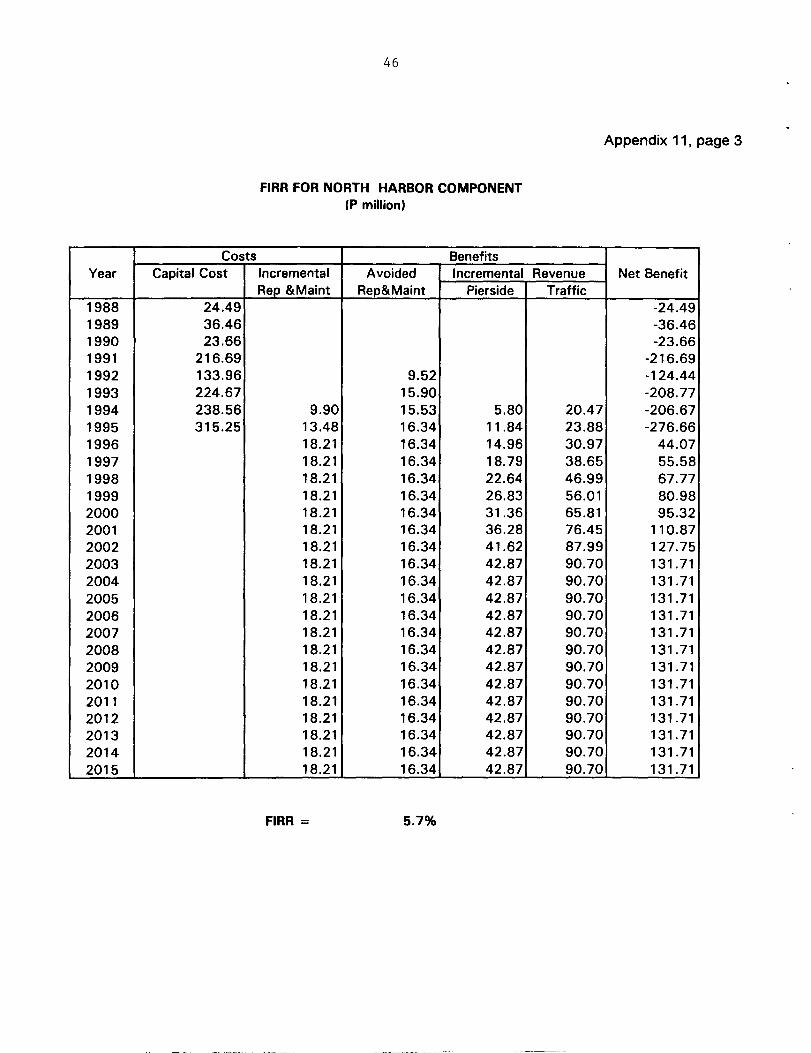
46
Appendix 11, page 3
FIRR FOR NORTH HARBOR COMPONENT(P million)
Costs _____________ BenefitsYear Capital Cost Incremental Avoided Incremental Revenue Net Benefit
________ _______________ Rep &Maint Rep&Maint Pierside Traffic _____________1988 24.49 -24.491989 36.46 -36.461990 23.66 -23.661991 216.69 -216.691992 133.96 9.52 -124.441993 224.67 15.90 -208.771994 238.56 9.90 15.53 5.80 20.47 -206.671995 315.25 13.48 16.34 11.84 23.88 -276.661996 18.21 16.34 14.96 30.97 44.071997 18.21 16.34 18.79 38.65 55.581998 18.21 16.34 22.64 46.99 67.771999 18.21 16.34 26.83 56.01 80.982000 18.21 16.34 31.36 65.81 95.322001 18.21 16.34 36.28 76.45 110.872002 18.21 16.34 41.62 87.99 127.752003 18.21 16.34 42.87 90.70 131.712004 18.21 16.34 42.87 90.70 131.712005 18.21 16.34 42.87 90.70 131.712006 18.21 16.34 42.87 90.70 131.712007 18.21 16.34 42.87 90.70 131.712008 18.21 16.34 42.87 90.70 131.712009 18.21 16.34 42.87 90.70 131.712010 18.21 16.34 42.87 90.70 131.712011 18.21 16.34 42.87 90.70 131.712012 18.21 16.34 42.87 90.70 131.712013 18.21 16.34 42.87 90.70 131.712014 18.21 16.34 42.87 90.70 131.712015 ____________ 18.21 16.34 42.87 90.70 131.71
FIRR = 5.7%
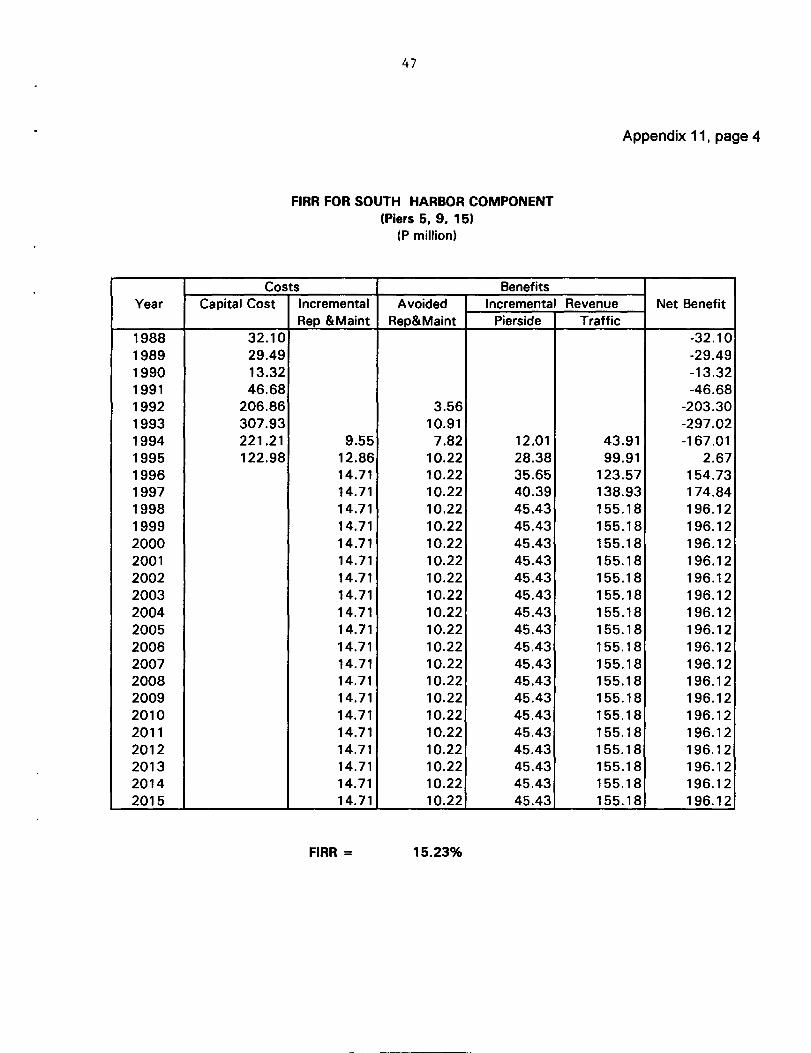
47
Appendix 11, page 4
FIRR FOR SOUTH HARBOR COMPONENT(Piers 5, 9, 15)
(P million)
Costs____________ BenefitsYear Capital Cost Incremental Avoided Incremental Revenue Net Benefit
_________ _____________ Rep &Maint Rep&Maint Pierside Traffic ____________
1988 32.10 -32.10
1989 29.49 -29.49
1990 13.32 -13.321991 46.68 -46.681992 206.86 3.56 -203.30
1993 307.93 10.91 -297.021994 221.21 9.55 7.82 12.01 43.91 -167.011995 122.98 12.86 10.22 28.38 99.91 2.671996 14.71 10.22 35.65 123.57 154.731997 14.71 10.22 40.39 138.93 174.841998 14.71 10.22 45.43 155.18 196.12
1999 14.71 10.22 45.43 155.18 196.122000 14.71 10.22 45.43 155.18 196.12
2001 14.71 10.22 45.43 155.18 196.122002 14.71 10.22 45.43 155.18 196.12
2003 14.71 10.22 45.43 155.18 196.12
2004 14.71 10.22 45.43 155.18 196.12
2005 14.71 10.22 45.43 155.18 196.12
2006 14.71 10.22 45.43 155.18 196.122007 14.71 10.22 45.43 155.18 196.122008 14.71 10.22 45.43 155.18 196.122009 14.71 10.22 45.43 155.18 196.122010 14.71 10.22 45.43 155.18 196.122011 14.71 10.22 45.43 155.18 196.122012 14.71 10.22 45.43 155.18 196.122013 14.71 10.22 45.43 155.18 196.122014 14.71 10.22 45.43 155.18 196.122015 ___________ 14.71 10.22 45.43 155.18 196.12
FIRR = 15.23%
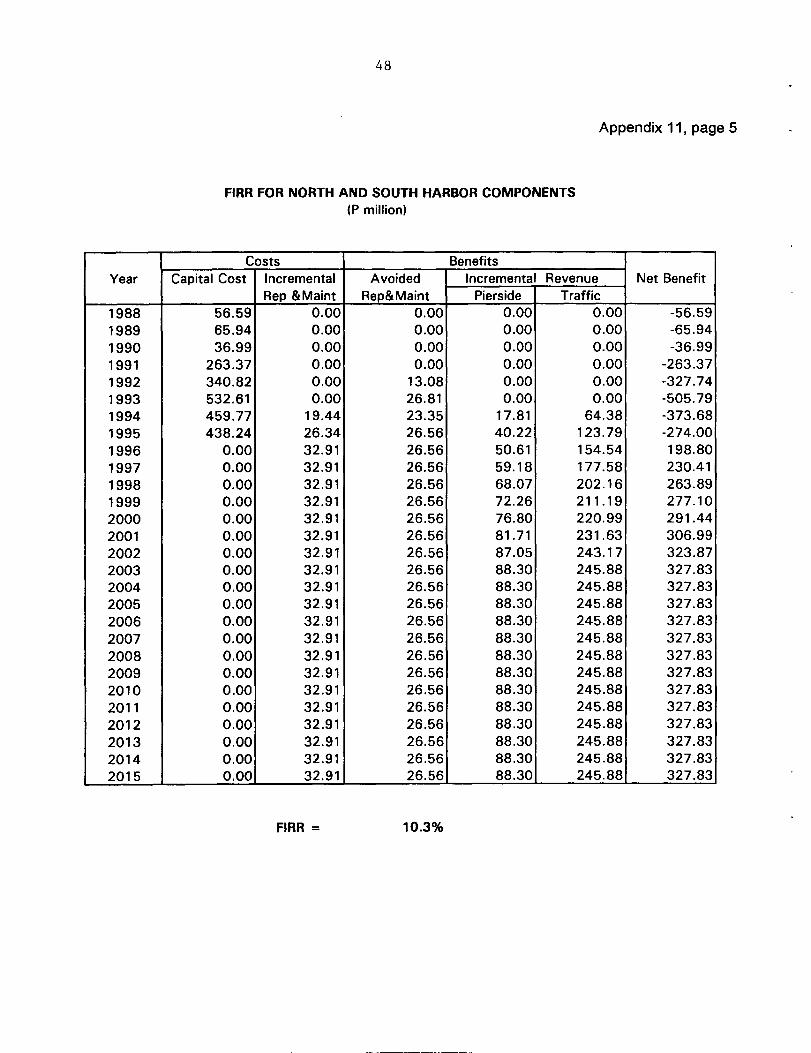
48
Appendix 11, page 5
FIRR FOR NORTH AND SOUTH HARBOR COMPONENTS
(P million)
Costs______________ BenefitsYear Capital Cost Incremental Avoided Incremental Revenue Net Benefit
__________ ____________ Rep &Maint Rep&Maint Pierside Traffic ___________1988 56.59 0.00 0.00 0.00 0.00 -56.591989 65.94 0.00 0.00 0.00 0.00 -65.941990 36.99 0.00 0.00 0.00 0.00 -36.991991 263.37 0.00 0.00 0.00 0.00 -263.371992 340.82 0.00 13.08 0.00 0.00 -327.741993 532.61 0.00 26.81 0.00 0.00 -505.791994 459.77 19.44 23.35 17.81 64.38 -373.681995 438.24 26.34 26.56 40.22 12379 -274.001996 0.00 32.91 26.56 50.61 154.54 198.801997 0.00 32.91 26.56 59.18 177.58 230.411998 0.00 32.91 26.56 68.07 202.16 263.891999 0.00 32.91 26.56 72.26 211.19 277.102000 0.00 32.91 26.56 76.80 220.99 291.442001 0.00 32.91 26.56 81.71 231.63 306.992002 0.00 32.91 26.56 87.05 243.17 323.872003 0.00 32.91 26.56 88.30 245.88 327.832004 0.00 32.91 26.56 88.30 245.88 327.832005 0.00 32.91 26.56 88.30 245.88 327.832006 0.00 32.91 26.56 88.30 245.88 327.832007 0.00 32.91 26.56 88.30 245.88 327.832008 0.00 32.91 26.56 88.30 245.88 327.832009 0.00 32.91 26.56 88.30 245.88 327.832010 0.00 32.91 26.56 88.30 245.88 327.832011 0.00 32.91 26.56 88.30 245.88 327.832012 0.00 32.91 26.56 88.30 245.88 327.832013 0.00 32.91 26.56 88.30 245.88 327.832014 0.00 32.91 26.56 88.30 245.88 327.832015 0.00 32.91 26.56 88.30 245.88 327.83
FIRR = 10.3%
49
Appendix 12, page 1
ECONOMIC REEVALUATION OF THE PROJECT
A. General
1. The economic return of the Project was reevaluated on the basis of a"with and without the Project" comparison, using a slightly different methodology fromthe one followed at appraisal. Without the Project, the deteriorated state of thefacilities at both North and South Harbors would have resulted in inefficient cargohandling operations and long ship service time. High maintenance costs would havebeen needed to keep the piers in operation. At North Harbor, containers would havehad to be moved to out-of-port facilities, because of the lack of container back-upspace in the port area. The piers of South and North Harbors would have reachedcapacity in 1995, resulting in excess cargo having to be handled at anchorage at ahigher cost. With the Project, the rehabilitated piers will allow better operatingconditions and will attract new equipment investment and replacement by privateoperators, thus improving cargo handling productivity and reducing ship turnaroundtime. Maintenance costs of the rehabilitated structure will be reduced. Additionalcontainer yard area and better container handling efficiency will reduce the requirementfor out-of-port handling. Capacity will be reached only in 1998 at South Harbor and in2003 at North Harbor, avoiding additional costs for excess cargo, which would havebeen handled at anchorage from 1995 without the Project.
2. The economic analysis has been conducted using world market prices(border prices). The economic price of traded goods is equal to their financial price(without tax), and a standard conversion factor of 0.82 has been applied to calculatethe economic price of nontraded goods. No shadow wage rate factor has beenconsidered. Based on these assumptions, the main costs have been broken down intotraded and nontraded goods, and specific conversion factors have been calculated tovalue all costs and benefits in economic terms.
B. Costs
3. The main Project costs were civil works and incremental maintenancecosts. Although equipment costs were deleted from the Project, private operators hadto purchase new and replace old equipment to be able to improve handling rates atrehabilitated piers. These costs have been added to the Project capital costs, becausewithout new equipment the expected benefits could not be attained. Incrementalmaintenance costs were computed as Project costs from the first year of operation.The annual incremental maintenance costs were estimated at 1.5 percent of the civilworks capital costs. Operating costs of cargo below the port capacity "without theProject" have been assumed to be the same "with" and "without" Project, and operatingcosts of incremental cargo, over "without the Project" case capacity, have been takeninto account in the net benefit calculation. No incremental operating costs havetherefore been considered. Financial costs have been converted into economic costsusing specific conversion factors for civil works (0.95); maintenance (0.91); andequipment (0.96).
50
Appendix 12, page 2
C. Benefits
4. The main economic benefits from the Project are (i) saved cargohandling costs, (ii) saved ship turnaround time, ai d (iii) deferred maintenance costs.Financial benefits have been converted into economic benefits using specificconversion factors for handling at anchorage and domestic shipping (0.93) as well asroad transport costs for container movement (0.93).
1. Saved Cargo Handling Costs
5. When piers reach capacity, the excess cargo has to be handled atanchorage, which is more expensive. Cargo handling costs at anchorage are avoidedbecause of increased pier capacity, and these have been considered as benefits to theProject. Given the difference in ship size and the interchange per ship between Southand North Harbors, the saving has been estimated at $5 per ton at South Harbor andonly $2 per ton at North Harbor, which is a conservative assumption considering thehigh proportion of containers at both locations. A large amount of cargo was alreadyhandled at anchorage at South Harbor before Project implementation. It was expectedat appraisal that this proportion would reduce with the Project, more cargo beinghandled at pier, resulting in additional Project benefits. Such benefits have not beenquantified for Project reevaluation.
6. It was considered at appraisal that, without the Project, containers wouldhave to be moved out of the port area when the container throughput reaches 300,000twenty-foot equivalent units (TEU) per annum at North Harbor. This level was actuallyreached in 1988, and excess containers were moved out of the port area to bestuffed/unstuffed. With the Project, more container stacking area has been madeavailable, resulting in a reduction of this practice until the additional area reaches itsstacking capacity, estimated at 650,000 TEU. The container handling saving has beenestimated at only $15 per TEU, not taking into account the additional costs resultingfrom increased risks of container breakage and pilferage, and has been attributed as abenefit to the Project.
2. Saved Ship Turnaround Time
7. With the Project, the cargo handling efficiency will improve, thusreducing the average ship turnaround time by about 22 hours at South Harbor and 18hours at North Harbor. The average ship costs per day have been estimated at $2,300for domestic shipping at North Harbor and $10,000 for international shipping at SouthHarbor. The resulting saving in ship costs is attributed as a benefit to the Project,initially increasing gradually with completion of various Project parts from 1992 to 1995.
51
Appendix 12, page 3
3. Deferred Maintenance Costs
8. With the Project, it is assumed that part of the maintenance costs will bedeferred over a period of 20 years, starting from the beginning of rehabilitation works in1992. The savings in deferred maintenance costs have been estimated at $0.18 millionfor South Harbor and $0.31 million for North Harbor in 1992, increasing to $0.30 millionand $0.44 million for South and North Harbors, respectively, from 1995 (financialcosts). The deferred costs were computed as Project benefits.
9. The uneven working surfaces at both North and South Harbors werecausing considerable wear and tear to the cargo handling equipment. At appraisal, itwas considered that, with the Project, the improved pavements would help to saveoperation and maintenance costs of equipment and increase their operating life. Thissaving is difficult to evaluate and has not been quantified for Project reevaluation.
D. Economic Reevaluation Results
10. The economic internal rate of return (EIRR) has been calculated over aperiod of 28 years, including 8 years of conception and construction (1988-1995) and20 years of operation (1996-2015). The average economic life of assets was estimatedat 20 years. Although the whole Project was completed only at the end of 1995,separate Project components were completed between 1992 and 1995. Some benefitsand incremental costs were therefore calculated from 1992. All costs and benefits areexpressed in constant 1995 dollars.
11. The EIRR was estimated for the Project as a whole. However, since theProject components at North and South Harbors are separate and distinct, the EIRRwas also computed for each component. The economic costs and benefits in the "with"and "without" the Project cases have been reevaluated for the Project as a whole, butalso for the North and South Harbor components separately. The EIRR was estimatedat 26.7 percent for the whole Project, 29.2 percent for North Harbor, and 23.3 percentfor South Harbor. Detailed EIRR calculations are provided in the attached tables.
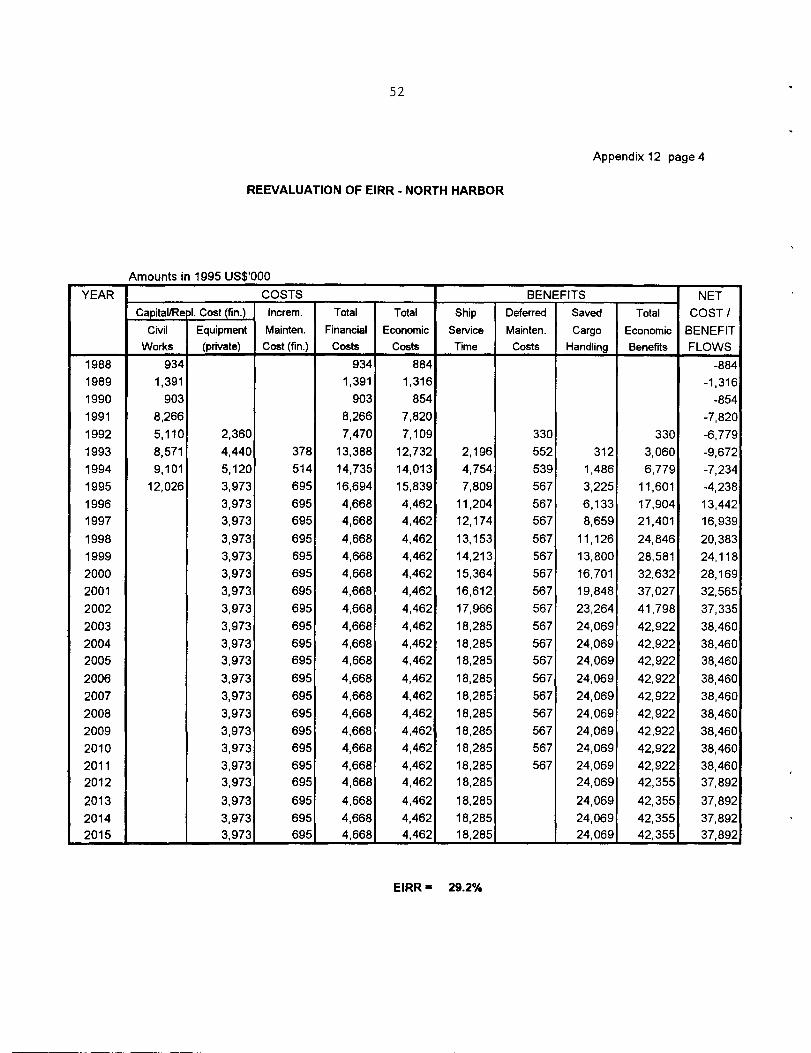
52
Appendix 12 page4
REEVALUATION OF EIRR - NORTH HARBOR
Amounts in 1995 US$'OOO
YEAR_______________ COSTS ______ ______ ______ BENEFITS _______ NET
Capital/Re I. Cost (fin.) Increm. Total Total Ship Deferred Saved Total COST /
Civil Equipment Mainten. Financial Economic Service Mainten. Cargo Economic BENEFIT
Works (private) Cost (fin.) Costs Costs Time Costs Handling Benefits FLOWS
1988 934 934 884 -8841989 1,391 1,391 1,316 -1316
1990 903 903 854 -854
1991 8266 8266 7,820 -7,820
1992 5,110 2,360 7,470 7,109 330 330 -6,779
1993 8,571 4440 378 13,388 12,732 2,196 552 312 3,060 -9672
1994 9,101 5,120 514 14,735 14,013 4,754 539 1,486 6,779 -7,234
1995 12,026 3973 695 16,694 15,839 7,809 567 3,225 11,601 -4,238
1996 3,973 695 4,668 4,462 11,204 567 6,133 17,904 13,4421997 3,973 695 4,668 4,462 12,174 567 8659 21,401 16,939
1998 3973 695 4,668 4,462 13,153 567 11,126 24,846 20,383
1999 3,973 695 4,668 4,462 14,213 567 13,800 28,581 24,118
2000 3,973 695 4,668 4,462 15,364 567 16,701 32,632 28,169
2001 3,973 695 4,668 4,462 16,612 567 19,848 37,027 32,565
2002 3,973 695 4,668 4,462 17,966 567 23,264 41798 37,335
2003 3,973 695 4,668 4,462 18,285 567 24,069 42,922 38,460
2004 3,973 695 4,668 4,462 18,285 567 24,069 42,922 38,460
2005 3,973 695 4,668 4,462 18,285 567 24,069 42,922 38,460
2006 3,973 695 4,668 4,462 18,285 567 24,069 42,922 38,460
2007 3,973 695 4,668 4,462 18285 567 24,069 42,922 38,460
2008 3973 695 4,668 4,462 18,285 567 24,069 42,922 38,460
2009 3973 695 4,668 4462 18,285 567 24,069 42,922 38,460
2010 3,973 695 4,668 4,462 18,285 567 24,069 42,922 38,460
2011 3,973 695 4,668 4,462 18,285 567 24,069 42,922 38,4602012 3,973 695 4,668 4,462 18,285 24,069 42,355 37,892
2013 3,973 695 4,668 4,462 18,285 24,069 42,355 37,892
2014 3,973 695 4,668 4,462 18,285 24,069 42,355 37,8922015 _______ 3,973 695 4,668 4,462 18,285 _______ 24,069 42,355 37,892
EIRR = 29.2%
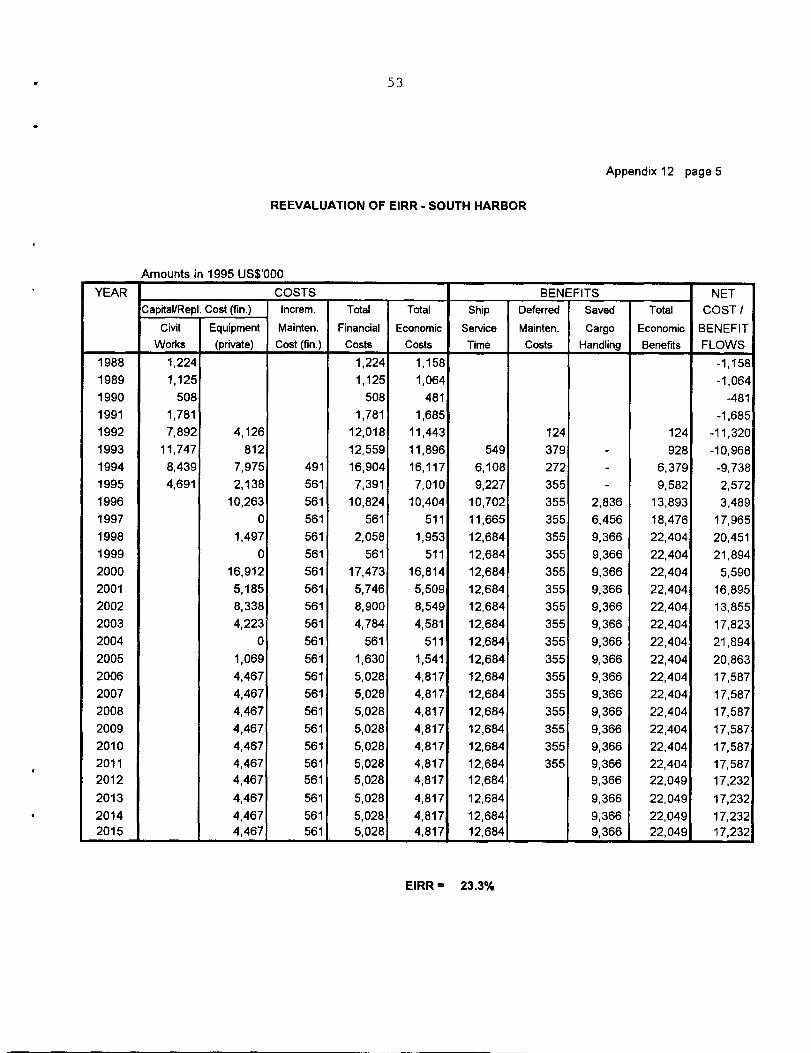
53
Appendix 12 page 5
REEVALUATION OF EIRR - SOUTH HARBOR
Amounts in 1995 US$000
YEAR_______________ COSTS ______ ______ ______ BENEFITS _______ NET
Capital/RepI. Cost (fin.) Increm. Total Total Ship Deferred Saved Total COST /
Civil Equipment Mainten. Financial Economic Service Mainten. Cargo Economic BENEFIT
________ Works (private) Cost (fin.) Costs Costs Time Costs Handling Benefits FLOWS
1988 1224 1,224 1,158 -1,1581989 1,125 1,125 1,064 -1,0641990 508 508 481 -4811991 1,781 1,781 1,685 -1,6851992 7,892 4,126 12,018 11,443 124 124 -11,3201993 11,747 812 12,559 11,896 549 379 - 928 -10,9681994 8,439 7,975 491 16,904 16,117 6,108 272 - 6,379 -97381995 4,691 2,138 561 7,391 7,010 9,227 355 - 9,582 2,5721996 10,263 561 10,824 10,404 10,702 355 2,836 13,893 3,4891997 0 561 561 511 11,665 355 6,456 18,476 17,9651998 1,497 561 2,058 1,953 12,684 355 9,366 22,404 20,4511999 0 561 561 511 12,684 355 9,366 22,404 21,8942000 16,912 561 17,473 16,814 12,684 355 9,366 22,404 5,5902001 5,185 561 5,746 5,509 12,684 355 9,366 22,404 16,8952002 8,338 561 8,900 8,549 12684 355 9,366 22,404 13,8552003 4,223 561 4,784 4,581 12,684 355 9,366 22,404 17,8232004 0 561 561 511 12,684 355 9,366 22,404 21,8942005 1,069 561 1,630 1,541 12,684 355 9,366 22,404 20,8632006 4,467 561 5,028 4,817 12,684 355 9,366 22,404 17,5872007 4,467 561 5,028 4,817 12,684 355 9,366 22,404 17,5872008 4,467 561 5,028 4,817 12684 355 9,366 22,404 17,5872009 4,467 561 5,028 4,817 12,684 355 9,366 22,404 17,5872010 4,467 561 5,028 4,817 12,684 355 9,366 22,404 17,5872011 4,467 561 5,028 4,817 12,684 355 9,366 22,404 17,5872012 4,467 561 5,028 4,817 12,684 9,366 22,049 17,232
2013 4,467 561 5,028 4,817 12,684 9,366 22,049 17,2322014 4,467 561 5,028 4,817 12,684 9,366 22,049 17,2322015 ________ 4,467 561 5,028 4,817 12,684 ________ 9,366 22,049 17,232
EIRR = 23.3%

54
Appendix 12 page 6
REEVALUATION OF EIRR - NORTH AND SOUTH HARBORS
Amounts in 1995 US$000
YEAR_______________ COSTS ______ ______ ______ BENEFITS _______ NET
Capital/Re I. Cost (fin.) Increm. Total Total Ship Deferred Saved Total COST /
Civil Equipment Mainten. Financial Economic Service Mainten. Cargo Economic BENEFIT
Works (private) Cost (fin.) Costs Costs Time Costs Handling Benefits FLOWS
1988 2,159 2,159 2,042 -2,0421989 2,516 2,516 2,380 -2,3801990 1,411 1,411 1,335 -1,3351991 10,047 10,047 9,504 -9,5041992 13,002 6,486 19,488 18,553 454 454 -18,0981993 20,318 5,252 378 25,948 24,627 2,745 931 312 3,988 -20,639
1994 17,539 13,095 1,005 31,639 30,130 10,861 811 1,486 13,158 -16,972
1995 16,718 6,111 1,256 24,085 22,849 17,035 922 3,225 21,183 -1,666
1996 14,236 1,256 15,492 14,866 21,906 922 8,969 31,797 16,931
1997 3,973 1,256 5,229 4,973 23,840 922 15,115 39,877 34,9041998 5,470 1,256 6,726 6,416 25,836 922 20,491 47,250 40,834
1999 3,973 1,256 5,229 4,973 26,897 922 23,165 50,985 46,012
2000 20,885 1,256 22,141 21,276 28,047 922 26,066 55,036 33,760
2001 9,158 1,256 10,414 9,971 29,295 922 29,214 59,431 49,460
2002 12,312 1,256 13,567 13,011 30,650 922 32,630 64,202 51,191
2003 8,196 1,256 9,452 9,044 30,969 922 33,435 65,326 56,283
2004 3,973 1,256 5,229 4,973 30,969 922 33,435 65,326 60,353
2005 5,042 1,256 6,298 6,003 30,969 922 33,435 65,326 59,323
2006 8,440 1,256 9,696 9,279 30,969 922 33,435 65,326 56,047
2007 8,440 1,256 9,696 9,279 30,969 922 33,435 65,326 56,047
2008 8,440 1,256 9,696 9,279 30,969 922 33,435 65,326 56,047
2009 8,440 1,256 9,696 9,279 30,969 922 33,435 65,326 56,047
2010 8,440 1,256 9,696 9,279 30,969 922 33,435 65,326 56,047
2011 8,440 1,256 9,696 9,279 30,969 922 33,435 65,326 56,047
2012 8,440 1,256 9,696 9,279 30,969 33,435 64,404 55,125
2013 8,440 1,256 9,696 9,279 30,969 33,435 64,404 55,125
2014 8,440 1,256 9,696 9,279 30,969 33,435 64,404 55,1252015 _______ 8,440 1,256 9,696 9,279 30,969 _______ 33,435 64,404 55,125
EIRR 26.7%