Embed Size (px)
Citation preview
ASIAN DEVELOPMENT BANK
ASIAN ECONOMICINTEGRATIONREPORT 2017THE ERA OF FINANCIAL INTERCONNECTEDNESS How Can Asia Strengthen Financial Resilience?

ASIAN DEVELOPMENT BANK
ASIAN ECONOMICINTEGRATIONREPORT 2017THE ERA OF FINANCIAL INTERCONNECTEDNESS How Can Asia Strengthen Financial Resilience?
Creative Commons Attribution 3.0 IGO license (CC BY 3.0 IGO)
© 2017 Asian Development Bank6 ADB Avenue, Mandaluyong City, 1550 Metro Manila, PhilippinesTel +63 2 632 4444; Fax +63 2 636 2444www.adb.org; openaccess.adb.org
Some rights reserved. Published in 2017.
ISBN 978-92-9257-977-7 (Print), 978-92-9257-978-4 (Electronic)Publication Stock No. TCS179038-2DOI: http://dx.doi.org/10.22617/TCS179038-2
The views expressed in this publication are those of the authors and do not necessarily reflect the views and policiesof the Asian Development Bank (ADB) or its Board of Governors or the governments they represent.
ADB does not guarantee the accuracy of the data included in this publication and accepts no responsibility for anyconsequence of their use. The mention of specific companies or products of manufacturers does not imply that theyare endorsed or recommended by ADB in preference to others of a similar nature that are not mentioned.
By making any designation of or reference to a particular territory or geographic area, or by using the term “country”in this document, ADB does not intend to make any judgments as to the legal or other status of any territory or area.
This work is available under the Creative Commons Attribution 3.0 IGO license (CC BY 3.0 IGO)https://creativecommons.org/licenses/by/3.0/igo/. By using the content of this publication, you agree to be boundby the terms of this license. For attribution, translations, adaptations, and permissions, please read the provisionsand terms of use at https://www.adb.org/terms-use#openaccess
This CC license does not apply to non-ADB copyright materials in this publication. If the material is attributedto another source, please contact the copyright owner or publisher of that source for permission to reproduce it.ADB cannot be held liable for any claims that arise as a result of your use of the material.
Please contact [email protected] if you have questions or comments with respect to content, or if you wishto obtain copyright permission for your intended use that does not fall within these terms, or for permission to usethe ADB logo.
Notes:In this publication, “$” refers to US dollars.Corrigenda to ADB publications may be found at http://www.adb.org/publications/corrigendaADB recognizes “China” as the People’s Republic of China; “Hong Kong” as Hong Kong, China; and “Korea” as the Republicof Korea.
CONTENTSForeword . . . . . . . . . . . . . . . . . . . . . . . . . . . . . . . . . . . . . . . . . . . . . . . . . . . . . . . viAcknowledgments . . . . . . . . . . . . . . . . . . . . . . . . . . . . . . . . . . . . . . . . . . . . . . viiDefinitions . . . . . . . . . . . . . . . . . . . . . . . . . . . . . . . . . . . . . . . . . . . . . . . . . . . . . . viiiAbbreviations . . . . . . . . . . . . . . . . . . . . . . . . . . . . . . . . . . . . . . . . . . . . . . . . . . . ixHighlights . . . . . . . . . . . . . . . . . . . . . . . . . . . . . . . . . . . . . . . . . . . . . . . . . . . . . . . xi
1. REGIONAL OUTLOOK, LINKAGES, AND VULNERABILITIES . . . . . . . . . . . . . . . . . . . . . . . . . . . . . . 1 Regional Outlook, Integration, and Challenges . . . . . . . . . . . . . . . . 2 Transmission Mechanism . . . . . . . . . . . . . . . . . . . . . . . . . . . . . . . . . . . . 4 Emerging Vulnerabilities . . . . . . . . . . . . . . . . . . . . . . . . . . . . . . . . . . . . . . 6 Coping Mechanisms . . . . . . . . . . . . . . . . . . . . . . . . . . . . . . . . . . . . . . . . . 8 Concluding Remarks . . . . . . . . . . . . . . . . . . . . . . . . . . . . . . . . . . . . . . . . . 11 References . . . . . . . . . . . . . . . . . . . . . . . . . . . . . . . . . . . . . . . . . . . . . . . . . . . 11
Box 1.1: Trade Volume Outlook For Asia . . . . . . . . . . . . . . . . . . . . . . . . . . . 5
2. TRADE AND THE GLOBAL VALUE CHAIN . . . . . . . . . . . . . 13 Recent Trends in Asia’s Trade . . . . . . . . . . . . . . . . . . . . . . . . . . . . . . . . . 14 Asia’s Intraregional Trade . . . . . . . . . . . . . . . . . . . . . . . . . . . . . . . . . . . . . . 16 Progress of Global and Regional Value Chains . . . . . . . . . . . . . . . . . 18 Updates on Regional Trade Policy . . . . . . . . . . . . . . . . . . . . . . . . . . . . . 19 References . . . . . . . . . . . . . . . . . . . . . . . . . . . . . . . . . . . . . . . . . . . . . . . . . . . . 23
Box 2.1: Gravity Model Estimation of Bilateral Exports . . . . . . . . . . . . . . 17
3. CROSS-BORDER INVESTMENT . . . . . . . . . . . . . . . . . . . . . . . 25 Trends and Patterns of FDI in Asia . . . . . . . . . . . . . . . . . . . . . . . . . . . . 26 Outward FDI . . . . . . . . . . . . . . . . . . . . . . . . . . . . . . . . . . . . . . . . . . . . . . . . . 30 References . . . . . . . . . . . . . . . . . . . . . . . . . . . . . . . . . . . . . . . . . . . . . . . . . . . . 36 Box 3.1: Outward Investments from Selected Asian Economies . . . . . 33
iii

Asian Economic Integration Report 2017iv Subregional Cooperation Initiatives viv
4. FINANCIAL INTEGRATION . . . . . . . . . . . . . . . . . . . . . . . . . . . 37 Progress in Cross-border Financial Transactions . . . . . . . . . . . . . . . 38 Analysis using Price Indicators . . . . . . . . . . . . . . . . . . . . . . . . . . . . . . . . . 49 Financial Spillovers . . . . . . . . . . . . . . . . . . . . . . . . . . . . . . . . . . . . . . . . . . . . 52 References . . . . . . . . . . . . . . . . . . . . . . . . . . . . . . . . . . . . . . . . . . . . . . . . . . . . 55
Box 4.1: Asia’s Cross-border Collateral Agreements . . . . . . . . . . . . . . . . . 47
5. REMITTANCES AND TOURISM RECEIPTS . . . . . . . . . . . . . 57 Remittance Flows to Asia . . . . . . . . . . . . . . . . . . . . . . . . . . . . . . . . . . . . . 58 Tourism Receipts . . . . . . . . . . . . . . . . . . . . . . . . . . . . . . . . . . . . . . . . . . . . . 62 References . . . . . . . . . . . . . . . . . . . . . . . . . . . . . . . . . . . . . . . . . . . . . . . . . . . . 64
Box 5.1: Understanding the Sources of Fluctuations in Remittance Inflows . . . . . . . . . . . . . . . . . . . . . . . . . . . . . . . . . . . . . 61
6. SUBREGIONAL COOPERATION INITIATIVES . . . . . . . . . 65 Central and West Asia: Central Asia Regional Economic
Cooperation Program . . . . . . . . . . . . . . . . . . . . . . . . . . . . . . . . . . . . . . . . . 66 Southeast Asia: Greater Mekong Subregion Program . . . . . . . . . . . 69 East Asia: Support to CAREC and GMS Programs . . . . . . . . . . . . . . 73 South Asia: South Asia Subregional Economic Cooperation . . . . 75 The Pacific: Regional Approach to Renewable Energy Investments . . . . . . . . . . . . . . . . . . . . . . . . . . . . . . . . . . . . . . . . . . . . . . . 79 Toward Regional Connectivity . . . . . . . . . . . . . . . . . . . . . . . . . . . . . . . . . 81 References . . . . . . . . . . . . . . . . . . . . . . . . . . . . . . . . . . . . . . . . . . . . . . . . . . . . 83
7. ASIA-PACIFIC REGIONAL COOPERATION AND INTEGRATION INDEX . . . . . . . . . . . . . . . . . . . . . . . . . . . 85
References . . . . . . . . . . . . . . . . . . . . . . . . . . . . . . . . . . . . . . . . . . . . . . . . . . . . 91 Annex . . . . . . . . . . . . . . . . . . . . . . . . . . . . . . . . . . . . . . . . . . . . . . . . . . . . . . . . 92
Box 7.1: Constructing the Asia-Pacific Regional Cooperation and Integration Index . . . . . . . . . . . . . . . . . . . . . . . . . . . . . . . . . . . . . . 87

Asian Economic Integration Report 2017iv Subregional Cooperation Initiatives vv
8. THEME CHAPTER THE ERA OF FINANCIAL INTERCONNECTEDNESS:
HOW CAN ASIA STRENGTHEN FINANCIAL RESILIENCE? . . . . . . . . . . . . . . . . . . . . . . . . . . . . . . . . . . . . . . . . . 95 Introduction . . . . . . . . . . . . . . . . . . . . . . . . . . . . . . . . . . . . . . . . . . . . . . . . . . 96 Experiences and Lessons from Past Crises . . . . . . . . . . . . . . . . . . . . . 97 Financial Conditions, Vulnerabilities, and Cycles in Asia . . . . . . . . 101 New Global Financial Conditions and Vulnerabilities . . . . . . . . . . 108 Asia’s Financial Interconnectedness, Transmission, and Spillovers of Shocks and Risks . . . . . . . . . . . . . . . . . . . . . . . . . . . . . . 110 Conclusions and Policy Considerations . . . . . . . . . . . . . . . . . . . . . . . . 125 Background Papers. . . . . . . . . . . . . . . . . . . . . . . . . . . . . . . . . . . . . . . . . . . . 130 References . . . . . . . . . . . . . . . . . . . . . . . . . . . . . . . . . . . . . . . . . . . . . . . . . . . . 131 Annex . . . . . . . . . . . . . . . . . . . . . . . . . . . . . . . . . . . . . . . . . . . . . . . . . . . . . . . . 134
Boxes 8.1: The Influence of US Dollar Funding Conditions on Asia’s Financial Markets . . . . . . . . . . . . . . . . . . . . . . . . . . . . . . . . . . . 106 8.2: Deriving Asia’s Financial Sector Network: Data, Methodology, and Model . . . . . . . . . . . . . . . . . . . . . . . . . . . . . . . . . 111 8.3: Assessing Interbank Contagion During the Global Financial Crisis: Data, Methodology, and Model . . . . . . . . . . . . 117 8.4: Estimating Macrofinancial Implications of Nonperforming Loans: Data, Methodology, and Model . . . . 122 9. STATISTICAL APPENDIX . . . . . . . . . . . . . . . . . . . . . . . . . . . . . 137
Asian Economic Integration Report 2017vi Subregional Cooperation Initiatives vii
FOREWORDThis year’s Asian Economic Integration Report (AEIR) continues to chronicle progress in regional cooperation and integration (RCI) in Asia and the Pacific. Despite an improved global economic outlook, elevated uncertainty in the international policy environment continues to weigh on global trade. Although world trade is expected to recover this year, its growth remains weaker than income growth following further deceleration in 2016. Foreign direct investment (FDI) worldwide also dropped 2% last year. Yet, the trend of RCI in Asia and the Pacific is gaining momentum, providing a buffer against the fallout from increasingly inward-looking policies around the world. Asia’s intraregional trade share—measured by value—rose to 57.3% in 2016 from 56.9% in 2015, up from an average 55.9% during 2010–2015. Intraregional FDI share also grew to 55.3% in 2016 from 47.6% in 2015. Asia’s cross-border bank claims increased to $4.4 trillion from $4.1 trillion. Asia’s international tourism receipts are increasingly sourced from other Asian economies, with more than 70% of Asia’s outbound tourists traveling within the region.
To better monitor this progress, AEIR 2017 introduces the Asia-Pacific Regional Cooperation and Integration Index (ARCII), a newly created composite index that allows comparative analysis of six RCI dimensions across subregional groups and economies. Its six component indexes cover: (i) trade and investment, (ii) money and finance, (iii) regional value chains, (iv) infrastructure and connectivity, (v) movement of people, and (vi) institutional and social integration. RCI in Asia and the Pacific, while significantly behind the European Union, ranks above both Africa and Latin America. Within the region, ARCII shows RCI is most advanced in East Asia and Southeast Asia, drawing on the expansion of regional trade and FDI networks linked to global supply chains.
AEIR 2017 includes a Theme Chapter on how best to enhance regional financial resilience as global financial systems become more interconnected. “The Era of Financial Interconnectedness: How Can Asia Strengthen Financial Resilience?” examines the structural weaknesses of the region’s financial systems, existing and emerging vulnerabilities, and the implications of increasingly more pronounced and procyclical financial cycles and financial interconnectedness. It investigates the evolution of financial networks and various channels through which financial shocks can be transmitted. And it specifically cites the region’s overreliance on external funding (largely denominated in US dollars) as one of many sources of potential vulnerability should the global financial cycle reverse and dollar liquidity tighten.
However, the Theme Chapter also shows that—20 years after the 1997/98 Asian financial crisis—wide-ranging reforms helped build national and regional financial resilience and safety net systems against the impact of external shocks—as seen by Asia’s relative resilience to and rapid recovery from the 2008/09 global financial crisis. The chapter reviews crisis lessons and remaining policy gaps for further structural reforms needed to further strengthen financial resilience. The region’s policy makers need to continue reforms that ensure good macroeconomic fundamentals, build strong regulatory and supervisory frameworks, deepen alternative sources of market financing such as local currency bond market transactions, and further strengthen financial safety nets. Finally, the region’s continued cooperation to ensure financial stability will allow authorities in Asia and the Pacific to respond promptly, decisively, and collectively should global risks and financial volatility pose risks to the region’s continued robust economic development.
Yasuyuki SawadaChief Economist and Director GeneralEconomic Research and Regional Cooperation DepartmentAsian Development Bank
Asian Economic Integration Report 2017vi Subregional Cooperation Initiatives vii
ACKNOWLEDGMENTSThe Asian Economic Integration Report (AEIR) 2017 was prepared by the Regional Cooperation and Integration Division (ERCI) of the Economic Research and Regional Cooperation Department (ERCD) of the Asian Development Bank (ADB), under the overall supervision of ERCI Director Cyn-Young Park. Jong Woo Kang coordinated overall production assisted by Mara Claire Tayag. ERCI consultants under Technical Assistance 9121: Asian Economic Integration—Building Knowledge for Policy Dialogue contributed data compilation, research, and analysis.
Contributing authors include James Villafuerte and with data support from Joy Blesilda Sinay and Pilar Dayag (Regional Outlook, Linkages, and Vulnerabilities); Jong Woo Kang, Mara Claire Tayag, Suzette Dagli, Dorothea Ramizo, and Paul Mariano (Trade and the Global Value Chain); Fahad Khan, Ma. Concepcion Latoja, Suzette Dagli, and Cindy Jane Justo (Cross-border Investment); Junkyu Lee, Kijin Kim, Satoru Yamadera, Ana Kristel Molina, and Racquel Claveria with data support from Clemence Fatima Cruz (Financial Integration); and Aiko Kikkawa Takenaka with data support from Grendell Vie Magoncia and Ma. Concepcion Latoja (Remittances and Tourism Receipts). The chapter “Subregional Cooperation Initiatives” was consolidated by Paulo Rodelio Halili based on contributions by regional departments of ADB: Shaista Hussain, Guoliang Wu, and Ronaldo Oblepias (Central and West Asia); Greater Mekong Subregion Secretariat (Southeast Asia); Ying Qian and Yuebin Zhang (East Asia); Rose McKenzie and Jesusito Tranquilino (South Asia); and Paul Curry and Rommel Rabanal (Pacific). The chapter on Asia-Pacific Regional Cooperation and Integration Index was written by Cyn-Young Park—based on a background paper by Cyn-Young Park and Hyeon-Seung Huh—with data support from Racquel Claveria. Junkyu Lee and Peter Rosenkranz coordinated and contributed to the production of the theme chapter, “The Era of Financial Interconnectedness: How Can Asia Strengthen Financial Resilience?” Background papers were provided by Ross Buckley, Stijn Claessens, Mardi Dungey, Junkyu Lee, Cyn-Young Park, Peter Rosenkranz, Kwanho Shin, and James Villafuerte. Monica Melchor, Jesson Pagaduan, Hoang Pham, and Alyssa Villanueva provided research support.
Guy Sacerdoti edited the report. Ariel Paelmo typeset and produced the layout. Erickson Mercado created the cover design and assisted in typesetting. Paulo Rodelio Halili and Aleli Rosario helped in proofreading. Support for AEIR 2017 printing and publishing was provided by the Printing Services Unit of ADB’s Office of Administrative Services and by the Publishing and Dissemination Unit of the Department of External Relations. Carol Ongchangco, Pia Asuncion Tenchavez, Maria Criselda Aherrera, and Marilyn Parra provided administrative and secretarial support, and helped organize the AEIR workshops, launch events, and other AEIR-related seminars. Harumi Kodama and Erik Churchill of the Department of External Relations coordinated dissemination of AEIR 2017.

Asian Economic Integration Report 2017viii Abbreviations ix
DEFINITIONSThe economies covered in the Asian Economic Integration Report 2017 are grouped by major analytic or geographic group.
● Asia refers to the 48 Asia and the Pacific members of the Asian Development Bank (ADB), which includes Japan and Oceania (Australia and New Zealand) in addition to the 45 developing Asian economies.
● Subregional economic groupings are listed below:
— Central Asia comprises Armenia, Azerbaijan, Georgia, Kazakhstan, the Kyrgyz Republic, Tajikistan, Turkmenistan, and Uzbekistan.
— East Asia comprises the People’s Republic of China; Hong Kong, China; Japan; the Republic of Korea; Mongolia; and Taipei,China.
— South Asia comprises Afghanistan, Bangladesh, Bhutan, India, Maldives, Nepal, Pakistan, and Sri Lanka.
— Southeast Asia comprises Brunei Darussalam, Cambodia, Indonesia, the Lao People’s Democratic Republic, Malaysia, Myanmar, the Philippines, Singapore, Thailand, and Viet Nam.
— The Pacific comprises the Cook Islands, Fiji, Kiribati, the Marshall Islands, the Federated States of Micronesia, Nauru, Papua New Guinea, Palau, Samoa, Solomon Islands, Timor-Leste, Tonga, Tuvalu, and Vanuatu.
— Oceania includes Australia and New Zealand.
Unless otherwise specified, the symbol “$” and the word “dollar” refer to US dollars, and percent changes are year-on-year.

Asian Economic Integration Report 2017viii Abbreviations ix
ABBREVIATIONSABMI Asian Bond Markets InitiativeADB Asian Development BankAEIR Asian Economic Integration ReportAFC Asian financial crisisAMRO ASEAN+3 Macroeconomic Research OfficeARCII Asia-Pacific Regional Cooperation and Integration IndexASEAN Association of Southeast Asian Nations (Brunei Darussalam, Cambodia, Indonesia,
the Lao People’s Democratic Republic, Malaysia, Myanmar, the Philippines, Singapore, Thailand, and Viet Nam)
ASEAN+3 ASEAN plus Japan, the People’s Republic of China, and the Republic of KoreaBCP border crossing pointBEZ border economic zone BIS Bank for International SettlementsBOJ Bank of JapanBOP balance of paymentsBOT Bank of ThailandBRI Belt and Road InitiativeCAGR compounded annual growth rateCAREC Central Asia Regional Economic CooperationCBCA cross-border collateral arrangementCBTA Cross-Border Transport Facilitation AgreementCCBM correspondent central banking modelCI CAREC InstituteCMI Chiang Mai InitiativeCMIM Chiang Mai Initiative MultilateralisationCSD central securities depositoriesDCC dynamic conditional correlationDMC developing member countryDVA domestic value addedECB European Central BankECD economic corridor developmentEDC European sovereign debt crisisEPA Economic Partnership AgreementEU European Union (Austria, Belgium, Bulgaria, Croatia, Cyprus, Czech Republic,
Denmark, Estonia, Finland, France, Germany, Greece, Hungary, Ireland, Italy, Latvia, Lithuania, Luxembourg, Malta, the Netherlands, Poland, Portugal, Romania, Slovak Republic, Slovenia, Spain, Sweden, and the United Kingdom)
euro area Austria, Belgium, Cyprus, Estonia, Finland, France, Germany, Greece, Ireland, Italy, Latvia, Lithuania, Luxembourg, Malta, the Netherlands, Portugal, Slovak Republic, Slovenia, and Spain
FDI foreign direct investmentFSM Federated States of MicronesiaFTA free trade agreementGCF Green Climate FundGDP gross domestic productGFC global financial crisisGMS Greater Mekong SubregionGVC global value chainHRD human resource developmentICT information and communication technology

Asian Economic Integration Report 2017x Highlights xi
IMF International Monetary FundM&A merger and acquisitionMW megawattNPL nonperforming loanOECD Organisation for Economic Co-operation and DevelopmentOFDI outward foreign direct investmentPCA principal components analysisPIREIP Pacific Islands Renewable Energy Investment ProgramPRC People’s Republic of ChinaPVAR panel vector autoregressionQE quantitative easingRCEP Regional Comprehensive Economic PartnershipRCI regional cooperation and integrationROW rest of the worldRTGS real-time gross settlementSASEC South Asia Subregional Economic CooperationSASEC OP SASEC Operational PlanSEZ special economic zoneSIFI systemically important financial institutionSME small and medium-sized enterpriseSPS sanitary and phytosanitarySSM Single Supervisory MechanismTFA Trade Facilitation AgreementTPP Trans-Pacific PartnershipTTF transport and trade facilitationTTFS Transport and Trade Facilitation StrategyTUTAP Turkmenistan–Uzbekistan–Tajikistan–Afghanistan–PakistanUK United KingdomUS United StatesVAR vector autoregressionVCIC Visakhapatnam–Chennai Industrial CorridorWTO World Trade Organization
Asian Economic Integration Report 2017x Highlights xi
Trade and Investment● Asia and the Pacific is leading a recovery in world trade amid the continued uncertainty surrounding
the global trade policy environment. In 2016, Asia’s trade (by volume) grew faster than global trade, but remained below its economic growth.1 Asia’s trade growth picked up to 1.7% in 2016 from 1.4% in 2015, while the world trade growth decelerated to 1.3% from 2.6%. Ongoing global economic recovery lifted demand for the region’s exports, particularly from Japan; Taipei,China; Hong Kong, China; and Viet Nam. The region’s import growth has also accelerated recently due to robust demand from the People’s Republic of China (PRC) and India, among others. Asia’s trade growth accelerated further to 7.4% during the first half of 2017 and will likely continue to gain momentum as global economic recovery gathers pace. However, potential bilateral trade friction and policy uncertainties among the world’s major trading partners remain downside risks.
● Asia’s intraregional trade continued to strengthen in 2016. Asia’s intraregional trade share—measured by value—rose to 57.3% in 2016 from 56.9% in 2015, up from an average 55.9% during 2010–2015. Strong intraregional trade offers a buffer against potential headwinds from global trade and policy uncertainties. Subregionally, trade integration—measured by the share of intra-subregional trade to total trade—is strongest in East Asia, followed by Southeast Asia and Central Asia.
● Amid a slowdown in total inward foreign direct investment to Asia, intraregional investment flows continue to rise. Global foreign direct investment (FDI) into the region (measured by gross inward FDI) fell 6% in 2016—to $492 billion from $525 billion in 2015. The region’s share of global inward FDI dropped to 28% from 30%. Nonetheless, intraregional FDI rose in both absolute value (to $272 billion in 2016 from $250 billion in 2015) and its share in total (to 55% from 48%). Intra-Asian FDI is geared more toward global and regional value chains, mainly going to greenfield investments in manufacturing. This should help strengthen the region’s trade globally as well as regionally.
● Asia’s outward foreign direct investment rose 11% in 2016—to $482 billion from $434 billion in 2015. The region’s outward FDI accounted for 33% of global FDI, up from 27% in 2015. In 2016, the PRC; Japan; and Hong Kong, China were among the world’s top 10 global investors. Combined, their outward FDI reached $391 billion, or 81% of total outward FDI from Asia. Emerging Asian investors such as India, the Republic of Korea, Malaysia, Singapore, and Thailand are also expanding their global presence in such areas as renewable energy, semiconductors, natural resources, information technology, and food, among others.
1 In this report, Asia refers to the 48 Asia and the Pacific members of the Asian Development Bank (ADB), including the region’s three advanced economies —Australia, Japan, and New Zealand, while developing Asia refers to ADB’s 45 developing member economies.
Highlights
Asian Economic Integration Report 2017xii Highlights xiii
Financial Integration● Asia’s portfolio investors continue to invest more outside the region. Outward debt investment from
Asian economies stood at $4.0 trillion in 2016, up from $3.6 trillion in 2015, driven largely by the region’s higher investments in the European Union (EU) (up $110 billion) and the United States (US) (up $224 billion). Outward equity investment outstanding also rose to $3.5 trillion from $3.2 trillion. Asia’s continued portfolio investment bias toward outside the region has led to a lower intraregional outward debt (equity) investment share—at 15.3% (19.0%) in 2016 from 16.7% (20.0%) in 2015.
● Cross-border banking activity in Asia is steadily increasing. Asia’s cross-border bank claims stood at $4.4 trillion in 2016, up from $4.1 trillion in 2015. Japan accounted for 88.7% of the increase due to its increased overseas lending especially to the US and the EU. Japan’s cross-border bank claims outstanding rose from $3.2 trillion to $3.4 trillion (driven by an increase of $19.8 billion to the region, $59.2 billion to the EU, and $131.3 billion to the US). The intraregional share of Asia’s cross-border bank claims also increased from 17.8% in 2011 to 21.4% in 2016.
● The volatility of Asian equity market returns is explained more by variations in global than regional equity market returns. Asian equity market return volatility is more prone to global impact, with the trend strengthening further since 2015. This suggests Asia’s equity markets remain more globally than regionally integrated. On the other hand, after the 2008/09 global financial crisis (GFC), a greater portion of volatility in Asian local currency bond returns is explained by variation in regional bond market returns, partly reflecting the growing participation of Asian investors in local currency bond markets. The impact of global shocks on local currency bond return volatility picked up, however, since the US Federal Reserve began to normalize monetary policy in 2015.
Movement of People● Remittances to the region dropped to $259 billion in 2016 from $269 billion in 2015—the largest drop
since 2009. Central Asian countries saw inflows decline for the third consecutive year, mainly due to weak economic recovery in the Russian Federation, the subregion’s top migrant destination. Low global oil prices also affected remittances to countries (like India and Pakistan) with a large number of workers in the Middle East. Around 45% of global remittances flow into Asia, the world’s largest source of international migrants. Empirical analyses suggest that remittance inflows are more stable when there is a higher proportion of female migrants. Quality institutions such as the rule of law and creditor protection in a migrant’s home country can also help stabilize remittance inflows, likely due to more reliable and efficient money transfer systems.
● Tourism is growing rapidly in the region, with an increasing number of tourists traveling within the region. Asia is the second largest beneficiary of tourism receipts after Europe. Tourism receipts reached $398.6 billion in 2015 after growing an average 10.1% yearly since 2012. More than 70% of Asia’s outbound tourists traveled within the region. The number of tourists from the PRC rose 11.8% in 2015, with 61.0% staying within the region. The PRC; Thailand; and Hong Kong, China earned most from tourism. However, as a proportion of gross domestic product (GDP), Maldives tops the list with 83.5% of GDP coming from tourism. The Pacific developing member countries earn an average 18.5% of GDP from tourism.

Asian Economic Integration Report 2017xii Highlights xiii
Asia-Pacific Regional Cooperation and Integration Index● This year’s Asian Economic Integration Report introduces a new composite index to gauge the progress
of regional cooperation and integration in Asia and the Pacific. Regional cooperation and integration (RCI) plays an important role in supporting economic growth and poverty reduction, and has been high on the development agenda for many Asian economies in recent years. Supporting RCI is one of ADB’s key strategic priorities for development assistance in the region. An index that calibrates the status of RCI can be a useful policy tool for assessing the progress of RCI efforts especially by various subregional initiatives.
● The Asia-Pacific Regional Cooperation and Integration Index is constructed from 26 socioeconomic indicators grouped into six dimensions to capture the diversity of regional cooperation and integration. The six dimensions cover: (i) trade and investment, (ii) money and finance, (iii) regional value chains, (iv) infrastructure and connectivity, (v) movement of people, and (vi) institutional and social integration (based on indicators for trade agreements, diplomatic ties, and cultural relations).
● The indicators are expressed as a ratio of a country’s intraregional sum (or average) to total sum (or average) of cross-border economic activities and are aggregated into a single composite index following a two-step procedure. The first step involves minimum-maximum scaling to normalize indicators with different measurement units to a uniform range between 0 and 1, with higher values denoting greater regional integration. The second step is to perform principal component analysis to estimate the weights used in aggregating individual indicators into a composite index: (i) first for each of the six dimensions and (ii) then again to combine the six composite indexes into the overall Asia-Pacific Regional Cooperation and Integration Index (ARCII).
● The ARCII allows Asian economies to keep track of the progress in their regional integration. The index allows comparative analysis of RCI by measuring the degree of RCI in the six dimensions as well as their collective contributions to overall regional integration across subregional groups or countries. The six dimensional indexes are designed to reflect the core socioeconomic components of the regional integration process. The ARCII allows each subregional group or economy to identify their strengths and weaknesses across the six RCI dimensions.
● The ARCII, by the nature of its construction, measures an Asian economy’s integration with the other regional economies relative to its integration with the world. As such, a low score in an economy’s ARCII does not necessarily mean the economy is not regionally integrated defined in some absolute terms, but it would simply reflect the economy’s higher interregional rather than intraregional integration. For example, Singapore, one of the region’s top performers in ARCII, scores high across all six dimensions, but its regional money and finance integration is weaker relative to other dimensions. This stems largely from the fact that Singapore is a global financial center and more globally integrated than regionally. Both Japan and Hong Kong, China are equally regarded as global financial centers and also have relatively low scores for regional money and finance integration.
● The EU has the highest regional integration score on all but one dimensional indexes; but Asia outranks both Africa and Latin America. The EU broadly outperforms Asia across all dimensions—Asia’s trade and investment integration index is the only one comparable in magnitude. Asia’s institutional and social integration is particularly weak. Asia’s composite ARCII index is 0.448, below the EU’s 0.617. Latin America follows close behind at 0.423, with Africa at 0.395. Regional value chain and movement of people are Asia’s most regionally integrated components, while institutional and social integration is least.
Asian Economic Integration Report 2017xiv Highlights xv
THEME CHAPTER
The Era of Financial Interconnectedness: How Can Asia Strengthen Financial Resilience?
● Twenty years after the Asian financial crisis, Asia stands strong—with more flexible exchange rates, higher foreign reserves, healthier financial systems, stronger regulations, deeper capital markets, and better regional financial cooperation mechanisms. Nonetheless, the region’s economic growth and financial stability were briefly disrupted by the GFC. Significant challenges remain, along with unresolved financial market and system weaknesses. Remaining regulatory policy gaps also leave room for a buildup of financial vulnerability through excessive leverage and risk-taking. Asia’s policy makers must remain vigilant and be ready to act when necessary, while continuing to deepen financial reforms.
● Structural weaknesses continue to permeate Asian financial markets and systems. In particular, when combined with increased procyclicality of financial cycles and growing regional and global financial interconnectedness, these weaknesses present new challenges. They include how: (i) increased financial interconnectedness helps speed international transmission of financial risks; (ii) foreign currency-(especially US dollar-)denominated debt continues to rise, reflecting limited domestic capital market-based financing solutions; (iii) rising private-sector debt and leverage—combined with the rapid growth of shadow banking (including wealth management products issued in some Asian economies)—increase financial fragility; and how (iv) deteriorating bank asset quality and its potential macrofinancial feedback effects pose risks to Asia’s economic and financial stability.
● Over the past 20 years, Asian financial markets have become more interconnected—both globally and intraregionally. Empirical analysis of 42 equity markets (15 within Asia) from 1996 to 2016 shows a deepening and growing complexity in Asian financial market interconnectedness. The results also reveal that interconnectedness increased during financial crises and decreased during recoveries.
● Growing financial interconnectedness can increase vulnerabilities to external shocks, financial contagion, or liquidity risks stemming from cross-border bank lending. Analyzing bilateral data on cross-border bank liabilities suggests that an economy’s banking exposure to crisis-affected economies can affect the size of capital outflows from the economy during a crisis. The analysis highlights how cross-border bank borrowing can become a global transmission channel when liquidity tightens.
● Continued high reliance on US dollar-denominated funding has significant implications for the transmission of global financial conditions to domestic financial and macroeconomic conditions. In the first quarter of 2017, 79% of total outstanding international debt securities for Asia’s major emerging economies were denominated in US dollars, with shares recently rising. The concentration of foreign borrowing in a single currency leaves the region’s financial systems vulnerable to external shocks through unexpected changes in foreign currency liquidity conditions and related capital flow reversals. Empirical evidence shows that a change in bilateral US dollar exchange rates has a significant impact on sovereign credit risk premiums (widening sovereign bond market spreads), which can affect financial conditions in some emerging Asian economies.
Asian Economic Integration Report 2017xiv Highlights xv
● The recent rise in nonperforming loans in several emerging Asian economies is a concern due to potential macrofinancial feedback effects. Nonperforming loans (NPLs) have increased in the PRC, India, Bangladesh, Indonesia, and Mongolia, among others. Empirical findings show that while macroeconomic conditions and bank-specific factors—such as rapid credit growth and excessive bank lending—contribute to the buildup of NPLs, a sustained increase can likewise lead to a reduction in credit supply and slowdown in overall economic activity.
Policy Considerations for Enhancing Financial Resilience
● A key lesson drawn from recent crises is the urgent need to strengthen macroprudential regulation and supervision in the region. Authorities should consider establishing and implementing an effective macroprudential policy framework to address two dimensions of system-wide risk: (i) a buildup of systemic risk over time (the “time dimension”), and (ii) a spillover and contagion of risk across different financial sectors and systems (the “cross-sectional dimension”). Macroprudential policy tools—such as countercyclical provisions, capital and liquidity buffers, and other balance sheet instruments—can be useful in mitigating financial system procyclicality.
● Further developing local currency bond markets across the region is key to enhancing financial resilience and mobilizing stable long-term finance. While local currency bonds outstanding in Association of Southeast Asian Nations plus the PRC, Japan, and the Republic of Korea (ASEAN+3) tripled from $6.6 trillion in 2002 to $19.8 trillion at end-2016, challenges remain. To meet the region’s financing needs, local currency bond markets must improve market efficiency, broaden their investor base, deepen secondary markets, and integrate more regionally.
● Growing cross-border banking activities and systemic importance of some large regional financial institutions underscore the need to discuss regional regulatory cooperation, including resolution mechanisms for interconnected regional banks. Supervisory colleges for regionally active foreign banks can be an effective regional cooperation tool to strengthen cross-border supervision in Asia. Regional cooperation to develop effective resolution mechanisms for distressed assets of cross-border financial institutions can also complement national efforts to address NPLs efficiently and sustainably.
● The region should consider reviewing and strengthening existing financial safety nets against potential contagion and spillover effects. Asia’s financial markets are increasingly open, interconnected, and vulnerable to external shocks. Strengthening the Chiang Mai Initiative Multilateralisation and its regional macroeconomic surveillance unit, the ASEAN+3 Macroeconomic Research Office, can help monitor potential liquidity risks and slow the spread of shocks across the region’s economies.

Regional Outlook, Linkages, and Vulnerabilities
01

Asian Economic Integration Report 20172 Regional Outlook, Linkages, and Vulnerabilities 3
Regional Outlook, Integration, and Challenges Developing Asia’s economic output is expected to grow 5.9% in 2017 from 5.8% in 2016—0.2 percentage point above the projection in the Asian Economic Integration Report 2016.
A rebound in global trade, recovery in major industrial economies, and stronger-than-expected growth in the People’s Republic of
China (PRC) are expected to support the better growth outlook. Gross domestic product (GDP) in the PRC is now expected to grow 6.7% in 2017—0.3 percentage point above the Asian Economic Integration Report 2016
forecast—led by expansionary fiscal policy and an unanticipated rise in external demand.
More than 70% of the region’s economies should see faster growth compared with 2016, with higher rates in all subregions except East Asia and South Asia, where growth this year is stable (Table 1.1). A better external environment and strong domestic demand generally support the forecast. After 2 years of lower export receipts, the value of the region’s exports surged 10.1% year-on-year in the first 7 months of 2017. Moderately rising oil prices are giving some fiscal relief to oil and gas exporters without destabilizing oil importers. Excluding the PRC, Asia’s eight largest developing economies also saw real manufacturing exports rebound—particularly electronics, where foreign direct investment has been increasing (ADB 2017).
Table 1.1: Regional GDP Growtha (%, year-on-year)2014 2015 2016 Forecastc
2017 2018
Developing Asiab 6.4 6.0 5.8 5.9 5.8
Central Asia 5.2 3.1 2.2 3.3 3.9
East Asia 6.6 6.1 6.0 6.0 5.8
People’s Republic of China 7.3 6.9 6.7 6.7 6.4
South Asia 6.9 7.3 6.7 6.7 7.0
India 7.5 8.0 7.1 7.0 7.4
Southeast Asia 4.6 4.6 4.6 5.0 5.1
The Pacific 9.4 8.4 2.4 2.9 3.2
Major industrialized economies
euro area 1.2 1.9 1.7 2.0 1.8
Japan 0.2 1.1 1.0 1.5 1.1
United States 2.4 2.9 1.5 2.2 2.4GDP = gross domestic product.a Aggregates weighted by gross national income levels (Atlas method, current $) from World Development Indicators, World Bank. b Refers to the 45 ADB developing member economies.c Forecasts based on ADB’s Asian Development Outlook Update 2017.Sources: ADB calculations using data from ADB (2017); and CEIC (accessed September 2017).
Regional Outlook, Linkages, and Vulnerabilities
Asian Economic Integration Report 20172 Regional Outlook, Linkages, and Vulnerabilities 3
Risks to the outlook have become more balanced, both positive and negative.
There are three main risks to the outlook: (i) lower-than-expected oil prices; (ii) United States (US) monetary policy surprises; and (iii) uncertain US fiscal policy reform. While softening oil prices would benefit importers, it would also hit oil exporters. A sharper-than-expected tightening of the US Federal Funds rate could still induce large capital outflows from developing Asia, although better communication of US Federal Reserve intentions has so far averted market overreaction. And while US tax reform and spending on public works could have positive global spillover effects, intense debate and possible political stalemate over budget details could unsettle currently buoyant business expectations of a boost in domestic demand, thereby increasing market uncertainty.
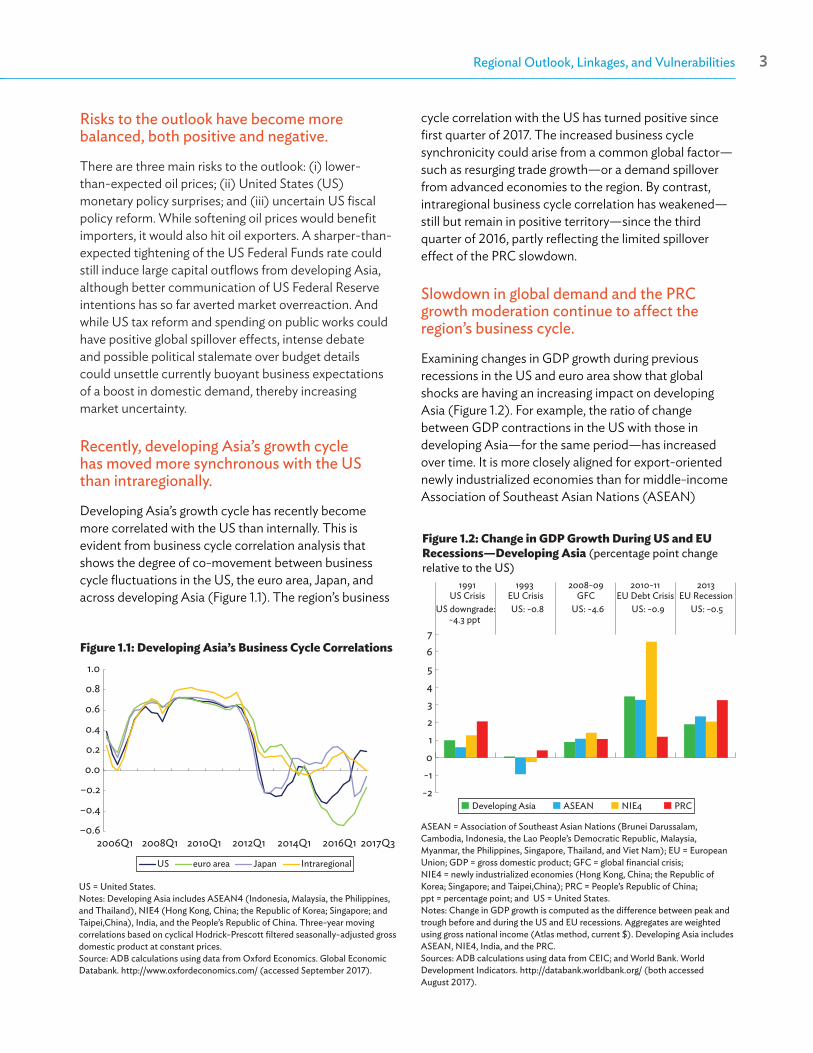
Recently, developing Asia’s growth cycle has moved more synchronous with the US than intraregionally.
Developing Asia’s growth cycle has recently become more correlated with the US than internally. This is evident from business cycle correlation analysis that shows the degree of co-movement between business cycle fluctuations in the US, the euro area, Japan, and across developing Asia (Figure 1.1). The region’s business
US euro area Japan Intraregional
–0.6
–0.4
–0.2
0.0
0.2
0.4
0.6
0.8
1.0
2006Q1 2008Q1 2010Q1 2012Q1 2014Q1 2016Q1 2017Q3
Figure 1.1: Developing Asia’s Business Cycle Correlations
US = United States. Notes: Developing Asia includes ASEAN4 (Indonesia, Malaysia, the Philippines, and Thailand), NIE4 (Hong Kong, China; the Republic of Korea; Singapore; and Taipei,China), India, and the People’s Republic of China. Three-year moving correlations based on cyclical Hodrick-Prescott filtered seasonally-adjusted gross domestic product at constant prices.Source: ADB calculations using data from Oxford Economics. Global Economic Databank. http://www.oxfordeconomics.com/ (accessed September 2017).
cycle correlation with the US has turned positive since first quarter of 2017. The increased business cycle synchronicity could arise from a common global factor—such as resurging trade growth—or a demand spillover from advanced economies to the region. By contrast, intraregional business cycle correlation has weakened—still but remain in positive territory—since the third quarter of 2016, partly reflecting the limited spillover effect of the PRC slowdown.
Slowdown in global demand and the PRC growth moderation continue to affect the region’s business cycle.
Examining changes in GDP growth during previous recessions in the US and euro area show that global shocks are having an increasing impact on developing Asia (Figure 1.2). For example, the ratio of change between GDP contractions in the US with those in developing Asia—for the same period—has increased over time. It is more closely aligned for export-oriented newly industrialized economies than for middle-income Association of Southeast Asian Nations (ASEAN)
-2-101234567
US downgrade:-4.3 ppt
US: -0.8 US: -4.6 US: -0.9 US: -0.5
1991US Crisis
1993 EU Crisis
2008-09GFC
2010-11EU Debt Crisis
2013EU Recession
Developing Asia ASEAN NIE4 PRC
Figure 1.2: Change in GDP Growth During US and EU Recessions—Developing Asia (percentage point change relative to the US)
ASEAN = Association of Southeast Asian Nations (Brunei Darussalam, Cambodia, Indonesia, the Lao People’s Democratic Republic, Malaysia, Myanmar, the Philippines, Singapore, Thailand, and Viet Nam); EU = European Union; GDP = gross domestic product; GFC = global financial crisis; NIE4 = newly industrialized economies (Hong Kong, China; the Republic of Korea; Singapore; and Taipei,China); PRC = People’s Republic of China; ppt = percentage point; and US = United States.Notes: Change in GDP growth is computed as the difference between peak and trough before and during the US and EU recessions. Aggregates are weighted using gross national income (Atlas method, current $). Developing Asia includes ASEAN, NIE4, India, and the PRC.Sources: ADB calculations using data from CEIC; and World Bank. World Development Indicators. http://databank.worldbank.org/ (both accessed August 2017).
Asian Economic Integration Report 20174 Regional Outlook, Linkages, and Vulnerabilities 5
economies. Similarly, as its exports grew, the PRC economy became more sensitive to the US and euro area recessions. Its growth moderation also continues to affect the region’s growth cycle and prospects.
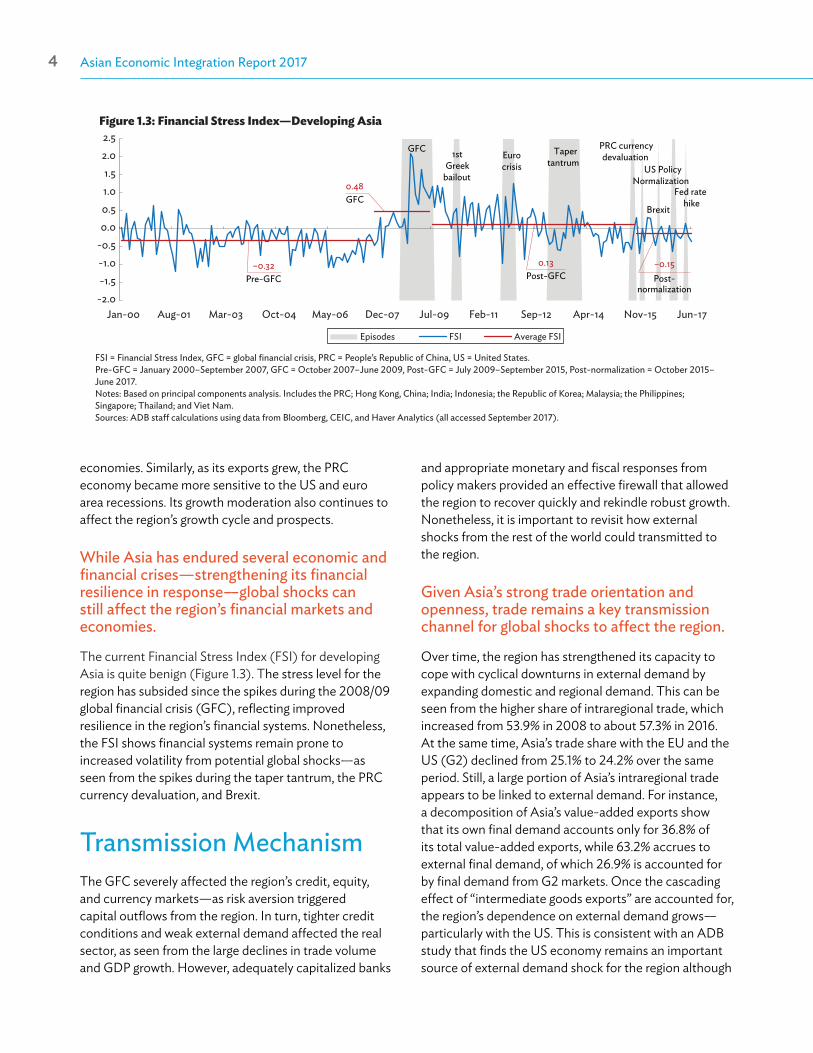
While Asia has endured several economic and financial crises—strengthening its financial resilience in response—global shocks can still affect the region’s financial markets and economies.
The current Financial Stress Index (FSI) for developing Asia is quite benign (Figure 1.3). The stress level for the region has subsided since the spikes during the 2008/09 global financial crisis (GFC), reflecting improved resilience in the region’s financial systems. Nonetheless, the FSI shows financial systems remain prone to increased volatility from potential global shocks—as seen from the spikes during the taper tantrum, the PRC currency devaluation, and Brexit.
Transmission MechanismThe GFC severely affected the region’s credit, equity, and currency markets—as risk aversion triggered capital outflows from the region. In turn, tighter credit conditions and weak external demand affected the real sector, as seen from the large declines in trade volume and GDP growth. However, adequately capitalized banks
Figure 1.3: Financial Stress Index—Developing Asia
FSI = Financial Stress Index, GFC = global financial crisis, PRC = People’s Republic of China, US = United States.Pre-GFC = January 2000–September 2007, GFC = October 2007–June 2009, Post-GFC = July 2009–September 2015, Post-normalization = October 2015–June 2017.Notes: Based on principal components analysis. Includes the PRC; Hong Kong, China; India; Indonesia; the Republic of Korea; Malaysia; the Philippines; Singapore; Thailand; and Viet Nam.Sources: ADB staff calculations using data from Bloomberg, CEIC, and Haver Analytics (all accessed September 2017).
–0.32Pre-GFC
Episodes FSI Average FSI
-2.0-1.5-1.0-0.50.00.51.01.5
2.02.5
Jan-00 Aug-01 Mar-03 Oct-04 May-06 Dec-07 Jul-09 Feb-11 Sep-12 Apr-14 Nov-15 Jun-17
0.48GFC
0.13Post-GFC
–0.15Post-
normalization
GFC 1st Greek
bailout
Euro crisis
Taper tantrum
PRC currency devaluation
US Policy Normalization
Brexit
Fed rate hike
and appropriate monetary and fiscal responses from policy makers provided an effective firewall that allowed the region to recover quickly and rekindle robust growth. Nonetheless, it is important to revisit how external shocks from the rest of the world could transmitted to the region.
Given Asia’s strong trade orientation and openness, trade remains a key transmission channel for global shocks to affect the region.
Over time, the region has strengthened its capacity to cope with cyclical downturns in external demand by expanding domestic and regional demand. This can be seen from the higher share of intraregional trade, which increased from 53.9% in 2008 to about 57.3% in 2016. At the same time, Asia’s trade share with the EU and the US (G2) declined from 25.1% to 24.2% over the same period. Still, a large portion of Asia’s intraregional trade appears to be linked to external demand. For instance, a decomposition of Asia’s value-added exports show that its own final demand accounts only for 36.8% of its total value-added exports, while 63.2% accrues to external final demand, of which 26.9% is accounted for by final demand from G2 markets. Once the cascading effect of “intermediate goods exports” are accounted for, the region’s dependence on external demand grows—particularly with the US. This is consistent with an ADB study that finds the US economy remains an important source of external demand shock for the region although
Asian Economic Integration Report 20174 Regional Outlook, Linkages, and Vulnerabilities 5
0.00.10.20.30.40.50.60.70.80.91.0
-40-30-20-10
01020304050
Jan-90 Jul-94 Jan-99 Jul-03 Jan-08 Jul-12 Jan-17
1990s: 0.34
2000s: 0.912010s: 0.85
Developing Asia's exports (left) US non-oil imports (left)Correlation (right)
% c
hang
e, ye
ar-o
n-ye
ar
Corre
latio
n
Figure 1.4: Correlation between US Non-oil Imports and Developing Asia’s Exports
US = United States.Notes: Non-oil imports is computed by subtracting crude oil imports from total goods imports. Developing Asia includes ASEAN4 (Indonesia, Malaysia, the Philippines, and Thailand), NIE4 (Hong Kong, China; the Republic of Korea; Singapore; and Taipei,China), India, and the People’s Republic of China.Sources: ADB calculations using data from CEIC; International Monetary Fund. International Financial Statistics. https://www.imf.org/en/Data; and United States Census Bureau. https://www.census.gov/ (all accessed August 2017).
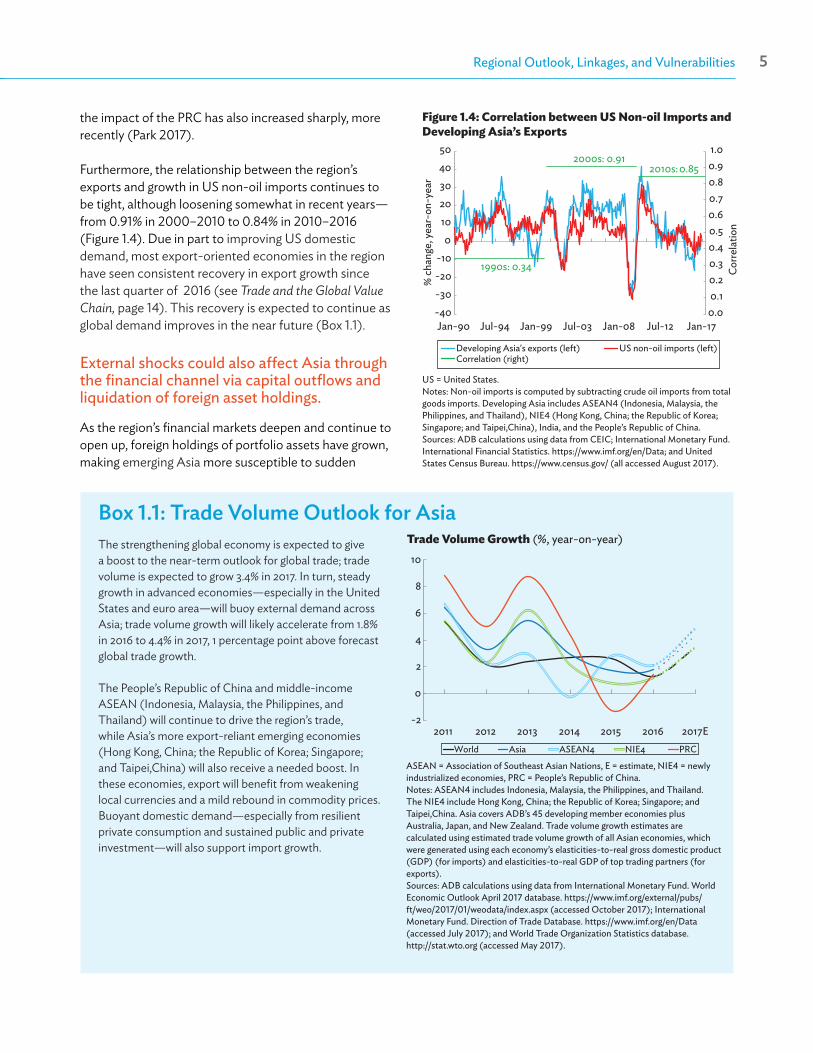
the impact of the PRC has also increased sharply, more recently (Park 2017).
Furthermore, the relationship between the region’s exports and growth in US non-oil imports continues to be tight, although loosening somewhat in recent years—from 0.91% in 2000–2010 to 0.84% in 2010–2016 (Figure 1.4). Due in part to improving US domestic demand, most export-oriented economies in the region have seen consistent recovery in export growth since the last quarter of 2016 (see Trade and the Global Value Chain, page 14). This recovery is expected to continue as global demand improves in the near future (Box 1.1).
External shocks could also affect Asia through the financial channel via capital outflows and liquidation of foreign asset holdings.
As the region’s financial markets deepen and continue to open up, foreign holdings of portfolio assets have grown, making emerging Asia more susceptible to sudden
Trade Volume Growth (%, year-on-year)
ASEAN = Association of Southeast Asian Nations, E = estimate, NIE4 = newly industrialized economies, PRC = People’s Republic of China. Notes: ASEAN4 includes Indonesia, Malaysia, the Philippines, and Thailand. The NIE4 include Hong Kong, China; the Republic of Korea; Singapore; and Taipei,China. Asia covers ADB’s 45 developing member economies plus Australia, Japan, and New Zealand. Trade volume growth estimates are calculated using estimated trade volume growth of all Asian economies, which were generated using each economy’s elasticities-to-real gross domestic product (GDP) (for imports) and elasticities-to-real GDP of top trading partners (for exports).Sources: ADB calculations using data from International Monetary Fund. World Economic Outlook April 2017 database. https://www.imf.org/external/pubs/ft/weo/2017/01/weodata/index.aspx (accessed October 2017); International Monetary Fund. Direction of Trade Database. https://www.imf.org/en/Data (accessed July 2017); and World Trade Organization Statistics database. http://stat.wto.org (accessed May 2017).
Box 1.1: Trade Volume Outlook for AsiaThe strengthening global economy is expected to givea boost to the near-term outlook for global trade; tradevolume is expected to grow 3.4% in 2017. In turn, steadygrowth in advanced economies—especially in the UnitedStates and euro area—will buoy external demand acrossAsia; trade volume growth will likely accelerate from 1.8%in 2016 to 4.4% in 2017, 1 percentage point above forecast global trade growth.
The People’s Republic of China and middle-income ASEAN (Indonesia, Malaysia, the Philippines, and Thailand) will continue to drive the region’s trade, while Asia’s more export-reliant emerging economies (Hong Kong, China; the Republic of Korea; Singapore; and Taipei,China) will also receive a needed boost. In these economies, export will benefit from weakening local currencies and a mild rebound in commodity prices. Buoyant domestic demand—especially from resilient private consumption and sustained public and private investment—will also support import growth.
World Asia ASEAN4 NIE4 PRC
-2
0
2
4
6
8
10
2011 2012 2013 2014 2015 2016 2017E
Asian Economic Integration Report 20176 Regional Outlook, Linkages, and Vulnerabilities 7
capital outflows (Figure 1.5). Many economies in the region continue to rely on foreign borrowing and foreign investment in their financial assets. This reflects the increasing integration of regional financial markets with global markets—increasing the impact and influence of global investor sentiment and asset price movements on the region’s financial markets.
There are also other transmission channels, such as commodity prices—which could transmit terms-of-trade shocks to Asia’s resource-dependent economies. Similarly, changes in the US monetary policy and exchange rate movements could also transmit some second-round price and wealth effects on trade and global financial asset positions.
Emerging VulnerabilitiesDespite strong resilience against a weak external environment, vulnerabilities in Asia’s financial systems should not be underestimated. Generally, the region’s policy makers have remained prudent in managing their economies—as seen in much-improved financial and external vulnerability indicators since 2006. However, some financial vulnerabilities linger and policy space could contract further should external conditions worsen.
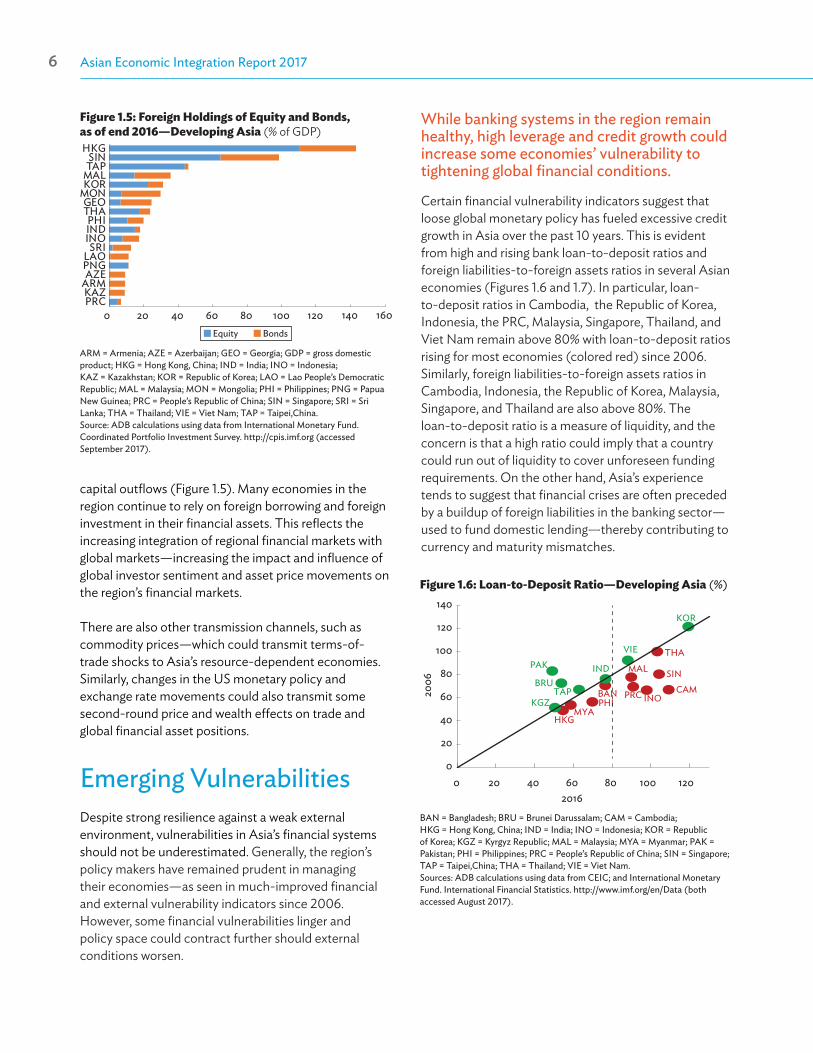
While banking systems in the region remain healthy, high leverage and credit growth could increase some economies’ vulnerability to tightening global financial conditions.
Certain financial vulnerability indicators suggest that loose global monetary policy has fueled excessive credit growth in Asia over the past 10 years. This is evident from high and rising bank loan-to-deposit ratios and foreign liabilities-to-foreign assets ratios in several Asian economies (Figures 1.6 and 1.7). In particular, loan-to-deposit ratios in Cambodia, the Republic of Korea, Indonesia, the PRC, Malaysia, Singapore, Thailand, and Viet Nam remain above 80% with loan-to-deposit ratios rising for most economies (colored red) since 2006. Similarly, foreign liabilities-to-foreign assets ratios in Cambodia, Indonesia, the Republic of Korea, Malaysia, Singapore, and Thailand are also above 80%. The loan-to-deposit ratio is a measure of liquidity, and the concern is that a high ratio could imply that a country could run out of liquidity to cover unforeseen funding requirements. On the other hand, Asia’s experience tends to suggest that financial crises are often preceded by a buildup of foreign liabilities in the banking sector—used to fund domestic lending—thereby contributing to currency and maturity mismatches.
Figure 1.6: Loan-to-Deposit Ratio—Developing Asia (%)
BAN = Bangladesh; BRU = Brunei Darussalam; CAM = Cambodia; HKG = Hong Kong, China; IND = India; INO = Indonesia; KOR = Republic of Korea; KGZ = Kyrgyz Republic; MAL = Malaysia; MYA = Myanmar; PAK = Pakistan; PHI = Philippines; PRC = People’s Republic of China; SIN = Singapore; TAP = Taipei,China; THA = Thailand; VIE = Viet Nam. Sources: ADB calculations using data from CEIC; and International Monetary Fund. International Financial Statistics. http://www.imf.org/en/Data (both accessed August 2017).
BANBRU
CAMPRC
HKG
IND
INO
KOR
KGZ
MAL
MYA
PAK
PHI
SIN
TAP
THAVIE
0
20
40
60
80
100
120
140
0 20 40 60 80 100 120
2006
2016
Figure 1.5: Foreign Holdings of Equity and Bonds, as of end 2016—Developing Asia (% of GDP)
ARM = Armenia; AZE = Azerbaijan; GEO = Georgia; GDP = gross domestic product; HKG = Hong Kong, China; IND = India; INO = Indonesia; KAZ = Kazakhstan; KOR = Republic of Korea; LAO = Lao People’s Democratic Republic; MAL = Malaysia; MON = Mongolia; PHI = Philippines; PNG = Papua New Guinea; PRC = People’s Republic of China; SIN = Singapore; SRI = Sri Lanka; THA = Thailand; VIE = Viet Nam; TAP = Taipei,China. Source: ADB calculations using data from International Monetary Fund. Coordinated Portfolio Investment Survey. http://cpis.imf.org (accessed September 2017).
Equity Bonds
0 20 40 60 80 100 120 140 160PRCKAZ
ARMAZE
PNGLAO
SRIINOINDPHI
THAGEO
MONKORMALTAPSIN
HKG
Asian Economic Integration Report 20176 Regional Outlook, Linkages, and Vulnerabilities 7
0 50 100 150 200 250
PRCTAP
MYAVIEPHI
HKGKORTHA
SINMALCAMINO
2016 2006
Figure 1.7: Foreign Liabilities-to-Foreign Assets Ratio —Developing Asia (%)
CAM = Cambodia; HKG = Hong Kong, China; INO = Indonesia; KOR = Republic of Korea; MAL = Malaysia; MYA = Myanmar; PHI = Philippines; PRC = People’s Republic of China; SIN = Singapore; TAP = Taipei,China; THA = Thailand; VIE = Viet Nam. Source: ADB calculations using data from CEIC; and International Monetary Fund. International Financial Statistics. http://www.imf.org/en/Data (both accessed August 2017).
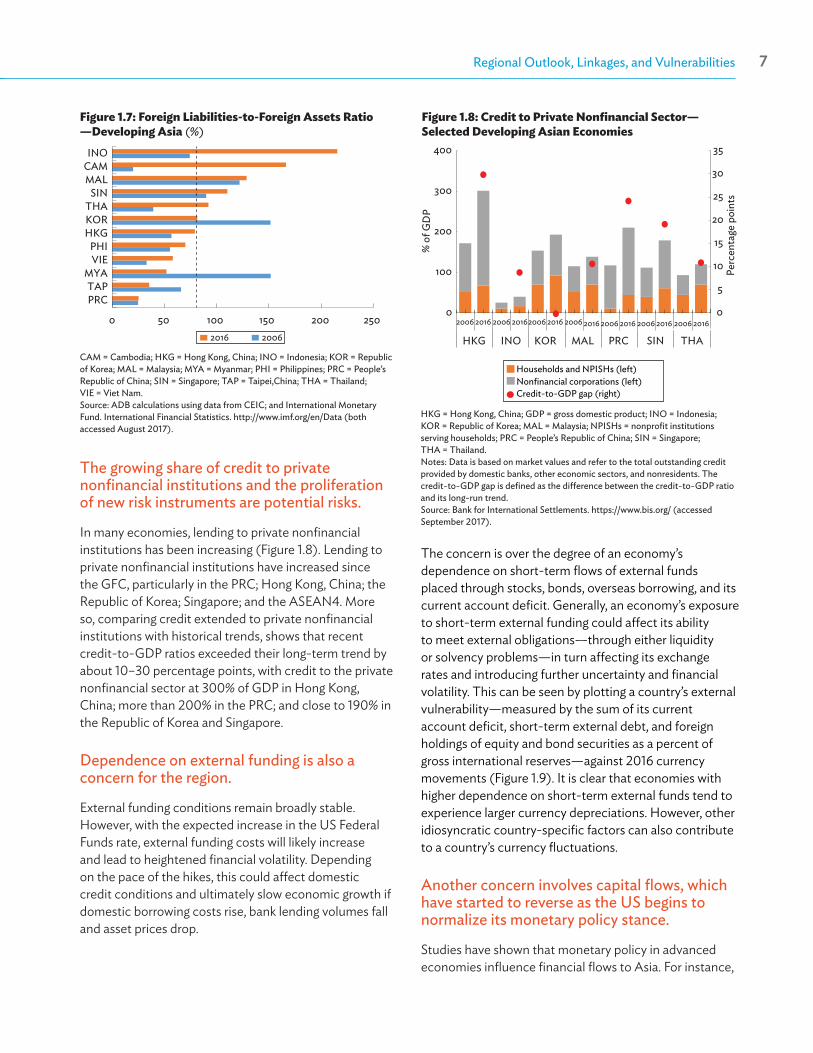
The growing share of credit to private nonfinancial institutions and the proliferation of new risk instruments are potential risks.
In many economies, lending to private nonfinancial institutions has been increasing (Figure 1.8). Lending to private nonfinancial institutions have increased since the GFC, particularly in the PRC; Hong Kong, China; the Republic of Korea; Singapore; and the ASEAN4. More so, comparing credit extended to private nonfinancial institutions with historical trends, shows that recent credit-to-GDP ratios exceeded their long-term trend by about 10–30 percentage points, with credit to the private nonfinancial sector at 300% of GDP in Hong Kong, China; more than 200% in the PRC; and close to 190% in the Republic of Korea and Singapore.
Dependence on external funding is also a concern for the region.
External funding conditions remain broadly stable. However, with the expected increase in the US Federal Funds rate, external funding costs will likely increase and lead to heightened financial volatility. Depending on the pace of the hikes, this could affect domestic credit conditions and ultimately slow economic growth if domestic borrowing costs rise, bank lending volumes fall and asset prices drop.
The concern is over the degree of an economy’s dependence on short-term flows of external funds placed through stocks, bonds, overseas borrowing, and its current account deficit. Generally, an economy’s exposure to short-term external funding could affect its ability to meet external obligations—through either liquidity or solvency problems—in turn affecting its exchange rates and introducing further uncertainty and financial volatility. This can be seen by plotting a country’s external vulnerability—measured by the sum of its current account deficit, short-term external debt, and foreign holdings of equity and bond securities as a percent of gross international reserves—against 2016 currency movements (Figure 1.9). It is clear that economies with higher dependence on short-term external funds tend to experience larger currency depreciations. However, other idiosyncratic country-specific factors can also contribute to a country’s currency fluctuations.
Another concern involves capital flows, which have started to reverse as the US begins to normalize its monetary policy stance.
Studies have shown that monetary policy in advanced economies influence financial flows to Asia. For instance,
Figure 1.8: Credit to Private Nonfinancial Sector—Selected Developing Asian Economies
HKG = Hong Kong, China; GDP = gross domestic product; INO = Indonesia; KOR = Republic of Korea; MAL = Malaysia; NPISHs = nonprofit institutions serving households; PRC = People’s Republic of China; SIN = Singapore; THA = Thailand. Notes: Data is based on market values and refer to the total outstanding credit provided by domestic banks, other economic sectors, and nonresidents. The credit-to-GDP gap is defined as the difference between the credit-to-GDP ratio and its long-run trend. Source: Bank for International Settlements. https://www.bis.org/ (accessed September 2017).
Households and NPISHs (left)Nonfinancial corporations (left)Credit-to-GDP gap (right)
0
5
10
15
20
25
30
35
0
100
200
300
400
HKG INO KOR
2006 2016 2006 20162006 2016 2006 2016 2006 2016 2006 2016 2006 2016
MAL PRC SIN THA
% o
f GD
P
Perc
enta
ge p
oint
s

Asian Economic Integration Report 20178 Regional Outlook, Linkages, and Vulnerabilities 9
an ADB study by Park et al. (2014) observed that the US quantitative easing (QE) had a significant impact on capital flows to Asian developing economies. Examining flows before and after periods of QE in the US found that while total flows were comparable, their composition changed—direct financing through capital markets partly replaced bank financing. When the individual impact of the three rounds of QE were examined, only the impact of the first was significant. Global risk variables and emerging stock market returns were also significant drivers (Cho and Rhee 2013, Koepke 2016, Morgan 2011, Park et al. 2014, and Sarno et al. 2016).
In step with these findings, the region’s cumulative and average net financial flows were compared pre-GFC, post-GFC, and during the normalization period (Figure 1.10). There are indications that changes in global monetary policy—as captured by expected movement in the US Federal Funds rate—affect financial inflows in the region. While developing Asia received average net financial inflows of $33 billion per quarter during the pre-GFC period, they fell to $27 billion per quarter during the GFC, suggesting only modest GFC impact on the region. However, net financial inflows to the region increased significantly during QE—peaking at $155 billion per quarter during the second QE period. As expected,
-1,000
-800
-600
-400
-200
0
200
400
600
Pre-GFC(Q1 2005-Q2 2008)
GFC(Q3 2008-Q4 2009)
QE(Q4 2009-Q3 2010)
QE(Q4 2010-Q2 2011)
QE(Q4 2012-Q4 2014)
Normalization(Q4 2015-Q4 2016)
Direct Investment Portfolio Investment Other InvestmentFinancial Account Financial Account (period average)
Figure 1.10: Net Financial Flows—Developing Asia ($ billion)
GFC = global financial crisis, QE = quantitative easing, Q = quarter.Notes: (i) There was a break in data comparability for the Philippines (2005), India
(2009), Brunei Darussalam (2010), and Malaysia (2010). For Malaysia, “other investment” was discounted in the assets and liabilities breakdown.
(ii) For consistency, net of “other investment” corresponds to resident inflows for Malaysia starting 2010.
(iii) In the Lao People’s Democratic Republic, net of direct, portfolio, and other investments correspond to “nonresident inflows” direct, portfolio, and other investments starting 2014.
(iv) Developing Asia includes ASEAN (Brunei Darussalam, Cambodia, Indonesia, the Lao People’s Democratic Republic, Malaysia, Myanmar, the Philippines, Singapore, Thailand, and Viet Nam), NIE4 (Hong Kong, China; the Republic of Korea; Singapore; and Taipei,China), India, and the People’s Republic of China. Excludes Cambodia starting Q1 2015; Brunei Darussalam, Myanmar, and Viet Nam for Q1 2016.
Source: ADB calculations using data from International Monetary Fund. Balance of Payments Statistics. http://www.imf.org/external/datamapper/datasets/BOP (accessed July 2017).
net financial flows reversed, averaging $128 billion in outflows per quarter during normalization. It is also notable that the primary source of financial outflows in the region was from other investment, which includes bank lending.
Coping MechanismsCountercyclical macroeconomic policies can help support domestic demand in times of economic crisis.
At the height of the GFC, many governments in the region used countercyclical policy measures—such as expansionary monetary policy and fiscal stimulus—to support domestic demand and counter weakening external demand from advanced economies. These fiscal and monetary interventions helped the region weather
Figure 1.9: External Vulnerability versus Currency Movement, 2016—Selected Developing Asian Economies
BAN = Bangladesh; CAM = Cambodia; IND = India; INO = Indonesia; KAZ = Kazakhstan; KOR = Republic of Korea; LAO = Lao People’s Democratic Republic; MAL = Malaysia; MYA = Myanmar; PAK = Pakistan; PHI = Philippines; SRI = Sri Lanka; TAP = Taipei,China; THA = Thailand; VIE = Viet Nam.Notes: External vulnerability ratio is derived by dividing the sum of current account deficit, short-term debt, and foreign holdings of stocks and bonds by gross international reserves (excluding gold). Currency movement is the percentage change in the $ value of local currency. Negative values indicate depreciation of local currency, and positive values indicate appreciation.Sources: ADB calculations using data from Bloomberg; International Monetary Fund. Coordinated Portfolio Investment Survey. http//cpis.imf.org; and World Bank. World Development Indicators. http://databank.worldbank.org/ (all accessed July 2017).
BAN
IND
INO
CAM
KAZ
KOR
LAO
MALMYA
PAK
PHI
SRI
TAP
THA
VIE
-6
-5
-4
-3
-2
-1
0
1
2
3
0 100 200 300 400 500 600
Curre
ncy
(% c
hang
e, 2
016)
External vulnerability
Asian Economic Integration Report 20178 Regional Outlook, Linkages, and Vulnerabilities 9
the GFC largely unscathed. Therefore, it is important to have adequate policy space in preparing for future crises.
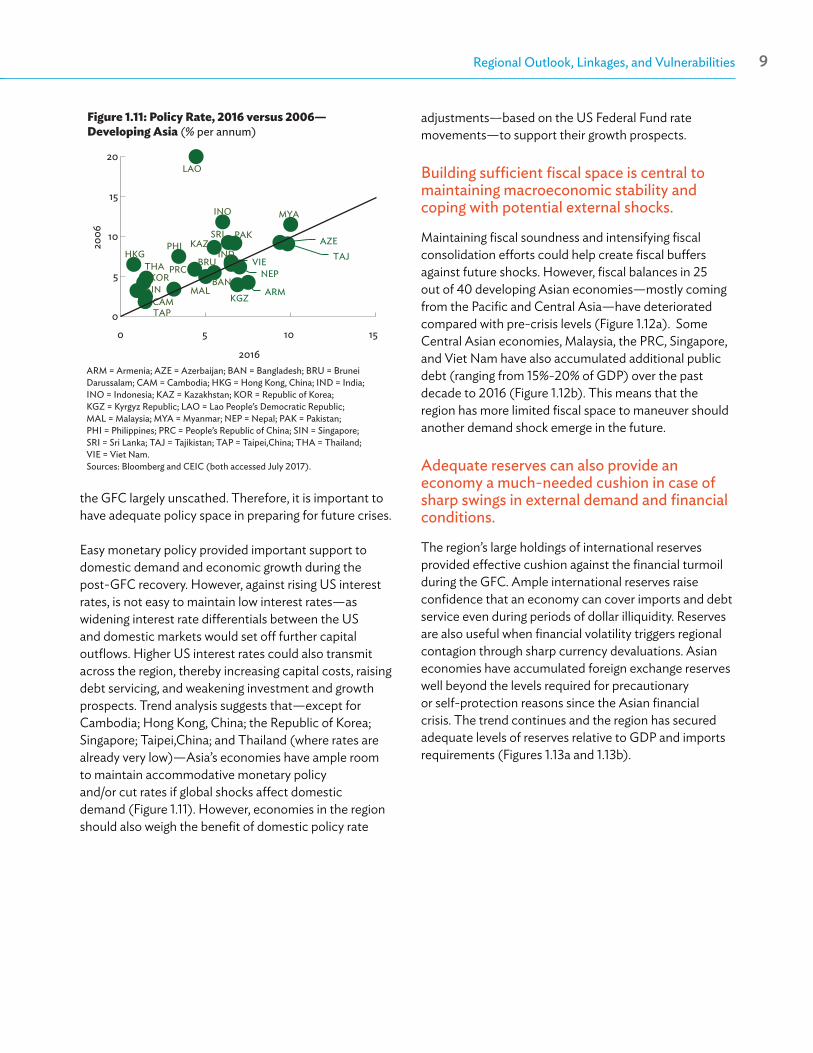
Easy monetary policy provided important support to domestic demand and economic growth during the post-GFC recovery. However, against rising US interest rates, is not easy to maintain low interest rates—as widening interest rate differentials between the US and domestic markets would set off further capital outflows. Higher US interest rates could also transmit across the region, thereby increasing capital costs, raising debt servicing, and weakening investment and growth prospects. Trend analysis suggests that—except for Cambodia; Hong Kong, China; the Republic of Korea; Singapore; Taipei,China; and Thailand (where rates are already very low)—Asia’s economies have ample room to maintain accommodative monetary policy and/or cut rates if global shocks affect domestic demand (Figure 1.11). However, economies in the region should also weigh the benefit of domestic policy rate
ARM
AZE
BAN
BRU
CAM
PRCHKG IND
INO
KAZ
KOR
KGZ
LAO
MAL
MYA
NEP
PAKPHI
SIN
SRI
TAP
TAJTHA VIE
0
5
10
15
20
0 5 10 15
2006
2016
Figure 1.11: Policy Rate, 2016 versus 2006—Developing Asia (% per annum)
ARM = Armenia; AZE = Azerbaijan; BAN = Bangladesh; BRU = Brunei Darussalam; CAM = Cambodia; HKG = Hong Kong, China; IND = India; INO = Indonesia; KAZ = Kazakhstan; KOR = Republic of Korea; KGZ = Kyrgyz Republic; LAO = Lao People’s Democratic Republic; MAL = Malaysia; MYA = Myanmar; NEP = Nepal; PAK = Pakistan; PHI = Philippines; PRC = People’s Republic of China; SIN = Singapore; SRI = Sri Lanka; TAJ = Tajikistan; TAP = Taipei,China; THA = Thailand; VIE = Viet Nam.Sources: Bloomberg and CEIC (both accessed July 2017).
adjustments—based on the US Federal Fund rate movements—to support their growth prospects.
Building sufficient fiscal space is central to maintaining macroeconomic stability and coping with potential external shocks.
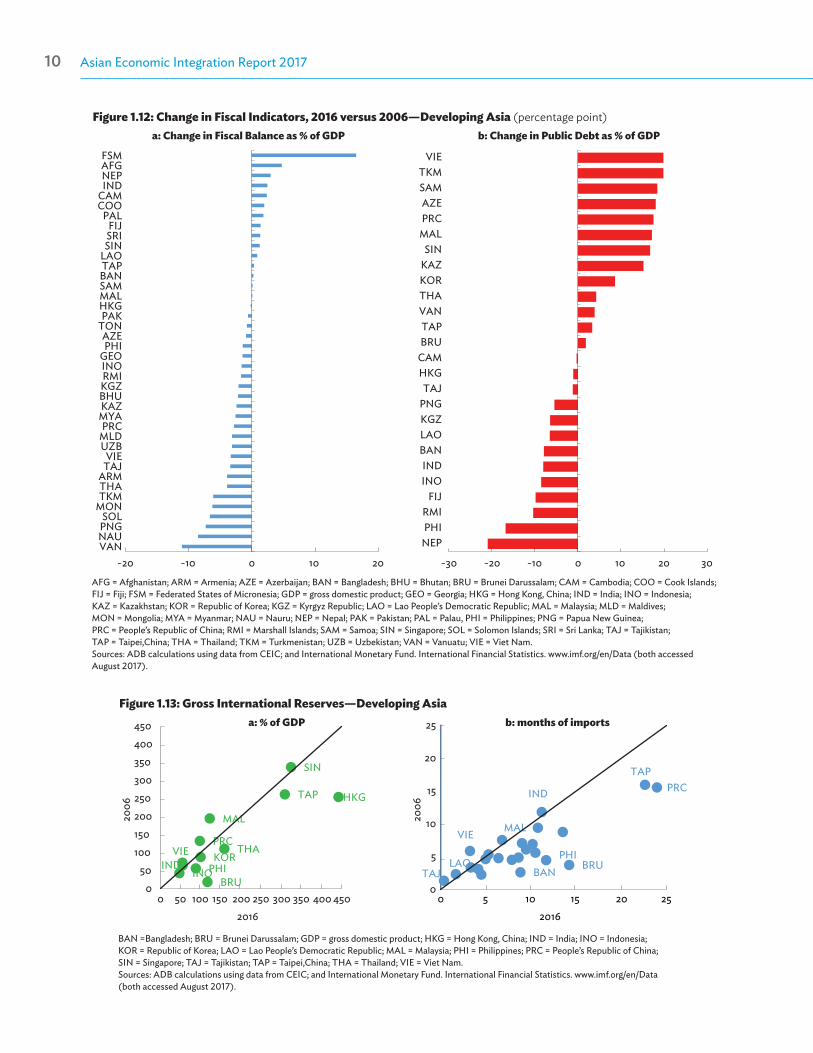
Maintaining fiscal soundness and intensifying fiscal consolidation efforts could help create fiscal buffers against future shocks. However, fiscal balances in 25 out of 40 developing Asian economies—mostly coming from the Pacific and Central Asia—have deteriorated compared with pre-crisis levels (Figure 1.12a). Some Central Asian economies, Malaysia, the PRC, Singapore, and Viet Nam have also accumulated additional public debt (ranging from 15%-20% of GDP) over the past decade to 2016 (Figure 1.12b). This means that the region has more limited fiscal space to maneuver should another demand shock emerge in the future.
Adequate reserves can also provide an economy a much-needed cushion in case of sharp swings in external demand and financial conditions.
The region’s large holdings of international reserves provided effective cushion against the financial turmoil during the GFC. Ample international reserves raise confidence that an economy can cover imports and debt service even during periods of dollar illiquidity. Reserves are also useful when financial volatility triggers regional contagion through sharp currency devaluations. Asian economies have accumulated foreign exchange reserves well beyond the levels required for precautionary or self-protection reasons since the Asian financial crisis. The trend continues and the region has secured adequate levels of reserves relative to GDP and imports requirements (Figures 1.13a and 1.13b).
Asian Economic Integration Report 201710 Regional Outlook, Linkages, and Vulnerabilities 11
BRU
PRC
HKG
INDINO
KOR
MAL
PHI
SIN
TAP
THAVIE
050
100150200250300350400450
0 50 100 150 200 250 300 350 400 450
2006
2016
a: % of GDP
BANBRU
PRCIND
LAO
MAL
PHI
TAP
TAJ
VIE
0
5
10
15
20
25
0 5 10 15 20 25
2006
2016
b: months of importsFigure 1.13: Gross International Reserves—Developing Asia
BAN =Bangladesh; BRU = Brunei Darussalam; GDP = gross domestic product; HKG = Hong Kong, China; IND = India; INO = Indonesia; KOR = Republic of Korea; LAO = Lao People’s Democratic Republic; MAL = Malaysia; PHI = Philippines; PRC = People’s Republic of China; SIN = Singapore; TAJ = Tajikistan; TAP = Taipei,China; THA = Thailand; VIE = Viet Nam. Sources: ADB calculations using data from CEIC; and International Monetary Fund. International Financial Statistics. www.imf.org/en/Data (both accessed August 2017).
Figure 1.12: Change in Fiscal Indicators, 2016 versus 2006—Developing Asia (percentage point)
AFG = Afghanistan; ARM = Armenia; AZE = Azerbaijan; BAN = Bangladesh; BHU = Bhutan; BRU = Brunei Darussalam; CAM = Cambodia; COO = Cook Islands; FIJ = Fiji; FSM = Federated States of Micronesia; GDP = gross domestic product; GEO = Georgia; HKG = Hong Kong, China; IND = India; INO = Indonesia; KAZ = Kazakhstan; KOR = Republic of Korea; KGZ = Kyrgyz Republic; LAO = Lao People’s Democratic Republic; MAL = Malaysia; MLD = Maldives; MON = Mongolia; MYA = Myanmar; NAU = Nauru; NEP = Nepal; PAK = Pakistan; PAL = Palau, PHI = Philippines; PNG = Papua New Guinea; PRC = People’s Republic of China; RMI = Marshall Islands; SAM = Samoa; SIN = Singapore; SOL = Solomon Islands; SRI = Sri Lanka; TAJ = Tajikistan; TAP = Taipei,China; THA = Thailand; TKM = Turkmenistan; UZB = Uzbekistan; VAN = Vanuatu; VIE = Viet Nam.Sources: ADB calculations using data from CEIC; and International Monetary Fund. International Financial Statistics. www.imf.org/en/Data (both accessed August 2017).
-20 -10 0 10 20VANNAUPNGSOL
MONTKMTHAARM
TAJVIE
UZBMLDPRC
MYAKAZBHUKGZRMIINOGEOPHIAZE
TONPAK
HKGMALSAMBANTAPLAOSINSRIFIJ
PALCOOCAM
INDNEPAFGFSM
-30 -20 -10 0 10 20 30
NEPPHIRMI
FIJINOIND
BANLAOKGZPNGTAJ
HKGCAMBRUTAP
VANTHAKORKAZSIN
MALPRCAZE
SAMTKM
VIE
a: Change in Fiscal Balance as % of GDP b: Change in Public Debt as % of GDP

Asian Economic Integration Report 201710 Regional Outlook, Linkages, and Vulnerabilities 11
Concluding RemarksWhile the economic outlook for developing Asia has improved and risks have become more balanced, policy makers must still address some important and lingering concerns.
The region remains vulnerable to global economic shocks as its business cycles have become increasingly synchronized with cycles in advanced economies. The regional economy has also become more sensitive to output shocks in the US, reflecting the significant role that final demand from this economy still plays in regional trade. High leverage and credit growth—particularly to private nonfinancial institutions—with a dependence on external funding, and potential capital flow reversals related to widening interest rate differentials are among the most pressing concerns.
Since the GFC, developing Asia has accumulated additional external borrowing equivalent to $3.4 trillion.1 The fiscal space—measured as the sum of combined fiscal surpluses and deficits in the region—has also shrunk by $0.5 trillion. And while many regional economies still have ample room to follow accommodative monetary policies, ongoing US monetary policy normalization will make it more challenging for them to keep interest rates low without further undermining foreign capital inflows.
Asia’s policy makers should continue to strengthen macroeconomic fundamentals and prepare for a prolonged weak recovery.
Against the backdrop of monetary policy normalization in advanced economies, maintaining sufficient international reserves and policy space should help cushion against potential shocks. Monetary policy must remain flexible to allow timely responses, while keeping inflationary expectations firmly anchored.
Macroeconomic policy support may need to be maintained and only gradually unwound in the face of the prolonged weak post-crisis recovery. In particular,
1 Based on available data for developing Asian economies: Bangladesh; Fiji; Hong Kong, China; India; Indonesia; Kazakhstan; Malaysia; Pakistan; Papua New Guinea; the Philippines; the PRC; the Republic of Korea; Singapore; Sri Lanka; Taipei,China; and Thailand.
and wherever possible, fiscal buffers could be built up and stand ready for use to mitigate the impact of external shocks. While extreme financial volatility requires careful monitoring of capital flows, excessive exchange rate intervention could lead to drawdowns in foreign reserves, which would further weaken investor confidence.
The region must also monitor any buildup of economic imbalances, while pursuing necessary long-term reforms.
Short-term responses can help stabilize financial volatility and lift market confidence. But the region’s policy makers need to deepen reforms to strengthen economic and financial resilience and upgrade regulatory and supervisory frameworks to ensure vulnerabilities are addressed.
Broader and deeper structural reforms will be needed to raise productivity, competitiveness, and economic growth. Asian economies can also explore ways to spur new growth drivers by improving policies that support trade, such as the promotion of foreign direct investment and innovation. An ADB study has noted the importance of policies that offer competitive labor costs, an efficient and reliable business environment, and strong linkages of global value chain with the domestic market through foreign direct investment. Linkages with domestic markets in particular can be better served by helping small and medium enterprises gain greater access to finance, and through supportive institutional mechanisms (ADB 2016).
ReferencesADB. 2016. Asian Economic Integration Report 2016: What Drives
Foreign Direct Investment in Asia and the Pacific? Manila.
_____. 2017. Asian Development Outlook 2017 Update: Sustaining Development Through Public-Private Partnership. Manila.
Bank for International Settlements. https://www.bis.org/ (accessed September 2017).
D. Cho and C. Rhee. 2013. Effects of Quantitative Easing on Asia: Capital Flows and Financial Markets. ADB Economics Working Papers. No. 350. Manila: Asian Development Bank.
Asian Economic Integration Report 201712 Regional Outlook, Linkages, and Vulnerabilities PB
International Monetary Fund. Balance of Payments Statistics. http://www.imf.org/external/datamapper/datasets/BOP (accessed July 2017).
R. Koepke. 2016. Fed Policy Expectations and Portfolio Flows to Emerging Markets. IIF Working Paper. Washington, DC: Institute of International Finance.
P. Morgan. 2011. Impact of US Quantitative Easing Policy on Emerging Asia. ADBI Working Paper. No. 321. Tokyo: Asian Development Bank Institute.
D. Park, A. Ramayandi, and K. Shin. 2014. Capital Flows During Quantitative Easing and Aftermath: Experiences of Asian Countries. ADB Economics Working Papers. No. 409. Manila: Asian Development Bank.
C.Y. Park. 2017. Decoupling Asia Revisited. ADB Economics Working Paper Series. No. 506. Manila: Asian Development Bank.
L. Sarno, I. Tsiakas, and B. Ulloa. 2016. What Drives International Portfolio Flows? Journal of International Money and Finance. 60(C). pp. 53-72.
Trade and the Global Value Chain
02
Asian Economic Integration Report 201714 Trade and the Global Value Chain 15
Trade and the Global Value Chain
Recent Trends in Asia’s TradeIn 2016, Asia’s trade volume grew faster than global trade, but remained below growth in gross domestic product.
By volume, Asia was the only region in the world that saw trade grow faster in 2016 than 2015. Asia’s trade volume grew 1.7% in 2016, up from
1.4% in 2015—as growth globally fell to 1.3% from 2.6% in 2015. Trade volume contracted in the Middle East (–6.4%), Latin America (–4.4%), and Africa (–3.7%), while it grew more slowly than 2015 in the European Union (EU) and North America. Asia’s exports rose 1.5% in 2016 (1.0% in 2015), while imports increased slightly to 2.0% (from 1.9%). Since 2012, growth in merchandise trade volume has been below growth in gross domestic product (GDP) (Figures 2.1a, 2.1b).
PRC = People’s Republic of China.Source: ADB calculations using data from World Trade Organization Statistics. http://stat.wto.org (accessed May 2017).
Figure 2.2: Sources of Asia’s Trade Volume Growth
-15
-5
5
15
25
-50
0
50
100
150
sour
ces o
f gro
wth
, %
% g
row
th
2002 2004 2006 2008 2010 2012 2014 2016
Imports: Asia ex-PRC (left) Exports: Asia ex-PRC (left)Imports: PRC (left) Exports: PRC (left)Trade growth (right)
Asia’s trade volume growth in 2016 was largely driven by exports from Japan; Taipei,China; and Hong Kong, China; and a rebound in imports in the People’s Republic of China.
Excluding the People’s Republic of China (PRC), Asia’s export volume growth rose to 2.3% in 2016 from 1.9% in 2015—covering almost half of Asia’s overall trade growth by volume (Figure 2.2). Japan; Taipei,China; and
Figure 2.1: Merchandise Trade Volume and Real GDP Growth—Asia and World (%, year-on-year)
GDP = gross domestic product.Note: Real GDP growth is weighted using nominal GDP in purchasing power parity. Sources: ADB calculations using data from International Monetary Fund. World Economic Outlook April 2017 Database. https://www.imf.org/external/pubs/ft/weo/2017/01/weodata/index.aspx; World Trade Organization Statistics. http://stat.wto.org (both accessed May 2017).
a: Asia
b: World
-15
-10
-5
0
5
10
15
20
25
2002 2005 2008 2011 2014 2016
-15
-10
-5
0
5
10
15
20
25
2002 2005 2008 2011 2014 2016
Merchandise trade volume Real GDP
a: Asia
b: World
-15
-10
-5
0
5
10
15
20
25
2002 2005 2008 2011 2014 2016
-15
-10
-5
0
5
10
15
20
25
2002 2005 2008 2011 2014 2016
Merchandise trade volume Real GDP
a: Asia b: World
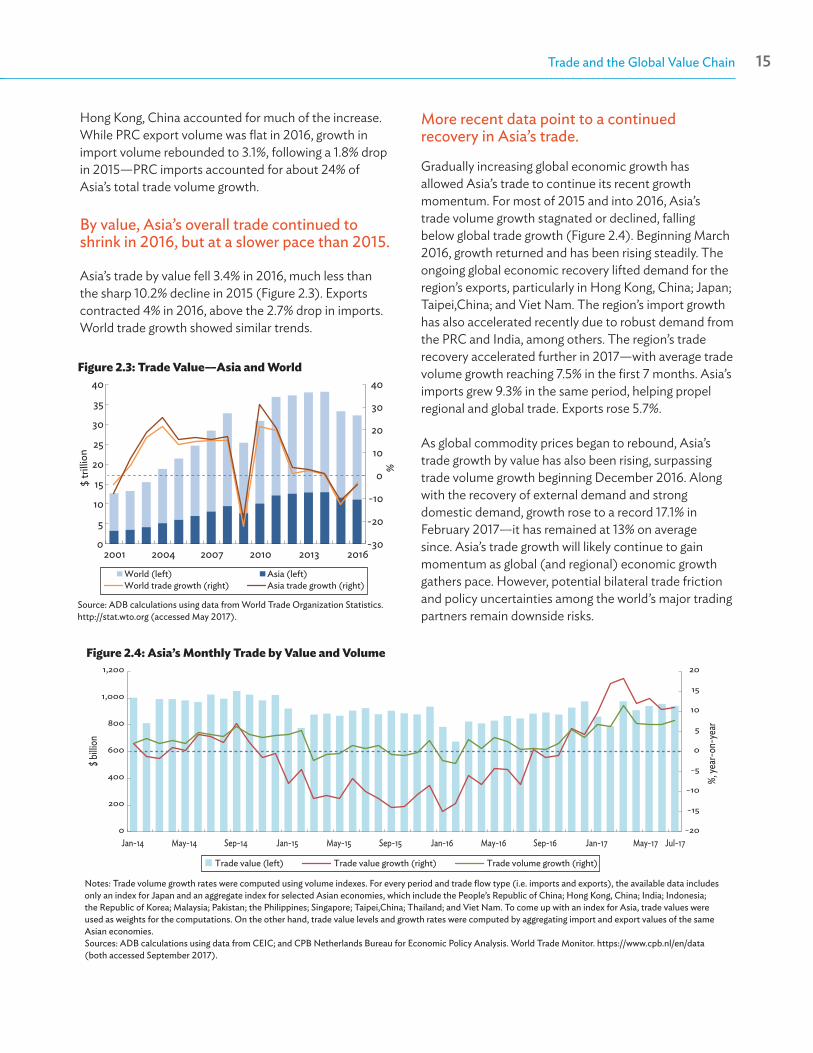
Asian Economic Integration Report 201714 Trade and the Global Value Chain 15
More recent data point to a continued recovery in Asia’s trade.
Gradually increasing global economic growth has allowed Asia’s trade to continue its recent growth momentum. For most of 2015 and into 2016, Asia’s trade volume growth stagnated or declined, falling below global trade growth (Figure 2.4). Beginning March 2016, growth returned and has been rising steadily. The ongoing global economic recovery lifted demand for the region’s exports, particularly in Hong Kong, China; Japan; Taipei,China; and Viet Nam. The region’s import growth has also accelerated recently due to robust demand from the PRC and India, among others. The region’s trade recovery accelerated further in 2017—with average trade volume growth reaching 7.5% in the first 7 months. Asia’s imports grew 9.3% in the same period, helping propel regional and global trade. Exports rose 5.7%.
As global commodity prices began to rebound, Asia’s trade growth by value has also been rising, surpassing trade volume growth beginning December 2016. Along with the recovery of external demand and strong domestic demand, growth rose to a record 17.1% in February 2017—it has remained at 13% on average since. Asia’s trade growth will likely continue to gain momentum as global (and regional) economic growth gathers pace. However, potential bilateral trade friction and policy uncertainties among the world’s major trading partners remain downside risks.
Figure 2.4: Asia’s Monthly Trade by Value and Volume
Notes: Trade volume growth rates were computed using volume indexes. For every period and trade flow type (i.e. imports and exports), the available data includes only an index for Japan and an aggregate index for selected Asian economies, which include the People’s Republic of China; Hong Kong, China; India; Indonesia; the Republic of Korea; Malaysia; Pakistan; the Philippines; Singapore; Taipei,China; Thailand; and Viet Nam. To come up with an index for Asia, trade values were used as weights for the computations. On the other hand, trade value levels and growth rates were computed by aggregating import and export values of the same Asian economies.Sources: ADB calculations using data from CEIC; and CPB Netherlands Bureau for Economic Policy Analysis. World Trade Monitor. https://www.cpb.nl/en/data (both accessed September 2017).
Trade value (left) Trade value growth (right) Trade volume growth (right)
-20
-15
-10
-5
0
5
10
15
20
0
200
400
600
800
1,000
1,200
Jan-14 May-14 Sep-14 Jan-15 May-15 Sep-15 Jan-16 May-16 Sep-16 Jan-17 May-17 Jul-17
%, ye
ar-o
n-ye
ar
$ billi
on
Figure 2.3: Trade Value—Asia and World
Source: ADB calculations using data from World Trade Organization Statistics. http://stat.wto.org (accessed May 2017).
World (left) Asia (left)World trade growth (right) Asia trade growth (right)
-30
-20
-10
0
10
20
30
40
0
5
10
15
20
25
30
35
40
2001 2004 2007 2010 2013 2016
$ tr
illio
n
%
Hong Kong, China accounted for much of the increase. While PRC export volume was flat in 2016, growth in import volume rebounded to 3.1%, following a 1.8% drop in 2015—PRC imports accounted for about 24% of Asia’s total trade volume growth.
By value, Asia’s overall trade continued to shrink in 2016, but at a slower pace than 2015.
Asia’s trade by value fell 3.4% in 2016, much less than the sharp 10.2% decline in 2015 (Figure 2.3). Exports contracted 4% in 2016, above the 2.7% drop in imports. World trade growth showed similar trends.
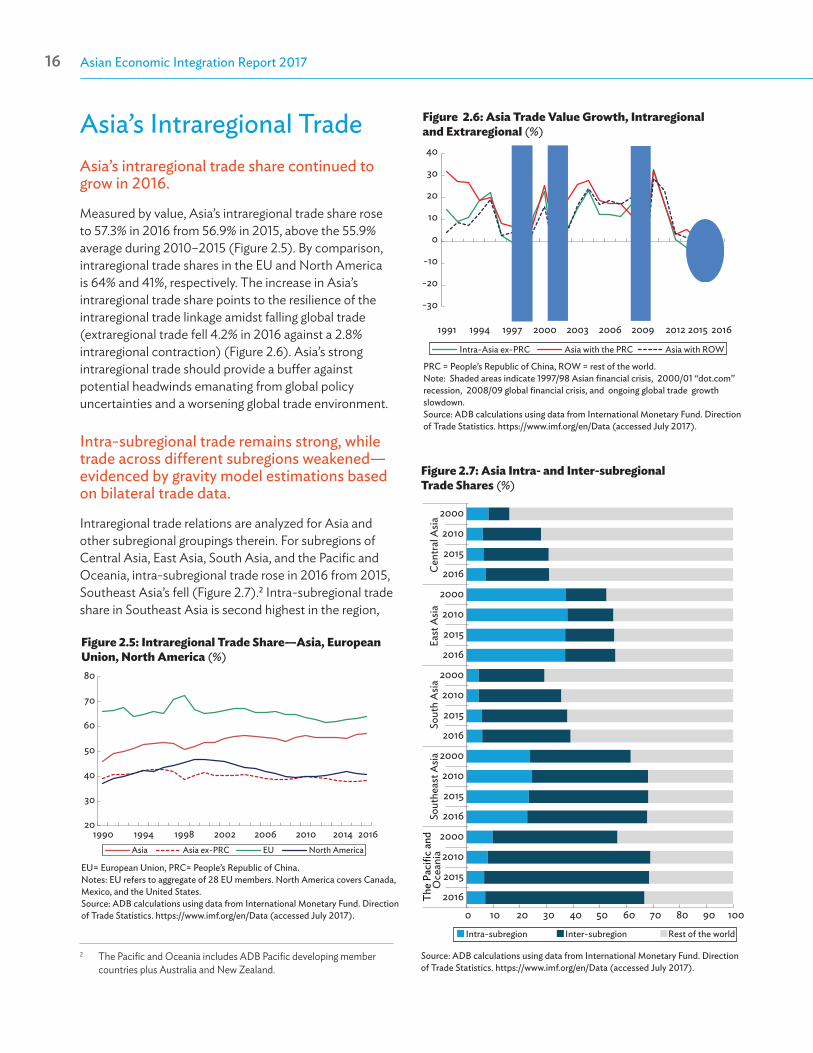
Asian Economic Integration Report 201716 Trade and the Global Value Chain 17
Asia’s Intraregional TradeAsia’s intraregional trade share continued to grow in 2016.
Measured by value, Asia’s intraregional trade share rose to 57.3% in 2016 from 56.9% in 2015, above the 55.9% average during 2010–2015 (Figure 2.5). By comparison, intraregional trade shares in the EU and North America is 64% and 41%, respectively. The increase in Asia’s intraregional trade share points to the resilience of the intraregional trade linkage amidst falling global trade (extraregional trade fell 4.2% in 2016 against a 2.8% intraregional contraction) (Figure 2.6). Asia’s strong intraregional trade should provide a buffer against potential headwinds emanating from global policy uncertainties and a worsening global trade environment.
Intra-subregional trade remains strong, while trade across different subregions weakened—evidenced by gravity model estimations based on bilateral trade data.
Intraregional trade relations are analyzed for Asia and other subregional groupings therein. For subregions of Central Asia, East Asia, South Asia, and the Pacific and Oceania, intra-subregional trade rose in 2016 from 2015, Southeast Asia’s fell (Figure 2.7).2 Intra-subregional trade share in Southeast Asia is second highest in the region,
2 The Pacific and Oceania includes ADB Pacific developing member countries plus Australia and New Zealand.
Intra-Asia ex-PRC Asia with the PRC Asia with ROW
-30
-20
-10
0
10
20
30
40
1991 1994 1997 2000 2003 2006 2009 2012 2015 2016
Figure 2.6: Asia Trade Value Growth, Intraregional and Extraregional (%)
PRC = People’s Republic of China, ROW = rest of the world. Note: Shaded areas indicate 1997/98 Asian financial crisis, 2000/01 “dot.com” recession, 2008/09 global financial crisis, and ongoing global trade growth slowdown.Source: ADB calculations using data from International Monetary Fund. Direction of Trade Statistics. https://www.imf.org/en/Data (accessed July 2017).
Figure 2.5: Intraregional Trade Share—Asia, European Union, North America (%)
EU= European Union, PRC= People’s Republic of China.Notes: EU refers to aggregate of 28 EU members. North America covers Canada, Mexico, and the United States. Source: ADB calculations using data from International Monetary Fund. Direction of Trade Statistics. https://www.imf.org/en/Data (accessed July 2017).
20
30
40
50
60
70
80
1990 1994 1998 2002 2006 2010 2014 2016Asia Asia ex-PRC EU North America
Figure 2.7: Asia Intra- and Inter-subregional Trade Shares (%)
Source: ADB calculations using data from International Monetary Fund. Direction of Trade Statistics. https://www.imf.org/en/Data (accessed July 2017).
0 10 20 30 40 50 60 70 80 90 100
2000
2010
2015
2016
2000
2010
2015
2016
2000
2010
2015
2016
2000
2010
2015
2016
2000
2010
2015
2016
Cent
ral A
siaEa
st A
siaSo
uth
Asia
Sout
heas
t Asia
The
Paci
fic a
ndO
cean
ia
Intra-subregion Inter-subregion Rest of the world
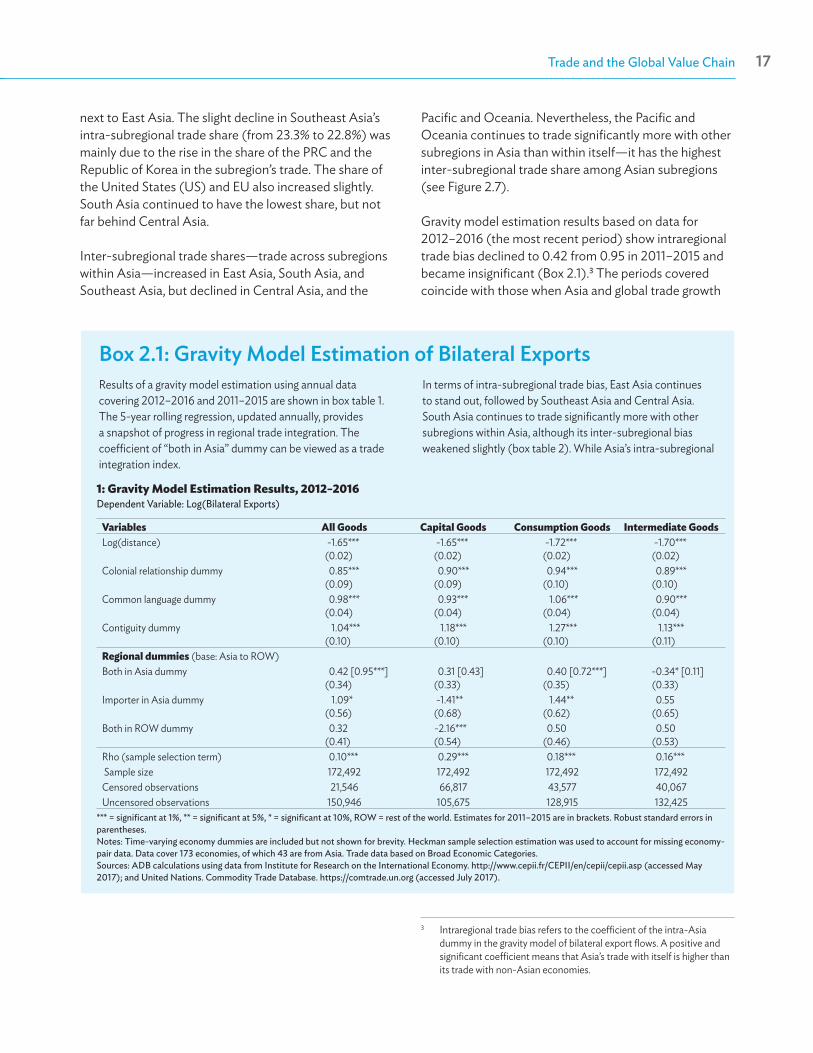
Asian Economic Integration Report 201716 Trade and the Global Value Chain 17
next to East Asia. The slight decline in Southeast Asia’s intra-subregional trade share (from 23.3% to 22.8%) was mainly due to the rise in the share of the PRC and the Republic of Korea in the subregion’s trade. The share of the United States (US) and EU also increased slightly. South Asia continued to have the lowest share, but not far behind Central Asia.
Inter-subregional trade shares—trade across subregions within Asia—increased in East Asia, South Asia, and Southeast Asia, but declined in Central Asia, and the
Pacific and Oceania. Nevertheless, the Pacific and Oceania continues to trade significantly more with other subregions in Asia than within itself—it has the highest inter-subregional trade share among Asian subregions (see Figure 2.7).
Gravity model estimation results based on data for 2012–2016 (the most recent period) show intraregional trade bias declined to 0.42 from 0.95 in 2011–2015 and became insignificant (Box 2.1).3 The periods covered coincide with those when Asia and global trade growth
3 Intraregional trade bias refers to the coefficient of the intra-Asia dummy in the gravity model of bilateral export flows. A positive and significant coefficient means that Asia’s trade with itself is higher than its trade with non-Asian economies.
Results of a gravity model estimation using annual data covering 2012–2016 and 2011–2015 are shown in box table 1. The 5-year rolling regression, updated annually, provides a snapshot of progress in regional trade integration. The coefficient of “both in Asia” dummy can be viewed as a trade integration index.
Box 2.1: Gravity Model Estimation of Bilateral Exports
1: Gravity Model Estimation Results, 2012–2016Dependent Variable: Log(Bilateral Exports)
Variables All Goods Capital Goods Consumption Goods Intermediate GoodsLog(distance) -1.65***
(0.02)-1.65***
(0.02)-1.72***
(0.02)-1.70***
(0.02)Colonial relationship dummy 0.85***
(0.09)0.90***
(0.09)0.94***
(0.10)0.89***
(0.10)Common language dummy 0.98***
(0.04)0.93***
(0.04)1.06***
(0.04)0.90***
(0.04)Contiguity dummy 1.04***
(0.10)1.18***
(0.10)1.27***
(0.10)1.13***
(0.11)Regional dummies (base: Asia to ROW)Both in Asia dummy 0.42 [0.95***]
(0.34)0.31 [0.43]
(0.33)0.40 [0.72***]
(0.35)-0.34* [0.11](0.33)
Importer in Asia dummy 1.09*(0.56)
-1.41**(0.68)
1.44**(0.62)
0.55(0.65)
Both in ROW dummy 0.32(0.41)
-2.16***(0.54)
0.50(0.46)
0.50(0.53)
Rho (sample selection term) 0.10*** 0.29*** 0.18*** 0.16*** Sample size 172,492 172,492 172,492 172,492Censored observations 21,546 66,817 43,577 40,067Uncensored observations 150,946 105,675 128,915 132,425
*** = significant at 1%, ** = significant at 5%, * = significant at 10%, ROW = rest of the world. Estimates for 2011–2015 are in brackets. Robust standard errors in parentheses. Notes: Time-varying economy dummies are included but not shown for brevity. Heckman sample selection estimation was used to account for missing economy-pair data. Data cover 173 economies, of which 43 are from Asia. Trade data based on Broad Economic Categories.Sources: ADB calculations using data from Institute for Research on the International Economy. http://www.cepii.fr/CEPII/en/cepii/cepii.asp (accessed May 2017); and United Nations. Commodity Trade Database. https://comtrade.un.org (accessed July 2017).
In terms of intra-subregional trade bias, East Asia continues to stand out, followed by Southeast Asia and Central Asia. South Asia continues to trade significantly more with other subregions within Asia, although its inter-subregional bias weakened slightly (box table 2). While Asia’s intra-subregional
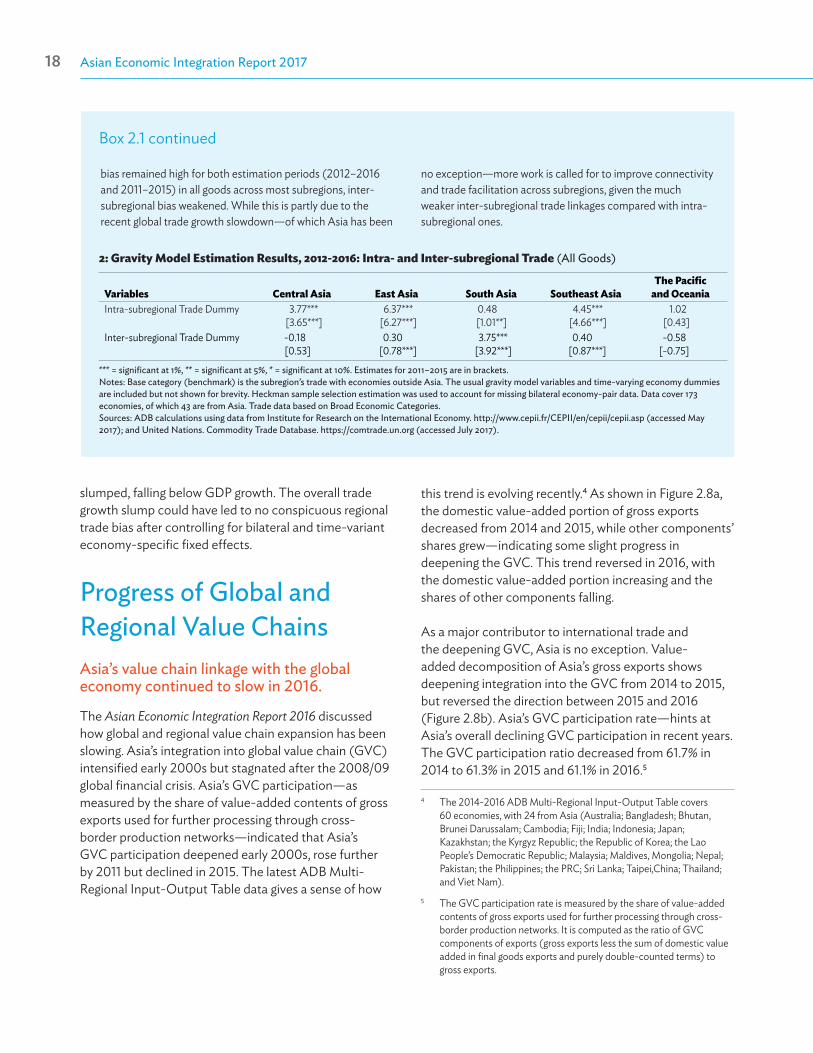
Asian Economic Integration Report 201718 Trade and the Global Value Chain 19
Box 2.1 continued
bias remained high for both estimation periods (2012–2016 and 2011–2015) in all goods across most subregions, inter-subregional bias weakened. While this is partly due to the recent global trade growth slowdown—of which Asia has been
2: Gravity Model Estimation Results, 2012-2016: Intra- and Inter-subregional Trade (All Goods)
Variables Central Asia East Asia South Asia Southeast AsiaThe Pacific
and OceaniaIntra-subregional Trade Dummy 3.77***
[3.65***]6.37***
[6.27***]0.48[1.01**]
4.45***[4.66***]
1.02[0.43]
Inter-subregional Trade Dummy -0.18[0.53]
0.30[0.78***]
3.75***[3.92***]
0.40[0.87***]
-0.58[-0.75]
*** = significant at 1%, ** = significant at 5%, * = significant at 10%. Estimates for 2011–2015 are in brackets.Notes: Base category (benchmark) is the subregion’s trade with economies outside Asia. The usual gravity model variables and time-varying economy dummies are included but not shown for brevity. Heckman sample selection estimation was used to account for missing bilateral economy-pair data. Data cover 173 economies, of which 43 are from Asia. Trade data based on Broad Economic Categories.Sources: ADB calculations using data from Institute for Research on the International Economy. http://www.cepii.fr/CEPII/en/cepii/cepii.asp (accessed May 2017); and United Nations. Commodity Trade Database. https://comtrade.un.org (accessed July 2017).
no exception—more work is called for to improve connectivity and trade facilitation across subregions, given the much weaker inter-subregional trade linkages compared with intra-subregional ones.
slumped, falling below GDP growth. The overall trade growth slump could have led to no conspicuous regional trade bias after controlling for bilateral and time-variant economy-specific fixed effects.
Progress of Global and Regional Value ChainsAsia’s value chain linkage with the global economy continued to slow in 2016.
The Asian Economic Integration Report 2016 discussed how global and regional value chain expansion has been slowing. Asia’s integration into global value chain (GVC) intensified early 2000s but stagnated after the 2008/09 global financial crisis. Asia’s GVC participation—as measured by the share of value-added contents of gross exports used for further processing through cross-border production networks—indicated that Asia’s GVC participation deepened early 2000s, rose further by 2011 but declined in 2015. The latest ADB Multi-Regional Input-Output Table data gives a sense of how
this trend is evolving recently.4 As shown in Figure 2.8a, the domestic value-added portion of gross exports decreased from 2014 and 2015, while other components’ shares grew—indicating some slight progress in deepening the GVC. This trend reversed in 2016, with the domestic value-added portion increasing and the shares of other components falling.
As a major contributor to international trade and the deepening GVC, Asia is no exception. Value-added decomposition of Asia’s gross exports shows deepening integration into the GVC from 2014 to 2015, but reversed the direction between 2015 and 2016 (Figure 2.8b). Asia’s GVC participation rate—hints at Asia’s overall declining GVC participation in recent years. The GVC participation ratio decreased from 61.7% in 2014 to 61.3% in 2015 and 61.1% in 2016.5
4 The 2014-2016 ADB Multi-Regional Input-Output Table covers 60 economies, with 24 from Asia (Australia; Bangladesh; Bhutan, Brunei Darussalam; Cambodia; Fiji; India; Indonesia; Japan; Kazakhstan; the Kyrgyz Republic; the Republic of Korea; the Lao People’s Democratic Republic; Malaysia; Maldives, Mongolia; Nepal; Pakistan; the Philippines; the PRC; Sri Lanka; Taipei,China; Thailand; and Viet Nam).
5 The GVC participation rate is measured by the share of value-added contents of gross exports used for further processing through cross-border production networks. It is computed as the ratio of GVC components of exports (gross exports less the sum of domestic value added in final goods exports and purely double-counted terms) to gross exports.

Asian Economic Integration Report 201718 Trade and the Global Value Chain 19
DVA = domestic value added, FVA = foreign value added, GVC = global value chain, PDC = purely double-counted terms, RDV = returned value added. Sources: ADB calculations using 2014–2016 ADB Multi-Regional Input-Output Tables, and methodology by Wang, Wei, and Zhu (2014).
PDC RDV FVA DVA GVC partcipation rate
66.5 67.1 67.0
60
70
80
90
100
2014 2015 2016
a: World
61.7 61.3 61.1
60
70
80
90
100
2014 2015 2016
b: Asia
Figure 2.8: Components of Gross Exports (%)
Updates on Regional Trade Policy While the number of Asia’s free trade agreements appears to be stagnating, Asia’s FTAs with non-Asian partners are expected to increase. Efforts to deepen and upgrade existing FTAs are also actively under way.
Recently, the number of free trade agreements (FTAs) worldwide taking effect continued to decline (Figure 2.9). In 2016, 12 new FTAs entered into force. This year, four new FTAs entered into force (as of September). Three of last year’s FTAs involved Asian economies: the Japan–Mongolia Economic Partnership
Asia
02468
101214161820
1958 1970 1982 1994 2006 2016World
Figure 2.9: Number of Newly Effective FTAs—Asia and World
FTA = free trade agreement.Source: World Trade Organization. Regional Trade Agreement Information System. http://rtias.wto.org (accessed September 2017).
Agreement (EPA), Korea–Colombia FTA, and the Eurasian Economic Union–Viet Nam FTA.
The number of signed FTAs has been declining since 2015 (Figure 2.10). In 2016, six were signed—down from 16 in 2015. Through July 2017, two FTAs were signed—the PRC–Georgia FTA on 13 May 2017 and the Pacific
FTA = free trade agreement.Notes: Includes bilateral and plurilateral FTAs with at least one of ADB’s 48 regional members as signatory. 2017 covers FTAs that came into effect from January to July. “Signed“ includes FTAs that are signed but not yet in effect, and those signed and in effect. “Proposed” includes FTAs that are: (i) proposed (the parties consider an FTA, governments or ministries issue a joint statement on the FTA’s desirability, or establish a joint study group and joint task force to conduct feasibility studies); (ii) framework agreements signed and under negotiation (the parties, through ministries, negotiate the contents of a framework agreement that serves as a framework for future negotiations); and (iii) under negotiation (the parties, through ministries, declare the official launch of negotiations, or start the first round of negotiations).Source: ADB. Asia Regional Integration Center FTA Database. https://aric.adb.org/fta (accessed August 2017).:
Figure 2.10: Number of FTAs Proposed and Signed by Year—Asia
Proposed Signed Proposed, 2-year moving average
0
5
10
15
20
25
30
35
40
2000 2002 2004 2006 2008 2010 2012 2014 2016 2017
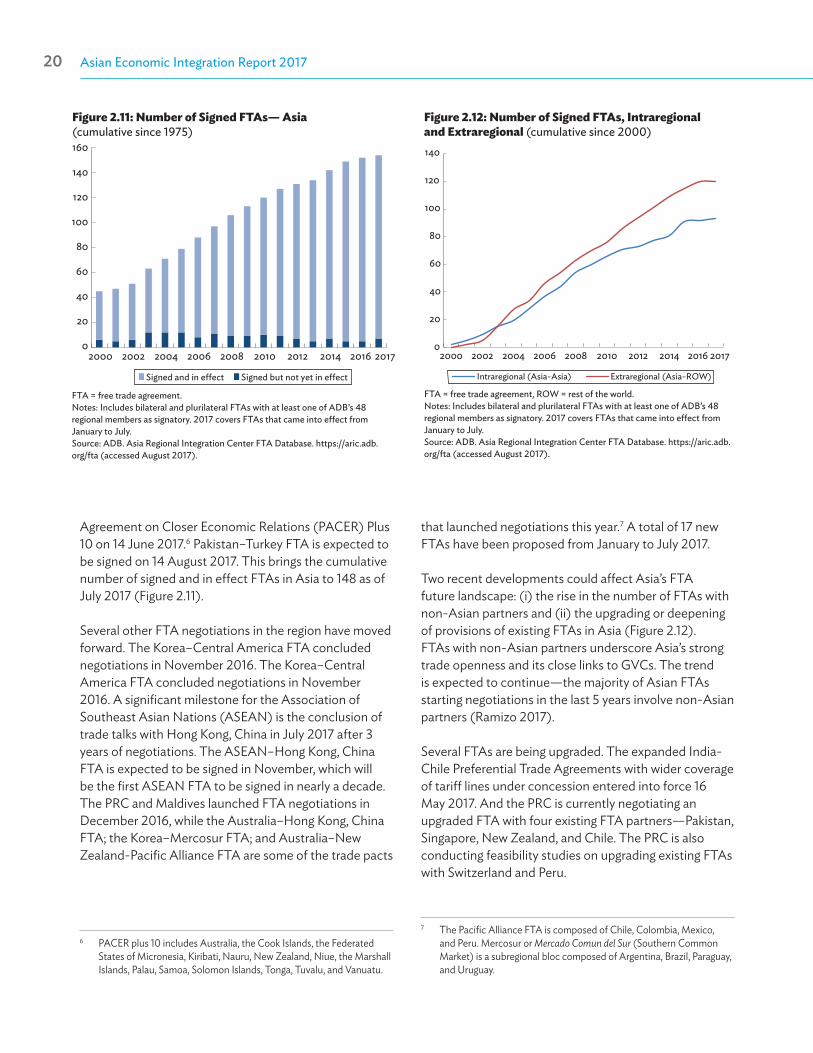
Asian Economic Integration Report 201720 Trade and the Global Value Chain 21
Agreement on Closer Economic Relations (PACER) Plus 10 on 14 June 2017.6 Pakistan–Turkey FTA is expected to be signed on 14 August 2017. This brings the cumulative number of signed and in effect FTAs in Asia to 148 as of July 2017 (Figure 2.11).
Several other FTA negotiations in the region have moved forward. The Korea–Central America FTA concluded negotiations in November 2016. The Korea–Central America FTA concluded negotiations in November 2016. A significant milestone for the Association of Southeast Asian Nations (ASEAN) is the conclusion of trade talks with Hong Kong, China in July 2017 after 3 years of negotiations. The ASEAN–Hong Kong, China FTA is expected to be signed in November, which will be the first ASEAN FTA to be signed in nearly a decade. The PRC and Maldives launched FTA negotiations in December 2016, while the Australia–Hong Kong, China FTA; the Korea–Mercosur FTA; and Australia–New Zealand-Pacific Alliance FTA are some of the trade pacts
6 PACER plus 10 includes Australia, the Cook Islands, the Federated States of Micronesia, Kiribati, Nauru, New Zealand, Niue, the Marshall Islands, Palau, Samoa, Solomon Islands, Tonga, Tuvalu, and Vanuatu.
Figure 2.11: Number of Signed FTAs— Asia (cumulative since 1975)
FTA = free trade agreement. Notes: Includes bilateral and plurilateral FTAs with at least one of ADB’s 48 regional members as signatory. 2017 covers FTAs that came into effect from January to July.Source: ADB. Asia Regional Integration Center FTA Database. https://aric.adb.org/fta (accessed August 2017).
Signed and in e�ect Signed but not yet in e�ect
0
20
40
60
80
100
120
140
160
2000 2002 2004 2006 2008 2010 2012 2014 2016 20170
20
40
60
80
100
120
140
2000 2002 2004 2006 2008 2010 2012 2014 2016 2017
Intraregional (Asia-Asia) Extraregional (Asia-ROW)
Figure 2.12: Number of Signed FTAs, Intraregional and Extraregional (cumulative since 2000)
FTA = free trade agreement, ROW = rest of the world.Notes: Includes bilateral and plurilateral FTAs with at least one of ADB’s 48 regional members as signatory. 2017 covers FTAs that came into effect from January to July.Source: ADB. Asia Regional Integration Center FTA Database. https://aric.adb.org/fta (accessed August 2017).
that launched negotiations this year.7 A total of 17 new FTAs have been proposed from January to July 2017.
Two recent developments could affect Asia’s FTA future landscape: (i) the rise in the number of FTAs with non-Asian partners and (ii) the upgrading or deepening of provisions of existing FTAs in Asia (Figure 2.12). FTAs with non-Asian partners underscore Asia’s strong trade openness and its close links to GVCs. The trend is expected to continue—the majority of Asian FTAs starting negotiations in the last 5 years involve non-Asian partners (Ramizo 2017).
Several FTAs are being upgraded. The expanded India-Chile Preferential Trade Agreements with wider coverage of tariff lines under concession entered into force 16 May 2017. And the PRC is currently negotiating an upgraded FTA with four existing FTA partners—Pakistan, Singapore, New Zealand, and Chile. The PRC is also conducting feasibility studies on upgrading existing FTAs with Switzerland and Peru.
7 The Pacific Alliance FTA is composed of Chile, Colombia, Mexico, and Peru. Mercosur or Mercado Comun del Sur (Southern Common Market) is a subregional bloc composed of Argentina, Brazil, Paraguay, and Uruguay.

Asian Economic Integration Report 201720 Trade and the Global Value Chain 21
output for ASEAN’s 50th anniversary this year. The ministers lauded the preparation of “RCEP Key Elements for Significant Outcomes by End of 2017” as agreed by the RCEP Trade Negotiating Committee. The document, which aims to move trade negotiations one step closer to conclusion, specifically identifies a set of “clear key elements” or negotiating areas that can be realistically achieved and lead to RCEP’s substantial conclusion by year-end.10
Japan-European Union Economic Partnership Agreement
Japan-EU EPA negotiations are being finalized.
After 18 rounds of negotiations (which began in 2013), Japan and the EU reached a political agreement in principle 6 July 2017 on an EPA.11 Japan and the EU together account for a third of global GDP. The EPA sends a strong signal to the rest of the world that the two remain committed to trade openness. The deal is known to substantially liberalize trade in goods. The EPA also covers key provisions on nontariff measures (like technical barriers to trade and sanitary and phytosanitary measures), trade remedies, trade in services, customs and trade facilitation, state-owned enterprises, government procurement, investment, data protection, intellectual property rights, competition, and small and medium enterprises. Although the agreement in principle includes key EPA provisions, some areas—such as investment protection, regulatory cooperation, and general and institutional chapters—will require further work. Negotiators say they plan to conclude the final text of the agreement by the end of 2017. Both sides will then proceed to legal verification and translation, with the final text submitted to their respective legislatures for approval.
10 See Xinhua (2017) for details. 11 While the EPA agreement in principle does not conclude the
negotiation process, it means both parties have agreed on generally everything of significance. As the final text of the EPA has not been released, the discussion of provisions should not be considered final (European Commission 2017).
Trans-Pacific Partnership
The future of Trans-Pacific Partnership remains uncertain after the US’ withdrawal.
While the US withdrew from the Trans-Pacific Partnership (TPP), Japan and New Zealand have ratified the Agreement.8 Ministers of TPP member economies have released a statement 21 May 2017 expressing their agreement to “launch a process to assess options to bring the comprehensive, high quality agreement into force expeditiously, including how to facilitate membership for the original signatories.”9 It remains uncertain if the option of a TPP without the US will push through given the lack of unity among the remaining countries involved.
The US says it will now pursue trade growth through bilateral rather than multilateral arrangements (The White House Office of Press Secretary 2017). The renegotiation of the North American Free Trade Agreement began 16 August 2017. The US recently called for a special session of the joint committee for the Korea–US FTA.
Regional Cooperation Economic Partnership
Another “mega” trade deal, the Regional Cooperation Economic Partnership, is under negotiation.
The Regional Cooperation Economic Partnership (RCEP) would bind the 10 ASEAN members and the six economies that have existing FTAs with ASEAN. The Joint Media Statement released after the 5th RCEP Ministerial Meeting (held 10 September 2017 in the Philippines) further emphasized the importance of RCEP’s conclusion, having been identified as a key
8 For the TPP to come into force, it must be passed by members’ legislatures and ratified within 2 years of the date of TPP signing (4 February 2016). If one or more members miss the ratification deadline, the TPP can survive if at least six original signatories—accounting for 85% of the region’s 2013 GDP—complete ratification, preferably but not necessarily within 2 years. Failure by either Japan or the US to ratify the agreement, constituting slightly less than 80% of total GDP of all TPP members, would effectively block the agreement.
9 See TPP Ministerial Statement issued on 21 May 2017 (Australian Government, Department of Foreign Affairs and Trade 2017).

Asian Economic Integration Report 201722 Trade and the Global Value Chain 23
Table 2.1: Trade Remedy Measuresa and WTO Casesb, 2010–2017
MeasuresWorld Total
Asiac Total
Asia (Affected/Complainant)–ROW
(Imposing/Respondent)
ROW (Affected/Complainant)–Asia
(Imposing/Respondent)
Asia (Affected/Complainant)–Asia
(Imposing/ Respondent)
Antidumping (Article VI of GATT 1994)
Number of measures implemented 1,074 856 408 122 326
Number of cases 38 28 16 7 5 (3.5%) (3.3%)
Countervailing Measures
Number of measures implemented 104 87 70 7 10
Number of casesd 32 21 10 10 1(30.8%) (24.1%)
Safeguardse
Number of measures implemented 78 49 29 49 49
Number of cases 13 6 3 0 3(16.7%) (12.2%)
Total
Number of measures implemented 1,256 992 507 178 385
Number of cases 83 55 29 17 9(6.6%) (5.5%)
GATT = General Agreement on Tariffs and Trade, ROW = rest of the world, WTO = World Trade Organization. Note: Numbers in parentheses are percentage share of cases to total measures implemented.a Trade remedy measures are trade rules or policies implemented by an economy. In the table, trade remedies include measures which are in force.b WTO cases are disputes on trade measures among WTO members that are brought before the WTO Dispute Settlement Body. c Asia as implementing/affected region equals the number of global trade remedy measures minus ROW-ROW measures (not shown in table). d Includes cases involving complaints on the grant of subsidies and countervailing measures. e Safeguard measures are imposed on all WTO members; no bilateral data available. Sources: ADB calculations using data from WTO. Integrated Trade Intelligence Portal. https://www.wto.org/english/res_e/statis_e/itip_e.htm; and WTO. Disputes by agreement. https://www.wto.org/english/tratop_e/dispu_e/dispu_agreements_index_e.htm (both accessed September 2017).
Figure 2.13: Trade-related Measures in Asia
Note: Based on cumulative number of measures in force as of end of each year. Source: ADB calculations using data from World Trade Organization. Integrated Trade Intelligence Portal. https://www.wto.org/english/res_e/statis_e/itip_e.htm (accessed September 2017).
0
2,000
4,000
6,000
8,000
10,000
12,000
Sanitary and phytosanitary rules Technical barriers to tradeTari�-rate quotas Antidumping measuresQuantitative restrictions Special safeguardsOther nontari� measures
2000 2005 2010 2015 2017
Trade Remedies
While traditional tariff barriers have been significantly lowered, other types of tariff and nontariff measures are on the rise.
The trend of rapidly growing tariff and nontariff measures amid tepid international trade growth continued during 2017 (Figure 2.13). While increasing in number, not all nontariff measures are protectionist—some have valid socio-economic objectives. For example, the sanitary and phytosanitory measures aim to protect the safety of food for consumers and prevent or limit the spread of pests and outbreak of diseases among plants and animals.
Antidumping duties remain the most prevalent trade remedy used against Asia’s exporters (Table 2.1).
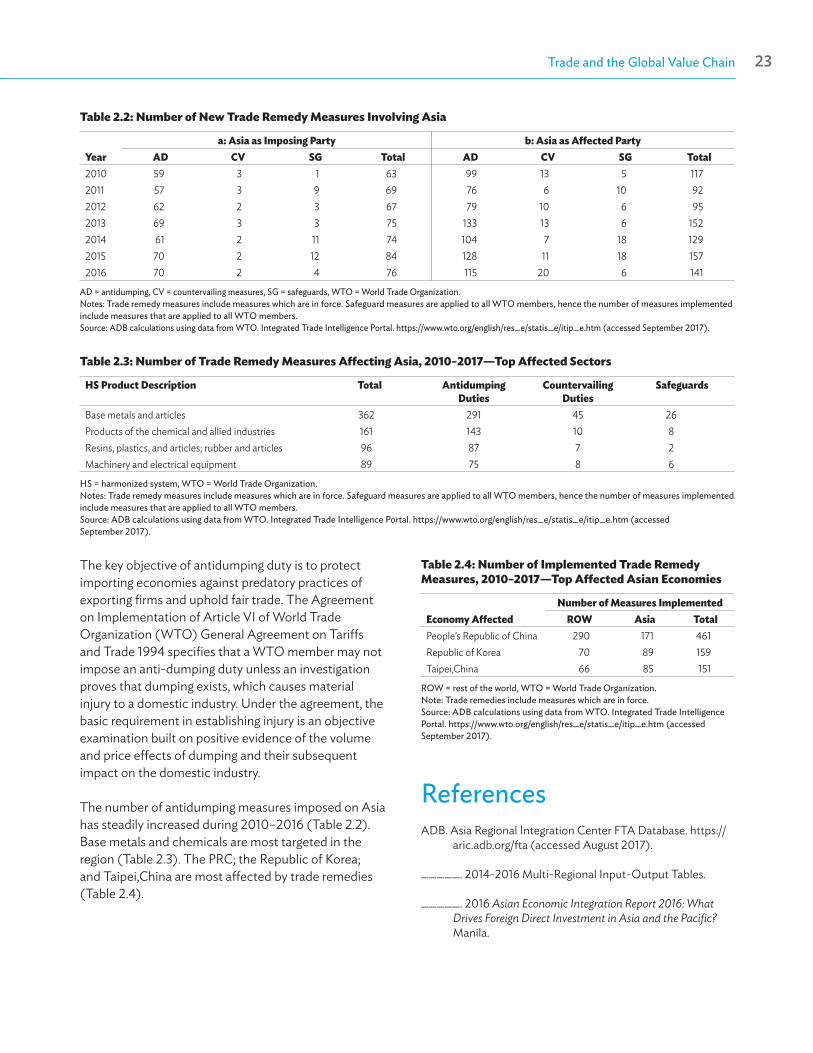
Asian Economic Integration Report 201722 Trade and the Global Value Chain 23
Table 2.2: Number of New Trade Remedy Measures Involving Asia
Yeara: Asia as Imposing Party b: Asia as Affected Party
AD CV SG Total AD CV SG Total2010 59 3 1 63 99 13 5 1172011 57 3 9 69 76 6 10 922012 62 2 3 67 79 10 6 952013 69 3 3 75 133 13 6 1522014 61 2 11 74 104 7 18 1292015 70 2 12 84 128 11 18 1572016 70 2 4 76 115 20 6 141
AD = antidumping, CV = countervailing measures, SG = safeguards, WTO = World Trade Organization.Notes: Trade remedy measures include measures which are in force. Safeguard measures are applied to all WTO members, hence the number of measures implemented include measures that are applied to all WTO members.Source: ADB calculations using data from WTO. Integrated Trade Intelligence Portal. https://www.wto.org/english/res_e/statis_e/itip_e.htm (accessed September 2017).
Table 2.3: Number of Trade Remedy Measures Affecting Asia, 2010–2017—Top Affected Sectors
HS Product Description Total Antidumping Duties
Countervailing Duties
Safeguards
Base metals and articles 362 291 45 26Products of the chemical and allied industries 161 143 10 8Resins, plastics, and articles; rubber and articles 96 87 7 2Machinery and electrical equipment 89 75 8 6
HS = harmonized system, WTO = World Trade Organization.Notes: Trade remedy measures include measures which are in force. Safeguard measures are applied to all WTO members, hence the number of measures implemented include measures that are applied to all WTO members.Source: ADB calculations using data from WTO. Integrated Trade Intelligence Portal. https://www.wto.org/english/res_e/statis_e/itip_e.htm (accessed September 2017).
Table 2.4: Number of Implemented Trade Remedy Measures, 2010–2017—Top Affected Asian Economies
Economy AffectedNumber of Measures Implemented
ROW Asia TotalPeople’s Republic of China 290 171 461Republic of Korea 70 89 159Taipei,China 66 85 151
ROW = rest of the world, WTO = World Trade Organization.Note: Trade remedies include measures which are in force. Source: ADB calculations using data from WTO. Integrated Trade Intelligence Portal. https://www.wto.org/english/res_e/statis_e/itip_e.htm (accessed September 2017).
The key objective of antidumping duty is to protect importing economies against predatory practices of exporting firms and uphold fair trade. The Agreement on Implementation of Article VI of World Trade Organization (WTO) General Agreement on Tariffs and Trade 1994 specifies that a WTO member may not impose an anti-dumping duty unless an investigation proves that dumping exists, which causes material injury to a domestic industry. Under the agreement, the basic requirement in establishing injury is an objective examination built on positive evidence of the volume and price effects of dumping and their subsequent impact on the domestic industry.
The number of antidumping measures imposed on Asia has steadily increased during 2010–2016 (Table 2.2). Base metals and chemicals are most targeted in the region (Table 2.3). The PRC; the Republic of Korea; and Taipei,China are most affected by trade remedies (Table 2.4).
ReferencesADB. Asia Regional Integration Center FTA Database. https://
aric.adb.org/fta (accessed August 2017).
_____. 2014-2016 Multi-Regional Input-Output Tables.
_____. 2016 Asian Economic Integration Report 2016: What Drives Foreign Direct Investment in Asia and the Pacific? Manila.
Asian Economic Integration Report 201724 Trade and the Global Value Chain PB
Association of Southeast Asian Nations. 2017. Fifth Regional Comprehensive Economic Partnership (RCEP) Ministerial Meeting Joint Media Statement. 10 September. http://asean.org/storage/2017/09/RCEP-5MM-Final-JMS1.pdf
Australian Government, Department of Foreign Affairs and Trade. 2017. Trans-Pacific Partnership (TPP) Agreement Ministerial Statement. News Release. 21 May.
CPB Netherlands Bureau for Economic Policy Analysis. World Trade Monitor. https://www.cpb.nl/en/data (accessed September 2017).
European Commission. 2017. EU-Japan EPA: The Agreement in Principle. 6 July. http://trade.ec.europa.eu/doclib/docs/2017/july/tradoc_155693.doc.pdf
Institute for Research on the International Economy. http://www.cepii.fr/CEPII/en/cepii/cepii.asp (accessed May 2017)
International Monetary Fund. Direction of Trade Database. https://www.imf.org/en/Data (accessed July 2017).
_____. World Economic Outlook April 2017 Database. https://www.imf.org/external/pubs/ft/weo/2017/01/weodata/index.aspx (accessed May 2017).
D. M. Ramizo. 2017. The Resurgence of Bilateralism and Asia’s Evolving FTA Landscape. Asian Regional Integration Center Blog. https://aric.adb.org/blog/the-resurgence-of-bilateralism-and-asias-evolving-fta-landscape
The US White House Office of the Press Secretary. 2017. Memorandum for the United States Trade Representative. Subject: Withdrawal of the United States from the Trans-Pacific Partnership Negotiations and Agreement. https://aric.adb.org/pdf/Withdrawal%20of%20the%20United%20States%20from%20the%20TPP%20Negotiations.pdf
United Nations. Commodity Trade Database. https://comtrade.un.org (accessed July 2017).
Z. Wang, S.J. Wei, and K. Zhu. 2014. Quantifying International Production Sharing at the Bilateral and Sector Levels. NBER Working Paper. No. 19677. Cambridge, MA: National Bureau of Economic Research.
World Trade Organization. 1994. General Agreement on Tariffs and Trade 1994. https://www.wto.org/English/Docs_E/legal_e/06-gatt_e.htm
_____. Disputes by Agreement. https://www.wto.org/english/tratop_e/dispu_e/dispu_agreements_index_e.htm (accessed September 2017).
_____. Integrated Trade Intelligence Portal (I-TIP). http://i-tip.wto.org/goods/default.aspx?language=en (accessed September 2017).
_____. Regional Trade Agreement Information System. http://rtias.wto.org (accessed September 2017).
_____. WTO Statistics. http://stat.wto.org (accessed May 2017).
Xinhua. 2017. RCEP Ministers Agree on “Key Elements” to Speed Up Talks on “Mega Trade Pact”. 11 September.
Cross-border Investment
03
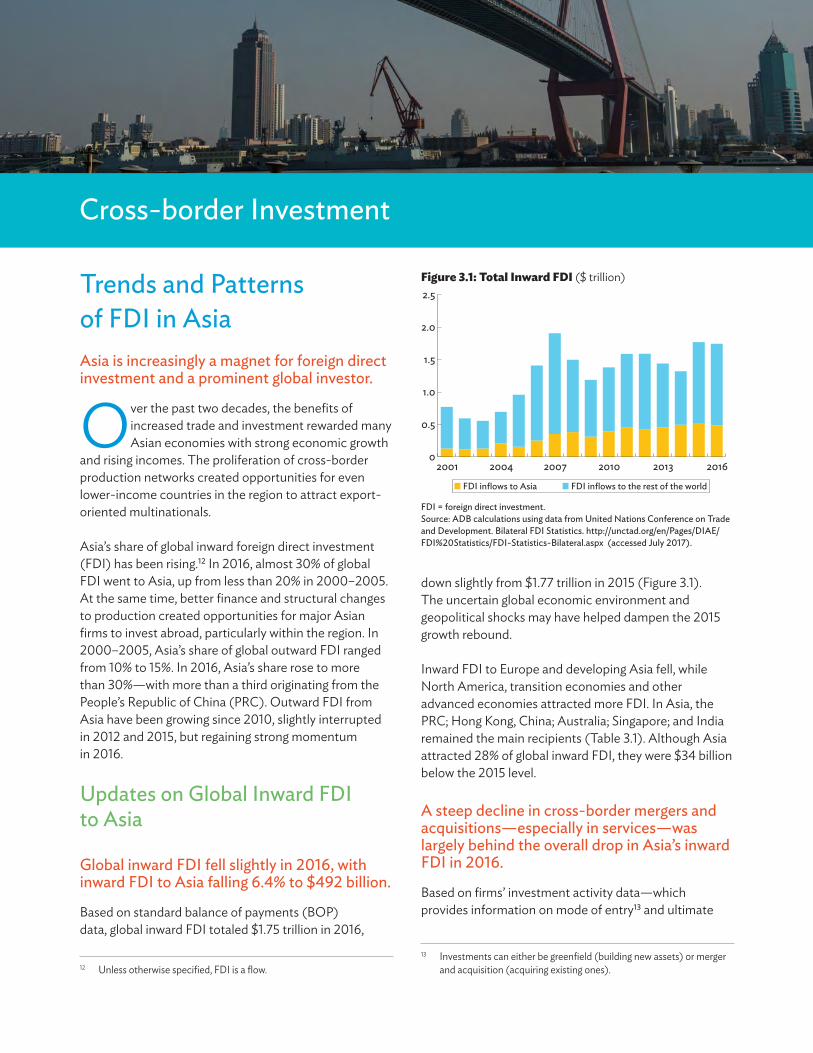
Asian Economic Integration Report 201726 Cross-border Investment 27
Cross-border Investment
Trends and Patterns of FDI in AsiaAsia is increasingly a magnet for foreign direct investment and a prominent global investor.
Over the past two decades, the benefits of increased trade and investment rewarded many Asian economies with strong economic growth
and rising incomes. The proliferation of cross-border production networks created opportunities for even lower-income countries in the region to attract export-oriented multinationals.
Asia’s share of global inward foreign direct investment (FDI) has been rising.12 In 2016, almost 30% of global FDI went to Asia, up from less than 20% in 2000–2005. At the same time, better finance and structural changes to production created opportunities for major Asian firms to invest abroad, particularly within the region. In 2000–2005, Asia’s share of global outward FDI ranged from 10% to 15%. In 2016, Asia’s share rose to more than 30%—with more than a third originating from the People’s Republic of China (PRC). Outward FDI from Asia have been growing since 2010, slightly interrupted in 2012 and 2015, but regaining strong momentum in 2016.
Updates on Global Inward FDI to Asia
Global inward FDI fell slightly in 2016, with inward FDI to Asia falling 6.4% to $492 billion.
Based on standard balance of payments (BOP) data, global inward FDI totaled $1.75 trillion in 2016,
12 Unless otherwise specified, FDI is a flow.
down slightly from $1.77 trillion in 2015 (Figure 3.1). The uncertain global economic environment and geopolitical shocks may have helped dampen the 2015 growth rebound.
Inward FDI to Europe and developing Asia fell, while North America, transition economies and other advanced economies attracted more FDI. In Asia, the PRC; Hong Kong, China; Australia; Singapore; and India remained the main recipients (Table 3.1). Although Asia attracted 28% of global inward FDI, they were $34 billion below the 2015 level.
A steep decline in cross-border mergers and acquisitions—especially in services—was largely behind the overall drop in Asia’s inward FDI in 2016.
Based on firms’ investment activity data—which provides information on mode of entry13 and ultimate
13 Investments can either be greenfield (building new assets) or merger and acquisition (acquiring existing ones).
Figure 3.1: Total Inward FDI ($ trillion)
FDI = foreign direct investment.Source: ADB calculations using data from United Nations Conference on Trade and Development. Bilateral FDI Statistics. http://unctad.org/en/Pages/DIAE/FDI%20Statistics/FDI-Statistics-Bilateral.aspx (accessed July 2017).
0
0.5
1.0
1.5
2.0
2.5
2001 2004 2007 2010 2013 2016
FDI inflows to Asia FDI inflows to the rest of the world
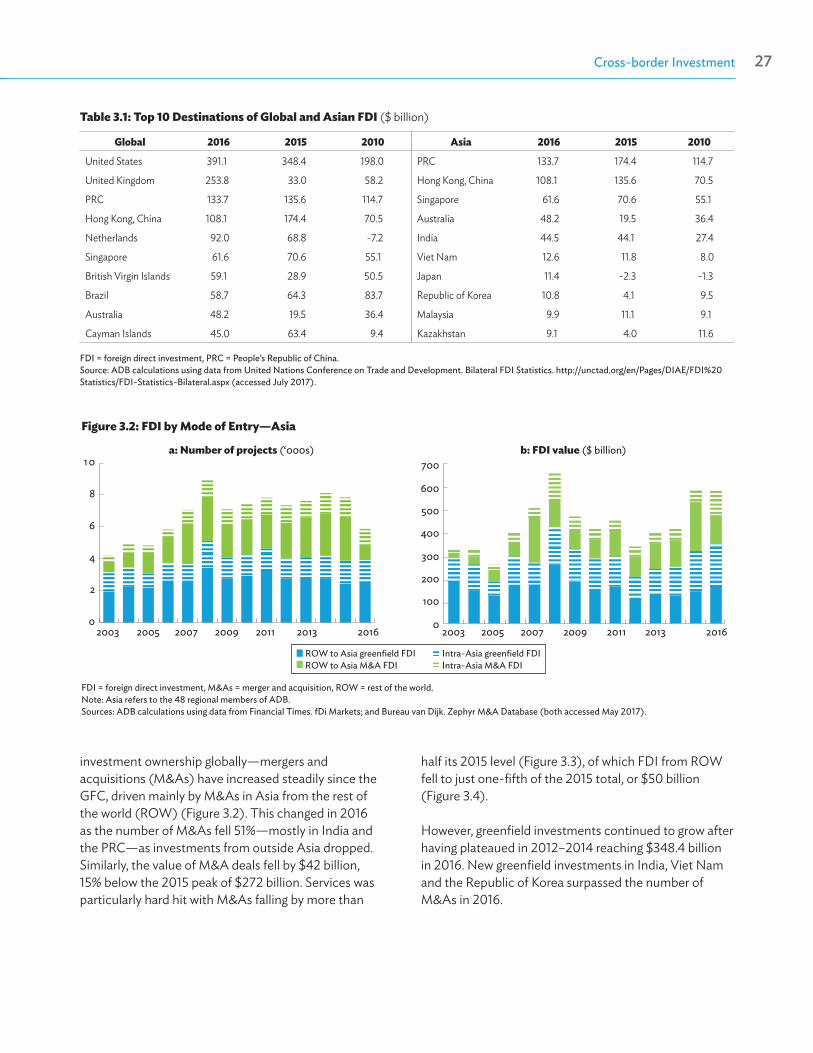
Asian Economic Integration Report 201726 Cross-border Investment 27
Table 3.1: Top 10 Destinations of Global and Asian FDI ($ billion)
Global 2016 2015 2010 Asia 2016 2015 2010
United States 391.1 348.4 198.0 PRC 133.7 174.4 114.7
United Kingdom 253.8 33.0 58.2 Hong Kong, China 108.1 135.6 70.5
PRC 133.7 135.6 114.7 Singapore 61.6 70.6 55.1
Hong Kong, China 108.1 174.4 70.5 Australia 48.2 19.5 36.4
Netherlands 92.0 68.8 -7.2 India 44.5 44.1 27.4
Singapore 61.6 70.6 55.1 Viet Nam 12.6 11.8 8.0
British Virgin Islands 59.1 28.9 50.5 Japan 11.4 -2.3 -1.3
Brazil 58.7 64.3 83.7 Republic of Korea 10.8 4.1 9.5
Australia 48.2 19.5 36.4 Malaysia 9.9 11.1 9.1
Cayman Islands 45.0 63.4 9.4 Kazakhstan 9.1 4.0 11.6
FDI = foreign direct investment, PRC = People’s Republic of China. Source: ADB calculations using data from United Nations Conference on Trade and Development. Bilateral FDI Statistics. http://unctad.org/en/Pages/DIAE/FDI%20Statistics/FDI-Statistics-Bilateral.aspx (accessed July 2017).
investment ownership globally—mergers and acquisitions (M&As) have increased steadily since the GFC, driven mainly by M&As in Asia from the rest of the world (ROW) (Figure 3.2). This changed in 2016 as the number of M&As fell 51%—mostly in India and the PRC—as investments from outside Asia dropped. Similarly, the value of M&A deals fell by $42 billion, 15% below the 2015 peak of $272 billion. Services was particularly hard hit with M&As falling by more than
Figure 3.2: FDI by Mode of Entry—Asia
FDI = foreign direct investment, M&As = merger and acquisition, ROW = rest of the world.Note: Asia refers to the 48 regional members of ADB.Sources: ADB calculations using data from Financial Times. fDi Markets; and Bureau van Dijk. Zephyr M&A Database (both accessed May 2017).
2003 2005 2007 2009 2011 2013 2016 2003 2005 2007 2009 2011 2013 2016
ROW to Asia greenfield FDI Intra-Asia greenfield FDIROW to Asia M&A FDI Intra-Asia M&A FDI
0
100
200
300
400
500
600
700a: Number of projects (‘000s) b: FDI value ($ billion)
0
2
4
6
8
10
half its 2015 level (Figure 3.3), of which FDI from ROW fell to just one-fifth of the 2015 total, or $50 billion (Figure 3.4).
However, greenfield investments continued to grow after having plateaued in 2012–2014 reaching $348.4 billion in 2016. New greenfield investments in India, Viet Nam and the Republic of Korea surpassed the number of M&As in 2016.
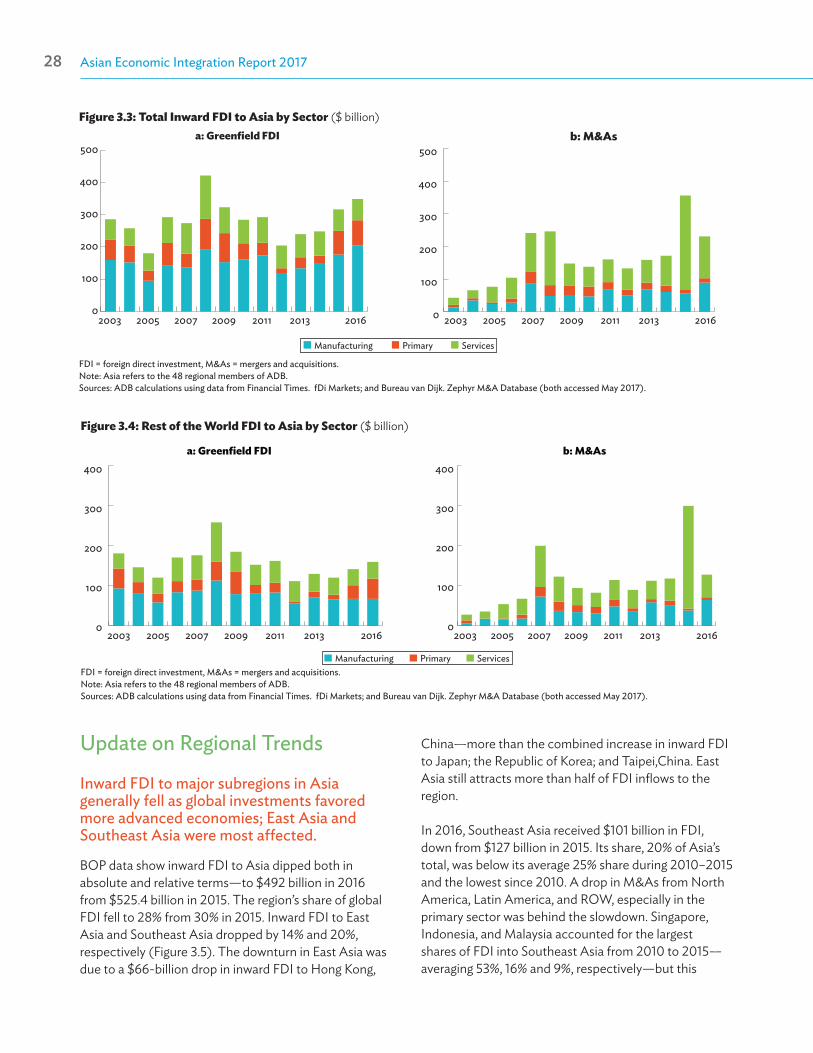
Asian Economic Integration Report 201728 Cross-border Investment 29
0
100
200
300
400
500
2003 2005 2007 2009 2011 2013 2016
a: Greenfield FDI
0
100
200
300
400
500
2003 2005 2007 2009 2011 2013 2016
b: M&As
Manufacturing Primary Services
Figure 3.3: Total Inward FDI to Asia by Sector ($ billion)
FDI = foreign direct investment, M&As = mergers and acquisitions.Note: Asia refers to the 48 regional members of ADB. Sources: ADB calculations using data from Financial Times. fDi Markets; and Bureau van Dijk. Zephyr M&A Database (both accessed May 2017).
0
100
200
300
400
2003 2005 2007 2009 2011 2013 2016
a: Greenfield FDI
0
100
200
300
400
2003 2005 2007 2009 2011 2013 2016
b: M&As
Manufacturing Primary Services
Figure 3.4: Rest of the World FDI to Asia by Sector ($ billion)
FDI = foreign direct investment, M&As = mergers and acquisitions.Note: Asia refers to the 48 regional members of ADB. Sources: ADB calculations using data from Financial Times. fDi Markets; and Bureau van Dijk. Zephyr M&A Database (both accessed May 2017).
Update on Regional Trends
Inward FDI to major subregions in Asia generally fell as global investments favored more advanced economies; East Asia and Southeast Asia were most affected.
BOP data show inward FDI to Asia dipped both in absolute and relative terms—to $492 billion in 2016 from $525.4 billion in 2015. The region’s share of global FDI fell to 28% from 30% in 2015. Inward FDI to East Asia and Southeast Asia dropped by 14% and 20%, respectively (Figure 3.5). The downturn in East Asia was due to a $66-billion drop in inward FDI to Hong Kong,
China—more than the combined increase in inward FDI to Japan; the Republic of Korea; and Taipei,China. East Asia still attracts more than half of FDI inflows to the region.
In 2016, Southeast Asia received $101 billion in FDI, down from $127 billion in 2015. Its share, 20% of Asia’s total, was below its average 25% share during 2010–2015 and the lowest since 2010. A drop in M&As from North America, Latin America, and ROW, especially in the primary sector was behind the slowdown. Singapore, Indonesia, and Malaysia accounted for the largest shares of FDI into Southeast Asia from 2010 to 2015—averaging 53%, 16% and 9%, respectively—but this
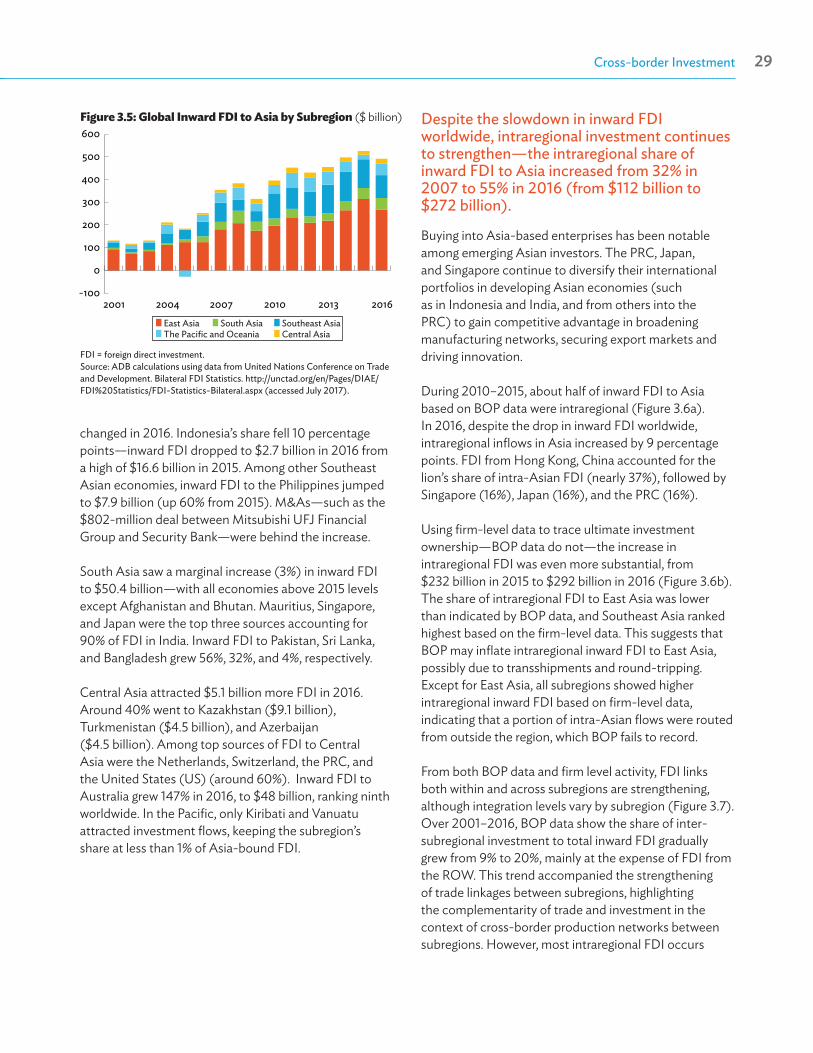
Asian Economic Integration Report 201728 Cross-border Investment 29
-100
0
100
200
300
400
500
600
2001 2004 2007 2010 2013 2016
East Asia South Asia Southeast AsiaThe Pacific and Oceania Central Asia
Figure 3.5: Global Inward FDI to Asia by Subregion ($ billion)
FDI = foreign direct investment.Source: ADB calculations using data from United Nations Conference on Trade and Development. Bilateral FDI Statistics. http://unctad.org/en/Pages/DIAE/FDI%20Statistics/FDI-Statistics-Bilateral.aspx (accessed July 2017).
changed in 2016. Indonesia’s share fell 10 percentage points—inward FDI dropped to $2.7 billion in 2016 from a high of $16.6 billion in 2015. Among other Southeast Asian economies, inward FDI to the Philippines jumped to $7.9 billion (up 60% from 2015). M&As—such as the $802-million deal between Mitsubishi UFJ Financial Group and Security Bank—were behind the increase.
South Asia saw a marginal increase (3%) in inward FDI to $50.4 billion—with all economies above 2015 levels except Afghanistan and Bhutan. Mauritius, Singapore, and Japan were the top three sources accounting for 90% of FDI in India. Inward FDI to Pakistan, Sri Lanka, and Bangladesh grew 56%, 32%, and 4%, respectively.
Central Asia attracted $5.1 billion more FDI in 2016. Around 40% went to Kazakhstan ($9.1 billion), Turkmenistan ($4.5 billion), and Azerbaijan ($4.5 billion). Among top sources of FDI to Central Asia were the Netherlands, Switzerland, the PRC, and the United States (US) (around 60%). Inward FDI to Australia grew 147% in 2016, to $48 billion, ranking ninth worldwide. In the Pacific, only Kiribati and Vanuatu attracted investment flows, keeping the subregion’s share at less than 1% of Asia-bound FDI.
Despite the slowdown in inward FDI worldwide, intraregional investment continues to strengthen—the intraregional share of inward FDI to Asia increased from 32% in 2007 to 55% in 2016 (from $112 billion to $272 billion).
Buying into Asia-based enterprises has been notable among emerging Asian investors. The PRC, Japan, and Singapore continue to diversify their international portfolios in developing Asian economies (such as in Indonesia and India, and from others into the PRC) to gain competitive advantage in broadening manufacturing networks, securing export markets and driving innovation.
During 2010–2015, about half of inward FDI to Asia based on BOP data were intraregional (Figure 3.6a). In 2016, despite the drop in inward FDI worldwide, intraregional inflows in Asia increased by 9 percentage points. FDI from Hong Kong, China accounted for the lion’s share of intra-Asian FDI (nearly 37%), followed by Singapore (16%), Japan (16%), and the PRC (16%).
Using firm-level data to trace ultimate investment ownership—BOP data do not—the increase in intraregional FDI was even more substantial, from $232 billion in 2015 to $292 billion in 2016 (Figure 3.6b). The share of intraregional FDI to East Asia was lower than indicated by BOP data, and Southeast Asia ranked highest based on the firm-level data. This suggests that BOP may inflate intraregional inward FDI to East Asia, possibly due to transshipments and round-tripping. Except for East Asia, all subregions showed higher intraregional inward FDI based on firm-level data, indicating that a portion of intra-Asian flows were routed from outside the region, which BOP fails to record.
From both BOP data and firm level activity, FDI links both within and across subregions are strengthening, although integration levels vary by subregion (Figure 3.7). Over 2001–2016, BOP data show the share of inter-subregional investment to total inward FDI gradually grew from 9% to 20%, mainly at the expense of FDI from the ROW. This trend accompanied the strengthening of trade linkages between subregions, highlighting the complementarity of trade and investment in the context of cross-border production networks between subregions. However, most intraregional FDI occurs

Asian Economic Integration Report 201730 Cross-border Investment 31
The Pacific and Oceania (left) Central Asia (left) South Asia (left)Southeast Asia (left) East Asia (left) Intraregional FDI share (right)
0
20
40
60
0
100
200
300
400
2003 2005 2007 2009 2011 2013 2016
b: Firm-level investment activity (Greenfield FDI and M&As)
$ bi
llion
% sh
are
a: Balance of Payments-based
0
20
40
60
0
100
200
300
400
$ bi
llion
% sh
are
2001 2003 2005 2007 2009 2011 2013 2016
Figure 3.6: Intraregional FDI Inflows—Asia
FDI = foreign direct investment, M&As = mergers and acquisitions.Notes: For the right panel chart, values and shares are based on the sum of greenfield FDI and M&A deal values. Asia refers to the 48 regional members of ADB. Sources: ADB calculations using data from Association of Southeast Nations Secretariat; CEIC; Eurostat. Balance of Payments. http://ec.europa.eu/eurostat/web/balance-of-payments/data/database (accessed July 2017); Korean Statistical Information Service. Balance of Payments. http://kosis.kr/statHtml/statHtml.do?orgId=301&tblId=DT_022Y016&language=en&conn_path=I3 (accessed August 2017); Rep. of Korea Ministry of Trade, Industry, and Energy. http://www.motie.go.kr/www/main.do (accessed August 2017); United Nations Conference on Trade and Development. Bilateral FDI Statistics. http://unctad.org/en/Pages/DIAE/FDI%20Statistics/FDI-Statistics-Bilateral.aspx (accessed July 2017); Financial Times. fDi Markets (accessed May 2017); and Bureau van Dijk. Zephyr M&A Database (accessed May 2017).
Inflows from the rest of the world Asia inter-subregional flowsAsia intra-subregional flows
2001 2004 2007 2010 2013 20160
10
20
30
40
50
60
70
80Figure 3.7. Regional FDI Share—Asia (%)
FDI = foreign direct investment.Sources: ADB calculations using data from Association of Southeast Nations Secretariat; CEIC; Eurostat. Balance of Payments. http://ec.europa.eu/eurostat/web/balance-of-payments/data/database (accessed July 2017); Korean Statistical Information Service. Balance of Payments. http://kosis.kr/statHtml/statHtml.do?orgId=301&tblId=DT_022Y016&language=en&conn_path=I3 (accessed August 2017); Rep. of Korea Ministry of Trade, Industry, and Energy. http://www.motie.go.kr/www/main.do (accessed August 2017); and United Nations Conference on Trade and Development. Bilateral FDI Statistics. http://unctad.org/en/Pages/DIAE/FDI%20Statistics/FDI-Statistics-Bilateral.aspx (accessed July 2017).
within subregions—the share of intra-subregional investment has stayed around 40% since 2001.
Intra-Asian FDI supports global value chains more than FDI from outside the region. And given the uncertain
global economic environment, geopolitical changes and the uncertain prognosis for future FDI flows, developing Asia must continue to foster intraregional trade and investment linkages to strengthen resilience to external shocks.
Outward FDI Lower outward investment from advanced economies reduced global outward FDI in 2016.
Based on BOP data, global outward FDI in 2016 were 9% below 2015 levels (Figure 3.8). Outward investment from advanced economies fell 11% to $1 trillion in 2016. The largest drop was in Ireland, Switzerland and Germany—together investing $254 billion less than in 2015.
Despite weakening outward FDI worldwide, Asia’s outward FDI increased 11% in 2016.
BOP-based outward FDI from Asia reached $482 billion in 2016, up 11% from 2015—91% by value came from East Asia (Figure 3.9). The PRC was the second-largest global investor in 2016, up from fifth in 2015. It is also the largest Asian investor, with $183.1 billion invested globally and over 75% outside Asia. Japan’s outward FDI surged 13% to $145 billion in 2016, its largest expansion
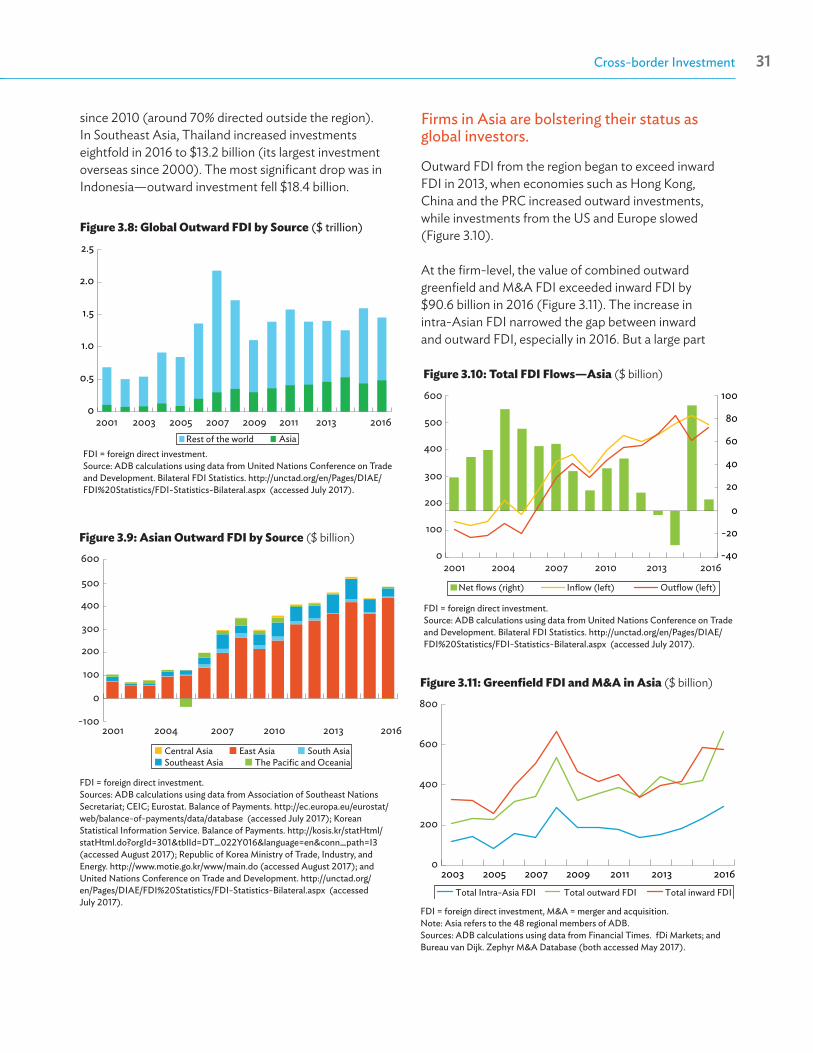
Asian Economic Integration Report 201730 Cross-border Investment 31
0
0.5
1.0
1.5
2.0
2.5
2001 2003 2005 2007 2009 2011 2013 2016Rest of the world Asia
Figure 3.8: Global Outward FDI by Source ($ trillion)
FDI = foreign direct investment.Source: ADB calculations using data from United Nations Conference on Trade and Development. Bilateral FDI Statistics. http://unctad.org/en/Pages/DIAE/FDI%20Statistics/FDI-Statistics-Bilateral.aspx (accessed July 2017).
Figure 3.9: Asian Outward FDI by Source ($ billion)
FDI = foreign direct investment.Sources: ADB calculations using data from Association of Southeast Nations Secretariat; CEIC; Eurostat. Balance of Payments. http://ec.europa.eu/eurostat/web/balance-of-payments/data/database (accessed July 2017); Korean Statistical Information Service. Balance of Payments. http://kosis.kr/statHtml/statHtml.do?orgId=301&tblId=DT_022Y016&language=en&conn_path=I3 (accessed August 2017); Republic of Korea Ministry of Trade, Industry, and Energy. http://www.motie.go.kr/www/main.do (accessed August 2017); and United Nations Conference on Trade and Development. http://unctad.org/en/Pages/DIAE/FDI%20Statistics/FDI-Statistics-Bilateral.aspx (accessed July 2017).
-100
0
100
200
300
400
500
600
2001 2004 2007 2010 2013 2016
East Asia South AsiaSoutheast Asia The Pacific and OceaniaCentral Asia
Figure 3.10: Total FDI Flows—Asia ($ billion)
FDI = foreign direct investment.Source: ADB calculations using data from United Nations Conference on Trade and Development. Bilateral FDI Statistics. http://unctad.org/en/Pages/DIAE/FDI%20Statistics/FDI-Statistics-Bilateral.aspx (accessed July 2017).
-40
-20
0
20
40
60
80
100
0
100
200
300
400
500
600
2001 2004 2007 2010 2013 2016
Net flows (right) Inflow (left) Outflow (left)
Firms in Asia are bolstering their status as global investors.
Outward FDI from the region began to exceed inward FDI in 2013, when economies such as Hong Kong, China and the PRC increased outward investments, while investments from the US and Europe slowed (Figure 3.10).
At the firm-level, the value of combined outward greenfield and M&A FDI exceeded inward FDI by $90.6 billion in 2016 (Figure 3.11). The increase in intra-Asian FDI narrowed the gap between inward and outward FDI, especially in 2016. But a large part
Figure 3.11: Greenfield FDI and M&A in Asia ($ billion)
FDI = foreign direct investment, M&A = merger and acquisition.Note: Asia refers to the 48 regional members of ADB. Sources: ADB calculations using data from Financial Times. fDi Markets; and Bureau van Dijk. Zephyr M&A Database (both accessed May 2017).
Total outward FDI
0
200
400
600
800
2003 2005 2007 2009 2011 2013 2016Total Intra-Asia FDI Total inward FDI
since 2010 (around 70% directed outside the region). In Southeast Asia, Thailand increased investments eightfold in 2016 to $13.2 billion (its largest investment overseas since 2000). The most significant drop was in Indonesia—outward investment fell $18.4 billion.
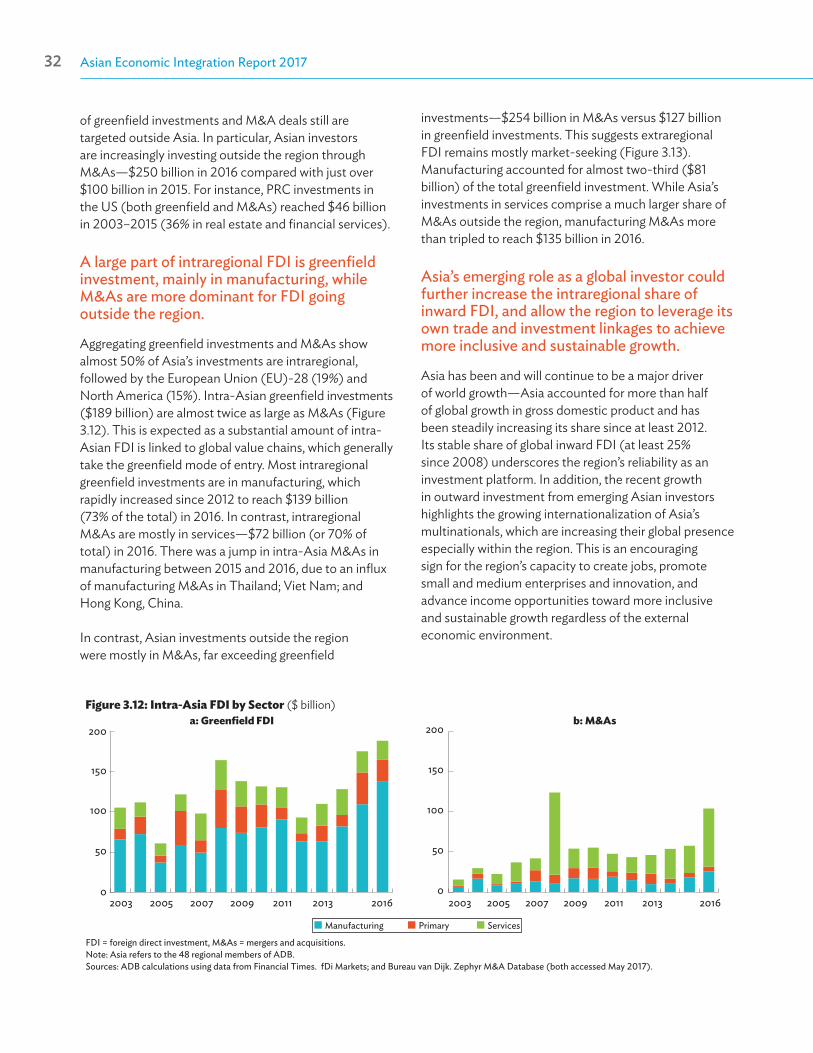
Asian Economic Integration Report 201732 Cross-border Investment 33
of greenfield investments and M&A deals still are targeted outside Asia. In particular, Asian investors are increasingly investing outside the region through M&As—$250 billion in 2016 compared with just over $100 billion in 2015. For instance, PRC investments in the US (both greenfield and M&As) reached $46 billion in 2003–2015 (36% in real estate and financial services).
A large part of intraregional FDI is greenfield investment, mainly in manufacturing, while M&As are more dominant for FDI going outside the region.
Aggregating greenfield investments and M&As show almost 50% of Asia’s investments are intraregional, followed by the European Union (EU)-28 (19%) and North America (15%). Intra-Asian greenfield investments ($189 billion) are almost twice as large as M&As (Figure 3.12). This is expected as a substantial amount of intra-Asian FDI is linked to global value chains, which generally take the greenfield mode of entry. Most intraregional greenfield investments are in manufacturing, which rapidly increased since 2012 to reach $139 billion (73% of the total) in 2016. In contrast, intraregional M&As are mostly in services—$72 billion (or 70% of total) in 2016. There was a jump in intra-Asia M&As in manufacturing between 2015 and 2016, due to an influx of manufacturing M&As in Thailand; Viet Nam; and Hong Kong, China.
In contrast, Asian investments outside the region were mostly in M&As, far exceeding greenfield
investments—$254 billion in M&As versus $127 billion in greenfield investments. This suggests extraregional FDI remains mostly market-seeking (Figure 3.13). Manufacturing accounted for almost two-third ($81 billion) of the total greenfield investment. While Asia’s investments in services comprise a much larger share of M&As outside the region, manufacturing M&As more than tripled to reach $135 billion in 2016.
Asia’s emerging role as a global investor could further increase the intraregional share of inward FDI, and allow the region to leverage its own trade and investment linkages to achieve more inclusive and sustainable growth.
Asia has been and will continue to be a major driver of world growth—Asia accounted for more than half of global growth in gross domestic product and has been steadily increasing its share since at least 2012. Its stable share of global inward FDI (at least 25% since 2008) underscores the region’s reliability as an investment platform. In addition, the recent growth in outward investment from emerging Asian investors highlights the growing internationalization of Asia’s multinationals, which are increasing their global presence especially within the region. This is an encouraging sign for the region’s capacity to create jobs, promote small and medium enterprises and innovation, and advance income opportunities toward more inclusive and sustainable growth regardless of the external economic environment.
Figure 3.12: Intra-Asia FDI by Sector ($ billion)
FDI = foreign direct investment, M&As = mergers and acquisitions.Note: Asia refers to the 48 regional members of ADB.Sources: ADB calculations using data from Financial Times. fDi Markets; and Bureau van Dijk. Zephyr M&A Database (both accessed May 2017).
0
50
100
150
200
2003 2005 2007 2009 2011 2013 2016
a: Greenfield FDI
0
50
100
150
200
2003 2005 2007 2009 2011 2013 2016
b: M&As
Manufacturing Primary Services
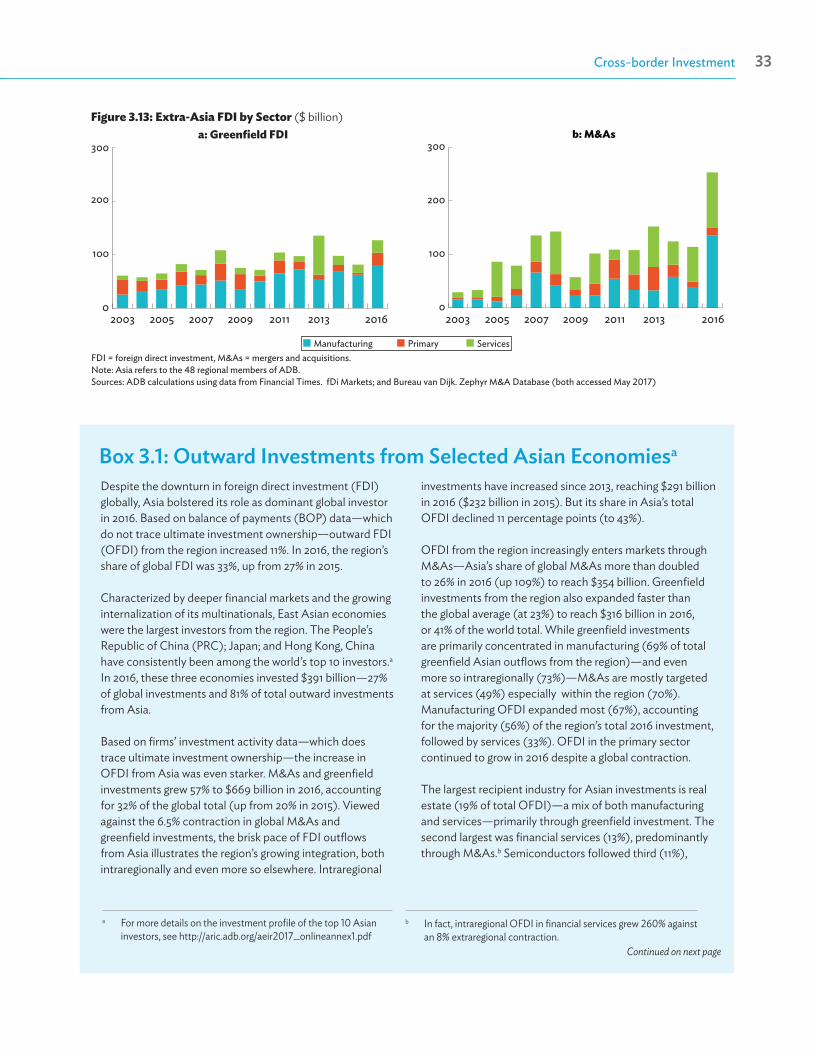
Asian Economic Integration Report 201732 Cross-border Investment 33
Figure 3.13: Extra-Asia FDI by Sector ($ billion)
FDI = foreign direct investment, M&As = mergers and acquisitions.Note: Asia refers to the 48 regional members of ADB.Sources: ADB calculations using data from Financial Times. fDi Markets; and Bureau van Dijk. Zephyr M&A Database (both accessed May 2017)
0
100
200
300
2003 2005 2007 2009 2011 2013 2016
a: Greenfield FDI
2003 2005 2007 2009 2011 2013 20160
100
200
300b: M&As
Manufacturing Primary Services
Box 3.1: Outward Investments from Selected Asian Economiesa
Continued on next page
a For more details on the investment profile of the top 10 Asian investors, see http://aric.adb.org/aeir2017_onlineannex1.pdf
b In fact, intraregional OFDI in financial services grew 260% against an 8% extraregional contraction.
Despite the downturn in foreign direct investment (FDI) globally, Asia bolstered its role as dominant global investor in 2016. Based on balance of payments (BOP) data—which do not trace ultimate investment ownership—outward FDI (OFDI) from the region increased 11%. In 2016, the region’s share of global FDI was 33%, up from 27% in 2015.
Characterized by deeper financial markets and the growing internalization of its multinationals, East Asian economies were the largest investors from the region. The People’s Republic of China (PRC); Japan; and Hong Kong, China have consistently been among the world’s top 10 investors.a In 2016, these three economies invested $391 billion—27% of global investments and 81% of total outward investments from Asia.
Based on firms’ investment activity data—which does trace ultimate investment ownership—the increase in OFDI from Asia was even starker. M&As and greenfield investments grew 57% to $669 billion in 2016, accounting for 32% of the global total (up from 20% in 2015). Viewedagainst the 6.5% contraction in global M&As and greenfield investments, the brisk pace of FDI outflows from Asia illustrates the region’s growing integration, both intraregionally and even more so elsewhere. Intraregional
investments have increased since 2013, reaching $291 billion in 2016 ($232 billion in 2015). But its share in Asia’s total OFDI declined 11 percentage points (to 43%).
OFDI from the region increasingly enters markets through M&As—Asia’s share of global M&As more than doubled to 26% in 2016 (up 109%) to reach $354 billion. Greenfield investments from the region also expanded faster than the global average (at 23%) to reach $316 billion in 2016, or 41% of the world total. While greenfield investments are primarily concentrated in manufacturing (69% of total greenfield Asian outflows from the region)—and even more so intraregionally (73%)—M&As are mostly targeted at services (49%) especially within the region (70%). Manufacturing OFDI expanded most (67%), accounting for the majority (56%) of the region’s total 2016 investment, followed by services (33%). OFDI in the primary sector continued to grow in 2016 despite a global contraction.
The largest recipient industry for Asian investments is real estate (19% of total OFDI)—a mix of both manufacturing and services—primarily through greenfield investment. The second largest was financial services (13%), predominantly through M&As.b Semiconductors followed third (11%),
Asian Economic Integration Report 201734 Cross-border Investment 35
Box 3.1 continued
c Hong Kong, China is the only top-10 source economy with outflows overestimated, rather than underestimated, by BOP data.
with the vast majority also via M&As. Asian investments in real estate and financial services were mostly intraregional (24% and 20% of total intra-Asian FDI, respectively). Semiconductors were the fastest growing, with Asian investments increasing more than eight times to $76 billion, almost entirely through M&As outside the region.
The PRC emerged as the largest Asian investor in 2016. Prior to the global financial crisis (GFC), Japan’s OFDI was, on average, five times the size of PRC investments. Since then, the PRC has grown to become dominant investor in all sectors, but particularly in services, accounting for 45% of total Asian OFDI. As the PRC moves away from export-oriented manufacturing toward more domestic consumption demand, the character of PRC investment has changed as well. In 2016, services accounted for 67% of M&As by the PRC, and more than tripled in value ($88 billion)—with intraregional M&As spiking tenfold (to $50 billion)—mainly in real estate and financial services in the United States (US) and Hong Kong, China. In contrast, most Japanese investments are in manufacturing, with semiconductors the largest recipient industry. Most of Japan’s OFDI (73%) is targeted outside the region, while its most popular destination in Asia is the PRC.
Hong Kong, China is the third-largest Asian investor based on BOP data, but firm-level data show investment activity is $20 billion lower than indicated by BOP.c This suggests the economy is a conduit for investments originating elsewhere. Hong Kong, China’s investments abroad reached $40.2 billion in 2016, based on firm-level data, mainly directed to non-Asian countries. The top recipients within Asia, Thailand and the PRC, each accounted for about 14% of its total outbound FDI. Its investment portfolio favors business and real estate services, mainly through cross-border M&As, while the majority of its manufacturing investments are in consumer products.
Most of the increase in the Republic of Korea’s foreign investments in 2016 was in the primary sector—especially coal, oil and natural gas (almost a quarter of OFDI)—but greenfield investments in manufacturing continued to make up the lion’s share. In a marked reversal from 2015, only 50% of OFDI from the Republic of Korea was intraregional (74% in 2015), with Viet Nam and Islamic Republic of Iran as first
and third largest destination, respectively. Multinationals from the Republic of Korea also invested considerably in alternative and renewable energy, mainly in the US.
In sharp contrast with other East Asian economies, investments from Taipei,China were mostly intraregional (83% in 2016)—the highest in the region. M&As in developing Asia drove much of its OFDI, which quadrupled from $3.7 billion in 2010 to $14.8 billion in 2016. Taipei,China’s investments are primarily concentrated in labor-intensive manufacturing such as electronic components and consumer electronics, as well as services such as financial services. Partner firms in the PRC accounted for almost half (46.1%) of Taipei,China’s OFDI, followed by Viet Nam (13.1%). Low labor costs, among other factors, attract export-oriented multinationals from Taipei,China.
Outside East Asia, Singapore is the dominant investor, with its OFDI mostly heading to the US (56.1%), followed by the PRC (7.8%) and India (7.4%). Since 2003, Singapore’s outward investments have been mostly in services. But recently it has shifted into manufacturing, with semiconductors accounting for almost half of all Singaporean investments in 2016.
In addition to Taipei,China; Thailand; Malaysia; and India were among source economies with an intraregional share of OFDI above 50%. Since 2000, Malaysia and India have emerged as prominent Asian investors. While interrupted by the GFC, Malaysia’s OFDI returned to growth in 2011, increasing 6% during 2010–2016 to $28.7 billion. In 2016, Malaysian OFDI grew fastest among Asian economies (164%). Traditionally, Malaysian investments have been in the primary sector (especially coal, oil and natural gas), but shifted markedly toward services, particularly financial services, in 2016. By contrast, India’s OFDI slowed from the GFC to 2015, before recovering 17.0% in 2016 to $21.1 billion—still less than half its 2007 peak. While India’s emergence as a notable investor was driven by services—software, information technology and financial services to the United Kingdom (UK) and the US—the 2016 recovery was largely from greenfield investments in coal, oil and natural gas (Australia attracted about 20% of the total). India’s multinationals also invested in pharmaceuticals in Bangladesh.
Unlike Malaysia and India, Thailand’s OFDI have been consistently increasing despite the GFC, expanding from $2.3 billion in 2007 to $17.2 in 2016 (84% intraregional). The spike since 2011 has been driven mainly by greenfield real-
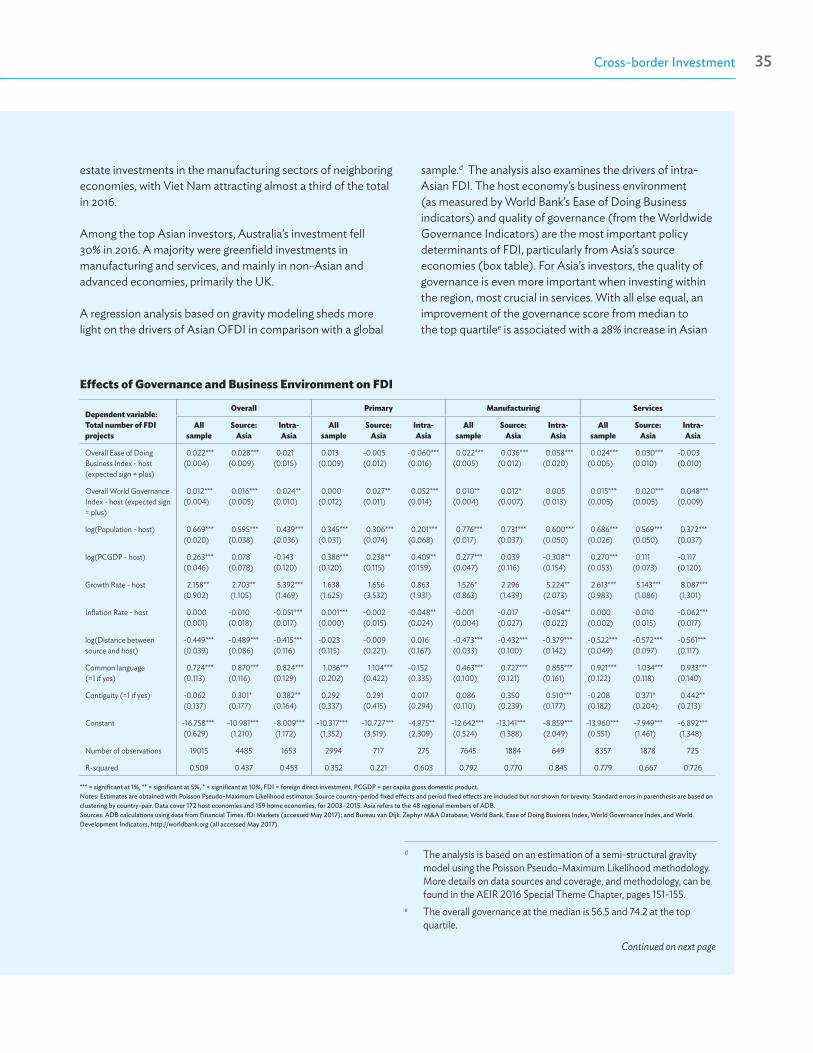
Asian Economic Integration Report 201734 Cross-border Investment 35
estate investments in the manufacturing sectors of neighboring economies, with Viet Nam attracting almost a third of the total in 2016.
Among the top Asian investors, Australia’s investment fell 30% in 2016. A majority were greenfield investments in manufacturing and services, and mainly in non-Asian and advanced economies, primarily the UK.
A regression analysis based on gravity modeling sheds more light on the drivers of Asian OFDI in comparison with a global
sample.d The analysis also examines the drivers of intra-Asian FDI. The host economy’s business environment (as measured by World Bank’s Ease of Doing Business indicators) and quality of governance (from the Worldwide Governance Indicators) are the most important policy determinants of FDI, particularly from Asia’s source economies (box table). For Asia’s investors, the quality of governance is even more important when investing within the region, most crucial in services. With all else equal, an improvement of the governance score from median to the top quartilee is associated with a 28% increase in Asian
d The analysis is based on an estimation of a semi-structural gravity model using the Poisson Pseudo-Maximum Likelihood methodology. More details on data sources and coverage, and methodology, can be found in the AEIR 2016 Special Theme Chapter, pages 151-155.
e The overall governance at the median is 56.5 and 74.2 at the top quartile.
Continued on next page
Effects of Governance and Business Environment on FDI
Dependent variable: Total number of FDI projects
Overall Primary Manufacturing Services
All sample
Source: Asia
Intra-Asia
All sample
Source: Asia
Intra-Asia
All sample
Source: Asia
Intra-Asia
All sample
Source: Asia
Intra-Asia
Overall Ease of Doing Business Index - host (expected sign = plus)
0.022***(0.004)
0.028***(0.009)
0.021(0.015)
0.013(0.009)
-0.005(0.012)
-0.060***(0.016)
0.022***(0.005)
0.036***(0.012)
0.058***(0.020)
0.024***(0.005)
0.030***(0.010)
-0.003(0.010)
Overall World Governance Index - host (expected sign = plus)
0.012***(0.004)
0.016***(0.005)
0.024**(0.010)
0.000(0.012)
0.027**(0.011)
0.052***(0.014)
0.010**(0.004)
0.012*(0.007)
0.005(0.013)
0.015***(0.005)
0.020***(0.005)
0.048***(0.009)
log(Population - host) 0.669***(0.020)
0.595***(0.038)
0.439***(0.036)
0.345***(0.031)
0.306***(0.074)
0.201***(0.068)
0.776***(0.017)
0.731***(0.037)
0.600***(0.050)
0.686***(0.026)
0.569***(0.050)
0.372***(0.037)
log(PCGDP - host) 0.263***(0.046)
0.078(0.078)
-0.143(0.120)
0.386***(0.120)
0.238**(0.115)
0.409**(0.159)
0.277***(0.047)
0.039(0.116)
-0.308**(0.154)
0.270***(0.053)
0.111(0.073)
-0.117(0.120)
Growth Rate - host 2.158**(0.902)
2.703**(1.105)
5.392***(1.469)
1.638(1.625)
1.656(3.532)
0.863(1.931)
1.526*(0.863)
2.296(1.439)
5.224**(2.073)
2.613***(0.983)
5.143***(1.086)
8.087***(1.301)
Inflation Rate - host 0.000(0.001)
-0.010(0.018)
-0.051***(0.017)
0.001***(0.000)
-0.002(0.015)
-0.048**(0.024)
-0.001(0.004)
-0.017(0.027)
-0.054**(0.022)
0.000(0.002)
-0.010(0.015)
-0.062***(0.017)
log(Distance between source and host)
-0.449***(0.039)
-0.489***(0.086)
-0.415***(0.116)
-0.023(0.115)
-0.009(0.221)
0.016(0.167)
-0.473***(0.033)
-0.432***(0.100)
-0.379***(0.142)
-0.522***(0.049)
-0.572***(0.097)
-0.561***(0.117)
Common language (=1 if yes)
0.724***(0.113)
0.870***(0.116)
0.824***(0.129)
1.036***(0.202)
1.104***(0.422)
-0.152(0.335)
0.463***(0.100)
0.727***(0.121)
0.855***(0.161)
0.921***(0.122)
1.034***(0.118)
0.933***(0.140)
Contiguity (=1 if yes) -0.062(0.137)
0.301*(0.177)
0.382**(0.164)
0.292(0.337)
0.291(0.415)
0.017(0.294)
0.086(0.110)
0.350(0.239)
0.510***(0.177)
-0.208(0.182)
0.371*(0.204)
0.442**(0.213)
Constant -16.758***(0.629)
-10.981***(1.210)
-8.009***(1.172)
-10.317***(1.352)
-10.727***(3.519)
-4.975**(2.309)
-12.642***(0.524)
-13.141***(1.388)
-8.859***(2.049)
-13.960***(0.551)
-7.949***(1.461)
-6.892***(1.348)
Number of observations 19015 4485 1653 2994 717 275 7645 1884 649 8357 1878 725
R-squared 0.509 0.437 0.453 0.352 0.221 0.603 0.792 0.770 0.845 0.779 0.667 0.726
*** = significant at 1%, ** = significant at 5%, * = significant at 10%, FDI = foreign direct investment, PCGDP = per capita gross domestic product.Notes: Estimates are obtained with Poisson Pseudo-Maximum Likelihood estimator. Source country-period fixed effects and period fixed effects are included but not shown for brevity. Standard errors in parenthesis are based on clustering by country-pair. Data cover 172 host economies and 159 home economies, for 2003–2015. Asia refers to the 48 regional members of ADB.Sources: ADB calculations using data from Financial Times. fDi Markets (accessed May 2017); and Bureau van Dijk. Zephyr M&A Database; World Bank. Ease of Doing Business Index, World Governance Index, and World Development Indicators, http://worldbank.org (all accessed May 2017).

Asian Economic Integration Report 201736 Cross-border Investment PB
investment projects, and 42% when the host economy is also Asian. In the services sector, the corresponding marginal impact is 35% and 85%, respectively. The growth rate of the host economy also matters significantly more for attracting intra-Asian OFDI in both manufacturing and services.
There are some interesting differences between the global and Asian sample. Results suggest that Asia’s multinationals are motivated by efficiency-seeking considerations (such as lower labor costs) when investing in manufacturing within the region. This reinforces the view that intra-Asian investments are tied to regional value chains (more so for greenfield investments). This contrasts with the global sample where per capita gross domestic product of the host economy is positively associated with the number of FDI projects. Asia’s investors are even more likely to invest in manufacturing in economies sharing a border, pointing to a high level of intra-subregional investment integration. Asian manufacturing investments in economies sharing a border are 67% higher, whereas there is no similar positive association between contiguity and FDI in the global sample.
Despite the increasingly inward-oriented policies in certain advanced economies, recent trends in Asia’s OFDI and the findings of the regression analysis are encouraging for the region’s developing economies. Improving governance will help these economies to continue attracting export-oriented multinationals from the region, despite the uncertain global economic environment.
Box 3.1 continued ReferencesADB. 2016. Asian Economic Integration Report 2016: What Drives
Foreign Direct Investments in Asia and the Pacific. Manila
Association of Southeast Nations Secretariat. ASEANstats Database. https://data.aseanstats.org/ (accessed July 2017).
Eurostat. Balance of Payments. http://ec.europa.eu/eurostat/web/balance-of-payments/data/database (accessed July 2017).
Korean Statistical Information Service. Balance of Payments. http://kosis.kr/statHtml/statHtml.do?orgId=301&tblId=DT_022Y016&language=en&conn_path=I3 (accessed August 2017).
Government of the Republic of Korea. Ministry of Trade, Industry, and Energy. FDI Arrival. http://www.motie.go.kr/www/main.do (accessed August 2017).
World Bank. 2017. Doing Business 2017: Equal Opportunity for All. http://www.doingbusiness.org/ (accessed September 2017).
_____. World Development Indicators. http://databank.worldbank.org/data/reports.aspx?source=world-development-indicators (accessed September 2017).
_____. Worldwide Governance Indicators. http://info.worldbank.org/governance/wgi/#home (accessed September 2017).
United Nations Conference on Trade and Development. Bilateral FDI Statistics. http://unctad.org/en/Pages/DIAE/FDI%20Statistics/FDI-Statistics-Bilateral.aspx (accessed July 2017).
Financial Integration
04
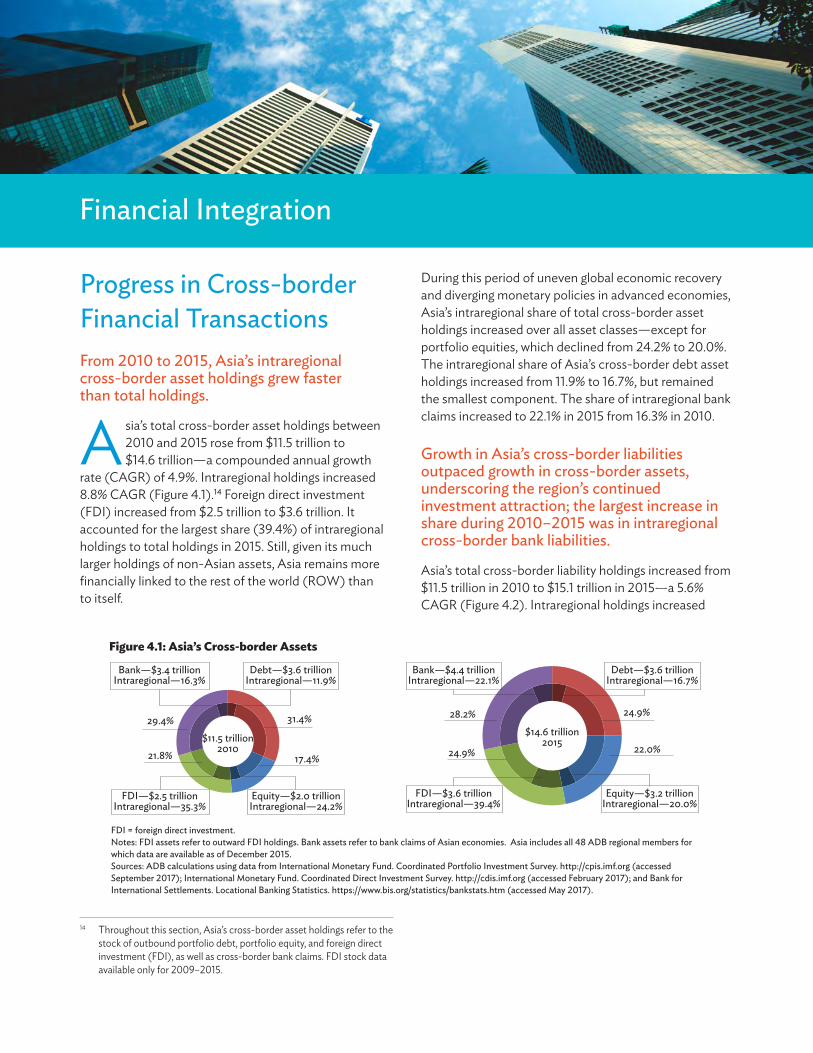
Asian Economic Integration Report 201738 Financial Integration 39
Financial Integration
Progress in Cross-border Financial TransactionsFrom 2010 to 2015, Asia’s intraregional cross-border asset holdings grew faster than total holdings.
Asia’s total cross-border asset holdings between 2010 and 2015 rose from $11.5 trillion to $14.6 trillion—a compounded annual growth
rate (CAGR) of 4.9%. Intraregional holdings increased 8.8% CAGR (Figure 4.1).14 Foreign direct investment (FDI) increased from $2.5 trillion to $3.6 trillion. It accounted for the largest share (39.4%) of intraregional holdings to total holdings in 2015. Still, given its much larger holdings of non-Asian assets, Asia remains more financially linked to the rest of the world (ROW) than to itself.
14 Throughout this section, Asia’s cross-border asset holdings refer to the stock of outbound portfolio debt, portfolio equity, and foreign direct investment (FDI), as well as cross-border bank claims. FDI stock data available only for 2009–2015.
17.4%21.8%
29.4% 31.4%
$11.5 trillion2010
Bank—$3.4 trillionIntraregional—16.3%
Debt—$3.6 trillionIntraregional—11.9%
FDI—$2.5 trillionIntraregional—35.3%
Equity—$2.0 trillionIntraregional—24.2%
24.9%
22.0%24.9%
28.2%$14.6 trillion
2015
Bank—$4.4 trillionIntraregional—22.1%
Debt—$3.6 trillionIntraregional—16.7%
FDI—$3.6 trillionIntraregional—39.4%
Equity—$3.2 trillionIntraregional—20.0%
Figure 4.1: Asia’s Cross-border Assets
FDI = foreign direct investment.Notes: FDI assets refer to outward FDI holdings. Bank assets refer to bank claims of Asian economies. Asia includes all 48 ADB regional members for which data are available as of December 2015.Sources: ADB calculations using data from International Monetary Fund. Coordinated Portfolio Investment Survey. http://cpis.imf.org (accessed September 2017); International Monetary Fund. Coordinated Direct Investment Survey. http://cdis.imf.org (accessed February 2017); and Bank for International Settlements. Locational Banking Statistics. https://www.bis.org/statistics/bankstats.htm (accessed May 2017).
During this period of uneven global economic recovery and diverging monetary policies in advanced economies, Asia’s intraregional share of total cross-border asset holdings increased over all asset classes—except for portfolio equities, which declined from 24.2% to 20.0%. The intraregional share of Asia’s cross-border debt asset holdings increased from 11.9% to 16.7%, but remained the smallest component. The share of intraregional bank claims increased to 22.1% in 2015 from 16.3% in 2010.
Growth in Asia’s cross-border liabilities outpaced growth in cross-border assets, underscoring the region’s continued investment attraction; the largest increase in share during 2010–2015 was in intraregional cross-border bank liabilities.
Asia’s total cross-border liability holdings increased from $11.5 trillion in 2010 to $15.1 trillion in 2015—a 5.6% CAGR (Figure 4.2). Intraregional holdings increased
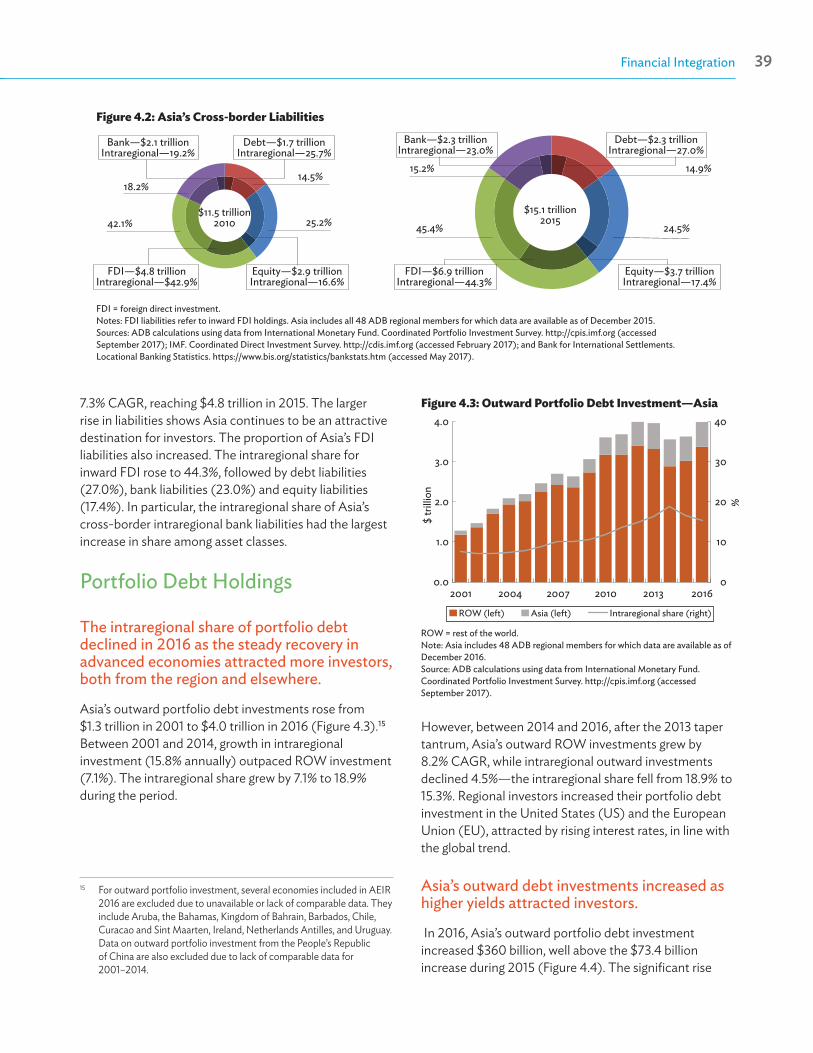
Asian Economic Integration Report 201738 Financial Integration 39
7.3% CAGR, reaching $4.8 trillion in 2015. The larger rise in liabilities shows Asia continues to be an attractive destination for investors. The proportion of Asia’s FDI liabilities also increased. The intraregional share for inward FDI rose to 44.3%, followed by debt liabilities (27.0%), bank liabilities (23.0%) and equity liabilities (17.4%). In particular, the intraregional share of Asia’s cross-border intraregional bank liabilities had the largest increase in share among asset classes.
Portfolio Debt Holdings
The intraregional share of portfolio debt declined in 2016 as the steady recovery in advanced economies attracted more investors, both from the region and elsewhere.
Asia’s outward portfolio debt investments rose from $1.3 trillion in 2001 to $4.0 trillion in 2016 (Figure 4.3).15 Between 2001 and 2014, growth in intraregional investment (15.8% annually) outpaced ROW investment (7.1%). The intraregional share grew by 7.1% to 18.9% during the period.
15 For outward portfolio investment, several economies included in AEIR 2016 are excluded due to unavailable or lack of comparable data. They include Aruba, the Bahamas, Kingdom of Bahrain, Barbados, Chile, Curacao and Sint Maarten, Ireland, Netherlands Antilles, and Uruguay. Data on outward portfolio investment from the People’s Republic of China are also excluded due to lack of comparable data for
2001–2014.
Bank—$2.1 trillionIntraregional—19.2%
Debt—$1.7 trillionIntraregional—25.7%
FDI—$4.8 trillionIntraregional—$42.9%
Equity—$2.9 trillionIntraregional—16.6%
14.5%
25.2%42.1%
18.2%
$11.5 trillion2010
Bank—$2.3 trillionIntraregional—23.0%
Debt—$2.3 trillionIntraregional—27.0%
FDI—$6.9 trillionIntraregional—44.3%
Equity—$3.7 trillionIntraregional—17.4%
14.9%
24.5%45.4%
15.2%
$15.1 trillion2015
Figure 4.2: Asia’s Cross-border Liabilities
FDI = foreign direct investment.Notes: FDI liabilities refer to inward FDI holdings. Asia includes all 48 ADB regional members for which data are available as of December 2015.Sources: ADB calculations using data from International Monetary Fund. Coordinated Portfolio Investment Survey. http://cpis.imf.org (accessed September 2017); IMF. Coordinated Direct Investment Survey. http://cdis.imf.org (accessed February 2017); and Bank for International Settlements. Locational Banking Statistics. https://www.bis.org/statistics/bankstats.htm (accessed May 2017).
However, between 2014 and 2016, after the 2013 taper tantrum, Asia’s outward ROW investments grew by 8.2% CAGR, while intraregional outward investments declined 4.5%—the intraregional share fell from 18.9% to 15.3%. Regional investors increased their portfolio debt investment in the United States (US) and the European Union (EU), attracted by rising interest rates, in line with the global trend.
Asia’s outward debt investments increased as higher yields attracted investors.
In 2016, Asia’s outward portfolio debt investment increased $360 billion, well above the $73.4 billion increase during 2015 (Figure 4.4). The significant rise
0
10
20
30
40
0.0
1.0
2.0
3.0
4.0
2001 2004 2007 2010 2013 2016
%
$ tr
illio
n
ROW (left) Asia (left) Intraregional share (right)
Figure 4.3: Outward Portfolio Debt Investment—Asia
ROW = rest of the world.Note: Asia includes 48 ADB regional members for which data are available as of December 2016.Source: ADB calculations using data from International Monetary Fund. Coordinated Portfolio Investment Survey. http://cpis.imf.org (accessed September 2017).

Asian Economic Integration Report 201740 Financial Integration 41
–600
–400
–200
0
200
400
2011 2012 2013 2014 2015 2016
Asia EU US ROW excludes the EU and the US Total
Figure 4.4: Change in Outward Portfolio Debt Investment—Asia ($ billion)
EU = European Union, ROW = rest of the world, US = United States.Note: Asia includes 48 ADB regional members for which data are available as of December 2016.Source: ADB calculations using data from International Monetary Fund. Coordinated Portfolio Investment Survey. http://cpis.imf.org (accessed September 2017).
derived from a trend reversal in outward investment with the EU and within Asia. Intraregional outward investment increased $5.8 billion—after decreasing $64.6 billion during 2015. Outward investment to the EU increased $109.6 billion—a sharp reversal from its $107.1 billion decrease in 2015.
In 2016, investors from Japan flocked to the region seeking higher-yielding bonds—particularly in Australia, New Zealand, Singapore, and Indonesia. Japan, together with Australia, was also a primary contributor to the
Table 4.1: Destinations for Asia’s Outward Portfolio Debt Investment ($ billion)
2016 2011 **
Asia
Australia 171 (4.3%) 188 (5.1%)
People’s Republic of China 148 (3.7%) 89 (2.4%)
Japan 68 (1.7%) 38 (1.0%)
Other Asia 226 (5.7%) 189 (5.1%)
Asia’s outward portfolio debt investment to Asia 613 (15.3%) 503 (13.6%)
Non-Asia
United States 1,621 (40.6%) 1,144 (31.0%)
European Union 1,034 (25.9%) 1,089 (29.5%)
Cayman Islands 205 (5.1%) 476 (12.9%)
Other non-Asia 521 (13.0%) 477 (12.9%)
Asia’s outward portfolio debt investment to non-Asia 3,381 (84.7%) 3,185 (86.4%)
Asia’s total outward portfolio debt investment 3,994 (100.0%) 3,688 (100.0%)
** = direction of change in the shares to total, = decrease, = increase.Source: ADB calculations using data from International Monetary Fund. Coordinated Portfolio Investment Survey. http://cpis.imf.org (accessed September 2017).
increase in Asia’s outward debt investment to the EU—Japan’s EU investments increased $41.3 billion in 2016 after declining $74.0 billion in 2015. EU bonds, especially French bonds, are higher yielding than Japanese bonds (Reuters 2016).
While investors across the region contributed to the $233.8 billion rise in Asia’s outward investment to the US, Japan contributed most—$168.5 billion.
The US remains top destination for Asia’s outward portfolio debt investment and is increasing its share coinciding with US monetary policy normalization— the US share rose from 31.0% in 2011 to 40.6% in 2016 (Table 4.1).
In Asia, while Australia, the People’s Republic of China (PRC), and Japan remain top destinations for outward portfolio debt investment, other Asian economies are seeing their share rise as well—from 5.1% in 2011 to 5.7% in 2016. Singapore; Hong Kong, China; and Indonesia were among the fastest growing destinations for Asia’s outward portfolio debt investment.
The increase in the proportion of Asia’s total outward portfolio debt investment to the PRC and Japan drove East Asia’s share up from 42.2% in 2011 to 48.1% in 2016 (Figure 4.5). Southeast Asia’s share rose from 12.5% in 2011 to 16.7% in 2016 as Singapore (as a financial hub) continued to grow along with investment to Indonesia

Asian Economic Integration Report 201740 Financial Integration 41
and Malaysia. East Asia remained the top source of Asia’s intraregional portfolio debt investment in 2016 (70.9%), despite dropping from 2011 (72.0%). Southeast Asia, the second top investment source, saw its share decrease from 24.8% in 2011 to 23.4% in 2016.
By economy, the top sources of Asia’s intraregional portfolio debt investment in 2016 were the ASEAN+3 financial centers—Hong Kong, China; Japan; and Singapore (Table 4.2). However, the share of Hong Kong, China’s portfolio debt investments to the PRC fell dramatically—from 80.4% in 2011 to 54.8% in 2016. Outside Asia, the EU, the US, and international
Figure 4.5: Asia’s Intraregional Portfolio Debt Investment by Subregion (%)
Note: Numbers in parentheses are total investments (in $ billion) from the respective subregions. Source: ADB calculation using data from International Monetary Fund. Coordinated Portfolio Investment Survey. http://cpis.imf.org (accessed September 2017).
Destination
0 25 50 75 100
Central Asia
South Asia
The Pacific and Oceania
Southeast Asia
East Asia
Total-Asia
b: 2016
0 25 50 75 100
Central Asia
South Asia
The Pacific and Oceania
Southeast Asia
East Asia
Total-Asia
Source Destinationa: 2011
(362.5)
(124.8)
(11.8)
(0.1)
(4.1)
(434.5)
(143.1)
(26.4)
(0.6)
(8.1)
(612.6)(503.2)
East AsiaDestination: Southeast Asia The Pacific and Oceania South Asia
Source
Table 4.2: Sources of Asia’s Inward Portfolio Debt Investment ($ billion)
2016 2011 **
Asia
Hong Kong, China 226 (10.1%) 181 (9.5%)
Japan 187 (8.4%) 178 (9.3%)
Singapore 111 (5.0%) 104 (5.5%)
Other Asia 89 (4.0%) 40 (2.1%)
Asia’s inward portfolio debt investment from Asia 613 (27.4%) 503 (26.4%)
Non-Asia
European Union 645 (28.9%) 555 (29.1%)
United States 438 (19.6%) 416 (21.8%)
International Organizations 260 (11.6%) 322 (16.9%)
Other non-Asia 277 (12.4%) 110 (5.8%)
Asia’s inward portfolio debt investment from non-Asia 1,619 (72.6%) 1,403 (73.6%)
Asia’s total inward portfolio debt investment 2,232 (100.0%) 1,906 (100.0%)
** = direction of change in the share to total, = decrease, = increase.Source: ADB calculations using data from International Monetary Fund. Coordinated Portfolio Investment Survey. http://cpis.imf.org (accessed September 2017).
organizations remained top sources for inward portfolio debt investment to Asia. Despite a drop in non-Asia’s relative share of inward portfolio debt investment—from 73.6% in 2011 to 72.6% in 2016—non-Asian economies remained the primary source of Asia’s inward portfolio debt investment.
Asia’s inward portfolio debt investment increased dramatically, from $410.5 billion in 2001 to $2.2 trillion in 2015 (Figure 4.6). In 2015, low-yielding debt securities in the EU and the US drove investors from non-Asian economies toward Asia’s portfolio debt markets—investment rose from $1.54 trillion in 2014 to

Asian Economic Integration Report 201742 Financial Integration 43
0
10
20
30
40
0.0
1.0
2.0
3.0
4.0
2001 2004 2007 2010 2013 2016
%
$ tr
illio
n
ROW (left) Asia (left) Intraregional share (right)
Figure 4.6: Asia’s Inward Portfolio Debt Investment—Asia
ROW = rest of the world.Note: Asia includes 48 ADB regional members for which data are available as of December 2016.Source: ADB calculations using data from International Monetary Fund, Coordinated Portfolio Investment Survey. http://cpis.imf.org (accessed September 2017).
$1.64 trillion in 2015. Higher US yields drove investment to Asia down slightly—from $1.64 trillion to $1.62 trillion in 2016. Intraregional investment rose to $612.6 billion as Japanese investors sought securities with higher yields than domestic debt. This increased Asia’s intraregional share to 27.5%.
Asia’s inward portfolio debt investment decreased $13.9 billion in 2016—a reversal from its $28.8 billion increase in 2015 (Figure 4.7)—as a result of a drastic increase in Cayman Island investment in 2015.
-200
0
200
400
2011 2012 2013 2014 2015 2016
Asia EU US ROW excludes the EU and the US Total
Figure 4.7: Change in Inward Portfolio Debt Investment—Asia ($ billion)
EU = European Union, ROW = rest of the world, US = United States.Note: Asia includes 48 ADB regional members for which data are available as of December 2016.Source: ADB calculations using data from International Monetary Fund. Coordinated Portfolio Investment Survey. http://cpis.imf.org (accessed September 2017).
The United Kingdom drove much of the EU change in debt investment toward Asia, increasing its investments in Japan ($48.7 billion). The increased inward portfolio debt investment from the US in 2016 ($18.0 billion) also had much of it invested in Japan ($46.6 billion), coinciding with Japan’s economic recovery. Moreover, the $77.6 billion decrease in inward portfolio debt investment into Asia, particularly the ROW excluding the EU and the US, was due to the region’s relative local currency depreciation (or slowed appreciation)—triggered by the expected series of US interest rate hikes in 2016.
Portfolio Equity Holdings
In 2016, Japan’s appetite for non-regional equity markets led to a decline in intraregional share of portfolio equity investments and an increase in Asia’s linkage to the ROW.
Asia’s outward portfolio equity investment increased from $3.2 trillion in 2015 to $3.5 trillion in 2016—its highest level since 2001 (Figure 4.8). The increase was largely to the ROW—from $2.6 trillion to $2.8 trillion. Much of the increase can be traced to Japan, which held $1.3 trillion in outward portfolio equity securities of non-Asian economies in 2016, up from $1.2 trillion in 2015. Intraregional outward portfolio equity investment rose from $644.0 billion in 2015 to $666.4 billion in
0
10
20
30
40
0
1
2
3
4
2001 2004 2007 2010 2013 2016
%
$ tr
illio
n
ROW (left) Asia (left) Intraregional share (right)
Figure 4.8: Outward Portfolio Equity Investment—Asia
ROW = rest of the world.Note: Asia includes 48 ADB regional members for which data are available as of December 2016.Source: ADB calculations using data from International Monetary Fund. Coordinated Portfolio Investment Survey. http://cpis.imf.org (accessed September 2017).

Asian Economic Integration Report 201742 Financial Integration 43
2016. However, Asia’s intraregional share dropped from 20.0% in 2015 to 19.0% in 2016, given its growing linkage to the ROW. By comparison, the EU’s intraregional share remained significantly above Asia’s (51.0%), down from 2015 (52.7%). While intraregional shares in Latin America and the Middle East both declined from 2015 to 2016, North America’s intraregional share increased (from 16.9% to 19.4%).
Intraregional outward portfolio equity investment rose in 2016 due to larger investments to the PRC and Hong Kong, China.
Asia’s outward portfolio equity investment in 2016 rose by $289.2 billion, well above the $128.0 billion increase in 2015 (Figure 4.9). While primarily due to Japan’s higher investment in the Cayman Islands and the US—by $59.2 billion and $56.0 billion respectively—the increase in Hong Kong, China investment to the Cayman Islands ($50.3 billion) also contributed to the significant rise in Asia’s outward portfolio equity investment during the year.16 Intraregional investment likewise rose $22.4 billion in 2016, due to an increase in outward portfolio equity investment to Hong Kong, China from the PRC ($26.3 billion) and to the PRC from Hong Kong, China ($16.4 billion).
16 The Cayman Islands is one of the largest offshore financial centers, acting as conduit for large international financial institutions to reduce taxes and evade onshore regulations. Investors from Asia, particularly Japan, use the Cayman Islands to indirectly access US financial markets (Fichtner 2016).
–200
0
200
400
600
2011 2012 2013 2014 2015 2016
USAsia EU ROW excludes the EU and the US Total
Figure 4.9: Change in Outward Portfolio Equity Investment—Asia ($ billion)
EU = European Union, ROW = rest of the world, US = United States.Note: Asia includes 48 ADB regional members for which data are available as of December 2016.Source: ADB calculations using data from International Monetary Fund. Coordinated Portfolio Investment Survey. http://cpis.imf.org (accessed September 2017).
From 2011 to 2016, Asia’s outward portfolio equity investment remained skewed toward the ROW than the region; unlike outward portfolio debt investment, its share of outward portfolio equity investment to non-Asian economies rose from 77.3% in 2011 to 81.0% in 2016.
The PRC remained top destination for Asia’s intraregional outward portfolio equity investment (Table 4.3). The decline in intraregional share was mainly due to an increase in relative share of investment going to the Cayman Islands—from 14.6% in 2011 to 26.2% in 2016. Hong Kong, China—aside from Japan—was a major source of outward portfolio equity investment to the Cayman Islands, whose stocks are allowed to list on Hong Kong Exchanges and Clearing, Ltd. The US and the EU, along with the Cayman Islands, were the most popular destinations for Asia’s outward portfolio equity investment in 2016, with much of the investment coming from Japan.
In 2016, East Asia remained top destination for intraregional portfolio equity investment (70.9%) (Figure 4.10). Southeast Asia’s intraregional share inched up from 12.1% in 2011 to 12.2% in 2016. South Asia’s share also rose (from 4.5% to 6.6%) due to increased investments in Pakistan and Nepal. East Asia remained the top source of intraregional portfolio equity investment, although its share slightly declined in 2016 (54.0%) from 2011 (54.2%). Southeast Asia’s relative share as source of intraregional equity investments increased to 35.0% from 32.6% during the same period.
Asia continued to depend on portfolio equity investment from outside the region.
Similar to inward portfolio debt investment, the region’s financial centers—Hong Kong, China; Singapore; and Japan—remained the top sources of inward portfolio equity investment (Table 4.4). Asia continues to depend on portfolio equity investment from the ROW. Despite a decline in Asia’s portfolio equity investment share from the EU between 2011 and 2016 (from 26.6% to 23.6%), the EU remained ranked second behind the US—which saw its share dip slightly (from 44.4% to 44.2%).
Asia’s inward portfolio equity investment increased from $653.8 billion in 2001 to $3.9 trillion in 2016 (Figure 4.11). The increase was driven by higher
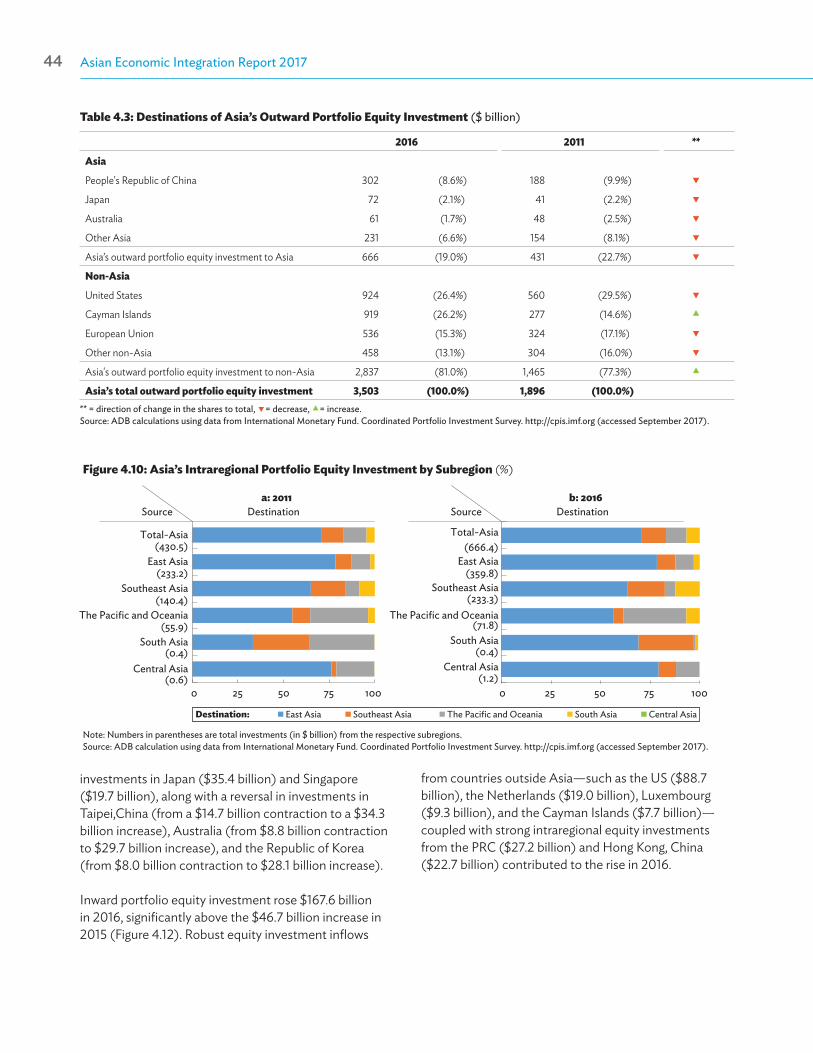
Asian Economic Integration Report 201744 Financial Integration 45
Figure 4.10: Asia’s Intraregional Portfolio Equity Investment by Subregion (%)
Note: Numbers in parentheses are total investments (in $ billion) from the respective subregions. Source: ADB calculation using data from International Monetary Fund. Coordinated Portfolio Investment Survey. http://cpis.imf.org (accessed September 2017).
Central Asia
South Asia
Southeast Asia
East Asia
Total-Asia
0 25 50 75 100
Central Asia
South Asia
The Pacific and Oceania The Pacific and Oceania
Southeast Asia
East Asia
Total-Asia
a: 2011
(233.2)
(140.4)
(55.9)
(0.4)
(0.6)
(359.8)
(233.3)
(71.8)
(0.4)
(1.2)
(666.4)(430.5)
Source Destination
0 25 50 75 100
Destination: East Asia Southeast Asia The Pacific and Oceania South Asia Central Asia
b: 2016Source Destination
investments in Japan ($35.4 billion) and Singapore ($19.7 billion), along with a reversal in investments in Taipei,China (from a $14.7 billion contraction to a $34.3 billion increase), Australia (from $8.8 billion contraction to $29.7 billion increase), and the Republic of Korea (from $8.0 billion contraction to $28.1 billion increase).
Inward portfolio equity investment rose $167.6 billion in 2016, significantly above the $46.7 billion increase in 2015 (Figure 4.12). Robust equity investment inflows
Table 4.3: Destinations of Asia’s Outward Portfolio Equity Investment ($ billion)
2016 2011 **
Asia
People's Republic of China 302 (8.6%) 188 (9.9%)
Japan 72 (2.1%) 41 (2.2%)
Australia 61 (1.7%) 48 (2.5%)
Other Asia 231 (6.6%) 154 (8.1%)
Asia’s outward portfolio equity investment to Asia 666 (19.0%) 431 (22.7%)
Non-Asia
United States 924 (26.4%) 560 (29.5%)
Cayman Islands 919 (26.2%) 277 (14.6%)
European Union 536 (15.3%) 324 (17.1%)
Other non-Asia 458 (13.1%) 304 (16.0%)
Asia's outward portfolio equity investment to non-Asia 2,837 (81.0%) 1,465 (77.3%)
Asia’s total outward portfolio equity investment 3,503 (100.0%) 1,896 (100.0%) ** = direction of change in the shares to total, = decrease, = increase.Source: ADB calculations using data from International Monetary Fund. Coordinated Portfolio Investment Survey. http://cpis.imf.org (accessed September 2017).
from countries outside Asia—such as the US ($88.7 billion), the Netherlands ($19.0 billion), Luxembourg ($9.3 billion), and the Cayman Islands ($7.7 billion)—coupled with strong intraregional equity investments from the PRC ($27.2 billion) and Hong Kong, China ($22.7 billion) contributed to the rise in 2016.
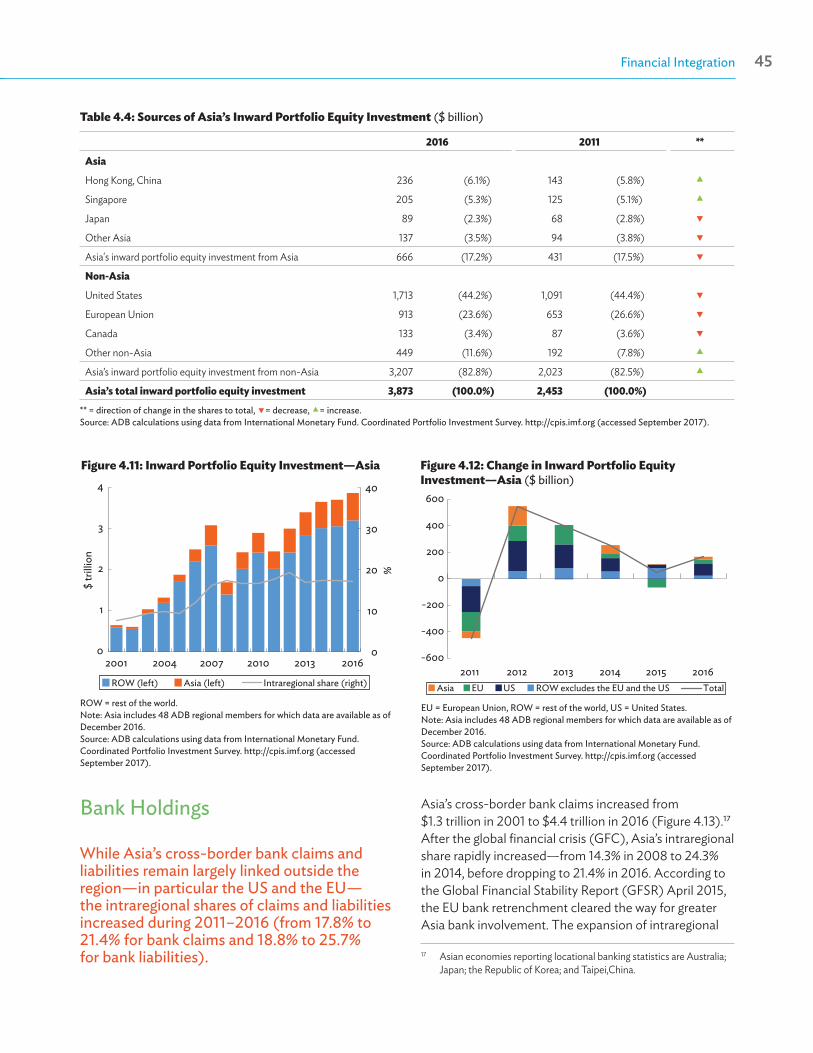
Asian Economic Integration Report 201744 Financial Integration 45
Table 4.4: Sources of Asia’s Inward Portfolio Equity Investment ($ billion)
2016 2011 **
Asia
Hong Kong, China 236 (6.1%) 143 (5.8%)
Singapore 205 (5.3%) 125 (5.1%)
Japan 89 (2.3%) 68 (2.8%)
Other Asia 137 (3.5%) 94 (3.8%)
Asia's inward portfolio equity investment from Asia 666 (17.2%) 431 (17.5%)
Non-Asia
United States 1,713 (44.2%) 1,091 (44.4%)
European Union 913 (23.6%) 653 (26.6%)
Canada 133 (3.4%) 87 (3.6%)
Other non-Asia 449 (11.6%) 192 (7.8%)
Asia’s inward portfolio equity investment from non-Asia 3,207 (82.8%) 2,023 (82.5%)
Asia’s total inward portfolio equity investment 3,873 (100.0%) 2,453 (100.0%)
** = direction of change in the shares to total, = decrease, = increase.Source: ADB calculations using data from International Monetary Fund. Coordinated Portfolio Investment Survey. http://cpis.imf.org (accessed September 2017).
Figure 4.11: Inward Portfolio Equity Investment—Asia
ROW = rest of the world.Note: Asia includes 48 ADB regional members for which data are available as of December 2016.Source: ADB calculations using data from International Monetary Fund. Coordinated Portfolio Investment Survey. http://cpis.imf.org (accessed September 2017).
0
10
20
30
40
0
1
2
3
4
2001 2004 2007 2010 2013 2016
%
$ tr
illio
n
ROW (left) Asia (left) Intraregional share (right)
Figure 4.12: Change in Inward Portfolio Equity Investment—Asia ($ billion)
EU = European Union, ROW = rest of the world, US = United States.Note: Asia includes 48 ADB regional members for which data are available as of December 2016.Source: ADB calculations using data from International Monetary Fund. Coordinated Portfolio Investment Survey. http://cpis.imf.org (accessed September 2017).
-600
-400
-200
0
200
400
600
2011 2012 2013 2014 2015 2016TotalAsia EU US ROW excludes the EU and the US
Bank Holdings
While Asia’s cross-border bank claims and liabilities remain largely linked outside the region—in particular the US and the EU— the intraregional shares of claims and liabilities increased during 2011–2016 (from 17.8% to 21.4% for bank claims and 18.8% to 25.7% for bank liabilities).
Asia’s cross-border bank claims increased from $1.3 trillion in 2001 to $4.4 trillion in 2016 (Figure 4.13).17 After the global financial crisis (GFC), Asia’s intraregional share rapidly increased—from 14.3% in 2008 to 24.3% in 2014, before dropping to 21.4% in 2016. According to the Global Financial Stability Report (GFSR) April 2015, the EU bank retrenchment cleared the way for greater Asia bank involvement. The expansion of intraregional
17 Asian economies reporting locational banking statistics are Australia; Japan; the Republic of Korea; and Taipei,China.
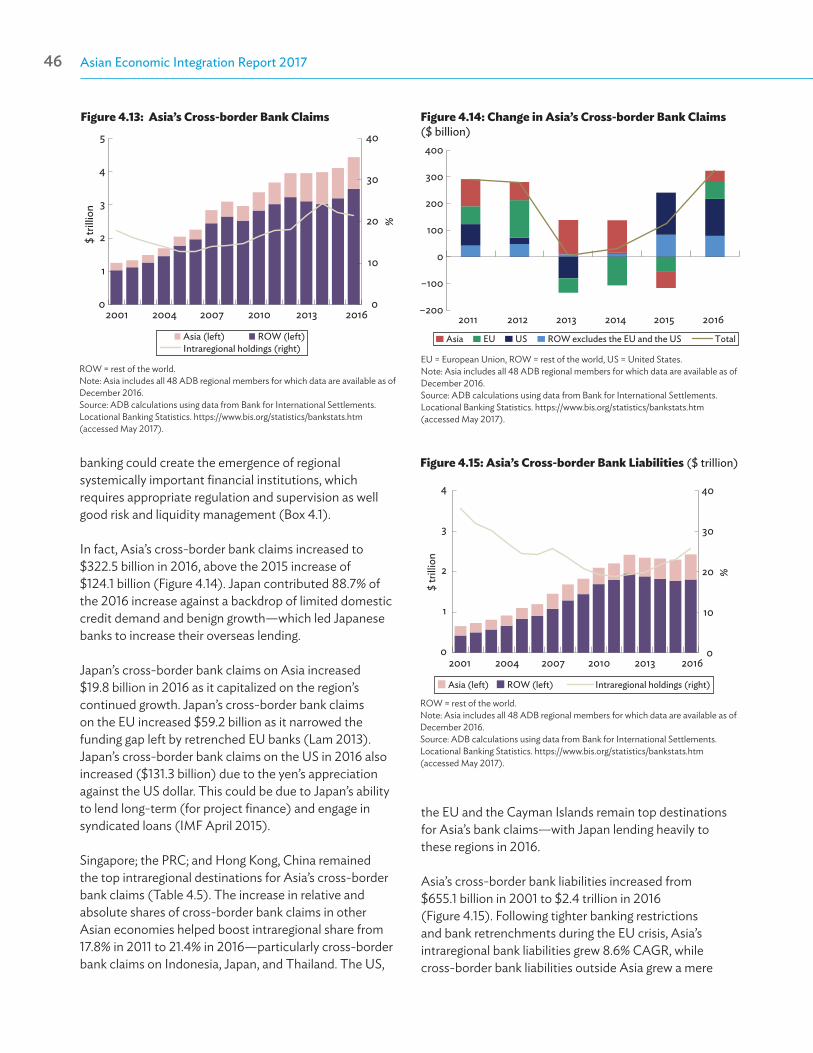
Asian Economic Integration Report 201746 Financial Integration 47
0
10
20
30
40
0
1
2
3
4
5
2001 2004 2007 2010 2013 2016
Asia (left) ROW (left)Intraregional holdings (right)
$ tr
illio
n
%
Figure 4.13: Asia’s Cross-border Bank Claims
ROW = rest of the world.Note: Asia includes all 48 ADB regional members for which data are available as of December 2016.Source: ADB calculations using data from Bank for International Settlements. Locational Banking Statistics. https://www.bis.org/statistics/bankstats.htm (accessed May 2017).
banking could create the emergence of regional systemically important financial institutions, which requires appropriate regulation and supervision as well good risk and liquidity management (Box 4.1).
In fact, Asia’s cross-border bank claims increased to $322.5 billion in 2016, above the 2015 increase of $124.1 billion (Figure 4.14). Japan contributed 88.7% of the 2016 increase against a backdrop of limited domestic credit demand and benign growth—which led Japanese banks to increase their overseas lending.
Japan’s cross-border bank claims on Asia increased $19.8 billion in 2016 as it capitalized on the region’s continued growth. Japan’s cross-border bank claims on the EU increased $59.2 billion as it narrowed the funding gap left by retrenched EU banks (Lam 2013). Japan’s cross-border bank claims on the US in 2016 also increased ($131.3 billion) due to the yen’s appreciation against the US dollar. This could be due to Japan’s ability to lend long-term (for project finance) and engage in syndicated loans (IMF April 2015).
Singapore; the PRC; and Hong Kong, China remained the top intraregional destinations for Asia’s cross-border bank claims (Table 4.5). The increase in relative and absolute shares of cross-border bank claims in other Asian economies helped boost intraregional share from 17.8% in 2011 to 21.4% in 2016—particularly cross-border bank claims on Indonesia, Japan, and Thailand. The US,
the EU and the Cayman Islands remain top destinations for Asia’s bank claims—with Japan lending heavily to these regions in 2016.
Asia’s cross-border bank liabilities increased from$655.1 billion in 2001 to $2.4 trillion in 2016 (Figure 4.15). Following tighter banking restrictions and bank retrenchments during the EU crisis, Asia’s intraregional bank liabilities grew 8.6% CAGR, while cross-border bank liabilities outside Asia grew a mere
–200
–100
0
100
200
300
400
2011 2012 2013 2014 2015 2016
Asia EU US ROW excludes the EU and the US Total
Figure 4.14: Change in Asia’s Cross-border Bank Claims ($ billion)
EU = European Union, ROW = rest of the world, US = United States.Note: Asia includes all 48 ADB regional members for which data are available as of December 2016.Source: ADB calculations using data from Bank for International Settlements. Locational Banking Statistics. https://www.bis.org/statistics/bankstats.htm (accessed May 2017).
Figure 4.15: Asia’s Cross-border Bank Liabilities ($ trillion)
ROW = rest of the world.Note: Asia includes all 48 ADB regional members for which data are available as of December 2016.Source: ADB calculations using data from Bank for International Settlements. Locational Banking Statistics. https://www.bis.org/statistics/bankstats.htm (accessed May 2017).
0
10
20
30
40
0
1
2
3
4
2001 2004 2007 2010 2013 2016
Asia (left) ROW (left) Intraregional holdings (right)
$ tr
illio
n
%
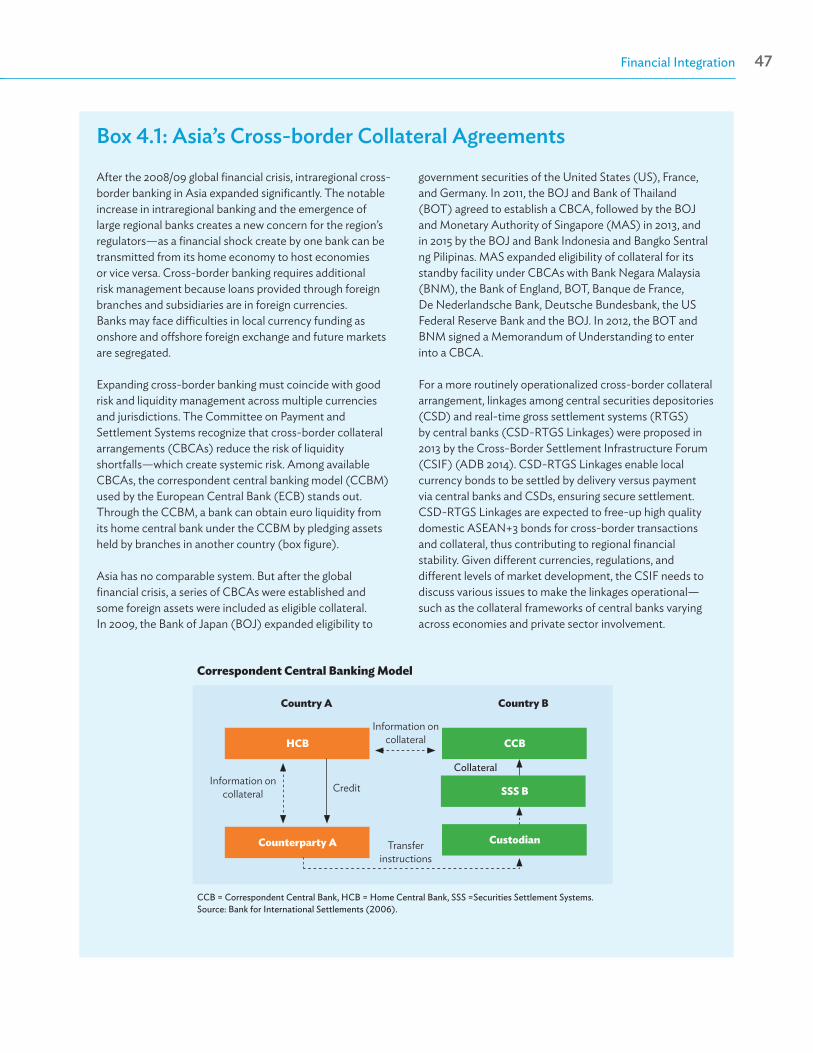
Asian Economic Integration Report 201746 Financial Integration 47
Box 4.1: Asia’s Cross-border Collateral Agreements
After the 2008/09 global financial crisis, intraregional cross-border banking in Asia expanded significantly. The notable increase in intraregional banking and the emergence of large regional banks creates a new concern for the region’s regulators—as a financial shock create by one bank can be transmitted from its home economy to host economies or vice versa. Cross-border banking requires additional risk management because loans provided through foreign branches and subsidiaries are in foreign currencies. Banks may face difficulties in local currency funding as onshore and offshore foreign exchange and future markets are segregated.
Expanding cross-border banking must coincide with good risk and liquidity management across multiple currencies and jurisdictions. The Committee on Payment and Settlement Systems recognize that cross-border collateral arrangements (CBCAs) reduce the risk of liquidity shortfalls—which create systemic risk. Among available CBCAs, the correspondent central banking model (CCBM) used by the European Central Bank (ECB) stands out. Through the CCBM, a bank can obtain euro liquidity from its home central bank under the CCBM by pledging assets held by branches in another country (box figure).
Asia has no comparable system. But after the global financial crisis, a series of CBCAs were established and some foreign assets were included as eligible collateral. In 2009, the Bank of Japan (BOJ) expanded eligibility to
government securities of the United States (US), France, and Germany. In 2011, the BOJ and Bank of Thailand (BOT) agreed to establish a CBCA, followed by the BOJ and Monetary Authority of Singapore (MAS) in 2013, and in 2015 by the BOJ and Bank Indonesia and Bangko Sentral ng Pilipinas. MAS expanded eligibility of collateral for its standby facility under CBCAs with Bank Negara Malaysia (BNM), the Bank of England, BOT, Banque de France, De Nederlandsche Bank, Deutsche Bundesbank, the US Federal Reserve Bank and the BOJ. In 2012, the BOT and BNM signed a Memorandum of Understanding to enter into a CBCA.
For a more routinely operationalized cross-border collateral arrangement, linkages among central securities depositories (CSD) and real-time gross settlement systems (RTGS) by central banks (CSD-RTGS Linkages) were proposed in 2013 by the Cross-Border Settlement Infrastructure Forum (CSIF) (ADB 2014). CSD-RTGS Linkages enable local currency bonds to be settled by delivery versus payment via central banks and CSDs, ensuring secure settlement. CSD-RTGS Linkages are expected to free-up high quality domestic ASEAN+3 bonds for cross-border transactions and collateral, thus contributing to regional financial stability. Given different currencies, regulations, and different levels of market development, the CSIF needs to discuss various issues to make the linkages operational—such as the collateral frameworks of central banks varying across economies and private sector involvement.
Country A Country B
HCB
Information oncollateral
Information oncollateral
Transferinstructions
Credit
Counterparty A Custodian
Correspondent Central Banking Model
CCB = Correspondent Central Bank, HCB = Home Central Bank, SSS =Securities Settlement Systems.Source: Bank for International Settlements (2006).
SSS B
CCB
Collateral
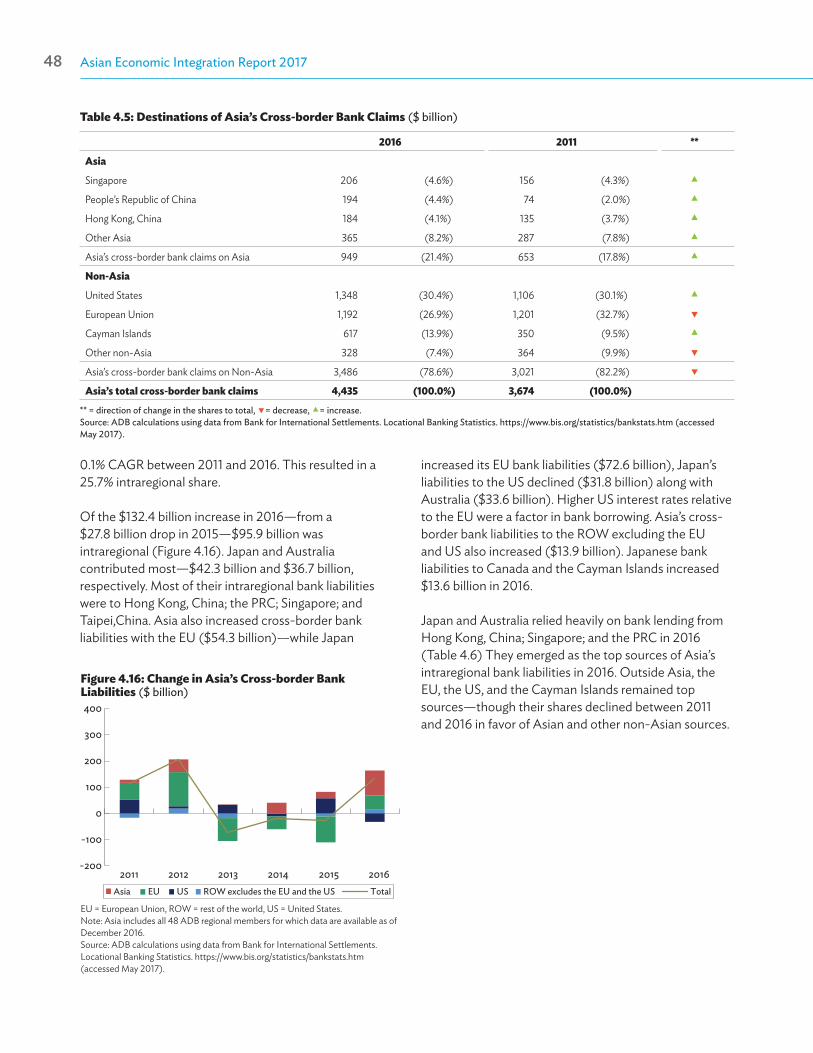
Asian Economic Integration Report 201748 Financial Integration 49
Table 4.5: Destinations of Asia’s Cross-border Bank Claims ($ billion)
2016 2011 **
Asia
Singapore 206 (4.6%) 156 (4.3%)
People’s Republic of China 194 (4.4%) 74 (2.0%)
Hong Kong, China 184 (4.1%) 135 (3.7%)
Other Asia 365 (8.2%) 287 (7.8%)
Asia’s cross-border bank claims on Asia 949 (21.4%) 653 (17.8%)
Non-Asia
United States 1,348 (30.4%) 1,106 (30.1%)
European Union 1,192 (26.9%) 1,201 (32.7%)
Cayman Islands 617 (13.9%) 350 (9.5%)
Other non-Asia 328 (7.4%) 364 (9.9%)
Asia’s cross-border bank claims on Non-Asia 3,486 (78.6%) 3,021 (82.2%)
Asia’s total cross-border bank claims 4,435 (100.0%) 3,674 (100.0%)
** = direction of change in the shares to total, = decrease, = increase.Source: ADB calculations using data from Bank for International Settlements. Locational Banking Statistics. https://www.bis.org/statistics/bankstats.htm (accessed May 2017).
0.1% CAGR between 2011 and 2016. This resulted in a 25.7% intraregional share.
Of the $132.4 billion increase in 2016—from a $27.8 billion drop in 2015—$95.9 billion was intraregional (Figure 4.16). Japan and Australia contributed most—$42.3 billion and $36.7 billion, respectively. Most of their intraregional bank liabilities were to Hong Kong, China; the PRC; Singapore; and Taipei,China. Asia also increased cross-border bank liabilities with the EU ($54.3 billion)—while Japan
Figure 4.16: Change in Asia’s Cross-border Bank Liabilities ($ billion)
EU = European Union, ROW = rest of the world, US = United States.Note: Asia includes all 48 ADB regional members for which data are available as of December 2016.Source: ADB calculations using data from Bank for International Settlements. Locational Banking Statistics. https://www.bis.org/statistics/bankstats.htm (accessed May 2017).
-200
-100
0
100
200
300
400
2011 2012 2013 2014 2015 2016Asia EU US ROW excludes the EU and the US Total
increased its EU bank liabilities ($72.6 billion), Japan’s liabilities to the US declined ($31.8 billion) along with Australia ($33.6 billion). Higher US interest rates relative to the EU were a factor in bank borrowing. Asia’s cross-border bank liabilities to the ROW excluding the EU and US also increased ($13.9 billion). Japanese bank liabilities to Canada and the Cayman Islands increased $13.6 billion in 2016.
Japan and Australia relied heavily on bank lending from Hong Kong, China; Singapore; and the PRC in 2016 (Table 4.6) They emerged as the top sources of Asia’s intraregional bank liabilities in 2016. Outside Asia, the EU, the US, and the Cayman Islands remained top sources—though their shares declined between 2011 and 2016 in favor of Asian and other non-Asian sources.
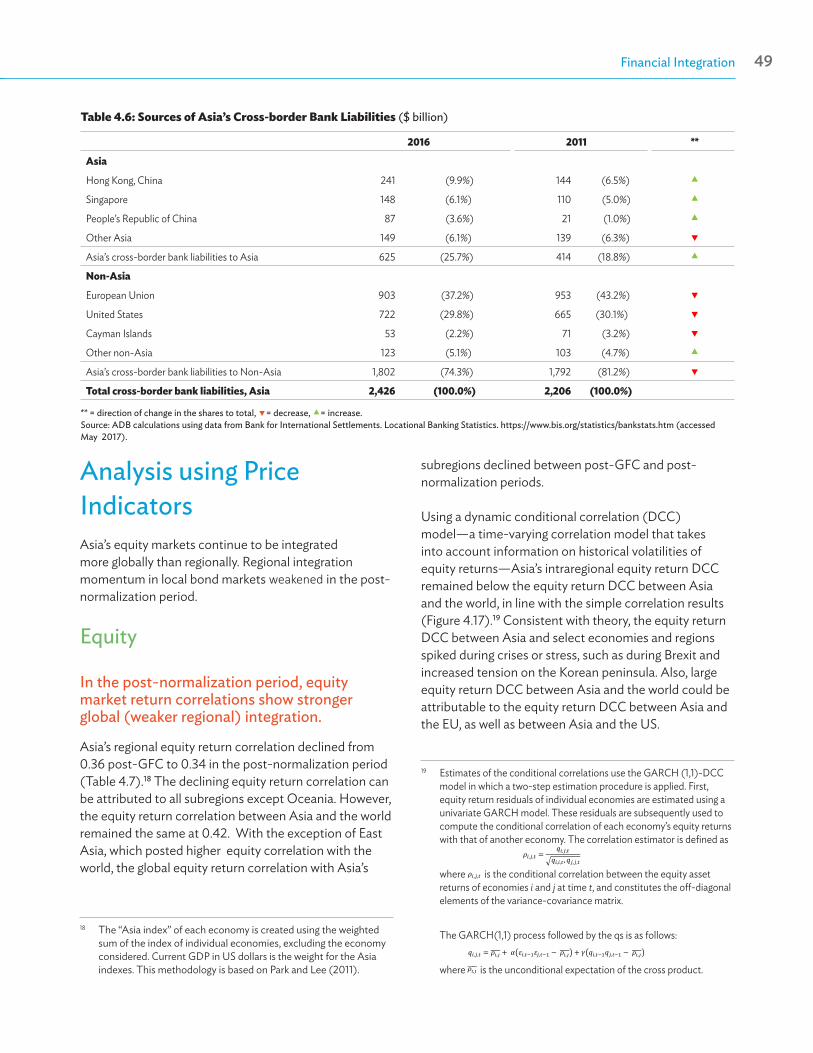
Asian Economic Integration Report 201748 Financial Integration 49
Table 4.6: Sources of Asia’s Cross-border Bank Liabilities ($ billion)
2016 2011 **
Asia
Hong Kong, China 241 (9.9%) 144 (6.5%)
Singapore 148 (6.1%) 110 (5.0%)
People’s Republic of China 87 (3.6%) 21 (1.0%)
Other Asia 149 (6.1%) 139 (6.3%)
Asia’s cross-border bank liabilities to Asia 625 (25.7%) 414 (18.8%)
Non-Asia
European Union 903 (37.2%) 953 (43.2%)
United States 722 (29.8%) 665 (30.1%)
Cayman Islands 53 (2.2%) 71 (3.2%)
Other non-Asia 123 (5.1%) 103 (4.7%)
Asia’s cross-border bank liabilities to Non-Asia 1,802 (74.3%) 1,792 (81.2%)
Total cross-border bank liabilities, Asia 2,426 (100.0%) 2,206 (100.0%)
** = direction of change in the shares to total, = decrease, = increase.Source: ADB calculations using data from Bank for International Settlements. Locational Banking Statistics. https://www.bis.org/statistics/bankstats.htm (accessed May 2017).
Analysis using Price IndicatorsAsia’s equity markets continue to be integrated more globally than regionally. Regional integration momentum in local bond markets weakened in the post-normalization period.
Equity
In the post-normalization period, equity market return correlations show stronger global (weaker regional) integration.
Asia’s regional equity return correlation declined from 0.36 post-GFC to 0.34 in the post-normalization period (Table 4.7).18 The declining equity return correlation can be attributed to all subregions except Oceania. However, the equity return correlation between Asia and the world remained the same at 0.42. With the exception of East Asia, which posted higher equity correlation with the world, the global equity return correlation with Asia’s
18 The “Asia index” of each economy is created using the weighted sum of the index of individual economies, excluding the economy considered. Current GDP in US dollars is the weight for the Asia indexes. This methodology is based on Park and Lee (2011).
subregions declined between post-GFC and post-normalization periods.
Using a dynamic conditional correlation (DCC) model—a time-varying correlation model that takes into account information on historical volatilities of equity returns—Asia’s intraregional equity return DCC remained below the equity return DCC between Asia and the world, in line with the simple correlation results (Figure 4.17).19 Consistent with theory, the equity return DCC between Asia and select economies and regions spiked during crises or stress, such as during Brexit and increased tension on the Korean peninsula. Also, large equity return DCC between Asia and the world could be attributable to the equity return DCC between Asia and the EU, as well as between Asia and the US.
19 Estimates of the conditional correlations use the GARCH (1,1)-DCC model in which a two-step estimation procedure is applied. First, equity return residuals of individual economies are estimated using a univariate GARCH model. These residuals are subsequently used to compute the conditional correlation of each economy’s equity returns with that of another economy. The correlation estimator is defined as
where is the conditional correlation between the equity asset returns of economies i and j at time t, and constitutes the off-diagonal elements of the variance-covariance matrix.
The GARCH(1,1) process followed by the qs is as follows:
where is the unconditional expectation of the cross product.
𝜌𝜌𝑖𝑖,𝑗𝑗,𝑡𝑡 =𝑞𝑞𝑖𝑖,𝑗𝑗,𝑡𝑡
√𝑞𝑞𝑖𝑖,𝑖𝑖,𝑡𝑡, 𝑞𝑞𝑗𝑗,𝑗𝑗,𝑡𝑡
𝜌𝜌𝑖𝑖,𝑗𝑗,𝑡𝑡
𝑞𝑞𝑖𝑖,𝑗𝑗,𝑡𝑡 = 𝜌𝜌𝑖𝑖,𝑗𝑗̅̅ ̅̅ + 𝛼𝛼(𝜀𝜀𝑖𝑖,𝑡𝑡−1𝜀𝜀𝑗𝑗,𝑡𝑡−1 − 𝜌𝜌𝑖𝑖,𝑗𝑗̅̅ ̅̅ ) + 𝛾𝛾(𝑞𝑞𝑖𝑖,𝑡𝑡−1𝑞𝑞𝑗𝑗,𝑡𝑡−1 − 𝜌𝜌𝑖𝑖,𝑗𝑗̅̅ ̅̅ )
𝜌𝜌𝑖𝑖,𝑗𝑗̅̅ ̅̅
𝜌𝜌𝑖𝑖,𝑗𝑗,𝑡𝑡 =𝑞𝑞𝑖𝑖,𝑗𝑗,𝑡𝑡
√𝑞𝑞𝑖𝑖,𝑖𝑖,𝑡𝑡, 𝑞𝑞𝑗𝑗,𝑗𝑗,𝑡𝑡
𝜌𝜌𝑖𝑖,𝑗𝑗,𝑡𝑡
𝑞𝑞𝑖𝑖,𝑗𝑗,𝑡𝑡 = 𝜌𝜌𝑖𝑖,𝑗𝑗̅̅ ̅̅ + 𝛼𝛼(𝜀𝜀𝑖𝑖,𝑡𝑡−1𝜀𝜀𝑗𝑗,𝑡𝑡−1 − 𝜌𝜌𝑖𝑖,𝑗𝑗̅̅ ̅̅ ) + 𝛾𝛾(𝑞𝑞𝑖𝑖,𝑡𝑡−1𝑞𝑞𝑗𝑗,𝑡𝑡−1 − 𝜌𝜌𝑖𝑖,𝑗𝑗̅̅ ̅̅ )
𝜌𝜌𝑖𝑖,𝑗𝑗̅̅ ̅̅
𝜌𝜌𝑖𝑖,𝑗𝑗,𝑡𝑡 =𝑞𝑞𝑖𝑖,𝑗𝑗,𝑡𝑡
√𝑞𝑞𝑖𝑖,𝑖𝑖,𝑡𝑡, 𝑞𝑞𝑗𝑗,𝑗𝑗,𝑡𝑡
𝜌𝜌𝑖𝑖,𝑗𝑗,𝑡𝑡
𝑞𝑞𝑖𝑖,𝑗𝑗,𝑡𝑡 = 𝜌𝜌𝑖𝑖,𝑗𝑗̅̅ ̅̅ + 𝛼𝛼(𝜀𝜀𝑖𝑖,𝑡𝑡−1𝜀𝜀𝑗𝑗,𝑡𝑡−1 − 𝜌𝜌𝑖𝑖,𝑗𝑗̅̅ ̅̅ ) + 𝛾𝛾(𝑞𝑞𝑖𝑖,𝑡𝑡−1𝑞𝑞𝑗𝑗,𝑡𝑡−1 − 𝜌𝜌𝑖𝑖,𝑗𝑗̅̅ ̅̅ )
𝜌𝜌𝑖𝑖,𝑗𝑗̅̅ ̅̅
𝜌𝜌𝑖𝑖,𝑗𝑗,𝑡𝑡 =𝑞𝑞𝑖𝑖,𝑗𝑗,𝑡𝑡
√𝑞𝑞𝑖𝑖,𝑖𝑖,𝑡𝑡, 𝑞𝑞𝑗𝑗,𝑗𝑗,𝑡𝑡
𝜌𝜌𝑖𝑖,𝑗𝑗,𝑡𝑡
𝑞𝑞𝑖𝑖,𝑗𝑗,𝑡𝑡 = 𝜌𝜌𝑖𝑖,𝑗𝑗̅̅ ̅̅ + 𝛼𝛼(𝜀𝜀𝑖𝑖,𝑡𝑡−1𝜀𝜀𝑗𝑗,𝑡𝑡−1 − 𝜌𝜌𝑖𝑖,𝑗𝑗̅̅ ̅̅ ) + 𝛾𝛾(𝑞𝑞𝑖𝑖,𝑡𝑡−1𝑞𝑞𝑗𝑗,𝑡𝑡−1 − 𝜌𝜌𝑖𝑖,𝑗𝑗̅̅ ̅̅ )
𝜌𝜌𝑖𝑖,𝑗𝑗̅̅ ̅̅
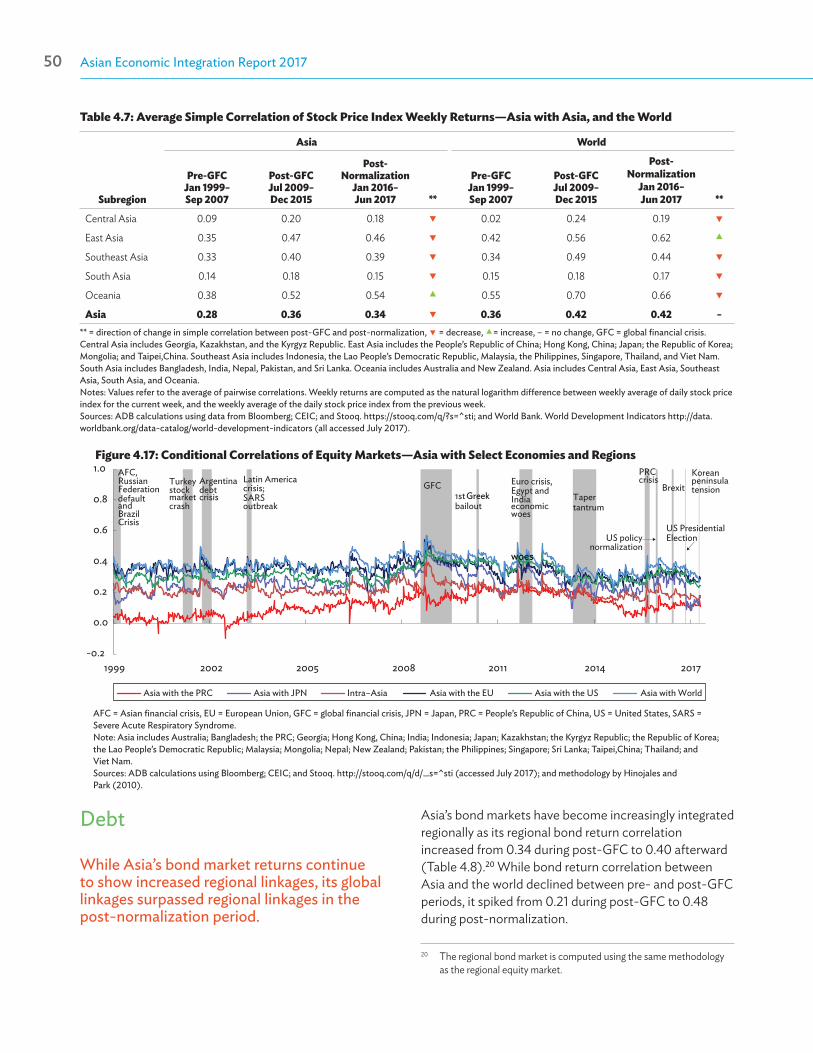
Asian Economic Integration Report 201750 Financial Integration 51
Figure 4.17: Conditional Correlations of Equity Markets—Asia with Select Economies and Regions
AFC = Asian financial crisis, EU = European Union, GFC = global financial crisis, JPN = Japan, PRC = People’s Republic of China, US = United States, SARS = Severe Acute Respiratory Syndrome.Note: Asia includes Australia; Bangladesh; the PRC; Georgia; Hong Kong, China; India; Indonesia; Japan; Kazakhstan; the Kyrgyz Republic; the Republic of Korea; the Lao People’s Democratic Republic; Malaysia; Mongolia; Nepal; New Zealand; Pakistan; the Philippines; Singapore; Sri Lanka; Taipei,China; Thailand; and Viet Nam. Sources: ADB calculations using Bloomberg; CEIC; and Stooq. http://stooq.com/q/d/_s=^sti (accessed July 2017); and methodology by Hinojales and Park (2010).
Asia with the PRC Asia with JPN Intra–Asia Asia with the EU Asia with the US Asia with World
-0.2
0.0
0.2
0.4
0.6
0.8
1.0
1999 2002 2005 2008 2011 2014 2017
AFC, Russian Federationdefault and BrazilCrisis
Turkey stock market crash
Argentinadebt crisis
Latin America crisis; SARS outbreak
GFC1st Greek bailout
Euro crisis, Egypt and Indiaeconomic woes
woes
Taper tantrum
PRCcrisis
US policy normalization
Brexit
US PresidentialElection
Korean peninsula tension
Debt
While Asia’s bond market returns continue to show increased regional linkages, its global linkages surpassed regional linkages in the post-normalization period.
Asia’s bond markets have become increasingly integrated regionally as its regional bond return correlation increased from 0.34 during post-GFC to 0.40 afterward (Table 4.8).20 While bond return correlation between Asia and the world declined between pre- and post-GFC periods, it spiked from 0.21 during post-GFC to 0.48 during post-normalization.
20 The regional bond market is computed using the same methodology as the regional equity market.
Table 4.7: Average Simple Correlation of Stock Price Index Weekly Returns—Asia with Asia, and the World
Subregion
Asia World
Pre-GFCJan 1999–Sep 2007
Post-GFCJul 2009–Dec 2015
Post-Normalization
Jan 2016–Jun 2017 **
Pre-GFCJan 1999–Sep 2007
Post-GFCJul 2009–Dec 2015
Post-Normalization
Jan 2016– Jun 2017 **
Central Asia 0.09 0.20 0.18 0.02 0.24 0.19
East Asia 0.35 0.47 0.46 0.42 0.56 0.62
Southeast Asia 0.33 0.40 0.39 0.34 0.49 0.44
South Asia 0.14 0.18 0.15 0.15 0.18 0.17
Oceania 0.38 0.52 0.54 0.55 0.70 0.66
Asia 0.28 0.36 0.34 0.36 0.42 0.42 –** = direction of change in simple correlation between post-GFC and post-normalization, = decrease, = increase, – = no change, GFC = global financial crisis.Central Asia includes Georgia, Kazakhstan, and the Kyrgyz Republic. East Asia includes the People’s Republic of China; Hong Kong, China; Japan; the Republic of Korea; Mongolia; and Taipei,China. Southeast Asia includes Indonesia, the Lao People’s Democratic Republic, Malaysia, the Philippines, Singapore, Thailand, and Viet Nam. South Asia includes Bangladesh, India, Nepal, Pakistan, and Sri Lanka. Oceania includes Australia and New Zealand. Asia includes Central Asia, East Asia, Southeast Asia, South Asia, and Oceania.Notes: Values refer to the average of pairwise correlations. Weekly returns are computed as the natural logarithm difference between weekly average of daily stock price index for the current week, and the weekly average of the daily stock price index from the previous week.Sources: ADB calculations using data from Bloomberg; CEIC; and Stooq. https://stooq.com/q/?s=^sti; and World Bank. World Development Indicators http://data.worldbank.org/data-catalog/world-development-indicators (all accessed July 2017).
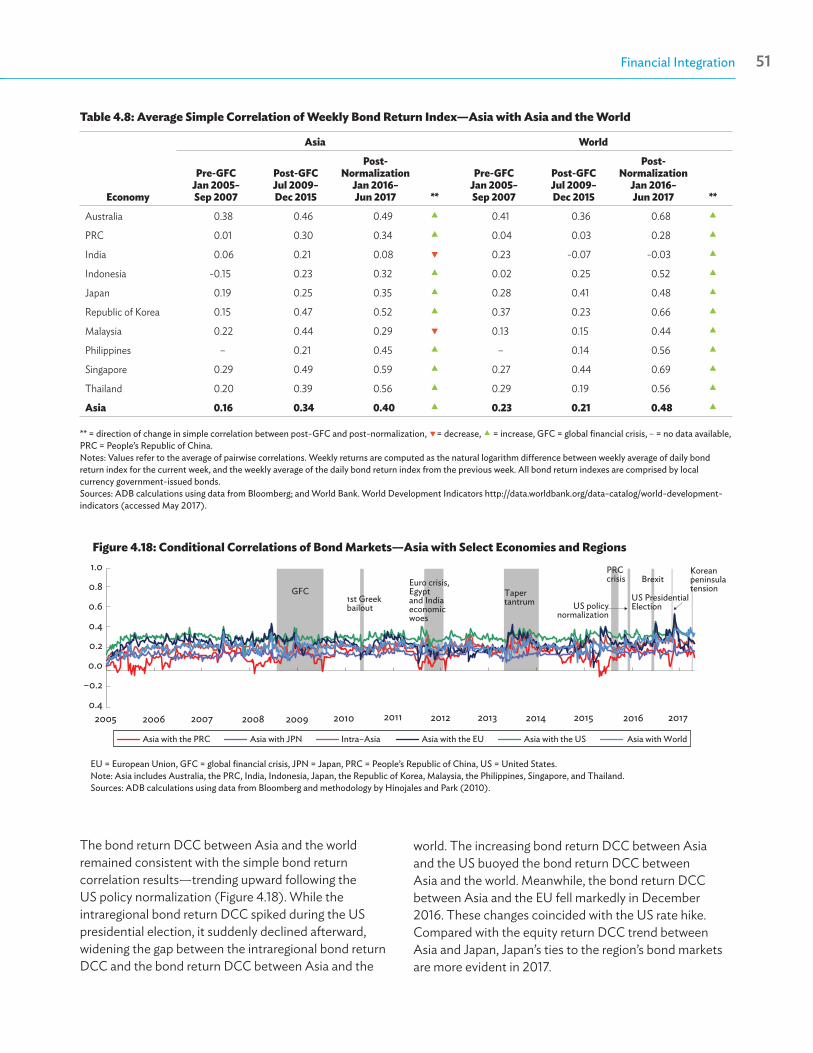
Asian Economic Integration Report 201750 Financial Integration 51
Table 4.8: Average Simple Correlation of Weekly Bond Return Index—Asia with Asia and the World
Economy
Asia World
Pre-GFCJan 2005–Sep 2007
Post-GFCJul 2009–Dec 2015
Post-Normalization
Jan 2016–Jun 2017 **
Pre-GFCJan 2005–Sep 2007
Post-GFCJul 2009–Dec 2015
Post-Normalization
Jan 2016–Jun 2017 **
Australia 0.38 0.46 0.49 0.41 0.36 0.68
PRC 0.01 0.30 0.34 0.04 0.03 0.28
India 0.06 0.21 0.08 0.23 -0.07 -0.03
Indonesia -0.15 0.23 0.32 0.02 0.25 0.52
Japan 0.19 0.25 0.35 0.28 0.41 0.48
Republic of Korea 0.15 0.47 0.52 0.37 0.23 0.66
Malaysia 0.22 0.44 0.29 0.13 0.15 0.44
Philippines – 0.21 0.45 – 0.14 0.56
Singapore 0.29 0.49 0.59 0.27 0.44 0.69
Thailand 0.20 0.39 0.56 0.29 0.19 0.56
Asia 0.16 0.34 0.40 0.23 0.21 0.48
** = direction of change in simple correlation between post-GFC and post-normalization, = decrease, = increase, GFC = global financial crisis, – = no data available, PRC = People’s Republic of China.Notes: Values refer to the average of pairwise correlations. Weekly returns are computed as the natural logarithm difference between weekly average of daily bond return index for the current week, and the weekly average of the daily bond return index from the previous week. All bond return indexes are comprised by local currency government-issued bonds.Sources: ADB calculations using data from Bloomberg; and World Bank. World Development Indicators http://data.worldbank.org/data-catalog/world-development-indicators (accessed May 2017).
Figure 4.18: Conditional Correlations of Bond Markets—Asia with Select Economies and Regions
EU = European Union, GFC = global financial crisis, JPN = Japan, PRC = People’s Republic of China, US = United States.Note: Asia includes Australia, the PRC, India, Indonesia, Japan, the Republic of Korea, Malaysia, the Philippines, Singapore, and Thailand.Sources: ADB calculations using data from Bloomberg and methodology by Hinojales and Park (2010).
1.0
0.8
0.6
0.4
0.2
0.0
–0.2
0.4
GFCBrexit
2005 2006 2007 2008 2009 2010 2011 2012 2013 2014 2015 2016 2017
1st Greek bailout
Euro crisis, Egypt and India economic woes
Taper tantrum
PRC crisis
US policy normalization
US Presidential Election
Korean peninsula tension
Asia with the PRC Asia with JPN Intra–Asia Asia with the EU Asia with the US Asia with World
The bond return DCC between Asia and the world remained consistent with the simple bond return correlation results—trending upward following the US policy normalization (Figure 4.18). While the intraregional bond return DCC spiked during the US presidential election, it suddenly declined afterward, widening the gap between the intraregional bond return DCC and the bond return DCC between Asia and the
world. The increasing bond return DCC between Asia and the US buoyed the bond return DCC between Asia and the world. Meanwhile, the bond return DCC between Asia and the EU fell markedly in December 2016. These changes coincided with the US rate hike. Compared with the equity return DCC trend between Asia and Japan, Japan’s ties to the region’s bond markets are more evident in 2017.
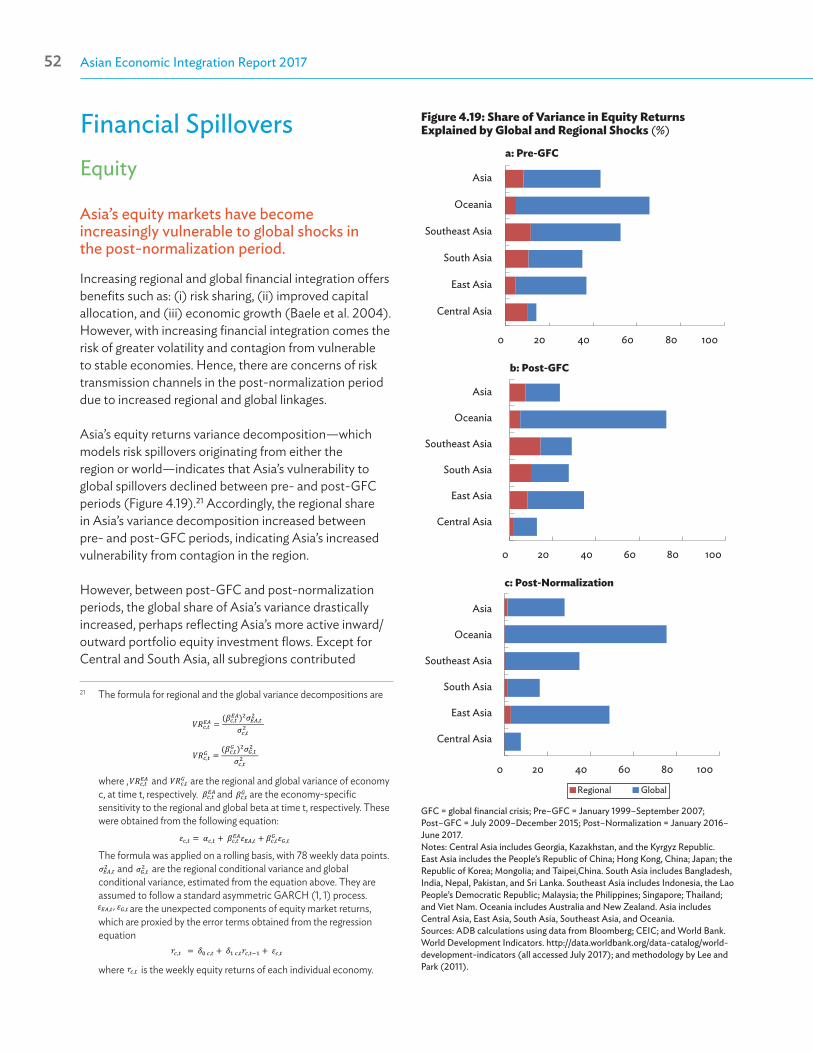
Asian Economic Integration Report 201752 Financial Integration 53
Financial SpilloversEquity
Asia’s equity markets have become increasingly vulnerable to global shocks in the post-normalization period.
Increasing regional and global financial integration offers benefits such as: (i) risk sharing, (ii) improved capital allocation, and (iii) economic growth (Baele et al. 2004). However, with increasing financial integration comes the risk of greater volatility and contagion from vulnerable to stable economies. Hence, there are concerns of risk transmission channels in the post-normalization period due to increased regional and global linkages.
Asia’s equity returns variance decomposition—which models risk spillovers originating from either the region or world—indicates that Asia’s vulnerability to global spillovers declined between pre- and post-GFC periods (Figure 4.19).21 Accordingly, the regional share in Asia’s variance decomposition increased between pre- and post-GFC periods, indicating Asia’s increased vulnerability from contagion in the region.
However, between post-GFC and post-normalization periods, the global share of Asia’s variance drastically increased, perhaps reflecting Asia’s more active inward/outward portfolio equity investment flows. Except for Central and South Asia, all subregions contributed
21 The formula for regional and the global variance decompositions are
where , and are the regional and global variance of economy c, at time t, respectively. and are the economy-specific sensitivity to the regional and global beta at time t, respectively. These were obtained from the following equation:
The formula was applied on a rolling basis, with 78 weekly data points. and are the regional conditional variance and global
conditional variance, estimated from the equation above. They are assumed to follow a standard asymmetric GARCH (1, 1) process.
are the unexpected components of equity market returns, which are proxied by the error terms obtained from the regression equation
where is the weekly equity returns of each individual economy.
𝑉𝑉𝑉𝑉𝑐𝑐,𝑡𝑡𝐸𝐸𝐸𝐸 = (𝛽𝛽𝑐𝑐,𝑡𝑡
𝐸𝐸𝐸𝐸)2𝜎𝜎𝐸𝐸𝐸𝐸,𝑡𝑡2
𝜎𝜎𝑐𝑐,𝑡𝑡2
𝑉𝑉𝑉𝑉𝑐𝑐,𝑡𝑡𝐺𝐺 = (𝛽𝛽𝑐𝑐,𝑡𝑡
𝐺𝐺 )2𝜎𝜎𝐺𝐺,𝑡𝑡2
𝜎𝜎𝑐𝑐,𝑡𝑡2
𝑉𝑉𝑉𝑉𝑐𝑐,𝑡𝑡𝐸𝐸𝐸𝐸
𝑉𝑉𝑉𝑉𝑐𝑐,𝑡𝑡𝐺𝐺
𝛽𝛽𝑐𝑐,𝑡𝑡𝐸𝐸𝐸𝐸
𝛽𝛽𝑐𝑐,𝑡𝑡𝐺𝐺
𝜀𝜀𝑐𝑐,𝑡𝑡 = 𝛼𝛼𝑐𝑐,𝑡𝑡 + 𝛽𝛽𝑐𝑐,𝑡𝑡𝐸𝐸𝐸𝐸𝜀𝜀𝐸𝐸𝐸𝐸,𝑡𝑡 + 𝛽𝛽𝑐𝑐,𝑡𝑡
𝐺𝐺 𝜀𝜀𝐺𝐺,𝑡𝑡
𝜎𝜎𝐸𝐸𝐸𝐸,𝑡𝑡2
𝜎𝜎𝐺𝐺,𝑡𝑡2
𝜀𝜀𝑐𝑐,𝑡𝑡, 𝜀𝜀𝐸𝐸𝐸𝐸,𝑡𝑡, 𝜀𝜀𝐺𝐺,𝑡𝑡
𝑟𝑟𝑐𝑐,𝑡𝑡 = 𝛿𝛿0 𝑐𝑐,𝑡𝑡 + 𝛿𝛿1 𝑐𝑐,𝑡𝑡𝑟𝑟𝑐𝑐,𝑡𝑡−1 + 𝜀𝜀𝑐𝑐,𝑡𝑡
𝑟𝑟𝑐𝑐,𝑡𝑡
Figure 4.19: Share of Variance in Equity Returns Explained by Global and Regional Shocks (%)
GFC = global financial crisis; Pre–GFC = January 1999–September 2007; Post–GFC = July 2009–December 2015; Post–Normalization = January 2016–June 2017.Notes: Central Asia includes Georgia, Kazakhstan, and the Kyrgyz Republic. East Asia includes the People’s Republic of China; Hong Kong, China; Japan; the Republic of Korea; Mongolia; and Taipei,China. South Asia includes Bangladesh, India, Nepal, Pakistan, and Sri Lanka. Southeast Asia includes Indonesia, the Lao People’s Democratic Republic; Malaysia; the Philippines; Singapore; Thailand; and Viet Nam. Oceania includes Australia and New Zealand. Asia includes Central Asia, East Asia, South Asia, Southeast Asia, and Oceania.Sources: ADB calculations using data from Bloomberg; CEIC; and World Bank. World Development Indicators. http://data.worldbank.org/data-catalog/world-development-indicators (all accessed July 2017); and methodology by Lee and Park (2011).
0 20 40 60 80 100
Central Asia
East Asia
South Asia
Southeast Asia
Oceania
Asia
a: Pre-GFC
0 20 40 60 80 100
Central Asia
East Asia
South Asia
Southeast Asia
Oceania
Asia
b: Post-GFC
0 20 40 60 80 100
Central Asia
East Asia
South Asia
Southeast Asia
Oceania
Asia
c: Post-Normalization
Regional Global

Asian Economic Integration Report 201752 Financial Integration 53
to the increase in the share of Asia’s equity variance explained by global shocks between post-GFC and post-normalization periods.
Debt
The influence of external shocks on local bond return variance grew larger in the post-GFC period, as the global share to total variance has become more significant particularly in the recent post-normalization period.
The global share to Asia’s total variance in local bond returns increased during the post-normalization period, while the external (both global and regional) shock exert more significant influence broadly across local currency bond markets in the post-GFC periods, reflecting a gradual global and regional integration of these markets (Figure 4.20). During post-normalization, in particular, the global share to Singapore, the Philippines, the Republic of Korea, the PRC, and Australia increased more significantly than other economies.
a: Pre-GFC b: Post-GFC c: Post-Normalization
Regional Global
0 20 40 60 80 100Australia
PRCIndia
IndonesiaJapan
Republic of KoreaMalaysia
PhilippinesSingapore
ThailandAsia
0 20 40 60 80 100Australia
PRCIndia
IndonesiaJapan
Republic of KoreaMalaysia
PhilippinesSingapore
ThailandAsia
0 20 40 60 80 100Australia
PRCIndia
IndonesiaJapan
Republic of KoreaMalaysia
PhilippinesSingapore
ThailandAsia
Figure 4.20: Share of Variance in Local Bond Returns Explained by Global and Regional Shocks (%)
GFC = global financial crisis, PRC = People’s Republic of China, Pre–GFC = January 2005–September 2007, Post–GFC = July 2009–December 2015, Post–Normalization = January 2016 – June 2017.Sources: ADB calculations using data from Bloomberg; World Bank, World Development Indicators. http://data.worldbank.org/data-catalog/world-development-indicators (both accessed July 2017); and methodology by Lee and Park (2011).
Bond Returns Convergence
The cross-border dispersion of Asia’s 10-year local currency government bond yields continued to show yield convergence in 2016, both with regional markets and the US.
Estimating the cross-border dispersion of 10-year local currency government bond yields—using σ-convergence of regional local currency government bond yields with a 10-year maturity—shows that convergence of Asia’s bond return fluctuations both within the region and with the US continued in 2016, suggesting increased co-movement after Brexit in June 2016 (Figure 4.21).22 While’s East Asia’s local bond returns seemed to diverge slightly during the 2013 taper tantrum, its σ-convergence declined afterward—although it has been up slightly more recently.
Since 2006, Asia’s local currency bond yields have been linked more to the US bond yields than intraregional bond markets. Asia and the US bond yields converged
22 To compute for the dispersion or σ-Convergence, each pairwise dispersion of bond yields r between economies i and j was obtained by
The formula was applied on a rolling basis, with 52 weekly data points. Each economy’s σ-convergence is the simple mean of all its pairwise dispersions. The subregional and Asia σ-convergence are the unweighted mean of each included economy’s σ-convergence.
𝜎𝜎𝑖𝑖𝑖𝑖𝑖𝑖 = [ 1𝑛𝑛 − 1∑ (𝑟𝑟𝑖𝑖𝑖𝑖 − 𝑟𝑟𝑖𝑖𝑖𝑖)
2𝑛𝑛
∀𝑖𝑖]1/2

Asian Economic Integration Report 201754 Financial Integration 55
further following the taper tantrum. While Asia’s local currency bond yields were more linked to the EU bond yields between 2006 and 2013—the onset of the taper tantrum—it changed as Asia-EU bond yields diverged. Convergence has remained benign since.
Capital Flow Volatility
With increasing financial integration and a growing appetite for financial assets outside the region, Asia’s capital flow volatilities of debt, FDI, and financial derivatives and other investments have increased, although equity volatility declined between post-GFC and post normalization periods.
Capital flow volatility of portfolio debt, FDI, and financial derivatives and other investments increased between post-GFC and post-normalization periods, while portfolio equity decreased (Table 4.9).
FDI remained the least volatile type of financial flow in the region during post-normalization (0.64). Against the post-GFC period, the increased volatility of FDI in the post-normalization period is attributed to Central Asia,
a: Intra-Asia b: Asia with non-Asia
0
2
4
6
Dec-06 Dec-08 Dec-10 Dec-12 Dec-14 Dec-16
Southeast Asia East AsiaOceania Developing AsiaDeveloped Asia Asia
0
2
4
6
Dec-06 Dec-08 Dec-10 Dec-12 Dec-14 Dec-16
Asia Asia-EU Asia-US Global
Figure 4.21: σ-Convergence of 10-year Government Bond Yields—Asia
EU = European Union, US = United States.Notes: (i) Values refer to the unweighted mean of individual economy’s σ-convergence, included in the subregion. Each economy’s σ-convergence is the simple mean of
all its pairwise standard deviation. Data are filtered using Hodrick-Prescott method. (ii) East Asia includes the People’s Republic of China; Hong Kong, China; Japan; the Republic of Korea; and Taipei,China. Southeast Asia includes Indonesia,
Malaysia, the Philippines, Singapore, and Thailand. Oceania includes Australia and New Zealand. Developed Asia includes Japan and Oceania. Developing Asia includes Southeast Asia and East Asia. Asia includes Developed Asia and Developing Asia. Global includes Asia, Colombia, the EU, Mexico, and the US.
Sources: ADB calculations using data from Bloomberg; CEIC; and methodology by Espinoza et al (2010), and Park (2013).
East Asia, and South Asia. The increase in portfolio debt volatility (from 0.96 during the post-GFC period to 1.27 afterward) was mainly due to the increase in Oceania’s portfolio debt volatility (from 2.86 to 3.20), as well as the increase in Southeast Asia’s portfolio debt volatility (from 0.83 to 1.06). The increase in volatility for financial derivatives and other instruments (from 1.37 post-GFC to 1.45 afterward) is also mainly attributed to South Asia and Oceania.

Asian Economic Integration Report 201754 Financial Integration 55
Table 4.9: Capital Flow Volatility—Asia (standard deviation of net capital inflow levels as % of GDP)
Subregion
Portfolio (Debt) Portfolio (Equity)
Pre-GFC Post-GFCPost-
Normalization ** Pre-GFC Post-GFCPost-
Normalization **Q1 1999–Q3 2007
Q3 2009–Q4 2015
Q1 2016–Q4 2016
Q1 1999–Q3 2007
Q3 2009–Q4 2015
Q1 2016–Q4 2016
Central Asia 4.21 4.38 3.18 1.88 1.03 0.39
East Asia 1.94 1.39 1.39 1.99 1.21 1.02
South Asia 0.00 0.85 0.73 0.90 1.04 0.65
Southeast Asia 1.11 0.83 1.06 1.05 0.70 1.01
Oceania 3.33 2.86 3.20 3.54 1.96 1.00
Asia 1.44 0.96 1.27 1.61 0.93 0.72
Subregion
FDI Financial Derivatives and Other Investmentsa
Pre-GFC Post-GFCPost-
Normalization ** Pre-GFC Post-GFCPost-
Normalization **Q1 1999–Q3 2007
Q3 2009–Q4 2015
Q1 2016–Q4 2016
Q1 1999–Q3 2007
Q3 2009–Q4 2015
Q1 2016–Q4 2016
Central Asia 4.20 2.68 3.69 4.27 6.59 5.69
East Asia 0.69 0.63 0.74 3.42 1.85 1.67
South Asia 0.29 0.55 0.91 1.65 1.33 2.71
Southeast Asia 1.77 1.20 0.59 3.04 2.89 2.31
Oceania 3.55 1.47 0.84 2.89 1.91 4.96
Asia 0.67 0.48 0.64 2.52 1.37 1.45 ** = direction of capital flow volatility between post-GFC and post-normalization, = decrease, = increase.– = no data available, FDI = foreign direct investment, GDP = gross domestic product, GFC = global financial crisis.a “Other Investments” includes: (i) other equity; (ii) currency and deposits; (iii) loans (including use of International Monetary Fund (IMF) credit and IMF loans); (iv) nonlife
insurance technical reserves, life insurance and annuities entitlements, pension entitlements, and provisions for calls under standardized guarantees; (v) trade credit and advances; (vi) other accounts receivable/payable; and (vii) special drawing rights (SDR) allocations (SDR holdings are included in reserve assets).
Notes: Central Asia includes Armenia, Azerbaijan, Georgia, Kazakhstan, the Kyrgyz Republic, and Tajikistan. East Asia includes the People’s Republic of China; Hong Kong, China; Japan; the Republic of Korea; and Mongolia. South Asia includes India and Sri Lanka. Southeast Asia includes Brunei Darussalam, Indonesia, Malaysia, the Philippines, Singapore, Thailand, and Viet Nam. Oceania includes Australia and New Zealand. Asia includes Central Asia, East Asia, South Asia, Southeast Asia, and Oceania.Sources: ADB calculations using data from CEIC; and International Monetary Fund. Balance of Payments and International Investment Position Statistics. http://www.imf.org/external/np/sta/bop/bop.htm (both accessed May 2017).
ReferencesAsian Development Bank. 2014. Basic Principles on Establishing
a Regional Settlement Intermediary and Next Steps Forward: Cross-Border Settlement Infrastructure Forum. Manila.
_____. 2016. Asian Economic Integration Report: What Drives Foreign Investment in Asia and the Pacific? Manila.
L. Baele, A. Fernando, P. Hördahl, E. Krylova, and C. Monnet. 2004. Measuring Financial Integration in the Euro Area. ECB Occasional Paper Series. No. 14. Frankfurt: European Central Bank.
Bank for International Settlements. Locational Banking Statistics. https://www.bis.org/statistics/bankstats.htm (accessed May 2017).
_____. 2006. Cross-border Collateral Arrangements. Basel.
R. Espinoza, A. Prasad, and O. Williams. 2010. Regional Financial Integration in the GCC. IMF Working Paper. No. 10/90. Washington, DC: International Monetary Fund.
J. Fichtner. 2016. The Anatomy of the Cayman Islands Offshore Financial Center: Anglo-America, Japan, and the Role of Hedge Funds. Review of International Political Economy. 23 (6). pp. 1034-1063.
Asian Economic Integration Report 201756 Financial Integration PB
M. Hinojales and C.Y. Park. 2010. Stock Market Integration: Emerging East Asia’s Experience. in M. Devereaux, P. Lane, C.Y. Park, and S.J. Wei, eds. The Dynamics of Asian Financial Integration: Facts and Analytics. London and New York: Routledge.
International Monetary Fund. 2015. Global Financial Stability Report: Navigating Monetary Policy Challenges and Managing Risks. Washington, DC.
_____. Coordinated Direct Investment Survey. http://cdis.imf.org (accessed February 2017).
_____. Coordinated Portfolio Investment Survey. http://cpis.imf.org (accessed September 2017).
W.R. Lam. 2013. Cross-border Activity of Japanese Banks. IMF Working Paper. No. 13/235. Washington, DC: International Monetary Fund.
J.W. Lee and C.Y. Park. 2011. Financial Integration in Emerging Asia: Challenges and Prospects. Asian Economic Policy Review. 6 (2). pp. 176-198.
C.Y. Park. 2013. Asian Capital Market Integration: Theory and Evidence. ADB Economics Working Paper Series. No. 351. Manila: Asian Development Bank.
Reuters. 2016. The Irony of Negative Rates: Japanese Investors Flock to Europe & Vice-Versa. 24 March.
Stooq. Stooq Online. https://stooq.com/q/?s=^sti (accessed July 2017).
World Bank. World Development Indicators Online. http://data.worldbank.org/data-catalog/world-development-indicators (accessed July 2017).

Remittances and Tourism Receipts
05
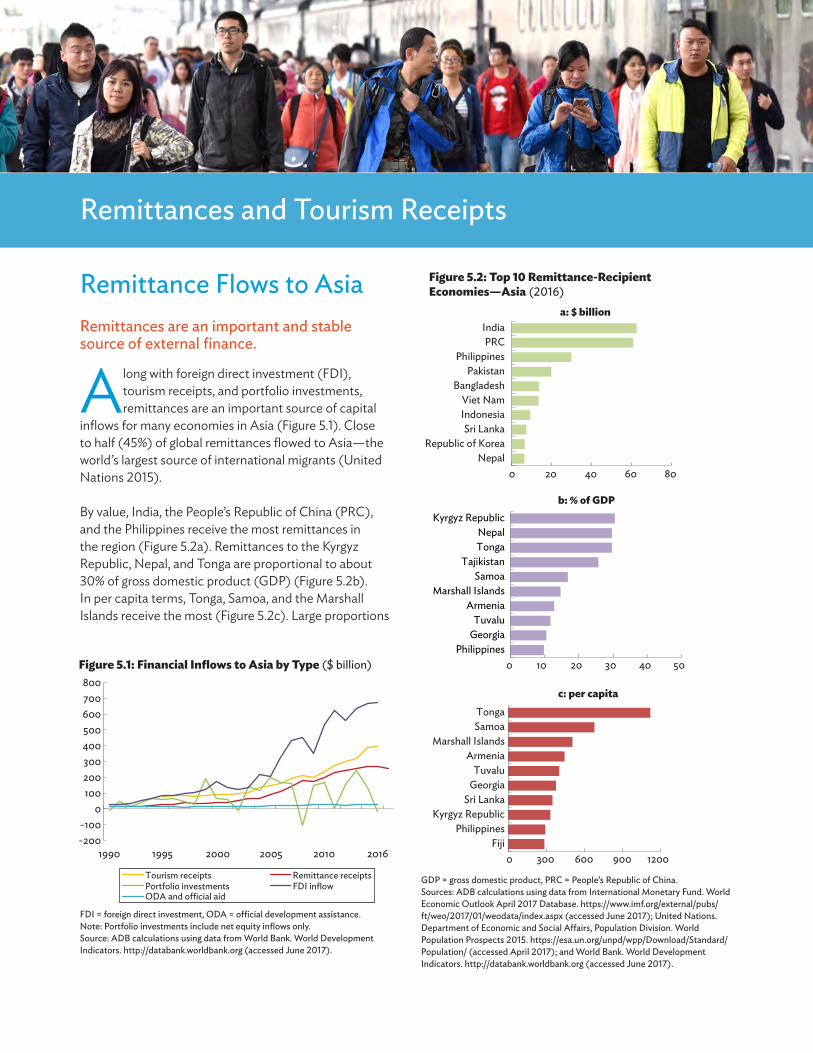
Asian Economic Integration Report 201758 Remittances and Tourism Receipts 59
Remittances and Tourism Receipts
Remittance Flows to AsiaRemittances are an important and stable source of external finance.
Along with foreign direct investment (FDI), tourism receipts, and portfolio investments, remittances are an important source of capital
inflows for many economies in Asia (Figure 5.1). Close to half (45%) of global remittances flowed to Asia—the world’s largest source of international migrants (United Nations 2015).
By value, India, the People’s Republic of China (PRC), and the Philippines receive the most remittances in the region (Figure 5.2a). Remittances to the Kyrgyz Republic, Nepal, and Tonga are proportional to about 30% of gross domestic product (GDP) (Figure 5.2b). In per capita terms, Tonga, Samoa, and the Marshall Islands receive the most (Figure 5.2c). Large proportions
-200-100
0100200300400500600700800
1990 1995 2000 2005 2010 2016
Tourism receipts Remittance receiptsPortfolio investmentsODA and o�cial aid
FDI inflow
Figure 5.1: Financial Inflows to Asia by Type ($ billion)
FDI = foreign direct investment, ODA = official development assistance.Note: Portfolio investments include net equity inflows only.Source: ADB calculations using data from World Bank. World Development Indicators. http://databank.worldbank.org (accessed June 2017).
Figure 5.2: Top 10 Remittance-Recipient Economies—Asia (2016)
GDP = gross domestic product, PRC = People’s Republic of China. Sources: ADB calculations using data from International Monetary Fund. World Economic Outlook April 2017 Database. https://www.imf.org/external/pubs/ft/weo/2017/01/weodata/index.aspx (accessed June 2017); United Nations. Department of Economic and Social Affairs, Population Division. World Population Prospects 2015. https://esa.un.org/unpd/wpp/Download/Standard/Population/ (accessed April 2017); and World Bank. World Development Indicators. http://databank.worldbank.org (accessed June 2017).
NepalRepublic of Korea
Sri LankaIndonesiaViet Nam
BangladeshPakistan
PhilippinesPRC
India
PhilippinesGeorgiaTuvalu
ArmeniaMarshall Islands
SamoaTajikistan
TongaNepal
Kyrgyz Republic
FijiPhilippines
Kyrgyz RepublicSri Lanka
GeorgiaTuvalu
ArmeniaMarshall Islands
SamoaTonga
0 20 40 60 80
a: $ billion
0 10 20 30 40 50
b: % of GDP
0 300 600 900 1200
c: per capita
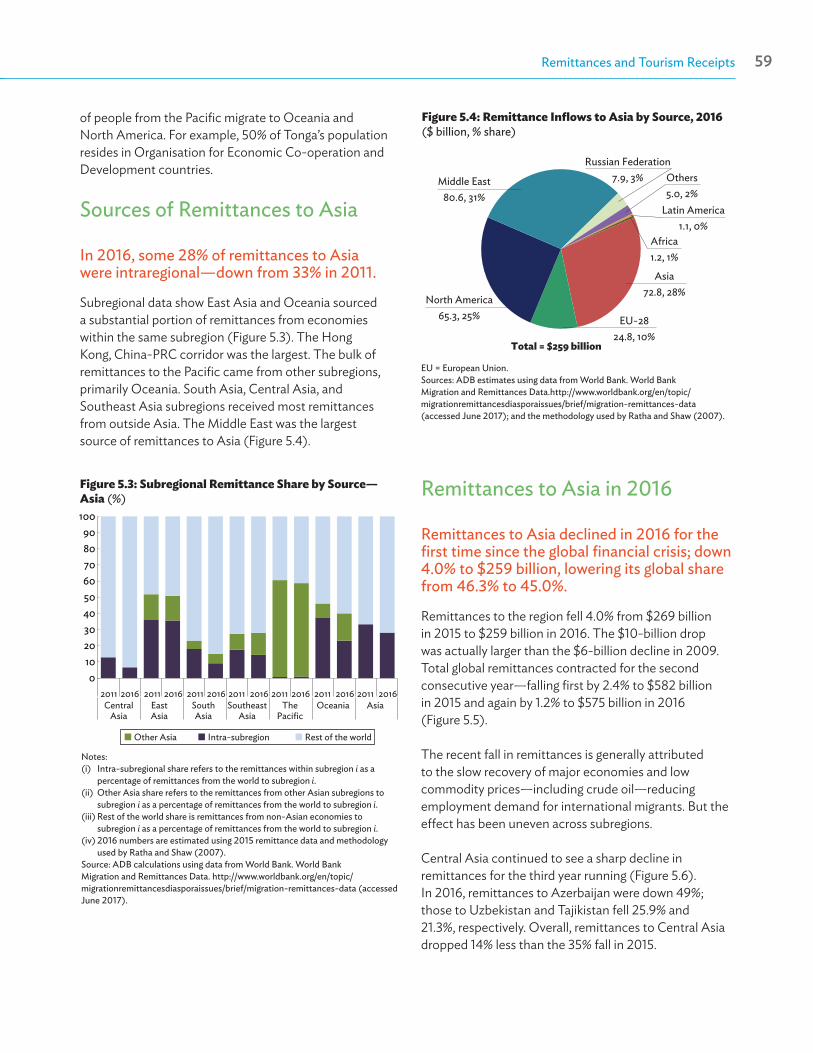
Asian Economic Integration Report 201758 Remittances and Tourism Receipts 59
of people from the Pacific migrate to Oceania and North America. For example, 50% of Tonga’s population resides in Organisation for Economic Co-operation and Development countries.
Sources of Remittances to Asia
In 2016, some 28% of remittances to Asia were intraregional—down from 33% in 2011.
Subregional data show East Asia and Oceania sourced a substantial portion of remittances from economies within the same subregion (Figure 5.3). The Hong Kong, China-PRC corridor was the largest. The bulk of remittances to the Pacific came from other subregions, primarily Oceania. South Asia, Central Asia, and Southeast Asia subregions received most remittances from outside Asia. The Middle East was the largest source of remittances to Asia (Figure 5.4).
Remittances to Asia in 2016
Remittances to Asia declined in 2016 for the first time since the global financial crisis; down 4.0% to $259 billion, lowering its global share from 46.3% to 45.0%.
Remittances to the region fell 4.0% from $269 billion in 2015 to $259 billion in 2016. The $10-billion drop was actually larger than the $6-billion decline in 2009. Total global remittances contracted for the second consecutive year—falling first by 2.4% to $582 billion in 2015 and again by 1.2% to $575 billion in 2016 (Figure 5.5).
The recent fall in remittances is generally attributed to the slow recovery of major economies and low commodity prices—including crude oil—reducing employment demand for international migrants. But the effect has been uneven across subregions.
Central Asia continued to see a sharp decline in remittances for the third year running (Figure 5.6). In 2016, remittances to Azerbaijan were down 49%; those to Uzbekistan and Tajikistan fell 25.9% and 21.3%, respectively. Overall, remittances to Central Asia dropped 14% less than the 35% fall in 2015.
Figure 5.3: Subregional Remittance Share by Source—Asia (%)
Notes: (i) Intra-subregional share refers to the remittances within subregion i as a
percentage of remittances from the world to subregion i.(ii) Other Asia share refers to the remittances from other Asian subregions to
subregion i as a percentage of remittances from the world to subregion i. (iii) Rest of the world share is remittances from non-Asian economies to
subregion i as a percentage of remittances from the world to subregion i.(iv) 2016 numbers are estimated using 2015 remittance data and methodology
used by Ratha and Shaw (2007). Source: ADB calculations using data from World Bank. World Bank Migration and Remittances Data. http://www.worldbank.org/en/topic/migrationremittancesdiasporaissues/brief/migration-remittances-data (accessed June 2017).
0102030405060708090
100
2011 2016 2011 2016 2011 2016 2011 2016 2011 2016 2011 2016 2011 2016Central
AsiaEastAsia
SouthAsia
SoutheastAsia
ThePacific
Oceania Asia
Other Asia Intra-subregion Rest of the world
Total = $259 billion
Russian Federation7.9, 3% Others
5.0, 2%Latin America
1.1, 0%Africa1.2, 1%
Asia72.8, 28%
EU-2824.8, 10%
North America65.3, 25%
Middle East80.6, 31%
Figure 5.4: Remittance Inflows to Asia by Source, 2016 ($ billion, % share)
EU = European Union.Sources: ADB estimates using data from World Bank. World Bank Migration and Remittances Data.http://www.worldbank.org/en/topic/migrationremittancesdiasporaissues/brief/migration-remittances-data (accessed June 2017); and the methodology used by Ratha and Shaw (2007).
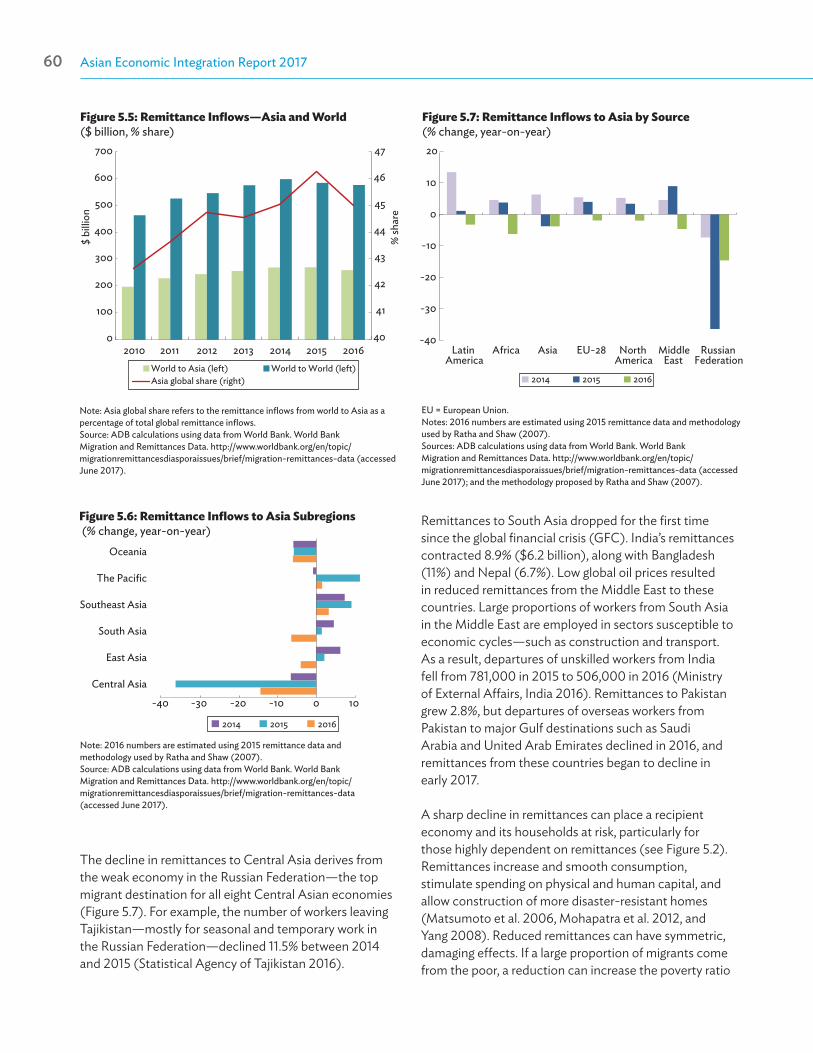
Asian Economic Integration Report 201760 Remittances and Tourism Receipts 61
Figure 5.5: Remittance Inflows—Asia and World ($ billion, % share)
Note: Asia global share refers to the remittance inflows from world to Asia as a percentage of total global remittance inflows. Source: ADB calculations using data from World Bank. World Bank Migration and Remittances Data. http://www.worldbank.org/en/topic/migrationremittancesdiasporaissues/brief/migration-remittances-data (accessed June 2017).
40
41
42
43
44
45
46
47
0
100
200
300
400
500
600
700
2010 2011 2012 2013 2014 2015 2016World to Asia (left) World to World (left)Asia global share (right)
$ bi
llion
% sh
are
Figure 5.6: Remittance Inflows to Asia Subregions (% change, year-on-year)
Note: 2016 numbers are estimated using 2015 remittance data and methodology used by Ratha and Shaw (2007). Source: ADB calculations using data from World Bank. World Bank Migration and Remittances Data. http://www.worldbank.org/en/topic/migrationremittancesdiasporaissues/brief/migration-remittances-data (accessed June 2017).
-40 -30 -20 -10 0 1020
Central Asia
East Asia
South Asia
Southeast Asia
The Pacific
Oceania
2014 2015 2016
Figure 5.7: Remittance Inflows to Asia by Source (% change, year-on-year)
EU = European Union.Notes: 2016 numbers are estimated using 2015 remittance data and methodology used by Ratha and Shaw (2007). Sources: ADB calculations using data from World Bank. World Bank Migration and Remittances Data. http://www.worldbank.org/en/topic/migrationremittancesdiasporaissues/brief/migration-remittances-data (accessed June 2017); and the methodology proposed by Ratha and Shaw (2007).
-40
-30
-20
-10
0
10
LatinAmerica
Africa Asia EU-28 NorthAmerica
MiddleEast
RussianFederation
2014 2015 2016
20
The decline in remittances to Central Asia derives from the weak economy in the Russian Federation—the top migrant destination for all eight Central Asian economies (Figure 5.7). For example, the number of workers leaving Tajikistan—mostly for seasonal and temporary work in the Russian Federation—declined 11.5% between 2014 and 2015 (Statistical Agency of Tajikistan 2016).
Remittances to South Asia dropped for the first time since the global financial crisis (GFC). India’s remittances contracted 8.9% ($6.2 billion), along with Bangladesh (11%) and Nepal (6.7%). Low global oil prices resulted in reduced remittances from the Middle East to these countries. Large proportions of workers from South Asia in the Middle East are employed in sectors susceptible to economic cycles—such as construction and transport. As a result, departures of unskilled workers from India fell from 781,000 in 2015 to 506,000 in 2016 (Ministry of External Affairs, India 2016). Remittances to Pakistan grew 2.8%, but departures of overseas workers from Pakistan to major Gulf destinations such as Saudi Arabia and United Arab Emirates declined in 2016, and remittances from these countries began to decline in early 2017.
A sharp decline in remittances can place a recipient economy and its households at risk, particularly for those highly dependent on remittances (see Figure 5.2). Remittances increase and smooth consumption, stimulate spending on physical and human capital, and allow construction of more disaster-resistant homes (Matsumoto et al. 2006, Mohapatra et al. 2012, and Yang 2008). Reduced remittances can have symmetric, damaging effects. If a large proportion of migrants come from the poor, a reduction can increase the poverty ratio

Asian Economic Integration Report 201760 Remittances and Tourism Receipts 61
2.9%, along with Lao People’s Democratic Republic (2.7%), and Myanmar (2.3%). The Philippines remained the largest recipient in the subregion, receiving a record $29.9 billion, a 4.9% increase. Still, departures from the Philippines to the Middle East—largely housemaids; service workers; and skilled workers in medicine, engineering, and management—remained unaffected. Labor demand in these sectors is less susceptible to business cycles (Box 5.1).23
23 Heterogeneous impacts of economic shocks on remittances inflows observed in 2016 are highly consistent with what occurred during the GFC in 2009. The impact may vary depending on the nature of migration such as destinations and sectors that employ foreign migrants, and workers’ skill level (ADB 2012).
Remittance inflow trends have diverged across economies in Asia, with sharp declines in some economies and continued growth in others. The sources of remittance volatility are examined from the perspective of variations in migration patterns across economies, while controlling for key economic and social indicators that may also cause remittance fluctuations (following Jackman 2013). Variables include: (i) changes in migrant stock, (ii) the proportion of female workers (often employed in sectors less affected by business cycles and who remit regularly), (iii) the degree of concentration of migrants in a single destination (diversifying sources of shocks), and (iv) the proportion of migrants working in Organisation for Economic Co-operation and
Development destinations (where wages are generally higher and longer-term contracts are more frequent).
Results suggest that the high proportion of female migrants among migrant populations contribute to lowering fluctuations. Having a moderate concentration of migrants in one destination country can stabilize remittance inflows, but excessive concentration (above 49%) will result in losing the benefit. The change in size of migrant population also generates volatility as expected. The analysis also shows that providing assurance of property rights can mitigate fluctuations.
Box 5.1: Understanding the Sources of Fluctuations in Remittance Inflows
CoefficientsMigrant population (% growth)
0.046*(0.027)
Ratio (%) of migrants in top destination (TOP)
-0.970**(0.427)
TOP_squared
0.010**(0.005)
Female migration dummy (= 1 if % female migration>55)
-10.214**(4.387)
Natural disaster occurrences
0.253(0.819)
Property rights assurance at origin country (= rule of law index)
-4.052*(2.285)
Proportion of migrants against total population (%)
-18.459(15.817)
Proportion of migrants in OECD countries (%)
0.022(0.064)
Proportion of college graduates among migrants (%)
-1.335(3.259)
GDP, exchange rate, and interest rate volatilities of origin and destination countries
Yes
Year dummy YesSubregion dummy YesConstant
63.720***(-17.801)
Number of observations 378R-squared 0.257
*** = significant at 1%, ** = significant at 5%, * = significant at 10%, GDP = gross domestic product, OECD = Organisation for Economic Co-operation and Development, SD = standard deviation.Notes: Robust standard errors are shown in parentheses. The ordinary least square analysis uses data of 38 economies in Asia between the period of 2000–2016.Sources: ADB calculations using data from Artuc et al. (2015); Centre for Research on the Epidemiology of Disasters. EM-DAT The International Disaster Database. http://www.emdat.be/ (accessed June 2017); International Monetary Fund. World Economic Outlook April 2017 Database. https://www.imf.org/external/pubs/ft/weo/2017/01/weodata/index.aspx (accessed June 2017); World Bank. World Development Indicators. http://databank.worldbank.org (accessed June 2017); World Bank. Migration and Remittances Data. http://www.worldbank.org/en/topic/migrationremittancesdiasporaissues/brief/migration-remittances-data (accessed June 2017); and United Nations. Department of Economic and Social Affairs, Population Division. World Population Prospects 2015. https://esa.un.org/unpd/wpp/Download/Standard/Population/ (accessed April 2017).
CoefficientsSources of Volatility in Remittance Inflow (Dependent Variable = 3 year rolling SD of remittance annual growth)
(ADB 2012). If the decline is only temporary, better-off migrants and their families may be able to minimize the shock by using savings and assets.
In contrast, remittances to Southeast Asia continued to grow.
Remittance inflows continued to grow in 2016 across much of Southeast Asia. Remittances to Viet Nam rose
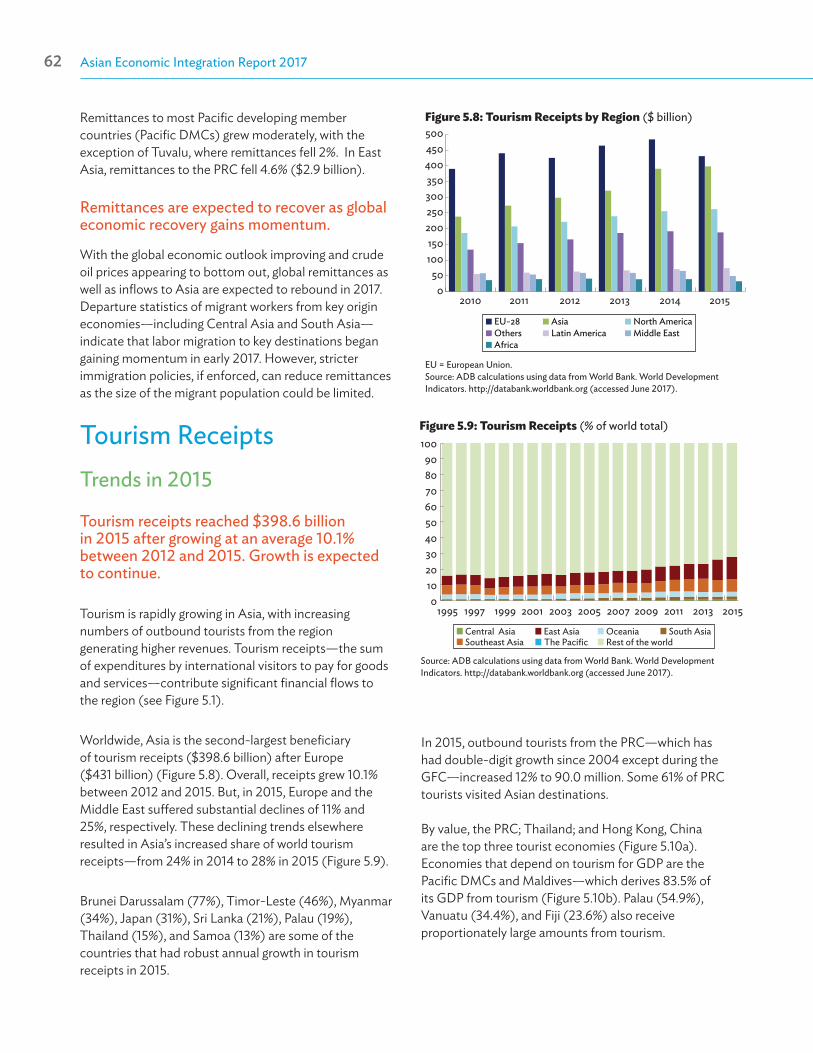
Asian Economic Integration Report 201762 Remittances and Tourism Receipts 63
Figure 5.8: Tourism Receipts by Region ($ billion)
EU = European Union.Source: ADB calculations using data from World Bank. World Development Indicators. http://databank.worldbank.org (accessed June 2017).
050
100150
200250300350400450500
2010 2011 2012 2013 2014 2015
EU-28 Asia North AmericaOthers Latin America Middle EastAfrica
Figure 5.9: Tourism Receipts (% of world total)
Source: ADB calculations using data from World Bank. World Development Indicators. http://databank.worldbank.org (accessed June 2017).
0102030405060708090
100
1995 1997 1999 2001 2003 2005 2007 2009 2011 2013 2015
Rest of the worldEast Asia
Southeast AsiaOceania
The PacificSouth AsiaCentral Asia
Remittances to most Pacific developing member countries (Pacific DMCs) grew moderately, with the exception of Tuvalu, where remittances fell 2%. In East Asia, remittances to the PRC fell 4.6% ($2.9 billion).
Remittances are expected to recover as global economic recovery gains momentum.
With the global economic outlook improving and crude oil prices appearing to bottom out, global remittances as well as inflows to Asia are expected to rebound in 2017. Departure statistics of migrant workers from key origin economies—including Central Asia and South Asia—indicate that labor migration to key destinations began gaining momentum in early 2017. However, stricter immigration policies, if enforced, can reduce remittances as the size of the migrant population could be limited.
Tourism ReceiptsTrends in 2015
Tourism receipts reached $398.6 billion in 2015 after growing at an average 10.1% between 2012 and 2015. Growth is expected to continue.
Tourism is rapidly growing in Asia, with increasing numbers of outbound tourists from the region generating higher revenues. Tourism receipts—the sum of expenditures by international visitors to pay for goods and services—contribute significant financial flows to the region (see Figure 5.1).
Worldwide, Asia is the second-largest beneficiary of tourism receipts ($398.6 billion) after Europe ($431 billion) (Figure 5.8). Overall, receipts grew 10.1% between 2012 and 2015. But, in 2015, Europe and the Middle East suffered substantial declines of 11% and 25%, respectively. These declining trends elsewhere resulted in Asia’s increased share of world tourism receipts—from 24% in 2014 to 28% in 2015 (Figure 5.9).
Brunei Darussalam (77%), Timor-Leste (46%), Myanmar (34%), Japan (31%), Sri Lanka (21%), Palau (19%), Thailand (15%), and Samoa (13%) are some of the countries that had robust annual growth in tourism receipts in 2015.
In 2015, outbound tourists from the PRC—which has had double-digit growth since 2004 except during the GFC—increased 12% to 90.0 million. Some 61% of PRC tourists visited Asian destinations.
By value, the PRC; Thailand; and Hong Kong, China are the top three tourist economies (Figure 5.10a). Economies that depend on tourism for GDP are the Pacific DMCs and Maldives—which derives 83.5% of its GDP from tourism (Figure 5.10b). Palau (54.9%), Vanuatu (34.4%), and Fiji (23.6%) also receive proportionately large amounts from tourism.
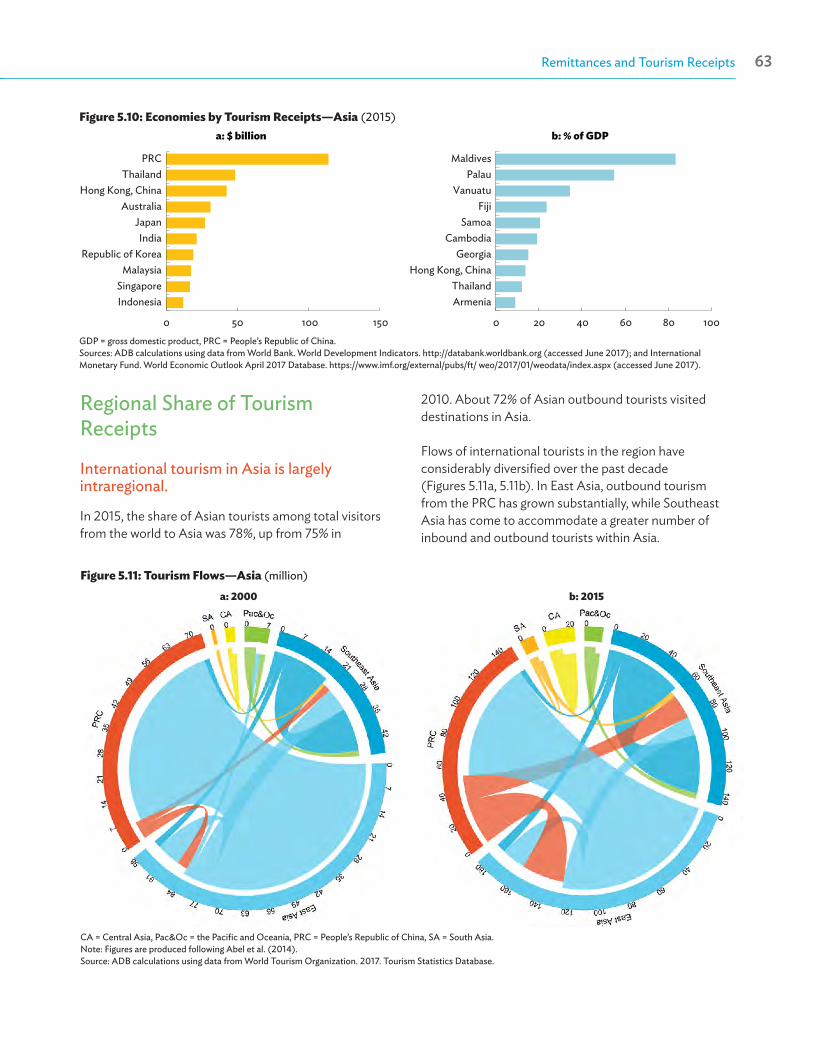
Asian Economic Integration Report 201762 Remittances and Tourism Receipts 63
Regional Share of Tourism Receipts
International tourism in Asia is largely intraregional.
In 2015, the share of Asian tourists among total visitors from the world to Asia was 78%, up from 75% in
2010. About 72% of Asian outbound tourists visited destinations in Asia.
Flows of international tourists in the region have considerably diversified over the past decade (Figures 5.11a, 5.11b). In East Asia, outbound tourism from the PRC has grown substantially, while Southeast Asia has come to accommodate a greater number of inbound and outbound tourists within Asia.
Figure 5.10: Economies by Tourism Receipts—Asia (2015)
GDP = gross domestic product, PRC = People’s Republic of China. Sources: ADB calculations using data from World Bank. World Development Indicators. http://databank.worldbank.org (accessed June 2017); and International Monetary Fund. World Economic Outlook April 2017 Database. https://www.imf.org/external/pubs/ft/ weo/2017/01/weodata/index.aspx (accessed June 2017).
0 20 40 60 80 100
ArmeniaThailand
Hong Kong, ChinaGeorgia
CambodiaSamoa
FijiVanuatu
PalauMaldives
b: % of GDP
0 50 100 150
IndonesiaSingapore
MalaysiaRepublic of Korea
IndiaJapan
AustraliaHong Kong, China
ThailandPRC
a: $ billion
CA = Central Asia, Pac&Oc = the Pacific and Oceania, PRC = People’s Republic of China, SA = South Asia.Note: Figures are produced following Abel et al. (2014).Source: ADB calculations using data from World Tourism Organization. 2017. Tourism Statistics Database.
Figure 5.11: Tourism Flows—Asia (million)
a: 2000 b: 2015
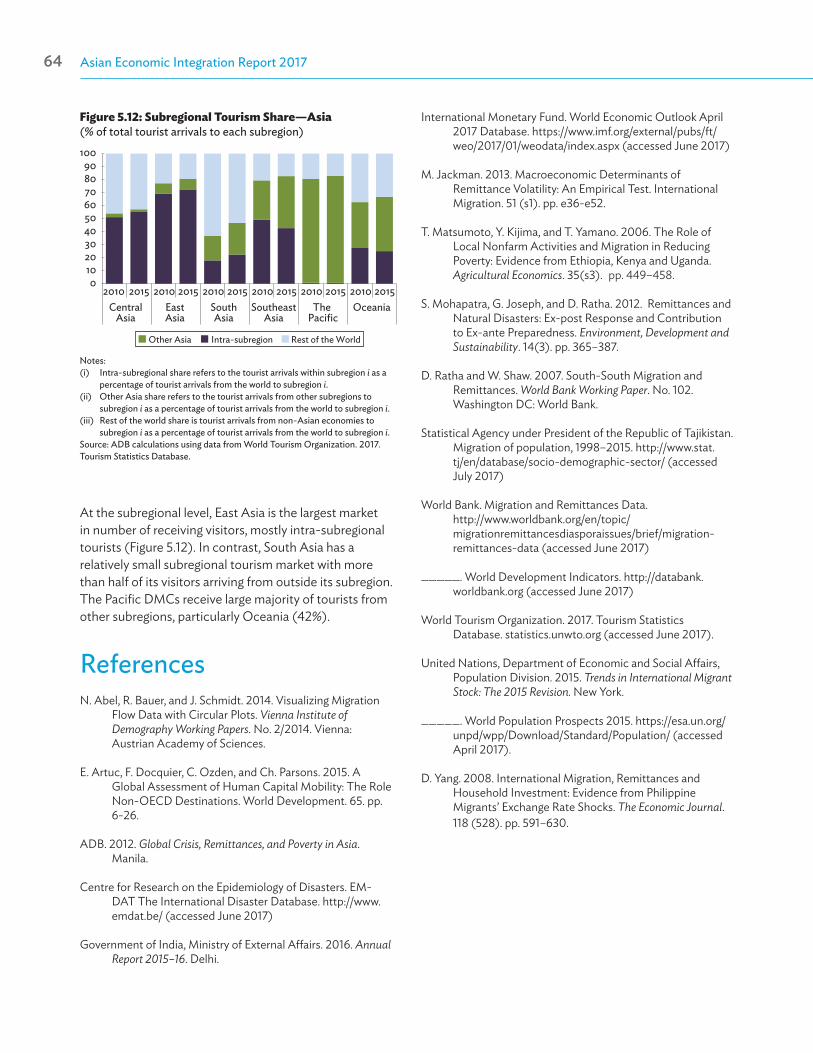
Asian Economic Integration Report 201764 Remittances and Tourism Receipts PB
Figure 5.12: Subregional Tourism Share—Asia (% of total tourist arrivals to each subregion)
Notes: (i) Intra-subregional share refers to the tourist arrivals within subregion i as a
percentage of tourist arrivals from the world to subregion i. (ii) Other Asia share refers to the tourist arrivals from other subregions to
subregion i as a percentage of tourist arrivals from the world to subregion i. (iii) Rest of the world share is tourist arrivals from non-Asian economies to
subregion i as a percentage of tourist arrivals from the world to subregion i.Source: ADB calculations using data from World Tourism Organization. 2017. Tourism Statistics Database.
0102030405060708090
100
2010 2015 2010 2015 2010 2015 2010 2015 2010 2015 2010 2015Central
AsiaEastAsia
SouthAsia
SoutheastAsia
The Pacific
Oceania
Rest of the WorldOther Asia Intra-subregion
At the subregional level, East Asia is the largest market in number of receiving visitors, mostly intra-subregional tourists (Figure 5.12). In contrast, South Asia has a relatively small subregional tourism market with more than half of its visitors arriving from outside its subregion. The Pacific DMCs receive large majority of tourists from other subregions, particularly Oceania (42%).
ReferencesN. Abel, R. Bauer, and J. Schmidt. 2014. Visualizing Migration
Flow Data with Circular Plots. Vienna Institute of Demography Working Papers. No. 2/2014. Vienna: Austrian Academy of Sciences.
E. Artuc, F. Docquier, C. Ozden, and Ch. Parsons. 2015. A Global Assessment of Human Capital Mobility: The Role Non-OECD Destinations. World Development. 65. pp. 6-26.
ADB. 2012. Global Crisis, Remittances, and Poverty in Asia. Manila.
Centre for Research on the Epidemiology of Disasters. EM-DAT The International Disaster Database. http://www.emdat.be/ (accessed June 2017)
Government of India, Ministry of External Affairs. 2016. Annual Report 2015–16. Delhi.
International Monetary Fund. World Economic Outlook April 2017 Database. https://www.imf.org/external/pubs/ft/weo/2017/01/weodata/index.aspx (accessed June 2017)
M. Jackman. 2013. Macroeconomic Determinants of Remittance Volatility: An Empirical Test. International Migration. 51 (s1). pp. e36-e52.
T. Matsumoto, Y. Kijima, and T. Yamano. 2006. The Role of Local Nonfarm Activities and Migration in Reducing Poverty: Evidence from Ethiopia, Kenya and Uganda. Agricultural Economics. 35(s3). pp. 449–458.
S. Mohapatra, G. Joseph, and D. Ratha. 2012. Remittances and Natural Disasters: Ex-post Response and Contribution to Ex-ante Preparedness. Environment, Development and Sustainability. 14(3). pp. 365–387.
D. Ratha and W. Shaw. 2007. South-South Migration and Remittances. World Bank Working Paper. No. 102. Washington DC: World Bank.
Statistical Agency under President of the Republic of Tajikistan. Migration of population, 1998–2015. http://www.stat.tj/en/database/socio-demographic-sector/ (accessed July 2017)
World Bank. Migration and Remittances Data. http://www.worldbank.org/en/topic/migrationremittancesdiasporaissues/brief/migration-remittances-data (accessed June 2017)
_____. World Development Indicators. http://databank.worldbank.org (accessed June 2017)
World Tourism Organization. 2017. Tourism Statistics Database. statistics.unwto.org (accessed June 2017).
United Nations, Department of Economic and Social Affairs, Population Division. 2015. Trends in International Migrant Stock: The 2015 Revision. New York.
_____. World Population Prospects 2015. https://esa.un.org/unpd/wpp/Download/Standard/Population/ (accessed April 2017).
D. Yang. 2008. International Migration, Remittances and Household Investment: Evidence from Philippine Migrants’ Exchange Rate Shocks. The Economic Journal. 118 (528). pp. 591–630.
Subregional Cooperation Initiatives
06
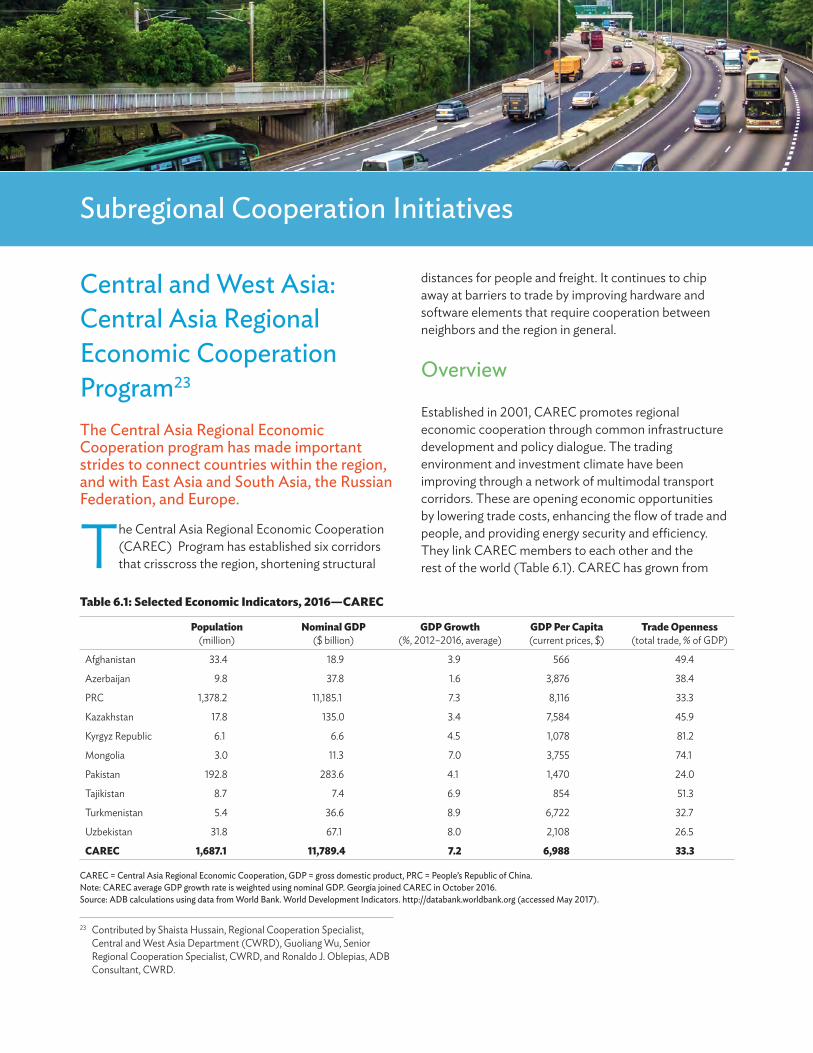
Asian Economic Integration Report 201766 Subregional Cooperation Initiatives 67
Subregional Cooperation Initiatives
Central and West Asia: Central Asia Regional Economic Cooperation Program23 The Central Asia Regional Economic Cooperation program has made important strides to connect countries within the region, and with East Asia and South Asia, the Russian Federation, and Europe.
The Central Asia Regional Economic Cooperation (CAREC) Program has established six corridors that crisscross the region, shortening structural
23 Contributed by Shaista Hussain, Regional Cooperation Specialist, Central and West Asia Department (CWRD), Guoliang Wu, Senior Regional Cooperation Specialist, CWRD, and Ronaldo J. Oblepias, ADB Consultant, CWRD.
distances for people and freight. It continues to chip away at barriers to trade by improving hardware and software elements that require cooperation between neighbors and the region in general.
Overview
Established in 2001, CAREC promotes regional economic cooperation through common infrastructure development and policy dialogue. The trading environment and investment climate have been improving through a network of multimodal transport corridors. These are opening economic opportunities by lowering trade costs, enhancing the flow of trade and people, and providing energy security and efficiency. They link CAREC members to each other and the rest of the world (Table 6.1). CAREC has grown from
Table 6.1: Selected Economic Indicators, 2016—CAREC
Population (million)
Nominal GDP ($ billion)
GDP Growth (%, 2012–2016, average)
GDP Per Capita (current prices, $)
Trade Openness (total trade, % of GDP)
Afghanistan 33.4 18.9 3.9 566 49.4
Azerbaijan 9.8 37.8 1.6 3,876 38.4
PRC 1,378.2 11,185.1 7.3 8,116 33.3
Kazakhstan 17.8 135.0 3.4 7,584 45.9
Kyrgyz Republic 6.1 6.6 4.5 1,078 81.2
Mongolia 3.0 11.3 7.0 3,755 74.1
Pakistan 192.8 283.6 4.1 1,470 24.0
Tajikistan 8.7 7.4 6.9 854 51.3
Turkmenistan 5.4 36.6 8.9 6,722 32.7
Uzbekistan 31.8 67.1 8.0 2,108 26.5
CAREC 1,687.1 11,789.4 7.2 6,988 33.3
CAREC = Central Asia Regional Economic Cooperation, GDP = gross domestic product, PRC = People’s Republic of China.Note: CAREC average GDP growth rate is weighted using nominal GDP. Georgia joined CAREC in October 2016.Source: ADB calculations using data from World Bank. World Development Indicators. http://databank.worldbank.org (accessed May 2017).

Asian Economic Integration Report 201766 Subregional Cooperation Initiatives 67
0
5
10
15
20
25
2006 2008 2010 2012 2014 2016
Transport Trade Facilitation Energy
Figure 6.1: CAREC Loans and Grants by Sector, as of end-2016 ($ billion)
CAREC = Central Asia Regional Economic Cooperation.Source: ADB. CAREC Program Portfolio.
six members in 2001 to 11 members in 2016. From six transport projects in 2001 worth $241 million, there were 176 projects in transport, energy, and trade facilitation worth $29.4 billion in 2016 (Figure 6.1). Of this, $10.4 billion (35%) was financed by ADB, $11.8 billion (40%) by other donor organizations, and $7.2 billion (24%) by CAREC governments (Figure 6.2).
In recent years, there has been a surge of interest among donors and governments to support economic cooperation initiatives in Central Asia. For example, there is the Belt and Road Initiative (BRI) and Silk Road Fund from the People’s Republic of China (PRC), the New Silk Road pioneered by the United States (US), the Republic of Korea’s Eurasia Initiative, and Quality Infrastructure sponsored by Japan. These offer new opportunities for cooperation, but also risk overlaps and competition if not coordinated and harmonized well. CAREC is now preparing a new long-term strategy to better position the group within a rapidly changing regional and global landscape.
ADB 10.4 (35%)
Other cofinanciers2.4 (8%)
World Bank6.4 (22%)
IsDB 1.4 (5%)
EBRD 1.6 (6%)
CAREC governments 7.2 (24%)
Total = $29.4 billion
Figure 6.2: CAREC Projects by Funding Source, as of end-2016 ($ billion)
CAREC = Central Asia Regional Economic Cooperation, EBRD = European Bank for Reconstruction and Development, IsDB = Islamic Development Bank.Source: ADB. CAREC Program Portfolio.
Performance and Progress over the Past Year
CAREC continues to prioritize transport and energy, along with trade facilitation and trade policy; most investment projects involve infrastructure connectivity.
Transport. By 2016, road and railway projects had already surpassed CAREC’s 2020 targets as outlined in its Transport and Trade Facilitation Strategy (TTFS) 2020 and Work Plan (CAREC 2017a) (Figure 6.3). With 1,363 kilometers (km) of expressways or national highways built, upgraded or improved in 2016, cumulative road infrastructure reached 8,592 km, well beyond the 7,800 km corridor length targeted for construction or improvement by 2020. In 2016, Turkmenistan completed 85 km of new railways, while 509 km of railways were improved in Azerbaijan and Uzbekistan. Thirteen projects in other transport subsectors (two ports, two logistics centers, three border crossing points [BCP], and six civil aviation projects) are being implemented. A new Railway Strategy and Road Safety Strategy were endorsed by CAREC ministers for 2017–2030.
Energy. In December 2016, ADB approved a $240-million loan for the fifth phase of the Turkmenistan–Uzbekistan–Tajikistan–Afghanistan–Pakistan (TUTAP) Power Interconnection Framework.
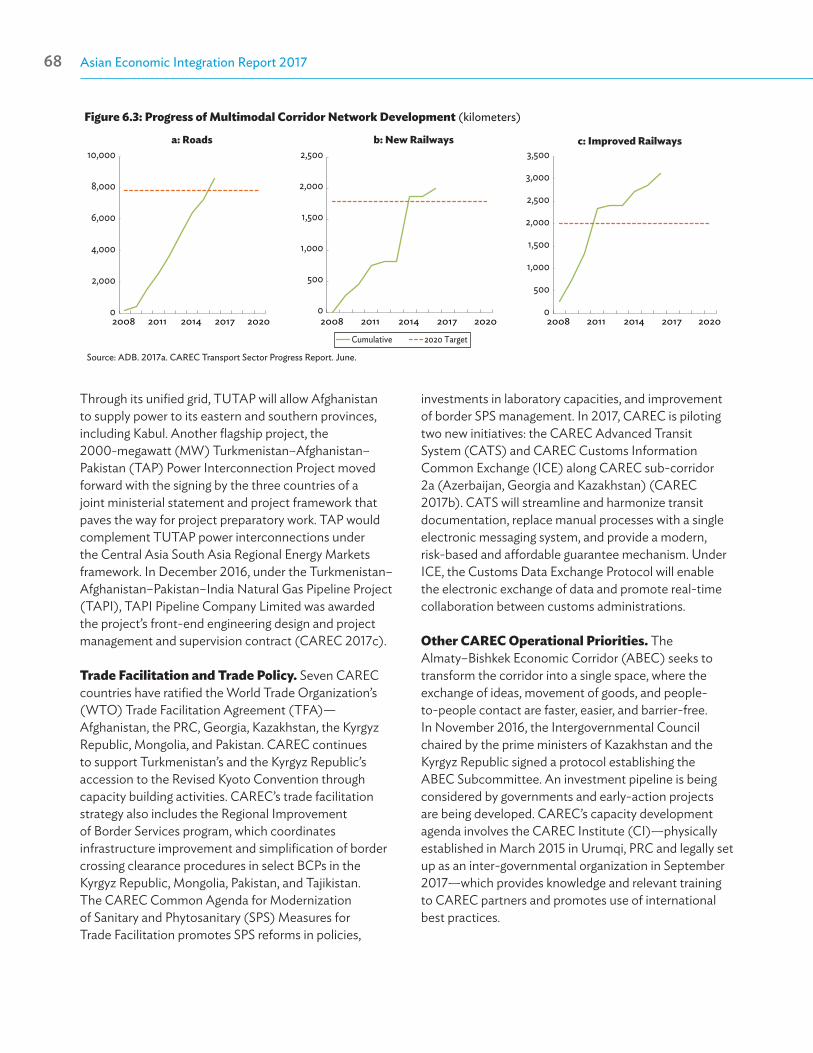
Asian Economic Integration Report 201768 Subregional Cooperation Initiatives 69
Figure 6.3: Progress of Multimodal Corridor Network Development (kilometers)
Source: ADB. 2017a. CAREC Transport Sector Progress Report. June.
Cumulative 2020 Target
0
2,000
4,000
6,000
8,000
10,000
2008 2011 2014 2017 2020
a: Roads
0
500
1,000
1,500
2,000
2,500
2008 2011 2014 2017 2020
b: New Railways
0
500
1,000
1,500
2,000
2,500
3,000
3,500
2008 2011 2014 2017 2020
c: Improved Railways
Through its unified grid, TUTAP will allow Afghanistan to supply power to its eastern and southern provinces, including Kabul. Another flagship project, the 2000-megawatt (MW) Turkmenistan–Afghanistan–Pakistan (TAP) Power Interconnection Project moved forward with the signing by the three countries of a joint ministerial statement and project framework that paves the way for project preparatory work. TAP would complement TUTAP power interconnections under the Central Asia South Asia Regional Energy Markets framework. In December 2016, under the Turkmenistan–Afghanistan–Pakistan–India Natural Gas Pipeline Project (TAPI), TAPI Pipeline Company Limited was awarded the project’s front-end engineering design and project management and supervision contract (CAREC 2017c).
Trade Facilitation and Trade Policy. Seven CAREC countries have ratified the World Trade Organization’s (WTO) Trade Facilitation Agreement (TFA)— Afghanistan, the PRC, Georgia, Kazakhstan, the Kyrgyz Republic, Mongolia, and Pakistan. CAREC continues to support Turkmenistan’s and the Kyrgyz Republic’s accession to the Revised Kyoto Convention through capacity building activities. CAREC’s trade facilitation strategy also includes the Regional Improvement of Border Services program, which coordinates infrastructure improvement and simplification of border crossing clearance procedures in select BCPs in the Kyrgyz Republic, Mongolia, Pakistan, and Tajikistan. The CAREC Common Agenda for Modernization of Sanitary and Phytosanitary (SPS) Measures for Trade Facilitation promotes SPS reforms in policies,
investments in laboratory capacities, and improvement of border SPS management. In 2017, CAREC is piloting two new initiatives: the CAREC Advanced Transit System (CATS) and CAREC Customs Information Common Exchange (ICE) along CAREC sub-corridor 2a (Azerbaijan, Georgia and Kazakhstan) (CAREC 2017b). CATS will streamline and harmonize transit documentation, replace manual processes with a single electronic messaging system, and provide a modern, risk-based and affordable guarantee mechanism. Under ICE, the Customs Data Exchange Protocol will enable the electronic exchange of data and promote real-time collaboration between customs administrations.
Other CAREC Operational Priorities. The Almaty–Bishkek Economic Corridor (ABEC) seeks to transform the corridor into a single space, where the exchange of ideas, movement of goods, and people-to-people contact are faster, easier, and barrier-free. In November 2016, the Intergovernmental Council chaired by the prime ministers of Kazakhstan and the Kyrgyz Republic signed a protocol establishing the ABEC Subcommittee. An investment pipeline is being considered by governments and early-action projects are being developed. CAREC’s capacity development agenda involves the CAREC Institute (CI)—physically established in March 2015 in Urumqi, PRC and legally set up as an inter-governmental organization in September 2017—which provides knowledge and relevant training to CAREC partners and promotes use of international best practices.

Asian Economic Integration Report 201768 Subregional Cooperation Initiatives 69
Prospects
At the 15th Ministerial Conference in October 2016, CAREC members agreed to begin working on a new development strategy following an extensive Mid-Term Review. To ensure relevance, ownership, and effective implementation, the process for formulating the new long-term strategy, CAREC 2030, involves consultations and participation from officials of all 11 CAREC members, multilateral and bilateral partners, the private sector, think tanks, and civil society. CAREC 2030 will bring a coordinated response to the multi-dimensional development challenges the subregion faces and consider new multilateral frameworks and initiatives—including the possibility of a broader mission and sectoral coverage to complement national efforts in achieving sustainable development goals and the 21st Conference of the Parties targets as an open and inclusive regional platform.
With much of Central Asia interconnected by road and rail—and with links to the rest of Asia and Europe—the logical next step is to build seamless air connectivity. Due to its strategic location, CAREC could become an aviation hub of both passenger and freight transport. Thus, CAREC 2030 calls for concerted actions of CAREC member countries to enhance aviation cooperation toward a regional open skies agreement.
Policy Challenges
The CAREC region has historically been susceptible to external economic shocks. Designing and implementing appropriate countercyclical policy responses in periods of the economic downturns remain challenging for the CAREC countries. CAREC countries find challenges with the pursuit of economic diversification, particularly with the expansion of trade in services. Against the backdrop of global trade growth slowing down, it becomes even more imperative for CAREC countries to further reduce technical barriers to trade and rationalize SPS measures to facilitate trade. Among the 11 member countries, eight countries are WTO members. Newly acceded countries are obliged to fulfill their WTO commitments by conducting necessary policy reforms for which the government require capacity building and knowledge solutions. CAREC, as an influential regional cooperation platform, thus plays an important role in helping connect
people, policies, and projects for shared and sustainable development for the CAREC region.
Southeast Asia: Greater Mekong Subregion Program24 Cambodia, the PRC (Yunnan Province and Guangxi Zhuang Autonomous Region), the Lao People’s Democratic Republic (Lao PDR), Myanmar, Thailand, and Viet Nam make up the Greater Mekong Subregion (GMS) Program. In over 25 years of cooperation, the GMS has created an interconnected subregion that continues to see improved economic growth amid enhanced connectivity and competitiveness.
Overview
The GMS—with a regional GDP growth of 5.9% in 2016—continues its robust economic growth supported by increased regional transport connectivity (Table 6.2). Road density, defined as kilometers of road per square kilometer (km/km2), increased 30% from 0.24 km/km2 in 2006 to 0.31 km/km2 in 2014, primarily due to new road transport networks being developed in Yunnan, Guangxi, Viet Nam, and Cambodia. These are contributing to the development of new urban centers and economic zones. Foreign direct investment (FDI) to the subregion increased from $10.8 billion in 2005 to $33.1 billion in 2015, while aggregate intraregional FDI increased from $8.3 billion in 2001–2006 to $29.2 billion in 2010–2015.
The program continues to be guided by the GMS Strategic Framework 2012–2022 (ADB 2011), which is anchored on economic corridor development. Strategic sectors of cooperation include: (i) strengthening transport linkages; (ii) delivering sustainable and secure energy; (iii) developing and promoting tourism along the Mekong as a single destination; (iv) promoting competitive, climate-friendly, and sustainable agriculture; (v) enhancing environmental performance; and (vi) supporting human resource development (HRD) to facilitate GMS integration.
24 Contributed by the GMS Secretariat.

Asian Economic Integration Report 201770 Subregional Cooperation Initiatives 71
Table 6.2: Selected Economic Indicators, 2016—Greater Mekong Subregion
Population (million)
Nominal GDP ($ billion)
GDP Growth (2012–2016 average, %)
GDP per Capita (current prices, $)
Trade Openness (total trade, % of GDP)
FDI Openness (total FDI inflows,
% of GDP)
Cambodia 16 20.0 7.2 1,268.80 107.3 9.4
Guangxi, PRC 48 274.2 9.1 5,668.50 17.5 0.6
Yunnan, PRC 47 223.5 10.1 4,713.70 9.5 1.4
Lao PDR 7 13.8 7.3 1,921.10 79.7 9.9
Myanmar 52 58.9 7.6 1,127.90 23.1 4.5
Thailand 69 407.0 3.4 5,900.60 96.4 2.7
Viet Nam 93 201.3 5.9 2,173.20 174.5 6.1
GMS 333 1,198.80 6.7 3,604.30 73.5 2.8
FDI = foreign direct investment, GDP = gross domestic product, GMS = Greater Mekong Subregion, Lao PDR = Lao People’s Democratic Republic, PRC = People’s Republic of China.Notes: GMS average GDP growth rate is weighted using nominal GDP. Total trade is the sum of exports and imports. FDI openness is based on 2015 data.Sources: ADB calculations using data from CEIC; and Greater Mekong Subregion Statistical Database. www.greatermekong.org/statistics/ (accessed May 2017).
Projects across these key sectors are consolidated under the GMS Regional Investment Framework (2013–2022) (GMS Secretariat 2013) to develop projects and mobilize financing for regional connectivity. Progress is tracked, monitored, and refined through the GMS Program Secretariat and various working groups involving national line ministries. A 2016 Study on Strengthening the Greater Mekong Subregion Program’s Institutional Framework (GMS Secretariat 2016a) found that through nearly 25 years of GMS Program cooperation, the GMS Program demand is for an activities- and projects-based initiative using a results-oriented approach.
Performance and Progress over the Past Year The GMS Program expanded GMS Economic Corridors to continue to advance its transport network, focusing on strengthened regional connectivity. Projects support regional health security, transport and trade facilitation, new urban center development along GMS corridors and border areas, and regional industry and trade through tourism and agricultural value chains.
Progress in the GMS is underpinned by improvements in cross-border connectivity and enhanced transport networks. Other sectors of cooperation include energy, urban development, tourism, agriculture, the
environment, and HRD. Substantial financial resources have contributed to this progress. As of 2016, for example, a total of $19.1 billion have been invested in GMS projects by GMS governments and multilateral and bilateral development partners. Of this, ADB has contributed $7.3 billion in 84 investment projects in the GMS (Figure 6.4).
Cross-border Physical Connectivity. In 2016, physical connectivity across the GMS benefited from the completion of three new bridges along GMS economic corridors—the Lao PDR–Myanmar Friendship Bridge over the Mekong River at Xiengkok–Kyainglap; the Tsubasa Bridge in Neak Loeung, Cambodia along the GMS Southern Economic Corridor; and a railway bridge between Cambodia and Thailand at Poipet–Klong Loeuk. Sections of the East–West Economic Corridor in Myanmar—Eindu–Kawkareik and the Mae Sot–Myawaddy border with Thailand—are also under construction.
To keep pace with the shifting patterns of trade, investment, tourism, and other economic flows—and the opening of Myanmar’s economy in recent years—a review of the current configuration of the major GMS economic corridors was conducted in 2016. Following the study, the 21st GMS Ministerial Conference in December 2016 approved the extension and expansion of the GMS economic corridors to link all GMS capitals, major economic centers, and important GMS maritime gateways—including missing sections in Myanmar, as well as important new sections in the Lao PDR.
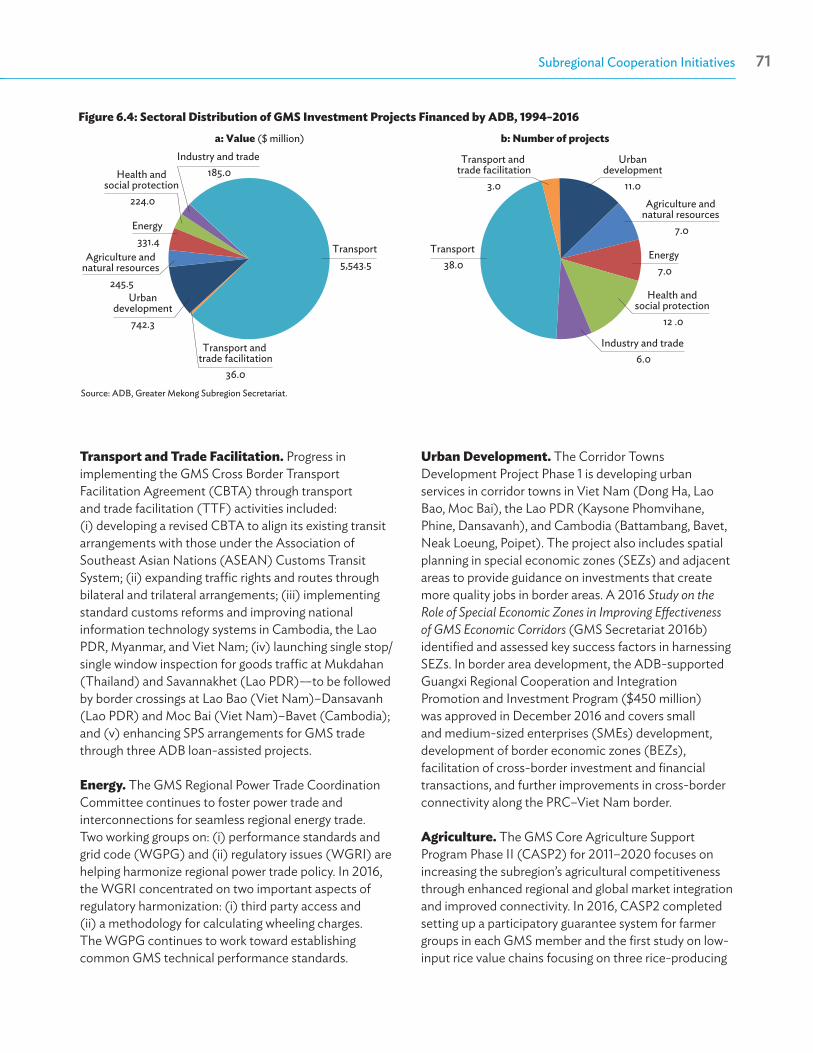
Asian Economic Integration Report 201770 Subregional Cooperation Initiatives 71
Figure 6.4: Sectoral Distribution of GMS Investment Projects Financed by ADB, 1994–2016
Source: ADB, Greater Mekong Subregion Secretariat.
Transport 5,543.5
Transport and trade facilitation
36.0
Urbandevelopment
742.3
Agriculture and natural resources
245.5
Energy 331.4
Health and social protection
224.0
Industry and trade 185.0
a: Value ($ million)
Transport 38.0
Transport and trade facilitation
3.0
Urbandevelopment
11.0Agriculture and
natural resources 7.0
Energy 7.0
Health and social protection
12 .0
Industry and trade 6.0
b: Number of projects
Transport and Trade Facilitation. Progress in implementing the GMS Cross Border Transport Facilitation Agreement (CBTA) through transport and trade facilitation (TTF) activities included: (i) developing a revised CBTA to align its existing transit arrangements with those under the Association of Southeast Asian Nations (ASEAN) Customs Transit System; (ii) expanding traffic rights and routes through bilateral and trilateral arrangements; (iii) implementing standard customs reforms and improving national information technology systems in Cambodia, the Lao PDR, Myanmar, and Viet Nam; (iv) launching single stop/single window inspection for goods traffic at Mukdahan (Thailand) and Savannakhet (Lao PDR)—to be followed by border crossings at Lao Bao (Viet Nam)–Dansavanh (Lao PDR) and Moc Bai (Viet Nam)–Bavet (Cambodia); and (v) enhancing SPS arrangements for GMS trade through three ADB loan-assisted projects.
Energy. The GMS Regional Power Trade Coordination Committee continues to foster power trade and interconnections for seamless regional energy trade. Two working groups on: (i) performance standards and grid code (WGPG) and (ii) regulatory issues (WGRI) are helping harmonize regional power trade policy. In 2016, the WGRI concentrated on two important aspects of regulatory harmonization: (i) third party access and (ii) a methodology for calculating wheeling charges. The WGPG continues to work toward establishing common GMS technical performance standards.
Urban Development. The Corridor Towns Development Project Phase 1 is developing urban services in corridor towns in Viet Nam (Dong Ha, Lao Bao, Moc Bai), the Lao PDR (Kaysone Phomvihane, Phine, Dansavanh), and Cambodia (Battambang, Bavet, Neak Loeung, Poipet). The project also includes spatial planning in special economic zones (SEZs) and adjacent areas to provide guidance on investments that create more quality jobs in border areas. A 2016 Study on the Role of Special Economic Zones in Improving Effectiveness of GMS Economic Corridors (GMS Secretariat 2016b) identified and assessed key success factors in harnessing SEZs. In border area development, the ADB-supported Guangxi Regional Cooperation and Integration Promotion and Investment Program ($450 million) was approved in December 2016 and covers small and medium-sized enterprises (SMEs) development, development of border economic zones (BEZs), facilitation of cross-border investment and financial transactions, and further improvements in cross-border connectivity along the PRC–Viet Nam border.
Agriculture. The GMS Core Agriculture Support Program Phase II (CASP2) for 2011–2020 focuses on increasing the subregion’s agricultural competitiveness through enhanced regional and global market integration and improved connectivity. In 2016, CASP2 completed setting up a participatory guarantee system for farmer groups in each GMS member and the first study on low-input rice value chains focusing on three rice-producing
Asian Economic Integration Report 201772 Subregional Cooperation Initiatives 73
countries—Cambodia, Thailand, and Viet Nam. It conducted vital national and regional capacity building, piloted climate-friendly and gender-responsive agriculture practices at the farm production level, and applied research and extension work on climate-and environment-friendly agricultural practices.
Tourism. With 57.9 million tourist arrivals in 2015 generating $65 billion in the GMS—contributing as much as 15% of GDP in Cambodia and allowing 89% of tourists visiting the Lao PDR to arrive by land—regional transport connectivity is having a deep impact on several GMS economies. A new GMS Tourism Sector Strategy for 2016–2025 was recently completed, setting out a framework to guide cooperation between GMS national tourism organizations and other tourism industry stakeholders. The strategy outlines five strategic directions: HRD, improving tourism infrastructure, enhancing visitor experiences and services, encouraging creative marketing and promotion, and facilitating regional travel. Corresponding programs and projects were selected for each strategic area based on their potential to enable more competitive, balanced, and sustainable destination development.
Human Resource Development. HRD covers education, technical and vocational skills, cooperation on health, and labor and migration. The GMS, ASEAN, and national development programs are working to increase and support regional labor mobility. Mutual recognition of skills and qualifications was expanded to cover additional areas of logistics, machinery, and food processing. The Quality Assurance System—using established ASEAN University Network standards—and the Academic Credit Transfer System Framework for Asia among GMS universities have both shown progress. A GMS University Consortium of 24 GMS universities has been established to further foster networking in tertiary education among GMS members. Communicable disease control and management has been further strengthened—including implementing malaria and tuberculosis prevention and treatment initiatives for migrant and mobile populations in Cambodia, the Lao PDR, Myanmar, and Viet Nam. A new GMS Health Security Project was approved for ADB financing for these four countries to contribute to the enhancement of GMS public health security and strengthen national and regional capacity for disease surveillance and response, risk assessment, case management, and subregional collaboration.
Environment. The GMS continues to strengthen management of transboundary environmental issues. This includes: (i) developing national environmental policies and strategies in Cambodia, the Lao PDR, and Viet Nam; (ii) supporting the application of sound environment management policies and tools—including the launch of Myanmar’s environmental impact assessment procedure and environmental quality guidelines, applying land use planning simulation modeling in Cambodia and the Lao PDR, and industrial pollution projection modeling in Cambodia and Myanmar; (iii) jointly developing transboundary biodiversity landscape monitoring and evaluation framework; (iv) creating transboundary conservation plans for rare species; and (v) promoting fuel efficient technologies, eco-driver training, and improved logistics measures—successfully tested in the Lao PDR and Viet Nam, and under way in Thailand.
Prospects and Future Strategies
As the GMS Program celebrates 25 years of cooperation, a Midterm Review of the GMS Strategic Framework 2012–2022 and several sector strategies are under way covering the next 5 years. Through 2017, a Strategy and Action Plan for Promoting Safe and Environment-Friendly Value Chains in the GMS is being developed, focusing on strengthening GMS competitive advantage through value-chain integration—particularly for smallholder farmers, rural women, and agricultural SMEs. The Action Plan will outline key GMS investments through the GMS Regional Investment Framework as well as policy and institutional measures. The Strategy and Action Plan will strengthen member commitment to food safety, market access for small producers, and inclusive food safety. HRD conducted a review of the latest Strategy and Action Plan to formulate and shape new strategic directions covering health, education, labor and migration, and social development. The new strategies on agriculture value chains and regional HRD cooperation—along with the new economic corridor alignment and GMS Tourism Sector Strategy 2016–2025—will drive investments in regional connectivity for the foreseeable future.
Asian Economic Integration Report 201772 Subregional Cooperation Initiatives 73
Policy Challenges
Implementing the GMS Cross-Border Transport Facilitation Agreement is a major challenge for the subregion.
As regional transport networks expand, tourism grows, and agricultural and industrial trade integrates across the region, the greatest challenge will be implementing the GMS CBTA fully. The GMS ministers of the National Transportation Facilitation Committee are committed, on a pilot basis, to test the GMS Road Transport Permit—allowing approved vehicles to travel freely across GMS country borders—as first step in implementing the CBTA. They are committed to full CBTA implementation by 2019. On transport facilitation, trade facilitation measures will also need to accelerate—in areas like SPS systems—to support intra-GMS trade in agriculture, food, and forest products.
The financing gap for GMS infrastructure investment is $6.4 billion, estimated in the 2016 Midterm Review of the Regional Investment Framework Implementation Plan. Greater participation and investments from the private sector—in the form of public private partnerships (PPP)—can help close the gap. This will require the GMS governments to strengthen PPP policy frameworks, bidding, and risk allocation to attract private sector investment.
East Asia: Support to CAREC and GMS Programs25
ADB supports regional cooperation and integration (RCI) in East Asia through the CAREC and GMS programs. It works to maximize synergies with new cooperation initiatives led by government stakeholders (including the BRI, for example). ADB has strengthened lending support to the PRC and Mongolia for RCI operations; covering connectivity, border economic zone development, SME development, border-crossing improvement, and single-window customs clearance, among others.
25 Contributed by Ying Qian, Director and Yuebin Zhang, Principal Regional Cooperation Specialist, East Asia Department.
Performance and Progress over the Past Year
ADB continues to support projects in Mongolia and the PRC that relate to CAREC and GMS economic cooperation.26
Mongolia. Under the Western Regional Road Corridor Development Program, ADB supports development of about 300 km of the 743 km corridor in CAREC Corridor 4a. The corridor—part of Asian Highway 4—runs north–south from Mongolia’s border with the Russian Federation at Ulaanbayshint to its border with the PRC at Yarant. As of 2016, paved roads covered just over 5% of Mongolia’s total road network with the majority of roads unimproved road tracks.
Under CAREC, ADB is helping Mongolia implement two loan projects—Regional Improvement of Border Services (RIBS) and the Mongolia Upgrades of Sanitary and Phytosanitary Measures for Trade (MUST). RIBS addresses inefficient trade processes by rehabilitating BCP facilities; upgrading the Customs Automated Information System; constructing access roads in border areas; and developing the national single-window customs platform for international trade. The project will improve connectivity and cross-border cooperation to reduce BCP costs and processing time.
Mongolia is taking the lead in implementing the CAREC Common Agenda for Modernization of SPS Measures through its MUST project. The project will improve laboratories, inspection and quarantine facilities at the key BCPs in three aimags (provinces), establish an integrated SPS inspection management system, and align SPS control and inspection with international standards. A regional technical assistance project on Transforming SPS Measures for Trade Facilitation was proposed in 2017 to further help implement the project.
Joint customs control is a priority under the CAREC Customs Cooperation Committee work program to share a common set of information and reduce repetitive customs inspections. A pilot joint customs project
26 ADB’s East Asia Department (EARD) provides technical and administrative support for the CAREC Trade Facilitation program. EARD also provides direct support to Mongolia for participating in CAREC, and to selected provinces and autonomous regions of the PRC involved with CAREC and the GMS.
Asian Economic Integration Report 201774 Subregional Cooperation Initiatives 75
between Mongolia and the PRC reported increased international cooperation and better management and coordination between the two customs administrations. It improved consistency in implementing customs control measures and saw a significant decrease in fraud (for example, less undervaluation and underweighting goods). A case study documenting the success factors of the pilot project and recommendations on how to replicate the experience at other BCPs is being finalized.
The People’s Republic of China. RCI is an integral part of ADB operations in the PRC, and one of the five strategic priorities of its Country Partnership Strategy 2016–2020 with the PRC. In 2016, ADB processed a multitranche financing facility and the first tranche of the Guangxi Regional Cooperation and Integration Promotion Investment Program to support Guangxi’s involvement in regional cooperation—particularly the GMS program. The investment program uses a holistic approach to address the wide range of RCI issues Guangxi faces. The project is also intended to be a model for future investment projects in other border provinces participating in RCI programs.
ADB continues to support PRC participation in GMS economic cooperation. It supports the memorandum of understanding (MOU) between the PRC and Viet Nam on jointly developing BEZs. A new regional technical assistance project further supports BEZ development by (i) formulating policy recommendations for coordinated BEZ development, (ii) strengthening coordination mechanisms for the development and management of the BEZs and public–private coordination, and (iii) conducting capacity building for government stakeholders. The MOU should boost trade and investment, contributing to the development of the GMS North–South Economic Corridor.
ADB and the PRC government jointly organized a regional knowledge sharing workshop on Development of Special Economic Zones as Catalysts for Economic Corridors in September 2016 in Shanghai. The workshop brought together more than 50 participants from ADB’s developing member countries (DMCs) to share lessons and experience on SEZ development and economic corridors.
In 2017, the $50-million second replenishment of the Poverty Reduction and Regional Cooperation Fund—established in 2005—came into effect. The PRC led the establishment of the CI with CAREC to conduct a Time Release Study and Corridor Performance Measurement and Monitoring subregional workshop in April 2017—to improve border management efficiency. There are plans to partner with the CI on a Regional Knowledge Sharing Initiative with the CAREC Federation of Carrier and Forwarder Association to discuss harmonizing standards for logistics operators in the subregion (in compliance with international best practices).
CAREC Trade Facilitation Program. A new CAREC Trade Facilitation Strategic Framework will be formulated to further broaden and deepen (i) implementation of the WTO TFA in close cooperation with trade policy agencies and related stakeholders, including the private sector; (ii) the current customs and integrated trade facilitation agenda; (iii) potential work on people mobility; and (iv) resolution of cross-sectoral trade facilitation issues anchored on economic corridor development like SEZs and cross-border economic zones (CBEZs), participation in regional and global value chains, e-commerce, cross-border finance, and access to trade by SMEs, among others.
Consultations with the PRC on the new CAREC Strategy 2030 led to three government recommendations on connectivity: (i) to focus on expanding connectivity, enhancing transport efficiency, and promoting green transportation—in particular the PRC–Kyrgyz Republic–Uzbekistan railway project—and liberalizing aviation markets by coordinating security and aviation infrastructure development, if possible with the BRI; (ii) to provide capacity building support on customs cooperation and standardizing customs procedures, developing CBEZs, and implementing WTO TFA provisions; and (iii) to facilitate negotiations on regional trade agreements, promote e-commerce to link SMEs to regional value chains, and enhance the region’s digital economy.

Asian Economic Integration Report 201774 Subregional Cooperation Initiatives 75
Prospects
The PRC‘s BRI—Silk Road Economic Belt and 21st Century Maritime Silk Road—aims to promote connectivity and strengthen economic partnerships across Asia, Europe, and Africa. It highlights five priorities for cooperation: (i) fostering economic and development policy coordination; (ii) strengthening connectivity through energy, transport, and telecommunications infrastructure; (iii) promoting trade and investment; (iv) deepening financial cooperation and integration; and (v) promoting people-to-people exchanges. The potential to enhance synergies between ADB-supported RCI programs and BRI is significant.
Policy Challenges
Implementing the TFA within CAREC is a challenge that will require technical assistance.
With TFA effectivity, CAREC countries who are WTO members will need to: (i) have a National Committee on Trade Facilitation in place, (ii) notify WTO of Category A designations, (iii) implement Category A designations, and (iv) notify WTO of Category B and C designations
along with indicative dates for implementation. An assessment of the readiness of CAREC countries (both WTO members and nonmembers) to implement the TFA has been done to determine appropriate technical assistance required. Coordinated support from donors will be critical to help make TFA implementation a priority.
South Asia: South Asia Subregional Economic Cooperation27
In 2001, Bangladesh, Bhutan, India, and Nepal launched the South Asia Subregional Economic Cooperation (SASEC) initiative, with ADB assistance, to help address constraints of size, geography, and institutional capacity hindering development in South Asia (Table 6.3). Maldives and Sri Lanka joined in 2014, followed by Myanmar in 2017, expanding the potential for RCI from a subregional to inter-regional level. ADB acts as lead financier, secretariat, and development partner. Its support covers: (i) capacity building and institutional strengthening, (ii) regional initiatives, and (iii) financing for projects and technical assistance.
27 Contributed by Rose McKenzie, Senior Regional Cooperation Specialist, South Asia Department (SARD) and Jesusito Tranquilino, ADB Consultant, SARD.
Table 6.3: Selected Economic Indicators, 2016—SASEC
Population (million)
Nominal GDP ($ billion)
GDP Growth (%, 2012–2016, average)
GDP Per Capita (current prices, $)
Trade Openness (total trade, % of GDP)
Bangladesh 162.9 221.4 6.5 1,359 33.1
Bhutan 0.8 2.1 5.3 2,695 102.7
India 1,326.9 2,259.6 6.9 1,703 27.4
Maldives 0.4 3.8 3.9 9,021 65.5
Nepal 28.9 21.2 3.4 735 40.3
Sri Lanka 21.2 81.3 5.3 3,843 34.3
SASEC 1,541.0 2,589.4 6.7 1,680 28.3
GDP = gross domestic product, SASEC = South Asia Subregional Economic Cooperation.Note: SASEC average GDP growth rate is weighted using nominal GDP.Sources: ADB calculations using data from ADB. 2017. Asian Development Outlook 2017. Manila; CEIC; International Monetary Fund. Direction of Trade Statistics. https://www.imf.org/en/Data; and World Bank. World Development Indicators. http://databank.worldbank.org (all accessed May 2017).
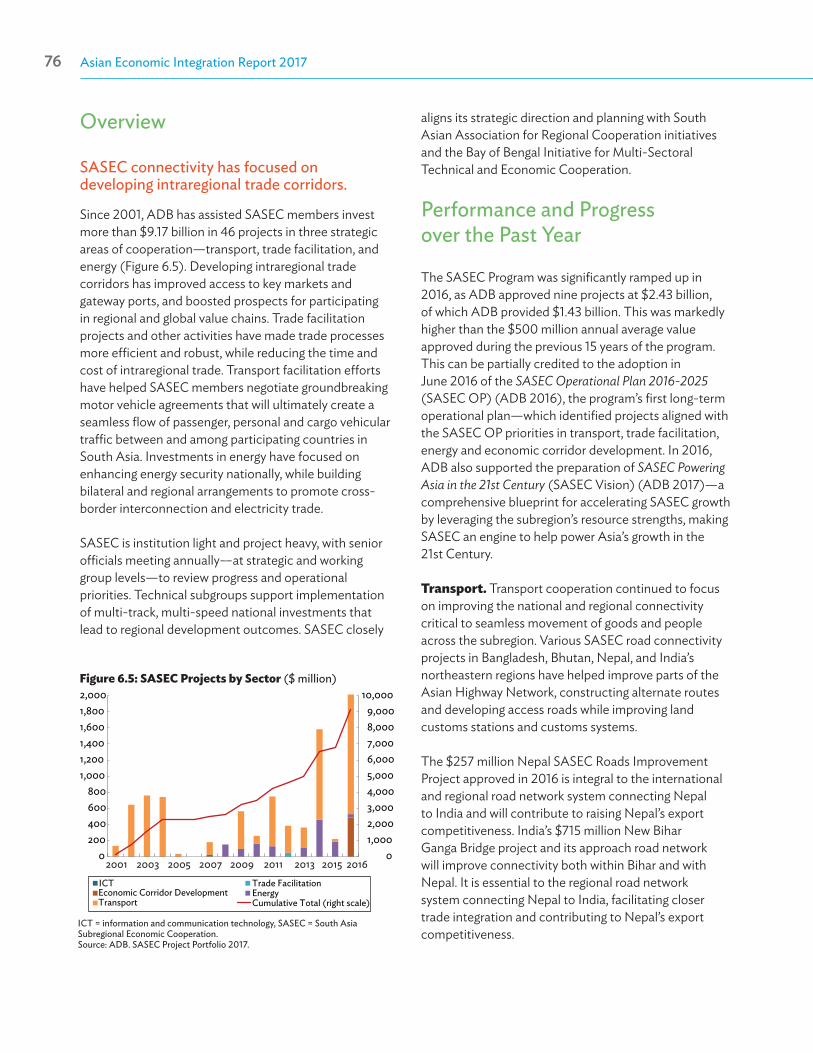
Asian Economic Integration Report 201776 Subregional Cooperation Initiatives 77
Overview
SASEC connectivity has focused on developing intraregional trade corridors.
Since 2001, ADB has assisted SASEC members invest more than $9.17 billion in 46 projects in three strategic areas of cooperation—transport, trade facilitation, and energy (Figure 6.5). Developing intraregional trade corridors has improved access to key markets and gateway ports, and boosted prospects for participating in regional and global value chains. Trade facilitation projects and other activities have made trade processes more efficient and robust, while reducing the time and cost of intraregional trade. Transport facilitation efforts have helped SASEC members negotiate groundbreaking motor vehicle agreements that will ultimately create a seamless flow of passenger, personal and cargo vehicular traffic between and among participating countries in South Asia. Investments in energy have focused on enhancing energy security nationally, while building bilateral and regional arrangements to promote cross-border interconnection and electricity trade.
SASEC is institution light and project heavy, with senior officials meeting annually—at strategic and working group levels—to review progress and operational priorities. Technical subgroups support implementation of multi-track, multi-speed national investments that lead to regional development outcomes. SASEC closely
Figure 6.5: SASEC Projects by Sector ($ million)
ICT = information and communication technology, SASEC = South Asia Subregional Economic Cooperation.Source: ADB. SASEC Project Portfolio 2017.
01,0002,0003,0004,0005,0006,0007,0008,0009,000
10,000
0200400600800
1,0001,2001,4001,6001,8002,000
2001 2003 2005 2007 2009 2011 2013 2015 2016
Economic Corridor DevelopmentICT Trade Facilitation
EnergyTransport Cumulative Total (right scale)
aligns its strategic direction and planning with South Asian Association for Regional Cooperation initiatives and the Bay of Bengal Initiative for Multi-Sectoral Technical and Economic Cooperation.
Performance and Progress over the Past Year
The SASEC Program was significantly ramped up in 2016, as ADB approved nine projects at $2.43 billion, of which ADB provided $1.43 billion. This was markedly higher than the $500 million annual average value approved during the previous 15 years of the program. This can be partially credited to the adoption in June 2016 of the SASEC Operational Plan 2016-2025 (SASEC OP) (ADB 2016), the program’s first long-term operational plan—which identified projects aligned with the SASEC OP priorities in transport, trade facilitation, energy and economic corridor development. In 2016, ADB also supported the preparation of SASEC Powering Asia in the 21st Century (SASEC Vision) (ADB 2017)—a comprehensive blueprint for accelerating SASEC growth by leveraging the subregion’s resource strengths, making SASEC an engine to help power Asia’s growth in the 21st Century.
Transport. Transport cooperation continued to focus on improving the national and regional connectivity critical to seamless movement of goods and people across the subregion. Various SASEC road connectivity projects in Bangladesh, Bhutan, Nepal, and India’s northeastern regions have helped improve parts of the Asian Highway Network, constructing alternate routes and developing access roads while improving land customs stations and customs systems.
The $257 million Nepal SASEC Roads Improvement Project approved in 2016 is integral to the international and regional road network system connecting Nepal to India and will contribute to raising Nepal’s export competitiveness. India’s $715 million New Bihar Ganga Bridge project and its approach road network will improve connectivity both within Bihar and with Nepal. It is essential to the regional road network system connecting Nepal to India, facilitating closer trade integration and contributing to Nepal’s export competitiveness.
Asian Economic Integration Report 201776 Subregional Cooperation Initiatives 77
Two ADB-supported railway enhancement projects in Bangladesh, approved in 2016 with a combined value of $890 million will improve the international connectivity of the rail system. These include sections of the Dohazari–Cox’s Bazar route along the overall Chittagong–Cox’s Bazar trade corridor, moving the SASEC–Myanmar Corridor toward completion—promoting inter-regional connectivity with Southeast Asia.
An additional $4 million in financing for Bhutan’s airports supports development of a safe, reliable, and efficient air transport system connecting urban and rural centers in Bhutan, improving accessibility, promoting tourism and high-value agriculture.
Trade Facilitation. SASEC’s Trade Facilitation Strategic Framework 2014–2018 (ADB 2014) focuses support to SASEC countries in five priority areas: (i) customs modernization and harmonization; (ii) standards and conformity assessments, primarily SPS and technical barriers to trade (TBT) measures; (iii) improvement of cross-border facilities; (iv) transport facilitation; and (v) institutional capacity building.
The SASEC Customs Subgroup coordinates subregional and national projects designed to promote trade facilitation, strengthen inter-agency cooperation and provide a regional knowledge-sharing platform. Projects focus on improving cross-border procedures and providing support to users of the Automated System for Customs Data World system. National and regional diagnostic studies in SPS and TBT will help identify and address nontariff barriers in the subregion. An electronic cargo tracking system initiative was launched in SASEC to speed up transit movement, simplify border-crossing procedures, and reduce congestion—by using satellite positioning systems, cellular communications, radio frequency identification, electronic seals, and monitoring software. Electronic tracking system technology also improves security of goods in transit and opens the way for off-border customs processes for exports, leading to substantial savings in time and cost for traders. Implementing the WTO TFA is a key area for coordinated capacity building in coordination with other development partners.
Energy. Energy cooperation continues to focus on enhancing electricity trade to expand and diversify the subregion’s energy supply—to meet energy needs and
secure power reliability. SASEC countries are forging arrangements for energy trade. Bhutan and Nepal are developing hydropower for export to neighbors. Meanwhile, transmission projects are strengthening Nepal’s national power grid in preparation for energy trade. Nepal’s power system expansion was approved in 2016—to support installation of utility-scale solar power to augment energy supply and expand domestic power transmission capacity for better power trade with India.
The SASEC Electricity Transmission Utility Forum completed its review of a transmission master plan study in December 2016, affirming the net economic benefits from interconnecting power systems in the subregion for power trading. Larger benefits will accrue from multi-country arrangements and from mitigating greenhouse gases as hydropower replaces fossil fuels. The SASEC countries agreed on the need to examine alternative scenarios that account for recent and future changes in each country’s energy situation. They also agreed on the need for an enhanced forum for capacity building, knowledge sharing and consensus-building on transmission plans along with technical and other issues involving regional power trade.
Economic Corridor Development. A new area of SASEC focus, economic corridor development (ECD) builds on the backbone of transport corridors, by leveraging—in the case of SASEC—infrastructure connectivity and cities as growth centers to unlock full market potential. This means SASEC transport connectivity and trade facilitation efforts will be augmented and strengthened by a multi-sector approach that includes developing special economic/industrial zones and logistics centers—backed by better coordinated planning and policies that raise the competitiveness of domestic enterprises.
India’s $484-million Visakhapatnam–Chennai Industrial Corridor (VCIC) Development Program was approved by ADB as the first SASEC ECD investment. It will complement ongoing efforts in Andhra Pradesh to enhance industrial growth and create high-quality jobs, focusing on priority infrastructure in VCIC with concomitant support for policy reform and institutional development. The VCIC is the first phase of India’s East Coast Economic Corridor (ECEC), which runs from Kolkata to Kanyakumari—a multimodal, regional maritime corridor that should help integrate India’s
Asian Economic Integration Report 201778 Subregional Cooperation Initiatives 79
economy with the dynamic global value chains in Southeast Asia and East Asia.
In Bangladesh, ADB is also supporting the development of the Khulna–Dhaka–Sylhet (KDS) Corridor to link the lagging southwest and northeast regions and integrate them with the vibrant growth centers of Dhaka and Chittagong. Phase 1 of the KDS Corridor involves preparing a comprehensive development plan for the Southwest Economic Corridor. In Sri Lanka, an ADB-funded conceptual study has identified potential economic corridors, gauging how best to strengthen domestic supply chains and join the global manufacturing supply chain. The Colombo–Trincomalee Economic Corridor (CTEC) will link the Colombo–Gampha west region with the central and eastern part of the island. CTEC can accommodate several industry clusters—including garments and new export-oriented manufacturing as well as agribusiness and tourism.
Prospects
SASEC Vision and Operational Plan. In April 2017, SASEC Finance Ministers launched their shared SASEC Vision, which articulates SASEC aspirations and how they can be achieved through regional collaboration. Framing the partnership in the larger context of the subregion’s collective growth and development, it lays out a plan to transform the subregion by generating synergies and leveraging natural resource-based industries, promoting industry linkages to develop regional value chains, and expanding trade and commerce by developing subregional gateways and hubs.
The SASEC OP supports the SASEC vision by identifying strategic objectives and operational priorities for transport, trade facilitation, and energy, while introducing ECD as a new area of strategic cooperation. It expands the scope of SASEC investments to: (i) strengthen regional connectivity
in railways and through seaports and inland waterways, (ii) increase focus on maritime-based trade facilitation together with SPS and standards conformity, and (iii) develop more clean energy and accelerate development of South Asia’s power trade. It examines the development impact of promoting synergies between economic corridors under development. The SASEC OP is supported by over 200 potential projects identified by SASEC partners worth more than $120 billion—to be implemented during 2016–2025.
Policy Challenges
Over the coming decade, SASEC will see the share of its working age population rise—a “demographic dividend” that presents both an opportunity and challenge for subregional development.
If harnessed properly, this demographic dividend could catapult the subregion into one of the fastest growing subregions in Asia. The SASEC Vision recognizes that upping the ante in RCI will improve the chances of realizing the economic potential of the demographic dividend.
Each SASEC member should take strong ownership of the Vision—a commitment to a challenging and dynamic process requiring multi-stakeholder involvement for cohesive planning and effective coordination of programs, projects, and policies. This process will entail several steps or layers, beginning with organizing cross-country advocacy forums, filtering both short- and long-term strategic initiatives for each country, sorting policies to guide both public and private investment, building consensus on needed interventions, agreeing on institutional mechanisms for moving the Vision forward, and putting in place risk management mechanisms covering project planning, financing, implementation, and monitoring and evaluation.
Asian Economic Integration Report 201778 Subregional Cooperation Initiatives 79
The Pacific: Regional Approach to Renewable Energy Investments28 A regional approach to renewable energy investments provides a unique opportunity for Pacific developing member countries to share experience and learn from innovation across the subregion.
The Framework for Pacific Regionalism—endorsed by Pacific Islands Forum Leaders in July 2014—is the current master strategy for strengthening RCI in the broader Pacific subregion, where climate change is a major priority. In December 2016, the Green Climate Fund (GCF) approved funding to support an ADB program to assist seven Pacific DMCs in transitioning to a renewable energy future. An initial $12-million grant for the Cook Islands to install energy storage systems and support private investment in renewable energy will spearhead a series of projects. A $5-million grant was also approved to improve the energy sector policies and institutions in the Pacific. The proposed program will help develop feasibility studies for renewable energy projects worth over $400 million in the remaining six Pacific DMCs. The program, however, may be extended to the other Pacific DMCs.
Overview
The Pacific Islands Renewable Energy Investment Program (PIREIP) was conceptualized as part of the GCF Pacific Roadmap developed during the GCF Pacific Regional meeting in August 2016, attended by leaders and Ministers from all Pacific island countries. PIREIP supports a shift from diesel power generation to renewable energy in the Cook Islands, the Republic of Marshall Islands, the Federated States of Micronesia (FSM), Nauru, Papua New Guinea, Samoa, and Tonga. A concerted move toward solar, hydropower, and wind energy will place these seven Pacific DMCs on a more sustainable and climate-resilient development pathway. The program is expected to support 22 solar
28 Contributed by Paul Curry, Principal Operations Coordination Specialist; and Rommel Rabanal, Senior Economics Officer, Pacific Department.
power plants, five wind farms, eight hydropower plants, seven energy storage facilities, and 25 renewable energy mini-grids. Combined, these investments will reduce greenhouse gas emissions by an estimated 120,000 tons of carbon dioxide equivalent per year.
A Paradigm Shift in Energy Production
The new energy pathway is low-carbon and climate resilient, while also expanding energy access to marginalized populations.
PIREIP is designed to help DMCs rapidly shift from their current traditional energy profile—which has been almost entirely dependent on fossil fuels—to a more progressive and sustainable pathway.
The program supports Pacific DMCs in overcoming the investment and technical barriers to integrate higher shares of renewables in their energy mix. Technical integration of intermittent renewable energy poses significant challenges, particularly on small grids managed by utilities with relatively limited system management capacity. To date, most Pacific DMCs have already gained valuable experience with small amounts of grid-connected solar and wind power, which existing diesel generator-dominated systems can integrate without much problem. However, as renewable energy shares increase, the relatively simple diesel grids will require significant upgrades—most notably in battery storage—and better system management. In general, the Pacific remains at the start of the investment cycle for renewable energy integration beyond small initial investments. This suggests that significant challenges are best addressed through a regional approach.
PIREIP also supports the promotion of greater private sector participation and investment to support the structural shift toward renewable energy. This is particularly important to those Pacific DMCs that lack sufficient sovereign financing and require technical support to manage the transition. Also, there exist significant financial disincentives for corporatized Pacific power utilities reliant on high-cost diesel-based generation centers to increase energy access for customers in remote areas. Most Pacific island countries lack the budgetary resources to support rural electrification programs. Renewable energy for rural

Asian Economic Integration Report 201780 Subregional Cooperation Initiatives 81
electrification offers low-cost power generation that allows utilities to extend grids and improve access at lower power generation costs. Lastly, the program will offer more opportunities for sharing lessons learned and best practices among Pacific utilities. A regional project management unit will facilitate the program, enhanced through regional workshops and knowledge products.
Regional Approach
A regional approach was selected to assist the Pacific’s transition to a sustainable, resilient energy future, as it supports: (i) improved knowledge transfer and dissemination of lessons learned and best practices, (ii) better sector planning and reform on medium-term basis using program financing, (iii) more efficient procurement through contract bundling across small island states with centralized procurement support, and (iv) greater private sector investment.
Improved Knowledge Transfer. The regional approach allows comprehensive sharing of lessons learned and innovative approaches between the participating Pacific power utilities—that often experience similar technical and management issues. This becomes more important as grids increase shares of renewable energy and where management of integration issues can be more complex. The implementation of a single initiative over multiple countries over many years will mobilize a broad spectrum of stakeholders to participate in the initiative. This would include: (i) Pacific DMC governments and regulators expecting to benefit from the broad range of services and skills available; (ii) Pacific power utilities, also to benefit from the broad range of services and skills available; (iii) development partners; and (iv) implementing and executing agencies, seeing opportunities for capacity building and increased efficiency.
Facilitating Sector Planning and Reform. Financing certainty over the medium-term helps infrastructure planning and possibly encourages additional co-finance. Currently, medium-term infrastructure planning suffers from a lack of clarity over medium-term funding, with plans often being overly dependent on the availability of short-term development partner finance. Medium-term engagement supports sector reform. The type of reforms needed vary among Pacific DMCs, but will cover key issues such as sector planning (like roadmaps and grid
integration studies), power utility management reform and capacity building, tariff review and reform, regulatory and policy frameworks, and promotion of private sector investment. Medium-term support for sector reform has consistently been more effective than uncoordinated short-term assistance.
More Efficient Procurement. The regional approach allows bundling of equipment and works packages across Pacific DMCs. This will increase package sizes and contribute to reducing costs. Larger contracts will also potentially attract additional bidders and encourage greater competition.
Promoting Private Sector Participation. Through longer-term perspective, a pipeline of suitable opportunities for complementary private investment can be identified that will likely attract broader private sector interest in renewable energy projects. Sovereign financing to help support investment, and provision of transaction advice, can also be used to promote greater private sector participation.
Expected Impacts
The cost of power generation in these seven Pacific DMCs is among the highest in the world. The reasons include: (i) reliance on imported diesel for generation, (ii) long supply chains of relatively small diesel quantities creating high transportation costs, and (iii) low economies of scale for relatively small grids. Many Pacific DMCs have small populations dispersed over vastly distant islands, and they are heavily dependent on diesel—five of the seven target countries rely on diesel for over 85% of electricity generation. The average supply cost for electricity across the Pacific is about $0.47 per kilowatt-hour, high by international standards. The cost of diesel power generation is even higher for smaller and more isolated grids in outer islands.
The proposed mitigation investments under the PIREIP will include the following:
● Solar power generation: 50 MW at approximately 22 sites in five Pacific DMCs
● Wind power generation: 10 MW at 5 sites in three Pacific DMCs
● Hydropower generation: 19 MW at 8 sites in two Pacific DMCs
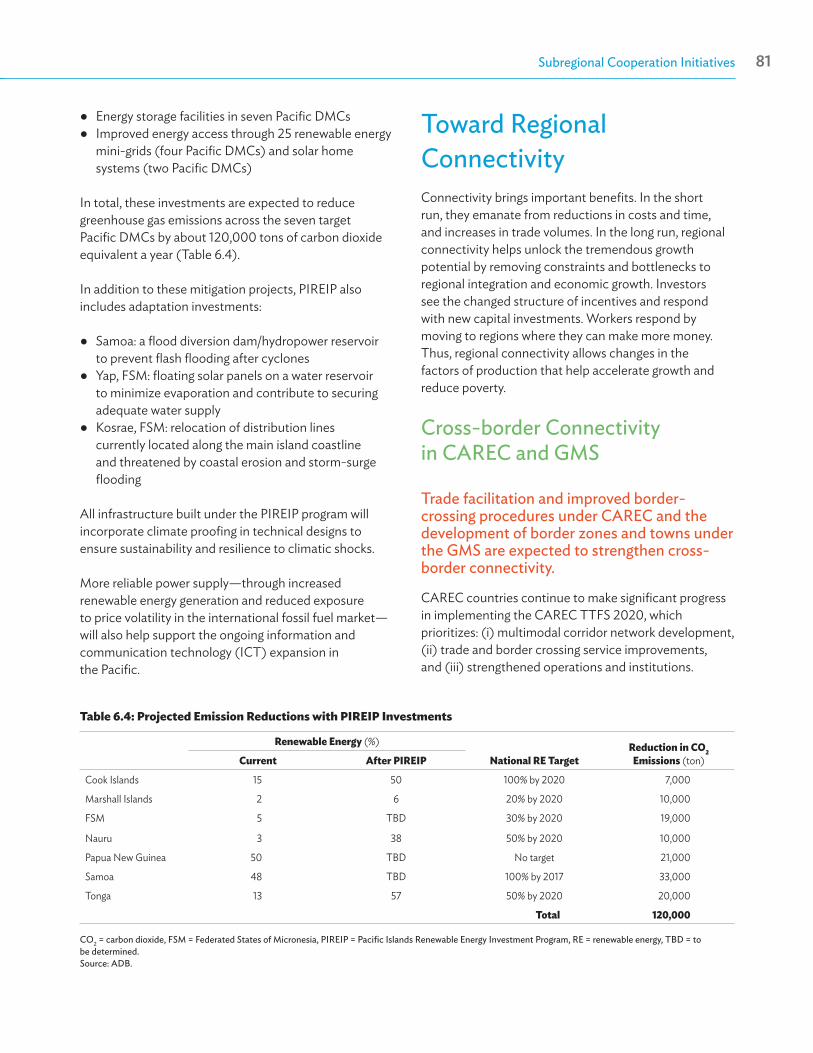
Asian Economic Integration Report 201780 Subregional Cooperation Initiatives 81
● Energy storage facilities in seven Pacific DMCs● Improved energy access through 25 renewable energy
mini-grids (four Pacific DMCs) and solar home systems (two Pacific DMCs)
In total, these investments are expected to reduce greenhouse gas emissions across the seven target Pacific DMCs by about 120,000 tons of carbon dioxide equivalent a year (Table 6.4).
In addition to these mitigation projects, PIREIP also includes adaptation investments:
● Samoa: a flood diversion dam/hydropower reservoir to prevent flash flooding after cyclones
● Yap, FSM: floating solar panels on a water reservoir to minimize evaporation and contribute to securing adequate water supply
● Kosrae, FSM: relocation of distribution lines currently located along the main island coastline and threatened by coastal erosion and storm-surge flooding
All infrastructure built under the PIREIP program will incorporate climate proofing in technical designs to ensure sustainability and resilience to climatic shocks.
More reliable power supply—through increased renewable energy generation and reduced exposure to price volatility in the international fossil fuel market—will also help support the ongoing information and communication technology (ICT) expansion in the Pacific.
Table 6.4: Projected Emission Reductions with PIREIP Investments
Renewable Energy (%)
National RE TargetReduction in CO2
Emissions (ton)Current After PIREIP
Cook Islands 15 50 100% by 2020 7,000
Marshall Islands 2 6 20% by 2020 10,000
FSM 5 TBD 30% by 2020 19,000
Nauru 3 38 50% by 2020 10,000
Papua New Guinea 50 TBD No target 21,000
Samoa 48 TBD 100% by 2017 33,000
Tonga 13 57 50% by 2020 20,000
Total 120,000
CO2 = carbon dioxide, FSM = Federated States of Micronesia, PIREIP = Pacific Islands Renewable Energy Investment Program, RE = renewable energy, TBD = to be determined. Source: ADB.
Toward Regional ConnectivityConnectivity brings important benefits. In the short run, they emanate from reductions in costs and time, and increases in trade volumes. In the long run, regional connectivity helps unlock the tremendous growth potential by removing constraints and bottlenecks to regional integration and economic growth. Investors see the changed structure of incentives and respond with new capital investments. Workers respond by moving to regions where they can make more money. Thus, regional connectivity allows changes in the factors of production that help accelerate growth and reduce poverty.
Cross-border Connectivity in CAREC and GMS
Trade facilitation and improved border-crossing procedures under CAREC and the development of border zones and towns under the GMS are expected to strengthen cross-border connectivity.
CAREC countries continue to make significant progress in implementing the CAREC TTFS 2020, which prioritizes: (i) multimodal corridor network development, (ii) trade and border crossing service improvements, and (iii) strengthened operations and institutions.
Asian Economic Integration Report 201782 Subregional Cooperation Initiatives 83
Implementing these is the joint responsibility of the Transport Sector Coordinating Committee (TSCC) leading in priorities: (i) and (iii), and the Customs Coordinating Committee leading in (ii). The TSCC maintains a 3-year rolling Transport Sector Work Plan, updated each year to ensure timely implementation. Under the current Work Plan (2016–2018), the physical investments (hard infrastructure) detailed in the TTFS 2020 is supported by a set of complementary soft-side initiatives covering four pillars: (i) road safety, (ii) railways, (iii) road asset management, and (iv) transport facilitation. As of 2016, road and railway projects already surpassed 2020 targets (Figure 6.3). With this connectivity in place, the focus is now on ensuring road and rail assets are properly managed and safe for users. And, as mentioned, CAREC’s new aviation pillar holds much potential for additional regional benefits.
In addition to transport and trade facilitation policies to support cross-border connectivity, the GMS will also need to synchronize its hardware. This includes prioritizing inter-operability of regional transport—like railways—managed through the GMS Railway Association. In energy, harmonized power grids for cross-border power trade are developed through the working groups of the Regional Power Trade Coordination Committee.
An emerging area of cooperation within the GMS is the development of border zones and border towns. As the Guangxi–Viet Nam project demonstrates, border zones require multi-sector investments. And border towns, such as those under the GMS Corridor Towns Development Project, can provide the necessary urban infrastructure investments and border area access roads to accelerate cross-border cooperation and attract new economic activities. Additionally, border zones will require logistics centers and multi-modal transport exchanges, facilities to support skills development, communicable health control centers, and business facilitation centers.
During 2017–2019, ADB plans to process seven investment projects for the PRC under the broad framework of the GMS and CAREC—for which ADB will provide about $1.2 billion in loans—to further enhance PRC physical connectivity and trade links with its neighbors and support economic corridor development. For Mongolia, ADB plans to finance two RCI projects for about $80 million to build regional roads, and
improve infrastructure and urban services in South Gobi border towns.
Connecting South Asia and Southeast Asia
Developing multimodal connectivity between India’s northeastern region, Bangladesh, and Myanmar holds the potential to unleash tremendous economic energy—creating opportunities for millions in the region.
In February 2017, Myanmar joined SASEC, opening the gateway to accelerate inter-subregional cooperation between South Asia and Southeast Asia. With Myanmar’s strategic location at the crossroads of Asia, better inter-subregional connectivity in transport and logistics, as well as in energy, among others, are expected to bring significant benefits to all SASEC members and Asia in general.
Myanmar’s membership reflects SASEC’s determination to look beyond South Asia—to the significant mutual benefits of cooperating with new partners and opening new regional markets. It will boost supply-chain linkages for businesses between South Asia and Southeast Asia. Myanmar can be a bridge for mutually beneficial trade and transport linkages from South Asia into Southeast Asia. Road corridors in Myanmar are the key links between the two subregions, and Myanmar’s ports can offer alternate routes and gateways to landlocked northeast India.
Digital Connectivity in the Pacific
Ongoing ICT expansion in the Pacific opens a range of economic opportunities.
In coordination with Pacific governments and development partners, ADB is supporting a suite of ICT infrastructure and services projects to strengthen the Pacific’s digital connectivity. Better connectivity, in turn, is expected to promote inclusive economic growth and social development across the Pacific.
ADB’s ICT investments in the Pacific include submarine cable projects—providing reliable and high-speed broadband internet connections in Tonga (2011), Samoa
Asian Economic Integration Report 201782 Subregional Cooperation Initiatives 83
(2015), and Palau (2015). Similar submarine cable projects are in the pipeline for the Cook Islands, Kiribati, and Nauru.
ICT-enabled education projects include the Samoa Schoolnet and Community Access Project and the Solomon Islands ICT for Better Education Services Project. For health, information management systems are planned for Papua New Guinea and Samoa, along with wider e-Government services in the Cook Islands and Tonga.
The Pacific Information and Communication Technology Investment Planning and Capacity Development Facility has been established through regional technical assistance to support ICT development in the subregion. The facility provides demand-driven technical advice and capacity building to help Pacific DMCs improve service delivery and expand economic opportunities through ICT.
ReferencesADB. CAREC Program Portfolio.
_____. 2011. The Greater Mekong Subregion Economic Cooperation Program Strategic Framework 2012–2022. Manila.
_____. 2014. South Asia Subregional Economic Cooperation Trade Facilitation Strategic Framework 2014-2018. Manila.
_____. 2016a. Mongolia: Supporting an Emergent Middle Income Economy. Development Effectiveness Brief. Manila.
_____. 2016b. South Asia Subregional Economic Cooperation Operation Plan, 2016-2025. Manila.
_____. 2016c. Pacific Islands Renewable Energy Investment Program: Funding proposal for the Green Climate Fund. November.
_____. 2017a. CAREC Transport Sector Progress Report. June.
_____. 2017b. ADB ICT Operations in the Pacific (infographic).
_____. 2017c. SASEC Powering Asia in the 21st Century. Manila.
_____. 2017d. ADB ICT Operations in the Pacific (infographic).
Central Asia Regional Economic Cooperation (CAREC). 2017a. Transport Sector Progress Report and Work Plan 2017–2019. Tbilisi. 17–19 May.
_____. 2017b. Trade Facilitation Sector Progress Report and Work Plan (October 2016–June 2017). Tbilisi.
20-21 June.
_____. 2017c. Energy Sector Progress Report and Work Plan (August 2016 - May 2017). Tbilisi, 20-21 June.
Government of the People’s Republic of China (PRC). 2016a. Outline of the Thirteenth Five-Year Plan for National Economic and Social Development of the People’s Republic of China. Beijing.
_____. 2016b. Outline of the Thirteenth Five-Year Plan for National Economic and Social Development of the People’s Republic of China. Beijing.
Greater Mekong Subregion (GMS) Secretariat. 2013. GMS Economic Cooperation Program: Regional Investment Framework Pipeline of Potential Projects (2013–2022). Manila.
_____. 2016a. Study on Strengthening the Greater Mekong Subregion Program’s Institutional Framework. Manila.
_____. 2016 b. The Role of Special Economic Zones in Improving Effectiveness of GMS Economic Corridors. Manila.
South Asia Subregional Economic Cooperation. http://www.sasec.asia/
State Council of the PRC. 2015. Vision and Actions on Jointly Building Silk Road Economic Belt and 21st Century Maritime Silk Road. Beijing.


Asia-Pacific Regional Cooperation and Integration Index
07
Asian Economic Integration Report 201786 Asia-Pacific Regional Cooperation and Integration Index 87
This year’s Asian Economic Integration Report introduces a new composite index to measure the progress of regional cooperation and integration in Asia and the Pacific.
Regional cooperation and integration (RCI) plays a pivotal role in accelerating economic growth and development, reducing poverty and economic
disparity, raising productivity and employment, and strengthening institutions (ADB 2015). Deeper regional integration expands markets, helps maximize the efficiency of resource allocation, and boosts productivity and investment opportunities—all helping narrow development gaps between ADB’s developing member economies. RCI can also generate considerable noneconomic benefits such as greater security and political stability. Recognizing its importance and its economic and noneconomic benefits, ADB adopted RCI as a key strategic priority for development assistance in Asia.
The Asia-Pacific Regional Cooperation and Integration Index allows Asian economies to track and monitor the progress of their regional integration efforts.
Understanding where the region stands on RCI is important to unlock its economic potential and maximize its benefits. Policy makers need mechanisms to monitor and evaluate progress against set goals. Against this backdrop, the Asian Economic Integration Report offers a new measure of RCI for Asia—using composite indexes constructed from 26 indicators categorized into six different socioeconomic dimensions. The weights of the composite indexes are obtained from a two-stage principal component analysis (PCA). In the first stage, the PCA is applied to the indicators in each dimension to create a dimensional composite index for the specific dimension. In the second stage, the PCA estimates weights for these six dimensional indexes to create an overall index of regional integration. The
detailed methodology for constructing these indexes is in Box 7.1.
The new index also builds on six dimensional indexes.
Regional integration is a multidimensional process. The index allows comparative analysis on multiple dimensions across different subregional groups and countries to capture the diversity in Asia’s RCI process.29 The six dimensional indexes are designed to reflect the core socioeconomic dimensions integral to the dynamic RCI process. These include: (i) trade and investment, (ii) money and finance, (iii) regional value chains, (iv) infrastructure and connectivity, (v) movement of people, and (vi) institutional and social integration. In turn, the Asia-Pacific Regional Cooperation and Integration Index (ARCII) will allow each subregional group and economy to identify its strengths and weaknesses across these six different socioeconomic dimensions.
29 The Asia-Pacific Regional Cooperation and Integration Index covers 48 Asian economies following the ADB classification (number of economies in parentheses): Central Asia (8)—Armenia, Azerbaijan, Georgia, Kazakhstan, the Kyrgyz Republic, Tajikistan, Turkmenistan, and Uzbekistan. East Asia (6)—Hong Kong, China; Japan; the People’s Republic of China; the Republic of Korea; Mongolia; and Taipei,China. Southeast Asia (10)—Brunei Darussalam, Cambodia, Indonesia, the Lao People’s Democratic Republic, Malaysia, Myanmar, the Philippines, Singapore, Thailand, and Viet Nam. South Asia (8)—Afghanistan, Bangladesh, Bhutan, India, Maldives, Nepal, Pakistan, and Sri Lanka. The Pacific (14)—the Cook Islands, the Federated States of Micronesia, Fiji, Kiribati, the Marshall Islands, Nauru, Palau, Papua New Guinea, Samoa, Solomon Islands, Timor-Leste, Tonga, Tuvalu, and Vanuatu. Oceania (2)—Australia and New Zealand.
Asia-Pacific Regional Cooperation and Integration Index

Asian Economic Integration Report 201786 Asia-Pacific Regional Cooperation and Integration Index 87
The Asia-Pacific Regional Cooperation and Integration Index (ARCII) makes use of 26 socioeconomic indicators categorized into six different dimensions to measure the diversity of regional cooperation and integration efforts. The box table lists these indicators in each of the six dimensions. All indicators are based on bilateral data, as regional integration is expressed as a ratio of the intraregional sum (or
Box 7.1: Constructing the Asia-Pacific Regional Cooperation and Integration Index
Design of the Asia-Pacific Regional Cooperation and Integration Index
R1.Trade and Investment
R11 Proportion of intraregional goods exports to total goods exports
R12 Proportion of intraregional goods imports to total goods imports
R13 Intraregional trade intensity index
R14 Proportion of intraregional foreign domestic investment (FDI) inflows to total FDI inflows
R15 Proportion of intraregional FDI inflows plus outflows to total FDI inflows plus outflows
R2.Money and Finance
R21 Proportion of intraregional cross-border equity liabilities to total cross-border equity liabilities
R22 Proportion of intraregional cross-border bond liabilities to total cross-border bond liabilities
R23 Pairwise dispersion of deposit rates average regionally relative to that averaged globally
R24 Pairwise correlation of equity returns average regionally minus that averaged globally
R3.Regional Value Chain
R31 Ratio between the average trade complementarity index over regional trading partners and the averaged trade complementarity index over all trading partners
R32 Ratio between the average trade concentration index over regional trading partners and the averaged trade concentration index over all trading partners
R33 Proportion of intraregional intermediate goods exports to total intraregional goods exports
R34 Proportion of intraregional intermediate goods imports to total intraregional goods imports
R4.Infrastructure and Connectivity
R41 Ratio between the average trade cost over regional trading partners and the average trade cost over all trading partners
R42 Ratio between the average liner shipping connectivity index over regional trading partners and the average liner shipping connectivity index over all trading partners
R43 Logistics performance index (overall)
R44 Doing Business Index (overall)
R5.Movement of People
R51 Proportion of intraregional outbound migration to total outbound migration
R52 Proportion of intraregional tourists to total tourists (inbound plus outbound)
R53 Proportion of intraregional remittances to total remittances
R54 Proportion of other Asian economies that do not require an entry visa
R6.Institutional and Social Integration
R61 Proportion of other Asian economies with which there is a signed free trade agreement
R62 Proportion of other Asian economies that have an embassy
R63 Proportion of other Asian economies with which there is a signed business investment treaty
R64 Proportion of other Asian economies with which there is a signed double taxation treaty
R65 Cultural proximity with other Asian economies relative to that with all other economies
Source: Huh and Park (2017).
average) to total sum (or average) of cross-border economic activity. There are three exceptions: R24 takes the difference between intraregional and total averages, whereas R43 and R44 only reflect national levels due to data availability. The indicators are drawn from the annual data for 2013, which have the most complete data for the composite indexes.
Continued on next page.
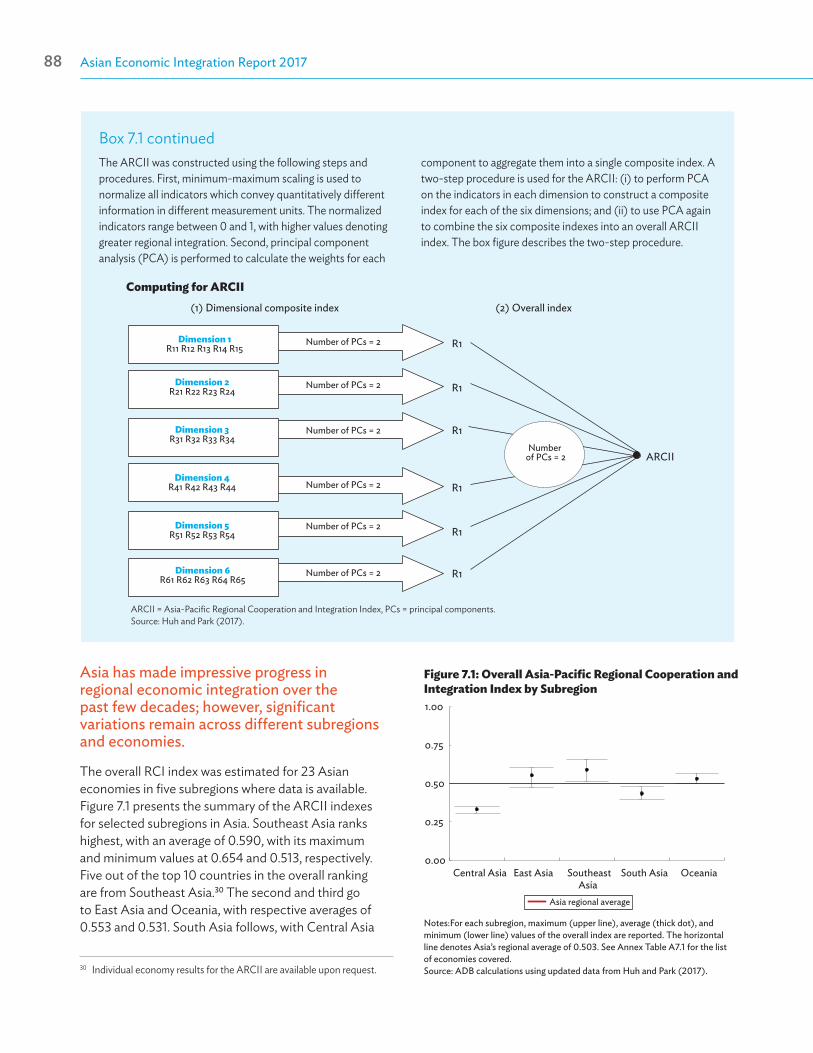
Asian Economic Integration Report 201788 Asia-Pacific Regional Cooperation and Integration Index 89
Asia has made impressive progress in regional economic integration over the past few decades; however, significant variations remain across different subregions and economies.
The overall RCI index was estimated for 23 Asian economies in five subregions where data is available. Figure 7.1 presents the summary of the ARCII indexes for selected subregions in Asia. Southeast Asia ranks highest, with an average of 0.590, with its maximum and minimum values at 0.654 and 0.513, respectively. Five out of the top 10 countries in the overall ranking are from Southeast Asia.30 The second and third go to East Asia and Oceania, with respective averages of 0.553 and 0.531. South Asia follows, with Central Asia
30 Individual economy results for the ARCII are available upon request.
0.00
0.25
0.50
0.75
1.00
Central Asia East Asia SoutheastAsia
South Asia Oceania
Asia regional average
Figure 7.1: Overall Asia-Pacific Regional Cooperation and Integration Index by Subregion
Notes:For each subregion, maximum (upper line), average (thick dot), and minimum (lower line) values of the overall index are reported. The horizontal line denotes Asia’s regional average of 0.503. See Annex Table A7.1 for the list of economies covered. Source: ADB calculations using updated data from Huh and Park (2017).
Box 7.1 continuedThe ARCII was constructed using the following steps and procedures. First, minimum-maximum scaling is used to normalize all indicators which convey quantitatively different information in different measurement units. The normalized indicators range between 0 and 1, with higher values denoting greater regional integration. Second, principal component analysis (PCA) is performed to calculate the weights for each
component to aggregate them into a single composite index. A two-step procedure is used for the ARCII: (i) to perform PCA on the indicators in each dimension to construct a composite index for each of the six dimensions; and (ii) to use PCA again to combine the six composite indexes into an overall ARCII index. The box figure describes the two-step procedure.
Dimension 1R11 R12 R13 R14 R15
Number of PCs = 2 R1
R1
R1
R1
R1
R1
Number of PCs = 2
Number of PCs = 2
Number of PCs = 2 ARCII
(2) Overall index(1) Dimensional composite index
Number of PCs = 2
Number of PCs = 2
Number of PCs = 2
Dimension 2R21 R22 R23 R24
Dimension 3R31 R32 R33 R34
Dimension 4R41 R42 R43 R44
Dimension 5R51 R52 R53 R54
Dimension 6R61 R62 R63 R64 R65
ARCII = Asia-Pacific Regional Cooperation and Integration Index, PCs = principal components.Source: Huh and Park (2017).
Computing for ARCII
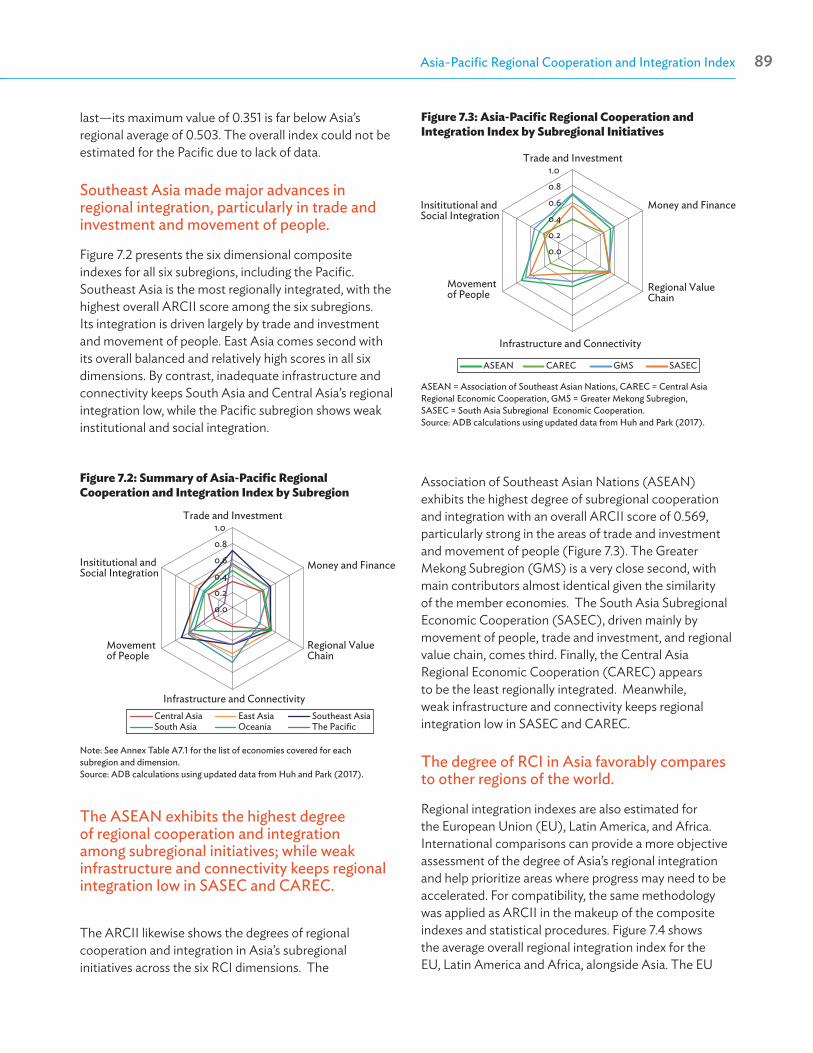
Asian Economic Integration Report 201788 Asia-Pacific Regional Cooperation and Integration Index 89
last—its maximum value of 0.351 is far below Asia’s regional average of 0.503. The overall index could not be estimated for the Pacific due to lack of data.
Southeast Asia made major advances in regional integration, particularly in trade and investment and movement of people.
Figure 7.2 presents the six dimensional composite indexes for all six subregions, including the Pacific. Southeast Asia is the most regionally integrated, with the highest overall ARCII score among the six subregions. Its integration is driven largely by trade and investment and movement of people. East Asia comes second with its overall balanced and relatively high scores in all six dimensions. By contrast, inadequate infrastructure and connectivity keeps South Asia and Central Asia’s regional integration low, while the Pacific subregion shows weak institutional and social integration.
Association of Southeast Asian Nations (ASEAN) exhibits the highest degree of subregional cooperation and integration with an overall ARCII score of 0.569, particularly strong in the areas of trade and investment and movement of people (Figure 7.3). The Greater Mekong Subregion (GMS) is a very close second, with main contributors almost identical given the similarity of the member economies. The South Asia Subregional Economic Cooperation (SASEC), driven mainly by movement of people, trade and investment, and regional value chain, comes third. Finally, the Central Asia Regional Economic Cooperation (CAREC) appears to be the least regionally integrated. Meanwhile, weak infrastructure and connectivity keeps regional integration low in SASEC and CAREC.
The degree of RCI in Asia favorably compares to other regions of the world.
Regional integration indexes are also estimated for the European Union (EU), Latin America, and Africa. International comparisons can provide a more objective assessment of the degree of Asia’s regional integration and help prioritize areas where progress may need to be accelerated. For compatibility, the same methodology was applied as ARCII in the makeup of the composite indexes and statistical procedures. Figure 7.4 shows the average overall regional integration index for the EU, Latin America and Africa, alongside Asia. The EU
0.0
0.2
0.4
0.6
0.8
1.0Trade and Investment
Money and Finance
Regional Value Chain
Infrastructure and Connectivity
Movementof People
Insititutional andSocial Integration
ASEAN CAREC GMS SASEC
Figure 7.3: Asia-Pacific Regional Cooperation and Integration Index by Subregional Initiatives
ASEAN = Association of Southeast Asian Nations, CAREC = Central Asia Regional Economic Cooperation, GMS = Greater Mekong Subregion, SASEC = South Asia Subregional Economic Cooperation. Source: ADB calculations using updated data from Huh and Park (2017).
Figure 7.2: Summary of Asia-Pacific Regional Cooperation and Integration Index by Subregion
Note: See Annex Table A7.1 for the list of economies covered for each subregion and dimension.Source: ADB calculations using updated data from Huh and Park (2017).
Trade and Investment
Money and Finance
Regional Value Chain
Infrastructure and Connectivity
Movementof People
Insititutional andSocial Integration
0.0
0.2
0.4
0.6
0.8
1.0
Central Asia East Asia Southeast AsiaSouth Asia Oceania The Pacific
The ASEAN exhibits the highest degree of regional cooperation and integration among subregional initiatives; while weak infrastructure and connectivity keeps regional integration low in SASEC and CAREC.
The ARCII likewise shows the degrees of regional cooperation and integration in Asia’s subregional initiatives across the six RCI dimensions. The
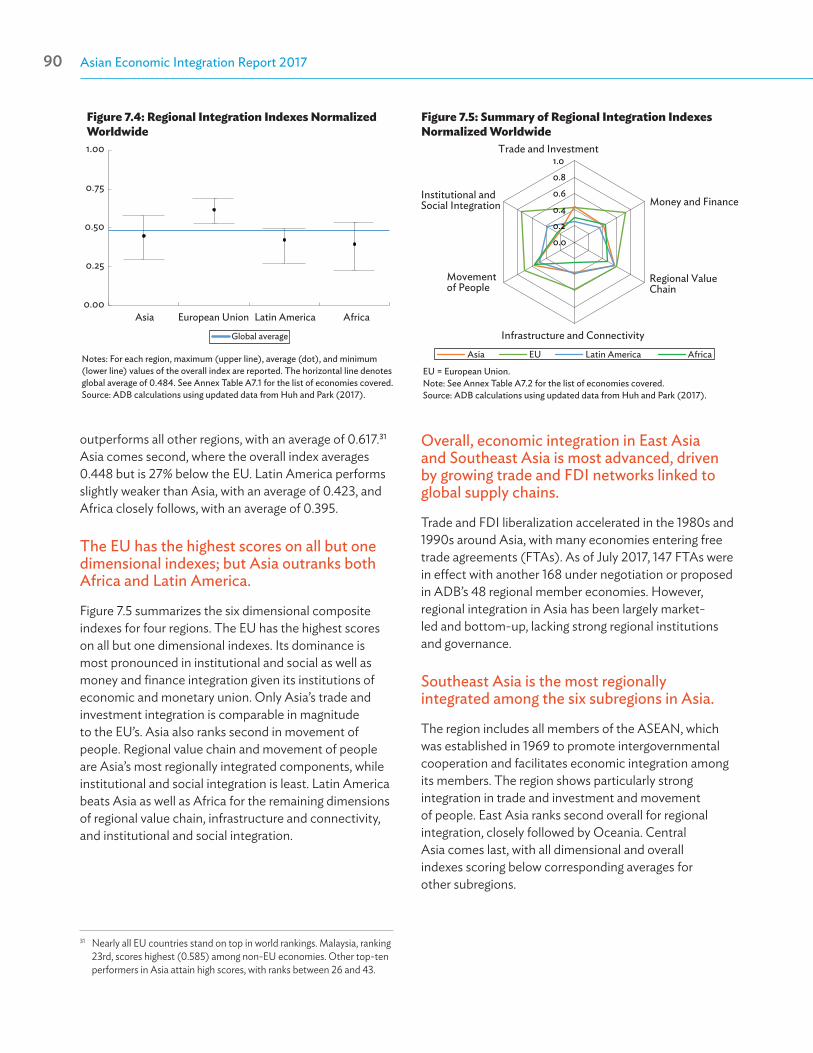
Asian Economic Integration Report 201790 Asia-Pacific Regional Cooperation and Integration Index 91
outperforms all other regions, with an average of 0.617.31 Asia comes second, where the overall index averages 0.448 but is 27% below the EU. Latin America performs slightly weaker than Asia, with an average of 0.423, and Africa closely follows, with an average of 0.395.
The EU has the highest scores on all but one dimensional indexes; but Asia outranks both Africa and Latin America.
Figure 7.5 summarizes the six dimensional composite indexes for four regions. The EU has the highest scores on all but one dimensional indexes. Its dominance is most pronounced in institutional and social as well as money and finance integration given its institutions of economic and monetary union. Only Asia’s trade and investment integration is comparable in magnitude to the EU’s. Asia also ranks second in movement of people. Regional value chain and movement of people are Asia’s most regionally integrated components, while institutional and social integration is least. Latin America beats Asia as well as Africa for the remaining dimensions of regional value chain, infrastructure and connectivity, and institutional and social integration.
31 Nearly all EU countries stand on top in world rankings. Malaysia, ranking 23rd, scores highest (0.585) among non-EU economies. Other top-ten performers in Asia attain high scores, with ranks between 26 and 43.
Overall, economic integration in East Asia and Southeast Asia is most advanced, driven by growing trade and FDI networks linked to global supply chains.
Trade and FDI liberalization accelerated in the 1980s and 1990s around Asia, with many economies entering free trade agreements (FTAs). As of July 2017, 147 FTAs were in effect with another 168 under negotiation or proposed in ADB’s 48 regional member economies. However, regional integration in Asia has been largely market-led and bottom-up, lacking strong regional institutions and governance.
Southeast Asia is the most regionally integrated among the six subregions in Asia.
The region includes all members of the ASEAN, which was established in 1969 to promote intergovernmental cooperation and facilitates economic integration among its members. The region shows particularly strong integration in trade and investment and movement of people. East Asia ranks second overall for regional integration, closely followed by Oceania. Central Asia comes last, with all dimensional and overall indexes scoring below corresponding averages for other subregions.
Figure 7.4: Regional Integration Indexes Normalized Worldwide
Notes: For each region, maximum (upper line), average (dot), and minimum (lower line) values of the overall index are reported. The horizontal line denotes global average of 0.484. See Annex Table A7.1 for the list of economies covered. Source: ADB calculations using updated data from Huh and Park (2017).
0.00
0.25
0.50
0.75
1.00
Asia European Union Latin America Africa
Global average
Figure 7.5: Summary of Regional Integration Indexes Normalized Worldwide
EU = European Union.Note: See Annex Table A7.2 for the list of economies covered.Source: ADB calculations using updated data from Huh and Park (2017).
Asia EU Latin America Africa
Trade and Investment
Money and Finance
Regional Value Chain
Infrastructure and Connectivity
Movementof People
Institutional andSocial Integration
0.0
0.2
0.4
0.6
0.8
1.0
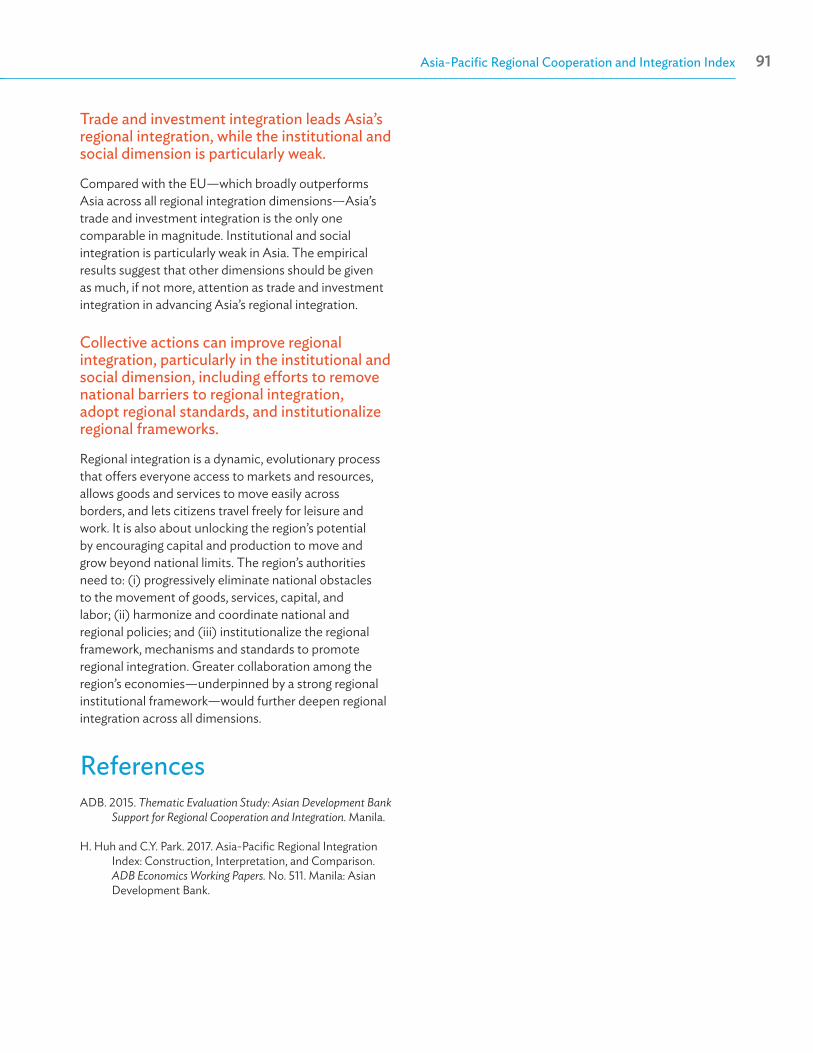
Asian Economic Integration Report 201790 Asia-Pacific Regional Cooperation and Integration Index 91
Trade and investment integration leads Asia’s regional integration, while the institutional and social dimension is particularly weak.
Compared with the EU—which broadly outperforms Asia across all regional integration dimensions—Asia’s trade and investment integration is the only one comparable in magnitude. Institutional and social integration is particularly weak in Asia. The empirical results suggest that other dimensions should be given as much, if not more, attention as trade and investment integration in advancing Asia’s regional integration.
Collective actions can improve regional integration, particularly in the institutional and social dimension, including efforts to remove national barriers to regional integration, adopt regional standards, and institutionalize regional frameworks.
Regional integration is a dynamic, evolutionary process that offers everyone access to markets and resources, allows goods and services to move easily across borders, and lets citizens travel freely for leisure and work. It is also about unlocking the region’s potential by encouraging capital and production to move and grow beyond national limits. The region’s authorities need to: (i) progressively eliminate national obstacles to the movement of goods, services, capital, and labor; (ii) harmonize and coordinate national and regional policies; and (iii) institutionalize the regional framework, mechanisms and standards to promote regional integration. Greater collaboration among the region’s economies—underpinned by a strong regional institutional framework—would further deepen regional integration across all dimensions.
ReferencesADB. 2015. Thematic Evaluation Study: Asian Development Bank
Support for Regional Cooperation and Integration. Manila.
H. Huh and C.Y. Park. 2017. Asia-Pacific Regional Integration Index: Construction, Interpretation, and Comparison. ADB Economics Working Papers. No. 511. Manila: Asian Development Bank.
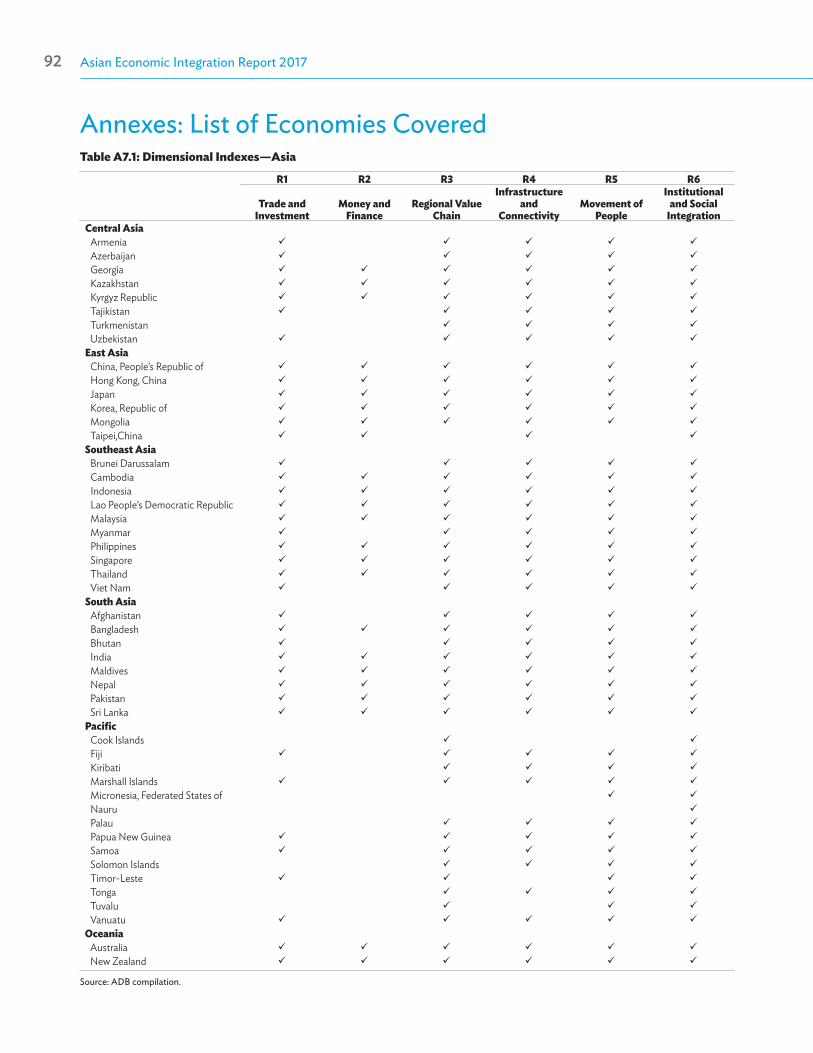
Asian Economic Integration Report 201792 Asia-Pacific Regional Cooperation and Integration Index 93
Annexes: List of Economies Covered
Source: ADB compilation.
Table A7.1: Dimensional Indexes—Asia
R1 R2 R3 R4 R5 R6
Trade and Investment
Money and Finance
Regional Value Chain
Infrastructure and
ConnectivityMovement of
People
Institutional and Social
IntegrationCentral Asia
Armenia Azerbaijan Georgia Kazakhstan Kyrgyz Republic Tajikistan Turkmenistan Uzbekistan
East Asia China, People’s Republic of Hong Kong, China Japan Korea, Republic of Mongolia Taipei,China
Southeast AsiaBrunei Darussalam Cambodia Indonesia Lao People’s Democratic Republic Malaysia Myanmar Philippines Singapore Thailand Viet Nam
South Asia Afghanistan Bangladesh Bhutan India Maldives Nepal Pakistan Sri Lanka
Pacific Cook Islands Fiji Kiribati Marshall Islands Micronesia, Federated States of Nauru Palau Papua New Guinea Samoa Solomon Islands Timor-Leste Tonga Tuvalu Vanuatu
Oceania Australia New Zealand

Asian Economic Integration Report 201792 Asia-Pacific Regional Cooperation and Integration Index 93
Table A7.2: Overall Regional Cooperation and Integration Indexes
Asia (23) European Union (26) Latin America (16) Africa (19)
Central Asia Austria Argentina Algeria
Georgia Belgium The Bahamas Benin
Kazakhstan Bulgaria Brazil Botswana
Kyrgyz Republic Cyprus Chile Ghana
East Asia Czech Republic Colombia Kenya
China, People’s Republic of Denmark Costa Rica Malawi
Hong Kong, China Estonia Ecuador Mauritius
Japan Finland Jamaica Morocco
Korea, Republic of France Mexico Mozambique
Mongolia Germany Nicaragua Namibia
Southeast Asia Greece Panama Nigeria
Cambodia Hungary Paraguay Rwanda
Indonesia Ireland Peru Seychelles
Lao People’s Democratic Republic Italy Trinidad and Tobago South Africa
Malaysia Latvia Uruguay Sudan
Philippines Lithuania Venezuela Swaziland
Singapore Luxembourg Tanzania
Thailand Malta Uganda
South Asia Netherlands Zambia
Bangladesh Poland
India Portugal
Maldives Romania
Nepal Slovenia
Pakistan Spain
Sri Lanka Sweden
Oceania United Kingdom
Australia
New ZealandSource: ADB compilation.

The Era of Financial Interconnectedness: How Can Asia Strengthen Financial Resilience?
08
Asian Economic Integration Report 201796 The Era of Financial Interconnectedness: How Can Asia Strengthen Financial Resilience? 97
The Era of Financial Interconnectedness: How Can Asia Strengthen Financial Resilience?
Introduction
Twenty years after the Asian financial crisis (AFC), Asia stands strong, with more resilient financial systems and a solid economic outlook. The AFC
triggered a wave of major economic and financial policy reforms, laying the foundations for a sustained period of high growth afterwards. The crisis exposed structural weaknesses and policy distortions in crisis-affected countries, combined with poorly planned financial liberalization and capital account opening. A surge in external capital inflows—driven in part by the region’s economic success and fixed exchange rates—led to rapid credit growth and asset price bubbles across crisis-affected countries. These financial imbalances quickly unraveled, triggering the crisis and threatening long-term economic growth.
The global financial crisis (GFC) that followed 10 years later led to a major change in thinking about the links between macroeconomics and finance, triggering changes in policy making. In particular, the GFC showed how risks of unbridled financial flows in an era of globalized finance and tightly interconnected financial markets could lead to a buildup of systemic risk and widespread financial instability. In emerging market economies, increasing financial integration can bring about excessive risk-taking and leverage. If poorly regulated and supervised, it can amplify the effects of financial cycles, create financial instability and damage the real economy. Thus, Asia’s increasingly integrated financial markets require a sound understanding of the associated risks and need to design appropriate policy responses.
The 2013–2014 “taper tantrum” exemplified the risks stemming from globalized finance. After the United States (US) Federal Reserve announced it was planning to end its ultra-loose monetary policy through gradual monetary policy normalization, many emerging market
economies—including some in developing Asia32—were hit by sudden large capital outflows and short-term financial instability. Thus, it is also important to understand the channels through which changes in monetary policy and financial conditions in advanced economies can affect emerging market macroeconomic and financial conditions and prepare policies that can mitigate these effects on financial stability.
Although the region has taken great strides in improving its financial resilience in the two decades since the AFC, significant structural weaknesses remain and new challenges have emerged. Remaining challenges include: (i) diversifying out of bank-dominated Asian financial systems, (ii) controlling rising credit and private sector debt, and (iii) avoiding high foreign currency-denominated debt financing. The recent rise in nonperforming loans and heavy reliance on US dollar-denominated debts are reemerging challenges in some economies. New challenges include: (i) links between financial cycles and the real economy, (ii) more rapid risk transmission from greater financial interconnectedness, and (iii) rising volatility from macrofinancial interlinkages. Taken together, these existing, reemerging and new challenges can exacerbate the region’s financial fragility. For example, a change in US dollar funding conditions transmits rapidly in a more interconnected and integrated global financial system, increasing the vulnerability of economies over-reliant on US dollar-denominated foreign debt.
This theme chapter analyzes these existing and new financial vulnerabilities and challenges. It identifies policy gaps, proposes policy considerations and offers suggestions on what can be done. In particular, it emphasizes policy options where increased regional cooperation can safeguard financial stability and promote financial resilience.
32 See for example ADB (2014) and Estrada, Noland, Park, and Ramayandi (2015).
Asian Economic Integration Report 201796 The Era of Financial Interconnectedness: How Can Asia Strengthen Financial Resilience? 97
Experiences and Lessons from Past CrisesTo better analyze current financial vulnerabilities in Asia and identify policy gaps, it is worth taking a thorough look at three relatively recent international economic and financial crises—the AFC, GFC, and the European sovereign debt crisis (EDC)—to examine the causes, policy responses, and lessons learned.
The Asian Financial Crisis
The AFC disrupted a period of high economic growth as a currency and banking crisis triggered a regional economic crisis.
After several years of high economic growth, the AFC began in Thailand in July 1997 and soon spread to Indonesia and Malaysia, before spilling over to other Asian economies with currencies tightly linked to the US dollar. The crisis originated in Thailand, triggered by the high volume of foreign capital that flooded into the country in the years leading to the crisis, fueling speculative markets in real estate and stocks alongside heavy domestic consumption. These contributed to a growing, unsustainable current account deficit. Authorities tried to defend the value of the Thai baht, but were ultimately forced to devalue the currency in early July 1997. In the following weeks, financial stress spread to neighboring economies as currency and then banking crises surfaced as the previously large capital inflows to the region slowed or reversed. It evolved into a more generalized regional economic crisis with deep impact on the real economy. In little more than a year, gross domestic product in Indonesia, Malaysia, the Philippines, the Republic of Korea, and Thailand fell a combined 30%. Banks succumbed to ever-expanding portfolios of nonperforming loans (NPLs). Investment rates plunged. And with several Asian economies amid deep recessions, spillovers affected trading partners across the region and around the globe.
Among other factors, the AFC was caused by: (i) the nature of foreign borrowing, (ii) financial sector weaknesses, (iii) fixed exchange rates, and (iv) a region-wide loss of confidence that precipitated substantial capital outflows.
The root of the AFC was the nature of foreign borrowing, which created a double maturity and currency mismatch. Much of the increasing foreign capital inflows were short-term (below 1-year) and unhedged. The lack of prudential supervision and proper regulations allowed these short-term inflows to be invested in long-term domestic projects—many in real estate and unproductive sectors (Sugisaki 1998, World Bank 1998). Thus, the maturity mismatch exposed the domestic financial systems to the risk that foreign loans might not be rolled over. The currency mismatch also arose from the de facto dollar peg in crisis-affected economies. The peg gave borrowers a false sense of security, encouraging them to take on increasing amounts of US dollar debt. It made domestic financial institutions less circumspect over exchange rate risks, in part due to the misplaced confidence that the US dollar loans could readily be repaid out of local currency earnings.
Weaknesses in the financial sector played a pivotal role as well. The region lacked the financial market infrastructure, supervision, and regulatory environment to efficiently allocate foreign capital inflows. Liberalizing local financial markets was premature and insufficiently regulated. Weak banking systems, poor corporate governance, and an overall lack of transparency exacerbated the loss of investor confidence in the region’s financial systems.
The AFC prompted a wide array of reforms, including more flexible exchange rate regimes, stronger financial regulation and supervision, banking sector restructuring, and domestic and regional capital market development. Regional financial cooperation initiatives centered on: (i) establishing a regional mechanism for liquidity support and crisis management (the ASEAN+3 Chiang Mai Initiative [CMI] and the Chiang Mai Initiative Multilateralisation [CMIM]), (ii) strengthening regional macroeconomic and financial surveillance (the CMIM-associated ASEAN+3 Macroeconomic Research Office [AMRO]), and (iii) deepening regional capital markets—particularly through local currency bond market development (the ASEAN+3 Asian Bond Markets
Asian Economic Integration Report 201798 The Era of Financial Interconnectedness: How Can Asia Strengthen Financial Resilience? 99
Initiative [ABMI]). More recent regional initiatives to develop local capital markets include the ASEAN Capital Markets Forum and implementation plan,33 and related initiatives under the Asia-Pacific Economic Cooperation forum (Goswami and Sharma 2011).
Among the lessons learned from the AFC were the need to: (i) develop long-term currency bond markets as an alternative to bank financing, (ii) enhance the infrastructure of local capital markets, and (iii) undertake prudential regulation and supervision.
One lesson from the crisis was the need to develop long-term local currency sovereign bond markets to avoid future currency and maturity mismatches and provide a more stable source of financing. More broadly, the crisis highlighted the need to develop the infrastructure of local capital markets and to establish mechanisms for adequate macroprudential regulation and supervision. Given the risks of foreign currency borrowing (and dollar funding in particular), local and international bank regulators need to maintain the safety and soundness of their domestic banking systems and be on the lookout for excessive capital inflows—specifically those that fund consumption or fuel local asset bubbles rather than contribute to expanding productive capacity. Apart from restrictions on short-term capital flows, protective measures designed to enhance financial resilience include ensuring adequate levels of foreign currency reserves and the development of cooperation mechanisms for cross-border crisis management (such as the CMIM). Finally, the AFC showed that the timing and sequence of external financial liberalization matters.
The Global Financial Crisis
The GFC began as a domestic mortgage crisis in the US, which rapidly spread worldwide after the failure of several “systemically important financial institutions”.
The GFC unfolded largely because improperly designed regulatory systems facilitated overinvestment in real estate, financed by increasingly complex,
33 The “Implementation Plan to Promote the Development of an Integrated Capital Market to Achieve the Objectives of the AEC Blueprint 2015” covers the adoption of international standards, progressive liberalization, and the sequencing of regional initiatives.
repackaged (and hard to trace) financial vehicles. It began as a domestic mortgage crisis in the US which rapidly spread across the world after the failure of Lehman Brothers Holdings, a major financial services company, and near-failure of American International Group (AIG), an insurance conglomerate. Financial institutions lost confidence in dealing with each other and international funding markets froze. The liquidity squeeze forced regulators worldwide to recapitalize financial institutions—including those not normally subject to bailouts—and become the lender of last resort for markets.
The GFC showed how greater financial integration could lead to greater financial vulnerabilities—stemming from weaknesses in SIFIs, the lack of macroprudential supervision and the lack of monitoring mechanisms for the early detection of systemic risk.
Aside from excessive borrowing and lending, poorly functioning credit markets, misaligned incentives, and a disconnect between regulatory structures and the rapidly integrated and sophisticated financial system, the GFC was also a product of the international transmission of systemic risk. The crisis underscored how increased financial integration and cross-border financial interlinkages can transmit risk globally—fueled by vulnerabilities and ultimate failure of “systemically important financial institutions” (SIFIs). The GFC also exposed the information gap between cross-border institutions and the inability of international and domestic regulatory structures to manage them effectively. It also exposed failures in financial market funding and the lack of prudential supervision (Arner 2009, Arner 2011). The excessive reliance on quantitative risk management mechanisms exacerbated the principal causes of the GFC (Arner 2009)—as they proved incapable of dealing with extreme market stress.
The GFC triggered a series of financial regulatory reforms aimed at enhancing the resilience of the global financial system.
The immediate government response was to inject massive amounts of capital to rescue SIFIs—an approach that differed from the International Monetary Fund (IMF) response to the AFC, which included very different measures, such as the closure of financial institutions and addressing of distressed assets
Asian Economic Integration Report 201798 The Era of Financial Interconnectedness: How Can Asia Strengthen Financial Resilience? 99
(Arner, Avgouleas, and Gibson 2017). Strengthening bank balance sheets and stabilizing financial systems ultimately restored banks’ ability to resume lending.
The international Group of Twenty forum and newly created Financial Stability Board (FSB) established the foundations underlying the new regulatory framework.34 They were charged with coordinating post-GFC responses and financial regulatory reforms, as well as setting financial standards and monitoring adherence to these standards. These reforms are still being implemented so their effectiveness cannot yet be fully gauged. Nonetheless, widening divergence in national regulatory practices has occurred recently along with a reluctance to abide by certain strictures—such as the capital adequacy frameworks set out in 2010 under Basel III.
The major lessons of the GFC included the need to: (i) provide adequate financial supervision and macroprudential regulation, (ii) devise early warning systems to detect and mitigate the buildup of systemic risk, and (iii) design a framework to resolve SIFIs.
Mechanisms for the early detection, mitigation, and effective resolution of crises and SIFIs are critical for financial stability and resilience. The inability to prevent and address systemic risk proved to be a crucial limitation of the regulatory architecture prevailing prior to the GFC (Arner 2009). Consequently, regulators need to identify and regulate SIFIs to mitigate the transmission of systemic risk. Moreover, they need to have the tools and mechanisms to ensure funding markets remain liquid under all market conditions.
More effective financial regulations and macroprudential supervision are critical to mitigating risks associated with complex financial instruments. Improving financial market infrastructure can likewise help contain possible sources of systemic risk (such as establishing central-counterparty clearinghouses). Regulatory bodies must possess the tools and mechanisms to assess and manage
34 These include: (i) building high-quality capital and liquidity standards and mitigating procyclicality, (ii) addressing SIFIs and resolution regimes, (iii) improving over-the-counter derivatives markets, (iv) strengthening accounting standards, (v) strengthening adherence to international supervisory and regulatory standards, (vi) reforming compensation practices to support financial stability, (vii) developing macroprudential frameworks and tools, and (viii) expanding and refining the regulatory perimeter (Arner 2011).
risks across the financial system as well as those that aggregate over time.
The absence of an effective SIFI resolution mechanism was a main factor behind the Lehman Brothers collapse and near collapse of AIG. A critical regulatory deficiency was the inability to adequately respond to the failure of large financial conglomerates and identify the risks inherent in cross-border interactions and interconnections. Regulatory bodies must have appropriate resolution powers and measures at their disposal to prevent serious financial instability in times of stress. The AFC and the GFC more broadly highlighted the need to establish appropriate responses and resolution systems—particularly for domestic or regional SIFIs. Regional dialogue has helped—especially in the context of executing the ASEAN Banking Integration Framework.
The European Sovereign Debt Crisis
The EDC unfolded as the euro area struggled to deal with weaknesses and failures of banks operating across borders.
The financial shocks during the GFC spilled over to most developed economies, including European Union (EU) members. Despite much discussion and work toward establishing a “Single Financial Market,” no single EU regulator existed. Adequate crisis resolution mechanisms—particularly those dealing with cross-border issues—were unavailable for nearly all EU jurisdictions (Avgouleas 2012). The threat of widespread bank failures thus accompanied the near collapse of the region’s financial systems. The banking crisis eventually gave way to a sovereign debt crisis, triggered by the excessive leverage in the banking systems of countries such as Cyprus, Ireland, and Spain. At the same time, markets became increasingly reluctant to roll over Greek debt, resulting in eventual IMF and EU rescue programs.
Asian Economic Integration Report 2017100 The Era of Financial Interconnectedness: How Can Asia Strengthen Financial Resilience? 101
The crisis stemmed in part from the lack of transnational supervisory and regulatory structures to govern banks and other financial institutions.
In the immediate aftermath of the GFC, high public and private debt across euro area economies, a flawed macroeconomic framework, and the absence of institutions capable of handling cross-border banking crises contributed to the sovereign debt crisis. Also, regulatory and institutional features crucial to support financial stability were insufficiently robust or nonexistent. This was particularly relevant for those resolving cross-border financial institutions, deposit guarantee arrangements, and providing regulatory, supervisory, and fiscal arrangements. The severity grew given the tight links between financial institutions operating in a single market—as links amplified the transmission of shocks across market segments.
The EDC (and GFC) underscored a need to revisit existing models of financial market integration—to ensure they had institutions and structures that could underpin financial stability and economic growth.
The EDC triggered a wave of regional policy initiatives toward establishing a European banking union—including a new European emergency financial assistance facility, euro area banking supervision, and resolution mechanisms.
Four reforms are worth noting. First, the European Stability Mechanism was established, aimed at providing financial assistance to euro area economies and troubled banks during a crisis. Second, the Single Supervisory Mechanism (SSM) for euro area banks was organized under the European Central Bank (ECB). An October 2013 SSM Regulation gave the ECB investigatory and supervisory powers to: (i) license financial institutions in the European Monetary Union; (ii) monitor compliance with capital, leverage, and liquidity requirements; (iii) supervise financial conglomerates; and (iv) require banks to take remedial action when regulatory capital requirements are breached. Third, the EU plans for harmonizing members’ resolution laws and introducing integrated resolution structures are being implemented. The single resolution mechanism (SRM) was established in 2014 to ensure continuity in essential banking operations; to protect depositors, assets and public
funds; and to safeguard overall financial stability. The mechanism should ensure speedy and credible resolution of cross-border failures. Based on the EU’s “Single Rulebook”,35 both the SSM and the SRM are pillars of the European banking union. And fourth, the development of common EU rulebooks for the single market by the European Supervisory Authorities is under way.
Financial stability risks rise as cross-border markets grow; international cooperation is needed to devise and implement measures that enhance financial stability.
With the failure of previous EU mechanisms to ensure financial market stability, the post-crisis reforms are milestones for greater integration and regionalism. The post-EDC response to further develop and run single market operations underscored the need to improve international and regional coordination.
The EDC highlighted the contagion risks inherent in a highly integrated system—a valuable lesson for Asia as financial integration and interconnectedness deepens. The EDC exposed weaknesses in national regulatory structures—particularly when addressing integrated financial markets. And it made clear the need for harmonized regulatory standards. Those most severely affected by the crisis had to adopt policies based on national circumstances, not necessarily harmonized or conforming to single market policies. This is increasingly relevant for Asia, given the region’s heterogeneity in economic size, development, and sociopolitical context.
35 The EU’s “Single Rulebook” refers to a unified regulatory framework for the financial sector in the EU that seeks to ensure a consistent application of Basel III in the EU.
Asian Economic Integration Report 2017100 The Era of Financial Interconnectedness: How Can Asia Strengthen Financial Resilience? 101
Financial Conditions, Vulnerabilities, and Cycles in AsiaThe AFC and GFC led to a major revision in thinking about the relationship between macroeconomics and finance—in particular the impact macrofinancial linkages can have on the real economy.
The significance of macrofinancial linkages and the impact financial channels have on the real economy has surfaced only recently. The GFC showed how the various forms of finance can become channels of transmission, amplification, and propagation of shocks—and become the source of shocks themselves. Prior to the GFC, few studies explored how macroeconomics and finance intersected—they were usually treated as separate issues. A lesson from the GFC was how financial markets can be less than fully efficient and subject to a herding behavior—among other biases. Prominent academics (for example, Blanchard et al. 2016) acknowledged the importance of macrofinancial linkages and the real economic effects shocks have on financial supply and demand. Spurred by the GFC, more empirical evidence has been collected on macrofinancial linkages and financial cycles and is being analyzed.
This section outlines both existing and newly emerging financial vulnerabilities and challenges36 in the region.
36 Online annex 2.A provides an overview of current financial and economic vulnerabilities compared with periods before the AFC and GFC. See also online annexes 2.B and 2.C for information on capital flows and exchange rate dynamics during past crises. https://aric.adb.org/aeir2017_onlineannex2.pdf
Current Status of Asia’s Financial Conditions and Sources of Financial Vulnerability
While the region has taken great strides in enhancing financial resilience in the wake of the AFC, substantial challenges remain and new sources of vulnerabilities have emerged.
The AFC triggered a wave of major economic and financial policy reforms that laid a strong foundation for post-crisis recovery and sustained high growth. However, the GFC highlighted several remaining challenges, including: (i) the bank-dominated nature of Asian financial systems, (ii) the role of credit growth and rising private sector debt, and (iii) high exposure to foreign currency-denominated debt.
Banks remain the biggest source of corporate financing in emerging Asia. While stock market capitalization and bank credit were roughly equal sources of corporate funding in 1996 (59.1% and 59.4% of GDP, respectively), bank credit has ballooned in the two decades since. As of 2016, bank credit was 113.6% of corporate financing in emerging Asia (as a percentage of GDP), far outstripping stock market capitalization (68.1%) and corporate bonds (21.8%) (Figure 8.1).
Loans and leverage are rising in several economies, raising concerns of unsustainable credit booms.37 And as credit increases and deviates from its long-run trend (Figure 8.2), credit gaps remain, if slightly narrowing. There was high credit growth during the pre-GFC period—particularly in Cambodia, India, Indonesia, the Lao People’s Democratic Republic, Myanmar, the People’s Republic of China (PRC), the Republic of Korea, and Viet Nam. However, others had low credit growth— Hong Kong, China; Japan; Malaysia; Taipei,China; and Thailand. Generally, credit growth has moderated since 2014, the result of a slowdown in net capital inflows—as global push factors grew bearish with the likely increase in the US Federal Fund rates, growth moderation in the PRC, and low global commodity prices.
37 See online annex 2.D for an overview on domestic credit growth and loan-to-deposit ratios since the pre-AFC period. https://aric.adb.org/aeir2017_onlineannex2.pdf

Asian Economic Integration Report 2017102 The Era of Financial Interconnectedness: How Can Asia Strengthen Financial Resilience? 103
0
20
40
60
80
100
120
1996 2006 2016
Corporate Bonds Stock Market Capitalization Bank Credit
Figure 8.1: Corporate Financing as % of GDP—Emerging Asia (excluding HKG and SIN)
GDP = gross domestic product, HKG = Hong Kong, China, SIN = Singapore.Note: Emerging Asia (excluding Hong Kong, China and Singapore) includes the People’s Republic of China; India; Indonesia; the Republic of Korea; Malaysia; the Philippines; Thailand; and Viet Nam. Sources: ADB calculations using data from AsianBondsOnline. https://asianbondsonline.adb.org; International Monetary Fund (IMF). International Financial Statistics. www.imf.org/en/Data; CEIC; and IMF. World Economic Outlook October 2016 Database. https://www.imf.org/external/pubs/ft/weo/2017/01/weodata/index.aspx (all accessed March 2017).
-60
-40
-20
0
20
40
60
Dec-95 Sep-99 Jun-03 Mar-07 Dec-10 Sep-14 Mar-17
PRC IND KORINO MAL THA
Figure 8.2: Deviation of Credit-to-GDP from Long-Run Trend (%)
GDP = gross domestic product, IND = India, INO = Indonesia, KOR = Republic of Korea, MAL = Malaysia, PRC = People’s Republic of China, THA = Thailand.Notes: The credit-to-GDP ratio, published in the Bank for International Settlements database of total credit to the private nonfinancial sector, captures total borrowing from all domestic and foreign sources. In terms of financial instruments, credit covers the core debt, which is here equal to loans and debt securities. A credit-to-GDP gap is defined as the difference between the credit-to-GDP ratio and its long-term trend, in percentage points. The long-term trend is calculated using a one-sided Hodrick-Prescott filter with a smoothing parameter of 400,000.Source: Bank for International Settlements. https://www.bis.org/ (accessed September 2017).
The combination of high leverage and slowing economic growth lowered the debt service capacity of many countries, raising the question of debt-at-risk. Corporate and household debt (and leverage) continues to be a concern for several economies in the region (Figure 8.3). The PRC’s leverage ratio, for instance, rose from 73% in March 2010 to 90% in March 2017, mostly due to growing corporate debt. The household debt-to-GDP ratio in the PRC more than doubled from 19% in March 2009 to 43% by September 2016. The Republic of Korea shows the same pattern—household debt increased from 74% of GDP in late 2008 to nearly 92% by September 2016. Thailand and Malaysia show similar trends. Mian, Sufi and Verner (2017) show that, in particular, an increase in the household debt-to-GDP ratio predicts lower GDP growth and higher unemployment in the medium run. Hence, these ratios could prove unsustainable should interest rates rise sharply—from rapid US monetary policy normalization, for example.
Figure 8.3: Credit to Private Nonfinancial Sector—Selected Asian Economies (% of GDP)
GDP= gross domestic product; HKG = Hong Kong, China; IND = India; INO = Indonesia; JPN = Japan; KOR = Republic of Korea; MAL = Malaysia; PRC = People’s Republic of China; SIN = Singapore; THA = Thailand. Notes: Credit covers core debt, equal to loans plus debt securities, and is provided by domestic banks, all other sectors of the economy and non-residents. Nonfinancial corporations include both private-owned and public-owned corporations; households include households and non-profit institutions serving households. For India, data starts second quarter of 2007.Source: Bank for International Settlements. https://www.bis.org/ (accessed July 2017).
0
50
100
150
200
250
300
350
1996
Q2
2016
Q4
2006
Q2
1996
Q2
2016
Q4
2006
Q2
1996
Q2
2016
Q4
2006
Q2
1996
Q2
2016
Q4
2006
Q2
1996
Q2
2016
Q4
PRC HKG INO IND JPN KOR MAL SIN THA
Households Nonfinancial corporations

Asian Economic Integration Report 2017102 The Era of Financial Interconnectedness: How Can Asia Strengthen Financial Resilience? 103
Compared with the AFC, external positions remain strong; although foreign borrowing has increased over the past decade.
Overall, total external debt38 in emerging Asia (excluding Singapore and Hong Kong, China) was $3.2 trillion in 2015—nearly 20% of the region’s GDP (up from 15% in 2005) (Figure 8.4). External debt ratios in India, Malaysia, the Republic of Korea, and Thailand increased, while those in Indonesia and the Philippines decreased. The PRC has maintained its debt level at about 12% of GDP.
Short-term external debt ratios also increased slightly. For Asia, short-term debt grew from 5.8% of GDP in 2005 to 7.9% in 2015. Malaysia had the largest rise—from 24% to 31% of GDP. Large short-term external debt increases the risk of potential currency and maturity mismatches.
By and large, bank capitalization is strong in emerging Asia—banks in the region remain sufficiently capitalized
38 The economies included are Cambodia; India; Indonesia; Kazakhstan; the Lao People’s Democratic Republic; Myanmar; Malaysia; the People’s Republic of China; the Philippines; the Republic of Korea; Sri Lanka; Taipei,China; Thailand; and Viet Nam. If Hong Kong, China and Singapore are included, the external debt level is $5.8 trillion, and the ratios for 2005 and 2010 are 30% and 33%, respectively.
to withstand modest shocks (for example, a rise in loan-loss provisioning consistent with a deceleration in trend economic growth and rising NPLs). However, the combination of high corporate leverage, large asset price volatility, and slowing growth is affecting bank asset quality in some countries.
Furthermore, there has been an increase in nonbank financing across the region in recent years. While this form of financing can provide a useful alternative to bank-based funding in spurring economic activity, it could also present a potential source of risk, facilitated through pronounced linkages with the banking sector FSB 2017). As a share of total financial assets, nonbank financial intermediation39 has remained steady in selected Asian economies40 over the period 2010–2014 at around 22%. In absolute terms, there has been a slight increase from $17 trillion to $20 trillion in this measure. At the same time, assets of other financial intermediaries41 across the region have increased
39 The FSB (2017) defines this as a measure of all nonbank financial intermediation, comprised of other financial institutions (OFIs), insurance corporations, and pension funds.
40 This includes Australia; Hong Kong, China; India; Indonesia; Japan; the People’s Republic of China; the Republic of Korea; and Singapore.
41 OFIs are comprised of all financial institutions that are not classified as banks, insurance corporations, pension funds, public financial institutions, central banks, or financial auxiliaries (FSB 2017).
Figure 8.4: External Debt-to-GDP Ratio—Selected Asian Economies (%)
GDP = gross domestic product, IND = India, INO = Indonesia, KOR = Republic of Korea, MAL = Malaysia, PHI = Philippines, PRC = People’s Republic of China, THA = Thailand.Notes: Columns show the share of external debt as a percentage of GDP. The bold areas indicate the fraction of short-term external debt as a percentage of GDP.Sources: ADB calculations using data from CEIC; and World Bank Quarterly External Debt Statistics SDDS. http://databank.worldbank.org/data/reports.aspx?source=quarterly-external-debt-statistics-sdds (accessed June 2017).
0
10
20
30
40
50
60
70
80
PRC IND INO KOR MAL PHI THA Asia2005 2010 2016
0
1
2
3
4
5
6
7
8
0
1,000
2,000
3,000
4,000
5,000
6,000
7,000
8,000
2011 2012 2013 2014
%
$ bill
ion
Narrow Measure of Shadow Banking (left)Share, as % of Total Financial Assets (right)
Figure 8.5: Narrow Measure of Shadow Banking for Selected Asian Economies
Notes: According to the Financial Stability Board’s methodology, the narrow measure of shadow banking includes nonbank financial entity types that are considered by authorities to be involved in credit intermediation where financial stability risks from shadow banking may occur. The measure has been aggregated for the following economies: Australia; Hong Kong, China; India; Indonesia; Japan; the People’s Republic of China; the Republic of Korea; and Singapore. The data spans from 2011 to 2014, due to availability. Source: Financial Stability Board (2015).
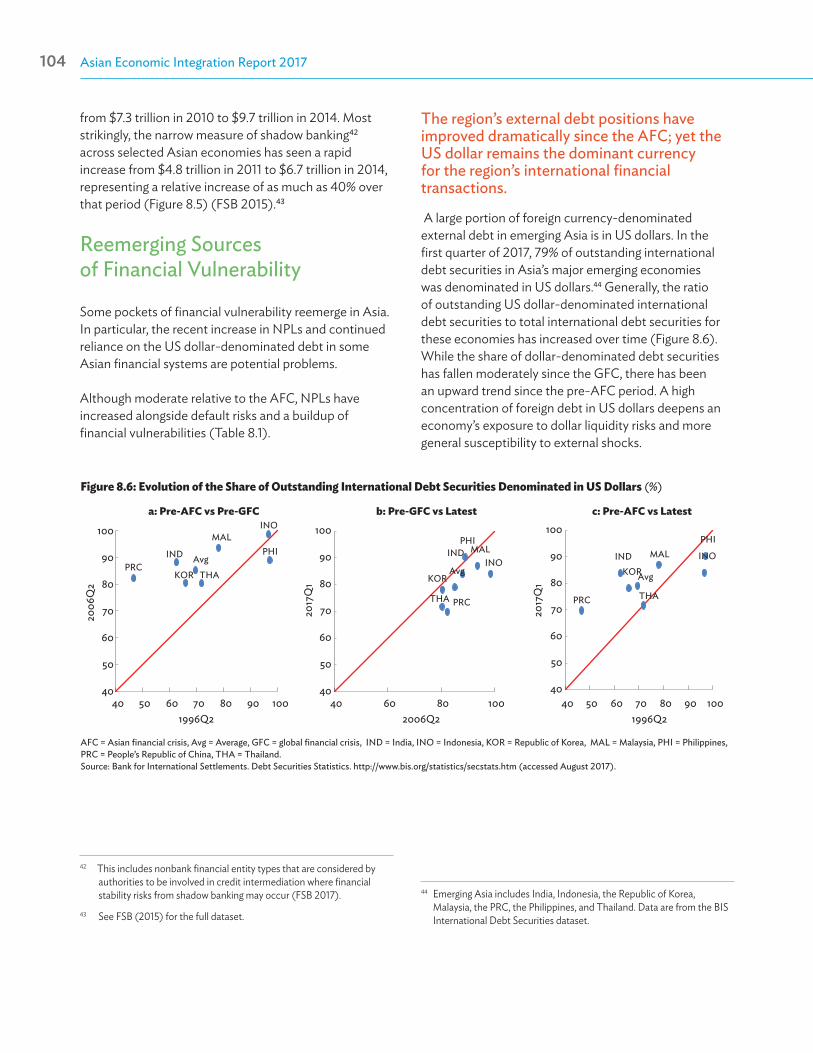
Asian Economic Integration Report 2017104 The Era of Financial Interconnectedness: How Can Asia Strengthen Financial Resilience? 105
from $7.3 trillion in 2010 to $9.7 trillion in 2014. Most strikingly, the narrow measure of shadow banking42 across selected Asian economies has seen a rapid increase from $4.8 trillion in 2011 to $6.7 trillion in 2014, representing a relative increase of as much as 40% over that period (Figure 8.5) (FSB 2015).43
Reemerging Sources of Financial Vulnerability
Some pockets of financial vulnerability reemerge in Asia. In particular, the recent increase in NPLs and continued reliance on the US dollar-denominated debt in some Asian financial systems are potential problems.
Although moderate relative to the AFC, NPLs have increased alongside default risks and a buildup of financial vulnerabilities (Table 8.1).
42 This includes nonbank financial entity types that are considered by authorities to be involved in credit intermediation where financial stability risks from shadow banking may occur (FSB 2017).
43 See FSB (2015) for the full dataset.
PRC
INO
IND
KOR
MALPHI
THAAvg
40
50
60
70
80
90
100
40 50 60 70 80 90 100
2006
Q2
1996Q2
PRC
INOIND
KOR
MALPHI
THA
Avg
40
50
60
70
80
90
100
40 60 80 100
2017
Q1
2006Q2
PRC
INOINDKOR
MALPHI
THA
Avg
40
50
60
70
80
90
100
40 50 60 70 80 90 100
2017
Q1
1996Q2
a: Pre-AFC vs Pre-GFC b: Pre-GFC vs Latest c: Pre-AFC vs Latest
Figure 8.6: Evolution of the Share of Outstanding International Debt Securities Denominated in US Dollars (%)
AFC = Asian financial crisis, Avg = Average, GFC = global financial crisis, IND = India, INO = Indonesia, KOR = Republic of Korea, MAL = Malaysia, PHI = Philippines, PRC = People’s Republic of China, THA = Thailand. Source: Bank for International Settlements. Debt Securities Statistics. http://www.bis.org/statistics/secstats.htm (accessed August 2017).
The region’s external debt positions have improved dramatically since the AFC; yet the US dollar remains the dominant currency for the region’s international financial transactions.
A large portion of foreign currency-denominated external debt in emerging Asia is in US dollars. In the first quarter of 2017, 79% of outstanding international debt securities in Asia’s major emerging economies was denominated in US dollars.44 Generally, the ratio of outstanding US dollar-denominated international debt securities to total international debt securities for these economies has increased over time (Figure 8.6). While the share of dollar-denominated debt securities has fallen moderately since the GFC, there has been an upward trend since the pre-AFC period. A high concentration of foreign debt in US dollars deepens an economy’s exposure to dollar liquidity risks and more general susceptibility to external shocks.
44 Emerging Asia includes India, Indonesia, the Republic of Korea, Malaysia, the PRC, the Philippines, and Thailand. Data are from the BIS International Debt Securities dataset.
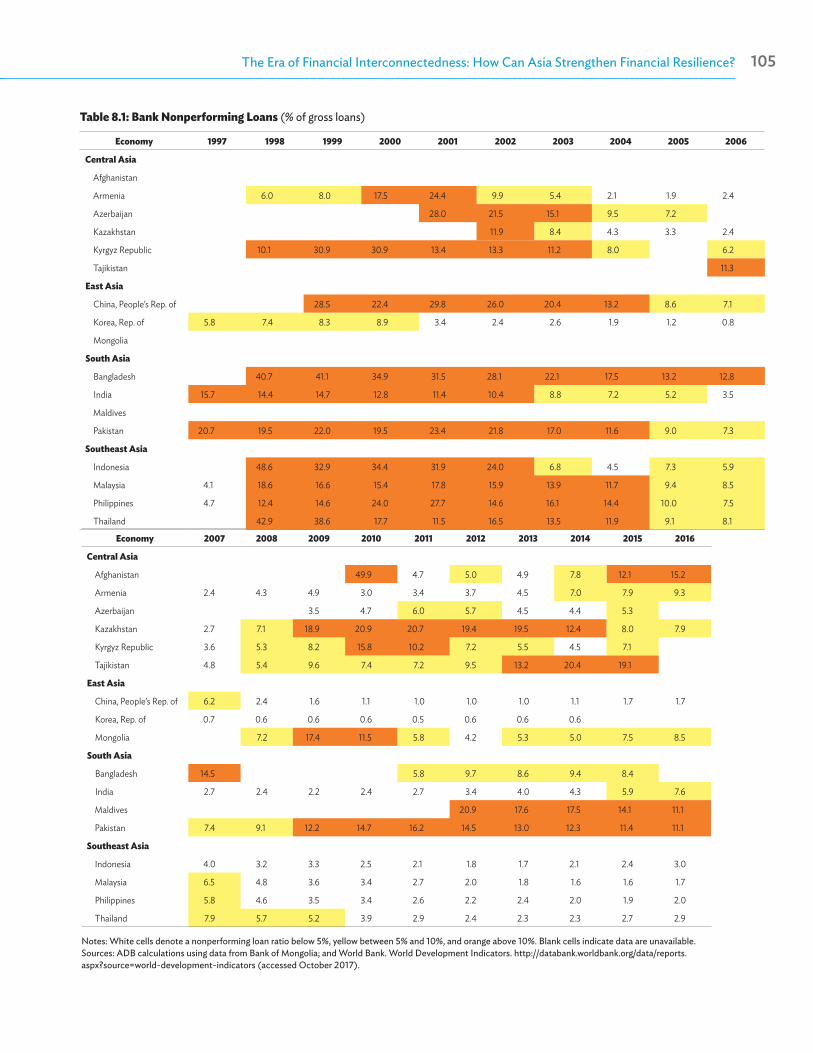
Asian Economic Integration Report 2017104 The Era of Financial Interconnectedness: How Can Asia Strengthen Financial Resilience? 105
Economy 2007 2008 2009 2010 2011 2012 2013 2014 2015 2016
Central Asia
Afghanistan 49.9 4.7 5.0 4.9 7.8 12.1 15.2
Armenia 2.4 4.3 4.9 3.0 3.4 3.7 4.5 7.0 7.9 9.3
Azerbaijan 3.5 4.7 6.0 5.7 4.5 4.4 5.3
Kazakhstan 2.7 7.1 18.9 20.9 20.7 19.4 19.5 12.4 8.0 7.9
Kyrgyz Republic 3.6 5.3 8.2 15.8 10.2 7.2 5.5 4.5 7.1
Tajikistan 4.8 5.4 9.6 7.4 7.2 9.5 13.2 20.4 19.1
East Asia
China, People’s Rep. of 6.2 2.4 1.6 1.1 1.0 1.0 1.0 1.1 1.7 1.7
Korea, Rep. of 0.7 0.6 0.6 0.6 0.5 0.6 0.6 0.6
Mongolia 7.2 17.4 11.5 5.8 4.2 5.3 5.0 7.5 8.5
South Asia
Bangladesh 14.5 5.8 9.7 8.6 9.4 8.4
India 2.7 2.4 2.2 2.4 2.7 3.4 4.0 4.3 5.9 7.6
Maldives 20.9 17.6 17.5 14.1 11.1
Pakistan 7.4 9.1 12.2 14.7 16.2 14.5 13.0 12.3 11.4 11.1
Southeast Asia
Indonesia 4.0 3.2 3.3 2.5 2.1 1.8 1.7 2.1 2.4 3.0
Malaysia 6.5 4.8 3.6 3.4 2.7 2.0 1.8 1.6 1.6 1.7
Philippines 5.8 4.6 3.5 3.4 2.6 2.2 2.4 2.0 1.9 2.0
Thailand 7.9 5.7 5.2 3.9 2.9 2.4 2.3 2.3 2.7 2.9
Notes: White cells denote a nonperforming loan ratio below 5%, yellow between 5% and 10%, and orange above 10%. Blank cells indicate data are unavailable. Sources: ADB calculations using data from Bank of Mongolia; and World Bank. World Development Indicators. http://databank.worldbank.org/data/reports.aspx?source=world-development-indicators (accessed October 2017).
Table 8.1: Bank Nonperforming Loans (% of gross loans)
Economy 1997 1998 1999 2000 2001 2002 2003 2004 2005 2006
Central Asia
Afghanistan
Armenia 6.0 8.0 17.5 24.4 9.9 5.4 2.1 1.9 2.4
Azerbaijan 28.0 21.5 15.1 9.5 7.2
Kazakhstan 11.9 8.4 4.3 3.3 2.4
Kyrgyz Republic 10.1 30.9 30.9 13.4 13.3 11.2 8.0 6.2
Tajikistan 11.3
East Asia
China, People’s Rep. of 28.5 22.4 29.8 26.0 20.4 13.2 8.6 7.1
Korea, Rep. of 5.8 7.4 8.3 8.9 3.4 2.4 2.6 1.9 1.2 0.8
Mongolia
South Asia
Bangladesh 40.7 41.1 34.9 31.5 28.1 22.1 17.5 13.2 12.8
India 15.7 14.4 14.7 12.8 11.4 10.4 8.8 7.2 5.2 3.5
Maldives
Pakistan 20.7 19.5 22.0 19.5 23.4 21.8 17.0 11.6 9.0 7.3
Southeast Asia
Indonesia 48.6 32.9 34.4 31.9 24.0 6.8 4.5 7.3 5.9
Malaysia 4.1 18.6 16.6 15.4 17.8 15.9 13.9 11.7 9.4 8.5
Philippines 4.7 12.4 14.6 24.0 27.7 14.6 16.1 14.4 10.0 7.5
Thailand 42.9 38.6 17.7 11.5 16.5 13.5 11.9 9.1 8.1
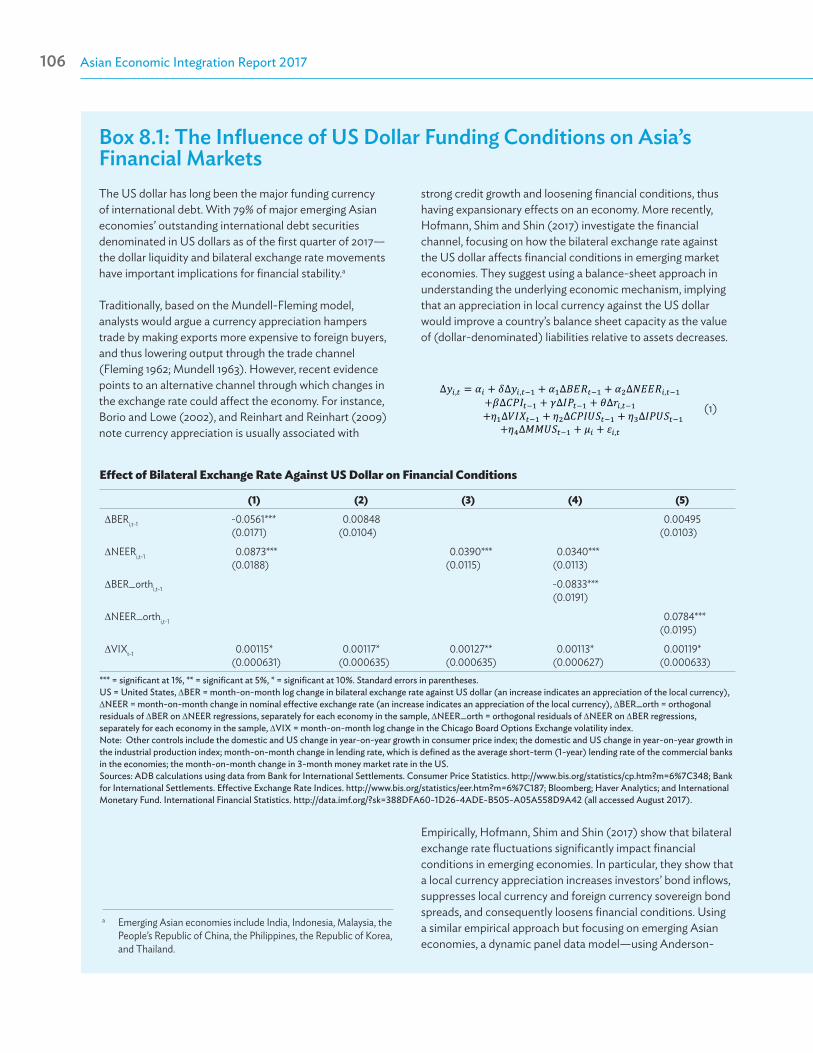
Asian Economic Integration Report 2017106 The Era of Financial Interconnectedness: How Can Asia Strengthen Financial Resilience? 107
Box 8.1: The Influence of US Dollar Funding Conditions on Asia’s Financial MarketsThe US dollar has long been the major funding currency of international debt. With 79% of major emerging Asian economies’ outstanding international debt securities denominated in US dollars as of the first quarter of 2017—the dollar liquidity and bilateral exchange rate movements have important implications for financial stability.a
Traditionally, based on the Mundell-Fleming model, analysts would argue a currency appreciation hampers trade by making exports more expensive to foreign buyers, and thus lowering output through the trade channel (Fleming 1962; Mundell 1963). However, recent evidence points to an alternative channel through which changes in the exchange rate could affect the economy. For instance, Borio and Lowe (2002), and Reinhart and Reinhart (2009) note currency appreciation is usually associated with
strong credit growth and loosening financial conditions, thus having expansionary effects on an economy. More recently, Hofmann, Shim and Shin (2017) investigate the financial channel, focusing on how the bilateral exchange rate against the US dollar affects financial conditions in emerging market economies. They suggest using a balance-sheet approach in understanding the underlying economic mechanism, implying that an appreciation in local currency against the US dollar would improve a country’s balance sheet capacity as the value of (dollar-denominated) liabilities relative to assets decreases.
∆𝑦𝑦𝑖𝑖,𝑡𝑡 = 𝛼𝛼𝑖𝑖 + 𝛿𝛿∆𝑦𝑦𝑖𝑖,𝑡𝑡−1 + 𝛼𝛼1∆𝐵𝐵𝐵𝐵𝑅𝑅𝑡𝑡−1 + 𝛼𝛼2∆𝑁𝑁𝐵𝐵𝐵𝐵𝑅𝑅𝑖𝑖,𝑡𝑡−1 +𝛽𝛽∆𝐶𝐶𝐶𝐶𝐼𝐼𝑡𝑡−1 + 𝛾𝛾∆𝐼𝐼𝐶𝐶𝑡𝑡−1 + 𝜃𝜃∆𝑟𝑟𝑖𝑖,𝑡𝑡−1
+𝜂𝜂1∆𝑉𝑉𝐼𝐼𝑋𝑋𝑡𝑡−1 + 𝜂𝜂2∆𝐶𝐶𝐶𝐶𝐼𝐼𝐶𝐶𝑆𝑆𝑡𝑡−1 + 𝜂𝜂3∆𝐼𝐼𝐶𝐶𝐶𝐶𝑆𝑆𝑡𝑡−1 +𝜂𝜂4∆𝑀𝑀𝑀𝑀𝐶𝐶𝑆𝑆𝑡𝑡−1 + 𝜇𝜇𝑖𝑖 + 𝜀𝜀𝑖𝑖,𝑡𝑡
(1)
Effect of Bilateral Exchange Rate Against US Dollar on Financial Conditions
(1) (2) (3) (4) (5)
∆BERi,t-1 -0.0561***(0.0171)
0.00848(0.0104)
0.00495(0.0103)
∆NEERi,t-1 0.0873***(0.0188)
0.0390***(0.0115)
0.0340***(0.0113)
∆BER_orthi,t-1 -0.0833***(0.0191)
∆NEER_orthi,t-1 0.0784***(0.0195)
∆VIXt-1 0.00115*(0.000631)
0.00117*(0.000635)
0.00127**(0.000635)
0.00113*(0.000627)
0.00119*(0.000633)
*** = significant at 1%, ** = significant at 5%, * = significant at 10%. Standard errors in parentheses.US = United States, ∆BER = month-on-month log change in bilateral exchange rate against US dollar (an increase indicates an appreciation of the local currency), ∆NEER = month-on-month change in nominal effective exchange rate (an increase indicates an appreciation of the local currency), ∆BER_orth = orthogonal residuals of ∆BER on ∆NEER regressions, separately for each economy in the sample, ∆NEER_orth = orthogonal residuals of ∆NEER on ∆BER regressions, separately for each economy in the sample, ∆VIX = month-on-month log change in the Chicago Board Options Exchange volatility index.Note: Other controls include the domestic and US change in year-on-year growth in consumer price index; the domestic and US change in year-on-year growth in the industrial production index; month-on-month change in lending rate, which is defined as the average short-term (1-year) lending rate of the commercial banks in the economies; the month-on-month change in 3-month money market rate in the US.Sources: ADB calculations using data from Bank for International Settlements. Consumer Price Statistics. http://www.bis.org/statistics/cp.htm?m=6%7C348; Bank for International Settlements. Effective Exchange Rate Indices. http://www.bis.org/statistics/eer.htm?m=6%7C187; Bloomberg; Haver Analytics; and International Monetary Fund. International Financial Statistics. http://data.imf.org/?sk=388DFA60-1D26-4ADE-B505-A05A558D9A42 (all accessed August 2017).
a Emerging Asian economies include India, Indonesia, Malaysia, the People’s Republic of China, the Philippines, the Republic of Korea, and Thailand.
Empirically, Hofmann, Shim and Shin (2017) show that bilateral exchange rate fluctuations significantly impact financial conditions in emerging economies. In particular, they show that a local currency appreciation increases investors’ bond inflows, suppresses local currency and foreign currency sovereign bond spreads, and consequently loosens financial conditions. Using a similar empirical approach but focusing on emerging Asian economies, a dynamic panel data model—using Anderson-
Asian Economic Integration Report 2017106 The Era of Financial Interconnectedness: How Can Asia Strengthen Financial Resilience? 107
Hsiao’s instrumental variable estimation (Anderson and Hsiao 1982)—offers some interesting results (box table).
The dependent variable is defined as the month-on-month change in local currency bond spread (LC spread)—an increase represents tightening domestic financial conditions.b It is regressed on the US dollar bilateral exchange rate (approximating the financial channel of exchange rates) and the nominal effective exchange rate (approximating the trade channel of the exchange rate). Monthly data from December 2006 to December 2016 for eight emerging Asian economies are used and five different model specifications are employed.c
First, a 1% appreciation of the domestic nominal effective exchange rate increases the LC spread by 8.7 basis points, indicating that exchange rates affect the economy through the trade channel. Second, a 1% appreciation of the domestic bilateral exchange rate against the US dollar decreases the LC spread by 5.6 basis points, thereby loosening domestic financial conditions. These results show exchange rates affect the economy through both trade and financial channels. Column (2) shows that without controlling for the trade channel, the bilateral exchange rate against the US dollar has a negligible net effect on financial conditions. On the other hand, column (3) indicates that without controlling for the change of bilateral exchange rate against the US dollar, the nominal effective exchange rate still has a significant impact on domestic financial conditions. Horse-race regressions between ∆NEER vs. BER_orth and ∆BER vs. NEER_orth reported in columns (4) and (5) further demonstrate pronounced pure effects of the financial and trade channels. In sum, the regression results are qualitatively matched with the findings of Hofmann, Shim, and Shin (2017)—that emerging Asian financial markets are particularly susceptible to changes in global dollar funding conditions.
b Defined as the difference between the 5-year sovereign local currency bond yield and the 5-year US Treasury yield.
c Estimations are calculated for India, Indonesia, Malaysia, the People’s Republic of China, the Philippines, the Republic of Korea, Thailand and Viet Nam.
Empirical evidence shows the significant impact of a change in bilateral US dollar exchange rates on sovereign bond spreads in selected emerging Asian economies with important implications for their financial conditions (Box 8.1). Generally, an appreciation of domestic currency against the US dollar improves the country’s balance sheet capacity—decreasing the value of dollar-denominated liabilities relative to assets. Policy makers need to monitor this interplay between the bilateral exchange rate and local financial market conditions.
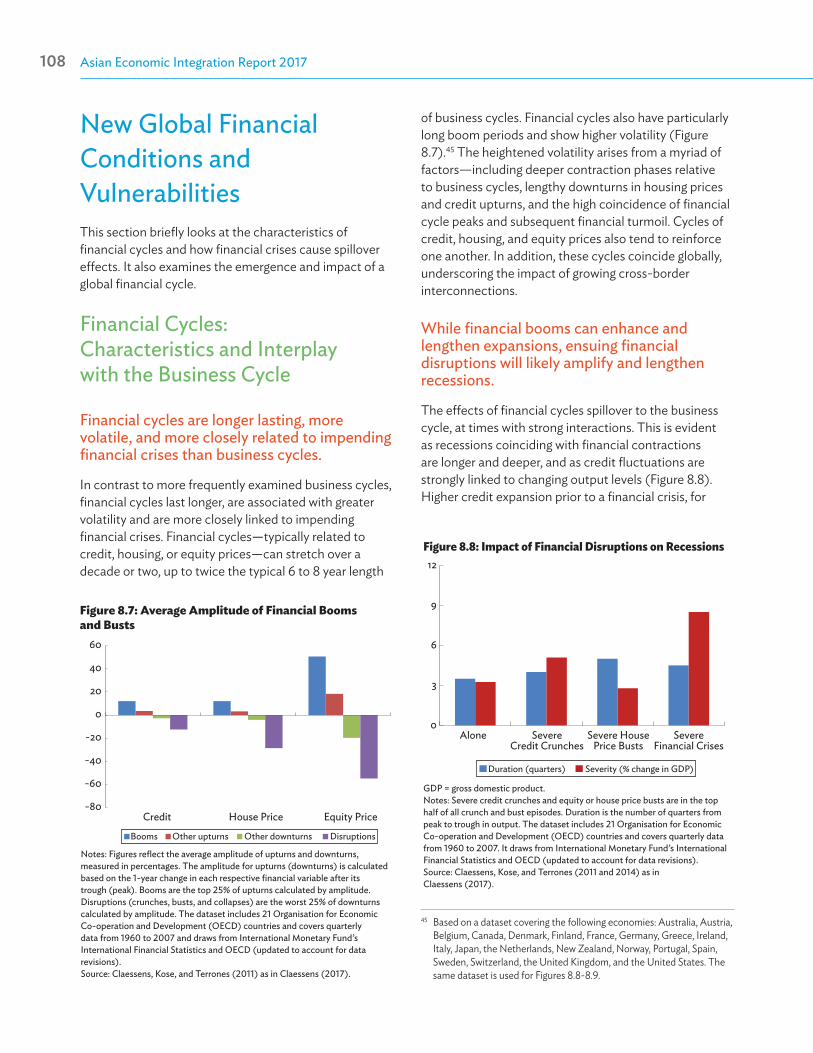
Asian Economic Integration Report 2017108 The Era of Financial Interconnectedness: How Can Asia Strengthen Financial Resilience? 109
of business cycles. Financial cycles also have particularly long boom periods and show higher volatility (Figure 8.7).45 The heightened volatility arises from a myriad of factors—including deeper contraction phases relative to business cycles, lengthy downturns in housing prices and credit upturns, and the high coincidence of financial cycle peaks and subsequent financial turmoil. Cycles of credit, housing, and equity prices also tend to reinforce one another. In addition, these cycles coincide globally, underscoring the impact of growing cross-border interconnections.
While financial booms can enhance and lengthen expansions, ensuing financial disruptions will likely amplify and lengthen recessions.
The effects of financial cycles spillover to the business cycle, at times with strong interactions. This is evident as recessions coinciding with financial contractions are longer and deeper, and as credit fluctuations are strongly linked to changing output levels (Figure 8.8). Higher credit expansion prior to a financial crisis, for
45 Based on a dataset covering the following economies: Australia, Austria, Belgium, Canada, Denmark, Finland, France, Germany, Greece, Ireland, Italy, Japan, the Netherlands, New Zealand, Norway, Portugal, Spain, Sweden, Switzerland, the United Kingdom, and the United States. The same dataset is used for Figures 8.8-8.9.
New Global Financial Conditions and Vulnerabilities This section briefly looks at the characteristics of financial cycles and how financial crises cause spillover effects. It also examines the emergence and impact of a global financial cycle.
Financial Cycles: Characteristics and Interplay with the Business Cycle
Financial cycles are longer lasting, more volatile, and more closely related to impending financial crises than business cycles.
In contrast to more frequently examined business cycles, financial cycles last longer, are associated with greater volatility and are more closely linked to impending financial crises. Financial cycles—typically related to credit, housing, or equity prices—can stretch over a decade or two, up to twice the typical 6 to 8 year length
Figure 8.8: Impact of Financial Disruptions on Recessions
GDP = gross domestic product.Notes: Severe credit crunches and equity or house price busts are in the top half of all crunch and bust episodes. Duration is the number of quarters from peak to trough in output. The dataset includes 21 Organisation for Economic Co-operation and Development (OECD) countries and covers quarterly data from 1960 to 2007. It draws from International Monetary Fund’s International Financial Statistics and OECD (updated to account for data revisions). Source: Claessens, Kose, and Terrones (2011 and 2014) as in Claessens (2017).
Alone SevereFinancial Crises
SevereCredit Crunches
Severe HousePrice Busts
Severity (% change in GDP)Duration (quarters)
0
3
6
9
12
Notes: Figures reflect the average amplitude of upturns and downturns, measured in percentages. The amplitude for upturns (downturns) is calculated based on the 1-year change in each respective financial variable after its trough (peak). Booms are the top 25% of upturns calculated by amplitude. Disruptions (crunches, busts, and collapses) are the worst 25% of downturns calculated by amplitude. The dataset includes 21 Organisation for Economic Co-operation and Development (OECD) countries and covers quarterly data from 1960 to 2007 and draws from International Monetary Fund’s International Financial Statistics and OECD (updated to account for data revisions). Source: Claessens, Kose, and Terrones (2011) as in Claessens (2017).
-80
-60
-40
-20
0
20
40
60
Credit House Price Equity Price
Booms Other upturns Other downturns Disruptions
Figure 8.7: Average Amplitude of Financial Booms and Busts
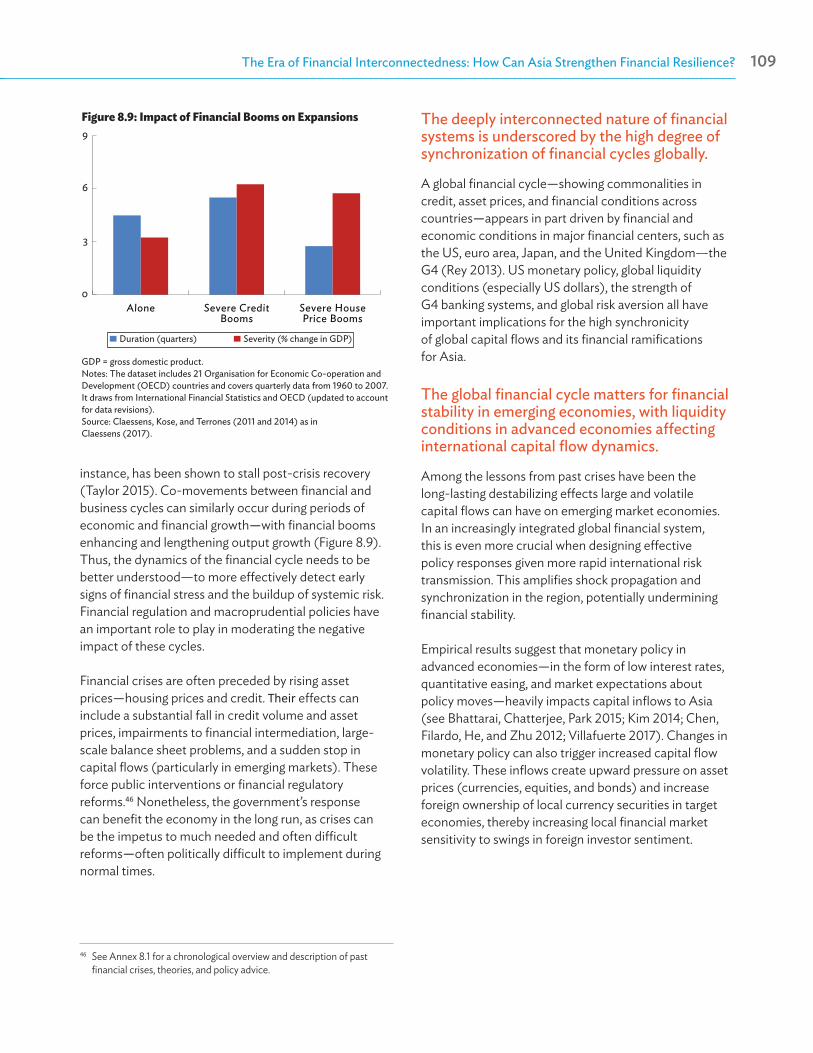
Asian Economic Integration Report 2017108 The Era of Financial Interconnectedness: How Can Asia Strengthen Financial Resilience? 109
Figure 8.9: Impact of Financial Booms on Expansions
GDP = gross domestic product. Notes: The dataset includes 21 Organisation for Economic Co-operation and Development (OECD) countries and covers quarterly data from 1960 to 2007. It draws from International Financial Statistics and OECD (updated to account for data revisions).Source: Claessens, Kose, and Terrones (2011 and 2014) as in Claessens (2017).
0
3
6
9
Alone Severe CreditBooms
Severe HousePrice Booms
Duration (quarters) Severity (% change in GDP)
instance, has been shown to stall post-crisis recovery (Taylor 2015). Co-movements between financial and business cycles can similarly occur during periods of economic and financial growth—with financial booms enhancing and lengthening output growth (Figure 8.9). Thus, the dynamics of the financial cycle needs to be better understood—to more effectively detect early signs of financial stress and the buildup of systemic risk. Financial regulation and macroprudential policies have an important role to play in moderating the negative impact of these cycles.
Financial crises are often preceded by rising asset prices—housing prices and credit. Their effects can include a substantial fall in credit volume and asset prices, impairments to financial intermediation, large-scale balance sheet problems, and a sudden stop in capital flows (particularly in emerging markets). These force public interventions or financial regulatory reforms.46 Nonetheless, the government’s response can benefit the economy in the long run, as crises can be the impetus to much needed and often difficult reforms—often politically difficult to implement during normal times.
46 See Annex 8.1 for a chronological overview and description of past financial crises, theories, and policy advice.
The deeply interconnected nature of financial systems is underscored by the high degree of synchronization of financial cycles globally.
A global financial cycle—showing commonalities in credit, asset prices, and financial conditions across countries—appears in part driven by financial and economic conditions in major financial centers, such as the US, euro area, Japan, and the United Kingdom—the G4 (Rey 2013). US monetary policy, global liquidity conditions (especially US dollars), the strength of G4 banking systems, and global risk aversion all have important implications for the high synchronicity of global capital flows and its financial ramifications for Asia.
The global financial cycle matters for financial stability in emerging economies, with liquidity conditions in advanced economies affecting international capital flow dynamics.
Among the lessons from past crises have been the long-lasting destabilizing effects large and volatile capital flows can have on emerging market economies. In an increasingly integrated global financial system, this is even more crucial when designing effective policy responses given more rapid international risk transmission. This amplifies shock propagation and synchronization in the region, potentially undermining financial stability.
Empirical results suggest that monetary policy in advanced economies—in the form of low interest rates, quantitative easing, and market expectations about policy moves—heavily impacts capital inflows to Asia (see Bhattarai, Chatterjee, Park 2015; Kim 2014; Chen, Filardo, He, and Zhu 2012; Villafuerte 2017). Changes in monetary policy can also trigger increased capital flow volatility. These inflows create upward pressure on asset prices (currencies, equities, and bonds) and increase foreign ownership of local currency securities in target economies, thereby increasing local financial market sensitivity to swings in foreign investor sentiment.
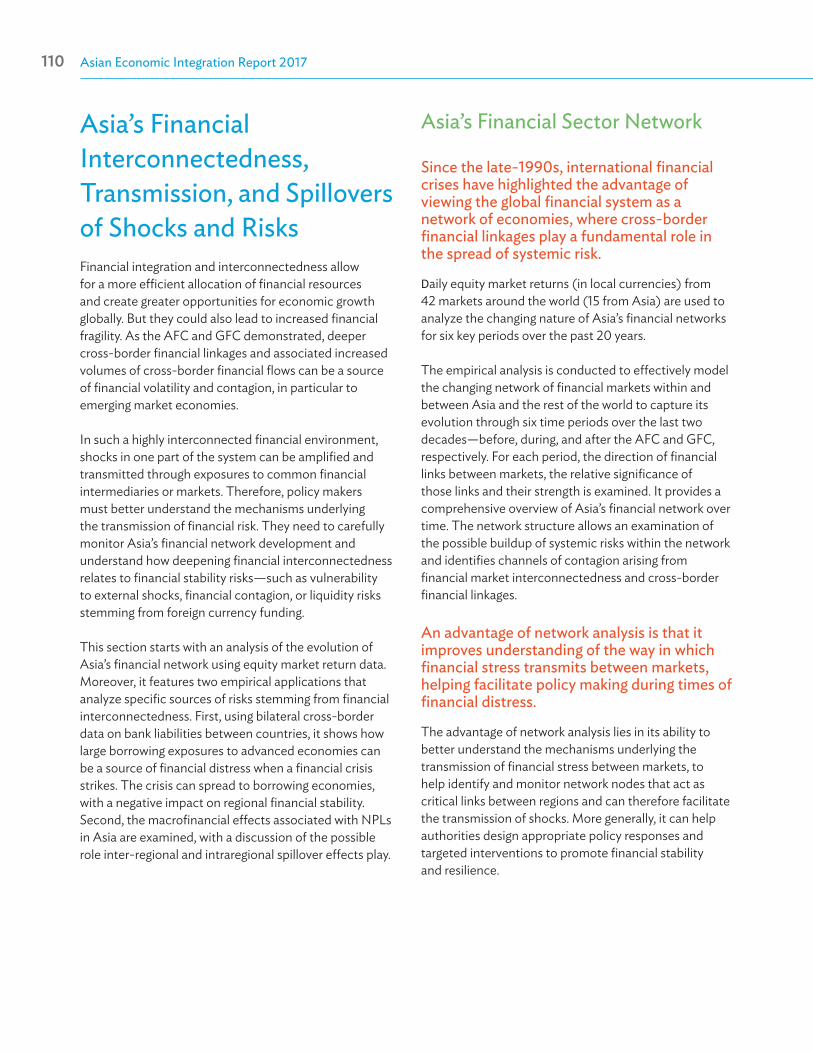
Asian Economic Integration Report 2017110 The Era of Financial Interconnectedness: How Can Asia Strengthen Financial Resilience? 111
Asia’s Financial Interconnectedness, Transmission, and Spillovers of Shocks and RisksFinancial integration and interconnectedness allow for a more efficient allocation of financial resources and create greater opportunities for economic growth globally. But they could also lead to increased financial fragility. As the AFC and GFC demonstrated, deeper cross-border financial linkages and associated increased volumes of cross-border financial flows can be a source of financial volatility and contagion, in particular to emerging market economies.
In such a highly interconnected financial environment, shocks in one part of the system can be amplified and transmitted through exposures to common financial intermediaries or markets. Therefore, policy makers must better understand the mechanisms underlying the transmission of financial risk. They need to carefully monitor Asia’s financial network development and understand how deepening financial interconnectedness relates to financial stability risks—such as vulnerability to external shocks, financial contagion, or liquidity risks stemming from foreign currency funding.
This section starts with an analysis of the evolution of Asia’s financial network using equity market return data. Moreover, it features two empirical applications that analyze specific sources of risks stemming from financial interconnectedness. First, using bilateral cross-border data on bank liabilities between countries, it shows how large borrowing exposures to advanced economies can be a source of financial distress when a financial crisis strikes. The crisis can spread to borrowing economies, with a negative impact on regional financial stability. Second, the macrofinancial effects associated with NPLs in Asia are examined, with a discussion of the possible role inter-regional and intraregional spillover effects play.
Asia’s Financial Sector Network
Since the late-1990s, international financial crises have highlighted the advantage of viewing the global financial system as a network of economies, where cross-border financial linkages play a fundamental role in the spread of systemic risk.
Daily equity market returns (in local currencies) from 42 markets around the world (15 from Asia) are used to analyze the changing nature of Asia’s financial networks for six key periods over the past 20 years.
The empirical analysis is conducted to effectively model the changing network of financial markets within and between Asia and the rest of the world to capture its evolution through six time periods over the last two decades—before, during, and after the AFC and GFC, respectively. For each period, the direction of financial links between markets, the relative significance of those links and their strength is examined. It provides a comprehensive overview of Asia’s financial network over time. The network structure allows an examination of the possible buildup of systemic risks within the network and identifies channels of contagion arising from financial market interconnectedness and cross-border financial linkages.
An advantage of network analysis is that it improves understanding of the way in which financial stress transmits between markets, helping facilitate policy making during times of financial distress.
The advantage of network analysis lies in its ability to better understand the mechanisms underlying the transmission of financial stress between markets, to help identify and monitor network nodes that act as critical links between regions and can therefore facilitate the transmission of shocks. More generally, it can help authorities design appropriate policy responses and targeted interventions to promote financial stability and resilience.

Asian Economic Integration Report 2017110 The Era of Financial Interconnectedness: How Can Asia Strengthen Financial Resilience? 111
Data of 42 equity market indexes (in local currencies)—15 located in Asia—are used to provide a comprehensive analysis of Asia’s financial network over 1996–2016.
The analysis draws on the approaches developed in Dungey et al. (2017b), Diebold and Yilmaz (2009, 2014), and Billio et al. (2012), primarily to document changes in the characteristics of Asia’s financial network over time—changes in the number and strength of links between financial markets in the network. To derive a comprehensive representation, two main steps are
applied using vector autoregression (VAR) models (Box 8.2). First, a VAR considers the relationships between all of the asset markets. Within that framework, nested Granger Causality tests determine which links are statistically significant. Second, the relative strength of the identified links—a spillover measure—is assessed through a forecast error variance decomposition, whereby the sources of observed volatility in each return are attributed to shocks in source nodes. These network statistics allow for a detailed analysis of Asia’s financial network and how it has evolved.
Box 8.2: Deriving Asia’s Financial Sector Network:Data, Methodology, and ModelThe data employed in the analysis is comprised of daily equity price indexes in local currencies of 42 markets over 1996–2016,a with 15 located in Asia. The observations are broken down into six phases covering the periods before, during and after the 1997/98 Asian financial crisis (AFC) and 2008/09 global financial crisis (GFC). Box tables 1 and 2 list the economies included, grouped by region and the time series observation in each subsample period.
Phase One and Phase Four correspond to the periods prior to the AFC and the GFC, respectively. Phases Two and Five indicate the crisis periods (see Dungey, Fry, and Martin 2006; and Dungey, Milunovich, Thorp, and Yang 2015 for more on the recognized crisis durations). Phases Three and Six cover the period following each crisis, and can be seen as recovery periods.
Using network analysis, the direction, relative significance, and strength of links between equity markets (or nodes) are determined. To study the changes in the networks across the six time periods, several aspects are assessed: (i) the changing completeness (or density) of the network; (ii) the changing number of links between nodes; (iii) the changing strength of links between nodes; (iv) the net and gross change in links between nodes; (v) “betweenness”, closeness, and eigenvalue centrality (indicating the substitutability of a node, the sum of distances to all other nodes, and the proximity between nodes, respectively); and (vi) Jaccard statistics (or the similarity of networks
1: Markets Grouped by Region
Europe Asia North America
United Kingdom Australia Canada
People’s Republic of China United States
Euro Area Hong Kong, China
Austria India Latin America
Belgium Japan Argentina
Finland Republic of Korea Brazil
France Singapore Chile
Germany Mexico
Greece ASEAN4
Ireland Indonesia Africa
Italy Malaysia Egypt
Netherlands Philippines South Africa
Portugal Thailand
Spain
Other Asia
Other Europe New Zealand
Czech Republic Pakistan
Denmark Sri Lanka
Hungary Taipei,China
Poland
Sweden
Switzerland
Turkey
Source: Dungey et al. (2017a).
Continued on next page
a The analysis is conducted using demeaned returns and actual day dating.
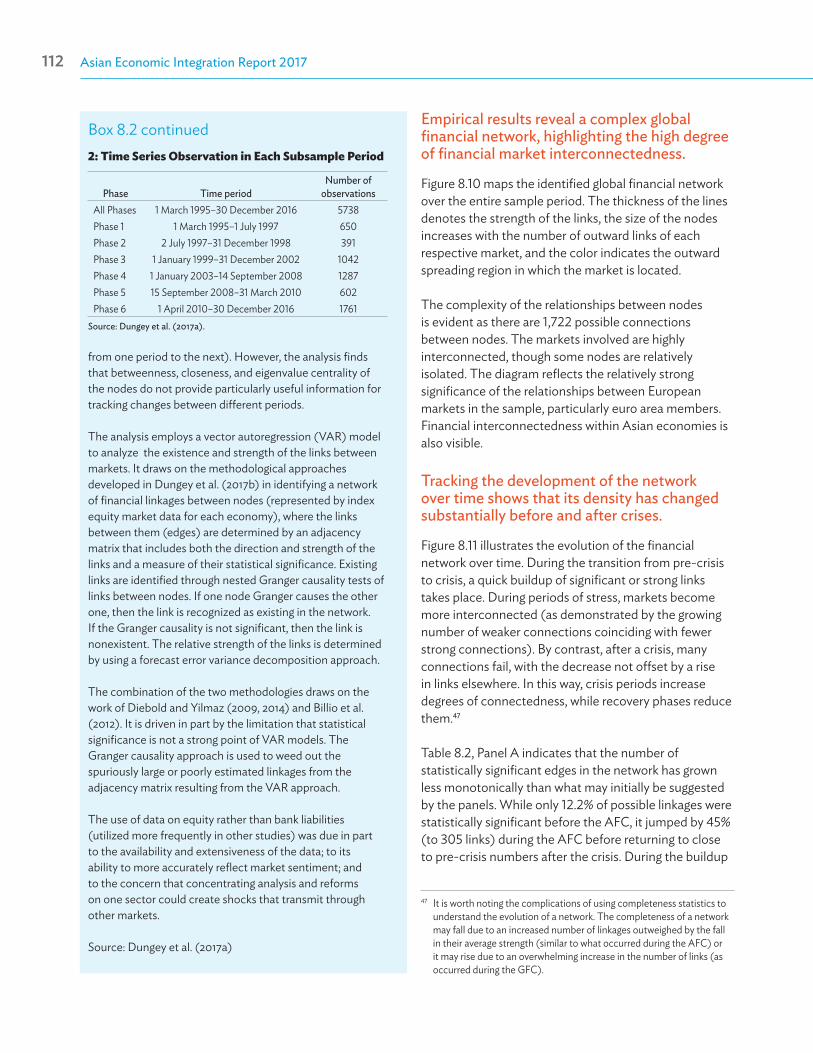
Asian Economic Integration Report 2017112 The Era of Financial Interconnectedness: How Can Asia Strengthen Financial Resilience? 113
from one period to the next). However, the analysis finds that betweenness, closeness, and eigenvalue centrality of the nodes do not provide particularly useful information for tracking changes between different periods.
The analysis employs a vector autoregression (VAR) model to analyze the existence and strength of the links between markets. It draws on the methodological approaches developed in Dungey et al. (2017b) in identifying a network of financial linkages between nodes (represented by index equity market data for each economy), where the links between them (edges) are determined by an adjacency matrix that includes both the direction and strength of the links and a measure of their statistical significance. Existing links are identified through nested Granger causality tests of links between nodes. If one node Granger causes the other one, then the link is recognized as existing in the network. If the Granger causality is not significant, then the link is nonexistent. The relative strength of the links is determined by using a forecast error variance decomposition approach.
The combination of the two methodologies draws on the work of Diebold and Yilmaz (2009, 2014) and Billio et al. (2012). It is driven in part by the limitation that statistical significance is not a strong point of VAR models. The Granger causality approach is used to weed out the spuriously large or poorly estimated linkages from the adjacency matrix resulting from the VAR approach.
The use of data on equity rather than bank liabilities (utilized more frequently in other studies) was due in part to the availability and extensiveness of the data; to its ability to more accurately reflect market sentiment; and to the concern that concentrating analysis and reforms on one sector could create shocks that transmit through other markets.
Source: Dungey et al. (2017a)
2: Time Series Observation in Each Subsample Period
Phase Time periodNumber of
observationsAll Phases 1 March 1995–30 December 2016 5738Phase 1 1 March 1995–1 July 1997 650Phase 2 2 July 1997–31 December 1998 391Phase 3 1 January 1999–31 December 2002 1042Phase 4 1 January 2003–14 September 2008 1287Phase 5 15 September 2008–31 March 2010 602Phase 6 1 April 2010–30 December 2016 1761
Source: Dungey et al. (2017a).
Box 8.2 continued Empirical results reveal a complex global financial network, highlighting the high degree of financial market interconnectedness.
Figure 8.10 maps the identified global financial network over the entire sample period. The thickness of the lines denotes the strength of the links, the size of the nodes increases with the number of outward links of each respective market, and the color indicates the outward spreading region in which the market is located.
The complexity of the relationships between nodes is evident as there are 1,722 possible connections between nodes. The markets involved are highly interconnected, though some nodes are relatively isolated. The diagram reflects the relatively strong significance of the relationships between European markets in the sample, particularly euro area members. Financial interconnectedness within Asian economies is also visible.
Tracking the development of the network over time shows that its density has changed substantially before and after crises.
Figure 8.11 illustrates the evolution of the financial network over time. During the transition from pre-crisis to crisis, a quick buildup of significant or strong links takes place. During periods of stress, markets become more interconnected (as demonstrated by the growing number of weaker connections coinciding with fewer strong connections). By contrast, after a crisis, many connections fail, with the decrease not offset by a rise in links elsewhere. In this way, crisis periods increase degrees of connectedness, while recovery phases reduce them.47
Table 8.2, Panel A indicates that the number of statistically significant edges in the network has grown less monotonically than what may initially be suggested by the panels. While only 12.2% of possible linkages were statistically significant before the AFC, it jumped by 45% (to 305 links) during the AFC before returning to close to pre-crisis numbers after the crisis. During the buildup
47 It is worth noting the complications of using completeness statistics to understand the evolution of a network. The completeness of a network may fall due to an increased number of linkages outweighed by the fall in their average strength (similar to what occurred during the AFC) or it may rise due to an overwhelming increase in the number of links (as occurred during the GFC).
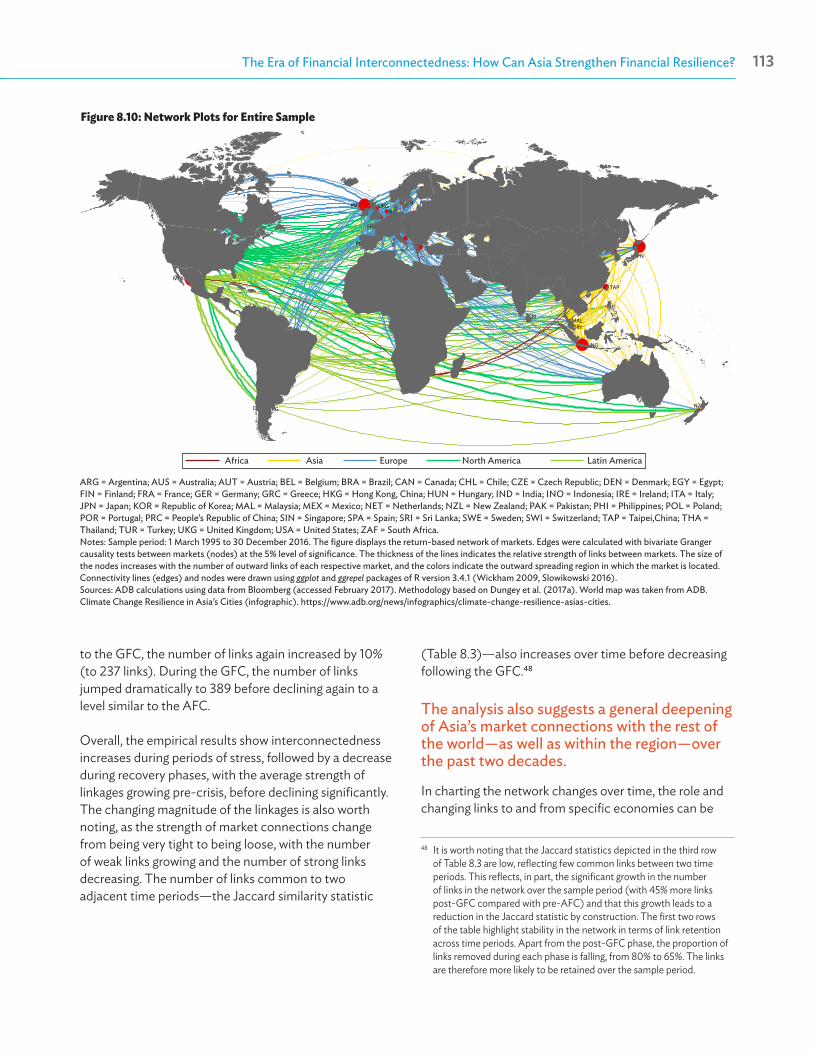
Asian Economic Integration Report 2017112 The Era of Financial Interconnectedness: How Can Asia Strengthen Financial Resilience? 113
to the GFC, the number of links again increased by 10% (to 237 links). During the GFC, the number of links jumped dramatically to 389 before declining again to a level similar to the AFC.
Overall, the empirical results show interconnectedness increases during periods of stress, followed by a decrease during recovery phases, with the average strength of linkages growing pre-crisis, before declining significantly. The changing magnitude of the linkages is also worth noting, as the strength of market connections change from being very tight to being loose, with the number of weak links growing and the number of strong links decreasing. The number of links common to two adjacent time periods—the Jaccard similarity statistic
(Table 8.3)—also increases over time before decreasing following the GFC.48
The analysis also suggests a general deepening of Asia’s market connections with the rest of the world—as well as within the region—over the past two decades.
In charting the network changes over time, the role and changing links to and from specific economies can be
48 It is worth noting that the Jaccard statistics depicted in the third row of Table 8.3 are low, reflecting few common links between two time periods. This reflects, in part, the significant growth in the number of links in the network over the sample period (with 45% more links post-GFC compared with pre-AFC) and that this growth leads to a reduction in the Jaccard statistic by construction. The first two rows of the table highlight stability in the network in terms of link retention across time periods. Apart from the post-GFC phase, the proportion of links removed during each phase is falling, from 80% to 65%. The links are therefore more likely to be retained over the sample period.
ARG = Argentina; AUS = Australia; AUT = Austria; BEL = Belgium; BRA = Brazil; CAN = Canada; CHL = Chile; CZE = Czech Republic; DEN = Denmark; EGY = Egypt; FIN = Finland; FRA = France; GER = Germany; GRC = Greece; HKG = Hong Kong, China; HUN = Hungary; IND = India; INO = Indonesia; IRE = Ireland; ITA = Italy; JPN = Japan; KOR = Republic of Korea; MAL = Malaysia; MEX = Mexico; NET = Netherlands; NZL = New Zealand; PAK = Pakistan; PHI = Philippines; POL = Poland; POR = Portugal; PRC = People’s Republic of China; SIN = Singapore; SPA = Spain; SRI = Sri Lanka; SWE = Sweden; SWI = Switzerland; TAP = Taipei,China; THA = Thailand; TUR = Turkey; UKG = United Kingdom; USA = United States; ZAF = South Africa.Notes: Sample period: 1 March 1995 to 30 December 2016. The figure displays the return-based network of markets. Edges were calculated with bivariate Granger causality tests between markets (nodes) at the 5% level of significance. The thickness of the lines indicates the relative strength of links between markets. The size of the nodes increases with the number of outward links of each respective market, and the colors indicate the outward spreading region in which the market is located. Connectivity lines (edges) and nodes were drawn using ggplot and ggrepel packages of R version 3.4.1 (Wickham 2009, Slowikowski 2016).Sources: ADB calculations using data from Bloomberg (accessed February 2017). Methodology based on Dungey et al. (2017a). World map was taken from ADB. Climate Change Resilience in Asia’s Cities (infographic). https://www.adb.org/news/infographics/climate-change-resilience-asias-cities.
Figure 8.10: Network Plots for Entire Sample
Africa Asia Europe North America Latin America
SWI
GERAUT
FIN
SPA GRC
IRE
ITA
BEL
POR
FRA
NETCZE
DENUKG
HUN
POL
SWE
TUR
ARG
BRA
CHL
MEX
INO
MAL
PHITHA
EGY
ZAF
CAN
USA
AUS
JPNPRC
IND
KOR
SIN
HKG
NZL
PAK
SRI
TAP
Africa Asia Europe North America Latin America

Asian Economic Integration Report 2017114 The Era of Financial Interconnectedness: How Can Asia Strengthen Financial Resilience? 115
ASEAN4 = Association of Southeast Asian Nation (Indonesia, Malaysia, Philippines, and Thailand); AUS = Australia; EUA = euro area; HKG = Hong Kong, China; IND = India; JPN = Japan; KOR = Republic of Korea; PRC = People’s Republic of China; SIN = Singapore; UKG = United Kingdom.Notes: The figure displays the returns-based network of 15 equity markets and regional groupings from 1 March 1995 to 30 December 2016. These are defined in Box 8.2. Edges were calculated using bivariate Granger causality tests between markets at the 5% level of significance. The thickness of the lines indicates the average relative strength of each market (or regional grouping). The size of the nodes increases with the number of outward links of each respective market (or regional grouping).Sources: ADB calculations using data from Bloomberg (accessed February 2017): and methodology based on Dungey et al. (2017a).
Figure 8.11: Evolution of Weighted Networksa: Pre-Asian Financial Crisis (1 Mar 1995–1 Jul 1997)
c: Post-Asian Financial Crisis (1 Jan 1999–31 Dec 2002)
e: Global Financial Crisis (15 Sep 2008–31 Mar 2010)
b: Asian Financial Crisis (2 Jul 1997–31 Dec 1998)
d: Pre-Global Financial Crisis (1 Jan 2003–14 Sep 2008)
f: Post-Global Financial Crisis (1 Apr 2010–30 Dec 2016)
North America
OtherAsia
OtherEurope
PRC
SIN
UKGAfrica ASEAN4
AUS
EUA
HKG
IND
JPN
KORLatin America
North America
OtherAsia
OtherEurope
PRC
SIN
UKGAfrica ASEAN4
AUS
EUA
HKG
IND
JPN
KORLatin America
North America
OtherAsia
OtherEurope
PRC
SIN
UKGAfrica ASEAN4
AUS
EUA
HKG
IND
JPN
KORLatin America
North America
OtherAsia
OtherEurope
PRC
SIN
UKGAfrica ASEAN4
AUS
EUA
HKG
IND
JPN
KORLatin America
North America
OtherAsia
OtherEurope
PRC
SIN
UKGAfrica ASEAN4
AUS
EUA
HKG
IND
JPN
KORLatin America
North America
OtherAsia
OtherEurope
PRC
SIN
UKGAfrica ASEAN4
AUS
EUA
HKG
IND
JPN
KORLatin America
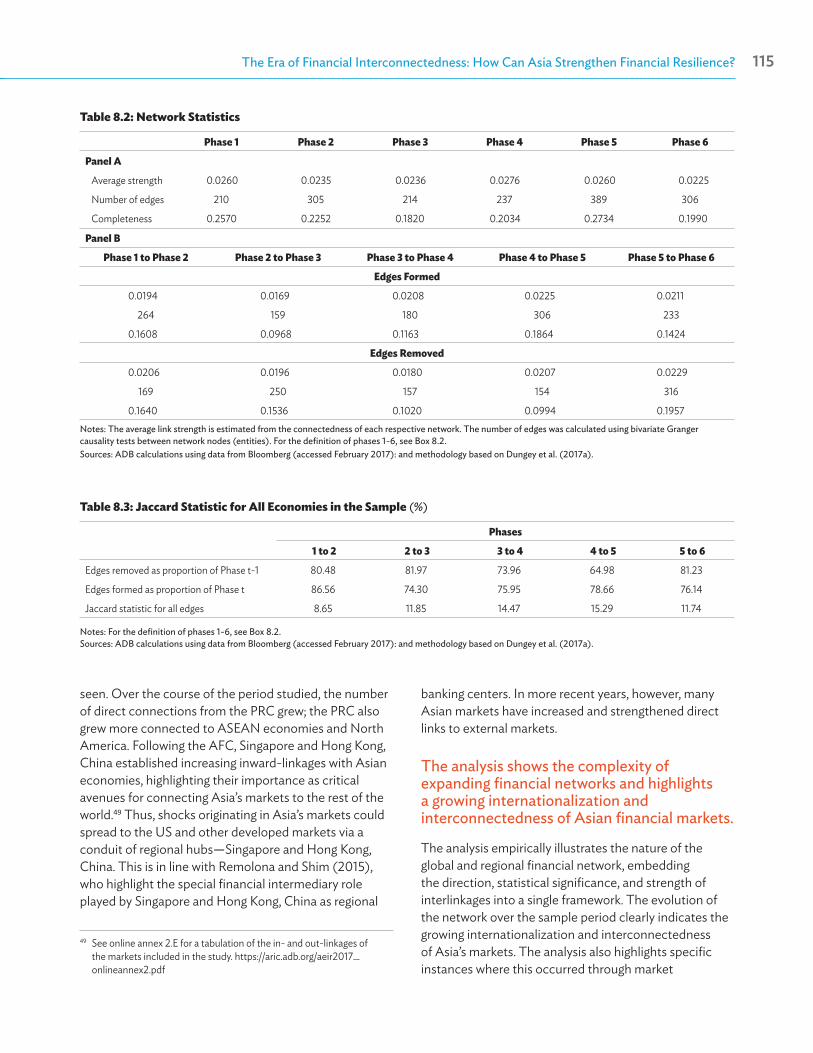
Asian Economic Integration Report 2017114 The Era of Financial Interconnectedness: How Can Asia Strengthen Financial Resilience? 115
Table 8.2: Network Statistics
Phase 1 Phase 2 Phase 3 Phase 4 Phase 5 Phase 6
Panel A
Average strength 0.0260 0.0235 0.0236 0.0276 0.0260 0.0225
Number of edges 210 305 214 237 389 306
Completeness 0.2570 0.2252 0.1820 0.2034 0.2734 0.1990
Panel B
Phase 1 to Phase 2 Phase 2 to Phase 3 Phase 3 to Phase 4 Phase 4 to Phase 5 Phase 5 to Phase 6
Edges Formed
0.0194 0.0169 0.0208 0.0225 0.0211
264 159 180 306 233
0.1608 0.0968 0.1163 0.1864 0.1424
Edges Removed
0.0206 0.0196 0.0180 0.0207 0.0229
169 250 157 154 316
0.1640 0.1536 0.1020 0.0994 0.1957Notes: The average link strength is estimated from the connectedness of each respective network. The number of edges was calculated using bivariate Granger causality tests between network nodes (entities). For the definition of phases 1-6, see Box 8.2.Sources: ADB calculations using data from Bloomberg (accessed February 2017): and methodology based on Dungey et al. (2017a).
seen. Over the course of the period studied, the number of direct connections from the PRC grew; the PRC also grew more connected to ASEAN economies and North America. Following the AFC, Singapore and Hong Kong, China established increasing inward-linkages with Asian economies, highlighting their importance as critical avenues for connecting Asia’s markets to the rest of the world.49 Thus, shocks originating in Asia’s markets could spread to the US and other developed markets via a conduit of regional hubs—Singapore and Hong Kong, China. This is in line with Remolona and Shim (2015), who highlight the special financial intermediary role played by Singapore and Hong Kong, China as regional
49 See online annex 2.E for a tabulation of the in- and out-linkages of the markets included in the study. https://aric.adb.org/aeir2017_onlineannex2.pdf
Table 8.3: Jaccard Statistic for All Economies in the Sample (%)
Phases
1 to 2 2 to 3 3 to 4 4 to 5 5 to 6
Edges removed as proportion of Phase t-1 80.48 81.97 73.96 64.98 81.23
Edges formed as proportion of Phase t 86.56 74.30 75.95 78.66 76.14
Jaccard statistic for all edges 8.65 11.85 14.47 15.29 11.74
Notes: For the definition of phases 1-6, see Box 8.2. Sources: ADB calculations using data from Bloomberg (accessed February 2017): and methodology based on Dungey et al. (2017a).
banking centers. In more recent years, however, many Asian markets have increased and strengthened direct links to external markets.
The analysis shows the complexity of expanding financial networks and highlights a growing internationalization and interconnectedness of Asian financial markets.
The analysis empirically illustrates the nature of the global and regional financial network, embedding the direction, statistical significance, and strength of interlinkages into a single framework. The evolution of the network over the sample period clearly indicates the growing internationalization and interconnectedness of Asia’s markets. The analysis also highlights specific instances where this occurred through market
Asian Economic Integration Report 2017116 The Era of Financial Interconnectedness: How Can Asia Strengthen Financial Resilience? 117
interaction with local or regional hubs—particularly Hong Kong, China or Singapore. However, over time Asia’s markets increasingly link directly with other regions.
Strikingly, the analysis shows just how interconnected Asia’s financial markets are, and their associated shared risks and vulnerabilities. This underscores the need for coordinated action in designing and structuring policies aimed at making the region’s financial systems more resilient. As past crises have taught us, economies cannot safeguard financial stability alone. Rather, national policies need to be supplemented regionally to make Asia more resilient.
Finally, one limitation inherent in the model follows from the use of the single dimension of asset markets in the analysis. Equity markets may not fully capture the complexities in overall financial linkages between economies. The challenge to researchers and policy makers is to include different asset markets and potentially different players to better reflect the complexity of multiple layers of financial interconnectedness between economies. Sovereign bond market networks will, for instance, differ from equity market networks (Dungey et al. 2017a), and real economy networks—such as trade networks or input-output production networks (Pesaran and Yang 2016)—are closely tied to financial networks, but the weights on the nodes can be different and multidimensional.50
Global Financial Interconnectedness of the Banking Sector
The GFC highlighted how financial weaknesses and vulnerabilities can intensify with greater financial interconnectedness.
Although the GFC originated in advanced economies—unlike the AFC—emerging economies were also hit due to the increasingly interconnected global financial system. Banks in emerging economies faced a liquidity crunch as some troubled banks in advanced economies unwound their international investment positions and
50 See online annex 2.F for a discussion on the use of high frequency data in assessing financial networks. https://aric.adb.org/aeir2017_onlineannex2. pdf
withdrew funds from emerging markets. These spillovers were exacerbated if the troubled banks were larger and more interconnected—SIFIs were responsible for transmitting financial distress to well-connected financial institutions.
Recent studies look at possible contagion through domestic banks’ liability-side exposure to foreign banks during the GFC.
A few recent studies highlight the risk of financial spillovers emanating from bank exposures on the liabilities side. An examination of the Northern Rock bank run in the United Kingdom demonstrates how a potential financial disruption can unfold as creditors pull back leverage in an effort to limit risk exposure.
Given the importance of the liability side as a channel of financial contagion, an empirical investigation tests the contagion effect of an economy using bilateral data on bank claims between economies. The goal is to empirically measure the effect of direct and indirect exposures of emerging economies to crisis-affected economies and to test whether these exposures can account for the capital outflows from emerging economies. Using data from 27 different Bank for International Settlements (BIS) reporting economies, 62 counterparty emerging economies are chosen for the model. These also include 12 emerging Asian economies (Box 8.3).51
An emerging economy’s direct and indirect exposures on the liability side to crisis-affected banks in advanced economies can explain the capital outflows experienced during the GFC.
The results reveal that both direct and indirect exposures to crisis-affected economies play an important role in explaining the capital outflows experienced by emerging market economies during the GFC. These findings highlight the importance of the banking channel for financial distress transmitted from advanced lending economies to borrowing emerging economies. Analyzing the impact of exposures to foreign liabilities on capital outflows during the GFC (Table 8.4) shows that the coefficients of direct exposure of the banking sector
51 Bangladesh, Georgia, India, Indonesia, the Kyrgyz Republic, Malaysia, Mongolia, Pakistan, the Philippines, the Republic of Korea, Sri Lanka, and Thailand.
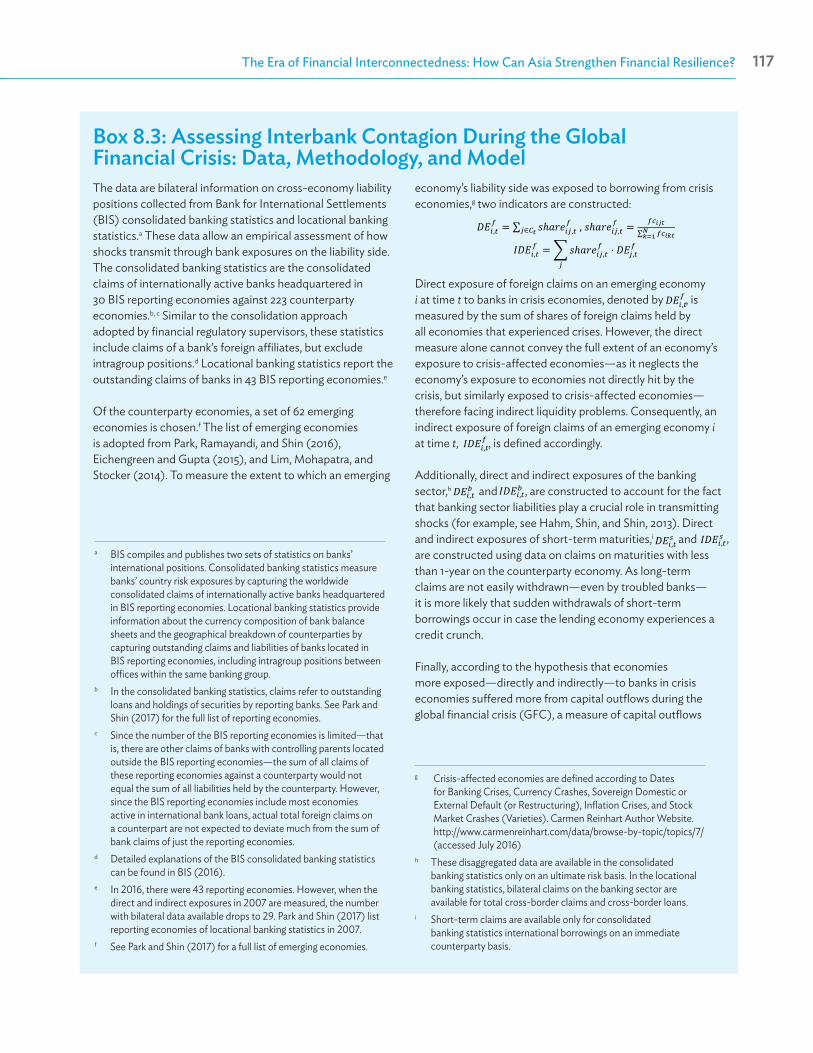
Asian Economic Integration Report 2017116 The Era of Financial Interconnectedness: How Can Asia Strengthen Financial Resilience? 117
Box 8.3: Assessing Interbank Contagion During the Global Financial Crisis: Data, Methodology, and ModelThe data are bilateral information on cross-economy liability positions collected from Bank for International Settlements (BIS) consolidated banking statistics and locational banking statistics.a These data allow an empirical assessment of how shocks transmit through bank exposures on the liability side. The consolidated banking statistics are the consolidated claims of internationally active banks headquartered in 30 BIS reporting economies against 223 counterparty economies.b, c Similar to the consolidation approach adopted by financial regulatory supervisors, these statistics include claims of a bank’s foreign affiliates, but exclude intragroup positions.d Locational banking statistics report the outstanding claims of banks in 43 BIS reporting economies.e
Of the counterparty economies, a set of 62 emerging economies is chosen.f The list of emerging economies is adopted from Park, Ramayandi, and Shin (2016), Eichengreen and Gupta (2015), and Lim, Mohapatra, and Stocker (2014). To measure the extent to which an emerging
economy’s liability side was exposed to borrowing from crisis economies,g two indicators are constructed:
Direct exposure of foreign claims on an emerging economy i at time t to banks in crisis economies, denoted by , is measured by the sum of shares of foreign claims held by all economies that experienced crises. However, the direct measure alone cannot convey the full extent of an economy’s exposure to crisis-affected economies—as it neglects the economy’s exposure to economies not directly hit by the crisis, but similarly exposed to crisis-affected economies—therefore facing indirect liquidity problems. Consequently, an indirect exposure of foreign claims of an emerging economy i at time t, , is defined accordingly.
Additionally, direct and indirect exposures of the banking sector,h and , are constructed to account for the fact that banking sector liabilities play a crucial role in transmitting shocks (for example, see Hahm, Shin, and Shin, 2013). Direct and indirect exposures of short-term maturities,i and are constructed using data on claims on maturities with less than 1-year on the counterparty economy. As long-term claims are not easily withdrawn—even by troubled banks—it is more likely that sudden withdrawals of short-term borrowings occur in case the lending economy experiences a credit crunch.
Finally, according to the hypothesis that economies more exposed—directly and indirectly—to banks in crisis economies suffered more from capital outflows during the global financial crisis (GFC), a measure of capital outflows
a BIS compiles and publishes two sets of statistics on banks’ international positions. Consolidated banking statistics measure banks’ country risk exposures by capturing the worldwide consolidated claims of internationally active banks headquartered in BIS reporting economies. Locational banking statistics provide information about the currency composition of bank balance sheets and the geographical breakdown of counterparties by capturing outstanding claims and liabilities of banks located in BIS reporting economies, including intragroup positions between offices within the same banking group.
b In the consolidated banking statistics, claims refer to outstanding loans and holdings of securities by reporting banks. See Park and Shin (2017) for the full list of reporting economies.
c Since the number of the BIS reporting economies is limited—that is, there are other claims of banks with controlling parents located outside the BIS reporting economies—the sum of all claims of these reporting economies against a counterparty would not equal the sum of all liabilities held by the counterparty. However, since the BIS reporting economies include most economies active in international bank loans, actual total foreign claims on a counterpart are not expected to deviate much from the sum of bank claims of just the reporting economies.
d Detailed explanations of the BIS consolidated banking statistics can be found in BIS (2016).
e In 2016, there were 43 reporting economies. However, when the direct and indirect exposures in 2007 are measured, the number with bilateral data available drops to 29. Park and Shin (2017) list reporting economies of locational banking statistics in 2007.
f See Park and Shin (2017) for a full list of emerging economies.
g Crisis-affected economies are defined according to Dates for Banking Crises, Currency Crashes, Sovereign Domestic or External Default (or Restructuring), Inflation Crises, and Stock Market Crashes (Varieties). Carmen Reinhart Author Website. http://www.carmenreinhart.com/data/browse-by-topic/topics/7/ (accessed July 2016)
h These disaggregated data are available in the consolidated banking statistics only on an ultimate risk basis. In the locational banking statistics, bilateral claims on the banking sector are available for total cross-border claims and cross-border loans.
i Short-term claims are available only for consolidated banking statistics international borrowings on an immediate counterparty basis.
𝐷𝐷𝐷𝐷𝑖𝑖,𝑡𝑡𝑓𝑓 = ∑ 𝑠𝑠ℎ𝑎𝑎𝑎𝑎𝑎𝑎𝑖𝑖𝑖𝑖,𝑡𝑡
𝑓𝑓𝑖𝑖∈𝐶𝐶𝑡𝑡 , 𝑠𝑠ℎ𝑎𝑎𝑎𝑎𝑎𝑎𝑖𝑖𝑖𝑖,𝑡𝑡
𝑓𝑓 = 𝑓𝑓𝑓𝑓𝑖𝑖𝑖𝑖𝑡𝑡∑ 𝑓𝑓𝑓𝑓𝑖𝑖𝑖𝑖𝑡𝑡𝑁𝑁𝑖𝑖=1
𝐼𝐼𝐷𝐷𝐷𝐷𝑖𝑖,𝑡𝑡𝑓𝑓 = ∑𝑠𝑠ℎ𝑎𝑎𝑎𝑎𝑎𝑎𝑖𝑖𝑖𝑖,𝑡𝑡
𝑓𝑓
𝑖𝑖· 𝐷𝐷𝐷𝐷𝑖𝑖,𝑡𝑡
𝑓𝑓
𝐷𝐷𝐷𝐷𝑖𝑖,𝑡𝑡𝑓𝑓
𝐼𝐼𝐷𝐷𝐷𝐷𝑖𝑖,𝑡𝑡
𝑓𝑓
𝐷𝐷𝐷𝐷𝑖𝑖,𝑡𝑡𝑏𝑏
𝐼𝐼𝐷𝐷𝐷𝐷𝑖𝑖,𝑡𝑡𝑏𝑏
𝐷𝐷𝐷𝐷𝑖𝑖,𝑡𝑡𝑠𝑠
𝐼𝐼𝐷𝐷𝐷𝐷𝑖𝑖,𝑡𝑡𝑠𝑠
𝐾𝐾𝐾𝐾𝐾𝐾𝐾𝐾𝐾𝐾𝐾𝐾𝐾𝐾𝐾𝐾𝑖𝑖
𝐾𝐾𝐾𝐾𝐾𝐾𝐾𝐾𝐾𝐾𝐾𝐾𝐾𝐾𝐾𝐾𝑖𝑖 =𝑇𝑇𝑇𝑇𝑇𝑇𝑖𝑖𝑚𝑚𝑚𝑚𝑚𝑚 − 𝑇𝑇𝑇𝑇𝑇𝑇𝑖𝑖𝑚𝑚𝑖𝑖𝑚𝑚
𝑇𝑇𝑇𝑇𝑇𝑇𝑖𝑖𝑚𝑚𝑚𝑚𝑚𝑚
𝑇𝑇𝑇𝑇𝑇𝑇𝑖𝑖𝑚𝑚𝑚𝑚𝑚𝑚
𝑇𝑇𝑇𝑇𝑇𝑇𝑖𝑖𝑚𝑚𝑖𝑖𝑚𝑚
𝐾𝐾𝐾𝐾𝐾𝐾𝐾𝐾𝐾𝐾𝐾𝐾𝐾𝐾𝐾𝐾𝑖𝑖 = 𝛽𝛽0 + 𝛽𝛽1𝐷𝐷𝐷𝐷𝑖𝑖,2007
𝑖𝑖 + 𝛽𝛽2𝐼𝐼𝐷𝐷𝐷𝐷𝑖𝑖,2007𝑖𝑖 +𝛽𝛽3𝑋𝑋𝑖𝑖,2007 + 𝜀𝜀𝑖𝑖
𝐷𝐷𝐷𝐷𝑖𝑖,2007
𝑖𝑖
𝐼𝐼𝐷𝐷𝐷𝐷𝑖𝑖,2007𝑖𝑖
,
Asian Economic Integration Report 2017118 The Era of Financial Interconnectedness: How Can Asia Strengthen Financial Resilience? 119
Box 8.2 continuedare positive and statistically significant, regardless of whether indirect exposure is added, and whether economy-specific control variables (Xi, 2007) are included in the analysis. It is also worth noting that the coefficient of indirect exposure of the banking sector is positive, although it is not statistically significant, when controlling for the full set of other variables. In particular, the addition of sovereign credit rating seems to play a role in mitigating the effect of an economy’s indirect exposure. Therefore, Table 8.4 indicates that it is predominantly the banking sector’s direct exposure, as opposed to indirect exposure, which explains the capital outflows experienced by emerging economies.52
This empirical exercise shows that shocks in advanced economies are transmitted to emerging economies as the credit crunch experienced by troubled banks in turn triggers a run on banks and other entities in emerging economies. The findings underscore the significance of both the degree of an economy’s direct and indirect exposures through the banking sector to crisis-affected countries as an important determinant of capital outflows. Hence, these findings suggest that the global banking network of aggregate cross-border lending can be a channel for a global liquidity crunch that can spread financial shocks globally. This liquidity issue of creditor banks can be particularly problematic for emerging market economies, as they rely heavily on foreign borrowing denominated in foreign currency.
The findings are consistent with the conclusions of recent financial contagion studies that highlight the financial vulnerabilities facing economies not directly affected by a crisis—that stem from deleveraging by creditors in crisis-affected economies, and exacerbated by a wider, denser global financial network (see Shin 2009). The results also demonstrate how financial distress can be transmitted from creditor economies to borrowing economies through their funding channels—highlighting the important dimension of the liability side (as in Čihák, Muñoz, and Scuzzarella 2011).
52 For more on the impact of direct and indirect exposures of foreign claims and of short-term international borrowings on capital outflows during the GFC, see Online Annexes 2.G and 2.H. https://aric.adb.org/aeir2017_onlineannex2.pdf
from economy i during the GFC, , is defined as follows:
where and are the maximum and the minimum levels of total foreign claims on economy i during the period from the first quarter (Q1) of 2007 to Q4 2009. It is assumed that the difference between the maximum and the minimum levels of foreign claims on economy i during the period represent the volume of capital outflows from economy i. Total foreign claims are measured by adding foreign claims on economy i across all reporting economies.
To measure the extent to which capital outflows from emerging economies during the GFC were triggered by direct and indirect exposures vis-à-vis crisis-affected advanced economies, the following regression equation for all three exposure definitions is applied:
where and are measures of direct and indirect exposure in Q4 2007, while Xi, 2007 captures other control variables of economy i at time t, that include aggravation of current account balances, real exchange rate appreciation before the GFC, increase in domestic credit-to-gross domestic product (GDP) ratio, inflation rate, and real GDP growth rate.j
Source: Park and Shin (2017).
𝐷𝐷𝐷𝐷𝑖𝑖,𝑡𝑡𝑓𝑓 = ∑ 𝑠𝑠ℎ𝑎𝑎𝑎𝑎𝑎𝑎𝑖𝑖𝑖𝑖,𝑡𝑡
𝑓𝑓𝑖𝑖∈𝐶𝐶𝑡𝑡 , 𝑠𝑠ℎ𝑎𝑎𝑎𝑎𝑎𝑎𝑖𝑖𝑖𝑖,𝑡𝑡
𝑓𝑓 = 𝑓𝑓𝑓𝑓𝑖𝑖𝑖𝑖𝑡𝑡∑ 𝑓𝑓𝑓𝑓𝑖𝑖𝑖𝑖𝑡𝑡𝑁𝑁𝑖𝑖=1
𝐼𝐼𝐷𝐷𝐷𝐷𝑖𝑖,𝑡𝑡𝑓𝑓 = ∑𝑠𝑠ℎ𝑎𝑎𝑎𝑎𝑎𝑎𝑖𝑖𝑖𝑖,𝑡𝑡
𝑓𝑓
𝑖𝑖· 𝐷𝐷𝐷𝐷𝑖𝑖,𝑡𝑡
𝑓𝑓
𝐷𝐷𝐷𝐷𝑖𝑖,𝑡𝑡𝑓𝑓
𝐼𝐼𝐷𝐷𝐷𝐷𝑖𝑖,𝑡𝑡
𝑓𝑓
𝐷𝐷𝐷𝐷𝑖𝑖,𝑡𝑡𝑏𝑏
𝐼𝐼𝐷𝐷𝐷𝐷𝑖𝑖,𝑡𝑡𝑏𝑏
𝐷𝐷𝐷𝐷𝑖𝑖,𝑡𝑡𝑠𝑠
𝐼𝐼𝐷𝐷𝐷𝐷𝑖𝑖,𝑡𝑡𝑠𝑠
𝐾𝐾𝐾𝐾𝐾𝐾𝐾𝐾𝐾𝐾𝐾𝐾𝐾𝐾𝐾𝐾𝑖𝑖
𝐾𝐾𝐾𝐾𝐾𝐾𝐾𝐾𝐾𝐾𝐾𝐾𝐾𝐾𝐾𝐾𝑖𝑖 =𝑇𝑇𝑇𝑇𝑇𝑇𝑖𝑖𝑚𝑚𝑚𝑚𝑚𝑚 − 𝑇𝑇𝑇𝑇𝑇𝑇𝑖𝑖𝑚𝑚𝑖𝑖𝑚𝑚
𝑇𝑇𝑇𝑇𝑇𝑇𝑖𝑖𝑚𝑚𝑚𝑚𝑚𝑚
𝑇𝑇𝑇𝑇𝑇𝑇𝑖𝑖𝑚𝑚𝑚𝑚𝑚𝑚
𝑇𝑇𝑇𝑇𝑇𝑇𝑖𝑖𝑚𝑚𝑖𝑖𝑚𝑚
𝐾𝐾𝐾𝐾𝐾𝐾𝐾𝐾𝐾𝐾𝐾𝐾𝐾𝐾𝐾𝐾𝑖𝑖 = 𝛽𝛽0 + 𝛽𝛽1𝐷𝐷𝐷𝐷𝑖𝑖,2007
𝑖𝑖 + 𝛽𝛽2𝐼𝐼𝐷𝐷𝐷𝐷𝑖𝑖,2007𝑖𝑖 +𝛽𝛽3𝑋𝑋𝑖𝑖,2007 + 𝜀𝜀𝑖𝑖
𝐷𝐷𝐷𝐷𝑖𝑖,2007
𝑖𝑖
𝐼𝐼𝐷𝐷𝐷𝐷𝑖𝑖,2007𝑖𝑖
j See Eichengreen and Gupta (2015) and Park, Ramayandi, and Shin (2016) for the motivation for including these as explanatory variables.
𝐷𝐷𝐷𝐷𝑖𝑖,𝑡𝑡𝑓𝑓 = ∑ 𝑠𝑠ℎ𝑎𝑎𝑎𝑎𝑎𝑎𝑖𝑖𝑖𝑖,𝑡𝑡
𝑓𝑓𝑖𝑖∈𝐶𝐶𝑡𝑡 , 𝑠𝑠ℎ𝑎𝑎𝑎𝑎𝑎𝑎𝑖𝑖𝑖𝑖,𝑡𝑡
𝑓𝑓 = 𝑓𝑓𝑓𝑓𝑖𝑖𝑖𝑖𝑡𝑡∑ 𝑓𝑓𝑓𝑓𝑖𝑖𝑖𝑖𝑡𝑡𝑁𝑁𝑖𝑖=1
𝐼𝐼𝐷𝐷𝐷𝐷𝑖𝑖,𝑡𝑡𝑓𝑓 = ∑𝑠𝑠ℎ𝑎𝑎𝑎𝑎𝑎𝑎𝑖𝑖𝑖𝑖,𝑡𝑡
𝑓𝑓
𝑖𝑖· 𝐷𝐷𝐷𝐷𝑖𝑖,𝑡𝑡
𝑓𝑓
𝐷𝐷𝐷𝐷𝑖𝑖,𝑡𝑡𝑓𝑓
𝐼𝐼𝐷𝐷𝐷𝐷𝑖𝑖,𝑡𝑡
𝑓𝑓
𝐷𝐷𝐷𝐷𝑖𝑖,𝑡𝑡𝑏𝑏
𝐼𝐼𝐷𝐷𝐷𝐷𝑖𝑖,𝑡𝑡𝑏𝑏
𝐷𝐷𝐷𝐷𝑖𝑖,𝑡𝑡𝑠𝑠
𝐼𝐼𝐷𝐷𝐷𝐷𝑖𝑖,𝑡𝑡𝑠𝑠
𝐾𝐾𝐾𝐾𝐾𝐾𝐾𝐾𝐾𝐾𝐾𝐾𝐾𝐾𝐾𝐾𝑖𝑖
𝐾𝐾𝐾𝐾𝐾𝐾𝐾𝐾𝐾𝐾𝐾𝐾𝐾𝐾𝐾𝐾𝑖𝑖 =𝑇𝑇𝑇𝑇𝑇𝑇𝑖𝑖𝑚𝑚𝑚𝑚𝑚𝑚 − 𝑇𝑇𝑇𝑇𝑇𝑇𝑖𝑖𝑚𝑚𝑖𝑖𝑚𝑚
𝑇𝑇𝑇𝑇𝑇𝑇𝑖𝑖𝑚𝑚𝑚𝑚𝑚𝑚
𝑇𝑇𝑇𝑇𝑇𝑇𝑖𝑖𝑚𝑚𝑚𝑚𝑚𝑚
𝑇𝑇𝑇𝑇𝑇𝑇𝑖𝑖𝑚𝑚𝑖𝑖𝑚𝑚
𝐾𝐾𝐾𝐾𝐾𝐾𝐾𝐾𝐾𝐾𝐾𝐾𝐾𝐾𝐾𝐾𝑖𝑖 = 𝛽𝛽0 + 𝛽𝛽1𝐷𝐷𝐷𝐷𝑖𝑖,2007
𝑖𝑖 + 𝛽𝛽2𝐼𝐼𝐷𝐷𝐷𝐷𝑖𝑖,2007𝑖𝑖 +𝛽𝛽3𝑋𝑋𝑖𝑖,2007 + 𝜀𝜀𝑖𝑖
𝐷𝐷𝐷𝐷𝑖𝑖,2007
𝑖𝑖
𝐼𝐼𝐷𝐷𝐷𝐷𝑖𝑖,2007𝑖𝑖
, j=f,b,s

Asian Economic Integration Report 2017118 The Era of Financial Interconnectedness: How Can Asia Strengthen Financial Resilience? 119
Table 8.4: Impact of Direct and Indirect Exposures of the Banking Sector on Capital Outflows during the Global Financial Crisis
Variables
(1) (2) (3) (4)
Outflow Outflow Outflow Outflow
Direct exposure of banking sector 0.257***[0.075]
0.228**[0.085]
0.282***[0.078]
0.253***[0.086]
Indirect exposure of banking sector 0.722**[0.285]
0.359[0.269]
Increase in current account deficit (2004–2007) -0.006[0.004]
-0.005[0.004]
Average change in real exchange rate (% annual, 2003–2007) -0.676*[0.366]
-0.667*[0.355]
Increase in credit to GDP ratio (2004–2007) 0.005**[0.002]
0.004**[0.002]
GDP growth (% annual, 2007) -0.017*[0.009]
-0.016[0.010]
Inflation rate (2007) -0.023***[0.008]
-0.022***[0.008]
Chinn-Ito Index (2007) 0.124**[0.060]
0.126**[0.061]
S&P Sovereign Local Currency Credit Rating (2007) -0.021**[0.010]
-0.020**[0.010]
Observations 60 49 60 49
R-squared 0.111 0.459 0.212 0.483
*** = significant at 1%, ** = significant at 5%, * = significant at 10%. GDP = gross domestic product. Robust standard errors in brackets.Notes: The dependent variable is the rate of capital outflows from each emerging economy during the global financial crisis. Measures of direct and indirect exposures are calculated using cross-border claims on the banking sector based on locational banking statistics. See Shin and Park (2017) for more detailed data descriptions. Source: Park and Shin (2017).
The findings underscore the need for Asia’s emerging economies and the region generally to monitor global conditions affecting their external liability side; and ensure adequate foreign currency liquidity coverage.
These findings are highly relevant for policy makers—as they support the idea that cross-border bank lending can serve as an avenue for transmitting global liquidity problems from creditor to borrower economies. They highlight an important channel of contagion and financial vulnerability linked to financial integration and financial interconnectedness.
Even though regional banking has grown in Asia (Remolona and Shim 2015)—underscored by the increase of Asia’s cross-border bank liabilities sourced within Asia (from 18.8% in 2011 to 25.7% in 2016)—around three-quarters of Asia’s cross-border bank liabilities in 2016 came from external sources, mostly advanced economies (see Table 4.6 in Financial Integration section above).
Even economies not directly hit by a crisis can become vulnerable to its effects—threatening financial stability. Therefore, policies that aim to strengthen regional financial stability and resilience should consider this potential impact. The findings highlight the relevance of considering foreign liability exposure when designing macroprudential policies, capital flow management measures, and financial regulations—both nationally and regionally. While these policies currently focus on the fundamentals of emerging economies, they also need to consider the soundness of lender countries and the cooperation between lender and borrower countries to regulate global SIFIs. As discussed by Ghosh et al. (2014), there is scope for enhanced cooperation on capital flow management measures, not only between source and recipient economies, but also among recipient economies themselves.
Also, the results support the need for emerging economies to closely monitor global financial conditions—in line with Cerutti, Claessens, and Puy (2015). While these results depict the risks of

Asian Economic Integration Report 2017120 The Era of Financial Interconnectedness: How Can Asia Strengthen Financial Resilience? 121
macroeconomic and financial spillovers, as well as their macrofinancial feedback effects. This conceptual framework captures the interplay between macrofinancial variables and NPLs along with the potential channels of financial spillovers across borders.
NPL ratios have recently begun to rise in several developing Asian economies—an emerging concern due to macrofinancial feedback effects.
NPL ratios in Asia have been trending downward since the AFC—particularly in Southeast Asia, where NPL ratios were 3% or below in 2016 (see Table 8.1). This contrasts starkly against the skyrocketing NPL ratios immediately following the crisis in 1999, when they were well above 30% of all loans in Indonesia and Thailand, 29% in the PRC, and over 10% in India, Malaysia and the Philippines. The improved bank asset quality has been attributed to stronger growth in nominal
contagion originating from advanced economies, they can equally appear in an expanding regional banking network. As analyzed by Remolona and Shim (2015), some regional banks in Asia have become increasingly important as a future source of systemic risk. Adequately monitoring their cross-border activities and properly supervising these banks will be key to enhancing regional financial resilience.
Macrofinancial Impacts of NPLs and Financial Spillovers across Asia
The recent rise of NPLs in some Asian economies calls for close monitoring due to potential macrofinancial feedback effects and implications for the region’s financial stability.
The rise of NPLs needs to be closely monitored. Figure 8.12 describes the dynamics underpinning
Interconnected economies across borders
A shock to financial sector such as a sharp rise in nonperforming loans
Transmission channels:● Bank lending channel● Confidence channel● Financial channel● Trade channel
● Impeded monetary policy transmission channel
● Regional implications of cross-border spillovers of deteriorating asset quality
Individual Economy
Macroeconomic indicators
● Gross domestic product (GDP)● Unemployment● Exchange rates, inflation rates
Bank and financial indicators
● Equity to assets ratio● Return on equity● Loans to deposits ratio● Loans growth rates
Nonperforming loans: negative feedback effects on bank credit, unemployment, GDP
Spillo
vers
Feedback effects
Figure 8.12: Macrofinancial Impacts of Nonperforming Loans
Sources: Conceptual framework by ADB, based on Arslanalp, Liao and Seneviratne (2016); Beaton, Myrvoda, and Thompson (2016); Beck, Jakubik, Piloiu (2013); De Bock and Demyanets (2012); Espinoza and Prasad (2010); Klein (2013); Lee and Rosenkranz (2017); Makri, Tsagkanos, Bellas (2014); Martin (2017); Nkusu (2011); Park (2017); Shu, He, Dong, Wang (2016); Swiston and Bayoumi (2008).
Asian Economic Integration Report 2017120 The Era of Financial Interconnectedness: How Can Asia Strengthen Financial Resilience? 121
incomes and credit, increased financial inclusion, and better supervision of bank credit risk management and underwriting.
However, global headwinds and moderating growth in the PRC in recent years exerted downward pressure on the region’s economic conditions. Coupled with greater financial volatility following the start of US monetary policy tightening and financial spillovers from the PRC, bank balance sheets have deteriorated, causing a buildup of NPLs in the region. In particular, since 2010, NPLs—by amount and/or share of total loans—increased in Bangladesh and India (South Asia); Hong Kong, China; Mongolia, and the PRC; (East Asia); and in Cambodia, Indonesia, Singapore, and Thailand (Southeast Asia).53 This sustained increase is particularly visible in the PRC,54 India,55 and Mongolia.
A large sustained NPL buildup could damage the financial sector and likewise lead to a reduction in credit supply and slowdown in overall economic activity. Multiple studies establish a link between deteriorating macroeconomic conditions (as captured by rising unemployment, slower growth, or falling asset prices) and unfavorable financial conditions (such as debt service problems or mounting distressed assets on bank balance sheets) (see Beaton, Myrvoda, Thompson 2016; Beck, Jakubik, and Piloiu 2013; De Bock and Demyanets 2012; Espinoza and Prasad 2010; Klein 2013; Makri, Tsagkanos, Bellas 2014; Nkusu 2011).
53 Based on ADB calculations using NPL data from CEIC; International Monetary Fund. International Financial Statistics. https://imf.org/en/Data; and World Bank. World Development Indicators.http://databank.worldbank.org (all accessed October 2017). For more details, see Table 8.1. and Online Annex 2.I. https://aric.adb.org/aeir2017_onlineannex2.pdf
54 According to the China Banking Regulatory Commission, the volume of NPLs was equal to CNY433 billion in March 2011, and jumped to as much as CNY1,640 billion in June 2017. Hence, even though the reported NPL ratio still does not exceed 2% in the PRC, the size has almost quadrupled over the last 6 years.
55 The distressed assets of India’s state-owned banks are concentrated in a few dozen large corporate accounts. Concerns over the problem have grown as estimates of bad loans held by three large corporate sector lenders have increased. Bank stress is compounded by a lack of private sector investment, which fell in three quarters of 2016 (Financial Times 2017).
Increasing NPL levels reflect weak macroeconomic conditions and excess leverage; and they have harmful feedback effects on the overall economy.
Empirical evidence on the determinants of NPLs in Asia has been limited. And they have not been analyzed from a regional perspective. Nevertheless, there is consensus that two groups of factors determine how NPLs evolve over time. One is overall macroeconomic conditions, which affect borrowers’ debt servicing capacity and explain credit risk. There are also bank-specific factors, which focus on variables that can signal or induce risky lending, affecting each bank’s NPL level.
Existing studies led to several important insights. First, most studies place greater emphasis on the role of macroeconomic conditions in determining NPLs (as opposed to bank-specific factors), with the analysis performed using aggregate/country-level data. Second, there are very few Asian studies that model NPLs and their macrofinancial feedback effects. Finally, few attempts have been made to control for structural changes such as those relating to the AFC or GFC.
Therefore, a panel VAR analysis of macrofinancial implications of NPLs in emerging Asia offers new insights and significant evidence for the feedback effects of NPLs on real economy and financial variables (Box 8.4). These effects are bidirectional—as macroeconomic conditions impact financial indicators (such as NPLs) and financial conditions in turn affect macroeconomic indicators. In particular, changes in the NPL ratio Granger-cause56 changes in the policy rate, credit growth, GDP growth, and unemployment (Table 8.5). The other direction of causality also holds as macroeconomic indicators also Granger-cause change in the NPL ratio. Moreover, the panel VAR impulse response functions (Figures 8.13, 8.14) confirm that positive shocks to GDP growth and credit supply both slow NPL ratio growth, while contractionary monetary policy shocks and shocks to unemployment both increase NPL ratio growth. More importantly, rising NPL ratio growth decreases GDP growth, credit supply, and increases the unemployment rate. By magnitude, a one standard deviation shock in NPL ratio would lead to about 0.18 percentage point contraction in GDP growth rate, about 3.61 percentage
56 Variable xt granger causes variable zt, if zt can be predicted more efficiently if the information of xt is taken into account in addition to all other available information.
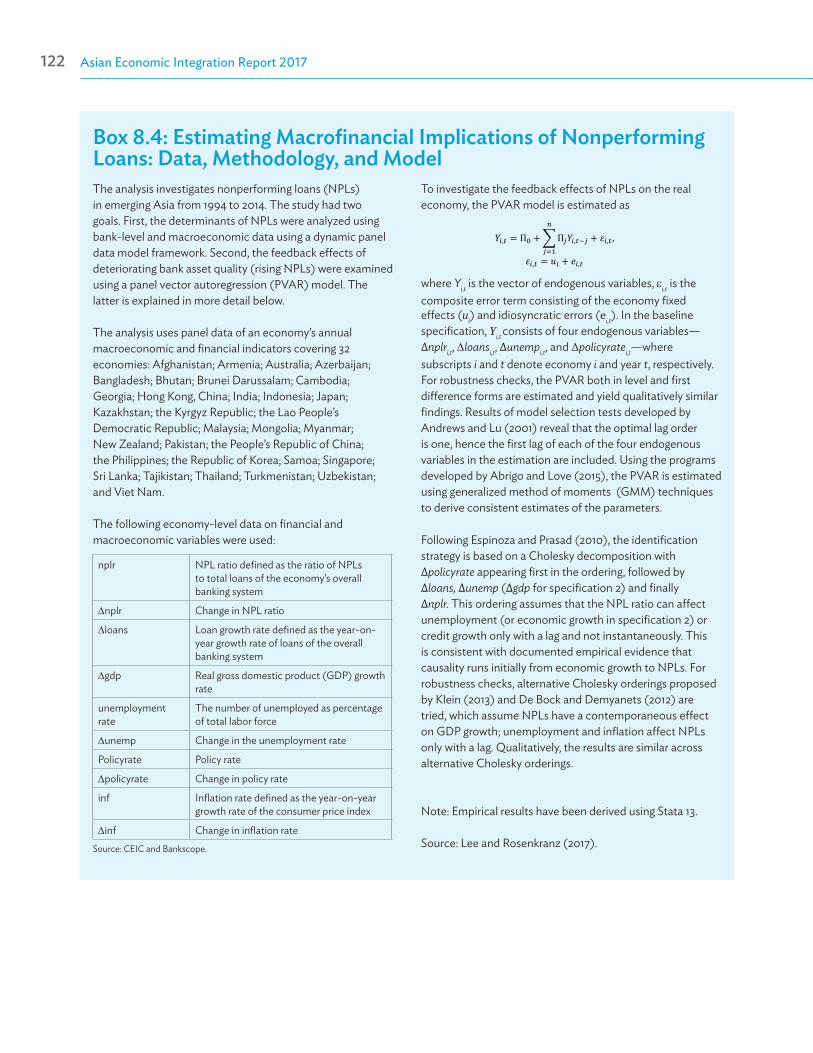
Asian Economic Integration Report 2017122 The Era of Financial Interconnectedness: How Can Asia Strengthen Financial Resilience? 123
Box 8.4: Estimating Macrofinancial Implications of Nonperforming Loans: Data, Methodology, and ModelThe analysis investigates nonperforming loans (NPLs) in emerging Asia from 1994 to 2014. The study had two goals. First, the determinants of NPLs were analyzed using bank-level and macroeconomic data using a dynamic panel data model framework. Second, the feedback effects of deteriorating bank asset quality (rising NPLs) were examined using a panel vector autoregression (PVAR) model. The latter is explained in more detail below.
The analysis uses panel data of an economy’s annual macroeconomic and financial indicators covering 32 economies: Afghanistan; Armenia; Australia; Azerbaijan; Bangladesh; Bhutan; Brunei Darussalam; Cambodia; Georgia; Hong Kong, China; India; Indonesia; Japan; Kazakhstan; the Kyrgyz Republic; the Lao People’s Democratic Republic; Malaysia; Mongolia; Myanmar; New Zealand; Pakistan; the People’s Republic of China; the Philippines; the Republic of Korea; Samoa; Singapore; Sri Lanka; Tajikistan; Thailand; Turkmenistan; Uzbekistan; and Viet Nam.
The following economy-level data on financial and macroeconomic variables were used:
To investigate the feedback effects of NPLs on the real economy, the PVAR model is estimated as
where Yi,t is the vector of endogenous variables, εi,t is the composite error term consisting of the economy fixed effects (ui) and idiosyncratic errors (ei,t). In the baseline specification, Yi,t consists of four endogenous variables—Δnplri,t, ∆loansi,t, Δunempi,t, and Δpolicyratei,t—where subscripts i and t denote economy i and year t, respectively. For robustness checks, the PVAR both in level and first difference forms are estimated and yield qualitatively similar findings. Results of model selection tests developed by Andrews and Lu (2001) reveal that the optimal lag order is one, hence the first lag of each of the four endogenous variables in the estimation are included. Using the programs developed by Abrigo and Love (2015), the PVAR is estimated using generalized method of moments (GMM) techniques to derive consistent estimates of the parameters.
Following Espinoza and Prasad (2010), the identification strategy is based on a Cholesky decomposition with Δpolicyrate appearing first in the ordering, followed by Δloans, Δunemp (Δgdp for specification 2) and finally Δnplr. This ordering assumes that the NPL ratio can affect unemployment (or economic growth in specification 2) or credit growth only with a lag and not instantaneously. This is consistent with documented empirical evidence that causality runs initially from economic growth to NPLs. For robustness checks, alternative Cholesky orderings proposed by Klein (2013) and De Bock and Demyanets (2012) are tried, which assume NPLs have a contemporaneous effect on GDP growth; unemployment and inflation affect NPLs only with a lag. Qualitatively, the results are similar across alternative Cholesky orderings.
Note: Empirical results have been derived using Stata 13.
Source: Lee and Rosenkranz (2017).
nplr NPL ratio defined as the ratio of NPLs to total loans of the economy’s overall banking system
∆nplr Change in NPL ratio
∆loans Loan growth rate defined as the year-on-year growth rate of loans of the overall banking system
∆gdp Real gross domestic product (GDP) growth rate
unemployment rate
The number of unemployed as percentage of total labor force
∆unemp Change in the unemployment rate
Policyrate Policy rate
∆policyrate Change in policy rate
inf Inflation rate defined as the year-on-year growth rate of the consumer price index
∆inf Change in inflation rateSource: CEIC and Bankscope.
𝑌𝑌𝑖𝑖,𝑡𝑡 = Π0 +∑Π𝑗𝑗𝑌𝑌𝑖𝑖,𝑡𝑡−𝑗𝑗𝑛𝑛
𝑗𝑗=1+ 𝜀𝜀𝑖𝑖,𝑡𝑡,
𝜀𝜀𝑖𝑖,𝑡𝑡 = 𝑢𝑢𝑖𝑖 + 𝑒𝑒𝑖𝑖,𝑡𝑡
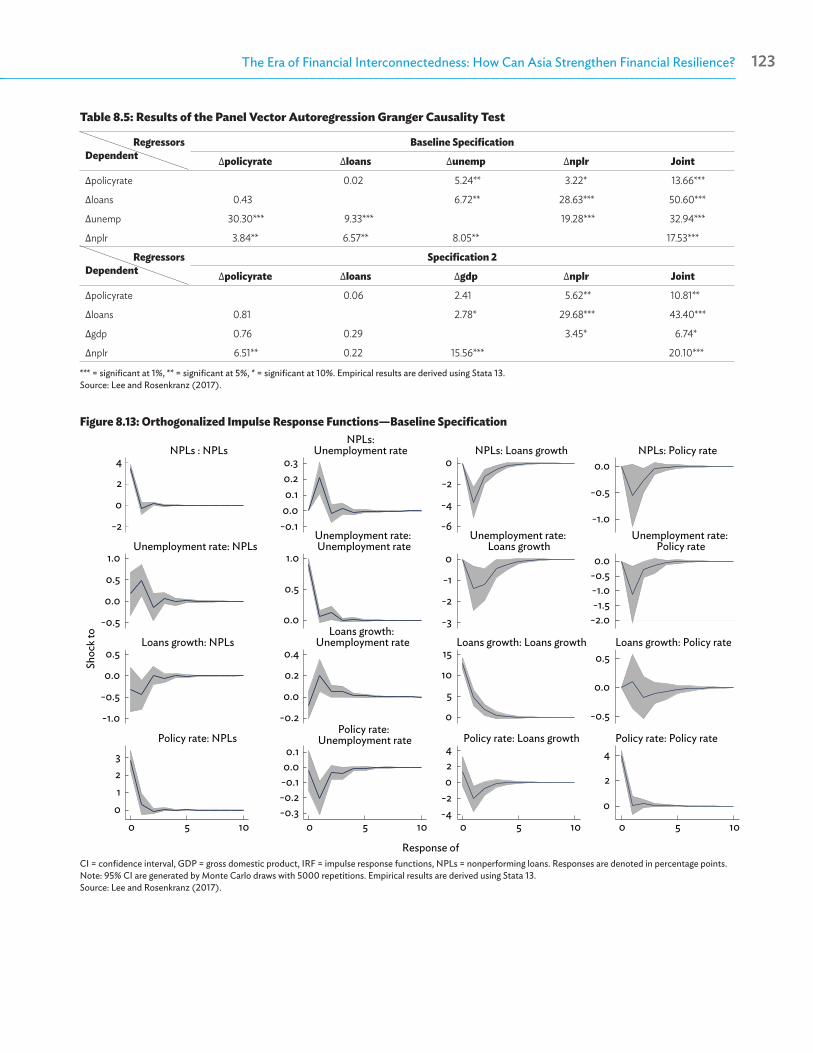
Asian Economic Integration Report 2017122 The Era of Financial Interconnectedness: How Can Asia Strengthen Financial Resilience? 123
Table 8.5: Results of the Panel Vector Autoregression Granger Causality Test
RegressorsDependent
Baseline Specification
Δpolicyrate Δloans Δunemp Δnplr Joint
Δpolicyrate 0.02 5.24** 3.22* 13.66***
Δloans 0.43 6.72** 28.63*** 50.60***
Δunemp 30.30*** 9.33*** 19.28*** 32.94***
Δnplr 3.84** 6.57** 8.05** 17.53***
RegressorsDependent
Specification 2
Δpolicyrate Δloans Δgdp Δnplr Joint
Δpolicyrate 0.06 2.41 5.62** 10.81**
Δloans 0.81 2.78* 29.68*** 43.40***
Δgdp 0.76 0.29 3.45* 6.74*
Δnplr 6.51** 0.22 15.56*** 20.10***
*** = significant at 1%, ** = significant at 5%, * = significant at 10%. Empirical results are derived using Stata 13.Source: Lee and Rosenkranz (2017).
CI = confidence interval, GDP = gross domestic product, IRF = impulse response functions, NPLs = nonperforming loans. Responses are denoted in percentage points. Note: 95% CI are generated by Monte Carlo draws with 5000 repetitions. Empirical results are derived using Stata 13.Source: Lee and Rosenkranz (2017).
Figure 8.13: Orthogonalized Impulse Response Functions—Baseline Specification
-2
0
2
4
-0.5
0.0
0.5
1.0
-1.0
-0.5
0.0
0.5
0123
-0.10.00.10.20.3
0.0
0.5
1.0
-0.2
0.0
0.2
0.4
-0.3-0.2-0.10.00.1
-6
-4
-2
0
-3
-2
-1
0
0
5
10
15
-4-2024
-1.0
-0.5
0.0
-2.0-1.5-1.0-0.50.0
-0.5
0.0
0.5
0
2
4
0 5 10 0 5 10 0 5 10 0 5 10
NPLs : NPLs
Unemployment rate: NPLs
Loans growth: NPLs
Policy rate: NPLs
NPLs:Unemployment rate
Unemployment rate: Unemployment rate
Loans growth: Unemployment rate
Policy rate: Unemployment rate
NPLs: Loans growth
Unemployment rate: Loans growth
Loans growth: Loans growth
Policy rate: Loans growth
NPLs: Policy rate
Unemployment rate: Policy rate
Loans growth: Policy rate
Policy rate: Policy rate
Response of
Shoc
k to
95% CI Orthogonalized IRF
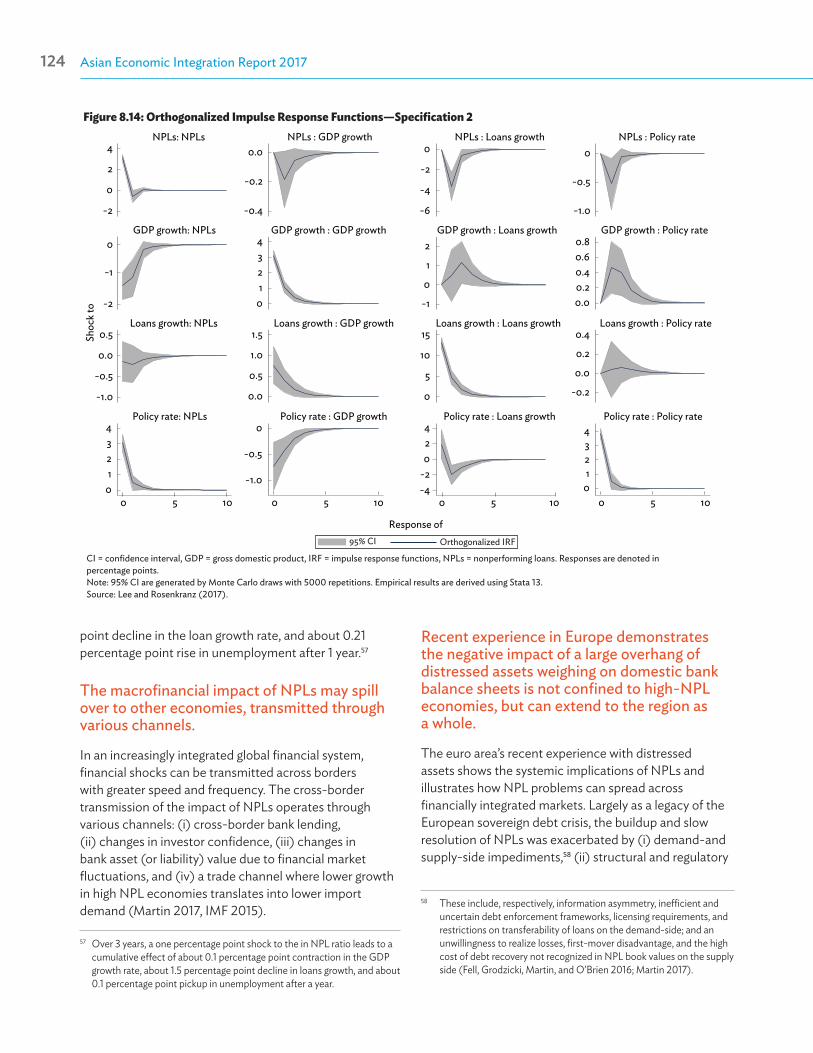
Asian Economic Integration Report 2017124 The Era of Financial Interconnectedness: How Can Asia Strengthen Financial Resilience? 125
point decline in the loan growth rate, and about 0.21 percentage point rise in unemployment after 1 year.57
The macrofinancial impact of NPLs may spill over to other economies, transmitted through various channels.
In an increasingly integrated global financial system, financial shocks can be transmitted across borders with greater speed and frequency. The cross-border transmission of the impact of NPLs operates through various channels: (i) cross-border bank lending, (ii) changes in investor confidence, (iii) changes in bank asset (or liability) value due to financial market fluctuations, and (iv) a trade channel where lower growth in high NPL economies translates into lower import demand (Martin 2017, IMF 2015).
57 Over 3 years, a one percentage point shock to the in NPL ratio leads to a cumulative effect of about 0.1 percentage point contraction in the GDP growth rate, about 1.5 percentage point decline in loans growth, and about 0.1 percentage point pickup in unemployment after a year.
Recent experience in Europe demonstrates the negative impact of a large overhang of distressed assets weighing on domestic bank balance sheets is not confined to high-NPL economies, but can extend to the region as a whole.
The euro area’s recent experience with distressed assets shows the systemic implications of NPLs and illustrates how NPL problems can spread across financially integrated markets. Largely as a legacy of the European sovereign debt crisis, the buildup and slow resolution of NPLs was exacerbated by (i) demand-and supply-side impediments,58 (ii) structural and regulatory
58 These include, respectively, information asymmetry, inefficient and uncertain debt enforcement frameworks, licensing requirements, and restrictions on transferability of loans on the demand-side; and an unwillingness to realize losses, first-mover disadvantage, and the high cost of debt recovery not recognized in NPL book values on the supply side (Fell, Grodzicki, Martin, and O’Brien 2016; Martin 2017).
CI = confidence interval, GDP = gross domestic product, IRF = impulse response functions, NPLs = nonperforming loans. Responses are denoted in percentage points. Note: 95% CI are generated by Monte Carlo draws with 5000 repetitions. Empirical results are derived using Stata 13.Source: Lee and Rosenkranz (2017).
Figure 8.14: Orthogonalized Impulse Response Functions—Specification 2
-2
0
2
4
-2
0
-1
-1.0
-0.5
0.0
0.5
01234
-0.4
-0.2
0.0
01234
0.0
0.5
1.0
1.5
-1.0
-0.5
0
-6
-4
-2
0
-1
0
1
2
0
5
10
15
-4-2024
-1.0
-0.5
0
0.00.20.40.60.8
-0.2
0.0
0.2
0.4
01234
0 5 10 0 5 10 0 5 10 0 5 10
NPLs: NPLs
GDP growth: NPLs
Loans growth: NPLs
Policy rate: NPLs
NPLs : GDP growth
GDP growth : GDP growth
Loans growth : GDP growth
Policy rate : GDP growth
NPLs : Loans growth
GDP growth : Loans growth
Loans growth : Loans growth
Policy rate : Loans growth
NPLs : Policy rate
GDP growth : Policy rate
Loans growth : Policy rate
Policy rate : Policy rate
Response of
Shoc
k to
95% CI Orthogonalized IRF
Asian Economic Integration Report 2017124 The Era of Financial Interconnectedness: How Can Asia Strengthen Financial Resilience? 125
impediments (such as a lack of transnational supervisory structures in fiscal monitoring, bank supervision and resolution), and (iii) less-developed distressed asset markets in Europe compared with the US (to effectively and preemptively address the problem), among others. As the euro area experience shows, the negative impact of a high stock of distressed assets weighing on bank balance sheets is not confined to high-NPL economies, but can extend to the region as whole (see Martin 2017; Buckley, Avgouleas, and Arner 2017).
Through the various channels mentioned, increasing NPL levels could (i) negatively impact the flow of cross-border lending, (ii) damage market sentiment of the region as a whole, (iii) have negative wealth effects, and (iv) lead to a deterioration in affected countries’ macroeconomic conditions, lowering import demand for others’ exports (Martin 2017). The systemic implication of NPLs is a potential cause for concern.59 One recent example in response includes policy discussions on a European blueprint for national asset management companies (AMCs).60 In Asia—with ADB’s support—the International Public Asset Management Company Forum (IPAF)61 was established in 2013. IPAF members share knowledge and experience on how to best deal with distressed assets from both national and regional perspectives—with an emphasis on facilitating NPL markets as part of Asia’s broader financial safety nets.
Broadly, the cross-border and systemic implication of NPLs underscores the need for policy makers to swiftly and effectively manage and respond to a buildup of distressed assets. The national and regional mechanisms underlying distressed asset resolution—in particular NPLs—are important for safeguarding financial stability. While it is critical to establish and strengthen national resolution mechanisms, regional cooperation can help advance more effective strategies for identifying and implementing national NPL resolution mechanisms and developing distressed asset markets.
59 See presentation of Martin on 30 May 2017, http://k-learn.adb.org/system/files/materials/2017/05/201705-resolution-nonperforming-loans.pdf
60 See the 3 February 2017 speech by ECB Vice President Vítor Constâncio, https://www.ecb.europa.eu/press/key/date/2017/html/sp170203.en.html. See also ESRB (2017) and Fell, Grodzicki, Martin and O’Brien (2017).
61 See IPAF website: https://ipaf.adb.org/
Conclusions and Policy ConsiderationsTwenty years after the AFC, Asia stands strong—with more flexible exchange rates, healthier external and fiscal positions, stronger regulations, deeper capital markets, and better regional financial cooperation mechanisms.
However, despite these visible improvements, the region was severely (if briefly) affected by the GFC 10 years later. This highlights the need for the region to identify and address the gaps between existing policies stemming from lessons learned from the AFC and emerging challenges since the AFC.
This thematic chapter has sought to identify and analyze both existing and newly emerging challenges that pose potential risks to financial stability in developing Asia, and to discuss lessons drawn from past crises. These lessons are distilled and briefly summarized below, complemented by possible policy considerations.
Past financial crises highlighted financial sector weaknesses and served as the impetus for crisis-affected economies to undertake needed reforms.
The AFC showed how a financial crisis can undercut economic development and how currency and maturity mismatches can lead to the buildup of troubled assets and disrupt financial systems. In response to the crisis, badly affected economies such as Indonesia, the Philippines, the Republic of Korea, and Thailand, undertook a wide array of reforms (Table 8.6). These included: (i) strengthening financial supervision and macroprudential regulations to address NPLs and restore banking sector confidence, (ii) adopting measures to stem short-term capital outflows and raising interest rates to reduce investor flight, (iii) establishing more flexible exchange rate regimes, and (iv) instituting a broader set of reforms to restructure the banking sector and develop and deepen capital markets.
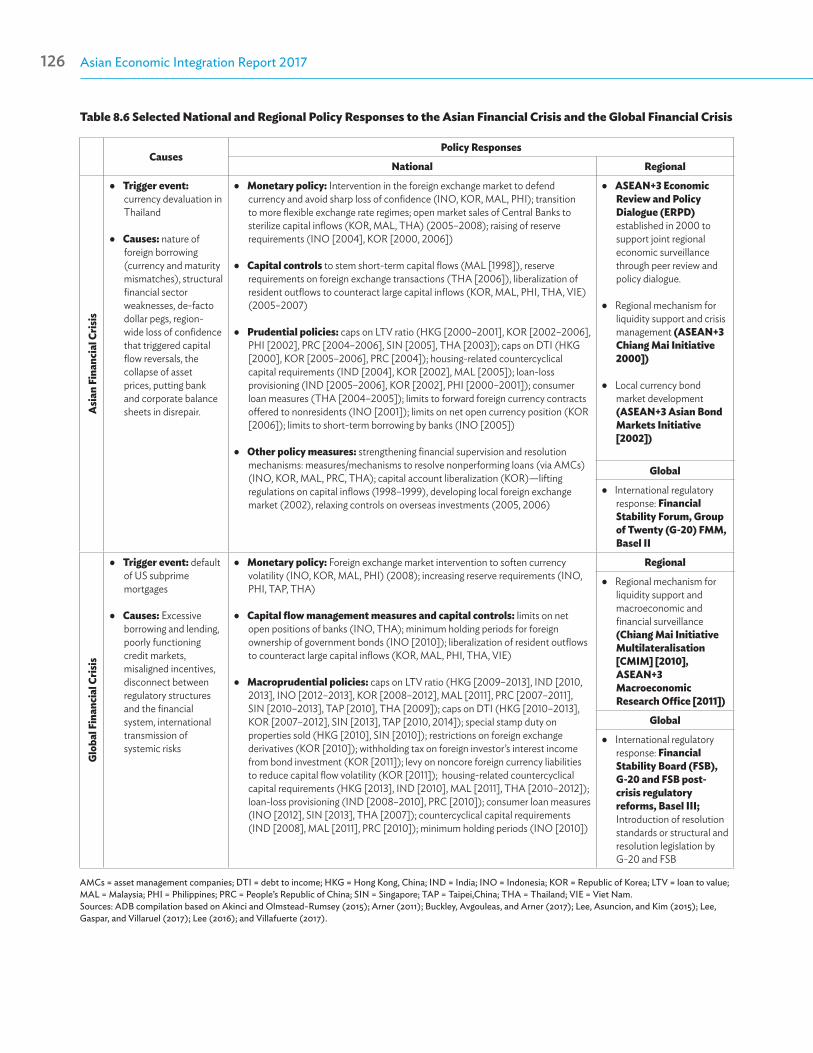
Asian Economic Integration Report 2017126 The Era of Financial Interconnectedness: How Can Asia Strengthen Financial Resilience? 127
Table 8.6 Selected National and Regional Policy Responses to the Asian Financial Crisis and the Global Financial Crisis
CausesPolicy Responses
National Regional
Asi
an F
inan
cial
Cris
is
● Trigger event: currency devaluation in Thailand
● Causes: nature of foreign borrowing (currency and maturity mismatches), structural financial sector weaknesses, de-facto dollar pegs, region-wide loss of confidence that triggered capital flow reversals, the collapse of asset prices, putting bank and corporate balance sheets in disrepair.
● Monetary policy: Intervention in the foreign exchange market to defend currency and avoid sharp loss of confidence (INO, KOR, MAL, PHI); transition to more flexible exchange rate regimes; open market sales of Central Banks to sterilize capital inflows (KOR, MAL, THA) (2005–2008); raising of reserve requirements (INO [2004], KOR [2000, 2006])
● Capital controls to stem short-term capital flows (MAL [1998]), reserve requirements on foreign exchange transactions (THA [2006]), liberalization of resident outflows to counteract large capital inflows (KOR, MAL, PHI, THA, VIE) (2005–2007)
● Prudential policies: caps on LTV ratio (HKG [2000–2001], KOR [2002–2006], PHI [2002], PRC [2004–2006], SIN [2005], THA [2003]); caps on DTI (HKG [2000], KOR [2005–2006], PRC [2004]); housing-related countercyclical capital requirements (IND [2004], KOR [2002], MAL [2005]); loan-loss provisioning (IND [2005–2006], KOR [2002], PHI [2000–2001]); consumer loan measures (THA [2004–2005]); limits to forward foreign currency contracts offered to nonresidents (INO [2001]); limits on net open currency position (KOR [2006]); limits to short-term borrowing by banks (INO [2005])
● Other policy measures: strengthening financial supervision and resolution mechanisms: measures/mechanisms to resolve nonperforming loans (via AMCs) (INO, KOR, MAL, PRC, THA); capital account liberalization (KOR)—lifting regulations on capital inflows (1998–1999), developing local foreign exchange market (2002), relaxing controls on overseas investments (2005, 2006)
● ASEAN+3 Economic Review and Policy Dialogue (ERPD) established in 2000 to support joint regional economic surveillance through peer review and policy dialogue.
● Regional mechanism for liquidity support and crisis management (ASEAN+3 Chiang Mai Initiative 2000])
● Local currency bond market development (ASEAN+3 Asian Bond Markets Initiative [2002])
Global
● International regulatory response: Financial Stability Forum, Group of Twenty (G-20) FMM, Basel II
Glo
bal F
inan
cial
Cris
is
● Trigger event: default of US subprime mortgages
● Causes: Excessive borrowing and lending, poorly functioning credit markets, misaligned incentives, disconnect between regulatory structures and the financial system, international transmission of systemic risks
● Monetary policy: Foreign exchange market intervention to soften currency volatility (INO, KOR, MAL, PHI) (2008); increasing reserve requirements (INO, PHI, TAP, THA)
● Capital flow management measures and capital controls: limits on net open positions of banks (INO, THA); minimum holding periods for foreign ownership of government bonds (INO [2010]); liberalization of resident outflows to counteract large capital inflows (KOR, MAL, PHI, THA, VIE)
● Macroprudential policies: caps on LTV ratio (HKG [2009–2013], IND [2010, 2013], INO [2012–2013], KOR [2008–2012], MAL [2011], PRC [2007–2011], SIN [2010–2013], TAP [2010], THA [2009]); caps on DTI (HKG [2010–2013], KOR [2007–2012], SIN [2013], TAP [2010, 2014]); special stamp duty on properties sold (HKG [2010], SIN [2010]); restrictions on foreign exchange derivatives (KOR [2010]); withholding tax on foreign investor’s interest income from bond investment (KOR [2011]); levy on noncore foreign currency liabilities to reduce capital flow volatility (KOR [2011]); housing-related countercyclical capital requirements (HKG [2013], IND [2010], MAL [2011], THA [2010–2012]); loan-loss provisioning (IND [2008–2010], PRC [2010]); consumer loan measures (INO [2012], SIN [2013], THA [2007]); countercyclical capital requirements (IND [2008], MAL [2011], PRC [2010]); minimum holding periods (INO [2010])
Regional
● Regional mechanism for liquidity support and macroeconomic and financial surveillance (Chiang Mai Initiative Multilateralisation [CMIM] [2010], ASEAN+3 Macroeconomic Research Office [2011])
Global
● International regulatory response: Financial Stability Board (FSB), G-20 and FSB post-crisis regulatory reforms, Basel III; Introduction of resolution standards or structural and resolution legislation by G-20 and FSB
AMCs = asset management companies; DTI = debt to income; HKG = Hong Kong, China; IND = India; INO = Indonesia; KOR = Republic of Korea; LTV = loan to value; MAL = Malaysia; PHI = Philippines; PRC = People’s Republic of China; SIN = Singapore; TAP = Taipei,China; THA = Thailand; VIE = Viet Nam.Sources: ADB compilation based on Akinci and Olmstead-Rumsey (2015); Arner (2011); Buckley, Avgouleas, and Arner (2017); Lee, Asuncion, and Kim (2015); Lee, Gaspar, and Villaruel (2017); Lee (2016); and Villafuerte (2017).
Asian Economic Integration Report 2017126 The Era of Financial Interconnectedness: How Can Asia Strengthen Financial Resilience? 127
The region’s crisis experiences underscored the need for regional cooperation in risk identification, mitigation, and response.
Asian policy makers should remain vigilant and work collectively to enhance financial resilience and safeguard financial stability. The three financial disruptions led to tightened supervisory structures and augmented regulatory standards—such as higher levels of capital and liquidity reserves. Other financial reforms included an overhaul of banking governance and better risk management measures.
Regional responses to the AFC consisted of both bilateral and multilateral assistance to crisis-affected economies and the furthering of regional cooperation initiatives. Immediately following the crisis, leaders from ASEAN+3 held regional dialogues on the measures required to bolster stability of the region’s financial systems. Several major regional initiatives were established to strengthen regional financial safety nets, enhance financial resilience, and develop capital markets in the region—including the ASEAN+3 Economic Review and Policy Dialogue, the ASEAN+3 CMI and its later Multilateralisation (CMIM), its associated ASEAN+3 Macroeconomic Research Office (AMRO), and the ASEAN+3 Asian Bond Markets Initiative (ABMI) (see Figure 8.15 for a chronological overview of Asia’s financial integration initiatives).
While crisis responses noticeably improved macroeconomic and financial management in the region, emerging Asia continues to face significant long-term challenges that could undermine regional financial stability.
The analyses in the preceding sections provided an overview for various pockets of financial fragility facing the region. Against the backdrop of increasing financial interconnectedness and procyclicality of financial cycles, recent trends of: (i) rising private sector debt and deteriorating asset quality, (ii) continued heavy reliance on foreign currency (particularly US dollar-) denominated debt, and (iii) limited domestic capital market-based financial solutions are among those vulnerabilities that could potentially destabilize Asia’s financial systems and hinder long-term economic development.
The empirical exercises conducted underscore the challenges to Asia’s financial stability. There are several important findings: (i) over the past 20 years, Asian financial markets have grown more interconnected both
within the region and across the globe; (ii) growing financial interconnectedness can increase vulnerabilities to external shocks, financial contagion, or liquidity risks stemming from cross-border bank lending; (iii) continued high reliance on US dollar-denominated funding has significant implications for the transmission of global financial conditions to domestic financial and macroeconomic conditions; and (iv) a sustained increase in NPLs can lead to a reduction in credit supply and slowdown in overall economic activity.
Lessons drawn from the crises and the results of empirical analyses highlight the importance of enhancing financial market resilience to safeguard Asia’s financial stability. This can only work through the interplay between adequate national policies/frameworks and efforts to continue and facilitate regional cooperation. In an increasingly interconnected global financial network, financial resilience cannot be achieved in isolation; it requires cross-border cooperation.
Maintaining sound macroeconomic fundamentals is a strong prerequisite for financial stability and resilience.
Sound macroeconomic conditions—healthy external and fiscal positions, exchange rate flexibility, a well-regulated and strong financial system, and adequate foreign exchange reserves—are central to financial resilience and economic growth. These also serve as a buffer against future crises and help soften the impact of external shocks. Targeted microprudential and macroprudential policies to curb financial excess are also needed to maintain financial stability and fiscal sustainability. Given the rapidly globalizing financial landscape, important considerations for prudential supervision include: (i) strengthening bank capacity to manage foreign currency liquidity risk—for example, through monitoring and implementing a foreign currency liquidity coverage ratio; (ii) consolidating supervision; (iii) ensuring adequate communication between central banks and other financial supervisors; and (iv) regulating SIFIs.

Asian Economic Integration Report 2017128 The Era of Financial Interconnectedness: How Can Asia Strengthen Financial Resilience? 129
AMRO = ASEAN+3 Macroeconomic Research Oce, ASEAN = Association of Southeast Asian Nations.Source: Authors’ compilation.
Economic Review andPolicy Dialogue
Chiang Mai Inititative(CMI)
Asian Bond MarketInitiative (ABMI)
Asian Bond Fund 1
AsianBondsOnlinewebsite launched
ASEAN CapitalMarkets Forum
New ABMIRoadmap signed
Asian BondMarket Forum
CMI replaced by CMIMultilateralisation
AMROestablished
ASEAN Exchangeswebsite launched
ASEAN FinancialIntegration Framework
ASEAN Trading Link
Cross-border SettlementInfrastructure Forum
ASEAN Framework for Cross-BorderO ering of Collective Investment Schemes
AMRO becomes aninternational organization
ASEAN SurveillanceProcess
ABMI: Credit GuaranteeInvestment Facility
ASEAN FinanceMinisters' Process
ASEAN+ Multi-CurrencyBond Issuance Framework
Implementation of ASEANBanking Integration Framework
ASEAN+3 Research Working Group
Asian Bond Fund 2
AMRO = ASEAN+3 Macroeconomic Research Office, ASEAN = Association of Southeast Asian Nations. Source: Park et al. (2017)
Figure 8.15: Asia’s Financial Integration Initiatives—Chronology
Asian policy makers need to further strengthen their national regulatory and supervisory frameworks, along with their institutional capacities.
Regulatory policy gaps and weaknesses in financial markets and systems leave room for excessive leverage and risk-taking—often through off-balance sheet activities—leading to the buildup of systemic risk. Thus, strengthening and broadening the scope of regulation and oversight is essential. While the AFC triggered the emergence of micro-prudential regulation—ensuring the safety and soundness of each significant financial institution in the system—the GFC highlighted the importance of a comprehensive macroprudential policy framework. The GFC exposed the possible
buildup of systemic risk stemming from SIFIs in tightly interconnected financial systems.
A key crisis lesson is the urgent need to strengthen macroprudential regulation and supervision in the region.
Authorities should consider establishing and implementing an effective macroprudential policy framework to address two dimensions of system-wide risks: (i) a buildup of a systemic risk over time (the “time dimension”) and (ii) a spillover and contagion of risk across different financial sectors and systems (the “cross-sectional dimension”). Macroprudential policies can be useful in dampening the procyclicality of the financial system. Countercylical provisions, capital and
Asian Economic Integration Report 2017128 The Era of Financial Interconnectedness: How Can Asia Strengthen Financial Resilience? 129
liquidity buffers, and balance sheet instruments such as leverage ratios, limits on debt-to-income and loan-to-value ratios are good examples.
Past crises have furthermore underscored the need for a foreign currency funding condition to macroprudential policies. As the AFC demonstrated, currency mismatches are a major source of risk. Given Asia’s heavy reliance on US dollar-denominated debt, the region could augment existing macroprudential policy tools with, for example, a foreign currency liquidity coverage ratio. This policy tool could help the banking sector strengthen resilience against external shocks, especially during times of financial distress.
More developed and regionally integrated banking sectors and financial markets can improve the efficiency of resource allocation to the real economy.
Asia’s funding limitations—due to insufficient capital market-based financing solutions and reliance on US dollar funding—suggests that its vast amounts of regional savings could be better channeled into more productive investments. For example, there is about $4.4 trillion invested in Asia’s pension funds, $5.1 trillion with insurers, and several large social security and public pension reserve funds. Yet, potential investors must often restrain investments due to concerns over political risk, weak regulatory systems, the legal environment, governance standards, and undeveloped capital markets. More developed and regionally integrated banking and financial markets can improve the efficiency of resource allocation to the real economy.
While local currency bonds outstanding in ASEAN+3 increased threefold—from $6.6 trillion in 2002 to $19.8 trillion by the end of 2016—challenges remain. To meet the region’s financing needs, local currency bond markets must improve market efficiency, broaden their investor base, deepen secondary markets, and integrate more regionally. Developing local currency bond markets will also help diversify funding sources, reduce concentrated funding risks, and provide long-term finance opportunities for investors—vital for financing long-term infrastructure projects. Regional efforts like the ABMI continue to help promote the development of regional capital markets, which can help avoid maturity and currency mismatches.
Strengthening policy dialogue and cooperation both globally and regionally is essential for enhancing Asia’s financial resilience.
Asia’s financial markets are increasingly open, interconnected, and vulnerable to external shocks. Approaching the challenges from a regional perspective helps build financial resilience. For example, a regional cooperation mechanism on macroprudential policy frameworks could be valuable for safeguarding financial stability in the region. Existing high-level policy forums—such as ASEAN, ASEAN+3, or the Asia-Pacific Economic Cooperation forums—are useful venues for regional dialogue. Strengthening the CMIM and its AMRO surveillance unit should also be considered to help monitor potential liquidity risks and slow the spread of shocks across the region’s economies.
Several options can be considered to strengthen the CMIM and AMRO to bolster financial safety nets: (i) the CMIM’s operability needs to be enhanced and clearly communicated to members; (ii) current callable capital can be complemented by paid-in capital to improve market sentiment over members’ CMIM commitments; (iii) paid-in capital could be further leveraged by issuing bonds, thereby increasing CMIM capacity and enabling it to respond to financial crises affecting the region’s larger economies; (iv) increased capacity could also offer scope for widening the CMIM’s mandate—in particular, CMIM resources could be utilized to recapitalize systemically important banks in the region; and (v) strengthening AMRO’s role as regional macroeconomic surveillance unit and enhancing CMIM efficacy by increasing the IMF de-linked portion can be considered.
Regional cooperation to develop effective resolution mechanisms for distressed assets of cross-border financial institutions is an important part of broader financial safety net arrangements.
With greater financial integration, banks increasingly operate internationally. Growing regional banking activities and institutions—possibly of systemic importance—underpin the need to discuss regional regulatory cooperation, including resolution mechanisms for interconnected regional banks—such as Qualified Asian Banks. In this highly interconnected environment, the failure of a single regional bank could have a
Asian Economic Integration Report 2017130 The Era of Financial Interconnectedness: How Can Asia Strengthen Financial Resilience? 131
considerable negative impact on economies in emerging Asia. Measures that identify and effectively deal with vulnerabilities in SIFIs would thus be key to reducing systemic risk and their associated moral hazards. Regional cooperation to develop effective resolution mechanisms for distressed assets of cross-border financial institutions can also complement national efforts to address NPLs efficiently and sustainably. In addition, developing both distressed asset markets and market infrastructure nationally can deepen financial markets and enhance market resilience, thereby contributing to strengthening multilayered financial safety nets.
Supervisory colleges for regionally active foreign banks can be an effective regional cooperation tool to strengthen cross-border supervision in Asia.
As highlighted above, the systemic importance of foreign banks in Asia is growing. Stable funding through foreign bank credit supply channels to a host economy remains a key issue for financial stability. Supervisory colleges for regionally active foreign banks can be an effective regional cooperation tool to strengthen cross-border supervision in Asia. They can enhance understanding and oversight of the sources and transmission channels of systemic risks and shocks.
Continued improvement of Asia’s financial market infrastructure by establishing cross-border collateral arrangements could strengthen the region’s multilayer financial safety nets and bolster financial market development.
Appropriate risk mitigation measures and multilayer regional financial safety nets are needed to adequately respond to heightened cross-border banking activity. In particular, cross-border collateral arrangements are needed to supply regional banks with liquidity from their home central banks by pledging assets held by branches in another economy. These measures have been discussed by the Cross-Border Settlement Infrastructure Forum under ASEAN+3. Proposals have been raised concerning the establishment of linkages among central securities depositories (CSD) and central banks (CSD-
RTGS62 Linkages) in the region. CSD-RTGS Linkages are expected to support the routinization of cross-border collateral arrangements and the efficient use of the region’s high-quality government bonds as collateral. This will help reduce local currency liquidity risks among cross-border banks in the region and develop local currency bond markets, thereby promoting the region’s financial development and resilience (see Box 4.1, page 47).
Background PapersR.P. Buckley, E. Avgouleas, and D.W. Arner. 2017. Twenty Years
of International Financial Crises: What Have We Learned and What Still Needs to Be Done? Background paper for Asian Economic Integration Report 2017 Theme Chapter on “The Era of Financial Interconnectedness: How Can Asia Strengthen Financial Resilience?” Manuscript.
S. Claessens. 2017. Financial Cycles and Crises in Asia. Background paper for Asian Economic Integration Report 2017 Theme Chapter on “The Era of Financial Interconnectedness: How Can Asia Strengthen Financial Resilience?” Manuscript.
M. Dungey, B. Chowdhury, M. Kangogo, M.A. Sayeed, and V. Volkov. 2017a. The Changing Network of Financial Market Linkages: The Asian Experience. Background paper for Asian Economic Integration Report 2017 Theme Chapter on “The Era of Financial Interconnectedness: How Can Asia Strengthen Financial Resilience?” Manuscript.
J. Lee and P. Rosenkranz. 2017. Nonperforming Loans in Asia: Determinants and Macro Financial Linkages. Background paper for Asian Economic Integration Report 2017 Theme Chapter on “The Era of Financial Interconnectedness: How Can Asia Strengthen Financial Resilience?” Manuscript.
C.Y. Park and K. Shin. 2017. A Contagion through Exposure to Foreign Banks during the Global Financial Crisis. ADB Economics Working Paper.No. 516. Manila: Asian Development Bank.
62 A “CSD-RTGS Linkage” connects national CSDs and real time gross settlement (RTGS) systems operated by central banks.
Asian Economic Integration Report 2017130 The Era of Financial Interconnectedness: How Can Asia Strengthen Financial Resilience? 131
J. Villafuerte. 2017. Managing Capital Flows to Emerging Asia. Background paper for Asian Economic Integration Report 2017 Theme Chapter on “The Era of Financial Interconnectedness: How Can Asia Strengthen Financial Resilience?” Manuscript.
References M.R.M. Abrigo and I. Love. 2015. Estimation of Panel Vector
Autoregression in Stata: A Package of Programs.http:// paneldataconference2015.ceu.hu/Program/MichaelAbrigo.pdf
ADB. 2014. Asian Economic Integration Monitor April2014. Manila.
_____. Climate Change Resilience in Asia’s Cities (infographic). https://www.adb.org/news/infographics/climate-change-resilience-asias-cities
O. Akinci and J. Olmstead-Rumsey. 2015. How Effective are Macroprudential Policies? An Empirical Investigation. International Finance Discussion Papers. No. 1136. Washington, DC: Board of Governors of the Federal Reserve System.
N. Ananchotikul, S. Piao, and E. Zoli. 2015. Drivers of Financial Integration—Implications for Asia. IMF Working Papers. No. 15/160. Washington, DC: International Monetary Fund.
T. Anderson and C. Hsiao. 1982. Formulation and Estimation of Dynamic Models Using Panel Data. Journal of Econometrics. 18 (1). pp. 47–82.
D.W.K. Andrews and B. Lu. 2001. Consistent Model and Moment Selection Procedures for GMM Estimation with Application to Dynamic Panel Data Models. Journal of Econometrics. 101 (1). pp. 123-164.
D.W. Arner. 2009. The Global Credit Crisis of 2008: Causes, Consequences, and Implications for International Finance. The International Lawyer. 43 (91).pp. 91-136.
_____. 2011. Adaptation and Resilience in Global Financial Regulation. North Carolina Law Review. 109 (89).pp. 1579-1627.
D.W. Arner, E. Avgouleas, and E.C. Gibson. 2017. Overstating Moral Hazard: Lessons from Two Decades of Financial Crises. University of Hong Kong Faculty of Law Research Paper. No. 2017/003. Hong Kong, China: University of Hong Kong.
S. Arslanalp, W. Liao, S. Piao, and D. Seneviratne. 2016. [People’s Republic of] China’s Growing Influence on Asian Financial Markets. IMF Working Paper. No. 15/173. Washington, DC: International Monetary Fund.
E. Avgouleas. 2012. Governance of Global Financial Markets: The Law, the Economics, the Politics. UK: Cambridge University Press.
Bank for International Settlements. 2016. BIS Statistical Bulletin. Basel.
K. Beaton, A. Myrvoda, S. Thompson. 2016. Nonperforming Loans in the ECCU: Determinants and Macroeconomic Impact. IMF Working Paper. No. 15/229. Washington, DC: International Monetary Fund.
R. Beck, P. Jakubik, and A. Piloiu. 2013. Nonperforming Loans: What Matters in Addition to the Economic Cycle? European Central Bank Working Paper. No. 1515. Frankfurt: European Central Bank.
S. Bhattarai, A. Chatterjee, and W.Y. Park. 2015. Effects of US Quantitative Easing on Emerging Market Economies. Federal Reserve Bank of Dallas Globalization and Monetary Policy Institute Working Paper. No. 255. Dallas: Federal Reserve Bank of Dallas.
M. Billio, M. Getmansky, A.W. Lo, and L. Pelizzon. 2012. Econometric Measures of Connectedness and Systemic Risk in the Finance and Insurance Sectors. Journal of Financial Economics. 104 (3). pp. 535-559.
O. Blanchard, R. Rajan, K. Rogoff, and L. H. Summers, eds. 2016. Progress and Confusion: The State of Macroeconomic Policy. Cambridge, MA: MIT Press.
C. Borio and P. Lowe. 2002. Assessing the Risk of Banking Crises. BIS Quarterly Review. December. pp. 43-54. Basel.
E. Cerutti, S. Claessens, and D. Puy. 2015. Push Factors and Capital Flows to Emerging Markets: Why Knowing Your Lender Matters More Than Fundamentals. IMF Working Paper. No. 15/127. Washington, DC: International Monetary Fund.
R. Chang and A. Velasco. 2001. A Model of Financial Crises in Emerging Markets. The Quarterly Journal of Economics. 116 (2). pp. 489-517.

Asian Economic Integration Report 2017132 The Era of Financial Interconnectedness: How Can Asia Strengthen Financial Resilience? 133
Q. Chen, A. Filardo, D. He and F. Zhu. 2011. International Spillovers of Central Bank Balance Sheet Policies. Contributed paper for the Joint Bank of Thailand and the Bank for International Settlements Conference on “Central bank balance sheets in Asia and the Pacific: the policy challenges ahead”. Chiang Mai. 12-13 December.
M. Čihák, S. Muñoz, and R. Scuzzarella. 2011. The Bright and the Dark Side of Cross-Border Banking Linkages. IMF Working Paper. No. 11/186. Washington, DC: International Monetary Fund.
S. Claessens, M.A. Kose, and M. Terrones. 2011. How Do Business and Financial Cycles Interact? Journal of International Economics. 87 (1). pp.178–90.
J.C. Cuaresma and T. Slacík. 2007. On the Determinants of Currency Crises: The Role of Model Uncertainty. Working Papers in Economics and Statistics. No. 2008-03. Innsbruck: University of Innsbruck.
R.D. De Bock and A. Demyanets. 2012. Bank Asset Quality in Emerging Markets: Determinants and Spillovers. IMF Working Paper. No. 12/71.Washington, DC: International Monetary Fund.
P. De Grauwe. 2011. The Governance of a Fragile Eurozone. CEPS Working Document. No. 346. Brussels: Centre for European Policy Studies.
D.W. Diamond and P.H. Dybvig. 1983. Bank Runs, Deposit Insurance, and Liquidity. Journal of Political Economy. 91 (3). pp. 401-419.
F.X. Diebold and K. Yilmaz. 2009. Measuring Financial Asset Return and Volatility Spillovers, with Application to Global Equity Markets. The Economic Journal. 119 (534). pp. 158-171.
_____. 2014. On the Network Topology of Variance Decompositions: Measuring the Connectedness of Financial Firms. Journal of Econometrics. 182 (1).
pp. 119-134.
M.H. Dungey, R. Fry, and V.L. Martin. 2006. Correlation Contagion, and Asian evidence. Asian Economic Papers.
5 (2). pp. 32-72.
M.H. Dungey, G. Milunovich, S. Thorp, and M. Yang. 2015. Endogenous Crisis Dating and Contagion Using Smooth Transition Structural GARCH. Journal of Banking and Finance. 58. pp. 71-79.
M.H. Dungey, D.J. Harvey, and V. Volkov. 2017b. The Changing International Network of Sovereign Debt and Financial Institutions. Discussion Paper Series. No. 2017-04. Hobart, TAS: University of Tasmania.
B. Eichengreen and P. Gupta. 2015. Tapering Talk: The Impact of Expectations of Reduced Federal Reserve Security Purchases on Emerging Markets. Emerging Markets Review. 25 (C). pp. 1–15.
R. Espinoza and A. Prasad. 2010. Nonperforming Loans in the GCC Banking System and their Macroeconomic Effects. IMF Working Paper. No. 10/224. Washington, DC: International Monetary Fund.
G.B. Estrada, M. Noland, D. Park, and A. Ramayandi. 2015. Financing Asia’s Growth. ADB Economics Working Paper.No. 438. Manila: Asian Development Bank.
European Systemic Risk Board. 2017. Resolving Nonperforming Loans in Europe. ESRB Reports. No. 2017. Frankfurt: European Systemic Risk Board.
J. Fell, M. Grodzicki, R. Martin, E. O’Brien. 2016. Addressing Market Failures in the Resolution of Nonperforming Loans in the euro area. Financial Stability Review November 2016. Frankfurt: European Central Bank.
J. Fell, M. Grodzicki, R. Martin, and E. O’Brien. 2017. A Role for Systemic Asset Management Companies in Solving Europe’s Nonperforming Loan Problems. European Economy: Banks, Regulation, and the Real Sector. pp. 71-85.
Financial Stability Board. 2015. Global Shadow Banking Monitoring Report 2015. Basel.
Financial Stability Board. 2017. Global Shadow Banking Monitoring Report 2016. Basel.
J. M. Fleming. 1962. Domestic Financial Policies under Fixed and under Floating Exchange Rates. IMF Staff Papers.
9 (3). pp. 369-380.
Financial Times. 2017. New Delhi Under Pressure for Bolder Action on Bad Loan Malaise. 15 May.
R.P. Flood and P.M. Garber. 1984. Collapsing Exchange-rate Regimes: Some Linear Examples. Journal of International Economics. 17 (1-2). pp. 1-13.
A.R. Ghosh, M.S. Qureshi, N. Sugawara. 2014. Regulating Capital Flows at Both Ends: Does It Work? IMF Working Paper. No. 14/188.Washington, DC: International Monetary Fund.
Asian Economic Integration Report 2017132 The Era of Financial Interconnectedness: How Can Asia Strengthen Financial Resilience? 133
M. Goswami and S. Sharma. 2011. The Development of Local Debt Markets in Asia. IMF Working Paper. No. 11/132. Washington, DC: International Monetary Fund.
J.H. Hahm, H.S. Shin, and K. Shin. 2013. Noncore Bank Liabilities and Financial Vulnerability. Journal of Money, Credit, and Banking. 45 (1). pp. 3–36.
B. Hoffmann, I. Shim, and H.S. Shin. 2017. Sovereign Yields and the Risk-taking Channel of Currency Appreciation. BIS Working Papers. No. 538. Basel: Bank for International Settlements.
International Monetary Fund. 2015. Regional Economic Outlook: Asia and the Pacific – Stabilizing and Outperforming Other Regions. Washington, DC.
G.L. Kaminsky and C.M. Reinhart. 1999. The Twin Crises: The Causes of Banking and Balance-of-Payments Problems. American Economic Review. 89 (3). pp. 473-500.
J.I. Kim. 2014. The International Transmission of Monetary Policy: [Republic of] Korea’s Experience. Contributed paper for the Bank for International Settlements Meeting of Senior Officials from Central Banks on the Transmission of Unconventional Monetary Policy to the Emerging Markets. Basel. 6-7 March.
N. Klein. 2013. Nonperforming Loans in CESEE: Determinants and Impact on MacroeconomicPerformance. IMF Working Paper. No. 13/72. Washington, DC: International Monetary Fund.
P. Krugman. 1979. A Model of Balance-of-Payments Crises. Journal of Money, Credit and Banking. 11(3).
pp. 311-325.
_____. 1999. Balance Sheets, the Transfer Problem, and Financial Crises. International Tax and Public Finance .
6 (4). pp 459–472.
M. Lee, R.C. Asuncion, J. Kim. 2015. Effectiveness of Macroprudential Policies in Developing Asia: An Empirical Analysis. ADB Economics Working Paper. No. 439. Manila: Asian Development Bank.
J.J. Lim, S. Mohapatra, and M. Stocker. 2014. Tinker, Taper, QE, Bye? The Effect of Quantitative Easing on Financial Flows to Developing Countries. Policy Research Working Paper. No. 6820. Washington, DC: World Bank.
V. Makri, A. Tsagkanos, and A. Bellas. 2014. Determinants of Nonperforming Loans: The Case of Eurozone. Paneconomicus. 2. pp. 193-206.
R. Martin. 2017. The Resolution of Nonperforming Loans. Presentation at the International Public Asset Management Company Forum Research Dissemination Workshop. Manila. 30 May.
A. Mian, A. Sufi, E. Verner. 2017. Household Debt and Business Cycles Worldwide. The Quarterly Journal of Economics. 132 (4). pp. 1755–1817.
S. Morris and H.S. Shin. 1998. Unique Equilibrium in a Model of Self-Fulfilling Currency Attacks. American Economic Review. 88 (3). pp. 587-597.
R.A. Mundell. 1963. Capital Mobility and Stabilization Policy under Fixed and Flexible Exchange Rates. The Canadian Journal of Economics and Political Science. 29 (4). pp. 475-485.
M. Nkusu. 2011. Nonperforming Loans and Macrofinancial Vulnerabilities in Advanced Economies. IMF Working Paper. No. 11/161. Washington, DC: International Monetary Fund.
M. Obstfeld. 1994. The Logic of Currency Crises. NBER Working Paper. No. 4640. Cambridge, MA: National Bureau of Economic Research.
_____. 1996. Models of Currency Crises with Self-Fulfilling Features. European Economic Review. 40. pp.1037-1047.
C.Y. Park. 2017. Decoupling Asia Revisited. ADB Economics Working Paper. No. 506. Manila: Asian Development Bank.
C.Y. Park, J. Lee, J. Villafuerte, and P. Rosenkranz. 2017. 20 Years after the Asian Financial Crisis: Lessons Learned and Future Challenges. ADB Briefs. No. 85. Manila: Asian Development Bank.
D. Park, A. Ramayandi, and K. Shin. 2016. Capital Flows During Quantitative Easing and Aftermath: Experiences of Asian Countries. Emerging Markets Finance and Trade. 52 (4). pp. 886–903.
M. Pesaran and C. Yang. 2016. Econometric Analysis of Production Networks with Dominant Units. CESifo Working Paper. No. 6141. Munich:CESifo Group Munich.
J. Lee. 2016. Recent Developments in Capital Flows and Policy Challenges. Presentation at the ADB-BSP Inception Workshop. Manila. 12 April.

Asian Economic Integration Report 2017134 The Era of Financial Interconnectedness: How Can Asia Strengthen Financial Resilience? 135
C.M. Reinhart. Dates for Banking Crises, Currency Crashes, Sovereign Domestic or External Default (or Restructuring), Inflation Crises, and Stock Market Crashes (Varieties). http://www.carmenreinhart.com/data/browse-by-topic/ topics/7/ (accessed July 2016).
C.M. Reinhart and V. R. Reinhart. 2009. Capital Flow Bonanzas: An Encompassing View of the Past and Present. NBER Working Paper Series. No. 14321. Cambridge, MA: National Bureau of Economic Research.
E. Remolona and I. Shim. 2015. The Rise of Regional Banking in Asia and the Pacific. BIS Quarterly Review. September 2015. pp. 119-134.
V. Constâncio. 2017. Resolving Europe’s NPL Burden: Challenges and Benefits. Speech at Bruegel’s event on “Tackling Europe’s Nonperforming Loans Crisis: Restructuring Debt, Reviving Growth”. Brussels. 3 February.
H. Rey. 2013. Dilemma not Trilemma: The Global Financial Cycle and Monetary Policy Independence. In Proceedings of the 2013 Federal Reserve Bank of Kansas City Economic Symposium at Jackson Hole. pp. 285-333.
P.L. Shimpalee and J.B. Breuer. 2006. Currency Crises and Institutions. Journal of International Money and Finance. 25 (1). pp. 125-145.
H.S. Shin. 2009. Reflections on Northern Rock: The Bank Run that Heralded the Global Financial Crisis. Journal of Economic Perspectives. 23 (1). pp. 101–119.
C. Shu, D. He, J. Dong, and H. Wang. 2016. Regional Pull vs. Global Push Factors: China and US Influence on AsiaPacific Financial Markets. BIS Working Papers. No. 579. Basel: Bank for International Settlements.
K. Slowikowski. 2016. ggrepel: Repulsive Text and Label Geoms for ‘ggplot2’. R package version 0.6.5. https://CRAN.R-project.org/package=ggrepel.
S. Sugisaki. 1998. Economic Crises in Asia. Address at the 1998 Harvard Asia Business Conference, Harvard Business School. Cambridge, MA. 30 January.
A. Swiston and T. Bayoumi. 2008. Spillovers across NAFTA. IMF Working Paper. No. 08/3. Washington, DC: International Monetary Fund.
A.M. Taylor. 2015. Credit, Financial Stability, and the Macroeconomy. Annual Review of Economics. 7 (1). pp. 309- 339.
H. Wickham. 2009. ggplot2: Elegant Graphics for Data Analysis. New York: Springer-Verlag.
World Bank. 1998. Global Development Finance 1998: Analysis and Summary Tables. Washington, DC.
AnnexAnnex 8.1: Chronology of Financial Crises, Theories, and Policy Advice
Financial crises can be classified into three main types. The first, sovereign debt crises, are rooted in the inability to repay sovereign (or government) debt owed to foreign creditors. Examples include the Latin American debt crisis of the early 1980s or the more recent debt crises in Europe, particularly Greece, which started toward the end of 2009, intensifying in 2010. The second, balance of payments (or currency) crises, occur due to an unsustainable balance of payments deficit with a drop in foreign exchange reserves—often followed by devaluation in a fixed exchange rate regime. Examples include India’s 1991 currency crisis, Mexico’s Tequila crisis in 1994, and the 1997/98 Asian financial crisis (AFC). The last type, banking crises, emerge more frequently and are due to bank runs and panics that affect banking activity. The most prominent examples include the United States savings and loan crisis in the 1980s and 1990s, the AFC and 1998 banking crisis in the Russian Federation.
Theories of currency crises fall under four generations, and highlight respectively weak macrofundamentals, self-fulfilling expectations, structural imbalances, and institutional factors. First generation models of currency crises are motivated by a series of events where fixed exchange rate regimes collapsed following speculative attacks—as occurred during the breakdown of the Bretton Wood global system in the early 1970s or the Latin American debt crisis in the 1980s. These crises were often preceded by excessive credit expansions, ongoing fiscal deficits, rising debt levels, or falling reserves as governments tried to maintain a fixed exchange rate regime. Seminal authors include Krugman

Asian Economic Integration Report 2017134 The Era of Financial Interconnectedness: How Can Asia Strengthen Financial Resilience? 135
(1979) and Flood and Garber (1984), who introduced a “shadow floating exchange rate” to extend the basic model by Krugman.
Second generation models were pioneered by Obstfeld (1994, 1996) following the collapse of the European Exchange Rate Mechanism in the early 1990s. These crises followed from speculative attacks and self-fulfilling expectations in multiple equilibria—as speculators forced the government to abandon an existing fixed-exchange rate regime by attacking its foreign currency reserves—maintaining the fixed exchange rate becomes too costly. Extensions of this model were undertaken by Morris and Shin (1998) and De Grauwe (2011).
While the first and second generation currency crisis literature focused on the government alone, third generation models connect currency crises to models of banking crises and credit friction. The AFC largely motivated this generation of models, spurring extensive research on how the rapid deterioration of balance sheets from asset price fluctuations (or banking crises) can precipitate currency crises—hence “twin crises” (Kaminsky and Reinhart 1999). A clear feature of these crises is the combination of a collapse of fixed exchange rate regimes, capital flow reversals, bankruptcies of financial institutions, and credit crunches. Relevant references include Krugman (1999), who models balance sheet effects of devaluation due to a currency mismatch; and Chang and Velasco (2001), who consider
double mismatches of currency and liquidity exposures as per the Diamond and Dybvig (1983) bank run model.
In the fourth generation of models, currency crises are said to be defined by institutional factors (Cuaresma and Slacík 2007, Shimpalee and Breuer 2006). The models identify features of the institutional environment that set the stage for the buildup of macroeconomic imbalances, which subsequently give rise to crises. They also highlight the roles of rule of law and contract enforcement, protection of shareholder and creditor rights, regulatory frameworks, and the socioeconomic environment.
Policy responses are largely a function of crisis type. Measures to respond to sovereign debt crises include debt restructuring and relief initiatives involving refinancing and rescheduling, debt reduction, and debt conversion. Balance of payments or currency crisis responses include the adoption of flexible exchange rates, creation of foreign reserve buffers, and currency swap arrangements. Policy pronouncements following banking crises have included capital adequacy ratios (Basel I, 1988), prudential regulation and supervision (Basel II, 2004), and systemic risk and macroprudential policies (Basel III, 2010).
A summary of financial crises including a timeline along with the corresponding financial theories and policy advice is illustrated in Figure 8A.1.
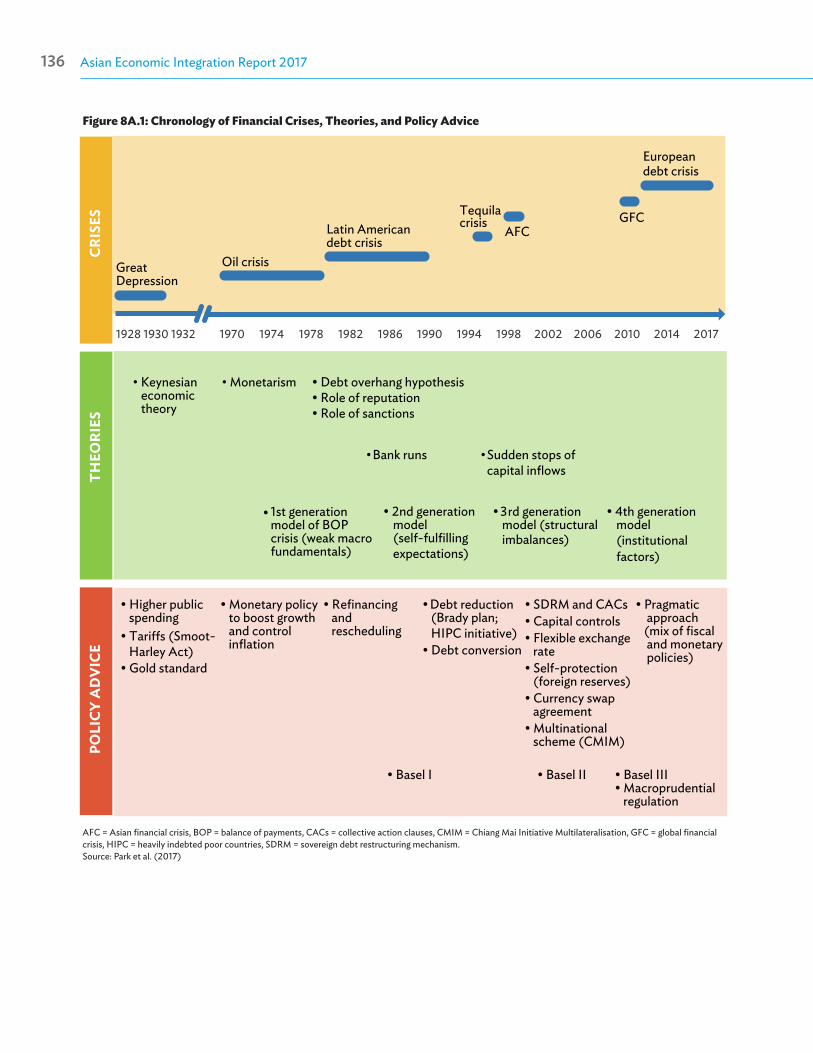
Asian Economic Integration Report 2017136 The Era of Financial Interconnectedness: How Can Asia Strengthen Financial Resilience? PB
• Keynesian economic theory
• Monetarism
• Higher public spending
• Gold standard
• Tari�s (Smoot- Harley Act)
• Monetary policy to boost growth and control inflation
• Debt overhang hypothesis• Role of reputation• Role of sanctions
• st generation model of BOP crisis (weak macro fundamentals)
• nd generation model (self-fulfillingexpectations)
• rd generation model (structural imbalances)
• th generation model (institutional factors)
0
2
4
6
8
10
Great Depression
Oil crisis
Tequila crisis
AFCGFC
Europeandebt crisis
Latin American debt crisis
CRIS
ES
POLI
CY A
DV
ICE
• Bank runs • Sudden stops ofcapital inflows
• Refinancingand
• Debt reduction (Brady plan; HIPC initiative)• Debt conversion
• SDRM and CACs• Capital controls• Flexible exchange rate• Self-protection (foreign reserves)• Currency swap agreement• Multinational scheme (CMIM)
• Basel I
• Pragmatic approach (mix of fiscal and monetary policies)
• Basel II • Basel III• Macroprudential regulation
THEO
RIES
rescheduling
Figure 8A.1: Chronology of Financial Crises, Theories, and Policy Advice
AFC = Asian financial crisis, BOP = balance of payments, CACs = collective action clauses, CMIM = Chiang Mai Initiative Multilateralisation, GFC = global financial crisis, HIPC = heavily indebted poor countries, SDRM = sovereign debt restructuring mechanism.Source: Park et al. (2017)
Statistical Appendix
09

Asian Economic Integration Report 2017138 Statistical Appendix 139
Statistical Appendix
The statistical appendix is comprised of 11 tables that present selected indicators on economic integration covering the 48 regional members of
the Asian Development Bank (ADB). The succeeding notes describe the country groupings and the calculation procedures undertaken.
Regional Groupings● Asia consists of the 48 regional members of ADB.● Developing Asia refers to Asia excluding Australia,
Japan, and New Zealand.● European Union (EU-28) consists of Austria,
Belgium, Bulgaria, Croatia, Cyprus, Czech Republic, Denmark, Estonia, Finland, France, Germany, Greece, Hungary, Ireland, Italy, Latvia, Lithuania, Luxembourg, Malta, the Netherlands, Poland, Portugal, Romania, Slovak Republic, Slovenia, Spain, Sweden, and the United Kingdom.
Table DescriptionsTable A1: Regional Integration Indicators—Asia (% of total)
The table provides a summary of regional integration indicators for three areas: trade and investment, capital (equity and bond holdings), and people movement (migration, remittances and tourism); and for Asian subregions, including ASEAN+3 (including Hong Kong, China). Cross-border flows within and across subregions are shown as well as total flows with Asia and the rest of the world. The definition of each indicators are provided in the description below.
Table A2: Trade Share—Asia (% of total trade)
It is calculated as (tij /Tiw)*100, where tij is the total trade of economy “i” with economy “j” and Tiw is the total trade
of economy “i” with the world. A higher share indicates a higher degree of regional trade integration.
Table A3: FTA Status—Asia
It is the number and status of bilateral and plurilateral free trade agreements (FTA) with at least one of the Asian economies as signatory. FTAs only proposed are excluded. It covers FTAs with the following status: Framework Agreement signed—the parties initially negotiate the contents of a framework agreement, which serves as a framework for future negotiations; Negotiations launched—the parties, through the relevant ministries, declare the official launch of negotiations or set the date for such, or start the first round of negotiations; Signed but not yet in effect—parties sign the agreement after negotiations have been completed, however, the agreement has yet to be implemented; and Signed and in effect—provisions of FTA come into force, after legislative or executive ratification.
Table A4: Time to Export and Import—Asia (number of hours)
Time to export (import) data measures the number of hours required to export (import) by ocean transport, including the processing of documents required to complete the transaction. It covers time used for documentation requirements and procedures at customs and other regulatory agencies as well as the time of inland transport between the largest business city and the main port used by traders. Regional aggregates are weighted averages based on total exports or imports.
Table A5: Logistics Performance Index—Asia (% to EU)
Logistics Performance Index scores are based on the following dimensions: (i) efficiency of border control and customs process; (ii) transport and trade-related infrastructure; (iii) competitively priced shipments;
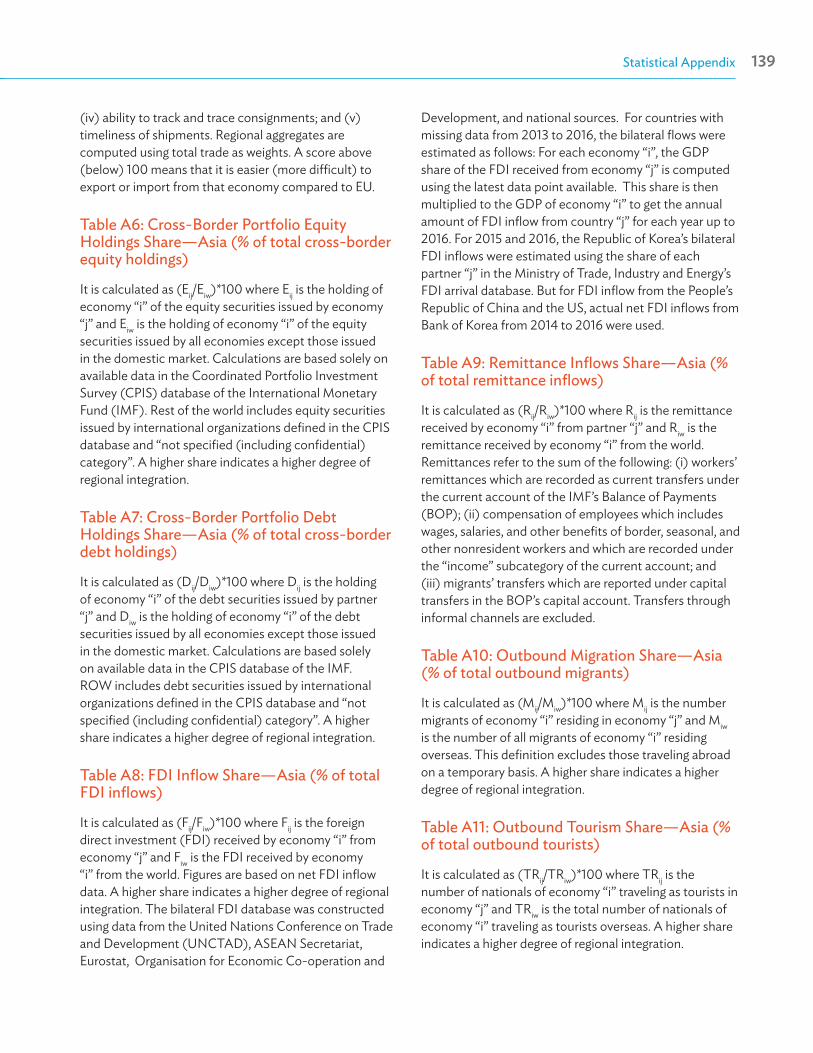
Asian Economic Integration Report 2017138 Statistical Appendix 139
(iv) ability to track and trace consignments; and (v) timeliness of shipments. Regional aggregates are computed using total trade as weights. A score above (below) 100 means that it is easier (more difficult) to export or import from that economy compared to EU.
Table A6: Cross-Border Portfolio Equity Holdings Share—Asia (% of total cross-border equity holdings)
It is calculated as (Eij/Eiw)*100 where Eij is the holding of economy “i” of the equity securities issued by economy “j” and Eiw is the holding of economy “i” of the equity securities issued by all economies except those issued in the domestic market. Calculations are based solely on available data in the Coordinated Portfolio Investment Survey (CPIS) database of the International Monetary Fund (IMF). Rest of the world includes equity securities issued by international organizations defined in the CPIS database and “not specified (including confidential) category”. A higher share indicates a higher degree of regional integration.
Table A7: Cross-Border Portfolio Debt Holdings Share—Asia (% of total cross-border debt holdings)
It is calculated as (Dij/Diw)*100 where Dij is the holding of economy “i” of the debt securities issued by partner “j” and Diw is the holding of economy “i” of the debt securities issued by all economies except those issued in the domestic market. Calculations are based solely on available data in the CPIS database of the IMF. ROW includes debt securities issued by international organizations defined in the CPIS database and “not specified (including confidential) category”. A higher share indicates a higher degree of regional integration.
Table A8: FDI Inflow Share—Asia (% of total FDI inflows)
It is calculated as (Fij/Fiw)*100 where Fij is the foreign direct investment (FDI) received by economy “i” from economy “j” and Fiw is the FDI received by economy “i” from the world. Figures are based on net FDI inflow data. A higher share indicates a higher degree of regional integration. The bilateral FDI database was constructed using data from the United Nations Conference on Trade and Development (UNCTAD), ASEAN Secretariat, Eurostat, Organisation for Economic Co-operation and
Development, and national sources. For countries with missing data from 2013 to 2016, the bilateral flows were estimated as follows: For each economy “i”, the GDP share of the FDI received from economy “j” is computed using the latest data point available. This share is then multiplied to the GDP of economy “i” to get the annual amount of FDI inflow from country “j” for each year up to 2016. For 2015 and 2016, the Republic of Korea’s bilateral FDI inflows were estimated using the share of each partner “j” in the Ministry of Trade, Industry and Energy’s FDI arrival database. But for FDI inflow from the People’s Republic of China and the US, actual net FDI inflows from Bank of Korea from 2014 to 2016 were used.
Table A9: Remittance Inflows Share—Asia (% of total remittance inflows)
It is calculated as (Rij/Riw)*100 where Rij is the remittance received by economy “i” from partner “j” and Riw is the remittance received by economy “i” from the world. Remittances refer to the sum of the following: (i) workers’ remittances which are recorded as current transfers under the current account of the IMF’s Balance of Payments (BOP); (ii) compensation of employees which includes wages, salaries, and other benefits of border, seasonal, and other nonresident workers and which are recorded under the “income” subcategory of the current account; and (iii) migrants’ transfers which are reported under capital transfers in the BOP’s capital account. Transfers through informal channels are excluded.
Table A10: Outbound Migration Share—Asia (% of total outbound migrants)
It is calculated as (Mij/Miw)*100 where Mij is the number migrants of economy “i” residing in economy “j” and Miw is the number of all migrants of economy “i” residing overseas. This definition excludes those traveling abroad on a temporary basis. A higher share indicates a higher degree of regional integration.
Table A11: Outbound Tourism Share—Asia (% of total outbound tourists)
It is calculated as (TRij/TRiw)*100 where TRij is the number of nationals of economy “i” traveling as tourists in economy “j” and TRiw is the total number of nationals of economy “i” traveling as tourists overseas. A higher share indicates a higher degree of regional integration.
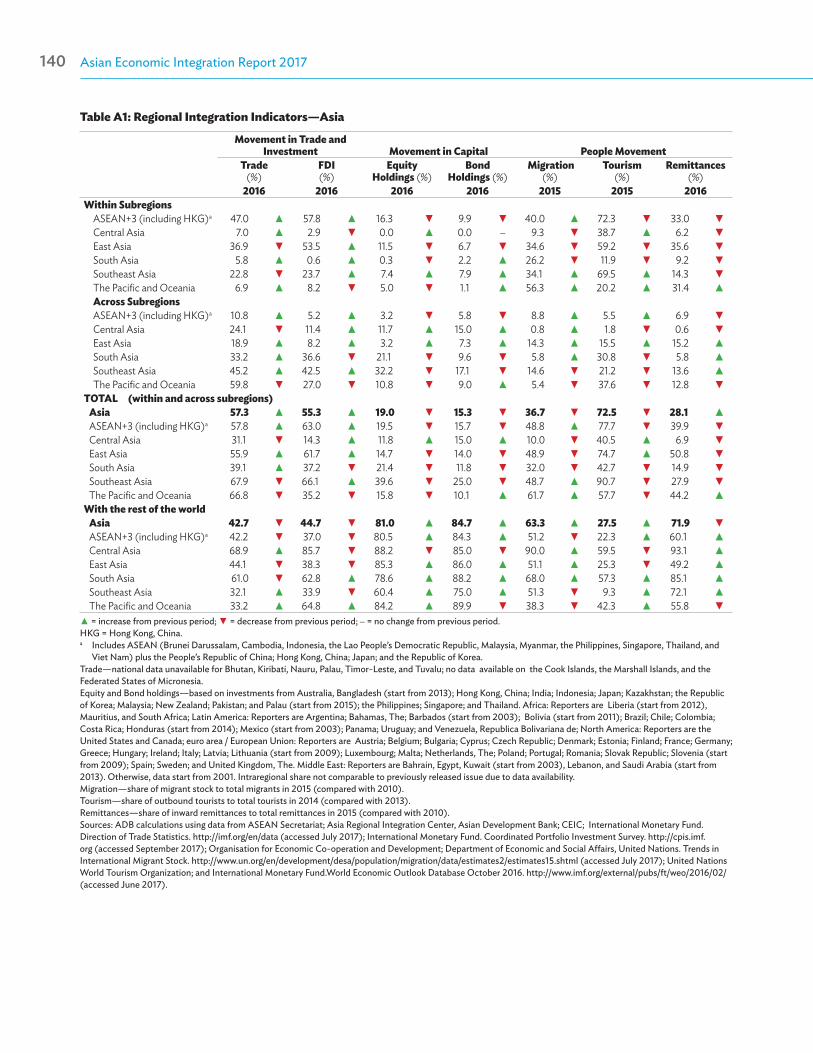
Asian Economic Integration Report 2017140 Statistical Appendix 141
Table A1: Regional Integration Indicators—Asia Movement in Trade and
Investment Movement in Capital People MovementTrade
(%)FDI (%)
Equity Holdings (%)
Bond Holdings (%)
Migration (%)
Tourism (%)
Remittances (%)
2016 2016 2016 2016 2015 2015 2016Within Subregions
ASEAN+3 (including HKG)a 47.0 ▲ 57.8 ▲ 16.3 ▼ 9.9 ▼ 40.0 ▲ 72.3 ▼ 33.0 ▼Central Asia 7.0 ▲ 2.9 ▼ 0.0 ▲ 0.0 – 9.3 ▼ 38.7 ▲ 6.2 ▼East Asia 36.9 ▼ 53.5 ▲ 11.5 ▼ 6.7 ▼ 34.6 ▼ 59.2 ▼ 35.6 ▼South Asia 5.8 ▲ 0.6 ▲ 0.3 ▼ 2.2 ▲ 26.2 ▼ 11.9 ▼ 9.2 ▼Southeast Asia 22.8 ▼ 23.7 ▲ 7.4 ▲ 7.9 ▲ 34.1 ▲ 69.5 ▲ 14.3 ▼The Pacific and Oceania 6.9 ▲ 8.2 ▼ 5.0 ▼ 1.1 ▲ 56.3 ▲ 20.2 ▲ 31.4 ▲Across SubregionsASEAN+3 (including HKG)a 10.8 ▲ 5.2 ▲ 3.2 ▼ 5.8 ▼ 8.8 ▲ 5.5 ▲ 6.9 ▼Central Asia 24.1 ▼ 11.4 ▲ 11.7 ▲ 15.0 ▲ 0.8 ▲ 1.8 ▼ 0.6 ▼East Asia 18.9 ▲ 8.2 ▲ 3.2 ▲ 7.3 ▲ 14.3 ▲ 15.5 ▲ 15.2 ▲South Asia 33.2 ▲ 36.6 ▼ 21.1 ▼ 9.6 ▼ 5.8 ▲ 30.8 ▼ 5.8 ▲Southeast Asia 45.2 ▲ 42.5 ▲ 32.2 ▼ 17.1 ▼ 14.6 ▼ 21.2 ▼ 13.6 ▲
The Pacific and Oceania 59.8 ▼ 27.0 ▼ 10.8 ▼ 9.0 ▲ 5.4 ▼ 37.6 ▼ 12.8 ▼TOTAL (within and across subregions)
Asia 57.3 ▲ 55.3 ▲ 19.0 ▼ 15.3 ▼ 36.7 ▼ 72.5 ▼ 28.1 ▲ASEAN+3 (including HKG)a 57.8 ▲ 63.0 ▲ 19.5 ▼ 15.7 ▼ 48.8 ▲ 77.7 ▼ 39.9 ▼Central Asia 31.1 ▼ 14.3 ▲ 11.8 ▲ 15.0 ▲ 10.0 ▼ 40.5 ▲ 6.9 ▼East Asia 55.9 ▲ 61.7 ▲ 14.7 ▼ 14.0 ▼ 48.9 ▼ 74.7 ▲ 50.8 ▼South Asia 39.1 ▲ 37.2 ▼ 21.4 ▼ 11.8 ▼ 32.0 ▼ 42.7 ▼ 14.9 ▼Southeast Asia 67.9 ▼ 66.1 ▲ 39.6 ▼ 25.0 ▼ 48.7 ▲ 90.7 ▼ 27.9 ▼The Pacific and Oceania 66.8 ▼ 35.2 ▼ 15.8 ▼ 10.1 ▲ 61.7 ▲ 57.7 ▼ 44.2 ▲
With the rest of the worldAsia 42.7 ▼ 44.7 ▼ 81.0 ▲ 84.7 ▲ 63.3 ▲ 27.5 ▲ 71.9 ▼ASEAN+3 (including HKG)a 42.2 ▼ 37.0 ▼ 80.5 ▲ 84.3 ▲ 51.2 ▼ 22.3 ▲ 60.1 ▲Central Asia 68.9 ▲ 85.7 ▼ 88.2 ▼ 85.0 ▼ 90.0 ▲ 59.5 ▼ 93.1 ▲East Asia 44.1 ▼ 38.3 ▼ 85.3 ▲ 86.0 ▲ 51.1 ▲ 25.3 ▼ 49.2 ▲South Asia 61.0 ▼ 62.8 ▲ 78.6 ▲ 88.2 ▲ 68.0 ▲ 57.3 ▲ 85.1 ▲Southeast Asia 32.1 ▲ 33.9 ▼ 60.4 ▲ 75.0 ▲ 51.3 ▼ 9.3 ▲ 72.1 ▲The Pacific and Oceania 33.2 ▲ 64.8 ▲ 84.2 ▲ 89.9 ▼ 38.3 ▼ 42.3 ▲ 55.8 ▼
▲ = increase from previous period; ▼ = decrease from previous period; – = no change from previous period.HKG = Hong Kong, China.a Includes ASEAN (Brunei Darussalam, Cambodia, Indonesia, the Lao People’s Democratic Republic, Malaysia, Myanmar, the Philippines, Singapore, Thailand, and
Viet Nam) plus the People’s Republic of China; Hong Kong, China; Japan; and the Republic of Korea. Trade—national data unavailable for Bhutan, Kiribati, Nauru, Palau, Timor-Leste, and Tuvalu; no data available on the Cook Islands, the Marshall Islands, and the Federated States of Micronesia.Equity and Bond holdings—based on investments from Australia, Bangladesh (start from 2013); Hong Kong, China; India; Indonesia; Japan; Kazakhstan; the Republic of Korea; Malaysia; New Zealand; Pakistan; and Palau (start from 2015); the Philippines; Singapore; and Thailand. Africa: Reporters are Liberia (start from 2012), Mauritius, and South Africa; Latin America: Reporters are Argentina; Bahamas, The; Barbados (start from 2003); Bolivia (start from 2011); Brazil; Chile; Colombia; Costa Rica; Honduras (start from 2014); Mexico (start from 2003); Panama; Uruguay; and Venezuela, Republica Bolivariana de; North America: Reporters are the United States and Canada; euro area / European Union: Reporters are Austria; Belgium; Bulgaria; Cyprus; Czech Republic; Denmark; Estonia; Finland; France; Germany; Greece; Hungary; Ireland; Italy; Latvia; Lithuania (start from 2009); Luxembourg; Malta; Netherlands, The; Poland; Portugal; Romania; Slovak Republic; Slovenia (start from 2009); Spain; Sweden; and United Kingdom, The. Middle East: Reporters are Bahrain, Egypt, Kuwait (start from 2003), Lebanon, and Saudi Arabia (start from 2013). Otherwise, data start from 2001. Intraregional share not comparable to previously released issue due to data availability.Migration—share of migrant stock to total migrants in 2015 (compared with 2010). Tourism—share of outbound tourists to total tourists in 2014 (compared with 2013). Remittances—share of inward remittances to total remittances in 2015 (compared with 2010). Sources: ADB calculations using data from ASEAN Secretariat; Asia Regional Integration Center, Asian Development Bank; CEIC; International Monetary Fund. Direction of Trade Statistics. http://imf.org/en/data (accessed July 2017); International Monetary Fund. Coordinated Portfolio Investment Survey. http://cpis.imf.org (accessed September 2017); Organisation for Economic Co-operation and Development; Department of Economic and Social Affairs, United Nations. Trends in International Migrant Stock. http://www.un.org/en/development/desa/population/migration/data/estimates2/estimates15.shtml (accessed July 2017); United Nations World Tourism Organization; and International Monetary Fund.World Economic Outlook Database October 2016. http://www.imf.org/external/pubs/ft/weo/2016/02/ (accessed June 2017).
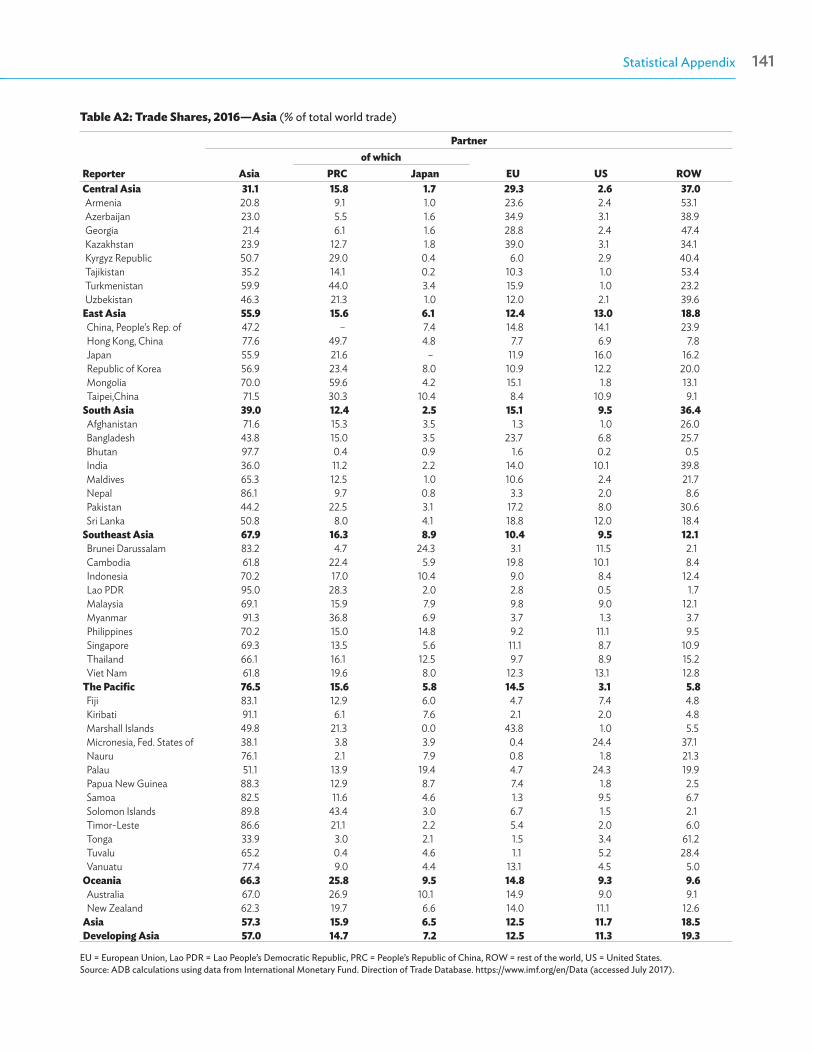
Asian Economic Integration Report 2017140 Statistical Appendix 141
Table A2: Trade Shares, 2016—Asia (% of total world trade)
Reporter
Partner
Asiaof which
EU US ROWPRC JapanCentral Asia 31.1 15.8 1.7 29.3 2.6 37.0Armenia 20.8 9.1 1.0 23.6 2.4 53.1Azerbaijan 23.0 5.5 1.6 34.9 3.1 38.9Georgia 21.4 6.1 1.6 28.8 2.4 47.4Kazakhstan 23.9 12.7 1.8 39.0 3.1 34.1Kyrgyz Republic 50.7 29.0 0.4 6.0 2.9 40.4Tajikistan 35.2 14.1 0.2 10.3 1.0 53.4Turkmenistan 59.9 44.0 3.4 15.9 1.0 23.2Uzbekistan 46.3 21.3 1.0 12.0 2.1 39.6
East Asia 55.9 15.6 6.1 12.4 13.0 18.8China, People’s Rep. of 47.2 – 7.4 14.8 14.1 23.9Hong Kong, China 77.6 49.7 4.8 7.7 6.9 7.8Japan 55.9 21.6 – 11.9 16.0 16.2Republic of Korea 56.9 23.4 8.0 10.9 12.2 20.0Mongolia 70.0 59.6 4.2 15.1 1.8 13.1Taipei,China 71.5 30.3 10.4 8.4 10.9 9.1
South Asia 39.0 12.4 2.5 15.1 9.5 36.4Afghanistan 71.6 15.3 3.5 1.3 1.0 26.0Bangladesh 43.8 15.0 3.5 23.7 6.8 25.7Bhutan 97.7 0.4 0.9 1.6 0.2 0.5India 36.0 11.2 2.2 14.0 10.1 39.8Maldives 65.3 12.5 1.0 10.6 2.4 21.7Nepal 86.1 9.7 0.8 3.3 2.0 8.6Pakistan 44.2 22.5 3.1 17.2 8.0 30.6Sri Lanka 50.8 8.0 4.1 18.8 12.0 18.4
Southeast Asia 67.9 16.3 8.9 10.4 9.5 12.1Brunei Darussalam 83.2 4.7 24.3 3.1 11.5 2.1Cambodia 61.8 22.4 5.9 19.8 10.1 8.4Indonesia 70.2 17.0 10.4 9.0 8.4 12.4Lao PDR 95.0 28.3 2.0 2.8 0.5 1.7Malaysia 69.1 15.9 7.9 9.8 9.0 12.1Myanmar 91.3 36.8 6.9 3.7 1.3 3.7Philippines 70.2 15.0 14.8 9.2 11.1 9.5Singapore 69.3 13.5 5.6 11.1 8.7 10.9Thailand 66.1 16.1 12.5 9.7 8.9 15.2Viet Nam 61.8 19.6 8.0 12.3 13.1 12.8
The Pacific 76.5 15.6 5.8 14.5 3.1 5.8Fiji 83.1 12.9 6.0 4.7 7.4 4.8Kiribati 91.1 6.1 7.6 2.1 2.0 4.8Marshall Islands 49.8 21.3 0.0 43.8 1.0 5.5Micronesia, Fed. States of 38.1 3.8 3.9 0.4 24.4 37.1Nauru 76.1 2.1 7.9 0.8 1.8 21.3Palau 51.1 13.9 19.4 4.7 24.3 19.9Papua New Guinea 88.3 12.9 8.7 7.4 1.8 2.5Samoa 82.5 11.6 4.6 1.3 9.5 6.7Solomon Islands 89.8 43.4 3.0 6.7 1.5 2.1Timor-Leste 86.6 21.1 2.2 5.4 2.0 6.0Tonga 33.9 3.0 2.1 1.5 3.4 61.2Tuvalu 65.2 0.4 4.6 1.1 5.2 28.4Vanuatu 77.4 9.0 4.4 13.1 4.5 5.0
Oceania 66.3 25.8 9.5 14.8 9.3 9.6Australia 67.0 26.9 10.1 14.9 9.0 9.1New Zealand 62.3 19.7 6.6 14.0 11.1 12.6
Asia 57.3 15.9 6.5 12.5 11.7 18.5Developing Asia 57.0 14.7 7.2 12.5 11.3 19.3
EU = European Union, Lao PDR = Lao People’s Democratic Republic, PRC = People’s Republic of China, ROW = rest of the world, US = United States. Source: ADB calculations using data from International Monetary Fund. Direction of Trade Database. https://www.imf.org/en/Data (accessed July 2017).
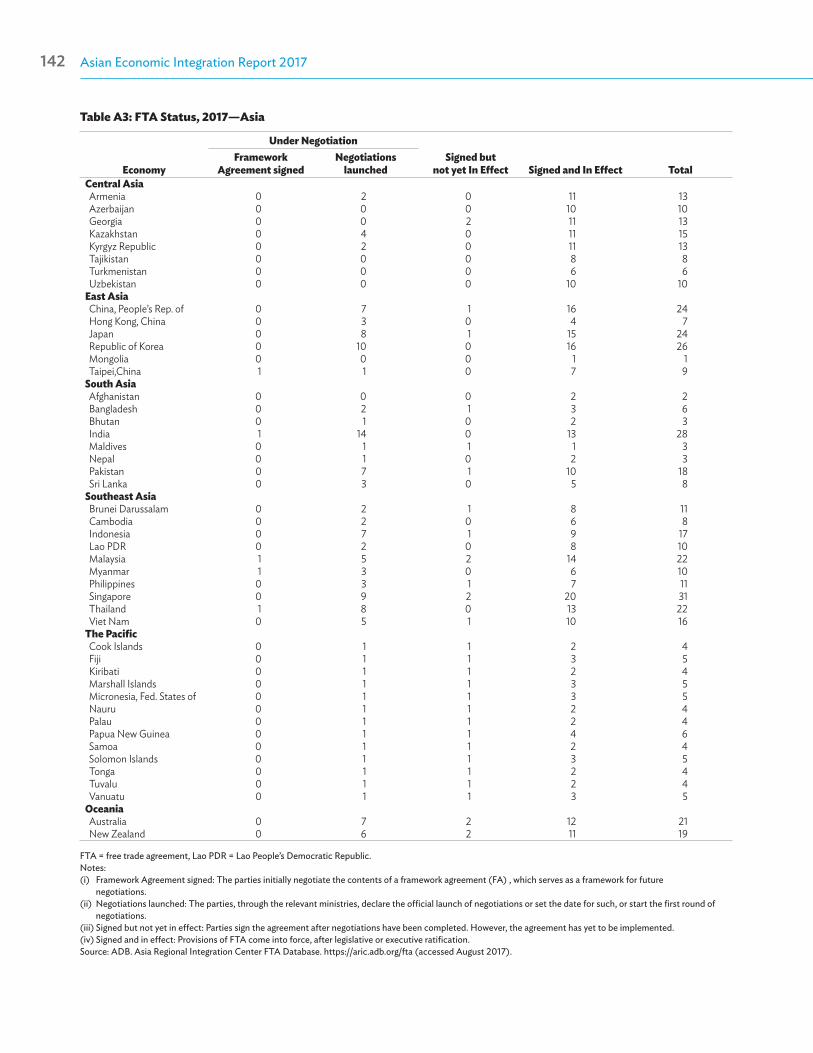
Asian Economic Integration Report 2017142 Statistical Appendix 143
Table A3: FTA Status, 2017—Asia
Economy
Under NegotiationSigned but
not yet In Effect Signed and In Effect TotalFramework
Agreement signedNegotiations
launchedCentral AsiaArmenia 0 2 0 11 13Azerbaijan 0 0 0 10 10Georgia 0 0 2 11 13Kazakhstan 0 4 0 11 15Kyrgyz Republic 0 2 0 11 13Tajikistan 0 0 0 8 8Turkmenistan 0 0 0 6 6Uzbekistan 0 0 0 10 10
East AsiaChina, People’s Rep. of 0 7 1 16 24Hong Kong, China 0 3 0 4 7Japan 0 8 1 15 24Republic of Korea 0 10 0 16 26Mongolia 0 0 0 1 1Taipei,China 1 1 0 7 9
South AsiaAfghanistan 0 0 0 2 2Bangladesh 0 2 1 3 6Bhutan 0 1 0 2 3India 1 14 0 13 28Maldives 0 1 1 1 3Nepal 0 1 0 2 3Pakistan 0 7 1 10 18Sri Lanka 0 3 0 5 8
Southeast AsiaBrunei Darussalam 0 2 1 8 11Cambodia 0 2 0 6 8Indonesia 0 7 1 9 17Lao PDR 0 2 0 8 10Malaysia 1 5 2 14 22Myanmar 1 3 0 6 10Philippines 0 3 1 7 11Singapore 0 9 2 20 31Thailand 1 8 0 13 22Viet Nam 0 5 1 10 16
The PacificCook Islands 0 1 1 2 4Fiji 0 1 1 3 5Kiribati 0 1 1 2 4Marshall Islands 0 1 1 3 5Micronesia, Fed. States of 0 1 1 3 5Nauru 0 1 1 2 4Palau 0 1 1 2 4Papua New Guinea 0 1 1 4 6Samoa 0 1 1 2 4Solomon Islands 0 1 1 3 5Tonga 0 1 1 2 4Tuvalu 0 1 1 2 4Vanuatu 0 1 1 3 5
OceaniaAustralia 0 7 2 12 21New Zealand 0 6 2 11 19
FTA = free trade agreement, Lao PDR = Lao People’s Democratic Republic. Notes:(i) Framework Agreement signed: The parties initially negotiate the contents of a framework agreement (FA) , which serves as a framework for future
negotiations. (ii) Negotiations launched: The parties, through the relevant ministries, declare the official launch of negotiations or set the date for such, or start the first round of
negotiations.(iii) Signed but not yet in effect: Parties sign the agreement after negotiations have been completed. However, the agreement has yet to be implemented.(iv) Signed and in effect: Provisions of FTA come into force, after legislative or executive ratification.Source: ADB. Asia Regional Integration Center FTA Database. https://aric.adb.org/fta (accessed August 2017).
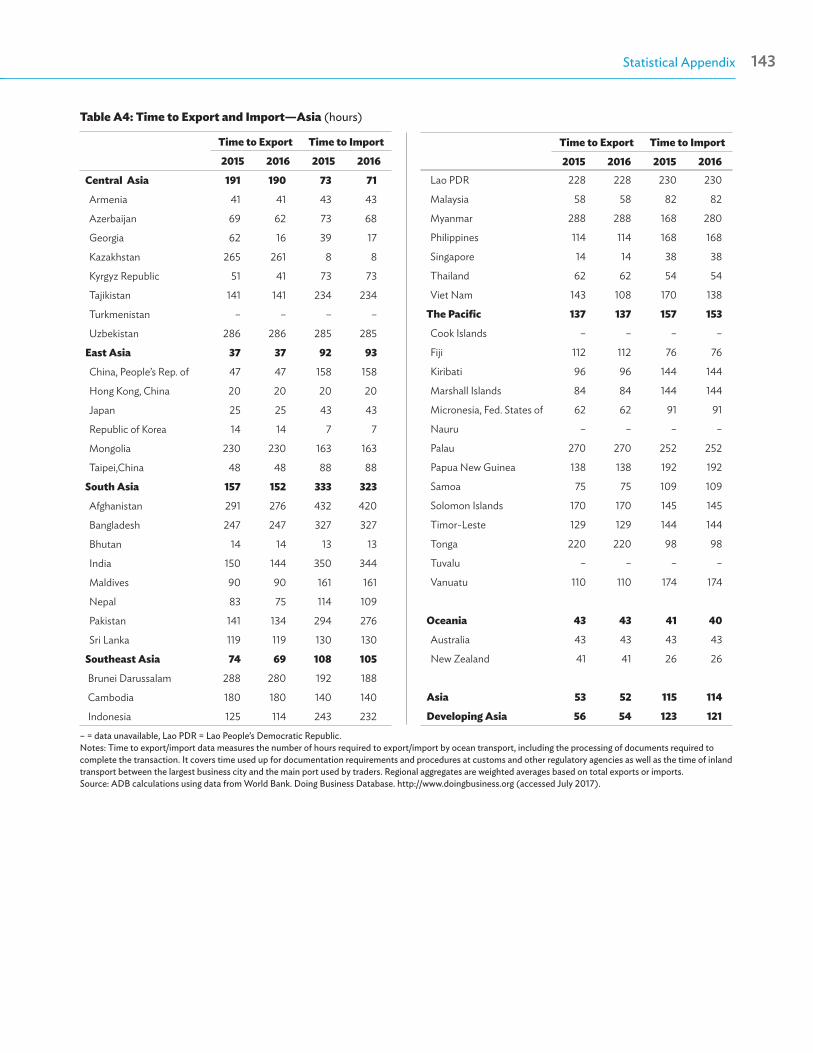
Asian Economic Integration Report 2017142 Statistical Appendix 143
Table A4: Time to Export and Import—Asia (hours)
Time to Export Time to Import
2015 2016 2015 2016
Central Asia 191 190 73 71
Armenia 41 41 43 43
Azerbaijan 69 62 73 68
Georgia 62 16 39 17
Kazakhstan 265 261 8 8
Kyrgyz Republic 51 41 73 73
Tajikistan 141 141 234 234
Turkmenistan – – – –
Uzbekistan 286 286 285 285
East Asia 37 37 92 93
China, People’s Rep. of 47 47 158 158
Hong Kong, China 20 20 20 20
Japan 25 25 43 43
Republic of Korea 14 14 7 7
Mongolia 230 230 163 163
Taipei,China 48 48 88 88
South Asia 157 152 333 323
Afghanistan 291 276 432 420
Bangladesh 247 247 327 327
Bhutan 14 14 13 13
India 150 144 350 344
Maldives 90 90 161 161
Nepal 83 75 114 109
Pakistan 141 134 294 276
Sri Lanka 119 119 130 130
Southeast Asia 74 69 108 105
Brunei Darussalam 288 280 192 188
Cambodia 180 180 140 140
Indonesia 125 114 243 232
Lao PDR 228 228 230 230
Malaysia 58 58 82 82
Myanmar 288 288 168 280
Philippines 114 114 168 168
Singapore 14 14 38 38
Thailand 62 62 54 54
Viet Nam 143 108 170 138
The Pacific 137 137 157 153
Cook Islands – – – –
Fiji 112 112 76 76
Kiribati 96 96 144 144
Marshall Islands 84 84 144 144
Micronesia, Fed. States of 62 62 91 91
Nauru – – – –
Palau 270 270 252 252
Papua New Guinea 138 138 192 192
Samoa 75 75 109 109
Solomon Islands 170 170 145 145
Timor-Leste 129 129 144 144
Tonga 220 220 98 98
Tuvalu – – – –
Vanuatu 110 110 174 174
Oceania 43 43 41 40
Australia 43 43 43 43
New Zealand 41 41 26 26
Asia 53 52 115 114
Developing Asia 56 54 123 121
Time to Export Time to Import
2015 2016 2015 2016
– = data unavailable, Lao PDR = Lao People’s Democratic Republic. Notes: Time to export/import data measures the number of hours required to export/import by ocean transport, including the processing of documents required to complete the transaction. It covers time used up for documentation requirements and procedures at customs and other regulatory agencies as well as the time of inland transport between the largest business city and the main port used by traders. Regional aggregates are weighted averages based on total exports or imports. Source: ADB calculations using data from World Bank. Doing Business Database. http://www.doingbusiness.org (accessed July 2017).
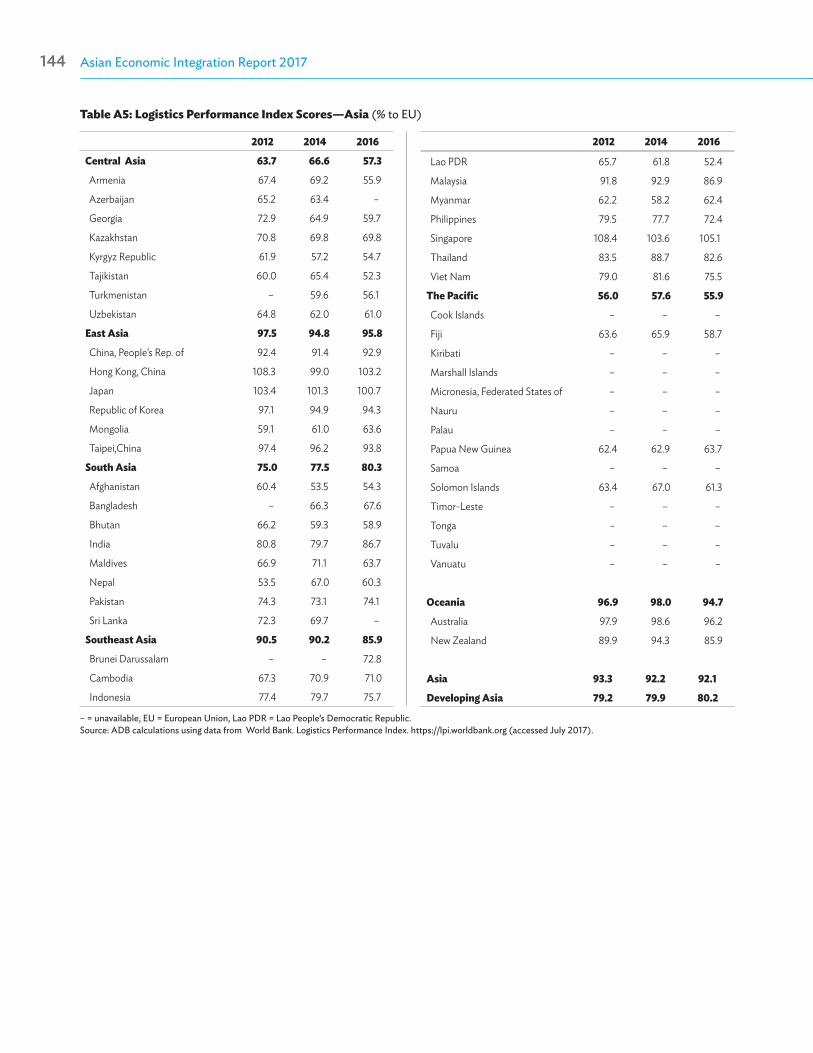
Asian Economic Integration Report 2017144 Statistical Appendix 145
2012 2014 2016
Central Asia 63.7 66.6 57.3
Armenia 67.4 69.2 55.9
Azerbaijan 65.2 63.4 –
Georgia 72.9 64.9 59.7
Kazakhstan 70.8 69.8 69.8
Kyrgyz Republic 61.9 57.2 54.7
Tajikistan 60.0 65.4 52.3
Turkmenistan – 59.6 56.1
Uzbekistan 64.8 62.0 61.0
East Asia 97.5 94.8 95.8
China, People’s Rep. of 92.4 91.4 92.9
Hong Kong, China 108.3 99.0 103.2
Japan 103.4 101.3 100.7
Republic of Korea 97.1 94.9 94.3
Mongolia 59.1 61.0 63.6
Taipei,China 97.4 96.2 93.8
South Asia 75.0 77.5 80.3
Afghanistan 60.4 53.5 54.3
Bangladesh – 66.3 67.6
Bhutan 66.2 59.3 58.9
India 80.8 79.7 86.7
Maldives 66.9 71.1 63.7
Nepal 53.5 67.0 60.3
Pakistan 74.3 73.1 74.1
Sri Lanka 72.3 69.7 –
Southeast Asia 90.5 90.2 85.9
Brunei Darussalam – – 72.8
Cambodia 67.3 70.9 71.0
Indonesia 77.4 79.7 75.7
Lao PDR 65.7 61.8 52.4
Malaysia 91.8 92.9 86.9
Myanmar 62.2 58.2 62.4
Philippines 79.5 77.7 72.4
Singapore 108.4 103.6 105.1
Thailand 83.5 88.7 82.6
Viet Nam 79.0 81.6 75.5
The Pacific 56.0 57.6 55.9
Cook Islands – – –
Fiji 63.6 65.9 58.7
Kiribati – – –
Marshall Islands – – –
Micronesia, Federated States of – – –
Nauru – – –
Palau – – –
Papua New Guinea 62.4 62.9 63.7
Samoa – – –
Solomon Islands 63.4 67.0 61.3
Timor-Leste – – –
Tonga – – –
Tuvalu – – –
Vanuatu – – –
Oceania 96.9 98.0 94.7
Australia 97.9 98.6 96.2
New Zealand 89.9 94.3 85.9
Asia 93.3 92.2 92.1
Developing Asia 79.2 79.9 80.2
Table A5: Logistics Performance Index Scores—Asia (% to EU)
– = unavailable, EU = European Union, Lao PDR = Lao People’s Democratic Republic.Source: ADB calculations using data from World Bank. Logistics Performance Index. https://lpi.worldbank.org (accessed July 2017).
2012 2014 2016

Asian Economic Integration Report 2017144 Statistical Appendix 145
Table A6: Cross-Border Equity Holdings, 2016—Asia (% of total cross-border equity holdings)
Reporter
Partner
Asiaof which
EU US ROWPRC JapanCentral Asia 11.8 0.0 8.7 24.9 52.4 10.9
Armenia – – – – – –Azerbaijan – – – – – –Georgia – – – – – –Kazakhstan 11.8 0.0 8.7 24.9 52.4 10.9Kyrgyz Republic – – – – – –Tajikistan – – – – – –Turkmenistan – – – – – –Uzbekistan – – – – – –
East Asia 16.5 8.4 1.0 15.9 23.5 44.1China, People’s Rep. of 37.8 0.0 4.2 15.2 32.5 14.5Hong Kong, China 26.9 23.3 0.9 11.7 3.0 58.3Japan 6.3 0.7 0.0 17.7 32.1 43.8Republic of Korea 19.9 4.2 6.1 23.0 46.5 10.5Mongolia 70.0 0.4 0.0 12.4 12.7 4.9Taipei,China – – – – – –
South Asia 21.4 13.3 0.2 32.7 28.7 17.2Afghanistan – – – – – –Bangladesh 100.0 0.0 0.0 0.0 0.0 0.0Bhutan – – – – – –India 22.8 14.4 0.3 34.7 31.0 11.5Maldives – – – – – –Nepal – – – – – –Pakistan 0.7 0.0 0.0 8.9 0.3 90.2Sri Lanka – – – – – –
Southeast Asia 39.6 12.7 5.3 10.3 26.0 24.0Brunei Darussalam – – – – – –Cambodia – – – – – –Indonesia 13.6 5.3 0.2 44.3 3.4 38.6Lao PDR – – – – – –Malaysia 46.6 1.6 0.6 8.2 39.4 5.8Myanmar – – – – – –Philippines 11.9 0.6 0.1 52.1 33.7 2.3Singapore 39.7 14.2 5.9 9.1 25.0 26.2Thailand 24.5 2.2 3.1 43.9 23.7 8.0Viet Nam – – – – – –
The Pacific – – – – – –Cook Islands – – – – – –Fiji – – – – – –Kiribati – – – – – –Marshall Islands – – – – – –Micronesia, Fed. States of – – – – – –Nauru – – – – – –Palau – – – – – –Papua New Guinea – – – – – –Samoa – – – – – –Solomon Islands – – – – – –Timor-Leste – – – – – –Tonga – – – – – –Tuvalu – – – – – –Vanuatu – – – – – –
Oceania 15.8 1.1 4.7 18.0 45.8 20.4Australia 13.1 1.2 4.8 19.1 47.2 20.6New Zealand 36.1 0.3 4.0 10.4 35.0 18.5
Asia 20.1 8.1 2.2 15.3 26.7 37.9Developing Asia 31.4 15.4 3.2 12.8 18.0 37.8
– = unavailable, EU = European Union, Lao PDR = Lao People’s Democratic Republic, PRC = People’s Republic of China, ROW = rest of the world, US = United States. Source: ADB calculations using data from International Monetary Fund. Coordinated Portfolio Investment Survey. http://cpis.imf.org (accessed September 2017).
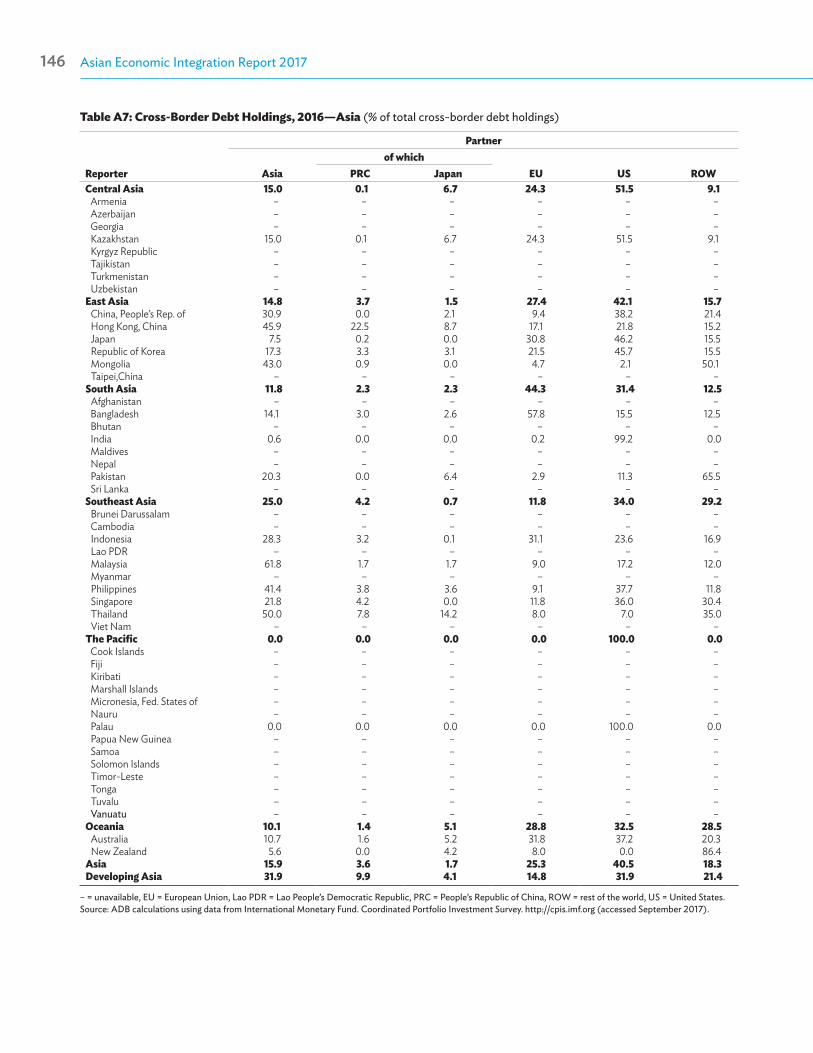
Asian Economic Integration Report 2017146 Statistical Appendix 147
Table A7: Cross-Border Debt Holdings, 2016—Asia (% of total cross-border debt holdings)
Reporter
Partner
Asiaof which
EU US ROWPRC JapanCentral Asia 15.0 0.1 6.7 24.3 51.5 9.1
Armenia – – – – – –Azerbaijan – – – – – –Georgia – – – – – –Kazakhstan 15.0 0.1 6.7 24.3 51.5 9.1Kyrgyz Republic – – – – – –Tajikistan – – – – – –Turkmenistan – – – – – –Uzbekistan – – – – – –
East Asia 14.8 3.7 1.5 27.4 42.1 15.7China, People’s Rep. of 30.9 0.0 2.1 9.4 38.2 21.4Hong Kong, China 45.9 22.5 8.7 17.1 21.8 15.2Japan 7.5 0.2 0.0 30.8 46.2 15.5Republic of Korea 17.3 3.3 3.1 21.5 45.7 15.5Mongolia 43.0 0.9 0.0 4.7 2.1 50.1Taipei,China – – – – – –
South Asia 11.8 2.3 2.3 44.3 31.4 12.5Afghanistan – – – – – –Bangladesh 14.1 3.0 2.6 57.8 15.5 12.5Bhutan – – – – – –India 0.6 0.0 0.0 0.2 99.2 0.0Maldives – – – – – –Nepal – – – – – –Pakistan 20.3 0.0 6.4 2.9 11.3 65.5Sri Lanka – – – – – –
Southeast Asia 25.0 4.2 0.7 11.8 34.0 29.2Brunei Darussalam – – – – – –Cambodia – – – – – –Indonesia 28.3 3.2 0.1 31.1 23.6 16.9Lao PDR – – – – – –Malaysia 61.8 1.7 1.7 9.0 17.2 12.0Myanmar – – – – – –Philippines 41.4 3.8 3.6 9.1 37.7 11.8Singapore 21.8 4.2 0.0 11.8 36.0 30.4Thailand 50.0 7.8 14.2 8.0 7.0 35.0Viet Nam – – – – – –
The Pacific 0.0 0.0 0.0 0.0 100.0 0.0Cook Islands – – – – – –Fiji – – – – – –Kiribati – – – – – –Marshall Islands – – – – – –Micronesia, Fed. States of – – – – – –Nauru – – – – – –Palau 0.0 0.0 0.0 0.0 100.0 0.0Papua New Guinea – – – – – –Samoa – – – – – –Solomon Islands – – – – – –Timor-Leste – – – – – –Tonga – – – – – –Tuvalu – – – – – –Vanuatu – – – – – –
Oceania 10.1 1.4 5.1 28.8 32.5 28.5Australia 10.7 1.6 5.2 31.8 37.2 20.3New Zealand 5.6 0.0 4.2 8.0 0.0 86.4
Asia 15.9 3.6 1.7 25.3 40.5 18.3Developing Asia 31.9 9.9 4.1 14.8 31.9 21.4
– = unavailable, EU = European Union, Lao PDR = Lao People’s Democratic Republic, PRC = People’s Republic of China, ROW = rest of the world, US = United States. Source: ADB calculations using data from International Monetary Fund. Coordinated Portfolio Investment Survey. http://cpis.imf.org (accessed September 2017).

Asian Economic Integration Report 2017146 Statistical Appendix 147
Table A8: FDI Inflow Share, 2016—Asia
Reporter
Partner
Asiaof which
Japan EU US ROWPRCCentral Asia 14.3 6.0 2.3 56.6 16.6 12.5Armenia 0.2 0.0 0.0 119.1 4.3 -23.6Azerbaijan 0.1 0.1 0.1 4.8 0.3 94.8Georgia 38.9 1.6 0.5 28.4 2.7 30.0Kazakhstan 22.6 10.6 5.2 118.4 37.8 -78.8Kyrgyz Republic 19.9 14.5 0.0 19.5 1.1 59.5Tajikistan 49.2 49.2 0.0 0.0 0.0 50.8Turkmenistan – – – – – –Uzbekistan – – – – – –
East Asia 61.7 10.6 5.4 15.4 4.9 18.0China, People’s Rep. of 31.2 24.8 2.8 11.1 0.4 57.3Hong Kong, China 76.9 -1.1 – 104.8 50.6 -132.3Japan 51.2 11.1 12.8 46.1 30.9 -28.2Republic of Korea -15.4 -5.4 -0.8 -43.3 -1.4 160.1Mongolia 86.0 – 7.3 2.6 2.6 8.8Taipei,China 22.4 3.0 4.2 86.2 1.7 -10.3
South Asia 37.2 1.7 11.6 19.3 5.9 37.6Afghanistan 16.5 16.5 – -5.0 – 88.6Bangladesh 44.4 1.2 2.1 19.6 3.0 33.0Bhutan -118.2 – – -28.9 0.0 247.0India 37.8 0.6 13.0 18.8 5.9 37.6Maldives 0.0 – 0.0 -8.6 0.0 108.6Nepal 9.4 8.1 1.3 0.0 0.0 90.6Pakistan 31.5 25.2 2.1 49.4 13.5 5.6Sri Lanka 26.3 2.6 -0.6 -6.9 0.0 80.6
Southeast Asia 66.1 9.1 13.8 28.6 11.5 -6.2Brunei Darussalam 44.9 0.0 2.3 117.6 -1.5 -61.0Cambodia 92.0 26.2 10.4 10.1 2.8 -4.9Indonesia 597.1 11.2 184.8 -8.0 -19.3 -469.8Lao PDR 108.7 79.8 5.0 1.8 0.4 -10.8Malaysia 75.6 8.9 9.2 13.7 8.2 2.6Myanmar 94.4 9.4 0.7 38.3 2.0 -34.7Philippines 54.9 0.2 33.3 18.2 17.0 9.9Singapore 33.2 8.7 0.5 47.3 15.2 4.3Thailand 445.5 16.4 231.9 -273.2 21.4 -93.7Viet Nam 55.9 7.7 10.6 4.4 1.6 38.1
The Pacific – – – – – –Cook Islands – – – – – –Fiji 112.7 29.6 3.8 2.8 – –Kiribati – – – – – –Marshall Islands 0.0 0.0 0.0 197.1 – –FSM – – – – – –Nauru – – – – – –Palau 16.7 0.0 16.7 – – –Papua New Guinea – – – – – –Samoa 67.5 52.3 15.2 32.5 – –Solomon Islands 121.9 0.0 0.0 0.0 – –Timor-Leste – – – – – –Tonga – – – – – –Tuvalu – – – – – –Vanuatu 74.0 8.9 -7.6 7.8 – –
Oceania 30.4 5.7 15.0 20.2 16.9 32.5Australia 30.3 6.0 15.8 21.9 17.5 30.3New Zealand 33.0 0.0 -0.8 -14.0 3.0 77.9
Asia 55.3 8.7 8.6 20.8 8.1 15.8Developing Asia 57.7 9.3 8.1 18.6 5.9 17.7
– = unavailable, EU = European Union, FSM = Federated States of Micronesia, FDI = foreign direct investments, Lao PDR = Lao People’s Democratic Republic, PRC = People’s Republic of China, ROW = rest of the world, US = United States. Sources: ADB calculations using data from Association of Southeast Asian Nations Secretariat; CEIC; Eurosatat. Balance of Payments; Organisation for Economic Co-operation and Development; and United Nations Conference on Trade and Development. Bilateral FDI Statistics. http://unctad.org/en/Pages/Home.aspx (all accessed July 2017).

Asian Economic Integration Report 2017148 Statistical Appendix 149
Table A9: Remittance Inflows Share, 2016—Asia (% of total remittance inflows)
Reporter
Partner
Asiaof which
EU US ROWJapanCentral Asia 6.9 0.0 8.2 2.7 82.2Armenia 4.4 0.0 10.5 13.9 71.2Azerbaijan 24.3 0.0 3.4 2.0 70.3Georgia 9.2 0.0 16.7 2.4 71.7Kazakhstan 4.2 0.0 22.1 0.6 73.1Kyrgyz Republic 4.7 0.0 12.8 0.7 81.9Tajikistan 12.3 0.0 4.3 0.9 82.5Turkmenistan – – – – –Uzbekistan – – – – –
East Asia 42.9 7.9 8.9 27.5 20.7China, People’s Rep. of 22.7 0.0 11.5 30.7 35.2Hong Kong, China 39.7 0.0 13.1 34.9 12.4Japan 16.9 26.4 4.5 44.9 33.7Republic of Korea 44.9 0.0 19.8 0.4 35.0Mongolia 45.9 6.6 9.0 25.4 19.7Taipei,China – – – – –
South Asia 14.8 0.2 9.5 11.8 63.9Afghanistan 31.7 0.0 7.7 2.2 58.3Bangladesh 34.9 0.2 5.5 3.4 56.2Bhutan 95.2 0.0 0.0 0.0 4.8India 12.5 0.2 8.6 17.0 61.9Maldives 50.0 0.0 0.0 0.0 50.0Nepal 20.9 0.0 3.0 4.7 71.4Pakistan 5.2 0.2 13.9 6.7 74.2Sri Lanka 16.2 0.6 19.0 3.1 61.7
Southeast Asia 25.4 2.5 9.8 31.2 33.6Brunei Darussalam – – – – –Cambodia 67.8 0.3 7.4 21.4 3.4Indonesia 39.1 0.7 4.6 2.8 53.6Lao PDR 74.7 0.0 4.2 20.0 1.1Malaysia 88.8 0.5 4.3 3.8 3.2Myanmar 66.2 0.0 0.7 5.4 27.7Philippines 14.6 3.5 7.0 33.9 44.5Singapore – – – – –Thailand 32.4 4.5 25.2 27.7 14.7Viet Nam 18.0 1.4 15.4 56.3 10.2
The Pacific 58.8 0.0 2.0 25.3 13.9Cook Islands – – – – –Fiji 59.6 0.0 3.1 23.1 14.1Kiribati 50.0 0.0 0.0 50.0 0.0Marshall Islands 3.7 0.0 0.0 92.6 3.7Micronesia, Fed. States of 0.0 0.0 0.0 70.8 29.2Nauru – – – – –Palau 0.0 0.0 0.0 50.0 50.0Papua New Guinea 90.9 0.0 0.0 9.1 0.0Samoa 64.4 0.0 0.0 12.9 22.7Solomon Islands 90.0 0.0 0.0 5.0 5.0Timor-Leste 93.8 0.0 6.2 0.0 0.0Tonga 57.1 0.0 0.0 39.5 3.4Tuvalu 75.0 0.0 0.0 0.0 25.0Vanuatu 20.8 0.0 8.3 4.2 66.7
Oceania 37.6 2.4 36.4 13.1 12.8Australia 28.7 2.7 41.8 14.9 14.6New Zealand 83.6 0.5 9.1 3.8 3.5
Asia 25.2 2.9 9.6 20.7 44.5Developing Asia 24.9 3.0 9.3 20.5 45.3
– = unavailable, EU = European Union, Lao PDR = Lao People’s Democratic Republic, ROW = rest of the world, US = United States.Source: ADB calculations using data from World Bank. World Bank Migration and Remittances Data. http://www.worldbank.org/en/topic/migrationremittancesdiasporaissues/brief/migration-remittances-data (accessed July 2017).

Asian Economic Integration Report 2017148 Statistical Appendix 149
Table A10: Outbound Migration Share, 2015—Asia (% of total outbound migrants)
Reporter
Partner
Asiaof which
EU US ROWPRC JapanCentral Asia 10.0 0.0 0.0 15.1 1.9 72.9Armenia 18.8 0.0 0.0 9.1 9.1 63.0Azerbaijan 15.1 0.0 0.0 3.7 1.7 79.4Georgia 11.9 0.0 0.0 20.4 2.9 64.8Kazakhstan 1.6 0.0 0.0 26.8 0.6 70.9Kyrgyz Republic 4.0 0.0 0.0 12.4 0.7 82.9Tajikistan 7.9 0.0 0.0 5.5 0.7 85.8Turkmenistan 2.8 0.0 0.0 4.2 0.9 92.2Uzbekistan 23.2 0.0 0.0 3.7 1.8 71.3
East Asia 37.0 3.4 8.5 9.6 27.5 25.9China, People’s Rep. of 47.5 0.0 6.8 9.9 22.0 20.5Hong Kong, China 15.9 26.0 0.0 11.9 21.5 50.7Japan 22.0 0.9 0.0 17.0 43.3 17.7Republic of Korea 8.9 8.0 22.3 4.2 47.7 39.2Mongolia 32.6 0.0 0.0 27.4 0.0 40.1Taipei,China 0.0 0.0 0.0 0.0 0.0 0.0
South Asia 31.8 0.1 0.1 8.6 7.2 52.4Afghanistan 34.6 0.0 0.0 5.9 1.3 58.1Bangladesh 51.8 0.1 0.1 5.3 2.6 40.3Bhutan 89.3 0.0 0.0 4.0 0.0 6.7India 21.8 0.1 0.1 7.7 12.6 57.9Maldives 73.9 0.0 0.0 17.3 0.0 8.8Nepal 52.9 0.0 0.0 4.7 4.6 37.8Pakistan 28.6 0.1 0.2 14.3 5.5 51.6Sri Lanka 20.7 0.3 0.6 22.0 2.9 54.4
Southeast Asia 46.1 0.8 1.8 7.9 20.3 25.7Brunei Darussalam 75.6 0.0 0.0 14.0 0.0 10.4Cambodia 77.0 0.0 0.3 6.1 14.1 2.8Indonesia 43.4 1.0 0.7 4.7 2.5 49.5Lao PDR 80.1 0.0 0.0 3.6 14.9 1.4Malaysia 88.0 0.3 0.4 5.3 3.5 3.2Myanmar 88.1 0.0 0.0 0.8 3.6 7.5Philippines 9.1 1.4 4.0 9.2 35.7 46.1Singapore 65.1 0.0 0.7 18.5 10.0 6.5Thailand 27.3 1.8 4.8 28.5 27.6 16.6Viet Nam 20.7 1.1 2.8 15.2 50.9 13.3
The Pacific 64.9 0.0 0.0 3.3 18.2 13.6Cook Islands 99.9 0.0 0.0 0.0 0.0 0.0Fiji 63.1 0.0 0.0 3.5 19.9 13.5Kiribati 93.5 0.0 0.0 4.3 0.0 2.2Marshall Islands 1.9 0.0 0.0 0.1 93.9 4.1Micronesia, Fed. States of 3.4 0.0 0.0 0.5 36.7 59.4Nauru 97.3 0.0 0.0 1.5 0.0 1.3Palau 12.3 0.0 0.0 7.7 0.0 80.0Papua New Guinea 46.5 0.0 0.0 33.7 0.0 19.8Samoa 70.2 0.0 0.0 0.8 14.9 14.1Solomon Islands 89.6 0.0 0.0 10.3 0.0 0.1Timor-Leste 89.1 0.0 0.0 10.7 0.0 0.2Tonga 64.7 0.0 0.0 0.8 31.3 3.1Tuvalu 77.6 0.0 0.0 2.0 0.0 20.4Vanuatu 22.6 0.0 0.0 12.0 0.0 65.4
Oceania 59.2 0.4 0.9 25.0 8.2 7.6Australia 23.8 1.0 1.7 47.0 14.8 14.5New Zealand 82.5 0.0 0.4 10.6 3.8 3.1
Asia 34.0 0.8 1.9 9.6 13.2 43.2Developing Asia 33.7 0.8 2.0 9.3 12.9 44.0
– = unavailable, EU = European Union, Lao PDR = Lao People’s Democratic Republic, PRC = People’s Republic of China, ROW = rest of the world, US = United States.Source: ADB calculations using data from United Nations. Department of Economic and Social Affairs, Population Division. International Migrant Stock 2015. http://www.un.org/en/development/desa/population/migration/data/index.shtml (accessed July 2016).
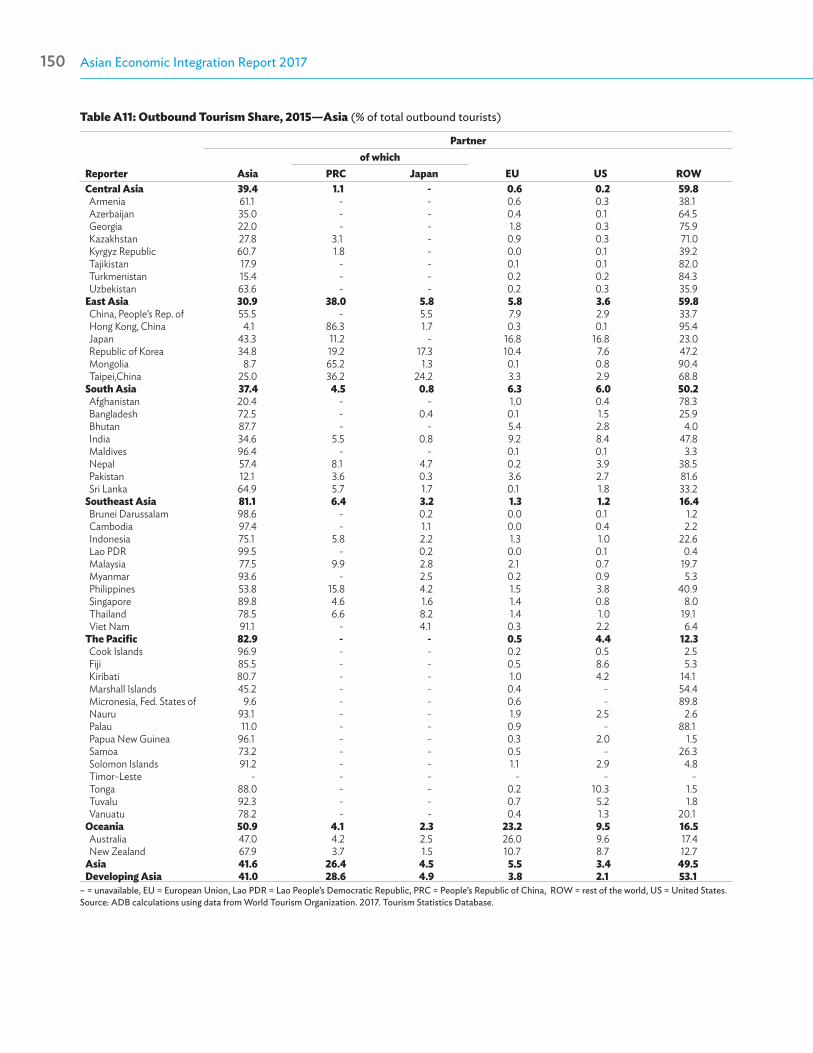
Asian Economic Integration Report 2017150 Statistical Appendix PB
Table A11: Outbound Tourism Share, 2015—Asia (% of total outbound tourists)
Reporter
Partner
Asiaof which
EU US ROWPRC JapanCentral Asia 39.4 1.1 - 0.6 0.2 59.8 Armenia 61.1 - - 0.6 0.3 38.1 Azerbaijan 35.0 - - 0.4 0.1 64.5 Georgia 22.0 - - 1.8 0.3 75.9 Kazakhstan 27.8 3.1 - 0.9 0.3 71.0 Kyrgyz Republic 60.7 1.8 - 0.0 0.1 39.2 Tajikistan 17.9 - - 0.1 0.1 82.0 Turkmenistan 15.4 - - 0.2 0.2 84.3 Uzbekistan 63.6 - - 0.2 0.3 35.9
East Asia 30.9 38.0 5.8 5.8 3.6 59.8 China, People’s Rep. of 55.5 - 5.5 7.9 2.9 33.7 Hong Kong, China 4.1 86.3 1.7 0.3 0.1 95.4 Japan 43.3 11.2 - 16.8 16.8 23.0 Republic of Korea 34.8 19.2 17.3 10.4 7.6 47.2 Mongolia 8.7 65.2 1.3 0.1 0.8 90.4 Taipei,China 25.0 36.2 24.2 3.3 2.9 68.8
South Asia 37.4 4.5 0.8 6.3 6.0 50.2 Afghanistan 20.4 - - 1.0 0.4 78.3 Bangladesh 72.5 - 0.4 0.1 1.5 25.9 Bhutan 87.7 - - 5.4 2.8 4.0 India 34.6 5.5 0.8 9.2 8.4 47.8 Maldives 96.4 - - 0.1 0.1 3.3 Nepal 57.4 8.1 4.7 0.2 3.9 38.5 Pakistan 12.1 3.6 0.3 3.6 2.7 81.6 Sri Lanka 64.9 5.7 1.7 0.1 1.8 33.2
Southeast Asia 81.1 6.4 3.2 1.3 1.2 16.4 Brunei Darussalam 98.6 - 0.2 0.0 0.1 1.2 Cambodia 97.4 - 1.1 0.0 0.4 2.2 Indonesia 75.1 5.8 2.2 1.3 1.0 22.6 Lao PDR 99.5 - 0.2 0.0 0.1 0.4 Malaysia 77.5 9.9 2.8 2.1 0.7 19.7 Myanmar 93.6 - 2.5 0.2 0.9 5.3 Philippines 53.8 15.8 4.2 1.5 3.8 40.9 Singapore 89.8 4.6 1.6 1.4 0.8 8.0 Thailand 78.5 6.6 8.2 1.4 1.0 19.1 Viet Nam 91.1 - 4.1 0.3 2.2 6.4
The Pacific 82.9 - - 0.5 4.4 12.3 Cook Islands 96.9 - - 0.2 0.5 2.5 Fiji 85.5 - - 0.5 8.6 5.3 Kiribati 80.7 - - 1.0 4.2 14.1 Marshall Islands 45.2 - - 0.4 - 54.4 Micronesia, Fed. States of 9.6 - - 0.6 - 89.8 Nauru 93.1 - - 1.9 2.5 2.6 Palau 11.0 - - 0.9 - 88.1 Papua New Guinea 96.1 - - 0.3 2.0 1.5 Samoa 73.2 - - 0.5 - 26.3 Solomon Islands 91.2 - - 1.1 2.9 4.8 Timor-Leste - - - - - - Tonga 88.0 - - 0.2 10.3 1.5 Tuvalu 92.3 - - 0.7 5.2 1.8 Vanuatu 78.2 - - 0.4 1.3 20.1
Oceania 50.9 4.1 2.3 23.2 9.5 16.5 Australia 47.0 4.2 2.5 26.0 9.6 17.4 New Zealand 67.9 3.7 1.5 10.7 8.7 12.7
Asia 41.6 26.4 4.5 5.5 3.4 49.5 Developing Asia 41.0 28.6 4.9 3.8 2.1 53.1
– = unavailable, EU = European Union, Lao PDR = Lao People’s Democratic Republic, PRC = People’s Republic of China, ROW = rest of the world, US = United States.Source: ADB calculations using data from World Tourism Organization. 2017. Tourism Statistics Database.

ASIAN ECONOMIC INTEGRATION REPORT 2017The Era of Financial Interconnectedness—How Can Asia Strengthen Financial Resilience?
The Asian Economic Integration Report 2017 is the annual report on Asia’s progress in regional cooperation and integration (RCI) of the Asian Development Bank (ADB). It covers ADB’s 48 regional members and analyzes regional and global economic linkages. This year’s special theme chapter, “The Era of Financial Interconnectedness: How Can Asia Strengthen Financial Resilience?” examines the region’s ability to absorb financial shocks and avoid instability. The report introduces an RCI composite index to help monitor and evaluate RCI progress in the region. The Asia-Pacific Regional Cooperation and Integration Index combines six RCI components: trade and investment, money and finance, regional value chains, infrastructure connectivity, movement of people, and institutional and social integration.
About the Asian Development Bank
ADB’s vision is an Asia and Pacific region free of poverty. Its mission is to help its developing member countries reduce poverty and improve the quality of life of their people. Despite the region’s many successes, it remains home to a large share of the world’s poor. ADB is committed to reducing poverty through inclusive economic growth, environmentally sustainable growth, and regional integration.
Based in Manila, ADB is owned by 67 members, including 48 from the region. Its main instruments for helping its developing member countries are policy dialogue, loans, equity investments, guarantees, grants, and technical assistance.
ASIAN DEVELOPMENT BANK6 ADB Avenue, Mandaluyong City1550 Metro Manila, Philippineswww.adb.org