Embed Size (px)
Citation preview
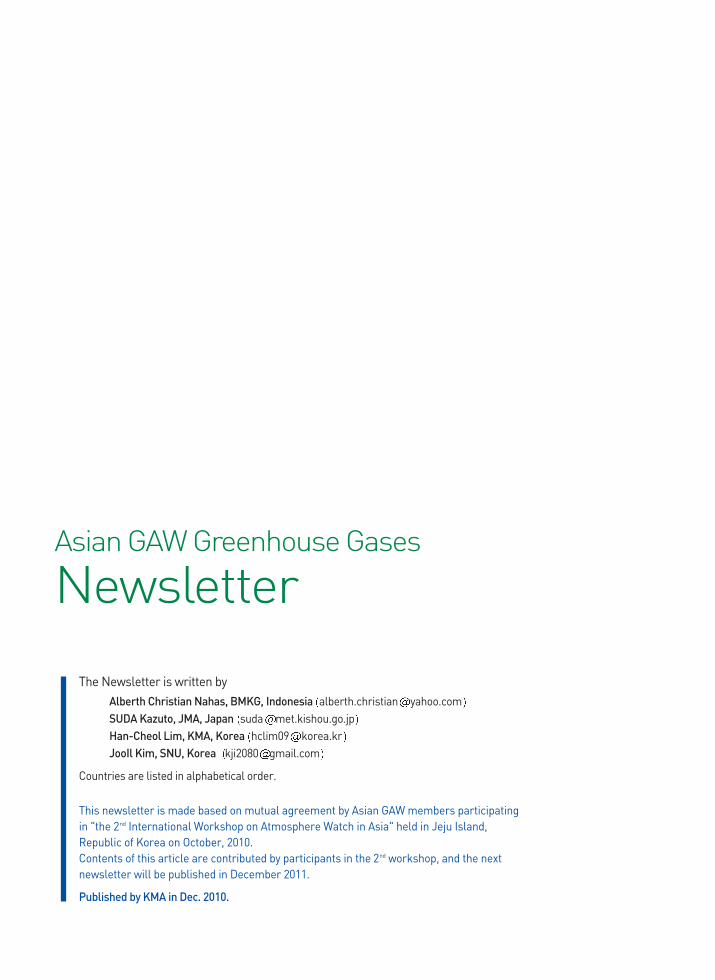
Asian GAW Greenhouse Gases
NewsletterVolume No.1 December, 2010
ISSN 2093-9590
The Newsletter is written byAlberth Christian Nahas, BMKG, Indonesia alberth.christian yahoo.comSUDA Kazuto, JMA, Japan suda met.kishou.go.jpHan-Cheol Lim, KMA, Korea hclim09 korea.krJooIl Kim, SNU, Korea kji2080 gmail.com
Countries are listed in alphabetical order.
This newsletter is made based on mutual agreement by Asian GAW members participatingin "the 2nd International Workshop on Atmosphere Watch in Asia" held in Jeju Island,Republic of Korea on October, 2010.Contents of this article are contributed by participants in the 2nd workshop, and the nextnewsletter will be published in December 2011.
Published by KMA in Dec. 2010.
Asian GAW Greenhouse Gases
Newsletter

1 Asian GAW Greenhouse Gases Newsletter Volume No.1, December, 2010
Asian Greenhouse Gases Newsletter for GAW
GAWAtmosphere Watch 2009 Report
KOREA (Anmyeon-do) Han-Cheol Lim (Korea Meteorological Administration)
Anmyeon-do (36°32′N, 126°19′E; 45.7m above
sea level) is a regional GAW stations located on
the west coast of the Korean Peninsula (Figure 1).
The observatory has been operated by the Korea
Global Atmosphere Watch Center (KGAWC) of
KMA since 1996, and presently, 36 parameters,
including greenhouse gases, aerosols, ultraviolet
radiation, ozone, and precipitation chemistry, are
being measured.
The center is actively engaged in international
activities, participating in intercomparison events,
organizing international workshops, and sharing
data from WDCGG (World Data Centre for
Greenhouse Gases). Due to its relatively pollution-
free environment, KGAWC provides an ideal site
for observations that are geographically
representative of the background atmosphere of
Northeast Asia, including the Korean Peninsula.
Since 1999, the center has been monitoring major
greenhouse gases (GHGs) such as carbon dioxide
(CO2), methane (CH4), nitrous oxide (N2O), and
chlorofluorocarbons (CFC-11, CFC-12). In 2007, the
number of GHGs monitored at the Center was
increased to seven, with the addition of
chlorofluorocarbon (CFC-113) and sulfur
hexafluoride (SF6). Figure 2 shows the
concentration levels for the five GHG types
observed at Anmyeon-do from 1999 to 2009,
along with the NOAA/GMD global CO2
concentration trends (CFC-113 and SF6 are not
shown). The CO2 concentrations at Anmyeon-do
are substantially higher than the global average
and the concentrations of both N2O and CH4 are
steadily increasing, while CFCs exhibit a
continuously declining trend (Table 1).
Figure 1. The Korea Global Atmosphere Watch
Center is located at the relatively
unpolluted western coastal area.
Figure 2. Annual averages of GHGs (CO2, CH4,
N2O, CFCs) Concentrations For 1999
-2009.

2 Asian GAW Greenhouse Gases Newsletter Volume No.1, December, 2010
Table 1. Average concentrations for 2009 and annual mean growth rates for the 11-year period from 1999
through 2009 of major GHGs in the background atmosphere of the Korean Peninsula.
GHGs CO2 CH4 N2O CFC-11 CFC-12
Average concentrations in 2009
392.5 (ppm)
1.906 (ppm)
323.9 (ppb)
249.3 (ppt)
528.9 (ppt)
11-year avg. growth rates
+2.15 (ppm/year)
+0.00246 (ppm/year)
+0.97 (ppb/year)
-2.26 (ppt/year)
-0.43 (ppt/year)
KGAWC also participated in the Global Round
Robin inter-comparison held by WMO/CCL
(NOAA/ESRL/GMD). We made the analysis of 5
types of greenhouse gases (CO2, CH4, N2O, CO,
SF6) in the three near ambient cylinders of
undisclosed trace gas mole fractions and the
analyzed results were submitted to WMO/CCL.
(Figure 3, left).
All the activities of KMA/KGAWC for 2009 were
reported in „Korea Global Atmosphere Watch 2009
Report‟ and the summary was also published in an
English version in September 2010 (Figure 3, right).
On Jeju Island, the 2nd International Workshop on
Atmosphere Watch in Asia was held by KMA and
KRISS on October 21st and 22nd, 2010 to enhance
international cooperation among Asia GAW
stations.
Mr. Kang-Dong Hun, who is one of the KGAWC
members, participated in the 19th Greenhouse
Gases training course of GAWTEC, which was held
by GAWTEC (Global Atmosphere Watch Training &
Education Centre) on October 2010, for providing
scientific guidance and instructions to GAW station
personnel from worldwide global and regional
stations. He learned how to measure GHGs as well
as characteristics of various types of GHGs. Data
evaluation tools and data handing methods were
also introduced in the training course (Figure 4).
References KMA, 2010, Summary of Korea Global Atmosphere Watch 2009 Report, 8pp.
Figure 3. KGAWC participated in the Global Round
Robin held by WMO/CCL on October, 2010.
The 5 typesof greenhouse gases (CO2,
CH4, N2O, CO, SF6) were analyzed and the
results were submitted by KGAWC in the
world inter-comparison. The right is the
cover of the Summary of Korea Global
Atmosphere Watch 2009 report‟ published
by KMA/KGAWC in 2010.
Figure 4. The 19th GAWTEC training course on
Greenhouse Gases was held by
GAWTEC on October 17th-30th.

3 Asian GAW Greenhouse Gases Newsletter Volume No.1, December, 2010
JAPAN (Minamitorishima, Ryori, Yonagunijima)
SUDA Kazuto (Japan Meteorological Agency)
The Japan Meteorological Agency (JMA)
conducts observations of greenhouse and reactive
gases, the ozone layer, aerosols, precipitation
chemistry and radiation as part of worldwide
observation networks including the Global
Atmosphere Watch (GAW) and Baseline Surface
Radiation Network (BSRN). The stations include the
GAW Global Station at Minamitorishima, Regional
Stations at Ryori and Yonagunijima for greenhouse
gases (Figure 1).
The GAW Global Station at Minamitorishima is
located near the eastern coast of an isolated island
in the North Pacific Ocean formed by a coral reef
and with a coast line of about 5.5 km and an area
of about 1.4 km2 (Figure 2). The observations were
started for CO2 in 1993, extended for CH4, CO and
O3 in the following year. Access to the island is
limited to staff and visitors involved with JMA and
the Ministry of Defense, and the site, exposed to
the prevailing wind from the east, is free from local
sources of pollution and significant change in the
land use in the next several decades.
For ensuring quality assurance of observations
pursuant to the GAW standards, JMA maintains
standard references for CO2, CH4, N2O, CO and O3
that are traceable to the primary standards of the
respective WMO Central Calibration Laboratories
(CCLs) through regular calibrations. It also
participates in inter-laboratory comparison activities,
including the WMO Round-Robin Reference Gas
Intercomparison organized by NOAA and the
Methane Reference Gas Intercomparison organized
by the World Calibration Centre for methane (WCC)
at JMA.
Observational data obtained from JMA‟s network
of stations are reported to the data centres
established in GAW for different parameters; data
for greenhouse and reactive gases are submitted
to the World Data Centre for Greenhouse Gases
(WDCGG) operated by JMA in Tokyo
(http://gaw.kishou.go.jp/wdcgg/). Data are also
provided to the NOAA Earth System Research
Laboratory (ESRL) in Boulder, USA, for its
GLOBALVIEW projects for CO2 and CH4.
Keifu Maru
Yonagunijima
Tsukuba
Fukuoka
Ishigakijima
Naha
Minamitorishima
Ryofu Maru
Ryori
Sapporo
Greenhouse gases and aerosols
Greenhouse gases by ship
Solar and long wave radiation
Ozone layer (and UV-B radiation
only at Sapporo, Tsukuba and Naha)
Precipitation chemistry
Figure 1. Map of JMA‟s observation stations
MinamitorishimaGAW Global Station MinamitorishimaGAW Global Station
MinamitorishimaGAW Global Station
MinamitorishimaGAW Global Station
Figure 2. General views of Minamitorishima and the
GAW Global Station

4 Asian GAW Greenhouse Gases Newsletter Volume No.1, December, 2010
Figure 4. Long-term observation records of CO2 at
8–13 km from 30°N to 30°S by using
JAL airliners between Japan and Australia
(Machida et al., 2007).
JMA analyzes the data to be published in its
regular reports such as “Climate Change
Monitoring Report” and “Annual Report on
Atmospheric and Marine Environment Monitoring”
and its website (http://www.jma.go.jp/jma/
indexe.html), which include time-series plots of
concentrations and growth rates of greenhouse
gases (Figure 3). It also produces global
distribution maps for CO2 calculated by transport
and inverse models based on data provided
through the WDCGG, which are published on JMA‟s
website.
Besides the monitoring at fixed stations on land,
JMA has research vessels observing greenhouse
gases in the air and the seawater of the western
North Pacific. The Meteorological Research Institute
(MRI) has lead several research projects on
greenhouse gas monitoring, including radon-222
observation at JMA‟s greenhouse gas stations
(Wada et al., 2010) and the monitoring of
greenhouse gases in the upper troposphere at
altitudes of 8–13 km using commercial passenger
aircraft, with the collaboration of MRI, National
Institute for Environmental Studies (NIES), and
Japan Airlines (JAL) (Figure 4). The MRI and JMA
collaborate in the research and development of
new measurement technologies to be applied in
future operational projects. Currently, a new air
sampling project for greenhouse gases on board
aircraft between mainland Japan and
Minamitorishima is in a final test to be started in
early 2011.
References
Machida, T., H. Matsueda and Y. Sawa, 2007, IGAC Newsletter, issue No. 37, 23-30.
Wada et al., 2010, Journal of the Meteorological Society of Japan, 88, 123-134.
Figure 3. Time series of monthly mean
concentrations and growth rates of
atmospheric CO2 at JMA‟s stations

5 Asian GAW Greenhouse Gases Newsletter Volume No.1, December, 2010
Figure 1. Main building of Global GAW Station
Bukit Kototabang
INDONESIA (Bukit Kototabang) Alberth Christian Nahas (The Indonesia Agency of Meteorology Climatology and Geophysics)
INTRODUCTION
Global GAW Station Bukit Kototabang is located
in the equatorial zone (0.2 S and 100.3E) on the
ridge of high plateau (864.5 m a.s.l.) about 17 km
North of Bukittinggi and 120 km North of Padang,
the capital city of West Sumatra Province.
Surrounding condition is dominated with tropical
rainforest with minimum human activities which
are mainly from farming. The station can be
reached via small access road, about 3 km from
the main road between Padang and Medan.
Average temperature is 21.6°C and high humidity
that is ranging from 80-100% with average is
89.6%. Air pressure at the station is 917.6 hPa and
total annual rainfall is 2560 mm. Wind direction is
influenced by monsoon pattern. During summer
monsoon period, wind moves from South East
which brings air mass from Southern Indian Ocean
and Australia. Meanwhile, during winter monsoon
period, air mass comes from North East, bringing
air from Asia.
Greenhouse gases (GHGs) monitoring activity in
the station has been began in 2004. This
monitoring is a part of Global Air Sampling
Monitoring Network, with the collaboration
between Indonesia Agency for Meteorology
Climatology and Geophysics (BMKG) and National
Oceanic and Atmospheric Administration (NOAA) –
Earth System Research Laboratory (ESRL). Today,
the network consists of 65 cooperative fixed sites
and 2 commercial ships. Measurement of GHGs
concentration in Bukit Kototabang is conducted by
air flask sampling method. Sampled air conducted
on weekly-time base is collected in a pair of 2.5 L
flasks. Flasks are flushed and pressurized to ~1.2
atm with a portable sampler. Sampled flasks are
then shipped to NOAA ESRL for further analysis.
RESULT
Carbon Dioxide
Despite its small concentration in the
atmosphere (~0.04%), carbon dioxide (CO2) is of
the greatest concern because of its contribution to
the greenhouse effect and climate change (Jacob,
1999). CO2 concentration is steadily increasing
since the 18th century that has sparked several
debates among those who concern on this issue.
Because of its characteristic as a well-mixed gas in
the atmosphere, CO2 concentration trend is found
similar in almost every observation location in the
world. This increasing trend is also observed at
Bukit Kototabang as it is showed on Figure 2.

6 Asian GAW Greenhouse Gases Newsletter Volume No.1, December, 2010
Figure 2. CO2 concentration from the period
2004 - mid 2010
From the above figure, it can be seen that CO2
concentration is continuously increasing since the
beginning of measurement. From that figure, it
also can be found seasonal pattern of this gas.
There is a period, commonly found in the early
months of the year, when the concentration is
higher than other months. This is due to air mass
transport that is coming to the station. Because
the station is located almost on the equator line, it
receives both of Northern and Southern
Hemisphere influences. When air mass comes from
the Northern Hemisphere, the air mass brings
more polluted air to the station because most of
CO2 and other air pollution emission are greater
from this region. As the result, CO2 concentration
during this time is found higher. On the contrary,
when air mass comes from the Southern
Hemisphere, CO2 concentration observes lower
during this time. This is happened commonly in
the middle of the year.
CO2 annual average concentration in Bukit
Kototabang has been increasing from 373.1 ppm
in 2004 to 381.9 ppm in 2009. Average growth rate
for this period is ~1.8 ppm/year. Particularly for last
two years (2008 and 2009), CO2 growth rate was
~2.5 ppm, indicating higher CO2 being emitted on
these years. In 2010, however, CO2 growth rate for
first semester decreased to ~1.8 ppm. Heavy
precipitation in Indonesia and in Sumatra in
particular, is very likely affecting CO2 emission on
this year.
Methane
Methane (CH4) is the most abundance
hydrocarbon found in the atmosphere though its
concentration is very small (~0.00017%). Its
concentration has increased dramatically after
industrial revolution in 1750 to the early 1990‟s.
Since that, the concentration tended to be at
steady state (Dlugokencky et al., 2003). It was until
2007 that CH4 concentration started to increase
again. Several factors has been suggested for the
cause of this increasing such as high temperature
anomaly in the Arctic and high precipitation in the
tropics (Dlugokencky et al., 2010). Observation in
Bukit Kototabang showed a slight increasing of
CH4 concentration as it is seen on Figure 3 below.
CH4 shows a seasonal pattern with cause is very
likely the same of that influenced CO2
concentration. Its dependency with other gases
concentration is also affecting the variation. In the
early 2005, Indonesia was experienced severe
wildfires that were very likely enhancing CH4
emission. CH4 concentration on that time was
recorded as the highest concentration on the
period.
Figure 3. CH4 concentration from the period
20004 - mid 2010

7 Asian GAW Greenhouse Gases Newsletter Volume No.1, December, 2010
CH4 annual growth rate from the period 2004-
2009 is ~2.5 ppb/year. In the first semester of 2010,
CH4 growth rate jumped to ~18.3 ppb. However, it
can not be inferred as continuous trend because in
2009, CH4 growth rate decreased to ~0.1 ppb
lower than that of 2008. Fluctuation of CH4 growth
rate observed at Bukit Kototabang suggested that
CH4 emission is strongly influenced by local
condition.
Nitrous Oxide
Similar to CO2 and CH4, concentration of nitrous
oxide (N2O) measured at Bukit Kototabang is
continuously increasing. This trend is showed on
the Figure 4 below.
N2O concentration has increased from its initial
concentration of 319.1 ppb in 2004 to 323.1 ppb in
2009. Annual growth rate of this gas is ~0.8
ppb/year and this rate found almost consistent for
each year. Largest growth was measured in 2008
when N2O annual concentration increased about 1
ppb. In the first semester of 2010, N2O
concentration growth rate is ~0.7 ppb.
Sulfur Hexafluoride
Despite having the smallest concentration, sulfur
hexafluoride (SF6) concentration measured at Bukit
Kototabang has the largest increasing percentage.
It can be showed from Figure 5 that SF6
concentration increased from 5.43 ppt in 2004 to
6.73 ppt in 2009 or almost 24% higher than its
initial value. SF6 is one of gases that can not be
made by nature and its emission is entirely from
man-made activity.
Average annual growth rate of SF6 is ~0.26
ppt/year, with 2007 marked as the highest growth
rate recorded (~0.31 ppt). Meanwhile, growth rate
of this gas on the first semester of 2010 is ~0.24
ppt.
Near Real Time Monitoring of CO2, CH4, and H2O
Besides sampling, another method being used to
measure GHGs concentration at Bukit Kototabang
is Cavity Ring Down Spectrophotometry (CRDS).
Picarro Model G1301 is used to carry out this
measurement. There are three gases measured:
CO2, CH4, and water vapor (H2O). The
measurement was started in 2008 and in 2009,
calibration unit completed with standard gases had
been added. Unfortunately, as of May 2010, the
measurement was temporarily terminated due to
instrument failure. Instrument was sent back to the
manufacturer and it is expected that the
measurement will be start again in late 2010 or
early 2011. Data produced on the measurement
period were considered preliminary.
Figure 4. N2O concentration from the period
2004 - mid 2010
Figure 5. SF6 concentration from the period 2004
- mid 2010

8 Asian GAW Greenhouse Gases Newsletter Volume No.1, December, 2010
References
Jacob, D.J. 1999, Introduction to Atmospheric Chemistry. Princeton University Press, New Jersey.
Dlugokencky, E.J., S. Houweling, L. Bruhwiler, K.A. Masarie, P.M. Lang, J.B. Miller, and P.P. Trans. 2003, Atmospheric Methane Levels Off: Tempo.

9 Asian GAW Greenhouse Gases Newsletter Volume No.1, December, 2010
KOREA (Gosan)
Jooil Kim (Seoul National University)
Seoul National University operates measurements
of important greenhouse gases (GHGs) at Gosan,
located on the southwestern tip of Jeju Island
(Korea), with the purpose of identifying and
quantifying the outflow of pollution from East Asia,
where large emissions are expected from the
various industrial activities in this region. The remote
coastal location of Gosan allows for minimal effects
from any local pollution, and wind conditions
(northerly winds in the cold season, and southernly
winds in summer) are favorable for observing
pollution events from the surrounding regions.
The longest GHG measurement record at Gosan is
the CO2 monitoring program, based on flask
sampling and measurement in cooperation with the
Scripps CO2 program (http://scrippsco2.ucsd.edu/
research/atmospheric_co2.html) for measuring 12C,
13C, and 14C isotopes of atmospheric CO2. Since
November 2007, the flask measurements have been
reinforced with high-frequency measurements using
the LOFLO CO2 analyzer, developed at the Australian
Commonwealth Scientific and Research Organization
(CSIRO). Together, a detailed record is being
compiled of both the long and short term variability
in atmospheric concentrations of CO2 in East Asia.
Measurements of halogenated compounds
started at Gosan on November 2007 through the
Advanced Global Atmospheric Gases Experiment
(AGAGE, http://agage.eas.gatech.edu/). The “Medusa”
GC-MS system, developed in AGAGE, allows for
high-frequency measurements of almost all
halogenated compounds important in the Montreal
and Kyoto Protocols, at precisions better than 1% of
ambient concentrations. These measurements have
provided valuable insight into the emissions of
halogenated compounds in East Asia, and some of
the recent findings are summarized below.
Figure 1. CO2 Measurements at Gosan, Jeju Island (Korea)

10 Asian GAW Greenhouse Gases Newsletter Volume No.1, December, 2010
Figure 2. Emissions of halogenated compounds from China (Kim et al., 2010)
Recent analysis in Chinese emissions of
halogenated compounds at Gosan (Kim et al., 2010)
confirm that China is now a dominant emission
source of various anthropogenic halogenated
species, including CFCs, HCFCs, HFCs, PFCs, and SF6.
Of note, we find large emissions of some HFC
compounds which were known to be used mostly in
developed countries and not in China. Continued
monitoring and analysis of emissions from China
should show future changes in emission patterns as
China adapts to the Montreal, Kyoto and future
environmental protocols. Advanced inversion
modeling analysis of emissions using FLEXPART
came to similar conclusions (Stohl et al., 2010), as
well as revealing spatial information regarding the
emission sources of many compounds. These new
analysis methods should help provide a deeper
understanding of emission patterns and changes in
China as well as in all of East Asia.
A study of global historical SF6 emissions (Rigby et
al., 2010) performed with global measurements of
SF6 in both the AGAGE and National Oceanic and
Atmospheric Administration (NOAA) networks as
well as Gosan showed that the current discrepancy
in top-down and bottom-up emissions of SF6 are
likely to be explained by emissions in East Asia, and
calls for regional emission modeling efforts to
further verify the SF6 emissions in this region.
In conclusion, high-quality, high-frequency GHG
measurements at Gosan have been shown to be
useful in enhancing our understanding of GHG
emissions in this region. Measurements at Gosan
should continue to provide valuable information in
this regard, helping to better define the global
budgets of GHGs, and ultimately in helping the
global efforts to mitigate climate change.

11 Asian GAW Greenhouse Gases Newsletter Volume No.1, December, 2010
References
Kim, J., et al. 2010, Regional atmospheric emissions determined from measurements at Jeju Island, Korea: Halogenated compounds from China, Geophys. Res. Lett., 37(12), L12801.
Rigby, M., et al. 2010, History of atmospheric SF6 from 1973 to 2008, Atmos. Chem. Phys., 10, 10305-10320, doi:10.5194/acp-10-10305-2010.
Stohl, A., et al. 2010, Hydrochlorofluorocarbon and hydrofluorocarbon emissions in East Asia determined by inverse modeling, Atmos Chem Phys, 10(8), 3545-3560. doi:10.5194/acp-10-3545-2010.

Participants at the 2nd International Workshop in Jeju Island, Republic of Korea.

Asian GAW Greenhouse Gases Newsletter
Volume No.1
December, 2010