Embed Size (px)
Citation preview

0 0 M o n t h 2 0 1 8 | V o L 0 0 0 | n A t U R E | 1
LEttERdoi:10.1038/nature25465
Asparagine bioavailability governs metastasis in a model of breast cancerSimon R. V. Knott1,2,3*, Elvin Wagenblast2,4,5*, Showkhin Khan2,6, Sun Y. Kim2, Mar Soto2, Michel Wagner7, Marc-olivier turgeon7, Lisa Fish8,9,10, nicolas Erard1, Annika L. Gable2, Ashley R. Maceli2, Steffen Dickopf2, Evangelia K. Papachristou1, Clive S. D’Santos1, Lisa A. Carey11, John E. Wilkinson12, J. Chuck harrell13, Charles M. Perou14, hani Goodarzi8,9,10, George Poulogiannis7,15 & Gregory J. hannon1,2,6
Using a functional model of breast cancer heterogeneity, we previously showed that clonal sub-populations proficient at generating circulating tumour cells were not all equally capable of forming metastases at secondary sites1. A combination of differential expression and focused in vitro and in vivo RNA interference screens revealed candidate drivers of metastasis that discriminated metastatic clones. Among these, asparagine synthetase expression in a patient’s primary tumour was most strongly correlated with later metastatic relapse. Here we show that asparagine bioavailability strongly influences metastatic potential. Limiting asparagine by knockdown of asparagine synthetase, treatment with l-asparaginase, or dietary asparagine restriction reduces metastasis without affecting growth of the primary tumour, whereas increased dietary asparagine or enforced asparagine synthetase expression promotes metastatic progression. Altering asparagine availability in vitro strongly influences invasive potential, which is correlated with an effect on proteins that promote the epithelial-to-mesenchymal transition. This provides at least one potential mechanism for how the bioavailability of a single amino acid could regulate metastatic progression.
Most women with breast cancer do not succumb to their primary tumour but instead to metastases that become apparent after the primary lesion has been removed. For cells to contribute to metastases, they must leave the primary site, enter the vasculature, survive in the blood, and then extravasate and colonize secondary sites. Our previous studies of a mouse model of breast tumour heterogeneity identified two clonal 4T1 sub-lines with a strong propensity to form circulating tumour cells (CTCs) through a non-invasive mechanism requiring vascular mimicry (4T1-E and -T)1,2. These two clones differed in their ability to form metastases, with 4T1-T preferentially colonizing brain, liver, and lungs. The distinction between the metastatic potential of the two CTC-forming clones offered the opportunity to identify drivers of metastasis, which exert their effects late in metastatic progression.
To validate the observation that 4T1-T had greater metastatic poten-tial among CTC-proficient clones, we combined equal numbers of 4T1-E and -T cells and introduced these directly into the bloodstream of immune-compromised recipients (NOD-SCID-Il2rg−/− (NSG) mice). Although the two clones were initially present in equal abun-dance (Fig. 1a), when cells were collected from the lung at day 7, clone T predominated, with its relative representation being inversely correlated with the total number of cells injected.
We identified 192 genes with higher expression in 4T1-T than 4T1-E cells (Supplementary Table 1). Their corresponding Gene Ontology
terms were enriched for processes important for metastatic spread (Supplementary Table 2; for example, cell migration and locomotion). A retrospective analysis of patient data showed that genes within the set are more highly expressed in aggressive breast tumour subtypes3 (Extended Data Fig. 1a). They were also more highly expressed in the primary tumours of patients with later relapse to the bone, brain, and lungs compared with primary tumours of relapse-free survivors (Extended Data Fig. 1b for lung).
To identify metastatic drivers, we performed an RNA interference (RNAi) screen, with two arms (Fig. 1b). In total, 26 pools of approx-imately 40 short hairpin RNAs (shRNAs), targeting protein-coding members of the 192-gene set, were introduced into 4T1-T cells4. These were collected onto Matrigel or introduced into NSG mice by tail vein injection. After 24 h, the cells that had invaded through the Matrigel were collected and, after 7 days, lungs were collected from the mice. Using high-throughput sequencing, we identified shRNAs that were depleted from the invaded cell populations or lung metastases, pre-sumably because they targeted genes important for these processes. Strong overlap was observed when the in vitro and in vivo candidates were compared (Fig. 1c and Supplementary Table 3).
Of the 11 candidate genes that scored in both the in vitro and in vivo assays, asparagine synthetase (Asns) had the most robust clinical evidence supporting its relevance to disease progression (Extended Data Fig. 1c) Expression levels of the human orthologue, ASNS, were predictive of general and lung-specific relapse in two datasets of patients with breast cancer. Also, when a small collection of matched tumour and lung metastases were transcriptionally profiled, ASNS was found to be more highly expressed in secondary lesions. ASNS is more highly expressed in aggressive tumour subtypes (Extended Data Fig. 1d) and it is more highly expressed in patients with relapse to the lymph node, brain, liver, and lungs compared with relapse-free survivors (Extended Data Fig. 1e). Subsequent analyses identified ASNS as predictive of survival in three additional datasets of patients with breast cancer (Extended Data Fig. 1f). In addition to breast tumours, ASNS is negatively correlated with survival in four out of the ten other solid tumours in The Cancer Genome Atlas (TCGA) Pan-Cancer dataset (Extended Data Fig. 1g) and is a globally predictive biomarker for solid tumours (Extended Data Fig. 1h). Previous research has shown that asparagine is an important regulator of cellular metabolism and adaptation5,6.
To validate Asns as a metastatic driver, we infected 4T1-T cells with two shRNAs targeting Asns or a control and introduced these
1Cancer Research UK Cambridge Institute, University of Cambridge, Li Ka Shing Centre, Robinson Way, Cambridge CB2 0RE, UK. 2Watson School of Biological Sciences, Howard Hughes Medical Institute, Cold Spring Harbor Laboratory, 1 Bungtown Road, Cold Spring Harbor, New York 11724, USA. 3Center for Bioinformatics and Functional Genomics, Department of Biomedical Sciences, Cedars-Sinai Medical Center, 8700 Beverly Boulevard, Los Angeles, California 90048, USA. 4Princess Margaret Cancer Centre, University Health Network, University of Toronto, Toronto, Ontario M5G 1L7, Canada. 5Department of Molecular Genetics, University of Toronto, Toronto, Ontario M5G 1L7, Canada. 6New York Genome Center, 101 6th Avenue, New York, New York 10013, USA. 7Division of Cancer Biology, The Institute of Cancer Research, 237 Fulham Road, London SW3 6JB, UK. 8Department of Biochemistry and Biophysics, University of California, San Francisco, San Francisco, California 94158, USA. 9Department of Urology, University of California, San Francisco, San Francisco, California 94158, USA. 10Helen Diller Family Comprehensive Cancer Center, University of California, San Francisco, San Francisco, California 94158, USA. 11Division of Hematology and Oncology, University of North Carolina at Chapel Hill, 170 Manning Drive, CB7305, Chapel Hill, North Carolina 27599, USA. 12Department of Pathology, University of Michigan School of Medicine, Ann Arbor, Michigan 48109, USA. 13Department of Pathology, Virginia Commonwealth University, Richmond, Virginia 23284, USA. 14Department of Genetics and Pathology, Lineberger Comprehensive Cancer Center, University of North Carolina at Chapel Hill, Chapel Hill, North Carolina 27599, USA. 15Division of Computational and Systems Medicine, Department of Surgery and Cancer, Imperial College London, London SW7 2AZ, UK.*These authors contributed equally to this work.
© 2018 Macmillan Publishers Limited, part of Springer Nature. All rights reserved.

2 | n A t U R E | V o L 0 0 0 | 0 0 M o n t h 2 0 1 8
LetterreSeArCH
cells intravenously into NSG mice (Supplementary Table 4). Asns-silenced cells produced significantly fewer lung metastases (Fig. 2a and Extended Data Fig. 2a). Asns-silenced cells also showed poor invasion into Matrigel (Fig. 2b and Extended Data Fig. 2b). Silencing Asns did affect proliferation in vitro; however, this defect was minor compared with that observed in the invasion assay (Extended Data Fig. 2c, d). Intracellular free asparagine was reduced by silencing of Asns in 4T1- T cells (Extended Data Fig. 2e), and the abilities to invade and proliferate were increased in Asns-silenced cells when the culture medium was supplemented with asparagine (Extended Data Fig. 2f, g).
When Asns-silenced cells were injected into the mammary fat pad, no significant change in primary tumour formation was observed (Fig. 2c), yet CTCs and lung metastases were reduced (Fig. 2d, e). Although statistically insignificant, metastases initiated by silenced cells were noticeably smaller, hinting at a growth defect at the metastatic site (Fig. 2f). Similar results were obtained with Asns-silenced parental 4T1 cells, indicating that Asns dependency is not a peculiarity of a single clonal line (Extended Data Fig. 3a, b). Enforced Asns expression in parental 4T1 populations did not affect primary tumour growth but did increase metastases both in number and in size (Extended Data Fig. 3c–e). Similar outcomes were observed upon enforced ASNS expression in human MDA-MB-231 breast cancer cells (Extended Data Fig. 3f–i).
To determine whether the observed effects were unique to aspar-agine, we supplemented the medium separately with other non- essential amino acids (NEAAs) lacking in the culture medium, or with glycine, which is present and acted as a negative control, and assayed cells for invasiveness. 4T1 cells responded uniquely to asparagine sup-plementation, with an approximately twofold increase in invasiveness (Fig. 3a), although levels of uptake were similar for each of the amino acids with the exception of aspartic and glutamic acids (Extended Data Fig. 4a). More profound effects were observed with MDA-MB-231 cells (Extended Data Fig. 4b, c). Growth was not affected by asparagine sup-plementation for either cell line during the same period (Extended Data Fig. 4d, e).
Because invasiveness could be modulated either by altering aspar-agine biosynthetic capacity or by modifying extracellular pools, we investigated whether metastasis could be influenced by treatment with l- asparaginase. This enzyme is used to treat acute lymphoblastic leukaemia, which is generally highly dependent on extracellular asparagine7,8. l-Asparaginase has proved ineffective for treating solid tumours, consistent with Asns silencing not affecting growth at the primary site9. NSG mice harbouring orthotopic 4T1 tumours were treated with 60 U l-asparaginase 5 times per week for 19 days, reducing serum asparagine to undetectable levels (Supplementary Table 5). Although no significant difference was detected in primary tumours, compared with controls, a reduction in metastasis was observed (Extended Data Fig. 5a–c).
In TEL-AML1-negative patients with acute lymphoblastic leukaemia, resistance to l-asparaginase is thought to be achieved through increased biosynthetic production of asparagine10. When Asns-silenced cells were injected orthotopically into mice treated with l-asparaginase, metastases were nearly undetectable (Fig. 3b and Extended Data Fig. 5d). In this case, a reduction of primary tumour volume was also observed (Extended Data Fig. 5e). Similar results were obtained with ASNS-silenced MDA-MB-231 cells (Extended Data Fig. 5f, g).
The availability of extracellular asparagine can also be manipu-lated by altering asparagine levels in the diet. shRNA-infected 4T1-T cells were orthotopically injected into mice that received a control, low-asparagine, or high-asparagine chow (0.6%, 0%, and 4%, respectively). High-performance liquid chromatography (HPLC)
0102030405060708090
100
Clo
ne r
epre
sent
atio
n (%
)
4T1-
T
4T1-
E
Pre-inj
ectio
nLu
ng
500,
000
cells Lu
ng
50,0
00 ce
lls Lung
5,00
0 ce
lls Lung
500
cells
a 4T1-E4T1-T
Depleted in vitroDepleted in vivo
b
4T1-T cells
Infection+
selection
shRNAs
+
Tail vein
Matrigel
11
31
12
Invasion
Metastasis
c
Figure 1 | Identification of metastatic drivers. a, Relative proportions of 4T1-E and -T cells extracted from the lungs of NSG mice, into which mixtures of cells were introduced via tail vein at different concentrations. Each bar represents a sample or independent mouse. b, RNAi screening scheme to identify drivers of invasion in vitro and extravasation and colonization in vivo (n = 5 mice or n = 2 Matrigel six-well invasion chambers per approximately 50-construct shRNA pool, gene-level hit calls with empirical Bayes-moderated t-test false discovery rate < 0.05 and 0.1 for in vivo and in vitro screens, respectively). c, Overlap between genes identified in each arm of the RNAi screen depicted in b (hypergeometric test P < 0.01).
Num
ber
of l
ung
met
asta
ses
d
0
0.05
0.10
0.15
0.20
0.25
0.30
4
6
8
10
12
14
16
18
20
Num
ber
of l
ung
met
asta
ses
Rel
ativ
e C
TC a
bun
dan
ce
shRen
illa
shAsn
s-1
shAsn
s-2
shRen
illa
shAsn
s-1
shAsn
s-2
shRen
illa
shAsn
s-1
shAsn
s-2
shRen
illa
shAsn
s-1
shAsn
s-2
shRen
illa
shAsn
s-1
shAsn
s-2
ca
shR
enill
ash
Asn
s-1
shA
sns-
2
b
50
100
150
200
250
Tum
our
volu
me
(mm
3 ) 300
7 days14 days
fe
120
140
160
180
220
240
Dia
met
er o
f met
asta
ses
(μm
)
200
5
10
15
20
25
30
35
Figure 2 | Validation of Asns as a driver of invasion and metastasis. a, Quantification of metastases in the lungs of mice intravenously injected with Asns-silenced or -expressing 4T1-T cells (n = 10 mice per cell line, edges of the box are the 25th and 75th percentiles, and error bars extend to the values q3 + w(q3 − q1) and q1 − w(q3 − q1), in which w is 1.5 and q1 and q3 are the 25th and 75th percentiles, which is also true for d–f, rank-sum test P < 0.001). b, Representative images of collection wells of the Matrigel assay after Asns-silenced and -expressing cells were applied 24 h previously (n = 3 invasion chambers per cell line). c, Tumour volumes resulting from the orthotopic injection of the cells described in a (n = 10 mice per cell line). d, Relative abundance of CTCs in animals corresponding to the tumours described in c (n = 6 mice per cell line, rank-sum P < 0.05 for shAsns-2). e, Quantification of metastases in H&E-stained lung sections, from mice described in d (rank-sum P < 0.0002). f, Average diameters of the metastases of each mouse described in e. See Source Data.
© 2018 Macmillan Publishers Limited, part of Springer Nature. All rights reserved.

0 0 M o n t h 2 0 1 8 | V o L 0 0 0 | n A t U R E | 3
Letter reSeArCH
confirmed that serum asparagine levels were significantly altered in concordance with dietary intake (Extended Data Fig. 6a). Asparagine restriction did not affect primary tumour growth, regardless of Asns expression status (Extended Data Fig. 6b). By contrast, metastatic burden was decreased in animals that were fed low-asparagine diets and increased in animals given high-asparagine diets (Fig. 3c and Extended Data Fig. 6c). Metastases were nearly undetectable in mice that were injected with Asns-silenced cells and fed a low-asparagine diet. Similar results were obtained when parental 4T1 cells were ortho-topically injected into animals fed these same asparagine-controlled diets (Extended Data Fig. 6d–f).
Analyses of the mammary gland, serum, and lungs of mice by mass spectrometry suggested that, under normal physiological conditions, asparagine levels are highest in mammary gland and lowest in serum (Fig. 3d). High asparagine availability in the mammary gland might blunt the effect of Asns silencing or changes in global asparagine lev-els on primary tumour growth, whereas low levels in the serum may make CTCs susceptible to these manipulations. Overall, asparagine abundance in tissues correlated with Asns expression (Extended Data Fig. 6g). ASNS expression levels follow a similar pattern across human tissues (Extended Data Fig. 6h), raising the possibility of similar effects if asparagine levels were altered in patients11.
To understand the mechanism by which asparagine availability might affect invasion and metastasis, we examined expression changes
induced by Asns silencing, at both the RNA and protein levels. RNA measurements were the strongest predictor of protein-level changes (Extended Data Fig. 7a). Consistent with a previous report of transla-tional pausing at asparagine residues in l-asparaginase-treated cells, we also found asparagine content to be predictive of corresponding protein-level changes12 (Extended Data Fig. 7a), irrespective of whether they were normalized for RNA levels (Extended Data Fig. 7b).
Among the asparagine-enriched proteins that were depleted on Asns silencing, we found genes whose human orthologues were upregu-lated after induction of the epithelial-to-mesenchymal transition (EMT)13 (Fig. 4a, Extended Data Fig. 7c and Supplementary Table 6; EMT-up proteins). Overall, depleted proteins had 10% higher aspara-gine content than the analysed proteome as a whole, whereas EMT-up proteins had 19% higher asparagine content (Extended Data Fig. 7c). Human EMT-up proteins were also asparagine-enriched (Extended Data Fig. 7c). A re-analysis of existing ribosomal profiling data revealed high rates of pausing at asparagine residues within EMT-up
0
10
20
30
40
50
Inva
sion
ind
ex
0 0.6 40
5
10
15
20
30
25
Num
ber
of l
ung
met
asta
ses
shRenilla
shAsns-2shAsns-1
0
2
4
6
8
10
106
× A
spar
agin
e p
eak
area
L-as
par
agin
ase
shAsns-1 shAsns-2shRenilla
PB
S
PBSL-asparagine
b
Dietary asparagine content (%) Lung
Serum
Mam
mar
y
gland
dc
No PGD NA EAmino acid
a
Figure 3 | Extracellular asparagine availability drives invasion and metastasis. a, Quantification of parental 4T1 cell invasion rates, as measured by the Matrigel invasion assay, in culture medium supplemented with the indicated NEAAs (n = 5 invasion chambers, rank-sum P < 0.01). b, Representative H&E-stained lung sections from animals injected with Asns-silenced or -expressing 4T1-T cells. Animals were administered l-asparaginase or PBS (n = 10 mice per condition). c, Quantification of lung metastases in animals injected with Asns-silenced or -expressing 4T1-T cells. Animals were administered a diet with either 0%, 0.6%, or 4% asparagine content for the duration of the experiment (n = 10 mice per condition, rank-sum P < 0.05 for Asns-silenced versus -expressing cells across all diets, for each cell line with 0% versus 4% diets, for shRenilla and shAsns-1 infected cells with 0% versus 0.6% diet, and for unsilenced cells with 0.6% versus 4% diet). d, Mass-spectrometric quantification of the asparagine levels in the mammary gland, blood serum, and lungs of animals administered l-asparaginase or PBS (relative abundance normalized by total metabolite peak area, n > 8 tissue sections per condition, rank-sum P < 0.005 for PBS versus l-asparaginase across all tissues, rank-sum P < 0.05 for mammary gland versus lung, and rank-sum P < 0.0005 for serum versus lung and serum versus mammary gland). See Source Data.
0
0.8
0.8
0.4
0.4
Pro
tein
ab
und
ance
(z-s
core
)
b
1.32
g l–1
shAsns-2shAsns-1shRenilla
Twis
t1C
dh1
eEMT-upEMT-down
Cdh1Twist1
–4
–3
–2
–1
0
1
2
3
4
5
log 2(
Asn
s-si
lenc
ed/A
sns-
exp
ress
ing)
Tumour Lung
d
shAsn
s-1
shRen
illa
–1
0
1
Pro
tein
ab
und
ance
(z-s
core
)
a
–2
–1
0
1
2
3
4
5
6
7
Exp
ress
ion
(log 2(
met
asta
ses/
tum
our)
)
shAsn
s-2
EMT-
up
EMT-
down
c
0 g
l–1
100 μm
Figure 4 | Asparagine availability regulates EMT. a, Relative protein abundances of EMT-up proteins in Asns-silenced and -expressing 4T1- T cells (n = 3 replicates per cell line, edges of the box are the 25th and 75th percentiles, and error bars extend to the values q3 + w(q3 − q1) and q1 − w(q3 − q1), in which w is 1.5 and q1 and q3 are the 25th and 75th percentiles, which is also true for b–d, rank-sum P < 0.01). b, Relative protein abundances of EMT-up proteins in 4T1-T cells when grown in normal and asparagine-supplemented medium (n = 3 replicates per cell line, rank-sum P < 0.05). c, Relative expression levels of EMT-up and -down genes in lung metastases versus primary tumours derived from orthotopic injection of 4T1-T cells (n = 4 mice, rank-sum P < 5.0 × 10⁻⁹ for EMT-up genes). d, Relative expression levels of Twist1, Cdh1, and EMT-up and -down genes in cells isolated from tumours and lungs derived from Asns-silenced versus -expressing 4T1-T cells (n = 4 replicates per condition, rank-sum P < 5.0 × 10⁻¹¹ for EMT-down genes in the tumour and rank-sum P < 5.0 × 10⁻⁸ for EMT-up genes in the lung; Cdh1 was differentially expressed in the tumours and lungs, and Twist1 was differentially expressed in tumours; DESeq false discovery rate < 0.05). e, Representative images of immunohistochemistry (IHC) stainings for Twist1 and Cdh1 in orthotopic tumours derived from Asns-silenced and -expressing 4T1-T cells. See Source Data.
© 2018 Macmillan Publishers Limited, part of Springer Nature. All rights reserved.

4 | n A t U R E | V o L 0 0 0 | 0 0 M o n t h 2 0 1 8
LetterreSeArCH
genes in l-asparaginase-treated human prostate cancer cells (Extended Data Fig. 7d, e), and these same proteins increased in expression when 4T1-T cells were cultured in elevated asparagine12 (Fig. 4b). Asparagine enrichment is a globally conserved property of EMT-up proteins, with enrichment being greatest in mammals (Extended Data Fig. 8).
EMT-up genes were also downregulated at the transcriptional level in Asns-silenced cells, and they were increased in their RNA levels when these cells were grown in asparagine-supplemented medium (Extended Data Fig. 9a, b). A re-analysis of existing data also showed reduced expression of EMT-up genes when ATF4, which regulates ASNS transcription, was deleted in haploid cells (Extended Data Fig. 9c), and liver cells from l-asparaginase-treated ATF4-knockout mice were more perturbed in their EMT program than were simi-larly treated wild-type mice (Extended Data Fig. 9d)14,15. Considered together, these data suggest that asparagine bioavailability might affect metastasis, at least in part, through regulation of EMT.
To examine the role of EMT in metastasis in our model, we orthotopi-cally injected 4T1-T cells in which we had silenced expression of trans-forming growth factor-β (Tgf-β , also known as Tgfb1), a key driver of EMT16 (Supplementary Table 4). Primary tumour growth was unaffected by this manipulation (Extended Data Fig. 9e); however, the expression of two prototypical EMT markers (Twist1 and E-cadherin) were altered to indicate a perturbed EMT program (Extended Data Fig. 9f, g). Tgf-β - silenced cells produced fewer metastases from the primary tumour or when intravenously injected (Extended Data Fig. 9h, i).
Although no differences were detected in haematoxylin and eosin (H&E)-stained tumour sections, morphological distinctions were noticeable when shRNA-infected 4T1-T cells were isolated from primary tumours by 6-thioguanine selection, with most Asns-silenced cells displaying an epithelial morphology (Extended Data Fig. 10a, b). Most 6-thioguanine-isolated metastatic cells displayed a mesenchymal morphology, regardless of Asns expression status, and this was matched by an increase in the expression of EMT-up genes (Fig. 4c). Nevertheless, EMT-up genes were downregu-lated in Asns-silenced versus -expressing metastatic cells, indicat-ing an increased representation of epithelial cells in the silenced populations. Similarly, EMT-down genes were upregulated, and Twist and E-cadherin expression measurements indicated a higher epithelial representation in Asns-silenced primary tumour cell popu-lations (Fig. 4d). These results were validated by qPCR for Twist and E-cadherin in Asns-silenced and -expressing cells that were isolated by fluorescence-activated cell sorting from primary and secondary lesions (Extended Data Fig. 10c, d).
Staining for Twist and E-cadherin proteins confirmed that EMT is perturbed in Asns-silenced tumours, and this same pattern was observed in the corresponding metastases (Fig. 4e and Extended Data Fig. 11a–c). Similar patterns were observed in the primary tumours of mice that had been treated with l-asparaginase (Extended Data Fig. 11d, e) or subjected to dietary asparagine restriction (Extended Data Fig. 11f, g).
Our model of breast tumour heterogeneity has strongly implicated asparagine bioavailability as a regulator of metastatic progression. This also seems to be relevant in human cancers, as high ASNS expression is a marker of poor prognosis for many tumour types. One mecha-nism underlying our findings is a probable link between asparagine bioavailability and EMT, which can be observed in vitro and in vivo. In our breast cancer model, the gating step probably occurs in the cir-culation, where asparagine levels are low and are strongly affected by either l-asparaginase treatment or dietary restriction. Nonetheless, we do see effects on ratios of epithelial- to mesenchymal-like tumour cells at the primary and secondary sites, which could also affect both tumour progression and response to therapy.Online Content Methods, along with any additional Extended Data display items and Source Data, are available in the online version of the paper; references unique to these sections appear only in the online paper.
received 5 July 2016; accepted 15 December 2017.
Published online 7 February 2018.
1. Wagenblast, E. et al. A model of breast cancer heterogeneity reveals vascular mimicry as a driver of metastasis. Nature 520, 358–362 (2015).
2. Miller, F. R., Miller, B. E. & Heppner, G. H. Characterization of metastatic heterogeneity among subpopulations of a single mouse mammary tumor: heterogeneity in phenotypic stability. Invasion Metastasis 3, 22–31 (1983).
3. Harrell, J. C. et al. Genomic analysis identifies unique signatures predictive of brain, lung, and liver relapse. Breast Cancer Res. Treat. 132, 523–535 (2012).
4. Knott, S. R. V. et al. A computational algorithm to predict shRNA potency. Mol. Cell 56, 796–807 (2014).
5. Zhang, J. et al. Asparagine plays a critical role in regulating cellular adaptation to glutamine depletion. Mol. Cell 56, 205–218 (2014).
6. Krall, A. S., Xu, S., Graeber, T. G., Braas, D. & Christofk, H. R. Asparagine promotes cancer cell proliferation through use as an amino acid exchange factor. Nat. Commun. 7, 11457 (2016).
7. Richards, N. G. & Schuster, S. M. Mechanistic issues in asparagine synthetase catalysis. Adv. Enzymol. 72, 145–198 (1998).
8. Richards, N. G. J. & Kilberg, M. S. Asparagine synthetase chemotherapy. Annu. Rev. Biochem. 75, 629–654 (2006).
9. Tallal, L. et al. E. coli l-asparaginase in the treatment of leukemia and solid tumors in 131 children. Cancer 25, 306–320 (1970).
10. Stams, W. A. G. et al. Asparagine synthetase expression is linked with l-asparaginase resistance in TEL-AML1-negative but not TEL-AML1-positive pediatric acute lymphoblastic leukemia. Blood 105, 4223–4225 (2005).
11. GTEx Consortium et al. Genetic effects on gene expression across human tissues. Nature 550, 204–213 (2017).
12. Loayza-Puch, F. et al. Tumour-specific proline vulnerability uncovered by differential ribosome codon reading. Nature 530, 490–494 (2016).
13. Taube, J. H. et al. Core epithelial-to-mesenchymal transition interactome gene-expression signature is associated with claudin-low and metaplastic breast cancer subtypes. Proc. Natl Acad. Sci. USA 107, 15449–15454 (2010).
14. Gowen, B. G. et al. A forward genetic screen reveals novel independent regulators of ULBP1, an activating ligand for natural killer cells. eLife 4, 1876 (2015).
15. Al-Baghdadi, R. J. T. et al. Role of activating transcription factor 4 in the hepatic response to amino acid depletion by asparaginase. Sci. Rep. 7, 1272 (2017).
16. McEarchern, J. A. et al. Invasion and metastasis of a mammary tumor involves TGF-β signaling. Int. J. Cancer 91, 76–82 (2001).
Supplementary Information is available in the online version of the paper.
Acknowledgements This work was performed with assistance from CSHL Shared Resources, which are funded, in part, by the Cancer Center Support Grant 5P30CA045508. We thank M. Mosquera, M. Cahn, J. Coblentz, and L. Bianco for support with mouse work; K. Cheng, J. Bourbonniere, D. Hoppe, A. Nourjanova, and R. Puzis for support with histology; E. Hodges and E. Lee for support with next-generation sequencing; and J. Johnson for assistance with HPLC. This work was also performed with the assistance of the Cancer Research UK, Cambridge Institute Proteomics Core Facility. S.R.V.K. is supported by a fellowship from The Hope Funds for Cancer Research. E.W. is supported by a long-term fellowship from the Human Frontier Science Program. L.A.C. is supported by the Susan G. Komen Foundation (SAC110006) and the NCI Breast SPORE program (P50-CA58223-09A1). J.C.H. and C.M.P. are supported by funds from the NCI Breast SPORE program (P50-CA58223-09A1), the Breast Cancer Research Foundation, and the Triple Negative Breast Cancer Foundation. H.G. is supported by a grant from the National Institutes of Health (NIH) (NCI R00 CA194077). Work in the G.P. laboratory is supported by the Institute of Cancer Research, London and a Cancer Research UK grand challenge award (C59824/A25044). G.J.H. is the Royal Society Wolfson Research Professor and is supported by core funding from Cancer Research UK, by a Program Project grant from the NIH (5 P01 CA013106-44), and by a grant from the Department of Defense Breast Cancer Research Program (W81XWH-12-1-0300).
Author Contributions S.R.V.K., E.W., and G.J.H. conceived the project, supervised research, and wrote the paper. S.R.V.K. and E.W. analysed experiments. S.R.V.K., E.W., S.K., S.Y.K., and M.S. performed in vitro and in vivo experiments. N.E., A.L.G., A.R.M., and S.D. assisted with virus production, shRNA cloning, and library preparation. L.A.C., J.C.H., and C.M.P. assisted with human expression data. J.E.W. performed histological analyses. E.K.P. and C.S.D. assisted with proteomic analyses. L.F. and H.G. assisted with ribosomal profiling analyses. M.W., M.T., and G.P. performed metabolite profiling experiments.
Author Information Reprints and permissions information is available at www.nature.com/reprints. The authors declare competing financial interests: details are available in the online version of the paper. Readers are welcome to comment on the online version of the paper. Publisher’s note: Springer Nature remains neutral with regard to jurisdictional claims in published maps and institutional affiliations. Correspondence and requests for materials should be addressed to G.J.H. ([email protected]).
reviewer Information Nature thanks R. Agami and the other anonymous reviewer(s) for their contribution to the peer review of this work.
© 2018 Macmillan Publishers Limited, part of Springer Nature. All rights reserved.

Letter reSeArCH
MethODSCell culture. The mouse mammary tumour cell line 4T1 (American Type Culture Collection, ATCC) and any derived clonal cell line were cultured in DMEM high glucose supplemented with 5% fetal bovine serum, 5% fetal calf serum, MEM NEAA, and penicillin–streptomycin (Thermo Fisher Scientific). The human breast tumour cell line MDA-MB-231 (ATCC) was cultured in DMEM high glucose supplemented with 10% fetal bovine serum, NEAA and penicillin–streptomycin (Thermo Fisher Scientific). The 4T1 and MDA-MB-231 cell lines were tested and authenticated by ATCC. The Platinum-A (Cell BioLabs) and 293FT (Thermo Fisher Scientific) packaging cell lines for virus production were cultured in DMEM high glucose supplemented with 10% fetal bovine serum and penicillin–streptomycin. All cell lines were routinely tested for mycoplasma contamination.Virus production. Retroviral vectors were packaged using the Platinum-A (Cell BioLabs) cell line and lentiviral vectors were packaged using the 293FT cell line (Thermo Fisher Scientific) as previously described1.Animal studies. All mouse experiments were approved by the Cold Spring Harbour Animal Care and Use Committee. The maximal permitted tumour size of 20 mm in any direction was never exceeded. All mouse injections were performed with 6- to 8-week-old female NOD-SCID-Il2rg−/− (NSG) mice (JAX). Balb/c mice were not used in this study as the different clonal cell lines have variable GFP levels due to the lentiviral barcode vector. Tail vein injections were performed using 5 × 10⁵ mouse mammary tumour cells, which were re-suspended in 100 μ l of PBS and injected via the tail vein. Orthotopic injections were performed using 1 × 10⁵ mouse mammary tumour cells or 5 × 10⁵ MDA-MB-231 cells. For this, cells were re-suspended in a 1:1 mix of PBS and growth-factor-reduced Matrigel (BD Biosciences). A volume of 20 μ l was injected into mammary gland number 4 for mouse mammary tumour cells and a volume of 40 μ l was injected for MDA-MB-231 cells. Primary tumour volume was measured using the formula V = ½(L × W2), in which L is length and W is width of the primary tumour. For l- asparaginase studies, mice were administered 200 μ l of 60 U l- asparaginase (Abcam) five times per week through intraperitoneal injections. For l- asparagine-adjusted diets, mice were given a control amino-acid diet (0.6% asparagine), an asparagine-deficient diet (0% asparagine), or an asparagine-rich diet (4% asparagine). All diets were isonitrogenous and contained similar calorie densities. Sample size was chosen to give sufficient power for calling significance with standard statistical tests. Tumour and metastasis experiments were performed with ten animals per condition to account for the variability observed in such in vivo experiments. Animals were assigned to treatment groups through random cage selection. Mice were excluded from the analysis if the primary tumour engrafted into the peritoneum. All image quantifications were performed in a blinded manner. Source data are available for tumour volume measurements and lung metastases.Barcode analysis. The barcodes of the 4T1-E and 4T1-T cells were amplified and sequenced as previously described1.In vivo shRNA lung screen and in vitro invasion screen. shRNAs were predicted on the basis of the Sherwood algorithm described in ref. 4. Pools of approximately 50 shRNAs were packaged in Platinum-A cells. For each pool, 10 million 4T1- T cells were infected at a multiplicity of infection of 0.3. The infected cells were selected with 500 μ g ml−1 hygromycin for 5 days and each pool was injected into five mice each via the tail vein. Two pre-injection pools were collected at the time of injection. After 7 days, mice were euthanized and perfused with PBS to remove blood and non-extravasated cells from the lungs. Lungs were collected and genomic DNA was isolated using phenol chloroform extraction. Genomic DNA of the pre- injection pools was isolated using a QIAamp DNA Blood Mini Kit (Qiagen).
The in vitro invasion assays were performed in parallel. Each pool was plated on two six-well BioCoat Matrigel invasion plates (Corning). Six hundred thousand cells were plated on top of each well in cell culture medium without serum. Cells were allowed to invade through the Matrigel into medium containing 5% fetal bovine serum and 5% fetal calf serum for 24 h. Invaded cells were scraped off, washed with PBS, and genomic DNA was isolated using a QIAamp DNA Blood Mini Kit.
The shRNAs were amplified using a two-step PCR protocol previously described in ref. 4 for next-generation sequencing.
First PCR forward primer 1: 5-CAG AAT CGT TGC CTG CAC ATC TTG GAA AC-3 and reverse primer 1: 5-CTG CTA AAG CGC ATG CTC CAG ACT GC-3.
Second PCR forward primer 2: 5-AAT GAT ACG GCG ACC ACC GAG ATC TAC ACT AGC CTG CGC ACG TAG TGA AGC CAC AGA TGT A-3 and reverse primer 2: 5-CAA GCA GAA GAC GGC ATA CGA GAT NNN NNN GTG ACT GGA GTT CAG ACG TGT GCT CTT CCG ATC TCT GCT AAA GCG CAT GCT CCA GAC TGC-3. The reverse primer contained a barcode (NNNNNN) that enabled multiplexing.Analysis of screening data. shRNA quantification was performed as previously described4. For each pool, shRNA quantities in each sample were normalized by their sum and log-fold changes were calculated using the initially infected cell
population as a reference. Fold change values for each pool were then consolidated into a single table and an empirical Bayes-moderated t-test was applied to identify depleted molecules. Genes with two or more depleted shRNAs were considered hits in each screen.Gene Ontology enrichment analysis. Gene Ontology enrichment analysis used the GOrilla web portal17. The Refseq identifiers of genes identified as overexpressed in 4T1-T cells, compared with 4T1-E cells, were used as foreground and the entire Refseq gene list was used as background.Expression subtype and relapse analysis. For all clinical data analysis, we used the University of North Carolina ‘855 patient set’, which is available as published data at https://genome.unc.edu. All data were derived from an initial matrix that was arranged with patients on the horizontal axis and genes on the vertical axis. Initial normalization involved quantile normalization to ensure that the global expression profile of each patient was similar. Following this, each gene was z-score normalized across patients. For Extended Data Fig. 1a, the average expression level of each gene was calculated for each patient subtype. For Extended Data Fig. 1b, the average expression level of each gene was calculated for each gene for patients with and without relapse to each secondary site. For Extended Data Fig. 1d, the level of ASNS in each patient, stratified by subtype, is plotted. For Extended Data Fig. 1e, each boxplot represents the level of ASNS in each patient with and without relapse to each secondary site.Individual in vitro invasion assay. The in vitro invasive capacity of cells was meas-ured using six-well BioCoat Matrigel invasion plates. For parental 4T1 cells, 1 × 10⁶ cells were plated on individual wells; for 4T1-T cells, 8 × 10⁵ cells were plated on individual wells; and for MDA-MB-231 cells, 5 × 10⁵ cells were used per indivi-dual well. Cells were re-suspended in medium without serum or NEAA and cells invaded into medium with 5% fetal bovine serum and 5% fetal calf serum. For Fig. 3a and Extended Data Fig. 4b, 4T1 and MDA-MB-231 cells were cultured in medium containing 100× concentration of the specified amino acid (relative to the concentration achieved by supplementing the medium with 1× NEAA) for 2 or 3 days, respectively, before starting the invasion assay. After 24 h, non-invaded cells were removed and the invasion wells were washed in PBS, fixed in 2% glu-taraldehyde for 2 min, and stained with 0.5% crystal violet for 10 min. The wells were washed in distilled H2O, air-dried, and scanned using an Odyssey infrared scanner. The signal was quantified using ImageJ (NIH).Competition and proliferation assay. For Extended Data Fig. 2c, d, cells were grown in medium lacking NEAA. For the mCherry competition assay, shRNA- transduced mCherry-positive cells were admixed with untransduced cells. mCherry fluorescence was quantified on an LSR II flow cytometer (BD Biosciences). The proliferation assay was performed using a CellTrace Violet Cell Proliferation Kit (Thermo Fisher Scientific). For Extended Data Fig. 4d, e, 4T1 and MDA-MB-231 cells were cultured in medium containing 100× concentra-tion of the specified amino acid (relative to the concentration that is achieved by supplementing the medium with 1 × NEAA) for 2 or 3 days, respectively, before starting the proliferation assay. Cells were stained with CellTrace violet and then trypsinized and re-suspended in the medium. After 24 h, cells were collected to quantify violet fluorescence intensity using an SH800 flow cytometer (Sony).Isolation of tumour and lung metastatic cells. Tumour and lung tissues were collected, minced, and digested into single cells as previously reported1. Cells were either grown in 4T1 cell culture medium containing 60 μ M 6-thioguanine to deplete stromal cells or directly sorted on the basis of mCherry expression using the FACSAria III cell sorter (BD Biosciences).RNA sequencing library preparation. RNA sequencing libraries from cultured 4T1-T cells were prepared as previously described1. Each sample was sequenced on an Illumina HiSeq sequencer generating 76-nucleotide single-end reads.RNA sequencing analysis. Illumina sequencing reads were aligned to the mouse genome (mm10) using Bowtie2 with default parameters18. Genes were assigned a count using HTseq-count, and differential expression analysis was performed using DESeq19,20.shRNA knockdown and cDNA overexpression studies. Mouse and human cell lines were transduced with shRNA expressing retroviral or lentiviral constructs, respectively. After infection, 4T1-T cells were selected with 500 μ g ml−1 hygromycin for 5 days and MDA-MB-231 cells were selected with 2 μ g ml−1 puromycin for 4 days. Cell lines infected with cDNA overexpressing retroviral constructs were selected with G418 for 1 week. The parental 4T1 cell line was selected with 600 μ g ml−1 G418 and MDA-MB-231 cells were selected with 1,500 μ g ml−1 G418.cDNA overexpression genes. Mouse Asns: NM_012055.1. Human ASNS: NM_001673.2.shRNA knockdown sequences. Mouse s hA sn s-1: T GC TG TT GA CA GT GA GC GC C A CT GC CA AT AA GA AA GT AT AT AG TG AA GC CA CA GA TG TA TA TA CT TTCT TATTGGCAGTGTTGCCTACTGCCTCGGA.
Mouse s hA sn s-2: T GC TG TT GA CA GT GA GC GC CA CT AT GA AG TT TT GG A T TT AT AG TG AA GC CA CA GA TG TA TA AA TC CAAAACTTCATAGTGTTGCC TACTGCCTCGGA.
© 2018 Macmillan Publishers Limited, part of Springer Nature. All rights reserved.

LetterreSeArCH
Mouse shTgfb1-1: T G C TG T T GA C A GT G A GC G C CA G T AT A T A T A T GT T C TT C A AT A G TG A A GC C A CA G A TG T A TT GA AG AACATATATATAC TGTTGCCTACTGCCTCGGA.
Mouse s hT gf b1 -2: T GC TG TT GA CA GT GA GC GA AG TA TA TA TA TG TT CT T C AA AT AG TG AA GC CA CA GA TG TA TT TG AA GAACATATATATACTGTGCC TACTGCCTCGGA.
Human s hA SN S-1: T GC TG TT GA CA GT GA GC GC CA GA AG CT AA AG GT C T TG TT AT AG TG AA GC CA CA GA TG TA TA AC AA GACCTTTAGCTTCTGATGC CTACTGCCTCGGA.
Human shASNS-2: T GC TGTTGACAGTGAGCGCAGCAATGACAGAAGATGGATATAGTGAAGCCACAGATGTATATCCATCTTCTGTCATTGCTTTG CCTACTGCCTCGGAQuantitative RT–PCR. Total RNA from cells was purified and DNase treated using an RNeasy Mini Kit (Qiagen). For whole tissues, RNA was isolated using a TRIzol Plus RNA Purification Kit (Thermo Fisher Scientific). The tissue lysate was homogenized using a Dounce homogenizer and passed through a column homog-enizer (Thermo Fisher Scientific) to reduce viscosity. RNA integrity (RNA integrity score > 9) was measured on an Agilent Bioanalyzer (RNA nano kit). cDNA was synthesized using SuperScript III Reverse Transcriptase (Sigma). qPCR was per-formed on an Eppendorf Mastercycler ep realplex. All signals were quantified using the Δ Ct method and were normalized to the levels of Gapdh. For mCherry-posi-tive flow cytometer sorted tumour and lung metastatic cells, cDNA was produced directly from lysed cells using a TaqMan Gene Expression Cells-to-Ct Kit (Thermo Fisher Scientific). qPCR was performed on an CFX96 (Bio-Rad) using TaqMan primer/probe sets and all signals were quantified as described above.Quantitative RT–PCR primers. Mouse Asns (exon 1–2): 5′ -CCT CTG CTC CAC CTT CTC T-3′ ; 5′ -GAT CTT CAT CGC ACT CAG ACA-3′.
Mouse Asns (exon 6–7): 5′ -CCA AGT TCA GTATCC TCT CCA G-3′ ; 5′ -CTT CAT GAT GCT CGCTTC CA-3′ .
Mouse Tgfb1 (exon 1–2): 5′ -CCG AAT GTC TGA CGT ATT GAA GA-3′ ; 5′ -GCG GAC TAC TAT GCT AAA GAG G-3′ .
Mouse Tgfb1 (exon 3–4): 5′ -GTT ATC TTT GCT GTC ACA AGA GC-3′ ; 5′ -CCC ACT GAT ACG CCT GAG-3′ .
Mouse Gapdh (exon 2–3): 5′ -AAT GGT GAA GGT CGGTGT G-3′ ; 5′ -GTG GAGTCA TACTGG AAC ATG TAG-3′ .
Human ASNS (exon 8–9): 5′ -GAGTCA GAC CTT TGT TTA AAG CA-3′ ; 5′ -GGA GTG CTT CAATGT AAC AAG AC-3′ .
Human ASNS (exon 12–13): 5′ -CTG GAT GAA GTC ATATTT TCC TTG G-3′ ; 5′ -CAG AGA AGATCA CCA CGCTAT C-3′ .
Human GAPDH (exon 2–3): 5′ -ACA TCG CTC AGA CAC CAT G-3′ ; 5′ -TGT AGT TGA GGT CAA TGA AGG G-3′ TaqMan probes. Mouse Asns: Mm00803785_m1. Mouse E-cadherin (Cdh1): Mm01247357_m1. Mouse Twist1: Mm00442036_m1. Mouse Gapdh: Mm99999915_g1.qPCR for CTCs. CTCs were quantified as previously described1. Genomic DNA was isolated from blood and CTC abundance was quantified using a qPCR assay against mCherry, which was expressed from the retroviral shRNA delivery vectors.
mCherry probes and primers were as follows: primer 1, 5′-GACTACTTGAAGC TGTCCTTCC-3′; primer 2, 5′-CGCAGCTTCACCTTGTAGAT-3′.
HEX probe: 5′-/56-FAM/TTCAAGTGG/ZEN/GAGCGCGTGATG AA/3IABkFQ//-3′.
Housekeeping probes and primers: primer 1, 5′-GACTTGTAACGGGCA GGCAGATTGTG-3′; primer 2, 5′-GAGGTGTGGGTCACCTCGACATC-3′.
HEX probe: 5′-/5HEX/CCGTGTCGC/ZEN/TCTGAAGGGCAATAT/ 3IABkFQ/-3′.Quantification of lung metastasis. For each lung, 5 μ m sections were prepared and stained with a standard H&E protocol. Lung metastatic burden was determined by counting individual lung nodules on one section.E-cadherin and Twist1 analysis. For immunohistochemistry, primary tumours and lungs were processed as previously described1. E-Cadherin (24E10) Rabbit mAb (3195, Cell Signaling) was used in a 1:400 dilution and Twist1 (Twist2C1a) Mouse mAb (ab50887, Abcam) was used in a 1:100 dilution. E-cadherin and Twist1 diaminobenzidine-stained (DAB) and haematoxylin stainings were quantified using ImageJ (NIH). For this, images were colour deconvoluted according to ref. 21 and the percentage area of E-cadherin- and Twist1-positive staining was measured.Free amino-acid quantification using HPLC. Free amino acids were quantified in cultured cells and blood serum. For Extended Data Fig. 2e, 4T1-T cells were cultured under normal medium conditions. For Extended Data Fig. 4a, c, 4T1 and MDA-MB-231 cells were cultured in medium containing 100× concentration of the specified amino acid (relative to the concentration achieved by supplementing the medium with 1× NEAA) for 2 or 3 days, respectively. All cultured cells were washed in ice-cold PBS, homogenized using a Dounce homogenizer, and the lysate subsequently filtered. Each biological sample was quantified in triplicates using
HPLC and a fluorometric detector. For each replicate, nanomoles of each amino acid were measured.Proteomic profiling using isobaric tags for relative and absolute protein quantification. All analyses were performed with three biological replicates per treatment. Cell pellets were lysed with 0.1 M triethylammonium bicarbonate, 0.1% SDS buffer, followed by tip sonication and boiling at 90 °C for 5 min. Protein concentration was estimated using a Bradford assay (Bio-Rad, Quick Start), and 90 μ g of total protein per sample were reduced with tris-2-carboxymethyl phos-phine (Sigma) for 1 h at 60 °C at a final concentration of 5 mM. Cysteines were blocked for 10 min at room temperature using methyl methanethiosulfonate (Sigma) at a final concentration of 10 mM. Samples were digested overnight at 37 °C with trypsin (Pierce) and peptides were labelled with the TMT10plex rea-gents according to the manufacturer’s instructions (Thermo Fisher Scientific). The TMT mixture was fractionated on a Dionex Ultimate 3000 system at high pH using a XBridge C18 column (3.5 μ m, 2.1 × 150 mm, Waters). Fractions were analysed on a Dionex Ultimate 3000 UHPLC system coupled with a nano Q-Exactive (Thermo Fisher Scientific) mass spectrometer. Samples were loaded on an Acclaim PepMap 100, 100 μ m × 2 cm C18, 5 μ m, 100 Å trapping column with the ulPickUp injection method at a loading flow rate of 4 μ l min−1 for 10 min. For peptide separation, an EASY-Spray analytical column 75 μ m × 25 cm, C18, 2 μ m, 100 Å column was used for multi-step gradient elution. Mobile phase (A) was composed of 2% acetonitrile, 0.1% formic acid, 5% dimethyl sulfoxide (DMSO); mobile phase (B) was composed of 80% acetonitrile, 0.1% formic acid, 5% DMSO. The full scans were obtained at 70,000 resolution and the MS2 scans at 35,000 resolution, with collision energy 33% and isolation window 1.2 Th. Raw data were processed with the SequestHT search engine on Proteome Discoverer 1.4 software. The parameters for the SequestHT node were as follows: precursor mass tolerance 20 p.p.m., fragment mass tolerance 0.02 Da; dynamic modifications were oxidation of M (+ 15.995 Da), deamidation of N, Q (+ 0.984 Da); and static modifications were TMT6plex at any N terminus, K (+ 229.163 Da) and Methylthio at C (+ 45.988 Da).
For each sample, raw peptide intensities were normalized by their sum. Peptides that had a representation that fell within the bottom quartile based on summed intensities across samples were not analysed further. For the dataset represented in Fig. 4a and Extended Data Fig. 7a, b, proteins were removed from subsequent analysis if fewer than 5 corresponding proteins were identified in any sample. Protein-level differences between treatments were calculated based on the trimmed mean of corresponding peptide log-fold changes (trimming the top and bottom 25% for the experiment represented in Fig. 4a and Extended Data Fig. 7a, b, and the top and bottom 10% for the experiment represented in Fig. 4b). Relative pro-tein abundances were calculated based on the trimmed mean of corresponding log-transformed peptide intensities (trimming the top and bottom 25% and 10% for the experiments representing in Fig. 4a and b, respectively).Metabolite profiling using LC–MS/MS. Organ tissue samples were placed in 2 ml lysing tubes prefilled with 1.4-mm ceramic beads for mammary glands or 2.8-mm ceramic beads for lungs and 1 ml of pre-chilled (− 80 °C) 80% methanol. Samples were homogenized with a Precellys24 homogenizer (Bertin Instruments) programmed with three 30-s cycles at 6,500 Hz and 4-min pause times. At the end of each cycle, samples were snap-frozen in liquid nitrogen and placed on dry ice. Metabolite extraction of blood serum samples (50 μ l) was performed using 200 μ l of 80% methanol at − 80 °C. After centrifugation for 10 min (13,200 revolutions per minute, 4 °C), supernatants were evaporated to dryness and stored at − 80 °C until liquid chromatography–tandem mass spectrometry (LC–MS/MS) analysis.
Dried-down extracts were re-suspended in 25 μ l HPLC-grade water, and 1 μ l was analysed using hydrophilic interaction chromatography coupled to tandem mass spectrometry analysis operated in the selected reaction monitoring mode (LC–SRM–MS). Analytical instrumentation consisted of a Nexera X2 (Shimadzu) liquid chromatography system with a XBridge BEH amide 2.1 × 100 mm, 2.5-μ m column (Waters) and a QTRAP 6500 hybrid triple quadrupole/linear ion trap mass spectrometer (SCIEX) equipped with an electrospray ion source. Raw LC–SRM–MS data were acquired with Analyst 1.6.2 (SCIEX) and peak areas of LC–SRM–MS traces for each metabolite were integrated using MultiQuant 1.1 software (SCIEX).Amino acid compositional analysis. For Extended Data Fig. 7b, the amino acid representations of genes that showed the greatest decrease in their protein or RNA levels (bottom 25% log-fold change) were compared to those of the analysed gene set, using a rank-sum test. For the amino acid enrichment analysis of protein minus RNA level expression changes, transcriptional- and protein-level log-fold changes were quantile normalized to the same distribution. RNA-level changes were then sub-tracted from protein-level changes. The amino acid representations of genes whose subsequent values fell within the lowest 25% were then compared to the analysed gene set using a rank-sum test, to identify amino acids whose abundance correlated with the protein-level changes that were not explained by transcriptional changes.
For Extended Data Fig. 7c, the same analysis was performed, this time com-paring the proteins of genes that had been detected as upregulated during EMT
© 2018 Macmillan Publishers Limited, part of Springer Nature. All rights reserved.

Letter reSeArCH
compared with all other genes. For the mouse amino-acid enrichment, the EMT-up genes were mouse orthologues of the EMT-up human genes.
For Extended Data Fig. 8, each organism harbouring a minimum of ten genes that were orthologues of the pro-EMT human genes described in Extended Data Fig. 7c were analysed. For each organism, the asparagine percentage of each protein was calculated. Then the asparagine enrichment level for each organism was determined by calculating the ratio of the median asparagine percentage of pro-EMT proteins versus the remaining organism-specific proteins. The statistical significance of enrichment was calculated as described for Extended Data Fig. 7c.Ribosome profiling analysis. For analysis, quality trimming and sequencing adapter removal was performed using Cutadapt22. Bowtie2 was used to remove reads that mapped to contaminating RNAs (for example, rRNA and tRNA sequences)18. STAR was subsequently used to map reads of length 29–33 to the human transcriptome23. The offset was corrected for each read on the basis of read length, and 12 and 15 nucleotides downstream were marked as P and A sites. For each gene, we then calculated the number of events at all positions and aggregated the counts for each codon and subsequently amino acid. Genes with fewer than ten events in any sample were not considered in subsequent analyses.Code availability. All custom code used during the current study is available from the corresponding author upon reasonable request.Data availability. All raw and processed high-throughput sequencing data are available at the Gene Expression Omnibus under accession numbers GSE104968
and GSE107109. The mass spectrometry proteomics data have been deposited in the ProteomeXchange consortium via the PRIDE24 partner repository, under the dataset identifier PXD008805. Source Data are available for tumour volume measurements, lung metastases and proteomic measurements. All other datasets generated during and/or analysed during the current study are available from the corresponding author upon reasonable request.
17. Eden, E., Navon, R., Steinfeld, I., Lipson, D. & Yakhini, Z. GOrilla: a tool for discovery and visualization of enriched GO terms in ranked gene lists. BMC Bioinformatics 10, 48 (2009).
18. Langmead, B. & Salzberg, S. L. Fast gapped-read alignment with Bowtie 2. Nat. Methods 9, 357–359 (2012).
19. Anders, S., Pyl, P. T. & Huber, W. HTSeq—a Python framework to work with high-throughput sequencing data. Bioinformatics 31, 166–169 (2015).
20. Anders, S. & Huber, W. Differential expression analysis for sequence count data. Genome Biol. 11, R106 (2010).
21. Ruifrok, A. C. & Johnston, D. A. Quantification of histochemical staining by color deconvolution. Anal. Quant. Cytol. Histol. 23, 291–299 (2001).
22. Martin, M. Cutadapt removes adapter sequences from high-throughput sequencing reads. EMBnet.journal 17, 10 (2011).
23. Dobin, A. et al. STAR: ultrafast universal RNA-seq aligner. Bioinformatics 29, 15–21 (2013).
24. Vizcaíno, et al. 2016 update of the PRIDE database and related tools. Nucleic Acids Res 44, D447–D456 (2016).
© 2018 Macmillan Publishers Limited, part of Springer Nature. All rights reserved.

LetterreSeArCH
h
4020 605030100Months
f
g
−4
−3
−2
−1
0
1
2
3
4
5
Mea
n ex
pres
sion
Mea
n ex
pres
sion
−4
−3
−2
−1
0
1
2
3
4
5
Luminal-A
Claudin
Basal
Her2+
Luminal-B
Relapse-free Relapsed
Any LiverBrainBoneLN Lung
Correlation with progressionNonePositive
Negative
0
0.2
1.0
0.8
0.6
0.4
Ove
rall s
urvi
val (
prob
abilit
y)
low 187/1212med 274/1210high 284/1211
C-index = 0.58 cox HR = 1.31 cox p = 1.5e-12
All cancers
4020 605030100
0
0.2
1.0
0.8
0.6
0.4O
vera
ll sur
viva
l (pr
obab
ility)
low 14/321med 19/318high 31/320
C-index = 0.634 cox HR = 1.5 cox p = 0.0031
TCGA
0
0.2
1.0
0.8
0.6
0.4
4020 605030100Months
low 12/109med 13/109high 25/110
C-index = 0.608 cox HR = 1.662 cox p = 0.0238
Colon
0
0.2
1.0
0.8
0.6
0.4
4020 605030100Months
low 48/165med 45/164high 53/165
C-index = 0.525 cox HR = 1.28 cox p = 0.0173
Squamous Head & Neck
0
0.2
1.0
0.8
0.6
0.4
4020 605030100Months
low 25/167med 46/167high 68/166
C-index = 0.647 cox HR = 1.958 cox p = 4.97e-08
Renal Clear Cell
0
0.2
1.0
0.8
0.6
0.4
4020 605030100Months
low 27/144med 39/143high 44/144
C-index = 0.513 cox HR = 1.087 cox p = 0.418
Lung Adenocarcinoma
0
0.2
1.0
0.8
0.6
0.4
4020 605030100
Ove
rall s
urvi
val (
prob
abilit
y)
Months
low 46/141med 37/142high 41/141
C-index = 0.468 cox HR = 0.8777 cox p = 0.182
Lung Squamous
0
0.2
1.0
0.8
0.6
0.4
4020 605030100Months
low 5/42med 5/42high 1/42
C-index = 0.347 cox HR = 0.3909 cox p = 0.107
Rectal
0
0.2
1.0
0.8
0.6
0.4
4020 605030100Months
low 42/53med 37/50high 37/52
C-index = 0.494 cox HR = 0.871 cox p = 0.577
Glioblastoma
0
0.2
1.0
0.8
0.6
0.4
4020 605030100Months
low 43/86med 36/85high 47/86
C-index = 0.517 cox HR = 1.033 cox p = 0.832
Ovarian
0
0.2
1.0
0.8
0.6
0.4
4020 605030100Months
low 8/121med 13/121high 18/122
C-index = 0.595 cox HR = 1.731 cox p = 0.0116
Endometrial
42 765310
low 24/164med 41/164high 44/165
C-index = 0.619 cox HR = 1.402 cox p = 0.0002
RF
surv
ival
(pro
babi
lity)
0
0.2
1.0
0.8
0.6
0.4
MDACC
42 10860MonthsYears Years
0
0.2
RF
surv
ival
(pro
babi
lity)
1.0
0.8
0.6
0.4
low 154/528med 189/528high 233/528
C-index = 0.564 cox HR = 1.129 cox p = 0.0001
METRABIC
0
0.2
1.0
0.8
0.6
0.4
4020 605030100
Ove
rall s
urvi
val (
prob
abilit
y)
low 29/124med 31/123high 41/124
C-index = 0.556 cox HR = 1.122 cox p = 0.379
Bladder
Months
Ove
rall s
urvi
val (
prob
abilit
y)
Ove
rall s
urvi
val (
prob
abilit
y)
Ove
rall s
urvi
val (
prob
abilit
y)
Ove
rall s
urvi
val (
prob
abilit
y)
Ove
rall s
urvi
val (
prob
abilit
y)
Ove
rall s
urvi
val (
prob
abilit
y)
Ove
rall s
urvi
val (
prob
abilit
y)
Ove
rall s
urvi
val (
prob
abilit
y)
ASNS
CCNE2
CD74
DUSP7
DUSP9
HMOX1
ITGA2
KDELR3
LCP1
UNC855-LRFS
UNC254-RFS
UNC855-RFS
Tumour-m
et
−0.8
−0.6
−0.4
−0.2
0.0
0.2
0.4
0.6
0.8
1.0
1.2
−0.6
−0.4
−0.2
0.0
0.2
0.4
0.6
Mea
n ex
pres
sion
(z-
scor
e)
Mea
n ex
pres
sion
(z-
scor
e)
Luminal-A
Claudin
Basal
Her2+
Luminal-B
Lung-relapse
Relapse-free
ba c d e
TUBA4A
NA
COQ10B
Extended Data Figure 1 | See next page for caption.
© 2018 Macmillan Publishers Limited, part of Springer Nature. All rights reserved.

Letter reSeArCH
Extended Data Figure 1 | Analysis of ASNS expression levels in patient data. a, Expression level of genes identified as overexpressed in 4T1-T compared with 4T1-E in the primary tumours of patients with different disease subtypes (edges of the box are the 25th and 75th percentiles and error bars extend to the values q3 + w(q3 − q1) and q1 − w(q3 − q1), in which w is 1.5 and q1 and q3 are the 25th and 75th percentiles, which is also true for b, d, and e, ANOVA P < 0.0001). b, Expression level of the same genes in disease-free survivors and patients with relapse to the lung (rank-sum P < 0.01). c, For each gene that was identified in the screen, a prognostic value was calculated using three different datasets. One consisted of gene expression measurements in three patient-matched basal tumour and metastasis pairs (patients A1, A7, and A11). Here genes were classified as correlated with progression if expression was higher in each of the metastases and negatively correlated if expression was higher in each of the primaries. The other two datasets consisted of primary tumour gene-expression profiles with matched outcomes. For the UNC254 patient dataset, the site of relapse was not available and genes were deemed positively correlated with progression if they had significant (Cox P < 0.05) relapse-free survival hazard ratios greater than 1, and
negatively correlated if these ratios were significant (Cox P < 0.05) and less than 1. As the UNC855 dataset also had site of relapse information, here both relapse-free and lung relapse-free survival (RFS and LRFS) hazard ratios were used to classify genes as positively or negatively correlated with progression based on the same criteria that were used for the UNC254 data. d, Expression level of ASNS in the primary tumours of patients with different disease subtypes (ANOVA P < 0.0001). e, Expression level of ASNS in the primary tumours of patients with non-specific relapse and relapse to the lymph node, bone, brain, liver, or lung compared with expression levels in patients without relapse to each corresponding site (rank-sum P < 0.005). f, Analysis of ASNS in three additional sets from patients with breast cancer (MDACC, METRABIC, and TCGA). Shown are survival plots and relevant statistics (Cox P < 0.01). g, Analysis of ASNS in the TCGA Pan-Cancer expression data. Shown are survival plots and relevant statistics for the ten non-breast solid tumours represented in the dataset (Cox P < 0.05 for colon, squamous head and neck, renal clear cell, and endometrial cancers). h, Analysis of ASNS across all tumours represented in the TCGA Pan-Cancer dataset (Cox P = 1.5 × 10⁻¹²).
© 2018 Macmillan Publishers Limited, part of Springer Nature. All rights reserved.

LetterreSeArCH
0.2
0.4
0.6
0.8
1.0
1.2
% m
Che
rry
(rel
ativ
e to
initi
al p
ool)
0.5
1
1.0
2
2.5
3
3.5
dc70
10
20
30
40
50
60
0
Inva
sion
inde
x
b
Mea
n vi
olet
inte
nsity
(hr
0/hr
24)
shRenilla shAsns-1 shAsns-2
shRenillashAsns-1shAsns-2
shRenillashAsns-1shAsns-2
shRenillashAsns-1shAsns-2
a
0
shRenilla shAsns-1 shAsns-2
% m
Che
rry
cells
0
10
20
30
40
50
60
70
0 48 9609648
f
D-asparagine L-asparagine
0
20
40
60
80
100
Inva
sion
inde
x
g0 mg/L Asn 1.32 g/L Asn
shRenilla shAsns-2shAsns-1
log 2(
shA
sns/
shR
enill
a)
Amino acid
e
-3
-2
-1
0
1
2
A R N D Q E G H L K M F P S T W Y VI
shAsns-1 shAsns-2
Hours
0
Extended Data Figure 2 | See next page for caption.
© 2018 Macmillan Publishers Limited, part of Springer Nature. All rights reserved.

Letter reSeArCH
Extended Data Figure 2 | Primary validation of Asns as a driver of invasion and metastasis. a, Representative images of the lungs of mice that were intravenously injected with Asns-silenced or -expressing 4T1-T cells as described in Fig. 2a. b, Quantification of Matrigel invasion capacity for Asns-silenced and -expressing 4T1-T cells (n = 3 replicates per cell line). c, Quantification of mCherry-positive 4T1-T cells after roughly 50% of cells were infected with mCherry-expressing constructs harbouring shRNAs targeting Renilla luciferase and Asns. Cells were grown during the 24-h period that the Matrigel invasion assay described in Fig. 2b was being performed (n = 3 replicates per cell line). d, Violet cell-labelling intensity of Asns-silenced and -expressing 4T1-T cells, relative to the initial population. Cells were grown during the 24-h period that the Matrigel
invasion assay described in Fig. 2b was being performed (n = 3 replicates per cell line). e, Free amino-acid quantification by HPLC for each amino acid in Asns-expressing and -silenced cells. Shown are the log-fold changes for each amino acid (n = 3 replicates per cell line). f, Quantification of mCherry-positive 4T1-T cells after roughly 50% of cells were infected with mCherry-expressing constructs harbouring shRNAs targeting Renilla luciferase and Asns. After infection, cells were grown in medium supplemented with l-asparagine or d-asparagine and mCherry percentages were measured at 48 and 96 h (n = 3 replicates per cell line). g, Quantification of Matrigel invasion for Asns-silenced and -expressing cells when assayed in medium supplemented with and without l-asparagine (n = 3 invasion chambers per cell line).
© 2018 Macmillan Publishers Limited, part of Springer Nature. All rights reserved.

LetterreSeArCH
c
250
350
650
550
450
Tum
our
volu
me
(mm
3 )
Empty Asns
15
20
25
30
35
40
45
Lung
met
asta
ses
d
Asns
f
0
10
20
30
40
Lung
met
asta
ses
Empty ASNS
140
160
180
200
220
240
260
Tum
our
volu
me
(mm
3 )
Empty ASNS
0
10
20
30
40
Inva
sion
inde
x
Empty ASNS
g
150
200
250
300
350
400
Tum
our
volu
me
(mm
3 )
10
15
20
25
30
35
5
Lung
met
asta
ses
ba
EmptyE
mpt
yA
SN
S
h i
150
200
250
300
350
400
450
Dia
met
er o
f met
asta
ses
(um
)
e
AsnsEmpty
shRenillashAsns-1shAsns-2
shRenillashAsns-1shAsns-2
Extended Data Figure 3 | Secondary validation of Asns as a driver of invasion and metastasis. a, Volume measurements of tumours resulting from orthotopic injection of Asns-silenced and -expressing parental 4T1 cells (n = 10 mice per cell line, edges of the box are the 25th and 75th percentiles and error bars extend to the values q3 + w(q3 − q1) and q1 − w(q3 − q1), in which w is 1.5 and q1 and q3 are the 25th and 75th percentiles, which is also the case for b–g). b, Quantification of lung metastases corresponding to the tumours described in a (rank-sum P < 0.002). c, Volume measurements of tumours resulting from orthotopic injection of parental 4T1 cells with basal (Empty) or enforced expression of Asns (n = 10 mice per cell line). d, Quantification of lung metastases
corresponding to the tumours described in c (rank-sum P < 5.0 × 10⁻⁵). e, Average diameters of the metastases of each mouse described in d (rank-sum P < 0.001). f, Volume measurements for tumours resulting from orthotopic injection of MDA-MB-231 cells with basal (Empty) or enforced expression of ASNS (n = 10 mice per cell line). g, Quantification of lung metastases corresponding to the tumours described in f (rank-sum P < 0.005). h, Quantification of Matrigel invasion for the MDA-MB-231-derived cell lines described in f (n = 3 invasion chambers per cell line). i, Representative images of the collection wells for the invasion assays described in h. See Source Data.
© 2018 Macmillan Publishers Limited, part of Springer Nature. All rights reserved.

Letter reSeArCH
0
20
40
60
Inva
sion
inde
x
b
Amino acidNo PGD NA E
80
0
10
20
30
40Not supplementedSupplemented
Cel
lula
r fr
ee a
min
o ac
id (
%)
D PA G NEAmino acid
Not supplementedSupplemented
0
10
20
30
40
50
60C
ellu
lar
free
am
ino
acid
(%
)
D PA G NE
c
a
Amino acid
0
3
4
5
Mea
n vi
olet
inte
nsity
(hr
0/hr
24)
6
1.32 g l-10 g l-10
1
2
2.5
1.32 g l-10 g l-1
Mea
n vi
olet
inte
nsity
(hr
0/hr
24)
d e
1.5
0.51
2
Extended Data Figure 4 | Primary validation that extracellular asparagine availability affects invasion and metastasis. a, HPLC quantification of cellular free amino-acid percentages for parental 4T1 cells when the medium is supplemented with each of the NEAAs lacking in the DMEM culture medium (n = 3 replicates per cell line). b, Quantification of MDA-MB-231 Matrigel invasion rates under the same conditions as described in Fig. 3a (n = 5 invasion chambers per condition, rank-sum P < 0.001). c, HPLC quantification of cellular free amino-acid percentages for MDA-MB-231 cells when cultured in the medium
conditions described in a (n = 3 replicates per cell line). d, Violet cell-labelling intensity of parental 4T1 cells when grown in asparagine-lacking or -supplemented medium for the same period that the Matrigel invasion assay described in Fig. 3a was being performed (n = 3 replicates per cell line). e, Violet cell-labelling intensity of MDA-MB-231 cells when grown in asparagine-lacking or -supplemented medium for the same period that the Matrigel invasion assay described in b was being performed (n = 3 replicates per cell line).
© 2018 Macmillan Publishers Limited, part of Springer Nature. All rights reserved.

LetterreSeArCH
550
500
450
400
350
300
0
25
20
15
10
5
Tum
our
volu
me
(mm
3 )
a b
Lung
met
asta
ses
PBSL-asparaginase
PBSc
L-asparaginase
g
500
0
100
200
300
400
Tum
our
volu
me
(mm
3 )
80
120
160
200
240
Tum
our
volu
me
(mm
3 )
PBS L-asparaginase
eshRenilla shAsns-2
shAsns-1
PBS L-asparaginase
shRenilla shASNS-2shASNS-1
f
0
10
20
30
40
50
60
Lung
met
asta
ses
Lung
met
asta
ses
0
20
40
60
80
PBS L-asparaginase
dshRenilla shAsns-2
shAsns-1
PBS L-asparaginase
shRenilla shASNS-2shASNS-1
PBS L-asparaginase
600
Extended Data Figure 5 | See next page for caption.
© 2018 Macmillan Publishers Limited, part of Springer Nature. All rights reserved.

Letter reSeArCH
Extended Data Figure 5 | Secondary validation that extracellular asparagine availability affects invasion and metastasis. a, Tumour volumes resulting from the orthotopic injection of parental 4T1 cells. Half of the mice received l-asparaginase and the other half received an equivalent volume of PBS at the same injection rate (n = 10 mice per condition, edges of the box are the 25th and 75th percentiles and error bars extend to the values q3 + w(q3 − q1) and q1 − w(q3 − q1), in which w is 1.5 and q1 and q3 are the 25th and 75th percentiles, which is also the case for b–g). b, Quantification of lung metastases detected in the animals described in a (rank-sum P < 0.001). c, Representative H&E-stained lung sections as described in b. d, Quantification of the lung metastases described in Fig. 3b, in which Asns-silenced and -expressing 4T1-T cells were injected into mice. Half of the mice received l-asparaginase and the other half received an equivalent volume of PBS at the same injection rate
(n = 10 mice per condition, rank-sum P < 0.0005 for l-asparaginase versus control for each line and for Asns-silenced versus -unsilenced cells in each drug condition). e, Tumour volumes corresponding to the lung metastases described in d (rank-sum P < 0.005 for Asns-silenced versus -expressing cells in l-asparaginase-treated mice). f, Lung metastases resulting from the orthotopic injection of ASNS-silenced and -expressing MDA-MB-231 cells and subsequent treatment of the injected animals with l-asparaginase or PBS (n = 10 mice per cell line, rank-sum P < 0.05 for ASNS-silenced versus -expressing cells in both conditions and for silenced cells in treated versus untreated mice). g, Tumour volumes corresponding to the mice described in f (rank-sum P < 0.05 for Asns-silenced versus -expressing cells under both treatments and for PBS versus l-asparaginase-treated animals for each cell line). See Source Data.
© 2018 Macmillan Publishers Limited, part of Springer Nature. All rights reserved.

LetterreSeArCH
0.2
0.6
1
1.4
1.8
2.2
100
150
200
250
300
350
200
250
300
350
400
450
500
550
0
5
10
15
0.6% Asn 4% Asn0% Asn0.6% Asn
4% Asn
0% Asn
Tum
our
volu
me
(mm
3 )
Tum
our
volu
me
(mm
3 )
Lung
met
asta
ses 0%
Asn
0.6%
Asn
4% A
sn
a
fed
b
0.6% Asn
4% Asn
0% Asn
0.6% Asn
4% Asn
0% Asn
0.4
0.8
1.2
1.6
Rel
ativ
e ex
pres
sion
0
P1 P2P1P2PBS L-asp
g
4% A
sn
shRenilla shAsns-1
0% A
sn
shAsns-2c
0.6%
Asn
shAsns-2shAsns-1shRenilla
50
100
150
200
0 0Breast
LungBlood
TP
M
h
Serum LungMammarygland
Asn
in s
erum
free
AA
(na
nom
oles
)
Extended Data Figure 6 | Tertiary validation that extracellular asparagine availability affects invasion and metastasis. a, Asparagine content in the serum free amino-acid pool, for mice fed 0%, 0.6%, or 4% asparagine diets (n = 5 mice per diet, edges of the box are the 25th and 75th percentiles and error bars extend to the values q3 + w(q3 − q1) and q1 − w(q3 − q1), in which w is 1.5 and q1 and q3 are the 25th and 75th percentiles, which is also the case for b, d, e and h, rank-sum P < 0.05 between each diet). b, Volumes of orthotropic tumours corresponding to the lung metastases described in Fig. 3c, in which Asns-silenced and -expressing 4T1-T cells were orthotopic injected into mice fed with 0%, 0.6%, and 4% asparagine diets (n = 10 mice per condition). c, Representative images of the lung metastases described for Fig. 3c, which also correspond to the mice described in b. d, Volumes of tumours
resulting from the orthotopic injection of parental 4T1 cells into mice fed with 0%, 0.6%, or 4% asparagine diets (n = 10 mice per diet). e, Quantification of metastases in the lungs of the animals described in d (rank-sum P < 0.05 for mice receiving 0% versus 0.6% and 0% versus 4% diets). f, Representative images of H&E-stained sections of the lungs described in e. g, Relative expression of Asns in the mammary gland, serum, and lungs of mice treated with l-asparaginase or PBS, as measured by qPCR with two primer pairs P1 and P2 (n = 3 per condition). h, Transcripts per million (TPM) expression measurements for ASNS in human breast, lung, and whole-blood samples (n > 114 for each tissue, rank-sum P < 2.8 × 10−37 for blood versus breast and blood versus lung). See Source Data.
© 2018 Macmillan Publishers Limited, part of Springer Nature. All rights reserved.

Letter reSeArCH
R NA VYWTSPFMKLIHGEQCDAmino acid
d
a
Pro
tein
cha
nge
(z-s
core
)
c
Protein-RNA
RNA
R NA VYWTSPFMKLIHGEQCDAmino acid
AA
enr
ichm
ent (
-log 10
(p-v
alue
))
Protein
2
0
2
20
2
Human
Mouse
AA
enr
ichm
ent (
-log 10
(p-v
alue
))
0
2
4
6
8
10
% A
sn c
odon
Asn
% d
iff (
(+L-
asp)
- (
-L-a
sp))
PBS L-asp
4
2
1
0
-1
3
-2
GenomeEMT-up
GenomeEMT-up
e
-6
-2
0
2
-4
-8
bRNA-upRNA-down
Asn-highAsn-low
-10
0
10
-10
0
10
-10
0
10
4
106
Extended Data Figure 7 | Primary validation that asparagine availability regulates EMT. a, Protein-level changes between Asns-silenced and -expressing cells when genes are stratified by transcription-level changes (top and bottom 10% of genes based on log-fold change in Asns-silenced cells, gene-up and -down, respectively) and asparagine content (top and bottom 10% of genes based on asparagine content, Asp-high and -low, respectively), edges of the box are the 25th and 75th percentiles and error bars extend to the values q3 + w(q3 − q1) and q1 − w(q3 − q1), in which w is 1.5 and q1 and q3 are the 25th and 75th percentiles, which is also the case for d and e, rank-sum P < 5.0 × 10⁻²⁴ for both individual variables, and rank-sum P < 0.005 for interacting variables). b, Amino acid enrichment analysis of downregulated genes (bottom 25% based on log-fold change) on the basis of RNA and protein levels in Asns-expressing versus -silenced 4T1-T cells. Negative correlations indicate the amino acid is depleted in the downregulated genes, whereas positive correlations indicate the amino acid is enriched.
For protein minus RNA level expression changes, amino acids with positive correlations are enriched in proteins in which depletion levels exceed what is predicted by corresponding RNA changes. Negative correlations indicate the amino acid is enriched in proteins in which depletion levels are less than what is predicted by corresponding RNA changes (rank-sum P < 1.0 × 10⁻⁵ for asparagine in protein and protein–RNA). c, Amino-acid enrichment in mouse and human EMT-up proteins (rank-sum P < 0.01 for both human and mouse). d, Position 15 asparagine codon enrichment in ribosome protected fragments from PC-3 cells grown with and without l-asparaginase, when all genes or only EMT-up genes are analysed (outliers were not plotted to improve interpretability, which is also the case for e, rank-sum P < 0.05 for EMT-up versus all genes in both untreated and l-asparaginase-treated cells). e, Increase in asparagine codon representation in ribosome protected fragments, when PC-3 cells are grown in l-asparaginase (relative to without), and all genes or EMT-up genes are analysed (rank-sum P < 0.05). See Source Data.
© 2018 Macmillan Publishers Limited, part of Springer Nature. All rights reserved.
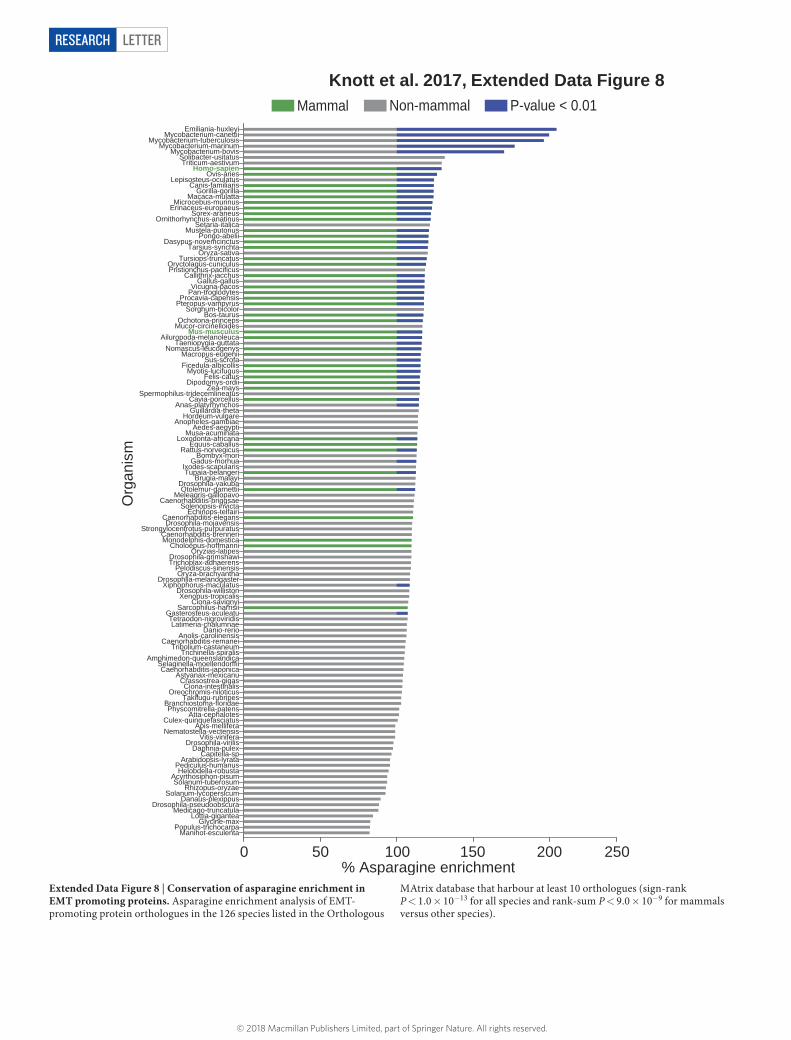
LetterreSeArCH
Emiliania-huxleyiMycobacterium-canettii
Mycobacterium-tuberculosisMycobacterium-marinum
Mycobacterium-bovisSolibacter-usitatusTriticum-aestivum
Homo-sapienOvis-aries
Lepisosteus-oculatusCanis-familiaris
Gorilla-gorillaMacaca-mulatta
Microcebus-murinusErinaceus-europaeus
Ornithorhynchus-anatinusSorex-araneus
Setaria-italicaMustela-putorius
Dasypus-novemcinctusPongo-abelii
Tarsius-syrichtaOryza-sativa
Tursiops-truncatusOryctolagus-cuniculusPristionchus-pacificus
Callithrix-jacchusGallus-gallus
Vicugna-pacosPan-troglodytes
Procavia-capensisPteropus-vampyrus
Sorghum-bicolor
Ochotona-princepsBos-taurus
Mucor-circinelloidesMus-musculus
Ailuropoda-melanoleucaTaeniopygia-guttata
Nomascus-leucogenysMacropus-eugenii
Ficedula-albicollisSus-scrofa
Myotis-lucifugus
Spermophilus-tridecemlineatus
Felis-catusDipodomys-ordii
Zea-mays
Cavia-porcellusAnas-platyrhynchos
Guillardia-thetaHordeum-vulgare
Anopheles-gambiaeAedes-aegypti
Musa-acuminataLoxodonta-africana
Equus-caballusRattus-norvegicus
Bombyx-moriGadus-morhua
Ixodes-scapularisTupaia-belangeri
Brugia-malayiDrosophila-yakubaOtolemur-garnettii
Meleagris-gallopavoCaenorhabditis-briggsae
Solenopsis-invicta
Caenorhabditis-elegansEchinops-telfairi
Drosophila-mojavensisStrongylocentrotus-purpuratus
Caenorhabditis-brenneriMonodelphis-domestica
Choloepus-hoffmanni
Drosophila-grimshawiOryzias-latipes
Trichoplax-adhaerensPelodiscus-sinensisOryza-brachyantha
Drosophila-melanogasterXiphophorus-maculatus
Drosophila-willistonXenopus-tropicalis
Ciona-savignyiSarcophilus-harrisii
Gasterosteus-aculeatuTetraodon-nigroviridisLatimeria-chalumnae
Anolis-carolinensisDanio-rerio
Caenorhabditis-remaneiTribolium-castaneum
Amphimedon-queenslandicaTrichinella-spiralis
Selaginella-moellendorffiiCaenorhabditis-japonica
Astyanax-mexicanu
s
Crassostrea-gigasCiona-intestinalis
Oreochromis-niloticusTakifugu-rubripes
Branchiostoma-floridaePhyscomitrella-patens
Culex-quinquefasciatusAtta-cephalotes
Nematostella-vectensisApis-mellifera
Vitis-viniferaDrosophila-virilis
Daphnia-pulexCapitella-sp
Arabidopsis-lyrataPediculus-humanusHelobdella-robusta
Acyrthosiphon-pisumSolanum-tuberosum
Rhizopus-oryzaeSolanum-lycopersicum
Danaus-plexippusDrosophila-pseudoobscura
Medicago-truncatulaLottia-gigantea
Glycine-maxPopulus-trichocarpa
Manihot-esculenta
0 50 100 150 200 250
Mammal Non-mammal P-value < 0.01O
rgan
ism
% Asparagine enrichment
Knott et al. 2017, Extended Data Figure 8
Extended Data Figure 8 | Conservation of asparagine enrichment in EMT promoting proteins. Asparagine enrichment analysis of EMT-promoting protein orthologues in the 126 species listed in the Orthologous
MAtrix database that harbour at least 10 orthologues (sign-rank P < 1.0 × 10⁻¹³ for all species and rank-sum P < 9.0 × 10⁻⁹ for mammals versus other species).
© 2018 Macmillan Publishers Limited, part of Springer Nature. All rights reserved.

Letter reSeArCH
220
260
300
340
380
shTgfb-2shRenilla shTgfb-1
Tum
our
volu
me
(mm
3 )
e
5
10
15
20
25
30
Lung
met
asta
ses
shTgfb-2shRenilla shTgfb-1
h0
shTgfb-2shRenillashTgfb-1
0
5
10
15
20
25
% C
dh1
posi
tive
gfshTgfb-2
shRenilla shTgfb-1
5
10
15
20
25
% T
wis
t1 p
ositi
ve
4
6
8
10
12
Lung
met
asta
ses
shTgfb-2shRenilla shTgfb-1
i
-3
-2
-1
0
1
2
3
a b
0
-1
-2
1
2
3lo
g 2(sh
Asn
s/sh
Ren
illa)
log 2(
+A
sn/-
Asn
)
EMT-downEMT-up
EMT-downEMT-up
-2-2
0
22
WT(L-asp)
ATF4 ATF4(L-asp)
log 2(
exp/
WT
)
c
0
-4
2
log 2(
ATF
4-K
O/W
T)
EMT-downEMT-up
-2
2
EMT-downEMT-up
d
-2
10
-10
10
-1
1
-1
1
Extended Data Figure 9 | See next page for caption.
© 2018 Macmillan Publishers Limited, part of Springer Nature. All rights reserved.

LetterreSeArCH
Extended Data Figure 9 | Secondary validation that asparagine availability regulates EMT. a, Transcription-level changes in EMT-up and -down genes that occur in response to Asns silencing in 4T1-T cells (n = 2 replicates per condition, edges of the box are the 25th and 75th percentiles and error bars extend to the values q3 + w(q3 − q1) and q1 − w(q3 − q1), in which w is 1.5 and q1 and q3 are the 25th and 75th percentiles, which is also the case for b–e, h and i, rank-sum P < 0.001 for EMT-up genes, DESeq false discovery rate < 0.05 for Twist1 and Cdh1). b, Transcription-level changes in EMT-up and -down genes that occur in response to the medium of Asns-silenced 4T1-T cells being supplemented with l-asparagine (n = 2 replicates per condition, rank-sum P < 0.005 for EMT-up genes). c, Gene expression changes in EMT-up and -down genes that result from ATF4 knockout in near haploid KBM-7 chronic myelogenous leukaemia (HAP-1 cells, rank-sum P < 0.05 for EMT-up genes). d, Gene expression changes in EMT-up and -down genes, which result in the liver cells of homozygous
ATF4-deleted mice when treated with l-asparaginase (rank-sum P < 0.05 for EMT-down genes in wild-type mice treated with l-asparaginase (WT+ L-asp) mice, and both EMT-up and -down genes in ATF4 mice treated with l-asparaginase (ATF4+ L-asp) mice). e, Volumes of tumours resulting from orthotopic injection of Tgf-β -silenced and -expressing 4T1-T cells (n = 10 mice per cell line). f, Percentage of Twist1-positive regions based on IHC staining of sections from tumours described in e (n = 5 tumour sections per cell line, rank-sum P < 0.01). g, Percentage of Cdh1-positive regions based on IHC staining of sections from tumours described in e (n = 5 tumour sections per cell line, rank-sum P < 0.01). h, Quantification of metastases resulting from the tumours described in e (rank-sum P < 0.05). i, Quantification of metastases resulting from intravenous injection of Tgf-β -silenced and -expressing cells (n = 10 mice per cell line, rank-sum P < 0.05). See Source Data.
© 2018 Macmillan Publishers Limited, part of Springer Nature. All rights reserved.

Letter reSeArCH
Tum
our
Lung
shRenilla shAsns-2shAsns-1b
1.2
0.0
0.4
0.8
shAsns-1shAsns-2
shRenilla16
0
4
8
12
shAsns-1shAsns-2
shRenilla
Rel
ativ
e C
dh1
expr
essi
on
Rel
ativ
e Tw
ist1
exp
ress
ion
Tumour Lung Lung
d
shRenilla shAsns-1 shAsns-2a
c
Tumour
100 um
100 um
Extended Data Figure 10 | Tertiary validation that asparagine availability regulates EMT. a, Representative H&E-stained sections of the tumours described in Fig. 2c, in which Asns-silenced and -expressing 4T1-T cells were orthotopically injected into NSG mice. b, Images of cultured cells after they were isolated from the tumours and lungs of mice injected orthotopically with Asns-silenced and -expressing 4T1-T cells.
c, Relative Twist1 expression, as measured by qPCR, which were sorted from the tumours and lungs of mice injected orthotopically with Asns-silenced and -expressing 4T1-T cells (n = 3 tumours and lungs per cell line). d, Relative Cdh1 expression, as measured by qPCR, in the tumours and lungs described in c (n = 3 tumours and lungs per cell line).
© 2018 Macmillan Publishers Limited, part of Springer Nature. All rights reserved.

LetterreSeArCH
40
10
20
% T
wis
t1 p
ositi
ve
30
shAsns-2shAsns-1shRenillaTw
ist1
Cdh
1
0
shAsns-1shAsns-2
shRenilla
30
0
10
20
shAsns-1shAsns-2
shRenilla
% T
wis
t1 p
ositi
ve
0
shAsns-1shAsns-2
shRenilla
% C
dh1
posi
tive
PBS L-asp 0.0% 4.0%0.6%
a
d e f
g
40
50
0
10
20
shAsns-1shAsns-2
shRenilla
% C
dh1
posi
tive
PBS L-asp
30
40
70
60
50
40
30
20
10
80
b c
50
0
10
20
shAsns-1shAsns-2
shRenilla
% C
dh1
posi
tive
Tumour Lung
30
40
0
10
20
shAsns-1shAsns-2
shRenilla
%Tw
ist1
pos
itive
Tumour Lung
30
40
60
70
0.0% 4.0%0.6%
Extended Data Figure 11 | Quaternary validation that asparagine availability regulates EMT. a, Representative images of IHC staining for Twist1 and Cdh1 on sections from lungs described in Fig. 4e, in which mice were injected orthotopically with Asns-silenced and -expressing 4T1-T cells. b, Quantification of all Twist1 stainings, described in Fig. 4e and a (n = 5 tumour sections and n > 5 lung metastases, edges of the box are the 25th and 75th percentiles and error bars extend to the values q3 + w(q3 − q1) and q1 − w(q3 − q1), in which w is 1.5 and q1 and q3 are the 25th and 75th percentiles, which is also the case for c–g, rank-sum P < 0.01 and P < 0.05 for Asns-silenced versus -expressing tumours and metastases, respectively). c, Quantification of all Cdh1 stainings, described in b (n = 5 tumour sections and n = 9 lung metastases, rank-sum P < 0.01 and P < 0.05 for Asns-silenced versus -expressing tumours and metastases, respectively). d, Quantification of Twist1-positive regions in the tumours resulting from orthotopic injection of Asns-expressing and -silenced
4T1-T cells into animals treated with PBS or l-asparaginase (n = 5 tumour sections per condition, rank-sum P < 0.01 for Asns-silenced versus -unsilenced cells and rank-sum P < 0.05 for each cell line in treated versus untreated mice). e, Quantification of Cdh1-positive regions in the tumours described in d (n = 5 tumour sections per condition, rank-sum P < 0.01 for Asns-silenced versus -unsilenced cells and rank-sum P < 0.05 for each cell line in treated versus untreated mice). f, Quantification of Twist1-positive regions in tumours resulting from orthotopic injection of Asns-expressing and -silenced cells into mice fed a 0%, 0.6%, or 4% asparagine diet (n = 5 tumour sections per condition, rank-sum P < 0.01 between Asns-silenced and -expressing cells and between diets). g, Quantification of Cdh1-positive regions in the tumours described in f (n = 5 tumour sections per condition, rank-sum P < 0.01 between Asns-silenced and -expressing cells and between diets).
© 2018 Macmillan Publishers Limited, part of Springer Nature. All rights reserved.

1
nature research | life sciences reporting summ
aryJune 2017
Corresponding author(s): Gregory Hannon
Initial submission Revised version Final submission
Life Sciences Reporting SummaryNature Research wishes to improve the reproducibility of the work that we publish. This form is intended for publication with all accepted life science papers and provides structure for consistency and transparency in reporting. Every life science submission will use this form; some list items might not apply to an individual manuscript, but all fields must be completed for clarity.
For further information on the points included in this form, see Reporting Life Sciences Research. For further information on Nature Research policies, including our data availability policy, see Authors & Referees and the Editorial Policy Checklist.
Experimental design1. Sample size
Describe how sample size was determined. Sample size was chosen to give sufficient power for calling significance with standard statistical tests. Mouse experiments were performed with 10 replicates to account for the variability that is observed in such in vivo experiments. In vitro experiments were performed with 5 replicates. In both cases standard rank-sum tests were able to identify significantly different observations.
2. Data exclusions
Describe any data exclusions. No data was excluded.
3. Replication
Describe whether the experimental findings were reliably reproduced.
All experiments have been performed several times in multiple cell lines and using multiple methods to perturb the in vivo environment in a specific manner.
4. Randomization
Describe how samples/organisms/participants were allocated into experimental groups.
In vitro samples were split into different groups based on well locations in the culture dishes and matrigel chambers. In vivo groups were based on cage location, to simplify drug/food dosing by animal staff.
5. Blinding
Describe whether the investigators were blinded to group allocation during data collection and/or analysis.
All image quantification was performed in a blinded manner. Data analysis required prior knowledge of the sample annotation.
Note: all studies involving animals and/or human research participants must disclose whether blinding and randomization were used.
6. Statistical parameters For all figures and tables that use statistical methods, confirm that the following items are present in relevant figure legends (or in the Methods section if additional space is needed).
n/a Confirmed
The exact sample size (n) for each experimental group/condition, given as a discrete number and unit of measurement (animals, litters, cultures, etc.)
A description of how samples were collected, noting whether measurements were taken from distinct samples or whether the same sample was measured repeatedly
A statement indicating how many times each experiment was replicated
The statistical test(s) used and whether they are one- or two-sided (note: only common tests should be described solely by name; more complex techniques should be described in the Methods section)
A description of any assumptions or corrections, such as an adjustment for multiple comparisons
The test results (e.g. P values) given as exact values whenever possible and with confidence intervals noted
A clear description of statistics including central tendency (e.g. median, mean) and variation (e.g. standard deviation, interquartile range)
Clearly defined error bars
See the web collection on statistics for biologists for further resources and guidance.
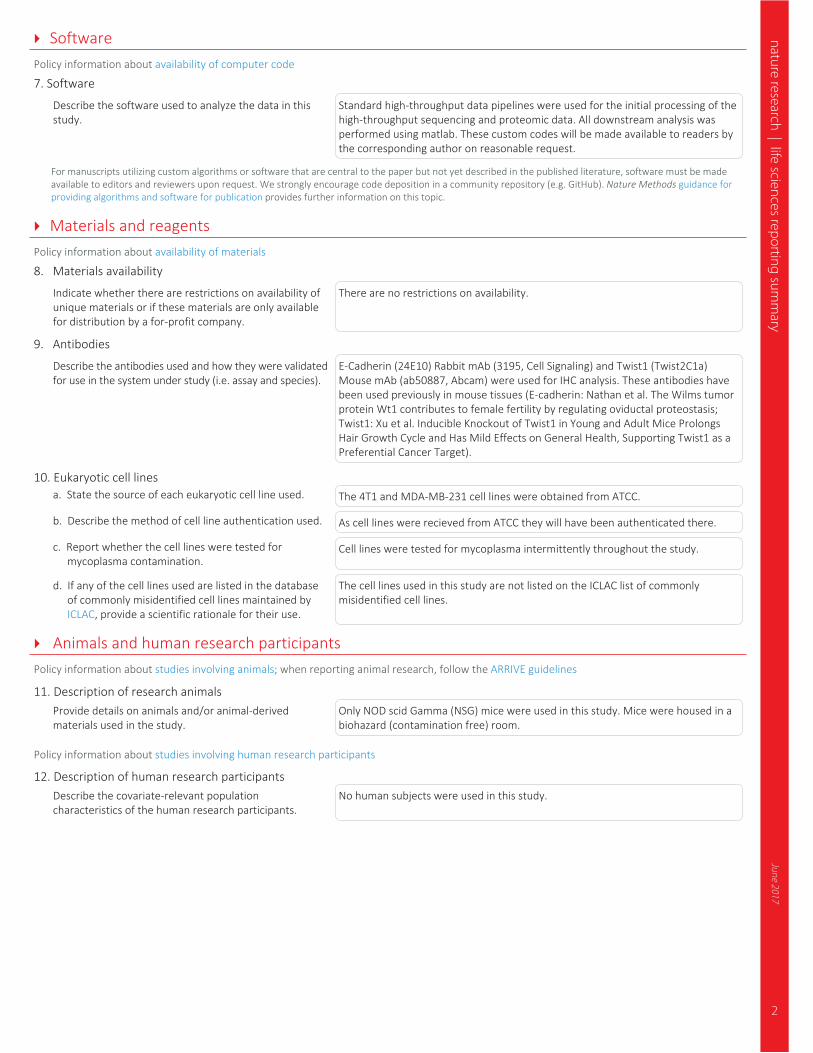
2
nature research | life sciences reporting summ
aryJune 2017
SoftwarePolicy information about availability of computer code
7. Software
Describe the software used to analyze the data in this study.
Standard high-throughput data pipelines were used for the initial processing of the high-throughput sequencing and proteomic data. All downstream analysis was performed using matlab. These custom codes will be made available to readers by the corresponding author on reasonable request.
For manuscripts utilizing custom algorithms or software that are central to the paper but not yet described in the published literature, software must be made available to editors and reviewers upon request. We strongly encourage code deposition in a community repository (e.g. GitHub). Nature Methods guidance for providing algorithms and software for publication provides further information on this topic.
Materials and reagentsPolicy information about availability of materials
8. Materials availability
Indicate whether there are restrictions on availability of unique materials or if these materials are only available for distribution by a for-profit company.
There are no restrictions on availability.
9. Antibodies
Describe the antibodies used and how they were validated for use in the system under study (i.e. assay and species).
E-Cadherin (24E10) Rabbit mAb (3195, Cell Signaling) and Twist1 (Twist2C1a) Mouse mAb (ab50887, Abcam) were used for IHC analysis. These antibodies have been used previously in mouse tissues (E-cadherin: Nathan et al. The Wilms tumor protein Wt1 contributes to female fertility by regulating oviductal proteostasis; Twist1: Xu et al. Inducible Knockout of Twist1 in Young and Adult Mice Prolongs Hair Growth Cycle and Has Mild Effects on General Health, Supporting Twist1 as a Preferential Cancer Target).
10. Eukaryotic cell linesa. State the source of each eukaryotic cell line used. The 4T1 and MDA-MB-231 cell lines were obtained from ATCC.
b. Describe the method of cell line authentication used. As cell lines were recieved from ATCC they will have been authenticated there.
c. Report whether the cell lines were tested for mycoplasma contamination.
Cell lines were tested for mycoplasma intermittently throughout the study.
d. If any of the cell lines used are listed in the database of commonly misidentified cell lines maintained by ICLAC, provide a scientific rationale for their use.
The cell lines used in this study are not listed on the ICLAC list of commonly misidentified cell lines.
Animals and human research participantsPolicy information about studies involving animals; when reporting animal research, follow the ARRIVE guidelines
11. Description of research animalsProvide details on animals and/or animal-derived materials used in the study.
Only NOD scid Gamma (NSG) mice were used in this study. Mice were housed in a biohazard (contamination free) room.
Policy information about studies involving human research participants
12. Description of human research participantsDescribe the covariate-relevant population characteristics of the human research participants.
No human subjects were used in this study.

nature research | flow cytom
etry reporting summ
aryJune 2017
1
Corresponding author(s): Gregory Hannon
Initial submission Revised version Final submission
Flow Cytometry Reporting Summary Form fields will expand as needed. Please do not leave fields blank.
Data presentationFor all flow cytometry data, confirm that:
1. The axis labels state the marker and fluorochrome used (e.g. CD4-FITC).
2. The axis scales are clearly visible. Include numbers along axes only for bottom left plot of group (a 'group' is an analysis of identical markers).
3. All plots are contour plots with outliers or pseudocolor plots.
4. A numerical value for number of cells or percentage (with statistics) is provided.
Methodological details5. Describe the sample preparation. For mouse and human cell lines (4T1 and MDA-MB-231), cells were
trypsinzed and washed in PBS, prior to flow cytometry analysis. Mouse primary tumors and lungs were minced and digested into single cells with 1× collagenase/hyaluronidase buffer (StemCell) and 10 U DNase I (Sigma) in DMEM high glucose media for 1 h at 37 °C. Cells were then washed in PBS twice before sorting.
6. Identify the instrument used for data collection. BD LSRII and Sony SH800 for analysis and BD FACSAria III for sorting.
7. Describe the software used to collect and analyze the flow cytometry data.
Data was collected with BD FACSDiva and Sony SH800 software. Flow cytometry data was analyzed using FlowJo (V.10)
8. Describe the abundance of the relevant cell populations within post-sort fractions.
Post-sort fractions were >90% as determined by a post-sort purity check of one representative sample.
9. Describe the gating strategy used. For analysis, preliminary FSC/SSC gates were drawn using uninfected or unstained 4T1 or MDA-MB-231 cell lines. mCherry positive gates were set at least one log fold away from the unstained/uninfected gates. For CellTrace violet, the intensity was measured among all viable cells. For tumors and lungs, preliminary FSC/SSC gates were drawn using uninfected and mCherry-infected 4T1 cells. mCherry positive gates were set at least one log fold away from the unstained/uninfected gates.
Tick this box to confirm that a figure exemplifying the gating strategy is provided in the Supplementary Information.