Embed Size (px)
Citation preview

Corporate Update
FC Research Analyst: Michelle Weerasinghe
SRI LANKA
NESTLÉ LANKA PLC HOLD
NEST.N0000 Mar 2016
Affordability stirs up demand
P/E 31 December 2013 2014 2015 2016E 2017E FY18E
Revenue (LKR mn) 30,913 32,903 35,855 40,337 46,185 53,344
Net Profit (LKR mn) 3,317 3,787 4,124 5,274 6,161 7,680
EPS (LKR) 61.7 70.5 76.8 98.2 114.7 140.3
YoY % Growth 13% 14% 9% 28% 17% 22%
Valuations
PER (x) 32.4 28.4 26.7 20.9 17.9 14.6
PBV (x) 25.5 26.3 24.4 24.1 23.8 23.8
Div Yield (%) 3.0% 3.4% 3.1% 4.7% 5.5% 6.8%
NAVPS 78.5 76.1 84.2 85.1 86.3 86.1
DPS (LKR) 60.0 68.5 64.5 97.2 113.5 138.9
Div Payout 97% 97% 84% 99% 99% 99%
Current Price: LKR 2,000.0 Fair Value: LKR 2,100.0
222150.5
Nestlé Lanka PLC is expected to keep up its growth momentum to achieve an
earnings CAGR of c.23% 2015-2018E. NEST’s margins which expanded due to
the decline in global commodity prices and energy prices is likely to be
maintained amidst the increase in affordability levels of middle income earners
driving NEST’s volumes. Further, an attractive return is expected from exports’
revenue contribution due to the rupee depreciation. NEST’s expensive multiples
sustained by strong growth leads to a fair value of LKR 2,100.0. HOLD
Revenue forecast at 14%: FC Research expects revenue to grow by c.49% in
2015-2018E growing at CAGR of c.14% throughout the period. Prices of Nestlé’s
products fall into the affordability level of Sri Lanka’s growing middle income
earning segment’s rising income (2014 GNI per capita - USD 3,460) leading it to
reach out to a wider group of consumers. Nestlé’s rapidly growing export
contribution (revenue contribution grew to 13% in 2014 from 11% in 2010)
dominated by exports is expected to support revenue further, strengthened by
the rupee depreciation.
GP margin maintained at 42%: FC Research expects to maintain the GP margin
target to reach c.42% by 2016E due to the advantage of lower cost of production.
The slump in global oil prices (WTI -4.26% YTD) and the slowdown in Chinese
economy have further led global commodity prices collapse making a
considerable impact on Nestlé’s raw materials such as wheat (-25% Jan-Nov
2015) and sugar (-2% YTD). Further, a growth in NEST’s volumes due to
economies of scale and price increase in products is further expected amid
increased affordability of consumers.
NEST overall return of 10% for 1 year period: NEST’s strong earnings growth
results in a CAGR of c.23% 2015-2018E. Our target price stands at LKR 2,100.0
providing a return of 10% including a dividend yield of 5%. [LKR 2,067.0 DCF
based, LKR 2,160.0 PER based, 2,021.0 DDM based]
Figure 1: NEST Price Volume Graph
Disclosure on Shareholding:
First Capital Equities (Pvt) Ltd and any of its
affiliates do not hold shares in NEST and will not
trade in this share for the seven trading days
following the issue of this document.
Source: CSE
KEY DATA
Share Price (LKR)
Average Daily Volume (Shares)
Average Daily Turnover (LKR)
53.7
Price Performance (%) 1 mth 3 mths 12mths
NEST 0% -9% -13%
ASPI -5% -12% -15%
90.82%
0.81%
0.64%
0.44%
0.37%
9.18%Estimated Free Float
Major Shareholders as at 31st Dec 2015
Nestle S A
HSBC International Nominees Ltd-SSBT
HSBC International Nominees Ltd-SSL
RBC Investor Services Bank
Ms Neesha Harnam
2,000.00
52w High/Low (LKR) 2,322.00 / 1,984.20
1,699
3,571,329
Issued Share Capital (Shares mn)
Market Capitalisation (LKR mn) 107,451

FC Research
2
“Affordability stirs up demand”
1.0 Introduction
“Local Multinational”: Nestle Lanka PLC is engaged in manufacturing,
marketing, selling and distribution of food and beverage products. It’ local
portfolio of products carry some of the renowned brands in the country
including Nestomalt, Milo, Milkmaid, Nespray and Maggi with 90% of its
products being manufactured at its production facility in Kurunegala.
Share Price Performance: NEST’s price had been ranging between LKR 2,320-
2,023 during the last 12 month period. Currently it trades at LKR 2,023, a -
12.8% decline in price since March 2015. With an estimated free float of
9.18% NEST has been recognized as an illiquid counter holding 4.17% of the
total market capitalization.
2.0 Revenue to grow at 14% CAGR 2015-18E
2.1 Growth in purchasing power & per capita GNI
GNI to grow at 13%: With the budgetary proposal on increasing the salary of
government sector employees by LKR 10,000 in March 2015 together with
implementation of several other proposals including reduction of energy
prices as well as commodity prices leading to improved purchasing power,
we expect Sri Lanka’s per capita GNI (Gross National Income) to grow at an
annual average of c.13% during 2015-2017E. GNI has grown at 12% CAGR in
2009-2014 and 13% CAGR in 2005-2009 displaying a healthy growth. Sri
Lanka’s GNI per capita in 2014 stands at USD 3,460, well above average South
Asia’s per capita GNI (USD 1,496) and that of lower middle income countries
(USD 2,012).
Figure 2: ASPI vs NEST
Source: FC Research
Figure 3: GNI per capita shows a steady growth compared to South Asian
Region and Lower Middle Income Countries
Source: The World Bank and FC Research Estimates

FC Research
3
“Affordability stirs up demand”
Source: Annual Reports
2.2 Exports continue growth at 15% annually
Exports to strengthen revenue: NEST, the world’s largest exporter of coconut
milk powder is expected to continue to grow its revenue by 15% annually
being in line with its historical trend of 15% CAGR 2010-14. NEST’s exports of
coconut milk powder accounts for a notable 13% of its 2014 revenue, LKR
4.3bn, a shift from 11% in 2010 revenue. Maggi Coconut Milk Powder is solely
developed in Sri Lanka and is now exported to nearly 60 countries across the
world. Despite volatility in coconut prices, Sri Lanka’s coconut milk powder
exports have grown both in value and volumes.
2.3 Negative publicity relating to Maggi noodles controversy
Marketing expense growth to moderate: Marketing expenses grew by
19.3%YoY in 2015 compared to 16.7%YoY in 2014. Going forward it is
expected that these expenses would moderate at c.19% through 2016E-
2017E and c.18% in 2018E.
Increase in marketing expenses in the past: For the past 8 quarters
marketing expenses had been increasing noticeably. For 4Q2015 and 3Q2015
marketing expenses had increased by 37%YoY for each quarter while
marketing to revenue ratio had rocketed to 25% in 4Q2015 from 15% in
1Q2015 due to Maggi noodles controversy in India. In 2015 marketing
expenses had increased by 26%YoY compared to 20% in 2014 and 19% in
2013. The increase in marketing expenses and promotional activities carried
out to gain market consolidation are expected to boost NEST’s revenue from
9% in 2015 to c.13% in 2016E.
Sink in Maggi noodles sales: In June 2015 Nestle India destroyed more than
USD50m worth of Maggi noodles, following a ban imposed by India's food
safety regulator. The regulator stated that tests have found the instant
noodles "unsafe and hazardous" and has accused Nestle of failing to comply
Figure 6: Marketing, Selling and Distribution
Expenses over past 8 quarters
Source: Quarterly Financial Reports
Figure 5: Export Revenue (Maggi Coconut Milk Powder)
2,000
2,500
3,000
3,500
4,000
4,500
LKR
(m
n)
CAGR 15% 2010-14
Figure 4: NEST Revenue Classification
87%
13%
Local Revenue Exports
Source: Annual Report

FC Research
4
“Affordability stirs up demand”
with food safety laws since it found higher-than-allowed levels of lead in
some packets. The negative publicity relating to India’s Maggi Noodles
controversy deemed to have hampered the revenue growth during 2015
compelling NEST to boost their Marketing, Sales and Distribution expenses
affecting the bottom line.
3.0 GP margin maintained at 42%
Margin to be maintained at 42%: NEST recorded a GP Margin of 42% in
4Q2015. We expect NEST’s margins to be maintained at the same level
(c.42%) by 2016E through 2018E from 40% in 2015 with growing economies
of scales and possible increases in prices due to affordability level of
consumers.
3.1 Exploiting the declining trend in commodity prices
Declining Food Index unlikely to rise: Food and Agriculture Organization of
the UN (FAO) Global Food Price Index fell 29% by end of January 2016
continuing the decline since April 2014. UN FAO the four year slump in world
food prices is unlikely to recover in the near future provided continuity in high
production and low energy costs in the industry.
Figure 8: UN FAO’s Global Food Index
Figure 7: GP margins
GP Margins are
expected to be
maintained at
c.42% 2016E-
2018E
Source: Annual Reports and FC Research estimates
Source: FAO

FC Research
5
“Affordability stirs up demand”
Figure 9: Global Wheat Prices
Figure 9: Global Raw Sugar Prices
Source: OECD
Source: FAO
Figure 10: Global Raw Sugar Prices
Source: OECD
Figure 11: Local Retail Fresh Milk Prices
Source: Dept. of Animal Production and Health
FC Research
6
“Affordability stirs up demand”
3.2 Favourable energy costs
Energy Cost Favourable on NEST: NEST will benefit from the
favourable energy cost prevailing in the country. The fuel costs and LP
gas prices were slashed as a result of implementation of budget
proposals (Diesel -21%YoY, LP Gas -16%YoY). This will help NEST to
reduce the cost pressure placed on production as well as selling and
distribution. Further, the Sky Lighting system, installed in 2013 which
reduces dependency on electrical power and uses day light in a
controlled manner inside manufacturing facilities and warehouses is
expected to deliver significant savings in electricity in the future.
85
90
95
100
105
110
115
120
125
LKR
pe
r Li
tre
Figure 12: Lanka Auto Diesel Prices
Figure 13: LP Gas Prices of 12.5kg Cylinder
Source: litrogas
Source: CEYPETCO

FC Research
7
“Affordability stirs up demand”
5.0 Expensive multiples but high growth
Expensive multiples sustained by high growth: NEST’s revenue is
expected to grow 2015E-18E CAGR of c.14% given the expected
increase in demand for NEST’s products while cost savings are to be
achieved by favourable energy costs and commodity prices. Hence FC
Research target price for NEST stands at LKR 2,100.0 The target price
of LKR 2,100.0 is based on the average price of LKR 2,067.0 via DCF
valuations, LKR 2,160.0 via PER based valuations and LKR 2,021.0 via
DDM based valuations.
5.1 Fair Value of LKR 2,100.0
We have obtained the target price of LKR 2,100.0 by rounding off the
value calculated by applying the DCF, DDM and PER techniques.
Expected NEST price for FY16E
DCF Valuation based target price 2,066.9
PER based target price 2,159.8
DDM based target price 2,021.0
Average Target Price 2,082.6
Return
Target Price 2,100.0
Current Price 2,000.0
Capital Gain (LKR) 100.0
Dividend FY16E (LKR) 97.2
Capital Gain % 5%
Dividend Yield % 5%
Total Return % 10%
P/E 31 December 2013 2014 2015 2016E 2017E FY18E
Revenue (LKR mn) 30,913 32,903 35,855 40,337 46,185 53,344
Net Profit (LKR mn) 3,317 3,787 4,124 5,274 6,161 7,680
EPS (LKR) 61.7 70.5 76.8 98.2 114.7 140.3
YoY % Growth 13% 14% 9% 28% 17% 22%
Valuations
PER (x) 32.4 28.4 26.7 20.9 17.9 14.6
PBV (x) 25.5 26.3 24.4 24.1 23.8 23.8
Div Yield (%) 3.0% 3.4% 3.1% 4.7% 5.5% 6.8%
NAVPS 78.5 76.1 84.2 85.1 86.3 86.1
DPS (LKR) 60.0 68.5 64.5 97.2 113.5 138.9
Div Payout 97% 97% 84% 99% 99% 99%
FC Research
8
“Affordability stirs up demand”
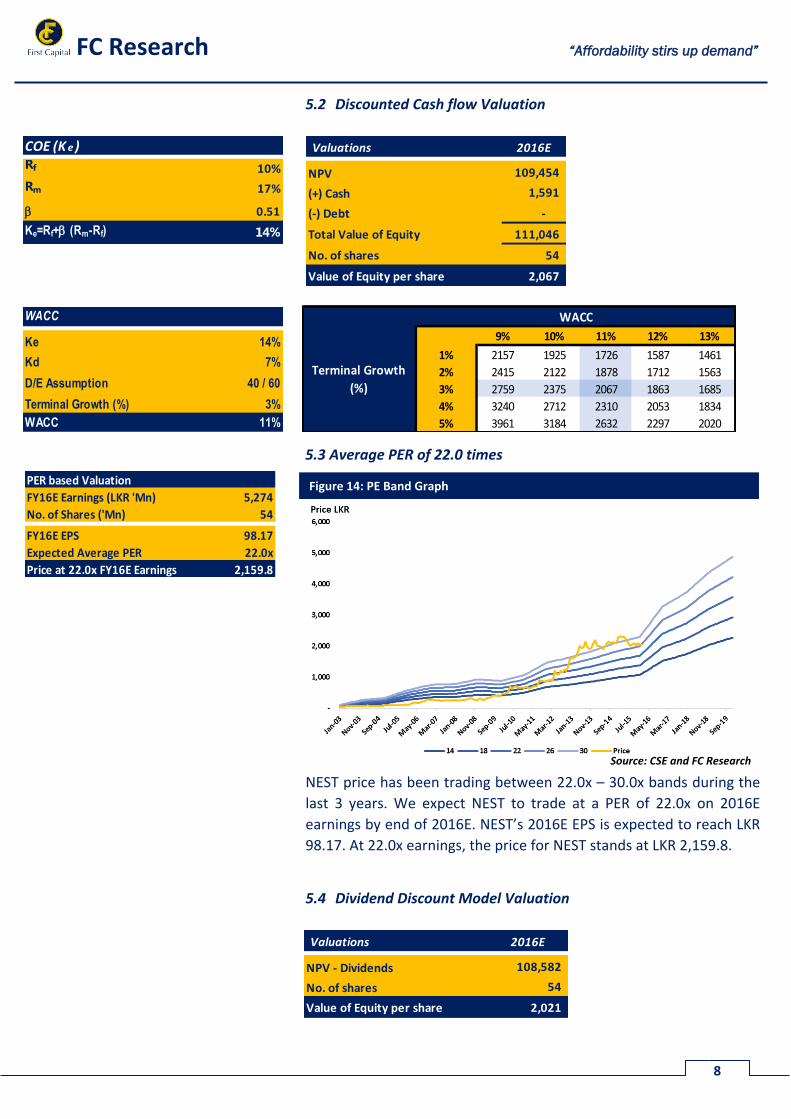
5.2 Discounted Cash flow Valuation
5.3 Average PER of 22.0 times
NEST price has been trading between 22.0x – 30.0x bands during the
last 3 years. We expect NEST to trade at a PER of 22.0x on 2016E
earnings by end of 2016E. NEST’s 2016E EPS is expected to reach LKR
98.17. At 22.0x earnings, the price for NEST stands at LKR 2,159.8.
5.4 Dividend Discount Model Valuation
Figure 14: PE Band Graph
Source: CSE and FC Research
Ke 14%
Kd 7%
D/E Assumption 40 / 60
Terminal Growth (%) 3%
WACC 11%
WACC
2067 9% 10% 11% 12% 13%
1% 2157 1925 1726 1587 1461
2% 2415 2122 1878 1712 1563
3% 2759 2375 2067 1863 1685
4% 3240 2712 2310 2053 1834
5% 3961 3184 2632 2297 2020
WACC
Terminal Growth
(%)
PER based Valuation
FY16E Earnings (LKR 'Mn) 5,274
No. of Shares ('Mn) 54
FY16E EPS 98.17
Expected Average PER 22.0x
Price at 22.0x FY16E Earnings 2,159.8
Valuations 2016E
NPV - Dividends 108,582
No. of shares 54
Value of Equity per share 2,021
Valuations 2016E
NPV 109,454
(+) Cash 1,591
(-) Debt -
Total Value of Equity 111,046
No. of shares 54
Value of Equity per share 2,067
COE (K e )Rf 10%
Rm 17%
0.51
Ke=Rf+ (Rm-Rf) 14%
FC Research
9
“Affordability stirs up demand”
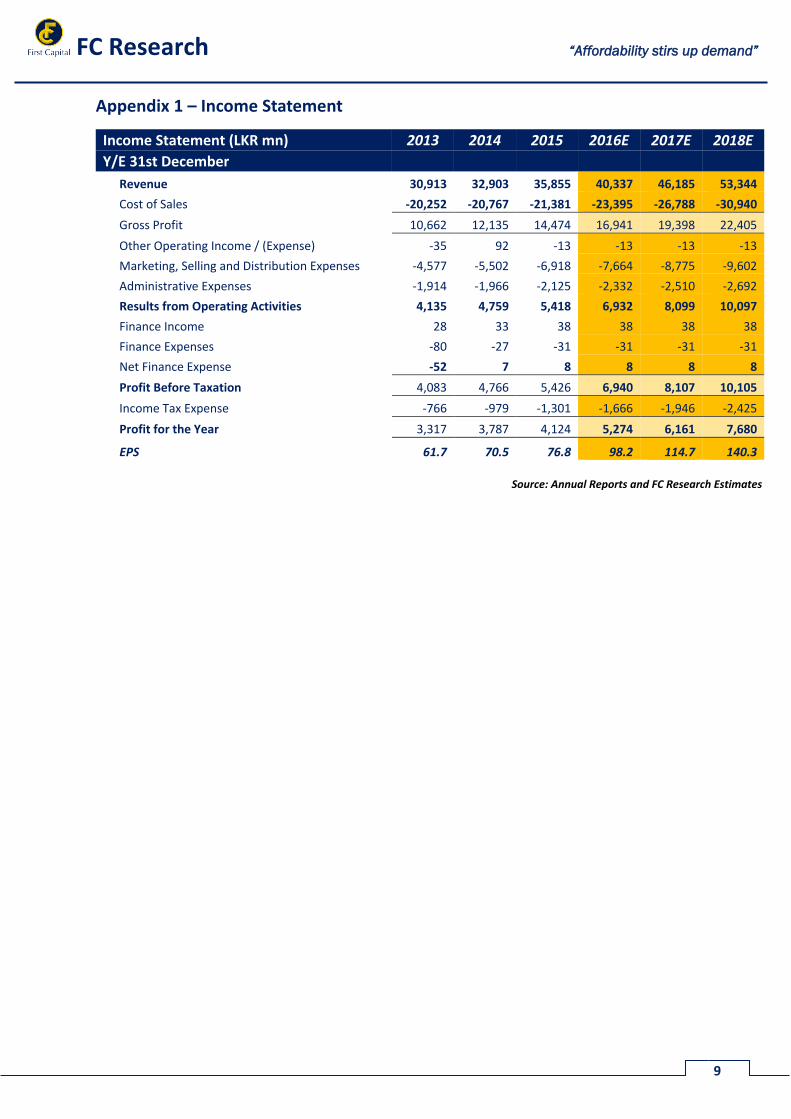
Appendix 1 – Income Statement
Income Statement (LKR mn) 2013 2014 2015 2016E 2017E 2018E
Y/E 31st December
Revenue 30,913 32,903 35,855 40,337 46,185 53,344
Cost of Sales -20,252 -20,767 -21,381 -23,395 -26,788 -30,940
Gross Profit 10,662 12,135 14,474 16,941 19,398 22,405
Other Operating Income / (Expense) -35 92 -13 -13 -13 -13
Marketing, Selling and Distribution Expenses -4,577 -5,502 -6,918 -7,664 -8,775 -9,602
Administrative Expenses -1,914 -1,966 -2,125 -2,332 -2,510 -2,692
Results from Operating Activities 4,135 4,759 5,418 6,932 8,099 10,097
Finance Income 28 33 38 38 38 38
Finance Expenses -80 -27 -31 -31 -31 -31
Net Finance Expense -52 7 8 8 8 8
Profit Before Taxation 4,083 4,766 5,426 6,940 8,107 10,105
Income Tax Expense -766 -979 -1,301 -1,666 -1,946 -2,425
Profit for the Year 3,317 3,787 4,124 5,274 6,161 7,680
EPS 61.7 70.5 76.8 98.2 114.7 140.3
Source: Annual Reports and FC Research Estimates

FC Research
10
“Affordability stirs up demand”
Appendix 2 – Balance Sheet
Balance Sheet (LKR mn) 2013 2014 2015 2016E 2017E 2018E
As at 31st December
ASSETS
Non-Currrent Assets
Property, Plant and Equipment 4,572 5,209 5,477 5,570 5,551 5,435
Capital Work-in-Progress 238 206 144 144 144 144
4,810 5,415 5,621 5,713 5,695 5,579
Current Assets
Inventories 2,604 2,953 3,322 2,420 2,771 3,201
Trade and Other Receivables 2,101 1,816 2,107 2,420 2,771 3,201
Amounts Due from Related Parties 228 305 204 204 204 204
Cash and Cash Equivalents 788 283 868 1,591 1,197 1,448
5,720 5,356 6,501 6,636 6,943 8,053
Total Assets 10,530 10,771 12,122 12,349 12,638 13,632
EQUITY AND LIABILITIES
Equity
Stated Capital 537 537 537 537 537 537
Retained Earnings 3,678 3,551 3,984 4,037 4,099 4,176
4,216 4,088 4,522 4,574 4,636 4,713
Non-Current Liabilities
Retirement Benefit Obligations 469 515 522 522 522 522
Deferred Tax Liabilities 460 641 699 699 699 699
929 1,156 1,222 1,222 1,222 1,222
Current Liabilities
Trade and Other Payables 2,975 3,765 4,137 4,211 4,286 4,950
Amounts Due to Related Parties 800 749 714 714 714 714
Income Tax Payable 619 706 942 1,043 1,195 1,448
Dividends Payable 88 103 137 137 137 137
Bank Overdrafts 904 205 448 448 448 448
Total Current Liabilities 5,385 5,527 6,379 6,553 6,781 7,698
Total Liabilities 6,314 6,683 7,600 7,775 8,002 8,919
Total Equity and Liabilities 10,530 10,771 12,122 12,350 12,638 13,632
NAVPS
78.5
76.1
84.2
85.1
86.3
86.1
Source: Annual Reports and FC Research Estimates

FC Research
11
“Affordability stirs up demand”
Appendix 3 – Cash flow Statement
Cash flow Statement (LKR mn) 2013 2014 2015 2016E 2017E 2018E Y/E 31st December Cash Flow from Operating Activities
Profit Before Taxation 4,083 4,766 5,426 6,940 8,107 10,105
Adjustments for;
Depreciation 540 548 603 657 668 666
Amortisation 11 0 0 0 0 0
Impairment of Fixed Assets 5 11 0 0 0 0 (Gain) / Loss on Sale of Property, Plant and Equipment 2 -47 -31 0 0 0
Amortisation of Staff Loan Interest 17 17 18 0 0 0
Interest Expense 80 25 31 31 31 31
Interest Income -28 -33 -29 -38 -38 -38
Provision for Obsolete Inventories 40 -8 0 0 0 0
Inventory Written Off 173 160 120 0 0 0
Provision for Impairment of Trade Receivables 6 11 8 0 0 0
Provision for Retirement Benefit Obligations 100 162 99 0 0 0
Net Fair Value Loss on Derivatives 0 1 0 0 0 0
Operating Profit Before Working Capital Changes 5,030 5,612 6,243 7,590 8,767 10,763
Working Capital Changes
(Increase) / Decrease in Inventories -944 -500 -462 902 -351 -430
(Increase) in Trade and Other Receivables -321 196 -197 -313 -351 -430
Increase / (Decrease) in Trade and Other Payables 801 738 310 74 75 664
Cash Generated From Operations 4,565 6,046 5,894 8,252 8,140 10,568
0 0 0 0 0 0
Interest Paid -80 -25 -31 -31 -31 -31
Income Tax Paid -474 -692 -1,000 -1,565 -1,793 -2,172
Retirement Benefit Obligations Paid -108 -181 -115 0 0 0
Net Cash Flows Generated from Operating Activities 3,903 5,147 4,110 6,657 6,317 8,365
Cash Flow from Investing Activities
Purchase of Property, Plant and Equipment -530 -1,166 -813 -750 -650 -550 Proceeds from Sale of Property, Plant and Equipment 66 49 35 0 0 0
Interest Received 10 16 11 38 38 38
Net Cash Flows Used in Investing Activities -455 -1,101 -767 -712 -612 -512
Cash Flow from Financing Activities
Dividends Paid -2,890 -3,853 -3,001 -5,222 -6,100 -7,603
Net Cash Flows Used in Financing Activities -2,890 -3,853 -3,001 -5,222 -6,100 -7,603
Net Decrease in Cash and Cash Equivalents 559 193 342 724 -395 251
Cash and Cash Equivalents at the Beginning of the Year -675 -116 77 419 1,143 748
Cash and Cash Equivalents at the End of the Year -116 77 419 1,143 748 999
Bank Overdrafts -904 -205 -448 -448 -448 -448
Cash in Hand and Balances with Bank 788 283 868 1,591 1,197 1,448
Source: Annual Reports and FC Research Estimates

347 1/1, Dr. Colvin R. De Silva Mawatha,
Colombo 2
Sales Desk: +94 11 2145 000
Fax: +94 11 2145 050
HEAD OFFICE BRANCHES
347 1/1, Matara Negombo
Dr. Colvin R. De Silva Mawatha, No. 24, 1/3, 2nd Floor, No.72A, 2/1,
Colombo 2 Lakshman Cooray Building, Old Chilaw Road,
Anagarika Dharmapala Mw, Negombo
Sales Desk: +94 11 2145 000 Matara
Fax: +94 11 2145 050 Tel: +94 41 2237 636 Tel: +94 31 2233 299
SALES BRANCHES
CEO Jaliya Wijeratne +94 71 5329 602 Negombo
Priyanka Anuruddha +94 76 6910 035
Colombo Priyantha Wijesiri +94 76 6910 036
Damian Le Grand +94 77 7383 237
Nishantha Mudalige +94 76 6910 041 Matara
Isuru Jayawardana +94 76 7084 953 Sumeda Jayawardana +94 76 6910 038
Anushka Buddhika +94 77 9553 613
Kapila Weerasinghe +94 71 5329 615
Gamini Hettiarachchi +94 76 6910 039
Thushara Abeyratne +94 76 6910 037
RESEARCH
Dimantha Mathew +94 11 2145 016 Amanda Lokugamage +94 11 2145 015
Atchuthan Srirangan +94 11 2145 017 Michelle Weerasinghe +94 11 2145 018
FIRST CAPITAL GROUP
HEAD OFFICE BRANCHES
No. 2, Deal Place, Matara Kurunegala Kandy
Colombo 3 No. 24, 1/3, 2nd Floor, No. 6, 1st Floor, No.213-215,
Tel: +94 11 2576 878 Lakshman Cooray Building, Union Assurance Building, Peradeniya Road,
Anagarika Dharmapala Mawatha, Rajapihilla Mawatha, Kandy
Matara Kurunegala
Tel: +94 41 2222 988 Tel: +94 37 2222 930 Tel: +94 81 2236 010
Disclaimer:This Review is prepared and issued by First Capital Equities (Pvt) Ltd. and is based on information available in the public domain, internally developed and other sources believed
to be correct. Although all reasonable care has been taken to ensure that the contents of this document are accurate, First Capital Equities (Pvt) Ltd and its Directors and
employees, are not responsible for its accuracy, usefulness and reliability and disclaim liability for any loss suffered by the use of information contained herein.
First Capital Equities (Pvt) Ltd may act as a Broker in the investments which are the subject of this document or any related investments and may have acted on or have used the
information contained in this document, or the research or analysis on which it is based, before its publication.
First Capital Equities (Pvt) Ltd


![2015 / 16...Southampton FC Stoke City FC Sunderland AFC Swansea City AFC Tottenham Hotspur FC [London ] Watford FC West Bromwich Albion FC West Ham United FC [London ] …](https://img.pdfslide.net/doc/110x75/6147d88ca830d0442101b33e/2015-16-southampton-fc-stoke-city-fc-sunderland-afc-swansea-city-afc-tottenham.jpg)