Embed Size (px)
Citation preview
NESTLÉ SA NESCAFE STRATEGIC PLAN 2020
Ripe Change, The Nestlé Way
HEC CSV Group, Nestle SA Christopher Sharp | Kim Bergeron | Gert Kongehl | Deniz Eras
Agenda Introduc)on Analysis Alterna)ve Implementa)on Financials Conclusion
1. ExecuBve Summary 2. Context & Problem Statement 3. Business Environment Scan 4. Key Success Factors 5. OpBons and AlternaBves 6. The SoluBon 7. ImplementaBon Plan 8. Financials 9. Key Takeaways
Execu:ve Summary Introduc)on Analysis Alterna)ve Implementa)on Financials Conclusion
Hybrid Strategic Plan • 2 Pronged Approach
1. Nestle Owned and Operated Farms • Long-‐term leases, backward integraBon, 4C method • Constant and reliable source of green coffee beans
2. Fairtrade© CerBfied Local Partners • Close work with local farmers • Achieve higher margins with minimum equitable floor price
Context & Problem Statement Introduc)on Analysis Alterna)ve Implementa)on Financials Conclusion
Context: Nestle SA is currently evaluaBng opBons to saBsfy, and potenBally exceed, a three fold mandate with respect to our NESCAFE 2020 plan in China. Problem Statement: How can Nestle create common shared value (CSV) for all stakeholders involved in our Chinese coffee farming, produc)on and end-‐user consump)on acBviBes?
Business Environment Scan Introduc)on Analysis Alterna)ve Implementa)on Financials Conclusion
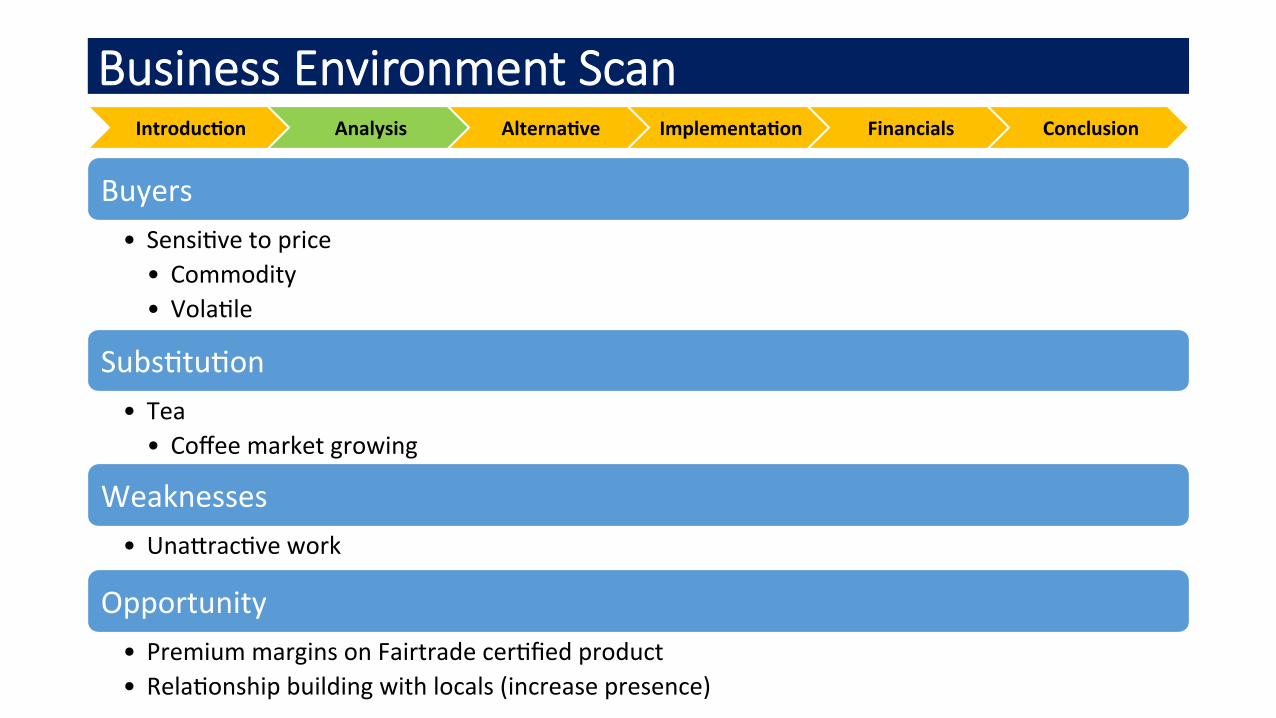
Buyers • SensiBve to price • Commodity • VolaBle
SubsBtuBon • Tea • Coffee market growing
Weaknesses • UnaeracBve work
Opportunity • Premium margins on Fairtrade cerBfied product • RelaBonship building with locals (increase presence)
Business Environment Scan Introduc)on Analysis Alterna)ve Implementa)on Financials Conclusion
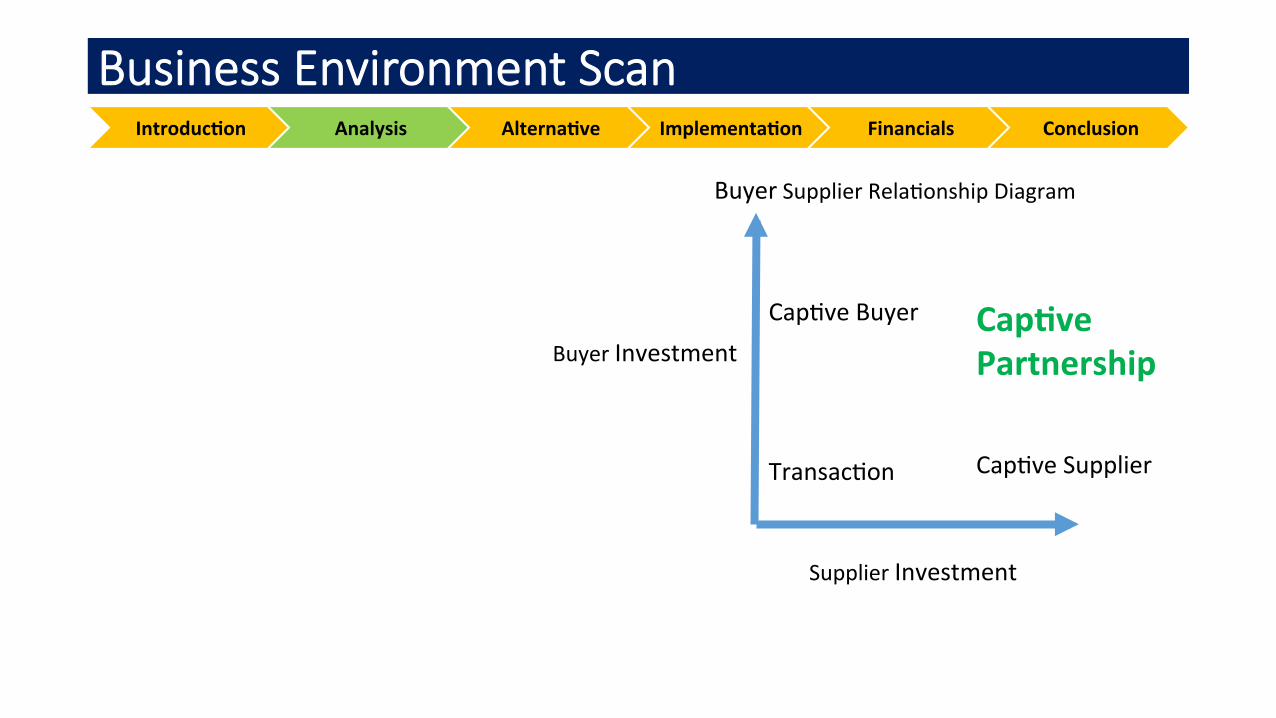
Buyer Investment
Supplier Investment
CapBve Buyer TransacBon
Cap)ve Partnership CapBve Supplier
Buyer Supplier RelaBonship Diagram
Stakeholders analysis Introduc)on Analysis Alterna)ve Implementa)on Financials Conclusion
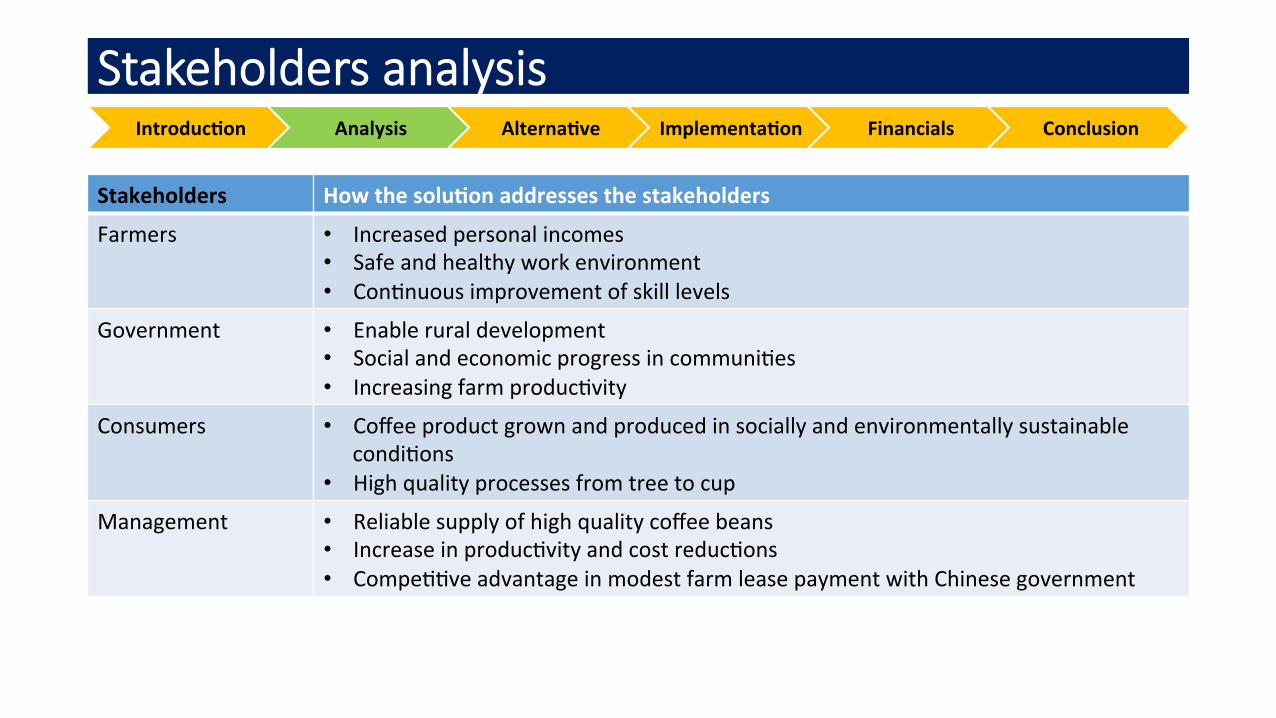
Stakeholders How the solu)on addresses the stakeholders
Farmers • Increased personal incomes • Safe and healthy work environment • ConBnuous improvement of skill levels
Government • Enable rural development • Social and economic progress in communiBes • Increasing farm producBvity
Consumers • Coffee product grown and produced in socially and environmentally sustainable condiBons
• High quality processes from tree to cup
Management • Reliable supply of high quality coffee beans • Increase in producBvity and cost reducBons • CompeBBve advantage in modest farm lease payment with Chinese government
Key Success Factors Introduc)on Analysis Alterna)ve Implementa)on Financials Conclusion
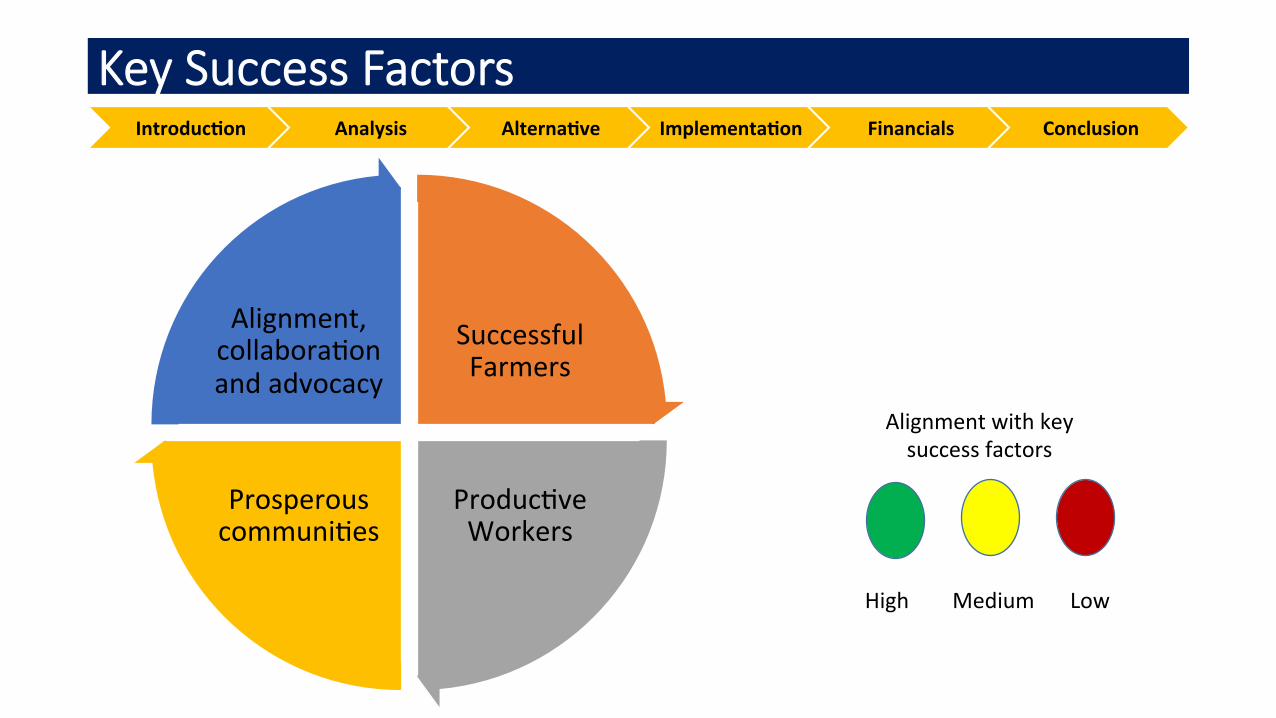
High Medium Low
Alignment with key success factors
Successful Farmers
ProducBve Workers
Prosperous communiBes
Alignment, collaboraBon and advocacy
Alterna:ves Introduc)on Analysis Alterna)ve Implementa)on Financials Conclusion
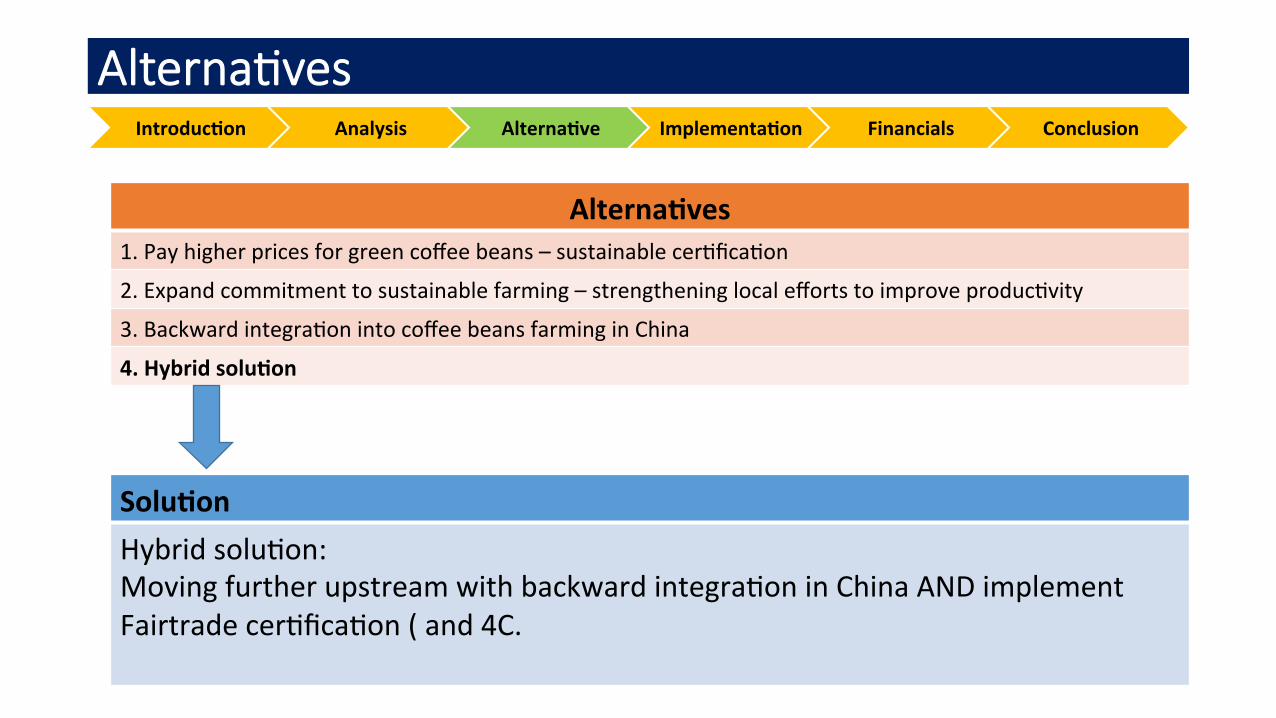
Alterna)ves 1. Pay higher prices for green coffee beans – sustainable cerBficaBon
2. Expand commitment to sustainable farming – strengthening local efforts to improve producBvity
3. Backward integraBon into coffee beans farming in China
4. Hybrid solu)on
Solu)on Hybrid soluBon: Moving further upstream with backward integraBon in China AND implement Fairtrade cerBficaBon ( and 4C.
Analysis of alterna:ves Introduc)on Analysis Alterna)ve Implementa)on Financials Conclusion
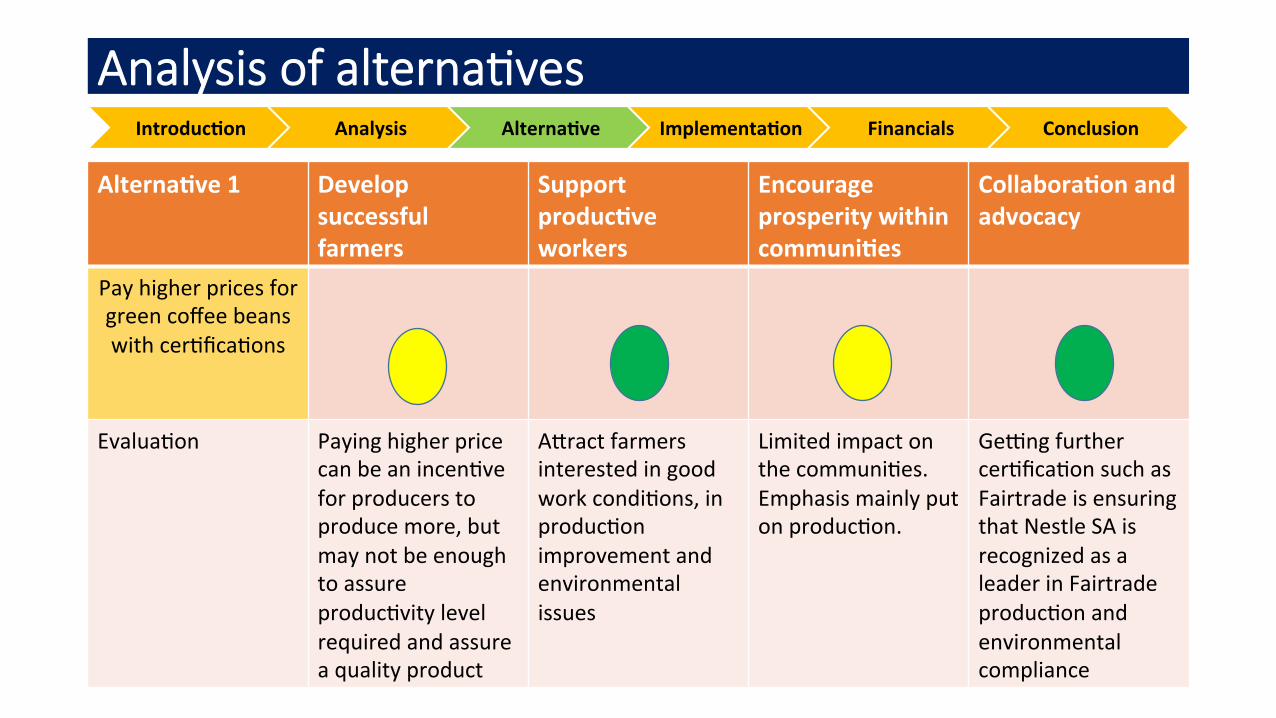
Alterna)ve 1
Develop successful farmers
Support produc)ve workers
Encourage prosperity within communi)es
Collabora)on and advocacy
Pay higher prices for green coffee beans with cerBficaBons
EvaluaBon Paying higher price can be an incenBve for producers to produce more, but may not be enough to assure producBvity level required and assure a quality product
Aeract farmers interested in good work condiBons, in producBon improvement and environmental issues
Limited impact on the communiBes. Emphasis mainly put on producBon.
Gekng further cerBficaBon such as Fairtrade is ensuring that Nestle SA is recognized as a leader in Fairtrade producBon and environmental compliance
Analysis of alterna:ves Introduc)on Analysis Alterna)ve Implementa)on Financials Conclusion
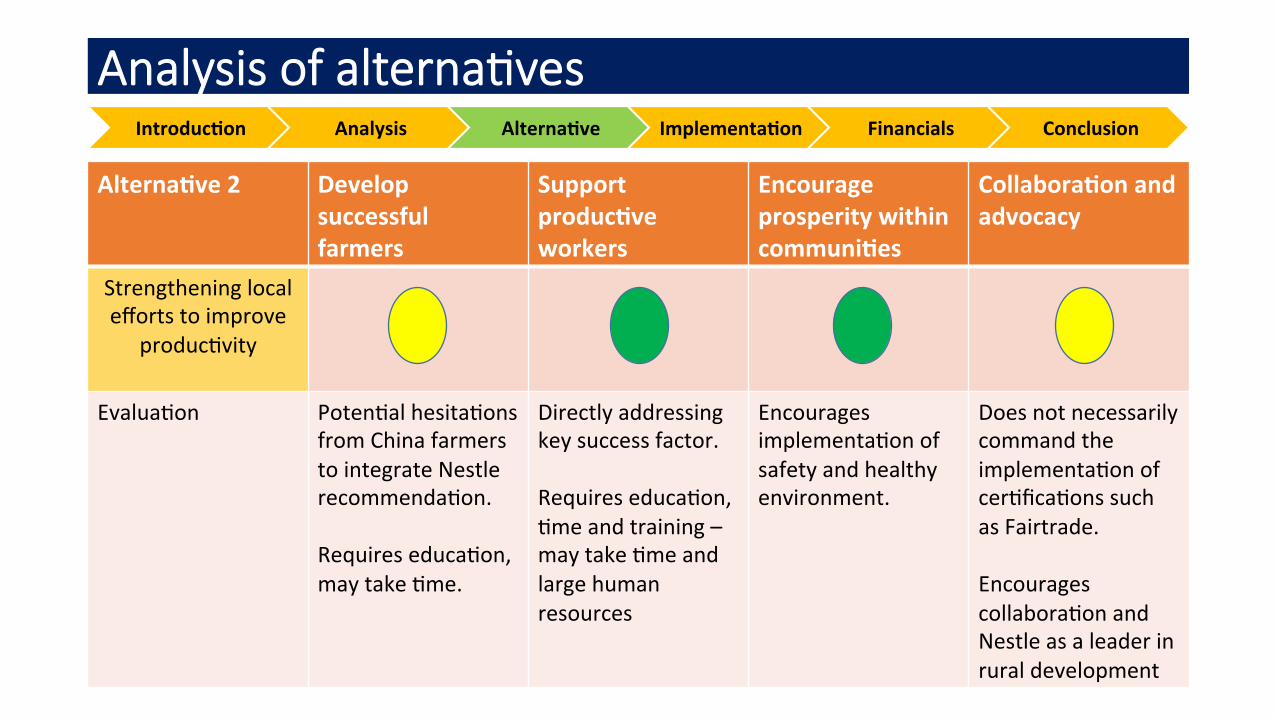
Alterna)ve 2
Develop successful farmers
Support produc)ve workers
Encourage prosperity within communi)es
Collabora)on and advocacy
Strengthening local efforts to improve
producBvity
EvaluaBon PotenBal hesitaBons from China farmers to integrate Nestle recommendaBon. Requires educaBon, may take Bme.
Directly addressing key success factor. Requires educaBon, Bme and training – may take Bme and large human resources
Encourages implementaBon of safety and healthy environment.
Does not necessarily command the implementaBon of cerBficaBons such as Fairtrade. Encourages collaboraBon and Nestle as a leader in rural development
Analysis of alterna:ves Introduc)on Analysis Alterna)ve Implementa)on Financials Conclusion
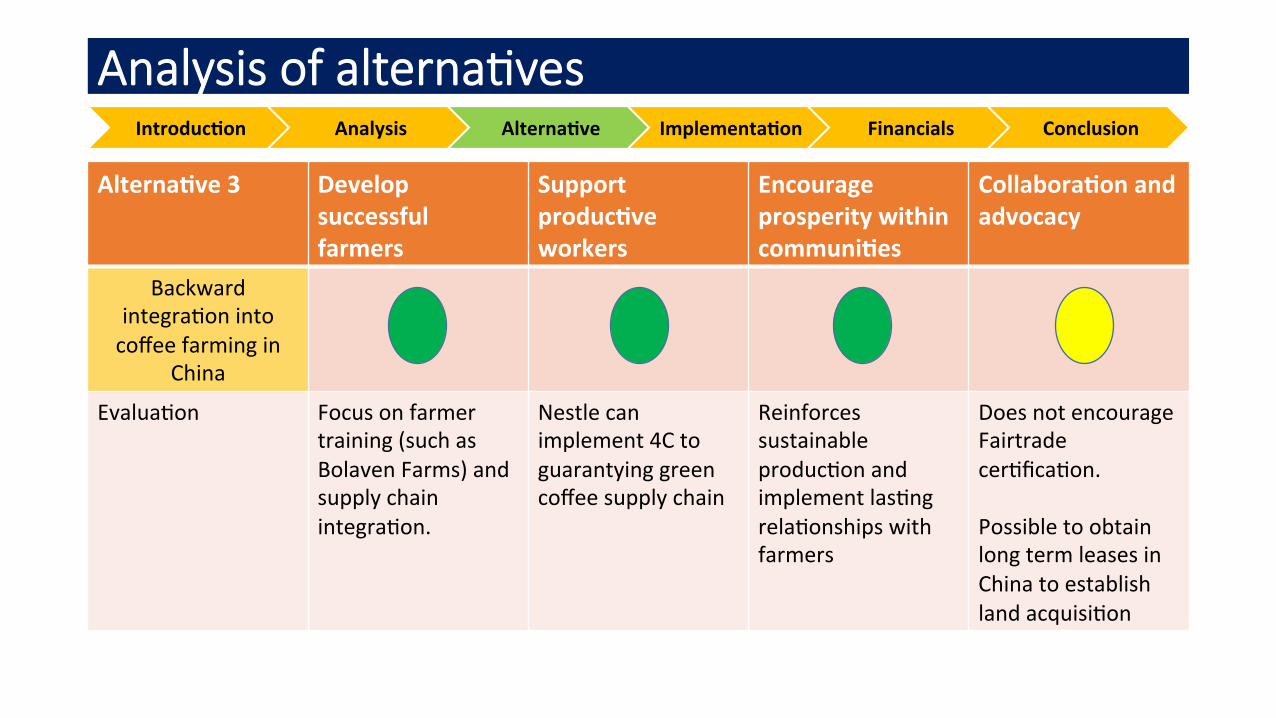
Alterna)ve 3
Develop successful farmers
Support produc)ve workers
Encourage prosperity within communi)es
Collabora)on and advocacy
Backward integraBon into coffee farming in
China
EvaluaBon Focus on farmer training (such as Bolaven Farms) and supply chain integraBon.
Nestle can implement 4C to guarantying green coffee supply chain
Reinforces sustainable producBon and implement lasBng relaBonships with farmers
Does not encourage Fairtrade cerBficaBon. Possible to obtain long term leases in China to establish land acquisiBon
Solu:on Introduc)on Analysis Alterna)ve Implementa)on Financials Conclusion
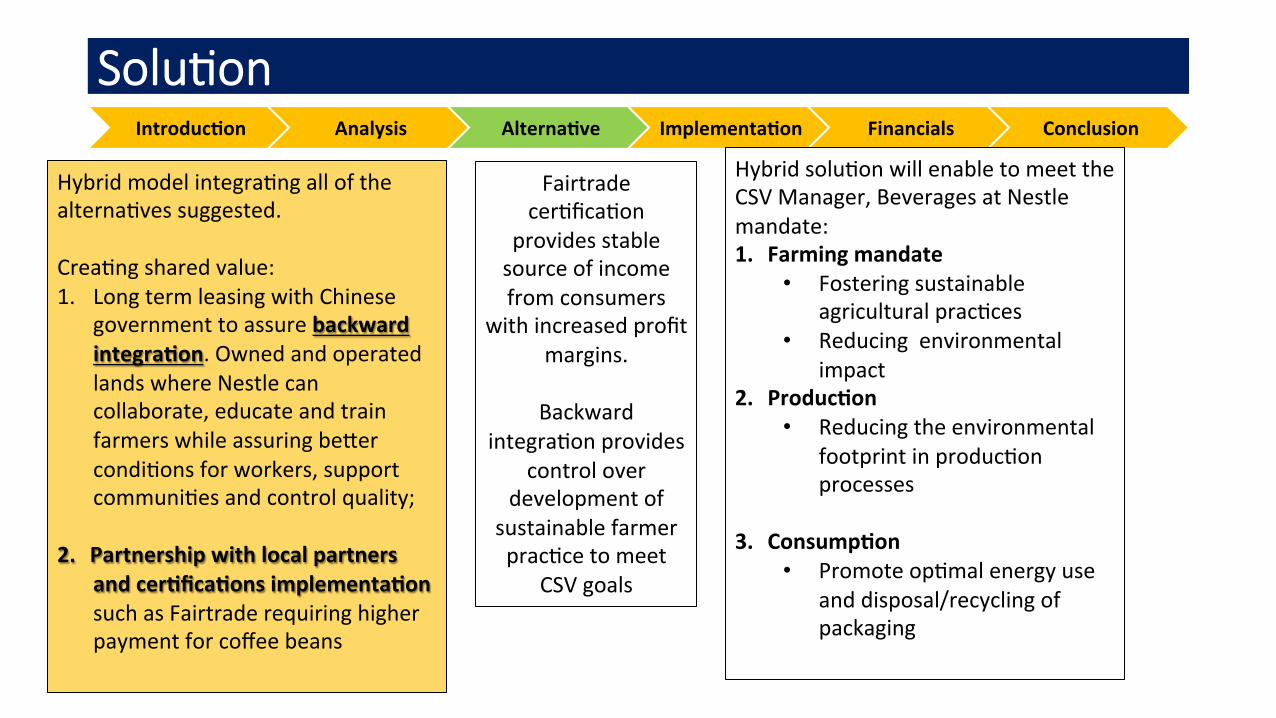
Hybrid soluBon will enable to meet the CSV Manager, Beverages at Nestle mandate: 1. Farming mandate
• Fostering sustainable agricultural pracBces
• Reducing environmental impact
2. Produc)on • Reducing the environmental
footprint in producBon processes
3. Consump)on • Promote opBmal energy use
and disposal/recycling of packaging
Hybrid model integraBng all of the alternaBves suggested. CreaBng shared value: 1. Long term leasing with Chinese
government to assure backward integra)on. Owned and operated lands where Nestle can collaborate, educate and train farmers while assuring beeer condiBons for workers, support communiBes and control quality;
2. Partnership with local partners and cer)fica)ons implementa)on such as Fairtrade requiring higher payment for coffee beans
Fairtrade cerBficaBon
provides stable source of income from consumers
with increased profit margins.
Backward
integraBon provides control over
development of sustainable farmer pracBce to meet
CSV goals
Marke:ng Plan Introduc)on Analysis Alterna)ve Implementa)on Financials Conclusion
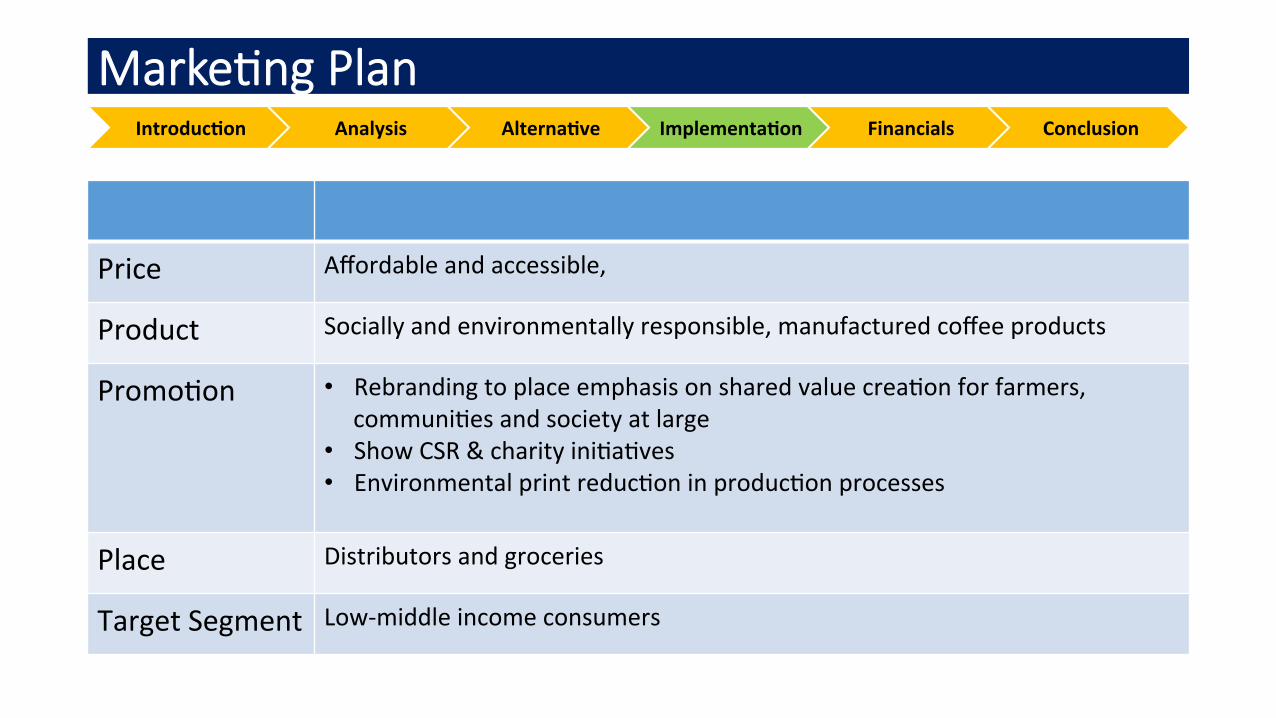
Price Affordable and accessible,
Product Socially and environmentally responsible, manufactured coffee products
PromoBon • Rebranding to place emphasis on shared value creaBon for farmers, communiBes and society at large
• Show CSR & charity iniBaBves • Environmental print reducBon in producBon processes
Place Distributors and groceries
Target Segment Low-‐middle income consumers
GanL Introduc)on Analysis Alterna)ve Implementa)on Financials Conclusion
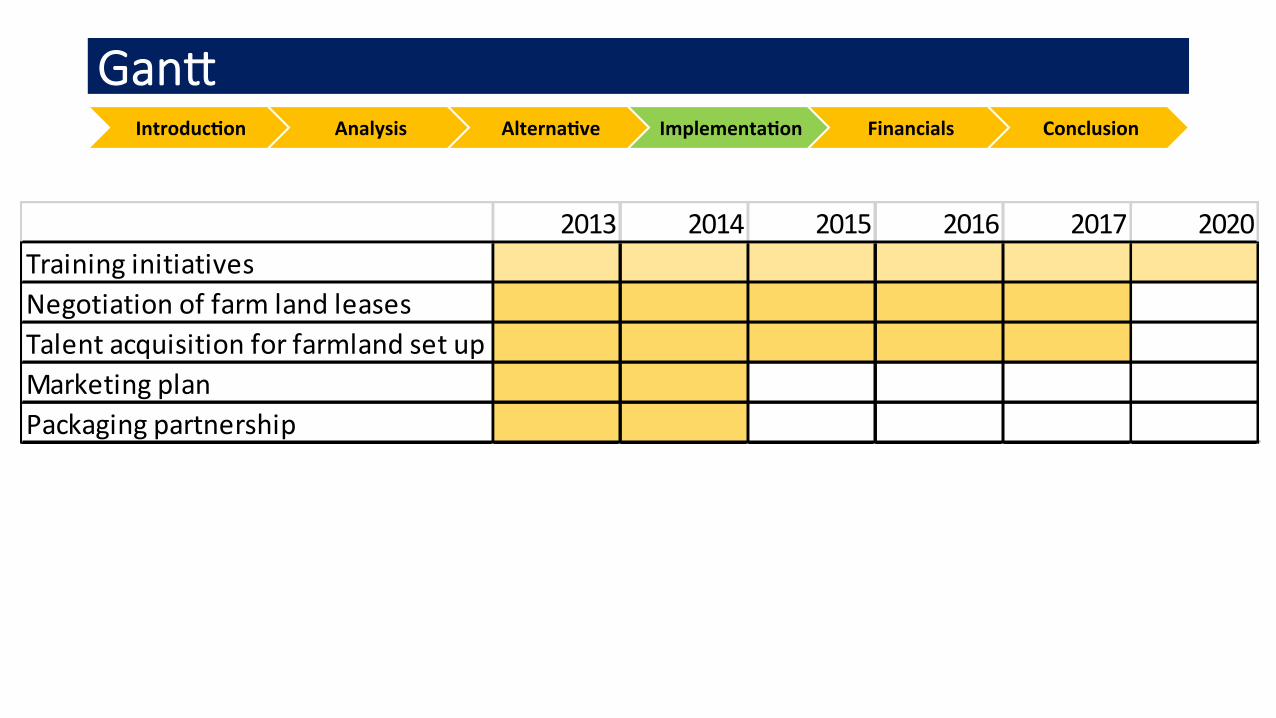
2013 2014 2015 2016 2017 2020Training initiativesNegotiation of farm land leasesTalent acquisition for farmland set upMarketing planPackaging partnership
Risks and mi:ga:on Introduc)on Analysis Alterna)ve Implementa)on Financials Conclusion
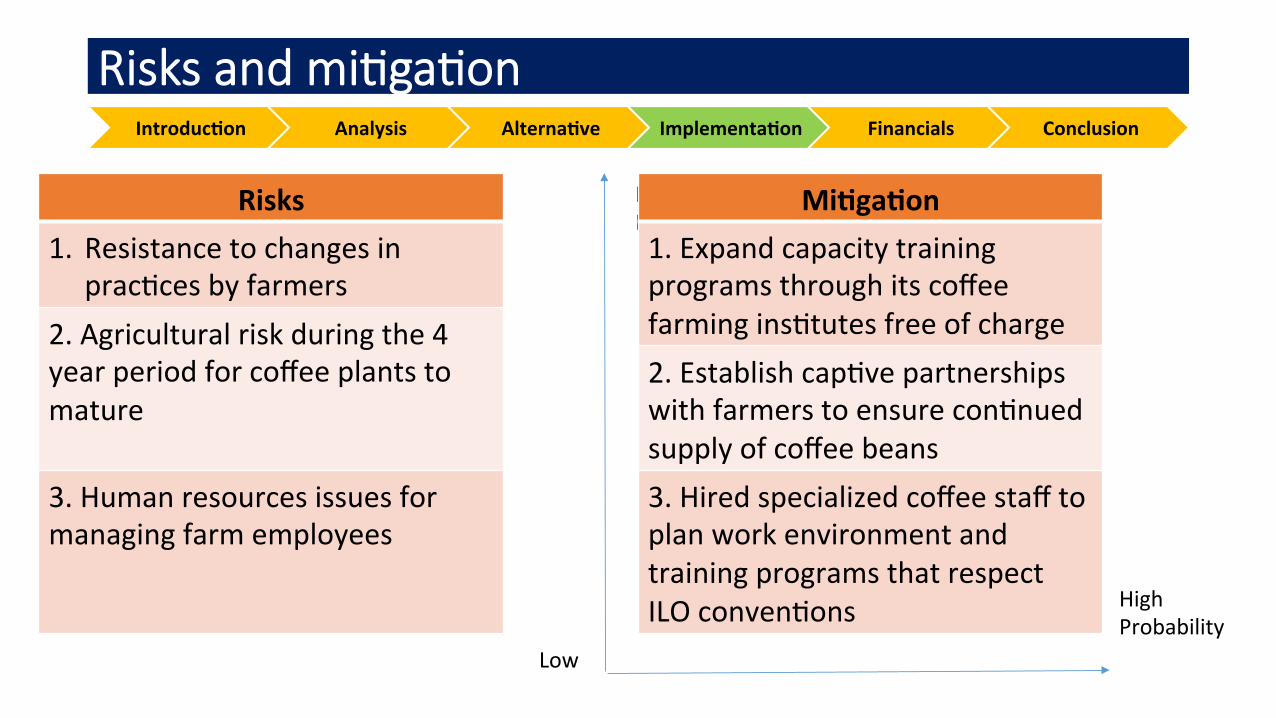
High Impact
High Probability
Low
1
2 3
Risks 1. Resistance to changes in
pracBces by farmers 2. Agricultural risk during the 4 year period for coffee plants to mature 3. Human resources issues for managing farm employees
Mi)ga)on 1. Expand capacity training programs through its coffee farming insBtutes free of charge 2. Establish capBve partnerships with farmers to ensure conBnued supply of coffee beans 3. Hired specialized coffee staff to plan work environment and training programs that respect ILO convenBons
Financials Introduc)on Analysis Alterna)ve Implementa)on Financials Conclusion
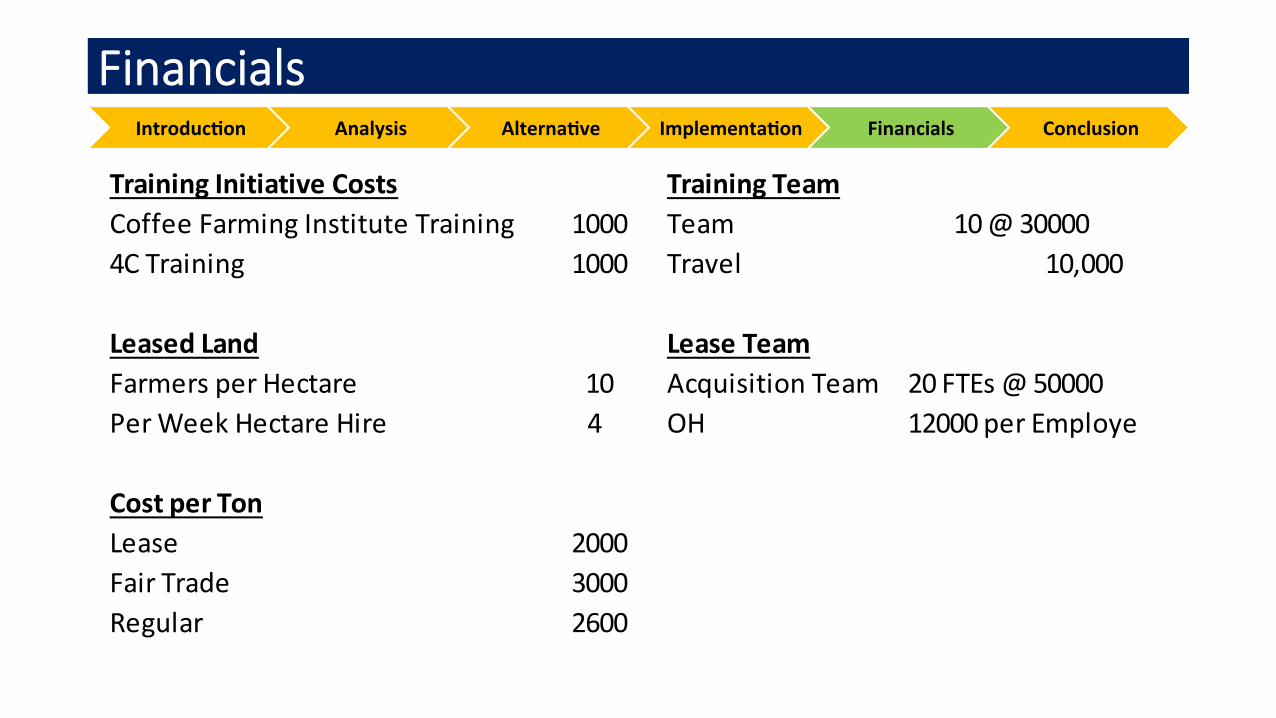
Training Initiative Costs Training TeamCoffee Farming Institute Training 1000 Team 10 @ 300004C Training 1000 Travel 10,000
Leased Land Lease TeamFarmers per Hectare 10 Acquisition Team 20 FTEs @ 50000Per Week Hectare Hire 4 OH 12000 per Employee
Cost per TonLease 2000Fair Trade 3000Regular 2600
Financials Revenues Introduc)on Analysis Alterna)ve Implementa)on Financials Conclusion
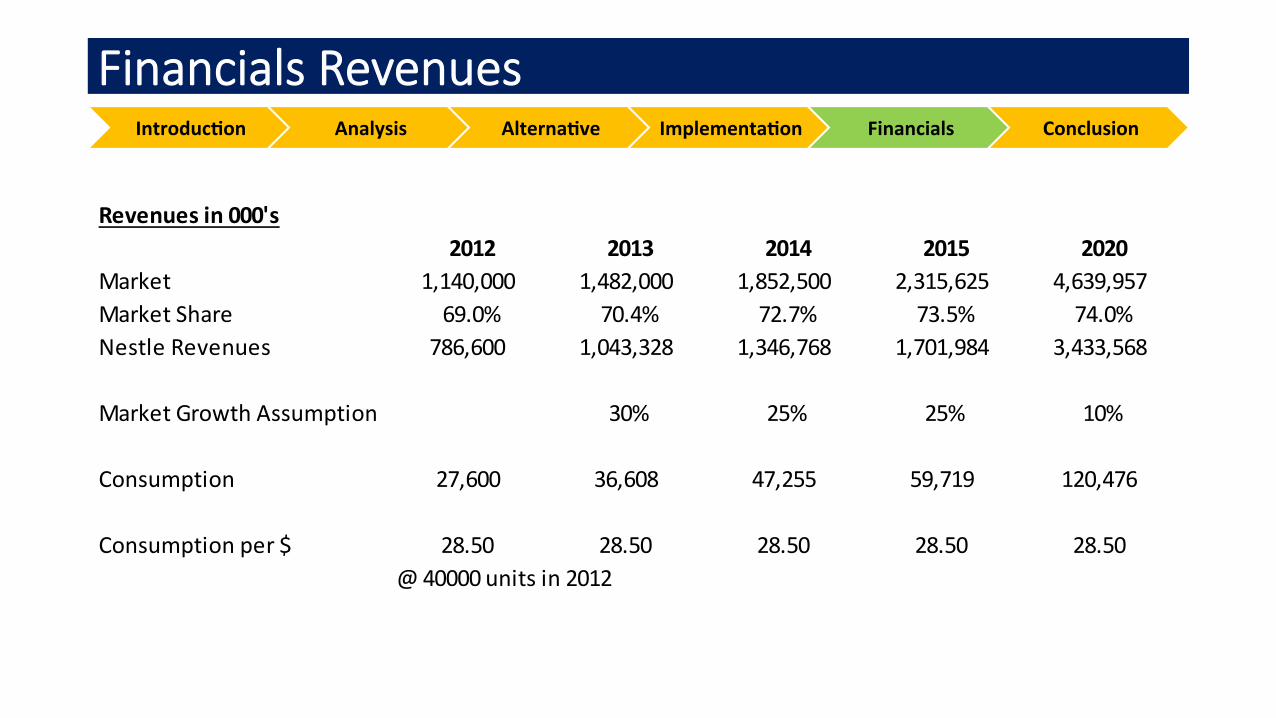
Revenues in 000's2012 2013 2014 2015 2020
Market 1,140,000 1,482,000 1,852,500 2,315,625 4,639,957Market Share 69.0% 70.4% 72.7% 73.5% 74.0%Nestle Revenues 786,600 1,043,328 1,346,768 1,701,984 3,433,568
Market Growth Assumption 30% 25% 25% 10%
Consumption 27,600 36,608 47,255 59,719 120,476
Consumption per $ 28.50 28.50 28.50 28.50 28.50@ 40000 units in 2012
Financials Costs Introduc)on Analysis Alterna)ve Implementa)on Financials Conclusion
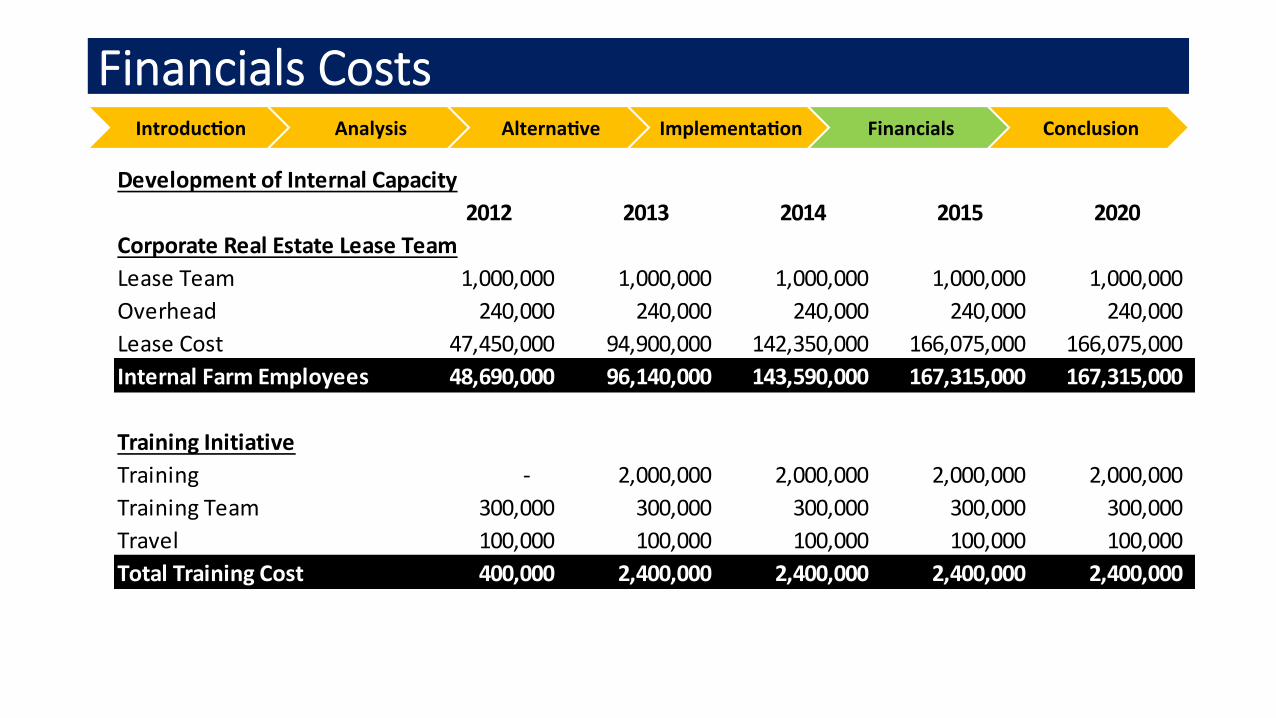
Development of Internal Capacity2012 2013 2014 2015 2020
Corporate Real Estate Lease TeamLease Team 1,000,000 1,000,000 1,000,000 1,000,000 1,000,000 Overhead 240,000 240,000 240,000 240,000 240,000 Lease Cost 47,450,000 94,900,000 142,350,000 166,075,000 166,075,000 Internal Farm Employees 48,690,000 96,140,000 143,590,000 167,315,000 167,315,000
Training InitiativeTraining -‐ 2,000,000 2,000,000 2,000,000 2,000,000 Training Team 300,000 300,000 300,000 300,000 300,000 Travel 100,000 100,000 100,000 100,000 100,000 Total Training Cost 400,000 2,400,000 2,400,000 2,400,000 2,400,000
Financials Costs Introduc)on Analysis Alterna)ve Implementa)on Financials Conclusion
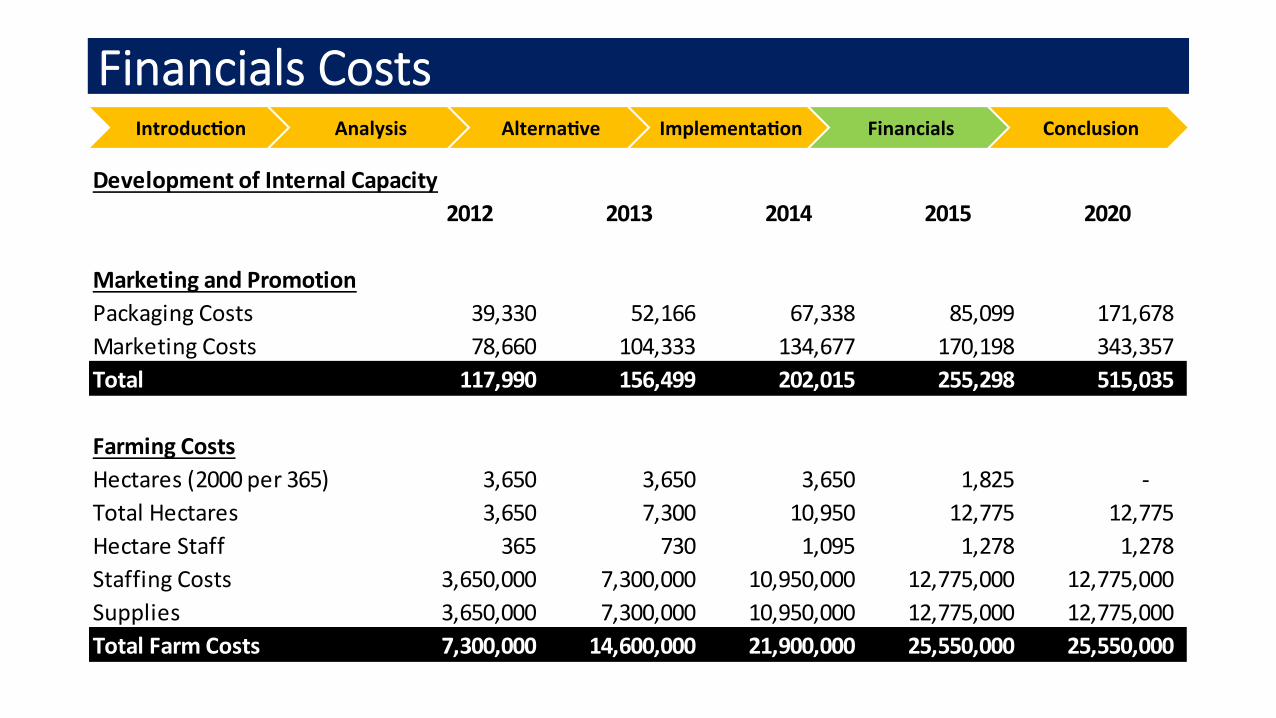
Development of Internal Capacity2012 2013 2014 2015 2020
Marketing and PromotionPackaging Costs 39,330 52,166 67,338 85,099 171,678 Marketing Costs 78,660 104,333 134,677 170,198 343,357 Total 117,990 156,499 202,015 255,298 515,035
Farming CostsHectares (2000 per 365) 3,650 3,650 3,650 1,825 -‐ Total Hectares 3,650 7,300 10,950 12,775 12,775 Hectare Staff 365 730 1,095 1,278 1,278 Staffing Costs 3,650,000 7,300,000 10,950,000 12,775,000 12,775,000 Supplies 3,650,000 7,300,000 10,950,000 12,775,000 12,775,000 Total Farm Costs 7,300,000 14,600,000 21,900,000 25,550,000 25,550,000
Financials Introduc)on Analysis Alterna)ve Implementa)on Financials Conclusion
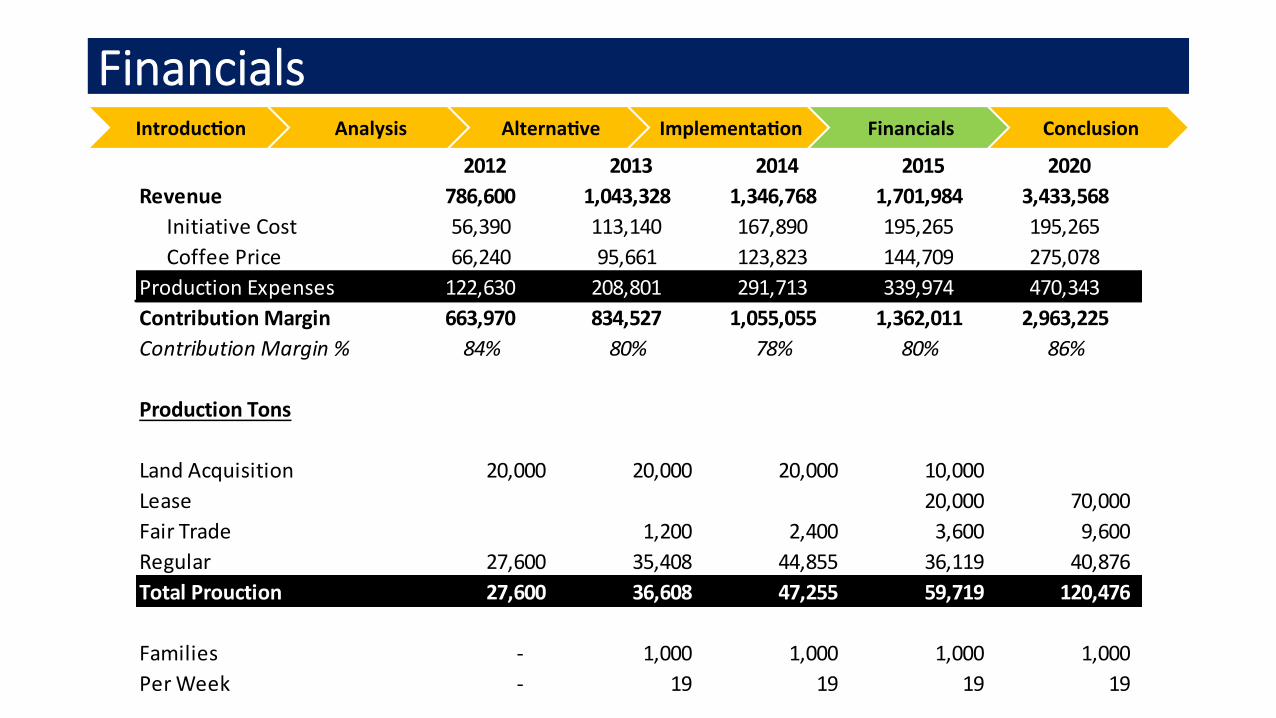
2012 2013 2014 2015 2020Revenue 786,600 1,043,328 1,346,768 1,701,984 3,433,568
Initiative Cost 56,390 113,140 167,890 195,265 195,265Coffee Price 66,240 95,661 123,823 144,709 275,078
Production Expenses 122,630 208,801 291,713 339,974 470,343Contribution Margin 663,970 834,527 1,055,055 1,362,011 2,963,225Contribution Margin % 84% 80% 78% 80% 86%
Production Tons
Land Acquisition 20,000 20,000 20,000 10,000 Lease 20,000 70,000 Fair Trade 1,200 2,400 3,600 9,600 Regular 27,600 35,408 44,855 36,119 40,876 Total Prouction 27,600 36,608 47,255 59,719 120,476
Families -‐ 1,000 1,000 1,000 1,000 Per Week -‐ 19 19 19 19
Key Takeaways Introduc)on Analysis Alterna)ve Implementa)on Financials Conclusion
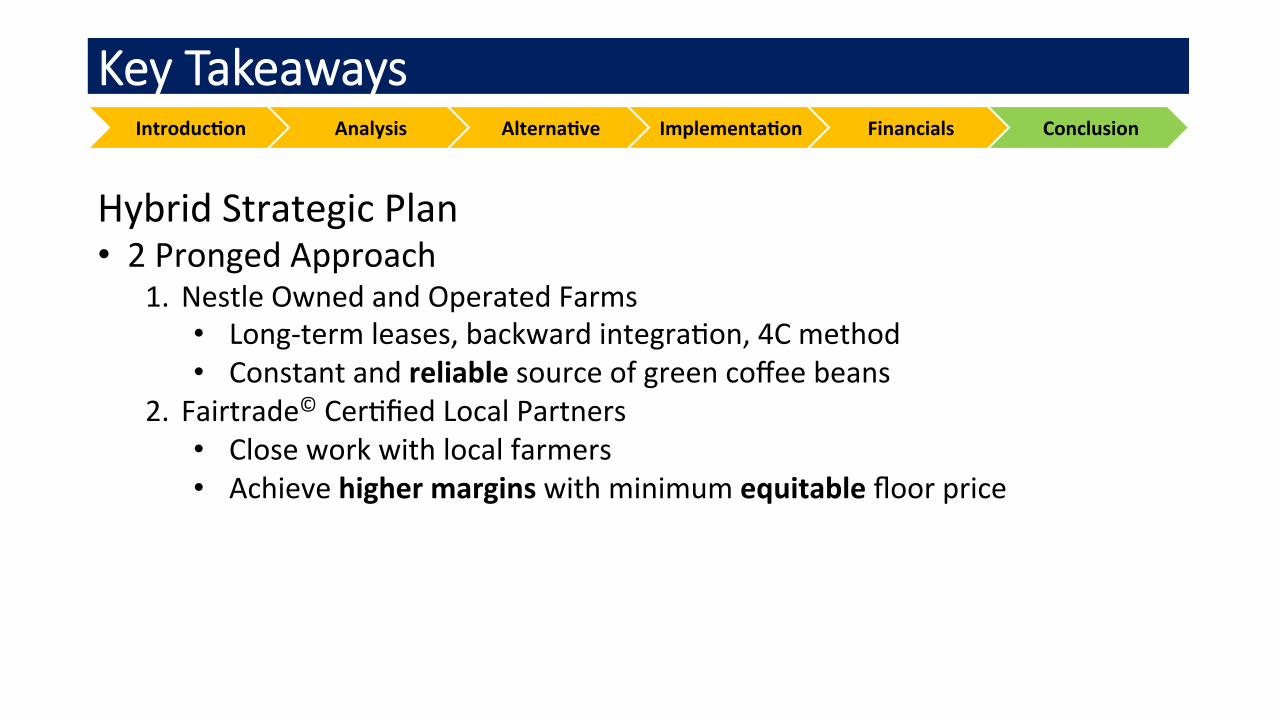
Hybrid Strategic Plan • 2 Pronged Approach
1. Nestle Owned and Operated Farms • Long-‐term leases, backward integraBon, 4C method • Constant and reliable source of green coffee beans
2. Fairtrade© CerBfied Local Partners • Close work with local farmers • Achieve higher margins with minimum equitable floor price

Thank you


![7(Things(to(Consider(when(Evaluang(PromoHon( Management ... · "I do think that it is true that most CRM implementations fail and it is true that virtually all [withheld] CRM implementations](https://img.pdfslide.net/doc/110x75/5f33addd84792311f42d87b2/7thingstoconsiderwhenevaluangpromohon-management-i-do-think-that.jpg)