Embed Size (px)
Citation preview

Assembly and Classification of Spectral Energy Distributions – A New VO Web Service
Hans-Martin Adorf, GAVO, Max-Planck-Institut für extraterr. Physik, Garching
Florian Kerber, ST-ECF, European Southern Observatory, Garching
Gerard Lemson, GAVO, Max-Planck-Institut für extraterr. Physik, Garching
Alberto Micol, ST-ECF, European Southern Observatory, Garching
Roberto Mignani, European Southern Observatory, Garching
Thomas Rauch, Institut für Astronomie und Astrophysik, Universität Tübingen
Wolfgang Voges, GAVO, Max-Planck-Institut für extraterr. Physik, Garching

Overview
• We report progress on a new Web service for automated object classification which comprises four major steps:– An input list of sky-positions is used for querying multiple distributed
catalogues covering different wavelength intervals. The sources returned are spatially matched using a probabilistic method.
– A list of observed spectral energy distributions (SEDs) is assembled. – The theoretical SEDs are prepared using a library of model spectra.– The obsrvational SEDs are submitted to a classifier that uses the
theoretical SED’s for template matching. For each observed SED the three best-matching theoretical SEDs are identified.
• A science case has been selected for testing the capabilities of the Web service described.
• This work has been carried out as a collaboration between the AVO (http://www.euro-vo.org) and GAVO (http://www.g-vo.org) projects.

Scientific Motivation
• Many scientific investigations benefit from a multi-spectral (“pan-chromatic”) view of the universe.– This idea has played a vital role at the very beginning of the virtual
observatory movement.
• Some areas of interest:– “panchromatic mining for quasars” – a key-stone science
application of the US-American NVO.
– AGN research: start with a list of AGN candidates; collect all photometric data from distributed catalogues covering the full spectral range; classify the AGN-zoo (type I, II, BL Lac, etc.)
– planetary nebulae, isolated neutron stars, brown dwarfs, CVs

Catalogue Query and Matching
• The catalogue query and matching process is itself a three-stage process:– The user uploads an input list of sky-positions
– The user selects the catalogues of interest. For each catalogue a deterministic matching service provided by CDS/Vizier is invoked that, for each object in the input list, carries out a simple cone search.
• The result is a set of match lists, one per catalogue. Often the matching results are ambiguous.
– Finally, the matcher fuses the match-lists into a single master list using GAVO’s “fuzzy” matcher algorithm.
• The resulting fused master list contains all plausible match candidates. Each entry in this list contains at most one source from each catalogue.

Catalogue Selection

Match-List before XMatch

Fused Master List (after XMatch)
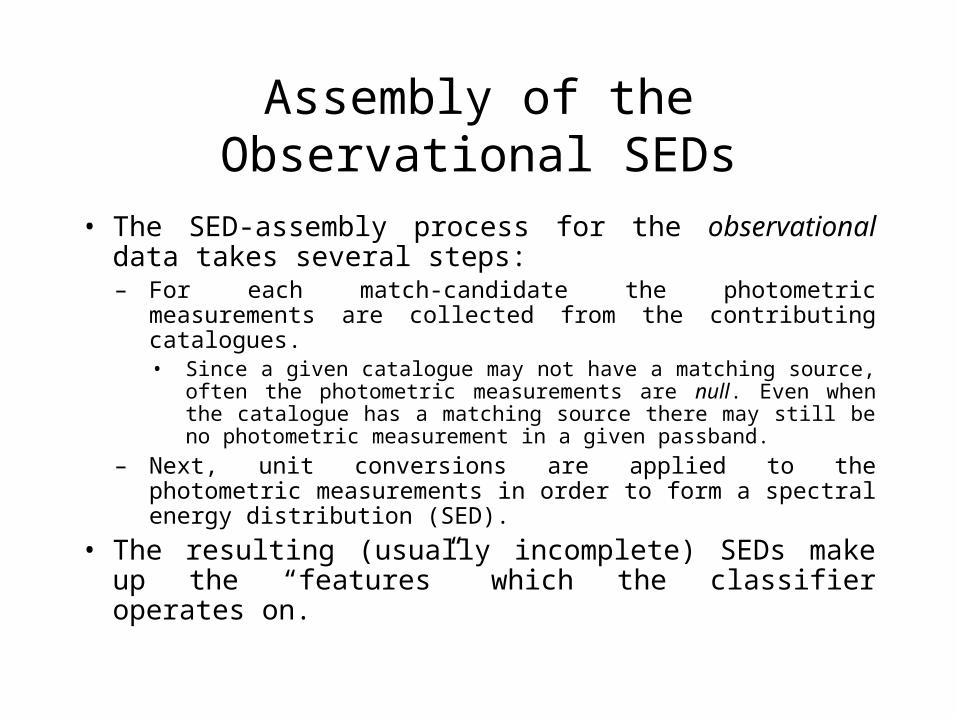
Assembly of the Observational SEDs
• The SED-assembly process for the observational data takes several steps:– For each match-candidate the photometric measurements are
collected from the contributing catalogues. • Since a given catalogue may not have a matching source, often the
photometric measurements are null. Even when the catalogue has a matching source there may still be no photometric measurement in a given passband.
– Next, unit conversions are applied to the photometric measurements in order to form a spectral energy distribution (SED).
• The resulting (usually incomplete) SEDs make up the “features” which the classifier operates on.

Observation Data Preview

Preparation of the Theoretical SEDs
• For the subsequent classification stage, the theoretical data has to be brought into the observational space.– We have used a grid of stellar model atmosphere spectra (Thomas
Rauch, http://astro.uni-tuebingen.de/~rauch/). The theoretical spectra have a much higher resolution than the observational broad band SEDs; the former therefore have been downsampled to match the latter.
– In order to match the low spectral resolution of the observations, the theoretical flux was extracted at the central wavelength for each of the 7 wavebands, i.e. Johnson B, V, R, I, H, J, K. (In principle one would have to convert the theoretical spectra using the proper sensitivity curves of the filters.)
– No correction was applied for interstellar extinction

Library Data Preview

Library Data View

Supervised Classification
• The list of observational SEDs is submitted to a supervised classifier.– The classifier uses the library of theoretical SED’s for template matching.
– In principle any user-supplied library may be used; we only require that the uploaded theoretical SEDs comprise the same features as those in the “observed” SEDs.
– The SED classifier currently uses a simple deterministic nearest neighbour (NN) algorithm which uses the Euclidean distance in feature space. For each observed SED the NN-classifier identifies the three best-matching theoretical SEDs.
– User choices: the features to use in the classification; the method for estimating the scaling factor; the number of best matches to report

SED Classifier Central

Classification View

Quick-look Graphics
• For an easy assessment of the results we decided to also provide quick-look on-line graphics.
• For each observational SED the chart contains – the “observed” SED and
– an overplot of the three best matching theoretical SEDs.
• We use the JFreeChart graphics package, wrapped in the Cewolf library for use within JavaServer Pages (JSPs). Fortunately, only a few lines of code are necessary in order to bring up a chart.

Quick-look Chart

Reporting
• Classification results are reported in a classification table.– the ID of the observational SED,– the No of (non-null) features contributing to the classification, and– for each of the best three matches
• the ID of the matching theoretical SED,• the dissimilarity between the observed and the matching theoretical
SED, and • a scaling factor (the “distance modulus”).
• The full complement of pair-wise dissimilarities is also reported.– This table can become very large, since it scales with the number
of observational SEDs times the number of theoretical SEDs.

Status
• The SED classifier is implemented in pure Java – as a standard J2EE Web Application
• We successfully use– the JavaServer Faces (JSF) technology, which offers a server- and
a client-side state-mechanism,• We extended it by a custom JSF-tag library for table input and output.
– an embedded 100% Java database (HSQLDB) for feature selection and reporting, and
– the GAVO table utility package (similar to AstroGrid‘s Topcat/STIL package).

Conclusions
• A proper handling of missing data (null values) is essential for this kind of application.
• Quick-look graphics are helpful to let the user assess the classification results.
• We need a statistical classifier to adequately handle the photometric uncertainties.
• We need to validate the classifier.
• This is work-in-progress. We are relying on the CDS/Vizier matching services, which we extend.

Selected References
• Adorf, H.-M. Classification of Low-Resolution Stellar Spectra via Template Matching -- A Simulation Study. in Workshop "Data Analysis in Astronomy II". 1986. Erice, Italy: Plenum Press, New York, USA.
• Kerber F., Mignani R.P., Guglielmetti F., Wicenec A., Galactic Planetary Nebulae and their central stars. I. An accurate and homogeneous set of coordinates. Astron. Astrophys. 408, 1029 (2003)
• McGlynn, T.A. , A.A. Suchkov, E.L. Winter, R.J. Hanisch, R.L. White, F. Ochsenbein, S. Derriere, W. Voges, and M.F. Corcoran, Automated Classification of ROSAT Sources Using Heterogeneous Multi-wavelength Source Catalogs, Astrophys. J. (submitted), 2004.
• Padovani, P., Allen, M. G., Rosati, P., Walton, N. A. 2004, Discovery of optically faint obscured quasars with Virtual Observatory tools, Astronomy Astrophys. 424, 545.
• Rauch, T., Grids of Synthetic Stellar Fluxes. 2004, Thomas Rauch. http://astro.uni-tuebingen.de/~rauch/.


![Vorlesungsskript Physik 1 für Ingenieure · (SieheTipler,Physik[Tip94,1]) (SieheGerthsen,Physik[GV95,1]) WirrechneninunsererVorlesungausschliesslichmitdemgesetzlichenEinhei-tensystem:SI](https://img.pdfslide.net/doc/110x75/5b3fd7677f8b9a2f138c8d06/vorlesungsskript-physik-1-fuer-siehetiplerphysiktip941-siehegerthsenphysikgv951.jpg)


![Ensayo final _ruta_magica[2].docx gavo](https://img.pdfslide.net/doc/110x75/555547f6b4c905f7688b5b81/ensayo-final-rutamagica2docx-gavo.jpg)