Embed Size (px)
Citation preview
ASSESMENT OF POWER QUALITY OF
PHOTOVOLTAIC GENERATIONS
Biswabandhu Nayak (710EE2145)
Department Of Electrical Engineering
National Institute Of Technology, Rourkela

A Thesis report on
ASSESMENT OF POWER QUALITY OF
PHOTOVOLTAIC GENERATIONS
in partial fulfilment of the requirements of the degree in
M Tech dual degree (Power, Control and Drives)
By
BISWABANDHU NAYAK (710EE2145)
Under the guidance of
Prof. P.K Ray
Department Of Electrical Engineering
National Institute Of Technology
Rourkela-769008 (ODISHA)
May 2015

DEPARTMENT OF ELECTRICAL ENGINEERING
NATIONAL INSTITUTE OF TECHNOLOGY, ROURKELA
ODISHA, INDIA -769008
CERTIFICATE
This is to certify that the thesis entitled “Assessment of power quality of photovoltaic
generations ”, submitted by Biswbandhu Nayak (Roll No. 710EE2145) in partial fulfilment
of the requirements for the award of Bachelor of Technology in Electrical Engineering &
Master of Technology in Power Control and Drives (Integrated Dual Degree) during
session 2014-2015 at National Institute of Technology, Rourkela.
The candidate has fulfilled all the prescribed requirements.
The Thesis is an authentic work, based on candidates’ own work.
To my knowledge, the thesis is up to the standard required for the award of a Bachelor of
Technology in Electrical Engineering & Master of Technology in Power Control and Drives
(Integrated Dual Degree) degree.
Place: Rourkela
Dept. Of Electrical Engineering Prof. P.K Ray
National Institute of Technology Assistant Professor
Rourkela -769008

ACKNOWLEDGEMENTS
I wish to express my heartfelt gratitude to my supervisor Prof. P.K Ray, Assistant Professor,
Department of Electrical Engineering, National Institute of Technology, Rourkela for his
valuable support, guidance, time and inspiration throughout my project. I also appreciate the
freedom provided by Prof. P.K Ray to explore new ideas in the field of my project.
I am also grateful to Prof. S. K. Sarangi, Director, National Institute of Technology, Rourkela
for providing me with outstanding facilities in the institute for my research.
I would also like to thank Prof. A. K. Panda, Head of Department, Department of Electrical
Engineering, National Institute of Technology, Rourkela for providing facilities during my
project work.
Finally, I want to thank my parents and the almighty god for their backing, without which this
would not have been conceivable.
Biswabandhu Nayak
710EE2145

Table of Contents
Chapter 1 ................................................................................................................................................. 1
1.1 Introduction ....................................................................................................................................... 1
1.2 Literature review ............................................................................................................................... 1
1.3 Motivation ......................................................................................................................................... 2
1.4 Objective ........................................................................................................................................... 3
Chapter 2 ................................................................................................................................................. 4
Distributed Generations .......................................................................................................................... 4
2.1 Introduction ................................................................................................................................... 4
2.2 Definition of DG ........................................................................................................................... 4
2.3 Types of DG .................................................................................................................................. 5
2.4 Advances in DG ............................................................................................................................ 8
2.5 Benefits and problems related to DG .......................................................................................... 10
Chapter 3 ............................................................................................................................................... 12
Photo-voltaic array ................................................................................................................................ 12
3.1 Introduction ................................................................................................................................. 12
3.2 Photovoltaic Cell ......................................................................................................................... 12
3.3 Photovoltaic Module ................................................................................................................... 13
3.4 Photovoltaic Array ...................................................................................................................... 13
3.5 Conclusion .................................................................................................................................. 15
Chapter 4 ............................................................................................................................................... 16
MPPT algorithm.................................................................................................................................... 16
4.1 MPPT algorithms ........................................................................................................................ 16
4.2 Perturb & Observe method ......................................................................................................... 16
4.3 Incremental Conductance Method .............................................................................................. 17
4.4 Conclusion .................................................................................................................................. 19
Chapter 5 ............................................................................................................................................... 20
Three phase grid connected PV array ................................................................................................... 20
5.1 Investigation of the behaviour of a three phase grid-connected photovoltaic system to control
active and reactive power. ................................................................................................................. 20
5.2 Stability and power quality issues in PV connected micro-grid without MPPT algorithm and
power control methods. ..................................................................................................................... 23
5.3 Simulations ................................................................................................................................. 23
Chapter 6 ............................................................................................................................................... 28
Results and Discussions ........................................................................................................................ 28

6.1 PV array with MPPT algorithm and power control techniques. ................................................. 28
6.2 PV array connected to grid without any MPPT algorithm and control scheme. ......................... 37
6.3 Conclusion and future work ........................................................................................................ 42
References ............................................................................................................................................. 44

ABSTRACT
In the recent times distributed generations or renewable energies are very much
needed for daily usage as the natural resources are on the verge of extinction. These
renewable energy sources are a very good solution for the global energy problem. The usage
of renewable energy, according to the statistics is around 17% all over the world, from which
only 0.06% constitute of solar PV power. These statistics show that we are lagging behind
from extracting the solar power. There are various factors that can be hold accountable for
this viz. very costly equipment, lack of knowledge and even we do not have enough
technology to harness the solar power.
Solar power, as most renewable energy sources, is not a steady power source. We
only can utilize or store it during daytime. We try to find the maximum power point (MPP) of
the PV array and then it is supplied to the grid. There are two different methods to track the
MPP – Perturb and Observe (P&O) method and Maximum Power Point Tracking algorithm
method (MPPT). In this project MPPT algorithm is used to track the MPP.
The MPPT algorithm uses the IPV and VPV of the PV array and gives the MPP and a
VDC,REF. This voltage is then passed on to the inverter and then further to the three-phase grid.
In this thesis the behaviour of the active and reactive power of the grid which is
supplied by the PV array is investigated. The various currents such as inverter current, grid
current and load currents are also investigated.

List of Figures
Fig 2.1 Types of DG
Fig 2.2 Photovoltaic cell
Fig 3.1 Circuit diagram of a PV cell
Fig 3.2 A PV cell
Fig 4.1 Incremental Conductance method algorithm
Fig 4.2 MPP of a PV curve
Fig 5.1 Grid connected photovoltaic system
Fig 5.2 Control scheme proposed
Fig 5.3 Active power control method of inverter
Fig 5.4 Hysteresis band controller
Fig 5.5 Simulink diagram of PV array
Fig 5.6 Simulink diagram of inverter
Fig 5.7 Simulink diagram of IC method
Fig 5.8 Simulink diagram of PV array without control schemes
Fig 6.1 PV and IV curve of photovoltaic array
Fig 6.2 Active and reactive power of load (RL)
Fig 6.3 Active and reactive power of grid (RL)
Fig 6.4 Active and reactive power of inverter (RL)
Fig 6.5 Current waveforms (RL)
Fig 6.6 Active and reactive power of load (L)
Fig 6.7 Active and reactive power of grid (L)
Fig 6.8 Active and reactive power of inverter (L)
Fig 6.9 Current waveforms (L)

Fig 6.10 Active and reactive power of load (R)
Fig 6.11 Active and reactive power of grid (R)
Fig 6.12 Active and reactive power of inverter (R)
Fig 6.13 Current waveforms (R)
Fig 6.14 Active and reactive power of load (RLC)
Fig 6.15 Active and reactive power of grid (RLC)
Fig 6.16 Active and reactive power of inverter (RLC)
Fig 6.17 Current waveforms (RLC)
Fig 6.18 Active and reactive power of load (RL)
Fig 6.19 Active and reactive power of grid (RL)
Fig 6.20 Active and reactive power of inverter (RL)
Fig 6.21 Active and reactive power of load (L)
Fig 6.22 Active and reactive power of grid (L)
Fig 6.23 Active and reactive power of inverter (L)
Fig 6.24 Active and reactive power of load (R)
Fig 6.25 Active and reactive power of grid (R)
Fig 6.26 Active and reactive power of inverter (R)
Fig 6.27 Active and reactive power of load (RLC)
Fig 6.28 Active and reactive power of grid (RLC)
Fig 6.29 Active and reactive power of inverter (RLC)
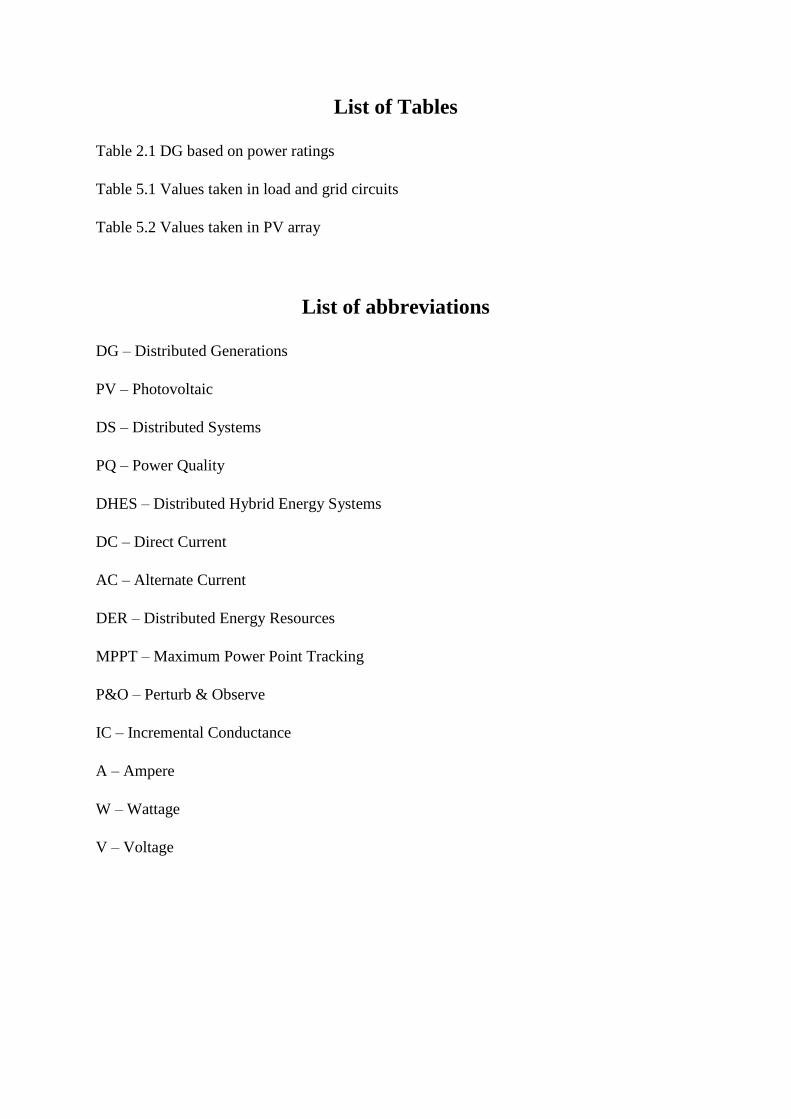
List of Tables
Table 2.1 DG based on power ratings
Table 5.1 Values taken in load and grid circuits
Table 5.2 Values taken in PV array
List of abbreviations
DG – Distributed Generations
PV – Photovoltaic
DS – Distributed Systems
PQ – Power Quality
DHES – Distributed Hybrid Energy Systems
DC – Direct Current
AC – Alternate Current
DER – Distributed Energy Resources
MPPT – Maximum Power Point Tracking
P&O – Perturb & Observe
IC – Incremental Conductance
A – Ampere
W – Wattage
V – Voltage

1
Chapter 1
1.1 Introduction
In the recent times distributed generations or renewable energies are very much
needed for daily usage as the natural resources are on the verge of extinction. These
renewable energy sources are a very good solution in the global energy problem. The energy
generated by the photovoltaic systems constitutes a large part of the total amount of energy
produced by renewable energy sources. Photo voltaic cells belong to the group of distributed
generations. These cells produce power by utilizing the sunlight. There have been many
research efforts to improve the efficiency of photovoltaic systems. These efforts were aimed
at supplying the grid with active and reactive power. In periods when there is no sunlight, the
inverter supplies the grid only with reactive power. Power quality analysis of these cells
require the study of active and reactive powers and all the disturbances associated with them
such as harmonics, sags etc. Investigation of the behaviour of a three phase grid-connected
photovoltaic system to control active and reactive power have been carried out.
MATLAB/Simulink has been used to carry out the simulations.
1.2 Literature review For investigating the active and reactive powers of the PV array with a three-
phase grid references of many available literature were taken. The references taken were from
basic understanding of DG technologies and their benefits in our usual life. [6] This paper
introduces a survey of the revolutionary approach of DGs. Surveying DG concept may
include DG definitions, technologies, applications, sizes and locations. There are different
types of DG:

2
Traditional
Non-traditional
Traditional include micro-turbine and non-traditional include electrochemical devices,
storage devices, renewable devices. Micro-turbines operate using natural gas, propane, fuel
oil. MT runs at less temperature and pressure and at faster speed. Then the advancements in
DG technologies was studied [5] The main and important distributed generation technologies
are in wind power generation technology, solar photovoltaic technology and in fuel cell
technology. In the wind power sector new wind turbines are being produced which increases
the efficiency of the plant and in PV sector scientists are working on lowering the cost of the
PV arrays and to increase their efficiency. The main research objective in the fuel cell
production is reduction of costs and improvement in the performance in the aspects of
production, material, systems and applications. The impact of DG over the power system
transients and voltage stability was studies. The different positive and negative impacts were
observed. The various problems associated in DG technologies due to the phenomenon such
as malfunctions, failure of electrical equipment, instabilities and weather related issues were
studied. [4]
1.3 Motivation The renewable resources or the distributed generations can cope with the global
energy crisis.
Photovoltaic systems have a major contributions in the total power generation from
the distributed generation technologies.
The photovoltaic system can be installed almost everywhere as it has sun as its
source.
The power quality of these generations need to be improved.

3
1.4 Objective
• To determine the disturbances in the power quality of the photovoltaic systems.
• To find a way to improve power quality of the photovoltaic systems connected to a
grid.
• To improve the output of the photovoltaic generations during different weather
conditions.
1.5 Thesis layout
Chapter 1: Introduction, motivation and objective.
Chapter 2: Distributed Generations
Chapter 3: Photovoltaic Array
Chapter 4: MPPT algorithm
Chapter 5: Three phase grid connected PV array
Chapter 6: Results and Discussions
4
Chapter 2
Distributed Generations
2.1 Introduction The recent times have brought this revelation to us that the mainstream energy
resources are on the verge of extinction. If we do not find alternate resources to provide with
energy, then our future generations will suffer for it. The best way to curb this energy crisis
problem is to use distributed generations. The usage of DG also comes with some challenges
such as low power quality, voltage sags, harmonic disturbances, voltage rise effects and
stability of power supply [14]. These problems needed to be minimized for the better usage of
DG.
2.2 Definition of DG The definition of DG not similar all around the world [6]. Different countries define
DG according to its purpose, rating, technology used and many other factors. Distributed
generation technologies are of many two types which are discussed in the section below.
The purpose of DG is to provide a certain number of consumers with clean energy
using renewable energy resources. These DG systems mostly are used with a three phase grid
connected to them but they can also be used as stand-alone devices for power supply. One
important factor of using DG is their location, which should be near to the consumers as DG
does not produce a huge amount of power. This would help minimize the in-line losses
during the transportation of power. We can even use batteries and other energy storing
devices to improve the efficiency of the DG in use. Based on the ratings of the DG they are
divided as follows:-

5
Table 2.1 DG based on power ratings
Type of DG Power Rating
Micro 1 W – 5 KW
Small 5 KW – 5 MW
Medium 5 MW – 50 MW
Large 50 MW – 300 MW
The power delivery area or the number of consumers for a particular DG system should not
be more as DGs do not provide enough power to feed a large number of consumers [11]. The
modes of operation of DG are of two types - (i) the power can directly be fed to the
consumers, (ii) or the power can be stored using storage device and distributed later in the
time of need. The main objective of DG technologies are that they can be used as supportive
power generation devices and they can assist the regular power generation methods such as
hydro power plants or the thermal power plants. New technologies are always being
researched to improve the efficiency of the power quality of DG systems. These technologies
do not have a negative impact over the environment as DG produces clean energy which is
environmental friendly.
2.3 Types of DG The types of DG depends upon the technologies, application, size and location of the
system [11]. There are two different types of DG:-
Traditional
Non-traditional
6
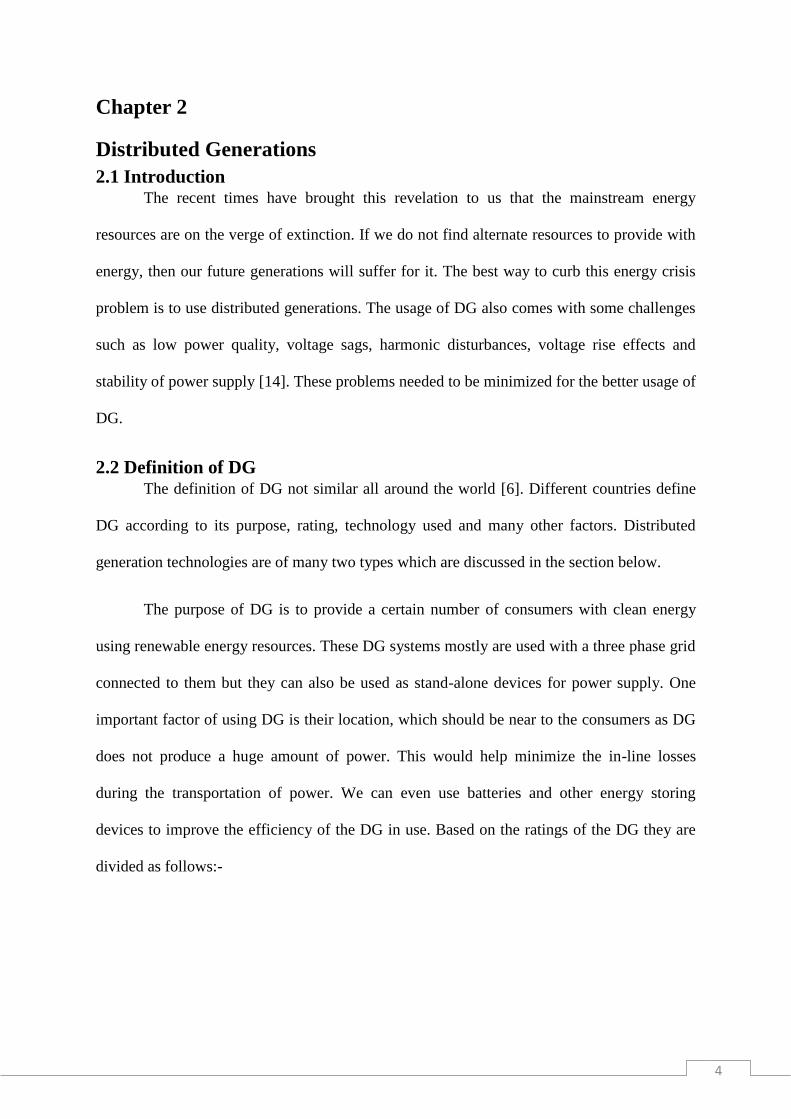
Fig 2.1 Types of DG
Traditional include micro-turbine and non- traditional include electrochemical
devices, storage device and renewable energy systems. Micro turbines operate using natural
gas, propane, fuel oil etc. Micro-turbine runs at less temperature and pressure and at faster
speed. Advantages of micro-turbine are:-
It takes less space.
Micro-turbines are very efficient energy generation devices.
The installation of micro-turbines are relatively easy.
The power supplied is of low cost and
The types of micro-turbines are BAS and combustion type where gas type can be
further classified into simple cycle gas, recuperated gas and combined cycle gas type micro-
turbine.
Distributed Generation Types and Technologies
Traditional
Generarators
Non- traditional
generators
Micro-turbine
Natural gas
turbine
Recurpated
CycleSimple Cycle
Combined
Cycle
Electrochemical
devices
Storage
devices
Renewable
devices
Fuel CellBatteries Flywheels
Photo Voltaic Wind Turbine
7
Fuel cell are another type of DG technology which provides energy through
electrochemical process like a battery. There is no need to charge the fuel cell. The fuel cell
operates at various temperature and uses various kinds of fuel. The fuel cell uses the cathode
and anode concept where two oxidant electrodes are used as cathode and anode.
Advantages of Fuel cells:-
Fuel cells provide 60% efficiency.
It does not include any movable parts and hence energy losses are minimum.
Combustion does not takes place in a fuel cell.
The non-traditional DG types includes the renewable resources of power generation:-
(i)Wind energy systems
In wind energy systems a wind turbine is used. The wind turbines are located in
places with high wind speed. According to the wind speed the turbine rotates and a generator
attached to the turbine produces electricity.
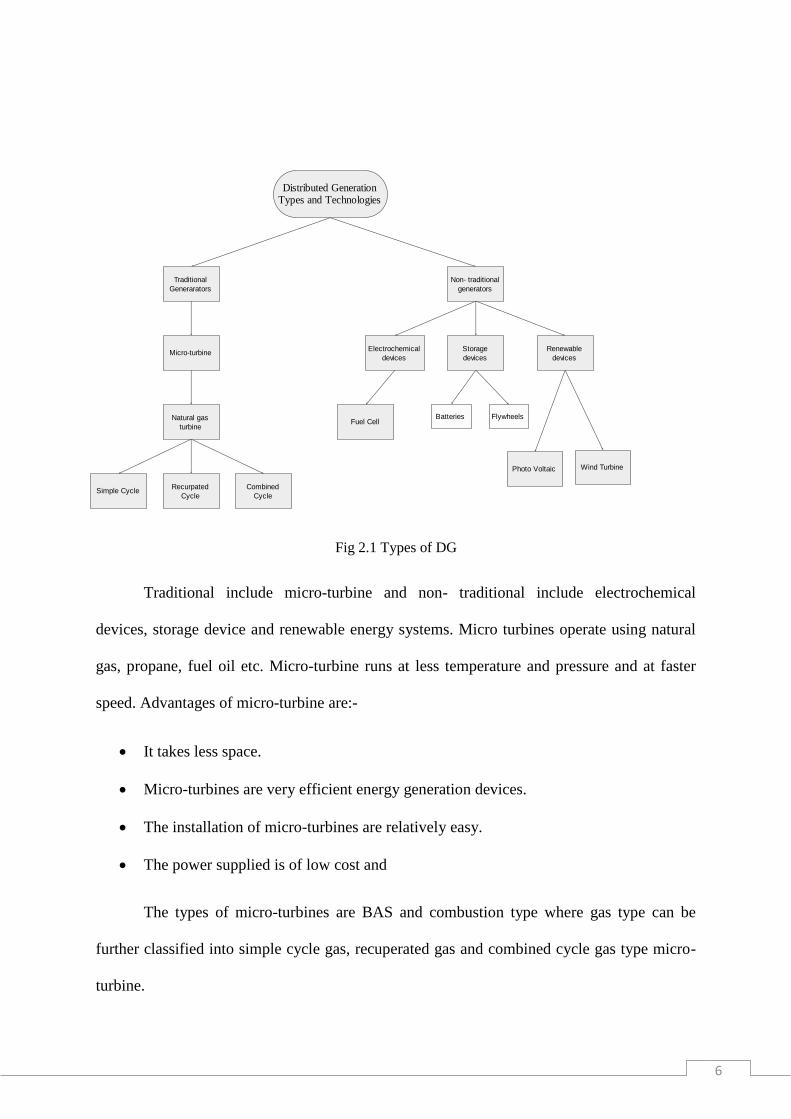
(ii)Photo- Voltaic cells
The photo-voltaic cells use the solar radiation to produce electricity. These PV cells
are made up of silicon and other semi-conductor devices which absorb power from the sun
and convert it to electrical energy. The circuit diagram of a photo-voltaic cell is shown in Fig
2.2. The solar cells are used in series or parallel combination to constitute a photo-voltaic
array. These arrays then convert energy during the day and may also be used to store energy
in batteries. Then this stored energy can be used during the night.

8
Fig 2.2 Photovoltaic cell
2.4 Advances in DG The main and important distributed generation technology are in wind power
generation technology, solar photovoltaic (PV) technology and fuel cell technology. In the
wind power sector new efficient wind turbines are being implemented which increases the
efficiency of the wind farm and in PV sector scientists are working on lowering the cost of
the PV arrays and to increase their efficiency. At present the biggest hurdle of photovoltaic
generation is the high price of solar cells, which accounts for over 60% the price of the whole
solar photovoltaic generation system, so the solar cells research such features as cheap price,
high efficiency, high reliability, high stability, long lifetime has become the world's focus. In
addition, the focus of photovoltaic generation is shifted gradually to components research and
system development for grid-connected photovoltaic generation system, such as grid-
connected inverter, BIPV, large-scale grid-connected photovoltaic station and the automatic
tracking systems of photovoltaic arrays. Research is underway in the reduction of voltage
sags, harmonics and other anomalies associated in the DG sector. The main research
objective in the fuel cell production is the reduction of costs and the improvement in the
aspect of production, material, system and applications.
Vpv
IPV
RSHDIPH
ID
ISH
9
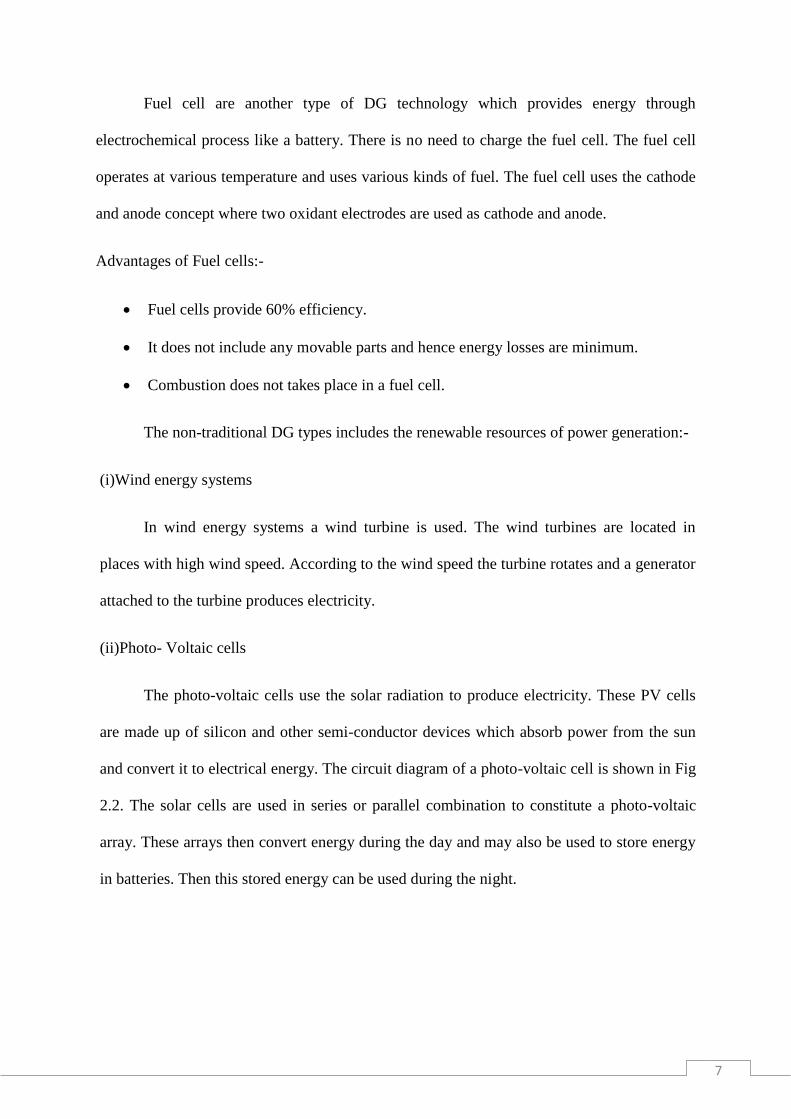
Micro grids
Micro grid consists of DG, load, DS, power conversion equipment and control
system. DG in micro-grid can be connected to utility grid directly by static switches. The
control problem associated with the micro-grid are external characteristics, time constants
and composition of micro-sources. Load for micro-grids is to be carefully classified or else
complexity may arise. Low power supply and PQ load are at the bottom position while high
power supply and power quality load are at top position of the pyramid. Micro-grids can
sustain a certain amount of consumers even if they are disconnected from the larger grids
unlike the DG systems.
Recently new hybrid generation systems are being used along with the micro-grids to
provide power. This is known as DHES. There are different type of DHES:-
Wind turbine and battery with an AC grid connected to it and it satisfies an AC load.
PV arrays and a battery satisfying a DC load.
Fuel cell with hydrogen tanks supplying DC power.
Component modelling in DHES is similar to the micro-grid. The control problems
associated with DHES are micro-sources which are flexible and controllable.
New smart micro-grid technology has also been implemented. In a smart micro-grid
the wind energy system, PV arrays and micro-turbines are connected to a single control
centre which supplies the power to different consumers. Storage devices are also used as a
supply to the control centre. The components associated with smart micro-grid are:-
Power supply from the sources viz. from wind farms, PV arrays, micro-turbines and
the storage devices.

10
The different types of demands which includes sensitive, adjustable and sheddable
demands. The management centre meets each demand according to the supply.
The environmental factors such as low wind speed, rains also come into
consideration of the efficiency of the smart grid.
These micro-grids are used because of the low amount of energy produced by the
DERs. The major factors that contributes to the DG evolution are [12]:-
DG technologies are being developed and scientists are researching on to increase the
power quality of the generated power.
New transmission lines need to constructed, so that the line losses while the
transportation of power is less.
As the customers demand for clean and un-hindered power supply is increasing. This
also has helped in the advancement of DG.
The electricity market has undergone liberation.
The concerns about the climate of earth due to the usage of mainstream power
generation methods also has helped the leap in DG research.
2.5 Benefits and problems related to DG The benefits of DG are:-
The application of DG in power system sector improves the reliability of the services,
as they can be turned on when regular services are off.
The usage of DG reduces the use of fossil fuel consumption, hence decreasing the
emission of greenhouse gases and this reduces the pollution.
The DG systems use wasted heat of the systems and hence increasing the efficiency
of machines.
They bypass the congestion in existing transmission grids.

11
The problems related to DG are:-
DG can produce inversion in the power flow.
The voltage control of DG is quite difficult as it is always fluctuating.
The management of reactive power in DG is quite difficult.
DG flow can reduce the effectiveness of the protection equipment.
Summary
The future of our civilization is in the hands of DG and for the advancement of DG
the fields of active distribution networks, micro grids, virtual utilities, advanced power
electronics and resource techniques needed to be improved.

12
Chapter 3
Photo-voltaic array
3.1 Introduction
A photovoltaic system basically uses one or more solar modules or panels in series or
parallel connection according to the desire of the user to convert solar energy to electrical
energy. The components required for a solar PV array are solar panel, electrical connections
and mostly MPPT algorithms are used to find the maximum power point of the produced
solar power. Sometimes storage devices are used to store the generated energy so that they
can be used when there is no sun light.
3.2 Photovoltaic Cell
The photovoltaic cell is the building unit of a photovoltaic array. These cells are made
up from semiconductor devices such as germanium, silicon etc. These semiconductor devices
are used as very thin wafers who work on the principle of potential difference due to the
presence of holes and electrons. Due to the potential difference across the wafer, voltage is
produced. Electrons attain energy when subjected to solar radiation and are free to move
around. If we connect an electrical circuit with the wafer, we can harness electricity from the
wafers. The electricity is produced due to the movement of electrons causing the flow of
current.

13
Fig 3.1 Circuit Diagram of PV cell
3.3 Photovoltaic Module The voltage produced by each cell is very low, around 0.5-0.7 V. So, a large number
of cells are connected either in series or in parallel to attain a much better voltage.
Sometimes diodes are also used in the cells to prevent the reverse current. This mostly
happens during the partial shading period. The solar panels needed to be set up at specific
places so that they can have the maximum amount of irradiance during the day.
3.4 Photovoltaic Array The power produced by one PV module is sometimes not enough of to facilitate
power supply to certain consumers. So, we combine many modules to form a PV array,
which produces enough power to meet the needs of customers. These PV arrays ensure the
reliability of the power supply. Recently these PV arrays are being used in micro-grid
concept with both wind turbines and fuel cells to provide electricity. As the PV arrays
produce DC, we need to change them to AC for the day-to-day usage. So mostly they are
combined with DC-DC boost converters to enhance the power and then with inverters to
transform DC to AC. The modules are also connected in series and parallel as per the
specifications of the user. [1]
Vpv
IPV
RSHDIPH
ID
ISH

14
Fig 3.2 A PV cell
The photovoltaic cell’s output voltage is due a function of the photocurrent. This
photocurrent is produced due to the irradiation level of the sun light.
Vc = 𝐀𝐊𝐓𝐜
𝒆 Ln (
𝐈𝐩𝐡+𝐈𝐨+𝐈𝐜
𝐈𝐨) - RsIs
The symbols used are
Vc: cell output voltage, V.
Tc: reference cell operating temperature (20 °C).
Rs: series resistance of cell (0.001 Ω).
Iph: photocurrent, function of irradiation level and junction temperature (5 A).
I0: reverse saturation current of the diode (2*10-4 A).
Ic: cell output current, A.
k: Boltzmann constant (1.38 × 10⁻²³ J/K).
PV cell
Sun Light
N
P
Semiconductor
layers

15
e: electron charge (1.602 × 10^-19 C)
3.5 Conclusion The photovoltaic arrays are the latest face of the DG technologies. These arrays are
needed to be made cheaper so that we can use the solar power for our daily usage. The use of
PV arrays prohibit the pollution and controls the use of fossil fuels.

16
Chapter 4
MPPT algorithm
4.1 MPPT algorithms
The MPPT algorithms are used to track the maximum power point of the DG
technologies. The MPPT algorithms are used in PV arrays because the power supplied by the
arrays is not always constant and is fluctuating in nature. For this we need to find the
maximum power point and provide it to the inverters which then convert it to AC and supply
to the grid. There are two types of MPPT algorithms:-
Perturb & Observe method
Incremental Conductance method
4.2 Perturb & Observe method
In this method a slight disturbance is created in the system. This disturbance created
tends to alter the power of the PV modules. If the modification or disturbance created
increases the power, then it travels towards a point where the power is maximum. This point
is called the maximum power point. The operations are kept at hold at this point and power is
being supplied to the further equipment.
The P&O method is the basic power point tracking method. This gives better results
and is very widely used. This algorithm is elementary, hence having only one loop.
The restrictions of P&O method is that sometimes if the weather changes and the
irradiation is altered, the power tends to decrease and the maximum power point could not be
achieved.

17
4.3 Incremental Conductance Method
Incremental conductance method uses a voltage and a current sensor. These sensors
are connected to the output voltage and current of PV array respectively. At MPP slope of the
PV curve is always zero.
𝐝𝐏
𝐝𝐕 Of maximum power point =
𝐝(𝐕𝐈)
𝐝𝐕
0 = I + V𝐝𝐈
𝐝𝐕 of maximum power point
𝐝𝐈
𝐝𝐕 Of maximum power point = −𝐈
𝐕
The above are the formulae used in an incremental conductance algorithm. We can
see in the formulae that both current and voltage of the arrays are being used, along with the
irradiation of the sun light. P is the conductance of the PV array and when the instantaneous
conductance equals the conductance of the PV array, then only the MPP is reached. [1]

18
Fig 4.1 Incremental Conductance method algorithm
The above is the flow chart of the incremental conductance algorithm. This as we can
see is a one loop algorithm. The problems associated with IC method is that it is very costly
and difficult to install.
Start
Measure Vdc(k),Ipv(k)
dVDC = VDC(K) - VDC(K-1), dIPV = IPV(K) - IPV(K-1), dPPV = VDC(K) - IPV
(K) - VDC(K-1) - IPV(K-1)
Step = N - abs(dPPV/dVDC)
dV=0
dIPV/dVDC =
-IPV/VDC dIPV = 0
Yes
dIPV/dVDC >
-IPV/VDC dIPV > 0
No Yes
Vdc,ref(K) = Vdc(K-1)
-step
Vdc,ref(K) = Vdc(K-1)
+ step
Vdc,ref(K) = Vdc(K-1)
- step
Vdc,ref(K) = Vdc(K-1)
+ step
Yes Yes
NoNo
Update Vdc(K-1) = Vdc,ref(K), Ipv(K-1) = Ipv(K)
Return
19
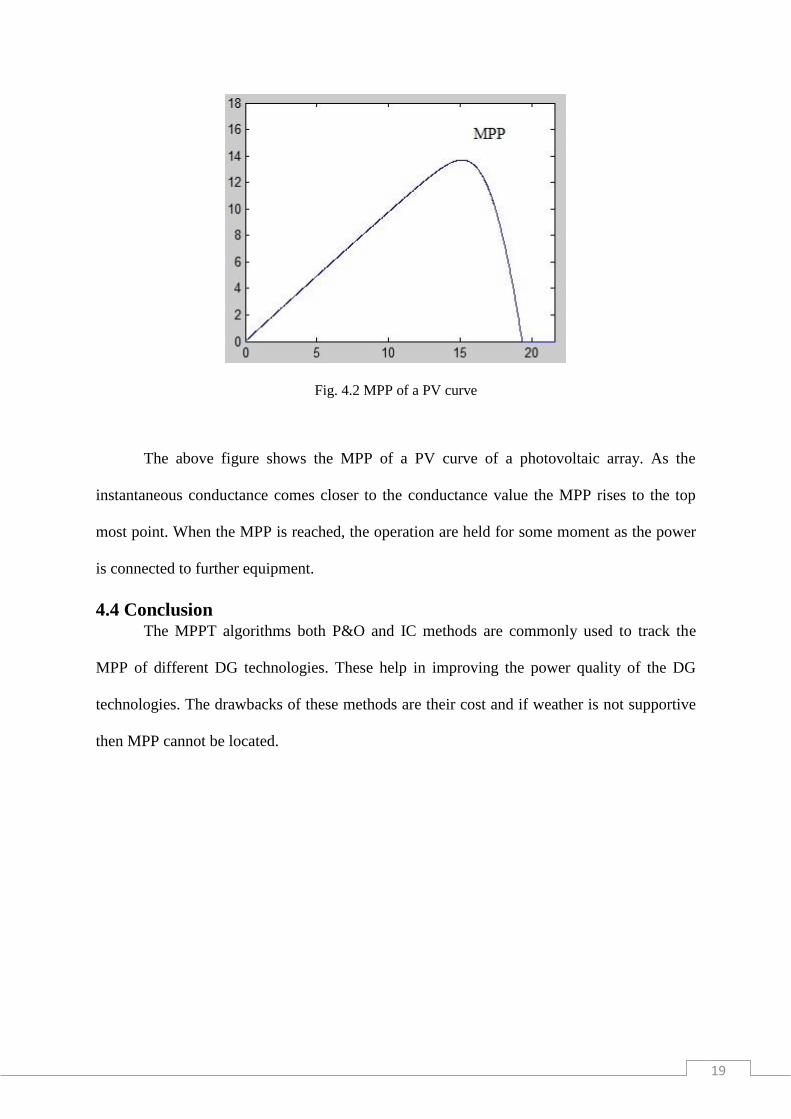
Fig. 4.2 MPP of a PV curve
The above figure shows the MPP of a PV curve of a photovoltaic array. As the
instantaneous conductance comes closer to the conductance value the MPP rises to the top
most point. When the MPP is reached, the operation are held for some moment as the power
is connected to further equipment.
4.4 Conclusion The MPPT algorithms both P&O and IC methods are commonly used to track the
MPP of different DG technologies. These help in improving the power quality of the DG
technologies. The drawbacks of these methods are their cost and if weather is not supportive
then MPP cannot be located.

20
Chapter 5
Three phase grid connected PV array
5.1 Investigation of the behaviour of a three phase grid-connected
photovoltaic system to control active and reactive power.
In this system a photovoltaic array is taken along with a three phase grid to investigate
and observe the behaviour of the active and reactive power provided by the photovoltaic
array. The system as shown in Fig 5.1 comprises of a photovoltaic array, an inverter, a three
phase grid and loads. The photovoltaic array is comprised of many photovoltaic cells which
when subjected to sun’s radiation develops potential difference and provides voltage to the
inverter.
Fig 5.1 Grid connected photovoltaic system
The PV array provides the MPPT algorithm with Ipv (Photovoltaic current) and Vpv
(photovoltaic voltage). Then the algorithm gives the MPP and a VDC,REF is produced. It is
then passed through a selector with a constant value. The constant value is given because if
PV array Inverter
Load
Load
Load
Lc
Lc
Lc
VdcCdc Grid
Active Power
Reactive Power

21
there is less solar radiation and the VDC,REF is low then it can take its place and the grid can
get uninterrupted power supply. The active and reactive power are calculated as shown in the
figure. With the help of PWM hysteresis band gating pulse are given to the inverter which
then supplies power to the grid.
Fig 5.2 Control scheme proposed
Reactive Power Control
As the conventional methods suggests, d-q synchronously rotating frame is required
for the calculation of reactive power. In three phase circuits the current and voltages are
transformed into synchronous rotating frame according to the following equation:-
IL,dq = K(θ)IL,abc
PV Array Inverter
Load
Load
Load
abc - αβ
abc - αβ
Reactive power
caluclation
αβ - pq
abc - αβ
PWM
hysterisisMPPT
alogorithm
Vpv
Constant Value
PI
Selector
Lc

22
K(θ) = Transformation matrix =2/3 *[
−sin𝜃 −sin(𝜃 −2𝛱
3) −sin(𝜃 +
2𝛱
3)
cos𝜃 cos(𝜃 −2𝛱
3) cos(𝜃 +
2𝛱
3)
1/2 1/2 1/2
]
Active Power Control
The MPPT algorithm provides the MPP which provides the maximum power of the
PV array. There are some switching effects in the inverter which induces losses in the circuit.
The equation that shows the connection between active power of the inverter and with
photvoltaic arrays active power is:-
PPV + PLOS = PInv
Fig 5.3 Active power control method of inverter
The above Fig 5.3 shows the active power control of the inverter. Here we can see the
selector and the constant value which if the irradiance is low will provide voltage to the grid.
In the simulation performed a simple MATLAB programming was taken in-stead of this
block diagram.
function V = fcn(Vdc) %#codegen k=240; if (Vdc > 132.8) V=Vdc; else V=k; end
Constant Value
Kp+Ki/S
Vdc,ref
∆V
Vpv
Selector

23
To control the output current of the inverter the hysteresis band technique is used.
This technique is used because it would keep the inverter’s output current in acertain
permissible zone, so that it does not affects other equipment.
Fig 5.4 Hysteresis band controller
5.2 Stability and power quality issues in PV connected micro-grid without
MPPT algorithm and power control methods.
As in Fig. 5.2 it is shown that a PV array is connected to a grid through an inverter.
The reason for observing and understanding the power quality issues and stability of PV is
that if there is a sudden change in weather and suddenly solar radiation is decreased, then
what can be done [2] [9]. As we could not perform this experiment with hardware setup, so
we performed it in the MATLAB/Simulink software and for the weather conditions, the
irradiation levels were decreased and the temperature was also decreased. The waveforms of
both active and reactive powers were simulated and both the waveforms are compared.
5.3 Simulations All the simulations were carried out in MATLAB/Simulink software. The values of
different components taken are shown in the tables below. The simulation diagrams are
shown in the next pages as well.
Hysterisis
BandDC/AC inverterIc
Icerror
24
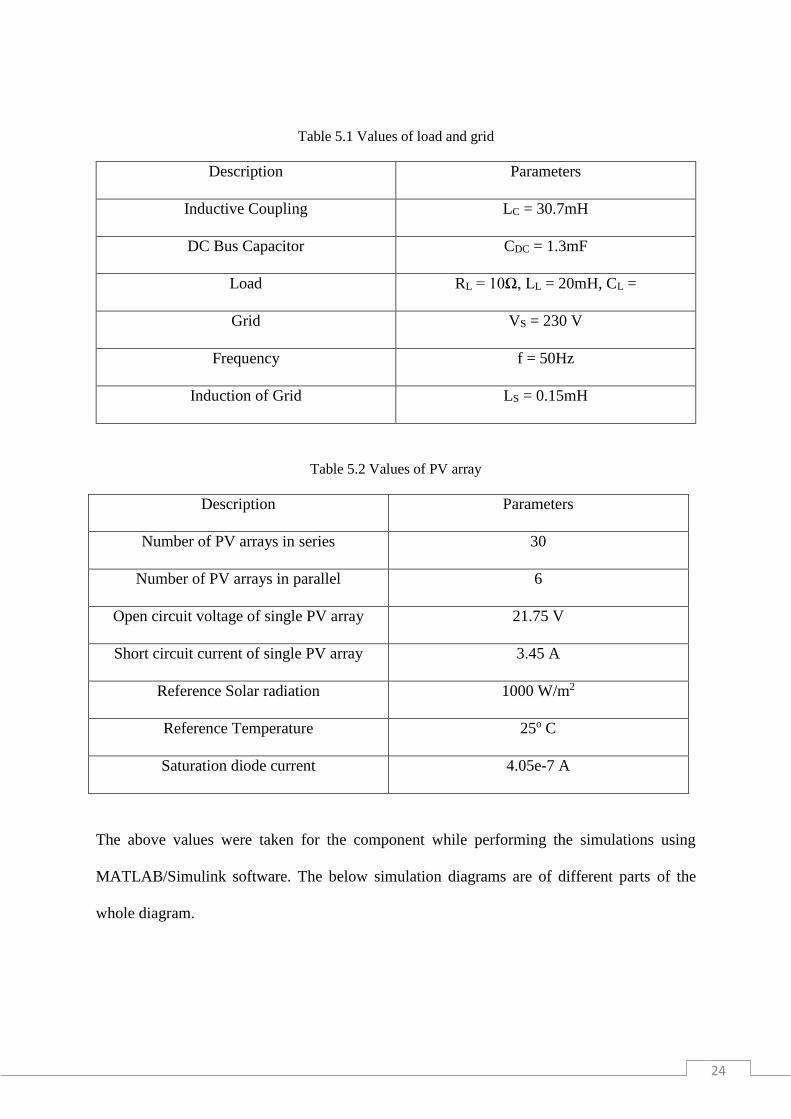
Table 5.1 Values of load and grid
Description Parameters
Inductive Coupling LC = 30.7mH
DC Bus Capacitor CDC = 1.3mF
Load RL = 10Ω, LL = 20mH, CL =
Grid VS = 230 V
Frequency f = 50Hz
Induction of Grid LS = 0.15mH
Table 5.2 Values of PV array
Description Parameters
Number of PV arrays in series 30
Number of PV arrays in parallel 6
Open circuit voltage of single PV array 21.75 V
Short circuit current of single PV array 3.45 A
Reference Solar radiation 1000 W/m2
Reference Temperature 25o C
Saturation diode current 4.05e-7 A
The above values were taken for the component while performing the simulations using
MATLAB/Simulink software. The below simulation diagrams are of different parts of the
whole diagram.
25
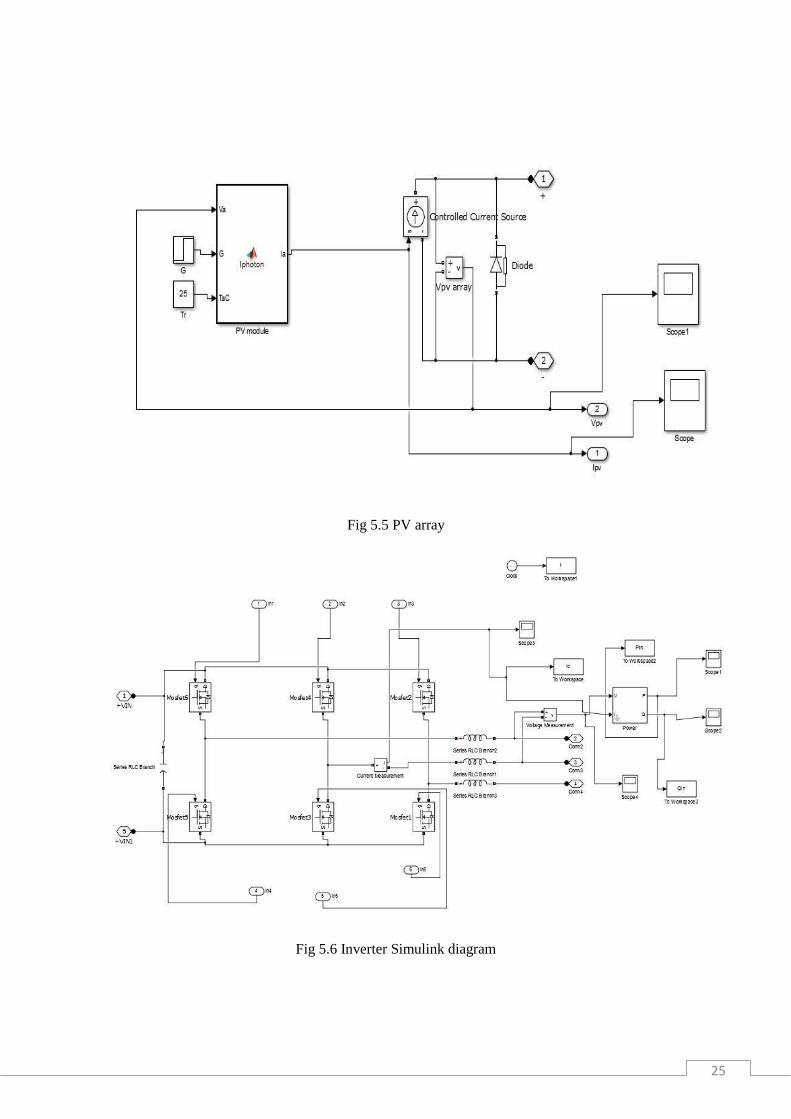
Fig 5.5 PV array
Fig 5.6 Inverter Simulink diagram
26
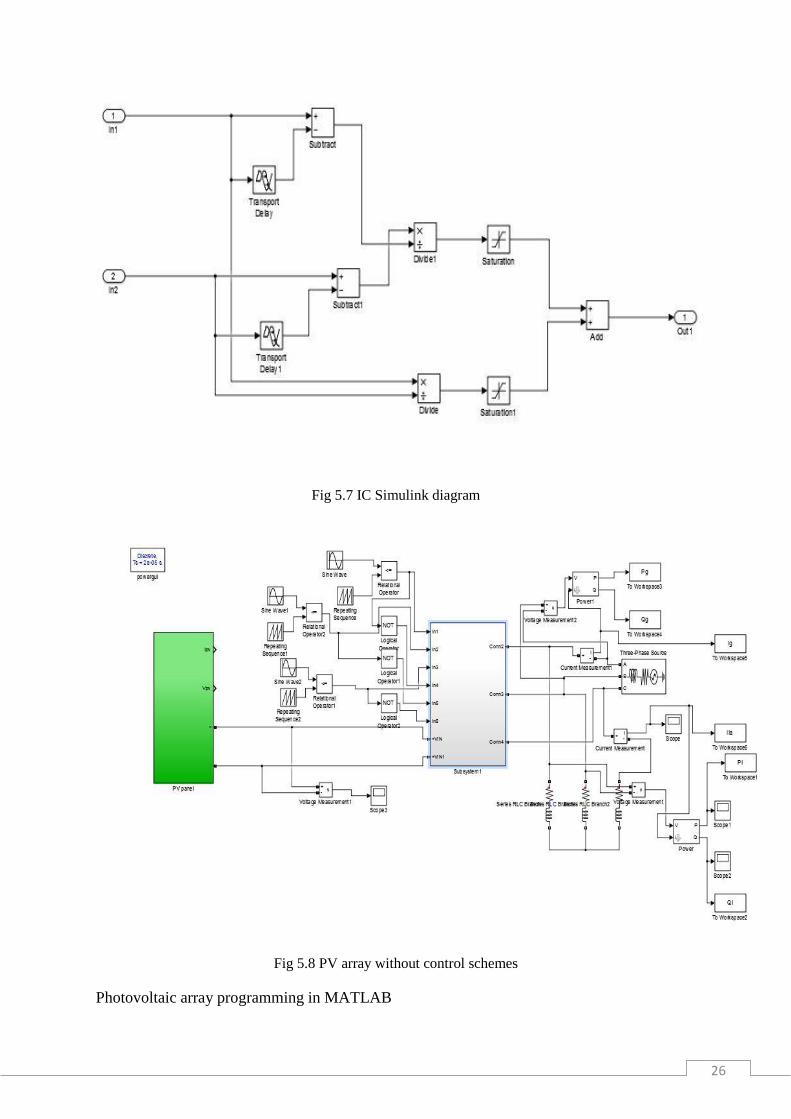
Fig 5.7 IC Simulink diagram
Fig 5.8 PV array without control schemes
Photovoltaic array programming in MATLAB

27
function Ia=Iphoton(Va,G,TaC) k = 1.381e-23; q = 1.602e-19; n = 1.3; Eg = 1.12; Ns = 30; Np=6; TrK = 299; Voc_TrK = 21.75 /Ns; Isc_TrK = 3.45 /Np; a = 1.33e-3; TaK = 273 + TaC; Vc = Va / Ns; Isc = Isc_TrK * (1 + (a * (TaK - TrK))); Iph = G * Isc; Vt_TrK = n * k * TrK / q; b = Eg * q /(n * k); Ir_TrK = Isc_TrK / (exp(Voc_TrK / Vt_TrK) -1); Ir = Ir_TrK * (TaK / TrK)^(3/n) * exp(-b * (1 / TaK -1 / TrK)); dVdI_Voc = -2.0/Ns; Xv = Ir_TrK / Vt_TrK * exp(Voc_TrK / Vt_TrK); Rs = - dVdI_Voc - 1/Xv; Vt_Ta = n * k * TaK / q; Ia=zeros(size(Vc)); for j=1:5; Ia = Ia - (Iph - Ia - Ir .* ( exp((Vc + Ia .* Rs) ./ Vt_Ta) -1))... ./ (-1 - Ir * (Rs ./ Vt_Ta) .* exp((Vc + Ia .* Rs) ./ Vt_Ta)); end Ia=Ia*Np; end
28
Chapter 6
Results and Discussions
6.1 PV array with MPPT algorithm and power control techniques.
PV Array
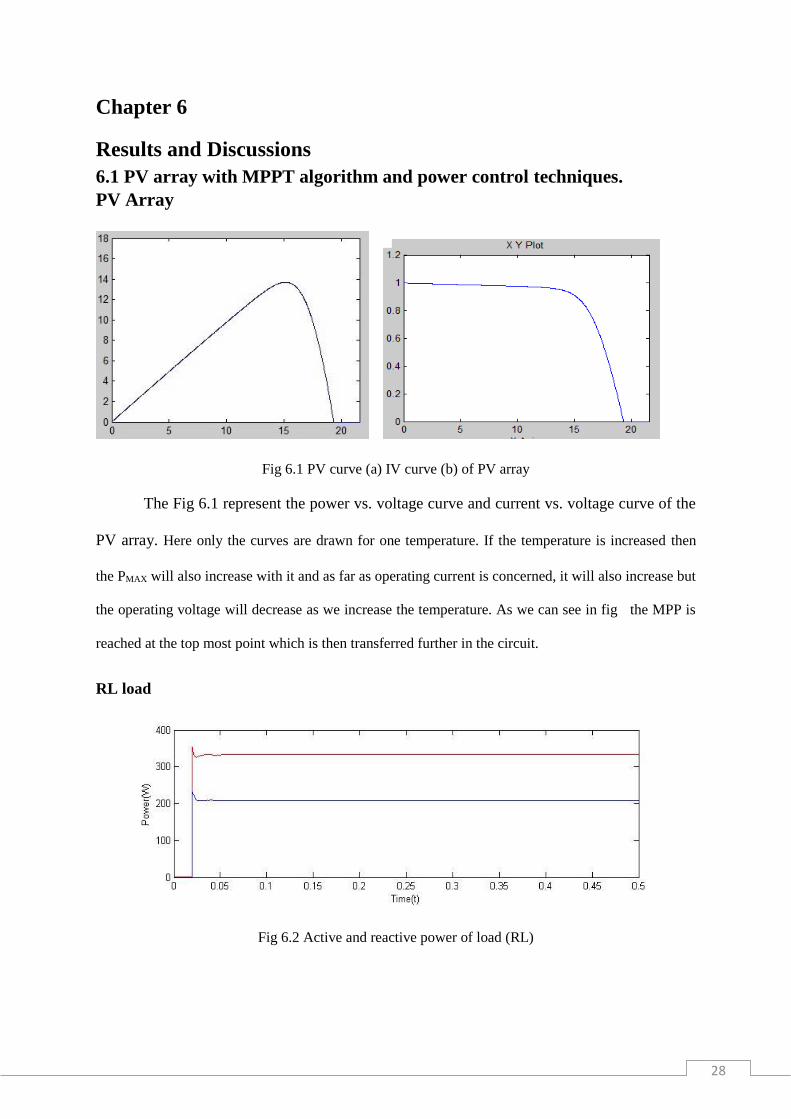
Fig 6.1 PV curve (a) IV curve (b) of PV array
The Fig 6.1 represent the power vs. voltage curve and current vs. voltage curve of the
PV array. Here only the curves are drawn for one temperature. If the temperature is increased then
the PMAX will also increase with it and as far as operating current is concerned, it will also increase but
the operating voltage will decrease as we increase the temperature. As we can see in fig the MPP is
reached at the top most point which is then transferred further in the circuit.
RL load
Fig 6.2 Active and reactive power of load (RL)

29
Fig 6.3 Active and reactive power of grid (RL)
Fig 6.4 Active and reactive power of inverter (RL)
The above waveforms show the power of the load, grid and inverter respectively. As
we can see due to the usage of MPPT algorithm and the proposed control scheme for active
and reactive power, the active and reactive power of load are quite similar (Fig 6.2). As a
matter of fact they are having a very good power factor. This improves the power quality,
which is being supplied to the consumers and is good for power quality analysis.

30
The Fig 6.3 shows that the reactive power is greater than the active power. It only
means the grid is supplying power to the load rather than storing power. As the grid provides
more power to the load, the PV array can be used to assist the main grid in supplying power
to the consumers. The Fig 6.4 shows the inverter’s active and reactive powers. It shows that
they both tend to have a unity power factor, which is helpful in achieving better power
quality.
Fig 6.5 Current waveforms (RL)
Ila = Load Current (Red)
Ig = Grid Current (Blue)
Ic = Inductor Current (Black)
The current waveforms are simulated as shown (Fig 6.5). The sum of the grid current,
Ig and inductor current, Ic is equal to the load current, Ila as the waveforms show. The currents
taken here are the phase currents only.
Ila = Ig +Ic
31
L load
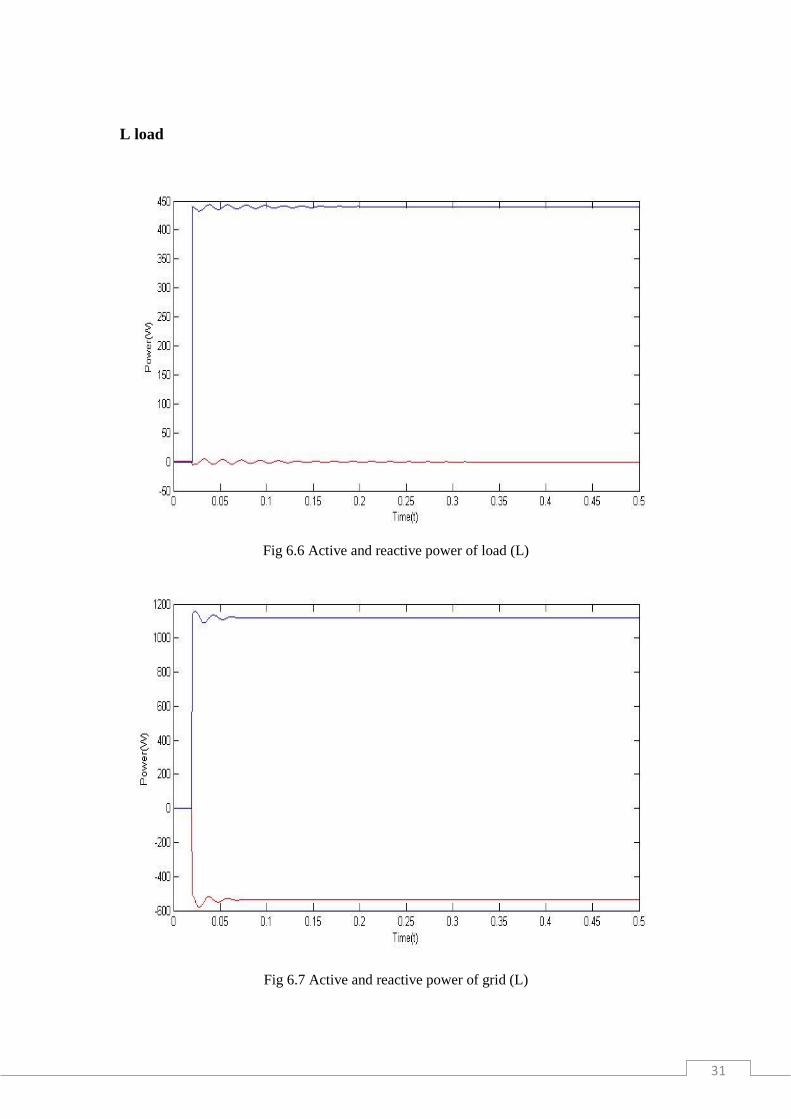
Fig 6.6 Active and reactive power of load (L)
Fig 6.7 Active and reactive power of grid (L)
32
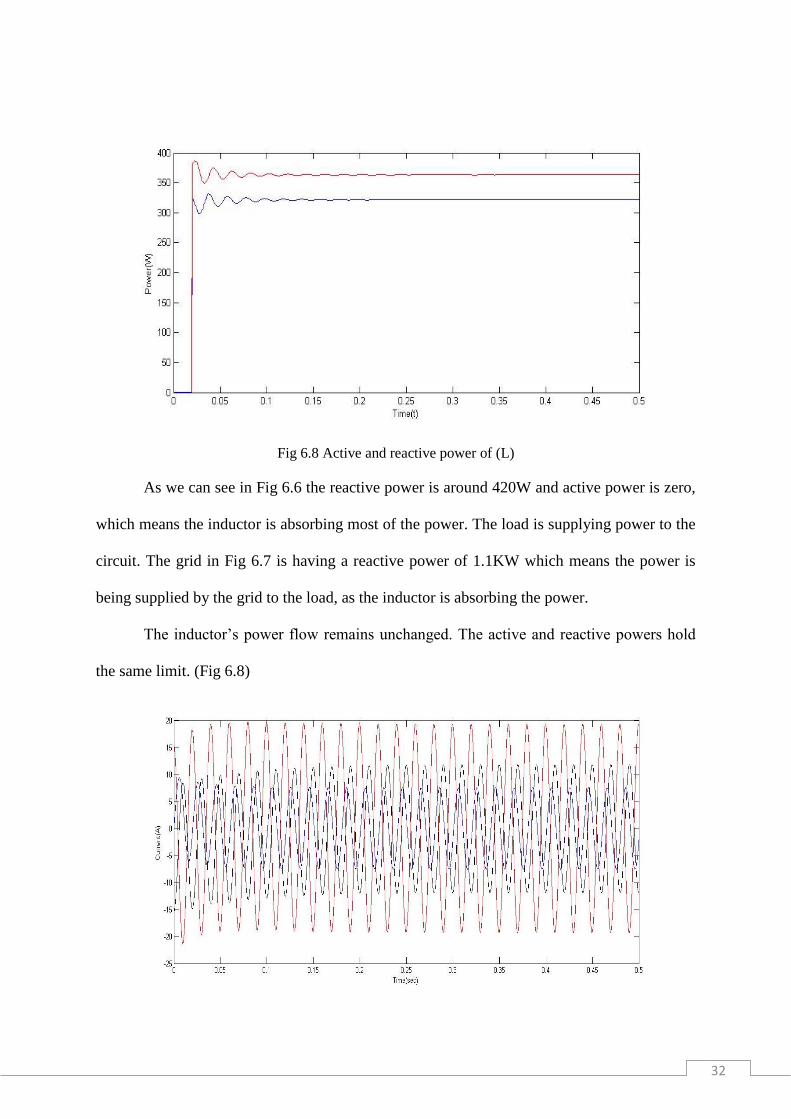
Fig 6.8 Active and reactive power of (L)
As we can see in Fig 6.6 the reactive power is around 420W and active power is zero,
which means the inductor is absorbing most of the power. The load is supplying power to the
circuit. The grid in Fig 6.7 is having a reactive power of 1.1KW which means the power is
being supplied by the grid to the load, as the inductor is absorbing the power.
The inductor’s power flow remains unchanged. The active and reactive powers hold
the same limit. (Fig 6.8)

33
Fig 6.9 Currents waveforms (L)
As in the above Fig 6.9 we see that the load current (Ila) is increased to 20A. this
might happen due to the power supply from both grid and PV array. The grid current (Ig) has
also increased to 10A but the inductor current (Ic) remains unchanged.
R load
Fig 6.10 Active and reactive power of load (R)

34
Fig 6.11 Active and reactive power of grid (R)
Fig 6.12 Active and reactive power of inverter (R)
The above figures show the power of load, grid and inverter when the load is only
resistive. We see in Fig 6.10 that the active power is 550W while reactive power is zero. This
suggests that using resistive load the power factor is very good and the useful power is only
available. In Fig 6.11 the reactive power is pf the value of 1.4KW which suggests that the
grid is supplying power to the load as well. The active power flowing through the grid is very
low considering the reactive power. The active and reactive powers through inverter remain
unchanged. (Fig 6.12)

35
Fig 6.13 Current waveforms (R)
The load current has a value of 15A and is sinusoidal, whereas both grid and inductor
current are of 8A each (Fig 6.13). This proves the formula:-
Ila = Ig + Ic
RLC load
Fig 6.14 Active and reactive power of load (RLC)
Fig 6.15 Active and reactive power of grid (RLC)
36
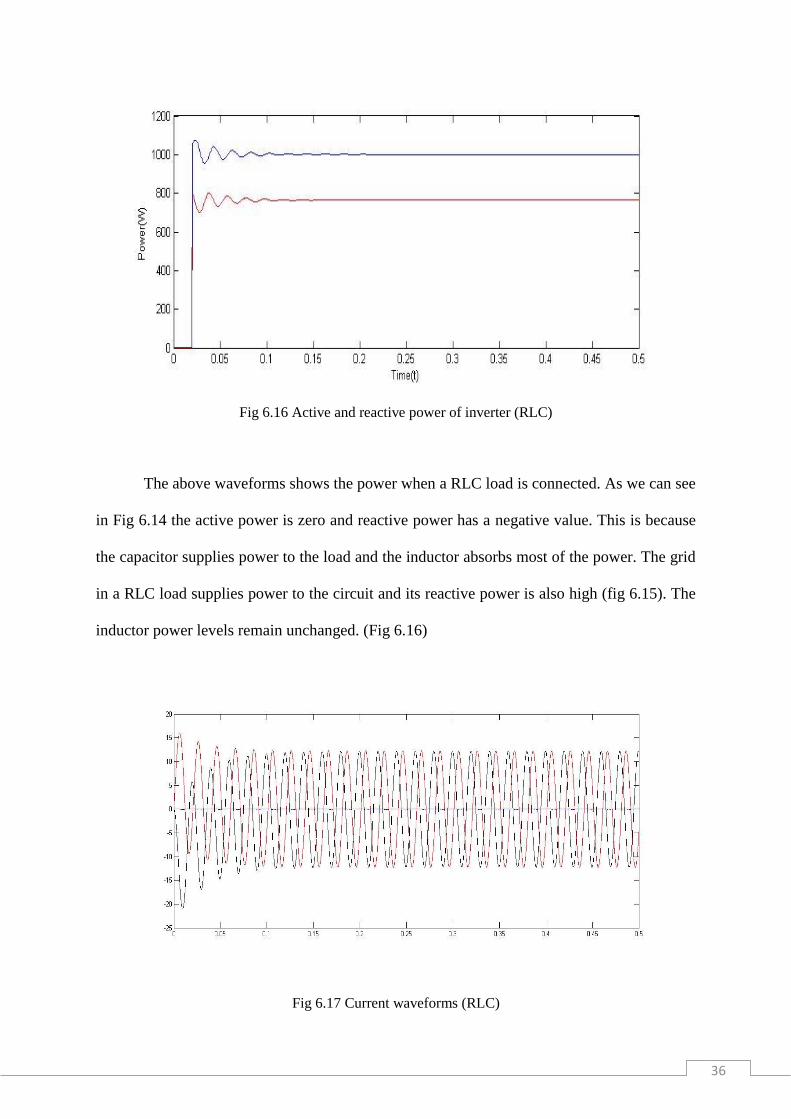
Fig 6.16 Active and reactive power of inverter (RLC)
The above waveforms shows the power when a RLC load is connected. As we can see
in Fig 6.14 the active power is zero and reactive power has a negative value. This is because
the capacitor supplies power to the load and the inductor absorbs most of the power. The grid
in a RLC load supplies power to the circuit and its reactive power is also high (fig 6.15). The
inductor power levels remain unchanged. (Fig 6.16)
Fig 6.17 Current waveforms (RLC)

37
The above Fig 6.17 shows the currents during an RLC load connection. It is observed
that the load and grid current are of similar value i.e 10A but there is no current flowing
through the inductor. This means all the current from the grid is being fed to the load.
6.2 PV array connected to grid without any MPPT algorithm and control
scheme.
RL load
Fig 6.18 Active and reactive power of load (RL)

38
Fig 6.19 Active and reactive power of grid (RL)
Fig 6.20 Active and reactive power of inverter (RLC)
The above waveforms show the power levels of a grid connected PV without any
control schemes. The load’s active power seems to be very low and it in return provides the
circuit with (Fig 6.18). The negative polarity of the reactive power suggest power flow is in
opposite directions. The grid has reactive power of the value 1.5KW which is very much high
and the power factor is not healthy for better power supply (fig 6.19). The losses in these
circuits is high, as the useful power is very much less. The inverter’s active and reactive
power remains similar to the previous attained values. (Fig 6.20)
L load
Fig 6.21 Active and reactive power of load (L)

39
Fig 6.22 Active and reactive power of grid (L)
Fig 6.23 Active and reactive power of inverter (L)
The above waveform show the power of load, grid and inverter if only an inductive
load is attached to the PV array and grid. The load shows that the active power is around
200W with the reactive power being nearly zero (Fig 6.21). This is explained as the inductive
load tends to absorb power from the array and grid both. The grid supplies active power to
the circuit, bur the reactive power is way above the limit (Fig 6.22). In the inductor the active
and reactive power remain at a constant value showing that the power through the inverter is
properly flowing to the load. (Fig 6.23)
40
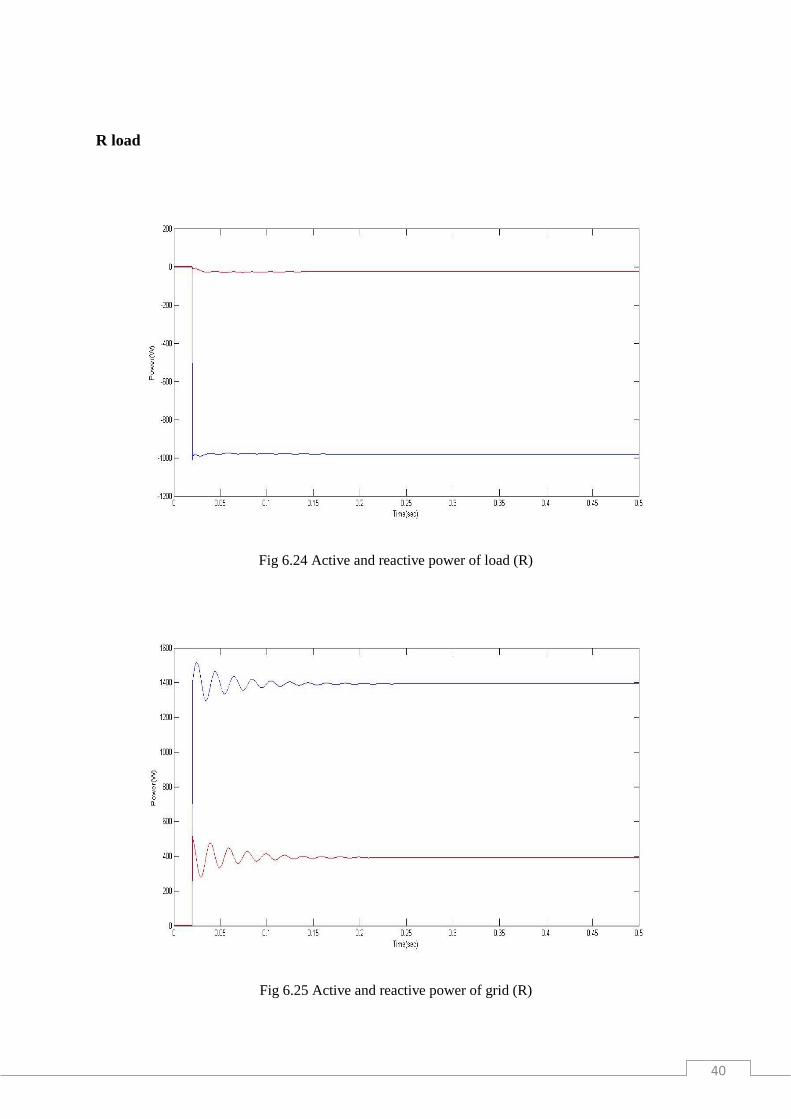
R load
Fig 6.24 Active and reactive power of load (R)
Fig 6.25 Active and reactive power of grid (R)
41
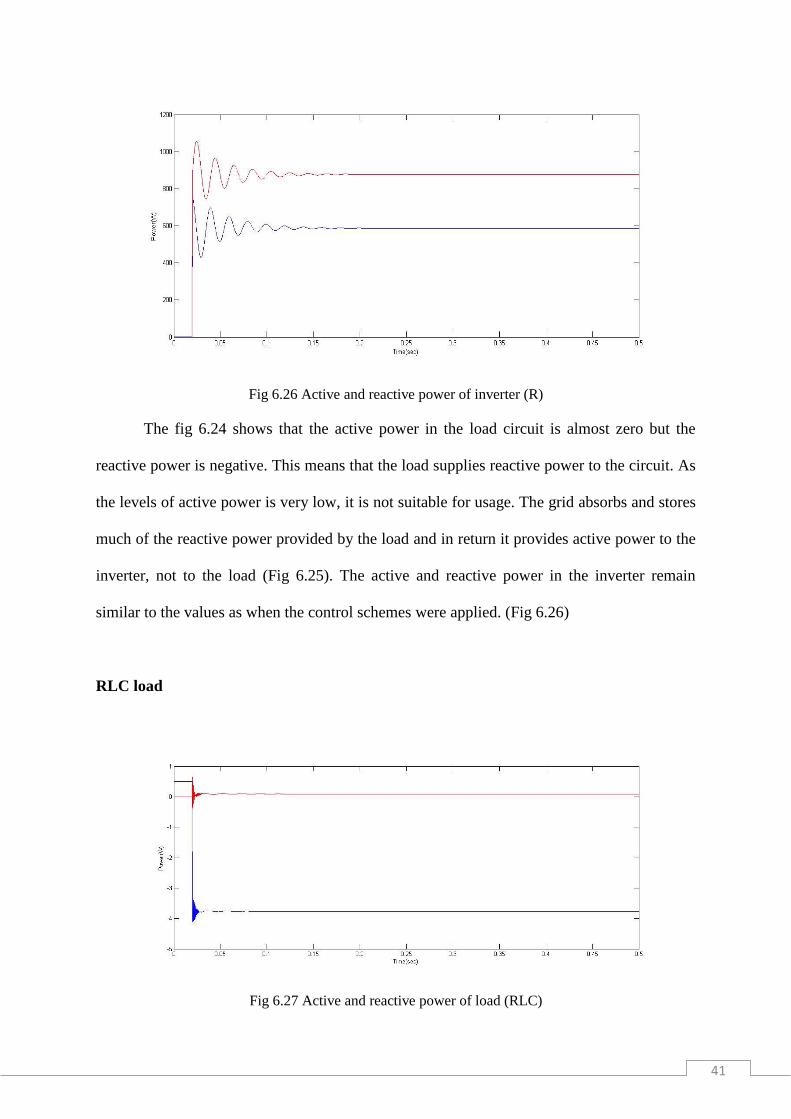
Fig 6.26 Active and reactive power of inverter (R)
The fig 6.24 shows that the active power in the load circuit is almost zero but the
reactive power is negative. This means that the load supplies reactive power to the circuit. As
the levels of active power is very low, it is not suitable for usage. The grid absorbs and stores
much of the reactive power provided by the load and in return it provides active power to the
inverter, not to the load (Fig 6.25). The active and reactive power in the inverter remain
similar to the values as when the control schemes were applied. (Fig 6.26)
RLC load
Fig 6.27 Active and reactive power of load (RLC)

42
Fig 6.28 Active and reactive power of grid (RLC)
Fig 6. 29 Active and reactive power of inverter (RLC)
The Fig 6.27 shows that the load now supplies power to the circuit, both active and
reactive power. Both of them are of meagre value and have negative polarity. The grid (Fig
6.28) provides active power to the inverter and absorbs the reactive power of both load and
inverter. The inverter has the active and reactive power at similar values as before. (Fig 6.29)
6.3 Conclusion and future work We see from the simulations performed and the output produced, when the grid
connected PV array has an MPPT algorithm to search the MPP and a control scheme for both

43
active and reactive power, the power factor has a good value and the reliability of the power
supply remains good. While if we use PV array without any of the control methods, then the
reactive power increases and much power is being drawn from the load. This way the PV
array is not very useful to the consumers.
The future work in the above simulations can be done by performing the real time
experiments of the simulations. In real time we will know about the righteousness of the
results obtained from Simulink.

44
References 1. Georgios Tsengenes, Georgios Adamidis, Investigation of the behavior of a three
phase grid connected photovoltaic system to control active and reactive power:
Electrical Power System research 81(2011) 177-184.
2. A. Moreno-Munoz, J.J.G.de-la-Rosa, M.A. Lopez-Rodriguez, J.M. Flores Arias, F.J.
Bellido-Outerino, M. Ruiz-de-Adana, Improvement of power quality using distributed
generations : Electrical power and energy systems 32(2010) 1069-1076.
3. R. Noorozian, M. Abedi, G.B. Gharehpetian, S.H. Hosseini, Distributed resources and
DC distribution system combination for high power quality : Electrical power and
energy systems 32(2010) 769-781.
4. Prakash K. Ray, Soumya R. Mohanty, Nand Kishore, Classification of power quality
disturbances due to environmental characteristics in DG systems : Sustainable energy
vol.4 no.2(2013) 302-313(IEEE).
5. Zuo Sun, Xun you Zhang, Advances in DG technologies: Energy procedia 17(2012)
32-38.
6. Thomas Ackerman, Goran Andersson, Lenart Soder, Distributed Generations: A
definition, Electric power system research 57(2001) 195-204.
7. A. Moreno-Munoz, J.J.G. de-la-Rosa, M.A. Lopez-Rodriguez, J.M. Flores-Arias, F.J.
Bellido-Outerino, M. Ruiz-de-Adana, Improvement of power quality using distributed
generation, Electrical power and Energy systems 32 (2010) 1069-1076
8. Frede Blaabjerg, Fellow, IEEE, Remus Teodorescu, Senior Member, IEEE, Marco
Liserre, Member, IEEE, and Adrian V. Timbus, Student Member, IEEE, Overview of
Control and Grid Synchronization for Distributed Power Generation Systems, IEEE
transaction on industrial electronics , VOL. 53, NO. 5, October 2006 1398-1409
9. Evangelos Rikos, Stathis Tselepis, Carsten Hoyer-Klick, and Marion Schroedter-
Homscheidt, Stability and Power Quality Issues in Microgrids Under Weather
Disturbances, IEEE journal on applied earth observations and remote sensing, vol.1
No. 3 , September 2008, 170-179
45
10. P.K. Dash, Malhar Padhee , S.K. Barik, Estiamtion of power quality indices in
Distributed generations systems during power islanding conditions, Electrical power
and Electrical energy systems,, Vol 36, 2012, 18-30
11. Davood Khani, Ahmad Sadeghi Yazdankhah, Hossein Madadi Kojabadi, Impacts of
Distributed generations on power system transient and voltage stability, Electrical
power and Electrical energy systems, Vol 43, 2012, 488-500
12. W. El-Khattam, M.M.A. Salama, Distributed generations technologies, definition and
benefits, Electrical Power system research, Vol 71, 2004, 119-128
13. AngelA.Bayod-Ru´ jula, Future developments of electrical systems with distributed
generations, Energy, Vol 34, 2009, 377-383
14. J.A. Pec¸as Lopes, N. Hatziargyriou, J. Mutale, P. Djapic, N. Jenkins, Integrating
distributed generation into electric power systems:A review of drivers, challenges and
opportunities, Electrical power system research, Vol 77, 2007, 1189-1203
15. Peter Dondi, Deia Bayoumi, Christoph Haederli, Danny Julian, Marco Suter, Network
integration of Distributed power generations, Journal of power sources, Vol 106,
2002, 1-9